UNITED STATES
SECURITIES AND EXCHANGE COMMISSION
Washington, D.C. 20549
FORM N-CSR
CERTIFIED SHAREHOLDER REPORT OF REGISTERED
MANAGEMENT INVESTMENT COMPANIES
Investment Company Act file number 811-05349
Goldman Sachs Trust
(Exact name of registrant as specified in charter)
71 South Wacker Drive, Chicago, Illinois 60606
(Address of principal executive offices) (Zip code)
| Caroline Kraus, Esq. | Copies to: | |
| Goldman Sachs & Co. LLC | Geoffrey R.T. Kenyon, Esq. | |
| 200 West Street | Dechert LLP | |
| New York, New York 10282 | 100 Oliver Street | |
| 40th Floor | ||
| Boston, MA 02110-2605 |
(Name and address of agents for service)
Registrant’s telephone number, including area code: (312) 655-4400
Date of fiscal year end: August 31
Date of reporting period: August 31, 2021
| ITEM 1. | REPORTS TO STOCKHOLDERS. |
The Annual Report to Shareholders is filed herewith. |
Goldman Sachs Funds

| Annual Report | August 31, 2021 | |||
Fundamental Equity Growth Funds | ||||
Capital Growth | ||||
Concentrated Growth | ||||
Flexible Cap | ||||
Growth Opportunities | ||||
Small Cap Growth | ||||
Small/Mid Cap Growth | ||||
Strategic Growth | ||||
Technology Opportunities | ||||
U.S. Equity ESG | ||||

Goldman Sachs Fundamental Equity Growth Funds
| ∎ | CAPITAL GROWTH |
| ∎ | CONCENTRATED GROWTH |
| ∎ | FLEXIBLE CAP |
| ∎ | GROWTH OPPORTUNITIES |
| ∎ | SMALL CAP GROWTH |
| ∎ | SMALL/MID CAP GROWTH |
| ∎ | STRATEGIC GROWTH |
| ∎ | TECHNOLOGY OPPORTUNITIES |
| ∎ | U.S. EQUITY ESG |
| ||||
| 1 | ||||
| 3 | ||||
| 49 | ||||
| 71 | ||||
| 82 | ||||
| 82 | ||||
| 90 | ||||
| 97 | ||||
| 104 | ||||
| 112 | ||||
| 119 | ||||
| 127 | ||||
| 135 | ||||
| 142 | ||||
| 149 | ||||
| 173 | ||||
| 175 | ||||
| NOT FDIC-INSURED | May Lose Value | No Bank Guarantee | ||
MARKET REVIEW
Goldman Sachs Fundamental Equity Growth Funds
Overall, U.S. equities rallied strongly during the 12 months ended August 31, 2021 (the “Reporting Period”). The Standard & Poor’s 500 Index (the “S&P 500 Index”) ended the Reporting Period with a return of 31.17%. The Russell 3000® Index generated a return of 33.04%.
U.S. equities moved lower as the Reporting Period began in September 2020, with the S&P 500 Index declining for the first time in five months. Shares of large-cap technology companies, which had been key drivers of the market’s powerful rally from its March 2020 lows, fell sharply in early September amid concerns about stretched valuations, among other factors. There were also worries about Congress failing to break an impasse on a fifth fiscal aid package, and it appeared there might well be strong division in advance of the then-upcoming U.S. Presidential elections. Still, corporate earnings were better than consensus expected.
In the fourth quarter of 2020, U.S. equities rebounded for the third consecutive quarter, extending a broad-based recovery from steep first quarter 2020 declines. Stocks rallied on the prospect of an end to the global COVID-19 pandemic and its weighty economic impact with the distribution of approved COVID-19 vaccines. While uncertainty surrounding the U.S. elections and other policy questions created the potential for higher market volatility, the Democrat victory for U.S. President in November proved positive for equity markets during the quarter. After a historically sharp but short recession in the spring of 2020, many major economies, including that of the U.S., entered an early-cycle phase of recovery. Employment conditions improved as temporary job losses were regained, and U.S. manufacturing activity recovered. Still, reminders of a COVID-19 ceiling for industries hit hardest by the pandemic restrictions persisted.
Rising bond yields and a value-led U.S. equity market dominated the first quarter of 2021. The key driver of this performance was the Democrat victory for Senators in Georgia in January, which, in turn, paved the way for additional massive U.S. fiscal stimulus and progress in the COVID-19 vaccine rollout. An increase in the 10-year U.S. Treasury yield benefited the financials sector and value-oriented stocks. The accelerating rollout of COVID-19 vaccines boosted investors’ hopes of a sustainable reopening of the economy. Small-cap stocks, which tend to be more cyclical and domestically focused, performed particularly well. The passage of a fiscal stimulus package led to upgrades in consensus forecasts for U.S. Gross Domestic Product growth for 2021. Some investors worried that the size of the fiscal stimulus could provoke an uptick in inflation. However, despite upgrading its economic growth forecasts and expecting unemployment to decline, the U.S. Federal Reserve (the “Fed”) stated it did not believe inflation would be meaningfully above target and did not expect to raise interest rates before 2024.
The U.S. equity market continued to perform well in the second quarter of 2021 overall. Discussions centered on the Fed liquidity tailwind, fiscal stimulus, COVID-19 vaccine progress, economic reopening momentum, strong corporate profit backdrop and robust equity inflows. While inflation concerns were fairly pervasive, the Fed remained consistent in its messaging around expectations that price pressures would be transitory. However, the peak inflation theme gained traction as the quarter progressed even as economists suggested the transitory period may be longer than initially expected. Corporate earnings season brought another round of outsized beats over consensus estimates, along with corporate commentary highlighting some input pressures offset by above-average pricing power or productivity initiatives. Despite a late-quarter agreement between the White House and a bipartisan group of Senators on the framework of a physical infrastructure package, the path to additional fiscal stimulus remained complicated.
U.S. equities continued to move higher in July and August 2021. Bullish narrative surrounding central bank liquidity tailwinds, excess savings from fiscal stimulus, economic reopening momentum, COVID-19 vaccine efficacy, upside corporate earnings surprises, elevated operating leverage, corporate buyback boom and retail impulse prevailed. Discussions centered around the reflation trade and the spread of the Delta variant of COVID-19. Focus remained on the possibility the Fed may not be as willing to let the economy run as “hot” as initially envisioned under its policy framework and on the Fed tapering its asset purchases, though payroll growth remained a key input in the tapering discussion. The U.S. Senate passed a $1 trillion bipartisan infrastructure bill in August, though the path to additional fiscal stimulus remained complicated. By the end of August, the second calendar quarter corporate earnings season had largely closed out with a year-over-year earnings per share growth rate topping 90%.
For the Reporting Period overall, all 11 sectors of the S&P 500 Index posted double-digit absolute gains, led by financials, energy and communication services. On a relative basis, the weakest performing sectors in the S&P 500 Index were consumer staples, consumer discretionary and utilities.
1
MARKET REVIEW
Within the U.S. equity market, all capitalization segments generated robust double-digit absolute returns, with small-cap stocks, as measured by the Russell 2000® Index, leading the way, followed by mid-cap stocks, as measured by the Russell Midcap® Index, and then large-cap stocks, as measured by the Russell 1000® Index. From a style perspective, in a reversal from the prior 12-month period ended August 31, 2020, value-oriented stocks significantly outpaced growth-oriented stocks across the capitalization spectrum during the Reporting Period, though both style segments posted healthy double-digit absolute gains across the U.S. equity market. (All as measured by the FTSE Russell indices.)
Looking Ahead
At the end of the Reporting Period, we remained optimistic about the pace and scope of the U.S. economic recovery, believing it was on an improving, though perhaps no longer accelerating, path alongside the rollout of the COVID-19 vaccines and continued expansionary monetary and fiscal policy. Against this significantly improved economic backdrop, in our view, we expected the U.S. equity market rally to continue but with broader sector participation and potential choppiness in the near term given ongoing uncertainty in the market. Additionally, we were closely monitoring persistent supply chain disruptions, rising interest rates and pockets of inflation as potential sources of volatility. As always, we believe it is crucial to stay true to our quality-first investment approach as we continue to seek to invest in businesses with healthy balance sheets, relatively stable free cash flow generation and differentiated business models aligned to secular advantages. We continue to test our strategies and re-evaluate our assumptions with increasing information, staying focused on the long-term investment horizon.
Regardless of market direction, our fundamental, bottom-up stock selection continues to drive our process, rather than headlines or sentiment. We maintain high conviction in the companies the Fundamental Equity Growth Funds own and believe they have the potential to outperform relative to the broader market regardless of economic growth conditions. As always, we maintain our focus on seeking companies that we believe will generate long-term growth in today’s ever-changing market conditions.
2
PORTFOLIO RESULTS
Goldman Sachs Capital Growth Fund
Portfolio Composition
The Fund seeks to achieve its investment objective by investing, under normal circumstances, in companies that are considered by the Investment Adviser to be positioned for long-term growth. The Fund invests in both value and growth companies. The Fund’s fundamental equity investment process involves evaluating potential investments based on specific characteristics believed to indicate a high-quality business with sustainable growth, including strong business franchises, favorable long-term prospects, and excellent management.
Portfolio Management Discussion and Analysis
Below, the Goldman Sachs Fundamental Equity U.S. Equity Team discusses the Goldman Sachs Capital Growth Fund’s (the “Fund”) performance and positioning for the 12-month period ended August 31, 2021 (the “Reporting Period”).
| Q | How did the Fund perform during the Reporting Period? |
| A | During the Reporting Period, the Fund’s Class A, Class C, Institutional, Service, Investor, Class R6, Class R and Class P Shares generated average annual total returns, without sales charges, of 32.38%, 31.41%, 32.86%, 32.21%, 32.71%, 32.92%, 32.09% and 32.90%, respectively. These returns compare to the 32.25% average annual total return of the Fund’s benchmark, the Russell 1000® Index (with dividends reinvested) (the “Russell Index”), during the same period. |
| Q | What key factors were responsible for the Fund’s performance during the Reporting Period? |
| A | Several share classes of the Fund outperformed the Russell Index on a relative basis during the Reporting Period due primarily to effective stock selection. Sector allocation as a whole had a rather neutral effect on relative performance during the Reporting Period. |
| Q | Which equity market sectors most significantly affected Fund performance? |
| A | The sectors that contributed most positively to the Fund’s relative performance during the Reporting Period were communication services, health care and financials, wherein stock selection in each proved effective. The sectors that detracted most from the Fund’s relative performance during the Reporting Period were real estate, energy and utilities, wherein stock selection in each dampened results. Having an underweight to the strongly-performing energy sector also dampened the Fund’s relative performance. |
| Q | What were some of the Fund’s best-performing individual stocks? |
| A | Those stocks the Fund benefited most from relative to the Russell Index were positions in biotechnology company Immunomedics, direct banking and payment services provider Discover Financial Services and digital payments and credit card firm American Express. |
The share price of Immunomedics nearly doubled during the Reporting Period when it was announced Gilead Sciences would acquire the company for more than $20 billion, which was a significant premium to the company’s market value. We viewed the acquisition as a validation of our investment thesis that the company’s prospects were underappreciated by the market. After the announcement and subsequent stock rally, we sold the Fund’s position in the stock. |
Discover Financial Services’ strong performance during the Reporting Period was driven by largely positive earnings reports. Increased consumer spending progressed toward normal activity levels as well. At the end of the Reporting Period, we maintained conviction in Discover Financial Services should broader economic activity resume and pay-down rates normalize as we anticipate, but we opted to sell the position following the company’s strong performance and reallocate the proceeds elsewhere. |
Shares of American Express appreciated in January 2021 on a positive fourth quarter 2020 earnings release, wherein earnings that beat consensus expectations were aided by a reserve release of $674 million in the quarter. There was previously a divergence in travel & expense versus non-travel & expense spending, though toward the end of the Reporting Period, American Express stated it was expecting |
3
PORTFOLIO RESULTS
| travel & expense spending to return to 80% of 2019 levels by the fourth quarter of 2021. At the end of the Reporting Period, we expected American Express’ stock to further appreciate, should travel & expense spending continue to increase as we anticipate given the expansion of COVID-19 vaccine adoption and the broader resumption of travel supported by the macroeconomic outlook. |
| Q | Which stocks detracted significantly from the Fund’s performance during the Reporting Period? |
| A | Those stocks detracting most from the Fund’s results relative to the Russell Index were positions in Fidelity National Information Services, McCormick & Company and Bank of America. |
Fidelity National Information Services is a technology provider for banks and capital markets businesses. Its share price fell in October 2020 along with the release of its third calendar quarter earnings results. However, most of the losses were recovered in the following days as the market digested the report. Its stock price also came under pressure with news of a failed merger between the company and Global Payments in late 2020. Later, turbulence was seen in July and August 2021 when its stock price declined following a smaller than consensus expected earnings per share raise and lower implied margins as reported in its second quarter 2021 earnings release. At the end of the Reporting Period, we believed Fidelity National Information Services was well positioned to take advantage of accelerating payments innovation globally along with financial institutions continuing to outsource for technology infrastructure. |
Spices and seasonings manufacturer McCormick & Company was adversely affected by supply chain constraints at the end of 2020. More specifically, poor results were driven by the company suspending the shipment of a lot of items to focus on key holiday items, putting some customers on allocation. While McCormick & Company lagged peers in the consumer staples sector and food industry during the Reporting Period, we believed at the end of the Reporting Period it was better positioned to perform well going forward, benefiting both from its November 2020 Cholula Hot Sauce acquisition and increases in home cooking given ongoing COVID-19 pandemic trends. |
Bank of America was a new position for the Fund during the Reporting Period. While the stock of financial institution Bank of America had very few negative developments during the Reporting Period, the Fund’s previously underweight position in its stock detracted from relative returns. We increased the Fund’s position in Bank of America during the Reporting Period on our view that Bank of America is appealing from a rate sensitivity and capital return standpoint and is also generally well positioned with a strong deposit base over the long term. |
| Q | How did the Fund use derivatives and similar instruments during the Reporting Period? |
| A | During the Reporting Period, we did not use derivatives as part of an active management strategy. |
| Q | Did the Fund make any significant purchases or sales during the Reporting Period? |
| A | In addition to the purchase of Bank of America, mentioned earlier, we initiated a Fund position in Align Technology. The company manufactures orthodontics and aesthetic dentistry products. Digital dentistry may be likely to gain a larger share of the dental market post-COVID-19 pandemic, in our view. We believe Align Technology is well positioned to benefit from this potential trend given it is the only company with scale and a full range of products to address virtually all types of dental issues. |
Conversely, in addition to those sales already mentioned, we exited the Fund’s position in retail giant Walmart during the Reporting Period. After initiating a Fund position in fellow retail leader Target during the Reporting Period, we decided to eliminate the Fund’s position in its competitor, Walmart. We were fully aware of Walmart’s strong performance during the Reporting Period but believed Target had more promising potential upside long term. |
We sold the Fund’s position in software and technology services firm Accenture. We no longer expected our investment thesis to come to realization in the near term, ultimately motivating us to allocate the sale proceeds to what we considered to be more attractive investment opportunities elsewhere. |
| Q | Were there any changes to the Fund’s portfolio management team during the Reporting Period? |
| A | There were no changes to the Fund’s portfolio management team during the Reporting Period. |
| Q | Were there any notable changes in the Fund’s weightings during the Reporting Period? |
| A | In constructing the Fund’s portfolio, we focus on picking stocks rather than on making industry or sector bets. We seek to outpace the benchmark index by overweighting stocks that |
4
PORTFOLIO RESULTS
| we expect to outperform and underweighting those that we think may lag. Consequently, changes in its sector weights are generally the direct result of individual stock selection or of stock appreciation or depreciation. That said, during the Reporting Period, relative to the Russell Index, the Fund’s allocations to communication services and health care increased, and its allocation to financials decreased. |
| Q | How was the Fund positioned relative to its benchmark index at the end of August 2021? |
| A | At the end of August 2021, the Fund was overweight relative to the Russell Index in materials, was underweight relative to the Russell Index in financials and was rather neutrally weighted to the remaining nine sectors in the Russell Index. |
5
FUND BASICS
Capital Growth Fund
as of August 31, 2021
| TOP TEN HOLDINGS AS OF 8/31/211 | ||||||||
Holding | % of Net Assets | Line of Business | ||||||
Microsoft Corp. | 5.3 | % | Software | |||||
Apple, Inc. | 5.1 | Technology Hardware, Storage & Peripherals | ||||||
Amazon.com, Inc. | 3.8 | Internet & Direct Marketing Retail | ||||||
Alphabet, Inc., Class A | 2.3 | Interactive Media & Services | ||||||
Facebook, Inc., Class A | 2.2 | Interactive Media & Services | ||||||
Alphabet, Inc., Class C | 2.0 | Interactive Media & Services | ||||||
PayPal Holdings, Inc. | 1.4 | IT Services | ||||||
Eli Lilly & Co. | 1.4 | Pharmaceuticals | ||||||
Bank of America Corp. | 1.3 | Banks | ||||||
Procter & Gamble Co. (The) | 1.2 | Household Products | ||||||
| 1 | The top 10 holdings may not be representative of the Fund’s future investments. |
| FUND VS. BENCHMARK SECTOR ALLOCATION2 |
| As of August 31, 2021 |
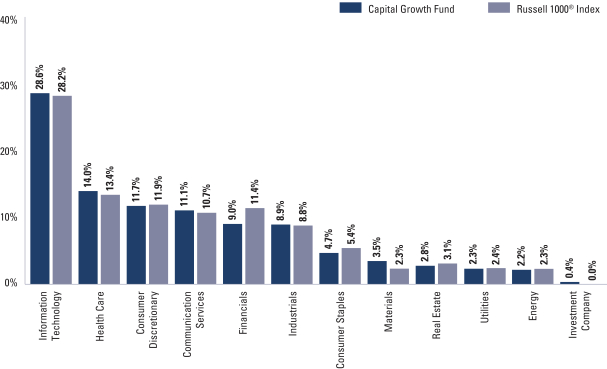
| 2 | The Fund is actively managed and, as such, its composition may differ over time. Consequently, the Fund’s overall sector allocations may differ from the percentages contained in the graph above. Figures in the above graph may not sum to 100% due to the exclusion of other assets and liabilities. The graph categorizes investments using the Global Industry Classification Standard (“GICS”), however, the sector classifications used by the portfolio management team may differ from GICS. The percentage shown for each investment category reflects the value of investments in that category as a percentage of market value. The graph depicts the Fund’s investments but may not represent the Fund’s market exposure due to the exclusion of certain derivatives, if any, as listed in the Additional Investment Information section of the Schedule of Investments. |
For more information about the Fund, please refer to www.GSAMFUNDS.com. There, you can learn more about the Fund’s investment strategies, holdings, and performance.
6
GOLDMAN SACHS CAPITAL GROWTH FUND
Performance Summary
August 31, 2021
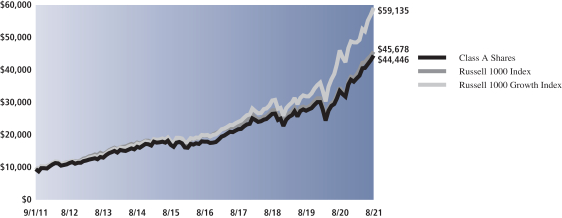
The following graph shows the value, as of August 31, 2021, of a $10,000 investment made on September 1, 2011 in Class A Shares at NAV (with the maximum sales charge of 5.50%). For comparative purposes, the performance of the Fund’s benchmark, the Russell 1000 Index (with dividends reinvested), is shown. Performance reflects applicable fee waivers and/or expense limitations in effect during the periods shown and in their absence, performance would be reduced. Returns do not reflect the deduction of taxes that a shareholder would pay on Fund distributions or the redemption of Fund shares. The returns set forth below represent past performance. Past performance does not guarantee future results. The Fund’s investment return and principal value will fluctuate so that an investor’s shares, when redeemed, may be worth more or less than their original cost. Current performance may be lower or higher than the performance quoted below. Please visit our web site at www.GSAMFUNDS.com to obtain the most recent month-end returns.
| Capital Growth Fund’s 10 Year Performance |
Performance of a $10,000 Investment, including any applicable sales charges, with distributions reinvested, from September 1, 2011 through August 31, 2021.
| Average Annual Total Return through August 31, 2021* | One Year | Five Years | Ten Years | Since Inception | ||||||||||
Class A | ||||||||||||||
Excluding sales charges | 32.38% | 20.00% | 16.73% | — | ||||||||||
Including sales charges | 25.09% | 18.64% | 16.07% | — | ||||||||||
| ||||||||||||||
Class C | ||||||||||||||
Excluding contingent deferred sales charges | 31.41% | 19.13% | 15.87% | — | ||||||||||
Including contingent deferred sales charges | 30.35% | 19.13% | 15.87% | — | ||||||||||
| ||||||||||||||
Institutional | 32.86% | 20.46% | 17.18% | — | ||||||||||
| ||||||||||||||
Service | 32.21% | 19.86% | 16.60% | — | ||||||||||
| ||||||||||||||
Investor | 32.71% | 20.30% | 17.02% | — | ||||||||||
| ||||||||||||||
Class R6 (Commenced July 31, 2015) | 32.92% | 20.48% | N/A | 16.28% | ||||||||||
| ||||||||||||||
Class R | 32.09% | 19.71% | 16.44% | — | ||||||||||
| ||||||||||||||
Class P (Commenced April 17, 2018) | 32.90% | N/A | N/A | 19.38% | ||||||||||
| ||||||||||||||
| * | These returns assume reinvestment of all distributions at NAV and reflect a maximum initial sales charge of 5.50% for Class A Shares and the assumed contingent deferred sales charge for Class C Shares (1% if redeemed within 12 months of purchase). Because Institutional, Service, Investor, Class P, Class R and Class R6 Shares do not involve a sales charge, such a charge is not applied to their Average Annual Total Return. |
7
PORTFOLIO RESULTS
Goldman Sachs Concentrated Growth Fund
Portfolio Composition
The Fund invests primarily in U.S. equity investments selected for their potential to achieve capital appreciation over the long term. The Fund typically holds 30-40 companies that are considered by the Investment Adviser to be positioned for long-term growth. The Fund may invest in securities of companies of any capitalization. Although the Fund invests primarily in publicly traded U.S. securities, it may invest up to 25% of its total assets in foreign securities, including securities of issuers in countries with emerging markets or economies (“emerging countries”) and securities quoted in foreign currencies. The Fund may also invest up to 10% of its total assets in fixed income securities, such as government, corporate and bank debt obligations.
Portfolio Management Discussion and Analysis
Below, the Goldman Sachs Fundamental Equity U.S. Equity Team discusses the Goldman Sachs Concentrated Growth Fund’s (the “Fund”) performance and positioning for the 12-month period ended August 31, 2021 (the “Reporting Period”).
| Q | How did the Fund perform during the Reporting Period? |
| A | During the Reporting Period, the Fund’s Class A, Class C, Institutional, Investor, Class R6, Class R and Class P Shares generated average annual total returns, without sales charges, of 28.17%, 27.24%, 28.56%, 28.50%, 28.59%, 27.84% and 28.60%, respectively. These returns compare to the 28.53% average annual total return of the Fund’s benchmark, the Russell 1000® Growth Index (with dividends reinvested) (the “Russell Index”), during the same period. |
| Q | What key factors were responsible for the Fund’s performance during the Reporting Period? |
| A | Several share classes of the Fund outperformed the Russell Index on a relative basis during the Reporting Period due primarily to effective sector allocation overall. Stock selection as a whole detracted, albeit modestly, from relative performance during the Reporting Period. |
| Q | Which equity market sectors most significantly affected Fund performance? |
| A | The sectors that contributed most positively to the Fund’s relative performance during the Reporting Period were industrials, consumer discretionary and information technology, wherein effective stock selection in each helped. Having underweighted allocations to industrials and consumer discretionary, each of which underperformed the Russell Index during the Reporting Period, also added value. On the other hand, challenging stock selection in health care, consumer staples and real estate detracted most from the Fund’s relative results during the Reporting Period. |
| Q | What were some of the Fund’s best-performing individual stocks? |
| A | The Fund benefited most relative to the Russell Index from positions in Alphabet, NXP Semiconductors and NVIDIA. |
Alphabet is a holding company that engages in advertising, digital content, applications, cloud offerings and more through its subsidiaries, including its largest, Google. Alphabet’s share price appreciated significantly during the Reporting Period as a result of substantially better than consensus expected revenues and earnings per share in every quarter, driven, in turn, by solid performance in advertising spending in Google, brand spending in YouTube and ongoing Cloud growth. At the end of the Reporting Period, we expected Alphabet to continue to perform well, as advertising markets appeared to be improving and margins notably bettering through cost discipline. |
NXP Semiconductors engages in the manufacture and provision of semiconductor solutions for automotive, industrial, Internet of Things, mobile and communication infrastructures. Its shares were supported during the Reporting Period by strong quarterly results, which illustrated cyclical improvement in its automotive business, continued competitive positioning and strong operating leverage even with the ongoing semiconductor shortage. We believed NXP Semiconductors’ illustration of demand and improvement on gross margins positioned the company well for continued strong performance, but we opted to sell the position, taking profits, and reallocate the proceeds elsewhere. |
8
PORTFOLIO RESULTS
NVIDIA engages in the design and manufacturing of computer graphics, processors, chipsets and related multimedia software. Its stock rallied through the end of 2020, as NVIDIA largely exceeded the market’s expectations during the announcement of its third and fourth quarter 2020 earnings. Following its announcement of its first quarter 2021 earnings, its stock saw a substantial downturn due to concerns of margin expansion and data center revenue growth. The stock quickly rebounded through the rest of the Reporting Period, as the company proved it could beat market estimates and out-innovate competitors. At the end of the Reporting Period, we believed NVIDIA was well positioned to continue to benefit from the strong secular growth themes of migration to the cloud and online entertainment along with strong performance versus its competitors. |
| Q | Which stocks detracted significantly from the Fund’s performance during the Reporting Period? |
| A | Those stocks detracting most from the Fund’s results relative to the Russell Index were Facebook, Fidelity National Information Services and Sarepta Therapeutics. |
Facebook engages in social media products that connect people though a variety of applications and hardware devices. Its stock detracted as the Fund held a slightly underweight position in the strongly performing company. Facebook consistently beat consensus earnings expectations, underpinned by advertisement revenue growth above market expectations. Facebook user growth decelerated causing modest concerns that were somewhat offset with engagement increases. At the end of the Reporting Period, we were positive on Facebook’s improving operating margins along with ongoing high barriers to entry, level of growth and margin compression. However, we thought additional headwinds may arise with the level of daily active users missing market expectations and with an increase in probing by regulatory officials affecting merger and acquisition activity and indeed possibly leading to future divestitures. Given our view that the remaining months of 2021 may be a difficult operating environment for Facebook, as we expect engagement on Facebook’s apps to potentially decline, we exited the Fund’s position in its stock. |
Fidelity National Information Services is a technology provider for banks and capital markets businesses. Its share price fell in October 2020 along with the release of its third calendar quarter earnings results. However, most of the losses were recovered in the following days as the market digested the report. Its stock price also came under pressure with news of a failed merger between the company and Global Payments in late 2020. Later, turbulence was seen in July and August 2021 when its stock price declined following a smaller than consensus expected earnings per share raise and lower implied margins as reported in its second quarter 2021 earnings release. At the end of the Reporting Period, we believed Fidelity National Information Services was well positioned to take advantage of accelerating payments innovation globally along with financial institutions continuing to outsource for technology infrastructure. |
In early January 2021, biopharmaceutical company Sarepta Therapeutics announced that the Phase Two study of one of its gene therapy drugs did not hit statistical significance, which caused its share price as well as investor optimism to decline. The company then reported in March 2021 an uneventful fourth quarter of 2020, with most of the questions surrounding the latest status on the gene therapy drug unanswered. |
| Q | How did the Fund use derivatives and similar instruments during the Reporting Period? |
| A | During the Reporting Period, we did not use derivatives as part of an active management strategy. |
| Q | Did the Fund make any significant purchases or sales during the Reporting Period? |
| A | We initiated a Fund position in consumer finance company Mastercard and eliminated the Fund’s position in Visa during the Reporting Period. We preferred Mastercard relative to Visa following what we saw as an outperformance of Visa’s fundamentals, as our view of credit improved relative to debit and as we became more optimistic in emerging market transactions, both factors potentially benefiting Mastercard relative to Visa, in our opinion. |
We established a Fund position in Marvell Technology Group, a designer, developer and seller of integrated circuits. We believe the demand for data infrastructure should remain strong, and some design win announcements may indicate continued forward momentum in the upcoming year for the company. |
As mentioned earlier, we sold the Fund’s position in Facebook during the Reporting Period. |
| Q | Were there any changes to the Fund’s portfolio management team during the Reporting Period? |
| A | There were no changes to the Fund’s portfolio management team during the Reporting Period. |
9
PORTFOLIO RESULTS
| Q | Were there any notable changes in the Fund’s weightings during the Reporting Period? |
| A | In constructing the Fund’s portfolio, we focus on picking stocks rather than on making industry or sector bets. We seek to outpace the benchmark index by overweighting stocks that we expect to outperform and underweighting those that we think may lag. Consequently, changes in its sector weights are generally the direct result of individual stock selection or of stock appreciation or depreciation. That said, during the Reporting Period, the Fund’s exposure to consumer discretionary and health care increased and its allocations to communication services, financials, industrials, information technology and real estate decreased relative to the Russell Index. |
| Q | How was the Fund positioned relative to its benchmark index at the end of August 2021? |
| A | At the end of August 2021, the Fund had overweighted positions relative to the Russell Index in the health care and communication services sectors. On the same date, the Fund had underweighted positions compared to the Russell Index in consumer discretionary, industrials and information technology. The Fund was rather neutrally weighted relative to the Russell Index in consumer staples, materials and real estate and had no positions at all in the utilities, energy and financials sectors at the end of the Reporting Period. |
10
FUND BASICS
Concentrated Growth Fund
as of August 31, 2021
| TOP TEN HOLDINGS AS OF 8/31/211 | ||||||||
Holding | % of Net Assets | Line of Business | ||||||
Microsoft Corp. | 8.8 | % | Software | |||||
Apple, Inc. | 7.7 | Technology Hardware, Storage & Peripherals | ||||||
Alphabet, Inc., Class A | 7.5 | Interactive Media & Services | ||||||
NVIDIA Corp. | 4.9 | Semiconductors & Semiconductor Equipment | ||||||
Amazon.com, Inc. | 4.5 | Internet & Direct Marketing Retail | ||||||
Mastercard, Inc., Class A | 4.2 | IT Services | ||||||
PayPal Holdings, Inc. | 3.2 | IT Services | ||||||
Adobe, Inc. | 3.0 | Software | ||||||
Workday, Inc., Class A | 3.0 | Software | ||||||
Netflix, Inc. | 3.0 | Entertainment | ||||||
| 1 | The top 10 holdings may not be representative of the Fund’s future investments. |
| FUND VS. BENCHMARK SECTOR ALLOCATION2 |
| As of August 31, 2021 |
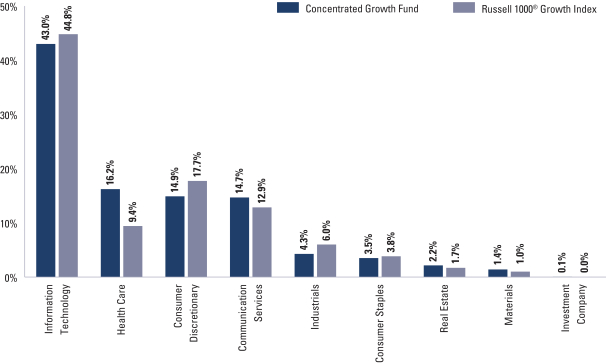
| 2 | The Fund is actively managed and, as such, its composition may differ over time. Consequently, the Fund’s overall sector allocations may differ from the percentages contained in the graph above. Figures in the above graph may not sum to 100% due to the exclusion of other assets and liabilities. The graph categorizes investments using the Global Industry Classification Standard (“GICS”), however, the sector classifications used by the portfolio management team may differ from GICS. The percentage shown for each investment category reflects the value of investments in that category as a percentage of market value. The graph depicts the Fund’s investments but may not represent the Fund’s market exposure due to the exclusion of certain derivatives, if any, as listed in the Additional Investment Information section of the Schedule of Investments. |
For more information about the Fund, please refer to www.GSAMFUNDS.com. There, you can learn more about the Fund’s investment strategies, holdings, and performance.
11
GOLDMAN SACHS CONCENTRATED GROWTH FUND
Performance Summary
August 31, 2021
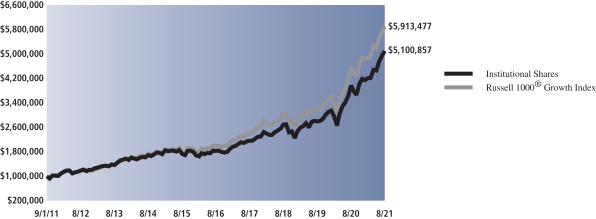
The following graph shows the value, as of August 31, 2021, of a $1,000,000 investment made on September 1, 2011 in Institutional Shares at NAV. For comparative purposes, the performance of the Fund’s benchmark, the Russell 1000® Growth Index (with dividends reinvested), is shown. Performance reflects applicable fee waivers and/or expense limitations in effect during the periods shown and in their absence, performance would be reduced. Returns do not reflect the deduction of taxes that a shareholder would pay on Fund distributions or the redemption of Fund shares. The returns set forth below represent past performance. Past performance does not guarantee future results. The Fund’s investment return and principal value will fluctuate so that an investor’s shares, when redeemed, may be worth more or less than their original cost. Current performance may be lower or higher than the performance quoted below. Please visit our web site at www.GSAMFUNDS.com to obtain the most recent month-end returns.
| Concentrated Growth Fund’s 10 Year Performance |
Performance of a $1,000,000 Investment, including any applicable sales charges, with distributions reinvested, from September 1, 2011 through August 31, 2021.
| Average Annual Total Return through August 31, 2021* | One Year | Five Years | Ten Years | Since Inception | ||||||||||
Class A | ||||||||||||||
Excluding sales charges | 28.17% | 22.31% | 17.24% | — | ||||||||||
Including sales charges | 21.14% | 20.93% | 16.58% | — | ||||||||||
| ||||||||||||||
Class C | ||||||||||||||
Excluding contingent deferred sales charges | 27.24% | 21.40% | 16.37% | — | ||||||||||
Including contingent deferred sales charges | 26.15% | 21.40% | 16.37% | — | ||||||||||
| ||||||||||||||
Institutional | 28.56% | 22.75% | 17.68% | — | ||||||||||
| ||||||||||||||
Investor | 28.50% | 22.63% | 17.54% | — | ||||||||||
| ||||||||||||||
Class R6 (Commenced July 31, 2015) | 28.59% | 22.75% | N/A | 18.09% | ||||||||||
| ||||||||||||||
Class R | 27.84% | 22.00% | 16.95% | — | ||||||||||
| ||||||||||||||
Class P (Commenced April 17, 2018) | 28.60% | N/A | N/A | 24.78% | ||||||||||
| ||||||||||||||
| * | These returns assume reinvestment of all distributions at NAV and reflect a maximum initial sales charge of 5.50% for Class A Shares and the assumed contingent deferred sales charge for Class C Shares (1% if redeemed within 12 months of purchase). Because Institutional, Investor, Class P, Class R and Class R6 Shares do not involve a sales charge, such a charge is not applied to their Average Annual Total Return. |
12
PORTFOLIO RESULTS
Goldman Sachs Flexible Cap Fund
Portfolio Composition
The Fund invests, under normal circumstances, at least 80% of its net assets plus any borrowings for investment purposes (measured at time of purchase) (“Net Assets”) in equity investments in small-, mid- and large-cap issuers. The Fund seeks to achieve its investment objective by investing, under normal circumstances, in companies that are considered by the Investment Adviser to be positioned for long-term growth of capital. This strategy is combined with a quantitative risk allocation process that is used to assist portfolio construction and trading decisions.
Portfolio Management Discussion and Analysis
Below, the Goldman Sachs Fundamental Equity U.S. Equity Team discusses the Goldman Sachs Flexible Cap Fund’s (the “Fund”) performance and positioning for the 12-month period ended August 31, 2021 (the “Reporting Period”).
| Q | How did the Fund perform during the Reporting Period? |
| A | During the Reporting Period, the Fund’s Class A, Class C, Institutional, Investor, Class R6, Class R and Class P Shares generated average annual total returns, without sales charges, of 30.12%, 29.19%, 30.62%, 30.39%, 30.64%, 29.78% and 30.55%, respectively. These returns compare to the 31.17% average annual total return of the Fund’s benchmark, the S&P 500 Index (with dividends reinvested), during the same period. |
| Q | What key factors were responsible for the Fund’s performance during the Reporting Period? |
| A | The Fund posted robust double-digit share price gains but underperformed the S&P 500 Index on a relative basis during the Reporting Period due primarily to stock selection. Sector allocation as a whole had a rather neutral effect on relative performance during the Reporting Period. |
| Q | Which equity market sectors most significantly affected Fund performance? |
| A | The sectors that detracted most from the Fund’s relative results during the Reporting Period were consumer staples, energy and materials, wherein stock selection proved challenging. The sectors that contributed most positively to the Fund’s relative performance during the Reporting Period were financials, communication services and real estate. Effective stock selection drove results in each of these sectors. |
| Q | Which stocks detracted significantly from the Fund’s performance during the Reporting Period? |
| A | Detracting most from the Fund’s results relative to the S&P 500 Index were positions in Sarepta Therapeutics, Bank of America and Facebook. |
| In early January 2021, biopharmaceutical company Sarepta Therapeutics announced that the Phase Two study of one of its gene therapy drugs did not hit statistical significance, which caused its share price as well as investor optimism to decline. The company then reported in March 2021 an uneventful fourth quarter of 2020, with most of the questions surrounding the latest status on the gene therapy drug unanswered. Ultimately, we decided to exit the Fund’s position in Sarepta Therapeutics given the lack of catalysts in the near term along with a questionable timeline for its gene therapy treatment. |
| While the stock of financial institution Bank of America had very few negative developments during the Reporting Period, the Fund’s previously underweight position in its stock detracted from relative returns. We increased the Fund’s position in Bank of America during the Reporting Period on our view that Bank of America is appealing from a rate sensitivity and capital return standpoint and is also generally well positioned with a strong deposit base over the long term. |
Facebook engages in social media products that connect people though a variety of applications and hardware devices. Its stock detracted as the Fund held a slightly underweight position in the company. Facebook consistently beat consensus earnings expectations, underpinned by advertisement revenue growth above market expectations. Facebook user growth decelerated causing modest concerns that were somewhat offset with engagement increases. At the end of the Reporting Period, we were positive on Facebook’s improving operating margins along with ongoing high barriers to entry, level of growth and margin compression. However, we thought additional headwinds may arise with the level of daily active users missing market expectations and with an increase in probing by regulatory officials |
13
PORTFOLIO RESULTS
| affecting merger and acquisition activity and indeed possibly leading to future divestitures. Given our view that the remaining months of 2021 may be a difficult operating environment for Facebook, as we expect engagement on Facebook’s apps to potentially decline, we continued to hold the Fund’s position in its stock but maintained an underweight position relative to the S&P 500 Index. |
| Q | What were some of the Fund’s best-performing individual stocks? |
| A | Those stocks the Fund benefited most from relative to the S&P 500 Index were positions in Discover Financial Services, SVB Financial Group and East West Bancorp — each a constituent of the financials sector of the S&P 500 Index. |
| Discover Financial Services’ strong performance during the Reporting Period was driven by largely positive earnings reports. Increased consumer spending progressed toward normal activity levels as well. At the end of the Reporting Period, we maintained conviction in Discover Financial Services, as broader economic activity resumes and pay-down rates normalize. |
| SVB Financial Group is a west coast bank focused primarily on lending to technology-based companies. In addition to broad strength within banks during the Reporting Period, SVB Financial Group performed well as a result of its higher growth profile relative to its peers and solid warrant and investment gains, better than consensus expected investment banking results and improved provisions for losses. At the end of the Reporting Period, we continued to believe SVB Financial Group was a niche investment opportunity given its long-standing relationships in the technology, health sciences, private equity and venture capital industries. We viewed these relationships as beneficial to driving outsized loan and deposit growth relative to peers. Additionally, we were optimistic that SVB Financial Group had altered its risk profile to be less exposed to early-stage companies. |
| East West Bank Bancorp, a bank holding company offering financial services, saw its share price appreciate in late January 2021 on its fourth quarter 2020 earnings release, which featured revenue, net interest income and earnings per share surpassing consensus expectations. Improved market conditions and a better rate environment buoyed the broader financials sector as well. At the end of the Reporting Period, we believed the political backdrop may impact the company’s business. However, its Chief Executive Officer is expecting more stability in Chinese/American relations under the current U.S. Administration. Although the backdrop remained uncertain, we remained confident in East West Bancorp given what we viewed as relatively positive developments from a credit, growth and margin standpoint. |
| Q | How did the Fund use derivatives and similar instruments during the Reporting Period? |
| A | During the Reporting Period, we did not use derivatives as part of an active management strategy. |
| Q | Did the Fund make any significant purchases or sales during the Reporting Period? |
| A | We initiated a Fund position in electric car maker Tesla during the Reporting Period, as we are optimistic on its improved profitability potential and the long-term outlook for electric vehicles. |
| We established a Fund position in S&P Global, an independent ratings and capital markets services provider. The company had benefited from an outsized issuance environment in 2020, and we believe the company has a good runway for growth remaining. |
| Conversely, in addition to the sale of Sarepta Therapeutics mentioned earlier, we sold the Fund’s position in software and technology services firm Accenture. We no longer expected our investment thesis to come to realization in the near term, ultimately motivating us to allocate the sale proceeds to what we considered to be more attractive investment opportunities elsewhere. |
| Following strong performance during the Reporting Period, we exited the Fund’s position in integrated energy company Chevron in favor of what we felt were more attractive risk/reward opportunities. |
| Q | Were there any changes to the Fund’s portfolio management team during the Reporting Period? |
| A | Effective September 30, 2020, Silverio Foresi no longer served as a portfolio manager for the Fund. There were no other changes to the Fund’s portfolio management team during the Reporting Period. |
| Q | Were there any notable changes in the Fund’s weightings during the Reporting Period? |
| A | In constructing the Fund’s portfolio, we focus on picking stocks rather than on making industry or sector bets. We seek to outpace the benchmark index by overweighting stocks that we expect to outperform and underweighting those that we think may lag. Consequently, changes in its sector weights |
14
PORTFOLIO RESULTS
| are generally the direct result of individual stock selection or of stock appreciation or depreciation. That said, during the Reporting Period, there were no notable changes in the Fund’s sector weightings. |
| Q | How was the Fund positioned relative to its benchmark index at the end of August 2021? |
| A | At the end of August 2021, the Fund was rather neutrally weighted to all 11 sectors in the S&P 500 Index. |
15
FUND BASICS
Flexible Cap Fund
as of August 31, 2021
| TOP TEN HOLDINGS AS OF 8/31/211 | ||||||||
Holding | % of Net Assets | Line of Business | ||||||
Microsoft Corp. | 6.4 | % | Software | |||||
Apple, Inc. | 5.6 | Technology Hardware, Storage & Peripherals | ||||||
Amazon.com, Inc. | 4.3 | Internet & Direct Marketing Retail | ||||||
Alphabet, Inc., Class A | 2.8 | Interactive Media & Services | ||||||
Alphabet, Inc., Class C | 2.3 | Interactive Media & Services | ||||||
JPMorgan Chase & Co. | 1.8 | Banks | ||||||
Facebook, Inc., Class A | 1.7 | Interactive Media & Services | ||||||
UnitedHealth Group, Inc. | 1.5 | Health Care Providers & Services | ||||||
Adobe, Inc. | 1.4 | Software | ||||||
Berkshire Hathaway, Inc., Class B | 1.4 | Diversified Financial Services | ||||||
| 1 | The top 10 holdings may not be representative of the Fund’s future investments. |
| FUND VS. BENCHMARK SECTOR ALLOCATION2 |
| As of August 31, 2021 |
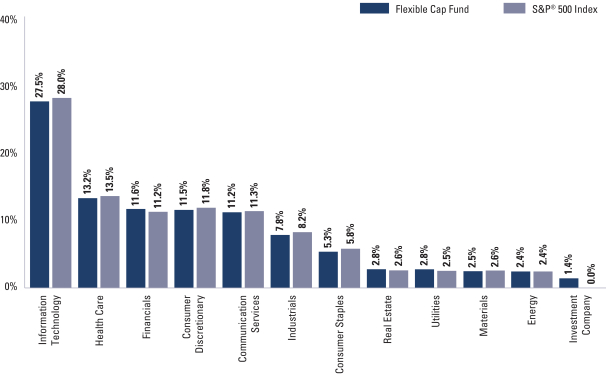
| 2 | The Fund is actively managed and, as such, its composition may differ over time. Consequently, the Fund’s overall sector allocations may differ from the percentages contained in the graph above. Figures in the above graph may not sum to 100% due to the exclusion of other assets and liabilities. The graph categorizes investments using the Global Industry Classification Standard (“GICS”), however, the sector classifications used by the portfolio management team may differ from GICS. The percentage shown for each investment category reflects the value of investments in that category as a percentage of market value. The graph depicts the Fund’s investments but may not represent the Fund’s market exposure due to the exclusion of certain derivatives, if any, as listed in the Additional Investment Information section of the Schedule of Investments. |
For more information about the Fund, please refer to www.GSAMFUNDS.com. There, you can learn more about the Fund’s investment strategies, holdings, and performance.
16
GOLDMAN SACHS FLEXIBLE CAP FUND
Performance Summary
August 31, 2021
The following graph shows the value, as of August 31, 2021, of a $10,000 investment made on September 1, 2011 in Class A Shares at NAV (with the maximum sales charge of 5.50%). For comparative purposes, the performance of the Fund’s benchmark, the S&P 500® Index (with dividends reinvested), is shown. Performance reflects applicable fee waivers and/or expense limitations in effect during the periods shown and in their absence, performance would be reduced. Returns do not reflect the deduction of taxes that a shareholder would pay on Fund distributions or the redemption of Fund shares. The returns set forth below represent past performance. Past performance does not guarantee future results. The Fund’s investment return and principal value will fluctuate so that an investor’s shares, when redeemed, may be worth more or less than their original cost. Current performance may be lower or higher than the performance quoted below. Please visit our web site at www.GSAMFUNDS.com to obtain the most recent month-end returns.
| Flexible Cap Growth Fund’s 10 Year Performance |
Performance of a $10,000 Investment, including any applicable sales charges, with distributions reinvested, from September 1, 2011 through August 31, 2021.
![]()
| Average Annual Total Return through August 31, 2021* | One Year | Five Years | Ten Years | Since Inception | ||||||||||
Class A | ||||||||||||||
Excluding sales charges | 30.12% | 18.53% | 16.09% | — | ||||||||||
Including sales charges | 22.98% | 17.20% | 15.44% | — | ||||||||||
| ||||||||||||||
Class C | ||||||||||||||
Excluding contingent deferred sales charges | 29.19% | 17.63% | 15.22% | — | ||||||||||
Including contingent deferred sales charges | 28.12% | 17.63% | 15.22% | — | ||||||||||
| ||||||||||||||
Institutional | 30.62% | 18.97% | 16.54% | — | ||||||||||
| ||||||||||||||
Investor | 30.39% | 18.81% | 16.38% | — | ||||||||||
| ||||||||||||||
Class R6 (Commenced July 31, 2015) | 30.64% | 18.98% | N/A | 14.93% | ||||||||||
| ||||||||||||||
Class R | 29.78% | 18.22% | 15.81% | — | ||||||||||
| ||||||||||||||
Class P (Commenced April 17, 2018) | 30.55% | N/A | N/A | 18.42% | ||||||||||
| ||||||||||||||
| * | These returns assume reinvestment of all distributions at NAV and reflect a maximum initial sales charge of 5.50% for Class A Shares and the assumed contingent deferred sales charge for Class C Shares (1% if redeemed within 12 months of purchase). Because Institutional, Investor, Class P, Class R and Class R6 Shares do not involve a sales charge, such a charge is not applied to their Average Annual Total Return. |
17
PORTFOLIO RESULTS
Goldman Sachs Growth Opportunities Fund
Portfolio Composition
The Fund invests primarily in medium-sized growth companies. The Fund seeks to achieve its investment objective of seeking long-term growth of capital by investing, under normal circumstances, in companies that are considered by the Investment Adviser to be positioned for long-term growth. Although the Fund invests primarily in publicly traded U.S. securities, it may invest up to 25% of its total assets in foreign securities, including securities of issuers in emerging countries and securities quoted in foreign currencies. The Fund may also invest in privately held companies and companies that only recently began to trade publicly.
Portfolio Management Discussion and Analysis
Below, the Goldman Sachs Fundamental Equity U.S. Equity Team discusses the Goldman Sachs Growth Opportunities Fund’s (the “Fund”) performance and positioning for the 12-month period ended August 31, 2021 (the “Reporting Period”).
| Q | How did the Fund perform during the Reporting Period? |
| A | During the Reporting Period, the Fund’s Class A, Class C, Institutional, Service, Investor, Class R6, Class R and Class P Shares generated average annual total returns, without sales charges, of 33.85%, 32.89%, 34.27%, 33.59%, 34.19%, 34.27%, 33.44% and 34.26%, respectively. These returns compare to the 35.17% average annual total return of the Fund’s benchmark, the Russell Midcap® Growth Index (with dividends reinvested) (the “Russell Index”), during the same period. |
| Q | What key factors were responsible for the Fund’s performance during the Reporting Period? |
| A | The Fund delivered robust double-digit absolute gains but underperformed the Russell Index on a relative basis during the Reporting Period due primarily to sector allocation as a whole. Stock selection overall contributed positively to relative performance. |
| Q | Which equity market sectors most significantly affected Fund performance? |
| A | The sectors that detracted most from the Fund’s relative performance during the Reporting Period were information technology, industrials and health care, wherein stock selection proved challenging. Having an underweight to information technology, which outperformed the Russell Index during the Reporting Period, also hurt. The sectors that contributed most positively to the Fund’s relative performance during the Reporting Period were financials, communication services and consumer discretionary, wherein effective stock selection drove results. |
| Q | Which stocks detracted significantly from the Fund’s performance during the Reporting Period? |
| A | Detracting most from the Fund’s results relative to the Russell Index were positions in transformative medicines company Moderna, spices and seasonings manufacturer McCormick & Company and software solutions developer Splunk. |
| Moderna was a strong performer during the Reporting Period on the back of its success with a COVID-19 vaccine. However, it was a top detractor from the Fund’s results because we decided to exit the position in November 2020 on our belief that the company’s valuation had grown too quickly on its vaccine effectiveness. In our view, there were still many unknowns in this business, such as duration of COVID-19 protection, competition and pricing. However, the stock’s momentum continued after we sold the position given the actual COVID-19 vaccine rollout, discussion of booster shots and what is widely anticipated to be positive upcoming mRNA flu vaccine data. |
| McCormick & Company was adversely affected by supply chain constraints at the end of 2020. More specifically, poor results were driven by the company suspending the shipment of a lot of items to focus on key holiday items, putting some customers on allocation. While McCormick & Company lagged peers in the consumer staples sector and food industry during the Reporting Period, we believed at the end of the Reporting Period it was better positioned to perform well, benefiting both from its November 2020 Cholula Hot Sauce acquisition and increases in home cooking given ongoing COVID-19 pandemic trends. |
18
PORTFOLIO RESULTS
Shares of Splunk first came under pressure during the Reporting Period in December 2020 after an earnings report was negatively impacted by three large customer deals that the company was unable to close, ultimately losing the business. Its share price also fell in line with the broader information technology sector in the first quarter of 2021 and as a result of departures of senior leaders. At the end of the Reporting Period, we remained confident in Splunk’s prospects given its transition to a subscription-based pricing model and what we saw as its near-term upsell opportunity with its existing renewal base and its relatively inexpensive valuation. |
| Q | What were some of the Fund’s best-performing individual stocks? |
| A | The Fund benefited most relative to the Russell Index from positions in direct banking and payment services provider Discover Financial Services, cloud-based marketing and sales software provider HubSpot and social media company Snap. |
Discover Financial Services’ strong performance during the Reporting Period was driven by largely positive earnings reports. Increased consumer spending progressed toward normal activity levels as well. At the end of the Reporting Period, conviction in Discover Financial Services should broader economic activity resume and pay-down rates normalize as we anticipate. |
The share price of HubSpot appreciated following the company’s announcement of the launch of Operations Hub. Operations Hub aims to make the sales process more efficient, coordinated, automated and based on a synced set of customer data. In early May 2021, HubSpot reported first quarter 2021 results that beat consensus expectations, highlighted by significant billings growth and an acceleration in net customer additions. At the end of the Reporting Period, we remained optimistic that HubSpot may benefit from a shift in demand for front office software as business activities become more dominantly online. We also remained confident in HubSpot’s ongoing ability to grow revenues through year end 2021 while continuing to make progress toward its long-term financial targets. |
Shares of Snap benefited during the Reporting Period from improved monetization prospects and solid growth in revenues and daily active users. While we continued to think advertisement spending and monetization for the company would improve, we decided to exit the Fund’s position in Snap in October 2020 after the sharp increase in its stock price. |
| Q | How did the Fund use derivatives and similar instruments during the Reporting Period? |
| A | During the Reporting Period, we did not use derivatives as part of an active management strategy. |
| Q | Did the Fund make any significant purchases or sales during the Reporting Period? |
| A | We initiated a Fund position in online travel services company Expedia during the Reporting Period. We believe Expedia will likely benefit from pent-up demand for travel following the rollout of COVID-19 vaccines. We are also encouraged by the company’s progress on cost-cutting metrics, strength in its Vrbo business and what we see as its solid balance sheet. |
We established a Fund position in biotechnology company Agilent Technologies. Agilent Technologies’ management has been highlighting the upside potential to its business segments’ cyclical tailwinds. We believe in the company’s positive incremental upside potential and are optimistic about its end-market strength. |
Conversely, in addition to those sales mentioned earlier, we exited the Fund’s position in household product manufacturer Church & Dwight. While we remain optimistic about consumer spending and the company management’s ability to achieve its 2021 guidance, we ultimately decided to sell the position in favor of what we believed to be better risk/reward prospects elsewhere. |
We eliminated the Fund’s position in cloud services company Akamai Technologies. In February 2021, it became apparent to us that the upside potential of our investment thesis for the company was unlikely to play out for the next year or so. This led us to exit the position and reallocate the capital to what we saw as more attractive investment opportunities. |
| Q | Were there any changes to the Fund’s portfolio management team during the Reporting Period? |
| A | There were no changes to the Fund’s portfolio management team during the Reporting Period. |
| Q | Were there any notable changes in the Fund’s weightings during the Reporting Period? |
| A | In constructing the Fund’s portfolio, we focus on picking stocks rather than on making industry or sector bets. We seek to outpace the benchmark index by overweighting stocks that we expect to outperform and underweighting those that we think may lag. Consequently, changes in its sector weights |
19
PORTFOLIO RESULTS
| are generally the direct result of individual stock selection or of stock appreciation or depreciation. That said, during the Reporting Period, the Fund’s exposure to communication services, consumer staples, health care and materials increased and its allocations to consumer discretionary, energy and financials decreased relative to the Russell Index. |
| Q | How was the Fund positioned relative to its benchmark index at the end of August 2021? |
| A | At the end of August 2021, the Fund had overweighted positions relative to the Russell Index in the health care, industrials, materials and consumer staples sectors. On the same date, the Fund had underweighted positions compared to the Russell Index in consumer discretionary, information technology, financials and real estate. The Fund was rather neutrally weighted to the Index in communication services and energy and had no position at all in utilities at the end of the Reporting Period. |
20
FUND BASICS
Growth Opportunities Fund
as of August 31, 2021
| TOP TEN HOLDINGS AS OF 8/31/211 | ||||||||
| Holding | % of Net Assets | Line of Business | ||||||
| DocuSign, Inc. | 2.6 | % | Software | |||||
| Cadence Design Systems, Inc. | 2.5 | Software | ||||||
| Veeva Systems, Inc., Class A | 2.4 | Health Care Technology | ||||||
| West Pharmaceutical Services, Inc. | 2.3 | Health Care Equipment & Supplies | ||||||
| Palo Alto Networks, Inc. | 2.3 | Software | ||||||
| Lululemon Athletica, Inc. | 2.3 | Textiles, Apparel & Luxury Goods | ||||||
| Etsy, Inc. | 2.2 | Internet & Direct Marketing Retail | ||||||
| CoStar Group, Inc. | 2.0 | Professional Services | ||||||
| Verisk Analytics, Inc. | 2.0 | Professional Services | ||||||
| HubSpot, Inc. | 2.0 | Software | ||||||
| 1 | The top 10 holdings may not be representative of the Fund’s future investments. |
| FUND VS. BENCHMARK SECTOR ALLOCATION2 |
| As of August 31, 2021 |
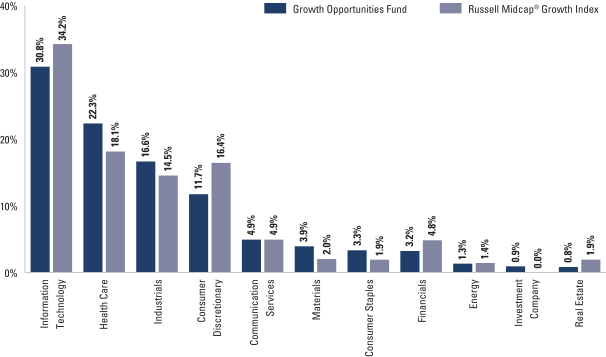
| 2 | The Fund is actively managed and, as such, its composition may differ over time. Consequently, the Fund’s overall sector allocations may differ from the percentages contained in the graph above. Figures in the above graph may not sum to 100% due to the exclusion of other assets and liabilities. The graph categorizes investments using the Global Industry Classification Standard (“GICS”), however, the sector classifications used by the portfolio management team may differ from GICS. The percentage shown for each investment category reflects the value of investments in that category as a percentage of market value. The graph depicts the Fund’s investments but may not represent the Fund’s market exposure due to the exclusion of certain derivatives, if any, as listed in the Additional Investment Information section of the Schedule of Investments. |
For more information about the Fund, please refer to www.GSAMFUNDS.com. There, you can learn more about the Fund’s investment strategies, holdings, and performance.
21
GOLDMAN SACHS GROWTH OPPORTUNITIES FUND
Performance Summary
August 31, 2021
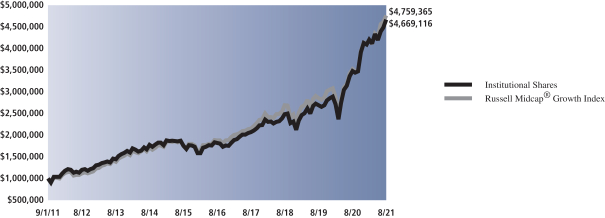
The following graph shows the value, as of August 31, 2021, of a $1,000,000 investment made on September 1, 2011 in Institutional Shares at NAV. For comparative purposes, the performance of the Fund’s benchmark the Russell Midcap® Growth Index (with dividends reinvested), is shown. Performance reflects applicable fee waivers and/or expense limitations in effect during the periods shown and in their absence, performance would be reduced. Returns do not reflect the deduction of taxes that a shareholder would pay on Fund distributions or the redemption of Fund shares. The returns set forth below represent past performance. Past performance does not guarantee future results. The Fund’s investment return and principal value will fluctuate so that an investor’s shares, when redeemed, may be worth more or less than their original cost. Current performance may be lower or higher than the performance quoted below. Please visit our web site at www.GSAMFUNDS.com to obtain the most recent month-end returns.
| Growth Opportunities Fund’s 10 Year Performance |
Performance of a $1,000,000 Investment, including any applicable sales charges, with distributions reinvested, from September 1, 2011 through August 31, 2021.
| Average Annual Total Return through August 31, 2021* | One Year | Five Years | Ten Years | Since Inception | ||||||||||
Class A | ||||||||||||||
Excluding sales charges | 33.85% | 20.32% | 16.22% | — | ||||||||||
Including sales charges | 26.47% | 18.97% | 15.56% | — | ||||||||||
| ||||||||||||||
Class C | ||||||||||||||
Excluding contingent deferred sales charges | 32.89% | 19.43% | 15.36% | — | ||||||||||
Including contingent deferred sales charges | 31.56% | 19.43% | 15.36% | — | ||||||||||
| ||||||||||||||
Institutional | 34.27% | 20.73% | 16.65% | — | ||||||||||
| ||||||||||||||
Service | 33.59% | 20.13% | 16.06% | — | ||||||||||
| ||||||||||||||
Investor | 34.19% | 20.63% | 16.51% | — | ||||||||||
| ||||||||||||||
Class R6 (Commenced July 31, 2015) | 34.27% | 20.74% | N/A | 16.22% | ||||||||||
| ||||||||||||||
Class R | 33.44% | 20.02% | 15.93% | — | ||||||||||
| ||||||||||||||
Class P (Commenced April 17, 2018) | 34.26% | N/A | N/A | 22.54% | ||||||||||
| ||||||||||||||
| * | These returns assume reinvestment of all distributions at NAV and reflect a maximum initial sales charge of 5.50% for Class A Shares and the assumed contingent deferred sales charge for Class C Shares (1% if redeemed within 12 months of purchase). Because Institutional, Service, Investor, Class P, Class R and Class R6 Shares do not involve a sales charge, such a charge is not applied to their Average Annual Total Return. |
22
PORTFOLIO RESULTS
Goldman Sachs Small Cap Growth Fund
Portfolio Composition
The Fund invests, under normal circumstances, at least 80% of its net assets plus any borrowings for investment purposes (measured at the time of purchase) (“Net Assets”) in a diversified portfolio of equity investments in small-cap issuers. Small-cap issuers are issuers with public stock market capitalizations (based upon shares available for trading on an unrestricted basis) within the range of the market capitalizations of companies constituting the Russell 2000® Growth Index at the time of investment. As of September 30, 2020, the capitalization range of the companies in the Russell 2000® Growth Index was between $29 million and $11.3 billion. The Fund seeks to achieve its investment objective of seeking long-term growth of capital by investing, under normal circumstances, in companies that are considered by the Investment Adviser to be positioned for long-term growth. Although the Fund invests primarily in publicly traded U.S. securities, it may invest up to 25% of its Net Assets in foreign securities, including securities of issuers in countries with emerging markets or economies (“emerging countries”) and securities quoted in foreign currencies. The Fund may also invest in privately held companies and companies that only recently began to trade publicly.
Portfolio Management Discussion and Analysis
Below, the Goldman Sachs Fundamental Equity U.S. Equity Team discusses the Goldman Sachs Small Cap Growth Fund’s (the “Fund”) performance and positioning for the 12-month period ended August 31, 2021 (the “Reporting Period”).
| Q | How did the Fund perform during the Reporting Period? |
| A | During the Reporting Period, the Fund’s Class A, Class C, Institutional, Investor, Class R6, Class R and Class P Shares generated average annual total returns, without sales charges, of 41.87%, 40.86%, 42.36%, 42.21%, 42.44%, 41.51% and 42.38%, respectively. These returns compare to the 35.61% average annual total return of the Fund’s benchmark, the Russell 2000® Growth Index (with dividends reinvested) (the “Russell Index”), during the same period. |
| Q | What key factors were responsible for the Fund’s performance during the Reporting Period? |
| A | The Fund outperformed the Russell Index on a relative basis during the Reporting Period due to both effective stock selection and sector allocation overall. |
| Q | Which equity market sectors most significantly affected Fund performance? |
| A | Effective stock selection in the health care, information technology and consumer discretionary sectors helped the Fund’s performance most relative to the Russell Index. Having an underweight to health care, which underperformed the Russell Index during the Reporting Period, and overweights to the information technology and consumer discretionary sectors, each of which outperformed the Russell Index during the Reporting Period, also contributed positively. Challenging stock selection in the industrials, communication services and financials sectors detracted most from the Fund’s relative results during the Reporting Period. |
| Q | What were some of the Fund’s best-performing individual stocks? |
| A | Those stocks the Fund benefited most from relative to the Russell Index were positions in Pacific Biosciences of California, Beam Therapeutics and Shockwave Medical—each a constituent of the health care sector of the Russell Index. |
Genetic analysis company Pacific Biosciences of California (“PACB”) was the top positive contributor to the Fund’s relative results during the Reporting Period. Its stock benefited during the third quarter of 2020 from a strong second quarter 2020 earnings report that demonstrated better than consensus expected earnings. The market also viewed the company’s clinical research collaboration with Asuragen favorably, driving its stock higher. PACB’s stock then got a boost during the fourth quarter of 2020 when the company announced a collaboration with Children’s Mercy Kansas City to sequence a statistically significant cohort of rare disease cases for which previous whole-genome and whole-exome sequencing studies yielded no answers. An $85 million secondary share offering in November 2020 extended the stock’s upward movement. In December 2020, PACB’s stock moved even higher following the |
23
PORTFOLIO RESULTS
| announcement of initial findings from the company’s research collaboration with Labcorp focused on SARS-CoV-2 and the related immune response to COVID-19. PACB’s stock continued to appreciate during the Reporting Period following strong earnings reports and positive forward guidance. At the end of the Reporting Period, we continued to like PACB’s management team and what we saw as its solid product cycle and innovative capabilities. |
| Beam Therapeutics is a biotechnology company that develops DNA-based editing technologies for the treatment of disease. Its stock appreciated following a secondary offering of 4.5 million shares at the end of September 2020. Its performance was further strengthened when Beam Therapeutics presented efficacy data for its cytosine base editor, BEAM-201, at the Society for Immunotherapy of Cancer Annual Meeting in November 2020. A $75 million deal with Apellis Pharmaceuticals to create new gene editing treatments for complement-driven diseases further contributed to positive stock performance for the company. At the end of the Reporting Period, we remained positive on the company’s ability to perform well in the gene editing space, which we believed was poised to grow over the long term. |
| Shockwave Medical manufactures medical devices. Its shares rose in February 2021 when the company announced the coronary Investigational Device Exemption study, Disrupt CAD III, met the primary safety and effectiveness endpoints. In March 2021, the market reacted positively to the announcement. At the end of the Reporting Period, we remained optimistic about Shockwave Medical, as its procedures and innovative technology may continue to become adopted and more cost effective. |
| Q | Which stocks detracted significantly from the Fund’s performance during the Reporting Period? |
| A | Those stocks detracting most from the Fund’s results relative to the Russell Index were positions in alternative energy technology provider Plug Power, intelligent identity solutions company Ping Identity Holding and rare disease biopharmaceutical company Inozyme Pharma. |
| While Plug Power’s fourth quarter 2020 earnings beat consensus expectations, the company’s announcement regarding accounting errors in previously issued financial statements drove its stock lower. We had initiated the Fund position in Plug Power in January 2021, but we sold the position in March 2021 as we viewed the company’s accounting issues as asymmetrically risky. |
| Ping Identity Holding saw its shares decline during the Reporting Period, as the market did not react positively to its acquisition of dynamic authorization company Symphonic Software in November 2020. Its share price continued to fall when the company announced underwhelming revenue and cash flow guidance for the fourth quarter of 2020. We exited the Fund’s position in Ping Identity Holding during the first quarter of 2021 and reallocated the proceeds to what we believed were better risk/reward opportunities elsewhere in the portfolio. |
| Second and third quarter 2020 earnings announcements kicked of Inozyme Pharma’s stock’s downward move during the Reporting Period, with its earnings misses driven by higher than expected research and development expenses. The market also reacted negatively to company management turnover, including the retirement and replacement of its chief scientific officer, the appointment of a new chief medical officer, the resignation of the senior vice president of finance and the appointment of an interim chief financial officer. We added to the Fund’s position in Inozyme Pharma on weakness. |
| Q | How did the Fund use derivatives and similar instruments during the Reporting Period? |
| A | During the Reporting Period, we did not use derivatives as part of an active management strategy. |
| Q | Did the Fund make any significant purchases or sales during the Reporting Period? |
| A | We initiated a Fund position in engineered equipment manufacturer Chart Industries during the Reporting Period. We like the company for its exposure to hydrogen and clean energy end markets. We also believe the company’s management team is deploying capital smartly through acquisition activity, solidifying the company’s leadership position in the hydrogen space. Further, its total addressable market appears to us to be growing across its business segments. |
We established a Fund position in consumer retail company Crocs. With what we view as stability in its operating expenses and pricing, we believe Crocs can withstand any shorter-term issues we see. Leveraging that with an increasing direct to consumer approach, we think Crocs is having a more pronounced impact on its own sales funnel and customer loyalty. (A sales funnel represents the ideal path companies hope buyers take to become customers.) We have also been consistently impressed with the company management’s ability to execute on its strategic plan, and we |
24
PORTFOLIO RESULTS
| believe creative and thoughtful marketing and merchandizing may result in continued success for the brand. |
| Conversely, in addition to those sales mentioned earlier, we exited the Fund’s position in Kinsale Capital Group, a specialty insurance company, in the first quarter of 2021, as we sought to move capital outside of the higher risk property & casualty insurance segment and reallocate to what we considered to be better risk/reward investment opportunities. |
| Q | Were there any changes to the Fund’s portfolio management team during the Reporting Period? |
| A | There were no changes to the Fund’s portfolio management team during the Reporting Period. |
| Q | Were there any notable changes in the Fund’s weightings during the Reporting Period? |
| A | In constructing the Fund’s portfolio, we focus on picking stocks rather than on making industry or sector bets. We seek to outpace the benchmark index by overweighting stocks that we expect to outperform and underweighting those that we think may lag. Consequently, changes in its sector weights are generally the direct result of individual stock selection or of stock appreciation or depreciation. That said, during the Reporting Period, the Fund’s exposure to consumer discretionary and information technology increased and its allocations to communication services, consumer staples, financials and health care decreased relative to the Russell Index. |
| Q | How was the Fund positioned relative to its benchmark index at the end of August 2021? |
| A | At the end of August 2021, the Fund had overweighted positions relative to the Russell Index in the information technology, industrials and consumer discretionary sectors. On the same date, the Fund had underweighted positions compared to the Russell Index in health care, communication services, consumer staples and financials. The Fund was rather neutrally weighted to the Russell Index in materials and had no positions at all in utilities, energy and real estate at the end of the Reporting Period. |
25
FUND BASICS
Small Cap Growth Fund
as of August 31, 2021
| TOP TEN HOLDINGS AS OF 8/31 /211 | ||||||||
| Holding | % of Net Assets | Line of Business | ||||||
| Chart Industries, Inc. | 1.9 | % | Machinery | |||||
| Crocs, Inc. | 1.8 | Textiles, Apparel & Luxury Goods | ||||||
| Axonics, Inc. | 1.7 | Health Care Equipment & Supplies | ||||||
| Shockwave Medical, Inc. | 1.6 | Health Care Equipment & Supplies | ||||||
| Rapid7, Inc. | 1.6 | Software | ||||||
| Halozyme Therapeutics, Inc. | 1.6 | Biotechnology | ||||||
| Watts Water Technologies, Inc., Class A | 1.6 | Machinery | ||||||
| Power Integrations, Inc. | 1.5 | Semiconductors & Semiconductor Equipment | ||||||
| Domo, Inc., Class B | 1.5 | Software | ||||||
| Novanta, Inc. | 1.4 | Electronic Equipment, Instruments & Components | ||||||
| 1 | The top 10 holdings may not be representative of the Fund’s future investments. |
| FUND VS. BENCHMARK SECTOR ALLOCATION2 |
| As of August 31, 2021 |
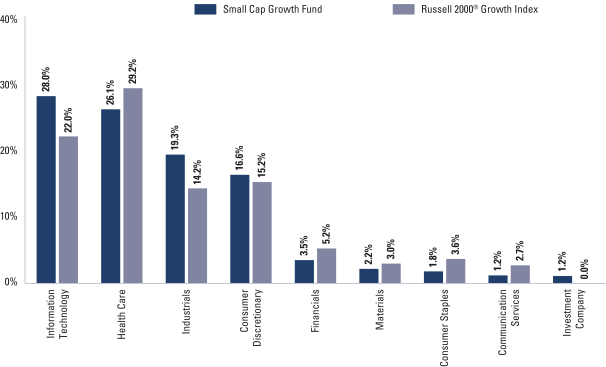
| 2 | The Fund is actively managed and, as such, its composition may differ over time. Consequently, the Fund’s overall sector allocations may differ from the percentages contained in the graph above. Figures in the above graph may not sum to 100% due to the exclusion of other assets and liabilities. The graph categorizes investments using the Global Industry Classification Standard (“GICS”), however, the sector classifications used by the portfolio management team may differ from GICS. The percentage shown for each investment category reflects the value of investments in that category as a percentage of market value. The graph depicts the Fund’s investments but may not represent the Fund’s market exposure due to the exclusion of certain derivatives, if any, as listed in the Additional Investment Information section of the Schedule of Investments. |
For more information about the Fund, please refer to www.GSAMFUNDS.com. There, you can learn more about the Fund’s investment strategies, holdings, and performance.
26
GOLDMAN SACHS SMALL CAP GROWTH FUND
Performance Summary
August 31, 2021
The following graph shows the value, as of August 31, 2021, of a $1,000,000 investment made on October 31, 2019 (commencement of operations) in Institutional Shares at NAV. For comparative purposes, the performance of the Fund’s benchmark, the Russell 2000® Growth Index (with dividends reinvested), is shown. Performance reflects applicable fee waivers and/or expense limitations in effect during the periods shown and in their absence, performance would be reduced. Returns do not reflect the deduction of taxes that a shareholder would pay on Fund distributions or the redemption of Fund shares. The returns set forth below represent past performance. Past performance does not guarantee future results. The Fund’s investment return and principal value will fluctuate so that an investor’s shares, when redeemed, may be worth more or less than their original cost. Current performance may be lower or higher than the performance quoted below. Please visit our web site at www.GSAMFUNDS.com to obtain the most recent month-end returns.
| Small Cap Growth Fund’s Lifetime Performance |
Performance of a $1,000,000 Investment, including any applicable sales charges, with distributions reinvested, from October 31, 2019 through August 31, 2021.
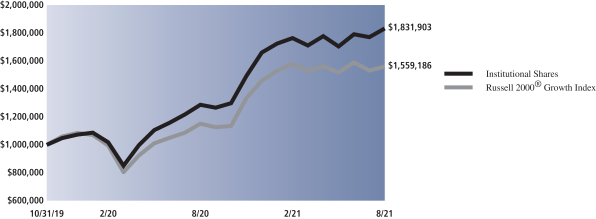
| Average Annual Total Return through August 31, 2021* | One Year | Since Inception | ||||||
Class A (Commenced October 31, 2019) | ||||||||
Excluding sales charges | 41.87% | 38.58% | ||||||
Including sales charges | 34.03% | 34.33% | ||||||
| ||||||||
Class C (Commenced October 31, 2019) | ||||||||
Excluding contingent deferred sales charges | 40.86% | 37.54% | ||||||
Including contingent deferred sales charges | 39.78% | 37.47% | ||||||
| ||||||||
Institutional (Commenced October 31, 2019) | 42.36% | 39.07% | ||||||
| ||||||||
Investor (Commenced October 31, 2019) | 42.21% | 38.91% | ||||||
| ||||||||
Class R6 (Commenced October 31, 2019) | 42.44% | 39.11% | ||||||
| ||||||||
Class R (Commenced October 31, 2019) | 41.51% | 38.24% | ||||||
| ||||||||
Class P (Commenced October 31, 2019) | 42.38% | 39.08% | ||||||
| ||||||||
| * | These returns assume reinvestment of all distributions at NAV and reflect a maximum initial sales charge of 5.50% for Class A Shares and the assumed contingent deferred sales charge for Class C Shares (1% if redeemed within 12 months of purchase). Because Institutional, Investor, Class P, Class R and Class R6 Shares do not involve a sales charge, such a charge is not applied to their Average Annual Total Return. |
27
PORTFOLIO RESULTS
Goldman Sachs Small/Mid Cap Growth Fund
Portfolio Composition
The Fund invests, under normal circumstances, at least 80% of its net assets plus any borrowings for investment purposes (measured at the time of purchase) (“Net Assets”) in a diversified portfolio of equity investments in small- and mid-cap issuers. Small- or mid-cap issuers are issuers with public stock capitalizations (based upon shares available for trading on an unrestricted basis) within the outside range of the market capitalizations of companies constituting the Russell 2000 Growth Index and the Russell Midcap Growth Index, as last reported by the indexes at the time of investment. As of September 30, 2020, the outside capitalization range of the companies in these indexes was between $188 million and $24 billion. Although the Fund invests primarily in publicly traded U.S. securities, it may invest up to 25% of its Net Assets in foreign securities, including securities of issuers in countries with emerging markets or economies and securities quoted in foreign currencies.
Portfolio Management Discussion and Analysis
Below, the Goldman Sachs Fundamental Equity U.S. Equity Team discusses the Goldman Sachs Small/Mid Cap Growth Fund’s (the “Fund”) performance and positioning for the 12-month period ended August 31, 2021 (the “Reporting Period”).
| Q | How did the Fund perform during the Reporting Period? |
| A | During the Reporting Period, the Fund’s Class A, Class C, Institutional, Service, Investor, Class R6, Class R and Class P Shares generated average annual total returns, without sales charges, of 39.05%, 38.00%, 39.51%, 38.78%, 39.37%, 39.51%, 38.72% and 39.51%, respectively. These returns compare to the 36.14% average annual total return of the Fund’s benchmark, the Russell 2500® Growth Index (with dividends reinvested) (the “Russell Index”), during the same period. |
| Q | What key factors were responsible for the Fund’s performance during the Reporting Period? |
| A | The Fund outperformed the Russell Index on a relative basis during the Reporting Period due to a combination of effective stock selection and sector allocation positioning overall. |
| Q | Which equity market sectors most significantly affected Fund performance? |
| A | Effective stock selection in the information technology, consumer discretionary and consumer staples sectors helped the Fund’s performance most relative to the Russell Index. Having overweights to the information technology and consumer discretionary sectors, which each outperformed the Russell Index during the Reporting Period, and having an underweight to consumer staples, which underperformed the Russell Index during the Reporting Period, also buoyed the Fund’s relative results. Challenging stock selection in the industrials, health care and financials sectors detracted from the Fund’s relative results during the Reporting Period. |
| Q | What were some of the Fund’s best-performing individual stocks? |
| A | Those stocks the Fund benefited most from relative to the Russell Index were positions in biotechnology company Beam Therapeutics, engine-powered products designer and manufacturer Generac Holdings and web infrastructure and website security company Cloudflare. |
| Beam Therapeutics is a biotechnology company that develops DNA-based editing technologies for the treatment of disease. Its stock appreciated following a secondary offering of 4.5 million shares at the end of September 2020. Its performance was further strengthened when Beam Therapeutics presented efficacy data for its cytosine base editor, BEAM-201, at the Society for Immunotherapy of Cancer Annual Meeting in November 2020. A $75 million deal with Apellis Pharmaceuticals to create new gene editing treatments for complement-driven diseases further contributed to positive stock performance for the company. At the end of the Reporting Period, we remained positive on the company’s ability to perform well in the gene editing space, which we believed was poised to grow over the long term. |
As climate change remained top of mind, interest in Generac Holdings’ backup power solutions was high during the |
28
PORTFOLIO RESULTS
| Reporting Period. Also, Generac Holdings made a number of acquisitions within and outside the U.S. during the Reporting Period that were well received by the market. At the end of the Reporting Period, we were optimistic that these acquisitions may establish Generac Holdings as a leading power alternative choice for residential and commercial users. |
| Cloudflare performed well during the Reporting Period. As cyber threats continued to affect businesses globally, Cloudflare’s strategic partnerships made the company a security provider of choice for many. In addition, Cloudflare’s commitment to a more environmentally friendly operation resulted in positive feedback from the market. At the end of the Reporting Period, we were optimistic that the company’s strong environmental awareness and partnerships provide a basis for favorable long-term business prospects. However, given its stock’s triple-digit gain during the Reporting Period, we opted to sell the position, taking profits, and reallocate the proceeds elsewhere. |
| Q | Which stocks detracted significantly from the Fund’s performance during the Reporting Period? |
| A | Those stocks detracting most from the Fund’s results relative to the Russell Index were positions in neuroscience-focused biopharmaceutical company Neurocrine Biosciences, global provider of medical technologies Teleflex and specialty coatings, sealants and building materials manufacturer RPM International. |
| Shares of Neurocrine Biosciences depreciated during the Reporting Period following disappointing results from the company’s INTERACT study on its schizophrenia drug Luvadaxistat. Still, at the end of the Reporting Period, we remained optimistic on Neurocrine Biosciences, as we believed the company’s drug pipeline and management team were poised for growth over the long term. |
| Growing medical demand due to COVID-19 caused manufacturing and output strains on a number of industries, including the medical devices and technologies industry. Teleflex saw revenue declines in its vascular and respiratory businesses. However, at the end of the Reporting Period, we believed Teleflex was positioned to recover from the COVID-19 setbacks due to what we saw as its strong leadership team and diversified business lines. |
| Despite growing revenues and earnings, the share price of RPM International remained volatile and depreciated during the Reporting Period. That being said, at the end of the Reporting Period, we remained positive on RPM International, as, in our view, the company continues to make strategic acquisitions that will help diversify its product offerings and, we believe, offset market shifts in the long run. |
| Q | How did the Fund use derivatives and similar instruments during the Reporting Period? |
| A | During the Reporting Period, we did not use derivatives as part of an active management strategy. |
| Q | Did the Fund make any significant purchases or sales during the Reporting Period? |
| A | We initiated a Fund position in data security and analytics company Varonis Systems during the Reporting Period. The company has launched new products and grown its businesses and additionally has reported stronger than consensus expected earnings during the Reporting Period. As more companies look to secure their sensitive data and keep security threats at bay, we believe Varonis Systems has an opportunity to capture market share and market value. |
| We established a Fund position in engineered equipment manufacturer Chart Industries during the Reporting Period. We like the company for its exposure to hydrogen and clean energy end markets. We also believe the company’s management team is deploying capital smartly through acquisition activity, solidifying the company’s leadership position in the hydrogen space. Further, its total addressable market appears to us to be growing across its business segments. |
| Conversely, in addition to the sale of Cloudflare mentioned earlier, we exited the Fund’s position in pharmaceutical design and manufacturing company West Pharmaceutical Services. Since purchasing its stock nearly four years ago, the company’s share price experienced strong performance, and as such, outgrew the Fund’s intended market capitalization criteria. With this in mind, we sold the position and reallocated the proceeds elsewhere. |
| We eliminated the Fund’s position in HubSpot, a cloud-based marketing and sales software provider. Shares of the company performed well during the Reporting Period, and the company ultimately outgrew the market capitalization criteria intended for the Fund. As such, we sold the position and reallocated the proceeds elsewhere. |
| Q | Were there any changes to the Fund’s portfolio management team during the Reporting Period? |
| A | There were no changes to the Fund’s portfolio management team during the Reporting Period. |
29
PORTFOLIO RESULTS
| Q | Were there any notable changes in the Fund’s weightings during the Reporting Period? |
| A | In constructing the Fund’s portfolio, we focus on picking stocks rather than on making industry or sector bets. We seek to outpace the benchmark index by overweighting stocks that we expect to outperform and underweighting those that we think may lag. Consequently, changes in its sector weights are generally the direct result of individual stock selection or of stock appreciation or depreciation. That said, during the Reporting Period, the Fund’s exposure to health care and information technology increased and its allocations to consumer staples and financials decreased relative to the Russell Index. |
| Q | How was the Fund positioned relative to its benchmark index at the end of August 2021? |
| A | At the end of August 2021, the Fund had overweighted positions relative to the Russell Index in the industrials, health care and information technology sectors. On the same date, the Fund had underweighted positions compared to the Russell Index in financials, communication services and consumer staples. The Fund was rather neutrally weighted to the Russell Index in consumer discretionary and materials and had no positions at all in utilities, energy and real estate at the end of the Reporting Period. |
30
FUND BASICS
Small/Mid Cap Growth Fund
as of August 31, 2021
| TOP TEN HOLDINGS AS OF 8/31/211 | ||||||||
Holding | % of Net Assets | Line of Business | ||||||
Dynatrace, Inc. | 2.2 | % | Software | |||||
Entegris, Inc. | 2.1 | Semiconductors & Semiconductor Equipment | ||||||
PerkinElmer, Inc. | 1.9 | Life Sciences Tools & Services | ||||||
Bill.com Holdings, Inc. | 1.8 | Software | ||||||
Molina Healthcare, Inc. | 1.8 | Health Care Providers & Services | ||||||
Bio-Techne Corp. | 1.7 | Life Sciences Tools & Services | ||||||
Monolithic Power Systems, Inc. | 1.7 | Semiconductors & Semiconductor Equipment | ||||||
RH | 1.6 | Specialty Retail | ||||||
Guardant Health, Inc. | 1.6 | Health Care Providers & Services | ||||||
Avalara, Inc. | 1.6 | Software | ||||||
| 1 | The top 10 holdings may not be representative of the Fund’s future investments. |
| FUND VS. BENCHMARK SECTOR ALLOCATION2 |
| As of August 31, 2021 |
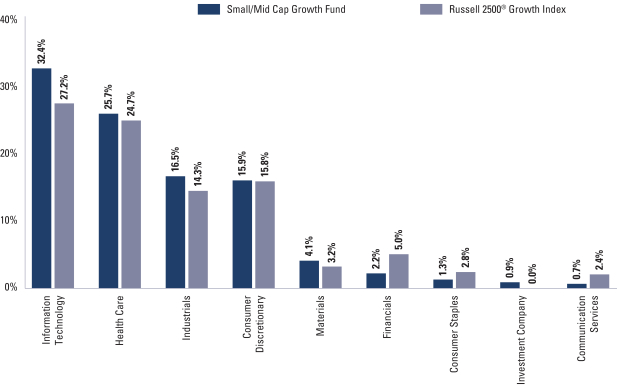
| 2 | The Fund is actively managed and, as such, its composition may differ over time. Consequently, the Fund’s overall sector allocations may differ from the percentages contained in the graph above. Figures in the above graph may not sum to 100% due to the exclusion of other assets and liabilities. The graph categorizes investments using the Global Industry Classification Standard (“GICS”), however, the sector classifications used by the portfolio management team may differ from GICS. The percentage shown for each investment category reflects the value of investments in that category as a percentage of market value. The graph depicts the Fund’s investments but may not represent the Fund’s market exposure due to the exclusion of certain derivatives, if any, as listed in the Additional Investment Information section of the Schedule of Investments. |
For more information about the Fund, please refer to www.GSAMFUNDS.com. There, you can learn more about the Fund’s investment strategies, holdings, and performance.
31
GOLDMAN SACHS SMALL/MID CAP GROWTH FUND
Performance Summary
August 31, 2021
The following graph shows the value, as of August 31, 2021, of a $1,000,000 investment made on September 1, 2011 in Institutional Shares at NAV. For comparative purposes, the performance of the Fund’s benchmark, the Russell 2500® Growth Index (with dividends reinvested), is shown. Performance reflects applicable fee waivers and/or expense limitations in effect during the periods shown and in their absence, performance would be reduced. Returns do not reflect the deduction of taxes that a shareholder would pay on Fund distributions or the redemption of Fund shares. The returns set forth below represent past performance. Past performance does not guarantee future results. The Fund’s investment return and principal value will fluctuate so that an investor’s shares, when redeemed, may be worth more or less than their original cost. Current performance may be lower or higher than the performance quoted below. Please visit our web site at www.GSAMFUNDS.com to obtain the most recent month-end returns.
| Small/Mid Cap Growth Fund’s 10 Year Performance |
Performance of a $1,000,000 Investment, including any applicable sales charges, with distributions reinvested, from September 1, 2011 through August 31, 2021.
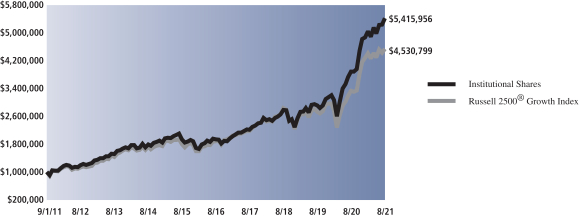
| Average Annual Total Return through August 31, 2021* | One Year | Five Years | Ten Years | Since Inception | ||||||||||
Class A | ||||||||||||||
Excluding sales charges | 39.05% | 22.44% | 17.96% | — | ||||||||||
Including sales charges | 31.41% | 21.06% | 17.29% | — | ||||||||||
| ||||||||||||||
Class C | ||||||||||||||
Excluding contingent deferred sales charges | 38.00% | 21.54% | 17.07% | — | ||||||||||
Including contingent deferred sales charges | 36.79% | 21.54% | 17.07% | — | ||||||||||
| ||||||||||||||
Institutional | 39.51% | 22.86% | 18.39% | — | ||||||||||
| ||||||||||||||
Service | 38.78% | 22.24% | 17.80% | — | ||||||||||
| ||||||||||||||
Investor | 39.37% | 22.74% | 18.25% | — | ||||||||||
| ||||||||||||||
Class R6 (Commenced July 31, 2015) | 39.51% | 22.88% | N/A | 16.87% | ||||||||||
| ||||||||||||||
Class R | 38.72% | 22.13% | 17.66% | — | ||||||||||
| ||||||||||||||
Class P (Commenced April 17, 2018) | 39.51% | N/A | N/A | 24.90% | ||||||||||
| ||||||||||||||
| * | These returns assume reinvestment of all distributions at NAV and reflect a maximum initial sales charge of 5.50% for Class A Shares and the assumed contingent deferred sales charge for Class C Shares (1% if redeemed within 12 months of purchase). Because Institutional, Service, Investor, Class P, Class R and Class R6 Shares do not involve a sales charge, such a charge is not applied to their Average Annual Total Return. |
32
PORTFOLIO RESULTS
Goldman Sachs Strategic Growth Fund
Portfolio Composition
The Fund invests primarily in U.S. equity investments. The Fund seeks to achieve its investment objective of seeking long-term growth of capital by investing, under normal circumstances, in companies that are considered by the Investment Adviser to be positioned for long-term growth. The Fund’s fundamental equity growth investment process involves evaluating potential investments based on specific characteristics believed to indicate a high quality business with sustainable growth including strong business franchises, favorable long-term prospects and excellent management.
At a special meeting of the shareholders of the Goldman Sachs Trust held on April 16, 2021, the Fund’s shareholders approved a proposal to change the Fund’s sub-classification under the Investment Company Act of 1940, as amended, from “diversified” to “non-diversified” and eliminated the related fundamental investment restriction.
Accordingly, effective that same date, the Fund was “non-diversified” and may invest a greater portion of its assets in one or more issuers or in fewer issuers than “diversified” mutual funds. As a “non-diversified” fund, the Fund may be more susceptible to adverse developments affecting any single issuer held in its portfolio, and may be more susceptible to greater losses because of these developments.
Portfolio Management Discussion and Analysis
Below, the Goldman Sachs Fundamental Equity U.S. Equity Team discusses the Goldman Sachs Strategic Growth Fund’s (the “Fund”) performance and positioning for the 12-month period ended August 31, 2021 (the “Reporting Period”).
| Q | How did the Fund perform during the Reporting Period? |
| A | During the Reporting Period, the Fund’s Class A, Class C, Institutional, Service, Investor, Class R6, Class R and Class P Shares generated average annual total returns, without sales charges, of 29.11%, 28.22%, 29.65%, 29.09%, 29.42%, 29.57%, 28.74% and 29.61%, respectively. These returns compare to the 28.53% average annual total return of the Fund’s benchmark, the Russell 1000® Growth Index (with dividends reinvested) (the “Russell Index”), during the same period. |
| Q | What key factors were responsible for the Fund’s performance during the Reporting Period? |
| A | Most share classes of the Fund outperformed the Russell Index on a relative basis during the Reporting Period, attributable primarily to effective stock selection overall. Sector allocation as a whole also contributed positively to relative performance. |
| Q | Which equity market sectors most significantly affected Fund performance? |
| A | The sectors that contributed most positively to the Fund’s relative performance during the Reporting Period were communication services, consumer discretionary and industrials, wherein effective stock selection drove results. Having an overweighted allocation to communication services, which outperformed the Russell Index during the Reporting Period, also added value. Challenging stock selection in information technology, health care and real estate detracted from the Fund’s relative performance most during the Reporting Period. |
| Q | What were some of the Fund’s best-performing individual stocks? |
| A | Those stocks the Fund benefited most from relative to the Russell Index were positions in Snap, Alphabet and NVIDIA. |
| Shares of social media company Snap benefited during the Reporting Period from improved monetization prospects and solid growth in revenues and daily active users. At the end of the Reporting Period, we continued to think advertisement spending and monetization for the company would improve, but we trimmed the Fund’s position in Snap after the sharp increase in its stock price. |
Alphabet is a holding company that engages in advertising, digital content, applications, cloud offerings and more through its subsidiaries, including its largest, Google. Alphabet’s share price appreciated significantly during the Reporting Period as a result of substantially better than consensus expected revenues and earnings per share in every quarter, driven, in turn, by solid performance in advertising |
33
PORTFOLIO RESULTS
| spending in Google, brand spending in YouTube and ongoing Cloud growth. At the end of the Reporting Period, we expected Alphabet to continue to perform well, as advertising markets appeared to be improving and margins notably bettering through cost discipline. |
| NVIDIA engages in the design and manufacturing of computer graphics, processors, chipsets and related multimedia software. Its stock rallied through the end of 2020, as NVIDIA largely exceeded the market’s expectations during the announcement of its third and fourth quarter 2020 earnings. Following its announcement of its first quarter 2021 earnings, its stock saw a substantial downturn due to concerns of margin expansion and data center revenue growth. The stock quickly rebounded through the rest of the Reporting Period, as the company proved it could beat market estimates and out-innovate competitors. At the end of the Reporting Period, we believed NVIDIA was well positioned to continue to benefit from the strong secular growth themes of migration to the cloud and online entertainment along with strong performance versus its competitors. |
| Q | Which stocks detracted significantly from the Fund’s performance during the Reporting Period? |
| A | The stocks detracting most from the Fund’s results relative to the Russell Index were technology provider for banks and capital markets businesses Fidelity National Information Services, transformative medicines company Moderna and biopharmaceutical company Sarepta Therapeutics. |
| The share price of Fidelity National Information Services fell in October 2020 along with the release of its third calendar quarter earnings results. However, most of the losses were recovered in the following days as the market digested the report. Its stock price also came under pressure with news of a failed merger between the company and Global Payments in late 2020. Later, turbulence was seen in July and August 2021 when its stock price declined following a smaller than consensus expected earnings per share raise and lower implied margins as reported in its second quarter 2021 earnings release. At the end of the Reporting Period, we believed Fidelity National Information Services was well positioned to take advantage of accelerating payments innovation globally along with financial institutions continuing to outsource for technology infrastructure. |
| Moderna, a new purchase for the Fund, was a strong performer during the Reporting Period on the back of its success with a COVID-19 vaccine. However, it was a top detractor from the Fund’s results because we decided to significantly trim the position in November 2020 on our belief that the company’s valuation had grown too quickly on its vaccine effectiveness. In our view, there were still many unknowns in this business, such as duration of COVID-19 protection, competition and pricing. However, the stock’s momentum continued after we sold the position given the actual COVID-19 vaccine rollout, discussion of booster shots and what is widely anticipated to be positive upcoming mRNA flu vaccine data. |
| In early January 2021, Sarepta Therapeutics announced that the Phase Two study of one of its gene therapy drugs did not hit statistical significance, which caused its share price as well as investor optimism to decline. The company then reported in March 2021 an uneventful fourth quarter of 2020, with most of the questions surrounding the latest status on the gene therapy drug unanswered. |
| Q | How did the Fund use derivatives and similar instruments during the Reporting Period? |
| A | During the Reporting Period, we did not use derivatives as part of an active management strategy. |
| Q | Did the Fund make any significant purchases or sales during the Reporting Period? |
| A | In addition to the purchase of Moderna mentioned earlier, we established a Fund position in United Parcel Service (“UPS”) during the Reporting Period. We initiated the position because we believe the automation and capacity efforts by UPS were starting to yield benefits through improved margins. In addition, pricing was quite strong broadly as UPS implemented surcharges as a result of high volumes against a backdrop of low truck and ocean transport capacity. |
| We initiated a Fund position in software solutions developer Splunk. We are optimistic about Splunk’s prospects given its transition to a subscription-based pricing model and what we see as its near-term upsell opportunity with its existing renewal base and relatively inexpensive valuation. |
| Conversely, we eliminated the Fund’s position in Qualcomm, which operates as a multinational semiconductor and telecommunications equipment company. We sold the position in April 2021 after numerous business risks were identified, along with decreased business momentum being demonstrated through increased competition and what we believed may be a valuation peak. |
We exited the Fund’s position in sales software platform provider Salesforce.com. The decision to sell was based on |
34
PORTFOLIO RESULTS
| our conviction being higher in one of its competitors, though we intend to continue to monitor developments in Salesforce.com as well as the broader cloud-based customer relationship management industry. |
| Q | Were there any changes to the Fund’s portfolio management team during the Reporting Period? |
| A | There were no changes to the Fund’s portfolio management team during the Reporting Period. |
| Q | Were there any notable changes in the Fund’s weightings during the Reporting Period? |
| A | In constructing the Fund’s portfolio, we focus on picking stocks rather than on making industry or sector bets. We seek to outpace the benchmark index by overweighting stocks that we expect to outperform and underweighting those that we think may lag. Consequently, changes in its sector weights are generally the direct result of individual stock selection or of stock appreciation or depreciation. That said, during the Reporting Period, the Fund’s exposure to health care increased and its allocation to information technology decreased relative to the Russell Index. |
| Q | How was the Fund positioned relative to its benchmark index at the end of August 2021? |
| A | At the end of August 2021, the Fund had overweighted allocations relative to the Russell Index in communication services, health care and materials and underweighted positions compared to the Russell Index in information technology, consumer discretionary, financials and industrials. The Fund was rather neutrally weighted in the consumer staples and real estate sectors of the Russell Index and had no positions at all in utilities and energy at the end of the Reporting Period. |
35
FUND BASICS
Strategic Growth Fund
as of August 31, 2021
| TOP TEN HOLDINGS AS OF 8/31/211 | ||||||||
| Holding | % of Net Assets | Line of Business | ||||||
Apple, Inc. | 8.2 | % | Technology Hardware, Storage & Peripherals | |||||
Microsoft Corp. | 7.4 | Software | ||||||
Amazon.com, Inc. | 7.0 | Internet & Direct Marketing Retail | ||||||
Alphabet, Inc., Class A | 5.0 | Interactive Media & Services | ||||||
Facebook, Inc., Class A | 4.3 | Interactive Media & Services | ||||||
NVIDIA Corp. | 3.5 | Semiconductors & Semiconductor Equipment | ||||||
Alphabet, Inc., Class C | 3.1 | Interactive Media & Services | ||||||
Adobe, Inc. | 2.6 | Software | ||||||
Mastercard, Inc., Class A | 2.6 | IT Services | ||||||
Visa, Inc., Class A | 2.3 | IT Services | ||||||
| 1 | The top 10 holdings may not be representative of the Fund’s future investments. |
| FUND VS. BENCHMARK SECTOR ALLOCATION2 |
| As of August 31, 2021 |
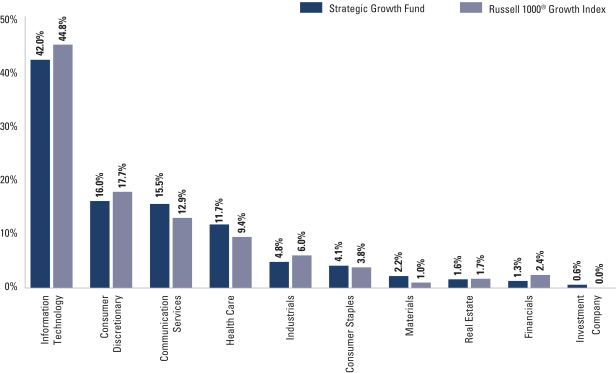
| 2 | The Fund is actively managed and, as such, its composition may differ over time. Consequently, the Fund’s overall sector allocations may differ from the percentages contained in the graph above. Figures in the above graph may not sum to 100% due to the exclusion of other assets and liabilities. The graph categorizes investments using the Global Industry Classification Standard (“GICS”), however, the sector classifications used by the portfolio management team may differ from GICS. The percentage shown for each investment category reflects the value of investments in that category as a percentage of market value. The graph depicts the Fund’s investments but may not represent the Fund’s market exposure due to the exclusion of certain derivatives, if any, as listed in the Additional Investment Information section of the Schedule of Investments. |
For more information about the Fund, please refer to www.GSAMFUNDS.com. There, you can learn more about the Fund’s investment strategies, holdings, and performance.
36
GOLDMAN SACHS STRATEGIC GROWTH FUND
Performance Summary
August 31, 2021
The following graph shows the value, as of August 31, 2021, of a $1,000,000 investment made on September 1, 2011 in Institutional Shares at NAV. For comparative purposes, the performance of the Fund’s benchmark, the Russell 1000® Growth Index (with dividends reinvested), is shown. Performance reflects applicable fee waivers and/or expense limitations in effect during the periods shown and in their absence, performance would be reduced. Returns do not reflect the deduction of taxes that a shareholder would pay on Fund distributions or the redemption of Fund shares. The returns set forth below represent past performance. Past performance does not guarantee future results. The Fund’s investment return and principal value will fluctuate so that an investor’s shares, when redeemed, may be worth more or less than their original cost. Current performance may be lower or higher than the performance quoted below. Please visit our web site at www.GSAMFUNDS.com to obtain the most recent month-end returns.
| Strategic Growth Fund’s 10 Year Performance |
Performance of a $1,000,000 Investment, including any applicable sales charges, with distributions reinvested, from September 1, 2011 through August 31, 2021.
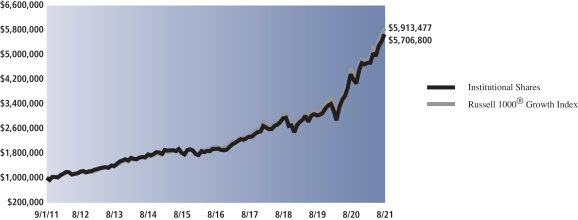
| Average Annual Total Return through August 31, 2021* | One Year | Five Years | Ten Years | Since Inception | ||||||||||
Class A | ||||||||||||||
Excluding sales charges | 29.11% | 23.54% | 18.54% | — | ||||||||||
Including sales charges | 22.05% | 22.16% | 17.87% | — | ||||||||||
| ||||||||||||||
Class C | ||||||||||||||
Excluding contingent deferred sales charges | 28.22% | 22.61% | 17.66% | — | ||||||||||
Including contingent deferred sales charges | 26.93% | 22.61% | 17.66% | — | ||||||||||
| ||||||||||||||
Institutional | 29.65% | 24.02% | 19.01% | — | ||||||||||
| ||||||||||||||
Service | 29.09% | 23.42% | 18.43% | — | ||||||||||
| ||||||||||||||
Investor | 29.42% | 23.85% | 18.84% | — | ||||||||||
| ||||||||||||||
Class R6 (Commenced July 31, 2015) | 29.57% | 24.05% | N/A | 19.40% | ||||||||||
| ||||||||||||||
Class R | 28.74% | 23.24% | 18.27% | — | ||||||||||
| ||||||||||||||
Class P (Commenced April 17, 2018) | 29.61% | N/A | N/A | 25.13% | ||||||||||
| ||||||||||||||
| * | These returns assume reinvestment of all distributions at NAV and reflect a maximum initial sales charge of 5.50% for Class A Shares and the assumed contingent deferred sales charge for Class C Shares (1% if redeemed within 12 months of purchase). Because Institutional, Service, Investor, Class P, Class R and Class R6 Shares do not involve a sales charge, such a charge is not applied to their Average Annual Total Return. |
37
PORTFOLIO RESULTS
Goldman Sachs Technology Opportunities Fund
Portfolio Composition
The Fund invests, under normal circumstances, at least 80% of its net assets plus any borrowing for investment purposes (measured at time of purchase) in equity investments in technology companies. The Fund seeks to achieve its investment objective by investing, under normal circumstances, in companies that are considered by the Investment Adviser to benefit from the proliferation of technology. Although the Fund invests primarily in publicly traded U.S. securities, it may invest up to 25% of its total assets measured at the time of purchase in foreign securities, including securities of issuers in countries with emerging markets or economies and securities quoted in foreign currencies. The Fund may also invest in privately held companies and companies that only recently began to trade publicly.
Portfolio Management Discussion and Analysis
Below, the Goldman Sachs Fundamental Equity U.S. Equity Team discusses the Goldman Sachs Technology Opportunities Fund’s (the “Fund”) performance and positioning for the 12-month period ended August 31, 2021 (the “Reporting Period”).
| Q | How did the Fund perform during the Reporting Period? |
| A | During the Reporting Period, the Fund’s Class A, Class C, Institutional, Service, Investor, Class R6 and Class P Shares generated average annual total returns, without sales charges, of 29.05%, 28.13%, 29.42%, 28.78%, 29.42%, 29.44% and 29.44%, respectively. These returns compare to the 30.49% average annual total return of the Fund’s benchmark, the NASDAQ Composite Total Return Index (the “NASDAQ Composite”), during the same period. |
| Q | What key factors were responsible for the Fund’s performance during the Reporting Period? |
| A | The Fund posted solid double-digit absolute gains but underperformed the NASDAQ Composite on a relative basis during the Reporting Period due primarily to stock selection overall. Sector allocation positioning as a whole contributed positively to relative performance. |
| Q | Which equity market sectors most significantly affected Fund performance? |
| A | As both the Fund and the NASDAQ Composite have the majority of their respective assets allocated to the information technology sector, broad equity market sector performance generally does not have a meaningful impact on relative performance. That said, weak stock selection within the consumer discretionary sector detracted most from the Fund’s relative results during the Reporting Period. Having no exposure to financials, which outperformed the NASDAQ Composite Index during the Reporting Period, and both challenging stock selection and allocation positioning in the real estate sector further dampened relative results. These detractors were partially offset by effective stock selection in the communication services sector, which contributed positively. Having no exposure to the consumer staples and utilities sectors, each of which underperformed the NASDAQ Composite Index during the Reporting Period, also helped. |
| Q | Which stocks detracted significantly from the Fund’s performance during the Reporting Period? |
| A | Detracting most from the Fund’s results relative to the NASDAQ Composite were positions in software solutions developer Splunk, information technology behemoth Apple and technology provider for banks and capital markets businesses Fidelity National Information Services. |
| Shares of Splunk first came under pressure during the Reporting Period in December 2020 after an earnings report was negatively impacted by three large customer deals that the company was unable to close, ultimately losing the business. Its share price also fell in line with the broader information technology sector in the first quarter of 2021 and as a result of departures of senior leaders. At the end of the Reporting Period, we remained confident in Splunk’s prospects given its transition to a subscription-based pricing model and what we see as its near-term upsell opportunity with its existing renewal base and its relatively inexpensive valuation. |
Apple’s stock underperformed the NASDAQ Composite during the Reporting Period, muted by increased regulatory |
38
PORTFOLIO RESULTS
| and litigation pressures. The U.K. announced its government’s plans to increase probes into “big tech” companies in the coming months. Additionally, the state of North Dakota in the U.S. rejected a bill that limits the commissions charged to businesses by Apple and Google. Similar bills were being discussed in Arizona, Georgia and Massachusetts and being lobbied for in Minnesota and Wisconsin. Moreover, Epic Games filed an antitrust complaint against Apple. On the product side, Apple’s stock price experienced volatility as the company discussed plans to build an Apple Car with multiple manufacturers, including Nokia and Kia. Overall, the Fund held an underweight position in Apple at the end of the Reporting Period, as we believed the market was overvaluing Apple’s upcoming 5G (fifth generation) product replacement cycle and that Apple’s end market was one of the most mature compared to the rest of the “big tech” companies. We continue to monitor the company for further developments. |
| The share price of Fidelity National Information Services fell in October 2020 along with the release of its third calendar quarter earnings results. However, most of the losses were recovered in the following days as the market digested the report. Its stock price also came under pressure with news of a failed merger between the company and Global Payments in late 2020. Later, turbulence was seen in July and August 2021 when its stock price declined following a smaller than consensus expected earnings per share raise and lower implied margins as reported in its second quarter 2021 earnings release. At the end of the Reporting Period, we believed Fidelity National Information Services was well positioned to take advantage of accelerating payments innovation globally along with financial institutions continuing to outsource for technology infrastructure. |
| Q | What were some of the Fund’s best-performing individual stocks? |
| A | Those stocks the Fund benefited most from relative to the NASDAQ Composite were positions in Alphabet, Microsoft and HubSpot. |
| Alphabet is a holding company that engages in advertising, digital content, applications, cloud offerings and more through its subsidiaries, including its largest, Google. Alphabet’s share price appreciated significantly during the Reporting Period as a result of substantially better than consensus expected revenues and earnings per share in every quarter, driven, in turn, by solid performance in advertising spending in Google, brand spending in YouTube and ongoing Cloud growth. At the end of the Reporting Period, we expected Alphabet to continue to perform well, as advertising markets appeared to be improving and margins notably bettering through cost discipline. |
| At the end of January 2021, software giant Microsoft reported strong corporate earnings, beating the market’s expectations across the board, sending its stock price notably higher. Perhaps the biggest highlight of that quarterly report was the strong performance of Microsoft’s cloud computing service Azure, driven by strong secular growth tailwinds. Overall, at the end of the Reporting Period, we remained constructive on Microsoft, as we believed it remains a well-diversified, high quality growth company led by an excellent management team. We further believed Microsoft is one of the best positioned enterprise software companies within the industry, and we felt the business can continue to produce strong growth driven by its Azure, Office and Windows business segments. |
| HubSpot is a cloud-based marketing and sales software provider. The share price of HubSpot appreciated following the company’s announcement of the launch of Operations Hub. Operations Hub aims to make the sales process more efficient, coordinated, automated and based on a synced set of customer data. In early May 2021, HubSpot reported first quarter 2021 results that beat consensus expectations, highlighted by significant billings growth and an acceleration in net customer additions. At the end of the Reporting Period, we remained optimistic that HubSpot may benefit from a shift in demand for front office software as business activities become more dominantly online. We also remained confident in HubSpot’s ongoing ability to grow revenues through year end 2021 while continuing to make progress toward its long-term financial targets. |
| Q | How did the Fund use derivatives and similar instruments during the Reporting Period? |
| A | During the Reporting Period, we did not use derivatives as part of an active management strategy. |
| Q | Did the Fund make any significant purchases or sales during the Reporting Period? |
| A | During the Reporting Period, we initiated a Fund position in diversified technology company Cisco Systems. We are optimistic about Cisco Systems as a COVID-19 economic recovery beneficiary, as we expect enterprise campus information technology spending to improve. At the time of purchase, we also believed the combination of low market expectations and improving fundamentals may benefit its stock. |
39
PORTFOLIO RESULTS
| We established a Fund position in MercadoLibre, often called the Amazon.com of Latin America. Its fundamentals, in our view, are strong, and the company continues to add to its competitive differentiation. In its most recent earnings reports, its commerce business segment delivered a quarter of triple-digit gross merchandise volume growth, with an improving take rate. (Take rate refers to the percentage of the value of the transactions an e-commerce company facilitates that it gets to keep as revenue. How much an e-commerce company is able to charge as a take rate depends on the strength of its underlying network of users and the degree of competition within the industry.) MercadoLibre also noted that its average delivery times improved significantly owing to investments it has made in its supply chain during the past few years. |
| Conversely, we exited the Fund’s position in Intuit, a financial software company, in order to reallocate capital into another name within the industry in which we see a stronger risk/reward profile. |
| We sold the Fund’s position in Alibaba Group Holding, a China-based e-commerce and Internet infrastructure company. Its stock experienced notable volatility in December 2020, as the Chinese government announced an antitrust investigation into the company. While we believe Alibaba Group Holding remains a strong player within the cloud and e-commerce industries, we decided to exit the position and reallocate capital into what we considered to be stronger potential risk/reward opportunities. We continue to monitor Alibaba Group Holding’s new regulatory environment. |
| Q | Were there any changes to the Fund’s portfolio management team during the Reporting Period? |
| A | There were no changes to the Fund’s portfolio management team during the Reporting Period. |
| Q | Were there any notable changes in the Fund’s weightings during the Reporting Period? |
| A | In constructing the Fund’s portfolio, we focus on picking stocks rather than on making industry or sector bets. We seek to outpace the benchmark index by overweighting stocks that we expect to outperform and underweighting those that we think may lag. Consequently, changes in its sector weights are generally the direct result of individual stock selection or of stock appreciation or depreciation. That said, during the Reporting Period, the Fund’s exposure to communication services, consumer discretionary, real estate and industrials increased relative to the NASDAQ Composite and its relative exposure to information technology and health care decreased. |
| Q | How was the Fund positioned relative to its benchmark index at the end of August 2021? |
| A | At the end of August 2021, the Fund was overweighted relative to the NASDAQ Composite in the information technology, real estate and communication services sectors. On the same date, the Fund had underweighted exposure compared to the NASDAQ Composite in consumer discretionary and industrials. The Fund had no exposure to the utilities, materials, energy, health care, consumer staples or financials sectors at the end of the Reporting Period. |
40
FUND BASICS
Technology Opportunities Fund
as of August 31, 2021
| TOP TEN HOLDINGS AS OF 8/31/211 | ||||||||
| Holding | % of Net Assets | Line of Business | ||||||
Microsoft Corp. | 9.3 | % | Software | |||||
Alphabet, Inc., Class C | 7.1 | Interactive Media & Services | ||||||
Amazon.com, Inc. | 6.1 | Internet & Direct Marketing Retail | ||||||
Facebook, Inc., Class A | 4.4 | Interactive Media & Services | ||||||
Adobe, Inc. | 3.8 | Software | ||||||
PayPal Holdings, Inc. | 3.7 | IT Services | ||||||
Alphabet, Inc., Class A | 3.5 | Interactive Media & Services | ||||||
Marvell Technology, Inc. | 3.1 | Semiconductors & Semiconductor Equipment | ||||||
HubSpot, Inc. | 2.9 | Software | ||||||
Workday, Inc., Class A | 2.7 | Software | ||||||
| 1 | The top 10 holdings may not be representative of the Fund’s future investments. |
| FUND VS. BENCHMARK SECTOR ALLOCATION2 |
| As of August 31, 2021 |
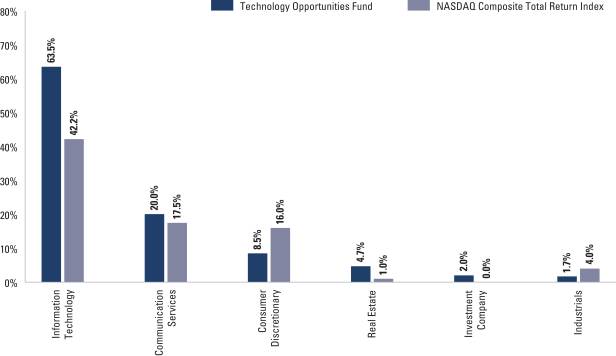
| 2 | The Fund is actively managed and, as such, its composition may differ over time. Consequently, the Fund’s overall sector allocations may differ from the percentages contained in the graph above. Figures in the above graph may not sum to 100% due to the exclusion of other assets and liabilities. The graph categorizes investments using the Global Industry Classification Standard (“GICS”), however, the sector classifications used by the portfolio management team may differ from GICS. The percentage shown for each investment category reflects the value of investments in that category as a percentage of market value. The graph depicts the Fund’s investments but may not represent the Fund’s market exposure due to the exclusion of certain derivatives, if any, as listed in the Additional Investment Information section of the Schedule of Investments. |
For more information about the Fund, please refer to www.GSAMFUNDS.com. There, you can learn more about the Fund’s investment strategies, holdings, and performance.
41
GOLDMAN SACHS TECHNOLOGY OPPORTUNITIES FUND
Performance Summary
August 31, 2021
The following graph shows the value as of August 31, 2021, of a $10,000 investment made on September 1, 2011 in Class A Shares at NAV (with the maximum sales charge of 5.50%). For comparative purposes, the performance of the Fund’s benchmark, the NASDAQ Composite Total Return Index, is shown. Performance reflects applicable fee waivers and/or expense limitations in effect during the periods shown and in their absence, performance would be reduced. Returns do not reflect the deduction of taxes that a shareholder would pay on Fund distributions or the redemption of Fund shares. The returns set forth below represent past performance. Past performance does not guarantee future results. The Fund’s investment return and principal value will fluctuate so that an investor’s shares, when redeemed, may be worth more or less than their original cost. Current performance may be lower or higher than the performance quoted below. Please visit our web site at www.GSAMFUNDS.com to obtain the most recent month-end returns.
| Technology Opportunities Fund’s 10 Year Performance |
Performance of a $10,000 Investment, including any applicable sales charges, with distributions reinvested, from September 1, 2011 through August 31, 2021.
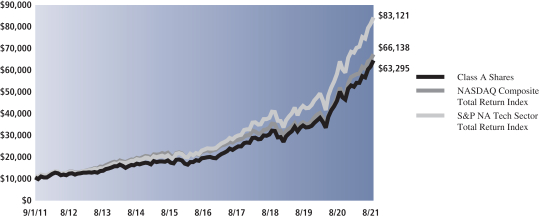
| Average Annual Total Return through August 31, 2021* | One Year | Five Years | Ten Years | Since Inception | ||||||||||
Class A | ||||||||||||||
Excluding sales charges | 29.05% | 28.04% | 20.93% | — | ||||||||||
Including sales charges | 21.96% | 26.60% | 20.25% | — | ||||||||||
| ||||||||||||||
Class C | ||||||||||||||
Excluding contingent deferred sales charges | 28.13% | 27.10% | 20.03% | — | ||||||||||
Including contingent deferred sales charges | 26.99% | 27.10% | 20.03% | — | ||||||||||
| ||||||||||||||
Institutional | 29.42% | 28.48% | 21.37% | — | ||||||||||
| ||||||||||||||
Service | 28.78% | 27.84% | 20.78% | — | ||||||||||
| ||||||||||||||
Investor | 29.42% | 28.36% | 21.23% | — | ||||||||||
| ||||||||||||||
Class R6 (Commenced December 29, 2017) | 29.44% | N/A | N/A | 28.77% | ||||||||||
| ||||||||||||||
Class P (Commenced April 17, 2018) | 29.44% | N/A | N/A | 27.69% | ||||||||||
| ||||||||||||||
| * | These returns assume reinvestment of all distributions at NAV and reflect a maximum initial sales charge of 5.50% for Class A Shares and the assumed contingent deferred sales charge for Class C Shares (1% if redeemed within 12 months of purchase). Because Institutional, Service, Investor, Class R6 and Class P Shares do not involve a sales charge, such a charge is not applied to their Average Annual Total Return. |
42
PORTFOLIO RESULTS
Goldman Sachs U.S. Equity ESG Fund
Portfolio Composition
The Fund invests, under normal circumstances, at least 80% of its net assets plus any borrowings for investment purposes (measured at the time of purchase) (“Net Assets”) in a diversified portfolio of equity investments of U.S. issuers that Goldman Sachs Asset Management, L.P. (the “Investment Adviser”) believes adhere to the Fund’s environmental, social and governance (“ESG”) criteria. Such equity investments may include exchange-traded funds (“ETFs”), futures and other instruments with similar economic exposures. The Fund seeks to achieve its investment objective by investing, under normal circumstances, in U.S. companies that are considered by the Investment Adviser to be positioned for long-term growth of capital. The Fund may also invest up to 20% of its Net Assets in equity investments that may not adhere to the Fund’s ESG criteria, in non-U.S. issuers, and in fixed income securities, such as government, corporate and bank debt obligations.
Portfolio Management Discussion and Analysis
Below, the Goldman Sachs Fundamental Equity U.S. Equity Team discusses the Goldman Sachs U.S. Equity ESG Fund’s (the “Fund”) performance and positioning for the 12-month period ended August 31, 2021 (the “Reporting Period”).
| Q | How did the Fund perform during the Reporting Period? |
| A | During the Reporting Period, the Fund’s Class A, Class C, Institutional, Investor, Class R6, Class R and Class P Shares generated average annual total returns, without sales charges, of 34.66%, 33.65%, 35.11%, 34.99%, 35.09%, 34.35% and 35.11%, respectively. These returns compare to the 31.17% average annual total return of the Fund’s benchmark, the Standard & Poor’s 500® Index (the “S&P 500 Index”), during the same period. |
| Q | What are the Fund’s investment criteria? |
| A | The Fund’s ESG criteria are generally designed to exclude companies that are involved in, and/or derive significant revenue from certain industries or product lines, including: gambling, alcohol, tobacco, adult entertainment, for-profit prisons, oil and gas exploration and production, coal and weapons. Once the Investment Adviser determines that an issuer meets the Fund’s ESG criteria, the Investment Adviser conducts a supplemental analysis of individual companies’ corporate governance factors and a range of environmental and social factors that may vary by sector. This supplemental analysis is conducted alongside traditional fundamental, bottom-up financial analysis of individual companies, using traditional fundamental metrics. The Investment Adviser may engage in active dialogues with company management teams to further inform investment decision-making and to foster best corporate governance practices using its fundamental and ESG analysis. |
| The Investment Adviser may sell holdings for several reasons, including, among others, changes in a company’s fundamentals or earnings, a company no longer meeting the Fund’s ESG criteria, or a company otherwise failing to conform to the Investment Adviser’s investment philosophy. |
| The Fund seeks to provide broad U.S. equity market exposure by investing in securities of U.S. issuers of any investment style. |
| The Fund’s performance benchmark index is the S&P 500 Index. |
| Q | What key factors were responsible for the Fund’s performance during the Reporting Period? |
| A | The Fund outperformed the S&P 500 Index on a relative basis during the Reporting Period due primarily to effective stock selection overall. Sector allocation as a whole also contributed positively to relative performance. |
| Q | Which equity market sectors most significantly affected Fund performance? |
| A | The sectors that contributed most positively to the Fund’s relative performance were consumer discretionary, industrials and health care, wherein stock selection in each proved beneficial. Allocation positioning in each of these three sectors also added value. Only partially offsetting these positive contributors was stock selection in materials and real estate, which detracted. Having no exposure to the energy sector, which outperformed the S&P 500 Index during the Reporting Period, also dampened the Fund’s relative results. |
43
PORTFOLIO RESULTS
| Q | What were some of the Fund’s best-performing individual stocks? |
| A | The Fund benefited most relative to the S&P 500 Index from positions in Alphabet, Aptiv and Deere & Company. |
| Alphabet is a holding company that engages in advertising, digital content, applications, cloud offerings and more through its subsidiaries, including its largest, Google. Alphabet’s share price appreciated significantly during the Reporting Period as a result of substantially better than consensus expected revenues and earnings per share in every quarter, driven, in turn, by solid performance in advertising spending in Google, brand spending in YouTube and ongoing Cloud growth. At the end of the Reporting Period, we expected Alphabet to continue to perform well, as advertising markets appeared to be improving and margins notably bettering through cost discipline. |
| Vehicle components manufacturer Aptiv outperformed the S&P 500 Index during the Reporting Period, and its third quarter 2020 earnings report reaffirmed our confidence in its stock, as, in our view, the earnings report highlighted Aptiv’s attractive positioning in the vehicle electrification and autonomous driving space and its strong execution. At the end of the Reporting Period, we continued to like what we saw as the risk/reward opportunities in the company along with its prospects ahead. |
| Deere & Company engages in the manufacturing of agricultural, turf, construction and forestry machinery and also provides the financial services associated with its equipment. Its stock rallied during the Reporting Period, as Deere & Company beat consensus earnings estimates and raised its forecasts in each quarter based on strength in its agricultural end-markets and what we believe to be more technologically advanced offerings relative to its peers. Its stock dipped in May 2021 as a result of less favorable sell-side reports but rebounded through the rest of the Reporting Period, as the company continued to beat consensus estimates, acquire companies to help fuel growth and prove its competitive advantage. At the end of the Reporting Period, we believed Deere & Company was well positioned to continue to benefit from strong demand for its products given the cyclical economic recovery and potential for infrastructure spending as well as from continued innovation and acquisitions to lead the way for future growth. Still, we were monitoring the position closely as agricultural end-market moderated toward the end of the Reporting Period. |
| Q | Which stocks detracted significantly from the Fund’s performance during the Reporting Period? |
| A | Those stocks detracting most from the Fund’s results relative to the S&P 500 Index were positions in bioscience company Chr. Hansen Holding, payments company Visa and pharmaceutical company AstraZeneca. |
| During the Reporting Period, Denmark-based Chr. Hansen Holding was in the midst of a portfolio transformation following the divestiture of its natural colors segment and subsequent acquisitions within the core microbial space. We decided to exit the Fund’s position in the company in February 2021 given that U.S. microbe alternatives had become available. |
| While Visa’s stock had a positive absolute return during the Reporting Period, it proved a detractor from the Fund’s relative results based on our positioning and the timing of our trade activity. Visa benefited during the Reporting Period from increased transaction activity upon the broader reopening of the economy as well as from the resumption of cross-border transactions. At the end of the Reporting Period, we continued to believe Visa was well positioned should the economic recovery continue, with a particular runway in cross-border transactions and credit spending. |
| In December 2020, it was announced that AstraZeneca would be acquiring Alexion Pharmaceuticals. In our view, this acquisition will likely prove to be a good deal in the long run, but it complicates an otherwise clean organic growth story for the company in the near term. Thus, in February 2021, we ultimately decided to sell the position as the backdrop of COVID-19 vaccine supply and efficacy headlines made 2021 a bit challenging for the company. |
| Q | How did the Fund use derivatives and similar instruments during the Reporting Period? |
| A | During the Reporting Period, we did not use derivatives as part of an active management strategy. |
| Q | Did the Fund make any significant purchases or sales during the Reporting Period? |
| A | During the Reporting Period, we initiated a Fund position in financial institution Morgan Stanley. With merger and acquisition announcements accelerating and a strong backlog of Initial Public Offerings waiting to be introduced, we believe these factors may serve the investment banking business of Morgan Stanley well. In our view, the longer-term thesis for Morgan Stanley is likely to focus on deal |
44
PORTFOLIO RESULTS
| integration, core asset growth and improving profitability over time. |
| We established a Fund position in industrial gases provider Linde. We view its business as a cyclical exposure with incremental growth drivers in place for its hydrogen business, which we believe continues to see a backlog of business growth. |
| Conversely, in addition to those sales mentioned earlier, we eliminated the Fund’s position in health care products manufacturer Johnson & Johnson during the Reporting Period. We sold the position in October 2020 following COVID-19 vaccination momentum and reallocated to what we saw as more attractive risk/reward opportunities elsewhere. |
| We exited the Fund’s position in home improvement products provider Lowe’s Companies. We remain optimistic about the company’s ability to continue driving operating leverage moving forward amid demand for home improvement projects, but we ultimately decided to sell the position in favor of what we believed to be better risk/reward prospects elsewhere. |
| Q | Were there any changes to the Fund’s portfolio management team during the Reporting Period? |
| A | There were no changes to the Fund’s portfolio management team during the Reporting Period. |
| Q | Were there any notable changes in the Fund’s weightings during the Reporting Period? |
| A | In constructing the Fund’s portfolio, we focus on picking stocks rather than on making industry or sector bets. We seek to outpace the benchmark index by overweighting stocks that we expect to outperform and underweighting those that we think may lag. Consequently, changes in its sector weights are generally the direct result of individual stock selection or of stock appreciation or depreciation. That said, during the Reporting Period, the Fund’s exposure to communication services, consumer staples and materials increased and its allocation to consumer discretionary decreased compared to the S&P 500 Index. |
| Q | How was the Fund positioned relative to its benchmark index at the end of August 2021? |
| A | At the end of August 2021, the Fund had overweighted positions relative to the S&P 500 Index in materials, utilities, industrials and information technology. On the same date, the Fund had underweighted positions compared to the S&P 500 Index in consumer discretionary, health care and consumer staples and was rather neutrally weighted to the S&P 500 Index in communication services, financials and real estate. The Fund had no position at all in energy at the end of the Reporting Period. |
45
FUND BASICS
U.S. Equity ESG Fund
as of August 31, 2021
| TOP TEN HOLDINGS AS OF 8/31/211 | ||||||||
| Holding | % of Net Assets | Line of Business | ||||||
Microsoft Corp. | 6.9 | % | Software | |||||
Alphabet, Inc., Class A | 6.0 | Interactive Media & Services | ||||||
Apple, Inc. | 5.1 | Technology Hardware, Storage & Peripherals | ||||||
JPMorgan Chase & Co. | 3.4 | Banks | ||||||
Danaher Corp. | 3.1 | Health Care Equipment & Supplies | ||||||
Visa, Inc., Class A | 3.0 | IT Services | ||||||
Procter & Gamble Co. (The) | 2.8 | Household Products | ||||||
Eli Lilly & Co. | 2.8 | Pharmaceuticals | ||||||
Cisco Systems, Inc. | 2.6 | Communications Equipment | ||||||
NextEra Energy, Inc. | 2.6 | Electric Utilities | ||||||
| 1 | The top 10 holdings may not be representative of the Portfolio’s future investments. The top 10 holdings exclude investments in money market funds. |
| FUND VS. BENCHMARK SECTOR ALLOCATION2 |
| As of August 31, 2021 |
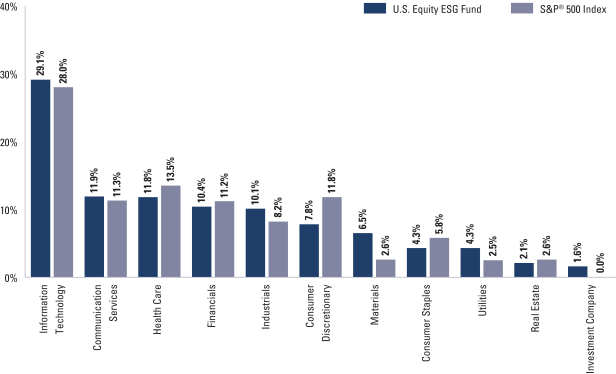
| 2 | The Fund is actively managed and, as such, its composition may differ over time. Consequently, the Fund’s overall sector allocations may differ from the percentages contained in the graph above. Figures in the above graph may not sum to 100% due to the exclusion of other assets and liabilities. The graph categorizes investments using the Global Industry Classification Standard (“GICS”), however, the sector classifications used by the portfolio management team may differ from GICS. The percentage shown for each investment category reflects the value of investments in that category as a percentage of market value. The graph depicts the Fund’s investments but may not represent the Fund’s market exposure due to the exclusion of certain derivatives, if any, as listed in the Additional Investment Information section of the Schedule of Investments. |
For more information about the Fund, please refer to www.GSAMFUNDS.com. There, you can learn more about the Fund’s investment strategies, holdings, and performance.
46
GOLDMAN SACHS U.S. EQUITY ESG FUND
Performance Summary
August 31, 2021
The following graph shows the value, as of August 31, 2021, of a $1,000,000 investment made on September 1, 2011 in Institutional Shares at NAV. For comparative purposes, the performance of the Fund’s benchmark, the S&P 500® Index (with dividends reinvested), is shown. Performance reflects applicable fee waivers and/or expense limitations in effect during the periods shown and in their absence, performance would be reduced. Returns do not reflect the deduction of taxes that a shareholder would pay on Fund distributions or the redemption of Fund shares. The returns set forth below represent past performance. Past performance does not guarantee future results. The Fund’s investment return and principal value will fluctuate so that an investor’s shares, when redeemed, may be worth more or less than their original cost. Current performance may be lower or higher than the performance quoted below. Please visit our web site at www.GSAMFUNDS.com to obtain the most recent month-end returns.
| U.S. Equity ESG Fund’s 10 Year Performance |
Performance of a $1,000,000 Investment, including any applicable sales charges, with distributions reinvested, from September 1, 2011 through August 31, 2021.
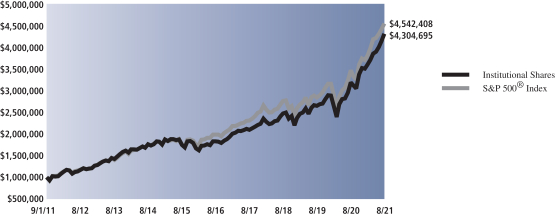
| Average Annual Total Return through August 31, 2021* | One Year | Five Years | Ten Years | Since Inception | ||||||||||
Class A | ||||||||||||||
Excluding sales charges | 34.66% | 18.25% | 15.27% | — | ||||||||||
Including sales charges | 27.25% | 16.92% | 14.63% | — | ||||||||||
| ||||||||||||||
Class C | ||||||||||||||
Excluding contingent deferred sales charges | 33.65% | 17.36% | 14.41% | — | ||||||||||
Including contingent deferred sales charges | 32.53% | 17.36% | 14.41% | — | ||||||||||
| ||||||||||||||
Institutional | 35.11% | 18.66% | 15.70% | — | ||||||||||
| ||||||||||||||
Investor | 34.99% | 18.53% | 15.55% | — | ||||||||||
| ||||||||||||||
Class R6 (Commenced July 31, 2015) | 35.09% | 18.68% | N/A | 14.66% | ||||||||||
| ||||||||||||||
Class R | 34.35% | 17.95% | 14.99% | — | ||||||||||
| ||||||||||||||
Class P (Commenced April 17, 2018) | 35.11% | N/A | N/A | 20.62% | ||||||||||
| ||||||||||||||
| * | These returns assume reinvestment of all distributions at NAV and reflect a maximum initial sales charge of 5.50% for Class A Shares and the assumed contingent deferred sales charge for Class C Shares (1% if redeemed within 12 months of purchase). Because Institutional, Investor, Class P, Class R and Class R6 Shares do not involve a sales charge, such a charge is not applied to their Average Annual Total Return. |
47
FUND BASICS
Index Definitions
The Russell 3000® Index is a market capitalization weighted equity index maintained by the FTSE Russell that provides exposure to the entire U.S. stock market. The index tracks the performance of the 3,000 largest U.S.-traded stocks which represent about 98% of all U.S incorporated equity securities. It is not possible to invest directly in an index.
The Russell 1000® Growth Index is an unmanaged index that measures the performance of those Russell 1000® companies with higher price-to-book ratios and higher forecasted growth values. The Russell 1000® Growth Index figures do not reflect any deduction for fees, expenses or taxes. It is not possible to invest directly in an index.
The S&P 500® Index is the Standard & Poor’s 500 Composite Index of 500 stocks, an unmanaged index of common stock prices. The S&P 500® Index figures do not reflect any deduction for fees, expenses or taxes. It is not possible to invest directly in an index.
The Russell Midcap® Growth Index is an unmanaged market capitalization weighted index that measures the performance of those Russell Midcap companies with higher price-to-book ratios and higher forecasted growth values. The Russell Midcap® Growth Index figures do not reflect any deduction for fees, expenses or taxes. It is not possible to invest directly in an index.
The Russell 2500® Growth Index is an unmanaged index that measures the performance of the small to mid-cap growth segment of the US equity universe. The Russell 2500® Growth Index is constructed to provide a comprehensive and unbiased barometer of the small- to mid-cap growth market. Based on ongoing empirical research of investment manager behavior, the methodology used to determine growth probability approximates the aggregate small- to mid-cap growth manager’s opportunity set. The Russell 2500® Growth Index figures do not reflect any deduction for fees, expenses or taxes. It is not possible to invest directly in an index.
The NASDAQ Composite Index includes all domestic and international based common type stocks listed on The NASDAQ Stock Market. The NASDAQ Composite Index is a broad based Index. It is not possible to invest directly in an index.
48
GOLDMAN SACHS CAPITAL GROWTH FUND
August 31, 2021
| Shares | Description | Value | ||||||
| Common Stocks – 98.7% | ||||||||
| Aerospace & Defense – 1.0% | ||||||||
| 31,145 | Boeing Co. (The)* | $ | 6,836,328 | |||||
| 18,225 | L3Harris Technologies, Inc. | 4,246,607 | ||||||
| 3,741 | TransDigm Group, Inc.* | 2,272,545 | ||||||
|
| |||||||
| 13,355,480 | ||||||||
|
| |||||||
| Air Freight & Logistics – 0.2% | ||||||||
| 14,692 | United Parcel Service, Inc., Class B | 2,874,196 | ||||||
|
| |||||||
| Airlines – 0.2% | ||||||||
| 43,346 | United Airlines Holdings, Inc.* | 2,016,022 | ||||||
|
| |||||||
| Auto Components – 0.5% | ||||||||
| 43,335 | Aptiv PLC* | 6,595,154 | ||||||
|
| |||||||
| Automobiles – 0.7% | ||||||||
| 12,006 | Tesla, Inc.* | 8,833,054 | ||||||
|
| |||||||
| Banks – 3.1% | ||||||||
| 384,019 | Bank of America Corp. | 16,032,793 | ||||||
| 72,250 | JPMorgan Chase & Co. | 11,556,388 | ||||||
| 18,517 | M&T Bank Corp. | 2,592,565 | ||||||
| 22,135 | Pinnacle Financial Partners, Inc. | 2,145,324 | ||||||
| 7,560 | SVB Financial Group* | 4,229,820 | ||||||
| 49,787 | Truist Financial Corp. | 2,840,846 | ||||||
|
| |||||||
| 39,397,736 | ||||||||
|
| |||||||
| Beverages – 1.4% | ||||||||
| 25,705 | Coca-Cola Co. (The) | 1,447,449 | ||||||
| 110,549 | Coca-Cola Europacific Partners PLC (United Kingdom) | 6,383,099 | ||||||
| 27,980 | Constellation Brands, Inc., Class A | 5,907,697 | ||||||
| 41,804 | Monster Beverage Corp.* | 4,078,816 | ||||||
|
| |||||||
| 17,817,061 | ||||||||
|
| |||||||
| Biotechnology – 1.8% | ||||||||
| 21,985 | Alnylam Pharmaceuticals, Inc.* | 4,428,438 | ||||||
| 7,425 | Biogen, Inc.* | 2,516,407 | ||||||
| 13,770 | BioMarin Pharmaceutical, Inc.* | 1,159,572 | ||||||
| 82,703 | Genmab A/S ADR (Denmark)* | 3,919,295 | ||||||
| 4,563 | Moderna, Inc.* | 1,718,836 | ||||||
| 55,210 | Neurocrine Biosciences, Inc.* | 5,255,992 | ||||||
| 24,118 | Seagen, Inc.* | 4,042,177 | ||||||
|
| |||||||
| 23,040,717 | ||||||||
|
| |||||||
| Building Products – 0.9% | ||||||||
| 105,146 | AZEK Co., Inc. (The)* | 4,467,654 | ||||||
| 32,998 | Trane Technologies PLC | 6,550,103 | ||||||
|
| |||||||
| 11,017,757 | ||||||||
|
| |||||||
| Capital Markets – 2.3% | ||||||||
| 6,252 | BlackRock, Inc. | 5,897,449 | ||||||
| 35,281 | Carlyle Group, Inc. (The) | 1,742,176 | ||||||
| 48,510 | Charles Schwab Corp. (The) | 3,533,953 | ||||||
| 95,183 | Morgan Stanley | 9,939,961 | ||||||
| 14,932 | Raymond James Financial, Inc. | 2,088,987 | ||||||
| 10,746 | S&P Global, Inc. | 4,769,290 | ||||||
| 21,322 | Tradeweb Markets, Inc., Class A | 1,855,227 | ||||||
|
| |||||||
| 29,827,043 | ||||||||
|
| |||||||
| Common Stocks – (continued) | ||||||||
| Chemicals – 2.0% | ||||||||
| 44,315 | Ecolab, Inc. | 9,986,828 | ||||||
| 32,079 | Linde PLC (United Kingdom) | 10,091,733 | ||||||
| 20,148 | Sherwin-Williams Co. (The) | 6,118,343 | ||||||
|
| |||||||
| 26,196,904 | ||||||||
|
| |||||||
| Commercial Services & Supplies – 0.2% | ||||||||
| 18,637 | Waste Connections, Inc. | 2,408,087 | ||||||
|
| |||||||
| Communications Equipment – 0.6% | ||||||||
| 120,529 | Cisco Systems, Inc. | 7,113,622 | ||||||
|
| |||||||
| Construction Materials – 0.7% | ||||||||
| 23,638 | Martin Marietta Materials, Inc. | 9,011,988 | ||||||
|
| |||||||
| Consumer Finance – 1.0% | ||||||||
| 79,486 | American Express Co. | 13,191,497 | ||||||
|
| |||||||
| Containers & Packaging – 0.5% | ||||||||
| 73,066 | Ball Corp. | 7,011,413 | ||||||
|
| |||||||
| Diversified Financial Services – 0.8% | ||||||||
| 33,942 | Berkshire Hathaway, Inc., Class B* | 9,699,605 | ||||||
|
| |||||||
| Diversified Telecommunication Services – 0.4% | ||||||||
| 172,398 | AT&T, Inc. | 4,727,153 | ||||||
|
| |||||||
| Electric Utilities – 1.1% | ||||||||
| 119,503 | NextEra Energy, Inc. | 10,037,057 | ||||||
| 58,985 | Xcel Energy, Inc. | 4,055,219 | ||||||
|
| |||||||
| 14,092,276 | ||||||||
|
| |||||||
| Electrical Equipment – 0.9% | ||||||||
| 19,222 | Eaton Corp. PLC | 3,236,216 | ||||||
| 23,634 | Rockwell Automation, Inc. | 7,691,685 | ||||||
|
| |||||||
| 10,927,901 | ||||||||
|
| |||||||
| Electronic Equipment, Instruments & Components – 0.8% | ||||||||
| 62,758 | Amphenol Corp., Class A | 4,809,145 | ||||||
| 33,133 | Keysight Technologies, Inc.* | 5,943,398 | ||||||
|
| |||||||
| 10,752,543 | ||||||||
|
| |||||||
| Entertainment – 2.8% | ||||||||
| 22,100 | Activision Blizzard, Inc. | 1,820,377 | ||||||
| 16,377 | Electronic Arts, Inc. | 2,378,104 | ||||||
| 39,611 | Live Nation Entertainment, Inc.* | 3,434,274 | ||||||
| 26,200 | Netflix, Inc.* | 14,912,778 | ||||||
| 74,066 | Walt Disney Co. (The)* | 13,428,166 | ||||||
|
| |||||||
| 35,973,699 | ||||||||
|
| |||||||
| Equity Real Estate Investment Trusts (REITs) – 2.8% | ||||||||
| 28,259 | Alexandria Real Estate Equities, Inc. REIT | 5,831,810 | ||||||
| 19,713 | American Tower Corp. REIT | 5,759,547 | ||||||
| 11,007 | AvalonBay Communities, Inc. REIT | 2,526,987 | ||||||
| 40,337 | Duke Realty Corp. REIT | 2,118,096 | ||||||
| 6,909 | Equinix, Inc. REIT | 5,827,396 | ||||||
| 22,294 | Equity LifeStyle Properties, Inc. REIT | 1,896,551 | ||||||
| 89,877 | Host Hotels & Resorts, Inc. REIT* | 1,488,363 | ||||||
| 93,242 | Invitation Homes, Inc. REIT | 3,839,706 | ||||||
|
| |||||||
| The accompanying notes are an integral part of these financial statements. | 49 |
GOLDMAN SACHS CAPITAL GROWTH FUND
Schedule of Investments (continued)
August 31, 2021
| Shares | Description | Value | ||||||
| Common Stocks – (continued) | ||||||||
| Equity Real Estate Investment Trusts (REITs) – (continued) | ||||||||
| 21,838 | Kilroy Realty Corp. REIT | $ | 1,433,665 | |||||
| 7,938 | Public Storage REIT | 2,568,816 | ||||||
| 39,344 | Ventas, Inc. REIT | 2,200,903 | ||||||
|
| |||||||
| 35,491,840 | ||||||||
|
| |||||||
| Food Products – 1.4% | ||||||||
| 115,618 | McCormick & Co., Inc. | 9,976,677 | ||||||
| 122,264 | Mondelez International, Inc., Class A | 7,588,927 | ||||||
|
| |||||||
| 17,565,604 | ||||||||
|
| |||||||
| Gas Utilities – 0.2% | ||||||||
| 32,773 | Atmos Energy Corp. | 3,195,695 | ||||||
|
| |||||||
| Health Care Equipment & Supplies – 4.9% | ||||||||
| 14,692 | Align Technology, Inc.* | 10,416,628 | ||||||
| 196,097 | Boston Scientific Corp.* | 8,853,780 | ||||||
| 33,068 | Danaher Corp. | 10,719,323 | ||||||
| 25,972 | Insulet Corp.* | 7,734,721 | ||||||
| 9,809 | Intuitive Surgical, Inc.* | 10,334,370 | ||||||
| 18,291 | West Pharmaceutical Services, Inc. | 8,260,582 | ||||||
| 43,512 | Zimmer Biomet Holdings, Inc. | 6,546,380 | ||||||
|
| |||||||
| 62,865,784 | ||||||||
|
| |||||||
| Health Care Providers & Services – 2.7% | ||||||||
| 114,465 | CVS Health Corp. | 9,888,632 | ||||||
| 56,964 | Guardant Health, Inc.* | 7,249,808 | ||||||
| 6,267 | Humana, Inc. | 2,540,767 | ||||||
| 36,436 | UnitedHealth Group, Inc. | 15,167,214 | ||||||
|
| |||||||
| 34,846,421 | ||||||||
|
| |||||||
| Health Care Technology – 0.6% | ||||||||
| 22,647 | Veeva Systems, Inc., Class A* | 7,518,351 | ||||||
|
| |||||||
| Hotels, Restaurants & Leisure – 1.4% | ||||||||
| 41,747 | McDonald’s Corp. | 9,913,243 | ||||||
| 33,709 | Wyndham Hotels & Resorts, Inc. | 2,450,644 | ||||||
| 26,479 | Wynn Resorts Ltd.* | 2,692,649 | ||||||
| 24,486 | Yum! Brands, Inc. | 3,208,401 | ||||||
|
| |||||||
| 18,264,937 | ||||||||
|
| |||||||
| Household Durables – 0.1% | ||||||||
| 9,051 | Lennar Corp., Class A | 971,263 | ||||||
|
| |||||||
| Household Products – 1.2% | ||||||||
| 109,875 | Procter & Gamble Co. (The) | 15,645,101 | ||||||
|
| |||||||
| Industrial Conglomerates – 1.7% | ||||||||
| 121,257 | General Electric Co. | 12,781,700 | ||||||
| 37,229 | Honeywell International, Inc. | 8,633,778 | ||||||
|
| |||||||
| 21,415,478 | ||||||||
|
| |||||||
| Insurance – 1.8% | ||||||||
| 80,907 | Arch Capital Group Ltd.* | 3,325,278 | ||||||
| 30,595 | Athene Holding Ltd., Class A* | 2,048,947 | ||||||
| 34,808 | Chubb Ltd. | 6,401,887 | ||||||
| 31,427 | Globe Life, Inc. | 3,019,192 | ||||||
| 2,628 | Markel Corp.* | 3,338,217 | ||||||
| 5,076 | Marsh & McLennan Cos., Inc. | 797,947 | ||||||
|
| |||||||
| Common Stocks – (continued) | ||||||||
| Insurance – (continued) | ||||||||
| 137,946 | Ryan Specialty Group Holdings, Inc., Class A* | 4,539,803 | ||||||
|
| |||||||
| 23,471,271 | ||||||||
|
| |||||||
| Interactive Media & Services – 7.2% | ||||||||
| 10,289 | Alphabet, Inc., Class A* | 29,775,851 | ||||||
| 8,678 | Alphabet, Inc., Class C* | 25,246,385 | ||||||
| 73,303 | Facebook, Inc., Class A* | 27,809,692 | ||||||
| 69,588 | Snap, Inc., Class A* | 5,296,343 | ||||||
| 53,043 | Twitter, Inc.* | 3,421,274 | ||||||
|
| |||||||
| 91,549,545 | ||||||||
|
| |||||||
| Internet & Direct Marketing Retail – 4.4% | ||||||||
| 14,082 | Amazon.com, Inc.* | 48,875,665 | ||||||
| 33,068 | Etsy, Inc.* | 7,151,285 | ||||||
|
| |||||||
| 56,026,950 | ||||||||
|
| |||||||
| IT Services – 6.3% | ||||||||
| 58,277 | Cognizant Technology Solutions Corp., Class A | 4,447,118 | ||||||
| 5,097 | EPAM Systems, Inc.* | 3,225,432 | ||||||
| 83,751 | Fidelity National Information Services, Inc. | 10,700,865 | ||||||
| 24,776 | Global Payments, Inc. | 4,029,569 | ||||||
| 69,783 | International Business Machines Corp. | 9,793,346 | ||||||
| 39,506 | Marqeta, Inc., Class A*(a) | 1,147,254 | ||||||
| 29,451 | Mastercard, Inc., Class A | 10,196,820 | ||||||
| 63,432 | PayPal Holdings, Inc.* | 18,310,281 | ||||||
| 19,016 | Snowflake, Inc., Class A* | 5,787,520 | ||||||
| 54,347 | Visa, Inc., Class A | 12,450,898 | ||||||
|
| |||||||
| 80,089,103 | ||||||||
|
| |||||||
| Leisure Products – 0.2% | ||||||||
| 25,320 | Brunswick Corp. | 2,452,748 | ||||||
|
| |||||||
| Life Sciences Tools & Services – 1.4% | ||||||||
| 140,546 | Adaptive Biotechnologies Corp.* | 5,104,631 | ||||||
| 7,719 | Illumina, Inc.* | 3,528,818 | ||||||
| 43,030 | PerkinElmer, Inc. | 7,951,944 | ||||||
| 3,375 | Thermo Fisher Scientific, Inc. | 1,872,956 | ||||||
|
| |||||||
| 18,458,349 | ||||||||
|
| |||||||
| Machinery – 0.9% | ||||||||
| 6,087 | Deere & Co. | 2,301,069 | ||||||
| 40,110 | Illinois Tool Works, Inc. | 9,340,014 | ||||||
|
| |||||||
| 11,641,083 | ||||||||
|
| |||||||
| Media – 0.7% | ||||||||
| 153,306 | Comcast Corp., Class A | 9,302,608 | ||||||
|
| |||||||
| Metals & Mining – 0.2% | ||||||||
| 62,711 | Freeport-McMoRan, Inc. | 2,282,053 | ||||||
|
| |||||||
| Multiline Retail – 0.9% | ||||||||
| 11,958 | Dollar General Corp. | 2,665,558 | ||||||
| 37,629 | Target Corp. | 9,293,610 | ||||||
|
| |||||||
| 11,959,168 | ||||||||
|
| |||||||
| 50 | The accompanying notes are an integral part of these financial statements. |
GOLDMAN SACHS CAPITAL GROWTH FUND
| Shares | Description | Value | ||||||
| Common Stocks – (continued) | ||||||||
| Multi-Utilities – 0.8% | ||||||||
| 59,102 | Ameren Corp. | $ | 5,184,428 | |||||
| 85,133 | CMS Energy Corp. | 5,459,579 | ||||||
|
| |||||||
| 10,644,007 | ||||||||
|
| |||||||
| Oil, Gas & Consumable Fuels – 2.2% | ||||||||
| 28,304 | Cheniere Energy, Inc.* | 2,475,468 | ||||||
| 94,831 | Chevron Corp. | 9,176,796 | ||||||
| 63,087 | ConocoPhillips | 3,503,221 | ||||||
| 105,607 | Devon Energy Corp. | 3,120,687 | ||||||
| 16,540 | Diamondback Energy, Inc. | 1,275,895 | ||||||
| 19,162 | Hess Corp. | 1,317,387 | ||||||
| 36,614 | Ovintiv, Inc. | 998,098 | ||||||
| 39,392 | Pioneer Natural Resources Co. | 5,895,801 | ||||||
|
| |||||||
| 27,763,353 | ||||||||
|
| |||||||
| Personal Products – 0.7% | ||||||||
| 26,339 | Estee Lauder Cos., Inc. (The), Class A | 8,968,166 | ||||||
|
| |||||||
| Pharmaceuticals – 2.5% | ||||||||
| 13,383 | AstraZeneca PLC ADR (United Kingdom) | 779,961 | ||||||
| 134,316 | Bristol-Myers Squibb Co. | 8,980,368 | ||||||
| 31,723 | Catalent, Inc.* | 4,137,948 | ||||||
| 69,449 | Eli Lilly & Co. | 17,937,982 | ||||||
|
| |||||||
| 31,836,259 | ||||||||
|
| |||||||
| Professional Services – 0.9% | ||||||||
| 41,242 | TransUnion | 5,012,140 | ||||||
| 31,742 | Verisk Analytics, Inc. | 6,404,266 | ||||||
|
| |||||||
| 11,416,406 | ||||||||
|
| |||||||
| Road & Rail – 2.1% | ||||||||
| 25,298 | Norfolk Southern Corp. | 6,414,055 | ||||||
| 22,701 | Old Dominion Freight Line, Inc. | 6,554,233 | ||||||
| 69,567 | Uber Technologies, Inc.* | 2,722,852 | ||||||
| 53,681 | Union Pacific Corp. | 11,640,188 | ||||||
|
| |||||||
| 27,331,328 | ||||||||
|
| |||||||
| Semiconductors & Semiconductor Equipment – 4.2% | ||||||||
| 23,068 | Advanced Micro Devices, Inc.* | 2,554,089 | ||||||
| 22,688 | KLA Corp. | 7,713,013 | ||||||
| 170,915 | Marvell Technology, Inc. | 10,458,289 | ||||||
| 24,606 | Micron Technology, Inc.* | 1,813,462 | ||||||
| 56,600 | NVIDIA Corp. | 12,669,910 | ||||||
| 12,526 | NXP Semiconductors NV (China) | 2,694,718 | ||||||
| 28,912 | Taiwan Semiconductor Manufacturing Co. Ltd. ADR (Taiwan) | 3,440,817 | ||||||
| 64,790 | Texas Instruments, Inc. | 12,369,059 | ||||||
|
| |||||||
| 53,713,357 | ||||||||
|
| |||||||
| Software – 11.7% | ||||||||
| 20,726 | Adobe, Inc.* | 13,755,846 | ||||||
| 15,151 | Atlassian Corp. PLC, Class A* | 5,561,326 | ||||||
| 25,110 | Bill.com Holdings, Inc.* | 6,889,933 | ||||||
| 22,093 | Cadence Design Systems, Inc.* | 3,611,764 | ||||||
| 5,994 | HubSpot, Inc.* | 4,102,713 | ||||||
| 10,690 | Intuit, Inc. | 6,051,716 | ||||||
|
| |||||||
| Common Stocks – (continued) | ||||||||
| Software – (continued) | ||||||||
| 224,376 | Microsoft Corp. | 67,734,627 | ||||||
| 14,426 | Palo Alto Networks, Inc.* | 6,650,963 | ||||||
| 14,570 | Paycom Software, Inc.* | 7,123,273 | ||||||
| 31,105 | Qualtrics International, Inc., Class A* | 1,408,434 | ||||||
| 13,576 | ServiceNow, Inc.* | 8,738,057 | ||||||
| 49,443 | Splunk, Inc.* | 7,558,351 | ||||||
| 45,249 | UiPath, Inc., Class A*(a) | 2,859,737 | ||||||
| 26,673 | Workday, Inc., Class A* | 7,285,997 | ||||||
|
| |||||||
| 149,332,737 | ||||||||
|
| |||||||
| Specialty Retail – 2.0% | ||||||||
| 18,039 | Advance Auto Parts, Inc. | 3,659,211 | ||||||
| 1,164 | Burlington Stores, Inc.* | 348,606 | ||||||
| 9,900 | Five Below, Inc.* | 2,106,819 | ||||||
| 11,202 | Home Depot, Inc. (The) | 3,653,868 | ||||||
| 13,771 | Lowe’s Cos., Inc. | 2,807,769 | ||||||
| 4,905 | O’Reilly Automotive, Inc.* | 2,913,963 | ||||||
| 7,607 | RH* | 5,329,997 | ||||||
| 41,163 | Ross Stores, Inc. | 4,873,699 | ||||||
|
| |||||||
| 25,693,932 | ||||||||
|
| |||||||
| Technology Hardware, Storage & Peripherals – 5.1% | ||||||||
| 427,275 | Apple, Inc. | 64,873,163 | ||||||
|
| |||||||
| Textiles, Apparel & Luxury Goods – 1.5% | ||||||||
| 11,559 | Lululemon Athletica, Inc.* | 4,625,565 | ||||||
| 70,788 | NIKE, Inc., Class B | 11,661,615 | ||||||
| 28,483 | PVH Corp.* | 2,984,734 | ||||||
|
| |||||||
| 19,271,914 | ||||||||
|
| |||||||
| Water Utilities – 0.1% | ||||||||
| 10,476 | American Water Works Co., Inc. | 1,909,251 | ||||||
|
| |||||||
| TOTAL COMMON STOCKS | ||||||||
| (Cost $691,918,089) | $ | 1,263,648,133 | ||||||
|
| |||||||
| Shares | Dividend Rate | Value | ||||
| Investment Company – 0.4%(b) | ||||||
Goldman Sachs Financial Square Government Fund – Institutional Shares |
| |||||
| 4,496,378 | 0.026% | $ | 4,496,378 | |||
| (Cost $4,496,378) |
| |||||
| ||||||
| TOTAL INVESTMENTS BEFORE SECURITIES LENDING REINVESTMENT VEHICLE |
| |||||
| (Cost $696,414,467) | $ | 1,268,144,511 | ||||
| ||||||
| The accompanying notes are an integral part of these financial statements. | 51 |
GOLDMAN SACHS CAPITAL GROWTH FUND
Schedule of Investments (continued)
August 31, 2021
| Shares | Dividend Rate | Value | ||||
| Securities Lending Reinvestment Vehicle – 0.3%(b) | ||||||
Goldman Sachs Financial Square Government Fund – Institutional Shares |
| |||||
| 3,856,622 | 0.026% | $ | 3,856,622 | |||
| (Cost $3,856,622) |
| |||||
| ||||||
| TOTAL INVESTMENTS – 99.4% |
| |||||
| (Cost $700,271,089) | $ | 1,272,001,133 | ||||
| ||||||
| OTHER ASSETS IN EXCESS OF LIABILITIES – 0.6% | 7,806,865 | |||||
| ||||||
| NET ASSETS – 100.0% | $ | 1,279,807,998 | ||||
| ||||||
| The percentage shown for each investment category reflects the value of investments in that category as a percentage of net assets. | ||
* | Non-income producing security. | |
(a) | All or a portion of security is on loan. | |
(b) | Represents an affiliated issuer. | |
| ||
Investment Abbreviations: | ||
ADR | —American Depositary Receipt | |
PLC | —Public Limited Company | |
REIT | —Real Estate Investment Trust | |
| ||
| 52 | The accompanying notes are an integral part of these financial statements. |
GOLDMAN SACHS CONCENTRATED GROWTH FUND
Schedule of Investments
August 31, 2021
| Shares | Description | Value | ||||||
| Common Stocks – 100.1% | ||||||||
| Aerospace & Defense – 1.1% | ||||||||
| 11,015 | Boeing Co. (The)* | $ | 2,417,792 | |||||
|
| |||||||
| Auto Components – 1.5% | ||||||||
| 22,378 | Aptiv PLC* | 3,405,708 | ||||||
|
| |||||||
| Beverages – 1.3% | ||||||||
| 29,759 | Monster Beverage Corp.* | 2,903,586 | ||||||
|
| |||||||
| Biotechnology – 4.0% | ||||||||
| 28,095 | BioMarin Pharmaceutical, Inc.* | 2,365,880 | ||||||
| 46,659 | Genmab A/S ADR (Denmark)* | 2,211,170 | ||||||
| 23,335 | Sarepta Therapeutics, Inc.* | 1,822,930 | ||||||
| 14,714 | Seagen, Inc.* | 2,466,066 | ||||||
|
| |||||||
| 8,866,046 | ||||||||
|
| |||||||
| Chemicals – 1.4% | ||||||||
| 13,361 | Ecolab, Inc. | 3,011,035 | ||||||
|
| |||||||
| Entertainment – 3.0% | ||||||||
| 11,620 | Netflix, Inc.* | 6,613,988 | ||||||
|
| |||||||
| Equity Real Estate Investment Trusts (REITs) – 2.1% | ||||||||
| 16,274 | American Tower Corp.REIT | 4,754,775 | ||||||
|
| |||||||
| Food & Staples Retailing – 1.1% | ||||||||
| 15,944 | Walmart, Inc. | 2,361,306 | ||||||
|
| |||||||
| Food Products – 1.1% | ||||||||
| 28,851 | McCormick & Co., Inc. | 2,489,553 | ||||||
|
| |||||||
| Health Care Equipment & Supplies – 5.9% | ||||||||
| 110,527 | Boston Scientific Corp.* | 4,990,294 | ||||||
| 16,099 | Danaher Corp. | 5,218,652 | ||||||
| 9,712 | Insulet Corp.* | 2,892,331 | ||||||
|
| |||||||
| 13,101,277 | ||||||||
|
| |||||||
| Health Care Technology – 1.4% | ||||||||
| 9,104 | Veeva Systems, Inc., Class A* | 3,022,346 | ||||||
|
| |||||||
| Hotels, Restaurants & Leisure – 1.6% | ||||||||
| 15,304 | McDonald’s Corp. | 3,634,088 | ||||||
|
| |||||||
| Interactive Media & Services – 11.7% | ||||||||
| 5,735 | Alphabet, Inc., Class A* | 16,596,803 | ||||||
| 1,939 | Alphabet, Inc., Class C* | 5,641,016 | ||||||
| 47,989 | Snap, Inc., Class A* | 3,652,443 | ||||||
|
| |||||||
| 25,890,262 | ||||||||
|
| |||||||
| Internet & Direct Marketing Retail – 5.5% | ||||||||
| 2,867 | Amazon.com, Inc.* | 9,950,755 | ||||||
| 54,107 | Farfetch Ltd., Class A (United Kingdom)* | 2,264,919 | ||||||
|
| |||||||
| 12,215,674 | ||||||||
|
| |||||||
| IT Services – 11.0% | ||||||||
| 30,159 | Fidelity National Information Services, Inc. | 3,853,415 | ||||||
| 27,105 | Mastercard, Inc., Class A | 9,384,564 | ||||||
| 24,489 | PayPal Holdings, Inc.* | 7,068,995 | ||||||
| 13,606 | Snowflake, Inc., Class A* | 4,140,986 | ||||||
|
| |||||||
| 24,447,960 | ||||||||
|
| |||||||
| Common Stocks – (continued) | ||||||||
| Life Sciences Tools & Services – 2.4% | ||||||||
| 66,783 | Adaptive Biotechnologies Corp.* | 2,425,559 | ||||||
| 6,209 | Illumina, Inc.* | 2,838,506 | ||||||
|
| |||||||
| 5,264,065 | ||||||||
|
| |||||||
| Pharmaceuticals – 2.6% | ||||||||
| 21,964 | Eli Lilly & Co. | 5,673,081 | ||||||
|
| |||||||
| Professional Services – 1.7% | ||||||||
| 18,089 | Verisk Analytics, Inc. | 3,649,637 | ||||||
|
| |||||||
| Road & Rail – 1.5% | ||||||||
| 103,869 | CSX Corp. | 3,378,859 | ||||||
|
| |||||||
| Semiconductors & Semiconductor Equipment – 7.9% | ||||||||
| 107,412 | Marvell Technology, Inc. | 6,572,540 | ||||||
| 48,808 | NVIDIA Corp. | 10,925,671 | ||||||
|
| |||||||
| 17,498,211 | ||||||||
|
| |||||||
| Software – 16.4% | ||||||||
| 10,039 | Adobe, Inc.* | 6,662,884 | ||||||
| 64,547 | Microsoft Corp. | 19,485,449 | ||||||
| 22,554 | Splunk, Inc.* | 3,447,830 | ||||||
| 24,375 | Workday, Inc., Class A* | 6,658,275 | ||||||
|
| |||||||
| 36,254,438 | ||||||||
|
| |||||||
| Specialty Retail – 1.7% | ||||||||
| 32,500 | Ross Stores, Inc. | 3,848,000 | ||||||
|
| |||||||
| Technology Hardware, Storage & Peripherals – 7.7% | ||||||||
| 111,990 | Apple, Inc. | 17,003,442 | ||||||
|
| |||||||
| Textiles, Apparel & Luxury Goods – 4.5% | ||||||||
| 10,602 | Lululemon Athletica, Inc.* | 4,242,602 | ||||||
| 34,139 | NIKE, Inc., Class B | 5,624,059 | ||||||
|
| |||||||
| 9,866,661 | ||||||||
|
| |||||||
| TOTAL COMMON STOCKS | ||||||||
| (Cost $109,600,022) | $ | 221,571,790 | ||||||
|
| |||||||
| Shares | Dividend Rate | Value | ||||
| Investment Company – 0.1%(a) | ||||||
Goldman Sachs Financial Square Government Fund – Institutional Shares |
| |||||
| 164,062 | 0.026% | $ | 164,062 | |||
| (Cost $164,062) |
| |||||
| ||||||
| TOTAL INVESTMENTS – 100.2% |
| |||||
| (Cost $109,764,084) | $ | 221,735,852 | ||||
| ||||||
| LIABILITIES IN EXCESS OF OTHER ASSETS – (0.2)% | (316,225 | ) | ||||
| ||||||
| NET ASSETS – 100.0% | $ | 221,419,627 | ||||
| ||||||
| The accompanying notes are an integral part of these financial statements. | 53 |
GOLDMAN SACHS CONCENTRATED GROWTH FUND
Schedule of Investments (continued)
August 31, 2021
| The percentage shown for each investment category reflects the value of investments in that category as a percentage of net assets. | ||
* | Non-income producing security. | |
(a) | Represents an affiliated issuer. | |
| ||
Investment Abbreviations: | ||
ADR | —American Depositary Receipt | |
PLC | —Public Limited Company | |
REIT | —Real Estate Investment Trust | |
| ||
| 54 | The accompanying notes are an integral part of these financial statements. |
GOLDMAN SACHS FLEXIBLE CAP FUND
Schedule of Investments
August 31, 2021
| Shares | Description | Value | ||||||
| Common Stocks – 98.6% | ||||||||
| Automobiles – 1.1% | ||||||||
| 560 | Tesla, Inc.* | $ | 412,003 | |||||
|
| |||||||
| Banks – 5.2% | ||||||||
| 12,324 | Bank of America Corp. | 514,527 | ||||||
| 2,265 | East West Bancorp, Inc. | 166,115 | ||||||
| 4,203 | JPMorgan Chase & Co. | 672,270 | ||||||
| 1,339 | M&T Bank Corp. | 187,473 | ||||||
| 401 | SVB Financial Group* | 224,360 | ||||||
| 4,131 | Truist Financial Corp. | 235,715 | ||||||
|
| |||||||
| 2,000,460 | ||||||||
|
| |||||||
| Beverages – 1.6% | ||||||||
| 3,796 | Coca-Cola Co. (The) | 213,753 | ||||||
| 1,757 | Coca-Cola Europacific Partners PLC (United Kingdom) | 101,449 | ||||||
| 659 | Constellation Brands, Inc., Class A | 139,141 | ||||||
| 1,456 | Monster Beverage Corp.* | 142,062 | ||||||
|
| |||||||
| 596,405 | ||||||||
|
| |||||||
| Biotechnology – 1.6% | ||||||||
| 1,690 | BioMarin Pharmaceutical, Inc.* | 142,315 | ||||||
| 3,734 | Genmab A/S ADR (Denmark)* | 176,954 | ||||||
| 1,449 | Neurocrine Biosciences, Inc.* | 137,945 | ||||||
| 1,008 | Seagen, Inc.* | 168,941 | ||||||
|
| |||||||
| 626,155 | ||||||||
|
| |||||||
| Building Products – 1.2% | ||||||||
| 1,394 | Allegion PLC | 200,722 | ||||||
| 1,222 | Trane Technologies PLC | 242,567 | ||||||
|
| |||||||
| 443,289 | ||||||||
|
| |||||||
| Capital Markets – 1.5% | ||||||||
| 1,710 | Raymond James Financial, Inc. | 239,229 | ||||||
| 781 | S&P Global, Inc. | 346,623 | ||||||
|
| |||||||
| 585,852 | ||||||||
|
| |||||||
| Chemicals – 1.5% | ||||||||
| 808 | Ecolab, Inc. | 182,091 | ||||||
| 1,014 | Linde PLC (United Kingdom) | 318,994 | ||||||
| 237 | Sherwin-Williams Co. (The) | 71,970 | ||||||
|
| |||||||
| 573,055 | ||||||||
|
| |||||||
| Communications Equipment – 1.1% | ||||||||
| 7,331 | Cisco Systems, Inc. | 432,676 | ||||||
|
| |||||||
| Consumer Finance – 1.5% | ||||||||
| 1,863 | American Express Co. | 309,184 | ||||||
| 2,051 | Discover Financial Services | 262,979 | ||||||
|
| |||||||
| 572,163 | ||||||||
|
| |||||||
| Containers & Packaging – 0.5% | ||||||||
| 1,136 | Packaging Corp. of America | 172,331 | ||||||
|
| |||||||
| Diversified Financial Services – 1.4% | ||||||||
| 1,855 | Berkshire Hathaway, Inc., Class B* | 530,103 | ||||||
|
| |||||||
| Diversified Telecommunication Services – 0.8% | ||||||||
| 11,437 | AT&T, Inc. | 313,602 | ||||||
|
| |||||||
| Common Stocks – (continued) | ||||||||
| Electric Utilities – 0.7% | ||||||||
| 3,229 | NextEra Energy, Inc. | 271,204 | ||||||
|
| |||||||
| Electrical Equipment – 1.0% | ||||||||
| 1,389 | AMETEK, Inc. | 188,862 | ||||||
| 629 | Rockwell Automation, Inc. | 204,708 | ||||||
|
| |||||||
| 393,570 | ||||||||
|
| |||||||
| Electronic Equipment, Instruments & Components – 0.4% | ||||||||
| 4,349 | Vontier Corp. | 158,173 | ||||||
|
| |||||||
| Entertainment – 1.6% | ||||||||
| 1,468 | Electronic Arts, Inc. | 213,168 | ||||||
| 439 | Netflix, Inc.* | 249,875 | ||||||
| 800 | Walt Disney Co. (The)* | 145,040 | ||||||
|
| |||||||
| 608,083 | ||||||||
|
| |||||||
| Equity Real Estate Investment Trusts (REITs) – 2.8% | ||||||||
| 876 | AvalonBay Communities, Inc. REIT | 201,112 | ||||||
| 581 | Essex Property Trust, Inc. REIT | 192,160 | ||||||
| 4,379 | Healthpeak Properties, Inc. REIT | 157,644 | ||||||
| 598 | Public Storage REIT | 193,519 | ||||||
| 480 | SBA Communications Corp. REIT | 172,306 | ||||||
| 2,564 | Ventas, Inc. REIT | 143,430 | ||||||
|
| |||||||
| 1,060,171 | ||||||||
|
| |||||||
| Food & Staples Retailing – 0.8% | ||||||||
| 2,078 | Walmart, Inc. | 307,752 | ||||||
|
| |||||||
| Food Products – 1.2% | ||||||||
| 1,875 | Lamb Weston Holdings, Inc. | 122,156 | ||||||
| 1,599 | McCormick & Co., Inc. | 137,978 | ||||||
| 3,116 | Mondelez International, Inc., Class A | 193,410 | ||||||
|
| |||||||
| 453,544 | ||||||||
|
| |||||||
| Health Care Equipment & Supplies – 3.4% | ||||||||
| 5,331 | Boston Scientific Corp.* | 240,695 | ||||||
| 1,254 | Danaher Corp. | 406,496 | ||||||
| 370 | IDEXX Laboratories, Inc.* | 249,291 | ||||||
| 544 | West Pharmaceutical Services, Inc. | 245,681 | ||||||
| 1,095 | Zimmer Biomet Holdings, Inc. | 164,743 | ||||||
|
| |||||||
| 1,306,906 | ||||||||
|
| |||||||
| Health Care Providers & Services – 3.6% | ||||||||
| 2,587 | Centene Corp.* | 162,929 | ||||||
| 3,197 | CVS Health Corp. | 276,189 | ||||||
| 451 | Humana, Inc. | 182,845 | ||||||
| 1,157 | Quest Diagnostics, Inc. | 176,824 | ||||||
| 1,357 | UnitedHealth Group, Inc. | 564,878 | ||||||
|
| |||||||
| 1,363,665 | ||||||||
|
| |||||||
| Health Care Technology – 0.5% | ||||||||
| 590 | Veeva Systems, Inc., Class A* | 195,868 | ||||||
|
| |||||||
| Hotels, Restaurants & Leisure – 2.0% | ||||||||
| 1,456 | McDonald’s Corp. | 345,742 | ||||||
| 2,785 | Wyndham Hotels & Resorts, Inc. | 202,469 | ||||||
| 1,697 | Yum! Brands, Inc. | 222,358 | ||||||
|
| |||||||
| 770,569 | ||||||||
|
| |||||||
| The accompanying notes are an integral part of these financial statements. | 55 |
GOLDMAN SACHS FLEXIBLE CAP FUND
Schedule of Investments (continued)
August 31, 2021
| Shares | Description | Value | ||||||
| Common Stocks – (continued) | ||||||||
| Household Durables – 0.6% | ||||||||
| 2,038 | Lennar Corp., Class A | $ | 218,698 | |||||
|
| |||||||
| Household Products – 1.2% | ||||||||
| 3,234 | Procter & Gamble Co. (The) | 460,489 | ||||||
|
| |||||||
| Independent Power and Renewable Electricity Producers – 0.4% | ||||||||
| 6,694 | AES Corp. (The) | 159,786 | ||||||
|
| |||||||
| Industrial Conglomerates – 0.8% | ||||||||
| 2,794 | General Electric Co. | 294,516 | ||||||
|
| |||||||
| Insurance – 2.0% | ||||||||
| 1,580 | Chubb Ltd. | 290,594 | ||||||
| 1,915 | Globe Life, Inc. | 183,974 | ||||||
| 1,936 | Marsh & McLennan Cos., Inc. | 304,339 | ||||||
|
| |||||||
| 778,907 | ||||||||
|
| |||||||
| Interactive Media & Services – 6.7% | ||||||||
| 369 | Alphabet, Inc., Class A* | 1,067,867 | ||||||
| 300 | Alphabet, Inc., Class C* | 872,772 | ||||||
| 1,697 | Facebook, Inc., Class A* | 643,808 | ||||||
|
| |||||||
| 2,584,447 | ||||||||
|
| |||||||
| Internet & Direct Marketing Retail – 4.3% | ||||||||
| 473 | Amazon.com, Inc.* | 1,641,684 | ||||||
|
| |||||||
| IT Services – 5.4% | ||||||||
| 2,443 | Cognizant Technology Solutions Corp., Class A | 186,425 | ||||||
| 1,782 | Fidelity National Information Services, Inc. | 227,686 | ||||||
| 1,123 | Global Payments, Inc. | 182,645 | ||||||
| 2,229 | International Business Machines Corp. | 312,818 | ||||||
| 1,320 | Mastercard, Inc., Class A | 457,024 | ||||||
| 1,156 | PayPal Holdings, Inc.* | 333,691 | ||||||
| 1,652 | Visa, Inc., Class A | 378,473 | ||||||
|
| |||||||
| 2,078,762 | ||||||||
|
| |||||||
| Leisure Products – 0.4% | ||||||||
| 1,609 | Brunswick Corp. | 155,864 | ||||||
|
| |||||||
| Life Sciences Tools & Services – 1.0% | ||||||||
| 752 | ICON PLC (Ireland)* | 192,339 | ||||||
| 1,096 | PerkinElmer, Inc. | 202,541 | ||||||
|
| |||||||
| 394,880 | ||||||||
|
| |||||||
| Machinery – 2.4% | ||||||||
| 709 | Cummins, Inc. | 167,310 | ||||||
| 2,451 | Fortive Corp. | 181,055 | ||||||
| 894 | Illinois Tool Works, Inc. | 208,177 | ||||||
| 1,952 | ITT, Inc. | 186,748 | ||||||
| 1,372 | Lincoln Electric Holdings, Inc. | 191,545 | ||||||
|
| |||||||
| 934,835 | ||||||||
|
| |||||||
| Media – 2.0% | ||||||||
| 6,819 | Comcast Corp., Class A | 413,777 | ||||||
| 6,712 | Discovery, Inc., Class C* | 185,184 | ||||||
| 3,518 | Liberty Media Corp.-Liberty SiriusXM, Class A* | 174,141 | ||||||
|
| |||||||
| 773,102 | ||||||||
|
| |||||||
| Common Stocks – (continued) | ||||||||
| Metals & Mining – 0.5% | ||||||||
| 5,557 | Freeport-McMoRan, Inc. | 202,219 | ||||||
|
| |||||||
| Multi-Utilities – 1.2% | ||||||||
| 1,638 | Ameren Corp. | 143,685 | ||||||
| 2,149 | CMS Energy Corp. | 137,816 | ||||||
| 2,614 | Public Service Enterprise Group, Inc. | 167,139 | ||||||
|
| |||||||
| 448,640 | ||||||||
|
| |||||||
| Oil, Gas & Consumable Fuels – 2.4% | ||||||||
| 8,768 | Devon Energy Corp. | 259,094 | ||||||
| 2,824 | Diamondback Energy, Inc. | 217,843 | ||||||
| 3,165 | Hess Corp. | 217,594 | ||||||
| 1,594 | Pioneer Natural Resources Co. | 238,574 | ||||||
|
| |||||||
| 933,105 | ||||||||
|
| |||||||
| Personal Products – 0.6% | ||||||||
| 679 | Estee Lauder Cos., Inc. (The), Class A | 231,193 | ||||||
|
| |||||||
| Pharmaceuticals – 3.1% | ||||||||
| 2,884 | AstraZeneca PLC ADR (United Kingdom) | 168,080 | ||||||
| 5,040 | Bristol-Myers Squibb Co. | 336,974 | ||||||
| 1,549 | Eli Lilly & Co. | 400,091 | ||||||
| 1,643 | Johnson & Johnson | 284,453 | ||||||
|
| |||||||
| 1,189,598 | ||||||||
|
| |||||||
| Professional Services – 0.9% | ||||||||
| 1,515 | Booz Allen Hamilton Holding Corp. | 124,094 | ||||||
| 1,127 | Verisk Analytics, Inc. | 227,383 | ||||||
|
| |||||||
| 351,477 | ||||||||
|
| |||||||
| Road & Rail – 1.0% | ||||||||
| 707 | Old Dominion Freight Line, Inc. | 204,125 | ||||||
| 744 | Saia, Inc.* | 178,657 | ||||||
|
| |||||||
| 382,782 | ||||||||
|
| |||||||
| Semiconductors & Semiconductor Equipment – 3.9% | ||||||||
| 1,489 | Intel Corp. | 80,495 | ||||||
| 2,452 | Marvell Technology, Inc. | 150,038 | ||||||
| 1,264 | Microchip Technology, Inc. | 198,903 | ||||||
| 1,012 | MKS Instruments, Inc. | 148,946 | ||||||
| 1,552 | NVIDIA Corp. | 347,415 | ||||||
| 1,053 | NXP Semiconductors NV (China) | 226,532 | ||||||
| 1,748 | Texas Instruments, Inc. | 333,711 | ||||||
|
| |||||||
| 1,486,040 | ||||||||
|
| |||||||
| Software – 10.5% | ||||||||
| 831 | Adobe, Inc.* | 551,535 | ||||||
| 1,440 | Cadence Design Systems, Inc.* | 235,411 | ||||||
| 680 | Intuit, Inc. | 384,955 | ||||||
| 8,079 | Microsoft Corp. | 2,438,888 | ||||||
| 495 | Palo Alto Networks, Inc.* | 228,215 | ||||||
| 723 | Workday, Inc., Class A* | 197,495 | ||||||
|
| |||||||
| 4,036,499 | ||||||||
|
| |||||||
| Specialty Retail – 3.2% | ||||||||
| 991 | Advance Auto Parts, Inc. | 201,024 | ||||||
| 498 | Home Depot, Inc. (The) | 162,438 | ||||||
| 699 | Lowe’s Cos., Inc. | 142,519 | ||||||
|
| |||||||
| 56 | The accompanying notes are an integral part of these financial statements. |
GOLDMAN SACHS FLEXIBLE CAP FUND
| Shares | Description | Value | ||||||
| Common Stocks – (continued) | ||||||||
| Specialty Retail – (continued) | ||||||||
| 413 | O’Reilly Automotive, Inc.* | $ | 245,355 | |||||
| 1,784 | Ross Stores, Inc. | 211,225 | ||||||
| 644 | Ulta Beauty, Inc.* | 249,428 | ||||||
|
| |||||||
| 1,211,989 | ||||||||
|
| |||||||
| Technology Hardware, Storage & Peripherals – 6.1% | ||||||||
| 14,194 | Apple, Inc. | 2,155,075 | ||||||
| 2,274 | NetApp, Inc. | 202,227 | ||||||
|
| |||||||
| 2,357,302 | ||||||||
|
| |||||||
| Trading Companies & Distributors – 0.5% | ||||||||
| 3,468 | Fastenal Co. | 193,688 | ||||||
|
| |||||||
| Water Utilities – 0.5% | ||||||||
| 961 | American Water Works Co., Inc. | 175,142 | ||||||
|
| |||||||
| TOTAL COMMON STOCKS | ||||||||
| (Cost $24,770,251) | $ | 37,823,243 | ||||||
|
| |||||||
| Shares | Dividend Rate | Value | ||||
| Investment Company – 1.4%(a) | ||||||
Goldman Sachs Financial Square Government Fund – Institutional Shares |
| |||||
| 544,338 | 0.026% | $ | 544,338 | |||
| (Cost $544,338) |
| |||||
| ||||||
| TOTAL INVESTMENTS – 100.0% |
| |||||
| (Cost $25,314,589) | $ | 38,367,581 | ||||
| ||||||
| OTHER ASSETS IN EXCESS OF LIABILITIES – 0.0% | 4,819 | |||||
| ||||||
| NET ASSETS – 100.0% | $ | 38,372,400 | ||||
| ||||||
| The percentage shown for each investment category reflects the value of investments in that category as a percentage of net assets. | ||
* | Non-income producing security. | |
(a) | Represents an affiliated issuer. | |
| ||
Investment Abbreviations: | ||
ADR | —American Depositary Receipt | |
PLC | —Public Limited Company | |
REIT | —Real Estate Investment Trust | |
| ||
| The accompanying notes are an integral part of these financial statements. | 57 |
GOLDMAN SACHS GROWTH OPPORTUNITIES FUND
Schedule of Investments
August 31, 2021
| Shares | Description | Value | ||||||
| Common Stocks – 98.8% | ||||||||
| Aerospace & Defense – 0.5% | ||||||||
| 11,490 | TransDigm Group, Inc.* | $ | 6,979,830 | |||||
|
| |||||||
| Banks – 0.4% | ||||||||
| 10,122 | SVB Financial Group* | 5,663,259 | ||||||
|
| |||||||
| Beverages – 0.9% | ||||||||
| 223,368 | Coca-Cola Europacific Partners PLC (United Kingdom) | 12,897,268 | ||||||
|
| |||||||
| Biotechnology – 3.8% | ||||||||
| 42,741 | Alnylam Pharmaceuticals, Inc.* | 8,609,320 | ||||||
| 209,003 | Genmab A/S ADR (Denmark)* | 9,904,652 | ||||||
| 142,953 | Neurocrine Biosciences, Inc.* | 13,609,126 | ||||||
| 39,884 | Novavax, Inc.* | 9,513,929 | ||||||
| 88,883 | Seagen, Inc.* | 14,896,791 | ||||||
|
| |||||||
| 56,533,818 | ||||||||
|
| |||||||
| Building Products – 3.6% | ||||||||
| 50,525 | Allegion PLC | 7,275,095 | ||||||
| 544,130 | AZEK Co., Inc. (The)* | 23,120,083 | ||||||
| 111,394 | Trane Technologies PLC | 22,111,709 | ||||||
|
| |||||||
| 52,506,887 | ||||||||
|
| |||||||
| Capital Markets – 1.3% | ||||||||
| 26,704 | MarketAxess Holdings, Inc. | 12,708,968 | ||||||
| 73,624 | Tradeweb Markets, Inc., Class A | 6,406,024 | ||||||
|
| |||||||
| 19,114,992 | ||||||||
|
| |||||||
| Chemicals – 1.1% | ||||||||
| 323,914 | Danimer Scientific, Inc.* | 6,329,280 | ||||||
| 66,071 | PPG Industries, Inc. | 10,541,628 | ||||||
|
| |||||||
| 16,870,908 | ||||||||
|
| |||||||
| Construction Materials – 1.0% | ||||||||
| 39,058 | Martin Marietta Materials, Inc. | 14,890,862 | ||||||
|
| |||||||
| Consumer Finance – 1.0% | ||||||||
| 115,099 | Discover Financial Services | 14,757,994 | ||||||
|
| |||||||
| Containers & Packaging – 1.8% | ||||||||
| 270,806 | Ball Corp. | 25,986,544 | ||||||
|
| |||||||
| Diversified Consumer Services – 0.7% | ||||||||
| 129,821 | Chegg, Inc.* | 10,803,704 | ||||||
|
| |||||||
| Electrical Equipment – 2.9% | ||||||||
| 109,010 | AMETEK, Inc. | 14,822,089 | ||||||
| 84,146 | Rockwell Automation, Inc. | 27,385,316 | ||||||
|
| |||||||
| 42,207,405 | ||||||||
|
| |||||||
| Electronic Equipment, Instruments & Components – 3.1% | ||||||||
| 302,834 | Amphenol Corp., Class A | 23,206,170 | ||||||
| 122,106 | Keysight Technologies, Inc.* | 21,903,374 | ||||||
|
| |||||||
| 45,109,544 | ||||||||
|
| |||||||
| Entertainment – 1.5% | ||||||||
| 167,499 | Live Nation Entertainment, Inc.* | 14,522,163 | ||||||
| 32,875 | Spotify Technology SA* | 7,703,928 | ||||||
|
| |||||||
| 22,226,091 | ||||||||
|
| |||||||
| Common Stocks – (continued) | ||||||||
| Equity Real Estate Investment Trusts (REITs) – 0.8% | ||||||||
| 136,091 | Equity LifeStyle Properties, Inc.REIT | 11,577,261 | ||||||
|
| |||||||
| Food Products – 2.4% | ||||||||
| 229,360 | McCormick & Co., Inc. | 19,791,475 | ||||||
| 833,960 | Utz Brands, Inc. | 16,195,503 | ||||||
|
| |||||||
| 35,986,978 | ||||||||
|
| |||||||
| Health Care Equipment & Supplies – 8.7% | ||||||||
| 29,637 | Align Technology, Inc.* | 21,012,633 | ||||||
| 41,474 | IDEXX Laboratories, Inc.* | 27,943,522 | ||||||
| 96,926 | Insulet Corp.* | 28,865,532 | ||||||
| 75,773 | West Pharmaceutical Services, Inc. | 34,220,602 | ||||||
| 106,199 | Zimmer Biomet Holdings, Inc. | 15,977,640 | ||||||
|
| |||||||
| 128,019,929 | ||||||||
|
| |||||||
| Health Care Providers & Services – 1.6% | ||||||||
| 180,706 | Guardant Health, Inc.* | 22,998,453 | ||||||
|
| |||||||
| Health Care Technology – 2.9% | ||||||||
| 223,835 | Certara, Inc.* | 7,514,141 | ||||||
| 107,863 | Veeva Systems, Inc., Class A* | 35,808,359 | ||||||
|
| |||||||
| 43,322,500 | ||||||||
|
| |||||||
| Hotels, Restaurants & Leisure – 2.4% | ||||||||
| 194,105 | Expedia Group, Inc.* | 28,048,172 | ||||||
| 59,898 | Yum! Brands, Inc. | 7,848,435 | ||||||
|
| |||||||
| 35,896,607 | ||||||||
|
| |||||||
| Insurance – 0.5% | ||||||||
| 246,044 | Ryan Specialty Group Holdings, Inc., Class A* | 8,097,308 | ||||||
|
| |||||||
| Interactive Media & Services – 2.9% | ||||||||
| 136,192 | Bumble, Inc., Class A* | 7,422,464 | ||||||
| 168,765 | Match Group, Inc.* | 23,195,062 | ||||||
| 182,645 | Twitter, Inc.* | 11,780,602 | ||||||
|
| |||||||
| 42,398,128 | ||||||||
|
| |||||||
| Internet & Direct Marketing Retail – 2.2% | ||||||||
| 147,534 | Etsy, Inc.* | 31,905,703 | ||||||
|
| |||||||
| IT Services – 2.3% | ||||||||
| 11,634 | EPAM Systems, Inc.* | 7,362,112 | ||||||
| 69,872 | Okta, Inc.* | 18,418,259 | ||||||
| 102,240 | Shift4 Payments, Inc., Class A* | 8,762,990 | ||||||
|
| |||||||
| 34,543,361 | ||||||||
|
| |||||||
| Life Sciences Tools & Services – 3.7% | ||||||||
| 29,734 | 10X Genomics, Inc., Class A* | 5,230,805 | ||||||
| 156,396 | Adaptive Biotechnologies Corp.* | 5,680,303 | ||||||
| 134,241 | Agilent Technologies, Inc. | 23,555,268 | ||||||
| 106,875 | PerkinElmer, Inc. | 19,750,500 | ||||||
|
| |||||||
| 54,216,876 | ||||||||
|
| |||||||
| Machinery – 2.8% | ||||||||
| 62,639 | Cummins, Inc. | 14,781,551 | ||||||
| 194,206 | Fortive Corp. | 14,345,997 | ||||||
| 130,379 | ITT, Inc. | 12,473,359 | ||||||
|
| |||||||
| 41,600,907 | ||||||||
|
| |||||||
| 58 | The accompanying notes are an integral part of these financial statements. |
GOLDMAN SACHS GROWTH OPPORTUNITIES FUND
| Shares | Description | Value | ||||||
| Common Stocks – (continued) | ||||||||
| Media – 0.5% | ||||||||
| 261,644 | Discovery, Inc., Class A*(a) | $ | 7,545,813 | |||||
|
| |||||||
| Oil, Gas & Consumable Fuels – 1.3% | ||||||||
| 89,453 | Cheniere Energy, Inc.* | 7,823,560 | ||||||
| 71,608 | Pioneer Natural Resources Co. | 10,717,569 | ||||||
|
| |||||||
| 18,541,129 | ||||||||
|
| |||||||
| Pharmaceuticals – 1.6% | ||||||||
| 181,025 | Catalent, Inc.* | 23,612,901 | ||||||
|
| |||||||
| Professional Services – 4.8% | ||||||||
| 352,813 | CoStar Group, Inc.* | 29,897,373 | ||||||
| 93,768 | TransUnion | 11,395,625 | ||||||
| 146,180 | Verisk Analytics, Inc. | 29,493,277 | ||||||
|
| |||||||
| 70,786,275 | ||||||||
|
| |||||||
| Road & Rail – 2.0% | ||||||||
| 78,211 | Old Dominion Freight Line, Inc. | 22,581,080 | ||||||
| 31,315 | Saia, Inc.* | 7,519,671 | ||||||
|
| |||||||
| 30,100,751 | ||||||||
|
| |||||||
| Semiconductors & Semiconductor Equipment – 5.5% | ||||||||
| 94,636 | Cree, Inc.* | 8,042,167 | ||||||
| 121,295 | Entegris, Inc. | 14,572,381 | ||||||
| 255,055 | Marvell Technology, Inc. | 15,606,816 | ||||||
| 105,206 | Microchip Technology, Inc. | 16,555,216 | ||||||
| 88,132 | MKS Instruments, Inc. | 12,971,268 | ||||||
| 286,074 | ON Semiconductor Corp.* | 12,690,243 | ||||||
|
| |||||||
| 80,438,091 | ||||||||
|
| |||||||
| Software – 19.9% | ||||||||
| 54,558 | ANSYS, Inc.* | 19,933,311 | ||||||
| 73,206 | Bill.com Holdings, Inc.* | 20,086,994 | ||||||
| 56,155 | C3.ai, Inc., Class A*(a) | 2,894,229 | ||||||
| 224,490 | Cadence Design Systems, Inc.* | 36,699,625 | ||||||
| 127,844 | DocuSign, Inc.* | 37,872,506 | ||||||
| 187,382 | Dynatrace, Inc.* | 12,878,765 | ||||||
| 42,480 | HubSpot, Inc.* | 29,076,286 | ||||||
| 72,960 | Palo Alto Networks, Inc.* | 33,637,478 | ||||||
| 50,543 | Paycom Software, Inc.* | 24,710,473 | ||||||
| 30,463 | Procore Technologies, Inc.*(a) | 2,762,994 | ||||||
| 82,588 | RingCentral, Inc., Class A* | 20,833,649 | ||||||
| 183,249 | Splunk, Inc.* | 28,013,275 | ||||||
| 101,682 | UiPath, Inc., Class A* | 6,426,302 | ||||||
| 64,685 | Zscaler, Inc.* | 18,004,423 | ||||||
|
| |||||||
| 293,830,310 | ||||||||
|
| |||||||
| Specialty Retail – 4.1% | ||||||||
| 49,196 | Burlington Stores, Inc.* | 14,733,710 | ||||||
| 27,203 | O’Reilly Automotive, Inc.* | 16,160,758 | ||||||
| 15,447 | RH* | 10,823,250 | ||||||
| 47,939 | Ulta Beauty, Inc.* | 18,567,254 | ||||||
|
| |||||||
| 60,284,972 | ||||||||
|
| |||||||
| Common Stocks – (continued) | ||||||||
| Textiles, Apparel & Luxury Goods – 2.3% | ||||||||
| 83,929 | Lululemon Athletica, Inc.* | 33,585,868 | ||||||
|
| |||||||
| TOTAL COMMON STOCKS | ||||||||
| (Cost $953,723,779 ) | $ | 1,455,839,227 | ||||||
|
| |||||||
| Shares | Dividend Rate | Value | ||||
| Investment Company – 0.9%(b) | ||||||
Goldman Sachs Financial Square Government Fund – Institutional Shares |
| |||||
| 13,911,294 | 0.026% | $ | 13,911,294 | |||
| (Cost $13,911,294) |
| |||||
| ||||||
| TOTAL INVESTMENTS BEFORE SECURITIES LENDING REINVESTMENT VEHICLE |
| |||||
| (Cost $967,635,073) | $ | 1,469,750,521 | ||||
| ||||||
| Securities Lending Reinvestment Vehicle – 0.5%(b) | ||||||
Goldman Sachs Financial Square Government Fund – Institutional Shares |
| |||||
| 7,447,030 | 0.026% | $ | 7,447,030 | |||
| (Cost $7,447,030) |
| |||||
| ||||||
| TOTAL INVESTMENTS – 100.2% |
| |||||
| (Cost $975,082,103) | $ | 1,477,197,551 | ||||
| ||||||
| LIABILITIES IN EXCESS OF OTHER ASSETS – (0.2)% | (2,951,523 | ) | ||||
| ||||||
| NET ASSETS – 100.0% | $ | 1,474,246,028 | ||||
| ||||||
| The percentage shown for each investment category reflects the value of investments in that category as a percentage of net assets. | ||
* | Non-income producing security. | |
(a) | All or a portion of security is on loan. | |
(b) | Represents an affiliated issuer. | |
| ||
Investment Abbreviations: | ||
ADR | —American Depositary Receipt | |
PLC | —Public Limited Company | |
REIT | —Real Estate Investment Trust | |
| ||
| The accompanying notes are an integral part of these financial statements. | 59 |
GOLDMAN SACHS SMALL CAP GROWTH FUND
Schedule of Investments
August 31, 2021
| Shares | Description | Value | ||||||
| Common Stocks – 98.6% | ||||||||
| Aerospace & Defense – 2.1% | ||||||||
| 5,480 | Kratos Defense & Security Solutions, Inc.* | $ | 135,466 | |||||
| 2,253 | Maxar Technologies, Inc. | 71,623 | ||||||
| 2,819 | Moog, Inc., Class A | 223,941 | ||||||
|
| |||||||
| 431,030 | ||||||||
|
| |||||||
| Auto Components – 1.2% | ||||||||
| 1,594 | Fox Factory Holding Corp.* | 244,950 | ||||||
|
| |||||||
| Automobiles – 0.8% | ||||||||
| 2,306 | Winnebago Industries, Inc. | 160,544 | ||||||
|
| |||||||
| Biotechnology – 11.7% | ||||||||
| 1,873 | 4D Molecular Therapeutics, Inc.* | 57,220 | ||||||
| 3,474 | ACADIA Pharmaceuticals, Inc.* | 60,830 | ||||||
| 1,599 | Acceleron Pharma, Inc.* | 214,074 | ||||||
| 4,620 | Agios Pharmaceuticals, Inc.* | 206,422 | ||||||
| 4,061 | Akouos, Inc.* | 48,285 | ||||||
| 3,829 | Allogene Therapeutics, Inc.* | 91,322 | ||||||
| 1,195 | Applied Molecular Transport, Inc.* | 35,934 | ||||||
| 4,992 | Avidity Biosciences, Inc.* | 114,017 | ||||||
| 2,460 | Beam Therapeutics, Inc.* | 272,863 | ||||||
| 3,976 | Cytokinetics, Inc.* | 131,089 | ||||||
| 4,003 | Design Therapeutics, Inc.* | 62,927 | ||||||
| 3,786 | Dyne Therapeutics, Inc.* | 64,097 | ||||||
| 2,062 | Generation Bio Co.* | 51,550 | ||||||
| 7,974 | Halozyme Therapeutics, Inc.* | 334,828 | ||||||
| 5,677 | Inozyme Pharma, Inc.* | 87,539 | ||||||
| 433 | Intellia Therapeutics, Inc.* | 69,510 | ||||||
| 2,942 | Kronos Bio, Inc.* | 61,517 | ||||||
| 5,867 | MaxCyte, Inc.* | 90,117 | ||||||
| 869 | PTC Therapeutics, Inc.* | 37,932 | ||||||
| 1,775 | Repare Therapeutics, Inc. (Canada)* | 60,350 | ||||||
| 5,220 | Sutro Biopharma, Inc.* | 113,378 | ||||||
| 2,322 | Y-mAbs Therapeutics, Inc.* | 71,471 | ||||||
| 1,230 | Zentalis Pharmaceuticals, Inc.* | 83,874 | ||||||
|
| |||||||
| 2,421,146 | ||||||||
|
| |||||||
| Building Products – 3.6% | ||||||||
| 4,016 | AAON, Inc. | 273,530 | ||||||
| 3,979 | AZEK Co., Inc. (The)* | 169,067 | ||||||
| 2,097 | Gibraltar Industries, Inc.* | 156,562 | ||||||
| 1,232 | Masonite International Corp.* | 147,446 | ||||||
|
| |||||||
| 746,605 | ||||||||
|
| |||||||
| Capital Markets – 3.5% | ||||||||
| 2,148 | Houlihan Lokey, Inc. | 193,750 | ||||||
| 3,716 | Moelis & Co., Class A | 230,206 | ||||||
| 5,358 | Open Lending Corp., Class A* | 198,085 | ||||||
| 4,460 | Virtu Financial, Inc., Class A | 109,181 | ||||||
|
| |||||||
| 731,222 | ||||||||
|
| |||||||
| Chemicals – 2.2% | ||||||||
| 2,230 | Ashland Global Holdings, Inc. | 203,175 | ||||||
| 1,737 | Balchem Corp. | 243,910 | ||||||
|
| |||||||
| 447,085 | ||||||||
|
| |||||||
| Common Stocks – (continued) | ||||||||
| Commercial Services & Supplies – 0.5% | ||||||||
| 794 | Tetra Tech, Inc. | 114,209 | ||||||
|
| |||||||
| Construction & Engineering – 1.4% | ||||||||
| 4,219 | Ameresco, Inc., Class A* | 291,744 | ||||||
|
| |||||||
| Diversified Telecommunication Services – 0.8% | ||||||||
| 1,577 | Bandwidth, Inc., Class A* | 162,273 | ||||||
|
| |||||||
| Electronic Equipment, Instruments & Components – 2.8% | ||||||||
| 1,788 | 908 Devices, Inc.* | 64,368 | ||||||
| 2,132 | Badger Meter, Inc. | 228,316 | ||||||
| 1,944 | Novanta, Inc.* | 297,859 | ||||||
|
| |||||||
| 590,543 | ||||||||
|
| |||||||
| Food Products – 0.7% | ||||||||
| 1,211 | Freshpet, Inc.* | 155,177 | ||||||
|
| |||||||
| Health Care Equipment & Supplies – 6.2% | ||||||||
| 4,690 | Axonics, Inc.* | 351,656 | ||||||
| 544 | Figs, Inc., Class A*(a) | 22,310 | ||||||
| 785 | Hill-Rom Holdings, Inc. | 114,280 | ||||||
| 1,083 | Inari Medical, Inc.* | 88,654 | ||||||
| 3,889 | Neogen Corp.* | 170,260 | ||||||
| 1,688 | Outset Medical, Inc.* | 83,202 | ||||||
| 1,581 | Shockwave Medical, Inc.* | 338,666 | ||||||
| 963 | Tandem Diabetes Care, Inc.* | 108,020 | ||||||
|
| |||||||
| 1,277,048 | ||||||||
|
| |||||||
| Health Care Providers & Services – 2.0% | ||||||||
| 5,829 | Alignment Healthcare, Inc.* | 102,998 | ||||||
| 3,231 | Castle Biosciences, Inc.* | 247,915 | ||||||
| 1,166 | National Research Corp. | 62,964 | ||||||
|
| |||||||
| 413,877 | ||||||||
|
| |||||||
| Health Care Technology – 1.6% | ||||||||
| 1,710 | Omnicell, Inc.* | 265,512 | ||||||
| 1,704 | Simulations Plus, Inc. | 75,487 | ||||||
|
| |||||||
| 340,999 | ||||||||
|
| |||||||
| Hotels, Restaurants & Leisure – 4.0% | ||||||||
| 1,396 | Shake Shack, Inc., Class A* | 121,103 | ||||||
| 2,817 | Texas Roadhouse, Inc. | 267,615 | ||||||
| 1,508 | Wingstop, Inc. | 259,270 | ||||||
| 2,600 | Wyndham Hotels & Resorts, Inc. | 189,020 | ||||||
|
| |||||||
| 837,008 | ||||||||
|
| |||||||
| Household Durables – 3.5% | ||||||||
| 7,521 | Purple Innovation, Inc.* | 183,513 | ||||||
| 6,768 | Sonos, Inc.* | 268,893 | ||||||
| 799 | TopBuild Corp.* | 174,813 | ||||||
| 3,538 | Traeger, Inc.* | 88,945 | ||||||
|
| |||||||
| 716,164 | ||||||||
|
| |||||||
| Internet & Direct Marketing Retail – 1.4% | ||||||||
| 2,851 | Poshmark, Inc., Class A* | 83,192 | ||||||
| 3,466 | Revolve Group, Inc.* | 199,156 | ||||||
|
| |||||||
| 282,348 | ||||||||
|
| |||||||
| 60 | The accompanying notes are an integral part of these financial statements. |
GOLDMAN SACHS SMALL CAP GROWTH FUND
| Shares | Description | Value | ||||||
| Common Stocks – (continued) | ||||||||
| IT Services – 1.0% | ||||||||
| 3,403 | BigCommerce Holdings, Inc.Series 1* | $ | 202,615 | |||||
|
| |||||||
| Leisure Products – 2.4% | ||||||||
| 2,314 | Latham Group, Inc.* | 50,839 | ||||||
| 3,065 | Malibu Boats, Inc., Class A* | 219,454 | ||||||
| 2,268 | YETI Holdings, Inc.* | 225,303 | ||||||
|
| |||||||
| 495,596 | ||||||||
|
| |||||||
| Life Sciences Tools & Services – 3.6% | ||||||||
| 3,614 | Alpha Teknova, Inc.* | 68,702 | ||||||
| 5,297 | Codex DNA, Inc.* | 68,702 | ||||||
| 3,039 | Nautilus Biotechnology, Inc.* | 23,978 | ||||||
| 1,970 | Olink Holding AB ADR (Sweden)* | 63,059 | ||||||
| 7,303 | Pacific Biosciences of California, Inc.* | 228,657 | ||||||
| 4,081 | Quanterix Corp.* | 208,335 | ||||||
| 4,221 | Rapid Micro Biosystems, Inc., Class A*(a) | 79,777 | ||||||
|
| |||||||
| 741,210 | ||||||||
|
| |||||||
| Machinery – 10.0% | ||||||||
| 2,045 | Chart Industries, Inc.* | 385,237 | ||||||
| 5,530 | Colfax Corp.* | 266,380 | ||||||
| 6,622 | Evoqua Water Technologies Corp.* | 257,728 | ||||||
| 4,145 | Federal Signal Corp. | 168,411 | ||||||
| 2,039 | Franklin Electric Co., Inc. | 173,274 | ||||||
| 1,145 | RBC Bearings, Inc.* | 265,091 | ||||||
| 4,892 | Shyft Group, Inc. (The) | 215,297 | ||||||
| 1,943 | Watts Water Technologies, Inc., Class A | 333,361 | ||||||
|
| |||||||
| 2,064,779 | ||||||||
|
| |||||||
| Media – 0.4% | ||||||||
| 3,024 | PubMatic, Inc., Class A* | 88,150 | ||||||
|
| |||||||
| Personal Products – 1.0% | ||||||||
| 6,781 | elf Beauty, Inc.* | 209,872 | ||||||
|
| |||||||
| Pharmaceuticals – 1.0% | ||||||||
| 1,387 | Atea Pharmaceuticals, Inc.* | 41,222 | ||||||
| 3,963 | Omeros Corp.*(a) | 64,597 | ||||||
| 489 | Pharvaris NV (Netherlands)* | 9,897 | ||||||
| 3,268 | Rani Therapeutics Holdings, Inc., Class A*(a) | 60,262 | ||||||
| 4,421 | Theravance Biopharma, Inc.* | 36,694 | ||||||
|
| |||||||
| 212,672 | ||||||||
|
| |||||||
| Road & Rail – 1.1% | ||||||||
| 915 | Saia, Inc.* | 219,719 | ||||||
|
| |||||||
| Semiconductors & Semiconductor Equipment – 9.1% | ||||||||
| 2,148 | Ambarella, Inc.* | 222,468 | ||||||
| 5,861 | Axcelis Technologies, Inc.* | 291,350 | ||||||
| 2,056 | Brooks Automation, Inc. | 174,678 | ||||||
| 5,580 | FormFactor, Inc.* | 216,950 | ||||||
| 4,808 | MACOM Technology Solutions Holdings, Inc.* | 291,894 | ||||||
| 2,045 | Onto Innovation, Inc.* | 151,596 | ||||||
| 2,934 | Power Integrations, Inc. | 318,750 | ||||||
| 3,117 | Semtech Corp.* | 217,941 | ||||||
|
| |||||||
| 1,885,627 | ||||||||
|
| |||||||
| Common Stocks – (continued) | ||||||||
| Software – 15.0% | ||||||||
| 4,528 | Alkami Technology, Inc.* | 129,320 | ||||||
| 2,126 | Alteryx, Inc., Class A* | 157,260 | ||||||
| 12,077 | BTRS Holdings, Inc.* | 131,760 | ||||||
| 3,536 | Couchbase, Inc.* | 177,613 | ||||||
| 3,374 | Domo, Inc., Class B* | 301,973 | ||||||
| 6,943 | EverCommerce, Inc.* | 149,969 | ||||||
| 3,625 | LivePerson, Inc.* | 232,362 | ||||||
| 2,805 | Olo, Inc., Class A* | 107,684 | ||||||
| 4,631 | PagerDuty, Inc.* | 198,207 | ||||||
| 2,761 | Rapid7, Inc.* | 335,517 | ||||||
| 3,948 | Sailpoint Technologies Holdings, Inc.* | 185,003 | ||||||
| 2,243 | Sprout Social, Inc., Class A* | 272,749 | ||||||
| 5,492 | Tenable Holdings, Inc.* | 243,680 | ||||||
| 6,731 | Vertex, Inc., Class A* | 139,332 | ||||||
| 5,060 | WalkMe Ltd. (Israel)* | 140,364 | ||||||
| 1,525 | Workiva, Inc.* | 213,912 | ||||||
|
| |||||||
| 3,116,705 | ||||||||
|
| |||||||
| Specialty Retail – 1.6% | ||||||||
| 7,534 | Leslie’s, Inc.* | 181,720 | ||||||
| 4,948 | MYT Netherlands Parent BV ADR (Germany)* | 141,711 | ||||||
|
| |||||||
| 323,431 | ||||||||
|
| |||||||
| Textiles, Apparel & Luxury Goods – 1.8% | ||||||||
| 2,656 | Crocs, Inc.* | 379,330 | ||||||
|
| |||||||
| Trading Companies & Distributors – 0.6% | ||||||||
| 4,638 | Core & Main, Inc., Class A* | 127,220 | ||||||
|
| |||||||
| TOTAL COMMON STOCKS | ||||||||
| (Cost $14,334,374) | $ | 20,430,898 | ||||||
|
| |||||||
| Shares | Dividend Rate | Value | ||||
| Investment Company – 1.2%(b) | ||||||
Goldman Sachs Financial Square Government Fund – Institutional Shares |
| |||||
| 249,984 | 0.026% | $ | 249,984 | |||
| (Cost $249,984) |
| |||||
| ||||||
| TOTAL INVESTMENTS BEFORE SECURITIES LENDING REINVESTMENT VEHICLE |
| |||||
| (Cost $14,584,358) | $ | 20,680,882 | ||||
| ||||||
| The accompanying notes are an integral part of these financial statements. | 61 |
GOLDMAN SACHS SMALL CAP GROWTH FUND
Schedule of Investments (continued)
August 31, 2021
| Shares | Dividend Rate | Value | ||||
| Securities Lending Reinvestment Vehicle – 0.7%(b) | ||||||
Goldman Sachs Financial Square Government Fund – Institutional Shares |
| |||||
| 141,504 | 0.026% | $ | 141,504 | |||
| (Cost $141,504) |
| |||||
| ||||||
| TOTAL INVESTMENTS – 100.5% |
| |||||
| (Cost $14,725,862) | $ | 20,822,386 | ||||
| ||||||
| LIABILITIES IN EXCESS OF OTHER ASSETS – (0.5)% | (98,440 | ) | ||||
| ||||||
| NET ASSETS – 100.0% | $ | 20,723,946 | ||||
| ||||||
| The percentage shown for each investment category reflects the value of investments in that category as a percentage of net assets. | ||
* | Non-income producing security. | |
(a) | All or a portion of security is on loan. | |
(b) | Represents an affiliated issuer. | |
| ||
Investment Abbreviations: | ||
ADR | —American Depositary Receipt | |
| ||
| 62 | The accompanying notes are an integral part of these financial statements. |
GOLDMAN SACHS SMALL/MID CAP GROWTH FUND
Schedule of Investments
August 31, 2021
| Shares | Description | Value | ||||||
| Common Stocks – 98.8% | ||||||||
| Aerospace & Defense – 0.1% | ||||||||
| 147,760 | Virgin Galactic Holdings, Inc.*(a) | $ | 4,005,774 | |||||
|
| |||||||
| Air Freight & Logistics – 0.4% | ||||||||
| 174,304 | GXO Logistics, Inc.* | 14,256,324 | ||||||
|
| |||||||
| Auto Components – 0.9% | ||||||||
| 198,082 | Fox Factory Holding Corp.* | 30,439,261 | ||||||
|
| |||||||
| Biotechnology – 8.9% | ||||||||
| 681,574 | Agios Pharmaceuticals, Inc.* | 30,452,726 | ||||||
| 316,705 | Allogene Therapeutics, Inc.* | 7,553,414 | ||||||
| 180,760 | Alnylam Pharmaceuticals, Inc.* | 36,410,487 | ||||||
| 87,484 | Argenx SE ADR (Netherlands)* | 28,958,954 | ||||||
| 411,197 | Beam Therapeutics, Inc.* | 45,609,971 | ||||||
| 1,269,713 | Exelixis, Inc.* | 24,340,398 | ||||||
| 845,476 | Halozyme Therapeutics, Inc.* | 35,501,537 | ||||||
| 44,247 | Intellia Therapeutics, Inc.* | 7,102,971 | ||||||
| 479,676 | Neurocrine Biosciences, Inc.* | 45,665,155 | ||||||
| 56,279 | Novavax, Inc.* | 13,424,793 | ||||||
| 57,259 | Twist Bioscience Corp.* | 6,482,292 | ||||||
| 196,267 | Ultragenyx Pharmaceutical, Inc.* | 18,898,550 | ||||||
| 334,467 | Y-mAbs Therapeutics, Inc.* | 10,294,894 | ||||||
|
| |||||||
| 310,696,142 | ||||||||
|
| |||||||
| Building Products – 3.0% | ||||||||
| 324,410 | Allegion PLC | 46,711,796 | ||||||
| 942,832 | AZEK Co., Inc. (The)* | 40,060,932 | ||||||
| 59,500 | Lennox International, Inc. | 19,943,210 | ||||||
|
| |||||||
| 106,715,938 | ||||||||
|
| |||||||
| Capital Markets – 2.2% | ||||||||
| 268,758 | Evercore, Inc., Class A | 37,529,367 | ||||||
| 556,996 | Stifel Financial Corp. | 38,488,424 | ||||||
|
| |||||||
| 76,017,791 | ||||||||
|
| |||||||
| Chemicals – 2.9% | ||||||||
| 409,085 | Ashland Global Holdings, Inc. | 37,271,734 | ||||||
| 525,434 | RPM International, Inc. | 43,237,964 | ||||||
| 137,339 | Scotts Miracle-Gro Co. (The) | 21,538,876 | ||||||
|
| |||||||
| 102,048,574 | ||||||||
|
| |||||||
| Commercial Services & Supplies – 0.8% | ||||||||
| 194,175 | Tetra Tech, Inc. | 27,930,132 | ||||||
|
| |||||||
| Communications Equipment – 0.4% | ||||||||
| 270,855 | Ciena Corp.* | 15,473,946 | ||||||
|
| |||||||
| Construction & Engineering – 0.5% | ||||||||
| 248,762 | Ameresco, Inc., Class A* | 17,201,892 | ||||||
|
| |||||||
| Containers & Packaging – 1.2% | ||||||||
| 189,349 | Avery Dennison Corp. | 42,677,371 | ||||||
|
| |||||||
| Distributors – 1.2% | ||||||||
| 87,660 | Pool Corp. | 43,330,338 | ||||||
|
| |||||||
| Electrical Equipment – 1.5% | ||||||||
| 85,087 | Generac Holdings, Inc.* | 37,181,317 | ||||||
|
| |||||||
| Common Stocks – (continued) | ||||||||
| Electrical Equipment – (continued) | ||||||||
| 514,621 | Shoals Technologies Group, Inc., Class A* | 16,761,206 | ||||||
|
| |||||||
| 53,942,523 | ||||||||
|
| |||||||
| Electronic Equipment, Instruments & Components – 3.0% | ||||||||
| 347,817 | Novanta, Inc.* | 53,292,521 | ||||||
| 114,543 | Teledyne Technologies, Inc.* | 53,076,935 | ||||||
|
| |||||||
| 106,369,456 | ||||||||
|
| |||||||
| Food Products – 1.3% | ||||||||
| 279,062 | Freshpet, Inc.* | 35,759,005 | ||||||
| 620,859 | Oatly Group AB ADR* | 11,312,051 | ||||||
|
| |||||||
| 47,071,056 | ||||||||
|
| |||||||
| Health Care Equipment & Supplies – 3.4% | ||||||||
| 250,127 | Axonics, Inc.* | 18,754,522 | ||||||
| 84,966 | Figs, Inc., Class A*(a) | 3,484,456 | ||||||
| 372,597 | Neogen Corp.* | 16,312,297 | ||||||
| 399,693 | Tandem Diabetes Care, Inc.* | 44,833,564 | ||||||
| 93,099 | Teleflex, Inc. | 36,816,930 | ||||||
|
| |||||||
| 120,201,769 | ||||||||
|
| |||||||
| Health Care Providers & Services – 4.4% | ||||||||
| 915,730 | Alignment Healthcare, Inc.* | 16,180,949 | ||||||
| 245,074 | Castle Biosciences, Inc.* | 18,804,528 | ||||||
| 447,118 | Guardant Health, Inc.* | 56,904,708 | ||||||
| 228,465 | Molina Healthcare, Inc.* | 61,404,538 | ||||||
|
| |||||||
| 153,294,723 | ||||||||
|
| |||||||
| Health Care Technology – 0.8% | ||||||||
| 860,556 | Certara, Inc.* | 28,888,865 | ||||||
|
| |||||||
| Hotels, Restaurants & Leisure – 2.4% | ||||||||
| 302,459 | Planet Fitness, Inc., Class A* | 24,589,917 | ||||||
| 331,481 | Texas Roadhouse, Inc. | 31,490,695 | ||||||
| 360,975 | Wyndham Hotels & Resorts, Inc. | 26,242,882 | ||||||
|
| |||||||
| 82,323,494 | ||||||||
|
| |||||||
| Household Durables – 0.4% | ||||||||
| 592,944 | Traeger, Inc.*(a) | 14,906,612 | ||||||
|
| |||||||
| Interactive Media & Services – 0.7% | ||||||||
| 436,429 | Bumble, Inc., Class A* | 23,785,380 | ||||||
|
| |||||||
| Internet & Direct Marketing Retail – 0.9% | ||||||||
| 244,024 | Revolve Group, Inc.* | 14,021,619 | ||||||
| 392,908 | Stitch Fix, Inc., Class A* | 16,466,774 | ||||||
|
| |||||||
| 30,488,393 | ||||||||
|
| |||||||
| IT Services – 2.8% | ||||||||
| 403,219 | DigitalOcean Holdings, Inc.* | 24,870,548 | ||||||
| 100,334 | MongoDB, Inc.* | 39,313,871 | ||||||
| 409,064 | Shift4 Payments, Inc., Class A* | 35,060,876 | ||||||
|
| |||||||
| 99,245,295 | ||||||||
|
| |||||||
| Leisure Products – 2.7% | ||||||||
| 325,133 | Brunswick Corp. | 31,495,634 | ||||||
| 387,533 | Latham Group, Inc.* | 8,514,100 | ||||||
|
| |||||||
| The accompanying notes are an integral part of these financial statements. | 63 |
GOLDMAN SACHS SMALL/MID CAP GROWTH FUND
Schedule of Investments (continued)
August 31, 2021
| Shares | Description | Value | ||||||
| Common Stocks – (continued) | ||||||||
| Leisure Products – (continued) | ||||||||
| 175,945 | Polaris, Inc. | $ | 21,071,173 | |||||
| 325,755 | YETI Holdings, Inc.* | 32,360,502 | ||||||
|
| |||||||
| 93,441,409 | ||||||||
|
| |||||||
| Life Sciences Tools & Services – 7.3% | ||||||||
| 169,292 | 10X Genomics, Inc., Class A* | 29,781,849 | ||||||
| 131,389 | Berkeley Lights, Inc.* | 4,672,193 | ||||||
| 119,052 | Bio-Techne Corp. | 59,423,615 | ||||||
| 461,649 | Pacific Biosciences of California, Inc.* | 14,454,230 | ||||||
| 359,980 | PerkinElmer, Inc. | 66,524,304 | ||||||
| 342,302 | Quanterix Corp.* | 17,474,517 | ||||||
| 155,372 | Repligen Corp.* | 43,967,169 | ||||||
| 838,690 | Stevanato Group SPA (Italy)* | 20,765,964 | ||||||
|
| |||||||
| 257,063,841 | ||||||||
|
| |||||||
| Machinery – 5.8% | ||||||||
| 239,385 | Chart Industries, Inc.* | 45,095,346 | ||||||
| 884,920 | Colfax Corp.* | 42,626,596 | ||||||
| 210,084 | IDEX Corp. | 47,058,816 | ||||||
| 170,092 | RBC Bearings, Inc.* | 39,379,700 | ||||||
| 263,004 | Toro Co. (The) | 28,914,660 | ||||||
|
| |||||||
| 203,075,118 | ||||||||
|
| |||||||
| Pharmaceuticals – 0.9% | ||||||||
| 222,517 | Atea Pharmaceuticals, Inc.* | 6,613,205 | ||||||
| 790,090 | Elanco Animal Health, Inc.* | 26,373,204 | ||||||
|
| |||||||
| 32,986,409 | ||||||||
|
| |||||||
| Professional Services – 2.1% | ||||||||
| 387,324 | Booz Allen Hamilton Holding Corp. | 31,725,709 | ||||||
| 297,209 | Jacobs Engineering Group, Inc. | 40,111,326 | ||||||
|
| |||||||
| 71,837,035 | ||||||||
|
| |||||||
| Road & Rail – 0.4% | ||||||||
| 174,304 | XPO Logistics, Inc.* | 15,148,761 | ||||||
|
| |||||||
| Semiconductors & Semiconductor Equipment – 8.9% | ||||||||
| 1,048,515 | Allegro MicroSystems, Inc. (Japan)* | 31,507,876 | ||||||
| 413,145 | Brooks Automation, Inc. | 35,100,799 | ||||||
| 91,589 | Enphase Energy, Inc.* | 15,911,757 | ||||||
| 626,937 | Entegris, Inc. | 75,320,211 | ||||||
| 724,796 | Lattice Semiconductor Corp.* | 45,024,327 | ||||||
| 349,477 | MKS Instruments, Inc. | 51,436,025 | ||||||
| 119,876 | Monolithic Power Systems, Inc. | 59,330,229 | ||||||
|
| |||||||
| 313,631,224 | ||||||||
|
| |||||||
| Software – 17.2% | ||||||||
| 305,851 | Avalara, Inc.* | 54,961,425 | ||||||
| 229,766 | Bill.com Holdings, Inc.* | 63,045,493 | ||||||
| 280,764 | Blackline, Inc.* | 30,631,352 | ||||||
| 1,140,101 | Dynatrace, Inc.* | 78,359,142 | ||||||
| 298,255 | Elastic NV* | 47,586,585 | ||||||
| 1,163,241 | EverCommerce, Inc.* | 25,126,006 | ||||||
| 48,847 | Monday.com Ltd.*(a) | 18,530,598 | ||||||
| 393,799 | nCino, Inc.* | 24,419,476 | ||||||
| 320,433 | Olo, Inc., Class A* | 12,301,423 | ||||||
| 174,543 | Procore Technologies, Inc.*(a) | 15,831,050 | ||||||
|
| |||||||
| Common Stocks – (continued) | ||||||||
| Software – (continued) | ||||||||
| 666,610 | Qualtrics International, Inc., Class A* | 30,184,101 | ||||||
| 444,285 | Rapid7, Inc.* | 53,989,513 | ||||||
| 526,162 | Sailpoint Technologies Holdings, Inc.* | 24,655,951 | ||||||
| 505,436 | Smartsheet, Inc., Class A* | 40,217,543 | ||||||
| 689,636 | Varonis Systems, Inc.* | 47,591,780 | ||||||
| 254,734 | Workiva, Inc.* | 35,731,538 | ||||||
|
| |||||||
| 603,162,976 | ||||||||
|
| |||||||
| Specialty Retail – 4.2% | ||||||||
| 192,789 | Five Below, Inc.* | 41,027,427 | ||||||
| 390,803 | Floor & Decor Holdings, Inc., Class A* | 48,186,010 | ||||||
| 81,658 | RH* | 57,215,311 | ||||||
|
| |||||||
| 146,428,748 | ||||||||
|
| |||||||
| Textiles, Apparel & Luxury Goods – 3.3% | ||||||||
| 222,729 | Crocs, Inc.* | 31,810,156 | ||||||
| 128,267 | Deckers Outdoor Corp.* | 53,673,326 | ||||||
| 1,192,372 | Levi Strauss & Co., Class A | 31,252,070 | ||||||
|
| |||||||
| 116,735,552 | ||||||||
|
| |||||||
| Trading Companies & Distributors – 1.9% | ||||||||
| 950,742 | Core & Main, Inc., Class A* | 26,078,853 | ||||||
| 204,625 | SiteOne Landscape Supply, Inc.* | 40,945,462 | ||||||
|
| |||||||
| 67,024,315 | ||||||||
|
| |||||||
| TOTAL COMMON STOCKS | ||||||||
| (Cost $2,366,162,945) | $ | 3,471,846,437 | ||||||
|
| |||||||
| Shares | Dividend Rate | Value | ||||
| Investment Company – 0.9%(b) | ||||||
Goldman Sachs Financial Square Government Fund – Institutional Shares |
| |||||
| 31,272,380 | 0.026% | $ | 31,272,380 | |||
| (Cost $31,272,380) |
| |||||
| ||||||
| TOTAL INVESTMENTS BEFORE SECURITIES LENDING REINVESTMENT VEHICLE |
| |||||
| (Cost $2,397,435,325) | $ | 3,503,118,817 | ||||
| ||||||
| Securities Lending Reinvestment Vehicle – 0.5%(b) | ||||||
Goldman Sachs Financial Square Government Fund – Institutional Shares |
| |||||
| 18,738,133 | 0.026% | $ | 18,738,133 | |||
| (Cost $18,738,133) |
| |||||
| ||||||
| TOTAL INVESTMENTS – 100.2% |
| |||||
| (Cost $2,416,173,458) | $ | 3,521,856,950 | ||||
| ||||||
| LIABILITIES IN EXCESS OF OTHER ASSETS – (0.2)% | (8,018,187 | ) | ||||
| ||||||
| NET ASSETS – 100.0% | $ | 3,513,838,763 | ||||
| ||||||
| 64 | The accompanying notes are an integral part of these financial statements. |
GOLDMAN SACHS SMALL/MID CAP GROWTH FUND
| The percentage shown for each investment category reflects the value of investments in that category as a percentage of net assets. | ||
* | Non-income producing security. | |
(a) | All or a portion of security is on loan. | |
(b) | Represents an affiliated issuer. | |
| ||
Investment Abbreviations: | ||
ADR | —American Depositary Receipt | |
PLC | —Public Limited Company | |
| ||
| The accompanying notes are an integral part of these financial statements. | 65 |
GOLDMAN SACHS STRATEGIC GROWTH FUND
Schedule of Investments
August 31, 2021
| Shares | Description | Value | ||||||
| Common Stocks – 99.3% | ||||||||
| Aerospace & Defense – 0.5% | ||||||||
| 5,209 | Boeing Co. (The)* | $ | 1,143,376 | |||||
|
| |||||||
| Air Freight & Logistics – 1.1% | ||||||||
| 12,319 | United Parcel Service, Inc., Class B | 2,409,966 | ||||||
|
| |||||||
| Auto Components – 0.5% | ||||||||
| 7,259 | Aptiv PLC* | 1,104,747 | ||||||
|
| |||||||
| Automobiles – 1.5% | ||||||||
| 4,550 | Tesla, Inc.* | 3,347,526 | ||||||
|
| |||||||
| Beverages – 1.5% | ||||||||
| 36,518 | Coca-Cola Co. (The) | 2,056,328 | ||||||
| 14,273 | Monster Beverage Corp.* | 1,392,617 | ||||||
|
| |||||||
| 3,448,945 | ||||||||
|
| |||||||
| Biotechnology – 2.8% | ||||||||
| 4,257 | Alnylam Pharmaceuticals, Inc.* | 857,487 | ||||||
| 9,533 | BioMarin Pharmaceutical, Inc.* | 802,774 | ||||||
| 25,617 | Genmab A/S ADR (Denmark)* | 1,213,990 | ||||||
| 3,379 | Moderna, Inc.* | 1,272,835 | ||||||
| 9,374 | Sarepta Therapeutics, Inc.* | 732,297 | ||||||
| 8,326 | Seagen, Inc.* | 1,395,438 | ||||||
|
| |||||||
| 6,274,821 | ||||||||
|
| |||||||
| Capital Markets – 1.3% | ||||||||
| 32,772 | Charles Schwab Corp. (The) | 2,387,440 | ||||||
| 5,120 | Intercontinental Exchange, Inc. | 611,994 | ||||||
|
| |||||||
| 2,999,434 | ||||||||
|
| |||||||
| Chemicals – 1.8% | ||||||||
| 15,209 | Danimer Scientific, Inc.* | 297,184 | ||||||
| 4,991 | Ecolab, Inc. | 1,124,772 | ||||||
| 3,982 | Linde PLC (United Kingdom) | 1,252,697 | ||||||
| 4,752 | Sherwin-Williams Co. (The) | 1,443,040 | ||||||
|
| |||||||
| 4,117,693 | ||||||||
|
| |||||||
| Construction Materials – 0.4% | ||||||||
| 2,480 | Martin Marietta Materials, Inc. | 945,500 | ||||||
|
| |||||||
| Diversified Consumer Services – 0.4% | ||||||||
| 11,223 | Chegg, Inc.* | 933,978 | ||||||
|
| |||||||
| Electronic Equipment, Instruments & Components – 0.7% | ||||||||
| 21,046 | Amphenol Corp., Class A | 1,612,755 | ||||||
|
| |||||||
| Entertainment – 2.5% | ||||||||
| 11,378 | Live Nation Entertainment, Inc.* | 986,473 | ||||||
| 7,991 | Netflix, Inc.* | 4,548,397 | ||||||
|
| |||||||
| 5,534,870 | ||||||||
|
| |||||||
| Equity Real Estate Investment Trusts (REITs) – 1.6% | ||||||||
| 6,907 | American Tower Corp. REIT | 2,018,018 | ||||||
| 1,935 | Equinix, Inc. REIT | 1,632,076 | ||||||
|
| |||||||
| 3,650,094 | ||||||||
|
| |||||||
| Food & Staples Retailing – 0.5% | ||||||||
| 7,465 | Walmart, Inc. | 1,105,567 | ||||||
|
| |||||||
| Common Stocks – (continued) | ||||||||
| Food Products – 1.3% | ||||||||
| 21,748 | McCormick & Co., Inc. | 1,876,635 | ||||||
| 16,981 | Mondelez International, Inc., Class A | 1,054,011 | ||||||
|
| |||||||
| 2,930,646 | ||||||||
|
| |||||||
| Health Care Equipment & Supplies – 4.9% | ||||||||
| 40,967 | Boston Scientific Corp.* | 1,849,660 | ||||||
| 7,929 | Danaher Corp. | 2,570,265 | ||||||
| 4,560 | Insulet Corp.* | 1,358,013 | ||||||
| 2,656 | Intuitive Surgical, Inc.* | 2,798,255 | ||||||
| 5,382 | West Pharmaceutical Services, Inc. | 2,430,619 | ||||||
|
| |||||||
| 11,006,812 | ||||||||
|
| |||||||
| Health Care Providers & Services – 0.4% | ||||||||
| 7,317 | Guardant Health, Inc.* | 931,235 | ||||||
|
| |||||||
| Health Care Technology – 0.9% | ||||||||
| 38,394 | American Well Corp., Class A* | 411,200 | ||||||
| 4,740 | Veeva Systems, Inc., Class A* | 1,573,585 | ||||||
|
| |||||||
| 1,984,785 | ||||||||
|
| |||||||
| Hotels, Restaurants & Leisure – 1.5% | ||||||||
| 712 | Chipotle Mexican Grill, Inc.* | 1,355,171 | ||||||
| 8,262 | McDonald’s Corp. | 1,961,894 | ||||||
|
| |||||||
| 3,317,065 | ||||||||
|
| |||||||
| Interactive Media & Services – 13.1% | ||||||||
| 3,894 | Alphabet, Inc., Class A* | 11,269,042 | ||||||
| 2,384 | Alphabet, Inc., Class C* | 6,935,628 | ||||||
| 25,608 | Facebook, Inc., Class A* | 9,715,163 | ||||||
| 21,864 | Snap, Inc., Class A* | 1,664,069 | ||||||
|
| |||||||
| 29,583,902 | ||||||||
|
| |||||||
| Internet & Direct Marketing Retail – 8.0% | ||||||||
| 4,558 | Amazon.com, Inc.* | 15,819,861 | ||||||
| 5,913 | Etsy, Inc.* | 1,278,745 | ||||||
| 25,899 | Farfetch Ltd., Class A (United Kingdom)* | 1,084,132 | ||||||
|
| |||||||
| 18,182,738 | ||||||||
|
| |||||||
| IT Services – 10.2% | ||||||||
| 16,812 | Fidelity National Information Services, Inc. | 2,148,069 | ||||||
| 5,728 | Global Payments, Inc. | 931,602 | ||||||
| 16,724 | Mastercard, Inc., Class A | 5,790,350 | ||||||
| 4,755 | Okta, Inc.* | 1,253,418 | ||||||
| 17,863 | PayPal Holdings, Inc.* | 5,156,334 | ||||||
| 427 | Shopify, Inc., Class A (Canada)* | 651,081 | ||||||
| 5,902 | Snowflake, Inc., Class A* | 1,796,274 | ||||||
| 23,079 | Visa, Inc., Class A | 5,287,399 | ||||||
|
| |||||||
| 23,014,527 | ||||||||
|
| |||||||
| Life Sciences Tools & Services – 1.4% | ||||||||
| 3,724 | 10X Genomics, Inc., Class A* | 655,126 | ||||||
| 21,376 | Adaptive Biotechnologies Corp.* | 776,376 | ||||||
| 3,831 | Illumina, Inc.* | 1,751,380 | ||||||
|
| |||||||
| 3,182,882 | ||||||||
|
| |||||||
| 66 | The accompanying notes are an integral part of these financial statements. |
GOLDMAN SACHS STRATEGIC GROWTH FUND
| Shares | Description | Value | ||||||
| Common Stocks – (continued) | ||||||||
| Machinery – 0.8% | ||||||||
| 4,848 | Deere & Co. | $ | 1,832,689 | |||||
|
| |||||||
| Personal Products – 0.7% | ||||||||
| 4,910 | Estee Lauder Cos., Inc. (The), Class A | 1,671,806 | ||||||
|
| |||||||
| Pharmaceuticals – 1.4% | ||||||||
| 12,236 | Eli Lilly & Co. | 3,160,436 | ||||||
|
| |||||||
| Professional Services – 1.1% | ||||||||
| 12,495 | Verisk Analytics, Inc. | 2,520,991 | ||||||
|
| |||||||
| Road & Rail – 1.3% | ||||||||
| 13,683 | Union Pacific Corp. | 2,967,022 | ||||||
|
| |||||||
| Semiconductors & Semiconductor Equipment – 5.2% | ||||||||
| 62,373 | Marvell Technology, Inc. | 3,816,604 | ||||||
| 35,091 | NVIDIA Corp. | 7,855,120 | ||||||
|
| |||||||
| 11,671,724 | ||||||||
|
| |||||||
| Software – 17.7% | ||||||||
| 8,932 | Adobe, Inc.* | 5,928,168 | ||||||
| 5,043 | Atlassian Corp. PLC, Class A* | 1,851,084 | ||||||
| 5,932 | Bill.com Holdings, Inc.* | 1,627,681 | ||||||
| 10,085 | C3.ai, Inc., Class A*(a) | 519,781 | ||||||
| 3,772 | HubSpot, Inc.* | 2,581,821 | ||||||
| 55,351 | Microsoft Corp. | 16,709,360 | ||||||
| 25,377 | Qualtrics International, Inc., Class A* | 1,149,071 | ||||||
| 3,821 | ServiceNow, Inc.* | 2,459,348 | ||||||
| 15,718 | Splunk, Inc.* | 2,402,811 | ||||||
| 8,182 | UiPath, Inc., Class A*(a) | 517,102 | ||||||
| 15,975 | Workday, Inc., Class A* | 4,363,731 | ||||||
|
| |||||||
| 40,109,958 | ||||||||
|
| |||||||
| Specialty Retail – 1.1% | ||||||||
| 20,573 | Ross Stores, Inc. | 2,435,843 | ||||||
|
| |||||||
| Technology Hardware, Storage & Peripherals – 8.2% | ||||||||
| 122,136 | Apple, Inc. | 18,543,909 | ||||||
|
| |||||||
| Textiles, Apparel & Luxury Goods – 3.0% | ||||||||
| 5,415 | Lululemon Athletica, Inc.* | 2,166,921 | ||||||
| 24,556 | NIKE, Inc., Class B | 4,045,355 | ||||||
| 5,919 | PVH Corp.* | 620,252 | ||||||
|
| |||||||
| 6,832,528 | ||||||||
|
| |||||||
| TOTAL COMMON STOCKS | ||||||||
| (Cost $92,580,698) | $ | 224,510,770 | ||||||
|
| |||||||
| Shares | Dividend Rate | Value | ||||
| Investment Company – 0.6%(b) | ||||||
Goldman Sachs Financial Square Government Fund – Institutional Shares |
| |||||
| 1,330,594 | 0.026% | $ | 1,330,594 | |||
| (Cost $1,330,594) |
| |||||
| ||||||
| TOTAL INVESTMENTS BEFORE SECURITIES LENDING REINVESTMENT VEHICLE |
| |||||
| (Cost $93,911,292) | $ | 225,841,364 | ||||
| ||||||
| Securities Lending Reinvestment Vehicle – 0.4%(b) | ||||||
Goldman Sachs Financial Square Government Fund – Institutional Shares |
| |||||
| 1,015,902 | 0.026% | $ | 1,015,902 | |||
| (Cost $1,015,902) |
| |||||
| ||||||
| TOTAL INVESTMENTS – 100.3% |
| |||||
| (Cost $94,927,194) | $ | 226,857,266 | ||||
| ||||||
| LIABILITIES IN EXCESS OF OTHER ASSETS – (0.3)% | (791,374 | ) | ||||
| ||||||
| NET ASSETS – 100.0% | $ | 226,065,892 | ||||
| ||||||
| The percentage shown for each investment category reflects the value of investments in that category as a percentage of net assets. | ||
* | Non-income producing security. | |
(a) | All or a portion of security is on loan. | |
(b) | Represents an affiliated issuer. | |
| ||
Investment Abbreviations: | ||
ADR | —American Depositary Receipt | |
PLC | —Public Limited Company | |
REIT | —Real Estate Investment Trust | |
| ||
| The accompanying notes are an integral part of these financial statements. | 67 |
GOLDMAN SACHS TECHNOLOGY OPPORTUNITIES FUND
Schedule of Investments
August 31, 2021
| Shares | Description | Value | ||||||
| Common Stocks – 98.4% | ||||||||
| Communications Equipment – 2.3% | ||||||||
| 363,368 | Cisco Systems, Inc. | $ | 21,445,979 | |||||
|
| |||||||
| Entertainment – 3.4% | ||||||||
| 174,735 | Activision Blizzard, Inc. | 14,392,922 | ||||||
| 98,150 | Walt Disney Co. (The)* | 17,794,595 | ||||||
|
| |||||||
| 32,187,517 | ||||||||
|
| |||||||
| Equity Real Estate Investment Trusts (REITs) – 4.7% | ||||||||
| 80,451 | American Tower Corp. REIT | 23,505,369 | ||||||
| 25,354 | Equinix, Inc. REIT | 21,384,831 | ||||||
|
| |||||||
| 44,890,200 | ||||||||
|
| |||||||
| Interactive Media & Services – 16.6% | ||||||||
| 11,569 | Alphabet, Inc., Class A* | 33,480,108 | ||||||
| 23,112 | Alphabet, Inc., Class C* | 67,238,355 | ||||||
| 111,102 | Facebook, Inc., Class A* | 42,149,877 | ||||||
| 194,075 | Snap, Inc., Class A* | 14,771,048 | ||||||
|
| |||||||
| 157,639,388 | ||||||||
|
| |||||||
| Internet & Direct Marketing Retail – 8.5% | ||||||||
| 16,679 | Amazon.com, Inc.* | 57,889,307 | ||||||
| 184,600 | Meituan, Class B (China)*(a) | 5,902,506 | ||||||
| 9,203 | MercadoLibre, Inc. (Argentina)* | 17,186,142 | ||||||
|
| |||||||
| 80,977,955 | ||||||||
|
| |||||||
| IT Services – 13.1% | ||||||||
| 37,573 | Accenture PLC, Class A | 12,645,569 | ||||||
| 156,545 | Fidelity National Information Services, Inc. | 20,001,755 | ||||||
| 58,914 | Mastercard, Inc., Class A | 20,397,794 | ||||||
| 120,269 | PayPal Holdings, Inc.* | 34,716,849 | ||||||
| 6,720 | Shopify, Inc., Class A (Canada)* | 10,246,522 | ||||||
| 44,845 | Snowflake, Inc., Class A* | 13,648,576 | ||||||
| 57,773 | Visa, Inc., Class A | 13,235,794 | ||||||
|
| |||||||
| 124,892,859 | ||||||||
|
| |||||||
| Road & Rail – 1.7% | ||||||||
| 418,849 | Uber Technologies, Inc.* | 16,393,750 | ||||||
|
| |||||||
| Semiconductors & Semiconductor Equipment – 15.7% | ||||||||
| 40,960 | KLA Corp. | 13,924,762 | ||||||
| 22,327 | Lam Research Corp. | 13,503,816 | ||||||
| 483,003 | Marvell Technology, Inc. | 29,554,954 | ||||||
| 82,982 | Microchip Technology, Inc. | 13,058,047 | ||||||
| 96,664 | NVIDIA Corp. | 21,638,236 | ||||||
| 75,191 | NXP Semiconductors NV (China) | 16,175,840 | ||||||
| 168,661 | Taiwan Semiconductor Manufacturing Co. Ltd. ADR (Taiwan) | 20,072,346 | ||||||
| 109,966 | Texas Instruments, Inc. | 20,993,609 | ||||||
|
| |||||||
| 148,921,610 | ||||||||
|
| |||||||
| Software – 29.9% | ||||||||
| 53,834 | Adobe, Inc.* | 35,729,626 | ||||||
| 65,288 | Atlassian Corp. PLC, Class A* | 23,964,613 | ||||||
| 39,715 | HubSpot, Inc.* | 27,183,726 | ||||||
| 293,758 | Microsoft Corp. | 88,679,665 | ||||||
| 29,758 | Palo Alto Networks, Inc.* | 13,719,628 | ||||||
|
| |||||||
| Common Stocks – (continued) | ||||||||
| Software – (continued) | ||||||||
| 41,046 | Paycom Software, Inc.* | 20,067,390 | ||||||
| 24,537 | ServiceNow, Inc.* | 15,792,995 | ||||||
| 137,868 | Splunk, Inc.* | 21,075,881 | ||||||
| 186,556 | UiPath, Inc., Class A* | 11,790,339 | ||||||
| 95,021 | Workday, Inc., Class A* | 25,955,936 | ||||||
|
| |||||||
| 283,959,799 | ||||||||
|
| |||||||
| Technology Hardware, Storage & Peripherals – 2.5% | ||||||||
| 157,057 | Apple, Inc. | 23,845,964 | ||||||
|
| |||||||
| TOTAL COMMON STOCKS | ||||||||
| (Cost $434,995,354) | $ | 935,155,021 | ||||||
|
| |||||||
| Shares | Dividend Rate | Value | ||||
| Investment Company – 2.0%(b) | ||||||
Goldman Sachs Financial Square Government Fund – Institutional Shares |
| |||||
| 19,184,235 | 0.026% | $ | 19,184,235 | |||
| (Cost $19,184,235) |
| |||||
| ||||||
| TOTAL INVESTMENTS – 100.4% |
| |||||
| (Cost $454,179,589) | $ | 954,339,256 | ||||
| ||||||
| LIABILITIES IN EXCESS OF OTHER ASSETS – (0.4)% | (3,914,306 | ) | ||||
| ||||||
| NET ASSETS – 100.0% | $ | 950,424,950 | ||||
| ||||||
| The percentage shown for each investment category reflects the value of investments in that category as a percentage of net assets. | ||
* | Non-income producing security. | |
(a) | Exempt from registration under Rule 144A of the Securities Act of 1933. | |
(b) | Represents an affiliated issuer. | |
| ||
Investment Abbreviations: | ||
ADR | —American Depositary Receipt | |
PLC | —Public Limited Company | |
REIT | —Real Estate Investment Trust | |
| ||
| 68 | The accompanying notes are an integral part of these financial statements. |
GOLDMAN SACHS U.S. EQUITY ESG FUND
Schedule of Investments
August 31, 2021
| Shares | Description | Value | ||||||
| Common Stocks – 98.2% | ||||||||
| Auto Components – 1.8% | ||||||||
| 2,066 | Aptiv PLC* | $ | 314,424 | |||||
|
| |||||||
| Banks – 3.4% | ||||||||
| 3,623 | JPMorgan Chase & Co. | 579,499 | ||||||
|
| |||||||
| Biotechnology – 0.5% | ||||||||
| 967 | BioMarin Pharmaceutical, Inc.* | 81,431 | ||||||
|
| |||||||
| Building Products – 0.3% | ||||||||
| 1,398 | AZEK Co., Inc. (The)* | 59,401 | ||||||
|
| |||||||
| Capital Markets – 4.8% | ||||||||
| 419 | BlackRock, Inc. | 395,239 | ||||||
| 4,150 | Morgan Stanley | 433,384 | ||||||
|
| |||||||
| 828,623 | ||||||||
|
| |||||||
| Chemicals – 4.1% | ||||||||
| 2,345 | Danimer Scientific, Inc.* | 45,821 | ||||||
| 1,404 | Ecolab, Inc. | 316,406 | ||||||
| 1,114 | Linde PLC (United Kingdom) | 350,453 | ||||||
|
| |||||||
| 712,680 | ||||||||
|
| |||||||
| Communications Equipment – 2.6% | ||||||||
| 7,634 | Cisco Systems, Inc. | 450,559 | ||||||
|
| |||||||
| Consumer Finance – 2.2% | ||||||||
| 2,280 | American Express Co. | 378,389 | ||||||
|
| |||||||
| Containers & Packaging – 2.4% | ||||||||
| 4,304 | Ball Corp. | 413,012 | ||||||
|
| |||||||
| Diversified Telecommunication Services – 1.9% | ||||||||
| 11,696 | AT&T, Inc. | 320,704 | ||||||
|
| |||||||
| Electric Utilities – 2.6% | ||||||||
| 5,354 | �� | NextEra Energy, Inc. | 449,682 | |||||
|
| |||||||
| Electrical Equipment – 4.0% | ||||||||
| 2,164 | Eaton Corp. PLC | 364,331 | ||||||
| 986 | Rockwell Automation, Inc. | 320,894 | ||||||
|
| |||||||
| 685,225 | ||||||||
|
| |||||||
| Entertainment – 2.6% | ||||||||
| 2,459 | Walt Disney Co. (The)* | 445,817 | ||||||
|
| |||||||
| Equity Real Estate Investment Trusts (REITs) – 2.1% | ||||||||
| 637 | American Tower Corp. REIT | 186,112 | ||||||
| 216 | Equinix, Inc. REIT | 182,185 | ||||||
|
| |||||||
| 368,297 | ||||||||
|
| |||||||
| Food Products – 1.6% | ||||||||
| 3,147 | McCormick & Co., Inc. | 271,555 | ||||||
|
| |||||||
| Health Care Equipment & Supplies – 3.1% | ||||||||
| 1,656 | Danaher Corp. | 536,809 | ||||||
|
| |||||||
| Health Care Providers & Services – 3.6% | ||||||||
| 4,247 | CVS Health Corp. | 366,898 | ||||||
| 628 | Humana, Inc. | 254,604 | ||||||
|
| |||||||
| 621,502 | ||||||||
|
| |||||||
| Common Stocks – (continued) | ||||||||
| Hotels, Restaurants & Leisure – 1.9% | ||||||||
| 1,381 | McDonald’s Corp. | 327,932 | ||||||
|
| |||||||
| Household Products – 2.7% | ||||||||
| 3,333 | Procter & Gamble Co. (The) | 474,586 | ||||||
|
| |||||||
| Industrial Conglomerates – 2.0% | ||||||||
| 3,286 | General Electric Co. | 346,377 | ||||||
|
| |||||||
| Interactive Media & Services – 6.0% | ||||||||
| 359 | Alphabet, Inc., Class A* | 1,038,928 | ||||||
|
| |||||||
| Internet & Direct Marketing Retail – 1.6% | ||||||||
| 1,296 | Etsy, Inc.* | 280,273 | ||||||
|
| |||||||
| IT Services – 3.0% | ||||||||
| 2,228 | Visa, Inc., Class A | 510,435 | ||||||
|
| |||||||
| Machinery – 1.2% | ||||||||
| 541 | Deere & Co. | 204,514 | ||||||
|
| |||||||
| Media – 1.4% | ||||||||
| 4,664 | New York Times Co. (The), Class A | 236,838 | ||||||
|
| |||||||
| Pharmaceuticals – 4.6% | ||||||||
| 4,780 | Bristol-Myers Squibb Co. | 319,591 | ||||||
| 1,836 | Eli Lilly & Co. | 474,220 | ||||||
|
| |||||||
| 793,811 | ||||||||
|
| |||||||
| Road & Rail – 2.6% | ||||||||
| 2,033 | Union Pacific Corp. | 440,836 | ||||||
|
| |||||||
| Semiconductors & Semiconductor Equipment – 7.7% | ||||||||
| 2,915 | Cree, Inc.* | 247,717 | ||||||
| 5,323 | Marvell Technology, Inc. | 325,714 | ||||||
| 1,894 | NVIDIA Corp. | 423,972 | ||||||
| 1,711 | Texas Instruments, Inc. | 326,647 | ||||||
|
| |||||||
| 1,324,050 | ||||||||
|
| |||||||
| Software – 10.7% | ||||||||
| 543 | Adobe, Inc.* | 360,389 | ||||||
| 3,948 | Microsoft Corp. | 1,191,822 | ||||||
| 1,059 | Workday, Inc., Class A* | 289,277 | ||||||
|
| |||||||
| 1,841,488 | ||||||||
|
| |||||||
| Technology Hardware, Storage & Peripherals – 5.1% | ||||||||
| 5,808 | Apple, Inc. | 881,829 | ||||||
|
| |||||||
| Textiles, Apparel & Luxury Goods – 2.4% | ||||||||
| 2,518 | NIKE, Inc., Class B | 414,815 | ||||||
| �� | |||||||
| Water Utilities – 1.7% | ||||||||
| 1,584 | American Water Works Co., Inc. | 288,684 | ||||||
|
| |||||||
| TOTAL COMMON STOCKS | ||||||||
| (Cost $11,318,870) | $ | 16,923,005 | ||||||
|
| |||||||
| The accompanying notes are an integral part of these financial statements. | 69 |
GOLDMAN SACHS U.S. EQUITY ESG FUND
Schedule of Investments (continued)
August 31, 2021
| Shares | Dividend Rate | Value | ||||
| Investment Company – 1.6%(a) | ||||||
Goldman Sachs Financial Square Government Fund – Institutional Shares |
| |||||
| 273,779 | 0.026% | $ | 273,779 | |||
| (Cost $273,779) |
| |||||
| ||||||
| TOTAL INVESTMENTS – 99.8% |
| |||||
| (Cost $11,592,649) | $ | 17,196,784 | ||||
| ||||||
OTHER ASSETS IN EXCESS OF LIABILITIES – 0.2% | 29,936 | |||||
| ||||||
| NET ASSETS – 100.0% | $ | 17,226,720 | ||||
| ||||||
| The percentage shown for each investment category reflects the value of investments in that category as a percentage of net assets. | ||
* | Non-income producing security. | |
(a) | Represents an affiliated issuer. | |
| ||
Investment Abbreviations: | ||
PLC | —Public Limited Company | |
REIT | —Real Estate Investment Trust | |
| ||
| 70 | The accompanying notes are an integral part of these financial statements. |
GOLDMAN SACHS FUNDAMENTAL EQUITY GROWTH FUNDS
Statements of Assets and Liabilities
August 31, 2021
| Capital Growth Fund | Concentrated Growth Fund | Flexible Cap Fund | ||||||||||||
| Assets: |
| |||||||||||||
Investments in unaffiliated issuers, at value (cost $691,918,089, $109,600,022 and $24,770,251, respectively)(a) | $ | 1,263,648,133 | $ | 221,571,790 | $ | 37,823,243 | ||||||||
Investments in affiliated issuers, at value (cost $4,496,378, $164,062 and $544,338, respectively) | 4,496,378 | 164,062 | 544,338 | |||||||||||
Investments in securities lending reinvestment vehicle, at value which equals cost | 3,856,622 | — | — | |||||||||||
Cash | 16,458,709 | 500,000 | 52,070 | |||||||||||
Receivables: | ||||||||||||||
Investments sold | 6,593,898 | 1,611,495 | — | |||||||||||
Dividends | 958,857 | 104,434 | 28,932 | |||||||||||
Fund shares sold | 321,849 | 86,692 | 5,175 | |||||||||||
Reimbursement from investment adviser | 68,128 | 36,416 | 28,465 | |||||||||||
Foreign tax reclaims | 2,054 | — | — | |||||||||||
Securities lending income | 958 | — | — | |||||||||||
Other assets | 53,273 | 40,262 | 24,624 | |||||||||||
| Total assets | 1,296,458,859 | 224,115,151 | 38,506,847 | |||||||||||
| Liabilities: |
| |||||||||||||
Payables: | ||||||||||||||
Investments purchased | 10,329,195 | 2,341,957 | — | |||||||||||
Upon return of securities loaned | 3,856,622 | — | — | |||||||||||
Fund shares redeemed | 1,016,762 | 55,712 | — | |||||||||||
Management fees | 740,278 | 140,298 | 17,490 | |||||||||||
Distribution and Service fees and Transfer Agency fees | 366,714 | 10,419 | 4,621 | |||||||||||
Accrued expenses | 341,290 | 147,138 | 112,336 | |||||||||||
| Total liabilities | 16,650,861 | 2,695,524 | 134,447 | |||||||||||
| Net Assets: |
| |||||||||||||
Paid-in capital | 615,298,051 | 77,327,495 | 23,515,431 | |||||||||||
Total distributable earnings | 664,509,947 | 144,092,132 | 14,856,969 | |||||||||||
| NET ASSETS | $ | 1,279,807,998 | $ | 221,419,627 | $ | 38,372,400 | ||||||||
Net Assets: | ||||||||||||||
Class A | $ | 961,786,102 | $ | 11,575,408 | $ | 7,359,231 | ||||||||
Class C | 21,143,752 | 1,007,859 | 1,354,291 | |||||||||||
Institutional | 118,822,842 | 16,788,892 | 4,513,599 | |||||||||||
Service | 2,151,065 | — | — | |||||||||||
Investor | 21,889,388 | 296,356 | 51,833 | |||||||||||
Class R6 | 8,706,765 | 1,496,559 | 334,237 | |||||||||||
Class R | 12,608,414 | 41,931 | 46,369 | |||||||||||
Class P | 132,699,670 | 190,212,622 | 24,712,840 | |||||||||||
Total Net Assets | $ | 1,279,807,998 | $ | 221,419,627 | $ | 38,372,400 | ||||||||
Shares Outstanding $0.001 par value (unlimited number of shares authorized): |
| |||||||||||||
Class A | 27,997,012 | 420,156 | 434,533 | |||||||||||
Class C | 1,064,859 | 49,073 | 95,567 | |||||||||||
Institutional | 2,969,464 | 555,504 | 243,230 | |||||||||||
Service | 66,362 | — | — | |||||||||||
Investor | 622,151 | 10,461 | 2,865 | |||||||||||
Class R6 | 217,906 | 49,640 | 18,052 | |||||||||||
Class R | 391,677 | 1,606 | 2,884 | |||||||||||
Class P | 3,322,078 | 6,311,491 | 1,334,042 | |||||||||||
Net asset value, offering and redemption price per share:(b) | ||||||||||||||
Class A | $ 34.35 | $ 27.55 | $ 16.94 | |||||||||||
Class C | 19.86 | 20.54 | 14.17 | |||||||||||
Institutional | 40.01 | 30.22 | 18.56 | |||||||||||
Service | 32.41 | — | — | |||||||||||
Investor | 35.18 | 28.33 | 18.09 | |||||||||||
Class R6 | 39.96 | 30.15 | 18.52 | |||||||||||
Class R | 32.19 | 26.11 | 16.08 | |||||||||||
Class P | 39.94 | 30.14 | 18.52 | |||||||||||
| (a) | Includes loaned securities having a market value of $3,785,604 for Capital Growth. |
| (b) | Maximum public offering price per share for Class A Shares of the Capital Growth, Concentrated Growth and Flexible Cap Funds is $36.35, $29.15 and $17.93, respectively. At redemption, Class C Shares may be subject to a contingent deferred sales charge, assessed on the amount equal to the lesser of the current net asset value (“NAV”) or the original purchase price of the shares. |
| The accompanying notes are an integral part of these financial statements. | 71 |
GOLDMAN SACHS FUNDAMENTAL EQUITY GROWTH FUNDS
Statements of Assets and Liabilities (continued)
August 31, 2021
| Growth Opportunities Fund | Small Cap Growth Fund | Small/Mid Cap Growth Fund | ||||||||||||
| Assets: |
| |||||||||||||
Investments in unaffiliated issuers, at value (cost $953,723,779, $14,334,374 and $2,366,162,945, respectively)(a) | $ | 1,455,839,227 | $ | 20,430,898 | $ | 3,471,846,437 | ||||||||
Investments in affiliated issuers, at value (cost $13,911,294, $249,984 and $31,272,380, respectively) | 13,911,294 | 249,984 | 31,272,380 | |||||||||||
Investments in securities lending reinvestment vehicle, at value which equals cost | 7,447,030 | 141,504 | 18,738,133 | |||||||||||
Cash | — | 49,047 | 4,935,230 | |||||||||||
Receivables: | ||||||||||||||
Investments sold | 33,587,928 | 126,599 | 5,323,698 | |||||||||||
Fund shares sold | 765,380 | — | 4,329,148 | |||||||||||
Dividends | 488,463 | 6,114 | 975,570 | |||||||||||
Reimbursement from investment adviser | 171,431 | 107,638 | 107,662 | |||||||||||
Securities lending income | 4,754 | 2,616 | 21,462 | |||||||||||
Other assets | 77,044 | 5,829 | 191,082 | |||||||||||
| Total assets | 1,512,292,551 | 21,120,229 | 3,537,740,802 | |||||||||||
| Liabilities: |
| |||||||||||||
Payables: | ||||||||||||||
Investments purchased | 22,549,649 | — | — | |||||||||||
Upon return of securities loaned | 7,447,030 | 141,504 | 18,738,133 | |||||||||||
Due to custodian | 4,633,012 | — | — | |||||||||||
Fund shares redeemed | 1,671,950 | — | 1,816,392 | |||||||||||
Management fees | 1,121,192 | 14,508 | 2,351,414 | |||||||||||
Distribution and Service fees and Transfer Agency fees | 247,298 | 1,011 | 496,517 | |||||||||||
Accrued expenses | 376,392 | 239,260 | 499,583 | |||||||||||
| Total liabilities | 38,046,523 | 396,283 | 23,902,039 | |||||||||||
| Net Assets: |
| |||||||||||||
Paid-in capital | 781,143,143 | 12,515,355 | 2,068,589,157 | |||||||||||
Total distributable earnings | 693,102,885 | 8,208,591 | 1,445,249,606 | |||||||||||
| NET ASSETS | $ | 1,474,246,028 | $ | 20,723,946 | $ | 3,513,838,763 | ||||||||
Net Assets: | ||||||||||||||
Class A | $ | 404,921,181 | $ | 668,736 | $ | 470,940,994 | ||||||||
Class C | 23,336,879 | 119,284 | 145,721,296 | |||||||||||
Institutional | 478,127,408 | 14,312,865 | 1,303,225,575 | |||||||||||
Service | 33,113,865 | — | 22,781,170 | |||||||||||
Investor | 105,877,635 | 91,410 | 815,104,380 | |||||||||||
Class R6 | 283,232,954 | 91,635 | 139,453,478 | |||||||||||
Class R | 54,986,627 | 90,577 | 14,817,922 | |||||||||||
Class P | 90,649,479 | 5,349,439 | 601,793,948 | |||||||||||
Total Net Assets | $ | 1,474,246,028 | $ | 20,723,946 | $ | 3,513,838,763 | ||||||||
Shares Outstanding $0.001 par value (unlimited number of shares authorized): |
| |||||||||||||
Class A | 22,248,020 | 39,593 | 16,635,689 | |||||||||||
Class C | 5,444,046 | 7,148 | 6,865,034 | |||||||||||
Institutional | 17,919,223 | 842,692 | 40,804,111 | |||||||||||
Service | 2,072,906 | — | 846,264 | |||||||||||
Investor | 5,137,840 | 5,389 | 26,874,941 | |||||||||||
Class R6 | 10,598,950 | 5,394 | 4,361,244 | |||||||||||
Class R | 3,437,976 | 5,380 | 561,155 | |||||||||||
Class P | 3,390,492 | 315,058 | 18,817,918 | |||||||||||
Net asset value, offering and redemption price per share:(b) | ||||||||||||||
Class A | $ 18.20 | $ 16.89 | $ 28.31 | |||||||||||
Class C | 4.29 | 16.69 | 21.23 | |||||||||||
Institutional | 26.68 | 16.98 | 31.94 | |||||||||||
Service | 15.97 | — | 26.92 | |||||||||||
Investor | 20.61 | 16.96 | 30.33 | |||||||||||
Class R6 | 26.72 | 16.99 | 31.98 | |||||||||||
Class R | 15.99 | 16.84 | 26.41 | |||||||||||
Class P | 26.74 | 16.98 | 31.98 | |||||||||||
| (a) | Includes loaned securities having a market value of $7,302,820, $138,540 and $18,130,704 for Growth Opportunities, Small Cap Growth and Small/Mid Cap Growth Funds, respectively. |
| (b) | Maximum public offering price per share for Class A Shares of the Growth Opportunities, Small Cap Growth and Small/Mid Cap Growth Funds is $19.26, $17.87 and $29.96, respectively. At redemption, Class C Shares may be subject to a contingent deferred sales charge, assessed on the amount equal to the lesser of the current net asset value (“NAV”) or the original purchase price of the shares. |
| 72 | The accompanying notes are an integral part of these financial statements. |
GOLDMAN SACHS FUNDAMENTAL EQUITY GROWTH FUNDS
| Strategic Growth Fund | Technology Opportunities Fund | U.S. Equity ESG Fund | ||||||||||||
| Assets: |
| |||||||||||||
Investments in unaffiliated issuers, at value (cost $92,580,698, $434,995,354 and $11,318,870, respectively)(a) | $ | 224,510,770 | $ | 935,155,021 | $ | 16,923,005 | ||||||||
Investments in affiliated issuers, at value (cost $1,330,594, $19,184,235 and $273,779, respectively) | 1,330,594 | 19,184,235 | 273,779 | |||||||||||
Investments in securities lending reinvestment vehicle, at value which equals cost | 1,015,902 | — | — | |||||||||||
Cash | 500,000 | 1,051,501 | 66,162 | |||||||||||
Receivables: | ||||||||||||||
Dividends | 111,828 | 338,895 | 14,690 | |||||||||||
Fund shares sold | 77,937 | 422,920 | 11,928 | |||||||||||
Reimbursement from investment adviser | 48,837 | 96,034 | 67,340 | |||||||||||
Securities lending income | 245 | 1,841 | — | |||||||||||
Investments sold | — | 1,476,799 | — | |||||||||||
Other assets | 50,752 | 142,157 | 20,942 | |||||||||||
| Total assets | 227,646,865 | 957,869,403 | 17,377,846 | |||||||||||
| Liabilities: |
| |||||||||||||
Payables: | ||||||||||||||
Upon return of securities loaned | 1,015,902 | — | — | |||||||||||
Fund shares redeemed | 249,866 | 736,452 | 8,771 | |||||||||||
Management fees | 132,807 | 732,907 | 7,832 | |||||||||||
Distribution and Service fees and Transfer Agency fees | 30,995 | 228,957 | 5,392 | |||||||||||
Investments purchased | — | 5,503,305 | — | |||||||||||
Accrued expenses | 151,403 | 242,832 | 129,131 | |||||||||||
| Total liabilities | 1,580,973 | 7,444,453 | 151,126 | |||||||||||
| Net Assets: |
| |||||||||||||
Paid-in capital | 72,221,429 | 353,432,561 | 11,055,550 | |||||||||||
Total distributable earnings | 153,844,463 | 596,992,389 | 6,171,170 | |||||||||||
| NET ASSETS | $ | 226,065,892 | $ | 950,424,950 | $ | 17,226,720 | ||||||||
Net Assets: | ||||||||||||||
Class A | $ | 63,591,245 | $ | 503,552,784 | $ | 7,353,575 | ||||||||
Class C | 3,901,236 | 27,865,774 | 2,430,038 | |||||||||||
Institutional | 62,893,826 | 190,704,875 | 1,921,143 | |||||||||||
Service | 622,668 | 38,670,269 | — | |||||||||||
Investor | 3,231,696 | 41,403,147 | 878,004 | |||||||||||
Class R6 | 789,278 | 3,134,479 | 1,198,551 | |||||||||||
Class R | 213,258 | — | 482,002 | |||||||||||
Class P | 90,822,685 | 145,093,622 | 2,963,407 | |||||||||||
Total Net Assets | $ | 226,065,892 | $ | 950,424,950 | $ | 17,226,720 | ||||||||
Shares Outstanding $0.001 par value (unlimited number of shares authorized): |
| |||||||||||||
Class A | 5,160,846 | 14,356,716 | 389,322 | |||||||||||
Class C | 617,066 | 1,139,174 | 137,207 | |||||||||||
Institutional | 4,336,924 | 4,606,059 | 100,437 | |||||||||||
Service | 52,037 | 1,146,817 | — | |||||||||||
Investor | 224,211 | 1,025,150 | 45,880 | |||||||||||
Class R6 | 54,567 | 75,651 | 62,628 | |||||||||||
Class R | 18,457 | — | 25,356 | |||||||||||
Class P | 6,290,028 | 3,502,055 | 154,923 | |||||||||||
Net asset value, offering and redemption price per share:(b) | ||||||||||||||
Class A | $ 12.32 | $ 35.07 | $ 18.89 | |||||||||||
Class C | 6.32 | 24.46 | 17.71 | |||||||||||
Institutional | 14.50 | 41.40 | 19.13 | |||||||||||
Service | 11.97 | 33.72 | — | |||||||||||
Investor | 14.41 | 40.39 | 19.14 | |||||||||||
Class R6 | 14.46 | 41.43 | 19.14 | |||||||||||
Class R | 11.55 | — | 19.01 | |||||||||||
Class P | 14.44 | 41.43 | 19.13 | |||||||||||
| (a) | Includes loaned securities having a market value of $984,944 for Strategic Growth. |
| (b) | Maximum public offering price per share for Class A Shares of the Strategic Growth, Technology Opportunities and U.S. Equity ESG Funds is $13.04, $37.11 and $19.99, respectively. At redemption, Class C Shares may be subject to a contingent deferred sales charge, assessed on the amount equal to the lesser of the current net asset value (“NAV”) or the original purchase price of the shares. |
| The accompanying notes are an integral part of these financial statements. | 73 |
GOLDMAN SACHS FUNDAMENTAL EQUITY GROWTH FUNDS
Statements of Operations
For the Fiscal Year Ended August 31, 2021
| Capital Growth Fund | Concentrated Growth Fund | Flexible Cap Fund | ||||||||||||
| Investment income: |
| |||||||||||||
Dividends — unaffiliated issuers (net of foreign withholding taxes of $19,987, $6,166 and $262, respectively) | $ | 10,211,212 | $ | 923,480 | $ | 339,709 | ||||||||
Securities lending income — unaffiliated issuer | 127,170 | 6,066 | 271 | |||||||||||
Dividends — affiliated issuers | 814 | 389 | 88 | |||||||||||
| Total investment income | 10,339,196 | 929,935 | 340,068 | |||||||||||
| Expenses: |
| |||||||||||||
Management fees | 7,678,577 | 1,471,820 | 160,356 | |||||||||||
Distribution and Service (12b-1) fees | 2,303,303 | 32,749 | 26,241 | |||||||||||
Transfer Agency fees | 1,489,650 | 74,141 | 19,228 | |||||||||||
Custody, accounting and administrative services | 205,695 | 40,464 | 29,915 | |||||||||||
Printing and mailing costs | 131,305 | 33,698 | 13,994 | |||||||||||
Registration fees | 122,146 | 97,350 | 125,009 | |||||||||||
Professional fees | 103,101 | 97,595 | 103,160 | |||||||||||
Service fees — Class C | 43,481 | 2,589 | 3,208 | |||||||||||
Trustee fees | 21,602 | 20,253 | 20,005 | |||||||||||
Shareholder administration fees — Service Shares | 4,416 | — | — | |||||||||||
Other | 13,141 | 6,208 | 3,102 | |||||||||||
| Total expenses | 12,116,417 | 1,876,867 | 504,218 | |||||||||||
Less — expense reductions | (574,532 | ) | (297,084 | ) | (295,061 | ) | ||||||||
| Net expenses | 11,541,885 | 1,579,783 | 209,157 | |||||||||||
| NET INVESTMENT INCOME (LOSS) | (1,202,689 | ) | (649,848 | ) | 130,911 | |||||||||
| Realized and unrealized gain (loss): |
| |||||||||||||
Net realized gain (loss) from: | ||||||||||||||
Investments — unaffiliated issuers | 112,670,809 | 34,008,869 | 1,824,645 | |||||||||||
Net change in unrealized gain (loss) on: | ||||||||||||||
Investments — unaffiliated issuers | 201,303,265 | 16,761,188 | 6,011,617 | |||||||||||
Foreign currency translations | (39 | ) | — | — | ||||||||||
| Net realized and unrealized gain | 313,974,035 | 50,770,057 | 7,836,262 | |||||||||||
| NET INCREASE IN NET ASSETS RESULTING FROM OPERATIONS | $ | 312,771,346 | $ | 50,120,209 | $ | 7,967,173 | ||||||||
| Distribution and/or Service (12b-1) Fees | Transfer Agency Fees | |||||||||||||||||||||||||||||||||||||||||||||||
Fund | Class A | Class C | Service | Class R | Class A | Class C | Institutional | Service | Investor | Class R6 | Class R | Class P | ||||||||||||||||||||||||||||||||||||
Capital Growth | $ | 2,114,267 | $ | 130,442 | $ | 4,416 | $ | 54,178 | $ | 1,353,143 | $ | 27,828 | $ | 34,953 | $ | 706 | $ | 21,074 | $ | 1,477 | $ | 17,337 | $ | 33,132 | ||||||||||||||||||||||||
Concentrated Growth | 24,806 | 7,766 | — | 177 | 15,876 | 1,656 | 5,859 | — | 354 | 256 | 57 | 50,083 | ||||||||||||||||||||||||||||||||||||
Flexible Cap | 16,334 | 9,625 | — | 282 | 10,454 | 2,054 | 755 | — | 69 | 77 | 90 | 5,729 | ||||||||||||||||||||||||||||||||||||
| 74 | The accompanying notes are an integral part of these financial statements. |
GOLDMAN SACHS FUNDAMENTAL EQUITY GROWTH FUNDS
| Growth Opportunities Fund | Small Cap Growth Fund | Small/Mid Cap Growth Fund | ||||||||||||
| Investment income: |
| |||||||||||||
Dividends — unaffiliated issuers (net of foreign withholding taxes of $5,711, $– and $–, respectively) | $ | 4,739,378 | $ | 44,100 | $ | 7,546,898 | ||||||||
Securities lending income — unaffiliated issuer | 339,378 | 7,622 | 280,515 | |||||||||||
Dividends — affiliated issuers | 3,629 | 110 | 13,578 | |||||||||||
| Total investment income | 5,082,385 | 51,832 | 7,840,991 | |||||||||||
| Expenses: |
| |||||||||||||
Management fees | 12,708,911 | 172,188 | 24,489,899 | |||||||||||
Distribution and Service (12b-1) fees | 1,484,072 | 2,400 | 2,312,020 | |||||||||||
Transfer Agency fees | 1,185,770 | 8,518 | 2,609,726 | |||||||||||
Custody, accounting and administrative services | 159,936 | 31,140 | 319,071 | |||||||||||
Registration fees | 137,182 | 92,886 | 198,577 | |||||||||||
Professional fees | 128,325 | 160,479 | 96,623 | |||||||||||
Printing and mailing costs | 112,489 | 70,474 | 98,789 | |||||||||||
Shareholder Administration fees — Service Shares | 77,072 | — | 81,669 | |||||||||||
Service fees — Class C | 63,854 | 287 | 387,144 | |||||||||||
Trustee fees | 22,055 | 19,990 | 24,468 | |||||||||||
Amortization of offering costs | — | 10,861 | — | |||||||||||
Other | 23,799 | 32,542 | 53,315 | |||||||||||
| Total expenses | 16,103,465 | 601,765 | 30,671,301 | |||||||||||
Less — expense reductions | (1,545,583 | ) | (414,476 | ) | (683,666 | ) | ||||||||
| Net expenses | 14,557,882 | 187,289 | 29,987,635 | |||||||||||
| NET INVESTMENT LOSS | (9,475,497 | ) | (135,457 | ) | (22,146,644 | ) | ||||||||
| Realized and unrealized gain (loss): |
| |||||||||||||
Net realized gain (loss) from: | ||||||||||||||
Investments — unaffiliated issuers | 257,986,575 | 2,863,972 | 477,942,099 | |||||||||||
Net change in unrealized gain (loss) on: | ||||||||||||||
Investments — unaffiliated issuers | 154,463,280 | 2,800,407 | 476,822,391 | |||||||||||
| Net realized and unrealized gain | 412,449,855 | 5,664,379 | 954,764,490 | |||||||||||
| NET INCREASE IN NET ASSETS RESULTING FROM OPERATIONS | $ | 402,974,358 | $ | 5,528,922 | $ | 932,617,846 | ||||||||
| Distribution and/or Service (12b-1) Fees | Transfer Agency Fees | |||||||||||||||||||||||||||||||||||||||||||||||
Fund | Class A | Class C | Service | Class R | Class A | Class C | Institutional | Service | Investor | Class R6 | Class R | Class P | ||||||||||||||||||||||||||||||||||||
Growth Opportunities | $ | 949,370 | $ | 191,562 | $ | 77,072 | $ | 266,068 | $ | 607,602 | $ | 40,867 | $ | 186,262 | $ | 12,332 | $ | 154,633 | $ | 73,116 | $ | 85,143 | $ | 25,815 | ||||||||||||||||||||||||
Small Cap Growth | 1,134 | 860 | — | 406 | 726 | 184 | 5,964 | — | 130 | 24 | 130 | 1,360 | ||||||||||||||||||||||||||||||||||||
Small/Mid Cap Growth | 991,118 | 1,161,432 | 81,669 | 77,801 | 634,321 | 247,774 | 459,799 | 13,067 | 1,061,789 | 32,426 | 24,897 | 135,653 | ||||||||||||||||||||||||||||||||||||
| The accompanying notes are an integral part of these financial statements. | 75 |
GOLDMAN SACHS FUNDAMENTAL EQUITY GROWTH FUNDS
Statements of Operations (continued)
For the Fiscal Year Ended August 31, 2021
| Strategic Growth Fund | Technology Opportunities Fund | U.S. Equity ESG Fund | ||||||||||||
| Investment income: |
| |||||||||||||
Dividends — unaffiliated issuers (net of foreign withholding taxes of $2,349, $81,879 and $–, respectively) | $ | 983,999 | $ | 4,129,089 | $ | 164,608 | ||||||||
Securities lending income — unaffiliated issuer | 41,034 | 280,748 | 831 | |||||||||||
Dividends — affiliated issuers | 245 | 3,122 | 35 | |||||||||||
| Total investment income | 1,025,278 | 4,412,959 | 165,474 | |||||||||||
| Expenses: |
| |||||||||||||
Management fees | 1,384,722 | 7,695,326 | 71,611 | |||||||||||
Distribution and Service (12b-1) fees | 150,270 | 1,407,051 | 32,214 | |||||||||||
Transfer Agency fees | 134,349 | 937,765 | 15,668 | |||||||||||
Registration fees | 123,185 | 110,584 | 100,218 | |||||||||||
Professional fees | 102,192 | 102,273 | 188,716 | |||||||||||
Printing and mailing costs | 57,663 | 150,280 | 37,143 | |||||||||||
Custody, accounting and administrative services | 38,776 | 104,918 | 19,145 | |||||||||||
Trustee fees | 20,264 | 21,182 | 19,999 | |||||||||||
Service fees — Class C | 10,667 | 67,456 | 5,411 | |||||||||||
Shareholder Administration fees — Service Shares | 1,277 | 92,492 | — | |||||||||||
Other | 7,019 | 1,352 | 3,425 | |||||||||||
| Total expenses | 2,030,384 | 10,690,679 | 493,550 | |||||||||||
Less — expense reductions | (343,860 | ) | (949,311 | ) | (360,992 | ) | ||||||||
| Net expenses | 1,686,524 | 9,741,368 | 132,558 | |||||||||||
| NET INVESTMENT INCOME (LOSS) | (661,246 | ) | (5,328,409 | ) | 32,916 | |||||||||
| Realized and unrealized gain (loss): |
| |||||||||||||
Net realized gain (loss) from: | ||||||||||||||
Investments — unaffiliated issuers | 27,166,411 | 120,819,810 | 657,932 | |||||||||||
Foreign currency transactions | — | (692 | ) | — | ||||||||||
Net change in unrealized gain (loss) on: | ||||||||||||||
Investments — unaffiliated issuers | 25,948,742 | 102,237,201 | 3,301,444 | |||||||||||
| Net realized and unrealized gain | 53,115,153 | 223,056,319 | 3,959,376 | |||||||||||
| NET INCREASE IN NET ASSETS RESULTING FROM OPERATIONS | $ | 52,453,907 | $ | 217,727,910 | $ | 3,992,292 | ||||||||
| Distribution and/or Service (12b-1) Fees | Transfer Agency Fees | |||||||||||||||||||||||||||||||||||||||||||||||
Fund | Class A | Class C | Service | Class R | Class A | Class C | Institutional | Service | Investor | Class R6 | Class R | Class P | ||||||||||||||||||||||||||||||||||||
Strategic Growth | $ | 116,383 | $ | 32,001 | $ | 1,277 | $ | 609 | $ | 74,486 | $ | 6,827 | $ | 23,262 | $ | 204 | $ | 4,613 | $ | 202 | $ | 195 | $ | 24,560 | ||||||||||||||||||||||||
Technology Opportunities | 1,112,192 | 202,367 | 92,492 | — | 711,809 | 43,172 | 65,652 | 14,799 | 72,164 | 571 | — | 29,598 | ||||||||||||||||||||||||||||||||||||
U.S. Equity ESG | 15,485 | 16,232 | — | 497 | 9,911 | 3,463 | 592 | — | 761 | 350 | 159 | 432 | ||||||||||||||||||||||||||||||||||||
| 76 | The accompanying notes are an integral part of these financial statements. |
GOLDMAN SACHS FUNDAMENTAL EQUITY GROWTH FUNDS
Statements of Changes in Net Assets
| Capital Growth Fund | Concentrated Growth Fund | |||||||||||||||||||||
| For the Fiscal Year Ended August 31, 2021 | For the Fiscal Year Ended August 31, 2020 | For the Fiscal Year Ended August 31, 2021 | For the Fiscal Year Ended August 31, 2020 | |||||||||||||||||||
| From operations: |
| |||||||||||||||||||||
Net investment income (loss) | $ | (1,202,689 | ) | $ | 2,641,405 | $ | (649,848 | ) | $ | (131,790 | ) | |||||||||||
Net realized gain | 112,670,809 | 35,198,989 | 34,008,869 | 13,618,666 | ||||||||||||||||||
Net change in unrealized gain | 201,303,226 | 143,218,010 | 16,761,188 | 42,115,306 | ||||||||||||||||||
| Net increase in net assets resulting from operations | 312,771,346 | 181,058,404 | 50,120,209 | 55,602,182 | ||||||||||||||||||
| Distributions to shareholders: |
| |||||||||||||||||||||
From distributable earnings: | ||||||||||||||||||||||
Class A Shares | (29,785,751 | ) | (29,383,082 | ) | (589,089 | ) | (570,407 | ) | ||||||||||||||
Class C Shares | (947,434 | ) | (1,094,018 | ) | (92,741 | ) | (82,505 | ) | ||||||||||||||
Institutional Shares | (2,366,718 | ) | (2,359,339 | ) | (802,543 | ) | (939,102 | ) | ||||||||||||||
Service Shares | (56,146 | ) | (70,266 | ) | — | — | ||||||||||||||||
Investor Shares | (371,777 | ) | (310,127 | ) | (12,344 | ) | (11,029 | ) | ||||||||||||||
Class R6 Shares | (92,242 | ) | (78,605 | ) | (45,645 | ) | (40,913 | ) | ||||||||||||||
Class R Shares | (385,346 | ) | (366,639 | ) | (2,170 | ) | (3,148 | ) | ||||||||||||||
Class P Shares | (3,547,586 | ) | (3,401,935 | ) | (9,334,561 | ) | (10,103,292 | ) | ||||||||||||||
| Total distributions to shareholders | (37,553,000 | ) | (37,064,011 | ) | (10,879,093 | ) | (11,750,396 | ) | ||||||||||||||
| From share transactions: |
| |||||||||||||||||||||
Proceeds from sales of shares | 110,074,487 | 32,027,024 | 15,178,558 | 6,673,794 | ||||||||||||||||||
Reinvestment of distributions | 35,803,881 | 35,117,504 | 10,783,130 | 11,629,845 | ||||||||||||||||||
Cost of shares redeemed | (117,761,664 | ) | (126,823,345 | ) | (29,601,069 | ) | (25,388,297 | ) | ||||||||||||||
| Net increase (decrease) in net assets resulting from share transactions | 28,116,704 | (59,678,817 | ) | (3,639,381 | ) | (7,084,658 | ) | |||||||||||||||
| TOTAL INCREASE | 303,335,050 | 84,315,576 | 35,601,735 | 36,767,128 | ||||||||||||||||||
| Net assets: | ||||||||||||||||||||||
Beginning of year | 976,472,948 | 892,157,372 | 185,817,892 | 149,050,764 | ||||||||||||||||||
End of year | $ | 1,279,807,998 | $ | 976,472,948 | $ | 221,419,627 | $ | 185,817,892 | ||||||||||||||
| The accompanying notes are an integral part of these financial statements. | 77 |
GOLDMAN SACHS FUNDAMENTAL EQUITY GROWTH FUNDS
Statements of Changes in Net Assets (continued)
| Flexible Cap Fund | Growth Opportunities Fund | |||||||||||||||||||||
| For the Fiscal Year Ended August 31, 2021 | For the Fiscal Year Ended August 31, 2020 | For the Fiscal Year Ended August 31, 2021 | For the Fiscal Year Ended August 31, 2020 | |||||||||||||||||||
| From operations: |
| |||||||||||||||||||||
Net investment income (loss) | $ | 130,911 | $ | 158,714 | $ | (9,475,497 | ) | $ | (5,206,960 | ) | ||||||||||||
Net realized gain | 1,824,645 | 1,298,428 | 257,986,575 | 255,049,975 | ||||||||||||||||||
Net change in unrealized gain | 6,011,617 | 2,881,593 | 154,463,280 | 47,781,792 | ||||||||||||||||||
| Net increase in net assets resulting from operations | 7,967,173 | 4,338,735 | 402,974,358 | 297,624,807 | ||||||||||||||||||
| Distributions to shareholders: |
| |||||||||||||||||||||
From distributable earnings: | ||||||||||||||||||||||
Class A Shares | (348,337 | ) | (329,577 | ) | (80,419,726 | ) | (84,857,623 | ) | ||||||||||||||
Class C Shares | (76,792 | ) | (83,942 | ) | (15,392,994 | ) | (17,520,548 | ) | ||||||||||||||
Institutional Shares | (30,388 | ) | (35,557 | ) | (73,299,105 | ) | (101,191,952 | ) | ||||||||||||||
Service Shares | — | — | (7,330,638 | ) | (7,618,287 | ) | ||||||||||||||||
Investor Shares | (2,137 | ) | (4,078 | ) | (17,952,306 | ) | (18,957,577 | ) | ||||||||||||||
Class R6 Shares | (13,001 | ) | (12,478 | ) | (36,107,697 | ) | (39,106,235 | ) | ||||||||||||||
Class R Shares | (2,962 | ) | (2,314 | ) | (12,453,846 | ) | (12,585,464 | ) | ||||||||||||||
Class P Shares | (868,917 | ) | (648,520 | ) | (13,547,235 | ) | (13,993,377 | ) | ||||||||||||||
| Total distributions to shareholders | (1,342,534 | ) | (1,116,466 | ) | (256,503,547 | ) | (295,831,063 | ) | ||||||||||||||
| From share transactions: |
| |||||||||||||||||||||
Proceeds from sales of shares | 9,481,676 | 2,838,561 | 260,135,416 | 246,951,218 | ||||||||||||||||||
Reinvestment of distributions | 1,342,533 | 1,116,467 | 239,672,958 | 272,525,182 | ||||||||||||||||||
Cost of shares redeemed | (2,605,305 | ) | (2,328,449 | ) | (431,164,146 | ) | (526,294,400 | ) | ||||||||||||||
| Net increase (decrease) in net assets resulting from share transactions | 8,218,904 | 1,626,579 | 68,644,228 | (6,818,000 | ) | |||||||||||||||||
| TOTAL INCREASE (DECREASE) | 14,843,543 | 4,848,848 | 215,115,039 | (5,024,256 | ) | |||||||||||||||||
| Net assets: | ||||||||||||||||||||||
Beginning of year | 23,528,857 | 18,680,009 | 1,259,130,989 | 1,264,155,245 | ||||||||||||||||||
End of year | $ | 38,372,400 | $ | 23,528,857 | $ | 1,474,246,028 | $ | 1,259,130,989 | ||||||||||||||
| 78 | The accompanying notes are an integral part of these financial statements. |
GOLDMAN SACHS FUNDAMENTAL EQUITY GROWTH FUNDS
| Small Cap Growth Fund | Small/Mid Cap Growth Fund | |||||||||||||||||||||
| For the Fiscal Year Ended August 31, 2021 | For the Period October 31, 2019* to August 31, 2020 | For the Fiscal Year Ended August 31, 2021 | For the Fiscal Year Ended August 31, 2020 | |||||||||||||||||||
| From operations: |
| |||||||||||||||||||||
Net investment loss | $ | (135,457 | ) | $ | (38,007 | ) | $ | (22,146,644 | ) | $ | (10,626,178 | ) | ||||||||||
Net realized gain | 2,863,972 | 681,031 | 477,942,099 | 333,727,471 | ||||||||||||||||||
Net change in unrealized gain | 2,800,407 | 3,296,117 | 476,822,391 | 235,696,580 | ||||||||||||||||||
| Net increase in net assets resulting from operations | 5,528,922 | 3,939,141 | 932,617,846 | 558,797,873 | ||||||||||||||||||
| Distributions to shareholders: |
| |||||||||||||||||||||
From distributable earnings: | ||||||||||||||||||||||
Class A Shares | (22,970 | ) | (82 | ) | (49,888,744 | ) | (39,805,523 | ) | ||||||||||||||
Class C Shares | (8,216 | ) | (18 | ) | (30,046,612 | ) | (27,720,082 | ) | ||||||||||||||
Institutional Shares | (953,009 | ) | (8,547 | ) | (138,905,563 | ) | (106,605,505 | ) | ||||||||||||||
Service Shares | — | — | (6,207,186 | ) | (2,626,257 | ) | ||||||||||||||||
Investor Shares | (5,612 | ) | (104 | ) | (77,471,106 | ) | (52,201,231 | ) | ||||||||||||||
Class R6 Shares | (5,676 | ) | (117 | ) | (12,136,651 | ) | (7,519,351 | ) | ||||||||||||||
Class R Shares | (5,508 | ) | (61 | ) | (2,365,428 | ) | (2,127,370 | ) | ||||||||||||||
Class P Shares | (250,100 | ) | (117 | ) | (46,974,296 | ) | (24,025,405 | ) | ||||||||||||||
| Total distributions to shareholders | (1,251,091 | ) | (9,046 | ) | (363,995,586 | ) | (262,630,724 | ) | ||||||||||||||
| From share transactions: |
| |||||||||||||||||||||
Proceeds from sales of shares | 8,222,531 | 10,431,165 | 1,149,686,953 | 584,729,950 | ||||||||||||||||||
Reinvestment of distributions | 1,251,091 | 9,047 | 339,495,791 | 237,385,247 | ||||||||||||||||||
Cost of shares redeemed | (6,834,486 | ) | (563,328 | ) | (829,149,871 | ) | (834,560,777 | ) | ||||||||||||||
| Net increase (decrease) in net assets resulting from share transactions | 2,639,136 | 9,876,884 | 660,032,873 | (12,445,580 | ) | |||||||||||||||||
| TOTAL INCREASE | 6,916,967 | 13,806,979 | 1,228,655,133 | 283,721,569 | ||||||||||||||||||
| Net assets: | ||||||||||||||||||||||
Beginning of period | 13,806,979 | — | 2,285,183,630 | 2,001,462,061 | ||||||||||||||||||
End of period | $ | 20,723,946 | $ | 13,806,979 | $ | 3,513,838,763 | $ | 2,285,183,630 | ||||||||||||||
| * | Commencement of operations. |
| The accompanying notes are an integral part of these financial statements. | 79 |
GOLDMAN SACHS FUNDAMENTAL EQUITY GROWTH FUNDS
Statements of Changes in Net Assets (continued)
| Strategic Growth Fund | Technology Opportunities Fund | |||||||||||||||||||||
| For the Fiscal Year Ended August 31, 2021 | For the Fiscal Year Ended August 31, 2020 | For the Fiscal Year Ended August 31, 2021 | For the Fiscal Year Ended August 31, 2020 | |||||||||||||||||||
| From operations: |
| |||||||||||||||||||||
Net investment loss | $ | (661,246 | ) | $ | (17,349 | ) | $ | (5,328,409 | ) | $ | (2,837,247 | ) | ||||||||||
Net realized gain | 27,166,411 | 24,739,132 | 120,819,118 | 64,543,294 | ||||||||||||||||||
Net change in unrealized gain | 25,948,742 | 34,445,849 | 102,237,201 | 186,929,345 | ||||||||||||||||||
| Net increase in net assets resulting from operations | 52,453,907 | 59,167,632 | 217,727,910 | 248,635,392 | ||||||||||||||||||
| Distributions to shareholders: |
| |||||||||||||||||||||
From distributable earnings: | ||||||||||||||||||||||
Class A Shares | (5,753,617 | ) | (4,611,552 | ) | (37,649,057 | ) | (46,818,272 | ) | ||||||||||||||
Class C Shares | (1,246,700 | ) | (998,734 | ) | (3,403,030 | ) | (4,769,848 | ) | ||||||||||||||
Institutional Shares | (7,620,404 | ) | (7,359,404 | ) | (11,618,167 | ) | (10,990,995 | ) | ||||||||||||||
Service Shares | (79,067 | ) | (100,316 | ) | (3,325,261 | ) | (4,475,409 | ) | ||||||||||||||
Investor Shares | (382,724 | ) | (235,813 | ) | (3,999,623 | ) | (2,550,857 | ) | ||||||||||||||
Class R6 Shares | (84,347 | ) | (54,771 | ) | (113,026 | ) | (32,559 | ) | ||||||||||||||
Class R Shares | (6,717 | ) | (41,983 | ) | — | — | ||||||||||||||||
Class P Shares | (10,678,494 | ) | (10,817,531 | ) | (5,859,003 | ) | (3,525,530 | ) | ||||||||||||||
| Total distributions to shareholders | (25,852,070 | ) | (24,220,104 | ) | (65,967,167 | ) | (73,163,470 | ) | ||||||||||||||
| From share transactions: |
| |||||||||||||||||||||
Proceeds from sales of shares | 36,302,264 | 27,015,766 | 171,089,507 | 203,785,120 | ||||||||||||||||||
Reinvestment of distributions | 25,398,921 | 23,784,787 | 62,828,022 | 68,777,718 | ||||||||||||||||||
Cost of shares redeemed | (46,298,529 | ) | (62,657,586 | ) | (206,094,335 | ) | (155,360,052 | ) | ||||||||||||||
| Net increase (decrease) in net assets resulting from share transactions | 15,402,656 | (11,857,033 | ) | 27,823,194 | 117,202,786 | |||||||||||||||||
| TOTAL INCREASE | 42,004,493 | 23,090,495 | 179,583,937 | 292,674,708 | ||||||||||||||||||
| Net assets: | ||||||||||||||||||||||
Beginning of year | 184,061,399 | 160,970,904 | 770,841,013 | 478,166,305 | ||||||||||||||||||
End of year | $ | 226,065,892 | $ | 184,061,399 | $ | 950,424,950 | $ | 770,841,013 | ||||||||||||||
| 80 | The accompanying notes are an integral part of these financial statements. |
GOLDMAN SACHS FUNDAMENTAL EQUITY GROWTH FUNDS
| U.S. Equity ESG Fund | ||||||||||
| For the Fiscal Year Ended August 31, 2021 | For the Fiscal Year Ended August 31, 2020 | |||||||||
| From operations: |
| |||||||||
Net investment income | $ | 32,916 | $ | 72,576 | ||||||
Net realized gain | 657,932 | 1,207,438 | ||||||||
Net change in unrealized gain | 3,301,444 | 419,704 | ||||||||
| Net increase in net assets resulting from operations | 3,992,292 | 1,699,718 | ||||||||
| Distributions to shareholders: |
| |||||||||
From distributable earnings: | ||||||||||
Class A Shares | (600,873 | ) | (177,225 | ) | ||||||
Class C Shares | (212,062 | ) | (59,804 | ) | ||||||
Institutional Shares | (138,080 | ) | (39,352 | ) | ||||||
Investor Shares | (38,039 | ) | (11,386 | ) | ||||||
Class R6 Shares | (127,443 | ) | (123,480 | ) | ||||||
Class R Shares | (2,431 | ) | (824 | ) | ||||||
Class P Shares | (91,452 | ) | (100,044 | ) | ||||||
| Total distributions to shareholders | (1,210,380 | ) | (512,115 | ) | ||||||
| From share transactions: |
| |||||||||
Proceeds from sales of shares | 3,995,264 | 2,753,884 | ||||||||
Reinvestment of distributions | 1,123,800 | 486,610 | ||||||||
Cost of shares redeemed | (1,637,812 | ) | (6,067,463 | ) | ||||||
| Net increase (decrease) in net assets resulting from share transactions | 3,481,252 | (2,826,969 | ) | |||||||
| TOTAL INCREASE (DECREASE) | 6,263,164 | (1,639,366 | ) | |||||||
| Net assets: | ||||||||||
Beginning of year | 10,963,556 | 12,602,922 | ||||||||
End of year | $ | 17,226,720 | $ | 10,963,556 | ||||||
| The accompanying notes are an integral part of these financial statements. | 81 |
GOLDMAN SACHS CAPITAL GROWTH FUND
Selected Share Data for a Share Outstanding Throughout Each Year
| Goldman Sachs Capital Growth Fund | ||||||||||||||||||||||
| Class A Shares | ||||||||||||||||||||||
| Year Ended August 31, | ||||||||||||||||||||||
| 2021 | 2020 | 2019 | 2018 | 2017 | ||||||||||||||||||
| Per Share Data |
| |||||||||||||||||||||
Net asset value, beginning of year | $ | 26.94 | $ | 22.93 | $ | 32.46 | $ | 28.92 | $ | 24.15 | ||||||||||||
Net investment income (loss)(a) | (0.05 | ) | 0.05 | 0.08 | 0.02 | 0.04 | ||||||||||||||||
Net realized and unrealized gain (loss) | 8.52 | 4.93 | (0.28 | ) | 6.01 | 5.07 | ||||||||||||||||
Total from investment operations | 8.47 | 4.98 | (0.20 | ) | 6.03 | 5.11 | ||||||||||||||||
Distributions to shareholders from net investment income | (0.06 | ) | (0.08 | ) | — | (b) | (0.02 | ) | (0.01 | ) | ||||||||||||
Distributions to shareholders from net realized gains | (1.00 | ) | (0.89 | ) | (9.33 | ) | (2.47 | ) | (0.33 | ) | ||||||||||||
Total distributions | (1.06 | ) | (0.97 | ) | (9.33 | ) | (2.49 | ) | (0.34 | ) | ||||||||||||
Net asset value, end of year | $ | 34.35 | $ | 26.94 | $ | 22.93 | $ | 32.46 | $ | 28.92 | ||||||||||||
| Total Return(c) | 32.38 | % | 22.26 | % | 3.72 | % | 22.01 | % | 21.47 | % | ||||||||||||
Net assets, end of year (in 000’s) | $ | 961,786 | $ | 776,919 | $ | 708,827 | $ | 745,362 | $ | 671,371 | ||||||||||||
Ratio of net expenses to average net assets | 1.11 | % | 1.14 | % | 1.14 | % | 1.14 | % | 1.15 | % | ||||||||||||
Ratio of total expenses to average net assets | 1.17 | % | 1.22 | % | 1.22 | % | 1.31 | % | 1.51 | % | ||||||||||||
Ratio of net investment income (loss) to average net assets | (0.17 | )% | 0.23 | % | 0.36 | % | 0.06 | % | 0.14 | % | ||||||||||||
Portfolio turnover rate(d) | 46 | % | 47 | % | 55 | % | 93 | % | 48 | % | ||||||||||||
| (a) | Calculated based on the average shares outstanding methodology. |
| (b) | Amount is less than $0.005 per share. |
| (c) | Assumes investment at the NAV at the beginning of the year, reinvestment of all dividends and distributions, a complete redemption of the investment at the NAV at the end of the year and no sales or redemption charges (if any). Total returns would be reduced if a sales or redemption charge was taken into account. Returns do not reflect the impact of taxes to shareholders relating to Fund distributions or the redemption of Fund shares. |
| (d) | The Fund’s portfolio turnover rate is calculated in accordance with regulatory requirements, without regard to transactions involving short term investments. If such transactions were included, the Fund’s portfolio turnover rate may be higher. |
| 82 | The accompanying notes are an integral part of these financial statements. |
GOLDMAN SACHS CAPITAL GROWTH FUND
Financial Highlights (continued)
Selected Share Data for a Share Outstanding Throughout Each Year
| Goldman Sachs Capital Growth Fund | ||||||||||||||||||||||
| Class C Shares | ||||||||||||||||||||||
| Year Ended August 31, | ||||||||||||||||||||||
| 2021 | 2020 | 2019 | 2018 | 2017 | ||||||||||||||||||
| Per Share Data |
| |||||||||||||||||||||
Net asset value, beginning of year | $ | 16.05 | $ | 14.05 | $ | 24.01 | $ | 22.13 | $ | 18.68 | ||||||||||||
Net investment loss(a) | (0.16 | ) | (0.06 | ) | (0.07 | ) | (0.16 | ) | (0.12 | ) | ||||||||||||
Net realized and unrealized gain (loss) | 4.97 | 2.95 | (0.56 | ) | 4.51 | 3.90 | ||||||||||||||||
Total from investment operations | 4.81 | 2.89 | (0.63 | ) | 4.35 | 3.78 | ||||||||||||||||
Distributions to shareholders from net realized gains | (1.00 | ) | (0.89 | ) | (9.33 | ) | (2.47 | ) | (0.33 | ) | ||||||||||||
Net asset value, end of year | $ | 19.86 | $ | 16.05 | $ | 14.05 | $ | 24.01 | $ | 22.13 | ||||||||||||
| Total Return(b) | 31.41 | % | 21.37 | % | 3.01 | % | 21.11 | % | 20.59 | % | ||||||||||||
Net assets, end of year (in 000’s) | $ | 21,144 | $ | 16,596 | $ | 18,674 | $ | 65,983 | $ | 62,701 | ||||||||||||
Ratio of net expenses to average net assets | 1.86 | % | 1.89 | % | 1.89 | % | 1.89 | % | 1.90 | % | ||||||||||||
Ratio of total expenses to average net assets | 1.92 | % | 1.97 | % | 1.97 | % | 2.06 | % | 2.26 | % | ||||||||||||
Ratio of net investment loss to average net assets | (0.92 | )% | (0.45 | )% | (0.41 | )% | (0.70 | )% | (0.61 | )% | ||||||||||||
Portfolio turnover rate(c) | 46 | % | 47 | % | 55 | % | 93 | % | 48 | % | ||||||||||||
| (a) | Calculated based on the average shares outstanding methodology. |
| (b) | Assumes investment at the NAV at the beginning of the year, reinvestment of all dividends and distributions, a complete redemption of the investment at the NAV at the end of the year and no sales or redemption charges (if any). Total returns would be reduced if a sales or redemption charge was taken into account. Returns do not reflect the impact of taxes to shareholders relating to Fund distributions or the redemption of Fund shares. |
| (c) | The Fund’s portfolio turnover rate is calculated in accordance with regulatory requirements, without regard to transactions involving short term investments. If such transactions were included, the Fund’s portfolio turnover rate may be higher. |
| The accompanying notes are an integral part of these financial statements. | 83 |
GOLDMAN SACHS CAPITAL GROWTH FUND
Financial Highlights (continued)
Selected Share Data for a Share Outstanding Throughout Each Year
| Goldman Sachs Capital Growth Fund | ||||||||||||||||||||||
| Institutional Shares | ||||||||||||||||||||||
| Year Ended August 31, | ||||||||||||||||||||||
| 2021 | 2020 | 2019 | 2018 | 2017 | ||||||||||||||||||
| Per Share Data |
| |||||||||||||||||||||
Net asset value, beginning of year | $ | 31.19 | $ | 26.39 | $ | 35.76 | $ | 31.60 | $ | 26.35 | ||||||||||||
Net investment income(a) | 0.07 | 0.16 | 0.20 | 0.13 | 0.15 | |||||||||||||||||
Net realized and unrealized gain (loss) | 9.90 | 5.70 | (0.17 | ) | 6.62 | 5.54 | ||||||||||||||||
Total from investment operations | 9.97 | 5.86 | 0.03 | 6.75 | 5.69 | |||||||||||||||||
Distributions to shareholders from net investment income | (0.15 | ) | (0.17 | ) | (0.07 | ) | (0.12 | ) | (0.11 | ) | ||||||||||||
Distributions to shareholders from net realized gains | (1.00 | ) | (0.89 | ) | (9.33 | ) | (2.47 | ) | (0.33 | ) | ||||||||||||
Total distributions | (1.15 | ) | (1.06 | ) | (9.40 | ) | (2.59 | ) | (0.44 | ) | ||||||||||||
Net asset value, end of year | $ | 40.01 | $ | 31.19 | $ | 26.39 | $ | 35.76 | $ | 31.60 | ||||||||||||
| Total Return(b) | 32.86 | % | 22.71 | % | 4.14 | % | 22.50 | % | 21.96 | % | ||||||||||||
Net assets, end of year (in 000’s) | $ | 118,823 | $ | 64,708 | $ | 60,169 | $ | 77,293 | $ | 165,948 | ||||||||||||
Ratio of net expenses to average net assets | 0.74 | % | 0.76 | % | 0.75 | % | 0.75 | % | 0.75 | % | ||||||||||||
Ratio of total expenses to average net assets | 0.80 | % | 0.84 | % | 0.83 | % | 0.93 | % | 1.11 | % | ||||||||||||
Ratio of net investment income to average net assets | 0.20 | % | 0.58 | % | 0.74 | % | 0.40 | % | 0.54 | % | ||||||||||||
Portfolio turnover rate(c) | 46 | % | 47 | % | 55 | % | 93 | % | 48 | % | ||||||||||||
| (a) | Calculated based on the average shares outstanding methodology. |
| (b) | Assumes investment at the NAV at the beginning of the year, reinvestment of all dividends and distributions, a complete redemption of the investment at the NAV at the end of the year and no sales or redemption charges (if any). Total returns would be reduced if a sales or redemption charge was taken into account. Returns do not reflect the impact of taxes to shareholders relating to Fund distributions or the redemption of Fund shares. |
| (c) | The Fund’s portfolio turnover rate is calculated in accordance with regulatory requirements, without regard to transactions involving short term investments. If such transactions were included, the Fund’s portfolio turnover rate may be higher. |
| 84 | The accompanying notes are an integral part of these financial statements. |
GOLDMAN SACHS CAPITAL GROWTH FUND
Financial Highlights (continued)
Selected Share Data for a Share Outstanding Throughout Each Year
| Goldman Sachs Capital Growth Fund | ||||||||||||||||||||||
| Service Shares | ||||||||||||||||||||||
| Year Ended August 31, | ||||||||||||||||||||||
| 2021 | 2020 | 2019 | 2018 | 2017 | ||||||||||||||||||
| Per Share Data |
| |||||||||||||||||||||
Net asset value, beginning of year | $ | 25.46 | $ | 21.73 | $ | 31.33 | $ | 28.00 | $ | 23.40 | ||||||||||||
Net investment income (loss)(a) | (0.08 | ) | 0.03 | 0.06 | (0.01 | ) | — | (b) | ||||||||||||||
Net realized and unrealized gain (loss) | 8.04 | 4.66 | (0.33 | ) | 5.81 | 4.93 | ||||||||||||||||
Total from investment operations | 7.96 | 4.69 | (0.27 | ) | 5.80 | 4.93 | ||||||||||||||||
Distributions to shareholders from net investment income | (0.01 | ) | (0.07 | ) | — | — | — | |||||||||||||||
Distributions to shareholders from net realized gains | (1.00 | ) | (0.89 | ) | (9.33 | ) | (2.47 | ) | (0.33 | ) | ||||||||||||
Total distributions | (1.01 | ) | (0.96 | ) | (9.33 | ) | (2.47 | ) | (0.33 | ) | ||||||||||||
Net asset value, end of year | $ | 32.41 | $ | 25.46 | $ | 21.73 | $ | 31.33 | $ | 28.00 | ||||||||||||
| Total Return(c) | 32.21 | % | 22.12 | % | 3.57 | % | 21.91 | % | 21.36 | % | ||||||||||||
Net assets, end of year (in 000’s) | $ | 2,151 | $ | 1,814 | $ | 1,546 | $ | 1,802 | $ | 1,437 | ||||||||||||
Ratio of net expenses to average net assets | 1.24 | % | 1.26 | % | 1.25 | % | 1.25 | % | 1.25 | % | ||||||||||||
Ratio of total expenses to average net assets | 1.30 | % | 1.34 | % | 1.33 | % | 1.41 | % | 1.61 | % | ||||||||||||
Ratio of net investment income (loss) to average net assets | (0.30 | )% | 0.13 | % | 0.25 | % | (0.04 | )% | 0.02 | % | ||||||||||||
Portfolio turnover rate(d) | 46 | % | 47 | % | 55 | % | 93 | % | 48 | % | ||||||||||||
| (a) | Calculated based on the average shares outstanding methodology. |
| (b) | Amount is less than $0.005 per share. |
| (c) | Assumes investment at the NAV at the beginning of the year, reinvestment of all dividends and distributions, a complete redemption of the investment at the NAV at the end of the year and no sales or redemption charges (if any). Total returns would be reduced if a sales or redemption charge was taken into account. Returns do not reflect the impact of taxes to shareholders relating to Fund distributions or the redemption of Fund shares. |
| (d) | The Fund’s portfolio turnover rate is calculated in accordance with regulatory requirements, without regard to transactions involving short term investments. If such transactions were included, the Fund’s portfolio turnover rate may be higher. |
| The accompanying notes are an integral part of these financial statements. | 85 |
GOLDMAN SACHS CAPITAL GROWTH FUND
Financial Highlights (continued)
Selected Share Data for a Share Outstanding Throughout Each Year
| Goldman Sachs Capital Growth Fund | ||||||||||||||||||||||
| Investor Shares | ||||||||||||||||||||||
| Year Ended August 31, | ||||||||||||||||||||||
| 2021 | 2020 | 2019 | 2018 | 2017 | ||||||||||||||||||
| Per Share Data |
| |||||||||||||||||||||
Net asset value, beginning of year | $ | 27.56 | $ | 23.43 | $ | 32.94 | $ | 29.31 | $ | 24.48 | ||||||||||||
Net investment income(a) | 0.02 | 0.11 | 0.15 | 0.09 | 0.11 | |||||||||||||||||
Net realized and unrealized gain (loss) | 8.73 | 5.05 | (0.28 | ) | 6.11 | 5.13 | ||||||||||||||||
Total from investment operations | 8.75 | 5.16 | (0.13 | ) | 6.20 | 5.24 | ||||||||||||||||
Distributions to shareholders from net investment income | (0.13 | ) | (0.14 | ) | (0.05 | ) | (0.10 | ) | (0.08 | ) | ||||||||||||
Distributions to shareholders from net realized gains | (1.00 | ) | (0.89 | ) | (9.33 | ) | (2.47 | ) | (0.33 | ) | ||||||||||||
Total distributions | (1.13 | ) | (1.03 | ) | (9.38 | ) | (2.57 | ) | (0.41 | ) | ||||||||||||
Net asset value, end of year | $ | 35.18 | $ | 27.56 | $ | 23.43 | $ | 32.94 | $ | 29.31 | ||||||||||||
| Total Return(b) | 32.71 | % | 22.56 | % | 3.96 | % | 22.35 | % | 21.77 | % | ||||||||||||
Net assets, end of year (in 000’s) | $ | 21,889 | $ | 8,703 | $ | 6,649 | $ | 9,259 | $ | 8,496 | ||||||||||||
Ratio of net expenses to average net assets | 0.86 | % | 0.89 | % | 0.89 | % | 0.89 | % | 0.90 | % | ||||||||||||
Ratio of total expenses to average net assets | 0.92 | % | 0.96 | % | 0.97 | % | 1.06 | % | 1.26 | % | ||||||||||||
Ratio of net investment income to average net assets | 0.08 | % | 0.46 | % | 0.60 | % | 0.31 | % | 0.43 | % | ||||||||||||
Portfolio turnover rate(c) | 46 | % | 47 | % | 55 | % | 93 | % | 48 | % | ||||||||||||
| (a) | Calculated based on the average shares outstanding methodology. |
| (b) | Assumes investment at the NAV at the beginning of the year, reinvestment of all dividends and distributions, a complete redemption of the investment at the NAV at the end of the year and no sales or redemption charges (if any). Total returns would be reduced if a sales or redemption charge was taken into account. Returns do not reflect the impact of taxes to shareholders relating to Fund distributions or the redemption of Fund shares. |
| (c) | The Fund’s portfolio turnover rate is calculated in accordance with regulatory requirements, without regard to transactions involving short term investments. If such transactions were included, the Fund’s portfolio turnover rate may be higher. |
| 86 | The accompanying notes are an integral part of these financial statements. |
GOLDMAN SACHS CAPITAL GROWTH FUND
Financial Highlights (continued)
Selected Share Data for a Share Outstanding Throughout Each Year
| Goldman Sachs Capital Growth Fund | ||||||||||||||||||||||
| Class R6 Shares | ||||||||||||||||||||||
| Year Ended August 31, | ||||||||||||||||||||||
| 2021 | 2020 | 2019 | 2018 | 2017 | ||||||||||||||||||
| Per Share Data |
| |||||||||||||||||||||
Net asset value, beginning of year | $ | 31.14 | $ | 26.35 | $ | 35.75 | $ | 31.60 | $ | 26.34 | ||||||||||||
Net investment income(a) | 0.07 | 0.16 | 0.19 | 0.20 | 0.16 | |||||||||||||||||
Net realized and unrealized gain (loss) | 9.90 | 5.69 | (0.17 | ) | 6.55 | 5.55 | ||||||||||||||||
Total from investment operations | 9.97 | 5.85 | 0.02 | 6.75 | 5.71 | |||||||||||||||||
Distributions to shareholders from net investment income | (0.15 | ) | (0.17 | ) | (0.09 | ) | (0.13 | ) | (0.12 | ) | ||||||||||||
Distributions to shareholders from net realized gains | (1.00 | ) | (0.89 | ) | (9.33 | ) | (2.47 | ) | (0.33 | ) | ||||||||||||
Total distributions | (1.15 | ) | (1.06 | ) | (9.42 | ) | (2.60 | ) | (0.45 | ) | ||||||||||||
Net asset value, end of year | $ | 39.96 | $ | 31.14 | $ | 26.35 | $ | 35.75 | $ | 31.60 | ||||||||||||
| Total Return(b) | 32.92 | % | 22.71 | % | 4.12 | % | 22.53 | % | 21.99 | % | ||||||||||||
Net assets, end of year (in 000’s) | $ | 8,707 | $ | 2,454 | $ | 2,313 | $ | 60 | $ | 16 | ||||||||||||
Ratio of net expenses to average net assets | 0.73 | % | 0.75 | % | �� | 0.74 | % | 0.74 | % | 0.75 | % | |||||||||||
Ratio of total expenses to average net assets | 0.78 | % | 0.83 | % | 0.83 | % | 0.90 | % | 1.10 | % | ||||||||||||
Ratio of net investment income to average net assets | 0.21 | % | 0.59 | % | 0.75 | % | 0.60 | % | 0.56 | % | ||||||||||||
Portfolio turnover rate(c) | 46 | % | 47 | % | 55 | % | 93 | % | 48 | % | ||||||||||||
| (a) | Calculated based on the average shares outstanding methodology. |
| (b) | Assumes investment at the NAV at the beginning of the year, reinvestment of all dividends and distributions, a complete redemption of the investment at the NAV at the end of the year and no sales or redemption charges (if any). Total returns would be reduced if a sales or redemption charge was taken into account. Returns do not reflect the impact of taxes to shareholders relating to Fund distributions or the redemption of Fund shares. |
| (c) | The Fund’s portfolio turnover rate is calculated in accordance with regulatory requirements, without regard to transactions involving short term investments. If such transactions were included, the Fund’s portfolio turnover rate may be higher. |
| The accompanying notes are an integral part of these financial statements. | 87 |
GOLDMAN SACHS CAPITAL GROWTH FUND
Financial Highlights (continued)
Selected Share Data for a Share Outstanding Throughout Each Year
| Goldman Sachs Capital Growth Fund | ||||||||||||||||||||||
| Class R Shares | ||||||||||||||||||||||
| Year Ended August 31, | ||||||||||||||||||||||
| 2021 | 2020 | 2019 | 2018 | 2017 | ||||||||||||||||||
| Per Share Data |
| |||||||||||||||||||||
Net asset value, beginning of year | $ | 25.32 | $ | 21.63 | $ | 31.26 | $ | 28.01 | $ | 23.44 | ||||||||||||
Net investment income (loss)(a) | (0.12 | ) | — | (b) | 0.02 | (0.06 | ) | (0.03 | ) | |||||||||||||
Net realized and unrealized gain (loss) | 8.01 | 4.62 | (0.32 | ) | 5.81 | 4.93 | ||||||||||||||||
Total from investment operations | 7.89 | 4.62 | (0.30 | ) | 5.75 | 4.90 | ||||||||||||||||
Distributions to shareholders from net investment income | (0.02 | ) | (0.04 | ) | — | (0.03 | ) | — | ||||||||||||||
Distributions to shareholders from net realized gains | (1.00 | ) | (0.89 | ) | (9.33 | ) | (2.47 | ) | (0.33 | ) | ||||||||||||
Total distributions | (1.02 | ) | (0.93 | ) | (9.33 | ) | (2.50 | ) | (0.33 | ) | ||||||||||||
Net asset value, end of year | $ | 32.19 | $ | 25.32 | $ | 21.63 | $ | 31.26 | $ | 28.01 | ||||||||||||
| Total Return(c) | 32.09 | % | 21.90 | % | 3.47 | % | 21.73 | % | 21.19 | % | ||||||||||||
Net assets, end of year (in 000’s) | $ | 12,608 | $ | 10,097 | $ | 8,559 | $ | 8,887 | $ | 8,093 | ||||||||||||
Ratio of net expenses to average net assets | 1.36 | % | 1.39 | % | 1.39 | % | 1.39 | % | 1.40 | % | ||||||||||||
Ratio of total expenses to average net assets | 1.42 | % | 1.47 | % | 1.47 | % | 1.56 | % | 1.77 | % | ||||||||||||
Ratio of net investment income (loss) to average net assets | (0.42 | )% | 0.01 | % | 0.11 | % | (0.20 | )% | (0.10 | )% | ||||||||||||
Portfolio turnover rate(d) | 46 | % | 47 | % | 55 | % | 93 | % | 48 | % | ||||||||||||
| (a) | Calculated based on the average shares outstanding methodology. |
| (b) | Amount is less than $0.005 per share. |
| (c) | Assumes investment at the NAV at the beginning of the year, reinvestment of all dividends and distributions, a complete redemption of the investment at the NAV at the end of the year and no sales or redemption charges (if any). Total returns would be reduced if a sales or redemption charge was taken into account. Returns do not reflect the impact of taxes to shareholders relating to Fund distributions or the redemption of Fund shares. |
| (d) | The Fund’s portfolio turnover rate is calculated in accordance with regulatory requirements, without regard to transactions involving short term investments. If such transactions were included, the Fund’s portfolio turnover rate may be higher. |
| 88 | The accompanying notes are an integral part of these financial statements. |
GOLDMAN SACHS CAPITAL GROWTH FUND
Financial Highlights (continued)
Selected Share Data for a Share Outstanding Throughout Each Period
| Goldman Sachs Capital Growth Fund | ||||||||||||||||||
| Class P Shares | ||||||||||||||||||
| Year Ended August 31, | Period Ended August 31, 2018(a) | |||||||||||||||||
| 2021 | 2020 | 2019 | ||||||||||||||||
| Per Share Data |
| |||||||||||||||||
Net asset value, beginning of period | $ | 31.13 | $ | 26.34 | $ | 35.74 | $ | 33.39 | ||||||||||
Net investment income(b) | 0.07 | 0.16 | 0.20 | 0.09 | ||||||||||||||
Net realized and unrealized gain (loss) | 9.89 | 5.69 | (0.18 | ) | 2.26 | |||||||||||||
Total from investment operations | 9.96 | 5.85 | 0.02 | 2.35 | ||||||||||||||
Distributions to shareholders from net investment income | (0.15 | ) | (0.17 | ) | (0.09 | ) | — | |||||||||||
Distributions to shareholders from net realized gains | (1.00 | ) | (0.89 | ) | (9.33 | ) | — | |||||||||||
Total distributions | (1.15 | ) | (1.06 | ) | (9.42 | ) | — | |||||||||||
Net asset value, end of period | $ | 39.94 | $ | 31.13 | $ | 26.34 | $ | 35.74 | ||||||||||
| Total Return(c) | 32.90 | % | 22.73 | % | 4.13 | % | 7.04 | % | ||||||||||
Net assets, end of period (in 000’s) | $ | 132,700 | $ | 95,182 | $ | 85,422 | $ | 104,131 | ||||||||||
Ratio of net expenses to average net assets | 0.73 | % | 0.75 | % | 0.74 | % | 0.74 | %(d) | ||||||||||
Ratio of total expenses to average net assets | 0.79 | % | 0.83 | % | 0.82 | % | 0.85 | %(d) | ||||||||||
Ratio of net investment income to average net assets | 0.21 | % | 0.59 | % | 0.75 | % | 0.72 | %(d) | ||||||||||
Portfolio turnover rate(e) | 46 | % | 47 | % | 55 | % | 93 | % | ||||||||||
| (a) | Commenced operations on April 17, 2018. |
| (b) | Calculated based on the average shares outstanding methodology. |
| (c) | Assumes investment at the NAV at the beginning of the period, reinvestment of all dividends and distributions, a complete redemption of the investment at the NAV at the end of the period and no sales or redemption charges (if any). Total returns would be reduced if a sales or redemption charge was taken into account. Returns do not reflect the impact of taxes to shareholders relating to Fund distributions or the redemption of Fund shares. Total returns for periods less than one full year are not annualized. |
| (d) | Annualized. |
| (e) | The Fund’s portfolio turnover rate is calculated in accordance with regulatory requirements, without regard to transactions involving short term investments. If such transactions were included, the Fund’s portfolio turnover rate may be higher. |
| The accompanying notes are an integral part of these financial statements. | 89 |
GOLDMAN SACHS CONCENTRATED GROWTH FUND
Financial Highlights (continued)
Selected Share Data for a Share Outstanding Throughout Each Year
| Goldman Sachs Concentrated Growth Fund | ||||||||||||||||||||||
| Class A Shares | ||||||||||||||||||||||
| Year Ended August 31, | ||||||||||||||||||||||
| 2021 | 2020 | 2019 | 2018 | 2017 | ||||||||||||||||||
| Per Share Data |
| |||||||||||||||||||||
Net asset value, beginning of year | $ | 22.91 | $ | 17.55 | $ | 19.33 | $ | 17.62 | $ | 15.06 | ||||||||||||
Net investment income (loss)(a) | (0.15 | ) | (0.08 | ) | (0.03 | ) | (0.01 | ) | 0.02 | |||||||||||||
Net realized and unrealized gain | 6.24 | 6.92 | 0.35 | 3.82 | 2.64 | |||||||||||||||||
Total from investment operations | 6.09 | 6.84 | 0.32 | 3.81 | 2.66 | |||||||||||||||||
Distributions to shareholders from net investment income | — | — | — | — | (b) | (0.03 | ) | |||||||||||||||
Distributions to shareholders from net realized gains | (1.45 | ) | (1.48 | ) | (2.10 | ) | (2.10 | ) | (0.07 | ) | ||||||||||||
Total distributions | (1.45 | ) | (1.48 | ) | (2.10 | ) | (2.10 | ) | (0.10 | ) | ||||||||||||
Net asset value, end of year | $ | 27.55 | $ | 22.91 | $ | 17.55 | $ | 19.33 | $ | 17.62 | ||||||||||||
| Total Return(c) | 28.17 | % | 41.52 | % | 3.58 | % | 23.68 | % | 17.75 | % | ||||||||||||
Net assets, end of year (in 000’s) | $ | 11,575 | $ | 9,302 | $ | 6,735 | $ | 5,633 | $ | 5,462 | ||||||||||||
Ratio of net expenses to average net assets | 1.11 | % | 1.16 | % | 1.16 | % | 1.17 | % | 1.20 | % | ||||||||||||
Ratio of total expenses to average net assets | 1.32 | % | 1.37 | % | 1.45 | % | 1.51 | % | 1.65 | % | ||||||||||||
Ratio of net investment income (loss) to average net assets | (0.63 | )% | (0.44 | )% | (0.18 | )% | (0.05 | )% | 0.11 | % | ||||||||||||
Portfolio turnover rate(d) | 37 | % | 36 | % | 40 | % | 44 | % | 54 | %(e) | ||||||||||||
| (a) | Calculated based on the average shares outstanding methodology. |
| (b) | Amount is less than $0.005 per share. |
| (c) | Assumes investment at the NAV at the beginning of the year, reinvestment of all dividends and distributions, a complete redemption of the investment at the NAV at the end of the year and no sales or redemption charges (if any). Total returns would be reduced if a sales or redemption charge was taken into account. Returns do not reflect the impact of taxes to shareholders relating to Fund distributions or the redemption of Fund shares. |
| (d) | The Fund’s portfolio turnover rate is calculated in accordance with regulatory requirements, without regard to transactions involving short term investments. If such transactions were included, the Fund’s portfolio turnover rate may be higher. |
| (e) | On July 28, 2017, Goldman Sachs Concentrated Growth Fund acquired all of the net assets of Goldman Sachs Focused Growth Fund pursuant to an Agreement and Plan of Reorganization. Portfolio turnover excludes purchases and sales of securities by Goldman Sachs Focused Growth Fund (acquired fund) prior to the merger date. |
| 90 | The accompanying notes are an integral part of these financial statements. |
GOLDMAN SACHS CONCENTRATED GROWTH FUND
Financial Highlights (continued)
Selected Share Data for a Share Outstanding Throughout Each Year
| Goldman Sachs Concentrated Growth Fund | ||||||||||||||||||||||
| Class C Shares | ||||||||||||||||||||||
| Year Ended August 31, | ||||||||||||||||||||||
| 2021 | 2020 | 2019 | 2018 | 2017 | ||||||||||||||||||
| Per Share Data |
| |||||||||||||||||||||
Net asset value, beginning of year | $ | 17.56 | $ | 13.87 | $ | 15.88 | $ | 14.93 | $ | 12.84 | ||||||||||||
Net investment loss(a) | (0.24 | ) | (0.17 | ) | (0.13 | ) | (0.12 | ) | (0.08 | ) | ||||||||||||
Net realized and unrealized gain | 4.67 | 5.34 | 0.22 | 3.17 | 2.24 | |||||||||||||||||
Total from investment operations | 4.43 | 5.17 | 0.09 | 3.05 | 2.16 | |||||||||||||||||
Distributions to shareholders from net realized gains | (1.45 | ) | (1.48 | ) | (2.10 | ) | (2.10 | ) | (0.07 | ) | ||||||||||||
Net asset value, end of year | $ | 20.54 | $ | 17.56 | $ | 13.87 | $ | 15.88 | $ | 14.93 | ||||||||||||
| Total Return(b) | 27.24 | % | 40.47 | % | 2.81 | % | 22.74 | % | 16.88 | % | ||||||||||||
Net assets, end of year (in 000’s) | $ | 1,008 | $ | 1,162 | $ | 823 | $ | 2,137 | $ | 2,210 | ||||||||||||
Ratio of net expenses to average net assets | 1.86 | % | 1.91 | % | 1.91 | % | 1.92 | % | 1.95 | % | ||||||||||||
Ratio of total expenses to average net assets | 2.07 | % | 2.10 | % | 2.21 | % | 2.26 | % | 2.40 | % | ||||||||||||
Ratio of net investment loss to average net assets | (1.38 | )% | (1.23 | )% | (0.98 | )% | (0.80 | )% | (0.61 | )% | ||||||||||||
Portfolio turnover rate(c) | 37 | % | 36 | % | 40 | % | 44 | % | 54 | %(d) | ||||||||||||
| (a) | Calculated based on the average shares outstanding methodology. |
| (b) | Assumes investment at the NAV at the beginning of the year, reinvestment of all dividends and distributions, a complete redemption of the investment at the NAV at the end of the year and no sales or redemption charges (if any). Total returns would be reduced if a sales or redemption charge was taken into account. Returns do not reflect the impact of taxes to shareholders relating to Fund distributions or the redemption of Fund shares. |
| (c) | The Fund’s portfolio turnover rate is calculated in accordance with regulatory requirements, without regard to transactions involving short term investments. If such transactions were included, the Fund’s portfolio turnover rate may be higher. |
| (d) | On July 28, 2017, Goldman Sachs Concentrated Growth Fund acquired all of the net assets of Goldman Sachs Focused Growth Fund pursuant to an Agreement and Plan of Reorganization. Portfolio turnover excludes purchases and sales of securities by Goldman Sachs Focused Growth Fund (acquired fund) prior to the merger date. |
| The accompanying notes are an integral part of these financial statements. | 91 |
GOLDMAN SACHS CONCENTRATED GROWTH FUND
Financial Highlights (continued)
Selected Share Data for a Share Outstanding Throughout Each Year
| Goldman Sachs Concentrated Growth Fund | ||||||||||||||||||||||
| Institutional Shares | ||||||||||||||||||||||
| Year Ended August 31, | ||||||||||||||||||||||
| 2021 | 2020 | 2019 | 2018 | 2017 | ||||||||||||||||||
| Per Share Data |
| |||||||||||||||||||||
Net asset value, beginning of year | $ | 24.92 | $ | 18.93 | $ | 20.61 | $ | 18.65 | $ | 15.94 | ||||||||||||
Net investment income (loss)(a) | (0.08 | ) | (0.01 | ) | 0.03 | 0.06 | 0.09 | |||||||||||||||
Net realized and unrealized gain | 6.83 | 7.50 | 0.41 | 4.07 | 2.78 | |||||||||||||||||
Total from investment operations | 6.75 | 7.49 | 0.44 | 4.13 | 2.87 | |||||||||||||||||
Distributions to shareholders from net investment income | — | (0.02 | ) | (0.02 | ) | (0.07 | ) | (0.09 | ) | |||||||||||||
Distributions to shareholders from net realized gains | (1.45 | ) | (1.48 | ) | (2.10 | ) | (2.10 | ) | (0.07 | ) | ||||||||||||
Total distributions | (1.45 | ) | (1.50 | ) | (2.12 | ) | (2.17 | ) | (0.16 | ) | ||||||||||||
Net asset value, end of year | $ | 30.22 | $ | 24.92 | $ | 18.93 | $ | 20.61 | $ | 18.65 | ||||||||||||
| Total Return(b) | 28.56 | % | 41.98 | % | 3.98 | % | 24.13 | % | 18.22 | % | ||||||||||||
Net assets, end of year (in 000’s) | $ | 16,789 | $ | 13,744 | $ | 12,497 | $ | 15,286 | $ | 142,623 | ||||||||||||
Ratio of net expenses to average net assets | 0.80 | % | 0.81 | % | 0.80 | % | 0.81 | % | 0.82 | % | ||||||||||||
Ratio of total expenses to average net assets | 0.95 | % | 1.01 | % | 1.07 | % | 1.20 | % | 1.26 | % | ||||||||||||
Ratio of net investment income (loss) to average net assets | (0.32 | )% | (0.07 | )% | 0.17 | % | 0.31 | % | 0.51 | % | ||||||||||||
Portfolio turnover rate(c) | 37 | % | 36 | % | 40 | % | 44 | % | 54 | %(d) | ||||||||||||
| (a) | Calculated based on the average shares outstanding methodology. |
| (b) | Assumes investment at the NAV at the beginning of the year, reinvestment of all dividends and distributions, a complete redemption of the investment at the NAV at the end of the year and no sales or redemption charges (if any). Total returns would be reduced if a sales or redemption charge was taken into account. Returns do not reflect the impact of taxes to shareholders relating to Fund distributions or the redemption of Fund shares. |
| (c) | The Fund’s portfolio turnover rate is calculated in accordance with regulatory requirements, without regard to transactions involving short term investments. If such transactions were included, the Fund’s portfolio turnover rate may be higher. |
| (d) | On July 28, 2017, Goldman Sachs Concentrated Growth Fund acquired all of the net assets of Goldman Sachs Focused Growth Fund pursuant to an Agreement and Plan of Reorganization. Portfolio turnover excludes purchases and sales of securities by Goldman Sachs Focused Growth Fund (acquired fund) prior to the merger date. |
| 92 | The accompanying notes are an integral part of these financial statements. |
GOLDMAN SACHS CONCENTRATED GROWTH FUND
Financial Highlights (continued)
Selected Share Data for a Share Outstanding Throughout Each Year
| Goldman Sachs Concentrated Growth Fund | ||||||||||||||||||||||
| Investor Shares | ||||||||||||||||||||||
| Year Ended August 31, | ||||||||||||||||||||||
| 2021 | 2020 | 2019 | 2018 | 2017 | ||||||||||||||||||
| Per Share Data |
| |||||||||||||||||||||
Net asset value, beginning of year | $ | 23.46 | $ | 17.90 | $ | 19.66 | $ | 17.88 | $ | 15.28 | ||||||||||||
Net investment income (loss)(a) | (0.09 | ) | (0.03 | ) | 0.01 | 0.03 | 0.07 | |||||||||||||||
Net realized and unrealized gain | 6.41 | 7.07 | 0.36 | 3.88 | 2.67 | |||||||||||||||||
Total from investment operations | 6.32 | 7.04 | 0.37 | 3.91 | 2.74 | |||||||||||||||||
Distributions to shareholders from net investment income | — | — | (b) | (0.03 | ) | (0.03 | ) | (0.07 | ) | |||||||||||||
Distributions to shareholders from net realized gains | (1.45 | ) | (1.48 | ) | (2.10 | ) | (2.10 | ) | (0.07 | ) | ||||||||||||
Total distributions | (1.45 | ) | (1.48 | ) | (2.13 | ) | (2.13 | ) | (0.14 | ) | ||||||||||||
Net asset value, end of year | $ | 28.33 | $ | 23.46 | $ | 17.90 | $ | 19.66 | $ | 17.88 | ||||||||||||
| Total Return(c) | 28.50 | % | 41.87 | % | 3.83 | % | 23.94 | % | 18.14 | % | ||||||||||||
Net assets, end of year (in 000’s) | $ | 296 | $ | 189 | $ | 133 | $ | 463 | $ | 780 | ||||||||||||
Ratio of net expenses to average net assets | 0.86 | % | 0.91 | % | 0.91 | % | 0.92 | % | 0.95 | % | ||||||||||||
Ratio of total expenses to average net assets | 1.07 | % | 1.11 | % | 1.22 | % | 1.26 | % | 1.41 | % | ||||||||||||
Ratio of net investment income (loss) to average net assets | (0.39 | )% | (0.18 | )% | 0.03 | % | 0.17 | % | 0.45 | % | ||||||||||||
Portfolio turnover rate(d) | 37 | % | 36 | % | 40 | % | 44 | % | 54 | %(e) | ||||||||||||
| (a) | Calculated based on the average shares outstanding methodology. |
| (b) | Amount is less than $0.005 per share. |
| (c) | Assumes investment at the NAV at the beginning of the year, reinvestment of all dividends and distributions, a complete redemption of the investment at the NAV at the end of the year and no sales or redemption charges (if any). Total returns would be reduced if a sales or redemption charge was taken into account. Returns do not reflect the impact of taxes to shareholders relating to Fund distributions or the redemption of Fund shares. |
| (d) | The Fund’s portfolio turnover rate is calculated in accordance with regulatory requirements, without regard to transactions involving short term investments. If such transactions were included, the Fund’s portfolio turnover rate may be higher. |
| (e) | On July 28, 2017, Goldman Sachs Concentrated Growth Fund acquired all of the net assets of Goldman Sachs Focused Growth Fund pursuant to an Agreement and Plan of Reorganization. Portfolio turnover excludes purchases and sales of securities by Goldman Sachs Focused Growth Fund (acquired fund) prior to the merger date. |
| The accompanying notes are an integral part of these financial statements. | 93 |
GOLDMAN SACHS CONCENTRATED GROWTH FUND
Financial Highlights (continued)
Selected Share Data for a Share Outstanding Throughout Each Year
| Goldman Sachs Concentrated Growth Fund | ||||||||||||||||||||||
| Class R6 Shares | ||||||||||||||||||||||
| Year Ended August 31, | ||||||||||||||||||||||
| 2021 | 2020 | 2019 | 2018 | 2017 | ||||||||||||||||||
| Per Share Data |
| |||||||||||||||||||||
Net asset value, beginning of year | $ | 24.86 | $ | 18.88 | $ | 20.60 | $ | 18.65 | $ | 15.95 | ||||||||||||
Net investment income (loss)(a) | (0.08 | ) | (0.01 | ) | 0.04 | 0.06 | 0.13 | |||||||||||||||
Net realized and unrealized gain | 6.82 | 7.49 | 0.39 | 4.06 | 2.74 | |||||||||||||||||
Total from investment operations | 6.74 | 7.48 | 0.43 | 4.12 | 2.87 | |||||||||||||||||
Distributions to shareholders from net investment income | — | (0.02 | ) | (0.05 | ) | (0.07 | ) | (0.10 | ) | |||||||||||||
Distributions to shareholders from net realized gains | (1.45 | ) | (1.48 | ) | (2.10 | ) | (2.10 | ) | (0.07 | ) | ||||||||||||
Total distributions | (1.45 | ) | (1.50 | ) | (2.15 | ) | (2.17 | ) | (0.17 | ) | ||||||||||||
Net asset value, end of year | $ | 30.15 | $ | 24.86 | $ | 18.88 | $ | 20.60 | $ | 18.65 | ||||||||||||
| Total Return(b) | 28.59 | % | 42.05 | % | 4.00 | % | 24.09 | % | 18.17 | % | ||||||||||||
Net assets, end of year (in 000’s) | $ | 1,497 | $ | 806 | $ | 538 | $ | 99 | $ | 68 | ||||||||||||
Ratio of net expenses to average net assets | 0.79 | % | 0.80 | % | 0.79 | % | 0.80 | % | 0.82 | % | ||||||||||||
Ratio of total expenses to average net assets | 0.94 | % | 0.98 | % | 1.04 | % | 1.09 | % | 1.32 | % | ||||||||||||
Ratio of net investment income (loss) to average net assets | (0.30 | )% | (0.07 | )% | 0.22 | % | 0.34 | % | 0.74 | % | ||||||||||||
Portfolio turnover rate(c) | 37 | % | 36 | % | 40 | % | 44 | % | 54 | %(d) | ||||||||||||
| (a) | Calculated based on the average shares outstanding methodology. |
| (b) | Assumes investment at the NAV at the beginning of the year, reinvestment of all dividends and distributions, a complete redemption of the investment at the NAV at the end of the year and no sales or redemption charges (if any). Total returns would be reduced if a sales or redemption charge was taken into account. Returns do not reflect the impact of taxes to shareholders relating to Fund distributions or the redemption of Fund shares. |
| (c) | The Fund’s portfolio turnover rate is calculated in accordance with regulatory requirements, without regard to transactions involving short term investments. If such transactions were included, the Fund’s portfolio turnover rate may be higher. |
| (d) | On July 28, 2017, Goldman Sachs Concentrated Growth Fund acquired all of the net assets of Goldman Sachs Focused Growth Fund pursuant to an Agreement and Plan of Reorganization. Portfolio turnover excludes purchases and sales of securities by Goldman Sachs Focused Growth Fund (acquired fund) prior to the merger date. |
| 94 | The accompanying notes are an integral part of these financial statements. |
GOLDMAN SACHS CONCENTRATED GROWTH FUND
Financial Highlights (continued)
Selected Share Data for a Share Outstanding Throughout Each Year
| Goldman Sachs Concentrated Growth Fund | ||||||||||||||||||||||
| Class R Shares | ||||||||||||||||||||||
| Year Ended August 31, | ||||||||||||||||||||||
| 2021 | 2020 | 2019 | 2018 | 2017 | ||||||||||||||||||
| Per Share Data |
| |||||||||||||||||||||
Net asset value, beginning of year | $ | 21.84 | $ | 16.84 | $ | 18.68 | $ | 17.13 | $ | 14.65 | ||||||||||||
Net investment loss(a) | (0.20 | ) | (0.12 | ) | (0.07 | ) | (0.05 | ) | (0.02 | ) | ||||||||||||
Net realized and unrealized gain | 5.92 | 6.60 | 0.33 | 3.70 | 2.57 | |||||||||||||||||
Total from investment operations | 5.72 | 6.48 | 0.26 | 3.65 | 2.55 | |||||||||||||||||
Distributions to shareholders from net realized gains | (1.45 | ) | (1.48 | ) | (2.10 | ) | (2.10 | ) | (0.07 | ) | ||||||||||||
Net asset value, end of year | $ | 26.11 | $ | 21.84 | $ | 16.84 | $ | 18.68 | $ | 17.13 | ||||||||||||
| Total Return(b) | 27.84 | % | 41.12 | % | 3.36 | % | 23.37 | % | 17.46 | % | ||||||||||||
Net assets, end of year (in 000’s) | $ | 42 | $ | 33 | $ | 36 | $ | 34 | $ | 25 | ||||||||||||
Ratio of net expenses to average net assets | 1.36 | % | 1.41 | % | 1.41 | % | 1.42 | % | 1.45 | % | ||||||||||||
Ratio of total expenses to average net assets | 1.57 | % | 1.66 | % | 1.70 | % | 1.75 | % | 1.91 | % | ||||||||||||
Ratio of net investment loss to average net assets | (0.88 | )% | (0.69 | )% | (0.43 | )% | (0.29 | )% | (0.14 | )% | ||||||||||||
Portfolio turnover rate(c) | 37 | % | 36 | % | 40 | % | 44 | % | 54 | %(d) | ||||||||||||
| (a) | Calculated based on the average shares outstanding methodology. |
| (b) | Assumes investment at the NAV at the beginning of the year, reinvestment of all dividends and distributions, a complete redemption of the investment at the NAV at the end of the year and no sales or redemption charges (if any). Total returns would be reduced if a sales or redemption charge was taken into account. Returns do not reflect the impact of taxes to shareholders relating to Fund distributions or the redemption of Fund shares. |
| (c) | The Fund’s portfolio turnover rate is calculated in accordance with regulatory requirements, without regard to transactions involving short term investments. If such transactions were included, the Fund’s portfolio turnover rate may be higher. |
| (d) | On July 28, 2017, Goldman Sachs Concentrated Growth Fund acquired all of the net assets of Goldman Sachs Focused Growth Fund pursuant to an Agreement and Plan of Reorganization. Portfolio turnover excludes purchases and sales of securities by Goldman Sachs Focused Growth Fund (acquired fund) prior to the merger date. |
| The accompanying notes are an integral part of these financial statements. | 95 |
GOLDMAN SACHS CONCENTRATED GROWTH FUND
Financial Highlights (continued)
Selected Share Data for a Share Outstanding Throughout Each Period
| Goldman Sachs Concentrated Growth Fund | ||||||||||||||||||
| Class P Shares | ||||||||||||||||||
| Year Ended August 31, | Period Ended August 31, 2018(a) | |||||||||||||||||
| 2021 | 2020 | 2019 | ||||||||||||||||
| Per Share Data |
| |||||||||||||||||
Net asset value, beginning of period | $ | 24.85 | $ | 18.88 | $ | 20.60 | $ | 18.54 | ||||||||||
Net investment income (loss)(b) | (0.08 | ) | (0.01 | ) | 0.03 | 0.02 | ||||||||||||
Net realized and unrealized gain | 6.82 | 7.48 | 0.40 | 2.04 | ||||||||||||||
Total from investment operations | 6.74 | 7.47 | 0.43 | 2.06 | ||||||||||||||
Distributions to shareholders from net investment income | — | (0.02 | ) | (0.05 | ) | — | ||||||||||||
Distributions to shareholders from net realized gains | (1.45 | ) | (1.48 | ) | (2.10 | ) | — | |||||||||||
Total distributions | (1.45 | ) | (1.50 | ) | (2.15 | ) | — | |||||||||||
Net asset value, end of period | $ | 30.14 | $ | 24.85 | $ | 18.88 | $ | 20.60 | ||||||||||
| Total Return(c) | 28.60 | % | 42.00 | % | 4.01 | % | 11.11 | % | ||||||||||
Net assets, end of period (in 000’s) | $ | 190,213 | $ | 160,582 | $ | 128,289 | $ | 143,078 | ||||||||||
Ratio of net expenses to average net assets | 0.79 | % | 0.80 | % | 0.79 | % | 0.79 | %(d) | ||||||||||
Ratio of total expenses to average net assets | 0.94 | % | 0.99 | % | 1.06 | % | 0.72 | %(d) | ||||||||||
Ratio of net investment income (loss) to average net assets | (0.31 | )% | (0.06 | )% | 0.18 | % | 0.32 | %(d) | ||||||||||
Portfolio turnover rate(e) | 37 | % | 36 | % | 40 | % | 44 | % | ||||||||||
| (a) | Commenced operations on April 17, 2018. |
| (b) | Calculated based on the average shares outstanding methodology. |
| (c) | Assumes investment at the NAV at the beginning of the period, reinvestment of all dividends and distributions, a complete redemption of the investment at the NAV at the end of the period and no sales or redemption charges (if any). Total returns would be reduced if a sales or redemption charge was taken into account. Returns do not reflect the impact of taxes to shareholders relating to Fund distributions or the redemption of Fund shares. Total returns for periods less than one full year are not annualized. |
| (d) | Annualized. |
| (e) | The Fund’s portfolio turnover rate is calculated in accordance with regulatory requirements, without regard to transactions involving short term investments. If such transactions were included, the Fund’s portfolio turnover rate may be higher. |
| 96 | The accompanying notes are an integral part of these financial statements. |
GOLDMAN SACHS FLEXIBLE CAP FUND
Financial Highlights (continued)
Selected Share Data for a Share Outstanding Throughout Each Year
| Goldman Sachs Flexible Cap Fund | ||||||||||||||||||||||
| Class A Shares | ||||||||||||||||||||||
| Year Ended August 31, | ||||||||||||||||||||||
| 2021 | 2020 | 2019 | 2018 | 2017 | ||||||||||||||||||
| Per Share Data |
| |||||||||||||||||||||
Net asset value, beginning of year | $ | 13.78 | $ | 11.93 | $ | 12.66 | $ | 14.09 | $ | 11.74 | ||||||||||||
Net investment income(a) | 0.03 | 0.07 | 0.09 | 0.09 | — | (b) | ||||||||||||||||
Net realized and unrealized gain | 3.93 | 2.48 | 0.15 | 2.17 | 2.36 | |||||||||||||||||
Total from investment operations | 3.96 | 2.55 | 0.24 | 2.26 | 2.36 | |||||||||||||||||
Distributions to shareholders from net investment income | (0.06 | ) | (0.08 | ) | (0.10 | ) | (0.01 | ) | — | |||||||||||||
Distributions to shareholders from net realized gains | (0.74 | ) | (0.62 | ) | (0.87 | ) | (3.68 | ) | (0.01 | ) | ||||||||||||
Total distributions | (0.80 | ) | (0.70 | ) | (0.97 | ) | (3.69 | ) | (0.01 | ) | ||||||||||||
Net asset value, end of year | $ | 16.94 | $ | 13.78 | $ | 11.93 | $ | 12.66 | $ | 14.09 | ||||||||||||
| Total Return(c) | 30.12 | % | 22.18 | % | 3.07 | % | 18.82 | % | 20.14 | % | ||||||||||||
Net assets, end of year (in 000’s) | $ | 7,359 | $ | 5,843 | $ | 5,383 | $ | 5,490 | $ | 5,627 | ||||||||||||
Ratio of net expenses to average net assets | 0.96 | % | 1.00 | % | 0.97 | % | 0.95 | % | 1.20 | % | ||||||||||||
Ratio of total expenses to average net assets | 2.00 | % | 2.47 | % | 2.88 | % | 2.47 | % | 3.01 | % | ||||||||||||
Ratio of net investment income (loss) to average net assets | 0.21 | % | 0.58 | % | 0.74 | % | 0.73 | % | (0.01 | )% | ||||||||||||
Portfolio turnover rate(d) | 43 | % | 69 | % | 50 | % | 157 | % | 47 | % | ||||||||||||
| (a) | Calculated based on the average shares outstanding methodology. |
| (b) | Amount is less than $0.005 per share. |
| (c) | Assumes investment at the NAV at the beginning of the year, reinvestment of all dividends and distributions, a complete redemption of the investment at the NAV at the end of the year and no sales or redemption charges (if any). Total returns would be reduced if a sales or redemption charge was taken into account. Returns do not reflect the impact of taxes to shareholders relating to Fund distributions or the redemption of Fund shares. |
| (d) | The Fund’s portfolio turnover rate is calculated in accordance with regulatory requirements, without regard to transactions involving short term investments. If such transactions were included, the Fund’s portfolio turnover rate may be higher. |
| The accompanying notes are an integral part of these financial statements. | 97 |
GOLDMAN SACHS FLEXIBLE CAP FUND
Financial Highlights (continued)
Selected Share Data for a Share Outstanding Throughout Each Year
| Goldman Sachs Flexible Cap Fund | ||||||||||||||||||||||
| Class C Shares | ||||||||||||||||||||||
| Year Ended August 31, | ||||||||||||||||||||||
| 2021 | 2020 | 2019 | 2018 | 2017 | ||||||||||||||||||
| Per Share Data |
| |||||||||||||||||||||
Net asset value, beginning of year | $ | 11.67 | $ | 10.23 | $ | 11.00 | $ | 12.75 | $ | 10.71 | ||||||||||||
Net investment loss(a) | (0.07 | ) | (0.02 | ) | — | (b) | — | (b) | (0.09 | ) | ||||||||||||
Net realized and unrealized gain | 3.31 | 2.10 | 0.13 | 1.93 | 2.14 | |||||||||||||||||
Total from investment operations | 3.24 | 2.08 | 0.13 | 1.93 | 2.05 | |||||||||||||||||
Distributions to shareholders from net investment income | — | (0.02 | ) | (0.03 | ) | — | — | |||||||||||||||
Distributions to shareholders from net realized gains | (0.74 | ) | (0.62 | ) | (0.87 | ) | (3.68 | ) | (0.01 | ) | ||||||||||||
Total distributions | (0.74 | ) | (0.64 | ) | (0.90 | ) | (3.68 | ) | (0.01 | ) | ||||||||||||
Net asset value, end of year | $ | 14.17 | $ | 11.67 | $ | 10.23 | $ | 11.00 | $ | 12.75 | ||||||||||||
| Total Return(c) | 29.19 | % | 21.16 | % | 2.30 | % | 18.00 | % | 19.18 | % | ||||||||||||
Net assets, end of year (in 000’s) | $ | 1,354 | $ | 1,516 | $ | 1,288 | $ | 1,304 | $ | 1,512 | ||||||||||||
Ratio of net expenses to average net assets | 1.71 | % | 1.75 | % | 1.72 | % | 1.70 | % | 1.95 | % | ||||||||||||
Ratio of total expenses to average net assets | 2.76 | % | 3.19 | % | 3.63 | % | 3.20 | % | 3.76 | % | ||||||||||||
Ratio of net investment loss to average net assets | (0.54 | )% | (0.16 | )% | — | %(d) | (0.02 | )% | (0.75 | )% | ||||||||||||
Portfolio turnover rate(e) | 43 | % | 69 | % | 50 | % | 157 | % | 47 | % | ||||||||||||
| (a) | Calculated based on the average shares outstanding methodology. |
| (b) | Amount is less than $0.005 per share. |
| (c) | Assumes investment at the NAV at the beginning of the year, reinvestment of all dividends and distributions, a complete redemption of the investment at the NAV at the end of the year and no sales or redemption charges (if any). Total returns would be reduced if a sales or redemption charge was taken into account. Returns do not reflect the impact of taxes to shareholders relating to Fund distributions or the redemption of Fund shares. |
| (d) | Amount is less than 0.005% per share. |
| (e) | The Fund’s portfolio turnover rate is calculated in accordance with regulatory requirements, without regard to transactions involving short term investments. If such transactions were included, the Fund’s portfolio turnover rate may be higher. |
| 98 | The accompanying notes are an integral part of these financial statements. |
GOLDMAN SACHS FLEXIBLE CAP FUND
Financial Highlights (continued)
Selected Share Data for a Share Outstanding Throughout Each Year
| Goldman Sachs Flexible Cap Fund | ||||||||||||||||||||||
| Institutional Shares | ||||||||||||||||||||||
| Year Ended August 31, | ||||||||||||||||||||||
| 2021 | 2020 | 2019 | 2018 | 2017 | ||||||||||||||||||
| Per Share Data |
| |||||||||||||||||||||
Net asset value, beginning of year | $ | 15.01 | $ | 12.94 | $ | 13.61 | $ | 14.88 | $ | 12.35 | ||||||||||||
Net investment income(a) | 0.09 | 0.12 | 0.13 | 0.14 | 0.05 | |||||||||||||||||
Net realized and unrealized gain | 4.31 | 2.70 | 0.19 | 2.33 | 2.49 | |||||||||||||||||
Total from investment operations | 4.40 | 2.82 | 0.32 | 2.47 | 2.54 | |||||||||||||||||
Distributions to shareholders from net investment income | (0.11 | ) | (0.13 | ) | (0.12 | ) | (0.06 | ) | — | |||||||||||||
Distributions to shareholders from net realized gains | (0.74 | ) | (0.62 | ) | (0.87 | ) | (3.68 | ) | (0.01 | ) | ||||||||||||
Total distributions | (0.85 | ) | (0.75 | ) | (0.99 | ) | (3.74 | ) | (0.01 | ) | ||||||||||||
Net asset value, end of year | $ | 18.56 | $ | 15.01 | $ | 12.94 | $ | 13.61 | $ | 14.88 | ||||||||||||
| Total Return(b) | 30.62 | % | 22.53 | % | 3.47 | % | 19.29 | % | 20.61 | % | ||||||||||||
Net assets, end of year (in 000’s) | $ | 4,514 | $ | 594 | $ | 587 | $ | 1,633 | $ | 11,111 | ||||||||||||
Ratio of net expenses to average net assets | 0.59 | % | 0.62 | % | 0.59 | % | 0.59 | % | 0.82 | % | ||||||||||||
Ratio of total expenses to average net assets | 1.46 | % | 2.11 | % | 2.41 | % | 2.01 | % | 2.62 | % | ||||||||||||
Ratio of net investment income to average net assets | 0.54 | % | 0.95 | % | 1.08 | % | 1.04 | % | 0.38 | % | ||||||||||||
Portfolio turnover rate(c) | 43 | % | 69 | % | 50 | % | 157 | % | 47 | % | ||||||||||||
| (a) | Calculated based on the average shares outstanding methodology. |
| (b) | Assumes investment at the NAV at the beginning of the year, reinvestment of all dividends and distributions, a complete redemption of the investment at the NAV at the end of the year and no sales or redemption charges (if any). Total returns would be reduced if a sales or redemption charge was taken into account. Returns do not reflect the impact of taxes to shareholders relating to Fund distributions or the redemption of Fund shares. |
| (c) | The Fund’s portfolio turnover rate is calculated in accordance with regulatory requirements, without regard to transactions involving short term investments. If such transactions were included, the Fund’s portfolio turnover rate may be higher. |
| The accompanying notes are an integral part of these financial statements. | 99 |
GOLDMAN SACHS FLEXIBLE CAP FUND
Financial Highlights (continued)
Selected Share Data for a Share Outstanding Throughout Each Year
| Goldman Sachs Flexible Cap Fund | ||||||||||||||||||||||
| Investor Shares | ||||||||||||||||||||||
| Year Ended August 31, | ||||||||||||||||||||||
| 2021 | 2020 | 2019 | 2018 | 2017 | ||||||||||||||||||
| Per Share Data |
| |||||||||||||||||||||
Net asset value, beginning of year | $ | 14.66 | $ | 12.65 | $ | 13.35 | $ | 14.63 | $ | 12.16 | ||||||||||||
Net investment income(a) | 0.07 | 0.10 | 0.12 | 0.12 | 0.05 | |||||||||||||||||
Net realized and unrealized gain | 4.19 | 2.64 | 0.18 | 2.28 | 2.43 | |||||||||||||||||
Total from investment operations | 4.26 | 2.74 | 0.30 | 2.40 | 2.48 | |||||||||||||||||
Distributions to shareholders from net investment income | (0.09 | ) | (0.11 | ) | (0.13 | ) | — | — | ||||||||||||||
Distributions to shareholders from net realized gains | (0.74 | ) | (0.62 | ) | (0.87 | ) | (3.68 | ) | (0.01 | ) | ||||||||||||
Total distributions | (0.83 | ) | (0.73 | ) | (1.00 | ) | (3.68 | ) | (0.01 | ) | ||||||||||||
Net asset value, end of year | $ | 18.09 | $ | 14.66 | $ | 12.65 | $ | 13.35 | $ | 14.63 | ||||||||||||
| Total Return(b) | 30.39 | % | 22.43 | % | 3.40 | % | 19.08 | % | 20.43 | % | ||||||||||||
Net assets, end of year (in 000’s) | $ | 52 | $ | 38 | $ | 70 | $ | 68 | $ | 379 | ||||||||||||
Ratio of net expenses to average net assets | 0.71 | % | 0.76 | % | 0.72 | % | 0.70 | % | 0.95 | % | ||||||||||||
Ratio of total expenses to average net assets | 1.74 | % | 2.66 | % | 2.63 | % | 2.08 | % | 2.83 | % | ||||||||||||
Ratio of net investment income to average net assets | 0.46 | % | 0.78 | % | 0.99 | % | 0.88 | % | 0.35 | % | ||||||||||||
Portfolio turnover rate(c) | 43 | % | 69 | % | 50 | % | 157 | % | 47 | % | ||||||||||||
| (a) | Calculated based on the average shares outstanding methodology. |
| (b) | Assumes investment at the NAV at the beginning of the year, reinvestment of all dividends and distributions, a complete redemption of the investment at the NAV at the end of the year and no sales or redemption charges (if any). Total returns would be reduced if a sales or redemption charge was taken into account. Returns do not reflect the impact of taxes to shareholders relating to Fund distributions or the redemption of Fund shares. |
| (c) | The Fund’s portfolio turnover rate is calculated in accordance with regulatory requirements, without regard to transactions involving short term investments. If such transactions were included, the Fund’s portfolio turnover rate may be higher. |
| 100 | The accompanying notes are an integral part of these financial statements. |
GOLDMAN SACHS FLEXIBLE CAP FUND
Financial Highlights (continued)
Selected Share Data for a Share Outstanding Throughout Each Year
| Goldman Sachs Flexible Cap Fund | ||||||||||||||||||||||
| Class R6 Shares | ||||||||||||||||||||||
| Year Ended August 31, | ||||||||||||||||||||||
| 2021 | 2020 | 2019 | 2018 | 2017 | ||||||||||||||||||
| Per Share Data |
| |||||||||||||||||||||
Net asset value, beginning of year | $ | 14.98 | $ | 12.91 | $ | 13.61 | $ | 14.88 | $ | 12.35 | ||||||||||||
Net investment income(a) | 0.10 | 0.13 | 0.14 | 0.15 | 0.05 | |||||||||||||||||
Net realized and unrealized gain | 4.29 | 2.69 | 0.18 | 2.32 | 2.49 | |||||||||||||||||
Total from investment operations | 4.39 | 2.82 | 0.32 | 2.47 | 2.54 | |||||||||||||||||
Distributions to shareholders from net investment income | (0.11 | ) | (0.13 | ) | (0.15 | ) | (0.06 | ) | — | |||||||||||||
Distributions to shareholders from net realized gains | (0.74 | ) | (0.62 | ) | (0.87 | ) | (3.68 | ) | (0.01 | ) | ||||||||||||
Total distributions | (0.85 | ) | (0.75 | ) | (1.02 | ) | (3.74 | ) | (0.01 | ) | ||||||||||||
Net asset value, end of year | $ | 18.52 | $ | 14.98 | $ | 12.91 | $ | 13.61 | $ | 14.88 | ||||||||||||
| Total Return(b) | 30.64 | % | 22.60 | % | 3.47 | % | 19.27 | % | 20.61 | % | ||||||||||||
Net assets, end of year (in 000’s) | $ | 334 | $ | 226 | $ | 202 | $ | 14 | $ | 12 | ||||||||||||
Ratio of net expenses to average net assets | 0.58 | % | 0.61 | % | 0.59 | % | 0.58 | % | 0.82 | % | ||||||||||||
Ratio of total expenses to average net assets | 1.61 | % | 2.10 | % | 2.59 | % | 2.09 | % | 2.61 | % | ||||||||||||
Ratio of net investment income to average net assets | 0.59 | % | 0.96 | % | 1.17 | % | 1.11 | % | 0.39 | % | ||||||||||||
Portfolio turnover rate(c) | 43 | % | 69 | % | 50 | % | 157 | % | 47 | % | ||||||||||||
| (a) | Calculated based on the average shares outstanding methodology. |
| (b) | Assumes investment at the NAV at the beginning of the year, reinvestment of all dividends and distributions, a complete redemption of the investment at the NAV at the end of the year and no sales or redemption charges (if any). Total returns would be reduced if a sales or redemption charge was taken into account. Returns do not reflect the impact of taxes to shareholders relating to Fund distributions or the redemption of Fund shares. |
| (c) | The Fund’s portfolio turnover rate is calculated in accordance with regulatory requirements, without regard to transactions involving short term investments. If such transactions were included, the Fund’s portfolio turnover rate may be higher. |
| The accompanying notes are an integral part of these financial statements. | 101 |
GOLDMAN SACHS FLEXIBLE CAP FUND
Financial Highlights (continued)
Selected Share Data for a Share Outstanding Throughout Each Year
| Goldman Sachs Flexible Cap Fund | ||||||||||||||||||||||
| Class R Shares | ||||||||||||||||||||||
| Year Ended August 31, | ||||||||||||||||||||||
| 2021 | 2020 | 2019 | 2018 | 2017 | ||||||||||||||||||
| Per Share Data |
| |||||||||||||||||||||
Net asset value, beginning of year | $ | 13.13 | $ | 11.40 | $ | 12.14 | $ | 13.67 | $ | 11.42 | ||||||||||||
Net investment income (loss)(a) | (0.01 | ) | 0.04 | 0.05 | 0.06 | (0.03 | ) | |||||||||||||||
Net realized and unrealized gain | 3.74 | 2.36 | 0.16 | 2.09 | 2.29 | |||||||||||||||||
Total from investment operations | 3.73 | 2.40 | 0.21 | 2.15 | 2.26 | |||||||||||||||||
Distributions to shareholders from net investment income | (0.04 | ) | (0.05 | ) | (0.08 | ) | — | — | ||||||||||||||
Distributions to shareholders from net realized gains | (0.74 | ) | (0.62 | ) | (0.87 | ) | (3.68 | ) | (0.01 | ) | ||||||||||||
Total distributions | (0.78 | ) | (0.67 | ) | (0.95 | ) | (3.68 | ) | (0.01 | ) | ||||||||||||
Net asset value, end of year | $ | 16.08 | $ | 13.13 | $ | 11.40 | $ | 12.14 | $ | 13.67 | ||||||||||||
| Total Return(b) | 29.78 | % | 21.78 | % | 2.89 | % | 18.50 | % | 19.83 | % | ||||||||||||
Net assets, end of year (in 000’s) | $ | 46 | $ | 49 | $ | 39 | $ | 49 | $ | 39 | ||||||||||||
Ratio of net expenses to average net assets | 1.21 | % | 1.25 | % | 1.22 | % | 1.20 | % | 1.45 | % | ||||||||||||
Ratio of total expenses to average net assets | 2.23 | % | 2.63 | % | 3.13 | % | 2.74 | % | 3.28 | % | ||||||||||||
Ratio of net investment income (loss) to average net assets | (0.04 | )% | 0.33 | % | 0.49 | % | 0.48 | % | (0.23 | )% | ||||||||||||
Portfolio turnover rate(c) | 43 | % | 69 | % | 50 | % | 157 | % | 47 | % | ||||||||||||
| (a) | Calculated based on the average shares outstanding methodology. |
| (b) | Assumes investment at the NAV at the beginning of the year, reinvestment of all dividends and distributions, a complete redemption of the investment at the NAV at the end of the year and no sales or redemption charges (if any). Total returns would be reduced if a sales or redemption charge was taken into account. Returns do not reflect the impact of taxes to shareholders relating to Fund distributions or the redemption of Fund shares. |
| (c) | The Fund’s portfolio turnover rate is calculated in accordance with regulatory requirements, without regard to transactions involving short term investments. If such transactions were included, the Fund’s portfolio turnover rate may be higher. |
| 102 | The accompanying notes are an integral part of these financial statements. |
GOLDMAN SACHS FLEXIBLE CAP FUND
Financial Highlights (continued)
Selected Share Data for a Share Outstanding Throughout Each Period
| Goldman Sachs Flexible Cap Fund | ||||||||||||||||||
| Class P Shares | ||||||||||||||||||
| Year Ended August 31, | Period Ended August 31, 2018(a) | |||||||||||||||||
| 2021 | 2020 | 2019 | ||||||||||||||||
| Per Share Data |
| |||||||||||||||||
Net asset value, beginning of period | $ | 14.99 | $ | 12.92 | $ | 13.61 | $ | 12.75 | ||||||||||
Net investment income(b) | 0.10 | 0.13 | 0.14 | 0.09 | ||||||||||||||
Net realized and unrealized gain | 4.28 | 2.69 | 0.19 | 0.77 | ||||||||||||||
Total from investment operations | 4.38 | 2.82 | 0.33 | 0.86 | ||||||||||||||
Distributions to shareholders from net investment income | (0.11 | ) | (0.13 | ) | (0.15 | ) | — | |||||||||||
Distributions to shareholders from net realized gains | (0.74 | ) | (0.62 | ) | (0.87 | ) | — | |||||||||||
Total distributions | (0.85 | ) | (0.75 | ) | (1.02 | ) | — | |||||||||||
Net asset value, end of period | $ | 18.52 | $ | 14.99 | $ | 12.92 | $ | 13.61 | ||||||||||
| Total Return(c) | 30.55 | % | 22.58 | % | 3.56 | % | 6.75 | % | ||||||||||
Net assets, end of period (in 000’s) | $ | 24,713 | $ | 15,263 | $ | 11,110 | $ | 12,616 | ||||||||||
Ratio of net expenses to average net assets | 0.58 | % | 0.61 | % | 0.58 | % | 0.58 | %(d) | ||||||||||
Ratio of total expenses to average net assets | 1.59 | % | 1.94 | % | 2.47 | % | 3.14 | %(d) | ||||||||||
Ratio of net investment income to average net assets | 0.59 | % | 0.96 | % | 1.13 | % | 1.79 | %(d) | ||||||||||
Portfolio turnover rate(e) | 43 | % | 69 | % | 50 | % | 157 | % | ||||||||||
| (a) | Commenced operations on April 17, 2018. |
| (b) | Calculated based on the average shares outstanding methodology. |
| (c) | Assumes investment at the NAV at the beginning of the period, reinvestment of all dividends and distributions, a complete redemption of the investment at the NAV at the end of the period and no sales or redemption charges (if any). Total returns would be reduced if a sales or redemption charge was taken into account. Returns do not reflect the impact of taxes to shareholders relating to Fund distributions or the redemption of Fund shares. Total returns for periods less than one full year are not annualized. |
| (d) | Annualized. |
| (e) | The Fund’s portfolio turnover rate is calculated in accordance with regulatory requirements, without regard to transactions involving short term investments. If such transactions were included, the Fund’s portfolio turnover rate may be higher. |
| The accompanying notes are an integral part of these financial statements. | 103 |
GOLDMAN SACHS GROWTH OPPORTUNITIES FUND
Financial Highlights (continued)
Selected Share Data for a Share Outstanding Throughout Each Year
| Goldman Sachs Growth Opportunities Fund | ||||||||||||||||||||||
| Class A Shares | ||||||||||||||||||||||
| Year Ended August 31, | ||||||||||||||||||||||
| 2021 | 2020 | 2019 | 2018 | 2017 | ||||||||||||||||||
| Per Share Data |
| |||||||||||||||||||||
Net asset value, beginning of year | $ | 17.14 | $ | 18.14 | $ | 23.42 | $ | 23.97 | $ | 21.70 | ||||||||||||
Net investment loss(a) | (0.15 | ) | (0.10 | ) | (0.09 | ) | (0.14 | ) | (0.12 | ) | ||||||||||||
Net realized and unrealized gain | 5.26 | 4.13 | 0.69 | 4.20 | 2.94 | |||||||||||||||||
Total from investment operations | 5.11 | 4.03 | 0.60 | 4.06 | 2.82 | |||||||||||||||||
Distributions to shareholders from net realized gains | (4.05 | ) | (5.03 | ) | (5.88 | ) | (4.61 | ) | (0.55 | ) | ||||||||||||
Net asset value, end of year | $ | 18.20 | $ | 17.14 | $ | 18.14 | $ | 23.42 | $ | 23.97 | ||||||||||||
| Total Return(b) | 33.85 | % | 28.84 | % | 8.00 | % | 19.37 | % | 13.40 | % | ||||||||||||
Net assets, end of year (in 000’s) | $ | 404,921 | $ | 347,644 | $ | 331,433 | $ | 421,605 | $ | 486,115 | ||||||||||||
Ratio of net expenses to average net assets | 1.24 | % | 1.25 | % | 1.27 | % | 1.30 | % | 1.30 | % | ||||||||||||
Ratio of total expenses to average net assets | 1.37 | % | 1.41 | % | 1.39 | % | 1.40 | % | 1.43 | % | ||||||||||||
Ratio of net investment loss to average net assets | (0.87 | )% | (0.64 | )% | (0.51 | )% | (0.60 | )% | (0.56 | )% | ||||||||||||
Portfolio turnover rate(c) | 57 | % | 65 | % | 69 | % | 60 | % | 61 | % | ||||||||||||
| (a) | Calculated based on the average shares outstanding methodology. |
| (b) | Assumes investment at the NAV at the beginning of the year, reinvestment of all dividends and distributions, a complete redemption of the investment at the NAV at the end of the year and no sales or redemption charges (if any). Total returns would be reduced if a sales or redemption charge was taken into account. Returns do not reflect the impact of taxes to shareholders relating to Fund distributions or the redemption of Fund shares. |
| (c) | The Fund’s portfolio turnover rate is calculated in accordance with regulatory requirements, without regard to transactions involving short term investments. If such transactions were included, the Fund’s portfolio turnover rate may be higher. |
| 104 | The accompanying notes are an integral part of these financial statements. |
GOLDMAN SACHS GROWTH OPPORTUNITIES FUND
Financial Highlights (continued)
Selected Share Data for a Share Outstanding Throughout Each Year
| Goldman Sachs Growth Opportunities Fund | ||||||||||||||||||||||
| Class C Shares | ||||||||||||||||||||||
| Year Ended August 31, | ||||||||||||||||||||||
| 2021 | 2020 | 2019 | 2018 | 2017 | ||||||||||||||||||
| Per Share Data |
| |||||||||||||||||||||
Net asset value, beginning of year | $ | 6.78 | $ | 10.16 | $ | 16.11 | $ | 17.95 | $ | 16.52 | ||||||||||||
Net investment loss(a) | (0.07 | ) | (0.09 | ) | (0.13 | ) | (0.22 | ) | (0.22 | ) | ||||||||||||
Net realized and unrealized gain | 1.63 | 1.74 | 0.06 | 2.99 | 2.20 | |||||||||||||||||
Total from investment operations | 1.56 | 1.65 | (0.07 | ) | 2.77 | 1.98 | ||||||||||||||||
Distributions to shareholders from net realized gains | (4.05 | ) | (5.03 | ) | (5.88 | ) | (4.61 | ) | (0.55 | ) | ||||||||||||
Net asset value, end of year | $ | 4.29 | $ | 6.78 | $ | 10.16 | $ | 16.11 | $ | 17.95 | ||||||||||||
| Total Return(b) | 32.89 | % | 27.86 | % | 7.24 | % | 18.52 | % | 12.49 | % | ||||||||||||
Net assets, end of year (in 000’s) | $ | 23,337 | $ | 28,894 | $ | 40,072 | $ | 77,990 | $ | 91,086 | ||||||||||||
Ratio of net expenses to average net assets | 1.99 | % | 2.00 | % | 2.02 | % | 2.05 | % | 2.05 | % | ||||||||||||
Ratio of total expenses to average net assets | 2.12 | % | 2.16 | % | 2.14 | % | 2.15 | % | 2.18 | % | ||||||||||||
Ratio of net investment loss to average net assets | (1.62 | )% | (1.38 | )% | (1.25 | )% | (1.35 | )% | (1.32 | )% | ||||||||||||
Portfolio turnover rate(c) | 57 | % | 65 | % | 69 | % | 60 | % | 61 | % | ||||||||||||
| (a) | Calculated based on the average shares outstanding methodology. |
| (b) | Assumes investment at the NAV at the beginning of the year, reinvestment of all dividends and distributions, a complete redemption of the investment at the NAV at the end of the year and no sales or redemption charges (if any). Total returns would be reduced if a sales or redemption charge was taken into account. Returns do not reflect the impact of taxes to shareholders relating to Fund distributions or the redemption of Fund shares. |
| (c) | The Fund’s portfolio turnover rate is calculated in accordance with regulatory requirements, without regard to transactions involving short term investments. If such transactions were included, the Fund’s portfolio turnover rate may be higher. |
| The accompanying notes are an integral part of these financial statements. | 105 |
GOLDMAN SACHS GROWTH OPPORTUNITIES FUND
Financial Highlights (continued)
Selected Share Data for a Share Outstanding Throughout Each Year
| Goldman Sachs Growth Opportunities Fund | ||||||||||||||||||||||
| Institutional Shares | ||||||||||||||||||||||
| Year Ended August 31, | ||||||||||||||||||||||
| 2021 | 2020 | 2019 | 2018 | 2017 | ||||||||||||||||||
| Per Share Data |
| |||||||||||||||||||||
Net asset value, beginning of year | $ | 23.41 | $ | 22.93 | $ | 27.78 | $ | 27.54 | $ | 24.76 | ||||||||||||
Net investment loss(a) | (0.13 | ) | (0.06 | ) | (0.04 | ) | (0.07 | ) | (0.05 | ) | ||||||||||||
Net realized and unrealized gain | 7.45 | 5.57 | 1.07 | 4.92 | 3.38 | |||||||||||||||||
Total from investment operations | 7.32 | 5.51 | 1.03 | 4.85 | 3.33 | |||||||||||||||||
Distributions to shareholders from net realized gains | (4.05 | ) | (5.03 | ) | (5.88 | ) | (4.61 | ) | (0.55 | ) | ||||||||||||
Net asset value, end of year | $ | 26.68 | $ | 23.41 | $ | 22.93 | $ | 27.78 | $ | 27.54 | ||||||||||||
| Total Return(b) | 34.27 | % | 29.33 | % | 8.34 | % | 19.78 | % | 13.81 | % | ||||||||||||
Net assets, end of year (in 000’s) | $ | 478,127 | $ | 442,693 | $ | 491,659 | $ | 1,178,239 | $ | 1,670,808 | ||||||||||||
Ratio of net expenses to average net assets | 0.90 | % | 0.91 | % | 0.93 | % | 0.96 | % | 0.95 | % | ||||||||||||
Ratio of total expenses to average net assets | 1.00 | % | 1.03 | % | 1.00 | % | 1.01 | % | 1.03 | % | ||||||||||||
Ratio of net investment loss to average net assets | (0.53 | )% | (0.29 | )% | (0.17 | )% | (0.26 | )% | (0.21 | )% | ||||||||||||
Portfolio turnover rate(c) | 57 | % | 65 | % | 69 | % | 60 | % | 61 | % | ||||||||||||
| (a) | Calculated based on the average shares outstanding methodology. |
| (b) | Assumes investment at the NAV at the beginning of the year, reinvestment of all dividends and distributions, a complete redemption of the investment at the NAV at the end of the year and no sales or redemption charges (if any). Total returns would be reduced if a sales or redemption charge was taken into account. Returns do not reflect the impact of taxes to shareholders relating to Fund distributions or the redemption of Fund shares. |
| (c) | The Fund’s portfolio turnover rate is calculated in accordance with regulatory requirements, without regard to transactions involving short term investments. If such transactions were included, the Fund’s portfolio turnover rate may be higher. |
| 106 | The accompanying notes are an integral part of these financial statements. |
GOLDMAN SACHS GROWTH OPPORTUNITIES FUND
Financial Highlights (continued)
Selected Share Data for a Share Outstanding Throughout Each Year
| Goldman Sachs Growth Opportunities Fund | ||||||||||||||||||||||
| Service Shares | ||||||||||||||||||||||
| Year Ended August 31, | ||||||||||||||||||||||
| 2021 | 2020 | 2019 | 2018 | 2017 | ||||||||||||||||||
| Per Share Data |
| |||||||||||||||||||||
Net asset value, beginning of year | $ | 15.50 | $ | 16.89 | $ | 22.29 | $ | 23.05 | $ | 20.92 | ||||||||||||
Net investment loss(a) | (0.16 | ) | (0.11 | ) | (0.11 | ) | (0.17 | ) | (0.15 | ) | ||||||||||||
Net realized and unrealized gain | 4.68 | 3.75 | 0.59 | 4.02 | 2.83 | |||||||||||||||||
Total from investment operations | 4.52 | 3.64 | 0.48 | 3.85 | 2.68 | |||||||||||||||||
Distributions to shareholders from net realized gains | (4.05 | ) | (5.03 | ) | (5.88 | ) | (4.61 | ) | (0.55 | ) | ||||||||||||
Net asset value, end of year | $ | 15.97 | $ | 15.50 | $ | 16.89 | $ | 22.29 | $ | 23.05 | ||||||||||||
| Total Return(b) | 33.59 | % | 28.64 | % | 7.82 | % | 19.21 | % | 13.22 | % | ||||||||||||
Net assets, end of year (in 000’s) | $ | 33,114 | $ | 27,723 | $ | 27,094 | $ | 34,211 | $ | 33,159 | ||||||||||||
Ratio of net expenses to average net assets | 1.40 | % | 1.41 | % | 1.43 | % | 1.46 | % | 1.45 | % | ||||||||||||
Ratio of total expenses to average net assets | 1.50 | % | 1.53 | % | 1.51 | % | 1.51 | % | 1.53 | % | ||||||||||||
Ratio of net investment loss to average net assets | (1.03 | )% | (0.79 | )% | (0.67 | )% | (0.76 | )% | (0.71 | )% | ||||||||||||
Portfolio turnover rate(c) | 57 | % | 65 | % | 69 | % | 60 | % | 61 | % | ||||||||||||
| (a) | Calculated based on the average shares outstanding methodology. |
| (b) | Assumes investment at the NAV at the beginning of the year, reinvestment of all dividends and distributions, a complete redemption of the investment at the NAV at the end of the year and no sales or redemption charges (if any). Total returns would be reduced if a sales or redemption charge was taken into account. Returns do not reflect the impact of taxes to shareholders relating to Fund distributions or the redemption of Fund shares. |
| (c) | The Fund’s portfolio turnover rate is calculated in accordance with regulatory requirements, without regard to transactions involving short term investments. If such transactions were included, the Fund’s portfolio turnover rate may be higher. |
| The accompanying notes are an integral part of these financial statements. | 107 |
GOLDMAN SACHS GROWTH OPPORTUNITIES FUND
Financial Highlights (continued)
Selected Share Data for a Share Outstanding Throughout Each Year
| Goldman Sachs Growth Opportunities Fund | ||||||||||||||||||||||
| Investor Shares | ||||||||||||||||||||||
| Year Ended August 31, | ||||||||||||||||||||||
| 2021 | 2020 | 2019 | 2018 | 2017 | ||||||||||||||||||
| Per Share Data |
| |||||||||||||||||||||
Net asset value, beginning of year | $ | 18.90 | $ | 19.47 | $ | 24.59 | $ | 24.90 | $ | 22.46 | ||||||||||||
Net investment loss(a) | (0.12 | ) | (0.07 | ) | (0.05 | ) | (0.08 | ) | (0.07 | ) | ||||||||||||
Net realized and unrealized gain | 5.88 | 4.53 | 0.81 | 4.38 | 3.06 | |||||||||||||||||
Total from investment operations | 5.76 | 4.46 | 0.76 | 4.30 | 2.99 | |||||||||||||||||
Distributions to shareholders from net realized gains | (4.05 | ) | (5.03 | ) | (5.88 | ) | (4.61 | ) | (0.55 | ) | ||||||||||||
Net asset value, end of year | $ | 20.61 | $ | 18.90 | $ | 19.47 | $ | 24.59 | $ | 24.90 | ||||||||||||
| Total Return(b) | 34.19 | % | 29.15 | % | 8.33 | % | 19.64 | % | 13.71 | % | ||||||||||||
Net assets, end of year (in 000’s) | $ | 105,878 | $ | 81,928 | $ | 77,012 | $ | 93,889 | $ | 132,003 | ||||||||||||
Ratio of net expenses to average net assets | 0.99 | % | 1.00 | % | 1.01 | % | 1.05 | % | 1.05 | % | ||||||||||||
Ratio of total expenses to average net assets | 1.12 | % | 1.16 | % | 1.15 | % | 1.15 | % | 1.18 | % | ||||||||||||
Ratio of net investment loss to average net assets | (0.62 | )% | (0.39 | )% | (0.25 | )% | (0.35 | )% | (0.31 | )% | ||||||||||||
Portfolio turnover rate(c) | 57 | % | 65 | % | 69 | % | 60 | % | 61 | % | ||||||||||||
| (a) | Calculated based on the average shares outstanding methodology. |
| (b) | Assumes investment at the NAV at the beginning of the year, reinvestment of all dividends and distributions, a complete redemption of the investment at the NAV at the end of the year and no sales or redemption charges (if any). Total returns would be reduced if a sales or redemption charge was taken into account. Returns do not reflect the impact of taxes to shareholders relating to Fund distributions or the redemption of Fund shares. |
| (c) | The Fund’s portfolio turnover rate is calculated in accordance with regulatory requirements, without regard to transactions involving short term investments. If such transactions were included, the Fund’s portfolio turnover rate may be higher. |
| 108 | The accompanying notes are an integral part of these financial statements. |
GOLDMAN SACHS GROWTH OPPORTUNITIES FUND
Financial Highlights (continued)
Selected Share Data for a Share Outstanding Throughout Each Year
| Goldman Sachs Growth Opportunities Fund | ||||||||||||||||||||||
| Class R6 Shares | ||||||||||||||||||||||
| Year Ended August 31, | ||||||||||||||||||||||
| 2021 | 2020 | 2019 | 2018 | 2017 | ||||||||||||||||||
| Per Share Data |
| |||||||||||||||||||||
Net asset value, beginning of year | $ | 23.44 | $ | 22.95 | $ | 27.80 | $ | 27.55 | $ | 24.77 | ||||||||||||
Net investment loss(a) | (0.13 | ) | (0.06 | ) | (0.04 | ) | (0.07 | ) | (0.04 | ) | ||||||||||||
Net realized and unrealized gain | 7.46 | 5.58 | 1.07 | 4.93 | 3.37 | |||||||||||||||||
Total from investment operations | 7.33 | 5.52 | 1.03 | 4.86 | 3.33 | |||||||||||||||||
Distributions to shareholders from net realized gains | (4.05 | ) | (5.03 | ) | (5.88 | ) | (4.61 | ) | (0.55 | ) | ||||||||||||
Net asset value, end of year | $ | 26.72 | $ | 23.44 | $ | 22.95 | $ | 27.80 | $ | 27.55 | ||||||||||||
| Total Return(b) | 34.27 | % | 29.35 | % | 8.35 | % | 19.80 | % | 13.80 | % | ||||||||||||
Net assets, end of year (in 000’s) | $ | 283,233 | $ | 211,480 | $ | 181,988 | $ | 231,077 | $ | 118,634 | ||||||||||||
Ratio of net expenses to average net assets | 0.89 | % | 0.90 | % | 0.92 | % | 0.95 | % | 0.93 | % | ||||||||||||
Ratio of total expenses to average net assets | 0.99 | % | 1.02 | % | 1.00 | % | 0.99 | % | 1.01 | % | ||||||||||||
Ratio of net investment loss to average net assets | (0.53 | )% | (0.28 | )% | (0.16 | )% | (0.25 | )% | (0.18 | )% | ||||||||||||
Portfolio turnover rate(c) | 57 | % | 65 | % | 69 | % | 60 | % | 61 | % | ||||||||||||
| (a) | Calculated based on the average shares outstanding methodology. |
| (b) | Assumes investment at the NAV at the beginning of the year, reinvestment of all dividends and distributions, a complete redemption of the investment at the NAV at the end of the year and no sales or redemption charges (if any). Total returns would be reduced if a sales or redemption charge was taken into account. Returns do not reflect the impact of taxes to shareholders relating to Fund distributions or the redemption of Fund shares. |
| (c) | The Fund’s portfolio turnover rate is calculated in accordance with regulatory requirements, without regard to transactions involving short term investments. If such transactions were included, the Fund’s portfolio turnover rate may be higher. |
| The accompanying notes are an integral part of these financial statements. | 109 |
GOLDMAN SACHS GROWTH OPPORTUNITIES FUND
Financial Highlights (continued)
Selected Share Data for a Share Outstanding Throughout Each Year
| Goldman Sachs Growth Opportunities Fund | ||||||||||||||||||||||
| Class R Shares | ||||||||||||||||||||||
| Year Ended August 31, | ||||||||||||||||||||||
| 2021 | 2020 | 2019 | 2018 | 2017 | ||||||||||||||||||
| Per Share Data |
| |||||||||||||||||||||
Net asset value, beginning of year | $ | 15.53 | $ | 16.92 | $ | 22.33 | $ | 23.11 | $ | 20.99 | ||||||||||||
Net investment loss(a) | (0.17 | ) | (0.12 | ) | (0.13 | ) | (0.19 | ) | (0.17 | ) | ||||||||||||
Net realized and unrealized gain | 4.68 | 3.76 | 0.60 | 4.02 | 2.84 | |||||||||||||||||
Total from investment operations | 4.51 | 3.64 | 0.47 | 3.83 | 2.67 | |||||||||||||||||
Distributions to shareholders from net realized gains | (4.05 | ) | (5.03 | ) | (5.88 | ) | (4.61 | ) | (0.55 | ) | ||||||||||||
Net asset value, end of year | $ | 15.99 | $ | 15.53 | $ | 16.92 | $ | 22.33 | $ | 23.11 | ||||||||||||
| Total Return(b) | 33.44 | % | 28.58 | % | 7.75 | % | 19.06 | % | 13.13 | % | ||||||||||||
Net assets, end of year (in 000’s) | $ | 54,987 | $ | 48,780 | $ | 45,005 | $ | 54,359 | $ | 59,225 | ||||||||||||
Ratio of net expenses to average net assets | 1.49 | % | 1.50 | % | 1.51 | % | 1.55 | % | 1.55 | % | ||||||||||||
Ratio of total expenses to average net assets | 1.62 | % | 1.66 | % | 1.64 | % | 1.65 | % | 1.68 | % | ||||||||||||
Ratio of net investment loss to average net assets | (1.12 | )% | (0.89 | )% | (0.76 | )% | (0.85 | )% | (0.81 | )% | ||||||||||||
Portfolio turnover rate(c) | 57 | % | 65 | % | 69 | % | 60 | % | 61 | % | ||||||||||||
| (a) | Calculated based on the average shares outstanding methodology. |
| (b) | Assumes investment at the NAV at the beginning of the year, reinvestment of all dividends and distributions, a complete redemption of the investment at the NAV at the end of the year and no sales or redemption charges (if any). Total returns would be reduced if a sales or redemption charge was taken into account. Returns do not reflect the impact of taxes to shareholders relating to Fund distributions or the redemption of Fund shares. |
| (c) | The Fund’s portfolio turnover rate is calculated in accordance with regulatory requirements, without regard to transactions involving short term investments. If such transactions were included, the Fund’s portfolio turnover rate may be higher. |
| 110 | The accompanying notes are an integral part of these financial statements. |
GOLDMAN SACHS GROWTH OPPORTUNITIES FUND
Financial Highlights (continued)
Selected Share Data for a Share Outstanding Throughout Each Period
| Goldman Sachs Growth Opportunities Fund | ||||||||||||||||||
| Class P Shares | ||||||||||||||||||
| Year Ended August 31, | Period Ended August 31, 2018(a) | |||||||||||||||||
| 2021 | 2020 | 2019 | ||||||||||||||||
| Per Share Data |
| |||||||||||||||||
Net asset value, beginning of period | $ | 23.45 | $ | 22.96 | $ | 27.80 | $ | 26.35 | ||||||||||
Net investment loss(b) | (0.13 | ) | (0.06 | ) | (0.04 | ) | (0.04 | ) | ||||||||||
Net realized and unrealized gain | 7.47 | 5.58 | 1.08 | 1.49 | ||||||||||||||
Total from investment operations | 7.34 | 5.52 | 1.04 | 1.45 | ||||||||||||||
Distributions to shareholders from net realized gains | (4.05 | ) | (5.03 | ) | (5.88 | ) | — | |||||||||||
Net asset value, end of period | $ | 26.74 | $ | 23.45 | $ | 22.96 | $ | 27.80 | ||||||||||
| Total Return(c) | 34.26 | % | 29.34 | % | 8.38 | % | 5.50 | % | ||||||||||
Net assets, end of period (in 000’s) | $ | 90,649 | $ | 69,989 | $ | 69,893 | $ | 94,794 | ||||||||||
Ratio of net expenses to average net assets | 0.89 | % | 0.90 | % | 0.92 | % | 0.95 | %(d) | ||||||||||
Ratio of total expenses to average net assets | 0.99 | % | 1.02 | % | 1.00 | % | 1.00 | %(d) | ||||||||||
Ratio of net investment loss to average net assets | (0.53 | )% | (0.28 | )% | (0.16 | )% | (0.36 | )%(d) | ||||||||||
Portfolio turnover rate(e) | 57 | % | 65 | % | 69 | % | 60 | % | ||||||||||
| (a) | Commenced operations on April 17, 2018. |
| (b) | Calculated based on the average shares outstanding methodology. |
| (c) | Assumes investment at the NAV at the beginning of the period, reinvestment of all dividends and distributions, a complete redemption of the investment at the NAV at the end of the period and no sales or redemption charges (if any). Total returns would be reduced if a sales or redemption charge was taken into account. Returns do not reflect the impact of taxes to shareholders relating to Fund distributions or the redemption of Fund shares. Total returns for periods less than one full year are not annualized. |
| (d) | Annualized. |
| (e) | The Fund’s portfolio turnover rate is calculated in accordance with regulatory requirements, without regard to transactions involving short term investments. If such transactions were included, the Fund’s portfolio turnover rate may be higher. |
| The accompanying notes are an integral part of these financial statements. | 111 |
GOLDMAN SACHS SMALL CAP GROWTH FUND
Financial Highlights (continued)
Selected Share Data for a Share Outstanding Throughout Each Period
| Goldman Sachs Small Cap Growth Fund | ||||||||||
| Class A Shares | ||||||||||
| Year Ended August 31, 2021 | Period Ended August 31, 2020(a) | |||||||||
| Per Share Data |
| |||||||||
Net asset value, beginning of period | $ | 12.81 | $ | 10.00 | ||||||
Net investment loss(b) | (0.16 | )(c) | (0.09 | ) | ||||||
Net realized and unrealized gain | | 5.36 | | 2.92 | ||||||
Total from investment operations | 5.20 | 2.83 | ||||||||
Distributions to shareholders from net investment income | (0.02 | ) | (0.02 | ) | ||||||
Distributions to shareholders from net realized gains | (1.10 | ) | — | |||||||
Total distributions | (1.12 | ) | (0.02 | ) | ||||||
Net asset value, end of period | $ | 16.89 | $ | 12.81 | ||||||
| Total Return(d) | 41.87 | % | 28.30 | % | ||||||
Net assets, end of period (in 000’s) | $ | 669 | $ | 175 | ||||||
Ratio of net expenses to average net assets | 1.28 | % | 1.30 | %(e) | ||||||
Ratio of total expenses to average net assets | 3.50 | % | 8.30 | %(e) | ||||||
Ratio of net investment loss to average net assets | (1.01 | )% | (0.94 | )%(e) | ||||||
Portfolio turnover rate(f) | 101 | % | 70 | % | ||||||
| (a) | Commenced operations on October 31, 2019. |
| (b) | Calculated based on the average shares outstanding methodology. |
| (c) | Reflects income recognized from special dividends which amounted to $0.01 per share and 0.08% of average net assets. |
| (d) | Assumes investment at the NAV at the beginning of the period, reinvestment of all dividends and distributions, a complete redemption of the investment at the NAV at the end of the period and no sales or redemption charges (if any). Total returns would be reduced if a sales or redemption charge was taken into account. Returns do not reflect the impact of taxes to shareholders relating to Fund distributions or the redemption of Fund shares. Total returns for periods less than one full year are not annualized. |
| (e) | Annualized. |
| (f) | The Fund’s portfolio turnover rate is calculated in accordance with regulatory requirements, without regard to transactions involving short term investments. If such transactions were included, the Fund’s portfolio turnover rate may be higher. |
| 112 | The accompanying notes are an integral part of these financial statements. |
GOLDMAN SACHS SMALL CAP GROWTH FUND
Financial Highlights (continued)
Selected Share Data for a Share Outstanding Throughout Each Period
| Goldman Sachs Small Cap Growth Fund | ||||||||||
| Class C Shares | ||||||||||
| Year Ended August 31, 2021 | Period Ended August 31, 2020(a) | |||||||||
| Per Share Data |
| |||||||||
Net asset value, beginning of period | $ | 12.74 | $ | 10.00 | ||||||
Net investment loss(b) | (0.27 | )(c) | (0.15 | ) | ||||||
Net realized and unrealized gain | 5.32 | 2.89 | ||||||||
Total from investment operations | 5.05 | 2.74 | ||||||||
Distributions to shareholders from net investment income | — | — | (d) | |||||||
Distributions to shareholders from net realized gains | (1.10 | ) | — | |||||||
Total distributions | (1.10 | ) | — | (d) | ||||||
Net asset value, end of period | $ | 16.69 | $ | 12.74 | ||||||
| Total Return(e) | 40.86 | % | 27.44 | % | ||||||
Net assets, end of period (in 000’s) | $ | 119 | $ | 91 | ||||||
Ratio of net expenses to average net assets | 2.03 | % | 2.06 | %(f) | ||||||
Ratio of total expenses to average net assets | 4.09 | % | 9.80 | %(f) | ||||||
Ratio of net investment loss to average net assets | (1.78 | )% | (1.70 | )%(f) | ||||||
Portfolio turnover rate(g) | 101 | % | 70 | % | ||||||
| (a) | Commenced operations on October 31, 2019. |
| (b) | Calculated based on the average shares outstanding methodology. |
| (c) | Reflects income recognized from special dividends which amounted to $0.01 per share and 0.08% of average net assets. |
| (d) | Amount is less than $0.005 per share. |
| (e) | Assumes investment at the NAV at the beginning of the period, reinvestment of all dividends and distributions, a complete redemption of the investment at the NAV at the end of the period and no sales or redemption charges (if any). Total returns would be reduced if a sales or redemption charge was taken into account. Returns do not reflect the impact of taxes to shareholders relating to Fund distributions or the redemption of Fund shares. Total returns for periods less than one full year are not annualized. |
| (f) | Annualized. |
| (g) | The Fund’s portfolio turnover rate is calculated in accordance with regulatory requirements, without regard to transactions involving short term investments. If such transactions were included, the Fund’s portfolio turnover rate may be higher. |
| The accompanying notes are an integral part of these financial statements. | 113 |
GOLDMAN SACHS SMALL CAP GROWTH FUND
Financial Highlights (continued)
Selected Share Data for a Share Outstanding Throughout Each Period
| Goldman Sachs Small Cap Growth Fund | ||||||||||
| Institutional Shares | ||||||||||
| Year Ended August 31, 2021 | Period Ended August 31, 2020(a) | |||||||||
| Per Share Data |
| |||||||||
Net asset value, beginning of period | $ | 12.84 | $ | 10.00 | ||||||
Net investment loss(b) | (0.10 | )(c) | (0.05 | ) | ||||||
Net realized and unrealized gain | 5.37 | 2.91 | ||||||||
Total from investment operations | 5.27 | 2.86 | ||||||||
Distributions to shareholders from net investment income | (0.03 | ) | (0.02 | ) | ||||||
Distributions to shareholders from net realized gains | (1.10 | ) | — | |||||||
Total distributions | (1.13 | ) | (0.02 | ) | ||||||
Net asset value, end of period | $ | 16.98 | $ | 12.84 | ||||||
| Total Return(d) | 42.36 | % | 28.68 | % | ||||||
Net assets, end of period (in 000’s) | $ | 14,313 | $ | 10,516 | ||||||
Ratio of net expenses to average net assets | 0.91 | % | 0.93 | %(e) | ||||||
Ratio of total expenses to average net assets | 2.93 | % | 8.24 | %(e) | ||||||
Ratio of net investment loss to average net assets | (0.66 | )% | (0.58 | )%(e) | ||||||
Portfolio turnover rate(f) | 101 | % | 70 | % | ||||||
| (a) | Commenced operations on October 31, 2019. |
| (b) | Calculated based on the average shares outstanding methodology. |
| (c) | Reflects income recognized from special dividends which amounted to $0.01 per share and 0.08% of average net assets. |
| (d) | Assumes investment at the NAV at the beginning of the period, reinvestment of all dividends and distributions, a complete redemption of the investment at the NAV at the end of the period and no sales or redemption charges (if any). Total returns would be reduced if a sales or redemption charge was taken into account. Returns do not reflect the impact of taxes to shareholders relating to Fund distributions or the redemption of Fund shares. Total returns for periods less than one full year are not annualized. |
| (e) | Annualized. |
| (f) | The Fund’s portfolio turnover rate is calculated in accordance with regulatory requirements, without regard to transactions involving short term investments. If such transactions were included, the Fund’s portfolio turnover rate may be higher. |
| 114 | The accompanying notes are an integral part of these financial statements. |
GOLDMAN SACHS SMALL CAP GROWTH FUND
Financial Highlights (continued)
Selected Share Data for a Share Outstanding Throughout Each Period
| Goldman Sachs Small Cap Growth Fund | ||||||||||
| Investor Shares | ||||||||||
| Year Ended August 31, 2021 | Period Ended August 31, 2020(a) | |||||||||
| Per Share Data |
| |||||||||
Net asset value, beginning of period | $ | 12.83 | $ | 10.00 | ||||||
Net investment loss(b) | (0.12 | )(c) | (0.06 | ) | ||||||
Net realized and unrealized gain | 5.37 | 2.91 | ||||||||
Total from investment operations | 5.25 | 2.85 | ||||||||
Distributions to shareholders from net investment income | (0.02 | ) | (0.02 | ) | ||||||
Distributions to shareholders from net realized gains | (1.10 | ) | — | |||||||
Total distributions | (1.12 | ) | (0.02 | ) | ||||||
Net asset value, end of period | $ | 16.96 | $ | 12.83 | ||||||
| Total Return(d) | 42.21 | % | 28.55 | % | ||||||
Net assets, end of period (in 000’s) | $ | 91 | $ | 64 | ||||||
Ratio of net expenses to average net assets | 1.03 | % | 1.06 | %(e) | ||||||
Ratio of total expenses to average net assets | 3.13 | % | 9.22 | %(e) | ||||||
Ratio of net investment loss to average net assets | (0.78 | )% | (0.69 | )%(e) | ||||||
Portfolio turnover rate(f) | 101 | % | 70 | % | ||||||
| (a) | Commenced operations on October 31, 2019. |
| (b) | Calculated based on the average shares outstanding methodology. |
| (c) | Reflects income recognized from special dividends which amounted to $0.01 per share and 0.08% of average net assets. |
| (d) | Assumes investment at the NAV at the beginning of the period, reinvestment of all dividends and distributions, a complete redemption of the investment at the NAV at the end of the period and no sales or redemption charges (if any). Total returns would be reduced if a sales or redemption charge was taken into account. Returns do not reflect the impact of taxes to shareholders relating to Fund distributions or the redemption of Fund shares. Total returns for periods less than one full year are not annualized. |
| (e) | Annualized. |
| (f) | The Fund’s portfolio turnover rate is calculated in accordance with regulatory requirements, without regard to transactions involving short term investments. If such transactions were included, the Fund’s portfolio turnover rate may be higher. |
| The accompanying notes are an integral part of these financial statements. | 115 |
GOLDMAN SACHS SMALL CAP GROWTH FUND
Financial Highlights (continued)
Selected Share Data for a Share Outstanding Throughout Each Period
| Goldman Sachs Small Cap Growth Fund | ||||||||||
| Class R6 Shares | ||||||||||
| Year Ended August 31, 2021 | Period Ended August 31, 2020(a) | |||||||||
| Per Share Data |
| |||||||||
Net asset value, beginning of period | $ | 12.84 | $ | 10.00 | ||||||
Net investment loss(b) | (0.10 | )(c) | (0.05 | ) | ||||||
Net realized and unrealized gain | 5.38 | 2.91 | ||||||||
Total from investment operations | 5.28 | 2.86 | ||||||||
Distributions to shareholders from net investment income | (0.03 | ) | (0.02 | ) | ||||||
Distributions to shareholders from net realized gains | (1.10 | ) | — | |||||||
Total distributions | (1.13 | ) | (0.02 | ) | ||||||
Net asset value, end of period | $ | 16.99 | $ | 12.84 | ||||||
| Total Return(d) | 42.44 | % | 28.68 | % | ||||||
Net assets, end of period (in 000’s) | $ | 92 | $ | 64 | ||||||
Ratio of net expenses to average net assets | 0.90 | % | 0.93 | %(e) | ||||||
Ratio of total expenses to average net assets | 3.00 | % | 9.08 | %(e) | ||||||
Ratio of net investment loss to average net assets | (0.65 | )% | (0.55 | )%(e) | ||||||
Portfolio turnover rate(f) | 101 | % | 70 | % | ||||||
| (a) | Commenced operations on October 31, 2019. |
| (b) | Calculated based on the average shares outstanding methodology. |
| (c) | Reflects income recognized from special dividends which amounted to $0.01 per share and 0.08% of average net assets. |
| (d) | Assumes investment at the NAV at the beginning of the period, reinvestment of all dividends and distributions, a complete redemption of the investment at the NAV at the end of the period and no sales or redemption charges (if any). Total returns would be reduced if a sales or redemption charge was taken into account. Returns do not reflect the impact of taxes to shareholders relating to Fund distributions or the redemption of Fund shares. Total returns for periods less than one full year are not annualized. |
| (e) | Annualized. |
| (f) | The Fund’s portfolio turnover rate is calculated in accordance with regulatory requirements, without regard to transactions involving short term investments. If such transactions were included, the Fund’s portfolio turnover rate may be higher. |
| 116 | The accompanying notes are an integral part of these financial statements. |
GOLDMAN SACHS SMALL CAP GROWTH FUND
Financial Highlights (continued)
Selected Share Data for a Share Outstanding Throughout Each Period
| Goldman Sachs Small Cap Growth Fund | ||||||||||
| Class R Shares | ||||||||||
| Year Ended August 31, 2021 | Period Ended August 31, 2020(a) | |||||||||
| Per Share Data |
| |||||||||
Net asset value, beginning of period | $ | 12.79 | $ | 10.00 | ||||||
Net investment loss(b) | (0.20 | )(c) | (0.11 | ) | ||||||
Net realized and unrealized gain | 5.35 | 2.91 | ||||||||
Total from investment operations | 5.15 | 2.80 | ||||||||
Distributions to shareholders from net investment income | — | (0.01 | ) | |||||||
Distributions to shareholders from net realized gains | (1.10 | ) | — | |||||||
Total distributions | (1.10 | ) | (0.01 | ) | ||||||
Net asset value, end of period | $ | 16.84 | $ | 12.79 | ||||||
| Total Return(d) | 41.51 | % | 28.05 | % | ||||||
Net assets, end of period (in 000’s) | $ | 91 | $ | 64 | ||||||
Ratio of net expenses to average net assets | 1.53 | % | 1.56 | %(e) | ||||||
Ratio of total expenses to average net assets | 3.62 | % | 9.73 | %(e) | ||||||
Ratio of net investment loss to average net assets | (1.28 | )% | (1.19 | )%(e) | ||||||
Portfolio turnover rate(f) | 101 | % | 70 | % | ||||||
| (a) | Commenced operations on October 31, 2019. |
| (b) | Calculated based on the average shares outstanding methodology. |
| (c) | Reflects income recognized from special dividends which amounted to $0.01 per share and 0.08% of average net assets. |
| (d) | Assumes investment at the NAV at the beginning of the period, reinvestment of all dividends and distributions, a complete redemption of the investment at the NAV at the end of the period and no sales or redemption charges (if any). Total returns would be reduced if a sales or redemption charge was taken into account. Returns do not reflect the impact of taxes to shareholders relating to Fund distributions or the redemption of Fund shares. Total returns for periods less than one full year are not annualized. |
| (e) | Annualized. |
| (f) | The Fund’s portfolio turnover rate is calculated in accordance with regulatory requirements, without regard to transactions involving short term investments. If such transactions were included, the Fund’s portfolio turnover rate may be higher. |
| The accompanying notes are an integral part of these financial statements. | 117 |
GOLDMAN SACHS SMALL CAP GROWTH FUND
Financial Highlights (continued)
Selected Share Data for a Share Outstanding Throughout Each Period
| Goldman Sachs Small Cap Growth Fund | ||||||||||
| Class P Shares | ||||||||||
| Year Ended August 31, 2021 | Period Ended August 31, 2020(a) | |||||||||
| Per Share Data |
| |||||||||
Net asset value, beginning of period | $ | 12.84 | $ | 10.00 | ||||||
Net investment loss(b) | (0.10 | )(c) | (0.05 | ) | ||||||
Net realized and unrealized gain | 5.37 | 2.91 | ||||||||
Total from investment operations | 5.27 | 2.86 | ||||||||
Distributions to shareholders from net investment income | (0.03 | ) | (0.02 | ) | ||||||
Distributions to shareholders from net realized gains | (1.10 | ) | — | |||||||
Total distributions | (1.13 | ) | (0.02 | ) | ||||||
Net asset value, end of period | $ | 16.98 | $ | 12.84 | ||||||
| Total Return(d) | 42.38 | % | 28.68 | % | ||||||
Net assets, end of period (in 000’s) | $ | 5,349 | $ | 2,831 | ||||||
Ratio of net expenses to average net assets | 0.90 | % | 0.90 | %(e) | ||||||
Ratio of total expenses to average net assets | 3.00 | % | 6.73 | %(e) | ||||||
Ratio of net investment loss to average net assets | (0.64 | )% | (0.55 | )%(e) | ||||||
Portfolio turnover rate(f) | 101 | % | 70 | % | ||||||
| (a) | Commenced operations on October 31, 2019. |
| (b) | Calculated based on the average shares outstanding methodology. |
| (c) | Reflects income recognized from special dividends which amounted to $0.01 per share and 0.08% of average net assets. |
| (d) | Assumes investment at the NAV at the beginning of the period, reinvestment of all dividends and distributions, a complete redemption of the investment at the NAV at the end of the period and no sales or redemption charges (if any). Total returns would be reduced if a sales or redemption charge was taken into account. Returns do not reflect the impact of taxes to shareholders relating to Fund distributions or the redemption of Fund shares. Total returns for periods less than one full year are not annualized. |
| (e) | Annualized. |
| (f) | The Fund’s portfolio turnover rate is calculated in accordance with regulatory requirements, without regard to transactions involving short term investments. If such transactions were included, the Fund’s portfolio turnover rate may be higher. |
| 118 | The accompanying notes are an integral part of these financial statements. |
GOLDMAN SACHS SMALL/MID CAP GROWTH FUND
Financial Highlights (continued)
Selected Share Data for a Share Outstanding Throughout Each Year
| Goldman Sachs Small/Mid Cap Growth Fund | ||||||||||||||||||||||
| Class A Shares | ||||||||||||||||||||||
| Year Ended August 31, | ||||||||||||||||||||||
| 2021 | 2020 | 2019 | 2018 | 2017 | ||||||||||||||||||
| Per Share Data |
| |||||||||||||||||||||
Net asset value, beginning of year | $ | 23.56 | $ | 20.53 | $ | 23.94 | $ | 21.81 | $ | 19.85 | ||||||||||||
Net investment loss(a) | (0.25 | ) | (0.15 | ) | (0.12 | )(b) | (0.14 | )(c) | (0.12 | )(d) | ||||||||||||
Net realized and unrealized gain | 8.84 | 6.20 | 0.36 | 5.15 | 2.77 | |||||||||||||||||
Total from investment operations | 8.59 | 6.05 | 0.24 | 5.01 | 2.65 | |||||||||||||||||
Distributions to shareholders from net realized gains | (3.84 | ) | (3.02 | ) | (3.65 | ) | (2.88 | ) | (0.69 | ) | ||||||||||||
Net asset value, end of year | $ | 28.31 | $ | 23.56 | $ | 20.53 | $ | 23.94 | $ | 21.81 | ||||||||||||
| Total Return(e) | 39.05 | % | 33.09 | % | 4.33 | % | 25.22 | % | 13.78 | % | ||||||||||||
Net assets, end of year (in 000’s) | $ | 470,941 | $ | 309,715 | $ | 295,072 | $ | 346,289 | $ | 351,253 | ||||||||||||
Ratio of net expenses to average net assets | 1.21 | % | 1.27 | % | 1.26 | % | 1.28 | % | 1.29 | % | ||||||||||||
Ratio of total expenses to average net assets | 1.26 | % | 1.32 | % | 1.32 | % | 1.35 | % | 1.46 | % | ||||||||||||
Ratio of net investment loss to average net assets | (0.94 | )% | (0.74 | )% | (0.59 | )%(b) | (0.64 | )%(c) | (0.62 | )%(d) | ||||||||||||
Portfolio turnover rate(f) | 60 | % | 76 | % | 76 | % | 59 | % | 60 | % | ||||||||||||
| (a) | Calculated based on the average shares outstanding methodology. |
| (b) | Reflects income recognized from special dividends which amounted to $0.02 per share and 0.08% of average net assets. |
| (c) | Reflects income recognized from special dividends which amounted to $0.03 per share and 0.11% of average net assets. |
| (d) | Reflects income recognized from special dividends which amounted to $0.03 per share and 0.14% of average net assets. |
| (e) | Assumes investment at the NAV at the beginning of the year, reinvestment of all dividends and distributions, a complete redemption of the investment at the NAV at the end of the year and no sales or redemption charges (if any). Total returns would be reduced if a sales or redemption charge was taken into account. Returns do not reflect the impact of taxes to shareholders relating to Fund distributions or the redemption of Fund shares. |
| (f) | The Fund’s portfolio turnover rate is calculated in accordance with regulatory requirements, without regard to transactions involving short term investments. If such transactions were included, the Fund’s portfolio turnover rate may be higher. |
| The accompanying notes are an integral part of these financial statements. | 119 |
GOLDMAN SACHS SMALL/MID CAP GROWTH FUND
Financial Highlights (continued)
Selected Share Data for a Share Outstanding Throughout Each Year
| Goldman Sachs Small/Mid Cap Growth Fund | ||||||||||||||||||||||
| Class C Shares | ||||||||||||||||||||||
| Year Ended August 31, | ||||||||||||||||||||||
| 2021 | 2020 | 2019 | 2018 | 2017 | ||||||||||||||||||
| Per Share Data |
| |||||||||||||||||||||
Net asset value, beginning of year | $ | 18.59 | $ | 16.90 | $ | 20.60 | $ | 19.27 | $ | 17.75 | ||||||||||||
Net investment loss(a) | (0.34 | ) | (0.25 | ) | (0.22 | )(b) | (0.27 | )(c) | (0.24 | )(d) | ||||||||||||
Net realized and unrealized gain | 6.82 | 4.96 | 0.17 | 4.48 | 2.45 | |||||||||||||||||
Total from investment operations | 6.48 | 4.71 | (0.05 | ) | 4.21 | 2.21 | ||||||||||||||||
Distributions to shareholders from net realized gains | (3.84 | ) | (3.02 | ) | (3.65 | ) | (2.88 | ) | (0.69 | ) | ||||||||||||
Net asset value, end of year | $ | 21.23 | $ | 18.59 | $ | 16.90 | $ | 20.60 | $ | 19.27 | ||||||||||||
| Total Return(e) | 38.00 | % | 32.18 | % | 3.50 | % | 24.30 | % | 12.98 | % | ||||||||||||
Net assets, end of year (in 000’s) | $ | 145,721 | $ | 153,835 | $ | 166,172 | $ | 232,881 | $ | 217,385 | ||||||||||||
Ratio of net expenses to average net assets | 1.96 | % | 2.02 | % | 2.01 | % | 2.03 | % | 2.04 | % | ||||||||||||
Ratio of total expenses to average net assets | 2.01 | % | 2.08 | % | 2.07 | % | 2.10 | % | 2.21 | % | ||||||||||||
Ratio of net investment loss to average net assets | (1.69 | )% | (1.55 | )% | (1.35 | )%(b) | (1.38 | )%(c) | (1.36 | )%(d) | ||||||||||||
Portfolio turnover rate(f) | 60 | % | 76 | % | 76 | % | 59 | % | 60 | % | ||||||||||||
| (a) | Calculated based on the average shares outstanding methodology. |
| (b) | Reflects income recognized from special dividends which amounted to $0.02 per share and 0.08% of average net assets. |
| (c) | Reflects income recognized from special dividends which amounted to $0.03 per share and 0.11% of average net assets. |
| (d) | Reflects income recognized from special dividends which amounted to $0.03 per share and 0.14% of average net assets. |
| (e) | Assumes investment at the NAV at the beginning of the year, reinvestment of all dividends and distributions, a complete redemption of the investment at the NAV at the end of the year and no sales or redemption charges (if any). Total returns would be reduced if a sales or redemption charge was taken into account. Returns do not reflect the impact of taxes to shareholders relating to Fund distributions or the redemption of Fund shares. |
| (f) | The Fund’s portfolio turnover rate is calculated in accordance with regulatory requirements, without regard to transactions involving short term investments. If such transactions were included, the Fund’s portfolio turnover rate may be higher. |
| 120 | The accompanying notes are an integral part of these financial statements. |
GOLDMAN SACHS SMALL/MID CAP GROWTH FUND
Financial Highlights (continued)
Selected Share Data for a Share Outstanding Throughout Each Year
| Goldman Sachs Small/Mid Cap Growth Fund | ||||||||||||||||||||||
| Institutional Shares | ||||||||||||||||||||||
| Year Ended August 31, | ||||||||||||||||||||||
| 2021 | 2020 | 2019 | 2018 | 2017 | ||||||||||||||||||
| Per Share Data |
| |||||||||||||||||||||
Net asset value, beginning of year | $ | 26.09 | $ | 22.36 | $ | 25.63 | $ | 23.08 | $ | 20.89 | ||||||||||||
Net investment loss(a) | (0.18 | ) | (0.09 | ) | (0.06 | )(b) | (0.07 | )(c) | (0.05 | )(d) | ||||||||||||
Net realized and unrealized gain | 9.87 | 6.84 | 0.44 | 5.50 | 2.93 | |||||||||||||||||
Total from investment operations | 9.69 | 6.75 | 0.38 | 5.43 | 2.88 | |||||||||||||||||
Distributions to shareholders from net realized gains | (3.84 | ) | (3.02 | ) | (3.65 | ) | (2.88 | ) | (0.69 | ) | ||||||||||||
Net asset value, end of year | $ | 31.94 | $ | 26.09 | $ | 22.36 | $ | 25.63 | $ | 23.08 | ||||||||||||
| Total Return(e) | 39.51 | % | 33.55 | % | 4.62 | % | 25.69 | % | 14.21 | % | ||||||||||||
Net assets, end of year (in 000’s) | $ | 1,303,226 | $ | 921,412 | $ | 853,375 | $ | 1,067,540 | $ | 1,149,459 | ||||||||||||
Ratio of net expenses to average net assets | 0.89 | % | 0.94 | % | 0.93 | % | 0.92 | % | 0.92 | % | ||||||||||||
Ratio of total expenses to average net assets | 0.89 | % | 0.95 | % | 0.93 | % | 0.96 | % | 1.06 | % | ||||||||||||
Ratio of net investment loss to average net assets | (0.63 | )% | (0.39 | )% | (0.26 | )%(b) | (0.27 | )%(c) | (0.24 | )%(d) | ||||||||||||
Portfolio turnover rate(f) | 60 | % | 76 | % | 76 | % | 59 | % | 60 | % | ||||||||||||
| (a) | Calculated based on the average shares outstanding methodology. |
| (b) | Reflects income recognized from special dividends which amounted to $0.02 per share and 0.08% of average net assets. |
| (c) | Reflects income recognized from special dividends which amounted to $0.03 per share and 0.11% of average net assets. |
| (d) | Reflects income recognized from special dividends which amounted to $0.03 per share and 0.14% of average net assets. |
| (e) | Assumes investment at the NAV at the beginning of the year, reinvestment of all dividends and distributions, a complete redemption of the investment at the NAV at the end of the year and no sales or redemption charges (if any). Total returns would be reduced if a sales or redemption charge was taken into account. Returns do not reflect the impact of taxes to shareholders relating to Fund distributions or the redemption of Fund shares. |
| (f) | The Fund’s portfolio turnover rate is calculated in accordance with regulatory requirements, without regard to transactions involving short term investments. If such transactions were included, the Fund’s portfolio turnover rate may be higher. |
| The accompanying notes are an integral part of these financial statements. | 121 |
GOLDMAN SACHS SMALL/MID CAP GROWTH FUND
Financial Highlights (continued)
Selected Share Data for a Share Outstanding Throughout Each Year
| Goldman Sachs Small/Mid Cap Growth Fund | ||||||||||||||||||||||
| Service Shares | ||||||||||||||||||||||
| Year Ended August 31, | ||||||||||||||||||||||
| 2021 | 2020 | 2019 | 2018 | 2017 | ||||||||||||||||||
| Per Share Data |
| |||||||||||||||||||||
Net asset value, beginning of year | $ | 22.60 | $ | 19.84 | $ | 23.32 | $ | 21.33 | $ | 19.46 | ||||||||||||
Net investment loss(a) | (0.27 | ) | (0.18 | ) | (0.15 | )(b) | (0.17 | )(c) | (0.14 | )(d) | ||||||||||||
Net realized and unrealized gain | 8.43 | 5.96 | 0.32 | 5.04 | 2.70 | |||||||||||||||||
Total from investment operations | 8.16 | 5.78 | 0.17 | 4.87 | 2.56 | |||||||||||||||||
Distributions to shareholders from net realized gains | (3.84 | ) | (3.02 | ) | (3.65 | ) | (2.88 | ) | (0.69 | ) | ||||||||||||
Net asset value, end of year | $ | 26.92 | $ | 22.60 | $ | 19.84 | $ | 23.32 | $ | 21.33 | ||||||||||||
| Total Return(e) | 38.78 | % | 32.87 | % | 4.13 | % | 25.12 | % | 13.59 | % | ||||||||||||
Net assets, end of year (in 000’s) | $ | 22,781 | $ | 32,215 | $ | 18,395 | $ | 18,210 | $ | 16,520 | ||||||||||||
Ratio of net expenses to average net assets | 1.39 | % | 1.44 | % | 1.43 | % | 1.42 | % | 1.42 | % | ||||||||||||
Ratio of total expenses to average net assets | 1.40 | % | 1.45 | % | 1.44 | % | 1.46 | % | 1.56 | % | ||||||||||||
Ratio of net investment loss to average net assets | (1.12 | )% | (0.92 | )% | (0.75 | )%(b) | (0.77 | )%(c) | (0.73 | )%(d) | ||||||||||||
Portfolio turnover rate(f) | 60 | % | 76 | % | 76 | % | 59 | % | 60 | % | ||||||||||||
| (a) | Calculated based on the average shares outstanding methodology. |
| (b) | Reflects income recognized from special dividends which amounted to $0.02 per share and 0.08% of average net assets. |
| (c) | Reflects income recognized from special dividends which amounted to $0.03 per share and 0.11% of average net assets. |
| (d) | Reflects income recognized from special dividends which amounted to $0.03 per share and 0.14% of average net assets. |
| (e) | Assumes investment at the NAV at the beginning of the year, reinvestment of all dividends and distributions, a complete redemption of the investment at the NAV at the end of the year and no sales or redemption charges (if any). Total returns would be reduced if a sales or redemption charge was taken into account. Returns do not reflect the impact of taxes to shareholders relating to Fund distributions or the redemption of Fund shares. |
| (f) | The Fund’s portfolio turnover rate is calculated in accordance with regulatory requirements, without regard to transactions involving short term investments. If such transactions were included, the Fund’s portfolio turnover rate may be higher. |
| 122 | The accompanying notes are an integral part of these financial statements. |
GOLDMAN SACHS SMALL/MID CAP GROWTH FUND
Financial Highlights (continued)
Selected Share Data for a Share Outstanding Throughout Each Year
| Goldman Sachs Small/Mid Cap Growth Fund | ||||||||||||||||||||||
| Investor Shares | ||||||||||||||||||||||
| Year Ended August 31, | ||||||||||||||||||||||
| 2021 | 2020 | 2019 | 2018 | 2017 | ||||||||||||||||||
| Per Share Data |
| |||||||||||||||||||||
Net asset value, beginning of year | $ | 24.96 | $ | 21.53 | $ | 24.85 | $ | 22.48 | $ | 20.39 | ||||||||||||
Net investment loss(a) | (0.19 | ) | (0.10 | ) | (0.07 | )(b) | (0.09 | )(c) | (0.08 | )(d) | ||||||||||||
Net realized and unrealized gain | 9.40 | 6.55 | 0.40 | 5.34 | 2.86 | |||||||||||||||||
Total from investment operations | 9.21 | 6.45 | 0.33 | 5.25 | 2.78 | |||||||||||||||||
Distributions to shareholders from net realized gains | (3.84 | ) | (3.02 | ) | (3.65 | ) | (2.88 | ) | (0.69 | ) | ||||||||||||
Net asset value, end of year | $ | 30.33 | $ | 24.96 | $ | 21.53 | $ | 24.85 | $ | 22.48 | ||||||||||||
| Total Return(e) | 39.37 | % | 33.44 | % | 4.57 | % | 25.57 | % | 14.06 | % | ||||||||||||
Net assets, end of year (in 000’s) | $ | 815,104 | $ | 495,629 | $ | 409,019 | $ | 529,670 | $ | 437,309 | ||||||||||||
Ratio of net expenses to average net assets | 0.96 | % | 1.02 | % | 1.01 | % | 1.03 | % | 1.04 | % | ||||||||||||
Ratio of total expenses to average net assets | 1.01 | % | 1.07 | % | 1.07 | % | 1.10 | % | 1.21 | % | ||||||||||||
Ratio of net investment loss to average net assets | (0.69 | )% | (0.47 | )% | (0.34 | )%(b) | (0.38 | )%(c) | (0.36 | )%(d) | ||||||||||||
Portfolio turnover rate(f) | 60 | % | 76 | % | 76 | % | 59 | % | 60 | % | ||||||||||||
| (a) | Calculated based on the average shares outstanding methodology. |
| (b) | Reflects income recognized from special dividends which amounted to $0.02 per share and 0.08% of average net assets. |
| (c) | Reflects income recognized from special dividends which amounted to $0.03 per share and 0.11% of average net assets. |
| (d) | Reflects income recognized from special dividends which amounted to $0.03 per share and 0.14% of average net assets. |
| (e) | Assumes investment at the NAV at the beginning of the year, reinvestment of all dividends and distributions, a complete redemption of the investment at the NAV at the end of the year and no sales or redemption charges (if any). Total returns would be reduced if a sales or redemption charge was taken into account. Returns do not reflect the impact of taxes to shareholders relating to Fund distributions or the redemption of Fund shares. |
| (f) | The Fund’s portfolio turnover rate is calculated in accordance with regulatory requirements, without regard to transactions involving short term investments. If such transactions were included, the Fund’s portfolio turnover rate may be higher. |
| The accompanying notes are an integral part of these financial statements. | 123 |
GOLDMAN SACHS SMALL/MID CAP GROWTH FUND
Financial Highlights (continued)
Selected Share Data for a Share Outstanding Throughout Each Year
| Goldman Sachs Small/Mid Cap Growth Fund | ||||||||||||||||||||||
| Class R6 Shares | ||||||||||||||||||||||
| Year Ended August 31, | ||||||||||||||||||||||
| 2021 | 2020 | 2019 | 2018 | 2017 | ||||||||||||||||||
| Per Share Data |
| |||||||||||||||||||||
Net asset value, beginning of year | $ | 26.12 | $ | 22.38 | $ | 25.64 | $ | 23.09 | $ | 20.89 | ||||||||||||
Net investment loss(a) | (0.18 | ) | (0.08 | ) | (0.05 | )(b) | (0.06 | )(c) | (0.04 | )(d) | ||||||||||||
Net realized and unrealized gain | 9.88 | 6.84 | 0.44 | 5.49 | 2.93 | |||||||||||||||||
Total from investment operations | 9.70 | 6.76 | 0.39 | 5.43 | 2.89 | |||||||||||||||||
Distributions to shareholders from net realized gains | (3.84 | ) | (3.02 | ) | (3.65 | ) | (2.88 | ) | (0.69 | ) | ||||||||||||
Net asset value, end of year | $ | 31.98 | $ | 26.12 | $ | 22.38 | �� | $ | 25.64 | $ | 23.09 | |||||||||||
| Total Return(e) | 39.51 | % | 33.56 | % | 4.67 | % | 25.68 | % | 14.26 | % | ||||||||||||
Net assets, end of year (in 000’s) | $ | 139,453 | $ | 73,863 | $ | 54,916 | $ | 39,263 | $ | 22,660 | ||||||||||||
Ratio of net expenses to average net assets | 0.88 | % | 0.93 | % | 0.92 | % | 0.91 | % | 0.90 | % | ||||||||||||
Ratio of total expenses to average net assets | 0.88 | % | 0.94 | % | 0.93 | % | 0.95 | % | 1.04 | % | ||||||||||||
Ratio of net investment loss to average net assets | (0.61 | )% | (0.38 | )% | (0.23 | )%(b) | (0.25 | )%(c) | (0.18 | )%(d) | ||||||||||||
Portfolio turnover rate(f) | 60 | % | 76 | % | 76 | % | 59 | % | 60 | % | ||||||||||||
| (a) | Calculated based on the average shares outstanding methodology. |
| (b) | Reflects income recognized from special dividends which amounted to $0.02 per share and 0.08% of average net assets. |
| (c) | Reflects income recognized from special dividends which amounted to $0.03 per share and 0.11% of average net assets. |
| (d) | Reflects income recognized from special dividends which amounted to $0.03 per share and 0.14% of average net assets. |
| (e) | Assumes investment at the NAV at the beginning of the year, reinvestment of all dividends and distributions, a complete redemption of the investment at the NAV at the end of the year and no sales or redemption charges (if any). Total returns would be reduced if a sales or redemption charge was taken into account. Returns do not reflect the impact of taxes to shareholders relating to Fund distributions or the redemption of Fund shares. |
| (f) | The Fund’s portfolio turnover rate is calculated in accordance with regulatory requirements, without regard to transactions involving short term investments. If such transactions were included, the Fund’s portfolio turnover rate may be higher. |
| 124 | The accompanying notes are an integral part of these financial statements. |
GOLDMAN SACHS SMALL/MID CAP GROWTH FUND
Financial Highlights (continued)
Selected Share Data for a Share Outstanding Throughout Each Year
| Goldman Sachs Small/Mid Cap Growth Fund | ||||||||||||||||||||||
| Class R Shares | ||||||||||||||||||||||
| Year Ended August 31, | ||||||||||||||||||||||
| 2021 | 2020 | 2019 | 2018 | 2017 | ||||||||||||||||||
| Per Share Data |
| |||||||||||||||||||||
Net asset value, beginning of year | $ | 22.24 | $ | 19.58 | $ | 23.08 | $ | 21.17 | $ | 19.34 | ||||||||||||
Net investment loss(a) | (0.29 | ) | (0.19 | ) | (0.16 | )(b) | (0.19 | )(c) | (0.17 | )(d) | ||||||||||||
Net realized and unrealized gain | 8.30 | 5.87 | 0.31 | 4.98 | 2.69 | |||||||||||||||||
Total from investment operations | 8.01 | 5.68 | 0.15 | 4.79 | 2.52 | |||||||||||||||||
Distributions to shareholders from net realized gains | (3.84 | ) | (3.02 | ) | (3.65 | ) | (2.88 | ) | (0.69 | ) | ||||||||||||
Net asset value, end of year | $ | 26.41 | $ | 22.24 | $ | 19.58 | $ | 23.08 | $ | 21.17 | ||||||||||||
| Total Return(e) | 38.72 | % | 32.78 | % | 4.07 | % | 24.92 | % | 13.47 | % | ||||||||||||
Net assets, end of year (in 000’s) | $ | 14,818 | $ | 13,209 | $ | 15,856 | $ | 24,215 | $ | 26,918 | ||||||||||||
Ratio of net expenses to average net assets | 1.46 | % | 1.52 | % | 1.51 | % | 1.53 | % | 1.54 | % | ||||||||||||
Ratio of total expenses to average net assets | 1.51 | % | 1.57 | % | 1.57 | % | 1.61 | % | 1.71 | % | ||||||||||||
Ratio of net investment loss to average net assets | (1.20 | )% | (1.00 | )% | (0.85 | )%(b) | (0.90 | )%(c) | (0.86 | )%(d) | ||||||||||||
Portfolio turnover rate(f) | 60 | % | 76 | % | 76 | % | 59 | % | 60 | % | ||||||||||||
| (a) | Calculated based on the average shares outstanding methodology. |
| (b) | Reflects income recognized from special dividends which amounted to $0.02 per share and 0.08% of average net assets. |
| (c) | Reflects income recognized from special dividends which amounted to $0.03 per share and 0.11% of average net assets. |
| (d) | Reflects income recognized from special dividends which amounted to $0.03 per share and 0.14% of average net assets. |
| (e) | Assumes investment at the NAV at the beginning of the year, reinvestment of all dividends and distributions, a complete redemption of the investment at the NAV at the end of the year and no sales or redemption charges (if any). Total returns would be reduced if a sales or redemption charge was taken into account. Returns do not reflect the impact of taxes to shareholders relating to Fund distributions or the redemption of Fund shares. |
| (f) | The Fund’s portfolio turnover rate is calculated in accordance with regulatory requirements, without regard to transactions involving short term investments. If such transactions were included, the Fund’s portfolio turnover rate may be higher. |
| The accompanying notes are an integral part of these financial statements. | 125 |
GOLDMAN SACHS SMALL/MID CAP GROWTH FUND
Financial Highlights (continued)
Selected Share Data for a Share Outstanding Throughout Each Period
| Goldman Sachs Small/Mid Cap Growth Fund | ||||||||||||||||||
| Class P Shares | ||||||||||||||||||
| Year Ended August 31, | Period Ended August 31, 2018(a) | |||||||||||||||||
| 2021 | 2020 | 2019 | ||||||||||||||||
| Per Share Data |
| |||||||||||||||||
Net asset value, beginning of period | $ | 26.12 | $ | 22.38 | $ | 25.64 | $ | 23.61 | ||||||||||
Net investment loss(b) | (0.18 | ) | (0.08 | ) | (0.05 | )(c) | (0.03 | )(d) | ||||||||||
Net realized and unrealized gain | 9.88 | 6.84 | 0.44 | 2.06 | ||||||||||||||
Total from investment operations | 9.70 | 6.76 | 0.39 | 2.03 | ||||||||||||||
Distributions to shareholders from net realized gains | (3.84 | ) | (3.02 | ) | (3.65 | ) | — | |||||||||||
Net asset value, end of period | $ | 31.98 | $ | 26.12 | $ | 22.38 | $ | 25.64 | ||||||||||
| Total Return(e) | 39.51 | % | 33.56 | % | 4.67 | % | 8.60 | % | ||||||||||
Net assets, end of period (in 000’s) | $ | 601,794 | $ | 285,307 | $ | 188,657 | $ | 245,612 | ||||||||||
Ratio of net expenses to average net assets | 0.88 | % | 0.93 | % | 0.92 | % | 0.90 | %(f) | ||||||||||
Ratio of total expenses to average net assets | 0.88 | % | 0.94 | % | 0.92 | % | 0.91 | %(f) | ||||||||||
Ratio of net investment loss to average net assets | (0.61 | )% | (0.38 | )% | (0.25 | )%(c) | (0.36 | )%(d)(f) | ||||||||||
Portfolio turnover rate(g) | 60 | % | 76 | % | 76 | % | 59 | % | ||||||||||
| (a) | Commenced operations on April 17, 2018. |
| (b) | Calculated based on the average shares outstanding methodology. |
| (c) | Reflects income recognized from special dividends which amounted to $0.02 per share and 0.08% of average net assets. |
| (d) | Reflects income recognized from special dividends which amounted to $0.03 per share and 0.11% of average net assets. |
| (e) | Assumes investment at the NAV at the beginning of the period, reinvestment of all dividends and distributions, a complete redemption of the investment at the NAV at the end of the period and no sales or redemption charges (if any). Total returns would be reduced if a sales or redemption charge was taken into account. Returns do not reflect the impact of taxes to shareholders relating to Fund distributions or the redemption of Fund shares. Total returns for periods less than one full year are not annualized. |
| (f) | Annualized. |
| (g) | The Fund’s portfolio turnover rate is calculated in accordance with regulatory requirements, without regard to transactions involving short term investments. If such transactions were included, the Fund’s portfolio turnover rate may be higher. |
| 126 | The accompanying notes are an integral part of these financial statements. |
GOLDMAN SACHS STRATEGIC GROWTH FUND
Financial Highlights (continued)
Selected Share Data for a Share Outstanding Throughout Each Year
| Goldman Sachs Strategic Growth Fund | ||||||||||||||||||||||
| Class A Shares | ||||||||||||||||||||||
| Year Ended August 31, | ||||||||||||||||||||||
| 2021 | 2020 | 2019 | 2018 | 2017 | ||||||||||||||||||
| Per Share Data |
| |||||||||||||||||||||
Net asset value, beginning of year | $ | 11.24 | $ | 9.25 | $ | 13.83 | $ | 13.79 | $ | 11.91 | ||||||||||||
Net investment income (loss)(a) | (0.07 | ) | (0.03 | ) | (0.01 | ) | (0.02 | ) | 0.02 | |||||||||||||
Net realized and unrealized gain (loss) | 2.92 | 3.58 | (0.30 | ) | 3.03 | 2.26 | ||||||||||||||||
Total from investment operations | 2.85 | 3.55 | (0.31 | ) | 3.01 | 2.28 | ||||||||||||||||
Distributions to shareholders from net investment income | — | — | — | — | (0.04 | ) | ||||||||||||||||
Distributions to shareholders from net realized gains | (1.77 | ) | (1.56 | ) | (4.27 | ) | (2.97 | ) | (0.36 | ) | ||||||||||||
Total distributions | (1.77 | ) | (1.56 | ) | (4.27 | ) | (2.97 | ) | (0.40 | ) | ||||||||||||
Net asset value, end of year | $ | 12.32 | $ | 11.24 | $ | 9.25 | $ | 13.83 | $ | 13.79 | ||||||||||||
| Total Return(b) | 29.11 | % | 43.98 | % | 2.86 | % | 25.59 | % | 19.79 | % | ||||||||||||
Net assets, end of year (in 000’s) | $ | 63,591 | $ | 36,688 | $ | 28,311 | $ | 30,174 | $ | 46,114 | ||||||||||||
Ratio of net expenses to average net assets | 1.12 | % | 1.14 | % | 1.14 | % | 1.14 | % | 1.15 | % | ||||||||||||
Ratio of total expenses to average net assets | 1.30 | % | 1.35 | % | 1.40 | % | 1.39 | % | 1.55 | % | ||||||||||||
Ratio of net investment income (loss) to average net assets | (0.60 | )% | (0.35 | )% | (0.07 | )% | (0.15 | )% | 0.15 | % | ||||||||||||
Portfolio turnover rate(c) | 31 | % | 39 | % | 28 | % | 40 | % | 54 | % | ||||||||||||
| (a) | Calculated based on the average shares outstanding methodology. |
| (b) | Assumes investment at the NAV at the beginning of the year, reinvestment of all dividends and distributions, a complete redemption of the investment at the NAV at the end of the year and no sales or redemption charges (if any). Total returns would be reduced if a sales or redemption charge was taken into account. Returns do not reflect the impact of taxes to shareholders relating to Fund distributions or the redemption of Fund shares. |
| (c) | The Fund’s portfolio turnover rate is calculated in accordance with regulatory requirements, without regard to transactions involving short term investments. If such transactions were included, the Fund’s portfolio turnover rate may be higher. |
| The accompanying notes are an integral part of these financial statements. | 127 |
GOLDMAN SACHS STRATEGIC GROWTH FUND
Financial Highlights (continued)
Selected Share Data for a Share Outstanding Throughout Each Year
| Goldman Sachs Strategic Growth Fund | ||||||||||||||||||||||
| Class C Shares | ||||||||||||||||||||||
| Year Ended August 31, | ||||||||||||||||||||||
| 2021 | 2020 | 2019 | 2018 | 2017 | ||||||||||||||||||
| Per Share Data |
| |||||||||||||||||||||
Net asset value, beginning of year | $ | 6.63 | $ | 6.09 | $ | 10.81 | $ | 11.46 | $ | 10.00 | ||||||||||||
Net investment loss(a) | (0.08 | ) | (0.07 | ) | (0.06 | ) | (0.09 | ) | (0.06 | ) | ||||||||||||
Net realized and unrealized gain (loss) | 1.54 | 2.17 | (0.39 | ) | 2.41 | 1.88 | ||||||||||||||||
Total from investment operations | 1.46 | 2.10 | (0.45 | ) | 2.32 | 1.82 | ||||||||||||||||
Distributions to shareholders from net realized gains | (1.77 | ) | (1.56 | ) | (4.27 | ) | (2.97 | ) | (0.36 | ) | ||||||||||||
Net asset value, end of year | $ | 6.32 | $ | 6.63 | $ | 6.09 | $ | 10.81 | $ | 11.46 | ||||||||||||
| Total Return(b) | 28.22 | % | 42.88 | % | 2.07 | % | 24.61 | % | 18.89 | % | ||||||||||||
Net assets, end of year (in 000’s) | $ | 3,901 | $ | 4,522 | $ | 4,142 | $ | 9,081 | $ | 9,326 | ||||||||||||
Ratio of net expenses to average net assets | 1.87 | % | 1.89 | % | 1.89 | % | 1.89 | % | 1.90 | % | ||||||||||||
Ratio of total expenses to average net assets | 2.05 | % | 2.11 | % | 2.14 | % | 2.13 | % | 2.30 | % | ||||||||||||
Ratio of net investment loss to average net assets | (1.34 | )% | (1.25 | )% | (0.83 | )% | (0.85 | )% | (0.60 | )% | ||||||||||||
Portfolio turnover rate(c) | 31 | % | 39 | % | 28 | % | 40 | % | 54 | % | ||||||||||||
| (a) | Calculated based on the average shares outstanding methodology. |
| (b) | Assumes investment at the NAV at the beginning of the year, reinvestment of all dividends and distributions, a complete redemption of the investment at the NAV at the end of the year and no sales or redemption charges (if any). Total returns would be reduced if a sales or redemption charge was taken into account. Returns do not reflect the impact of taxes to shareholders relating to Fund distributions or the redemption of Fund shares. |
| (c) | The Fund’s portfolio turnover rate is calculated in accordance with regulatory requirements, without regard to transactions involving short term investments. If such transactions were included, the Fund’s portfolio turnover rate may be higher. |
| 128 | The accompanying notes are an integral part of these financial statements. |
GOLDMAN SACHS STRATEGIC GROWTH FUND
Financial Highlights (continued)
Selected Share Data for a Share Outstanding Throughout Each Year
| Goldman Sachs Strategic Growth Fund | ||||||||||||||||||||||
| Institutional Shares | ||||||||||||||||||||||
| Year Ended August 31, | ||||||||||||||||||||||
| 2021 | 2020 | 2019 | 2018 | 2017 | ||||||||||||||||||
| Per Share Data |
| |||||||||||||||||||||
Net asset value, beginning of year | $ | 12.88 | $ | 10.39 | $ | 14.92 | $ | 14.67 | $ | 12.64 | ||||||||||||
Net investment income (loss)(a) | (0.03 | ) | 0.01 | 0.03 | 0.04 | 0.07 | ||||||||||||||||
Net realized and unrealized gain (loss) | 3.42 | 4.07 | (0.26 | ) | 3.25 | 2.40 | ||||||||||||||||
Total from investment operations | 3.39 | 4.08 | (0.23 | ) | 3.29 | 2.47 | ||||||||||||||||
Distributions to shareholders from net investment income | — | (b) | (0.03 | ) | (0.03 | ) | (0.07 | ) | (0.08 | ) | ||||||||||||
Distributions to shareholders from net realized gains | (1.77 | ) | (1.56 | ) | (4.27 | ) | (2.97 | ) | (0.36 | ) | ||||||||||||
Total distributions | (1.77 | ) | (1.59 | ) | (4.30 | ) | (3.04 | ) | (0.44 | ) | ||||||||||||
Net asset value, end of year | $ | 14.50 | $ | 12.88 | $ | 10.39 | $ | 14.92 | $ | 14.67 | ||||||||||||
| Total Return(c) | 29.65 | % | 44.36 | % | 3.31 | % | 26.11 | % | 20.29 | % | ||||||||||||
Net assets, end of year (in 000’s) | $ | 62,894 | $ | 60,474 | $ | 52,461 | $ | 75,470 | $ | 211,311 | ||||||||||||
Ratio of net expenses to average net assets | 0.75 | % | 0.76 | % | 0.75 | % | 0.75 | % | 0.75 | % | ||||||||||||
Ratio of total expenses to average net assets | 0.93 | % | 0.98 | % | 1.00 | % | 0.99 | % | 1.14 | % | ||||||||||||
Ratio of net investment income (loss) to average net assets | (0.23 | )% | 0.10 | % | 0.32 | % | 0.31 | % | 0.51 | % | ||||||||||||
Portfolio turnover rate(d) | 31 | % | 39 | % | 28 | % | 40 | % | 54 | % | ||||||||||||
| (a) | Calculated based on the average shares outstanding methodology. |
| (b) | Amount is less than $0.005 per share. |
| (c) | Assumes investment at the NAV at the beginning of the year, reinvestment of all dividends and distributions, a complete redemption of the investment at the NAV at the end of the year and no sales or redemption charges (if any). Total returns would be reduced if a sales or redemption charge was taken into account. Returns do not reflect the impact of taxes to shareholders relating to Fund distributions or the redemption of Fund shares. |
| (d) | The Fund’s portfolio turnover rate is calculated in accordance with regulatory requirements, without regard to transactions involving short term investments. If such transactions were included, the Fund’s portfolio turnover rate may be higher. |
| The accompanying notes are an integral part of these financial statements. | 129 |
GOLDMAN SACHS STRATEGIC GROWTH FUND
Financial Highlights (continued)
Selected Share Data for a Share Outstanding Throughout Each Year
| Goldman Sachs Strategic Growth Fund | ||||||||||||||||||||||
| Service Shares | ||||||||||||||||||||||
| Year Ended August 31, | ||||||||||||||||||||||
| 2021 | 2020 | 2019 | 2018 | 2017 | ||||||||||||||||||
| Per Share Data |
| |||||||||||||||||||||
Net asset value, beginning of year | $ | 10.97 | $ | 9.08 | $ | 13.67 | $ | 13.70 | $ | 11.85 | ||||||||||||
Net investment income (loss)(a) | (0.08 | ) | (0.04 | ) | (0.01 | ) | (0.03 | ) | 0.01 | |||||||||||||
Net realized and unrealized gain (loss) | 2.85 | 3.49 | (0.31 | ) | 3.00 | 2.24 | ||||||||||||||||
Total from investment operations | 2.77 | 3.45 | (0.32 | ) | 2.97 | 2.25 | ||||||||||||||||
Distributions to shareholders from net investment income | — | — | — | (0.03 | ) | (0.04 | ) | |||||||||||||||
Distributions to shareholders from net realized gains | (1.77 | ) | (1.56 | ) | (4.27 | ) | (2.97 | ) | (0.36 | ) | ||||||||||||
Total distributions | (1.77 | ) | (1.56 | ) | (4.27 | ) | (3.00 | ) | (0.40 | ) | ||||||||||||
Net asset value, end of year | $ | 11.97 | $ | 10.97 | $ | 9.08 | $ | 13.67 | $ | 13.70 | ||||||||||||
| Total Return(b) | 29.09 | % | 43.67 | % | 2.79 | % | 25.48 | % | 19.66 | % | ||||||||||||
Net assets, end of year (in 000’s) | $ | 623 | $ | 505 | $ | 622 | $ | 597 | $ | 478 | ||||||||||||
Ratio of net expenses to average net assets | 1.25 | % | 1.26 | % | 1.25 | % | 1.25 | % | 1.25 | % | ||||||||||||
Ratio of total expenses to average net assets | 1.43 | % | 1.53 | % | 1.53 | % | 1.48 | % | 1.65 | % | ||||||||||||
Ratio of net investment income (loss) to average net assets | (0.72 | )% | (0.47 | )% | (0.14 | )% | (0.21 | )% | 0.09 | % | ||||||||||||
Portfolio turnover rate(c) | 31 | % | 39 | % | 28 | % | 40 | % | 54 | % | ||||||||||||
| (a) | Calculated based on the average shares outstanding methodology. |
| (b) | Assumes investment at the NAV at the beginning of the year, reinvestment of all dividends and distributions, a complete redemption of the investment at the NAV at the end of the year and no sales or redemption charges (if any). Total returns would be reduced if a sales or redemption charge was taken into account. Returns do not reflect the impact of taxes to shareholders relating to Fund distributions or the redemption of Fund shares. |
| (c) | The Fund’s portfolio turnover rate is calculated in accordance with regulatory requirements, without regard to transactions involving short term investments. If such transactions were included, the Fund’s portfolio turnover rate may be higher. |
| 130 | The accompanying notes are an integral part of these financial statements. |
GOLDMAN SACHS STRATEGIC GROWTH FUND
Financial Highlights (continued)
Selected Share Data for a Share Outstanding Throughout Each Year
| Goldman Sachs Strategic Growth Fund | ||||||||||||||||||||||
| Investor Shares | ||||||||||||||||||||||
| Year Ended August 31, | ||||||||||||||||||||||
| 2021 | 2020 | 2019 | 2018 | 2017 | ||||||||||||||||||
| Per Share Data |
| |||||||||||||||||||||
Net asset value, beginning of year | $ | 12.83 | $ | 10.34 | $ | 14.89 | $ | 14.66 | $ | 12.63 | ||||||||||||
Net investment income (loss)(a) | (0.04 | ) | (0.01 | ) | 0.02 | 0.02 | 0.06 | |||||||||||||||
Net realized and unrealized gain (loss) | 3.39 | 4.07 | (0.27 | ) | 3.24 | 2.40 | ||||||||||||||||
Total from investment operations | 3.35 | 4.06 | (0.25 | ) | 3.26 | 2.46 | ||||||||||||||||
Distributions to shareholders from net investment income | — | (0.01 | ) | (0.03 | ) | (0.06 | ) | (0.07 | ) | |||||||||||||
Distributions to shareholders from net realized gains | (1.77 | ) | (1.56 | ) | (4.27 | ) | (2.97 | ) | (0.36 | ) | ||||||||||||
Total distributions | (1.77 | ) | (1.57 | ) | (4.30 | ) | (3.03 | ) | (0.43 | ) | ||||||||||||
Net asset value, end of year | $ | 14.41 | $ | 12.83 | $ | 10.34 | $ | 14.89 | $ | 14.66 | ||||||||||||
| Total Return(b) | 29.42 | % | 44.28 | % | 3.14 | % | 25.90 | % | 20.15 | % | ||||||||||||
Net assets, end of year (in 000’s) | $ | 3,232 | $ | 2,758 | $ | 1,533 | $ | 2,578 | $ | 2,264 | ||||||||||||
Ratio of net expenses to average net assets | 0.87 | % | 0.89 | % | 0.89 | % | 0.89 | % | 0.90 | % | ||||||||||||
Ratio of total expenses to average net assets | 1.05 | % | 1.06 | % | 1.14 | % | 1.12 | % | 1.30 | % | ||||||||||||
Ratio of net investment income (loss) to average net assets | (0.35 | )% | (0.09 | )% | 0.16 | % | 0.15 | % | 0.48 | % | ||||||||||||
Portfolio turnover rate(c) | 31 | % | 39 | % | 28 | % | 40 | % | 54 | % | ||||||||||||
| (a) | Calculated based on the average shares outstanding methodology. |
| (b) | Assumes investment at the NAV at the beginning of the year, reinvestment of all dividends and distributions, a complete redemption of the investment at the NAV at the end of the year and no sales or redemption charges (if any). Total returns would be reduced if a sales or redemption charge was taken into account. Returns do not reflect the impact of taxes to shareholders relating to Fund distributions or the redemption of Fund shares. |
| (c) | The Fund’s portfolio turnover rate is calculated in accordance with regulatory requirements, without regard to transactions involving short term investments. If such transactions were included, the Fund’s portfolio turnover rate may be higher. |
| The accompanying notes are an integral part of these financial statements. | 131 |
GOLDMAN SACHS STRATEGIC GROWTH FUND
Financial Highlights (continued)
Selected Share Data for a Share Outstanding Throughout Each Year
| Goldman Sachs Strategic Growth Fund | ||||||||||||||||||||||
| Class R6 Shares | ||||||||||||||||||||||
| Year Ended August 31, | ||||||||||||||||||||||
| 2021 | 2020 | 2019 | 2018 | 2017 | ||||||||||||||||||
| Per Share Data |
| |||||||||||||||||||||
Net asset value, beginning of year | $ | 12.86 | $ | 10.37 | $ | 14.91 | $ | 14.66 | $ | 12.63 | ||||||||||||
Net investment income (loss)(a) | (0.03 | ) | 0.01 | 0.04 | 0.04 | 0.08 | ||||||||||||||||
Net realized and unrealized gain (loss) | 3.40 | 4.07 | (0.27 | ) | 3.25 | 2.40 | ||||||||||||||||
Total from investment operations | 3.37 | 4.08 | (0.23 | ) | 3.29 | 2.48 | ||||||||||||||||
Distributions to shareholders from net investment income | — | (b) | (0.03 | ) | (0.04 | ) | (0.07 | ) | (0.09 | ) | ||||||||||||
Distributions to shareholders from net realized gains | (1.77 | ) | (1.56 | ) | (4.27 | ) | (2.97 | ) | (0.36 | ) | ||||||||||||
Total distributions | (1.77 | ) | (1.59 | ) | (4.31 | ) | (3.04 | ) | (0.45 | ) | ||||||||||||
Net asset value, end of year | $ | 14.46 | $ | 12.86 | $ | 10.37 | $ | 14.91 | $ | 14.66 | ||||||||||||
| Total Return(c) | 29.57 | % | 44.49 | % | 3.33 | % | 26.15 | % | 20.33 | % | ||||||||||||
Net assets, end of year (in 000’s) | $ | 789 | $ | 509 | $ | 477 | $ | 15 | $ | 12 | ||||||||||||
Ratio of net expenses to average net assets | 0.74 | % | 0.75 | % | 0.74 | % | 0.74 | % | 0.75 | % | ||||||||||||
Ratio of total expenses to average net assets | 0.92 | % | 0.99 | % | 1.03 | % | 0.97 | % | 1.14 | % | ||||||||||||
Ratio of net investment income (loss) to average net assets | (0.22 | )% | 0.10 | % | 0.40 | % | 0.30 | % | 0.57 | % | ||||||||||||
Portfolio turnover rate(d) | 31 | % | 39 | % | 28 | % | 40 | % | 54 | % | ||||||||||||
| (a) | Calculated based on the average shares outstanding methodology. |
| (b) | Amount is less than $0.005 per share. |
| (c) | Assumes investment at the NAV at the beginning of the year, reinvestment of all dividends and distributions, a complete redemption of the investment at the NAV at the end of the year and no sales or redemption charges (if any). Total returns would be reduced if a sales or redemption charge was taken into account. Returns do not reflect the impact of taxes to shareholders relating to Fund distributions or the redemption of Fund shares. |
| (d) | The Fund’s portfolio turnover rate is calculated in accordance with regulatory requirements, without regard to transactions involving short term investments. If such transactions were included, the Fund’s portfolio turnover rate may be higher. |
| 132 | The accompanying notes are an integral part of these financial statements. |
GOLDMAN SACHS STRATEGIC GROWTH FUND
Financial Highlights (continued)
Selected Share Data for a Share Outstanding Throughout Each Year
| Goldman Sachs Strategic Growth Fund | ||||||||||||||||||||||
| Class R Shares | ||||||||||||||||||||||
| Year Ended August 31, | ||||||||||||||||||||||
| 2021 | 2020 | 2019 | 2018 | 2017 | ||||||||||||||||||
| Per Share Data |
| |||||||||||||||||||||
Net asset value, beginning of year | $ | 10.67 | $ | 8.88 | $ | 13.49 | $ | 13.56 | $ | 11.75 | ||||||||||||
Net investment loss(a) | (0.09 | ) | (0.06 | ) | (0.03 | ) | (0.04 | ) | (0.01 | ) | ||||||||||||
Net realized and unrealized gain (loss) | 2.74 | 3.41 | (0.31 | ) | 2.96 | 2.23 | ||||||||||||||||
Total from investment operations | 2.65 | 3.35 | (0.34 | ) | 2.92 | 2.22 | ||||||||||||||||
Distributions to shareholders from net investment income | — | — | — | (0.02 | ) | (0.05 | ) | |||||||||||||||
Distributions to shareholders from net realized gains | (1.77 | ) | (1.56 | ) | (4.27 | ) | (2.97 | ) | (0.36 | ) | ||||||||||||
Total distributions | (1.77 | ) | (1.56 | ) | (4.27 | ) | (2.99 | ) | (0.41 | ) | ||||||||||||
Net asset value, end of year | $ | 11.55 | $ | 10.67 | $ | 8.88 | $ | 13.49 | $ | 13.56 | ||||||||||||
| Total Return(b) | 28.74 | % | 43.52 | % | 2.67 | % | 25.29 | % | 19.56 | % | ||||||||||||
Net assets, end of year (in 000’s) | $ | 213 | $ | 66 | $ | 292 | $ | 255 | $ | 169 | ||||||||||||
Ratio of net expenses to average net assets | 1.37 | % | 1.40 | % | 1.39 | % | 1.39 | % | 1.40 | % | ||||||||||||
Ratio of total expenses to average net assets | 1.55 | % | 1.75 | % | 1.65 | % | 1.62 | % | 1.80 | % | ||||||||||||
Ratio of net investment loss to average net assets | (0.85 | )% | (0.66 | )% | (0.31 | )% | (0.34 | )% | (0.07 | )% | ||||||||||||
Portfolio turnover rate(c) | 31 | % | 39 | % | 28 | % | 40 | % | 54 | % | ||||||||||||
| (a) | Calculated based on the average shares outstanding methodology. |
| (b) | Assumes investment at the NAV at the beginning of the year, reinvestment of all dividends and distributions, a complete redemption of the investment at the NAV at the end of the year and no sales or redemption charges (if any). Total returns would be reduced if a sales or redemption charge was taken into account. Returns do not reflect the impact of taxes to shareholders relating to Fund distributions or the redemption of Fund shares. |
| (c) | The Fund’s portfolio turnover rate is calculated in accordance with regulatory requirements, without regard to transactions involving short term investments. If such transactions were included, the Fund’s portfolio turnover rate may be higher. |
| The accompanying notes are an integral part of these financial statements. | 133 |
GOLDMAN SACHS STRATEGIC GROWTH FUND
Financial Highlights (continued)
Selected Share Data for a Share Outstanding Throughout Each Period
| Goldman Sachs Strategic Growth Fund | ||||||||||||||||||
| Class P Shares | ||||||||||||||||||
| Year Ended August 31, | Period Ended August 31, 2018(a) | |||||||||||||||||
| 2021 | 2020 | 2019 | ||||||||||||||||
| Per Share Data |
| |||||||||||||||||
Net asset value, beginning of period | $ | 12.84 | $ | 10.35 | $ | 14.90 | $ | 13.53 | ||||||||||
Net investment income (loss)(b) | (0.03 | ) | 0.01 | 0.04 | 0.01 | |||||||||||||
Net realized and unrealized gain (loss) | 3.40 | 4.07 | (0.28 | ) | 1.36 | |||||||||||||
Total from investment operations | 3.37 | 4.08 | (0.24 | ) | 1.37 | |||||||||||||
Distributions to shareholders from net investment income | — | (c) | (0.03 | ) | (0.04 | ) | — | |||||||||||
Distributions to shareholders from net realized gains | (1.77 | ) | (1.56 | ) | (4.27 | ) | — | |||||||||||
Total distributions | (1.77 | ) | (1.59 | ) | (4.31 | ) | — | |||||||||||
Net asset value, end of period | $ | 14.44 | $ | 12.84 | $ | 10.35 | $ | 14.90 | ||||||||||
| Total Return(d) | 29.61 | % | 44.56 | % | 3.26 | % | 10.13 | % | ||||||||||
Net assets, end of period (in 000’s) | $ | 90,823 | $ | 78,539 | $ | 73,132 | $ | 104,590 | ||||||||||
Ratio of net expenses to average net assets | 0.74 | % | 0.75 | % | 0.74 | % | 0.74 | %(e) | ||||||||||
Ratio of total expenses to average net assets | 0.92 | % | 0.98 | % | 0.99 | % | 0.96 | %(e) | ||||||||||
Ratio of net investment income (loss) to average net assets | (0.22 | )% | 0.12 | % | 0.32 | % | 0.22 | %(e) | ||||||||||
Portfolio turnover rate(f) | 31 | % | 39 | % | 28 | % | 40 | % | ||||||||||
| (a) | Commenced operations on April 17, 2018. |
| (b) | Calculated based on the average shares outstanding methodology. |
| (c) | Amount is less than $0.005 per share. |
| (d) | Assumes investment at the NAV at the beginning of the period, reinvestment of all dividends and distributions, a complete redemption of the investment at the NAV at the end of the period and no sales or redemption charges (if any). Total returns would be reduced if a sales or redemption charge was taken into account. Returns do not reflect the impact of taxes to shareholders relating to Fund distributions or the redemption of Fund shares. Total returns for periods less than one full year are not annualized. |
| (e) | Annualized. |
| (f) | The Fund’s portfolio turnover rate is calculated in accordance with regulatory requirements, without regard to transactions involving short term investments. If such transactions were included, the Fund’s portfolio turnover rate may be higher. |
| 134 | The accompanying notes are an integral part of these financial statements. |
GOLDMAN SACHS TECHNOLOGY OPPORTUNITIES FUND
Financial Highlights (continued)
Selected Share Data for a Share Outstanding Throughout Each Year
| Goldman Sachs Technology Opportunities Fund | ||||||||||||||||||||||
| Class A Shares | ||||||||||||||||||||||
| Year Ended August 31, | ||||||||||||||||||||||
| 2021 | 2020 | 2019 | 2018 | 2017 | ||||||||||||||||||
| Per Share Data |
| |||||||||||||||||||||
Net asset value, beginning of year | $ | 29.76 | $ | 23.17 | $ | 27.91 | $ | 23.04 | $ | 18.73 | ||||||||||||
Net investment loss(a) | (0.22 | ) | (0.13 | ) | (0.12 | ) | (0.16 | ) | (0.15 | ) | ||||||||||||
Net realized and unrealized gain | 8.18 | 10.43 | 0.44 | 6.79 | 5.37 | |||||||||||||||||
Total from investment operations | 7.96 | 10.30 | 0.32 | 6.63 | 5.22 | |||||||||||||||||
Distributions to shareholders from net realized gains | (2.65 | ) | (3.71 | ) | (5.06 | ) | (1.76 | ) | (0.91 | ) | ||||||||||||
Net asset value, end of year | $ | 35.07 | $ | 29.76 | $ | 23.17 | $ | 27.91 | $ | 23.04 | ||||||||||||
| Total Return(b) | 29.05 | % | 51.05 | % | 4.73 | % | 30.46 | % | 29.17 | % | ||||||||||||
Net assets, end of year (in 000’s) | $ | 503,553 | $ | 429,267 | $ | 305,666 | $ | 312,289 | $ | 268,746 | ||||||||||||
Ratio of net expenses to average net assets | 1.26 | % | 1.28 | % | 1.34 | % | 1.38 | % | 1.42 | % | ||||||||||||
Ratio of total expenses to average net assets | 1.41 | % | 1.46 | % | 1.48 | % | 1.48 | % | 1.53 | % | ||||||||||||
Ratio of net investment loss to average net assets | (0.72 | )% | (0.55 | )% | (0.53 | )% | (0.65 | )% | (0.74 | )% | ||||||||||||
Portfolio turnover rate(c) | 41 | % | 41 | % | 27 | % | 46 | % | 19 | % | ||||||||||||
| (a) | Calculated based on the average shares outstanding methodology. |
| (b) | Assumes investment at the NAV at the beginning of the year, reinvestment of all dividends and distributions, a complete redemption of the investment at the NAV at the end of the year and no sales or redemption charges (if any). Total returns would be reduced if a sales or redemption charge was taken into account. Returns do not reflect the impact of taxes to shareholders relating to Fund distributions or the redemption of Fund shares. |
| (c) | The Fund’s portfolio turnover rate is calculated in accordance with regulatory requirements, without regard to transactions involving short term investments. If such transactions were included, the Fund’s portfolio turnover rate may be higher. |
| The accompanying notes are an integral part of these financial statements. | 135 |
GOLDMAN SACHS TECHNOLOGY OPPORTUNITIES FUND
Financial Highlights (continued)
Selected Share Data for a Share Outstanding Throughout Each Year
| Goldman Sachs Technology Opportunities Fund | ||||||||||||||||||||||
| Class C Shares | ||||||||||||||||||||||
| Year Ended August 31, | ||||||||||||||||||||||
| 2021 | 2020 | 2019 | 2018 | 2017 | ||||||||||||||||||
| Per Share Data |
| |||||||||||||||||||||
Net asset value, beginning of year | $ | 21.68 | $ | 17.94 | $ | 23.05 | $ | 19.45 | $ | 16.07 | ||||||||||||
Net investment loss(a) | (0.31 | ) | (0.23 | ) | (0.24 | ) | (0.29 | ) | (0.25 | ) | ||||||||||||
Net realized and unrealized gain | 5.74 | 7.68 | 0.19 | 5.65 | 4.54 | |||||||||||||||||
Total from investment operations | 5.43 | 7.45 | (0.05 | ) | 5.36 | 4.29 | ||||||||||||||||
Distributions to shareholders from net realized gains | (2.65 | ) | (3.71 | ) | (5.06 | ) | (1.76 | ) | (0.91 | ) | ||||||||||||
Net asset value, end of year | $ | 24.46 | $ | 21.68 | $ | 17.94 | $ | 23.05 | $ | 19.45 | ||||||||||||
| Total Return(b) | 28.13 | % | 49.93 | % | 3.97 | % | 29.49 | % | 28.18 | % | ||||||||||||
Net assets, end of year (in 000’s) | $ | 27,866 | $ | 30,011 | $ | 24,948 | $ | 57,207 | $ | 50,779 | ||||||||||||
Ratio of net expenses to average net assets | 2.01 | % | 2.03 | % | 2.10 | % | 2.13 | % | 2.17 | % | ||||||||||||
Ratio of total expenses to average net assets | 2.16 | % | 2.21 | % | 2.23 | % | 2.23 | % | 2.28 | % | ||||||||||||
Ratio of net investment loss to average net assets | (1.47 | )% | (1.31 | )% | (1.31 | )% | (1.40 | )% | (1.49 | )% | ||||||||||||
Portfolio turnover rate(c) | 41 | % | 41 | % | 27 | % | 46 | % | 19 | % | ||||||||||||
| (a) | Calculated based on the average shares outstanding methodology. |
| (b) | Assumes investment at the NAV at the beginning of the year, reinvestment of all dividends and distributions, a complete redemption of the investment at the NAV at the end of the year and no sales or redemption charges (if any). Total returns would be reduced if a sales or redemption charge was taken into account. Returns do not reflect the impact of taxes to shareholders relating to Fund distributions or the redemption of Fund shares. |
| (c) | The Fund’s portfolio turnover rate is calculated in accordance with regulatory requirements, without regard to transactions involving short term investments. If such transactions were included, the Fund’s portfolio turnover rate may be higher. |
| 136 | The accompanying notes are an integral part of these financial statements. |
GOLDMAN SACHS TECHNOLOGY OPPORTUNITIES FUND
Financial Highlights (continued)
Selected Share Data for a Share Outstanding Throughout Each Year
| Goldman Sachs Technology Opportunities Fund | ||||||||||||||||||||||
| Institutional Shares | ||||||||||||||||||||||
| Year Ended August 31, | ||||||||||||||||||||||
| 2021 | 2020 | 2019 | 2018 | 2017 | ||||||||||||||||||
| Per Share Data |
| |||||||||||||||||||||
Net asset value, beginning of year | $ | 34.57 | $ | 26.28 | $ | 30.78 | $ | 25.15 | $ | 20.29 | ||||||||||||
Net investment loss(a) | (0.16 | ) | (0.07 | ) | (0.04 | ) | (0.07 | ) | (0.07 | ) | ||||||||||||
Net realized and unrealized gain | 9.64 | 12.07 | 0.60 | 7.46 | 5.84 | |||||||||||||||||
Total from investment operations | 9.48 | 12.00 | 0.56 | 7.39 | 5.77 | |||||||||||||||||
Distributions to shareholders from net realized gains | (2.65 | ) | (3.71 | ) | (5.06 | ) | (1.76 | ) | (0.91 | ) | ||||||||||||
Net asset value, end of year | $ | 41.40 | $ | 34.57 | $ | 26.28 | $ | 30.78 | $ | 25.15 | ||||||||||||
| Total Return(b) | 29.42 | % | 51.49 | % | 5.12 | % | 30.95 | % | 29.66 | % | ||||||||||||
Net assets, end of year (in 000’s) | $ | 190,705 | $ | 157,267 | $ | 74,728 | $ | 87,522 | $ | 85,095 | ||||||||||||
Ratio of net expenses to average net assets | 0.98 | % | 0.99 | % | 0.98 | % | 0.99 | % | 1.02 | % | ||||||||||||
Ratio of total expenses to average net assets | 1.04 | % | 1.08 | % | 1.09 | % | 1.09 | % | 1.13 | % | ||||||||||||
Ratio of net investment loss to average net assets | (0.44 | )% | (0.27 | )% | (0.17 | )% | (0.26 | )% | (0.34 | )% | ||||||||||||
Portfolio turnover rate(c) | 41 | % | 41 | % | 27 | % | 46 | % | 19 | % | ||||||||||||
| (a) | Calculated based on the average shares outstanding methodology. |
| (b) | Assumes investment at the NAV at the beginning of the year, reinvestment of all dividends and distributions, a complete redemption of the investment at the NAV at the end of the year and no sales or redemption charges (if any). Total returns would be reduced if a sales or redemption charge was taken into account. Returns do not reflect the impact of taxes to shareholders relating to Fund distributions or the redemption of Fund shares. |
| (c) | The Fund’s portfolio turnover rate is calculated in accordance with regulatory requirements, without regard to transactions involving short term investments. If such transactions were included, the Fund’s portfolio turnover rate may be higher. |
| The accompanying notes are an integral part of these financial statements. | 137 |
GOLDMAN SACHS TECHNOLOGY OPPORTUNITIES FUND
Financial Highlights (continued)
Selected Share Data for a Share Outstanding Throughout Each Year
| Goldman Sachs Technology Opportunities Fund | ||||||||||||||||||||||
| Service Shares | ||||||||||||||||||||||
| Year Ended August 31, | ||||||||||||||||||||||
| 2021 | 2020 | 2019 | 2018 | 2017 | ||||||||||||||||||
| Per Share Data |
| |||||||||||||||||||||
Net asset value, beginning of year | $ | 28.77 | $ | 22.56 | $ | 27.35 | $ | 22.64 | $ | 18.44 | ||||||||||||
Net investment loss(a) | (0.27 | ) | (0.17 | ) | (0.15 | ) | (0.18 | ) | (0.16 | ) | ||||||||||||
Net realized and unrealized gain | 7.87 | 10.09 | 0.42 | 6.65 | 5.27 | |||||||||||||||||
Total from investment operations | 7.60 | 9.92 | 0.27 | 6.47 | 5.11 | |||||||||||||||||
Distributions to shareholders from net realized gains | (2.65 | ) | (3.71 | ) | (5.06 | ) | (1.76 | ) | (0.91 | ) | ||||||||||||
Net asset value, end of year | $ | 33.72 | $ | 28.77 | $ | 22.56 | $ | 27.35 | $ | 22.64 | ||||||||||||
| Total Return(b) | 28.78 | % | 50.71 | % | 4.62 | % | 30.28 | % | 29.03 | % | ||||||||||||
Net assets, end of year (in 000’s) | $ | 38,670 | $ | 41,024 | $ | 29,084 | $ | 33,109 | $ | 18,919 | ||||||||||||
Ratio of net expenses to average net assets | 1.48 | % | 1.49 | % | 1.48 | % | 1.49 | % | 1.51 | % | ||||||||||||
Ratio of total expenses to average net assets | 1.54 | % | 1.58 | % | 1.59 | % | 1.59 | % | 1.63 | % | ||||||||||||
Ratio of net investment loss to average net assets | (0.94 | )% | (0.77 | )% | (0.67 | )% | (0.75 | )% | (0.83 | )% | ||||||||||||
Portfolio turnover rate(c) | 41 | % | 41 | % | 27 | % | 46 | % | 19 | % | ||||||||||||
| (a) | Calculated based on the average shares outstanding methodology. |
| (b) | Assumes investment at the NAV at the beginning of the year, reinvestment of all dividends and distributions, a complete redemption of the investment at the NAV at the end of the year and no sales or redemption charges (if any). Total returns would be reduced if a sales or redemption charge was taken into account. Returns do not reflect the impact of taxes to shareholders relating to Fund distributions or the redemption of Fund shares. |
| (c) | The Fund’s portfolio turnover rate is calculated in accordance with regulatory requirements, without regard to transactions involving short term investments. If such transactions were included, the Fund’s portfolio turnover rate may be higher. |
| 138 | The accompanying notes are an integral part of these financial statements. |
GOLDMAN SACHS TECHNOLOGY OPPORTUNITIES FUND
Financial Highlights (continued)
Selected Share Data for a Share Outstanding Throughout Each Year
| Goldman Sachs Technology Opportunities Fund | ||||||||||||||||||||||
| Investor Shares | ||||||||||||||||||||||
| Year Ended August 31, | ||||||||||||||||||||||
| 2021 | 2020 | 2019 | 2018 | 2017 | ||||||||||||||||||
| Per Share Data |
| |||||||||||||||||||||
Net asset value, beginning of year | $ | 33.79 | $ | 25.78 | $ | 30.33 | $ | 24.84 | $ | 20.08 | ||||||||||||
Net investment loss(a) | (0.16 | ) | (0.08 | ) | (0.07 | ) | (0.11 | ) | (0.10 | ) | ||||||||||||
Net realized and unrealized gain | 9.41 | 11.80 | 0.58 | 7.36 | 5.77 | |||||||||||||||||
Total from investment operations | 9.25 | 11.72 | 0.51 | 7.25 | 5.67 | |||||||||||||||||
Distributions to shareholders from net realized gains | (2.65 | ) | (3.71 | ) | (5.06 | ) | (1.76 | ) | (0.91 | ) | ||||||||||||
Net asset value, end of year | $ | 40.39 | $ | 33.79 | $ | 25.78 | $ | 30.33 | $ | 24.84 | ||||||||||||
| Total Return(b) | 29.42 | % | 51.40 | % | 5.01 | % | 30.76 | % | 29.46 | % | ||||||||||||
Net assets, end of year (in 000’s) | $ | 41,403 | $ | 48,387 | $ | 19,207 | $ | 22,520 | $ | 23,317 | ||||||||||||
Ratio of net expenses to average net assets | 1.01 | % | 1.02 | % | 1.09 | % | 1.13 | % | 1.16 | % | ||||||||||||
Ratio of total expenses to average net assets | 1.16 | % | 1.21 | % | 1.23 | % | 1.23 | % | 1.28 | % | ||||||||||||
Ratio of net investment loss to average net assets | (0.47 | )% | (0.31 | )% | (0.29 | )% | (0.40 | )% | (0.46 | )% | ||||||||||||
Portfolio turnover rate(c) | 41 | % | 41 | % | 27 | % | 46 | % | 19 | % | ||||||||||||
| (a) | Calculated based on the average shares outstanding methodology. |
| (b) | Assumes investment at the NAV at the beginning of the year, reinvestment of all dividends and distributions, a complete redemption of the investment at the NAV at the end of the year and no sales or redemption charges (if any). Total returns would be reduced if a sales or redemption charge was taken into account. Returns do not reflect the impact of taxes to shareholders relating to Fund distributions or the redemption of Fund shares. |
| (c) | The Fund’s portfolio turnover rate is calculated in accordance with regulatory requirements, without regard to transactions involving short term investments. If such transactions were included, the Fund’s portfolio turnover rate may be higher. |
| The accompanying notes are an integral part of these financial statements. | 139 |
GOLDMAN SACHS TECHNOLOGY OPPORTUNITIES FUND
Financial Highlights (continued)
Selected Share Data for a Share Outstanding Throughout Each Period
| Goldman Sachs Technology Opportunities Fund | ||||||||||||||||||
| Class R6 Shares | ||||||||||||||||||
| Year Ended August 31, | Period Ended August 31, 2018(a) | |||||||||||||||||
| 2021 | 2020 | 2019 | ||||||||||||||||
| Per Share Data |
| |||||||||||||||||
Net asset value, beginning of period | $ | 34.59 | $ | 26.29 | $ | 30.78 | $ | 25.08 | ||||||||||
Net investment loss(b) | (0.15 | ) | (0.08 | ) | (0.02 | ) | (0.04 | ) | ||||||||||
Net realized and unrealized gain | 9.64 | 12.09 | 0.59 | 5.74 | ||||||||||||||
Total from investment operations | 9.49 | 12.01 | 0.57 | 5.70 | ||||||||||||||
Distributions to shareholders from net realized gains | (2.65 | ) | (3.71 | ) | (5.06 | ) | — | |||||||||||
Net asset value, end of period | $ | 41.43 | $ | 34.59 | $ | 26.29 | $ | 30.78 | ||||||||||
| Total Return(c) | 29.44 | % | 51.51 | % | 5.15 | % | 22.73 | % | ||||||||||
Net assets, end of period (in 000’s) | $ | 3,134 | $ | 1,330 | $ | 138 | $ | 12 | ||||||||||
Ratio of net expenses to average net assets | 0.97 | % | 0.97 | % | 0.97 | % | 0.98 | %(d) | ||||||||||
Ratio of total expenses to average net assets | 1.03 | % | 1.06 | % | 1.09 | % | 1.08 | %(d) | ||||||||||
Ratio of net investment loss to average net assets | (0.43 | )% | (0.28 | )% | (0.07 | )% | (0.20 | )%(d) | ||||||||||
Portfolio turnover rate(e) | 41 | % | 41 | % | 27 | % | 46 | % | ||||||||||
| (a) | Commenced operations on December 29, 2017. |
| (b) | Calculated based on the average shares outstanding methodology. |
| (c) | Assumes investment at the NAV at the beginning of the period, reinvestment of all dividends and distributions, a complete redemption of the investment at the NAV at the end of the period and no sales or redemption charges (if any). Total returns would be reduced if a sales or redemption charge was taken into account. Returns do not reflect the impact of taxes to shareholders relating to Fund distributions or the redemption of Fund shares. Total returns for periods less than one full year are not annualized. |
| (d) | Annualized. |
| (e) | The Fund’s portfolio turnover rate is calculated in accordance with regulatory requirements, without regard to transactions involving short term investments. If such transactions were included, the Fund’s portfolio turnover rate may be higher. |
| 140 | The accompanying notes are an integral part of these financial statements. |
GOLDMAN SACHS TECHNOLOGY OPPORTUNITIES FUND
Financial Highlights (continued)
Selected Share Data for a Share Outstanding Throughout Each Period
| Goldman Sachs Technology Opportunities Fund | ||||||||||||||||||
| Class P Shares | ||||||||||||||||||
| Year Ended August 31, | Period Ended August 31, 2018(a) | |||||||||||||||||
| 2021 | 2020 | 2019 | ||||||||||||||||
| Per Share Data |
| |||||||||||||||||
Net asset value, beginning of period | $ | 34.59 | $ | 26.29 | $ | 30.79 | $ | 27.83 | ||||||||||
Net investment income (loss)(b) | (0.15 | ) | (0.07 | ) | (0.04 | ) | 0.01 | |||||||||||
Net realized and unrealized gain | 9.64 | 12.08 | 0.60 | 2.95 | ||||||||||||||
Total from investment operations | 9.49 | 12.01 | 0.56 | 2.96 | ||||||||||||||
Distributions to shareholders from net realized gains | (2.65 | ) | (3.71 | ) | (5.06 | ) | — | |||||||||||
Net asset value, end of period | $ | 41.43 | $ | 34.59 | $ | 26.29 | $ | 30.79 | ||||||||||
| Total Return(c) | 29.44 | % | 51.51 | % | 5.11 | % | 10.64 | % | ||||||||||
Net assets, end of period (in 000’s) | $ | 145,094 | $ | 63,555 | $ | 24,396 | $ | 24,951 | ||||||||||
Ratio of net expenses to average net assets | 0.97 | % | 0.98 | % | 0.97 | % | 0.97 | %(d) | ||||||||||
Ratio of total expenses to average net assets | 1.03 | % | 1.07 | % | 1.08 | % | 1.14 | %(d) | ||||||||||
Ratio of net investment income (loss) to average net assets | (0.43 | )% | (0.25 | )% | (0.16 | )% | 0.08 | %(d) | ||||||||||
Portfolio turnover rate(e) | 41 | % | 41 | % | 27 | % | 46 | % | ||||||||||
| (a) | Commenced operations on April 17, 2018. |
| (b) | Calculated based on the average shares outstanding methodology. |
| (c) | Assumes investment at the NAV at the beginning of the period, reinvestment of all dividends and distributions, a complete redemption of the investment at the NAV at the end of the period and no sales or redemption charges (if any). Total returns would be reduced if a sales or redemption charge was taken into account. Returns do not reflect the impact of taxes to shareholders relating to Fund distributions or the redemption of Fund shares. Total returns for periods less than one full year are not annualized. |
| (d) | Annualized. |
| (e) | The Fund’s portfolio turnover rate is calculated in accordance with regulatory requirements, without regard to transactions involving short term investments. If such transactions were included, the Fund’s portfolio turnover rate may be higher. |
| The accompanying notes are an integral part of these financial statements. | 141 |
GOLDMAN SACHS U.S. EQUITY ESG FUND
Financial Highlights (continued)
Selected Share Data for a Share Outstanding Throughout Each Year
| Goldman Sachs U.S. Equity ESG Fund | ||||||||||||||||||||||
| Class A Shares | ||||||||||||||||||||||
| Year Ended August 31, | ||||||||||||||||||||||
| 2021 | 2020 | 2019 | 2018 | 2017 | ||||||||||||||||||
| Per Share Data |
| |||||||||||||||||||||
Net asset value, beginning of year | $ | 15.63 | $ | 13.59 | $ | 14.00 | $ | 14.84 | $ | 13.08 | ||||||||||||
Net investment income(a) | 0.04 | 0.09 | 0.12 | 0.11 | 0.07 | |||||||||||||||||
Net realized and unrealized gain | 4.91 | 2.56 | 0.64 | 2.15 | 1.76 | |||||||||||||||||
Total from investment operations | 4.95 | 2.65 | 0.76 | 2.26 | 1.83 | |||||||||||||||||
Distributions to shareholders from net investment income | (0.07 | ) | (0.15 | ) | (0.08 | ) | (0.09 | ) | (0.07 | ) | ||||||||||||
Distributions to shareholders from net realized gains | (1.62 | ) | (0.46 | ) | (1.09 | ) | (3.01 | ) | — | (b) | ||||||||||||
Total distributions | (1.69 | ) | (0.61 | ) | (1.17 | ) | (3.10 | ) | (0.07 | ) | ||||||||||||
Net asset value, end of year | $ | 18.89 | $ | 15.63 | $ | 13.59 | $ | 14.00 | $ | 14.84 | ||||||||||||
| Total Return(c) | 34.66 | % | 19.93 | % | 6.80 | % | 17.50 | % | 14.06 | % | ||||||||||||
Net assets, end of year (in 000’s) | $ | 7,354 | $ | 5,448 | $ | 3,878 | $ | 2,533 | $ | 1,880 | ||||||||||||
Ratio of net expenses to average net assets | 1.01 | % | 1.05 | % | 1.03 | % | 1.04 | % | 1.17 | % | ||||||||||||
Ratio of total expenses to average net assets | 3.73 | % | 3.30 | % | 4.26 | % | 5.12 | % | 4.64 | % | ||||||||||||
Ratio of net investment income to average net assets | 0.26 | % | 0.64 | % | 0.90 | % | 0.81 | % | 0.53 | % | ||||||||||||
Portfolio turnover rate(d) | 31 | % | 65 | % | 47 | % | 71 | % | 77 | % | ||||||||||||
| (a) | Calculated based on the average shares outstanding methodology. |
| (b) | Amount is less than $0.005 per share. |
| (c) | Assumes investment at the NAV at the beginning of the year, reinvestment of all dividends and distributions, a complete redemption of the investment at the NAV at the end of the year and no sales or redemption charges (if any). Total returns would be reduced if a sales or redemption charge was taken into account. Returns do not reflect the impact of taxes to shareholders relating to Fund distributions or the redemption of Fund shares. |
| (d) | The Fund’s portfolio turnover rate is calculated in accordance with regulatory requirements, without regard to transactions involving short term investments. If such transactions were included, the Fund’s portfolio turnover rate may be higher. |
| 142 | The accompanying notes are an integral part of these financial statements. |
GOLDMAN SACHS U.S. EQUITY ESG FUND
Financial Highlights (continued)
Selected Share Data for a Share Outstanding Throughout Each Year
| Goldman Sachs U.S. Equity ESG Fund | ||||||||||||||||||||||
| Class C Shares | ||||||||||||||||||||||
| Year Ended August 31, | ||||||||||||||||||||||
| 2021 | 2020 | 2019 | 2018 | 2017 | ||||||||||||||||||
| Per Share Data |
| |||||||||||||||||||||
Net asset value, beginning of year | $ | 14.79 | $ | 12.91 | $ | 13.40 | $ | 14.36 | $ | 12.69 | ||||||||||||
Net investment income (loss)(a) | (0.08 | ) | (0.01 | ) | 0.02 | 0.01 | (0.02 | ) | ||||||||||||||
Net realized and unrealized gain | 4.62 | 2.41 | 0.62 | 2.07 | 1.69 | |||||||||||||||||
Total from investment operations | 4.54 | 2.40 | 0.64 | 2.08 | 1.67 | |||||||||||||||||
Distributions to shareholders from net investment income | — | (0.06 | ) | (0.04 | ) | (0.03 | ) | — | ||||||||||||||
Distributions to shareholders from net realized gains | (1.62 | ) | (0.46 | ) | (1.09 | ) | (3.01 | ) | — | (b) | ||||||||||||
Total distributions | (1.62 | ) | (0.52 | ) | (1.13 | ) | (3.04 | ) | — | (b) | ||||||||||||
Net asset value, end of year | $ | 17.71 | $ | 14.79 | $ | 12.91 | $ | 13.40 | $ | 14.36 | ||||||||||||
| Total Return(c) | 33.65 | % | 18.97 | % | 6.04 | % | 16.66 | % | 13.18 | % | ||||||||||||
Net assets, end of year (in 000’s) | $ | 2,430 | $ | 1,985 | $ | 1,487 | $ | 172 | $ | 178 | ||||||||||||
Ratio of net expenses to average net assets | 1.76 | % | 1.80 | % | 1.78 | % | 1.80 | % | 1.92 | % | ||||||||||||
Ratio of total expenses to average net assets | 4.46 | % | 4.07 | % | 4.97 | % | 5.86 | % | 5.38 | % | ||||||||||||
Ratio of net investment income (loss) to average net assets | (0.49 | )% | (0.11 | )% | 0.18 | % | 0.05 | % | (0.18 | )% | ||||||||||||
Portfolio turnover rate(d) | 31 | % | 65 | % | 47 | % | 71 | % | 77 | % | ||||||||||||
| (a) | Calculated based on the average shares outstanding methodology. |
| (b) | Amount is less than $0.005 per share. |
| (c) | Assumes investment at the NAV at the beginning of the year, reinvestment of all dividends and distributions, a complete redemption of the investment at the NAV at the end of the year and no sales or redemption charges (if any). Total returns would be reduced if a sales or redemption charge was taken into account. Returns do not reflect the impact of taxes to shareholders relating to Fund distributions or the redemption of Fund shares. |
| (d) | The Fund’s portfolio turnover rate is calculated in accordance with regulatory requirements, without regard to transactions involving short term investments. If such transactions were included, the Fund’s portfolio turnover rate may be higher. |
| The accompanying notes are an integral part of these financial statements. | 143 |
GOLDMAN SACHS U.S. EQUITY ESG FUND
Financial Highlights (continued)
Selected Share Data for a Share Outstanding Throughout Each Year
| Goldman Sachs U.S. Equity ESG Fund | ||||||||||||||||||||||
| Institutional Shares | ||||||||||||||||||||||
| Year Ended August 31, | ||||||||||||||||||||||
| 2021 | 2020 | 2019 | 2018 | 2017 | ||||||||||||||||||
| Per Share Data |
| |||||||||||||||||||||
Net asset value, beginning of year | $ | 15.80 | $ | 13.73 | $ | 14.10 | $ | 14.92 | $ | 13.17 | ||||||||||||
Net investment income(a) | 0.10 | 0.14 | 0.16 | 0.16 | 0.12 | |||||||||||||||||
Net realized and unrealized gain | 4.97 | 2.58 | 0.67 | 2.17 | 1.77 | |||||||||||||||||
Total from investment operations | 5.07 | 2.72 | 0.83 | 2.33 | 1.89 | |||||||||||||||||
Distributions to shareholders from net investment income | (0.12 | ) | (0.19 | ) | (0.11 | ) | (0.14 | ) | (0.14 | ) | ||||||||||||
Distributions to shareholders from net realized gains | (1.62 | ) | (0.46 | ) | (1.09 | ) | (3.01 | ) | — | (b) | ||||||||||||
Total distributions | (1.74 | ) | (0.65 | ) | (1.20 | ) | (3.15 | ) | (0.14 | ) | ||||||||||||
Net asset value, end of year | $ | 19.13 | $ | 15.80 | $ | 13.73 | $ | 14.10 | $ | 14.92 | ||||||||||||
| Total Return(c) | 35.11 | % | 20.29 | % | 7.27 | % | 17.92 | % | 14.43 | % | ||||||||||||
Net assets, end of year (in 000’s) | $ | 1,921 | $ | 1,009 | $ | 791 | $ | 4,969 | $ | 3,499 | ||||||||||||
Ratio of net expenses to average net assets | 0.67 | % | 0.70 | % | 0.67 | % | 0.68 | % | 0.79 | % | ||||||||||||
Ratio of total expenses to average net assets | 3.39 | % | 2.99 | % | 3.97 | % | 4.65 | % | 4.28 | % | ||||||||||||
Ratio of net investment income to average net assets | 0.60 | % | 0.99 | % | 1.22 | % | 1.20 | % | 0.88 | % | ||||||||||||
Portfolio turnover rate(d) | 31 | % | 65 | % | 47 | % | 71 | % | 77 | % | ||||||||||||
| (a) | Calculated based on the average shares outstanding methodology. |
| (b) | Amount is less than $0.005 per share. |
| (c) | Assumes investment at the NAV at the beginning of the year, reinvestment of all dividends and distributions, a complete redemption of the investment at the NAV at the end of the year and no sales or redemption charges (if any). Total returns would be reduced if a sales or redemption charge was taken into account. Returns do not reflect the impact of taxes to shareholders relating to Fund distributions or the redemption of Fund shares. |
| (d) | The Fund’s portfolio turnover rate is calculated in accordance with regulatory requirements, without regard to transactions involving short term investments. If such transactions were included, the Fund’s portfolio turnover rate may be higher. |
| 144 | The accompanying notes are an integral part of these financial statements. |
GOLDMAN SACHS U.S. EQUITY ESG FUND
Financial Highlights (continued)
Selected Share Data for a Share Outstanding Throughout Each Year
| Goldman Sachs U.S. Equity ESG Fund | ||||||||||||||||||||||
| Investor Shares | ||||||||||||||||||||||
| Year Ended August 31, | ||||||||||||||||||||||
| 2021 | 2020 | 2019 | 2018 | 2017 | ||||||||||||||||||
| Per Share Data |
| |||||||||||||||||||||
Net asset value, beginning of year | $ | 15.81 | $ | 13.72 | $ | 14.11 | $ | 14.92 | $ | 13.16 | ||||||||||||
Net investment income(a) | 0.09 | 0.11 | 0.15 | 0.14 | 0.11 | |||||||||||||||||
Net realized and unrealized gain | 4.96 | 2.60 | 0.65 | 2.18 | 1.76 | |||||||||||||||||
Total from investment operations | 5.05 | 2.71 | 0.80 | 2.32 | 1.87 | |||||||||||||||||
Distributions to shareholders from net investment income | (0.10 | ) | (0.16 | ) | (0.10 | ) | (0.12 | ) | (0.11 | ) | ||||||||||||
Distributions to shareholders from net realized gains | (1.62 | ) | (0.46 | ) | (1.09 | ) | (3.01 | ) | — | (b) | ||||||||||||
Total distributions | (1.72 | ) | (0.62 | ) | (1.19 | ) | (3.13 | ) | (0.11 | ) | ||||||||||||
Net asset value, end of year | $ | 19.14 | $ | 15.81 | $ | 13.72 | $ | 14.11 | $ | 14.92 | ||||||||||||
| Total Return(c) | 34.99 | % | 20.23 | % | 7.05 | % | 17.86 | % | 14.27 | % | ||||||||||||
Net assets, end of year (in 000’s) | $ | 878 | $ | 344 | $ | 1,064 | $ | 235 | $ | 188 | ||||||||||||
Ratio of net expenses to average net assets | 0.76 | % | 0.85 | % | 0.78 | % | 0.79 | % | 0.92 | % | ||||||||||||
Ratio of total expenses to average net assets | 3.79 | % | 3.75 | % | 4.06 | % | 4.87 | % | 4.47 | % | ||||||||||||
Ratio of net investment income to average net assets | 0.52 | % | 0.76 | % | 1.16 | % | 1.06 | % | 0.78 | % | ||||||||||||
Portfolio turnover rate(d) | 31 | % | 65 | % | 47 | % | 71 | % | 77 | % | ||||||||||||
| (a) | Calculated based on the average shares outstanding methodology. |
| (b) | Amount is less than $0.005 per share. |
| (c) | Assumes investment at the NAV at the beginning of the year, reinvestment of all dividends and distributions, a complete redemption of the investment at the NAV at the end of the year and no sales or redemption charges (if any). Total returns would be reduced if a sales or redemption charge was taken into account. Returns do not reflect the impact of taxes to shareholders relating to Fund distributions or the redemption of Fund shares. |
| (d) | The Fund’s portfolio turnover rate is calculated in accordance with regulatory requirements, without regard to transactions involving short term investments. If such transactions were included, the Fund’s portfolio turnover rate may be higher. |
| The accompanying notes are an integral part of these financial statements. | 145 |
GOLDMAN SACHS U.S. EQUITY ESG FUND
Financial Highlights (continued)
Selected Share Data for a Share Outstanding Throughout Each Year
| Goldman Sachs U.S. Equity ESG Fund | ||||||||||||||||||||||
| Class R6 Shares | ||||||||||||||||||||||
| Year Ended August 31, | ||||||||||||||||||||||
| 2021 | 2020 | 2019 | 2018 | 2017 | ||||||||||||||||||
| Per Share Data |
| |||||||||||||||||||||
Net asset value, beginning of year | $ | 15.81 | $ | 13.73 | $ | 14.11 | $ | 14.93 | $ | 13.17 | ||||||||||||
Net investment income(a) | 0.10 | 0.13 | 0.17 | 0.16 | 0.13 | |||||||||||||||||
Net realized and unrealized gain | 4.96 | 2.60 | 0.65 | 2.17 | 1.77 | |||||||||||||||||
Total from investment operations | 5.06 | 2.73 | 0.82 | 2.33 | 1.90 | |||||||||||||||||
Distributions to shareholders from net investment income | (0.11 | ) | (0.19 | ) | (0.11 | ) | (0.14 | ) | (0.14 | ) | ||||||||||||
Distributions to shareholders from net realized gains | (1.62 | ) | (0.46 | ) | (1.09 | ) | (3.01 | ) | — | (b) | ||||||||||||
Total distributions | (1.73 | ) | (0.65 | ) | (1.20 | ) | (3.15 | ) | (0.14 | ) | ||||||||||||
Net asset value, end of year | $ | 19.14 | $ | 15.81 | $ | 13.73 | $ | 14.11 | $ | 14.93 | ||||||||||||
| Total Return(c) | 35.09 | % | 20.37 | % | 7.20 | % | 17.94 | % | 14.52 | % | ||||||||||||
Net assets, end of year (in 000’s) | $ | 1,199 | $ | 1,325 | $ | 3,229 | $ | 11 | $ | 11 | ||||||||||||
Ratio of net expenses to average net assets | 0.66 | % | 0.71 | % | 0.66 | % | 0.68 | % | 0.77 | % | ||||||||||||
Ratio of total expenses to average net assets | 3.30 | % | 3.84 | % | 3.76 | % | 4.73 | % | 4.20 | % | ||||||||||||
Ratio of net investment income to average net assets | 0.60 | % | 0.96 | % | 1.31 | % | 1.16 | % | 0.95 | % | ||||||||||||
Portfolio turnover rate(d) | 31 | % | 65 | % | 47 | % | 71 | % | 77 | % | ||||||||||||
| (a) | Calculated based on the average shares outstanding methodology. |
| (b) | Amount is less than $0.005 per share. |
| (c) | Assumes investment at the NAV at the beginning of the year, reinvestment of all dividends and distributions, a complete redemption of the investment at the NAV at the end of the year and no sales or redemption charges (if any). Total returns would be reduced if a sales or redemption charge was taken into account. Returns do not reflect the impact of taxes to shareholders relating to Fund distributions or the redemption of Fund shares. |
| (d) | The Fund’s portfolio turnover rate is calculated in accordance with regulatory requirements, without regard to transactions involving short term investments. If such transactions were included, the Fund’s portfolio turnover rate may be higher. |
| 146 | The accompanying notes are an integral part of these financial statements. |
GOLDMAN SACHS U.S. EQUITY ESG FUND
Financial Highlights (continued)
Selected Share Data for a Share Outstanding Throughout Each Year
| Goldman Sachs U.S. Equity ESG Fund | ||||||||||||||||||||||
| Class R Shares | ||||||||||||||||||||||
| Year Ended August 31, | ||||||||||||||||||||||
| 2021 | 2020 | 2019 | 2018 | 2017 | ||||||||||||||||||
| Per Share Data |
| |||||||||||||||||||||
Net asset value, beginning of year | $ | 15.72 | $ | 13.67 | $ | 14.07 | $ | 14.89 | $ | 13.09 | ||||||||||||
Net investment income(a) | 0.03 | 0.05 | 0.08 | 0.08 | 0.04 | |||||||||||||||||
Net realized and unrealized gain | 4.92 | 2.57 | 0.67 | 2.16 | 1.76 | |||||||||||||||||
Total from investment operations | 4.95 | 2.62 | 0.75 | 2.24 | 1.80 | |||||||||||||||||
Distributions to shareholders from net investment income | (0.04 | ) | (0.11 | ) | (0.06 | ) | (0.05 | ) | — | |||||||||||||
Distributions to shareholders from net realized gains | (1.62 | ) | (0.46 | ) | (1.09 | ) | (3.01 | ) | — | (b) | ||||||||||||
Total distributions | (1.66 | ) | (0.57 | ) | (1.15 | ) | (3.06 | ) | — | (b) | ||||||||||||
Net asset value, end of year | $ | 19.01 | $ | 15.72 | $ | 13.67 | $ | 14.07 | $ | 14.89 | ||||||||||||
| Total Return(c) | 34.35 | % | 19.56 | % | 6.58 | % | 17.21 | % | 13.77 | % | ||||||||||||
Net assets, end of year (in 000’s) | $ | 482 | $ | 23 | $ | 20 | $ | 20 | $ | 22 | ||||||||||||
Ratio of net expenses to average net assets | 1.26 | % | 1.30 | % | 1.27 | % | 1.29 | % | 1.41 | % | ||||||||||||
Ratio of total expenses to average net assets | 5.23 | % | 3.68 | % | 4.53 | % | 5.36 | % | 4.88 | % | ||||||||||||
Ratio of net investment income to average net assets | 0.15 | % | 0.39 | % | 0.64 | % | 0.55 | % | 0.30 | % | ||||||||||||
Portfolio turnover rate(d) | 31 | % | 65 | % | 47 | % | 71 | % | 77 | % | ||||||||||||
| (a) | Calculated based on the average shares outstanding methodology. |
| (b) | Amount is less than $0.005 per share. |
| (c) | Assumes investment at the NAV at the beginning of the year, reinvestment of all dividends and distributions, a complete redemption of the investment at the NAV at the end of the year and no sales or redemption charges (if any). Total returns would be reduced if a sales or redemption charge was taken into account. Returns do not reflect the impact of taxes to shareholders relating to Fund distributions or the redemption of Fund shares. |
| (d) | The Fund’s portfolio turnover rate is calculated in accordance with regulatory requirements, without regard to transactions involving short term investments. If such transactions were included, the Fund’s portfolio turnover rate may be higher. |
| The accompanying notes are an integral part of these financial statements. | 147 |
GOLDMAN SACHS U.S. EQUITY ESG FUND
Financial Highlights (continued)
Selected Share Data for a Share Outstanding Throughout Each Period
| Goldman Sachs U.S. Equity ESG Fund | ||||||||||||||||||
| Class P Shares | ||||||||||||||||||
| Year Ended August 31, | Period Ended August 31, 2018(a) | |||||||||||||||||
| 2021 | 2020 | 2019 | ||||||||||||||||
| Per Share Data |
| |||||||||||||||||
Net asset value, beginning of period | $ | 15.80 | $ | 13.73 | $ | 14.11 | $ | 13.06 | ||||||||||
Net investment income(b) | 0.11 | 0.14 | 0.17 | 0.06 | ||||||||||||||
Net realized and unrealized gain | 4.95 | 2.58 | 0.65 | 0.99 | ||||||||||||||
Total from investment operations | 5.06 | 2.72 | 0.82 | 1.05 | ||||||||||||||
Distributions to shareholders from net investment income | (0.11 | ) | (0.19 | ) | (0.11 | ) | — | |||||||||||
Distributions to shareholders from net realized gains | (1.62 | ) | (0.46 | ) | (1.09 | ) | — | |||||||||||
Total distributions | (1.73 | ) | (0.65 | ) | (1.20 | ) | — | |||||||||||
Net asset value, end of period | $ | 19.13 | $ | 15.80 | $ | 13.73 | $ | 14.11 | ||||||||||
| Total Return(c) | 35.11 | % | 20.30 | % | 7.22 | % | 8.04 | % | ||||||||||
Net assets, end of period (in 000’s) | $ | 2,963 | $ | 830 | $ | 2,135 | $ | 2,026 | ||||||||||
Ratio of net expenses to average net assets | 0.66 | % | 0.71 | % | 0.66 | % | 0.66 | %(d) | ||||||||||
Ratio of total expenses to average net assets | 3.70 | % | 3.98 | % | 3.88 | % | 5.72 | %(d) | ||||||||||
Ratio of net investment income to average net assets | 0.63 | % | 0.98 | % | 1.26 | % | 1.23 | %(d) | ||||||||||
Portfolio turnover rate(e) | 31 | % | 65 | % | 47 | % | 71 | % | ||||||||||
| (a) | Commenced operations on April 17, 2018. |
| (b) | Calculated based on the average shares outstanding methodology. |
| (c) | Assumes investment at the NAV at the beginning of the period, reinvestment of all dividends and distributions, a complete redemption of the investment at the NAV at the end of the period and no sales or redemption charges (if any). Total returns would be reduced if a sales or redemption charge was taken into account. Returns do not reflect the impact of taxes to shareholders relating to Fund distributions or the redemption of Fund shares. Total returns for periods less than one full year are not annualized. |
| (d) | Annualized. |
| (e) | The Fund’s portfolio turnover rate is calculated in accordance with regulatory requirements, without regard to transactions involving short term investments. If such transactions were included, the Fund’s portfolio turnover rate may be higher. |
| 148 | The accompanying notes are an integral part of these financial statements. |
GOLDMAN SACHS FUNDAMENTAL EQUITY GROWTH FUNDS
August 31, 2021
| 1. ORGANIZATION |
Goldman Sachs Trust (the “Trust”) is a Delaware statutory trust registered under the Investment Company Act of 1940, as amended (the “Act”), as an open-end management investment company. The following table lists those series of the Trust that are included in this report (collectively, the “Funds” or individually a “Fund”), along with their corresponding share classes and respective diversification status under the Act:
| Fund | Share Classes Offered | Diversified/ Non-Diversified | ||
Capital Growth, Growth Opportunities and Small/Mid Cap Growth | A, C, Institutional, Service, Investor, R6, R and P | Diversified | ||
Strategic Growth | A, C, Institutional, Service, Investor, R6, R and P | Non-Diversified | ||
| Concentrated Growth, Flexible Cap, Small Cap Growth and U.S. Equity ESG Fund | A, C, Institutional, Investor, R6, R and P | Diversified | ||
Technology Opportunities | A, C, Institutional, Service, Investor, R6 and P | Diversified |
Class A Shares are sold with a front-end sales charge of up to 5.50%. Class C Shares are sold with a contingent deferred sales charge (“CDSC”) of 1.00%, which is imposed on redemptions made within 12 months of purchase. Institutional, Service, Investor, Class R6, Class R and Class P Shares are not subject to a sales charge.
Goldman Sachs Asset Management, L.P. (“GSAM”), an affiliate of Goldman Sachs & Co. LLC (“Goldman Sachs”), serves as investment adviser to the Funds pursuant to a management agreement (the “Agreement”) with the Trust.
| 2. SIGNIFICANT ACCOUNTING POLICIES |
The financial statements have been prepared in accordance with accounting principles generally accepted in the United States of America (“GAAP”) and require management to make estimates and assumptions that may affect the reported amounts and disclosures. Actual results may differ from those estimates and assumptions. Each Fund is an investment company under GAAP and follows the accounting and reporting guidance applicable to investment companies.
A. Investment Valuation — The Funds’ valuation policy is to value investments at fair value.
B. Investment Income and Investments — Investment income includes interest income, dividend income and securities lending income, if any. Interest income is accrued daily and adjusted for amortization of premiums and accretion of discounts. Dividend income is recognized on ex-dividend date or, for certain foreign securities, as soon as such information is obtained subsequent to the ex-dividend date. Non-cash dividends, if any, are recorded at the fair market value of the securities received. Investment transactions are reflected on trade date. Realized gains and losses are calculated using identified cost. Investment transactions are recorded on the following business day for daily net asset value (“NAV”) calculations. Investment income is recorded net of any foreign withholding taxes, less any amounts reclaimable. The Funds may file withholding tax reclaims in certain jurisdictions to recover a portion of amounts previously withheld. These reclaims if any, are recorded when the amount is known and there are no significant uncertainties on collectability. Such amounts recovered if any, are reflected as other income in the Statements of Operations. Any foreign capital gains tax is accrued daily based upon net unrealized gains, and is payable upon sale of such investments. Distributions received from the Funds’ investments in U.S. real estate investment trusts (“REITs”) may be characterized as ordinary income, net capital gain and/or a return of capital. A return of capital is recorded by the Funds as a reduction to the cost basis of the REIT.
C. Class Allocations and Expenses — Investment income, realized and unrealized gain (loss), if any, and non-class specific expenses of each Fund are allocated daily based upon the proportion of net assets of each class. Non-class specific expenses directly incurred by a Fund are charged to that Fund, while such expenses incurred by the Trust are allocated across the applicable Funds on a straight-line and/or pro-rata basis depending upon the nature of the expenses. Class specific expenses, where
149
GOLDMAN SACHS FUNDAMENTAL EQUITY GROWTH FUNDS
Notes to Financial Statements (continued)
August 31, 2021
| 2. SIGNIFICANT ACCOUNTING POLICIES (continued) |
applicable, are borne by the respective share classes and include Distribution and Service, Transfer Agency and Service and Shareholder Administration fees.
D. Federal Taxes and Distributions to Shareholders — It is each Fund’s policy to comply with the requirements of the Internal Revenue Code of 1986, as amended (the “Code”), applicable to regulated investment companies and to distribute each year substantially all of its investment company taxable income and capital gains to its shareholders. Accordingly, each Fund is not required to make any provisions for the payment of federal income tax. Distributions to shareholders are recorded on the ex-dividend date. Income and capital gains distributions, if any, are declared and paid at least annually.
Net capital losses, if any, are carried forward to future fiscal years and may be used to the extent allowed by the Code to offset any future capital gains. Losses that are carried forward will retain their character as either short-term or long-term capital losses. Utilization of capital loss carryforwards will reduce the requirement of future capital gains distributions.
The characterization of distributions to shareholders for financial reporting purposes is determined in accordance with federal income tax rules, which may differ from GAAP. The source of each Fund’s distributions may be shown in the accompanying financial statements as either from distributable earnings or capital. Certain components of the Funds’ net assets on the Statements of Assets and Liabilities reflect permanent GAAP/tax differences based on the appropriate tax character.
E. Foreign Currency Translation — The accounting records and reporting currency of the Funds are maintained in U.S. dollars. Assets and liabilities denominated in foreign currencies are translated into U.S. dollars using the current exchange rates at the close of each business day. The effect of changes in foreign currency exchange rates on investments is included within net realized and unrealized gain (loss) on investments. Changes in the value of other assets and liabilities as a result of fluctuations in foreign exchange rates are included in the Statements of Operations within net change in unrealized gain (loss) on foreign currency translation. Transactions denominated in foreign currencies are translated into U.S. dollars on the date the transaction occurred, the effects of which are included within net realized gain (loss) on foreign currency transactions.
F. Offering Costs — Offering costs paid in connection with the initial offering of shares of Small Cap Growth Fund are being amortized on a straight-line basis over 12 months from the date of commencement of operations.
| 3. INVESTMENTS AND FAIR VALUE MEASUREMENTS |
U.S. GAAP defines the fair value of a financial instrument as the amount that would be received to sell an asset or paid to transfer a liability in an orderly transaction between market participants at the measurement date (i.e., the exit price); the Funds’ policy is to use the market approach. GAAP establishes a fair value hierarchy that prioritizes the inputs to valuation techniques used to measure fair value. The hierarchy gives the highest priority to unadjusted quoted prices in active markets for identical assets or liabilities (Level 1 measurements) and the lowest priority to unobservable inputs (Level 3 measurements). The level in the fair value hierarchy within which the fair value measurement in its entirety falls shall be determined based on the lowest level input that is significant to the fair value measurement in its entirety. The levels used for classifying investments are not necessarily an indication of the risk associated with investing in these investments. The three levels of the fair value hierarchy are described below:
Level 1 — Unadjusted quoted prices in active markets that are accessible at the measurement date for identical, unrestricted assets or liabilities;
Level 2 — Quoted prices in markets that are not active or financial instruments for which significant inputs are observable (including, but not limited to, quoted prices for similar investments, interest rates, foreign exchange rates, volatility and credit spreads), either directly or indirectly;
Level 3 — Prices or valuations that require significant unobservable inputs (including GSAM’s assumptions in determining fair value measurement).
The Board of Trustees (“Trustees”) has approved Valuation Procedures that govern the valuation of the portfolio investments held by the Funds, including investments for which market quotations are not readily available. The Trustees have delegated to GSAM
150
GOLDMAN SACHS FUNDAMENTAL EQUITY GROWTH FUNDS
| 3. INVESTMENTS AND FAIR VALUE MEASUREMENTS (continued) |
day-to-day responsibility for implementing and maintaining internal controls and procedures related to the valuation of the Funds’ investments. To assess the continuing appropriateness of pricing sources and methodologies, GSAM regularly performs price verification procedures and issues challenges as necessary to third party pricing vendors or brokers, and any differences are reviewed in accordance with the Valuation Procedures.
A. Level 1 and Level 2 Fair Value Investments — The valuation techniques and significant inputs used in determining the fair values for investments classified as Level 1 and Level 2 are as follows:
Equity Securities — Equity securities traded on a United States (“U.S.”) securities exchange or the NASDAQ system, or those located on certain foreign exchanges, including but not limited to the Americas, are valued daily at their last sale price or official closing price on the principal exchange or system on which they are traded. If there is no sale or official closing price or such price is believed by GSAM to not represent fair value, equity securities will be valued at the valid closing bid price for long positions and at the valid closing ask price for short positions (i.e. where there is sufficient volume, during normal exchange trading hours). If no valid bid/ask price is available, the equity security will be valued pursuant to the Valuation Procedures approved by the Trustees and consistent with applicable regulatory guidance. To the extent these investments are actively traded, they are classified as Level 1 of the fair value hierarchy, otherwise they are generally classified as Level 2. Certain equity securities containing unique attributes may be classified as Level 2.
Unlisted equity securities for which market quotations are available are valued at the last sale price on the valuation date, or if no sale occurs, at the last bid price for long positions or the last ask price for short positions, and are generally classified as Level 2. Securities traded on certain foreign securities exchanges are valued daily at fair value determined by an independent fair value service (if available) under Fair Valuation Procedures approved by the Trustees and consistent with applicable regulatory guidance. The independent fair value service takes into account multiple factors including, but not limited to, movements in the securities markets, certain depositary receipts, futures contracts and foreign currency exchange rates that have occurred subsequent to the close of the foreign securities exchange. These investments are generally classified as Level 2 of the fair value hierarchy.
Money Market Funds — Investments in the Goldman Sachs Financial Square Government Fund (“Underlying Fund”) are valued at the NAV per share of the Institutional Share class on the day of valuation. These investments are generally classified as Level 1 of the fair value hierarchy. For information regarding the Underlying Fund’s accounting policies and investment holdings, please see the Underlying Fund’s shareholder report.
B. Level 3 Fair Value Investments — To the extent that significant inputs to valuation models and other alternative pricing sources are unobservable, or if quotations are not readily available, or if GSAM believes that such quotations do not accurately reflect fair value, the fair value of a Fund’s investments may be determined under Valuation Procedures approved by the Trustees. GSAM, consistent with its procedures and applicable regulatory guidance, may make an adjustment to the most recent valuation prices of either domestic or foreign securities in light of significant events to reflect what it believes to be the fair value of the securities at the time of determining a Fund’s NAV. To the extent investments are valued using single source broker quotations obtained directly from the broker or passed through from third party pricing vendors, such investments are classified as Level 3 investments.
151
GOLDMAN SACHS FUNDAMENTAL EQUITY GROWTH FUNDS
Notes to Financial Statements (continued)
August 31, 2021
| 3. INVESTMENTS AND FAIR VALUE MEASUREMENTS (continued) |
C. Fair Value Hierarchy — The following is a summary of the Funds’ investments classified in the fair value hierarchy as of August 31, 2021:
| CAPITAL GROWTH FUND |
| |||||||||||
| Investment Type | Level 1 | Level 2 | Level 3 | |||||||||
| Assets | ||||||||||||
Common Stock and/or Other Equity Investments(a) |
| |||||||||||
Asia | $ | 6,135,535 | $ | — | $ | — | ||||||
Europe | 21,174,088 | — | — | |||||||||
North America | 1,236,338,510 | — | — | |||||||||
Investment Company | 4,496,378 | — | — | |||||||||
Securities Lending Reinvestment Vehicle | 3,856,622 | — | — | |||||||||
| Total | $ | 1,272,001,133 | $ | — | $ | — | ||||||
| CONCENTRATED GROWTH FUND |
| |||||||||||
| Investment Type | Level 1 | Level 2 | Level 3 | |||||||||
| Assets | ||||||||||||
Common Stock and/or Other Equity Investments(a) |
| |||||||||||
Europe | $ | 4,476,089 | $ | — | $ | — | ||||||
North America | 217,095,701 | — | — | |||||||||
Investment Company | 164,062 | — | — | |||||||||
| Total | $ | 221,735,852 | $ | — | $ | — | ||||||
| FLEXIBLE CAP FUND |
| |||||||||||
| Investment Type | Level 1 | Level 2 | Level 3 | |||||||||
| Assets | ||||||||||||
Common Stock and/or Other Equity Investments(a) |
| |||||||||||
Asia | $ | 226,532 | $ | — | $ | — | ||||||
Europe | 957,816 | — | — | |||||||||
North America | 36,638,895 | — | — | |||||||||
Investment Company | 544,338 | — | — | |||||||||
| Total | $ | 38,367,581 | $ | — | $ | — | ||||||
| GROWTH OPPORTUNITIES FUND |
| |||||||||||
| Investment Type | Level 1 | Level 2 | Level 3 | |||||||||
| Assets | ||||||||||||
Common Stock and/or Other Equity Investments(a) |
| |||||||||||
Europe | $ | 22,801,920 | $ | — | $ | — | ||||||
North America | 1,433,037,307 | — | — | |||||||||
Investment Company | 13,911,294 | — | — | |||||||||
Securities Lending Reinvestment Vehicle | 7,447,030 | — | — | |||||||||
| Total | $ | 1,477,197,551 | $ | — | $ | — | ||||||
| (a) | Amounts are disclosed by continent to highlight the impact of time zone differences between local market close and the calculation of NAV. Security valuations are based on the principal exchange or system on which they are traded, which may differ from country of domicile noted in table. |
152
GOLDMAN SACHS FUNDAMENTAL EQUITY GROWTH FUNDS
| 3. INVESTMENTS AND FAIR VALUE MEASUREMENTS (continued) |
| SMALL CAP GROWTH FUND |
| |||||||||||
| Investment Type | Level 1 | Level 2 | Level 3 | |||||||||
| Assets | ||||||||||||
Common Stock and/or Other Equity Investments(a) |
| |||||||||||
Asia | $ | 140,364 | $ | — | $ | — | ||||||
Europe | 214,667 | — | — | |||||||||
North America | 20,075,867 | — | — | |||||||||
Investment Company | 249,984 | — | — | |||||||||
Securities Lending Reinvestment Vehicle | 141,504 | — | — | |||||||||
| Total | $ | 20,822,386 | $ | — | $ | — | ||||||
| SMALL/MID CAP GROWTH FUND |
| |||||||||||
| Investment Type | Level 1 | Level 2 | Level 3 | |||||||||
| Assets | ||||||||||||
Common Stock and/or Other Equity Investments(a) |
| |||||||||||
Asia | $ | 31,507,876 | $ | — | $ | — | ||||||
Europe | 49,724,918 | — | — | |||||||||
North America | 3,390,613,643 | — | — | |||||||||
Investment Company | 31,272,380 | — | — | |||||||||
Securities Lending Reinvestment Vehicle | 18,738,133 | — | — | |||||||||
| Total | $ | 3,521,856,950 | $ | — | $ | — | ||||||
| STRATEGIC GROWTH FUND |
| |||||||||||
| Investment Type | Level 1 | Level 2 | Level 3 | |||||||||
| Assets | ||||||||||||
Common Stock and/or Other Equity Investments(a) |
| |||||||||||
Europe | $ | 3,550,819 | $ | — | $ | — | ||||||
North America | 220,959,951 | — | — | |||||||||
Investment Company | 1,330,594 | — | — | |||||||||
Securities Lending Reinvestment Vehicle | 1,015,902 | — | — | |||||||||
| Total | $ | 226,857,266 | $ | — | $ | — | ||||||
| TECHNOLOGY OPPORTUNITIES FUND |
| |||||||||||
| Investment Type | Level 1 | Level 2 | Level 3 | |||||||||
| Assets | ||||||||||||
Common Stock and/or Other Equity Investments(a) |
| |||||||||||
Asia | $ | 36,248,186 | $ | 5,902,506 | $ | — | ||||||
North America | 875,818,187 | — | — | |||||||||
South America | 17,186,142 | — | — | |||||||||
Investment Company | 19,184,235 | — | — | |||||||||
| Total | $ | 948,436,750 | $ | 5,902,506 | $ | — | ||||||
| (a) | Amounts are disclosed by continent to highlight the impact of time zone differences between local market close and the calculation of NAV. Security valuations are based on the principal exchange or system on which they are traded, which may differ from country of domicile noted in table. The Fund utilizes fair value model prices provided by an independent third-party (fair value) service for certain international equity securities resulting in a Level 2 classification. |
153
GOLDMAN SACHS FUNDAMENTAL EQUITY GROWTH FUNDS
Notes to Financial Statements (continued)
August 31, 2021
| 3. INVESTMENTS AND FAIR VALUE MEASUREMENTS (continued) |
| U.S. EQUITY ESG FUND |
| |||||||||||
| Investment Type | Level 1 | Level 2 | Level 3 | |||||||||
| Assets | ||||||||||||
Common Stock and/or Other Equity Investments(a) |
| |||||||||||
Europe | $ | 350,453 | $ | — | $ | — | ||||||
North America | 16,572,552 | — | — | |||||||||
Investment Company | 273,779 | — | — | |||||||||
| Total | $ | 17,196,784 | $ | — | $ | — | ||||||
| (a) | Amounts are disclosed by continent to highlight the impact of time zone differences between local market close and the calculation of NAV. Security valuations are based on the principal exchange or system on which they are traded, which may differ from country of domicile noted in table. |
For further information regarding security characteristics, see the Schedules of Investments.
| 4. AGREEMENTS AND AFFILIATED TRANSACTIONS |
A. Management Agreement — Under the Agreement, GSAM manages the Funds, subject to the general supervision of the Trustees.
As compensation for the services rendered pursuant to the Agreement, the assumption of the expenses related thereto and administration of the Funds’ business affairs, including providing facilities, GSAM is entitled to a management fee, accrued daily and paid monthly, equal to an annual percentage rate of each Fund’s average daily net assets.
As of August 31, 2021, contractual and effective net management fees with GSAM were at the following rates:
| Contractual Management Rate | Effective Contractual Management Rate | Effective Net Management Rate# | ||||||||||||||||||||||||||||||
| Fund | First $1 billion | Next $1 billion | Next $3 billion | Next $3 billion | Over $8 billion | |||||||||||||||||||||||||||
Capital Growth | 0.71 | % | 0.64 | % | 0.61 | % | 0.61 | % | 0.61 | % | 0.70 | % | 0.70 | % | ||||||||||||||||||
Concentrated Growth | 0.76 | 0.68 | 0.65 | 0.64 | 0.62 | 0.76 | 0.76 | |||||||||||||||||||||||||
Flexible Cap | 0.55 | 0.50 | 0.47 | 0.46 | 0.45 | 0.55 | 0.55 | |||||||||||||||||||||||||
Growth Opportunities | 0.92 | 0.92 | 0.83 | 0.79 | 0.77 | 0.92 | 0.86 | * | ||||||||||||||||||||||||
Small Cap Growth | 0.85 | 0.85 | 0.77 | 0.73 | 0.71 | 0.85 | 0.85 | |||||||||||||||||||||||||
Small/Mid Cap Growth | 0.85 | 0.85 | 0.77 | 0.73 | 0.71 | 0.83 | 0.82 | |||||||||||||||||||||||||
Strategic Growth | 0.71 | 0.64 | 0.61 | 0.59 | 0.58 | 0.71 | 0.71 | |||||||||||||||||||||||||
Technology Opportunities | 0.94 | 0.85 | 0.80 | 0.79 | 0.77 | 0.94 | 0.94 | |||||||||||||||||||||||||
U.S. Equity ESG Fund | 0.55 | 0.50 | 0.47 | 0.46 | 0.45 | 0.55 | 0.55 | |||||||||||||||||||||||||
| # | The Effective Net Management Rate includes the impact of management fee waivers of affiliated underlying funds, if any. The Effective Net Management Rate may not correlate to the Contractual Management Rate as a result of management fee waivers that may be in effect from time to time. |
| * | The Investment Adviser agreed to waive a portion of its management fee in order to achieve an effective net management fee rate of 0.86% as an annual percentage rate of the Growth Opportunities Fund’s average daily net assets. This arrangement will remain in effect through at least December 29, 2021. |
The Funds invest in Institutional Shares of the Goldman Sachs Financial Square Government Fund (“Government Money Market Fund”), which is an affiliated Underlying Fund. GSAM has agreed to waive a portion of its management fee payable by the Funds in an amount equal to the management fee it earns as an investment adviser to the affiliated Underlying Fund in which the
154
GOLDMAN SACHS FUNDAMENTAL EQUITY GROWTH FUNDS
| 4. AGREEMENTS AND AFFILIATED TRANSACTIONS (continued) |
Funds invest, except those management fees it earns from the Funds’ investments of cash collateral received in connection with securities lending transactions in the Government Money Market Fund. For the fiscal year ended August 31, 2021, the management fee waived by GSAM for each Fund was as follows:
| Fund | Management Fee Waived | |||||
Capital Growth | $ | 3,502 | ||||
Concentrated Growth | 1,855 | |||||
Flexible Cap | 342 | |||||
Growth Opportunities | 12,463 | |||||
Small Cap Growth | 401 | |||||
Small/Mid Cap Growth | 52,842 | |||||
Strategic Growth | 1,037 | |||||
Technology Opportunities | 14,921 | |||||
U.S. Equity ESG Fund | 177 | |||||
B. Distribution and/or Service (12b-1) Plans — The Trust, on behalf of Class A and Class R Shares of each applicable Fund, has adopted Distribution and Service Plans subject to Rule 12b-1 under the Act. Under the Distribution and Service Plans, Goldman Sachs, which serves as distributor (the “Distributor”), is entitled to a fee accrued daily and paid monthly for distribution services and personal and account maintenance services, which may then be paid by Goldman Sachs to authorized dealers. These fees are equal to an annual percentage rate of the average daily net assets attributable to Class A or Class R Shares of the Funds, as applicable, as set forth below.
The Trust, on behalf of Class C Shares of each applicable Fund, has adopted a Distribution Plan subject to Rule 12b-1 under the Act. Under the Distribution Plan, Goldman Sachs as Distributor is entitled to a fee accrued daily and paid monthly for distribution services, which may then be paid by Goldman Sachs to authorized dealers. These fees are equal to an annual percentage rate of the average daily net assets attributable to Class C Shares of the Funds, as set forth below.
The Trust, on behalf of Service Shares of each applicable Fund, has adopted a Service Plan subject to Rule 12b-1 under the Act to allow Service Shares to compensate service organizations (including Goldman Sachs) for providing personal and account maintenance services to their customers who are beneficial owners of such shares. The Service Plan provides for compensation to the service organizations equal to an annual percentage rate of the average daily net assets attributable to Service Shares of the Funds, as set forth below.
| Distribution and/or Service Plan Rates | ||||||||||||||||
| Class A* | Class C | Class R* | Service | |||||||||||||
Distribution and/or Service Plan | 0.25 | % | 0.75 | % | 0.50 | % | 0.25 | % | ||||||||
| * | With respect to Class A and Class R Shares, the Distributor at its discretion may use compensation for distribution services paid under the Distribution and/or Service Plans to compensate service organizations for personal and account maintenance services and expenses as long as such total compensation does not exceed the maximum cap on “service fees” imposed by the Financial Industry Regulatory Authority. |
155
GOLDMAN SACHS FUNDAMENTAL EQUITY GROWTH FUNDS
Notes to Financial Statements (continued)
August 31, 2021
| 4. AGREEMENTS AND AFFILIATED TRANSACTIONS (continued) |
C. Distribution Agreement — Goldman Sachs, as Distributor of the shares of the Funds pursuant to a Distribution Agreement, may retain a portion of the Class A Shares’ front end sales charge and Class C Shares’ CDSC. During the fiscal year ended August 31, 2021, Goldman Sachs retained the following amounts:
| Front End Sales Charge | Contingent Deferred Sales Charge | |||||||||
| Fund | Class A | Class C | ||||||||
Capital Growth | $ | 24,344 | $ | 893 | ||||||
Concentrated Growth | 3,158 | — | ||||||||
Flexible Cap | 1,188 | — | ||||||||
Growth Opportunities | 20,552 | 1,599 | ||||||||
Small Cap Growth | 230 | — | ||||||||
Small/Mid Cap Growth | 52,579 | — | ||||||||
Strategic Growth | 2,503 | — | ||||||||
Technology Opportunities | 17,206 | 892 | ||||||||
U.S. Equity ESG Fund | 682 | — | ||||||||
D. Service and Shareholder Administration Plans — The Trust, on behalf of each applicable Fund, has adopted Service Plans to allow Class C Shares and Shareholder Administration Plans to allow Service Shares, respectively, to compensate service organizations (including Goldman Sachs) for providing varying levels of personal and account maintenance or shareholder administration services to their customers who are beneficial owners of such shares. The Service and Shareholder Administration Plans each provide for compensation to the service organizations equal to an annual percentage rate of 0.25% of the average daily net assets attributable to Class C and Service Shares of the Funds, respectively.
E. Transfer Agency Agreement — Goldman Sachs also serves as the transfer agent of the Funds for a fee pursuant to the Transfer Agency Agreement. The fees charged for such transfer agency services are accrued daily and paid monthly at annual rates as follows: 0.16% of the average daily net assets of Class A, Class C, Investor and Class R Shares; 0.03% of the average daily net assets of Class R6 and Class P Shares; and 0.04% of the average daily net assets of Institutional and Service Shares.
For the fiscal year ended August 31, 2021, the transfer agency fee waivers were as follows:
| Transfer Agency Waivers (Class A, Class C, Investor, and Class R Shares) | ||||||||||
| Fund | Before December 29, 2020 | As of December 29, 2020* | ||||||||
Concentrated Growth | 0.03 | % | 0.07 | % | ||||||
Growth Opportunities | 0.03 | % | 0.02 | % | ||||||
Small/Mid Cap Growth | 0.05 | % | 0.04 | % | ||||||
Technology Opportunities | 0.11 | % | 0.08 | % | ||||||
U.S. Equity ESG Fund | 0.03 | % | 0.02 | % | ||||||
| * | These arrangements will remain in effect through at least December 29, 2021, and prior to such date, Goldman Sachs may not terminate the arrangement without the approval of the Board of Trustees. |
F. Other Expense Agreements and Affiliated Transactions — GSAM has agreed to reduce or limit certain “Other Expenses” of the Funds (excluding acquired fund fees and expenses, transfer agency fees and expenses, service fees and
156
GOLDMAN SACHS FUNDAMENTAL EQUITY GROWTH FUNDS
| 4. AGREEMENTS AND AFFILIATED TRANSACTIONS (continued) |
shareholder administration fees (as applicable), taxes, interest, brokerage fees, expenses of shareholder meetings, litigation and indemnification, and extraordinary expenses) to the extent such expenses exceed, on an annual basis, a percentage rate of the average daily net assets of each Fund. Such Other Expense reimbursements, if any, are accrued daily and paid monthly. In addition, the Funds are not obligated to reimburse GSAM for prior fiscal year expense reimbursements, if any. The Other Expense limitations as an annual percentage rate of average daily net assets for Capital Growth, Concentrated Growth, Flexible Cap, Growth Opportunities, Small Cap Growth, Small/Mid Cap Growth, Strategic Growth, Technology Opportunities, and U.S. Equity ESG Funds are 0.004%, 0.004%, 0.004%, 0.004%, 0.024%, 0.044%, 0.004%, 0.004%, and 0.084%, respectively. Prior to December 29, 2020, the Other Expense limitation for Small/Mid Cap Growth was 0.064%. These Other Expense limitations will remain in place through at least December 29, 2021, and prior to such date GSAM may not terminate the arrangements without the approval of the Trustees. In addition, the Funds have entered into certain offset arrangements with the transfer agent, which may result in a reduction of the Funds’ expenses and are received irrespective of the application of the “Other Expense” limitations described above.
For the fiscal year ended August 31, 2021, these expense reductions, including any fee waivers and Other Expense reimbursements, were as follows:
| Fund | Management Fee Waiver | Transfer Agency Fee Waiver/Credits | Other Expense Reimbursements | Total Expense Reductions | ||||||||||||||
Capital Growth | $ | 3,502 | $ | — | $ | 571,030 | $ | 574,532 | ||||||||||
Concentrated Growth | 1,855 | 6,649 | 288,580 | 297,084 | ||||||||||||||
Flexible Cap | 342 | — | 294,719 | 295,061 | ||||||||||||||
Growth Opportunities | 841,310 | 174,861 | 529,412 | 1,545,583 | ||||||||||||||
Small Cap Growth | 401 | — | 414,075 | 414,476 | ||||||||||||||
Small/Mid Cap Growth | 52,842 | 630,824 | — | 683,666 | ||||||||||||||
Strategic Growth | 1,037 | — | 342,823 | 343,860 | ||||||||||||||
Technology Opportunities | 14,921 | 469,636 | 464,754 | 949,311 | ||||||||||||||
U.S. Equity ESG Fund | 177 | 2,803 | 358,012 | 360,992 | ||||||||||||||
G. Line of Credit Facility — As of August 31, 2021, the Funds participated in a $1,000,000,000 committed, unsecured revolving line of credit facility (the “facility”) together with other funds of the Trust and certain registered investment companies having management agreements with GSAM or its affiliates. This facility is to be used for temporary emergency purposes, or to allow for an orderly liquidation of securities to meet redemption requests. The interest rate on borrowings is based on the federal funds rate. The facility also requires a fee to be paid by the Funds based on the amount of the commitment that has not been utilized. For the fiscal year ended August 31, 2021, the Funds did not have any borrowings under the facility. Prior to April 26, 2021, the facility was $700,000,000.
H. Other Transactions with Affiliates — For the fiscal year ended August 31, 2021, Goldman Sachs earned the following amounts in brokerage commissions from portfolio transactions, on behalf of the Funds:
| Capital Growth | Concentrated Growth | Flexible Cap Growth | Growth Opportunitites | Small Cap Growth | Small/Mid Cap Growth | Strategic Growth | Technology Opportunities | U.S. Equity ESG Fund | ||||||||||||||||||||||||||||
Brokerage commissions paid | $ | 2,330 | $ | 118 | $ | 54 | $ | 6,586 | $ | 393 | $ | 21,993 | $ | 534 | $ | 5,469 | $ | — | ||||||||||||||||||
157
GOLDMAN SACHS FUNDAMENTAL EQUITY GROWTH FUNDS
Notes to Financial Statements (continued)
August 31, 2021
| 4. AGREEMENTS AND AFFILIATED TRANSACTIONS (continued) |
The table below shows the transactions in and earnings from investments in the Government Money Market Fund — Institutional Shares for the fiscal year ended August 31, 2021:
| Fund | Beginning Value as of August 31, 2020 | Purchases at Cost | Proceeds from Sales | Market Value as of August 31, 2021 | Shares as of August 31, 2021 | Dividend Income | ||||||||||||||||||
Capital Growth | $ | 1,589,879 | $ | 44,924,137 | $ | (42,017,638 | ) | $ | 4,496,378 | 4,496,378 | $ | 814 | ||||||||||||
Concentrated Growth | 950,092 | 23,434,991 | (24,221,021 | ) | 164,062 | 164,062 | 389 | |||||||||||||||||
Flexible Cap | 100,184 | 7,321,721 | (6,877,567 | ) | 544,338 | 544,338 | 88 | |||||||||||||||||
Growth Opportunities | 1,701,230 | 302,083,221 | (289,873,157 | ) | 13,911,294 | 13,911,294 | 3,629 | |||||||||||||||||
Small Cap Growth | 76,393 | 10,366,300 | (10,192,709 | ) | 249,984 | 249,984 | 110 | |||||||||||||||||
Small/Mid Cap Growth | 25,252,010 | 934,578,815 | (928,558,445 | ) | 31,272,380 | 31,272,380 | 13,578 | |||||||||||||||||
Strategic Growth | 91,121 | 39,627,388 | (38,387,915 | ) | 1,330,594 | 1,330,594 | 245 | |||||||||||||||||
Technology Opportunities | 21,043,925 | 148,285,000 | (150,144,690 | ) | 19,184,235 | 19,184,235 | 3,122 | |||||||||||||||||
U.S. Equity ESG Fund | 118,383 | 2,772,925 | (2,617,529 | ) | 273,779 | 273,779 | 35 | |||||||||||||||||
As of August 31, 2021, The Goldman Sachs Group, Inc. was the beneficial owner of 5% or more of outstanding shares of the following Funds:
| Fund | Class A | Class C | Institutional | Investor | Class P | Class R | Class R6 | |||||||||||||||||||||
Concentrated Growth | — | % | — | % | — | % | 15 | % | — | % | 100 | % | — | % | ||||||||||||||
Flexible Cap | — | — | — | 95 | — | 99 | 7 | |||||||||||||||||||||
Small Cap Growth | 14 | 75 | 47 | 100 | — | 100 | 100 | |||||||||||||||||||||
Stategic Growth | — | — | — | — | — | 9 | — | |||||||||||||||||||||
U.S. Equity ESG | — | — | 33 | — | — | 6 | — | |||||||||||||||||||||
158
GOLDMAN SACHS FUNDAMENTAL EQUITY GROWTH FUNDS
| 5. PORTFOLIO SECURITIES TRANSACTIONS |
The cost of purchases and proceeds from sales and maturities of long-term securities for the fiscal year ended August 31, 2021, were as follows:
| Fund | Purchases | Sales | ||||||||
Capital Growth | $ | 490,835,381 | $ | 505,725,448 | ||||||
Concentrated Growth | 71,442,862 | 84,999,258 | ||||||||
Flexible Cap | 18,998,576 | 12,432,744 | ||||||||
Growth Opportunities | 777,454,285 | 989,366,043 | ||||||||
Small Cap Growth | 20,810,520 | 19,730,720 | ||||||||
Small/Mid Cap Growth | 2,018,370,628 | 1,747,282,859 | ||||||||
Strategic Growth | 59,696,511 | 72,063,938 | ||||||||
Technology Opportunities | 329,230,464 | 365,998,535 | ||||||||
U.S. Equity ESG Fund | 6,071,926 | 3,980,362 | ||||||||
| 6. SECURITIES LENDING |
The Funds may lend their securities through a securities lending agent, the Bank of New York Mellon (“BNYM”), to certain qualified borrowers. In accordance with the Funds’ securities lending procedures, the Funds receive cash collateral at least equal to the market value of the securities on loan. The market value of the loaned securities is determined at the close of business of the Funds, at their last sale price or official closing price on the principal exchange or system on which they are traded, and any additional required collateral is delivered to the Funds on the next business day. As with other extensions of credit, the Funds may experience delay in the recovery of their securities or incur a loss should the borrower of the securities breach its agreement with the Funds or become insolvent at a time when the collateral is insufficient to cover the cost of repurchasing securities on loan. Dividend income received from securities on loan may not be subject to withholding taxes and therefore withholding taxes paid may differ from the amounts listed in the Statements of Operations. Loans of securities are terminable at any time and as such 1) the remaining contractual maturities of the outstanding securities lending transactions are considered to be overnight and continuous and 2) the borrower, after notice, is required to return borrowed securities within the standard time period for settlement of securities transactions.
The Funds invest the cash collateral received in connection with securities lending transactions in the Government Money Market Fund, an affiliated series of the Goldman Sachs Trust. The Government Money Market Fund is registered under the Act as an open end investment company, is subject to Rule 2a-7 under the Act, and is managed by GSAM, for which GSAM may receive a management fee of up to 0.16% on an annualized basis of the average daily net assets of the Government Money Market Fund.
In the event of a default by a borrower with respect to any loan, BNYM may exercise any and all remedies provided under the applicable borrower agreement to make the Funds whole. These remedies include purchasing replacement securities by applying the collateral held from the defaulting broker against the purchase cost of the replacement securities. If BNYM is unable to purchase replacement securities, BNYM will indemnify the Funds by paying the Funds an amount equal to the market value of the securities loaned minus the value of cash collateral received from the borrower for the loan, subject to an exclusion for any shortfalls resulting from a loss of value in such cash collateral due to reinvestment risk. The Funds’ master netting agreements with certain borrowers provide the right, in the event of a default (including bankruptcy or insolvency), for the non-defaulting party to liquidate the collateral and calculate net exposure to the defaulting party or request additional collateral. However, in the event of a default by a borrower, a resolution authority could determine that such rights are not enforceable due to the restrictions or
159
GOLDMAN SACHS FUNDAMENTAL EQUITY GROWTH FUNDS
Notes to Financial Statements (continued)
August 31, 2021
| 6. SECURITIES LENDING (continued) |
prohibitions against the right of set-off that may be imposed in accordance with a particular jurisdiction’s bankruptcy or insolvency laws. The Funds’ loaned securities were all subject to enforceable Securities Lending Agreements and the value of the collateral was at least equal to the value of the cash received. The amounts of the Funds’ overnight and continuous agreements, which represent the gross amounts of recognized liabilities for securities lending transactions outstanding as of August 31, 2021, are disclosed as “Payable upon return of securities loaned” on the Statements of Assets and Liabilities, where applicable.
Each of the Funds and BNYM received compensation relating to the lending of the Funds’ securities. The amounts earned, if any, by the Funds for the fiscal year ended August 31, 2021, are reported under Investment Income on the Statements of Operations.
The following table provides information about the Funds’ investments in the Government Money Market Fund for the fiscal year ended August 31, 2021:
| Fund | Beginning Value as of August 31, 2020 | Purchases at Cost | Proceeds from Sales | Ending Value as of August 31, 2021 | ||||||||||||||
Capital Growth | $ | — | $ | 72,195,433 | $ | (68,338,811) | $ | 3,856,622 | ||||||||||
Concentrated Growth | — | 12,396,078 | (12,396,078 | ) | — | |||||||||||||
Flexible Cap | — | 1,042,906 | (1,042,906 | ) | — | |||||||||||||
Growth Opportunities | — | 195,500,982 | (188,053,952 | ) | 7,447,030 | |||||||||||||
Small Cap Growth | — | 6,041,041 | (5,899,537 | ) | 141,504 | |||||||||||||
Small/Mid Cap Growth | 13,387,318 | 514,614,873 | (509,264,058 | ) | 18,738,133 | |||||||||||||
Strategic Growth | — | 30,571,706 | (29,555,804 | ) | 1,015,902 | |||||||||||||
Technology Opportunities | — | 74,904,367 | (74,904,367 | ) | — | |||||||||||||
U.S. Equity ESG | — | 1,196,295 | (1,196,295 | ) | — | |||||||||||||
| 7. TAX INFORMATION |
The tax character of distributions paid during the fiscal year ended August 31, 2021 was as follows:
Capital | Concentrated Growth | Flexible Cap Growth | Growth Opportunities | Small Cap Growth | Small/Mid Cap Growth | Strategic Growth | Technology Opportunities | U.S. Equity ESG Fund | ||||||||||||||||||||||||||||
Distributions paid from: | ||||||||||||||||||||||||||||||||||||
Ordinary Income | $ | 2,653,571 | $ | 709,768 | $ | 530,052 | $ | 42,355,710 | $ | 1,250,968 | $ | 96,550,926 | $ | 2,114,975 | $ | 10,001,353 | $ | 61,198 | ||||||||||||||||||
Net long-term capital gains | 34,899,429 | 10,169,325 | 812,482 | 214,147,837 | 123 | 267,444,660 | 23,737,095 | 55,965,814 | 1,149,182 | |||||||||||||||||||||||||||
Total taxable distributions | $ | 37,553,000 | $ | 10,879,093 | $ | 1,342,534 | $ | 256,503,547 | $ | 1,251,091 | $ | 363,995,586 | $ | 25,852,070 | $ | 65,967,167 | $ | 1,210,380 | ||||||||||||||||||
160
GOLDMAN SACHS FUNDAMENTAL EQUITY GROWTH FUNDS
| 7. TAX INFORMATION (continued) |
The tax character of distributions paid during the fiscal year ended August 31, 2020 was as follows:
| Capital Growth | Concentrated Growth | Flexible Cap Growth | Growth Opportunities | Small Cap Growth | Small/Mid Cap Growth | Strategic Growth | Technology Opportunities | U.S. Equity ESG Fund | ||||||||||||||||||||||||||||
Distributions paid from: | ||||||||||||||||||||||||||||||||||||
Ordinary Income | $ | 3,675,435 | $ | 171,788 | $ | 167,657 | $ | 3,401,778 | $ | 9,046 | $ | 24,522 | $ | 387,013 | $ | — | $ | 131,879 | ||||||||||||||||||
Net long-term capital gains | 33,388,576 | 11,578,608 | 948,809 | 292,429,285 | — | 262,606,202 | 23,833,091 | 73,163,470 | 380,236 | |||||||||||||||||||||||||||
Total taxable distributions | $ | 37,064,011 | $ | 11,750,396 | $ | 1,116,466 | $ | 295,831,063 | $ | 9,046 | $ | 262,630,724 | $ | 24,220,104 | $ | 73,163,470 | $ | 512,115 | ||||||||||||||||||
As of August 31, 2021, the components of accumulated earnings (losses) on a tax basis were as follows:
Capital Growth | Concentrated Growth | Flexible Cap Growth | Growth Opportunities | Small Cap Growth | Small/Mid Cap Growth | Strategic Growth | Technology Opportunities | U.S. Equity ESG Fund | ||||||||||||||||||||||||||||
Undistributed ordinary income — net | $ | 31,754,280 | $ | 6,461,756 | $ | 909,063 | $ | 62,861,176 | $ | 1,158,153 | $ | 74,831,316 | $ | 5,130,133 | $ | 15,585,735 | $ | 367,537 | ||||||||||||||||||
Undistributed long-term capital gains | 65,534,766 | 26,108,426 | 949,333 | 130,133,101 | 1,087,576 | 266,363,659 | 17,190,578 | 81,871,481 | 221,497 | |||||||||||||||||||||||||||
Total undistributed earnings | $ | 97,289,046 | $ | 32,570,182 | $ | 1,858,396 | $ | 192,994,277 | $ | 2,245,729 | $ | 341,194,975 | $ | 22,320,711 | $ | 97,457,216 | $ | 589,034 | ||||||||||||||||||
Unrealized gains (losses) — net | 567,220,901 | 111,521,950 | 12,998,573 | 500,108,608 | 5,962,862 | 1,104,054,631 | 131,523,752 | 499,535,173 | 5,582,136 | |||||||||||||||||||||||||||
Total accumulated earnings (losses) net | $ | 664,509,947 | $ | 144,092,132 | $ | 14,856,969 | $ | 693,102,885 | $ | 8,208,591 | $ | 1,445,249,606 | $ | 153,844,463 | $ | 596,992,389 | $ | 6,171,170 | ||||||||||||||||||
As of August 31, 2021, the Funds’ aggregate security unrealized gains and losses based on cost for U.S. federal income tax purposes were as follows:
Capital Growth | Concentrated Growth | Flexible Cap Growth | Growth Opportunities | Small Cap Growth | Small/Mid Cap Growth | Strategic Growth | Technology Opportunities | U.S. Equity ESG Fund | ||||||||||||||||||||||||||||
Tax Cost | $ | 704,780,236 | $ | 110,213,902 | $ | 25,369,008 | $ | 977,088,943 | $ | 14,859,524 | $ | 2,417,802,319 | $ | 95,333,514 | $ | 454,804,083 | $ | 11,614,648 | ||||||||||||||||||
Gross unrealized gain | 576,618,279 | 113,749,570 | 13,226,617 | 513,803,066 | 6,640,885 | 1,167,315,097 | 133,528,396 | 505,788,534 | 5,698,838 | |||||||||||||||||||||||||||
Gross unrealized loss | (9,397,378 | ) | (2,227,620 | ) | (228,044 | ) | (13,694,458 | ) | (678,023 | ) | (63,260,466 | ) | (2,004,644 | ) | (6,253,361 | ) | (116,702 | ) | ||||||||||||||||||
Net unrealized gains (losses) | $ | 567,220,901 | $ | 111,521,950 | $ | 12,998,573 | $ | 500,108,608 | $ | 5,962,862 | $ | 1,104,054,631 | $ | 131,523,752 | $ | 499,535,173 | $ | 5,582,136 | ||||||||||||||||||
The difference between GAAP-basis and tax basis unrealized gains (losses) is attributable primarily to wash sales and differences in the tax treatment of passive foreign investment company investments.
161
GOLDMAN SACHS FUNDAMENTAL EQUITY GROWTH FUNDS
Notes to Financial Statements (continued)
August 31, 2021
| 7. TAX INFORMATION (continued) |
The Small Cap Growth Fund reclassed $112 from paid-in capital to distributable earnings. In order to present certain components of the Funds’ capital accounts on a tax-basis, certain reclassifications have been recorded to the Funds’ accounts. These reclassifications have no impact on the net asset value of the Funds’ and result primarily from certain non-deductible expenses.
GSAM has reviewed the Funds’ tax positions for all open tax years (the current and prior three years, as applicable) and has concluded that no provision for income tax is required in the Funds’ financial statements. Such open tax years remain subject to examination and adjustment by tax authorities.
| 8. OTHER RISKS |
The Funds’ risks include, but are not limited to, the following:
Foreign and Emerging Countries Risk — Investing in foreign markets may involve special risks and considerations not typically associated with investing in the U.S. Foreign securities may be subject to risk of loss because of more or less foreign government regulation; less public information; less stringent investor protections; less stringent accounting, corporate governance, financial reporting and disclosure standards; and less economic, political and social stability in the countries in which a Fund invests. The imposition of exchange controls (including repatriation restrictions), confiscation of assets and property, trade restrictions (including tariffs) and other government restrictions by the U.S. or other governments, or problems with registration, settlement or custody, may also result in losses. Foreign risk also involves the risk of negative foreign currency rate fluctuations, which may cause the value of securities denominated in such foreign currency (or other instruments through which a Fund has exposure to foreign currencies) to decline in value. Currency exchange rates may fluctuate significantly over short periods of time.
Foreign Custody Risk — The Funds may invest in foreign securities, and as such the Funds may hold such securities and cash with foreign banks, agents, and securities depositories appointed by each Fund’s custodian (each a “Foreign Custodian”). Some foreign custodians may be recently organized or new to the foreign custody business. In some countries, Foreign Custodians may be subject to little or no regulatory oversight over, or independent evaluation of, their operations. Further, the laws of certain countries may place limitations on a Fund’s ability to recover its assets if a Foreign Custodian enters bankruptcy. Investments in emerging markets may be subject to even greater custody risks than investments in more developed markets. Custody services in emerging market countries are very often undeveloped and may be considerably less well regulated than in more developed countries, and thus may not afford the same level of investor protection as would apply in developed countries.
Industry Concentration Risk — The Technology Opportunities Fund invests primarily in equity investments in high-quality technology, media, or service companies that adopt or use technology to improve their cost structure, revenue opportunities or competitive advantage. Because of its focus on technology, media and service companies, the Technology Opportunities Fund is subject to greater risk of loss as a result of adverse economic, business or other developments than if its investments were diversified across different industry sectors. The Technology Opportunities Fund may also invest in a relatively few number of issuers. Thus, the Technology Opportunities Fund may be more susceptible to adverse developments affecting any single issuer held in its portfolio and may be more susceptible to greater losses because of these developments.
Issuer Concentration Risk — Under normal circumstances, the Concentrated Growth Fund and the U.S. Equity ESG Fund intend to invest in up to approximately 40 and 50 companies, respectively. As a result of the relatively small number of issuers in which a Fund generally invests, it may be subject to greater risks than a fund that invests in a greater number of issuers. A change in the value of any single investment held by a Fund may affect the overall value of the Fund more than it would affect a mutual fund that holds more investments. In particular, a Fund may be more susceptible to adverse developments affecting any single issuer in the Fund and may be susceptible to greater losses because of these developments.
Investments in Other Investment Companies Risk — As a shareholder of another investment company, a Fund will indirectly bear its proportionate share of any net management fees and other expenses paid by such other investment companies, in addition to the fees and expenses regularly borne by the Fund.
162
GOLDMAN SACHS FUNDAMENTAL EQUITY GROWTH FUNDS
| 8. OTHER RISKS (continued) |
Large Shareholder Transactions Risk — A Fund may experience adverse effects when certain large shareholders, such as other funds, institutional investors (including those trading by use of non-discretionary mathematical formulas), financial intermediaries (who may make investment decisions on behalf of underlying clients and/or include a Fund in their investment model), individuals, accounts and Goldman Sachs affiliates, purchase or redeem large amounts of shares of a Fund. Such large shareholder redemptions, which may occur rapidly or unexpectedly, may cause a Fund to sell portfolio securities at times when it would not otherwise do so, which may negatively impact a Fund’s NAV and liquidity. These transactions may also accelerate the realization of taxable income to shareholders if such sales of investments resulted in gains, and may also increase transaction costs. In addition, a large redemption could result in a Fund’s current expenses being allocated over a smaller asset base, leading to an increase in the Fund’s expense ratio. Similarly, large Fund share purchases may adversely affect a Fund’s performance to the extent that the Fund is delayed in investing new cash or otherwise maintains a larger cash position than it ordinarily would.
Liquidity Risk — A Fund may make investments that are illiquid or that may become less liquid in response to market developments or adverse investor perceptions. Illiquid investments may be more difficult to value. Liquidity risk may also refer to the risk that a Fund will not be able to pay redemption proceeds within the allowable time period or without significant dilution to remaining investors’ interests because of unusual market conditions, an unusually high volume of redemption requests, or other reasons. To meet redemption requests, a Fund may be forced to sell investments at an unfavorable time and/or under unfavorable conditions. If a Fund is forced to sell securities at an unfavorable time and/or under unfavorable conditions, such sales may adversely affect the Fund’s NAV and dilute remaining investors’ interests. These risks may be more pronounced in connection with the Funds’ investments in securities of issuers located in emerging market countries. Redemptions by large shareholders may have a negative impact on a Fund’s liquidity.
Market and Credit Risks — In the normal course of business, a Fund trades financial instruments and enters into financial transactions where risk of potential loss exists due to changes in the market (market risk). The value of the securities in which a Fund invests may go up or down in response to the prospects of individual companies, particular sectors or governments and/or general economic conditions throughout the world due to increasingly interconnected global economies and financial markets. Events such as war, acts of terrorism, social unrest, natural disasters, the spread of infectious illness or other public health threats could also significantly impact a Fund and its investments. Additionally, a Fund may also be exposed to credit risk in the event that an issuer or guarantor fails to perform or that an institution or entity with which the Fund has unsettled or open transactions defaults.
Non-Diversification Risk — The Strategic Growth Fund is non-diversified, meaning that it is permitted to invest a larger percentage of its assets in one or more issuers or fewer issuers than diversified mutual funds. Thus, the Fund may be more susceptible to adverse developments affecting any single issuer held in its portfolio, and may be more susceptible to greater losses because of these developments.
| 9. INDEMNIFICATIONS |
Under the Trust’s organizational documents, its Trustees, officers, employees and agents are indemnified, to the extent permitted by the Act and state law, against certain liabilities that may arise out of performance of their duties to the Funds. Additionally, in the course of business, the Funds enter into contracts that contain a variety of indemnification clauses. The Funds’ maximum exposure under these arrangements is unknown, as this would involve future claims that may be made against the Funds that have not yet occurred. However, GSAM believes the risk of loss under these arrangements to be remote.
| 10. SUBSEQUENT EVENTS |
Subsequent events after the Statements of Assets and Liabilities date have been evaluated, and GSAM has concluded that there is no impact requiring adjustment or disclosure in the financial statements.
163
GOLDMAN SACHS FUNDAMENTAL EQUITY GROWTH FUNDS
Notes to Financial Statements (continued)
August 31, 2021
| 11. SUMMARY OF SHARE TRANSACTIONS |
| Capital Growth Fund | ||||||||||||||||
|
| |||||||||||||||
| For the Fiscal Year Ended August 31, 2021 | For the Fiscal Year Ended August 31, 2020 | |||||||||||||||
|
| |||||||||||||||
| Shares | Dollars | Shares | Dollars | |||||||||||||
|
| |||||||||||||||
| Class A Shares |
| |||||||||||||||
Shares sold | 886,562 | $ | 26,514,670 | 509,128 | $ | 11,684,562 | ||||||||||
Reinvestment of distributions | 1,027,840 | 28,452,549 | 1,181,420 | 27,979,749 | ||||||||||||
Shares redeemed | (2,757,413 | ) | (81,210,223 | ) | (3,761,845 | ) | (85,901,304 | ) | ||||||||
| (843,011 | ) | (26,243,004 | ) | (2,071,297 | ) | (46,236,993 | ) | |||||||||
| Class C Shares | ||||||||||||||||
Shares sold | 393,978 | 6,814,811 | 170,312 | 2,318,595 | ||||||||||||
Reinvestment of distributions | 58,241 | 934,178 | 71,152 | 1,004,660 | ||||||||||||
Shares redeemed | (421,568 | ) | (7,092,696 | ) | (536,412 | ) | (7,409,929 | ) | ||||||||
| 30,651 | 656,293 | (294,948 | ) | (4,086,674 | ) | |||||||||||
| Institutional Shares | ||||||||||||||||
Shares sold | 1,341,028 | 46,329,321 | 165,989 | 4,497,004 | ||||||||||||
Reinvestment of distributions | 61,338 | 1,978,574 | 70,107 | 1,922,071 | ||||||||||||
Shares redeemed | (507,792 | ) | (17,806,383 | ) | (441,460 | ) | (11,580,510 | ) | ||||||||
| 894,574 | 30,501,512 | (205,364 | ) | (5,161,435 | ) | |||||||||||
| Service Shares | ||||||||||||||||
Shares sold | 10,248 | 297,051 | 16,235 | 372,217 | ||||||||||||
Reinvestment of distributions | 2,075 | 54,101 | 3,047 | 68,220 | ||||||||||||
Shares redeemed | (17,229 | ) | (426,311 | ) | (19,150 | ) | (388,887 | ) | ||||||||
| (4,906 | ) | (75,159 | ) | 132 | 51,550 | |||||||||||
| Investor Shares | ||||||||||||||||
Shares sold | 356,199 | 11,219,002 | 136,874 | 3,218,458 | ||||||||||||
Reinvestment of distributions | 13,102 | 371,777 | 12,797 | 310,127 | ||||||||||||
Shares redeemed | (62,949 | ) | (1,957,912 | ) | (117,666 | ) | (2,785,148 | ) | ||||||||
| 306,352 | 9,632,867 | 32,005 | 743,437 | |||||||||||||
| Class R6 Shares | ||||||||||||||||
Shares sold | 160,137 | 5,589,483 | 23,451 | 624,213 | ||||||||||||
Reinvestment of distributions | 2,625 | 84,554 | 2,870 | 78,575 | ||||||||||||
Shares redeemed | (23,660 | ) | (826,105 | ) | (35,280 | ) | (950,712 | ) | ||||||||
| 139,102 | 4,847,932 | (8,959 | ) | (247,924 | ) | |||||||||||
| Class R Shares | ||||||||||||||||
Shares sold | 66,611 | 1,874,883 | 94,899 | 2,152,097 | ||||||||||||
Reinvestment of distributions | 14,679 | 380,562 | 15,822 | 352,167 | ||||||||||||
Shares redeemed | (88,336 | ) | (2,396,082 | ) | (107,748 | ) | (2,347,836 | ) | ||||||||
| (7,046 | ) | (140,637 | ) | 2,973 | 156,428 | |||||||||||
| Class P Shares | ||||||||||||||||
Shares sold | 330,332 | 11,435,266 | 269,239 | 7,159,878 | ||||||||||||
Reinvestment of distributions | 110,152 | 3,547,586 | 124,310 | 3,401,935 | ||||||||||||
Shares redeemed | (175,655 | ) | (6,045,952 | ) | (578,888 | ) | (15,459,019 | ) | ||||||||
| 264,829 | 8,936,900 | (185,339 | ) | (4,897,206 | ) | |||||||||||
NET INCREASE (DECREASE) | 780,545 | $ | 28,116,704 | (2,730,797 | ) | $ | (59,678,817 | ) | ||||||||
164
GOLDMAN SACHS FUNDAMENTAL EQUITY GROWTH FUNDS
| 11. SUMMARY OF SHARE TRANSACTIONS (continued) |
| Concentrated Growth Fund | ||||||||||||||||
|
| |||||||||||||||
| For the Fiscal Year Ended August 31, 2021 | For the Fiscal Year Ended August 31, 2020 | |||||||||||||||
|
| |||||||||||||||
| Shares | Dollars | Shares | Dollars | |||||||||||||
|
| |||||||||||||||
| Class A Shares | ||||||||||||||||
Shares sold | 59,704 | $ | 1,382,411 | 53,997 | $ | 994,775 | ||||||||||
Reinvestment of distributions | 23,289 | 511,420 | 28,021 | 488,414 | ||||||||||||
Shares redeemed | (68,834 | ) | (1,616,717 | ) | (59,729 | ) | (1,101,894 | ) | ||||||||
| 14,159 | 277,114 | 22,289 | 381,295 | |||||||||||||
| Class C Shares | ||||||||||||||||
Shares sold | 15,276 | 268,005 | 39,614 | 508,211 | ||||||||||||
Reinvestment of distributions | 5,634 | 92,741 | 4,844 | 65,059 | ||||||||||||
Shares redeemed | (37,977 | ) | (660,721 | ) | (37,662 | ) | (536,353 | ) | ||||||||
| (17,067 | ) | (299,975 | ) | 6,796 | 36,917 | |||||||||||
| Institutional Shares | ||||||||||||||||
Shares sold | 44,169 | 1,074,773 | 24,191 | 478,401 | ||||||||||||
Reinvestment of distributions | 32,623 | 784,250 | 48,540 | 919,091 | ||||||||||||
Shares redeemed | (72,734 | ) | (1,848,235 | ) | (181,552 | ) | (3,448,442 | ) | ||||||||
| 4,058 | 10,788 | (108,821 | ) | (2,050,950 | ) | |||||||||||
| Investor Shares | ||||||||||||||||
Shares sold | 2,523 | 63,003 | 755 | 11,837 | ||||||||||||
Reinvestment of distributions | 548 | 12,344 | 619 | 11,029 | ||||||||||||
Shares redeemed | (682 | ) | (16,167 | ) | (730 | ) | (13,288 | ) | ||||||||
| 2,389 | 59,180 | 644 | 9,578 | |||||||||||||
| Class R6 Shares | ||||||||||||||||
Shares sold | 23,259 | 671,356 | 12,509 | 258,679 | ||||||||||||
Reinvestment of distributions | 1,903 | 45,645 | 2,165 | 40,913 | ||||||||||||
Shares redeemed | (7,929 | ) | (206,454 | ) | (10,757 | ) | (218,738 | ) | ||||||||
| 17,233 | 510,547 | 3,917 | 80,854 | |||||||||||||
| Class R Shares | ||||||||||||||||
Shares sold | — | — | 176 | 2,986 | ||||||||||||
Reinvestment of distributions | 104 | 2,170 | 123 | 2,047 | ||||||||||||
Shares redeemed | — | — | (918 | ) | (15,755 | ) | ||||||||||
| 104 | 2,170 | (619 | ) | (10,722 | ) | |||||||||||
| Class P Shares | ||||||||||||||||
Shares sold | 445,789 | 11,719,010 | 219,615 | 4,418,905 | ||||||||||||
Reinvestment of distributions | 389,427 | 9,334,560 | 534,993 | 10,103,292 | ||||||||||||
Shares redeemed | (984,468 | ) | (25,252,775 | ) | (1,089,383 | ) | (20,053,827 | ) | ||||||||
| (149,252 | ) | (4,199,205 | ) | (334,775 | ) | (5,531,630 | ) | |||||||||
NET DECREASE | (128,376 | ) | $ | (3,639,381 | ) | (410,569 | ) | $ | (7,084,658 | ) | ||||||
165
GOLDMAN SACHS FUNDAMENTAL EQUITY GROWTH FUNDS
Notes to Financial Statements (continued)
August 31, 2021
| 11. SUMMARY OF SHARE TRANSACTIONS (continued) |
| Flexible Cap Fund | ||||||||||||||||
|
| |||||||||||||||
| For the Fiscal Year Ended August 31, 2021 | For the Fiscal Year Ended August 31, 2020 | |||||||||||||||
|
| |||||||||||||||
| Shares | Dollars | Shares | Dollars | |||||||||||||
|
| |||||||||||||||
| Class A Shares | ||||||||||||||||
Shares sold | 77,961 | $ | 1,153,418 | 31,470 | $ | 379,391 | ||||||||||
Reinvestment of distributions | 25,327 | 348,337 | 27,095 | 329,577 | ||||||||||||
Shares redeemed | (92,841 | ) | (1,391,459 | ) | (85,587 | ) | (1,011,671 | ) | ||||||||
| 10,447 | 110,296 | (27,022 | ) | (302,703 | ) | |||||||||||
| Class C Shares | ||||||||||||||||
Shares sold | 4,591 | 55,263 | 22,339 | 220,974 | ||||||||||||
Reinvestment of distributions | 6,672 | 76,792 | 8,140 | 83,942 | ||||||||||||
Shares redeemed | (45,543 | ) | (537,786 | ) | (26,577 | ) | (259,968 | ) | ||||||||
| (34,280 | ) | (405,731 | ) | 3,902 | 44,948 | |||||||||||
| Institutional Shares | ||||||||||||||||
Shares sold | 216,397 | 3,614,754 | 17,400 | 221,848 | ||||||||||||
Reinvestment of distributions | 2,015 | 30,388 | 2,684 | 35,557 | ||||||||||||
Shares redeemed | (14,758 | ) | (245,782 | ) | (25,854 | ) | (328,449 | ) | ||||||||
| 203,654 | 3,399,360 | (5,770 | ) | (71,044 | ) | |||||||||||
| Investor Shares | ||||||||||||||||
Shares sold | 347 | 5,740 | 506 | 6,675 | ||||||||||||
Reinvestment of distributions | 146 | 2,137 | 315 | 4,078 | ||||||||||||
Shares redeemed | (195 | ) | (3,241 | ) | (3,781 | ) | (50,058 | ) | ||||||||
| 298 | 4,636 | (2,960 | ) | (39,305 | ) | |||||||||||
| Class R6 Shares | ||||||||||||||||
Shares sold | 3,364 | 58,461 | 3,902 | 52,182 | ||||||||||||
Reinvestment of distributions | 864 | 13,001 | 944 | 12,478 | ||||||||||||
Shares redeemed | (1,270 | ) | (20,316 | ) | (5,409 | ) | (71,382 | ) | ||||||||
| 2,958 | 51,146 | (563 | ) | (6,722 | ) | |||||||||||
| Class R Shares | ||||||||||||||||
Shares sold | 140 | 1,940 | 137 | 1,550 | ||||||||||||
Reinvestment of distributions | 226 | 2,962 | 200 | 2,314 | ||||||||||||
Shares redeemed | (1,243 | ) | (19,919 | ) | (4 | ) | (45 | ) | ||||||||
| (877 | ) | (15,017 | ) | 333 | 3,819 | |||||||||||
| Class P Shares | ||||||||||||||||
Shares sold | 282,586 | 4,592,100 | 160,203 | 1,955,941 | ||||||||||||
Reinvestment of distributions | 57,745 | 868,916 | 49,025 | 648,521 | ||||||||||||
Shares redeemed | (24,712 | ) | (386,802 | ) | (50,921 | ) | (606,876 | ) | ||||||||
| 315,619 | 5,074,214 | 158,307 | 1,997,586 | |||||||||||||
NET INCREASE | 497,819 | $ | 8,218,904 | 126,227 | $ | 1,626,579 | ||||||||||
166
GOLDMAN SACHS FUNDAMENTAL EQUITY GROWTH FUNDS
| 11. SUMMARY OF SHARE TRANSACTIONS (continued) |
| Growth Opportunities Fund | ||||||||||||||||
|
| |||||||||||||||
| For the Fiscal Year Ended August 31, 2021 | For the Fiscal Year Ended August 31, 2020 | |||||||||||||||
|
| |||||||||||||||
| Shares | Dollars | Shares | Dollars | |||||||||||||
|
| |||||||||||||||
| Class A Shares |
| |||||||||||||||
Shares sold | 4,411,800 | $ | 73,944,026 | 3,557,918 | $ | 52,567,974 | ||||||||||
Reinvestment of distributions | 4,768,671 | 74,105,140 | 5,640,613 | 77,784,047 | ||||||||||||
Shares redeemed | (7,210,263 | ) | (120,846,872 | ) | (7,191,542 | ) | (109,881,675 | ) | ||||||||
| 1,970,208 | 27,202,294 | 2,006,989 | 20,470,346 | |||||||||||||
| Class C Shares | ||||||||||||||||
Shares sold | 731,025 | 3,090,651 | 919,073 | 5,231,584 | ||||||||||||
Reinvestment of distributions | 4,148,159 | 15,265,226 | 2,761,788 | 15,134,597 | ||||||||||||
Shares redeemed | (3,696,232 | ) | (15,936,397 | ) | (3,364,985 | ) | (21,480,985 | ) | ||||||||
| 1,182,952 | 2,419,480 | 315,876 | (1,114,804 | ) | ||||||||||||
| Institutional Shares | ||||||||||||||||
Shares sold | 3,347,250 | 81,088,034 | 6,074,577 | 121,027,748 | ||||||||||||
Reinvestment of distributions | 2,934,286 | 66,696,305 | 4,948,888 | 92,940,121 | ||||||||||||
Shares redeemed | (7,270,958 | ) | (175,144,044 | ) | (13,552,375 | ) | (269,388,899 | ) | ||||||||
| (989,422 | ) | (27,359,705 | ) | (2,528,910 | ) | (55,421,030 | ) | |||||||||
| Service Shares | ||||||||||||||||
Shares sold | 339,162 | 5,113,887 | 424,825 | 5,812,784 | ||||||||||||
Reinvestment of distributions | 523,212 | 7,141,844 | 561,939 | 7,013,003 | ||||||||||||
Shares redeemed | (577,657 | ) | (8,445,644 | ) | (802,783 | ) | (10,436,556 | ) | ||||||||
| 284,717 | 3,810,087 | 183,981 | 2,389,231 | |||||||||||||
| Investor Shares | ||||||||||||||||
Shares sold | 924,701 | 17,746,694 | 925,508 | 15,193,353 | ||||||||||||
Reinvestment of distributions | 1,022,341 | 17,952,306 | 1,249,675 | 18,957,577 | ||||||||||||
Shares redeemed | (1,143,338 | ) | (21,685,235 | ) | (1,797,301 | ) | (29,657,889 | ) | ||||||||
| 803,704 | 14,013,765 | 377,882 | 4,493,041 | |||||||||||||
| Class R6 Shares | ||||||||||||||||
Shares sold | 2,314,802 | 56,501,509 | 1,723,177 | 34,918,433 | ||||||||||||
Reinvestment of distributions | 1,443,405 | 32,851,908 | 1,839,234 | 34,577,597 | ||||||||||||
Shares redeemed | (2,181,156 | ) | (53,150,885 | ) | (2,468,722 | ) | (49,771,961 | ) | ||||||||
| 1,577,051 | 36,202,532 | 1,093,689 | 19,724,069 | |||||||||||||
| Class R Shares | ||||||||||||||||
Shares sold | 576,764 | 8,612,699 | 629,794 | 8,750,163 | ||||||||||||
Reinvestment of distributions | 885,453 | 12,112,994 | 969,214 | 12,124,863 | ||||||||||||
Shares redeemed | (1,165,474 | ) | (17,196,429 | ) | (1,117,506 | ) | (15,506,141 | ) | ||||||||
| 296,743 | 3,529,264 | 481,502 | 5,368,885 | |||||||||||||
| Class P Shares | ||||||||||||||||
Shares sold | 598,466 | 14,037,916 | 164,784 | 3,449,179 | ||||||||||||
Reinvestment of distributions | 594,960 | 13,547,235 | 743,933 | 13,993,377 | ||||||||||||
Shares redeemed | (787,397 | ) | (18,758,640 | ) | (967,912 | ) | (20,170,294 | ) | ||||||||
| 406,029 | 8,826,511 | (59,195 | ) | (2,727,738 | ) | |||||||||||
NET INCREASE (DECREASE) | 5,531,982 | $ | 68,644,228 | 1,871,814 | $ | (6,818,000 | ) | |||||||||
167
GOLDMAN SACHS FUNDAMENTAL EQUITY GROWTH FUNDS
Notes to Financial Statements (continued)
August 31, 2021
| 11. SUMMARY OF SHARE TRANSACTIONS (continued) |
| Small Cap Growth Fund | ||||||||||||||||
|
| |||||||||||||||
| For the Six Months Ended | For the period | |||||||||||||||
|
| |||||||||||||||
| For the Fiscal Year Ended August 31, 2021 | For the Fiscal Year Ended August 31, 2020 | |||||||||||||||
|
| |||||||||||||||
| Shares | Dollars | Shares | Dollars | |||||||||||||
|
| |||||||||||||||
| Class A Shares |
| |||||||||||||||
Shares sold | 38,347 | $ | 615,981 | 24,816 | $ | 260,087 | ||||||||||
Reinvestment of distributions | 1,558 | 22,970 | 8 | 83 | ||||||||||||
Shares redeemed | (14,010 | ) | (227,968 | ) | (11,126 | ) | (117,360 | ) | ||||||||
| 25,895 | 410,983 | 13,698 | 142,810 | |||||||||||||
| Class C Shares | ||||||||||||||||
Shares sold | 1,747 | 29,026 | 7,167 | 67,619 | ||||||||||||
Reinvestment of distributions | 562 | 8,216 | 2 | 18 | ||||||||||||
Shares redeemed | (2,330 | ) | (38,703 | ) | — | — | ||||||||||
| (21 | ) | (1,461 | ) | 7,169 | 67,637 | |||||||||||
| Institutional Shares | ||||||||||||||||
Shares sold | 266,393 | 4,401,259 | 829,480 | 7,210,281 | ||||||||||||
Reinvestment of distributions | 64,374 | 953,009 | 806 | 8,547 | ||||||||||||
Shares redeemed | (306,862 | ) | (4,793,015 | ) | (11,499 | ) | (108,704 | ) | ||||||||
| 23,905 | 561,253 | 818,787 | 7,110,124 | |||||||||||||
| Investor Shares | ||||||||||||||||
Shares sold | — | — | 5,000 | 50,000 | ||||||||||||
Reinvestment of distributions | 379 | 5,612 | 10 | 104 | ||||||||||||
| 379 | 5,612 | 5,010 | 50,104 | |||||||||||||
| Class R6 Shares | ||||||||||||||||
Shares sold | — | — | 5,000 | 50,000 | ||||||||||||
Reinvestment of distributions | 383 | 5,676 | 11 | 117 | ||||||||||||
| 383 | 5,676 | 5,011 | 50,117 | |||||||||||||
| Class R Shares | ||||||||||||||||
Shares sold | — | — | 5,000 | 50,000 | ||||||||||||
Reinvestment of distributions | 374 | 5,508 | 6 | 61 | ||||||||||||
| 374 | 5,508 | 5,006 | 50,061 | |||||||||||||
| Class P Shares | ||||||||||||||||
Shares sold | 191,038 | 3,176,265 | 251,440 | 2,743,178 | ||||||||||||
Reinvestment of distributions | 16,894 | 250,100 | 11 | 117 | ||||||||||||
Shares redeemed | (113,387 | ) | (1,774,800 | ) | (30,938 | ) | (337,264 | ) | ||||||||
| 94,545 | 1,651,565 | 220,513 | 2,406,031 | |||||||||||||
NET INCREASE | 145,460 | $ | 2,639,136 | 1,075,194 | $ | 9,876,884 | ||||||||||
| * | Commencement of Operations |
168
GOLDMAN SACHS FUNDAMENTAL EQUITY GROWTH FUNDS
| 11. SUMMARY OF SHARE TRANSACTIONS (continued) |
| Small/Mid Cap Growth Fund | ||||||||||||||||
|
| |||||||||||||||
| For the Fiscal Year Ended August 31, 2021 | For the Fiscal Year Ended August 31, 2020 | |||||||||||||||
|
| |||||||||||||||
| Shares | Dollars | Shares | Dollars | |||||||||||||
|
| |||||||||||||||
| Class A Shares |
| |||||||||||||||
Shares sold | 4,740,101 | $ | 123,361,276 | 3,787,265 | $ | 73,547,275 | ||||||||||
Reinvestment of distributions | 1,836,091 | 44,874,070 | 1,906,384 | 35,840,022 | ||||||||||||
Shares redeemed | (3,086,393 | ) | (80,138,991 | ) | (6,922,792 | ) | (131,322,470 | ) | ||||||||
| 3,489,799 | 88,096,355 | (1,229,143 | ) | (21,935,173 | ) | |||||||||||
| Class C Shares | ||||||||||||||||
Shares sold | 845,766 | 16,778,281 | 606,585 | 9,332,945 | ||||||||||||
Reinvestment of distributions | 1,601,630 | 29,518,042 | 1,697,652 | 25,311,985 | ||||||||||||
Shares redeemed | (3,859,120 | ) | (76,651,705 | ) | (3,857,818 | ) | (59,971,098 | ) | ||||||||
| (1,411,724 | ) | (30,355,382 | ) | (1,553,581 | ) | (25,326,168 | ) | |||||||||
| Institutional Shares | ||||||||||||||||
Shares sold | 12,680,064 | 370,172,898 | 10,993,756 | 239,838,233 | ||||||||||||
Reinvestment of distributions | 4,377,026 | 120,455,750 | 4,259,079 | 88,461,069 | ||||||||||||
Shares redeemed | (11,564,824 | ) | (338,002,572 | ) | (18,101,436 | ) | (383,808,691 | ) | ||||||||
| 5,492,266 | 152,626,076 | (2,848,601 | ) | (55,509,389 | ) | |||||||||||
| Service Shares | ||||||||||||||||
Shares sold | 1,594,414 | 35,391,326 | 994,719 | 20,782,076 | ||||||||||||
Reinvestment of distributions | 260,883 | 6,070,740 | 130,447 | 2,354,561 | ||||||||||||
Shares redeemed | (2,434,431 | ) | (60,424,848 | ) | (627,094 | ) | (11,735,697 | ) | ||||||||
| (579,134 | ) | (18,962,782 | ) | 498,072 | 11,400,940 | |||||||||||
| Investor Shares | ||||||||||||||||
Shares sold | 10,541,900 | 296,328,064 | 5,938,295 | 127,370,352 | ||||||||||||
Reinvestment of distributions | 2,963,694 | 77,470,953 | 2,624,916 | 52,183,322 | ||||||||||||
Shares redeemed | (6,490,683 | ) | (179,213,509 | ) | (7,704,411 | ) | (158,699,905 | ) | ||||||||
| 7,014,911 | 194,585,508 | 858,800 | 20,853,769 | |||||||||||||
| Class R6 Shares | ||||||||||||||||
Shares sold | 2,174,127 | 64,179,364 | 981,189 | 21,371,966 | ||||||||||||
Reinvestment of distributions | 431,371 | 11,884,258 | 354,195 | 7,363,714 | ||||||||||||
Shares redeemed | (1,072,329 | ) | (31,492,709 | ) | (961,271 | ) | (20,831,469 | ) | ||||||||
| 1,533,169 | 44,570,913 | 374,113 | 7,904,211 | |||||||||||||
| Class R Shares | ||||||||||||||||
Shares sold | 221,459 | 5,420,426 | 187,440 | 3,412,058 | ||||||||||||
Reinvestment of distributions | 98,410 | 2,247,682 | 103,778 | 1,845,169 | ||||||||||||
Shares redeemed | (352,609 | ) | (8,610,079 | ) | (507,184 | ) | (9,368,570 | ) | ||||||||
| (32,740 | ) | (941,971 | ) | (215,966 | ) | (4,111,343 | ) | |||||||||
| Class P Shares | ||||||||||||||||
Shares sold | 8,073,333 | 238,055,318 | 4,245,963 | 89,075,046 | ||||||||||||
Reinvestment of distributions | 1,705,056 | 46,974,296 | 1,155,623 | 24,025,405 | ||||||||||||
Shares redeemed | (1,882,850 | ) | (54,615,458 | ) | (2,908,213 | ) | (58,822,878 | ) | ||||||||
| 7,895,539 | 230,414,156 | 2,493,373 | 54,277,573 | |||||||||||||
NET INCREASE (DECREASE) | 23,402,086 | $ | 660,032,873 | (1,622,933 | ) | $ | (12,445,580 | ) | ||||||||
169
GOLDMAN SACHS FUNDAMENTAL EQUITY GROWTH FUNDS
Notes to Financial Statements (continued)
August 31, 2021
| 11. SUMMARY OF SHARE TRANSACTIONS (continued) |
| Strategic Growth Fund | ||||||||||||||||
|
| |||||||||||||||
| For the Fiscal Year Ended August 31, 2021 | For the Fiscal Year Ended August 31, 2020 | |||||||||||||||
|
| |||||||||||||||
| Shares | Dollars | Shares | Dollars | |||||||||||||
|
| |||||||||||||||
| Class A Shares |
| |||||||||||||||
Shares sold | 2,211,800 | $ | 23,109,951 | 553,235 | $ | 4,903,579 | ||||||||||
Reinvestment of distributions | 539,120 | 5,353,462 | 513,629 | 4,304,210 | ||||||||||||
Shares redeemed | (854,990 | ) | (9,373,663 | ) | (862,216 | ) | (7,517,379 | ) | ||||||||
| 1,895,930 | 19,089,750 | 204,648 | 1,690,410 | |||||||||||||
| Class C Shares | ||||||||||||||||
Shares sold | 146,125 | 896,160 | 141,767 | 736,027 | ||||||||||||
Reinvestment of distributions | 242,301 | 1,240,583 | 188,776 | 938,217 | ||||||||||||
Shares redeemed | (453,098 | ) | (2,538,075 | ) | (328,543 | ) | (1,733,964 | ) | ||||||||
| (64,672 | ) | (401,332 | ) | 2,000 | (59,720 | ) | ||||||||||
| Institutional Shares | ||||||||||||||||
Shares sold | 471,239 | 5,959,408 | 829,394 | 7,933,508 | ||||||||||||
Reinvestment of distributions | 651,729 | 7,599,286 | 762,714 | 7,331,386 | ||||||||||||
Shares redeemed | (1,480,003 | ) | (18,734,640 | ) | (1,949,649 | ) | (19,965,455 | ) | ||||||||
| (357,035 | ) | (5,175,946 | ) | (357,541 | ) | (4,700,561 | ) | |||||||||
| Service Shares | ||||||||||||||||
Shares sold | 10,660 | 112,383 | 9,552 | 90,934 | ||||||||||||
Reinvestment of distributions | 8,193 | 79,067 | 12,249 | 100,316 | ||||||||||||
Shares redeemed | (12,805 | ) | (128,377 | ) | (44,300 | ) | (322,197 | ) | ||||||||
| 6,048 | 63,073 | (22,499 | ) | (130,947 | ) | |||||||||||
| Investor Shares | ||||||||||||||||
Shares sold | 71,697 | 904,045 | 699,635 | 6,739,272 | ||||||||||||
Reinvestment of distributions | 32,993 | 382,724 | 24,665 | 235,813 | ||||||||||||
Shares redeemed | (95,477 | ) | (1,200,916 | ) | (657,615 | ) | (5,547,277 | ) | ||||||||
| 9,213 | 85,853 | 66,685 | 1,427,808 | |||||||||||||
| Class R6 Shares | ||||||||||||||||
Shares sold | 22,517 | 276,660 | 22,653 | 245,561 | ||||||||||||
Reinvestment of distributions | 5,037 | 58,588 | 5,708 | 54,757 | ||||||||||||
Shares redeemed | (12,605 | ) | (160,196 | )�� | (34,804 | ) | (358,218 | ) | ||||||||
| 14,949 | 175,052 | (6,443 | ) | (57,900 | ) | |||||||||||
| Class R Shares | ||||||||||||||||
Shares sold | 13,998 | 137,988 | 14,367 | 116,717 | ||||||||||||
Reinvestment of distributions | 720 | 6,717 | 321 | 2,557 | ||||||||||||
Shares redeemed | (2,423 | ) | (26,842 | ) | (41,401 | ) | (357,139 | ) | ||||||||
| 12,295 | 117,863 | (26,713 | ) | (237,865 | ) | |||||||||||
| Class P Shares | ||||||||||||||||
Shares sold | 391,470 | 4,905,669 | 623,912 | 6,250,168 | ||||||||||||
Reinvestment of distributions | 919,738 | 10,678,494 | 1,128,927 | 10,817,531 | ||||||||||||
Shares redeemed | (1,140,145 | ) | (14,135,820 | ) | (2,698,348 | ) | (26,855,957 | ) | ||||||||
| 171,063 | 1,448,343 | (945,509 | ) | (9,788,258 | ) | |||||||||||
NET INCREASE (DECREASE) | 1,687,791 | $ | 15,402,656 | (1,085,372 | ) | $ | (11,857,033 | ) | ||||||||
170
GOLDMAN SACHS FUNDAMENTAL EQUITY GROWTH FUNDS
| 11. SUMMARY OF SHARE TRANSACTIONS (continued) |
| Technology Opportunities Fund | ||||||||||||||||
|
| |||||||||||||||
| For the Fiscal Year Ended August 31, 2021 | For the Fiscal Year Ended August 31, 2020 | |||||||||||||||
|
| |||||||||||||||
| Shares | Dollars | Shares | Dollars | |||||||||||||
|
| |||||||||||||||
| Class A Shares | ||||||||||||||||
Shares sold | 1,409,437 | $ | 42,207,117 | 2,497,794 | $ | 57,989,772 | ||||||||||
Reinvestment of distributions | 1,253,567 | 34,974,532 | 2,085,573 | 43,609,325 | ||||||||||||
Shares redeemed | (2,731,899 | ) | (82,269,590 | ) | (3,350,577 | ) | (77,184,340 | ) | ||||||||
| (68,895 | ) | (5,087,941 | ) | 1,232,790 | 24,414,757 | |||||||||||
| Class C Shares | ||||||||||||||||
Shares sold | 175,693 | 3,723,127 | 411,605 | 7,006,981 | ||||||||||||
Reinvestment of distributions | 172,234 | 3,368,893 | 269,706 | 4,131,894 | ||||||||||||
Shares redeemed | (592,805 | ) | (12,389,857 | ) | (687,548 | ) | (11,865,762 | ) | ||||||||
| (244,878 | ) | (5,297,837 | ) | (6,237 | ) | (726,887 | ) | |||||||||
| Institutional Shares | ||||||||||||||||
Shares sold | 1,305,235 | 45,946,399 | 2,457,174 | 67,343,687 | ||||||||||||
Reinvestment of distributions | 340,510 | 11,192,560 | 433,094 | 10,502,518 | ||||||||||||
Shares redeemed | (1,589,060 | ) | (55,801,050 | ) | (1,184,364 | ) | (30,880,214 | ) | ||||||||
| 56,685 | 1,337,909 | 1,705,904 | 46,965,991 | |||||||||||||
| Service Shares | ||||||||||||||||
Shares sold | 229,563 | 6,509,328 | 740,768 | 16,455,724 | ||||||||||||
Reinvestment of distributions | 123,618 | 3,320,385 | 218,520 | 4,425,035 | ||||||||||||
Shares redeemed | (632,428 | ) | (17,980,339 | ) | (822,663 | ) | (18,106,252 | ) | ||||||||
| (279,247 | ) | (8,150,626 | ) | 136,625 | 2,774,507 | |||||||||||
| Investor Shares | ||||||||||||||||
Shares sold | 324,085 | 10,955,177 | 875,798 | 22,475,983 | ||||||||||||
Reinvestment of distributions | 124,715 | 3,999,623 | 107,586 | 2,550,857 | ||||||||||||
Shares redeemed | (855,462 | ) | (29,665,721 | ) | (296,616 | ) | (7,844,763 | ) | ||||||||
| (406,662 | ) | (14,710,921 | ) | 686,768 | 17,182,077 | |||||||||||
| Class R6 Shares | ||||||||||||||||
Shares sold | 37,303 | 1,390,131 | 40,331 | 1,174,805 | ||||||||||||
Reinvestment of distributions | 3,436 | 113,026 | 1,342 | 32,559 | ||||||||||||
Shares redeemed | (3532 | ) | (130,198 | ) | (8,472 | ) | (199,381 | ) | ||||||||
| 37,207 | 1,372,959 | 33,201 | 1,007,983 | |||||||||||||
| Class P Shares | ||||||||||||||||
Shares sold | 1,708,880 | 60,358,228 | 1,140,621 | 31,338,168 | ||||||||||||
Reinvestment of distributions | 178,139 | 5,859,003 | 145,323 | 3,525,530 | ||||||||||||
Shares redeemed | (222,473 | ) | (7,857,580 | ) | (376,367 | ) | (9,279,340 | ) | ||||||||
| 1,664,546 | 58,359,651 | 909,577 | 25,584,358 | |||||||||||||
NET INCREASE | 758,756 | $ | 27,823,194 | 4,698,628 | $ | 117,202,786 | ||||||||||
171
GOLDMAN SACHS FUNDAMENTAL EQUITY GROWTH FUNDS
Notes to Financial Statements (continued)
August 31, 2021
| 11. SUMMARY OF SHARE TRANSACTIONS (continued) |
| U.S. Equity ESG Fund | ||||||||||||||||
|
| |||||||||||||||
| For the Fiscal Year Ended August 31, 2021 | For the Fiscal Year Ended August 31, 2020 | |||||||||||||||
|
| |||||||||||||||
| Shares | Dollars | Shares | Dollars | |||||||||||||
|
| |||||||||||||||
| Class A Shares | ||||||||||||||||
Shares sold | 36,027 | $ | 602,085 | 128,411 | $ | 1,726,402 | ||||||||||
Reinvestment of distributions | 40,274 | 600,840 | 12,565 | 176,323 | ||||||||||||
Shares redeemed | (35,495 | ) | (577,139 | ) | (77,681 | ) | (1,056,288 | ) | ||||||||
| 40,806 | 625,786 | 63,295 | 846,437 | |||||||||||||
| Class C Shares | ||||||||||||||||
Shares sold | 3,032 | 45,968 | 19,484 | 254,410 | ||||||||||||
Reinvestment of distributions | 15,158 | 212,062 | 4,445 | 59,055 | ||||||||||||
Shares redeemed | (15,176 | ) | (237,192 | ) | (4,920 | ) | (60,492 | ) | ||||||||
| 3,014 | 20,838 | 19,009 | 252,973 | |||||||||||||
| Institutional Shares | ||||||||||||||||
Shares sold | 33,976 | 560,242 | 8,620 | 115,908 | ||||||||||||
Reinvestment of distributions | 3,494 | 52,836 | 1,252 | 17,743 | ||||||||||||
Shares redeemed | (846 | ) | (14,980 | ) | (3,698 | ) | (48,507 | ) | ||||||||
| 36,624 | 598,098 | 6,174 | 85,144 | |||||||||||||
| Investor Shares | ||||||||||||||||
Shares sold | 24270 | 427,247 | 5,965 | 82,388 | ||||||||||||
Reinvestment of distributions | 2,516 | 38,039 | 737 | 10,448 | ||||||||||||
Shares redeemed | (2659 | ) | (47,084 | ) | (62,468 | ) | (875,883 | ) | ||||||||
| 24,127 | 418,202 | (55,766 | ) | (783,047 | ) | |||||||||||
| Class R6 Shares | ||||||||||||||||
Shares sold | 11,345 | 193,173 | 41,308 | 574,818 | ||||||||||||
Reinvestment of distributions | 8,342 | 126,140 | 8,674 | 122,997 | ||||||||||||
Shares redeemed | (40,849 | ) | (670,313 | ) | (201,316 | ) | (2,732,496 | ) | ||||||||
| (21,162 | ) | (351,000 | ) | (151,334 | ) | (2,034,681 | ) | |||||||||
| Class R Shares | ||||||||||||||||
Shares sold | 24,272 | 432,443 | — | — | ||||||||||||
Reinvestment of distributions | 162 | 2,431 | — | — | ||||||||||||
Shares redeemed | (538 | ) | (9,952 | ) | — | — | ||||||||||
| 23,896 | 424,922 | — | — | |||||||||||||
| Class P Shares | ||||||||||||||||
Shares sold | 101,686 | 1,734,106 | — | — | ||||||||||||
Reinvestment of distributions | 6,052 | 91,452 | 7,056 | 100,044 | ||||||||||||
Shares redeemed | (5,371 | ) | (81,152 | ) | (110,018 | ) | (1,293,839 | ) | ||||||||
| 102,367 | 1,744,406 | (102,962 | ) | (1,193,795 | ) | |||||||||||
NET INCREASE (DECREASE) | 209,672 | $ | 3,481,252 | (221,584 | ) | $ | (2,826,969 | ) | ||||||||
172
Report of Independent Registered Public
Accounting Firm
To the Board of Trustees of Goldman Sachs Trust and Shareholders of Goldman Sachs Capital Growth Fund, Goldman Sachs Concentrated Growth Fund, Goldman Sachs Flexible Cap Fund, Goldman Sachs Growth Opportunities Fund, Goldman Sachs Small Cap Growth Fund, Goldman Sachs Small/Mid Cap Growth Fund, Goldman Sachs Strategic Growth Fund, Goldman Sachs Technology Opportunities Fund, and Goldman Sachs U.S. Equity ESG Fund
Opinions on the Financial Statements
We have audited the accompanying statements of assets and liabilities, including the schedules of investments, of each of the funds indicated in the table below (nine of the funds constituting Goldman Sachs Trust, hereafter collectively referred to as the “Funds”) as of August 31, 2021, the related statements of operations and of changes in net assets for each of the periods indicated in the table below, including the related notes, and the financial highlights for each of the periods indicated in the table below (collectively referred to as the “financial statements”). In our opinion, the financial statements present fairly, in all material respects, the financial position of each of the Funds as of August 31, 2021, the results of each of their operations, the changes in each of their net assets, and each of the financial highlights for each of the periods indicated in the table below, in conformity with accounting principles generally accepted in the United States of America.
| Fund | Statement of operations | Statements of changes in net assets | Financial highlights | |||
| Goldman Sachs Capital Growth Fund, Goldman Sachs Concentrated Growth Fund, Goldman Sachs Flexible Cap Fund, Goldman Sachs Growth Opportunities Fund, Goldman Sachs Small/Mid Cap Growth Fund, Goldman Sachs Strategic Growth Fund, Goldman Sachs Technology Opportunities Fund, and Goldman Sachs U.S. Equity ESG Fund | For the year ended August 31, 2021 | For the two years ended August 31, 2021 | For each of the periods indicated therein | |||
| Goldman Sachs Small Cap Growth Fund | For the year ended August 31, 2021 | For the year ended August 31, 2021, and for the period October 31, 2019 (commencement of operations) through August 31, 2020 | ||||
Basis for Opinions
These financial statements are the responsibility of the Funds’ management. Our responsibility is to express an opinion on the Funds’ financial statements based on our audits. We are a public accounting firm registered with the Public Company Accounting Oversight Board (United States) (PCAOB) and are required to be independent with respect to the Funds in accordance with the U.S. federal securities laws and the applicable rules and regulations of the Securities and Exchange Commission and the PCAOB.
We conducted our audits of these financial statements in accordance with the standards of the PCAOB. Those standards require that we plan and perform the audit to obtain reasonable assurance about whether the financial statements are free of material misstatement, whether due to error or fraud. Our audits included performing procedures to assess the risks of material misstatement of the financial statements, whether due to error or fraud, and performing procedures that respond to those risks. Such procedures included examining, on a test basis, evidence regarding the amounts and disclosures in the financial statements. Our audits also included evaluating the accounting principles used and significant estimates made by management, as well as evaluating the overall presentation of the financial statements. Our procedures included confirmation of securities owned as of August 31, 2021 by correspondence with the custodian, transfer agent and brokers; when replies were not received from brokers, we performed other auditing procedures. We believe that our audits provide a reasonable basis for our opinions.
/s/ PricewaterhouseCoopers LLP
Boston, Massachusetts
October 26, 2021
We have served as the auditor of one or more investment companies in the Goldman Sachs fund complex since 2000.
173
GOLDMAN SACHS FUNDAMENTAL EQUITY GROWTH FUNDS
Voting Results of Special Meeting of Shareholders (Unaudited)
A Special Meeting of the shareholders of the Goldman Sachs Trust was held on April 16, 2021 to consider and act upon a proposal to approve a change to the Goldman Sachs Strategic Growth Fund’s sub-classification under the Investment Company Act of 1940 from “diversified” to “non-diversified” and eliminate the Fund’s related fundamental investment restriction.
The shareholders voted as follows:
| Proposal 1 | For | Against/Withhold | Abstain | |||||||||
To approve a change to the Fund’s sub-classification under the Investment Company Act of 1940 from “diversified” to “non-diversified” and to eliminate any related fundamental investment restriction for the Fund. | 7,265,885.933 | 319,966.701 | 372,384.714 | |||||||||
174
GOLDMAN SACHS FUNDAMENTAL EQUITY GROWTH FUNDS
Fund Expenses — Six Month Period Ended August 31, 2021 (Unaudited)
As a shareholder of Class A, Class C, Institutional, Service, Investor, Class P, Class R or Class R6 Shares of a Fund, you incur two types of costs: (1) transaction costs, including sales charges on purchase payments (with respect to Class A Shares), contingent deferred sales charges on redemptions (with respect to Class C Shares), and (2) ongoing costs, including management fees; distribution and/or service (12b-1) fees (with respect to Class A, Class C, Service and Class R Shares); and other Fund expenses. The example is intended to help you understand your ongoing costs (in dollars) of investing in Class A, Class C, Institutional, Service, Investor, Class P, Class R and Class R6 Shares of the Funds and to compare these costs with the ongoing costs of investing in other mutual funds.
The example is based on an investment of $1,000 invested at the beginning of the period and held for the entire period from March 1, 2021 through August 31, 2021, which represents a period of 184 days of a 365 day year.
Actual Expenses — The first line under each share class in the table below provides information about actual account values and actual expenses. You may use the information in this line, together with the amount you invested, to estimate the expenses that you paid over the period. Simply divide your account value by $1,000 (for example, an $8,600 account value divided by $1,000=8.6), then multiply the result by the number in the first line under the heading entitled “Expenses Paid” to estimate the expenses you paid on your account during this period.
Hypothetical Example for Comparison Purposes — The second line under each share class in the table below provides information about hypothetical account values and hypothetical expenses based on the Funds’ actual net expense ratios and an assumed rate of return of 5% per year before expenses, which is not the Funds’ actual return. The hypothetical account values and expenses may not be used to estimate the actual ending account balance or expenses you paid for the period. You may use this information to compare the ongoing costs of investing in the Funds and other funds. To do so, compare this 5% hypothetical example with the 5% hypothetical examples that appear in the shareholder reports of the other funds.
Please note that the expenses shown in the table are meant to highlight your ongoing costs only and do not reflect any transactional costs, such as sales charges, redemption fees, or exchange fees. Therefore, the second line of the table is useful in comparing ongoing costs only, and will not help you determine the relative total costs of owning different funds. In addition, if these transactional costs were included, your costs would have been higher.
| Capital Growth Fund | Concentrated Growth Fund | Flexible Cap Fund | Growth Opportunities Fund | Small Cap Growth Fund | ||||||||||||||||||||||||||||||||||||||||||||||||||||||||
| Share Class | Beginning Account Value 3/1/21 | Ending Account Value 8/31/21 | Expenses Paid for the 6 months ended 8/31/2021* | Beginning Account Value 3/1/21 | Ending Account Value 8/31/21 | Expenses Paid for the 6 months ended 8/31/2021* | Beginning Account Value 3/1/21 | Ending Account Value 8/31/21 | Expenses Paid for the 6 months ended 8/31/2021* | Beginning Account Value 3/1/21 | Ending Account Value 8/31/21 | Expenses Paid for the 6 months ended 8/31/2021* | Beginning Account Value 3/1/21 | Ending Account Value 8/31/21 | Expenses Paid for the 6 months ended 8/31/2021* | |||||||||||||||||||||||||||||||||||||||||||||
| Class A | ||||||||||||||||||||||||||||||||||||||||||||||||||||||||||||
Actual | $ | 1,000.00 | $ | 1,190.23 | $ | 6.13 | $ | 1,000.00 | $ | 1,209.93 | $ | 6.14 | $ | 1,000.00 | $ | 1,187.11 | $ | 5.29 | $ | 1,000.00 | $ | 1,110.43 | $ | 6.61 | $ | 1,000.00 | $ | 1,037.47 | $ | 6.56 | ||||||||||||||||||||||||||||||
Hypothetical 5% return | 1,000.00 | 1,019.61 | + | 5.65 | 1,000.00 | 1,019.65 | + | 5.61 | 1,000.00 | 1,020.37 | + | 4.88 | 1,000.00 | 1,018.94 | + | 6.33 | 1,000.00 | 1,018.76 | + | 6.50 | ||||||||||||||||||||||||||||||||||||||||
| Class C | ||||||||||||||||||||||||||||||||||||||||||||||||||||||||||||
Actual | 1,000.00 | 1,185.67 | 10.25 | 1,000.00 | 1,205.40 | 10.30 | 1,000.00 | 1,181.82 | 9.40 | 1,000.00 | 1,105.67 | 10.58 | 1,000.00 | 1,034.08 | 10.40 | |||||||||||||||||||||||||||||||||||||||||||||
Hypothetical 5% return | 1,000.00 | 1,015.83 | + | 9.45 | 1,000.00 | 1,015.87 | + | 9.41 | 1,000.00 | 1,016.59 | + | 8.69 | 1,000.00 | 1,015.16 | + | 10.12 | 1,000.00 | 1,014.98 | + | 10.30 | ||||||||||||||||||||||||||||||||||||||||
| Institutional | ||||||||||||||||||||||||||||||||||||||||||||||||||||||||||||
Actual | 1,000.00 | 1,192.55 | 4.09 | 1,000.00 | 1,211.71 | 4.47 | 1,000.00 | 1,188.98 | 3.25 | 1,000.00 | 1,112.13 | 4.81 | 1,000.00 | 1,039.17 | 4.66 | |||||||||||||||||||||||||||||||||||||||||||||
Hypothetical 5% return | 1,000.00 | 1,021.47 | + | 3.77 | 1,000.00 | 1,021.16 | + | 4.09 | 1,000.00 | 1,022.24 | + | 3.00 | 1,000.00 | 1,020.65 | + | 4.60 | 1,000.00 | 1,020.63 | + | 4.62 | ||||||||||||||||||||||||||||||||||||||||
| Service | ||||||||||||||||||||||||||||||||||||||||||||||||||||||||||||
Actual | 1,000.00 | 1,189.36 | 6.84 | N/A | N/A | N/A | N/A | N/A | N/A | 1,000.00 | 1,109.03 | 7.44 | N/A | N/A | N/A | |||||||||||||||||||||||||||||||||||||||||||||
Hypothetical 5% return | 1,000.00 | 1,018.95 | + | 6.31 | N/A | N/A | N/A | N/A | N/A | N/A | 1,000.00 | 1,018.15 | + | 7.12 | N/A | N/A | N/A | |||||||||||||||||||||||||||||||||||||||||||
| Investor | ||||||||||||||||||||||||||||||||||||||||||||||||||||||||||||
Actual | 1,000.00 | 1,191.73 | 4.75 | 1,000.00 | 1,211.20 | 4.75 | 1,000.00 | 1,187.79 | 3.91 | 1,000.00 | 1,111.65 | 5.29 | 1,000.00 | 1,038.58 | 5.28 | |||||||||||||||||||||||||||||||||||||||||||||
Hypothetical 5% return | 1,000.00 | 1,020.87 | + | 4.38 | 1,000.00 | 1,020.91 | + | 4.34 | 1,000.00 | 1,021.64 | + | 3.61 | 1,000.00 | 1,020.20 | + | 5.06 | 1,000.00 | 1,020.03 | + | 5.23 | ||||||||||||||||||||||||||||||||||||||||
| Class R6 | ||||||||||||||||||||||||||||||||||||||||||||||||||||||||||||
Actual | 1,000.00 | 1,192.84 | 4.04 | 1,000.00 | 1,211.82 | 4.42 | 1,000.00 | 1,188.70 | 3.19 | 1,000.00 | 1,111.94 | 4.75 | 1,000.00 | 1,039.78 | 4.61 | |||||||||||||||||||||||||||||||||||||||||||||
Hypothetical 5% return | 1,000.00 | 1,021.52 | + | 3.72 | 1,000.00 | 1,021.21 | + | 4.04 | 1,000.00 | 1,022.29 | + | 2.95 | 1,000.00 | 1,020.70 | + | 4.55 | 1,000.00 | 1,020.68 | + | 4.57 | ||||||||||||||||||||||||||||||||||||||||
| Class R | ||||||||||||||||||||||||||||||||||||||||||||||||||||||||||||
Actual | 1,000.00 | 1,188.70 | 7.50 | 1,000.00 | 1,208.24 | 7.52 | 1,000.00 | 1,184.97 | 6.66 | 1,000.00 | 1,108.88 | 7.94 | 1,000.00 | 1,036.31 | 7.84 | |||||||||||||||||||||||||||||||||||||||||||||
Hypothetical 5% return | 1,000.00 | 1,018.35 | + | 6.92 | 1,000.00 | 1,018.39 | + | 6.88 | 1,000.00 | 1,019.11 | + | 6.15 | 1,000.00 | 1,017.68 | + | 7.59 | 1,000.00 | 1,017.50 | + | 7.77 | ||||||||||||||||||||||||||||||||||||||||
| Class P | ||||||||||||||||||||||||||||||||||||||||||||||||||||||||||||
Actual | 1,000.00 | 1,192.60 | 4.04 | 1,000.00 | 1,211.90 | 4.42 | 1,000.00 | 1,188.70 | 3.19 | 1,000.00 | 1,111.90 | 4.75 | 1,000.00 | 1,039.80 | 4.61 | |||||||||||||||||||||||||||||||||||||||||||||
Hypothetical 5% return | 1,000.00 | 1,021.52 | + | 3.72 | 1,000.00 | 1,021.21 | + | 4.04 | 1,000.00 | 1,022.29 | + | 2.95 | 1,000.00 | 1,020.70 | + | 4.55 | 1,000.00 | 1,020.68 | + | 4.57 | ||||||||||||||||||||||||||||||||||||||||
| + | Hypothetical expenses are based on each Fund’s actual annualized net expense ratios and an assumed rate of return of 5% per year before expenses. |
| * | Expenses for each share class are calculated using each Fund’s annualized net expense ratio for each class, which represents the ongoing expenses as a percentage of net assets for the six months ended August 31, 2021. Expenses are calculated by multiplying the annualized net expense ratio by the average account value for the period; then multiplying the result by the number of days in the most recent fiscal half year; and then dividing that result by the number of days in the fiscal year. The annualized net expense ratios for the period were as follows: |
| Fund | Class A Shares | Class C Shares | Institutional Shares | Service Shares | Investor Shares | Class R6 Shares | Class R Shares | Class P Shares | ||||||||||||||||||||||||
Capital Growth Fund | 1.11 | % | 1.86 | % | 0.74 | % | 1.24 | % | 0.86 | % | 0.73 | % | 1.36 | % | 0.73 | % | ||||||||||||||||
Concentrated Growth Fund | 1.10 | 1.85 | 0.80 | N/A | 0.85 | 0.79 | 1.35 | 0.79 | ||||||||||||||||||||||||
Flexible Cap Fund | 0.96 | 1.71 | 0.59 | N/A | 0.71 | 0.58 | 1.21 | 0.58 | ||||||||||||||||||||||||
Growth Opportunities Fund | 1.24 | 1.99 | 0.90 | 1.40 | 0.99 | 0.89 | 1.49 | 0.89 | ||||||||||||||||||||||||
Small Cap Growth Fund | 1.28 | 2.03 | 0.91 | N/A | 1.03 | 0.90 | 1.53 | 0.90 | ||||||||||||||||||||||||
175
GOLDMAN SACHS FUNDAMENTAL EQUITY GROWTH FUNDS
Fund Expenses — Six Month Period Ended August 31, 2021 (Unaudited) (continued)
| Small/Mid Cap Growth Fund | Strategic Growth Fund | Technology Opportunities Fund | U.S. Equity ESG Fund | |||||||||||||||||||||||||||||||||||||||||||||
| Share Class | Beginning 3/1/21 | Ending Account Value 8/31/21 | Expenses Paid for the 6 months ended 8/31/2021* | Beginning 3/1/21 | Ending Account Value 8/31/21 | Expenses Paid for the 6 months ended 8/31/2021* | Beginning 3/1/21 | Ending Account Value 8/31/21 | Expenses Paid for the 6 months ended 8/31/2021* | Beginning 3/1/21 | Ending Account Value 8/31/21 | Expenses Paid for the 6 months ended 8/31/2021* | ||||||||||||||||||||||||||||||||||||
| Class A | ||||||||||||||||||||||||||||||||||||||||||||||||
Actual | $ | 1,000.00 | $ | 1,073.98 | $ | 6.28 | $ | 1,000.00 | $ | 1,192.64 | $ | 6.20 | $ | 1,000.00 | $ | 1,194.89 | $ | 7.04 | $ | 1,000.00 | $ | 1,197.09 | $ | 5.58 | ||||||||||||||||||||||||
Hypothetical 5% return | 1,000.00 | 1,019.15 | + | 6.11 | 1,000.00 | 1,019.55 | + | 5.71 | 1,000.00 | 1,018.79 | + | 6.47 | 1,000.00 | 1,020.12 | + | 5.13 | ||||||||||||||||||||||||||||||||
| Class C | ||||||||||||||||||||||||||||||||||||||||||||||||
Actual | 1,000.00 | 1,070.06 | 10.18 | 1,000.00 | 1,187.97 | 10.32 | 1,000.00 | 1,190.85 | 11.16 | 1,000.00 | 1,192.59 | 9.72 | ||||||||||||||||||||||||||||||||||||
Hypothetical 5% return | 1,000.00 | 1,015.37 | + | 9.91 | 1,000.00 | 1,015.77 | + | 9.51 | 1,000.00 | 1,015.01 | + | 10.27 | 1,000.00 | 1,016.34 | + | 8.94 | ||||||||||||||||||||||||||||||||
| Institutional | ||||||||||||||||||||||||||||||||||||||||||||||||
Actual | 1,000.00 | 1,075.78 | 4.61 | 1,000.00 | 1,195.38 | 4.16 | 1,000.00 | 1,196.88 | 5.44 | 1,000.00 | 1,199.37 | 3.71 | ||||||||||||||||||||||||||||||||||||
Hypothetical 5% return | 1,000.00 | 1,020.76 | + | 4.49 | 1,000.00 | 1,021.41 | + | 3.83 | 1,000.00 | 1,020.26 | + | 5.00 | 1,000.00 | 1,021.84 | + | 3.41 | ||||||||||||||||||||||||||||||||
| Service | ||||||||||||||||||||||||||||||||||||||||||||||||
Actual | 1,000.00 | 1,072.94 | 7.21 | 1,000.00 | 1,193.42 | 6.91 | 1,000.00 | 1,194.05 | 8.18 | N/A | N/A | N/A | ||||||||||||||||||||||||||||||||||||
Hypothetical 5% return | 1,000.00 | 1,018.25 | + | 7.02 | 1,000.00 | 1,018.90 | + | 6.36 | 1,000.00 | 1,017.74 | + | 7.53 | N/A | N/A | N/A | |||||||||||||||||||||||||||||||||
| Investor | ||||||||||||||||||||||||||||||||||||||||||||||||
Actual | 1,000.00 | 1,075.15 | 4.98 | 1,000.00 | 1,194.86 | 4.83 | 1,000.00 | 1,196.74 | 5.66 | 1,000.00 | 1,198.50 | 4.20 | ||||||||||||||||||||||||||||||||||||
Hypothetical 5% return | 1,000.00 | 1,020.41 | + | 4.85 | 1,000.00 | 1,020.81 | + | 4.44 | 1,000.00 | 1,020.05 | + | 5.20 | 1,000.00 | 1,021.38 | + | 3.86 | ||||||||||||||||||||||||||||||||
| Class R6 | ||||||||||||||||||||||||||||||||||||||||||||||||
Actual | 1,000.00 | 1,076.04 | 4.56 | 1,000.00 | 1,195.04 | 4.11 | 1,000.00 | 1,197.05 | 5.38 | 1,000.00 | 1,199.25 | 3.65 | ||||||||||||||||||||||||||||||||||||
Hypothetical 5% return | 1,000.00 | 1,020.81 | + | 4.44 | 1,000.00 | 1,021.46 | + | 3.78 | 1,000.00 | 1,020.31 | + | 4.95 | 1,000.00 | 1,021.89 | + | 3.36 | ||||||||||||||||||||||||||||||||
| Class R | ||||||||||||||||||||||||||||||||||||||||||||||||
Actual | 1,000.00 | 1,072.71 | 7.58 | 1,000.00 | 1,190.72 | 7.58 | N/A | N/A | N/A | 1,000.00 | 1,195.60 | 6.97 | ||||||||||||||||||||||||||||||||||||
Hypothetical 5% return | 1,000.00 | 1,017.89 | + | 7.38 | 1,000.00 | 1,018.29 | + | 6.98 | N/A | N/A | N/A | 1,000.00 | 1,018.86 | + | 6.41 | |||||||||||||||||||||||||||||||||
| Class P | ||||||||||||||||||||||||||||||||||||||||||||||||
Actual | 1,000.00 | 1,075.68 | 4.56 | 1,000.00 | 1,195.36 | 4.11 | 1,000.00 | 1,197.05 | 5.38 | 1,000.00 | 1,199.37 | 3.65 | ||||||||||||||||||||||||||||||||||||
Hypothetical 5% return | 1,000.00 | 1,020.81 | + | 4.44 | 1,000.00 | 1,021.46 | + | 3.78 | 1,000.00 | 1,020.31 | + | 4.95 | 1,000.00 | 1,021.89 | + | 3.36 | ||||||||||||||||||||||||||||||||
| + | Hypothetical expenses are based on each Fund’s actual annualized net expense ratios and an assumed rate of return of 5% per year before expenses. |
| * | Expenses for each share class are calculated using each Fund’s annualized net expense ratio for each class, which represents the ongoing expenses as a percentage of net assets for the six months ended August 31, 2021. Expenses are calculated by multiplying the annualized net expense ratio by the average account value for the period; then multiplying the result by the number of days in the most recent fiscal half year; and then dividing that result by the number of days in the fiscal year. The annualized net expense ratios for the period were as follows: |
| Fund | Class A Shares | Class C Shares | Institutional Shares | Service Shares | Investor Shares | Class R6 Shares | Class R Shares | Class P Shares | ||||||||||||||||||||||||
Small/Mid Cap Growth Fund | 1.20 | % | 1.95 | % | 0.88 | % | 1.38 | % | 0.95 | % | 0.87 | % | 1.45 | % | 0.87 | % | ||||||||||||||||
Strategic Growth Fund | 1.12 | 1.87 | 0.75 | 1.25 | 0.87 | 0.74 | 1.37 | 0.74 | ||||||||||||||||||||||||
Technology Opportunities Fund | 1.27 | 2.02 | 0.98 | 1.48 | 1.02 | 0.97 | N/A | 0.97 | ||||||||||||||||||||||||
U.S. Equity ESG Fund | 1.01 | 1.76 | 0.67 | N/A | 0.76 | 0.66 | 1.26 | 0.66 | ||||||||||||||||||||||||
176
GOLDMAN SACHS FUNDAMENTAL EQUITY GROWTH FUNDS
Statement Regarding Basis for Approval of Management Agreement (Unaudited)
Background
The Goldman Sachs Capital Growth Fund, Goldman Sachs Concentrated Growth Fund, Goldman Sachs Flexible Cap Fund, Goldman Sachs Growth Opportunities Fund, Goldman Sachs Small Cap Growth Fund, Goldman Sachs Small/Mid Cap Growth Fund, Goldman Sachs Strategic Growth Fund, Goldman Sachs Technology Opportunities Fund, and Goldman Sachs U.S. Equity ESG Fund (the “Funds”) are investment portfolios of Goldman Sachs Trust (the “Trust”). The Board of Trustees oversees the management of the Trust and reviews the investment performance and expenses of the Funds at regularly scheduled meetings held throughout the year. In addition, the Board of Trustees determines annually whether to approve the continuance of the Trust’s investment management agreement (the “Management Agreement”) with Goldman Sachs Asset Management, L.P. (the “Investment Adviser”) on behalf of the Funds.
The Management Agreement was most recently approved for continuation until June 30, 2022 by the Board of Trustees, including those Trustees who are not parties to the Management Agreement or “interested persons” (as defined in the Investment Company Act of 1940, as amended) of any party thereto (the “Independent Trustees”), at a meeting held on June 15-16, 2021 (the “Annual Meeting”).
The review process undertaken by the Trustees spans the course of the year and culminates with the Annual Meeting. To assist the Trustees in their deliberations, the Trustees have established a Contract Review Committee (the “Committee”), comprised of the Independent Trustees. The Committee held two meetings over the course of the year since the Management Agreement was last approved. At those Committee meetings, regularly scheduled Board or other committee meetings, and/or the Annual Meeting, matters relevant to the renewal of the Management Agreement were considered by the Board, or the Independent Trustees, as applicable. With respect to each Fund, such matters included:
| (a) | the nature and quality of the advisory, administrative, and other services provided to the Fund by the Investment Adviser and its affiliates, including information about: |
| (i) | the structure, staff, and capabilities of the Investment Adviser and its portfolio management teams; |
| (ii) | the groups within the Investment Adviser and its affiliates that support the portfolio management teams or provide other types of necessary services, including fund services groups (e.g., accounting and financial reporting, tax, shareholder services, and operations); controls and risk management groups (e.g., legal, compliance, valuation oversight, credit risk management, internal audit, compliance testing, market risk analysis, finance, and central funding); sales and distribution support groups, and others (e.g., information technology and training); |
| (iii) | trends in employee headcount; |
| (iv) | the Investment Adviser’s financial resources and ability to hire and retain talented personnel and strengthen its operations; and |
| (v) | the parent company’s support of the Investment Adviser and its mutual fund business, as expressed by the firm’s senior management; |
| (b) | information on the investment performance of the Fund, including comparisons to the performance of similar mutual funds, as provided by a third-party mutual fund data provider engaged as part of the contract review process (the “Outside Data Provider”), a benchmark performance index, and (in the case of the Concentrated Growth Fund and Strategic Growth Fund) a composite of accounts with comparable investment strategies managed by the Investment Adviser; and information on general investment outlooks in the markets in which the Fund invests; |
| (c) | information provided by the Investment Adviser indicating the Investment Adviser’s views on whether the Fund’s peer group and/or benchmark index had high, medium, or low relevance given the Fund’s particular investment strategy; |
| (d) | the terms of the Management Agreement and other agreements with affiliated service providers entered into by the Trust on behalf of the Fund; |
| (e) | fee and expense information for the Fund, including: |
| (i) | the relative management fee and expense levels of the Fund as compared to those of comparable funds managed by other advisers, as provided by the Outside Data Provider; |
| (ii) | the Fund’s expense trends over time (except for the Small Cap Growth Fund, which commenced operations on October 31, 2019); and |
| (iii) | to the extent the Investment Adviser manages other types of accounts (such as bank collective trusts, private wealth management accounts, institutional separate accounts, sub-advised mutual funds, and non-U.S. funds) having investment objectives and policies similar to those of the Fund, comparative information on the advisory fees charged and services provided to those accounts by the Investment Adviser; |
| (f) | with respect to the investment performance and expense comparison data provided by the Outside Data Provider, its processes in producing that data for the Fund; |
| (g) | the undertakings of the Investment Adviser and its affiliates to implement fee waivers and/or expense limitations; |
177
GOLDMAN SACHS FUNDAMENTAL EQUITY GROWTH FUNDS
Statement Regarding Basis for Approval of Management Agreement (Unaudited) (continued)
| (h) | information relating to the profitability of the Management Agreement and the transfer agency and distribution and service arrangements of the Fund to the Investment Adviser and its affiliates; |
| (i) | whether the Fund’s existing management fee schedule adequately addressed any economies of scale; |
| (j) | a summary of the “fall-out” benefits derived by the Investment Adviser and its affiliates from their relationships with the Fund, including the fees received by the Investment Adviser’s affiliates from the Fund for transfer agency, portfolio trading, distribution and other services; |
| (k) | a summary of potential benefits derived by the Fund as a result of its relationship with the Investment Adviser; |
| (l) | information regarding commissions paid by the Fund and broker oversight, an update on the Investment Adviser’s soft dollars practices, other information regarding portfolio trading, and how the Investment Adviser carries out its duty to seek best execution; |
| (m) | portfolio manager ownership of Fund shares; the manner in which portfolio manager compensation is determined; and the number and types of accounts managed by the portfolio managers; |
| (n) | the nature and quality of the services provided to the Fund by its unaffiliated service providers, and the Investment Adviser’s general oversight and evaluation (including reports on due diligence) of those service providers as part of the administrative services provided under the Management Agreement; and |
| (o) | the Investment Adviser’s processes and policies addressing various types of potential conflicts of interest; its approach to risk management; the annual review of the effectiveness of the Fund’s compliance program; and periodic compliance reports. |
The Trustees also received an overview of the Funds’ distribution arrangements. They received information regarding the Funds’ assets, share purchase and redemption activity, and payment of distribution, service, and shareholder administration fees, as applicable. Information was also provided to the Trustees relating to revenue sharing payments made by and services provided by the Investment Adviser and its affiliates to intermediaries that promote the sale, distribution, and/or servicing of Fund shares. The Independent Trustees also discussed the broad range of other investment choices that are available to Fund investors, including the availability of comparable funds managed by other advisers.
The presentations made at the Board and Committee meetings and at the Annual Meeting encompassed the Funds and other mutual funds for which the Board of Trustees has responsibility. In evaluating the Management Agreement at the Annual Meeting, the Trustees relied upon their knowledge, resulting from their meetings and other interactions throughout the year, of the Investment Adviser and its affiliates, their services, and the Funds. In conjunction with these meetings, the Trustees received written materials and oral presentations on the topics covered, and the Investment Adviser addressed the questions and concerns of the Trustees, including concerns regarding the investment performance of certain of the funds they oversee. The Independent Trustees were advised by their independent legal counsel regarding their responsibilities and other regulatory requirements related to the approval and continuation of mutual fund investment management agreements under applicable law. In addition, the Investment Adviser and its affiliates provided the Independent Trustees with a written response to a formal request for information sent on behalf of the Independent Trustees by their independent legal counsel. During the course of their deliberations, the Independent Trustees met in executive sessions with their independent legal counsel, without representatives of the Investment Adviser or its affiliates present.
Nature, Extent, and Quality of the Services Provided Under the Management Agreement
As part of their review, the Trustees considered the nature, extent, and quality of the services provided to the Funds by the Investment Adviser. In this regard, the Trustees considered both the investment advisory services and non-advisory services that are provided by the Investment Adviser and its affiliates. The Trustees noted the transition in the leadership and changes in personnel of various of the Investment Adviser’s portfolio management teams that had occurred in recent periods, and the ongoing recruitment efforts aimed at bringing high quality investment talent to the Investment Adviser. They also noted the Investment Adviser’s commitment to maintaining high quality systems and expending substantial resources to respond to ongoing changes to the market, regulatory and control environment in which the Funds and their service providers operate, including changes associated with the COVID-19 pandemic, as well as the efforts of the Investment Adviser and its affiliates to combat cyber security risks. The Trustees also considered information regarding the Investment Adviser’s business continuity planning and remote operations capabilities. The Trustees concluded that the Investment Adviser continued to commit substantial financial and operational resources to the Funds and expressed confidence that the Investment Adviser would continue to do so in the future. The Trustees also recognized that the Investment Adviser had made significant commitments to address regulatory compliance requirements applicable to the Funds and the Investment Adviser and its affiliates.
178
GOLDMAN SACHS FUNDAMENTAL EQUITY GROWTH FUNDS
Statement Regarding Basis for Approval of Management Agreement (Unaudited) (continued)
Investment Performance
The Trustees also considered the investment performance of the Funds. In this regard, they compared the investment performance of each Fund to its peers using rankings and (with the exception of the Small Cap Growth Fund) ratings compiled by the Outside Data Provider as of December 31, 2020, and updated performance information prepared by the Investment Adviser using the peer group identified by the Outside Data Provider as of March 31, 2021. The information on each Fund’s investment performance was provided for the one-, three-, five-, and ten-year periods ending on the applicable dates, to the extent that each Fund had been in existence for those periods. The Trustees also reviewed each Fund’s investment performance relative to its performance benchmark. As part of this review, they considered the investment performance trends of the Funds over time, and reviewed the investment performance of each Fund in light of its investment objective and policies and market conditions. The Trustees also received information comparing the Concentrated Growth Fund’s and Strategic Growth Fund’s performance to that of composites of accounts with comparable investment strategies managed by the Investment Adviser.
In addition, the Trustees considered materials prepared and presentations made by the Investment Adviser’s senior management and portfolio management personnel in which Fund performance was assessed. The Trustees also considered the Investment Adviser’s periodic reports with respect to the Funds’ risk profiles, and how the Investment Adviser’s approach to risk monitoring and management influences portfolio management.
The Trustees noted that the Capital Growth Fund’s Institutional Shares had placed in the top half of the Fund’s peer group for the one-, three-, five-, and ten-year periods, and had underperformed the Fund’s benchmark index for the one- and three-year periods and outperformed its benchmark index for the five- and ten-year periods ended March 31, 2021. They observed that the Concentrated Growth Fund’s Institutional Shares had placed in the top half of the Fund’s peer group for the three- and five-year periods and in the third quartile for the one- and ten-year periods, and had underperformed the Fund’s benchmark index for the one-, three-, five-, and ten-year periods ended March 31, 2021. The Trustees noted that the Flexible Cap Fund’s Institutional Shares had placed in the third quartile of the Fund’s peer group for the one-, five-, and ten-year periods and in the fourth quartile for the three- year period, and had outperformed the Fund’s benchmark index for the one-, five-, and ten-year periods and underperformed for the three-year period ended March 31, 2021. They also considered that the Flexible Cap Fund had experienced certain portfolio management changes in 2020. The Trustees noted that the Growth Opportunities Fund’s Institutional Shares had placed in the top half of the Fund’s peer group for the three-, five- and ten-year periods and in the third quartile for the one-year period, and had outperformed the Fund’s benchmark index for the one-, three-, and five-year periods and underperformed for the ten-year period ended March 31, 2021. They considered that the Small Cap Growth Fund’s Institutional Shares had placed in the top half of the Fund’s peer group and had outperformed the Fund’s benchmark index for the one-year period ended March 31, 2021. The Trustees observed that the Small/Mid Cap Growth Fund’s Institutional Shares had placed in the top half of the Fund’s peer group and had outperformed the Fund’s benchmark index for the one-, three-, five- and ten-year periods ended March 31, 2021. They noted that the Strategic Growth Fund’s Institutional Shares had placed in the top half of the Fund’s peer group for the one-, three-, five-, and ten-year periods, and had outperformed the Fund’s benchmark index for the one-year period and underperformed for the three-, five-, and ten-year periods ended March 31, 2021. The Trustees observed that the Technology Opportunities Fund’s Institutional Shares had placed in the third quartile of the Fund’s peer group for the three-, five-, and ten-year periods and in the fourth quartile for the one-year period, and had underperformed the Fund’s benchmark index for the one- and ten-year periods and outperformed for the three- and five-year periods ended March 31, 2021. They noted that the U.S. Equity ESG Fund’s Institutional Shares had placed in the third quartile of the Fund’s peer group for the three-year period and in the fourth quartile for the one-, five-, and ten-year periods, and had underperformed the Fund’s benchmark index for the one- and ten-year periods and outperformed for the three- and five-year periods ended March 31, 2021. The Trustees considered that the former Blue Chip Fund had been repositioned as the U.S. Equity ESG Fund in 2020, which had involved changes to the Fund’s investment strategy and portfolio management, as well as the Fund’s name.
Costs of Services Provided and Competitive Information
The Trustees considered the contractual terms of the Management Agreement and the fee rates payable by each Fund thereunder. In this regard, the Trustees considered information on the services rendered by the Investment Adviser to the Funds, which included both advisory and administrative services that were directed to the needs and operations of the Funds as registered mutual funds.
In particular, the Trustees reviewed analyses prepared by the Outside Data Provider regarding the expense rankings of the Funds. The analyses provided a comparison of each Fund’s management fee and breakpoints to those of a relevant peer group and category universe; an expense analysis which compared each Fund’s overall net and gross expenses to a peer group and a category universe; and data comparing each Fund’s net expenses to the peer and category medians. The analyses also compared each Fund’s other expenses and fee waivers/reimbursements to those of the peer group and category medians. The Trustees concluded that the
179
GOLDMAN SACHS FUNDAMENTAL EQUITY GROWTH FUNDS
Statement Regarding Basis for Approval of Management Agreement (Unaudited) (continued)
comparisons provided by the Outside Data Provider were useful in evaluating the reasonableness of the management fees and total expenses paid by the Funds.
In addition, the Trustees considered the Investment Adviser’s undertakings to implement fee waivers and/or expense limitations. The Trustees also noted that certain changes were being made to existing fee waiver or expense limitation arrangements of the Capital Growth Fund, Technology Opportunities Fund, Growth Opportunities Fund, and Strategic Growth Fund that would have the effect of decreasing expenses of Class A, Class C, Investor, and Class R Shares of each Fund and/or total Fund expenses and of the U.S. Equity ESG Fund that would have the effect of increasing expenses of Class A, Class C, Investor, and Class R Shares of the Fund, with such changes taking effect in connection with the Funds’ next annual registration statement update. They also considered, to the extent that the Investment Adviser manages other types of accounts having investment objectives and policies similar to those of the Funds, comparative fee information for services provided by the Investment Adviser to those accounts, and information that indicated that services provided to the Funds differed in various significant respects from the services provided to other types of accounts which, in many cases, operated under less stringent legal and regulatory structures, required fewer services from the Investment Adviser to a smaller number of client contact points, and were less time-intensive.
In addition, the Trustees noted that shareholders are able to redeem their Fund shares at any time if shareholders believe that the Fund fees and expenses are too high or if they are dissatisfied with the performance of the Fund.
Profitability
The Trustees reviewed each Fund’s contribution to the Investment Adviser’s revenues and pre-tax profit margins. In this regard the Trustees noted that they had received, among other things, profitability analyses and summaries, revenue and expense schedules by Fund and by function (i.e., investment management, transfer agency and distribution and service), and information on the Investment Adviser’s expense allocation methodology. They observed that the profitability and expense figures are substantially similar to those used by the Investment Adviser for many internal purposes, including compensation decisions among various business groups, and are thus subject to a vigorous internal debate about how certain revenue and expenses should be allocated. The Trustees also noted that the internal audit group within the Goldman Sachs organization periodically audits the expense allocation methodology and that the internal audit group was satisfied with the reasonableness, consistency, and accuracy of the Investment Adviser’s expense allocation methodology. Profitability data for each Fund was provided for 2020 and 2019, and the Trustees considered this information in relation to the Investment Adviser’s overall profitability.
Economies of Scale
The Trustees considered the information that had been provided regarding whether there have been economies of scale with respect to the management of the Funds. The Trustees also considered the breakpoints in the fee rate payable under the Management Agreement for each of the Funds at the following annual percentage rates of the average daily net assets of the Funds:
Average Daily Net Assets | Capital Growth Fund | Concentrated Fund | Flexible Cap Fund | Growth Opportunities Fund | Small Cap Fund | |||||||||||||||
| First $1 billion | 0.71 | % | 0.76 | % | 0.55 | % | 0.92 | % | 0.85 | % | ||||||||||
| Next $1 billion | 0.64 | 0.68 | 0.50 | 0.92 | 0.85 | |||||||||||||||
| Next $3 billion | 0.61 | 0.65 | 0.47 | 0.83 | 0.77 | |||||||||||||||
| Next $3 billion | 0.61 | 0.64 | 0.46 | 0.79 | 0.73 | |||||||||||||||
| Over $8 billion | 0.61 | 0.62 | 0.45 | 0.77 | 0.71 | |||||||||||||||
Average Daily Net Assets | Small/Mid Cap Fund | Strategic Fund | Technology Opportunities Fund | U.S. Equity Fund | ||||||||||||
| First $1 billion | 0.85 | % | 0.71 | % | 0.94 | % | 0.55 | % | ||||||||
| Next $1 billion | 0.85 | 0.64 | 0.85 | 0.50 | ||||||||||||
| Next $3 billion | 0.77 | 0.61 | 0.80 | 0.47 | ||||||||||||
| Next $3 billion | 0.73 | 0.59 | 0.79 | 0.46 | ||||||||||||
| Over $8 billion | 0.71 | 0.58 | 0.77 | 0.45 | ||||||||||||
The Trustees noted that the breakpoints were designed to share potential economies of scale, if any, with the Funds and their shareholders as assets under management reach those asset levels. The Trustees considered the amounts of assets in the Funds; the Funds’ recent share purchase and redemption activity; the information provided by the Investment Adviser relating to the costs of
180
GOLDMAN SACHS FUNDAMENTAL EQUITY GROWTH FUNDS
Statement Regarding Basis for Approval of Management Agreement (Unaudited) (continued)
the services provided by the Investment Adviser and its affiliates and their realized profits; information comparing fee rates charged by the Investment Adviser with fee rates charged to other funds in the peer groups; and the Investment Adviser’s undertakings to waive a portion of its management fee for the Growth Opportunities Fund and to limit certain expenses of the Funds that exceed specified levels, as well as Goldman Sachs & Co. LLC’s (“Goldman Sachs”) undertaking to waive a portion of the transfer agency fees paid by the Concentrated Growth Fund’s, Growth Opportunities Fund’s, Small/Mid Cap Growth Fund’s, Technology Opportunities Fund’s, and U.S. Equity ESG Fund’s Class A, Class C, Investor, and Class R Shares, as applicable. Upon reviewing these matters at the Annual Meeting, the Trustees concluded that the fee breakpoints represented a means of assuring that benefits of scalability, if any, would be passed along to shareholders at the specified asset levels. They also noted that the Investment Adviser had passed along savings to shareholders of the Small/Mid Cap Growth Fund, which had asset levels above at least the first breakpoint during the prior fiscal year.
Other Benefits to the Investment Adviser and Its Affiliates
The Trustees also considered the other benefits derived by the Investment Adviser and its affiliates from their relationships with the Funds as stated above, including: (a) transfer agency fees received by Goldman Sachs; (b) brokerage and futures commissions earned by Goldman Sachs for executing securities and futures transactions on behalf of the Funds; (c) research received by the Investment Adviser from broker-dealers in exchange for executing certain transactions on behalf of the Funds; (d) trading efficiencies resulting from aggregation of orders of the Funds with those for other funds or accounts managed by the Investment Adviser; (e) fees earned by the Investment Adviser for managing the fund in which the Funds’ securities lending cash collateral is invested; (f) the Investment Adviser’s ability to leverage the infrastructure designed to service the Funds on behalf of its other clients; (g) the Investment Adviser’s ability to cross-market other products and services to Fund shareholders; (h) Goldman Sachs’ retention of certain fees as Fund Distributor; (i) the Investment Adviser’s ability to negotiate better pricing with custodians on behalf of its other clients, as a result of the relationship with the Funds; (j) the investment of cash and cash collateral in money market funds managed by the Investment Adviser that will result in increased assets under management for those money market funds; (k) the investment in exchange-traded funds (“ETFs”) managed by the Investment Adviser that will result in increased assets under management for those ETFs and may facilitate the development of the Investment Adviser’s ETF advisory business; and (l) the possibility that the working relationship between the Investment Adviser and the Funds’ third-party service providers may cause those service providers to be more likely to do business with other areas of Goldman Sachs. In the course of considering the foregoing, the Independent Trustees requested and received further information quantifying certain of these fall-out benefits.
Other Benefits to the Funds and Their Shareholders
The Trustees also noted that the Funds receive certain other potential benefits as a result of their relationship with the Investment Adviser, including: (a) trading efficiencies resulting from aggregation of orders of the Funds with those of other funds or accounts managed by the Investment Adviser; (b) enhanced servicing from vendors due to the volume of business generated by the Investment Adviser and its affiliates; (c) enhanced servicing from broker-dealers due to the volume of business generated by the Investment Adviser and its affiliates; (d) the advantages received from the Investment Adviser’s knowledge and experience gained from managing other accounts and products; (e) the Investment Adviser’s ability to hire and retain qualified personnel to provide services to the Funds because of the reputation of the Goldman Sachs organization; (f) the Funds’ access, through the Investment Adviser, to certain firm-wide resources (e.g., proprietary risk management systems and databases), subject to certain restrictions; and (g) the Funds’ access to certain affiliated distribution channels. In addition, the Trustees noted the competitive nature of the mutual fund marketplace, and considered that many of the Funds’ shareholders invested in the Funds in part because of the Funds’ relationship with the Investment Adviser and that those shareholders have a general expectation that the relationship will continue.
Conclusion
In connection with their consideration of the Management Agreement, the Trustees gave weight to each of the factors described above, but did not identify any particular factor as controlling their decision. After deliberation and consideration of all of the information provided, including the factors described above, the Trustees concluded, in the exercise of their business judgment, that the management fees paid by each of the Funds were reasonable in light of the services provided to it by the Investment Adviser, the Investment Adviser’s costs and each Fund’s current and reasonably foreseeable asset levels. The Trustees unanimously concluded that the Investment Adviser’s continued management likely would benefit each Fund and its shareholders and that the Management Agreement should be approved and continued with respect to each Fund until June 30, 2022.
181
GOLDMAN SACHS FUNDAMENTAL EQUITY GROWTH FUNDS
Trustees and Officers (Unaudited)
Independent Trustees
| Name, Address and Age1 | Position(s) Held with the Trust | Term of Office and Length of Time Served2 | Principal Occupation(s) During Past 5 Years | Number of Portfolios in Fund Complex Overseen by Trustee3 | Other Directorships Held by Trustee4 | |||||
Jessica Palmer Age: 72 | Chair of the Board of Trustees | Since 2018 (Trustee since 2007) | Ms. Palmer is retired. She was formerly Consultant, Citigroup Human Resources Department (2007-2008); Managing Director, Citigroup Corporate and Investment Banking (previously, Salomon Smith Barney/ Salomon Brothers) (1984-2006). Ms. Palmer was a Member of the Board of Trustees of Indian Mountain School (private elementary and secondary school) (2004-2009).
Chair of the Board of Trustees — Goldman Sachs Trust and Goldman Sachs Variable Insurance Trust. | 109 | None | |||||
Dwight L. Bush Age: 64 | Trustee | Since 2020 | Ambassador Bush is President and CEO of D.L. Bush & Associates (a financial advisory and private investment firm) (2002-2014 and 2017-present); Director of MoneyLion Inc. (an operator of a data-driven, digital financial platform) (2021-present); and was formerly U.S. Ambassador to the Kingdom of Morocco (2014-2017) and a Member of the Board of Directors of Santander Bank, N.A. (2018-2019). Previously, Ambassador Bush served as an Advisory Board Member of Goldman Sachs Trust and Goldman Sachs Variable Insurance Trust (October 2019-January 2020).
Trustee — Goldman Sachs Trust and Goldman Sachs Variable Insurance Trust. | 109 | None | |||||
Kathryn A. Cassidy Age: 67 | Trustee | Since 2015 | Ms. Cassidy is retired. Formerly, she was Advisor to the Chairman (May 2014-December 2014); and Senior Vice President and Treasurer (2008-2014), General Electric Company & General Electric Capital Corporation (technology and financial services companies).
Trustee — Goldman Sachs Trust and Goldman Sachs Variable Insurance Trust. | 109 | None | |||||
Diana M. Daniels Age: 72 | Trustee | Since 2007 | Ms. Daniels is retired. Formerly, she was Vice President, General Counsel and Secretary, The Washington Post Company (1991-2006). Ms. Daniels is a Trustee Emeritus and serves as a Presidential Councillor of Cornell University (2013-Present); former Member of the Legal Advisory Board, New York Stock Exchange (2003- 2006) and of the Corporate Advisory Board, Standish Mellon Management Advisors (2006- 2007).
Trustee — Goldman Sachs Trust and Goldman Sachs Variable Insurance Trust. | 109 | None | |||||
Joaquin Delgado Age: 61 | Trustee | Since 2020 | Dr. Delgado is retired. He is Director, Hexion Inc. (a specialty chemical manufacturer) (2019-present); and Director, Stepan Company (a specialty chemical manufacturer) (2011-present); and was formerly Executive Vice President, Consumer Business Group of 3M Company (July 2016-July 2019); and Executive Vice President, Health Care Business Group of 3M Company (October 2012-July 2016). Previously, Dr. Delgado served as an Advisory Board Member of Goldman Sachs Trust and Goldman Sachs Variable Insurance Trust (October 2019-January 2020).
Trustee — Goldman Sachs Trust and Goldman Sachs Variable Insurance Trust. | 109 | Hexion Inc. (a specialty chemical manufacturer); Stepan Company (a specialty chemical manufacturer) | |||||
182
GOLDMAN SACHS FUNDAMENTAL EQUITY GROWTH FUNDS
Trustees and Officers (Unaudited) (continued)
Independent Trustees
| Name, Address and Age1 | Position(s) Held with the Trust | Term of Office and Length of Time Served2 | Principal Occupation(s) During Past 5 Years | Number of Portfolios in Fund Complex Overseen by Trustee3 | Other Directorships Held by Trustee4 | |||||
Roy W. Templin Age: 61 | Trustee | Since 2013 | Mr. Templin is retired. He is Director, Armstrong World Industries, Inc. (a designer and manufacturer of ceiling and wall systems) (2016-Present); and was formerly Chairman of the Board of Directors, Con- Way Incorporated (a transportation, logistics and supply chain management service company) (2014-2015); Executive Vice President and Chief Financial Officer, Whirlpool Corporation (an appliance manufacturer and marketer) (2004-2012).
Trustee — Goldman Sachs Trust and Goldman Sachs Variable Insurance Trust. | 109 | Armstrong World Industries, Inc. (a ceiling and wall systems manufacturer) | |||||
Gregory G. Weaver Age: 69 | Trustee | Since 2015 | Mr. Weaver is retired. He is Director, Verizon Communications Inc. (2015-Present); and was formerly Chairman and Chief Executive Officer, Deloitte & Touche LLP (a professional services firm) (2001-2005 and 2012-2014); and Member of the Board of Directors, Deloitte & Touche LLP (2006-2012).
Trustee — Goldman Sachs Trust and Goldman Sachs Variable Insurance Trust. | 109 | Verizon Communications Inc. | |||||
Interested Trustee*
| Name, Address and Age1 | Position(s) Held with the Trust | Term of Office and Length of Time Served2 | Principal Occupation(s) During Past 5 Years | Number of Portfolios in Fund Complex Overseen by Trustee3 | Other Directorships Held by Trustee4 | |||||
James A. McNamara Age: 58 | President and Trustee | Since 2007 | Advisory Director, Goldman Sachs (January 2018-Present); Managing Director, Goldman Sachs (January 2000-December 2017); Director of Institutional Fund Sales, GSAM (April 1998-December 2000); and Senior Vice President and Manager, Dreyfus Institutional Service Corporation (January 1993-April 1998).
President and Trustee — Goldman Sachs Trust; Goldman Sachs Variable Insurance Trust; Goldman Sachs Trust II; Goldman Sachs MLP and Energy Renaissance Fund; Goldman Sachs ETF Trust; Goldman Sachs Credit Income Fund; and Goldman Sachs Real Estate Diversified Income Fund. | 166 | None | |||||
| * | Mr. McNamara is considered to be an “Interested Trustee” because he holds positions with Goldman Sachs and owns securities issued by The Goldman Sachs Group, Inc. Mr. McNamara holds comparable positions with certain other companies of which Goldman Sachs, GSAM or an affiliate thereof is the investment adviser, administrator and/or distributor. |
| 1 | Each Trustee may be contacted by writing to the Trustee, c/o Goldman Sachs, 200 West Street, New York, New York, 10282, Attn: Caroline Kraus. Information is provided as of August 31, 2021. |
| 2 | Subject to such policies as may be adopted by the Board from time-to-time, each Trustee holds office for an indefinite term, until the earliest of: (a) the election of his or her successor; (b) the date the Trustee resigns or is removed by the Board or shareholders, in accordance with the Trust’s Declaration of Trust; or (c) the termination of the Trust. The Board has adopted policies which provide that each Independent Trustee shall retire as of December 31st of the calendar year in which he or she reaches (a) his or her 75th birthday or (b) the 15th anniversary of the date he or she became a Trustee, whichever is earlier, unless a waiver of such requirements shall have been adopted by a majority of the other Trustees. These policies may be changed by the Trustees without shareholder vote. |
| 3 | The Goldman Sachs Fund Complex includes certain other companies listed above for each respective Trustee. As of August 31, 2021, Goldman Sachs Trust consisted of 92 portfolios (90 of which offered shares to the public); Goldman Sachs Variable Insurance Trust consisted of 17 portfolios (13 of which offered shares to the public); Goldman Sachs Trust II consisted of 18 portfolios (16 of which offered shares to the public); Goldman Sachs ETF Trust consisted of 36 portfolios (21 of which offered shares to the public); and Goldman Sachs MLP and Energy Renaissance Fund, Goldman Sachs Credit Income Fund and Goldman Sachs Real Estate Diversified Income Fund each consisted of one portfolio. Goldman Sachs Credit Income Fund did not offer shares to the public. |
| 4 | This column includes only directorships of companies required to report to the Securities and Exchange Commission under the Securities Exchange Act of 1934 (i.e., “public companies”) or other investment companies registered under the Act. |
Additional information about the Trustees is available in the Fund’s Statement of Additional Information, which can be obtained from Goldman Sachs free of charge by calling this toll-free number (in the United States of America): 1-800-526-7384.
183
GOLDMAN SACHS FUNDAMENTAL EQUITY GROWTH FUNDS
Trustees and Officers (Unaudited) (continued)
Officers of the Trust*
| Name, Address and Age1 | Positions Held with the Trust | Term of Office and Length of Time Served2 | Principal Occupation(s) During Past 5 Years | |||
James A. McNamara 200 West Street New York, NY 10282 Age: 58 | Trustee and President | Since 2007 | Advisory Director, Goldman Sachs (January 2018-Present); Managing Director, Goldman Sachs (January 2000-December 2017); Director of Institutional Fund Sales, GSAM (April 1998-December 2000); and Senior Vice President and Manager, Dreyfus Institutional Service Corporation (January 1993-April 1998).
President and Trustee — Goldman Sachs Trust; Goldman Sachs Variable Insurance Trust; Goldman Sachs Trust II; Goldman Sachs MLP and Energy Renaissance Fund; Goldman Sachs ETF Trust; Goldman Sachs Credit Income Fund; and Goldman Sachs Real Estate Diversified Income Fund. | |||
Caroline L. Kraus 200 West Street New York, NY 10282 Age: 44 | Secretary | Since 2012 | Managing Director, Goldman Sachs (January 2016-Present); Vice President, Goldman Sachs (August 2006-December 2015); Senior Counsel, Goldman Sachs (January 2020-Present); Associate General Counsel, Goldman Sachs (2012-December 2019); Assistant General Counsel, Goldman Sachs (August 2006-December 2011); and Associate, Weil, Gotshal & Manges, LLP (2002-2006).
Secretary — Goldman Sachs Trust (previously Assistant Secretary (2012)); Goldman Sachs Variable Insurance Trust (previously Assistant Secretary (2012)); Goldman Sachs Trust II; Goldman Sachs BDC, Inc.; Goldman Sachs Private Middle Market Credit LLC; Goldman Sachs Private Middle Market Credit II LLC; Goldman Sachs Middle Market Lending Corp.; Goldman Sachs MLP and Energy Renaissance Fund; Goldman Sachs ETF Trust; Goldman Sachs Credit Income Fund; and Goldman Sachs Real Estate Diversified Income Fund. | |||
Joseph F. DiMaria 30 Hudson Street Jersey City, NJ 07302 Age: 53 | Treasurer, Principal Financial Officer and Principal Accounting Officer | Since 2017 (Treasurer and Principal Financial Officer since 2019) | Managing Director, Goldman Sachs (November 2015-Present) and Vice President — Mutual Fund Administration, Columbia Management Investment Advisers, LLC (May 2010- October 2015).
Treasurer, Principal Financial Officer and Principal Accounting Officer — Goldman Sachs Trust (previously Assistant Treasurer (2016)); Goldman Sachs Variable Insurance Trust (previously Assistant Treasurer (2016)); Goldman Sachs Trust II (previously Assistant Treasurer (2017)); Goldman Sachs MLP and Energy Renaissance Fund (previously Assistant Treasurer (2017)); Goldman Sachs ETF Trust (previously Assistant Treasurer (2017)); Goldman Sachs Credit Income Fund; and Goldman Sachs Real Estate Diversified Income Fund. | |||
| * | Represents a partial list of officers of the Trust. Additional information about all the officers is available in the Fund’s Statement of Additional Information, which can be obtained from Goldman Sachs free of charge by calling this toll-free number (in the United States): 1-800-526-7384. |
| 1 | Information is provided as of August 31, 2021. |
| 2 | Officers hold office at the pleasure of the Board of Trustees or until their successors are duly elected and qualified. Each officer holds comparable positions with certain other companies of which Goldman Sachs, GSAM or an affiliate thereof is the investment adviser, administrator and/or distributor. |
Goldman Sachs Trust — Fundamental Equity Growth Funds — Tax Information (Unaudited)
For the year ended August 31, 2021, 97.44%, 99.94%, 51,54%, 14.89%, 2.32%, 11.90%, 13.37%, 11.35% and 89.59% of the dividends paid from net investment company taxable income by the Capital Growth, Concentrated Growth, Flexible Cap Growth, Growth Opportunities, Small Cap Growth, Small/Mid Cap Growth, Strategic Growth, Technology Opportunities and U.S. Equity ESG Funds, respectively, qualify for the dividends received deduction available to corporations.
Pursuant to Section 852 of the Internal Revenue Code, the Capital Growth, Concentrated Growth, Flexible Cap Growth, Growth Opportunities, Small Cap Growth, Small/Mid Cap Growth, Strategic Growth, Technology Opportunities and U.S. Equity ESG Funds, designate $34,899,429, $10,169,325, $812,890, $214,147,837, $123, $267,444,660, $23,737,095, $55,965,814 and $1,149,182, respectively, or if different, the maximum amount allowable, as capital gain dividends paid during the year ended August 31, 2021.
For the year ended August 31, 2021, 100%, 100%, 55.20%, 15.61%, 1.46% 9.26%, 59.03%, 34.77% and 100% of the dividends paid from net investment company taxable income by the Capital Growth, Concentrated Growth, Flexible Cap Growth, Growth Opportunities, Small Cap Growth, Small/Mid Cap Growth, Strategic Growth, Technology Opportunities and U.S. Equity ESG Funds, respectively, qualify for the reduced tax rate under the Jobs and Growth Tax Relief and Reconciliation Act of 2003.
During the fiscal year ended August 31, 2021, the Capital Growth, Concentrated Growth, Flexible Cap Growth, Growth Opportunities, Small Cap Growth, Small/Mid Cap Growth, Strategic Growth, Technology Opportunities and U.S. Equity ESG Funds, designate $95,296, $709,768, $376,107, $42,355,710, $1,215,797, $96,550,926, $2,087,912, $10,001,353 and $5,972 respectively, as short-term capital gain dividends pursuant to Section 871(k) of the Internal Revenue Code.
For the year ended August 31, 2021, 1.96%, 0.43%, 0.51%, 1.58% and 2.58% of the dividend paid from net investment company taxable income by the Flexible Cap Growth, Growth Opportunities, Small/Mid Cap Growth, Strategic Growth, and Technology Opportunities respectively, qualifies as section 199A dividends.
184
FUNDS PROFILE
Goldman Sachs Funds
Goldman Sachs is a premier financial services firm, known since 1869 for creating thoughtful and customized investment solutions in complex global markets.
Today, the Asset Management Division of Goldman Sachs serves a diverse set of clients worldwide, including private institutions, public entities and individuals. With approximately $2.09 trillion in assets under supervision as of June 30, 2021, Goldman Sachs Asset Management has portfolio management teams located around the world and our investment professionals bring firsthand knowledge of local markets to every investment decision. Assets under supervision includes assets under management and other client assets for which Goldman Sachs does not have full discretion. Goldman Sachs Asset Management leverages the resources of Goldman Sachs & Co. LLC subject to legal, internal and regulatory restrictions.
Money Market
Financial Square FundsSM
| ∎ | Financial Square Treasury Solutions Fund1 |
| ∎ | Financial Square Government Fund1 |
| ∎ | Financial Square Money Market Fund2 |
| ∎ | Financial Square Prime Obligations Fund2 |
| ∎ | Financial Square Treasury Instruments Fund1 |
| ∎ | Financial Square Treasury Obligations Fund1 |
| ∎ | Financial Square Federal Instruments Fund1 |
Investor FundsSM
| ∎ | Investor Money Market Fund3 |
| ∎ | Investor Tax-Exempt Money Market Fund3 |
Fixed Income
Short Duration and Government
| ∎ | Enhanced Income Fund |
| ∎ | High Quality Floating Rate Fund |
| ∎ | Short-Term Conservative Income Fund |
| ∎ | Short Duration Government Fund |
| ∎ | Short Duration Bond Fund4 |
| ∎ | Government Income Fund |
| ∎ | Inflation Protected Securities Fund |
Multi-Sector
| ∎ | Bond Fund |
| ∎ | Core Fixed Income Fund |
| ∎ | Global Core Fixed Income Fund |
| ∎ | Income Fund |
| ∎ | Strategic Income Fund |
Municipal and Tax-Free
| ∎ | High Yield Municipal Fund |
| ∎ | Dynamic Municipal Income Fund |
| ∎ | Short Duration Tax-Free Fund |
| ∎ | Municipal Income Completion Fund |
Single Sector
| ∎ | Investment Grade Credit Fund |
| ∎ | U.S. Mortgages Fund |
| ∎ | High Yield Fund |
| ∎ | High Yield Floating Rate Fund |
| ∎ | Emerging Markets Debt Fund |
| ∎ | Local Emerging Markets Debt Fund |
Fixed Income Alternatives
| ∎ | Long Short Credit Strategies Fund |
Fundamental Equity
| ∎ | Equity Income Fund |
| ∎ | Small Cap Growth Fund |
| ∎ | Small Cap Value Fund |
| ∎ | Small/Mid Cap Value Fund |
| ∎ | Mid Cap Value Fund |
| ∎ | Large Cap Value Fund |
| ∎ | Focused Value Fund |
| ∎ | Capital Growth Fund |
| ∎ | Strategic Growth Fund |
| ∎ | Small/Mid Cap Growth Fund |
| ∎ | Flexible Cap Fund |
| ∎ | Concentrated Growth Fund |
| ∎ | Technology Opportunities Fund |
| ∎ | Growth Opportunities Fund |
| ∎ | Rising Dividend Growth Fund |
| ∎ | U.S. Equity ESG Fund |
| ∎ | Income Builder Fund |
Tax-Advantaged Equity
| ∎ | U.S. Tax-Managed Equity Fund |
| ∎ | International Tax-Managed Equity Fund |
| ∎ | U.S. Equity Dividend and Premium Fund |
| ∎ | International Equity Dividend and Premium Fund |
Equity Insights
| ∎ | Small Cap Equity Insights Fund |
| ∎ | U.S. Equity Insights Fund |
| ∎ | Small Cap Growth Insights Fund |
| ∎ | Large Cap Growth Insights Fund |
| ∎ | Large Cap Value Insights Fund |
| ∎ | Small Cap Value Insights Fund |
| ∎ | International Small Cap Insights Fund |
| ∎ | International Equity Insights Fund |
| ∎ | Emerging Markets Equity Insights Fund |
Fundamental Equity International
| ∎ | International Equity Income Fund |
| ∎ | International Equity ESG Fund |
| ∎ | China Equity Fund |
| ∎ | Emerging Markets Equity Fund |
| ∎ | ESG Emerging Markets Equity Fund |
Alternative
| ∎ | Real Estate Securities Fund |
| ∎ | International Real Estate Securities Fund |
| ∎ | Commodity Strategy Fund |
| ∎ | Global Real Estate Securities Fund |
| ∎ | Alternative Premia Fund |
| ∎ | Absolute Return Tracker Fund |
| ∎ | Managed Futures Strategy Fund |
| ∎ | MLP Energy Infrastructure Fund |
| ∎ | Energy Infrastructure Fund |
| ∎ | Multi-Manager Alternatives Fund |
| ∎ | Global Infrastructure Fund |
| ∎ | Clean Energy Income Fund |
| ∎ | Defensive Equity Fund |
Total Portfolio Solutions
| ∎ | Global Managed Beta Fund |
| ∎ | Multi-Manager Non-Core Fixed Income Fund |
| ∎ | Multi-Manager Global Equity Fund |
| ∎ | Multi-Manager International Equity Fund |
| ∎ | Tactical Tilt Overlay Fund |
| ∎ | Balanced Strategy Portfolio |
| ∎ | Multi-Manager U.S. Small Cap Equity Fund |
| ∎ | Multi-Manager Real Assets Strategy Fund |
| ∎ | Growth and Income Strategy Portfolio |
| ∎ | Growth Strategy Portfolio |
| ∎ | Dynamic Global Equity Fund |
| ∎ | Satellite Strategies Portfolio |
| ∎ | Enhanced Dividend Global Equity Portfolio |
| ∎ | Tax-Advantaged Global Equity Portfolio |
| ∎ | Strategic Factor Allocation Fund |
| ∎ | Strategic Volatility Premium Fund |
| ∎ | Target Date Retirement Portfolio |
| ∎ | Target Date 2025 Portfolio |
| ∎ | Target Date 2030 Portfolio |
| ∎ | Target Date 2035 Portfolio |
| ∎ | Target Date 2040 Portfolio |
| ∎ | Target Date 2045 Portfolio |
| ∎ | Target Date 2050 Portfolio |
| ∎ | Target Date 2055 Portfolio |
| ∎ | Target Date 2060 Portfolio |
| ∎ | GQG Partners International Opportunities Fund |
| 1 | You could lose money by investing in the Fund. Although the Fund seeks to preserve the value of your investment at $1.00 per share, it cannot guarantee it will do so. An investment in the Fund is not a deposit of a bank and is not insured or guaranteed by the Federal Deposit Insurance Corporation or any other government agency. The Fund’s sponsor has no legal obligation to provide financial support to the Fund, and you should not expect that the sponsor will provide financial support to the Fund at any time. |
| 2 | You could lose money by investing in the Fund. Because the share price of the Fund will fluctuate, when you sell your shares they may be worth more or less than what you originally paid for them. The Fund may impose a fee upon sale of your shares or may temporarily suspend your ability to sell shares if the Fund’s liquidity falls below required minimums because of market conditions or other factors. An investment in the Fund is not a deposit of a bank and is not insured or guaranteed by the Federal Deposit Insurance Corporation or any other government agency. The Fund’s sponsor has no legal obligation to provide financial support to the Fund, and you should not expect that the sponsor will provide financial support to the Fund at any time. |
| 3 | You could lose money by investing in the Fund. Although the Fund seeks to preserve the value of your investment at $1.00 per share, it cannot guarantee it will do so. The Fund may impose a fee upon sale of your shares or may temporarily suspend your ability to sell shares if the Fund’s liquidity falls below required minimums because of market conditions or other factors. An investment in the Fund is not a deposit of a bank and is not insured or guaranteed by the Federal Deposit Insurance Corporation or any other government agency. The Fund’s sponsor has no legal obligation to provide financial support to the Fund, and you should not expect that the sponsor will provide financial support to the Fund at any time. |
| 4 | Effective after the close of business on July 29, 2021, the Goldman Sachs Short Duration Income Fund was renamed the Goldman Sachs Short Duration Bond Fund. |
Financial Square FundsSM and Investor FundsSM are registered service marks of Goldman Sachs & Co. LLC.
| * | This list covers open-end funds only. Please visit our website at www.GSAMFUNDS.com to learn about our closed-end funds and exchange-traded funds. |
TRUSTEES Jessica Palmer, Chair Dwight L. Bush Kathryn A. Cassidy Diana M. Daniels Joaquin Delgado James A. McNamara Roy W. Templin Gregory G. Weaver | OFFICERS James A. McNamara, President Joseph F. DiMaria, Principal Financial Officer, Principal Accounting Officer and Treasurer Caroline L. Kraus, Secretary | |
GOLDMAN SACHS & CO. LLC Distributor and Transfer Agent | GOLDMAN SACHS ASSET MANAGEMENT, L.P. Investment Adviser | |
Visit our web site at www.GSAMFUNDS.com to obtain the most recent month-end returns.
Goldman Sachs Asset Management, L.P. 200 West Street, New York, New York 10282
The reports concerning the Funds included in this shareholder report may contain certain forward-looking statements about the factors that may affect the performance of the Funds in the future. These statements are based on Fund management’s predictions and expectations concerning certain future events and their expected impact on the Funds, such as performance of the economy as a whole and of specific industry sectors, changes in the levels of interest rates, the impact of developing world events, and other factors that may influence the future performance of the Funds. Management believes these forward-looking statements to be reasonable, although they are inherently uncertain and difficult to predict. Actual events may cause adjustments in portfolio management strategies from those currently expected to be employed.
A description of the policies and procedures that the Funds use to determine how to vote proxies relating to portfolio securities and information regarding how a Fund voted proxies relating to portfolio securities during the most recent 12-month period ended June 30 is available (i) without charge, upon request by calling 1-800-526-7384 (for Retail Shareholders) or 1-800-621-2550 (for Institutional Shareholders); and (ii) on the Securities and Exchange Commission (“SEC”) web site at http://www.sec.gov.
The Funds will file their portfolio holdings information for each month in a fiscal quarter within 60 days after the end of the relevant fiscal quarter on Form N-PORT. Portfolio holdings information for the third month of each fiscal quarter will be made available on the SEC’s web site at http://www.sec.gov. Portfolio holdings information may be obtained upon request and without charge by calling 1-800-526-7384 (for Retail Shareholders) or 1-800-621-2550 (for Institutional Shareholders).
Goldman Sachs & Co. LLC (‘‘Goldman Sachs’’) does not provide legal, tax or accounting advice. Any statement contained in this communication (including any attachments) concerning U.S. tax matters was not intended or written to be used, and cannot be used, for the purpose of avoiding penalties under the Internal Revenue Code, and was written to support the promotion or marketing of the transaction(s) or matter(s) addressed. Clients of Goldman Sachs should obtain their own independent tax advice based on their particular circumstances.
Fund holdings and allocations shown are as of August 31, 2021 and may not be representative of future investments. Fund holdings should not be relied on in making investment decisions and should not be construed as research or investment advice regarding particular securities. Current and future holdings are subject to risk.
The Global Industry Classification Standard (GICS) was developed by and is the exclusive property and a service mark of Morgan Stanley Capital International Inc. (MSCI) and Standard & Poor’s, a division of The McGraw-Hill Companies, Inc. (S&P) and is licensed for use by Goldman Sachs. Neither MSCI, S&P nor any other party involved in making or compiling the GICS or any GICS classifications makes any express or implied warranties or representations with respect to such standard or classification (or the results to be obtained by the use thereof), and all such parties hereby expressly disclaim all warranties of originality, accuracy, completeness, merchantability or fitness for a particular purpose with respect to any of such standard or classification. Without limiting any of the foregoing, in no event shall MSCI, S&P, any of their affiliates or any third party involved in making or compiling the GICS or any GICS classifications have any liability for any direct, indirect, special, punitive, consequential or any other damages (including lost profits) even if notified of the possibility of such damages.
The portfolio risk management process includes an effort to monitor and manage risk, but does not imply low risk.
This material is not authorized for distribution to prospective investors unless preceded or accompanied by a current Prospectus or summary prospectus, if applicable. Investors should consider a Fund’s objective, risks, and charges and expenses, and read the summary prospectus, if available, and/or the Prospectus carefully before investing or sending money. The summary prospectus, if available, and the Prospectus contain this and other information about a Fund and may be obtained from your authorized dealer or from Goldman Sachs & Co. LLC by calling (retail – 1-800-526-7384) (institutional – 1-800-621-2550).
© 2021 Goldman Sachs. All rights reserved. 256212-OTU-1495653 EQGRWAR-21
Goldman Sachs Funds

| Annual Report | August 31, 2021 | |||
Fundamental Equity Value Funds | ||||
Equity Income | ||||
Focused Value | ||||
Large Cap Value | ||||
Mid Cap Value | ||||
Small Cap Value | ||||
Small/Mid Cap Value | ||||

Goldman Sachs Fundamental Equity Value Funds
| ∎ | EQUITY INCOME |
| ∎ | FOCUSED VALUE |
| ∎ | LARGE CAP VALUE |
| ∎ | MID CAP VALUE |
| ∎ | SMALL CAP VALUE |
| ∎ | SMALL/MID CAP VALUE |
| ||||
| 1 | ||||
| 3 | ||||
| 31 | ||||
| 47 | ||||
| 54 | ||||
| 62 | ||||
| 69 | ||||
| 77 | ||||
| 85 | ||||
| 93 | ||||
| 100 | ||||
| 119 | ||||
| 120 | ||||
| NOT FDIC-INSURED | May Lose Value | No Bank Guarantee | ||
Goldman Sachs Fundamental Equity Value Funds
Market Review
Overall, U.S. equities rallied strongly during the 12 months ended August 31, 2021 (the “Reporting Period”). The Standard & Poor’s 500 Index (the “S&P 500 Index”) ended the Reporting Period with a return of 31.17%. The Russell 3000® Index generated a return of 33.04%.
U.S. equities moved lower as the Reporting Period began in September 2020, with the S&P 500 Index declining for the first time in five months. Shares of large-cap technology companies, which had been key drivers of the market’s powerful rally from its March 2020 lows, fell sharply in early September amid concerns about stretched valuations, among other factors. There were also worries about Congress failing to break an impasse on a fifth fiscal aid package, and it appeared there might well be strong division in advance of the then-upcoming U.S. Presidential elections. Still, corporate earnings were better than consensus expected.
In the fourth quarter of 2020, U.S. equities rebounded for the third consecutive quarter, extending a broad-based recovery from steep first quarter 2020 declines. Stocks rallied on the prospect of an end to the global COVID-19 pandemic and its weighty economic impact with the distribution of approved COVID-19 vaccines. While uncertainty surrounding the U.S. elections and other policy questions created the potential for higher market volatility, the Democrat victory for U.S. President in November proved positive for equity markets during the quarter. After a historically sharp but short recession in the spring of 2020, many major economies, including that of the U.S., entered an early-cycle phase of recovery. Employment conditions improved as temporary job losses were regained, and U.S. manufacturing activity recovered. Still, reminders of a COVID-19 ceiling for industries hit hardest by the pandemic restrictions persisted.
Rising bond yields and a value-led U.S. equity market dominated the first quarter of 2021. The key driver of this performance was the Democrat victory for Senators in Georgia in January, which, in turn, paved the way for additional massive U.S. fiscal stimulus and progress in the COVID-19 vaccine rollout. An increase in the 10-year U.S. Treasury yield benefited the financials sector and value-oriented stocks. The accelerating rollout of COVID-19 vaccines boosted investors’ hopes of a sustainable reopening of the economy. Small-cap stocks, which tend to be more cyclical and domestically focused, performed particularly well. The passage of a fiscal stimulus package led to upgrades in consensus forecasts for U.S. Gross Domestic Product growth for 2021. Some investors worried that the size of the fiscal stimulus could provoke an uptick in inflation. However, despite upgrading its economic growth forecasts and expecting unemployment to decline, the U.S. Federal Reserve (the “Fed”) stated it did not believe inflation would be meaningfully above target and did not expect to raise interest rates before 2024.
The U.S. equity market continued to perform well in the second quarter of 2021 overall. Discussions centered on the Fed liquidity tailwind, fiscal stimulus, COVID-19 vaccine progress, economic reopening momentum, strong corporate profit backdrop and robust equity inflows. While inflation concerns were fairly pervasive, the Fed remained consistent in its messaging around expectations that price pressures would be transitory. However, the peak inflation theme gained traction as the quarter progressed even as economists suggested the transitory period may be longer than initially expected. Corporate earnings season brought another round of outsized beats over consensus estimates, along with corporate commentary highlighting some input pressures offset by above-average pricing power or productivity initiatives. Despite a late-quarter agreement between the White House and a bipartisan group of Senators on the framework of a physical infrastructure package, the path to additional fiscal stimulus remained complicated.
U.S. equities continued to move higher in July and August 2021. Bullish narrative surrounding central bank liquidity tailwinds, excess savings from fiscal stimulus, economic reopening momentum, COVID-19 vaccine efficacy, upside corporate earnings surprises, elevated operating leverage, corporate buyback boom and retail impulse prevailed. Discussions centered around the reflation trade and the spread of the Delta variant of COVID-19. Focus remained on the possibility the Fed may not be as willing to let the economy run as “hot” as initially envisioned under its policy framework and on the Fed tapering its asset purchases, though payroll growth remained a key input in the tapering discussion. The U.S. Senate passed a $1 trillion bipartisan infrastructure bill in August, though the path to additional fiscal stimulus remained complicated. By the end of August, the second calendar quarter corporate earnings season had largely closed out with a year-over-year earnings per share growth rate topping 90%.
1
MARKET REVIEW
For the Reporting Period overall, all 11 sectors of the S&P 500 Index posted double-digit absolute gains, led by financials, energy and communication services. On a relative basis, the weakest performing sectors in the S&P 500 Index were consumer staples, consumer discretionary and utilities.
Within the U.S. equity market, all capitalization segments generated robust double-digit absolute returns, with small-cap stocks, as measured by the Russell 2000® Index, leading the way, followed by mid-cap stocks, as measured by the Russell Midcap® Index, and then large-cap stocks, as measured by the Russell 1000® Index. From a style perspective, in a reversal from the prior 12-month period ended August 31, 2020, value-oriented stocks significantly outpaced growth-oriented stocks across the capitalization spectrum during the Reporting Period, though both style segments posted healthy double-digit absolute gains across the U.S. equity market. (All as measured by the FTSE Russell indices.)
Looking Ahead
At the end of the Reporting Period, we remained optimistic about the pace and scope of the U.S. economic recovery, believing it was on an improving, though perhaps no longer accelerating, path alongside the rollout of the COVID-19 vaccines and continued expansionary monetary and fiscal policy. Against this significantly improved economic backdrop, in our view, we expected the U.S. equity market rally to continue but with broader sector participation and potential choppiness in the near term given ongoing uncertainty in the market. Additionally, we were closely monitoring persistent supply chain disruptions, rising interest rates and pockets of inflation as potential sources of volatility. As always, we believe it is crucial to stay true to our quality-first investment approach as we continue to seek to invest in businesses with healthy balance sheets, relatively stable free cash flow generation and differentiated business models aligned to secular advantages. We continue to test our strategies and re-evaluate our assumptions with increasing information, staying focused on the long-term investment horizon.
Regardless of market direction, our fundamental, bottom-up stock selection continues to drive our process, rather than headlines or sentiment. We maintain high conviction in the companies the Fundamental Equity Value Funds (the “Funds”) own and believe they have the potential to outperform relative to the broader market regardless of economic growth conditions. We continue to focus on undervalued companies that we believe have comparatively greater control of their own destiny, such as innovators with differentiated products, companies with low cost structures or companies that have been investing in their own businesses and may be poised to gain market share. We remain focused on the long-term performance of the Funds.
As always, deep research resources, a forward-looking investment process and truly actively managed portfolios are keys, in our view, to both preserving capital and outperforming the market over the long term.
2
PORTFOLIO RESULTS
Goldman Sachs Equity Income Fund
Under normal circumstances, the Fund invests at least 80% of its net assets in equity investments that the Goldman Sachs Fundamental Equity U.S. Equity Team considers to have favorable prospects for capital appreciation and/or dividend-paying ability. Although the Fund will invest primarily in publicly traded U.S. securities, including preferred and convertible securities, it may invest up to 25% of its Net Assets in foreign securities, including securities of issuers in emerging countries and securities quoted in foreign currencies. The Fund may also invest up to 20% of its Net Assets in fixed income securities, such as government, corporate and bank debt obligations, that offer the potential to further the Fund’s investment objective of long-term capital appreciation and growth of income.
Portfolio Management Discussion and Analysis
Below, the Goldman Sachs Fundamental Equity U.S. Equity Team discusses the Goldman Sachs Equity Income Fund’s (the “Fund”) performance and positioning for the 12-month period ended August 31, 2021 (the “Reporting Period”).
| Q | How did the Fund perform during the Reporting Period? |
| A | During the Reporting Period, the Fund’s Class A, Class C, Institutional, Service, Investor, Class R6, Class R and Class P Shares generated average annual total returns, without sales charges, of 26.23%, 25.26%, 26.63%, 26.01%, 26.54%, 26.64%, 25.91% and 26.65%, respectively. These returns compare to the 36.44% average annual total return of the Fund’s benchmark, the Russell 1000® Value Index (with dividends reinvested) (the “Russell Index”), during the same period. |
| Q | What key factors were responsible for the Fund’s performance during the Reporting Period? |
| A | While the Fund posted robust double-digit absolute gains, it underperformed the Russell Index on a relative basis during the Reporting Period due primarily to stock selection. Sector allocation as a whole also detracted from the Fund’s relative performance. |
During this Reporting Period, it is particularly worth remembering that we seek to take a diversified approach when solving for yield in the Fund. While the Fund has an emphasis on higher yielding, defensive sectors, we also seek more predictable cash flow generating companies in the cyclical part of the market, many of which are attractive on a relative value basis, in our view. This focus on quality companies detracted from the Fund’s performance relative to the Russell Index during the Reporting Period, especially during the fourth quarter of 2020 and first quarter of 2021. |
| Q | Which equity market sectors most significantly affected Fund performance? |
| A | All sectors within the Russell Index detracted from the Fund’s relative results during the Reporting Period. The sectors that detracted most from the Fund’s relative results during the Reporting Period were financials, consumer staples and consumer discretionary, wherein stock selection proved challenging. Underweights to financials and consumer discretionary, which each outperformed the Russell Index during the Reporting Period, and an overweight to consumer staples, which underperformed the Russell Index during the Reporting Period, hurt as well. Detracting least from the Fund’s relative results were the materials, real estate and health care sectors. While the Fund’s overweight allocations to materials and real estate contributed positively, such positioning was more than offset by weak stock selection. Both allocation positioning and stock selection dampened results in the health care sector. |
| Q | Which stocks detracted significantly from the Fund’s performance during the Reporting Period? |
| A | Detracting most from the Fund’s results relative to the Russell Index were positions in Kimberly-Clark, Citigroup and Amgen. |
Personal care company Kimberly-Clark was the biggest detractor from the Fund’s results during the Reporting Period. The company suffered during the Reporting from COVID-19 pandemic-driven volatility and from higher input costs. At the end of the Reporting Period, we remained constructive on the company due to the brand’s fundamentals |
3
PORTFOLIO RESULTS
| as well as what we see as the potential growth of its business across emerging markets. |
Diversified financial services holding company Citigroup’s stock generated a robust double-digit gain during the Reporting Period, but it detracted from the Fund’s relative results. We initiated the Fund position in March 2021. At the time of purchase, we found Citigroup’s dividend to be well covered and its valuation at an attractive entry point. We also were favorable on Citigroup relative to other banks given Citigroup’s reserve builds and believed there was potential for reserve releases in the back half of 2021. We further believed credit card volumes may recover in the fourth quarter of 2021 and into 2022, and Citigroup may benefit from this trend. Its share price rose for several months after we established the Fund position, but it subsequently declined from its June 2021 high, and we opted to sell the position. |
U.S.-based multinational biopharmaceutical company Amgen generated a negative return during the Reporting Period, as the company experienced a decrease in diagnoses over the course of the COVID-19 pandemic, and its field activity was only at a percentage of pre-COVID-19 levels. |
| Q | What were some of the Fund’s best-performing individual stocks? |
| A | The Fund benefited most relative to the Russell Index from positions in Eli Lilly and Company, Eaton and JPMorgan Chase. |
Eli Lilly and Company, a leading pharmaceutical company with a history of innovation and a strong drug pipeline, was the top positive contributor to the Fund’s relative results during the Reporting Period. Its shares rose on strong results on its Alzheimer’s drug. Its returns were also driven by earnings that beat consensus expectations. At the end of the Reporting Period, we remained optimistic on the company, as it had demonstrated accelerating top-line growth due to drug launches and increased margin growth. |
Eaton, a multinational power management company, significantly outpaced the Russell Index during the Reporting Period, as the company’s new Chief Executive Officer appears to have done a good job of reshaping its portfolio and driving operational changes. In our view, the company has also been able to reliably generate attractive free cash flow. At the end of the Reporting Period, we saw value in Eaton’s end market exposure to some recovering sectors, including commercial aerospace, and we believed the company was well positioned to benefit from any incremental government stimulus focused around infrastructure. |
U.S. bank JPMorgan Chase performed well during the Reporting Period, with its share price benefiting from increasing revenue driven by fee growth and strong investment banking activity. |
| Q | How did the Fund use derivatives and similar instruments during the Reporting Period? |
| A | During the Reporting Period, we did not use derivatives as part of an active management strategy. |
| Q | Did the Fund make any significant purchases or sales during the Reporting Period? |
| A | During the Reporting Period, we initiated a Fund position in Bank of America. We believe the financial institution offers appealing potential for return improvement through operating leverage and increasing capital returns. We also believe the bank will continue to be able to largely offset the impact of the lower interest rate environment with its robust asset growth. |
We established a Fund position in UnitedHealth Group, which owns and manages organized health systems. We were encouraged by the company’s strong membership growth during the first half of 2021 as well as by what we see as its innovative commercial benefit products. |
Conversely, in addition to the sale of Citigroup, already mentioned, we eliminated the Fund’s position in Verizon Communications within the communication services sector to fund a position in AT&T. We were encouraged by the AT&T and Discovery merger announcement along with AT&T’s new management team’s approach toward value creation. |
We sold the Fund’s position in information technology behemoth Apple due to our fundamental outlook and because we believed its stock was trading at peak valuations. We believed the most recent iPhone cycle was likely to be the peak cycle for a few years. A combination of pent-up demand from China being satisfied, an underwhelming reception to 5G (fifth generation technology), lack of appreciable innovation and a fully penetrated market led us to believe the growth of the iPhone line of business was likely to decelerate. Additionally, Apple’s margins were likely to be under pressure, in our view, from rising semiconductor prices and increasing regulatory pressures. |
4
PORTFOLIO RESULTS
| Finally, the yield of Apple’s stock had fallen as its stock price appreciated. |
| Q | Were there any changes to the Fund’s portfolio management team during the Reporting Period? |
| A | There were no changes to the Fund’s portfolio management team during the Reporting Period. |
| Q | Were there any notable changes in the Fund’s weightings during the Reporting Period? |
| A | In constructing the Fund’s portfolio, we focus on picking stocks rather than on making industry or sector bets. We seek to outpace the benchmark index by overweighting stocks that we expect to outperform and underweighting those that we think may lag. Consequently, changes in its sector weights are generally the direct result of individual stock selection or of stock appreciation or depreciation. That said, during the Reporting Period, the Fund’s allocations compared to the Russell Index in financials, real estate and industrials increased. The Fund’s exposure to communication services and information technology decreased compared to the Russell Index. |
| Q | How was the Fund positioned relative to its benchmark index at the end of August 2021? |
| A | At the end of August 2021, the Fund had overweight positions relative to the Russell Index in the information technology, consumer staples, real estate, utilities and materials sectors. On the same date, the Fund had underweight positions compared to the Russell Index in financials, health care and communication services and was rather neutrally weighted to the Russell Index in industrials, consumer discretionary and energy. |
5
FUND BASICS
Equity Income Fund
as of August 31, 2021
| TOP 10 HOLDINGS AS OF 8/31/211 | ||||||||||
| Holding | % of Net Assets | Line of Business | Country | |||||||
| JPMorgan Chase & Co. | 4.1 | % | Banks | United States | ||||||
| Johnson & Johnson | 2.8 | Pharmaceuticals | United States | |||||||
| Medtronic PLC | 2.6 | Health Care Equipment & Supplies | United States | |||||||
| Bank of America Corp. | 2.5 | Banks | United States | |||||||
| Cisco Systems, Inc. | 2.3 | Communications Equipment | United States | |||||||
| Chevron Corp. | 2.3 | Oil, Gas & Consumable Fuels | United States | |||||||
| UnitedHealth Group, Inc. | 2.3 | Health Care Providers & Services | United States | |||||||
| AT&T, Inc. | 2.2 | Diversified Telecommunication Services | United States | |||||||
| Eaton Corp. PLC | 2.2 | Electrical Equipment | United States | |||||||
| Eli Lilly & Co. | 2.2 | Pharmaceuticals | United States | |||||||
| 1 | The top 10 holdings may not be representative of the Fund’s future investments. |
| FUND VS. BENCHMARK SECTOR ALLOCATIONS2 |
| As of August 31, 2021 |
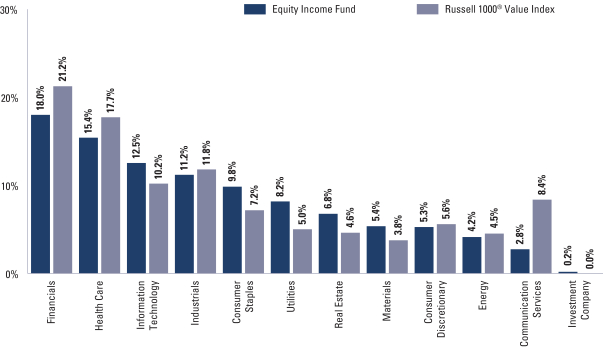
| 2 | The Fund is actively managed and, as such, its composition may differ over time. Consequently, the Fund’s overall sector allocations may differ from the percentages contained in the graph above. Figures in the above graph may not sum to 100% due to the exclusion of other assets and liabilities. The graph categorizes investments using the Global Industry Classification Standard (“GICS”); however, the sector classifications used by the portfolio management team may differ from GICS. The percentage shown for each investment category reflects the value of investments in that category as a percentage of market value. The graph depicts the Fund’s investments but may not represent the Fund’s market exposure due to the exclusion of certain derivatives, if any, as listed in the Additional Investment Information section of the Schedule of Investments. |
For more information about the Fund, please refer to www.GSAMFUNDS.com. There, you can learn more about the Fund’s investment strategies, holdings, and performance.
6
GOLDMAN SACHS EQUITY INCOME FUND
Performance Summary
August 31, 2021
The following graph shows the value, as of August 31, 2021, of a $10,000 investment made on September 1, 2011 in Class A Shares (with the maximum sales charge of 5.5%). For comparative purposes, the performance of the Fund’s benchmark, the Russell 1000® Value Index (with dividends reinvested), is shown. Performance reflects applicable fee waivers and/or expense limitations in effect during the periods shown and in their absence, performance would be reduced. Returns do not reflect the deduction of taxes that a shareholder would pay on Fund distributions or the redemption of Fund shares. The returns set forth below represent past performance. Past performance does not guarantee future results. The Fund’s investment return and principal value will fluctuate so that an investor’s shares, when redeemed, may be worth more or less than their original cost. Current performance may be lower or higher than the performance quoted below. Please visit our web site at www.GSAMFUNDS.com to obtain the most recent month-end returns.
| Equity Income Fund’s 10 Year Performance |
Performance of a $10,000 Investment, including any applicable sales charges, with distributions reinvested, from September 1, 2011 through August 31, 2021.
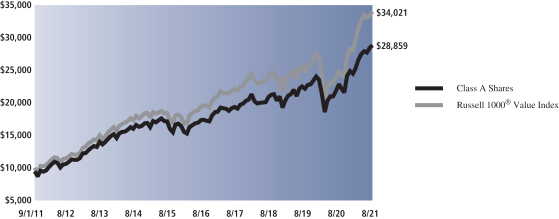
| Average Annual Total Return through August 31, 2021* | One Year | Five Years | Ten Years | Since Inception | ||||||||||
Class A | ||||||||||||||
Excluding sales charges | 26.23% | 10.63% | 11.80% | — | ||||||||||
Including sales charges | 19.28% | 9.39% | 11.17% | — | ||||||||||
|
|
|
|
|
|
|
| |||||||
Class C | ||||||||||||||
Excluding contingent deferred sales charges | 25.26% | 9.82% | 10.97% | — | ||||||||||
Including contingent deferred sales charges | 24.25% | 9.82% | 10.97% | — | ||||||||||
|
|
|
|
|
|
|
| |||||||
Institutional | 26.63% | 11.04% | 12.23% | — | ||||||||||
|
|
|
|
|
|
|
| |||||||
Service | 26.01% | 10.49% | 11.67% | — | ||||||||||
|
|
|
|
|
|
|
| |||||||
Investor | 26.54% | 10.92% | 12.08% | — | ||||||||||
|
|
|
|
|
|
|
| |||||||
Class R6 (Commenced July 31, 2015) | 26.64% | 11.06% | N/A | 9.34% | ||||||||||
|
|
|
|
|
|
|
| |||||||
Class R | 25.91% | 10.37% | 11.52% | — | ||||||||||
|
|
|
|
|
|
|
| |||||||
Class P (Commenced April 17, 2018) | 26.65% | N/A | N/A | 11.42% | ||||||||||
|
|
|
|
|
|
|
|
| * | These returns assume reinvestment of all distributions at NAV and reflect a maximum initial sales charge of 5.50% for Class A Shares and the assumed contingent deferred sales charge for Class C Shares (1% if redeemed within 12 months of purchase). Because Institutional, Service, Investor, Class P, Class R and Class R6 Shares do not involve a sales charge, such a charge is not applied to their Average Annual Total Return. |
7
PORTFOLIO RESULTS
Goldman Sachs Focused Value Fund
Portfolio Composition
The Fund’s investment objective is to seek long-term capital appreciation. The Fund invests, under normal circumstances, at least 80% of its net assets plus any borrowings for investment purposes (measured at time of purchase) in a portfolio of equity investments, including common stocks, preferred stocks and other securities and instruments having equity characteristics. The Fund seeks to achieve its investment objective by investing, under normal circumstances, in approximately 20-40 companies that are considered value opportunities, which the Investment Adviser defines as companies with identifiable competitive advantages whose intrinsic value is not reflected in the stock price. The Fund may invest in securities of companies of any capitalization. Although the Fund will invest primarily in publicly traded U.S. securities, it may invest up to 20% of its total assets in foreign securities, including securities of issuers in countries with emerging markets or economies (“emerging countries”) and securities quoted in foreign currencies. The Fund may invest in fixed income securities, such as government, corporate and bank debt obligations.
Portfolio Management Discussion and Analysis
Below, the Goldman Sachs Fundamental Equity U.S. Equity Team discusses the Goldman Sachs Focused Value Fund’s (the “Fund”) performance and positioning for the 12-month period ended August 31, 2021 (the “Reporting Period”).
| Q | How did the Fund perform during the Reporting Period? |
| A | During the Reporting Period, the Fund’s Class A, Class C, Institutional, Investor, Class R6, Class R and Class P Shares generated average annual total returns, without sales charges, of 34.43%, 33.34%, 34.80%, 34.71%, 34.79%, 34.04% and 34.76%, respectively. These returns compare to the 36.44% average annual total return of the Fund’s benchmark, the Russell 1000® Value Index (with dividends reinvested) (the “Russell Index”), during the same period. |
| Q | What key factors were responsible for the Fund’s performance during the Reporting Period? |
| A | While the Fund posted robust double-digit absolute gains, it underperformed the Russell Index on a relative basis due primarily to sector allocation overall. Stock selection as a whole contributed positively to the Fund’s performance relative to the Russell Index during the Reporting Period, albeit more modestly. |
| Q | Which equity market sectors most significantly affected Fund performance? |
| A | The sectors that detracted most from the Fund’s relative results during the Reporting Period were financials, energy and materials, wherein both sector allocation positioning and stock selection proved challenging. Contributing positively to the Fund’s relative results was effective stock selection in the communication services, information technology and industrials sectors. Having an overweight to industrials, which outperformed the Russell Index during the Reporting Period, also added value. |
| Q | Which stocks detracted significantly from the Fund’s performance during the Reporting Period? |
| A | Detracting most from the Fund’s results relative to the Russell Index were positions in health insurance services provider Humana, musculoskeletal healthcare services company Zimmer Biomet Holdings and utilities company Ameren. |
Humana’s stock finished the Reporting Period relatively flat, largely due to varying quarterly earnings reports with both positive and negative results. At the end of the Reporting Period, we were monitoring the name closely, as COVID-19-related hospitalizations had increased once again, leading us to carefully watch the health insurance industry overall. |
Zimmer Biomet Holdings achieved positive returns during the Reporting Period but detracted from the Fund’s relative results based on the timing of our trading activity and on our positioning in the name. At the end of the Reporting Period, we continued to view the stock as a recovery and restructuring opportunity and believed Zimmer Biomet Holdings was well-equipped from a product standpoint to perform well within the industry. |
8
PORTFOLIO RESULTS
Ameren detracted from the Fund’s relative results largely as a result of a 15% drawdown in its stock after it reported third quarter 2020 earnings in which the earnings were in line with consensus expectations but revenues missed consensus expectations. Lower electric sales due to high temperatures and the ripple effects of the COVID-19 pandemic caused the company to further reduce its guidance. At the end of the Reporting Period, we remained optimistic on the company, as we believed it had a compelling valuation relative to its prospects ahead. |
| Q | What were some of the Fund’s best-performing individual stocks? |
| A | The Fund benefited most relative to the Russell Index from positions in General Electric, Aptiv and Alphabet. |
General Electric engages in the industrial industry through its power, renewable energy, aviation and health care segments and also has a financial services business segment. Its stock rallied during the Reporting Period as the company beat consensus earnings estimates in all quarters except the fourth quarter of 2020. The company also announced strategic partnerships, acquisitions and Environmental, Social and Governance efforts during the Reporting Period, prompting an improved investor outlook. At the end of the Reporting Period, we believed General Electric was well positioned to continue to benefit from strategic partnerships, technological innovations, a recovery in commercial aviation and an improving cash flow profile. |
Vehicle components manufacturer Aptiv outperformed the Russell Index during the Reporting Period, and its third quarter 2020 earnings report reaffirmed our confidence in its stock, as, in our view, the earnings report highlighted Aptiv’s attractive positioning in the vehicle electrification and autonomous driving space and its strong execution. Given its strong performance, however, we opted to sell the position, taking profits. |
Alphabet is a holding company that engages in advertising, digital content, applications, cloud offerings and more through its subsidiaries, including its largest, Google. Alphabet’s share price appreciated significantly during the Reporting Period as a result of substantially better than consensus expected revenues and earnings per share in every quarter, driven, in turn, by solid performance in advertising spending in Google, brand spending in YouTube and ongoing Cloud growth. At the end of the Reporting Period, we expected Alphabet to continue to perform well, as advertising markets appeared to be improving and margins notably bettering through cost discipline. |
| Q | How did the Fund use derivatives and similar instruments during the Reporting Period? |
| A | During the Reporting Period, we did not use derivatives as part of an active management strategy. |
| Q | Did the Fund make any significant purchases or sales during the Reporting Period? |
| A | During the Reporting Period, we initiated a Fund position in BlackRock, which provides investment management services to institutional clients and to retail investors through various investment vehicles. In our view, the company has a diversified product platform that continues to perform at a high level and is heavily focused on the broader demand for data and analytics related to sustainability. We also favorably viewed its growth prospects, competitive positioning and valuation. |
We established a Fund position in Marvell Technology Group, a designer, developer and seller of integrated circuits. We believe the demand for data infrastructure should remain strong, and some design win announcements may indicate continued forward momentum in the upcoming year for the company. |
Conversely, in addition to the sale of Aptiv mentioned earlier, we eliminated the Fund’s position in health care products manufacturer Johnson & Johnson during the Reporting Period. We sold the position in October 2020 following COVID-19 vaccination momentum and reallocated to what we saw as more attractive risk/reward opportunities elsewhere. |
We exited the Fund’s position in entertainment and media enterprise Walt Disney Company. While we continued to like the company’s prospects and the momentum of Disney+, we ultimately decided to sell the position in favor of what we considered to be more attractive risk/reward opportunities. |
| Q | Were there any changes to the Fund’s portfolio management team during the Reporting Period? |
| A | There were no changes to the Fund’s portfolio management team during the Reporting Period. |
| Q | Were there any notable changes in the Fund’s weightings during the Reporting Period? |
| A | In constructing the Fund’s portfolio, we focus on picking stocks rather than on making industry or sector bets. We seek to outpace the benchmark index by overweighting stocks that we expect to outperform and underweighting those that we think may lag. Consequently, changes in its sector weights |
9
PORTFOLIO RESULTS
| are generally the direct result of individual stock selection or of stock appreciation or depreciation. That said, during the Reporting Period, the Fund’s allocations compared to the Russell Index in communication services, consumer staples, materials and real estate increased. The Fund’s exposure to the energy, health care, industrials and information technology sectors decreased compared to the Russell Index. |
| Q | How was the Fund positioned relative to its benchmark index at the end of August 2021? |
| A | At the end of August 2021, the Fund was overweight in materials, industrials, utilities, consumer staples and real estate relative to the Russell Index. On the same date, the Fund was underweight in financials, consumer discretionary and information technology and was rather neutrally weighted to the Russell Index in communication services, energy and health care. |
10
FUND BASICS
Focused Value Fund
as of August 31, 2021
| TOP 10 HOLDINGS AS OF 8/31/211 | ||||||||||
| Holding | % of Net Assets | Line of Business | Country | |||||||
| JPMorgan Chase & Co. | 4.7 | % | Banks | United States | ||||||
| Alphabet, Inc., Class A | 4.0 | Interactive Media & Services | United States | |||||||
| General Electric Co. | 4.0 | Industrial Conglomerates | United States | |||||||
| NextEra Energy, Inc. | 3.9 | Electric Utilities | United States | |||||||
| BlackRock, Inc. | 3.8 | Capital Markets | United States | |||||||
| Marvell Technology, Inc. | 3.6 | Semiconductors & Semiconductor Equipment | United States | |||||||
| Procter & Gamble Co. (The) | 3.5 | Household Products | United States | |||||||
| AvalonBay Communities, Inc.REIT | 3.4 | Equity Real Estate Investment Trusts (REITs) | United States | |||||||
| Truist Financial Corp. | 3.2 | Banks | United States | |||||||
| Bristol-Myers Squibb Co. | 3.1 | Pharmaceuticals | United States | |||||||
| 1 | The top 10 holdings may not be representative of the Fund’s future investments. |
| FUND VS. BENCHMARK SECTOR ALLOCATIONS2 |
| As of August 31, 2021 |
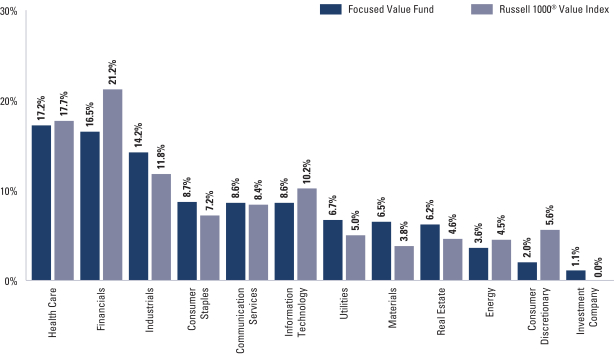
| 2 | The Fund is actively managed and, as such, its composition may differ over time. Consequently, the Fund’s overall sector allocations may differ from the percentages contained in the graph above. Figures in the above graph may not sum to 100% due to the exclusion of other assets and liabilities. The graph categorizes investments using the Global Industry Classification Standard (“GICS”); however, the sector classifications used by the portfolio management team may differ from GICS. The percentage shown for each investment category reflects the value of investments in that category as a percentage of market value. The graph depicts the Fund’s investments but may not represent the Fund’s market exposure due to the exclusion of certain derivatives, if any, as listed in the Additional Investment Information section of the Schedule of Investments. |
For more information about the Fund, please refer to www.GSAMFUNDS.com. There, you can learn more about the Fund’s investment strategies, holdings, and performance.
11
GOLDMAN SACHS FOCUSED VALUE FUND
Performance Summary
August 31, 2021
The following graph shows the value, as of August 31, 2021, of a $1,000,000 investment made on July 31, 2015 (commencement of operations) in Institutional Shares at NAV. For comparative purposes, the performance of the Fund’s benchmark, the Russell 1000® Value Index (with dividends reinvested), is shown. Performance reflects applicable fee waivers and/or expense limitations in effect during the periods shown and in their absence, performance would be reduced. Returns do not reflect the deduction of taxes that a shareholder would pay on Fund distributions or the redemption of Fund shares. The returns set forth below represent past performance. Past performance does not guarantee future results. The Fund’s investment return and principal value will fluctuate so that an investor’s shares, when redeemed, may be worth more or less than their original cost. Current performance may be lower or higher than the performance quoted below. Please visit our web site at www.GSAMFUNDS.com to obtain the most recent month-end returns.
| Focused Value Fund’s Lifetime Performance |
Performance of a $1,000,000 Investment, including any applicable sales charges, with distributions reinvested, from July 31, 2015 through August 31, 2021.
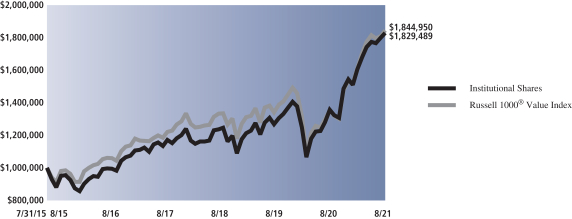
| Average Annual Total Return through August 31, 2021* | One Year | Five Years | Since Inception | |||||||
Class A (Commenced July 31, 2015) | ||||||||||
Excluding sales charges | 34.43% | 12.51% | 10.02% | |||||||
Including sales charges | 27.09% | 11.23% | 9.01% | |||||||
| ||||||||||
Class C (Commenced July 31, 2015) | ||||||||||
Excluding contingent deferred sales charges | 33.34% | 11.67% | 9.20% | |||||||
Including contingent deferred sales charges | 32.33% | 11.67% | 9.20% | |||||||
| ||||||||||
Institutional (Commenced July 31, 2015) | 34.80% | 12.89% | 10.42% | |||||||
| ||||||||||
Investor (Commenced July 31, 2015) | 34.71% | 12.78% | 10.30% | |||||||
| ||||||||||
Class R6 (Commenced July 31, 2015) | 34.79% | 12.91% | 10.44% | |||||||
| ||||||||||
Class R (Commenced July 31, 2015) | 34.04% | 12.20% | 9.74% | |||||||
| ||||||||||
Class P (Commenced April 17, 2018) | 34.76% | N/A | 14.14% | |||||||
| ||||||||||
| * | These returns assume reinvestment of all distributions at NAV and reflect a maximum initial sales charge of 5.50% for Class A Shares and the assumed contingent deferred sales charge for Class C Shares (1% if redeemed within 12 months of purchase). Because Institutional, Investor, Class P, Class R and Class R6 Shares do not involve a sales charge, such a charge is not applied to their Average Annual Total Return. |
12
PORTFOLIO RESULTS
Goldman Sachs Large Cap Value Fund
Portfolio Composition
The Fund invests, under normal circumstances, at least 80% of its net assets plus borrowings for investment practices (measured at the time of purchase) in a diversified portfolio of equity investments in large-cap issuers with public stock market capitalizations within the range of the market capitalization of companies constituting the Russell 1000® Value Index at the time of investment. The Fund seeks its investment objective of long-term capital appreciation by investing in value opportunities that the Goldman Sachs Fundamental Equity U.S. Equity Team defines as companies with identifiable competitive advantages whose intrinsic value is not reflected in the stock price. Although the Fund will invest primarily in publicly traded U.S. securities, including preferred and convertible securities, it may invest in foreign securities, including securities of issuers in countries with emerging markets or economies (“emerging countries”) and quoted in foreign currencies. The Fund may also invest in fixed income securities, such as government, corporate and bank debt obligations.
Portfolio Management Discussion and Analysis
Below, the Goldman Sachs Fundamental Equity U.S. Equity Team discusses the Goldman Sachs Large Cap Value Fund’s (the “Fund”) performance and positioning for the 12-month period ended August 31, 2021 (the “Reporting Period”).
| Q | How did the Fund perform during the Reporting Period? |
| A | During the Reporting Period, the Fund’s Class A, Class C, Institutional, Service, Investor, Class R6, Class R and Class P Shares generated average annual total returns, without sales charges, of 32.64%, 31.59%, 33.08%, 32.36%, 32.92%, 33.05%, 32.32% and 33.05%, respectively. These returns compare to the 36.44% average annual total return of the Fund’s benchmark, the Russell 1000® Value Index (with dividends reinvested) (the “Russell Index”), during the same period. |
| Q | What key factors were responsible for the Fund’s performance during the Reporting Period? |
| A | While the Fund posted robust double-digit absolute gains, it underperformed the Russell Index on a relative basis due both to stock selection and sector allocation overall. |
| Q | Which equity market sectors most significantly affected Fund performance? |
| A | Detracting most from the Fund’s performance relative to the Russell Index was both stock selection and sector allocation positioning in the information technology, utilities and energy sectors. Only partially offsetting these detractors were consumer discretionary, industrials and communication services, which contributed positively as stock selection in each proved effective. |
| Q | Which stocks detracted significantly from the Fund’s performance during the Reporting Period? |
| A | Detracting most from the Fund’s results relative to the Russell Index were positions in health insurance services provider Humana, musculoskeletal healthcare services company Zimmer Biomet Holdings and utilities company Ameren. |
Humana’s stock finished the Reporting Period relatively flat, largely due to varying quarterly earnings reports with both positive and negative results. At the end of the Reporting Period, we were monitoring the name closely, as COVID-19-related hospitalizations had increased once again, leading us to carefully watch the health insurance industry overall. |
Zimmer Biomet Holdings achieved positive returns during the Reporting Period but detracted from the Fund’s relative results based on the timing of our trading activity and on our positioning in the name. At the end of the Reporting Period, we continued to view the stock as a recovery and restructuring opportunity and believed Zimmer Biomet Holdings was well-equipped from a product standpoint to perform well within the industry. |
Ameren detracted from the Fund’s relative results largely as a result of a 15% drawdown in its stock after it reported third quarter 2020 earnings in which the earnings were in line with consensus expectations but revenues missed consensus expectations. Lower electric sales due to high temperatures and the ripple effects of the COVID-19 pandemic caused the company to further reduce its guidance. At the end of the |
13
PORTFOLIO RESULTS
| Reporting Period, we remained optimistic on the company, as we believed it had a compelling valuation relative to its prospects ahead. |
| Q | What were some of the Fund’s best-performing individual stocks? |
| A | The Fund benefited most relative to the Russell Index from positions in General Electric, Aptiv and Alphabet. |
General Electric engages in the industrial industry through its power, renewable energy, aviation and health care segments and also has a financial services business segment. Its stock rallied during the Reporting Period as the company beat consensus earnings estimates in all quarters except the fourth quarter of 2020. The company also announced strategic partnerships, acquisitions and Environmental, Social and Governance efforts during the Reporting Period, prompting an improved investor outlook. At the end of the Reporting Period, we believed General Electric was well positioned to continue to benefit from strategic partnerships, technological innovations, a recovery in commercial aviation and an improving cash flow profile. |
Vehicle components manufacturer Aptiv outperformed the Russell Index during the Reporting Period, and its third quarter 2020 earnings report reaffirmed our confidence in its stock, as, in our view, the earnings report highlighted Aptiv’s attractive positioning in the vehicle electrification and autonomous driving space and its strong execution. Given its strong performance, however, we opted to sell the position, taking profits. |
Alphabet is a holding company that engages in advertising, digital content, applications, cloud offerings and more through its subsidiaries, including its largest, Google. Alphabet’s share price appreciated significantly during the Reporting Period as a result of substantially better than consensus expected revenues and earnings per share in every quarter, driven, in turn, by solid performance in advertising spending in Google, brand spending in YouTube and ongoing Cloud growth. At the end of the Reporting Period, we expected Alphabet to continue to perform well, as advertising markets appeared to be improving and margins notably bettering through cost discipline. |
| Q | How did the Fund use derivatives and similar instruments during the Reporting Period? |
| A | During the Reporting Period, we did not use derivatives as part of an active management strategy. |
| Q | Did the Fund make any significant purchases or sales during the Reporting Period? |
| A | During the Reporting Period, we initiated a Fund position in Bank of America. We believe the financial institution offers appealing potential for return improvement through operating leverage and increasing capital returns. We also believe the bank will continue to be able to largely offset the impact of the lower interest rate environment with its robust asset growth. |
We eliminated the Fund’s position in Verizon Communications within the communication services sector to fund a new position in AT&T. We were encouraged by the AT&T and Discovery merger announcement along with AT&T’s new management team’s approach toward value creation. |
We sold the Fund’s position in financial institution Citigroup in September 2020 after a consent order was issued by the U.S. Federal Reserve by which Citigroup was required to make a plan to improve firmwide risk management and controls. |
| Q | Were there any changes to the Fund’s portfolio management team during the Reporting Period? |
| A | There were no changes to the Fund’s portfolio management team during the Reporting Period. |
| Q | Were there any notable changes in the Fund’s weightings during the Reporting Period? |
| A | In constructing the Fund’s portfolio, we focus on picking stocks rather than on making industry or sector bets. We seek to outpace the benchmark index by overweighting stocks that we expect to outperform and underweighting those that we think may lag. Consequently, changes in its sector weights are generally the direct result of individual stock selection or of stock appreciation or depreciation. That said, during the Reporting Period, the Fund’s allocations compared to the Russell Index in consumer staples, financials and materials increased. The Fund’s exposure to communication services, consumer discretionary, information technology and utilities decreased compared to the Russell Index. |
| Q | How was the Fund positioned relative to its benchmark index at the end of August 2021? |
| A | At the end of August 2021, the Fund had overweight positions relative to the Russell Index in the materials and consumer staples sectors. On the same date, the Fund had |
14
PORTFOLIO RESULTS
| underweight positions compared to the Russell Index in communication services and health care and had rather neutral allocations relative to the Russell Index in consumer discretionary, energy, financials, industrials, information technology, real estate and utilities. |
15
FUND BASICS
Large Cap Value Fund
as of August 31, 2021
| TOP 10 HOLDINGS AS OF 8/31/211 | ||||||||||
| Holding | % of Net Assets | Line of Business | Country | |||||||
| JPMorgan Chase & Co. | 3.9 | % | Banks | United States | ||||||
| Bank of America Corp. | 2.8 | Banks | United States | |||||||
| Johnson & Johnson | 2.7 | Pharmaceuticals | United States | |||||||
| Procter & Gamble Co. (The) | 2.5 | Household Products | United States | |||||||
| Morgan Stanley | 2.3 | Capital Markets | United States | |||||||
| NextEra Energy, Inc. | 2.1 | Electric Utilities | United States | |||||||
| Comcast Corp., Class A | 2.0 | Media | United States | |||||||
| BlackRock, Inc. | 2.0 | Capital Markets | United States | |||||||
| AT&T, Inc. | 2.0 | Diversified Telecommunication Services | United States | |||||||
| Bristol-Myers Squibb Co. | 1.9 | Pharmaceuticals | United States | |||||||
| 1 | The top 10 holdings may not be representative of the Fund’s future investments. |
| FUND VS. BENCHMARK SECTOR ALLOCATIONS2 |
| As of August 31, 2021 |
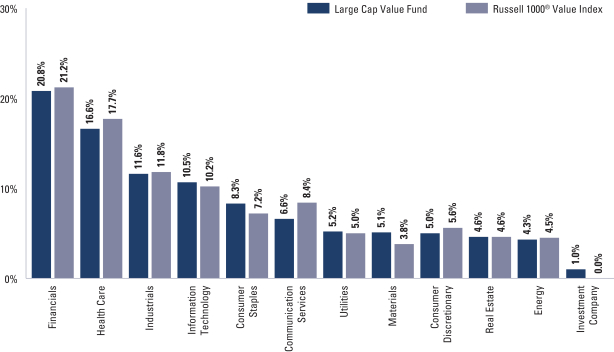
| 2 | The Fund is actively managed and, as such, its composition may differ over time. Consequently, the Fund’s overall sector allocations may differ from the percentages contained in the graph above. Figures in the above graph may not sum to 100% due to the exclusion of other assets and liabilities. The graph categorizes investments using the Global Industry Classification Standard (“GICS”); however, the sector classifications used by the portfolio management team may differ from GICS. The percentage shown for each investment category reflects the value of investments in that category as a percentage of market value. The graph depicts the Fund’s investments but may not represent the Fund’s market exposure due to the exclusion of certain derivatives, if any, as listed in the Additional Investment Information section of the Schedule of Investments. |
For more information about the Fund, please refer to www.GSAMFUNDS.com. There, you can learn more about the Fund’s investment strategies, holdings, and performance.
16
GOLDMAN SACHS LARGE CAP VALUE FUND
Performance Summary
August 31, 2021
The following graph shows the value, as of August 31, 2021, of a $1,000,000 investment made on September 1, 2011 in Institutional Shares at NAV. For comparative purposes, the performance of the Fund’s benchmark, the Russell 1000® Value Index (with dividends reinvested), is shown. Performance reflects applicable fee waivers and/or expense limitations in effect during the periods shown and in their absence, performance would be reduced. Returns do not reflect the deduction of taxes that a shareholder would pay on Fund distributions or the redemption of Fund shares. The returns set forth below represent past performance. Past performance does not guarantee future results. The Fund’s investment return and principal value will fluctuate so that an investor’s shares, when redeemed, may be worth more or less than their original cost. Current performance may be lower or higher than the performance quoted below. Please visit our web site at www.GSAMFUNDS.com to obtain the most recent month-end returns.
| Large Cap Value Fund’s 10 Year Performance |
Performance of a $1,000,000 Investment, including any applicable sales charges, with distributions reinvested, from September 1, 2011 through August 31, 2021.
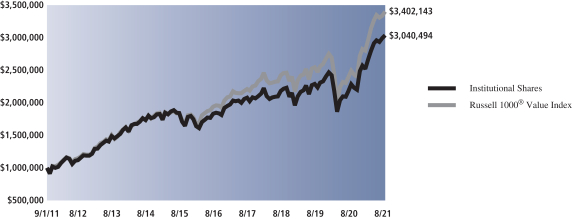
| Average Annual Total Return through August 31, 2021* | One Year | Five Years | Ten Years | Since Inception | ||||||||||
Class A | ||||||||||||||
Excluding sales charges | 32.64% | 10.10% | 11.35% | — | ||||||||||
Including sales charges | 25.35% | 8.86% | 10.73% | — | ||||||||||
|
|
|
|
|
|
|
| |||||||
Class C | ||||||||||||||
Excluding contingent deferred sales charges | 31.59% | 9.27% | 10.52% | — | ||||||||||
Including contingent deferred sales charges | 30.57% | 9.27% | 10.52% | — | ||||||||||
|
|
|
|
|
|
|
| |||||||
Institutional | 33.08% | 10.45% | 11.75% | — | ||||||||||
|
|
|
|
|
|
|
| |||||||
Service | 32.36% | 9.90% | 11.20% | — | ||||||||||
|
|
|
|
|
|
|
| |||||||
Investor | 32.92% | 10.36% | 11.63% | — | ||||||||||
|
|
|
|
|
|
|
| |||||||
Class R6 (Commenced July 31, 2015) | 33.05% | 10.51% | N/A | 8.65% | ||||||||||
|
|
|
|
|
|
|
| |||||||
Class R | 32.32% | 9.82% | 11.07% | — | ||||||||||
|
|
|
|
|
|
|
| |||||||
Class P (Commenced April 17, 2018) | 33.05% | N/A | N/A | 11.51% | ||||||||||
|
|
|
|
|
|
|
|
| * | These returns assume reinvestment of all distributions at NAV and reflect a maximum initial sales charge of 5.50% for Class A Shares and the assumed contingent deferred sales charge for Class C Shares (1% if redeemed within 12 months of purchase). Because Institutional, Service, Investor, Class P, Class R and Class R6 Shares do not involve a sales charge, such a charge is not applied to their Average Annual Total Return. |
17
PORTFOLIO RESULTS
Goldman Sachs Mid Cap Value Fund
Portfolio Composition
The Fund invests, under normal circumstances, at least 80% of its net assets (plus borrowings for investment purposes) (“Net Assets”) in a diversified portfolio of equity investments in mid-cap issuers with public stock market capitalizations within the range of the market capitalization of companies constituting the Russell Midcap® Value Index at the time of investment. The Fund seeks its investment objective of long-term capital appreciation by investing in value opportunities that the Investment Adviser defines as companies with identifiable competitive advantages whose intrinsic value is not reflected in the stock price. Although the Fund will invest primarily in publicly traded U.S. securities, it may invest up to 25% of its Net Assets in foreign securities, including securities of issuers in emerging countries and securities quoted in foreign currencies. The Fund may also invest in the aggregate up to 20% of its Net Assets in companies with public stock market capitalizations outside the range of companies constituting the Russell Midcap® Value Index at the time of investment and in fixed income securities, such as government, corporate and bank debt obligations.
Portfolio Management Discussion and Analysis
Below, the Goldman Sachs Fundamental Equity U.S. Equity Team discusses the Goldman Sachs Mid Cap Value Fund’s (the “Fund”) performance and positioning for the 12-month period ended August 31, 2021 (the “Reporting Period”).
| Q | How did the Fund perform during the Reporting Period? |
| A | During the Reporting Period, the Fund’s Class A, Class C, Institutional, Service, Investor, Class R6, Class R, and Class P Shares generated average annual total returns, without sales charges, of 43.77%, 42.70%, 44.27%, 43.57%, 44.11%, 44.33%, 43.41% and 44.30%, respectively. These returns compare to the 44.50% average annual total return of the Fund’s benchmark, the Russell Midcap® Value Index (with dividends reinvested) (the “Russell Index”), during the same period. |
| Q | What key factors were responsible for the Fund’s performance during the Reporting Period? |
| A | The Fund posted robust double-digit absolute gains but modestly underperformed the Russell Index on a relative basis due to both stock selection and sector allocation overall. |
| Q | Which equity market sectors most significantly affected Fund performance? |
| A | Detracting most from the Fund’s performance relative to the Russell Index was stock selection in industrials, real estate and communication services. Only partially offsetting these detractors were financials, consumer discretionary and consumer staples, which contributed positively as stock selection in each proved effective. |
| Q | Which stocks detracted significantly from the Fund’s performance during the Reporting Period? |
| A | Detracting most from the Fund’s results relative to the Russell Index were positions in musculoskeletal health care services company Zimmer Biomet Holdings, telecommunications company ViacomCBS and frozen foods company Nomad Foods. |
Zimmer Biomet Holdings achieved positive returns during the Reporting Period but detracted from the Fund’s relative results based on the timing of our trading activity and on our positioning in the name. At the end of the Reporting Period, we continued to view the stock as a recovery and restructuring opportunity and believed Zimmer Biomet Holdings was well-equipped from a product standpoint to perform well within the industry. |
ViacomCBS was a new purchase for the Fund during the Reporting Period. Much of ViacomCBS’ weak performance during the Reporting Period was driven by technical rather than fundamental factors. At the end of the Reporting Period, we believed the long-term opportunities and performance of the company would likely offset the effect of its recent equity issuance. We also remained optimistic that ViacomCBS’ new streaming service would allow it to remain competitive relative to other media companies and believed its valuations were reasonable. |
Nomad Foods’ share price was muted following a slight miss to top-line performance due to heightened consensus earnings expectations in the fourth quarter of 2020. However, |
18
PORTFOLIO RESULTS
| its stock rebounded after the company announced its acquisition of frozen food brand Findus Switzerland. At the end of the Reporting Period, we believed the company’s stock balance sheet and position in its industry would likely enable it to perform strategic acquisitions to expand its domain in the international space. Additionally, we felt its strong penetration within leading food chains across the U.S. and its current brand equity may well shift consumers’ attention to frozen food alternatives. |
| Q | What were some of the Fund’s best-performing individual stocks? |
| A | The Fund benefited most relative to the Russell Index from positions in Pinnacle Financial Partners, SVB Financial Group and Discover Financial Services—each a constituent of the financials sector. |
Banking company Pinnacle Financial Partners’ shares rallied in late October 2020 after the company reported strong third calendar quarter earnings. Its earnings reports also yielded favorable results in the fourth quarter of 2020 and first quarter of 2021. More specifically, the company delivered strong revenues across both fees and net interest. In addition to a strong top line, lower provisions and well-controlled expenses relative to revenue contributed to above-consensus expectations for earnings. At the end of the Reporting Period, we believed the company’s management team would both execute and create value for shareholders going forward and guide it to take market share, as we saw potential normalization in commercial loan demand. |
SVB Financial Group is a west coast bank focused primarily on lending to technology-based companies. In addition to broad strength within banks during the Reporting Period, SVB Financial Group performed well as a result of its higher growth profile relative to its peers and solid warrant and investment gains, better than consensus expected investment banking results and improved provisions for losses. At the end of the Reporting Period, we continued to believe SVB Financial Group was a niche investment opportunity given its long-standing relationships in the technology, health sciences, private equity and venture capital industries. We viewed these relationships as beneficial to driving outsized loan and deposit growth relative to peers. Additionally, we were optimistic that SVB Financial Group had altered its risk profile to be less exposed to early-stage companies. |
Discover Financial Services is a direct banking and payment services provider. Its strong performance during the Reporting Period was driven by largely positive earnings reports. Increased consumer spending progressed toward normal activity levels as well. At the end of the Reporting Period, we maintained conviction in Discover Financial Services should broader economic activity resume and pay-down rates normalize as we anticipate. |
| Q | How did the Fund use derivatives and similar instruments during the Reporting Period? |
| A | During the Reporting Period, we did not use derivatives as part of an active management strategy. |
| Q | Did the Fund make any significant purchases or sales during the Reporting Period? |
| A | During the Reporting Period, we initiated a Fund position in medical specialty company Perkin Elmer. We looked favorably on the company’s acquisition of Oxford Immunotech, which we believe will give the company exposure to the fast-growing latent tuberculosis testing market. We also believe the company’s fast-growing diagnostics business should push its top-line growth in the near term. |
We established a Fund position in diesel and natural gas engine manufacturer Cummins. Moving forward, we think Cummins should be a beneficiary of the structural clean energy transition, a potential mining cycle and any infrastructure spending packages passed by Congress, which, in our view, position the company well relative to its peers in the construction and heavy machinery space. |
Conversely, we exited the Fund’s position in tool manufacturer Stanley Black & Decker. The company was a significant beneficiary of COVID-19-driven stimulus and thus may experience decelerating top-line trends for calendar year 2021. The impact of inflation on companies with low pricing power also led us to sell the position and reallocate the capital to what we saw as more attractive risk/reward opportunities. |
We sold the Fund’s position in agricultural products provider Corteva. Corteva was executing well in taking share across seed and crop protection products and also was managing an effective cost savings plan, in our view. We simply preferred other stock positions at this time. |
| Q | Were there any changes to the Fund’s portfolio management team during the Reporting Period? |
| A | Effective February 10, 2021, Adam Agress, vice president and portfolio manager on the Goldman Sachs Fundamental Equity U.S. Equity Team and a portfolio manager of the Fund since 2017, left the firm to pursue another opportunity. |
19
PORTFOLIO RESULTS
| Sung Cho, managing director, continues to serve as portfolio manager for the Fund. Sung joined Goldman Sachs Asset Management in 2004 and has 19 years of investment experience. He has been a lead portfolio manager for the U.S. Mid Cap Value strategy since 2015. Sung will continue to leverage the expertise of more than 20 investment professionals as part of the Goldman Sachs Fundamental Equity U.S. Equity Team. By design, all investment decisions for the Fund are performed within a co-lead or team structure, with multiple subject matter experts. This strategic decision make has been a cornerstone of our approach and helps to ensure continuity in the Fund. |
| Q | Were there any notable changes in the Fund’s weightings during the Reporting Period? |
| A | In constructing the Fund’s portfolio, we focus on picking stocks rather than on making industry or sector bets. We seek to outpace the benchmark index by overweighting stocks that we expect to outperform and underweighting those that we think may lag. Consequently, changes in its sector weights are generally the direct result of individual stock selection or of stock appreciation or depreciation. That said, during the Reporting Period, the Fund’s allocations compared to the Russell Index in energy and utilities increased. The Fund’s exposure to the communication services sector decreased compared to the Russell Index. |
| Q | How was the Fund positioned relative to its benchmark index at the end of August 2021? |
| A | At the end of August 2021, the Fund had an overweight position relative to the Russell Index in utilities sector, an underweight position in the consumer discretionary sector and was rather neutrally weighted to the remaining nine sectors in the Russell Index. |
20
FUND BASICS
Mid Cap Value Fund
as of August 31, 2021
| TOP 10 HOLDINGS AS OF 8/31/211 | ||||||||||
| Holding | % of Net Assets | Line of Business | Country | |||||||
| Marvell Technology, Inc. | 2.1 | % | Semiconductors & Semiconductor Equipment | United States | ||||||
| Ball Corp. | 1.8 | Containers & Packaging | United States | |||||||
| AMETEK, Inc. | 1.8 | Electrical Equipment | United States | |||||||
| Motorola Solutions, Inc. | 1.7 | Communications Equipment | United States | |||||||
| Zimmer Biomet Holdings, Inc. | 1.6 | Health Care Equipment & Supplies | United States | |||||||
| Live Nation Entertainment, Inc. | 1.6 | Entertainment | United States | |||||||
| Packaging Corp. of America | 1.6 | Containers & Packaging | United States | |||||||
| PerkinElmer, Inc. | 1.6 | Life Sciences Tools & Services | United States | |||||||
| East West Bancorp, Inc. | 1.6 | Banks | United States | |||||||
| M&T Bank Corp. | 1.6 | Banks | United States | |||||||
| 1 | The top 10 holdings may not be representative of the Fund’s future investments. |
| FUND VS. BENCHMARK SECTOR ALLOCATIONS2 |
| As of August 31, 2021 |
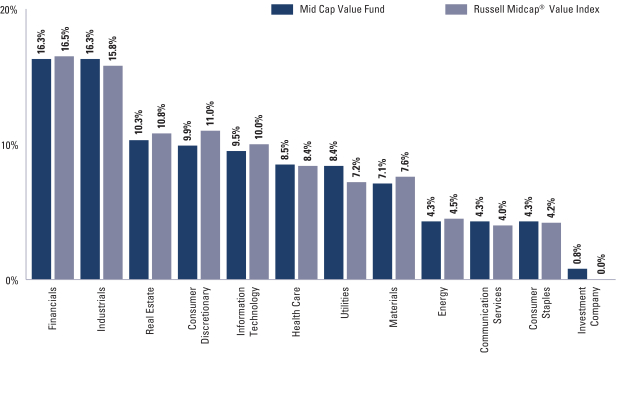
| 2 | The Fund is actively managed and, as such, its composition may differ over time. Consequently, the Fund’s overall sector allocations may differ from the percentages contained in the graph above. Figures in the above graph may not sum to 100% due to the exclusion of other assets and liabilities. The graph categorizes investments using the Global Industry Classification Standard (“GICS”); however, the sector classifications used by the portfolio management team may differ from GICS. The percentage shown for each investment category reflects the value of investments in that category as a percentage of market value. The graph depicts the Fund’s investments but may not represent the Fund’s market exposure due to the exclusion of certain derivatives, if any, as listed in the Additional Investment Information section of the Schedule of Investments. |
For more information about the Fund, please refer to www.GSAMFUNDS.com. There, you can learn more about the Fund’s investment strategies, holdings, and performance.
21
GOLDMAN SACHS MID CAP VALUE FUND
Performance Summary
August 31, 2021
The following graph shows the value, as of August 31, 2021, of a $10,000 investment made on September 1, 2011 in Class A Shares (with the maximum sales charge of 5.5%). For comparative purposes, the performance of the Fund’s benchmark, the Russell Midcap® Value Index (with dividends reinvested), is shown. Performance reflects applicable fee waivers and/or expense limitations in effect during the periods shown and in their absence, performance would be reduced. Returns do not reflect the deduction of taxes that a shareholder would pay on Fund distributions or the redemption of Fund shares. The returns set forth below represent past performance. Past performance does not guarantee future results. The Fund’s investment return and principal value will fluctuate so that an investor’s shares, when redeemed, may be worth more or less than their original cost. Current performance may be lower or higher than the performance quoted below. Please visit our web site at www.GSAMFUNDS.com to obtain the most recent month-end returns.
| Mid Cap Value Fund’s 10 Year Performance |
Performance of a $10,000 Investment, including any applicable sales charges, with distributions reinvested, from September 1, 2011 through August 31, 2021.
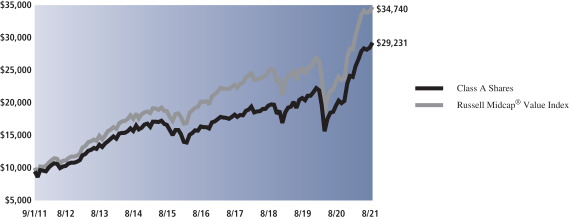
| Average Annual Total Return through August 31, 2021* | One Year | Five Years | Ten Years | Since Inception | ||||||||||
Class A | ||||||||||||||
Excluding sales charges | 43.77% | 12.43% | 11.94% | — | ||||||||||
Including sales charges | 35.85% | 11.16% | 11.31% | — | ||||||||||
|
|
|
|
|
|
|
| |||||||
Class C | ||||||||||||||
Excluding contingent deferred sales charges | 42.70% | 11.59% | 11.11% | — | ||||||||||
Including contingent deferred sales charges | 41.70% | 11.59% | 11.11% | — | ||||||||||
|
|
|
|
|
|
|
| |||||||
Institutional | 44.27% | 12.86% | 12.38% | — | ||||||||||
|
|
|
|
|
|
|
| |||||||
Service | 43.57% | 12.30% | 11.82% | — | ||||||||||
|
|
|
|
|
|
|
| |||||||
Investor | 44.11% | 12.71% | 12.22% | — | ||||||||||
|
|
|
|
|
|
|
| |||||||
Class R6 (Commenced July 31, 2015) | 44.33% | 12.87% | N/A | 10.15% | ||||||||||
|
|
|
|
|
|
|
| |||||||
Class R | 43.41% | 12.15% | 11.66% | — | ||||||||||
|
|
|
|
|
|
|
| |||||||
Class P (Commenced April 17, 2018) | 44.30% | N/A | N/A | 13.99% | ||||||||||
|
|
|
|
|
|
|
|
| * | These returns assume reinvestment of all distributions at NAV and reflect a maximum initial sales charge of 5.50% for Class A Shares and the assumed contingent deferred sales charge for Class C Shares (1% if redeemed within 12 months of purchase). Because Institutional, Service, Investor, Class P, Class R and Class R6 Shares do not involve a sales charge, such a charge is not applied to their Average Annual Total Return. |
22
PORTFOLIO RESULTS
Goldman Sachs Small Cap Value Fund
Portfolio Composition
The Fund invests, under normal circumstances, at least 80% of its net assets (plus any borrowings for investment purposes) (“Net Assets”) in a diversified portfolio of equity investments in small-cap issuers with public stock market capitalizations within the range of the market capitalization of companies constituting the Russell 2000® Value Index at the time of investment. Under normal circumstances, the Fund’s investment horizon for ownership of stocks will be two to three years. The Fund seeks its investment objective of long-term capital appreciation by investing in value opportunities that the Investment Adviser defines as companies with identifiable competitive advantages whose intrinsic value is not reflected in the stock price. Although the Fund will invest primarily in publicly traded U.S. securities, it may invest up to 25% of its Net Assets in foreign securities, including securities of issuers in emerging countries and securities quoted in foreign currencies. The Fund may also invest in the aggregate up to 20% of its Net Assets in companies with public stock market capitalizations outside the range of companies constituting the Russell 2000® Value Index at the time of investment and in fixed income securities, such as government, corporate and bank debt obligations.
Portfolio Management Discussion and Analysis
Below, the Goldman Sachs Small Cap Value Team discusses the Goldman Sachs Small Cap Value Fund’s (the “Fund”) performance and positioning for the 12-month period ended August 31, 2021 (the “Reporting Period”).
| Q | How did the Fund perform during the Reporting Period? |
| A | During the Reporting Period, the Fund’s Class A, Class C, Institutional, Service, Investor, Class R6, Class R and Class P Shares generated average annual total returns, without sales charges, of 49.77%, 48.69%, 50.29%, 49.53%, 50.14%, 50.31%, 49.39% and 50.28%, respectively. These returns compare to the 59.49% average annual total return of the Fund’s benchmark, the Russell 2000® Value Index (with dividends reinvested) (the “Russell Index”), during the same period. |
| Q | What key factors were responsible for the Fund’s performance during the Reporting Period? |
| A | The Fund generated robust double-digit absolute gains but underperformed the Russell Index on a relative basis during the Reporting Period due primarily to stock selection. Sector allocation as a whole also detracted from the Fund’s relative performance, albeit more modestly. |
| Q | Which equity market sectors most significantly affected Fund performance? |
| A | Weak stock selection in the financials, real estate and communication services sectors detracted most from the Fund’s performance relative to the Russell Index. Having an underweight to communication services, which outperformed the Russell Index during the Reporting Period, also hurt. The only two sectors to contribute positively to the Fund’s relative results during the Reporting Period were health care and consumer staples, where stock selection proved effective. |
| Q | Which stocks detracted significantly from the Fund’s performance during the Reporting Period? |
| A | Detracting most from the Fund’s results relative to the Russell Index were positions in insurance holding company Palomar Holdings, data center real estate investment trust CyrusOne and industrial properties manager Terreno Realty. |
Shares of Palomar Holdings fell as the risk profile of the company, which provides specialty insurance solutions, including for earthquakes and floods, shifted following the weather-related catastrophe exposure the insurer incurred during the Reporting Period. The heightened exposure changed the insurer’s earnings profile from one with relatively predictable earnings to more volatile results. In turn, we decided to exit the Fund’s position in Palomar Holdings. |
After reporting relatively strong results, it came as a surprise to many investors that CyrusOne’s recently hired Chief Executive Officer would be leaving the company, driving a decline in the real estate investment trust’s share price. We opted to sell the Fund’s position in CyrusOne after this announcement. |
For no apparent fundamental reason, Terreno Realty’s shares lagged the Russell Index during the Reporting Period and thus detracted from the Fund’s relative results. That being said, at the end of the Reporting Period, we remained |
23
PORTFOLIO RESULTS
| optimistic in the company as it continued to grow its cash flows and expand its real estate portfolio. |
| Q | What were some of the Fund’s best-performing individual stocks? |
| A | The Fund benefited most relative to the Russell Index from positions in consumer retail company Crocs, oil and natural gas company ChampionX and agriculture commodities company Darling Ingredients. |
Shares of Crocs performed well during the Reporting Period, led by strong sales and earnings that beat consensus expectations in both the first and second quarters of 2021. In addition to the solid results, the company raised its fiscal year 2021 sales and margin guidance. At the end of the Reporting Period, we continued to be impressed with Crocs’ management’s ability to execute on its strategic plan and believed creative and thoughtful marketing and merchandising may well result in ongoing success for the brand. |
In part due to merger synergies, ChampionX generated strong free cash flows and reduced debt levels during the Reporting Period. As a result, the company delivered strong results during the Reporting Period despite a difficult operating environment that included significant raw material cost inflation. At the end of the Reporting Period, we remained optimistic about ChampionX, as it remained, in our view, focused on generating returns and free cash flows. |
Darling Ingredients delivered second quarter 2021 results that were meaningfully above consensus expectations, and its management provided guidance through 2022 that underscored their confidence in the business. We exited the Fund’s position in Darling Ingredients as the company grew beyond the capitalization criteria of the portfolio. |
| Q | How did the Fund use derivatives and similar instruments during the Reporting Period? |
| A | During the Reporting Period, we did not use derivatives as part of an active management strategy. |
| Q | Did the Fund make any significant purchases or sales during the Reporting Period? |
| During the Reporting Period, we initiated a Fund position in supply chain solutions company WESCO International. The company provides logistics expertise and systems capabilities globally. We believe WESCO International should potentially benefit from increased cloud-based computing and the need for enhanced broadband capabilities across markets. |
We established a Fund position in residential thermal and security solutions provider Resideo Technologies. We were positive, at the time of purchase, on the company’s strategic positioning within the home solutions market and saw long-term growth potential for its “smart home” technologies. |
Conversely, in addition to those sales mentioned earlier, we exited the Fund’s position in utilities company PNM Resources, reallocating proceeds to what we saw as better risk/reward opportunities. |
| Q | Were there any changes to the Fund’s portfolio management team during the Reporting Period? |
| A | There were no changes to the Fund’s portfolio management team during the Reporting Period. |
| Q | Were there any notable changes in the Fund’s weightings during the Reporting Period? |
| A | In constructing the Fund’s portfolio, we focus on picking stocks rather than on making industry or sector bets. We seek to outpace the benchmark index by overweighting stocks that we expect to outperform and underweighting those that we think may lag. Consequently, changes in its sector weights are generally the direct result of individual stock selection or of stock appreciation or depreciation. That said, during the Reporting Period, the Fund’s allocations compared to the Russell Index in energy and industrials increased, and its allocations compared to the Russell Index in consumer discretionary and health care decreased. |
| Q | How was the Fund positioned relative to its benchmark index at the end of August 2021? |
| A | At the end of August 2021, the Fund was overweight compared to the Russell Index in industrials, was underweight compared to the Russell Index in health care and was rather neutrally weighted to the remaining nine sectors in the Russell Index. |
24
FUND BASICS
Small Cap Value Fund
as of August 31, 2021
| TOP 10 HOLDINGS AS OF 8/31/211 | ||||||||||
| Holding | % of Net Assets | Line of Business | Country | |||||||
| Avient Corp. | 1.3 | % | Chemicals | United States | ||||||
| Rexnord Corp. | 1.2 | Machinery | United States | |||||||
| WESCO International, Inc. | 1.0 | Trading Companies & Distributors | United States | |||||||
| Tenet Healthcare Corp. | 1.0 | Health Care Providers & Services | United States | |||||||
| Resideo Technologies, Inc. | 0.9 | Building Products | United States | |||||||
| KBR, Inc. | 0.9 | Professional Services | United States | |||||||
| Healthcare Realty Trust, Inc. REIT | 0.9 | Equity Real Estate Investment Trusts (REITs) | United States | |||||||
| PennyMac Mortgage Investment Trust REIT | 0.8 | Mortgage Real Estate Investment Trusts (REITs) | United States | |||||||
| Highwoods Properties, Inc. REIT | 0.8 | Equity Real Estate Investment Trusts (REITs) | United States | |||||||
| Pebblebrook Hotel Trust REIT | 0.8 | Equity Real Estate Investment Trusts (REITs) | United States | |||||||
| 1 | The top 10 holdings may not be representative of the Fund’s future investments. |
| FUND VS. BENCHMARK SECTOR ALLOCATIONS2 |
| As of August 31, 2021 |
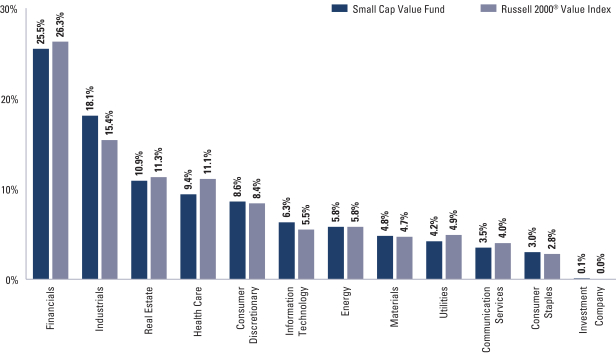
| 2 | The Fund is actively managed and, as such, its composition may differ over time. Consequently, the Fund’s overall sector allocations may differ from the percentages contained in the graph above. Figures in the above graph may not sum to 100% due to the exclusion of other assets and liabilities. The graph categorizes investments using the Global Industry Classification Standard (“GICS”), however, the sector classifications used by the portfolio management team may differ from GICS. Underlying sector allocations of Exchange Traded Funds held by the Fund (if any) are not reflected in the graph above. The percentage shown for each investment category reflects the value of investments in that category as a percentage of market value (excluding investments in the securities lending reinvestment vehicle, if any). Investments in the securities lending reinvestment vehicle represented 0.55% of the Fund’s net assets as of August 31, 2021. The graph depicts the Fund’s investments but may not represent the Fund’s market exposure due to the exclusion of certain derivatives, if any, as listed in the Additional Investment Information section of the Schedule of Investments. |
For more information about the Fund, please refer to www.GSAMFUNDS.com. There, you can learn more about the Fund’s investment strategies, holdings, and performance.
25
GOLDMAN SACHS SMALL CAP VALUE FUND
Performance Summary
August 31, 2021
The following graph shows the value, as of August 31, 2021, of a $1,000,000 investment made on September 1, 2011 in Institutional Shares at NAV. For comparative purposes, the performance of the Fund’s benchmark, the Russell 2000® Value Index (with dividends reinvested), is shown. Performance reflects applicable fee waivers and/or expense limitations in effect during the periods shown and in their absence, performance would be reduced. Returns do not reflect the deduction of taxes that a shareholder would pay on Fund distributions or the redemption of Fund shares. The returns set forth below represent past performance. Past performance does not guarantee future results. The Fund’s investment return and principal value will fluctuate so that an investor’s shares, when redeemed, may be worth more or less than their original cost. Current performance may be lower or higher than the performance quoted below. Please visit our web site at www.GSAMFUNDS.com to obtain the most recent month-end returns.
| Small Cap Value Fund’s 10 Year Performance |
Performance of a $1,000,000 Investment, including any applicable sales charges, with distributions reinvested, from September 1, 2011 through August 31, 2021.
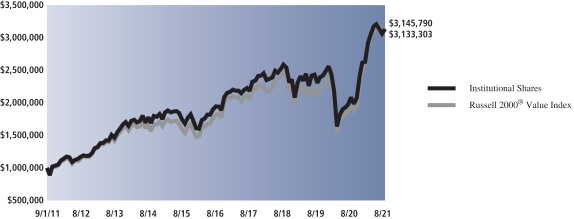
| Average Annual Total Return through August 31, 2021* | One Year | Five Years | Ten Years | Since Inception | ||||||||||
Class A | ||||||||||||||
Excluding sales charges | 49.77% | 9.56% | 11.65% | — | ||||||||||
Including sales charges | 41.54% | 8.33% | 11.02% | — | ||||||||||
|
|
|
|
|
|
|
| |||||||
Class C | ||||||||||||||
Excluding contingent deferred sales charges | 48.69% | 8.75% | 10.82% | — | ||||||||||
Including contingent deferred sales charges | 47.69% | 8.75% | 10.82% | — | ||||||||||
|
|
|
|
|
|
|
| |||||||
Institutional | 50.29% | 9.98% | 12.09% | — | ||||||||||
|
|
|
|
|
|
|
| |||||||
Service | 49.53% | 9.43% | 11.53% | — | ||||||||||
|
|
|
|
|
|
|
| |||||||
Investor | 50.14% | 9.84% | 11.93% | — | ||||||||||
|
|
|
|
|
|
|
| |||||||
Class R6 (Commenced July 31, 2015) | 50.31% | 9.99% | N/A | 9.11% | ||||||||||
|
|
|
|
|
|
|
| |||||||
Class R | 49.39% | 9.29% | 11.37% | — | ||||||||||
|
|
|
|
|
|
|
| |||||||
Class P (Commenced April 17, 2018) | 50.28% | N/A | N/A | 7.91% | ||||||||||
|
|
|
|
|
|
|
|
| * | These returns assume reinvestment of all distributions at NAV and reflect a maximum initial sales charge of 5.50% for Class A Shares and the assumed contingent deferred sales charge for Class C Shares (1% if redeemed within 12 months of purchase). Because Institutional, Service, Investor, Class P, Class R and Class R6 Shares do not involve a sales charge, such a charge is not applied to their Average Annual Total Return. |
26
PORTFOLIO RESULTS
Goldman Sachs Small/Mid Cap Value Fund
Portfolio Composition
The Fund’s investment objective is to seek long-term capital appreciation. The Fund invests, under normal circumstances, at least 80% of its net assets plus any borrowings for investment purposes (measured at time of purchase) in a diversified portfolio of equity investments in small- and mid-cap issuers with public stock market capitalizations within the range of the market capitalization of companies constituting the Russell 2000® Value Index and the Russell Midcap Value Index, respectively, at the time of investment. As of September 30, 2020, the capitalization range of the companies in these indexes was between $33 million and $37.287 billion. Under normal circumstances, the Fund’s investment horizon for ownership of stocks will be two to three years. Although the Fund will invest primarily in publicly traded U.S. securities, it may also invest in foreign securities, including securities of issuers in emerging countries and securities quoted in foreign currencies. The Fund may invest in companies with public stock market capitalizations outside the range of companies constituting the Russell 2000® Value Index and the Russell Midcap Value Index at the time of investment and in fixed income securities, such as government, corporate and bank debt obligations.
Portfolio Management Discussion and Analysis
Below, the Goldman Sachs Small Cap Value Team discusses the Goldman Sachs Small/Mid Cap Value Fund’s (the “Fund”) performance and positioning for the 12-month period ended August 31, 2021 (the “Reporting Period”).
| Q | How did the Fund perform during the Reporting Period? |
| A | During the Reporting Period, the Fund’s Class A, Class C, Institutional, Investor, Class R6, Class R and Class P Shares generated average annual total returns, without sales charges, of 50.62%, 49.46%, 51.16%, 50.98%, 51.12%, 50.17% and 51.04%, respectively. These returns compare to the 52.51% average annual total return of the Fund’s benchmark, the Russell 2500® Value Index (with dividends reinvested) (the “Russell Index”), during the same period. |
| Q | What key factors were responsible for the Fund’s performance during the Reporting Period? |
| A | The Fund posted robust double-digit absolute gains but modestly underperformed the Russell Index on a relative basis during the Reporting Period due to both stock selection and sector allocation overall. |
| Q | Which equity market sectors most significantly affected Fund performance? |
| A | Challenging stock selection in the financials, real estate and information technology sectors detracted most from the Fund’s performance relative to the Russell Index. Partially offsetting these detractors was effective stock selection in the consumer discretionary, health care and industrials sectors, which contributed positively. |
| Q | Which stocks detracted significantly from the Fund’s performance during the Reporting Period? |
| A | Detracting most from the Fund’s results relative to the Russell Index were positions in data center real estate investment trust CyrusOne, residential and commercial building products manufacturer AZEK Company and Texas-based gas utilities company Atmos Energy. |
After reporting relatively strong results, it came as a surprise to many investors that CyrusOne’s recently hired Chief Executive Officer would be leaving the company, driving a decline in the real estate investment trust’s share price. We opted to sell the Fund’s position in CyrusOne after this announcement. |
Shares of AZEK Company lagged the Russell Index during the Reporting Period as the ongoing impact of inflation and the company’s capacity expansion plans proved to be near-term headwinds to its margins. Still, at the end of the Reporting Period, we remained optimistic on the company, as it appears to us it continues to improve its margins and capitalize on the strong demand for its products. |
Shares of Atmos Energy were relatively flat during the Reporting Period, reflecting general uncertainty in the company. Given this broad uncertainty, we exited the Fund’s position in Atmos Energy in May 2021. |
27
PORTFOLIO RESULTS
| Q | What were some of the Fund’s best-performing individual stocks? |
| A | The Fund benefited most relative to the Russell Index from positions in consumer retail company Crocs, specialty retailer Bath & Body Works and banking company Pinnacle Financial Partners. |
Shares of Crocs performed well during the Reporting Period, led by strong sales and earnings that beat consensus expectations in both the first and second quarters of 2021. In addition to the solid results, the company raised its fiscal year 2021 sales and margin guidance. At the end of the Reporting Period, we continued to be impressed with Crocs’ management’s ability to execute on its strategic plan and believed creative and thoughtful marketing and merchandising may well result in ongoing success for the brand. |
Bath & Body Works was a new purchase for the Fund during the Reporting Period. Following the initiation of the Fund’s position in the company in January 2021, its shares appreciated as Bath & Body Works delivered record top-line sales, driven by growth across categories. With this momentum, the company also realized benefits from its profit improvement plans and permanent store closures. At the end of the Reporting Period, we remained optimistic on the company, as we believed it continues to grow and execute on its business initiatives. |
Banking company Pinnacle Financial Partners’ shares rallied in late October 2020 after the company reported strong third calendar quarter earnings. Its earnings reports also yielded favorable results in the fourth quarter of 2020 and first quarter of 2021. More specifically, the company delivered strong revenues across both fees and net interest. In addition to a strong top line, lower provisions and well-controlled expenses relative to revenue contributed to above-consensus expectations for earnings. At the end of the Reporting Period, we believed the company’s management team would both execute and create value for shareholders going forward and guide it to take market share, as we saw potential normalization in commercial loan demand. |
| Q | How did the Fund use derivatives and similar instruments during the Reporting Period? |
| A | During the Reporting Period, we did not use derivatives as part of an active management strategy. |
| Q | Did the Fund make any significant purchases or sales during the Reporting Period? |
| A | In addition to the purchase of Bath & Body Works, mentioned earlier, we initiated a Fund position in biopharmaceutical development and commercialization services company Syneos Health. We are optimistic about the company’s ability to perform amid favorable demand and trial environments across segments. |
We established a Fund position in energy company Devon Energy. In addition to broad energy sector tailwinds during the Reporting Period, we believe its balance sheet is in a strong position going forward, opening opportunities for greater payout of free cash flows in the form of dividends. Overall, we also remain optimistic about the company’s ability to drive return for shareholders. |
Conversely, in addition to the sale of Cyrus One mentioned earlier, we exited the Fund’s position in real estate development company Duke Realty. As the company continues to grow, we sold the position and reallocated the proceeds to what we felt were better risk/reward opportunities elsewhere. |
| Q | Were there any changes to the Fund’s portfolio management team during the Reporting Period? |
| A | There were no changes to the Fund’s portfolio management team during the Reporting Period. |
| Q | Were there any notable changes in the Fund’s weightings during the Reporting Period? |
| A | In constructing the Fund’s portfolio, we focus on picking stocks rather than on making industry or sector bets. We seek to outpace the benchmark index by overweighting stocks that we expect to outperform and underweighting those that we think may lag. Consequently, changes in its sector weights are generally the direct result of individual stock selection or of stock appreciation or depreciation. That said, during the Reporting Period, the Fund’s allocations compared to the Russell Index in consumer discretionary, energy and materials increased, and its allocations compared to the Russell Index in industrials and real estate decreased. |
| Q | How was the Fund positioned relative to its benchmark index at the end of August 2021? |
| A | At the end of August 2021, the Fund had an overweight position compared to the Russell Index in consumer discretionary and was rather neutrally weighted in the remaining ten sectors of the Russell Index. |
28
FUND BASICS
Small/Mid Cap Value Fund
as of August 31, 2021
| TOP 10 HOLDINGS AS OF 8/31/211 | ||||||||||
| Holding | % of Net Assets | Line of Business | Country | |||||||
| Avient Corp. | 1.2 | % | Chemicals | United States | ||||||
| Quanta Services, Inc. | 1.2 | Construction & Engineering | United States | |||||||
| Highwoods Properties, Inc. REIT | 1.2 | Equity Real Estate Investment Trusts (REITs) | United States | |||||||
| Hill-Rom Holdings, Inc. | 1.1 | Health Care Equipment & Supplies | United States | |||||||
| Syneos Health, Inc. | 1.1 | Life Sciences Tools & Services | United States | |||||||
| Rexnord Corp. | 1.1 | Machinery | United States | |||||||
| Devon Energy Corp. | 1.1 | Oil, Gas & Consumable Fuels | United States | |||||||
| PerkinElmer, Inc. | 1.0 | Life Sciences Tools & Services | United States | |||||||
| Equity LifeStyle Properties, Inc. REIT | 1.0 | Equity Real Estate Investment Trusts (REITs) | United States | |||||||
| Crown Holdings, Inc. | 1.0 | Containers & Packaging | United States | |||||||
| 1 | The top 10 holdings may not be representative of the Fund’s future investments. |
| FUND VS. BENCHMARK SECTOR ALLOCATIONS2 |
| As of August 31, 2021 |
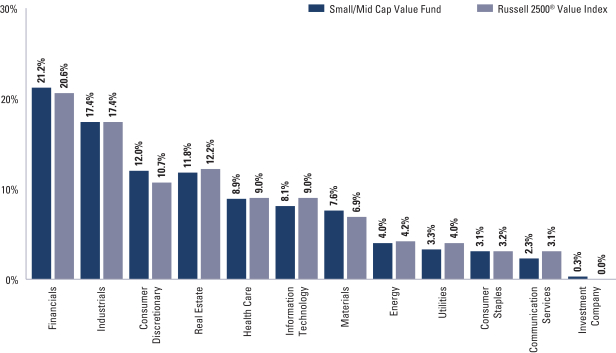
| 2 | The Fund is actively managed and, as such, its composition may differ over time. Consequently, the Fund’s overall sector allocations may differ from the percentages contained in the graph above. Figures in the above graph may not sum to 100% due to the exclusion of other assets and liabilities. The graph categorizes investments using the Global Industry Classification Standard (“GICS”); however, the sector classifications used by the portfolio management team may differ from GICS. The percentage shown for each investment category reflects the value of investments in that category as a percentage of market value (excluding investments in the securities lending reinvestment vehicle, if any). Investments in the securities lending reinvestment vehicle represented 0.34% of the Fund’s net assets as of August 31, 2021. The graph depicts the Fund’s investments but may not represent the Fund’s market exposure due to the exclusion of certain derivatives, if any, as listed in the Additional Investment Information section of the Schedule of Investments. |
For more information about the Fund, please refer to www.GSAMFUNDS.com. There, you can learn more about the Fund’s investment strategies, holdings, and performance.
29
GOLDMAN SACHS SMALL/MID CAP VALUE FUND
Performance Summary
August 31, 2021
The following graph shows the value, as of August 31, 2021, of a $1,000,000 investment made on January 31, 2014 (commencement of operations) in Institutional Shares at NAV. For comparative purposes, the performance of the Fund’s benchmark, the Russell 2500® Value Index (with dividends reinvested), is shown. Performance reflects applicable fee waivers and/or expense limitations in effect during the periods shown and in their absence, performance would be reduced. Returns do not reflect the deduction of taxes that a shareholder would pay on Fund distributions or the redemption of Fund shares. The returns set forth below represent past performance. Past performance does not guarantee future results. The Fund’s investment return and principal value will fluctuate so that an investor’s shares, when redeemed, may be worth more or less than their original cost. Current performance may be lower or higher than the performance quoted below. Please visit our web site at www.GSAMFUNDS.com to obtain the most recent month-end returns.
| Small/Mid Cap Value Fund’s Lifetime Performance |
Performance of a $1,000,000 Investment, including any applicable sales charges, with distributions reinvested, from January 31, 2014 through August 31, 2021.
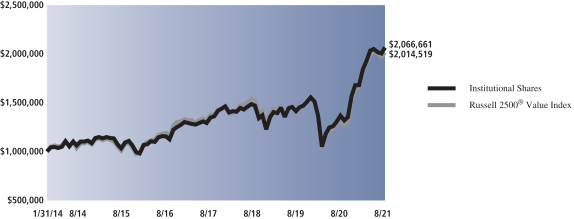
| Average Annual Total Return through August 31, 2021* | One Year | Five Years | Since Inception | |||||||
Class A (Commenced January 31, 2014) | ||||||||||
Excluding sales charges | 50.62% | 11.84% | 9.58% | |||||||
Including sales charges | 42.33% | 10.58% | 8.77% | |||||||
| ||||||||||
Class C (Commenced January 31, 2014) | ||||||||||
Excluding contingent deferred sales charges | 49.46% | 11.00% | 8.78% | |||||||
Including contingent deferred sales charges | 48.46% | 11.00% | 8.78% | |||||||
| ||||||||||
Institutional (Commenced January 31, 2014) | 51.16% | 12.26% | 10.04% | |||||||
| ||||||||||
Investor (Commenced January 31, 2014) | 50.98% | 12.11% | 9.86% | |||||||
| ||||||||||
Class R6 (Commenced July 31, 2015) | 51.12% | 12.28% | 10.35% | |||||||
| ||||||||||
Class R (Commenced January 31, 2014) | 50.17% | 11.55% | 9.32% | |||||||
| ||||||||||
Class P (Commenced April 17, 2018) | 51.04% | N/A | 11.39% | |||||||
| ||||||||||
| * | These returns assume reinvestment of all distributions at NAV and reflect a maximum initial sales charge of 5.50% for Class A Shares and the assumed contingent deferred sales charge for Class C Shares (1% if redeemed within 12 months of purchase). Because Institutional, Investor, Class P, Class R and Class R6 Shares do not involve a sales charge, such a charge is not applied to their Average Annual Total Return. |
30
GOLDMAN SACHS EQUITY INCOME FUND
August 31, 2021
| Shares | Description | Value | ||||||
| Common Stocks – 99.5% | ||||||||
| Aerospace & Defense – 1.5% | ||||||||
| 28,114 | L3Harris Technologies, Inc. | $ | 6,550,843 | |||||
|
| |||||||
| Banks – 9.8% | ||||||||
| 252,847 | Bank of America Corp. | 10,556,362 | ||||||
| 110,393 | JPMorgan Chase & Co. | 17,657,360 | ||||||
| 44,689 | M&T Bank Corp. | 6,256,907 | ||||||
| 130,750 | Truist Financial Corp. | 7,460,595 | ||||||
|
| |||||||
| 41,931,224 | ||||||||
|
| |||||||
| Beverages – 2.1% | ||||||||
| 121,362 | Coca-Cola Co. (The) | 6,833,894 | ||||||
| 33,453 | Coca-Cola Europacific Partners PLC (United Kingdom) | 1,931,576 | ||||||
|
| |||||||
| 8,765,470 | ||||||||
|
| |||||||
| Biotechnology – 0.8% | ||||||||
| 15,654 | Amgen, Inc. | 3,530,447 | ||||||
|
| |||||||
| Capital Markets – 3.4% | ||||||||
| 6,879 | BlackRock, Inc. | 6,488,892 | ||||||
| 50,854 | Morgan Stanley | 5,310,683 | ||||||
| 24,706 | Singapore Exchange Ltd. ADR (Singapore) | 2,700,860 | ||||||
|
| |||||||
| 14,500,435 | ||||||||
|
| |||||||
| Chemicals – 2.5% | ||||||||
| 16,838 | Ecolab, Inc. | 3,794,612 | ||||||
| 21,588 | Linde PLC (United Kingdom) | 6,791,369 | ||||||
|
| |||||||
| 10,585,981 | ||||||||
|
| |||||||
| Commercial Services & Supplies – 1.6% | ||||||||
| 53,874 | Republic Services, Inc. | 6,687,380 | ||||||
|
| |||||||
| Communications Equipment – 2.8% | ||||||||
| 167,781 | Cisco Systems, Inc. | 9,902,435 | ||||||
| 72,804 | Juniper Networks, Inc. | 2,109,860 | ||||||
|
| |||||||
| 12,012,295 | ||||||||
|
| |||||||
| Construction & Engineering – 0.6% | ||||||||
| 91,715 | Vinci SA ADR (France) | 2,455,211 | ||||||
|
| |||||||
| Consumer Finance – 1.1% | ||||||||
| 28,173 | American Express Co. | 4,675,591 | ||||||
|
| |||||||
| Containers & Packaging – 1.4% | ||||||||
| 101,514 | International Paper Co. | 6,099,976 | ||||||
|
| |||||||
| Diversified Telecommunication Services – 2.2% | ||||||||
| 339,708 | AT&T, Inc. | 9,314,793 | ||||||
|
| |||||||
| Electric Utilities – 2.9% | ||||||||
| 107,380 | NextEra Energy, Inc. | 9,018,846 | ||||||
| 50,024 | Xcel Energy, Inc. | 3,439,150 | ||||||
|
| |||||||
| 12,457,996 | ||||||||
|
| |||||||
| Electrical Equipment – 2.2% | ||||||||
| 54,860 | Eaton Corp. PLC | 9,236,230 | ||||||
|
| |||||||
| Electronic Equipment, Instruments & Components – 1.1% | ||||||||
| 30,350 | TE Connectivity Ltd. | 4,559,177 | ||||||
|
| |||||||
| Common Stocks – (continued) | ||||||||
| Equity Real Estate Investment Trusts (REITs) – 6.8% | ||||||||
| 23,050 | Alexandria Real Estate Equities, Inc. REIT | 4,756,828 | ||||||
| 10,333 | American Tower Corp. REIT | 3,018,993 | ||||||
| 29,151 | AvalonBay Communities, Inc. REIT | 6,692,487 | ||||||
| 18,333 | Boston Properties, Inc. REIT | 2,071,446 | ||||||
| 70,703 | Duke Realty Corp. REIT | 3,712,614 | ||||||
| 91,698 | Healthpeak Properties, Inc. REIT | 3,301,128 | ||||||
| 105,170 | Hudson Pacific Properties, Inc. REIT | 2,774,385 | ||||||
| 46,093 | Ventas, Inc. REIT | 2,578,442 | ||||||
|
| |||||||
| 28,906,323 | ||||||||
|
| |||||||
| Food & Staples Retailing – 0.8% | ||||||||
| 22,506 | Walmart, Inc. | 3,333,139 | ||||||
|
| |||||||
| Food Products – 3.4% | ||||||||
| 35,816 | Archer-Daniels-Midland Co. | 2,148,960 | ||||||
| 69,697 | General Mills, Inc. | 4,029,184 | ||||||
| 35,891 | McCormick & Co., Inc. | 3,097,034 | ||||||
| 81,989 | Mondelez International, Inc., Class A | 5,089,057 | ||||||
|
| |||||||
| 14,364,235 | ||||||||
|
| |||||||
| Health Care Equipment & Supplies – 3.7% | ||||||||
| 84,409 | Medtronic PLC | 11,266,913 | ||||||
| 30,229 | Zimmer Biomet Holdings, Inc. | 4,547,953 | ||||||
|
| |||||||
| 15,814,866 | ||||||||
|
| |||||||
| Health Care Providers & Services – 3.9% | ||||||||
| 82,196 | CVS Health Corp. | 7,100,912 | ||||||
| 23,185 | UnitedHealth Group, Inc. | 9,651,220 | ||||||
|
| |||||||
| 16,752,132 | ||||||||
|
| |||||||
| Hotels, Restaurants & Leisure – 3.2% | ||||||||
| 26,442 | McDonald’s Corp. | 6,278,917 | ||||||
| 23,700 | Starbucks Corp. | 2,784,513 | ||||||
| 35,086 | Yum! Brands, Inc. | 4,597,319 | ||||||
|
| |||||||
| 13,660,749 | ||||||||
|
| |||||||
| Household Products – 3.6% | ||||||||
| 17,919 | Clorox Co. (The) | 3,011,288 | ||||||
| 33,819 | Kimberly-Clark Corp. | 4,660,597 | ||||||
| 54,721 | Procter & Gamble Co. (The) | 7,791,723 | ||||||
|
| |||||||
| 15,463,608 | ||||||||
|
| |||||||
| Industrial Conglomerates – 1.7% | ||||||||
| 30,706 | Honeywell International, Inc. | 7,121,028 | ||||||
|
| |||||||
| Insurance – 3.7% | ||||||||
| 32,018 | Chubb Ltd. | 5,888,751 | ||||||
| 29,941 | Marsh & McLennan Cos., Inc. | 4,706,725 | ||||||
| 82,037 | MetLife, Inc. | 5,086,294 | ||||||
|
| |||||||
| 15,681,770 | ||||||||
|
| |||||||
| IT Services – 4.3% | ||||||||
| 14,069 | Accenture PLC, Class A | 4,735,063 | ||||||
| 49,156 | Cognizant Technology Solutions Corp., Class A | 3,751,094 | ||||||
|
| |||||||
| The accompanying notes are an integral part of these financial statements. | 31 |
GOLDMAN SACHS EQUITY INCOME FUND
Schedule of Investments (continued)
August 31, 2021
| Shares | Description | Value | ||||||
| Common Stocks – (continued) | ||||||||
| IT Services – (continued) | ||||||||
| 33,180 | Fidelity National Information Services, Inc. | $ | 4,239,409 | |||||
| 41,053 | International Business Machines Corp. | 5,761,378 | ||||||
|
| |||||||
| 18,486,944 | ||||||||
|
| |||||||
| Machinery – 2.7% | ||||||||
| 21,569 | Cummins, Inc. | 5,089,852 | ||||||
| 28,231 | Illinois Tool Works, Inc. | �� | 6,573,871 | |||||
|
| |||||||
| 11,663,723 | ||||||||
|
| |||||||
| Media – 0.6% | ||||||||
| 48,163 | New York Times Co. (The), Class A | 2,445,717 | ||||||
|
| |||||||
| Metals & Mining – 1.4% | ||||||||
| 81,661 | Rio Tinto PLC ADR (Australia) | 6,130,291 | ||||||
|
| |||||||
| Multiline Retail – 1.0% | ||||||||
| 17,209 | Target Corp. | 4,250,279 | ||||||
|
| |||||||
| Multi-Utilities – 4.1% | ||||||||
| 59,226 | Ameren Corp. | 5,195,305 | ||||||
| 69,625 | CMS Energy Corp. | 4,465,051 | ||||||
| 58,427 | National Grid PLC ADR (United Kingdom) | 3,791,328 | ||||||
| 30,357 | Sempra Energy | 4,018,053 | ||||||
|
| |||||||
| 17,469,737 | ||||||||
|
| |||||||
| Oil, Gas & Consumable Fuels – 4.2% | ||||||||
| 101,723 | Chevron Corp. | 9,843,735 | ||||||
| 104,580 | Devon Energy Corp. | 3,090,339 | ||||||
| 18,770 | Pioneer Natural Resources Co. | 2,809,306 | ||||||
| 48,941 | Royal Dutch Shell PLC, Class B ADR (Netherlands) | 1,926,807 | ||||||
|
| |||||||
| 17,670,187 | ||||||||
|
| |||||||
| Pharmaceuticals – 6.9% | ||||||||
| 128,763 | Bristol-Myers Squibb Co. | 8,609,094 | ||||||
| 35,442 | Eli Lilly & Co. | 9,154,314 | ||||||
| 68,254 | Johnson & Johnson | 11,816,815 | ||||||
|
| |||||||
| 29,580,223 | ||||||||
|
| |||||||
| Road & Rail – 1.0% | ||||||||
| 18,748 | Union Pacific Corp. | 4,065,316 | ||||||
|
| |||||||
| Semiconductors & Semiconductor Equipment – 3.2% | ||||||||
| 13,686 | KLA Corp. | 4,652,692 | ||||||
| 73,757 | Marvell Technology, Inc. | 4,513,191 | ||||||
| 22,633 | Texas Instruments, Inc. | 4,320,866 | ||||||
|
| |||||||
| 13,486,749 | ||||||||
|
| |||||||
| Software – 0.6% | ||||||||
| 8,684 | Microsoft Corp. | 2,621,526 | ||||||
|
| |||||||
| Specialty Retail – 1.1% | ||||||||
| 12,314 | Advance Auto Parts, Inc. | 2,497,895 | ||||||
| 6,580 | Home Depot, Inc. (The) | 2,146,264 | ||||||
|
| |||||||
| 4,644,159 | ||||||||
|
| |||||||
| Common Stocks – (continued) | ||||||||
| Technology Hardware, Storage & Peripherals – 0.5% | ||||||||
| 25,532 | NetApp, Inc. | 2,270,561 | ||||||
|
| |||||||
| Water Utilities – 1.1% | ||||||||
| 26,528 | American Water Works Co., Inc. | $ | 4,834,728 | |||||
|
| |||||||
| TOTAL COMMON STOCKS | ||||||||
| (Cost $325,693,736) | $ | 424,081,039 | ||||||
|
| |||||||
| Shares | Dividend Rate | Value | ||||||
| Investment Company – 0.2%(a) | ||||||||
| | Goldman Sachs Financial Square Government Fund – | | ||||||
| 809,595 | 0.026% | $ | 809,595 | |||||
| (Cost $809,595) | ||||||||
|
| |||||||
| TOTAL INVESTMENTS – 99.7% | ||||||||
| (Cost $326,503,331) | $ | 424,890,634 | ||||||
|
| |||||||
| | OTHER ASSETS IN EXCESS OF LIABILITIES – 0.3% | 1,243,921 | ||||||
|
| |||||||
| NET ASSETS – 100.0% | $ | 426,134,555 | ||||||
|
| |||||||
| The percentage shown for each investment category reflects the value of investments in that category as a percentage of net assets. | ||
(a) | Represents an affiliated issuer. | |
| ||||
Investment Abbreviations: | ||||
ADR | —American Depositary Receipt | |||
PLC | —Public Limited Company | |||
REIT | —Real Estate Investment Trust | |||
| ||||
| 32 | The accompanying notes are an integral part of these financial statements. |
GOLDMAN SACHS FOCUSED VALUE FUND
Schedule of Investments
August 31, 2021
| Shares | Description | Value | ||||||
| Common Stocks – 98.8% | ||||||||
| Aerospace & Defense – 2.7% | ||||||||
| 4,682 | L3Harris Technologies, Inc. | $ | 1,090,953 | |||||
|
| |||||||
| Airlines – 1.6% | ||||||||
| 14,079 | United Airlines Holdings, Inc.* | 654,814 | ||||||
|
| |||||||
| Automobiles – 2.0% | ||||||||
| 15,850 | General Motors Co.* | 776,809 | ||||||
|
| |||||||
| Banks – 10.6% | ||||||||
| 11,673 | JPMorgan Chase & Co. | 1,867,097 | ||||||
| 7,732 | M&T Bank Corp. | 1,082,557 | ||||||
| 21,885 | Truist Financial Corp. | 1,248,758 | ||||||
|
| |||||||
| 4,198,412 | ||||||||
|
| |||||||
| Beverages – 2.8% | ||||||||
| 19,619 | Coca-Cola Co. (The) | 1,104,746 | ||||||
|
| |||||||
| Capital Markets – 3.8% | ||||||||
| 1,602 | BlackRock, Inc. | 1,511,151 | ||||||
|
| |||||||
| Chemicals – 2.8% | ||||||||
| 4,848 | Ecolab, Inc. | 1,092,545 | ||||||
|
| |||||||
| Construction Materials – 2.3% | ||||||||
| 2,397 | Martin Marietta Materials, Inc. | 913,856 | ||||||
|
| |||||||
| Consumer Finance – 2.1% | ||||||||
| 5,026 | American Express Co. | 834,115 | ||||||
|
| |||||||
| Diversified Telecommunication Services – 1.8% | ||||||||
| 26,524 | AT&T, Inc. | 727,288 | ||||||
|
| |||||||
| Electric Utilities – 3.9% | ||||||||
| 18,520 | NextEra Energy, Inc. | 1,555,495 | ||||||
|
| |||||||
| Equity Real Estate Investment Trusts (REITs) – 6.2% | ||||||||
| 5,432 | Alexandria Real Estate Equities, Inc. REIT | 1,121,002 | ||||||
| 5,841 | AvalonBay Communities, Inc. REIT | 1,340,977 | ||||||
|
| |||||||
| 2,461,979 | ||||||||
|
| |||||||
| Food Products – 2.5% | ||||||||
| 15,988 | Mondelez International, Inc., Class A | 992,375 | ||||||
|
| |||||||
| Health Care Equipment & Supplies – 5.8% | ||||||||
| 25,800 | Boston Scientific Corp.* | 1,164,870 | ||||||
| 7,481 | Zimmer Biomet Holdings, Inc. | 1,125,516 | ||||||
|
| |||||||
| 2,290,386 | ||||||||
|
| |||||||
| Health Care Providers & Services – 2.9% | ||||||||
| 2,825 | Humana, Inc. | 1,145,312 | ||||||
|
| |||||||
| Household Products – 3.5% | ||||||||
| 9,637 | Procter & Gamble Co. (The) | 1,372,212 | ||||||
|
| |||||||
| Industrial Conglomerates – 4.0% | ||||||||
| 14,915 | General Electric Co. | 1,572,190 | ||||||
|
| |||||||
| Interactive Media & Services – 4.0% | ||||||||
| 552 | Alphabet, Inc., Class A* | 1,597,460 | ||||||
|
| |||||||
| IT Services – 2.9% | ||||||||
| 14,889 | Cognizant Technology Solutions Corp., Class A | 1,136,180 | ||||||
|
| |||||||
| Common Stocks – (continued) | ||||||||
| Life Sciences Tools & Services – 2.5% | ||||||||
| 5,360 | PerkinElmer, Inc. | 990,528 | ||||||
|
| |||||||
| Machinery – 2.9% | ||||||||
| 4,899 | Illinois Tool Works, Inc. | 1,140,781 | ||||||
|
| |||||||
| Media – 2.7% | ||||||||
| 17,960 | Comcast Corp., Class A | 1,089,813 | ||||||
|
| |||||||
| Metals & Mining – 1.5% | ||||||||
| 16,075 | Freeport-McMoRan, Inc. | 584,969 | ||||||
|
| |||||||
| Multi-Utilities – 2.7% | ||||||||
| 12,407 | Ameren Corp. | 1,088,342 | ||||||
|
| |||||||
| Oil, Gas & Consumable Fuels – 3.6% | ||||||||
| 8,814 | Chevron Corp. | 852,931 | ||||||
| 19,572 | Devon Energy Corp. | 578,352 | ||||||
|
| |||||||
| 1,431,283 | ||||||||
|
| |||||||
| Pharmaceuticals – 6.1% | ||||||||
| 18,301 | Bristol-Myers Squibb Co. | 1,223,605 | ||||||
| 4,595 | Eli Lilly & Co. | 1,186,842 | ||||||
|
| |||||||
| 2,410,447 | ||||||||
|
| |||||||
| Road & Rail – 2.9% | ||||||||
| 5,350 | Union Pacific Corp. | 1,160,094 | ||||||
|
| |||||||
| Semiconductors & Semiconductor Equipment – 3.5% | ||||||||
| 23,014 | Marvell Technology, Inc. | 1,408,227 | ||||||
|
| |||||||
| Software – 2.2% | ||||||||
| 5,668 | Splunk, Inc.* | 866,467 | ||||||
|
| |||||||
| TOTAL COMMON STOCKS | ||||||||
| (Cost $33,833,888) | $ | 39,199,229 | ||||||
|
| |||||||
| Shares | Dividend Rate | Value | ||||||
| Investment Company – 1.1%(a) | ||||||||
| | Goldman Sachs Financial Square Government Fund – | | ||||||
| 426,826 | 0.026% | $ | 426,826 | |||||
| (Cost $426,826) | ||||||||
|
| |||||||
| TOTAL INVESTMENTS – 99.9% | ||||||||
| (Cost $34,260,714) | $ | 39,626,055 | ||||||
|
| |||||||
| | OTHER ASSETS IN EXCESS OF LIABILITIES – 0.1% | 63,977 | ||||||
|
| |||||||
| NET ASSETS – 100.0% | $ | 39,690,032 | ||||||
|
| |||||||
| The percentage shown for each investment category reflects the value of investments in that category as a percentage of net assets. | ||
* | Non-income producing security. | |
(a) | Represents an affiliated issuer. | |
| ||||
Investment Abbreviations: | ||||
REIT | —Real Estate Investment Trust | |||
| ||||
| The accompanying notes are an integral part of these financial statements. | 33 |
GOLDMAN SACHS LARGE CAP VALUE FUND
Schedule of Investments
August 31, 2021
| Shares | Description | Value | ||||||
| Common Stocks – 98.8% | ||||||||
| Aerospace & Defense – 1.5% | ||||||||
| 33,386 | L3Harris Technologies, Inc. | $ | 7,779,272 | |||||
|
| |||||||
| Airlines – 0.9% | ||||||||
| 92,675 | United Airlines Holdings, Inc.* | 4,310,314 | ||||||
|
| |||||||
| Automobiles – 0.9% | ||||||||
| 87,979 | General Motors Co.* | 4,311,851 | ||||||
|
| |||||||
| Banks – 9.7% | ||||||||
| 338,281 | Bank of America Corp. | 14,123,232 | ||||||
| 121,212 | JPMorgan Chase & Co. | 19,387,859 | ||||||
| 46,273 | M&T Bank Corp. | 6,478,683 | ||||||
| 152,800 | Truist Financial Corp. | 8,718,768 | ||||||
|
| |||||||
| 48,708,542 | ||||||||
|
| |||||||
| Beverages – 2.3% | ||||||||
| 124,284 | Coca-Cola Co. (The) | 6,998,432 | ||||||
| 22,238 | Constellation Brands, Inc., Class A | 4,695,331 | ||||||
|
| |||||||
| 11,693,763 | ||||||||
|
| |||||||
| Biotechnology – 0.9% | ||||||||
| 6,701 | Biogen, Inc.* | 2,271,036 | ||||||
| 14,450 | BioMarin Pharmaceutical, Inc.* | 1,216,834 | ||||||
| 9,345 | Neurocrine Biosciences, Inc.* | 889,644 | ||||||
|
| |||||||
| 4,377,514 | ||||||||
|
| |||||||
| Capital Markets – 5.3% | ||||||||
| 10,403 | BlackRock, Inc. | 9,813,046 | ||||||
| 72,626 | Charles Schwab Corp. (The) | 5,290,804 | ||||||
| 107,607 | Morgan Stanley | 11,237,399 | ||||||
|
| |||||||
| 26,341,249 | ||||||||
|
| |||||||
| Chemicals – 2.1% | ||||||||
| 24,453 | Ecolab, Inc. | 5,510,728 | ||||||
| 15,871 | Linde PLC (United Kingdom) | 4,992,858 | ||||||
|
| |||||||
| 10,503,586 | ||||||||
|
| |||||||
| Commercial Services & Supplies – 1.1% | ||||||||
| 41,801 | Waste Connections, Inc. | 5,401,107 | ||||||
|
| |||||||
| Communications Equipment – 1.8% | ||||||||
| 153,833 | Cisco Systems, Inc. | 9,079,224 | ||||||
|
| |||||||
| Construction Materials – 1.3% | ||||||||
| 16,534 | Martin Marietta Materials, Inc. | 6,303,587 | ||||||
|
| |||||||
| Consumer Finance – 0.8% | ||||||||
| 24,678 | American Express Co. | 4,095,561 | ||||||
|
| |||||||
| Containers & Packaging – 0.9% | ||||||||
| 47,086 | Ball Corp. | 4,518,373 | ||||||
|
| |||||||
| Diversified Financial Services – 1.1% | ||||||||
| 18,577 | Berkshire Hathaway, Inc., Class B* | 5,308,749 | ||||||
|
| |||||||
| Diversified Telecommunication Services – 1.9% | ||||||||
| 356,449 | AT&T, Inc. | 9,773,832 | ||||||
|
| |||||||
| Electric Utilities – 3.1% | ||||||||
| 123,678 | NextEra Energy, Inc. | 10,387,715 | ||||||
| 73,036 | Xcel Energy, Inc. | 5,021,225 | ||||||
|
| |||||||
| 15,408,940 | ||||||||
|
| |||||||
| Common Stocks – (continued) | ||||||||
| Electrical Equipment – 1.1% | ||||||||
| 32,862 | Eaton Corp. PLC | 5,532,646 | ||||||
|
| |||||||
| Entertainment – 1.0% | ||||||||
| 27,791 | Walt Disney Co. (The)* | 5,038,508 | ||||||
|
| |||||||
| Equity Real Estate Investment Trusts (REITs) – 4.6% | ||||||||
| 22,465 | Alexandria Real Estate Equities, Inc. REIT | 4,636,102 | ||||||
| 24,676 | AvalonBay Communities, Inc. REIT | 5,665,116 | ||||||
| 31,845 | Boston Properties, Inc. REIT | 3,598,166 | ||||||
| 38,080 | Prologis, Inc. REIT | 5,127,853 | ||||||
| 12,326 | Public Storage REIT | 3,988,817 | ||||||
|
| |||||||
| 23,016,054 | ||||||||
|
| |||||||
| Food & Staples Retailing – 0.7% | ||||||||
| 25,225 | Walmart, Inc. | 3,735,822 | ||||||
|
| |||||||
| Food Products – 2.7% | ||||||||
| 67,305 | General Mills, Inc. | 3,890,902 | ||||||
| 41,320 | Lamb Weston Holdings, Inc. | 2,691,998 | ||||||
| 109,893 | Mondelez International, Inc., Class A | 6,821,059 | ||||||
|
| |||||||
| 13,403,959 | ||||||||
|
| |||||||
| Gas Utilities – 0.5% | ||||||||
| 25,818 | Atmos Energy Corp. | 2,517,513 | ||||||
|
| |||||||
| Health Care Equipment & Supplies – 4.3% | ||||||||
| 159,274 | Boston Scientific Corp.* | 7,191,221 | ||||||
| 60,976 | Medtronic PLC | 8,139,076 | ||||||
| 40,517 | Zimmer Biomet Holdings, Inc. | 6,095,783 | ||||||
|
| |||||||
| 21,426,080 | ||||||||
|
| |||||||
| Health Care Providers & Services – 3.0% | ||||||||
| 76,588 | CVS Health Corp. | 6,616,437 | ||||||
| 19,322 | Guardant Health, Inc.* | 2,459,111 | ||||||
| 14,399 | Humana, Inc. | 5,837,643 | ||||||
|
| |||||||
| 14,913,191 | ||||||||
|
| |||||||
| Hotels, Restaurants & Leisure – 1.7% | ||||||||
| 34,880 | McDonald’s Corp. | 8,282,605 | ||||||
|
| |||||||
| Household Products – 2.5% | ||||||||
| 88,515 | Procter & Gamble Co. (The) | 12,603,651 | ||||||
|
| |||||||
| Industrial Conglomerates – 3.4% | ||||||||
| 88,264 | General Electric Co. | 9,303,908 | ||||||
| 32,783 | Honeywell International, Inc. | 7,602,706 | ||||||
|
| |||||||
| 16,906,614 | ||||||||
|
| |||||||
| Insurance – 3.9% | ||||||||
| 33,664 | Chubb Ltd. | 6,191,483 | ||||||
| 33,447 | Globe Life, Inc. | 3,213,253 | ||||||
| 38,628 | Marsh & McLennan Cos., Inc. | 6,072,322 | ||||||
| 67,758 | MetLife, Inc. | 4,200,996 | ||||||
|
| |||||||
| 19,678,054 | ||||||||
|
| |||||||
| Interactive Media & Services – 1.7% | ||||||||
| 2,877 | Alphabet, Inc., Class A* | 8,325,894 | ||||||
|
| |||||||
| 34 | The accompanying notes are an integral part of these financial statements. |
GOLDMAN SACHS LARGE CAP VALUE FUND
| Shares | Description | Value | ||||||
| Common Stocks – (continued) | ||||||||
| IT Services – 3.6% | ||||||||
| 67,405 | Cognizant Technology Solutions Corp., Class A | $ | 5,143,675 | |||||
| 52,028 | Fidelity National Information Services, Inc. | 6,647,618 | ||||||
| 45,247 | International Business Machines Corp. | 6,349,964 | ||||||
|
| |||||||
| 18,141,257 | ||||||||
|
| |||||||
| Life Sciences Tools & Services – 2.7% | ||||||||
| 29,965 | PerkinElmer, Inc. | 5,537,532 | ||||||
| 14,334 | Thermo Fisher Scientific, Inc. | 7,954,653 | ||||||
|
| |||||||
| 13,492,185 | ||||||||
|
| |||||||
| Machinery – 1.0% | ||||||||
| 20,880 | Illinois Tool Works, Inc. | 4,862,117 | ||||||
|
| |||||||
| Media – 2.0% | ||||||||
| 164,273 | Comcast Corp., Class A | 9,968,086 | ||||||
|
| |||||||
| Metals & Mining – 0.9% | ||||||||
| 120,429 | Freeport-McMoRan, Inc. | 4,382,411 | ||||||
|
| |||||||
| Multiline Retail – 1.1% | ||||||||
| 21,468 | Target Corp. | 5,302,167 | ||||||
|
| |||||||
| Multi-Utilities – 1.6% | ||||||||
| 50,569 | Ameren Corp. | 4,435,913 | ||||||
| 58,947 | CMS Energy Corp. | 3,780,271 | ||||||
|
| |||||||
| 8,216,184 | ||||||||
|
| |||||||
| Oil, Gas & Consumable Fuels – 4.3% | ||||||||
| 92,727 | Chevron Corp. | 8,973,192 | ||||||
| 104,122 | ConocoPhillips | 5,781,895 | ||||||
| 142,279 | Devon Energy Corp. | 4,204,344 | ||||||
| 37,887 | Hess Corp. | 2,604,731 | ||||||
|
| |||||||
| 21,564,162 | ||||||||
|
| |||||||
| Pharmaceuticals – 5.8% | ||||||||
| 142,651 | Bristol-Myers Squibb Co. | 9,537,646 | ||||||
| 23,553 | Eli Lilly & Co. | 6,083,504 | ||||||
| 76,826 | Johnson & Johnson | 13,300,886 | ||||||
|
| |||||||
| 28,922,036 | ||||||||
|
| |||||||
| Road & Rail – 2.6% | ||||||||
| 21,399 | Norfolk Southern Corp. | 5,425,502 | ||||||
| 35,395 | Union Pacific Corp. | 7,675,052 | ||||||
|
| |||||||
| 13,100,554 | ||||||||
|
| |||||||
| Semiconductors & Semiconductor Equipment – 4.0% | ||||||||
| 22,965 | Cree, Inc.* | 1,951,566 | ||||||
| 10,539 | KLA Corp. | 3,582,838 | ||||||
| 95,420 | Marvell Technology, Inc. | 5,838,750 | ||||||
| 13,907 | NXP Semiconductors NV (China) | 2,991,813 | ||||||
| 30,402 | Texas Instruments, Inc. | 5,804,046 | ||||||
|
| |||||||
| 20,169,013 | ||||||||
|
| |||||||
| Software – 1.1% | ||||||||
| 34,576 | Splunk, Inc.* | 5,285,633 | ||||||
|
| |||||||
| Common Stocks – (continued) | ||||||||
| Specialty Retail – 1.4% | ||||||||
| 12,083 | O’Reilly Automotive, Inc.* | $ | 7,178,269 | |||||
|
| |||||||
| TOTAL COMMON STOCKS | ||||||||
| (Cost $372,713,613) | $ | 493,880,129 | ||||||
|
| |||||||
| Shares | Dividend Rate | Value | ||||||
| Investment Company – 1.0%(a) | ||||||||
| | Goldman Sachs Financial Square Government Fund – | | ||||||
| 5,056,208 | 0.026% | $ | 5,056,208 | |||||
| (Cost $5,056,208) | ||||||||
|
| |||||||
| TOTAL INVESTMENTS – 99.8% | ||||||||
| (Cost $377,769,821) | $ | 498,936,337 | ||||||
|
| |||||||
| | OTHER ASSETS IN EXCESS OF LIABILITIES – 0.2% | 735,181 | ||||||
|
| |||||||
| NET ASSETS – 100.0% | $ | 499,671,518 | ||||||
|
| |||||||
| The percentage shown for each investment category reflects the value of investments in that category as a percentage of net assets. | ||
* | Non-income producing security. | |
(a) | Represents an affiliated issuer. | |
| ||||
Investment Abbreviations: | ||||
PLC | —Public Limited Company | |||
REIT | —Real Estate Investment Trust | |||
| ||||
| The accompanying notes are an integral part of these financial statements. | 35 |
GOLDMAN SACHS MID CAP VALUE FUND
Schedule of Investments
August 31, 2021
| Shares | Description | Value | ||||||
| Common Stocks – 99.1% | ||||||||
| Aerospace & Defense – 1.5% | ||||||||
| 29,622 | L3Harris Technologies, Inc. | $ | 6,902,222 | |||||
| 19,765 | TransDigm Group, Inc.* | 12,006,645 | ||||||
|
| |||||||
| 18,908,867 | ||||||||
|
| |||||||
| Airlines – 1.5% | ||||||||
| 402,410 | United Airlines Holdings, Inc.* | 18,716,089 | ||||||
|
| |||||||
| Auto Components – 1.2% | ||||||||
| 98,753 | Aptiv PLC* | 15,029,219 | ||||||
|
| |||||||
| Banks – 7.1% | ||||||||
| 263,589 | Citizens Financial Group, Inc. | 11,542,562 | ||||||
| 274,448 | East West Bancorp, Inc. | 20,128,016 | ||||||
| 141,963 | M&T Bank Corp. | 19,876,240 | ||||||
| 146,504 | Pinnacle Financial Partners, Inc. | 14,199,168 | ||||||
| 29,938 | Signature Bank | 7,763,822 | ||||||
| 27,097 | SVB Financial Group* | 15,160,771 | ||||||
|
| |||||||
| 88,670,579 | ||||||||
|
| |||||||
| Beverages – 1.3% | ||||||||
| 150,379 | Coca-Cola Europacific Partners PLC (United Kingdom) | 8,682,883 | ||||||
| 37,442 | Constellation Brands, Inc., Class A | 7,905,504 | ||||||
|
| |||||||
| 16,588,387 | ||||||||
|
| |||||||
| Biotechnology – 1.2% | ||||||||
| 25,233 | Alnylam Pharmaceuticals, Inc.* | 5,082,683 | ||||||
| 50,867 | Neurocrine Biosciences, Inc.* | 4,842,539 | ||||||
| 32,470 | Seagen, Inc.* | 5,441,972 | ||||||
|
| |||||||
| 15,367,194 | ||||||||
|
| |||||||
| Building Products – 1.9% | ||||||||
| 87,381 | Allegion PLC | 12,581,990 | ||||||
| 54,468 | Trane Technologies PLC | 10,811,898 | ||||||
|
| |||||||
| 23,393,888 | ||||||||
|
| |||||||
| Capital Markets – 2.4% | ||||||||
| 187,337 | Bank of New York Mellon Corp. (The) | 10,344,749 | ||||||
| 184,955 | Carlyle Group, Inc. (The) | 9,133,078 | ||||||
| 79,115 | Raymond James Financial, Inc. | 11,068,188 | ||||||
|
| |||||||
| 30,546,015 | ||||||||
|
| |||||||
| Chemicals – 1.7% | ||||||||
| 106,189 | Ashland Global Holdings, Inc. | 9,674,880 | ||||||
| 74,867 | PPG Industries, Inc. | 11,945,030 | ||||||
|
| |||||||
| 21,619,910 | ||||||||
|
| |||||||
| Communications Equipment – 2.6% | ||||||||
| 84,609 | Motorola Solutions, Inc. | 20,663,210 | ||||||
| 687,835 | Viavi Solutions, Inc.* | 11,204,832 | ||||||
|
| |||||||
| 31,868,042 | ||||||||
|
| |||||||
| Construction Materials – 1.2% | ||||||||
| 39,497 | Martin Marietta Materials, Inc. | 15,058,231 | ||||||
|
| |||||||
| Consumer Finance – 0.7% | ||||||||
| 67,568 | Discover Financial Services | 8,663,569 | ||||||
|
| |||||||
| Common Stocks – (continued) | ||||||||
| Containers & Packaging – 3.4% | ||||||||
| 233,773 | Ball Corp. | 22,432,857 | ||||||
| 132,780 | Packaging Corp. of America | 20,142,726 | ||||||
|
| |||||||
| 42,575,583 | ||||||||
|
| |||||||
| Electric Utilities – 2.3% | ||||||||
| 253,966 | Alliant Energy Corp. | 15,438,593 | ||||||
| 199,288 | Xcel Energy, Inc. | 13,701,050 | ||||||
|
| |||||||
| 29,139,643 | ||||||||
|
| |||||||
| Electrical Equipment – 2.9% | ||||||||
| 164,562 | AMETEK, Inc. | 22,375,495 | ||||||
| 43,791 | Rockwell Automation, Inc. | 14,251,781 | ||||||
|
| |||||||
| 36,627,276 | ||||||||
|
| |||||||
| Electronic Equipment, Instruments & Components – 1.8% | ||||||||
| 80,624 | Keysight Technologies, Inc.* | 14,462,333 | ||||||
| 209,050 | Vontier Corp. | 7,603,149 | ||||||
|
| |||||||
| 22,065,482 | ||||||||
|
| |||||||
| Entertainment – 1.6% | ||||||||
| 234,441 | Live Nation Entertainment, Inc.* | 20,326,035 | ||||||
|
| |||||||
| Equity Real Estate Investment Trusts (REITs) – 10.3% | ||||||||
| 73,383 | Alexandria Real Estate Equities, Inc. REIT | 15,144,050 | ||||||
| 53,246 | AvalonBay Communities, Inc. REIT | 12,224,217 | ||||||
| 56,600 | Camden Property Trust REIT | 8,492,264 | ||||||
| 120,801 | CubeSmart REIT | 6,462,854 | ||||||
| 234,491 | Duke Realty Corp. REIT | 12,313,122 | ||||||
| 117,392 | Equity LifeStyle Properties, Inc. REIT | 9,986,537 | ||||||
| 26,644 | Essex Property Trust, Inc. REIT | 8,812,237 | ||||||
| 213,154 | Healthpeak Properties, Inc. REIT | 7,673,544 | ||||||
| 191,092 | Highwoods Properties, Inc. REIT | 8,730,993 | ||||||
| 229,346 | Invitation Homes, Inc. REIT | 9,444,468 | ||||||
| 108,320 | Kilroy Realty Corp. REIT | 7,111,208 | ||||||
| 189,240 | Ryman Hospitality Properties, Inc. REIT* | 15,720,167 | ||||||
| 73,283 | Welltower, Inc. REIT | 6,414,461 | ||||||
|
| |||||||
| 128,530,122 | ||||||||
|
| |||||||
| Food & Staples Retailing – 0.8% | ||||||||
| 197,953 | Performance Food Group Co.* | 9,941,200 | ||||||
|
| |||||||
| Food Products – 2.2% | ||||||||
| 114,739 | Lamb Weston Holdings, Inc. | 7,475,246 | ||||||
| 73,787 | McCormick & Co., Inc. | 6,367,080 | ||||||
| 510,715 | Nomad Foods Ltd. (United Kingdom)* | 13,477,769 | ||||||
|
| |||||||
| 27,320,095 | ||||||||
|
| |||||||
| Gas Utilities – 0.6% | ||||||||
| 76,437 | Atmos Energy Corp. | 7,453,372 | ||||||
|
| |||||||
| Health Care Equipment & Supplies – 2.9% | ||||||||
| 35,114 | Cooper Cos., Inc. (The) | 15,826,231 | ||||||
| 135,928 | Zimmer Biomet Holdings, Inc. | 20,450,368 | ||||||
|
| |||||||
| 36,276,599 | ||||||||
|
| |||||||
| 36 | The accompanying notes are an integral part of these financial statements. |
GOLDMAN SACHS MID CAP VALUE FUND
| Shares | Description | Value | ||||||
| Common Stocks – (continued) | ||||||||
| Health Care Providers & Services – 1.5% | ||||||||
| 78,101 | Centene Corp.* | $ | 4,918,801 | |||||
| 93,529 | Quest Diagnostics, Inc. | 14,294,037 | ||||||
|
| |||||||
| 19,212,838 | ||||||||
|
| |||||||
| Hotels, Restaurants & Leisure – 4.0% | ||||||||
| 74,387 | Expedia Group, Inc.* | 10,748,921 | ||||||
| 143,389 | Royal Caribbean Cruises Ltd.* | 11,862,572 | ||||||
| 95,489 | Wyndham Hotels & Resorts, Inc. | 6,942,050 | ||||||
| 122,511 | Wynn Resorts Ltd.* | 12,458,144 | ||||||
| 64,686 | Yum! Brands, Inc. | 8,475,807 | ||||||
|
| |||||||
| 50,487,494 | ||||||||
|
| |||||||
| Independent Power and Renewable Electricity Producers – 1.5% | ||||||||
| 503,808 | AES Corp. (The) | 12,025,897 | ||||||
| 90,862 | NextEra Energy Partners LP | 7,262,600 | ||||||
|
| |||||||
| 19,288,497 | ||||||||
|
| |||||||
| Insurance – 6.1% | ||||||||
| 8,916 | Alleghany Corp.* | 6,033,368 | ||||||
| 48,643 | American Financial Group, Inc. | 6,709,815 | ||||||
| 264,809 | Arch Capital Group Ltd.* | 10,883,650 | ||||||
| 66,989 | Arthur J Gallagher & Co. | 9,620,960 | ||||||
| 131,548 | Athene Holding Ltd., Class A* | 8,809,770 | ||||||
| 68,638 | Globe Life, Inc. | 6,594,053 | ||||||
| 6,083 | Markel Corp.* | 7,726,931 | ||||||
| 191,076 | Principal Financial Group, Inc. | 12,765,787 | ||||||
| 207,240 | Ryan Specialty Group Holdings, Inc., Class A* | 6,820,268 | ||||||
|
| |||||||
| 75,964,602 | ||||||||
|
| |||||||
| Interactive Media & Services – 0.7% | ||||||||
| 138,649 | Twitter, Inc.* | 8,942,860 | ||||||
|
| |||||||
| Life Sciences Tools & Services – 1.6% | ||||||||
| 108,974 | PerkinElmer, Inc. | 20,138,395 | ||||||
|
| |||||||
| Machinery – 4.6% | ||||||||
| 72,970 | Cummins, Inc. | 17,219,461 | ||||||
| 225,340 | Fortive Corp. | 16,645,866 | ||||||
| 40,292 | IDEX Corp. | 9,025,408 | ||||||
| 152,353 | ITT, Inc. | 14,575,611 | ||||||
|
| |||||||
| 57,466,346 | ||||||||
|
| |||||||
| Media – 2.0% | ||||||||
| 334,443 | Discovery, Inc., Class C* | 9,227,283 | ||||||
| 51,725 | Liberty Broadband Corp., Class C* | 9,896,027 | ||||||
| 132,765 | ViacomCBS, Inc., Class B | 5,503,109 | ||||||
|
| |||||||
| 24,626,419 | ||||||||
|
| |||||||
| Metals & Mining – 0.8% | ||||||||
| 259,326 | Freeport-McMoRan, Inc. | 9,436,873 | ||||||
|
| |||||||
| Multi-Utilities – 3.2% | ||||||||
| 153,358 | Ameren Corp. | 13,452,564 | ||||||
| 237,441 | CMS Energy Corp. | 15,227,091 | ||||||
| 172,228 | Public Service Enterprise Group, Inc. | 11,012,258 | ||||||
|
| |||||||
| 39,691,913 | ||||||||
|
| |||||||
| Common Stocks – (continued) | ||||||||
| Oil, Gas & Consumable Fuels – 4.3% | ||||||||
| 520,380 | Devon Energy Corp. | 15,377,229 | ||||||
| 153,661 | Diamondback Energy, Inc. | 11,853,409 | ||||||
| 185,925 | Hess Corp. | 12,782,344 | ||||||
| 95,124 | Pioneer Natural Resources Co. | 14,237,209 | ||||||
|
| |||||||
| 54,250,191 | ||||||||
|
| |||||||
| Pharmaceuticals – 1.3% | ||||||||
| 119,525 | Catalent, Inc.* | 15,590,841 | ||||||
|
| |||||||
| Professional Services – 0.7% | ||||||||
| 99,395 | Booz Allen Hamilton Holding Corp. | 8,141,444 | ||||||
|
| |||||||
| Road & Rail – 2.1% | ||||||||
| 67,454 | Old Dominion Freight Line, Inc. | 19,475,319 | ||||||
| 30,563 | Saia, Inc.* | 7,339,093 | ||||||
|
| |||||||
| 26,814,412 | ||||||||
|
| |||||||
| Semiconductors & Semiconductor Equipment – 4.0% | ||||||||
| 418,777 | Marvell Technology, Inc. | 25,624,965 | ||||||
| 56,036 | MKS Instruments, Inc. | 8,247,378 | ||||||
| 354,541 | ON Semiconductor Corp.* | 15,727,439 | ||||||
|
| |||||||
| 49,599,782 | ||||||||
|
| |||||||
| Software – 1.2% | ||||||||
| 13,420 | Paycom Software, Inc.* | 6,561,038 | ||||||
| 55,380 | Splunk, Inc.* | 8,465,941 | ||||||
|
| |||||||
| 15,026,979 | ||||||||
|
| |||||||
| Specialty Retail – 3.6% | ||||||||
| 90,945 | Advance Auto Parts, Inc. | 18,448,193 | ||||||
| 111,780 | Bath & Body Works, Inc. | 7,542,915 | ||||||
| 29,272 | Burlington Stores, Inc.* | 8,766,671 | ||||||
| 14,920 | RH* | 10,453,996 | ||||||
|
| |||||||
| 45,211,775 | ||||||||
|
| |||||||
| Textiles, Apparel & Luxury Goods – 1.0% | ||||||||
| 223,734 | Capri Holdings Ltd.* | 12,643,208 | ||||||
|
| |||||||
| Trading Companies & Distributors – 1.1% | ||||||||
| 245,969 | Fastenal Co. | 13,737,369 | ||||||
|
| |||||||
| Water Utilities – 0.7% | ||||||||
| 48,511 | American Water Works Co., Inc. | 8,841,130 | ||||||
|
| |||||||
| TOTAL COMMON STOCKS | ||||||||
| (Cost $902,237,935) | $ | 1,239,798,765 | ||||||
|
| |||||||
| The accompanying notes are an integral part of these financial statements. | 37 |
GOLDMAN SACHS MID CAP VALUE FUND
Schedule of Investments (continued)
August 31, 2021
| Shares | Dividend Rate | Value | ||||
| Investment Company – 0.8%(a) | ||||||
Goldman Sachs Financial Square Government Fund – Institutional Shares |
| |||||
| 10,084,240 | 0.026% | $ | 10,084,240 | |||
| (Cost $10,084,240) |
| |||||
| ||||||
| TOTAL INVESTMENTS – 99.9% |
| |||||
| (Cost $912,322,175) | $ | 1,249,883,005 | ||||
| ||||||
| OTHER ASSETS IN EXCESS OF LIABILITIES – 0.1% | 929,944 | |||||
| ||||||
| NET ASSETS – 100.0% | $ | 1,250,812,949 | ||||
| ||||||
| The percentage shown for each investment category reflects the value of investments in that category as a percentage of net assets. | ||
* | Non-income producing security. | |
(a) | Represents an affiliated issuer. | |
| ||||
Investment Abbreviations: | ||||
LP | —Limited Partnership | |||
PLC | —Public Limited Company | |||
REIT | —Real Estate Investment Trust | |||
| ||||
| 38 | The accompanying notes are an integral part of these financial statements. |
GOLDMAN SACHS SMALL CAP VALUE FUND
Schedule of Investments
August 31, 2021
| Shares | Description | Value | ||||||
| Common Stocks – 99.9% | ||||||||
| Aerospace & Defense – 1.0% | ||||||||
| 632,987 | AAR Corp.* | $ | 21,426,610 | |||||
| 225,222 | Ducommun, Inc.* | 11,869,199 | ||||||
| 415,370 | Kaman Corp. | 16,232,660 | ||||||
|
| |||||||
| 49,528,469 | ||||||||
|
| |||||||
| Air Freight & Logistics – 0.2% | ||||||||
| 418,977 | Air Transport Services Group, Inc.* | 11,475,780 | ||||||
|
| |||||||
| Airlines – 0.3% | ||||||||
| 80,052 | Allegiant Travel Co.* | 15,405,207 | ||||||
|
| |||||||
| Auto Components – 0.7% | ||||||||
| 616,014 | Adient PLC* | 24,233,991 | ||||||
| 540,687 | Goodyear Tire & Rubber Co. (The)* | 8,564,482 | ||||||
|
| |||||||
| 32,798,473 | ||||||||
|
| |||||||
| Automobiles – 0.1% | ||||||||
| 317,905 | Workhorse Group, Inc.*(a) | 3,118,648 | ||||||
|
| |||||||
| Banks – 15.6% | ||||||||
| 291,715 | Amalgamated Financial Corp. | 4,536,168 | ||||||
| 701,145 | Ameris Bancorp | 34,524,380 | ||||||
| 789,761 | Atlantic Union Bankshares Corp. | 29,221,157 | ||||||
| 852,614 | BancorpSouth Bank | 25,007,169 | ||||||
| 549,787 | Banner Corp. | 31,447,816 | ||||||
| 1,202,124 | Brookline Bancorp, Inc. | 17,995,796 | ||||||
| 344,131 | Cadence BanCorp | 7,402,258 | ||||||
| 844,962 | Columbia Banking System, Inc. | 30,722,818 | ||||||
| 437,185 | Community Bank System, Inc. | 32,351,690 | ||||||
| 773,532 | ConnectOne Bancorp, Inc. | 22,130,751 | ||||||
| 1,383,652 | CVB Financial Corp. | 28,171,155 | ||||||
| 738,089 | Eastern Bankshares, Inc. | 14,599,401 | ||||||
| 663,675 | FB Financial Corp. | 27,336,773 | ||||||
| 397,400 | First Financial Bankshares, Inc. | 18,924,188 | ||||||
| 696,103 | First Merchants Corp. | 28,644,639 | ||||||
| 161,756 | First of Long Island Corp. (The) | 3,429,227 | ||||||
| 349,372 | German American Bancorp, Inc. | 13,052,538 | ||||||
| 614,152 | Glacier Bancorp, Inc. | 32,709,736 | ||||||
| 496,618 | Great Western Bancorp, Inc. | 15,375,293 | ||||||
| 551,431 | Hancock Whitney Corp. | 25,343,769 | ||||||
| 553,074 | Heritage Financial Corp. | 14,075,733 | ||||||
| 967,052 | Home BancShares, Inc. | 21,420,202 | ||||||
| 311,390 | Independent Bank Corp. | 23,883,613 | ||||||
| 456,496 | Lakeland Financial Corp. | 30,315,899 | ||||||
| 999,181 | OceanFirst Financial Corp. | 21,242,588 | ||||||
| 740,596 | Pacific Premier Bancorp, Inc. | 29,594,216 | ||||||
| 519,137 | PacWest Bancorp | 22,089,279 | ||||||
| 249,291 | Pinnacle Financial Partners, Inc. | 24,161,284 | ||||||
| 716,120 | Renasant Corp. | 25,135,812 | ||||||
| 407,859 | South State Corp. | 27,970,970 | ||||||
| 524,651 | Towne Bank | 15,986,116 | ||||||
| 485,220 | TriCo Bancshares | 19,190,451 | ||||||
| 1,045,672 | United Community Banks, Inc. | 31,547,924 | ||||||
|
| |||||||
| 749,540,809 | ||||||||
|
| |||||||
| Beverages – 0.8% | ||||||||
| 2,083,409 | Primo Water Corp.(a) | 37,001,344 | ||||||
|
| |||||||
| Common Stocks – (continued) | ||||||||
| Biotechnology – 3.1% | ||||||||
| 342,726 | Agios Pharmaceuticals, Inc.* | 15,312,998 | ||||||
| 470,730 | Alkermes PLC* | 14,715,020 | ||||||
| 353,459 | Allogene Therapeutics, Inc.* | 8,429,997 | ||||||
| 275,078 | Arena Pharmaceuticals, Inc.* | 14,557,128 | ||||||
| 463,746 | Bluebird Bio, Inc.* | 8,486,552 | ||||||
| 76,237 | Blueprint Medicines Corp.* | 7,110,625 | ||||||
| 185,646 | Cytokinetics, Inc.* | 6,120,748 | ||||||
| 687,791 | Inovio Pharmaceuticals, Inc.*(a) | 5,942,514 | ||||||
| 406,589 | Invitae Corp.*(a) | 12,047,232 | ||||||
| 854,081 | Ironwood Pharmaceuticals, Inc.* | 11,188,461 | ||||||
| 137,548 | Mersana Therapeutics, Inc.* | 1,916,044 | ||||||
| 538,492 | Myriad Genetics, Inc.* | 19,267,244 | ||||||
| 245,964 | REVOLUTION Medicines, Inc.* | 7,155,093 | ||||||
| 203,178 | Turning Point Therapeutics, Inc.* | 15,648,769 | ||||||
|
| |||||||
| 147,898,425 | ||||||||
|
| |||||||
| Building Products – 1.4% | ||||||||
| 239,332 | Gibraltar Industries, Inc.* | 17,868,527 | ||||||
| 208,799 | Griffon Corp. | 5,052,936 | ||||||
| 1,397,931 | Resideo Technologies, Inc.* | 45,069,295 | ||||||
|
| |||||||
| 67,990,758 | ||||||||
|
| |||||||
| Capital Markets – 1.4% | ||||||||
| 133,231 | Hamilton Lane, Inc., Class A | 11,467,192 | ||||||
| 183,801 | Houlihan Lokey, Inc. | 16,578,850 | ||||||
| 212,359 | PJT Partners, Inc., Class A | 16,772,114 | ||||||
| 314,540 | Stifel Financial Corp. | 21,734,714 | ||||||
|
| |||||||
| 66,552,870 | ||||||||
|
| |||||||
| Chemicals – 2.3% | ||||||||
| 355,737 | Amyris, Inc.* | 5,353,842 | ||||||
| 1,234,898 | Avient Corp. | 64,325,837 | ||||||
| 184,094 | HB Fuller Co. | 12,439,231 | ||||||
| 226,805 | Kraton Corp.* | 9,553,027 | ||||||
| 1,000,623 | Tronox Holdings PLC, Class A | 21,143,164 | ||||||
|
| |||||||
| 112,815,101 | ||||||||
|
| |||||||
| Commercial Services & Supplies – 1.3% | ||||||||
| 253,583 | Brady Corp., Class A | 13,523,581 | ||||||
| 636,925 | Deluxe Corp. | 24,426,074 | ||||||
| 97,339 | UniFirst Corp. | 22,297,445 | ||||||
|
| |||||||
| 60,247,100 | ||||||||
|
| |||||||
| Communications Equipment – 0.7% | ||||||||
| 368,094 | NetScout Systems, Inc.* | 10,093,137 | ||||||
| 1,446,102 | Viavi Solutions, Inc.* | 23,557,002 | ||||||
|
| |||||||
| 33,650,139 | ||||||||
|
| |||||||
| Construction & Engineering – 1.5% | ||||||||
| 432,805 | Arcosa, Inc. | 21,995,150 | ||||||
| 282,884 | Dycom Industries, Inc.* | 21,309,652 | ||||||
| 966,711 | WillScot Mobile Mini Holdings Corp.* | 28,614,645 | ||||||
|
| |||||||
| 71,919,447 | ||||||||
|
| |||||||
| The accompanying notes are an integral part of these financial statements. | 39 |
GOLDMAN SACHS SMALL CAP VALUE FUND
Schedule of Investments (continued)
August 31, 2021
| Shares | Description | Value | ||||||
| Common Stocks – (continued) | ||||||||
| Construction Materials – 0.5% | ||||||||
| 673,094 | Summit Materials, Inc., Class A* | $ | 22,663,075 | |||||
|
| |||||||
| Consumer Finance – 1.0% | ||||||||
| 215,463 | FirstCash, Inc. | 18,463,024 | ||||||
| 452,965 | Green Dot Corp., Class A* | 23,662,892 | ||||||
| 220,074 | Oportun Financial Corp.* | 5,556,869 | ||||||
|
| |||||||
| 47,682,785 | ||||||||
|
| |||||||
| Diversified Financial Services – 0.1% | ||||||||
| 146,712 | Alerus Financial Corp. | 4,380,820 | ||||||
|
| |||||||
| Diversified Telecommunication Services – 0.6% | ||||||||
| 652,365 | Iridium Communications, Inc.* | 29,036,766 | ||||||
|
| |||||||
| Electric Utilities – 2.1% | ||||||||
| 473,728 | ALLETE, Inc. | 31,938,742 | ||||||
| 327,514 | IDACORP, Inc. | 34,503,600 | ||||||
| 415,217 | MGE Energy, Inc. | 33,441,577 | ||||||
|
| |||||||
| 99,883,919 | ||||||||
|
| |||||||
| Electronic Equipment, Instruments & Components – 1.8% | ||||||||
| 460,240 | CTS Corp. | 16,145,219 | ||||||
| 277,752 | FARO Technologies, Inc.* | 19,148,223 | ||||||
| 283,626 | Knowles Corp.* | 5,672,520 | ||||||
| 128,833 | Rogers Corp.* | 27,365,418 | ||||||
| 1,284,251 | TTM Technologies, Inc.* | 17,979,514 | ||||||
|
| |||||||
| 86,310,894 | ||||||||
|
| |||||||
| Energy Equipment & Services – 1.1% | ||||||||
| 593,428 | Cactus, Inc., Class A | 22,259,484 | ||||||
| 1,411,063 | ChampionX Corp.* | 32,920,100 | ||||||
|
| |||||||
| 55,179,584 | ||||||||
|
| |||||||
| Equity Real Estate Investment Trusts (REITs) – 10.4% | ||||||||
| 1,369,466 | Acadia Realty Trust REIT | 29,060,069 | ||||||
| 4,092,425 | DigitalBridge Group, Inc. REIT* | 28,237,732 | ||||||
| 129,911 | EastGroup Properties, Inc. REIT | 23,417,757 | ||||||
| 1,361,100 | Healthcare Realty Trust, Inc. REIT | 40,873,833 | ||||||
| 858,312 | Highwoods Properties, Inc. REIT | 39,216,275 | ||||||
| 1,400,652 | Hudson Pacific Properties, Inc. REIT | 36,949,200 | ||||||
| 470,641 | National Health Investors, Inc. REIT | 28,153,745 | ||||||
| 1,118,763 | Park Hotels & Resorts, Inc. REIT* | 21,413,124 | ||||||
| 1,778,034 | Pebblebrook Hotel Trust REIT | 39,170,089 | ||||||
| 110,776 | PS Business Parks, Inc. REIT | 17,417,310 | ||||||
| 2,006,875 | RLJ Lodging Trust REIT | 28,959,206 | ||||||
| 419,638 | Ryman Hospitality Properties, Inc. REIT* | 34,859,329 | ||||||
| 2,021,642 | Sabra Health Care REIT, Inc. REIT | 32,346,272 | ||||||
| 2,183,627 | SITE Centers Corp. REIT | 35,178,231 | ||||||
| 852,236 | STAG Industrial, Inc. REIT | 36,006,971 | ||||||
| 418,168 | Terreno Realty Corp. REIT | 27,937,804 | ||||||
|
| |||||||
| 499,196,947 | ||||||||
|
| |||||||
| Food & Staples Retailing – 1.0% | ||||||||
| 557,668 | BJ’s Wholesale Club Holdings, Inc.* | 31,597,469 | ||||||
| 53,245 | Performance Food Group Co.* | 2,673,964 | ||||||
| 443,608 | United Natural Foods, Inc.* | 16,324,774 | ||||||
|
| |||||||
| 50,596,207 | ||||||||
|
| |||||||
| Common Stocks – (continued) | ||||||||
| Food Products – 1.1% | ||||||||
| 1,526,481 | Hostess Brands, Inc.* | 24,362,637 | ||||||
| 462,957 | Simply Good Foods Co. (The)* | 16,490,528 | ||||||
| 730,205 | Utz Brands, Inc. | 14,180,581 | ||||||
|
| |||||||
| 55,033,746 | ||||||||
|
| |||||||
| Gas Utilities – 1.3% | ||||||||
| 208,042 | Chesapeake Utilities Corp. | 27,191,089 | ||||||
| 500,691 | ONE Gas, Inc. | 35,959,628 | ||||||
|
| |||||||
| 63,150,717 | ||||||||
|
| |||||||
| Health Care Equipment & Supplies – 2.7% | ||||||||
| 674,284 | Avanos Medical, Inc.* | 22,251,372 | ||||||
| 197,360 | CONMED Corp. | 25,921,262 | ||||||
| 135,780 | Figs, Inc., Class A*(a) | 5,568,338 | ||||||
| 218,866 | LivaNova PLC* | 18,098,030 | ||||||
| 405,435 | Merit Medical Systems, Inc.* | 29,098,070 | ||||||
| 450,482 | NuVasive, Inc.* | 27,992,951 | ||||||
|
| |||||||
| 128,930,023 | ||||||||
|
| |||||||
| Health Care Providers & Services – 2.7% | ||||||||
| 378,857 | Acadia Healthcare Co., Inc.* | 25,050,025 | ||||||
| 218,845 | AMN Healthcare Services, Inc.* | 24,843,284 | ||||||
| 700,369 | Option Care Health, Inc.* | 18,734,871 | ||||||
| 402,248 | Owens & Minor, Inc. | 14,995,806 | ||||||
| 614,735 | Tenet Healthcare Corp.* | 46,320,282 | ||||||
|
| |||||||
| 129,944,268 | ||||||||
|
| |||||||
| Health Care Technology – 0.4% | ||||||||
| 1,220,138 | Allscripts Healthcare Solutions, Inc.* | 18,741,320 | ||||||
|
| |||||||
| Hotels, Restaurants & Leisure – 1.6% | ||||||||
| 345,894 | Bloomin’ Brands, Inc.* | 9,266,500 | ||||||
| 324,380 | Boyd Gaming Corp.* | 19,907,201 | ||||||
| 634,876 | SeaWorld Entertainment, Inc.* | 31,229,550 | ||||||
| 330,655 | Travel + Leisure Co. | 18,106,668 | ||||||
|
| |||||||
| 78,509,919 | ||||||||
|
| |||||||
| Household Durables – 1.6% | ||||||||
| 455,998 | Century Communities, Inc. | 31,965,460 | ||||||
| 105,170 | Installed Building Products, Inc. | 13,060,011 | ||||||
| 246,188 | Meritage Homes Corp.* | 27,459,809 | ||||||
| 186,696 | Tupperware Brands Corp.* | 4,456,433 | ||||||
|
| |||||||
| 76,941,713 | ||||||||
|
| |||||||
| Independent Power and Renewable Electricity Producers – 0.4% | ||||||||
| 255,504 | NextEra Energy Partners LP | 20,422,435 | ||||||
|
| |||||||
| Insurance – 3.0% | ||||||||
| 183,883 | AMERISAFE, Inc. | 10,582,467 | ||||||
| 480,209 | BRP Group, Inc., Class A* | 18,079,869 | ||||||
| 1,140,036 | CNO Financial Group, Inc. | 27,885,281 | ||||||
| 101,623 | Enstar Group Ltd.* | 23,441,377 | ||||||
| 109,445 | Primerica, Inc. | 16,738,518 | ||||||
| 147,689 | RLI Corp. | 16,132,069 | ||||||
| 396,853 | Selective Insurance Group, Inc. | 33,165,005 | ||||||
|
| |||||||
| 146,024,586 | ||||||||
|
| |||||||
| 40 | The accompanying notes are an integral part of these financial statements. |
GOLDMAN SACHS SMALL CAP VALUE FUND
| Shares | Description | Value | ||||||
| Common Stocks – (continued) | ||||||||
| IT Services – 0.6% | ||||||||
| 556,692 | LiveRamp Holdings, Inc.* | $ | 27,277,908 | |||||
|
| |||||||
| Leisure Products – 0.5% | ||||||||
| 868,266 | Callaway Golf Co.* | 24,363,544 | ||||||
|
| |||||||
| Life Sciences Tools & Services – 0.3% | ||||||||
| 509,243 | Pacific Biosciences of California, Inc.* | 15,944,398 | ||||||
|
| |||||||
| Machinery – 6.3% | ||||||||
| 374,071 | Astec Industries, Inc. | 22,870,701 | ||||||
| 189,067 | Chart Industries, Inc.* | 35,616,442 | ||||||
| 739,084 | Colfax Corp.* | 35,601,676 | ||||||
| 695,044 | Columbus McKinnon Corp. | 32,006,776 | ||||||
| 728,045 | Federal Signal Corp. | 29,580,468 | ||||||
| 828,469 | Kennametal, Inc. | 30,802,478 | ||||||
| 153,698 | Proto Labs, Inc.* | 11,398,244 | ||||||
| 923,411 | Rexnord Corp. | 56,106,452 | ||||||
| 252,140 | SPX FLOW, Inc. | 20,304,834 | ||||||
| 514,396 | Terex Corp. | 26,259,916 | ||||||
|
| |||||||
| 300,547,987 | ||||||||
|
| |||||||
| Media – 2.4% | ||||||||
| 1,363,987 | Entravision Communications Corp., Class A | 9,506,989 | ||||||
| 634,715 | Gray Television, Inc. | 14,433,419 | ||||||
| 1,124,936 | iHeartMedia, Inc., Class A* | 27,988,408 | ||||||
| 577,710 | John Wiley & Sons, Inc., Class A | 33,564,951 | ||||||
| 185,514 | Nexstar Media Group, Inc., Class A | 27,780,722 | ||||||
|
| |||||||
| 113,274,489 | ||||||||
|
| |||||||
| Metals & Mining – 1.8% | ||||||||
| 199,013 | Alcoa Corp.* | 8,830,207 | ||||||
| 490,841 | Allegheny Technologies, Inc.* | 8,766,420 | ||||||
| 774,144 | Arconic Corp.* | 26,700,227 | ||||||
| 1,339,941 | Coeur Mining, Inc.* | 9,446,584 | ||||||
| 513,827 | Commercial Metals Co. | 16,761,037 | ||||||
| 745,174 | Constellium SE* | 15,067,418 | ||||||
|
| |||||||
| 85,571,893 | ||||||||
|
| |||||||
| Mortgage Real Estate Investment Trusts (REITs) – 1.8% | ||||||||
| 1,120,134 | KKR Real Estate Finance Trust, Inc. REIT | 23,892,458 | ||||||
| 2,065,814 | PennyMac Mortgage Investment Trust REIT | 40,097,450 | ||||||
| 3,251,485 | Two Harbors Investment Corp. REIT | 21,459,801 | ||||||
|
| |||||||
| 85,449,709 | ||||||||
|
| |||||||
| Multiline Retail – 0.4% | ||||||||
| 198 | Big Lots, Inc. | 9,634 | ||||||
| 885,502 | Macy’s, Inc.* | 19,826,390 | ||||||
|
| |||||||
| 19,836,024 | ||||||||
|
| |||||||
| Oil, Gas & Consumable Fuels – 4.6% | ||||||||
| 2,595,460 | Antero Resources Corp.* | 35,609,711 | ||||||
| 918,142 | Brigham Minerals, Inc., Class A | 17,554,875 | ||||||
|
| |||||||
| Common Stocks – (continued) | ||||||||
| Oil, Gas & Consumable Fuels – (continued) | ||||||||
| 1,854,729 | Centennial Resource Development, Inc., Class A* | 9,459,118 | ||||||
| 1,943,104 | CNX Resources Corp.* | 22,073,661 | ||||||
| 862,090 | EQT Corp.* | 15,802,110 | ||||||
| 1,575,959 | Magnolia Oil & Gas Corp., Class A | 24,711,037 | ||||||
| 632,178 | PDC Energy, Inc. | 26,393,432 | ||||||
| 1,584,963 | Range Resources Corp.* | 23,172,159 | ||||||
| 35,139 | Rattler Midstream LP | 383,015 | ||||||
| 1,123,332 | SM Energy Co. | 21,455,641 | ||||||
| 1,407,053 | Viper Energy Partners LP | 26,058,622 | ||||||
|
| |||||||
| 222,673,381 | ||||||||
|
| |||||||
| Paper & Forest Products – 0.2% | ||||||||
| 190,248 | Domtar Corp.* | 10,431,298 | ||||||
|
| |||||||
| Pharmaceuticals – 0.2% | ||||||||
| 244,889 | Intra-Cellular Therapies, Inc.* | 8,130,315 | ||||||
|
| |||||||
| Professional Services – 2.7% | ||||||||
| 290,215 | ASGN, Inc.* | 32,559,221 | ||||||
| 984,979 | First Advantage Corp.* | 22,349,173 | ||||||
| 173,847 | ICF International, Inc. | 16,282,510 | ||||||
| 1,089,170 | KBR, Inc. | 42,412,280 | ||||||
| 198,623 | ManTech International Corp., Class A | 15,724,983 | ||||||
|
| |||||||
| 129,328,167 | ||||||||
|
| |||||||
| Real Estate Management & Development – 0.5% | ||||||||
| 1,052,094 | Kennedy-Wilson Holdings, Inc. | 23,135,547 | ||||||
|
| |||||||
| Road & Rail – 1.4% | ||||||||
| 319,192 | ArcBest Corp. | 21,299,682 | ||||||
| 162,139 | Avis Budget Group, Inc.* | 14,714,114 | ||||||
| 129,885 | Saia, Inc.* | 31,189,285 | ||||||
|
| |||||||
| 67,203,081 | ||||||||
|
| |||||||
| Semiconductors & Semiconductor Equipment – 1.9% | ||||||||
| 835,404 | Cohu, Inc.* | 29,807,215 | ||||||
| 445,855 | MACOM Technology Solutions Holdings, Inc.* | 27,067,857 | ||||||
| 457,019 | Onto Innovation, Inc.* | 33,878,818 | ||||||
|
| |||||||
| 90,753,890 | ||||||||
|
| |||||||
| Software – 1.4% | ||||||||
| 153,378 | Cerence, Inc.* | 16,632,310 | ||||||
| 199,034 | InterDigital, Inc. | 14,352,342 | ||||||
| 230,376 | Marathon Digital Holdings, Inc.*(a) | 9,350,962 | ||||||
| 1,764,847 | Vonage Holdings Corp.* | 24,884,343 | ||||||
|
| |||||||
| 65,219,957 | ||||||||
|
| |||||||
| Specialty Retail – 2.7% | ||||||||
| 607,182 | Abercrombie & Fitch Co., Class A* | 21,712,828 | ||||||
| 113,186 | Academy Sports & Outdoors, Inc.* | 5,010,744 | ||||||
| 380,287 | American Eagle Outfitters, Inc. | 11,606,359 | ||||||
| 140,655 | Citi Trends, Inc.* | 12,116,022 | ||||||
| 137,284 | Group 1 Automotive, Inc. | 22,712,265 | ||||||
| 476,110 | Rent-A-Center, Inc. | 30,033,019 | ||||||
|
| |||||||
| The accompanying notes are an integral part of these financial statements. | 41 |
GOLDMAN SACHS SMALL CAP VALUE FUND
Schedule of Investments (continued)
August 31, 2021
| Shares | Description | Value | ||||||
| Common Stocks – (continued) | ||||||||
| Specialty Retail – (continued) | ||||||||
| 5,549 | RH* | $ | 3,888,018 | |||||
| 246,346 | Signet Jewelers Ltd. | 19,510,603 | ||||||
| 123,013 | Zumiez, Inc.* | 4,943,893 | ||||||
|
| |||||||
| 131,533,751 | ||||||||
|
| |||||||
| Textiles, Apparel & Luxury Goods – 0.9% | ||||||||
| 182,915 | Capri Holdings Ltd.* | 10,336,527 | ||||||
| 219,046 | Crocs, Inc.* | 31,284,150 | ||||||
| 7,119 | Deckers Outdoor Corp.* | 2,978,945 | ||||||
|
| |||||||
| 44,599,622 | ||||||||
|
| |||||||
| Thrifts & Mortgage Finance – 2.6% | ||||||||
| 2,148,314 | MGIC Investment Corp. | 32,804,755 | ||||||
| 798,668 | NMI Holdings, Inc., Class A* | 18,025,936 | ||||||
| 313,159 | Walker & Dunlop, Inc. | 34,776,307 | ||||||
| 1,130,053 | Washington Federal, Inc. | 37,630,765 | ||||||
|
| |||||||
| 123,237,763 | ||||||||
|
| |||||||
| Trading Companies & Distributors – 2.0% | ||||||||
| 490,236 | Beacon Roofing Supply, Inc.* | 25,237,349 | ||||||
| 156,445 | Herc Holdings, Inc.* | 20,564,695 | ||||||
| 426,479 | WESCO International, Inc.* | 49,906,573 | ||||||
|
| |||||||
| 95,708,617 | ||||||||
|
| |||||||
| Water Utilities – 0.4% | ||||||||
| 247,341 | SJW Group | 17,148,151 | ||||||
|
| |||||||
| Wireless Telecommunication Services – 0.5% | ||||||||
| 1,186,602 | Telephone and Data Systems, Inc. | 24,111,753 | ||||||
|
| |||||||
| TOTAL COMMON STOCKS | ||||||||
| (Cost $3,477,007,160) | $ | 4,798,053,539 | ||||||
|
| |||||||
| Shares | Dividend Rate | Value | ||||||
| Investment Company – 0.1%(b) | ||||||||
Goldman Sachs Financial Square Government Fund – Institutional Shares |
| |||||||
| 5,404,503 | 0.026% | $ | 5,404,503 | |||||
| (Cost $5,404,503) |
| |||||||
| ||||||||
| TOTAL INVESTMENTS BEFORE SECURITIES LENDING REINVESTMENT VEHICLE |
| |||||||
| (Cost $3,482,411,663) | $ | 4,803,458,042 | ||||||
| ||||||||
| Securities Lending Reinvestment Vehicle – 0.5%(b) | ||||||||
Goldman Sachs Financial Square Government Fund – Institutional Shares |
| |||||||
| 26,189,986 | 0.026 | % | $ | 26,189,986 | ||||
| (Cost $26,189,986) |
| |||||||
| ||||||||
| TOTAL INVESTMENTS – 100.5% |
| |||||||
| (Cost $3,508,601,649) |
| $ | 4,829,648,028 | |||||
| ||||||||
| LIABILITIES IN EXCESS OF OTHER ASSETS – (0.5)% |
| (27,002,700 | ) | |||||
| ||||||||
| NET ASSETS – 100.0% |
| $ | 4,802,645,328 | |||||
| ||||||||
| The percentage shown for each investment category reflects the value of investments in that category as a percentage of net assets. | ||
* | Non-income producing security. | |
(a) | All or a portion of security is on loan. | |
(b) | Represents an affiliated issuer. | |
| ||||
Investment Abbreviations: | ||||
LP | —Limited Partnership | |||
PLC | —Public Limited Company | |||
REIT | —Real Estate Investment Trust | |||
| ||||
| 42 | The accompanying notes are an integral part of these financial statements. |
GOLDMAN SACHS SMALL/MID CAP VALUE FUND
Schedule of Investments
August 31, 2021
| Shares | Description | Value | ||||||
| Common Stocks – 99.5% | ||||||||
| Aerospace & Defense – 0.4% | ||||||||
| 21,566 | AAR Corp.* | $ | 730,009 | |||||
| 3,716 | Hexcel Corp.* | 210,734 | ||||||
|
| |||||||
| 940,743 | ||||||||
|
| |||||||
| Air Freight & Logistics – 0.4% | ||||||||
| 9,695 | GXO Logistics, Inc.* | 792,954 | ||||||
|
| |||||||
| Airlines – 0.7% | ||||||||
| 6,172 | Allegiant Travel Co.* | 1,187,740 | ||||||
| 8,148 | SkyWest, Inc.* | 380,104 | ||||||
|
| |||||||
| 1,567,844 | ||||||||
|
| |||||||
| Auto Components – 0.4% | ||||||||
| 24,805 | Adient PLC* | 975,829 | ||||||
|
| |||||||
| Banks – 9.9% | ||||||||
| 15,222 | BOK Financial Corp. | 1,340,297 | ||||||
| 38,430 | Columbia Banking System, Inc. | 1,397,315 | ||||||
| 18,452 | Commerce Bancshares, Inc. | 1,304,925 | ||||||
| 12,516 | Cullen/Frost Bankers, Inc. | 1,429,578 | ||||||
| 27,041 | East West Bancorp, Inc. | 1,983,187 | ||||||
| 22,502 | First Financial Bankshares, Inc. | 1,071,545 | ||||||
| 20,700 | Glacier Bancorp, Inc. | 1,102,482 | ||||||
| 32,531 | Hancock Whitney Corp. | 1,495,125 | ||||||
| 40,125 | PacWest Bancorp | 1,707,319 | ||||||
| 20,675 | Pinnacle Financial Partners, Inc. | 2,003,821 | ||||||
| 22,118 | Prosperity Bancshares, Inc. | 1,545,606 | ||||||
| 7,241 | Signature Bank | 1,877,809 | ||||||
| 15,912 | South State Corp. | 1,091,245 | ||||||
| 34,213 | Synovus Financial Corp. | 1,474,580 | ||||||
| 18,066 | Wintrust Financial Corp. | 1,352,059 | ||||||
|
| |||||||
| 22,176,893 | ||||||||
|
| |||||||
| Beverages – 0.7% | ||||||||
| 77 | Boston Beer Co., Inc. (The), Class A* | 43,906 | ||||||
| 91,518 | Primo Water Corp. | 1,625,360 | ||||||
|
| |||||||
| 1,669,266 | ||||||||
|
| |||||||
| Biotechnology – 0.6% | ||||||||
| 9,899 | Agios Pharmaceuticals, Inc.* | 442,287 | ||||||
| 18,099 | Alkermes PLC* | 565,775 | ||||||
| 13,918 | Bluebird Bio, Inc.* | 254,699 | ||||||
|
| |||||||
| 1,262,761 | ||||||||
|
| |||||||
| Building Products – 1.4% | ||||||||
| 8,446 | Armstrong World Industries, Inc. | 877,793 | ||||||
| 2,942 | AZEK Co., Inc. (The)* | 125,005 | ||||||
| 7,107 | Gibraltar Industries, Inc.* | 530,609 | ||||||
| 52,596 | Resideo Technologies, Inc.* | 1,695,695 | ||||||
|
| |||||||
| 3,229,102 | ||||||||
|
| |||||||
| Capital Markets – 2.5% | ||||||||
| 5,738 | Cboe Global Markets, Inc. | 723,849 | ||||||
| 6,136 | Hamilton Lane, Inc., Class A | 528,126 | ||||||
| 6,875 | Houlihan Lokey, Inc. | 620,125 | ||||||
| 37,101 | Jefferies Financial Group, Inc. | 1,371,253 | ||||||
| 7,624 | LPL Financial Holdings, Inc. | 1,127,208 | ||||||
|
| |||||||
| Common Stocks – (continued) | ||||||||
| Capital Markets – (continued) | ||||||||
| 18,700 | Stifel Financial Corp. | 1,292,170 | ||||||
|
| |||||||
| 5,662,731 | ||||||||
|
| |||||||
| Chemicals – 2.8% | ||||||||
| 6,991 | Ashland Global Holdings, Inc. | 636,950 | ||||||
| 52,379 | Avient Corp. | 2,728,422 | ||||||
| 51,142 | Element Solutions, Inc. | 1,162,458 | ||||||
| 34,986 | Tronox Holdings PLC, Class A | 739,254 | ||||||
| 11,215 | Westlake Chemical Corp. | 979,630 | ||||||
|
| |||||||
| 6,246,714 | ||||||||
|
| |||||||
| Communications Equipment – 1.3% | ||||||||
| 34,140 | Ciena Corp.* | 1,950,418 | ||||||
| 60,178 | Viavi Solutions, Inc.* | 980,300 | ||||||
|
| |||||||
| 2,930,718 | ||||||||
|
| |||||||
| Construction & Engineering – 2.8% | ||||||||
| 32,568 | AECOM* | 2,135,158 | ||||||
| 17,572 | MasTec, Inc.* | 1,606,784 | ||||||
| 25,359 | Quanta Services, Inc. | 2,589,154 | ||||||
|
| |||||||
| 6,331,096 | ||||||||
|
| |||||||
| Construction Materials – 0.5% | ||||||||
| 21,396 | Summit Materials, Inc., Class A* | 720,403 | ||||||
| 2,266 | Vulcan Materials Co. | 421,318 | ||||||
|
| |||||||
| 1,141,721 | ||||||||
|
| |||||||
| Consumer Finance – 1.1% | ||||||||
| 6,303 | FirstCash, Inc. | 540,104 | ||||||
| 15,274 | Green Dot Corp., Class A* | 797,914 | ||||||
| 21,476 | OneMain Holdings, Inc. | 1,241,957 | ||||||
|
| |||||||
| 2,579,975 | ||||||||
|
| |||||||
| Containers & Packaging – 2.2% | ||||||||
| 5,650 | Avery Dennison Corp. | 1,273,453 | ||||||
| 21,602 | Berry Global Group, Inc.* | 1,451,006 | ||||||
| 20,535 | Crown Holdings, Inc. | 2,254,538 | ||||||
|
| |||||||
| 4,978,997 | ||||||||
|
| |||||||
| Diversified Consumer Services – 0.0% | ||||||||
| 1,384 | Chegg, Inc.* | 115,176 | ||||||
|
| |||||||
| Diversified Financial Services – 0.6% | ||||||||
| 19,910 | Voya Financial, Inc. | 1,293,752 | ||||||
|
| |||||||
| Electric Utilities – 2.0% | ||||||||
| 17,389 | ALLETE, Inc. | 1,172,366 | ||||||
| 27,657 | Alliant Energy Corp. | 1,681,269 | ||||||
| 16,617 | IDACORP, Inc. | 1,750,601 | ||||||
|
| |||||||
| 4,604,236 | ||||||||
|
| |||||||
| Electrical Equipment – 1.6% | ||||||||
| 8,218 | Hubbell, Inc. | 1,693,812 | ||||||
| 13,498 | Regal Beloit Corp. | 2,016,871 | ||||||
|
| |||||||
| 3,710,683 | ||||||||
|
| |||||||
| The accompanying notes are an integral part of these financial statements. | 43 |
GOLDMAN SACHS SMALL/MID CAP VALUE FUND
Schedule of Investments (continued)
August 31, 2021
| Shares | Description | Value | ||||||
| Common Stocks – (continued) | ||||||||
| Electronic Equipment, Instruments & Components – 1.9% | ||||||||
| 5,661 | Littelfuse, Inc. | $ | 1,615,649 | |||||
| 38,018 | National Instruments Corp. | 1,589,913 | ||||||
| 31,059 | Vontier Corp. | 1,129,616 | ||||||
|
| |||||||
| 4,335,178 | ||||||||
|
| |||||||
| Energy Equipment & Services – 0.5% | ||||||||
| 46,710 | ChampionX Corp.* | 1,089,744 | ||||||
|
| |||||||
| Entertainment – 0.9% | ||||||||
| 22,820 | Liberty Media Corp.-Liberty Formula One, Class C* | 1,153,323 | ||||||
| 9,370 | Live Nation Entertainment, Inc.* | 812,379 | ||||||
|
| |||||||
| 1,965,702 | ||||||||
|
| |||||||
| Equity Real Estate Investment Trusts (REITs) – 11.3% | ||||||||
| 34,284 | Americold Realty Trust REIT | 1,259,594 | ||||||
| 13,947 | Camden Property Trust REIT | 2,092,608 | ||||||
| 6,624 | CoreSite Realty Corp. REIT | 982,803 | ||||||
| 41,385 | CubeSmart REIT | 2,214,098 | ||||||
| 155,159 | DigitalBridge Group, Inc. REIT* | 1,070,597 | ||||||
| 8,471 | EastGroup Properties, Inc. REIT | 1,526,983 | ||||||
| 26,637 | Equity LifeStyle Properties, Inc. REIT | 2,266,010 | ||||||
| 35,426 | Healthcare Realty Trust, Inc. REIT | 1,063,843 | ||||||
| 56,638 | Highwoods Properties, Inc. REIT | 2,587,790 | ||||||
| 53,953 | Hudson Pacific Properties, Inc. REIT | 1,423,280 | ||||||
| 29,787 | MGM Growth Properties LLC, Class A REIT | 1,234,969 | ||||||
| 60,231 | Park Hotels & Resorts, Inc. REIT* | 1,152,821 | ||||||
| 58,896 | Pebblebrook Hotel Trust REIT | 1,297,479 | ||||||
| 23,500 | Regency Centers Corp. REIT | 1,612,570 | ||||||
| 75,974 | RLJ Lodging Trust REIT | 1,096,305 | ||||||
| 13,578 | Ryman Hospitality Properties, Inc. REIT* | 1,127,924 | ||||||
| 86,066 | SITE Centers Corp. REIT | 1,386,523 | ||||||
|
| |||||||
| 25,396,197 | ||||||||
|
| |||||||
| Food & Staples Retailing – 0.8% | ||||||||
| 23,266 | BJ’s Wholesale Club Holdings, Inc.* | 1,318,252 | ||||||
| 7,455 | Performance Food Group Co.* | 374,390 | ||||||
|
| |||||||
| 1,692,642 | ||||||||
|
| |||||||
| Food Products – 1.6% | ||||||||
| 8,537 | Darling Ingredients, Inc.* | 636,006 | ||||||
| 72,550 | Hostess Brands, Inc.* | 1,157,898 | ||||||
| 16,225 | Lamb Weston Holdings, Inc. | 1,057,059 | ||||||
| 33,825 | Utz Brands, Inc. | 656,882 | ||||||
|
| |||||||
| 3,507,845 | ||||||||
|
| |||||||
| Gas Utilities – 0.6% | ||||||||
| 19,072 | ONE Gas, Inc. | 1,369,751 | ||||||
|
| |||||||
| Health Care Equipment & Supplies – 3.0% | ||||||||
| 9,225 | CONMED Corp. | 1,211,611 | ||||||
| 5,834 | Figs, Inc., Class A*(a) | 239,252 | ||||||
| 15,345 | Globus Medical, Inc., Class A* | 1,252,152 | ||||||
| 16,538 | Hill-Rom Holdings, Inc. | 2,407,602 | ||||||
| 20,711 | Integra LifeSciences Holdings Corp.* | 1,558,089 | ||||||
|
| |||||||
| 6,668,706 | ||||||||
|
| |||||||
| Common Stocks – (continued) | ||||||||
| Health Care Providers & Services – 2.0% | ||||||||
| 23,101 | Acadia Healthcare Co., Inc.* | 1,527,438 | ||||||
| 5,210 | Molina Healthcare, Inc.* | 1,400,292 | ||||||
| 20,158 | Tenet Healthcare Corp.* | 1,518,905 | ||||||
|
| |||||||
| 4,446,635 | ||||||||
|
| |||||||
| Hotels, Restaurants & Leisure – 2.5% | ||||||||
| 25,511 | Boyd Gaming Corp.* | 1,565,610 | ||||||
| 11,299 | Caesars Entertainment, Inc.* | 1,148,317 | ||||||
| 2,991 | Marriott Vacations Worldwide Corp.* | 447,304 | ||||||
| 28,393 | SeaWorld Entertainment, Inc.* | 1,396,652 | ||||||
| 18,402 | Travel + Leisure Co. | 1,007,694 | ||||||
|
| |||||||
| 5,565,577 | ||||||||
|
| |||||||
| Household Durables – 2.0% | ||||||||
| 20,598 | Century Communities, Inc. | 1,443,920 | ||||||
| 5,723 | Meritage Homes Corp. * | 638,343 | ||||||
| 33,421 | Sonos, Inc.* | 1,327,816 | ||||||
| 5,055 | TopBuild Corp.* | 1,105,984 | ||||||
|
| |||||||
| 4,516,063 | ||||||||
|
| |||||||
| Independent Power and Renewable Electricity Producers – 0.6% | ||||||||
| 17,229 | NextEra Energy Partners LP | 1,377,114 | ||||||
|
| |||||||
| Insurance – 4.8% | ||||||||
| 11,507 | American Financial Group, Inc. | 1,587,276 | ||||||
| 19,997 | Brown & Brown, Inc. | 1,160,826 | ||||||
| 21,062 | Globe Life, Inc. | 2,023,426 | ||||||
| 52,569 | Old Republic International Corp. | 1,366,794 | ||||||
| 6,517 | Primerica, Inc. | 996,710 | ||||||
| 36,493 | Ryan Specialty Group Holdings, Inc., Class A* | 1,200,985 | ||||||
| 15,678 | Selective Insurance Group, Inc. | 1,310,210 | ||||||
| 15,099 | W R Berkley Corp. | 1,137,106 | ||||||
|
| |||||||
| 10,783,333 | ||||||||
|
| |||||||
| IT Services – 0.6% | ||||||||
| 8,193 | Jack Henry & Associates, Inc. | 1,445,081 | ||||||
|
| |||||||
| Leisure Products – 0.4% | ||||||||
| 34,303 | Callaway Golf Co.* | 962,542 | ||||||
|
| |||||||
| Life Sciences Tools & Services – 2.1% | ||||||||
| 12,460 | PerkinElmer, Inc. | 2,302,608 | ||||||
| 25,880 | Syneos Health, Inc.* | 2,401,146 | ||||||
|
| |||||||
| 4,703,754 | ||||||||
|
| |||||||
| Machinery – 4.6% | ||||||||
| 5,865 | Chart Industries, Inc.* | 1,104,849 | ||||||
| 39,541 | Colfax Corp.* | 1,904,690 | ||||||
| 22,590 | ITT, Inc. | 2,161,185 | ||||||
| 5,708 | Nordson Corp. | 1,361,929 | ||||||
| 39,291 | Rexnord Corp. | 2,387,321 | ||||||
| 19,601 | Timken Co. (The) | 1,441,457 | ||||||
|
| |||||||
| 10,361,431 | ||||||||
|
| |||||||
| Media – 1.4% | ||||||||
| 361 | Cable One, Inc. | 757,952 | ||||||
|
| |||||||
| 44 | The accompanying notes are an integral part of these financial statements. |
GOLDMAN SACHS SMALL/MID CAP VALUE FUND
| Shares | Description | Value | ||||||
| Common Stocks – (continued) | ||||||||
| Media – (continued) | ||||||||
| 43,082 | iHeartMedia, Inc., Class A* | $ | 1,071,880 | |||||
| 8,608 | Nexstar Media Group, Inc., Class A | 1,289,048 | ||||||
|
| |||||||
| 3,118,880 | ||||||||
|
| |||||||
| Metals & Mining – 2.1% | ||||||||
| 22,537 | Alcoa Corp.* | 999,967 | ||||||
| 14,820 | Allegheny Technologies, Inc.* | 264,685 | ||||||
| 18,082 | Arconic Corp.* | 623,648 | ||||||
| 23,232 | Cleveland-Cliffs, Inc.* | 545,255 | ||||||
| 15,792 | Commercial Metals Co. | 515,135 | ||||||
| 26,032 | Constellium SE* | 526,367 | ||||||
| 12,577 | Steel Dynamics, Inc. | 848,822 | ||||||
| 13,677 | United States Steel Corp. | 365,860 | ||||||
|
| |||||||
| 4,689,739 | ||||||||
|
| |||||||
| Mortgage Real Estate Investment Trusts (REITs) – 1.0% | ||||||||
| 78,545 | PennyMac Mortgage Investment Trust REIT | 1,524,559 | ||||||
| 98,077 | Two Harbors Investment Corp. REIT | 647,308 | ||||||
|
| |||||||
| 2,171,867 | ||||||||
|
| |||||||
| Multiline Retail – 0.2% | ||||||||
| 19,674 | Macy’s, Inc.* | 440,501 | ||||||
|
| |||||||
| Oil, Gas & Consumable Fuels – 3.5% | ||||||||
| 66,001 | Antero Resources Corp.* | 905,534 | ||||||
| 80,276 | Devon Energy Corp. | 2,372,156 | ||||||
| 26,304 | Diamondback Energy, Inc. | 2,029,091 | ||||||
| 62,541 | EQT Corp.* | 1,146,376 | ||||||
| 52,998 | Ovintiv, Inc. | 1,444,725 | ||||||
|
| |||||||
| 7,897,882 | ||||||||
|
| |||||||
| Personal Products – 0.1% | ||||||||
| 13,212 | Coty, Inc., Class A* | 129,081 | ||||||
|
| |||||||
| Pharmaceuticals – 1.3% | ||||||||
| 16,861 | Catalent, Inc.* | 2,199,349 | ||||||
| 4,870 | Jazz Pharmaceuticals PLC* | 641,428 | ||||||
|
| |||||||
| 2,840,777 | ||||||||
|
| |||||||
| Professional Services – 3.7% | ||||||||
| 19,319 | ASGN, Inc.* | 2,167,399 | ||||||
| 4,801 | CACI International, Inc., Class A* | 1,236,450 | ||||||
| 46,054 | First Advantage Corp.* | 1,044,965 | ||||||
| 14,915 | Jacobs Engineering Group, Inc. | 2,012,928 | ||||||
| 45,229 | KBR, Inc. | 1,761,217 | ||||||
|
| |||||||
| 8,222,959 | ||||||||
|
| |||||||
| Real Estate Management & Development – 0.5% | ||||||||
| 54,397 | Kennedy-Wilson Holdings, Inc. | 1,196,190 | ||||||
|
| |||||||
| Road & Rail – 1.7% | ||||||||
| 9,997 | ArcBest Corp. | 667,100 | ||||||
| 4,081 | Old Dominion Freight Line, Inc. | 1,178,266 | ||||||
| 2,772 | Saia, Inc.* | 665,640 | ||||||
| 15,825 | XPO Logistics, Inc.* | 1,375,351 | ||||||
|
| |||||||
| 3,886,357 | ||||||||
|
| |||||||
| Common Stocks – (continued) | ||||||||
| Semiconductors & Semiconductor Equipment – 2.6% | ||||||||
| 10,597 | Cree, Inc.* | 900,533 | ||||||
| 12,738 | MKS Instruments, Inc. | 1,874,779 | ||||||
| 49,505 | ON Semiconductor Corp.* | 2,196,042 | ||||||
| 5,656 | Silicon Laboratories, Inc.* | 891,498 | ||||||
|
| |||||||
| 5,862,852 | ||||||||
|
| |||||||
| Software – 1.6% | ||||||||
| 15,186 | Black Knight, Inc.* | 1,149,125 | ||||||
| 8,985 | Cerence, Inc.* | 974,333 | ||||||
| 9,808 | Dynatrace, Inc.* | 674,104 | ||||||
| 63,220 | Vonage Holdings Corp.* | 891,402 | ||||||
|
| |||||||
| 3,688,964 | ||||||||
|
| |||||||
| Specialty Retail – 4.6% | ||||||||
| 22,714 | Abercrombie & Fitch Co., Class A* | 812,253 | ||||||
| 17,039 | American Eagle Outfitters, Inc. | 520,030 | ||||||
| 22,477 | Bath & Body Works, Inc. | 1,516,748 | ||||||
| 2,838 | Burlington Stores, Inc.* | 849,953 | ||||||
| 3,832 | Dick’s Sporting Goods, Inc. (a) | 539,584 | ||||||
| 31,688 | Leslie’s, Inc.* | 764,314 | ||||||
| 5,170 | Lithia Motors, Inc. | 1,712,821 | ||||||
| 17,820 | Rent-A-Center, Inc. | 1,124,086 | ||||||
| 230 | RH* | 161,154 | ||||||
| 19,476 | Shoe Carnival, Inc. | 745,541 | ||||||
| 11,778 | Signet Jewelers Ltd. | 932,818 | ||||||
| 10,985 | Victoria’s Secret & Co.* | 728,305 | ||||||
|
| |||||||
| 10,407,607 | ||||||||
|
| |||||||
| Textiles, Apparel & Luxury Goods – 1.8% | ||||||||
| 18,647 | Capri Holdings Ltd.* | 1,053,742 | ||||||
| 9,888 | Crocs, Inc.* | 1,412,204 | ||||||
| 3,562 | Deckers Outdoor Corp.* | 1,490,519 | ||||||
|
| |||||||
| 3,956,465 | ||||||||
|
| |||||||
| Thrifts & Mortgage Finance – 1.3% | ||||||||
| 81,670 | MGIC Investment Corp. | 1,247,101 | ||||||
| 19,196 | NMI Holdings, Inc., Class A* | 433,254 | ||||||
| 39,460 | Washington Federal, Inc. | 1,314,018 | ||||||
|
| |||||||
| 2,994,373 | ||||||||
|
| |||||||
| TOTAL COMMON STOCKS | ||||||||
| (Cost $179,009,738) | $ | 223,902,980 | ||||||
|
| |||||||
| Shares | Dividend Rate | Value | ||||||
| Investment Company – 0.3%(b) | ||||||||
Goldman Sachs Financial Square Government Fund – Institutional Shares |
| |||||||
| 583,228 | 0.026 | % | $ | 583,228 | ||||
| (Cost $583,228) |
| |||||||
| ||||||||
| TOTAL INVESTMENTS BEFORE SECURITIES LENDING REINVESTMENT VEHICLE |
| |||||||
| (Cost $179,592,966) |
| $ | 224,486,208 | |||||
| ||||||||
| The accompanying notes are an integral part of these financial statements. | 45 |
GOLDMAN SACHS SMALL/MID CAP VALUE FUND
Schedule of Investments (continued)
August 31, 2021
| Shares | Dividend Rate | Value | ||||||
| Securities Lending Reinvestment Vehicle – 0.3%(b) | ||||||||
Goldman Sachs Financial Square Government Fund – Institutional Shares |
| |||||||
| 764,357 | 0.026 | % | $ | 764,357 | ||||
| (Cost $764,357) |
| |||||||
| ||||||||
| TOTAL INVESTMENTS – 100.1% |
| |||||||
| (Cost $180,357,323) |
| $ | 225,250,565 | |||||
| ||||||||
| LIABILITIES IN EXCESS OF OTHER ASSETS – (0.1)% |
| (228,976 | ) | |||||
| ||||||||
| NET ASSETS – 100.0% |
| $ | 225,021,589 | |||||
| ||||||||
| The percentage shown for each investment category reflects the value of investments in that category as a percentage of net assets. | ||
* | Non-income producing security. | |
(a) | All or a portion of security is on loan. | |
(b) | Represents an affiliated issuer. | |
| ||||
Investment Abbreviations: | ||||
LP | —Limited Partnership | |||
PLC | —Public Limited Company | |||
REIT | —Real Estate Investment Trust | |||
| ||||
| 46 | The accompanying notes are an integral part of these financial statements. |
GOLDMAN SACHS FUNDAMENTAL EQUITY VALUE FUNDS
Statements of Assets and Liabilities
August 31, 2021
| Equity Income Fund | Focused Value Fund | Large Cap Value Fund | ||||||||||||
| Assets: | ||||||||||||||
Investments in unaffiliated issuers, at value (cost $325,693,736, $33,833,888 and $372,713,613, respectively) | $ | 424,081,039 | $ | 39,199,229 | $ | 493,880,129 | ||||||||
Investments in affiliated issuers, at value (cost $809,595, $426,826 and $5,056,208, respectively) | 809,595 | 426,826 | 5,056,208 | |||||||||||
Cash | 593,777 | 53,534 | 542,229 | |||||||||||
Receivables: | ||||||||||||||
Dividends | 1,255,133 | 48,749 | 705,446 | |||||||||||
Reimbursement from investment adviser | 44,684 | 42,787 | 78,804 | |||||||||||
Foreign tax reclaims | 40,004 | 243 | 54,947 | |||||||||||
Fund shares sold | 10,960 | 12,365 | 10,211 | |||||||||||
Securities lending income | 10 | — | — | |||||||||||
Other assets | 57,175 | 55,028 | 31,742 | |||||||||||
| Total assets | 426,892,377 | 39,838,761 | 500,359,716 | |||||||||||
| Liabilities: | ||||||||||||||
Payables: | ||||||||||||||
Management fees | 248,316 | 22,780 | 316,678 | |||||||||||
Fund shares redeemed | 170,804 | — | 115,391 | |||||||||||
Distribution and Service fees and Transfer Agency fees | 125,686 | 1,231 | 55,854 | |||||||||||
Accrued expenses | 213,016 | 124,718 | 200,275 | |||||||||||
| Total liabilities | 757,822 | 148,729 | 688,198 | |||||||||||
| Net Assets: | ||||||||||||||
Paid-in capital | 300,055,521 | 32,585,708 | 336,703,839 | |||||||||||
Total distributable earnings | 126,079,034 | 7,104,324 | 162,967,679 | |||||||||||
| NET ASSETS | $ | 426,134,555 | $ | 39,690,032 | $ | 499,671,518 | ||||||||
Net Assets: | ||||||||||||||
Class A | $ | 334,885,614 | $ | 369,488 | $ | 87,358,795 | ||||||||
Class C | 6,026,081 | 49,135 | 12,948,320 | |||||||||||
Institutional | 33,659,570 | 5,999,411 | 181,806,453 | |||||||||||
Service | 103,378 | — | 845,893 | |||||||||||
Investor | 3,042,489 | 13,284 | 3,559,449 | |||||||||||
Class R6 | 6,981,466 | 13,288 | 1,958,087 | |||||||||||
Class R | 1,337,051 | 43,415 | 3,268,677 | |||||||||||
Class P | 40,098,906 | 33,202,011 | 207,925,844 | |||||||||||
Total Net Assets | $ | 426,134,555 | $ | 39,690,032 | $ | 499,671,518 | ||||||||
Shares Outstanding $0.001 par value (unlimited number of shares authorized): | ||||||||||||||
Class A | 7,086,813 | 24,869 | 4,891,968 | |||||||||||
Class C | 134,227 | 3,354 | 770,787 | |||||||||||
Institutional | 699,072 | 402,154 | 10,058,173 | |||||||||||
Service | 2,179 | — | 47,586 | |||||||||||
Investor | 64,490 | 893 | 199,183 | |||||||||||
Class R6 | 144,985 | 892 | 105,624 | |||||||||||
Class R | 28,460 | 2,941 | 189,319 | |||||||||||
Class P | 832,947 | 2,228,601 | 11,217,339 | |||||||||||
Net asset value, offering and redemption price per share:(a) | ||||||||||||||
Class A | $47.25 | $14.86 | $17.86 | |||||||||||
Class C | 44.89 | 14.65 | 16.80 | |||||||||||
Institutional | 48.15 | 14.92 | 18.08 | |||||||||||
Service | 47.45 | — | 17.78 | |||||||||||
Investor | 47.18 | 14.88 | 17.87 | |||||||||||
Class R6 | 48.15 | 14.89 | 18.54 | |||||||||||
Class R | 46.98 | 14.76 | 17.27 | |||||||||||
Class P | 48.14 | 14.90 | 18.54 | |||||||||||
| (a) | Maximum public offering price per share for Class A Shares of the Equity Income, Focused Value and Large Cap Value Funds is $50.00, $15.72 and $18.90, respectively. At redemption, Class C Shares may be subject to a contingent deferred sales charge, assessed on the amount equal to the lesser of the current net asset value (“NAV”) or the original purchase price of the shares. |
| The accompanying notes are an integral part of these financial statements. | 47 |
GOLDMAN SACHS FUNDAMENTAL EQUITY VALUE FUNDS
Statements of Assets and Liabilities (continued)
August 31, 2021
| Mid Cap Value Fund | Small Cap Value Fund | Small/Mid Cap Value Fund | ||||||||||||
| Assets: | ||||||||||||||
Investments in unaffiliated issuers, at value (cost $902,237,935, $3,477,007,160 and $179,009,738, respectively)(a) | $ | 1,239,798,765 | $ | 4,798,053,539 | $ | 223,902,980 | ||||||||
Investments in affiliated issuers, at value (cost $10,084,240, $5,404,503 and $583,228, respectively) | 10,084,240 | 5,404,503 | 583,228 | |||||||||||
Investments in securities lending reinvestment vehicle, at value which equals cost | — | 26,189,986 | 764,357 | |||||||||||
Cash | 2,510,609 | 4,154,001 | 668,899 | |||||||||||
Receivables: | ||||||||||||||
Dividends | 862,535 | 2,944,963 | 147,087 | |||||||||||
Fund shares sold | 513,712 | 3,841,175 | 659,825 | |||||||||||
Reimbursement from investment adviser | 20,983 | 258,718 | 58,362 | |||||||||||
Foreign tax reclaims | 6,591 | 208,183 | 4,469 | |||||||||||
Investments sold | — | 29,616,377 | 219,697 | |||||||||||
Securities lending income | — | 15,203 | 172 | |||||||||||
Other assets | 51,983 | 136,936 | 27,039 | |||||||||||
| Total assets | 1,253,849,418 | 4,870,823,584 | 227,036,115 | |||||||||||
| Liabilities: | ||||||||||||||
Payables: | ||||||||||||||
Fund shares redeemed | 1,664,965 | 10,386,348 | 264,079 | |||||||||||
Management fees | 787,773 | 3,723,878 | 148,328 | |||||||||||
Distribution and Service fees and Transfer Agency fees | 252,232 | 352,882 | 9,274 | |||||||||||
Investments purchased | — | 26,631,430 | 684,190 | |||||||||||
Upon return of securities loaned | — | 26,189,986 | 764,357 | |||||||||||
Accrued expenses | 331,499 | 893,732 | 144,298 | |||||||||||
| Total liabilities | 3,036,469 | 68,178,256 | 2,014,526 | |||||||||||
| Net Assets: | ||||||||||||||
Paid-in capital | 763,383,077 | 2,839,903,346 | 172,681,383 | |||||||||||
Total distributable earnings | 487,429,872 | 1,962,741,982 | 52,340,206 | |||||||||||
| NET ASSETS | $ | 1,250,812,949 | $ | 4,802,645,328 | $ | 225,021,589 | ||||||||
Net Assets: | ||||||||||||||
Class A | $ | 536,383,724 | $ | 468,122,450 | $ | 2,034,037 | ||||||||
Class C | 12,836,206 | 2,204,095 | 1,483,495 | |||||||||||
Institutional | 331,383,106 | 2,331,481,730 | 18,471,903 | |||||||||||
Service | 34,850,656 | 27,101,945 | — | |||||||||||
Investor | 42,205,981 | 140,918,454 | 13,553,438 | |||||||||||
Class R6 | 80,114,081 | 1,436,953,936 | 97,323,807 | |||||||||||
Class R | 21,248,956 | 62,338,796 | 99,191 | |||||||||||
Class P | 191,790,239 | 333,523,922 | 92,055,718 | |||||||||||
Total Net Assets | $ | 1,250,812,949 | $ | 4,802,645,328 | $ | 225,021,589 | ||||||||
Shares Outstanding $0.001 par value (unlimited number of shares authorized): | ||||||||||||||
Class A | 11,995,190 | 7,713,699 | 117,862 | |||||||||||
Class C | 333,150 | 51,701 | 88,917 | |||||||||||
Institutional | 7,308,371 | 35,018,998 | 1,054,639 | |||||||||||
Service | 797,699 | 463,755 | — | |||||||||||
Investor | 967,935 | 2,341,539 | 778,578 | |||||||||||
Class R6 | 1,768,077 | 21,593,361 | 5,562,334 | |||||||||||
Class R | 493,074 | 1,056,961 | 5,762 | |||||||||||
Class P | 4,233,401 | 5,011,683 | 5,262,002 | |||||||||||
Net asset value, offering and redemption price per share:(b) | ||||||||||||||
Class A | $44.72 | $60.69 | $17.26 | |||||||||||
Class C | 38.53 | 42.63 | 16.68 | |||||||||||
Institutional | 45.34 | 66.58 | 17.51 | |||||||||||
Service | 43.69 | 58.44 | — | |||||||||||
Investor | 43.60 | 60.18 | 17.41 | |||||||||||
Class R6 | 45.31 | 66.55 | 17.50 | |||||||||||
Class R | 43.09 | 58.98 | 17.21 | |||||||||||
Class P | 45.30 | 66.55 | 17.49 | |||||||||||
| (a) | Includes loaned securities having a market value of $25,514,094 and $739,826 for Small Cap Value and Small/Mid Cap Value Funds, respectively. |
| (b) | Maximum public offering price per share for Class A Shares of the Mid Cap Value, Small Cap Value and Small/Mid Cap Value Funds is $47.32, $64.22 and $18.26, respectively. At redemption, Class C Shares may be subject to a contingent deferred sales charge, assessed on the amount equal to the lesser of the current net asset value (“NAV”) or the original purchase price of the shares. |
| 48 | The accompanying notes are an integral part of these financial statements. |
GOLDMAN SACHS FUNDAMENTAL EQUITY VALUE FUNDS
Statements of Operations
For the Fiscal Year Ended August 31, 2021
| Equity Income Fund | Focused Value Fund | Large Cap Value Fund | ||||||||||||
| Investment income: | ||||||||||||||
Dividends — unaffiliated issuers (net of foreign withholding taxes of $8,645, $632 and $10,975, respectively) | $ | 9,454,525 | $ | 381,013 | 8,034,615 | |||||||||
Securities lending income — unaffiliated issuer | 3,418 | — | — | |||||||||||
Dividends — affiliated issuers | 526 | 153 | 993 | |||||||||||
| Total investment income | 9,458,469 | 381,166 | 8,035,608 | |||||||||||
| Expenses: |
| |||||||||||||
Management fees | 2,662,116 | 170,423 | 3,388,259 | |||||||||||
Distribution and Service (12b-1) fees | 826,373 | 1,226 | 340,319 | |||||||||||
Transfer Agency fees | 536,032 | 8,264 | 287,330 | |||||||||||
Registration fees | 121,078 | 84,684 | 112,243 | |||||||||||
Professional fees | 110,302 | 103,372 | 101,763 | |||||||||||
Printing and mailing costs | 74,125 | 24,236 | 42,217 | |||||||||||
Custody, accounting and administrative services | 62,268 | 24,707 | 71,314 | |||||||||||
Trustee fees | 20,543 | 20,018 | 20,636 | |||||||||||
Service fees — Class C | 13,846 | 137 | 39,514 | |||||||||||
Shareholder Administration fees — Service Shares | 313 | — | 2,080 | |||||||||||
Other | 2,031 | 4,335 | 7,712 | |||||||||||
| Total expenses | 4,429,027 | 441,402 | 4,413,387 | |||||||||||
Less — expense reductions | (563,209 | ) | (261,045 | ) | (683,036 | ) | ||||||||
| Net expenses | 3,865,818 | 180,357 | 3,730,351 | |||||||||||
| NET INVESTMENT INCOME | 5,592,651 | 200,809 | 4,305,257 | |||||||||||
| Realized and unrealized gain (loss): | ||||||||||||||
Net realized gain (loss) from: | ||||||||||||||
Investments — unaffiliated issuers | 40,146,256 | 1,991,243 | 46,577,715 | |||||||||||
Foreign currency transactions | — | (7 | ) | (68 | ) | |||||||||
Net change in unrealized gain (loss) on: | ||||||||||||||
Investments — unaffiliated issuers | 44,279,659 | 4,369,956 | 75,981,715 | |||||||||||
Foreign currency translations | — | (2 | ) | 45 | ||||||||||
| Net realized and unrealized gain | 84,425,915 | 6,361,190 | 122,559,407 | |||||||||||
| NET INCREASE IN NET ASSETS RESULTING FROM OPERATIONS | $ | 90,018,566 | $ | 6,561,999 | $ | 126,864,664 | ||||||||
| Distribution and/or Service (12b-1) Fees | Transfer Agency Fees | |||||||||||||||||||||||||||||||||||||||||||||||
Fund | Class A | Class C | Service | Class R | Class A | Class C | Institutional | Service | Investor | Class R6 | Class R | Class P | ||||||||||||||||||||||||||||||||||||
Equity Income | $ | 778,292 | $ | 41,538 | $ | 313 | $ | 6,230 | $ | 498,111 | $ | 8,861 | $ | 11,486 | $ | 50 | $ | 4,761 | $ | 1,776 | $ | 1,994 | $ | 8,993 | ||||||||||||||||||||||||
Focused Value | 600 | 412 | — | 214 | 384 | 88 | 1,550 | — | 35 | 7 | 68 | 6,132 | ||||||||||||||||||||||||||||||||||||
Large Cap Value | 204,234 | 118,541 | 2,081 | 15,463 | 130,711 | 25,289 | 65,828 | 333 | 5,525 | 567 | 4,948 | 54,129 | ||||||||||||||||||||||||||||||||||||
| The accompanying notes are an integral part of these financial statements. | 49 |
GOLDMAN SACHS FUNDAMENTAL EQUITY VALUE FUNDS
Statements of Operations (continued)
For the Fiscal Year Ended August 31, 2021
| Mid Cap Value Fund | Small Cap Value Fund | Small/Mid Cap Value Fund | ||||||||||||
| Investment income: | ||||||||||||||
Dividends — unaffiliated issuers (net of foreign withholding taxes of $3,607, $42,321 and $1,175, respectively) | $ | 13,735,636 | $ | 57,862,654 | $ | 2,034,143 | ||||||||
Securities lending income — unaffiliated issuer | 5,386 | 188,156 | 1,089 | |||||||||||
Dividends — affiliated issuers | 1,455 | 7,005 | 575 | |||||||||||
| Total investment income | 13,742,477 | 58,057,815 | 2,035,807 | |||||||||||
| Expenses: |
| |||||||||||||
Management fees | 8,440,325 | 46,450,264 | 1,274,278 | |||||||||||
Distribution and Service (12b-1) fees | 1,513,151 | 1,581,343 | 13,685 | |||||||||||
Transfer Agency fees | 1,100,942 | 2,664,468 | 59,260 | |||||||||||
Custody, accounting and administrative services | 141,154 | 569,928 | 44,620 | |||||||||||
Registration fees | 134,352 | 166,841 | 127,533 | |||||||||||
Printing and mailing costs | 131,543 | 482,210 | 34,693 | |||||||||||
Professional fees | 100,613 | 103,533 | 102,483 | |||||||||||
Shareholder Administration fees — Service Shares | 80,854 | 88,488 | — | |||||||||||
Service fees — Class C | 36,659 | 6,206 | 3,231 | |||||||||||
Trustee fees | 21,665 | 26,056 | 20,222 | |||||||||||
Other | 16,872 | 151,134 | 8,483 | |||||||||||
| Total expenses | 11,718,130 | 52,290,471 | 1,688,488 | |||||||||||
Less — expense reductions | (5,613 | ) | (1,496,243 | ) | (334,353 | ) | ||||||||
| Net expenses | 11,712,517 | 50,794,228 | 1,354,135 | |||||||||||
| NET INVESTMENT INCOME | 2,029,960 | 7,263,587 | 681,672 | |||||||||||
| Realized and unrealized gain (loss): |
| |||||||||||||
Net realized gain (loss) from: | ||||||||||||||
Investments — unaffiliated issuers | 196,723,419 | 1,144,799,805 | 18,641,348 | |||||||||||
In-Kind redemptions | — | 60,216,076 | — | |||||||||||
Net change in unrealized gain (loss) on: | ||||||||||||||
Investments — unaffiliated issuers | 199,656,980 | 847,333,265 | 36,742,167 | |||||||||||
| Net realized and unrealized gain | 396,380,399 | 2,052,349,146 | 55,383,515 | |||||||||||
| NET INCREASE IN NET ASSETS RESULTING FROM OPERATIONS | $ | 398,410,359 | $ | 2,059,612,733 | $ | 56,065,187 | ||||||||
| Distribution and/or Service (12b-1) Fees | Transfer Agency Fees | |||||||||||||||||||||||||||||||||||||||||||||||
Fund | Class A | Class C | Service | Class R | Class A | Class C | Institutional | Service | Investor | Class R6 | Class R | Class P | ||||||||||||||||||||||||||||||||||||
Mid Cap Value | $ | 1,223,482 | $ | 109,977 | $ | 80,854 | $ | 98,838 | $ | 783,035 | $ | 23,462 | $ | 119,675 | $ | 12,937 | $ | 60,550 | $ | 20,696 | $ | 31,629 | $ | 48,958 | ||||||||||||||||||||||||
Small Cap Value | 1,158,863 | 18,617 | 88,488 | 315,375 | 741,678 | 3,972 | 1,057,008 | 14,158 | 234,517 | 426,884 | 100,921 | 85,330 | ||||||||||||||||||||||||||||||||||||
Small/Mid Cap Value | 3,573 | 9,694 | — | 418 | 2,286 | 2,068 | 5,183 | — | 8,040 | 22,839 | 134 | 18,710 | ||||||||||||||||||||||||||||||||||||
| 50 | The accompanying notes are an integral part of these financial statements. |
GOLDMAN SACHS FUNDAMENTAL EQUITY VALUE FUNDS
Statements of Changes in Net Assets
| Equity Income Fund | Focused Value Fund | |||||||||||||||||||||
| For the Fiscal Year Ended August 31, 2021 | For the Fiscal Year Ended August 31, 2020 | For the Fiscal Year Ended August 31, 2021 | For the Fiscal Year Ended August 31, 2020 | |||||||||||||||||||
| From operations: |
| |||||||||||||||||||||
Net investment income | $ | 5,592,651 | $ | 5,876,288 | $ | 200,809 | $ | 97,729 | ||||||||||||||
Net realized gain (loss) | 40,146,256 | (13,778,505 | ) | 1,991,236 | (263,076 | ) | ||||||||||||||||
Net change in unrealized gain | 44,279,659 | 17,898,586 | 4,369,954 | 749,647 | ||||||||||||||||||
| Net increase in net assets resulting from operations | 90,018,566 | 9,996,369 | 6,561,999 | 584,300 | ||||||||||||||||||
| Distributions to shareholders: | ||||||||||||||||||||||
From distributable earnings: | ||||||||||||||||||||||
Class A Shares | (4,116,697 | ) | (17,532,636 | ) | (2,864 | ) | (896 | ) | ||||||||||||||
Class C Shares | (34,681 | ) | (409,370 | ) | (390 | ) | (328 | ) | ||||||||||||||
Institutional Shares | (456,144 | ) | (1,216,336 | ) | (19,225 | ) | (13,526 | ) | ||||||||||||||
Service Shares | (1,462 | ) | (9,520 | ) | — | — | ||||||||||||||||
Investor Shares | (47,164 | ) | (148,693 | ) | (715 | ) | (521 | ) | ||||||||||||||
Class R6 Shares | (94,517 | ) | (352,619 | ) | (749 | ) | (557 | ) | ||||||||||||||
Class R Shares | (13,611 | ) | (83,278 | ) | (1,033 | ) | (358 | ) | ||||||||||||||
Class P Shares | (459,964 | ) | (751,373 | ) | (221,552 | ) | (141,442 | ) | ||||||||||||||
| Total distributions to shareholders | (5,224,240 | ) | (20,503,825 | ) | (246,528 | ) | (157,628 | ) | ||||||||||||||
| From share transactions: | ||||||||||||||||||||||
Proceeds from sales of shares | 38,748,349 | 27,017,610 | 28,455,067 | 5,277,622 | ||||||||||||||||||
Reinvestment of distributions | 5,118,773 | 20,013,288 | 246,528 | 157,628 | ||||||||||||||||||
Cost of shares redeemed | (52,150,664 | ) | (48,563,613 | ) | (5,136,268 | ) | (1,754,963 | ) | ||||||||||||||
| Net increase (decrease) in net assets resulting from share transactions | (8,283,542 | ) | (1,532,715 | ) | 23,565,327 | 3,680,287 | ||||||||||||||||
| TOTAL INCREASE (DECREASE) | 76,510,784 | (12,040,171 | ) | 29,880,798 | 4,106,959 | |||||||||||||||||
| Net assets: | ||||||||||||||||||||||
Beginning of year | 349,623,771 | 361,663,942 | 9,809,234 | 5,702,275 | ||||||||||||||||||
End of year | $ | 426,134,555 | $ | 349,623,771 | $ | 39,690,032 | $ | 9,809,234 | ||||||||||||||
| The accompanying notes are an integral part of these financial statements. | 51 |
GOLDMAN SACHS FUNDAMENTAL EQUITY VALUE FUNDS
Statements of Changes in Net Assets (continued)
| Large Cap Value Fund |
| Mid Cap Value Fund | ||||||||||||||||||||
| For the Fiscal Year Ended August 31, 2021 | For the Fiscal Year Ended August 31, 2020 | For the Fiscal Year Ended August 31, 2021 | For the Fiscal Year Ended August 31, 2020 | |||||||||||||||||||
| From operations: | ||||||||||||||||||||||
Net investment income | $ | 4,305,257 | $ | 5,602,606 | $ | 2,029,960 | $ | 6,756,368 | ||||||||||||||
Net realized gain (loss) | 46,577,647 | 11,871,508 | 196,723,419 | (18,287,118 | ) | |||||||||||||||||
Net change in unrealized gain (loss) | 75,981,760 | (8,987,506 | ) | 199,656,980 | 6,802,943 | |||||||||||||||||
| Net increase (decrease) in net assets resulting from operations | 126,864,664 | 8,486,608 | 398,410,359 | (4,727,807 | ) | |||||||||||||||||
| Distributions to shareholders: | ||||||||||||||||||||||
From distributable earnings: | ||||||||||||||||||||||
Class A Shares | (2,596,115 | ) | (4,777,394 | ) | (1,732,461 | ) | (15,695,026 | ) | ||||||||||||||
Class C Shares | (463,197 | ) | (1,128,907 | ) | — | (730,806 | ) | |||||||||||||||
Institutional Shares | (5,488,119 | ) | (8,924,042 | ) | (1,983,199 | ) | (11,197,871 | ) | ||||||||||||||
Service Shares | (26,170 | ) | (55,313 | ) | (69,711 | ) | (1,246,153 | ) | ||||||||||||||
Investor Shares | (118,038 | ) | (239,744 | ) | (214,960 | ) | (1,409,539 | ) | ||||||||||||||
Class R6 Shares | (68,223 | ) | (112,182 | ) | (461,696 | ) | (1,788,686 | ) | ||||||||||||||
Class R Shares | (95,537 | ) | (208,225 | ) | (26,075 | ) | (644,977 | ) | ||||||||||||||
Class P Shares | (5,747,841 | ) | (10,614,391 | ) | (1,049,073 | ) | (4,380,812 | ) | ||||||||||||||
From return of capital: | ||||||||||||||||||||||
Class A Shares | — | — | — | (496,723 | ) | |||||||||||||||||
Class C Shares | — | — | — | (23,129 | ) | |||||||||||||||||
Institutional Shares | — | — | — | (354,394 | ) | |||||||||||||||||
Service Shares | — | — | — | (39,439 | ) | |||||||||||||||||
Investor Shares | — | — | — | (44,610 | ) | |||||||||||||||||
Class R6 Shares | — | — | — | (56,609 | ) | |||||||||||||||||
Class R Shares | — | — | — | (20,412 | ) | |||||||||||||||||
Class P Shares | — | — | — | (138,646 | ) | |||||||||||||||||
| Total distributions to shareholders | (14,603,240 | ) | (26,060,198 | ) | (5,537,175 | ) | (38,267,832 | ) | ||||||||||||||
| From share transactions: | ||||||||||||||||||||||
Proceeds from sales of shares | 48,264,420 | 39,333,770 | 145,667,551 | 168,041,377 | ||||||||||||||||||
Reinvestment of distributions | 14,348,855 | 25,541,835 | 5,131,889 | 35,333,367 | ||||||||||||||||||
Cost of shares redeemed | (71,581,795 | ) | (126,591,157 | ) | (270,253,443 | ) | (387,348,378 | ) | ||||||||||||||
| Net decrease in net assets resulting from share transactions | (8,968,520 | ) | (61,715,552 | ) | (119,454,003 | ) | (183,973,634 | ) | ||||||||||||||
| TOTAL INCREASE (DECREASE) | 103,292,904 | (79,289,142 | ) | 273,419,181 | (226,969,273 | ) | ||||||||||||||||
| Net assets: | ||||||||||||||||||||||
Beginning of year | 396,378,614 | 475,667,756 | 977,393,768 | 1,204,363,041 | ||||||||||||||||||
End of year | $ | 499,671,518 | $ | 396,378,614 | $ | 1,250,812,949 | $ | 977,393,768 | ||||||||||||||
| 52 | The accompanying notes are an integral part of these financial statements. |
GOLDMAN SACHS FUNDAMENTAL EQUITY VALUE FUNDS
Statements of Changes in Net Assets (continued)
| Small Cap Value Fund | Small/Mid Cap Value Fund | |||||||||||||||||||||
| For the Fiscal Year Ended August 31, 2021 | For the Fiscal Year Ended August 31, 2020 | For the Fiscal Year Ended August 31, 2021 | For the Fiscal Year Ended August 31, 2020 | |||||||||||||||||||
| From operations: |
| |||||||||||||||||||||
Net investment income | $ | 7,263,587 | $ | 34,972,897 | $ | 681,672 | $ | 854,786 | ||||||||||||||
Net realized gain (loss) | 1,205,015,881 | (193,640,071 | ) | 18,641,348 | (8,209,215 | ) | ||||||||||||||||
Net change in unrealized gain (loss) | 847,333,265 | (309,976,878 | ) | 36,742,167 | 1,696,171 | |||||||||||||||||
| Net increase (decrease) in net assets resulting from operations | 2,059,612,733 | (468,644,052 | ) | 56,065,187 | (5,658,258 | ) | ||||||||||||||||
| Distributions to shareholders: |
| |||||||||||||||||||||
From distributable earnings: | ||||||||||||||||||||||
Class A Shares | (884,665 | ) | (27,617,788 | ) | (4,199 | ) | (7,146 | ) | ||||||||||||||
Class C Shares | — | (455,913 | ) | — | — | |||||||||||||||||
Institutional Shares | (13,501,670 | ) | (150,441,897 | ) | (60,427 | ) | (64,934 | ) | ||||||||||||||
Service Shares | (18,081 | ) | (2,760,504 | ) | — | — | ||||||||||||||||
Investor Shares | (585,487 | ) | (7,064,182 | ) | (7,543 | ) | (29,922 | ) | ||||||||||||||
Class R6 Shares | (7,311,413 | ) | (65,209,388 | ) | (439,348 | ) | (605,200 | ) | ||||||||||||||
Class R Shares | — | (3,705,297 | ) | — | (584 | ) | ||||||||||||||||
Class P Shares | (1,337,472 | ) | (10,863,518 | ) | (332,143 | ) | (508,457 | ) | ||||||||||||||
| Total distributions to shareholders | (23,638,788 | ) | (268,118,487 | ) | (843,660 | ) | (1,216,243 | ) | ||||||||||||||
| From share transactions: |
| |||||||||||||||||||||
Proceeds from sales of shares | 1,182,845,461 | 1,187,909,742 | 98,655,098 | 19,961,483 | ||||||||||||||||||
Reinvestment of distributions | 23,006,155 | 258,783,478 | 842,799 | 1,215,128 | ||||||||||||||||||
Cost of shares redeemed | (2,958,322,797 | ) | (1,736,309,339 | ) | (30,854,997 | ) | (31,021,453 | ) | ||||||||||||||
| Net increase (decrease) in net assets resulting from share transactions | (1,752,471,181 | ) | (289,616,119 | ) | 68,642,900 | (9,844,842 | ) | |||||||||||||||
| TOTAL INCREASE (DECREASE) | 283,502,764 | (1,026,378,658 | ) | 123,864,427 | (16,719,343 | ) | ||||||||||||||||
| Net assets: | ||||||||||||||||||||||
Beginning of year | 4,519,142,564 | 5,545,521,222 | 101,157,162 | 117,876,505 | ||||||||||||||||||
End of year | $ | 4,802,645,328 | $ | 4,519,142,564 | $ | 225,021,589 | $ | 101,157,162 | ||||||||||||||
| The accompanying notes are an integral part of these financial statements. | 53 |
GOLDMAN SACHS EQUITY INCOME FUND
Selected Share Data for a Share Outstanding Throughout Each Year
| (a) | Calculated based on the average shares outstanding methodology. |
| (b) | Assumes investment at the NAV at the beginning of the year, reinvestment of all dividends and distributions, a complete redemption of the investment at the NAV at the end of the year and no sales or redemption charges (if any). Total returns would be reduced if a sales or redemption charge was taken into account. Returns do not reflect the impact of taxes to shareholders relating to Fund distributions or the redemption of Fund shares. |
| (c) | The Fund’s portfolio turnover rate is calculated in accordance with regulatory requirements, without regard to transactions involving short term investments. If such transactions were included, the Fund’s portfolio turnover rate may be higher. |
| 54 | The accompanying notes are an integral part of these financial statements. |
GOLDMAN SACHS EQUITY INCOME FUND
Financial Highlights (continued)
Selected Share Data for a Share Outstanding Throughout Each Year
| Goldman Sachs Equity Income Fund | ||||||||||||||||||||||
| Class C Shares | ||||||||||||||||||||||
| Year Ended August 31, | ||||||||||||||||||||||
| 2021 | 2020 | 2019 | 2018 | 2017 | ||||||||||||||||||
| Per Share Data |
| |||||||||||||||||||||
Net asset value, beginning of year | $ | 36.06 | $ | 37.12 | $ | 36.41 | $ | 33.50 | $ | 31.01 | ||||||||||||
Net investment income(a) | 0.26 | 0.34 | 0.38 | 0.37 | 0.33 | |||||||||||||||||
Net realized and unrealized gain | 8.82 | 0.54 | 0.96 | 2.98 | 2.48 | |||||||||||||||||
Total from investment operations | 9.08 | 0.88 | 1.34 | 3.35 | 2.81 | |||||||||||||||||
Distributions to shareholders from net investment income | (0.25 | ) | (0.37 | ) | (0.33 | ) | (0.44 | ) | (0.32 | ) | ||||||||||||
Distributions to shareholders from net realized gains | — | (1.57 | ) | (0.30 | ) | — | — | |||||||||||||||
Total distributions | (0.25 | ) | (1.94 | ) | (0.63 | ) | (0.44 | ) | (0.32 | ) | ||||||||||||
Net asset value, end of year | $ | 44.89 | $ | 36.06 | $ | 37.12 | $ | 36.41 | $ | 33.50 | ||||||||||||
| Total Return(b) | 25.26 | % | 2.33 | % | 3.82 | % | 10.06 | % | 9.10 | % | ||||||||||||
Net assets, end of year (in 000’s) | $ | 6,026 | $ | 5,477 | $ | 8,116 | $ | 16,982 | $ | 18,460 | ||||||||||||
Ratio of net expenses to average net assets | 1.79 | % | 1.83 | % | 1.85 | % | 1.87 | % | 1.88 | % | ||||||||||||
Ratio of total expenses to average net assets | 1.95 | % | 2.00 | % | 2.00 | % | 2.02 | % | 1.99 | % | ||||||||||||
Ratio of net investment income to average net assets | 0.65 | % | 0.94 | % | 1.05 | % | 1.06 | % | 1.02 | % | ||||||||||||
Portfolio turnover rate(c) | 44 | % | 42 | % | 42 | % | 69 | % | 43 | % | ||||||||||||
| (a) | Calculated based on the average shares outstanding methodology. |
| (b) | Assumes investment at the NAV at the beginning of the year, reinvestment of all dividends and distributions, a complete redemption of the investment at the NAV at the end of the year and no sales or redemption charges (if any). Total returns would be reduced if a sales or redemption charge was taken into account. Returns do not reflect the impact of taxes to shareholders relating to Fund distributions or the redemption of Fund shares. |
| (c) | The Fund’s portfolio turnover rate is calculated in accordance with regulatory requirements, without regard to transactions involving short term investments. If such transactions were included, the Fund’s portfolio turnover rate may be higher. |
| The accompanying notes are an integral part of these financial statements. | 55 |
GOLDMAN SACHS EQUITY INCOME FUND
Financial Highlights (continued)
Selected Share Data for a Share Outstanding Throughout Each Year
| Goldman Sachs Equity Income Fund | ||||||||||||||||||||||
| Institutional Shares | ||||||||||||||||||||||
| Year Ended August 31, | ||||||||||||||||||||||
| 2021 | 2020 | 2019 | 2018 | 2017 | ||||||||||||||||||
| Per Share Data |
| |||||||||||||||||||||
Net asset value, beginning of year | $ | 38.65 | $ | 39.66 | $ | 38.92 | $ | 35.77 | $ | 33.07 | ||||||||||||
Net investment income(a) | 0.75 | 0.76 | 0.83 | 0.81 | 0.77 | |||||||||||||||||
Net realized and unrealized gain | 9.44 | 0.58 | 1.01 | 3.18 | 2.64 | |||||||||||||||||
Total from investment operations | 10.19 | 1.34 | 1.84 | 3.99 | 3.41 | |||||||||||||||||
Distributions to shareholders from net investment income | (0.69 | ) | (0.78 | ) | (0.80 | ) | (0.84 | ) | (0.71 | ) | ||||||||||||
Distributions to shareholders from net realized gains | — | (1.57 | ) | (0.30 | ) | — | — | |||||||||||||||
Total distributions | (0.69 | ) | (2.35 | ) | (1.10 | ) | (0.84 | ) | (0.71 | ) | ||||||||||||
Net asset value, end of year | $ | 48.15 | $ | 38.65 | $ | 39.66 | $ | 38.92 | $ | 35.77 | ||||||||||||
| Total Return(b) | 26.63 | % | 3.41 | % | 4.94 | % | 11.30 | % | 10.38 | % | ||||||||||||
Net assets, end of year (in 000’s) | $ | 33,660 | $ | 22,592 | $ | 19,906 | $ | 24,658 | $ | 37,415 | ||||||||||||
Ratio of net expenses to average net assets | 0.73 | % | 0.74 | % | 0.73 | % | 0.73 | % | 0.73 | % | ||||||||||||
Ratio of total expenses to average net assets | 0.83 | % | 0.86 | % | 0.86 | % | 0.87 | % | 0.84 | % | ||||||||||||
Ratio of net investment income to average net assets | 1.73 | % | 2.00 | % | 2.17 | % | 2.17 | % | 2.19 | % | ||||||||||||
Portfolio turnover rate(c) | 44 | % | 42 | % | 42 | % | 69 | % | 43 | % | ||||||||||||
| (a) | Calculated based on the average shares outstanding methodology. |
| (b) | Assumes investment at the NAV at the beginning of the year, reinvestment of all dividends and distributions, a complete redemption of the investment at the NAV at the end of the year and no sales or redemption charges (if any). Total returns would be reduced if a sales or redemption charge was taken into account. Returns do not reflect the impact of taxes to shareholders relating to Fund distributions or the redemption of Fund shares. |
| (c) | The Fund’s portfolio turnover rate is calculated in accordance with regulatory requirements, without regard to transactions involving short term investments. If such transactions were included, the Fund’s portfolio turnover rate may be higher. |
| 56 | The accompanying notes are an integral part of these financial statements. |
GOLDMAN SACHS EQUITY INCOME FUND
Financial Highlights (continued)
Selected Share Data for a Share Outstanding Throughout Each Year
| Goldman Sachs Equity Income Fund | ||||||||||||||||||||||
| Service Shares | ||||||||||||||||||||||
| Year Ended August 31, | ||||||||||||||||||||||
| 2021 | 2020 | 2019 | 2018 | 2017 | ||||||||||||||||||
| Per Share Data |
| |||||||||||||||||||||
Net asset value, beginning of year | $ | 38.08 | $ | 39.10 | $ | 38.39 | $ | 35.28 | $ | 32.53 | ||||||||||||
Net investment income(a) | 0.48 | 0.57 | 0.61 | 0.63 | 0.57 | |||||||||||||||||
Net realized and unrealized gain | 9.35 | 0.57 | 1.01 | 3.13 | 2.61 | |||||||||||||||||
Total from investment operations | 9.83 | 1.14 | 1.62 | 3.76 | 3.18 | |||||||||||||||||
Distributions to shareholders from net investment income | (0.46 | ) | (0.59 | ) | (0.61 | ) | (0.65 | ) | (0.43 | ) | ||||||||||||
Distributions to shareholders from net realized gains | — | (1.57 | ) | (0.30 | ) | — | — | |||||||||||||||
Total distributions | (0.46 | ) | (2.16 | ) | (0.91 | ) | (0.65 | ) | (0.43 | ) | ||||||||||||
Net asset value, end of year | $ | 47.45 | $ | 38.08 | $ | 39.10 | $ | 38.39 | $ | 35.28 | ||||||||||||
| Total Return(b) | 26.01 | % | 2.89 | % | 4.40 | % | 10.77 | % | 9.84 | % | ||||||||||||
Net assets, end of year (in 000’s) | $ | 103 | $ | 161 | $ | 175 | $ | 84 | $ | 86 | ||||||||||||
Ratio of net expenses to average net assets | 1.23 | % | 1.24 | % | 1.23 | % | 1.23 | % | 1.23 | % | ||||||||||||
Ratio of total expenses to average net assets | 1.33 | % | 1.37 | % | 1.36 | % | 1.38 | % | 1.33 | % | ||||||||||||
Ratio of net investment income to average net assets | 1.16 | % | 1.52 | % | 1.60 | % | 1.70 | % | 1.66 | % | ||||||||||||
Portfolio turnover rate(c) | 44 | % | 42 | % | 42 | % | 69 | % | 43 | % | ||||||||||||
| (a) | Calculated based on the average shares outstanding methodology. |
| (b) | Assumes investment at the NAV at the beginning of the year, reinvestment of all dividends and distributions, a complete redemption of the investment at the NAV at the end of the year and no sales or redemption charges (if any). Total returns would be reduced if a sales or redemption charge was taken into account. Returns do not reflect the impact of taxes to shareholders relating to Fund distributions or the redemption of Fund shares. |
| (c) | The Fund’s portfolio turnover rate is calculated in accordance with regulatory requirements, without regard to transactions involving short term investments. If such transactions were included, the Fund’s portfolio turnover rate may be higher. |
| The accompanying notes are an integral part of these financial statements. | 57 |
GOLDMAN SACHS EQUITY INCOME FUND
Financial Highlights (continued)
Selected Share Data for a Share Outstanding Throughout Each Year
| Goldman Sachs Equity Income Fund | ||||||||||||||||||||||
| Investor Shares | ||||||||||||||||||||||
| Year Ended August 31, | ||||||||||||||||||||||
| 2021 | 2020 | 2019 | 2018 | 2017 | ||||||||||||||||||
| Per Share Data |
| |||||||||||||||||||||
Net asset value, beginning of year | $ | 37.88 | $ | 38.91 | $ | 38.20 | $ | 35.12 | $ | 32.49 | ||||||||||||
Net investment income(a) | 0.69 | 0.71 | 0.76 | 0.76 | 0.75 | |||||||||||||||||
Net realized and unrealized gain | 9.27 | 0.58 | 1.00 | 3.11 | 2.55 | |||||||||||||||||
Total from investment operations | 9.96 | 1.29 | 1.76 | 3.87 | 3.30 | |||||||||||||||||
Distributions to shareholders from net investment income | (0.66 | ) | (0.75 | ) | (0.75 | ) | (0.79 | ) | (0.67 | ) | ||||||||||||
Distributions to shareholders from net realized gains | — | (1.57 | ) | (0.30 | ) | — | — | |||||||||||||||
Total distributions | (0.66 | ) | (2.32 | ) | (1.05 | ) | (0.79 | ) | (0.67 | ) | ||||||||||||
Net asset value, end of year | $ | 47.18 | $ | 37.88 | $ | 38.91 | $ | 38.20 | $ | 35.12 | ||||||||||||
| Total Return(b) | 26.54 | % | 3.33 | % | 4.82 | % | 11.15 | % | 10.21 | % | ||||||||||||
Net assets, end of year (in 000’s) | $ | 3,042 | $ | 2,384 | $ | 2,321 | $ | 2,851 | $ | 2,623 | ||||||||||||
Ratio of net expenses to average net assets | 0.80 | % | 0.83 | % | 0.85 | % | 0.87 | % | 0.88 | % | ||||||||||||
Ratio of total expenses to average net assets | 0.95 | % | 0.99 | % | 1.00 | % | 1.02 | % | 1.00 | % | ||||||||||||
Ratio of net investment income to average net assets | 1.66 | % | 1.92 | % | 2.04 | % | 2.07 | % | 2.17 | % | ||||||||||||
Portfolio turnover rate(c) | 44 | % | 42 | % | 42 | % | 69 | % | 43 | % | ||||||||||||
| (a) | Calculated based on the average shares outstanding methodology. |
| (b) | Assumes investment at the NAV at the beginning of the year, reinvestment of all dividends and distributions, a complete redemption of the investment at the NAV at the end of the year and no sales or redemption charges (if any). Total returns would be reduced if a sales or redemption charge was taken into account. Returns do not reflect the impact of taxes to shareholders relating to Fund distributions or the redemption of Fund shares. |
| (c) | The Fund’s portfolio turnover rate is calculated in accordance with regulatory requirements, without regard to transactions involving short term investments. If such transactions were included, the Fund’s portfolio turnover rate may be higher. |
| 58 | The accompanying notes are an integral part of these financial statements. |
GOLDMAN SACHS EQUITY INCOME FUND
Financial Highlights (continued)
Selected Share Data for a Share Outstanding Throughout Each Year
| Goldman Sachs Equity Income Fund | ||||||||||||||||||||||
| Class R6 Shares | ||||||||||||||||||||||
| Year Ended August 31, | ||||||||||||||||||||||
| 2021 | 2020 | 2019 | 2018 | 2017 | ||||||||||||||||||
| Per Share Data |
| |||||||||||||||||||||
Net asset value, beginning of year | $ | 38.65 | $ | 39.66 | $ | 38.92 | $ | 35.76 | $ | 33.06 | ||||||||||||
Net investment income(a) | 0.75 | 0.76 | 0.80 | 0.83 | 0.77 | |||||||||||||||||
Net realized and unrealized gain | 9.44 | 0.58 | 1.04 | 3.17 | 2.64 | |||||||||||||||||
Total from investment operations | 10.19 | 1.34 | 1.84 | 4.00 | 3.41 | |||||||||||||||||
Distributions to shareholders from net investment income | (0.69 | ) | (0.78 | ) | (0.80 | ) | (0.84 | ) | (0.71 | ) | ||||||||||||
Distributions to shareholders from net realized gains | — | (1.57 | ) | (0.30 | ) | — | — | |||||||||||||||
Total distributions | (0.69 | ) | (2.35 | ) | (1.10 | ) | (0.84 | ) | (0.71 | ) | ||||||||||||
Net asset value, end of year | $ | 48.15 | $ | 38.65 | $ | 39.66 | $ | 38.92 | $ | 35.76 | ||||||||||||
| Total Return(b) | 26.64 | % | 3.42 | % | 4.95 | % | 11.34 | % | 10.39 | % | ||||||||||||
Net assets, end of year (in 000’s) | $ | 6,981 | $ | 5,378 | $ | 5,973 | $ | 13 | $ | 11 | ||||||||||||
Ratio of net expenses to average net assets | 0.72 | % | 0.73 | % | 0.72 | % | 0.72 | % | 0.73 | % | ||||||||||||
Ratio of total expenses to average net assets | 0.82 | % | 0.86 | % | 0.85 | % | 0.86 | % | 0.84 | % | ||||||||||||
Ratio of net investment income to average net assets | 1.73 | % | 2.00 | % | 2.08 | % | 2.22 | % | 2.20 | % | ||||||||||||
Portfolio turnover rate(c) | 44 | % | 42 | % | 42 | % | 69 | % | 43 | % | ||||||||||||
| (a) | Calculated based on the average shares outstanding methodology. |
| (b) | Assumes investment at the NAV at the beginning of the year, reinvestment of all dividends and distributions, a complete redemption of the investment at the NAV at the end of the year and no sales or redemption charges (if any). Total returns would be reduced if a sales or redemption charge was taken into account. Returns do not reflect the impact of taxes to shareholders relating to Fund distributions or the redemption of Fund shares. |
| (c) | The Fund’s portfolio turnover rate is calculated in accordance with regulatory requirements, without regard to transactions involving short term investments. If such transactions were included, the Fund’s portfolio turnover rate may be higher. |
| The accompanying notes are an integral part of these financial statements. | 59 |
GOLDMAN SACHS EQUITY INCOME FUND
Financial Highlights (continued)
Selected Share Data for a Share Outstanding Throughout Each Year
| Goldman Sachs Equity Income Fund | ||||||||||||||||||||||
| Class R Shares | ||||||||||||||||||||||
| Year Ended August 31, | ||||||||||||||||||||||
| 2021 | 2020 | 2019 | 2018 | 2017 | ||||||||||||||||||
| Per Share Data |
| |||||||||||||||||||||
Net asset value, beginning of year | $ | 37.73 | $ | 38.75 | $ | 38.05 | $ | 34.98 | $ | 32.35 | ||||||||||||
Net investment income(a) | 0.49 | 0.53 | 0.57 | 0.57 | 0.53 | |||||||||||||||||
Net realized and unrealized gain | 9.22 | 0.57 | 1.00 | 3.10 | 2.59 | |||||||||||||||||
Total from investment operations | 9.71 | 1.10 | 1.57 | 3.67 | 3.12 | |||||||||||||||||
Distributions to shareholders from net investment income | (0.46 | ) | (0.55 | ) | (0.57 | ) | (0.60 | ) | (0.49 | ) | ||||||||||||
Distributions to shareholders from net realized gains | — | (1.57 | ) | (0.30 | ) | — | — | |||||||||||||||
Total distributions | (0.46 | ) | (2.12 | ) | (0.87 | ) | (0.60 | ) | (0.49 | ) | ||||||||||||
Net asset value, end of year | $ | 46.98 | $ | 37.73 | $ | 38.75 | $ | 38.05 | $ | 34.98 | ||||||||||||
| Total Return(b) | 25.91 | % | 2.82 | % | 4.29 | % | 10.59 | % | 9.68 | % | ||||||||||||
Net assets, end of year (in 000’s) | $ | 1,337 | $ | 1,131 | $ | 1,525 | $ | 1,492 | $ | 1,571 | ||||||||||||
Ratio of net expenses to average net assets | 1.29 | % | 1.33 | % | 1.34 | % | 1.37 | % | 1.38 | % | ||||||||||||
Ratio of total expenses to average net assets | 1.45 | % | 1.50 | % | 1.50 | % | 1.52 | % | 1.49 | % | ||||||||||||
Ratio of net investment income to average net assets | 1.15 | % | 1.42 | % | 1.54 | % | 1.55 | % | 1.54 | % | ||||||||||||
Portfolio turnover rate(c) | 44 | % | 42 | % | 42 | % | 69 | % | 43 | % | ||||||||||||
| (a) | Calculated based on the average shares outstanding methodology. |
| (b) | Assumes investment at the NAV at the beginning of the year, reinvestment of all dividends and distributions, a complete redemption of the investment at the NAV at the end of the year and no sales or redemption charges (if any). Total returns would be reduced if a sales or redemption charge was taken into account. Returns do not reflect the impact of taxes to shareholders relating to Fund distributions or the redemption of Fund shares. |
| (c) | The Fund’s portfolio turnover rate is calculated in accordance with regulatory requirements, without regard to transactions involving short term investments. If such transactions were included, the Fund’s portfolio turnover rate may be higher. |
| 60 | The accompanying notes are an integral part of these financial statements. |
GOLDMAN SACHS EQUITY INCOME FUND
Financial Highlights (continued)
Selected Share Data for a Share Outstanding Throughout Each Period
| Goldman Sachs Equity Income Fund | ||||||||||||||||||
| Class P Shares | ||||||||||||||||||
| Year Ended August 31, | Period Ended August 31, 2018(a) | |||||||||||||||||
| 2021 | 2020 | 2019 | ||||||||||||||||
| Per Share Data |
| |||||||||||||||||
Net asset value, beginning of period | $ | 38.64 | $ | 39.65 | $ | 38.92 | $ | 37.37 | ||||||||||
Net investment income(b) | 0.76 | 0.76 | 0.82 | 0.31 | ||||||||||||||
Net realized and unrealized gain | 9.43 | 0.59 | 1.01 | 1.48 | ||||||||||||||
Total from investment operations | 10.19 | 1.35 | 1.83 | 1.79 | ||||||||||||||
Distributions to shareholders from net investment income | (0.69 | ) | (0.79 | ) | (0.80 | ) | (0.24 | ) | ||||||||||
Distributions to shareholders from net realized gains | — | (1.57 | ) | (0.30 | ) | — | ||||||||||||
Total distributions | (0.69 | ) | (2.36 | ) | (1.10 | ) | (0.24 | ) | ||||||||||
Net asset value, end of period | $ | 48.14 | $ | 38.64 | $ | 39.65 | $ | 38.92 | ||||||||||
| Total Return(c) | 26.65 | % | 3.43 | % | 4.92 | % | 4.84 | % | ||||||||||
Net assets, end of period (in 000’s) | $ | 40,099 | $ | 20,492 | $ | 11,500 | $ | 10,835 | ||||||||||
Ratio of net expenses to average net assets | 0.72 | % | 0.73 | % | 0.72 | % | 0.72 | %(d) | ||||||||||
Ratio of total expenses to average net assets | 0.82 | % | 0.85 | % | 0.85 | % | 0.95 | %(d) | ||||||||||
Ratio of net investment income to average net assets | 1.74 | % | 2.04 | % | 2.16 | % | 2.20 | %(d) | ||||||||||
Portfolio turnover rate(e) | 44 | % | 42 | % | 42 | % | 69 | % | ||||||||||
| (a) | Commenced operations on April 17, 2018. |
| (b) | Calculated based on the average shares outstanding methodology. |
| (c) | Assumes investment at the NAV at the beginning of the period, reinvestment of all dividends and distributions, a complete redemption of the investment at the NAV at the end of the period and no sales or redemption charges (if any). Total returns would be reduced if a sales or redemption charge was taken into account. Returns do not reflect the impact of taxes to shareholders relating to Fund distributions or the redemption of Fund shares. Total returns for periods less than one full year are not annualized. |
| (d) | Annualized. |
| (e) | The Fund’s portfolio turnover rate is calculated in accordance with regulatory requirements, without regard to transactions involving short term investments. If such transactions were included, the Fund’s portfolio turnover rate may be higher. |
| The accompanying notes are an integral part of these financial statements. | 61 |
GOLDMAN SACHS FOCUSED VALUE FUND
Financial Highlights (continued)
Selected Share Data for a Share Outstanding Throughout Each Year
| (a) | Calculated based on the average shares outstanding methodology. |
| (b) | Assumes investment at the NAV at the beginning of the year, reinvestment of all dividends and distributions, a complete redemption of the investment at the NAV at the end of the year and no sales or redemption charges (if any). Total returns would be reduced if a sales or redemption charge was taken into account. Returns do not reflect the impact of taxes to shareholders relating to Fund distributions or the redemption of Fund shares. |
| (c) | The Fund’s portfolio turnover rate is calculated in accordance with regulatory requirements, without regard to transactions involving short term investments. If such transactions were included, the Fund’s portfolio turnover rate may be higher. |
| 62 | The accompanying notes are an integral part of these financial statements. |
GOLDMAN SACHS FOCUSED VALUE FUND
Financial Highlights (continued)
Selected Share Data for a Share Outstanding Throughout Each Year
| Goldman Sachs Focused Value Fund | ||||||||||||||||||||||
| Class C Shares | ||||||||||||||||||||||
| Year Ended August 31, | ||||||||||||||||||||||
| 2021 | 2020 | 2019 | 2018 | 2017 | ||||||||||||||||||
| Per Share Data |
| |||||||||||||||||||||
Net asset value, beginning of year | $ | 11.11 | $ | 10.60 | $ | 11.03 | $ | 11.05 | $ | 9.84 | ||||||||||||
Net investment income (loss)(a) | (0.03 | ) | 0.01 | — | (0.03 | ) | 0.03 | |||||||||||||||
Net realized and unrealized gain | 3.71 | 0.61 | 0.09 | 0.87 | 1.21 | |||||||||||||||||
Total from investment operations | 3.68 | 0.62 | 0.09 | 0.84 | 1.24 | |||||||||||||||||
Distributions to shareholders from net investment income | — | — | (0.01 | ) | — | (0.03 | ) | |||||||||||||||
Distributions to shareholders from net realized gains | (0.14 | ) | (0.11 | ) | (0.51 | ) | (0.86 | ) | — | |||||||||||||
Total distributions | (0.14 | ) | (0.11 | ) | (0.52 | ) | (0.86 | ) | (0.03 | ) | ||||||||||||
Net asset value, end of year | $ | 14.65 | $ | 11.11 | $ | 10.60 | $ | 11.03 | $ | 11.05 | ||||||||||||
| Total Return(b) | 33.34 | % | 5.85 | % | 1.27 | % | 7.87 | % | 12.64 | % | ||||||||||||
Net assets, end of year (in 000’s) | $ | 49 | $ | 32 | $ | 30 | $ | 30 | $ | 48 | ||||||||||||
Ratio of net expenses to average net assets | 1.79 | % | 1.85 | % | 1.85 | % | 1.87 | % | 1.88 | % | ||||||||||||
Ratio of total expenses to average net assets | 2.99 | % | 5.81 | % | 8.79 | % | 5.77 | % | 8.66 | % | ||||||||||||
Ratio of net investment income (loss) to average net assets | (0.24 | )% | 0.06 | % | 0.05 | % | (0.24 | )% | 0.25 | % | ||||||||||||
Portfolio turnover rate(c) | 78 | % | 102 | % | 122 | % | 204 | % | 126 | % | ||||||||||||
| (a) | Calculated based on the average shares outstanding methodology. |
| (b) | Assumes investment at the NAV at the beginning of the year, reinvestment of all dividends and distributions, a complete redemption of the investment at the NAV at the end of the year and no sales or redemption charges (if any). Total returns would be reduced if a sales or redemption charge was taken into account. Returns do not reflect the impact of taxes to shareholders relating to Fund distributions or the redemption of Fund shares. |
| (c) | The Fund’s portfolio turnover rate is calculated in accordance with regulatory requirements, without regard to transactions involving short term investments. If such transactions were included, the Fund’s portfolio turnover rate may be higher. |
| The accompanying notes are an integral part of these financial statements. | 63 |
GOLDMAN SACHS FOCUSED VALUE FUND
Financial Highlights (continued)
Selected Share Data for a Share Outstanding Throughout Each Year
| Goldman Sachs Focused Value Fund | ||||||||||||||||||||||
| Institutional Shares | ||||||||||||||||||||||
| Year Ended August 31, | ||||||||||||||||||||||
| 2021 | 2020 | 2019 | 2018 | 2017 | ||||||||||||||||||
| Per Share Data |
| |||||||||||||||||||||
Net asset value, beginning of year | $ | 11.29 | $ | 10.72 | $ | 11.13 | $ | 11.14 | $ | 9.92 | ||||||||||||
Net investment income(a) | 0.11 | 0.12 | 0.12 | 0.09 | 0.15 | |||||||||||||||||
Net realized and unrealized gain | 3.77 | 0.63 | 0.08 | 0.88 | 1.21 | |||||||||||||||||
Total from investment operations | 3.88 | 0.75 | 0.20 | 0.97 | 1.36 | |||||||||||||||||
Distributions to shareholders from net investment income | (0.11 | ) | (0.07 | ) | (0.10 | ) | (0.12 | ) | (0.14 | ) | ||||||||||||
Distributions to shareholders from net realized gains | (0.14 | ) | (0.11 | ) | (0.51 | ) | (0.86 | ) | — | |||||||||||||
Total distributions | (0.25 | ) | (0.18 | ) | (0.61 | ) | (0.98 | ) | (0.14 | ) | ||||||||||||
Net asset value, end of year | $ | 14.92 | $ | 11.29 | $ | 10.72 | $ | 11.13 | $ | 11.14 | ||||||||||||
| Total Return(b) | 34.80 | % | 7.00 | % | 2.47 | % | 9.06 | % | 13.79 | % | ||||||||||||
Net assets, end of year (in 000’s) | $ | 5,999 | $ | 871 | $ | 776 | $ | 1,007 | $ | 4,802 | ||||||||||||
Ratio of net expenses to average net assets | 0.73 | % | 0.76 | % | 0.73 | % | 0.73 | % | 0.73 | % | ||||||||||||
Ratio of total expenses to average net assets | 1.65 | % | 4.65 | % | 7.57 | % | 4.40 | % | 7.40 | % | ||||||||||||
Ratio of net investment income to average net assets | 0.82 | % | 1.13 | % | 1.16 | % | 0.86 | % | 1.39 | % | ||||||||||||
Portfolio turnover rate(c) | 78 | % | 102 | % | 122 | % | 204 | % | 126 | % | ||||||||||||
| (a) | Calculated based on the average shares outstanding methodology. |
| (b) | Assumes investment at the NAV at the beginning of the year, reinvestment of all dividends and distributions, a complete redemption of the investment at the NAV at the end of the year and no sales or redemption charges (if any). Total returns would be reduced if a sales or redemption charge was taken into account. Returns do not reflect the impact of taxes to shareholders relating to Fund distributions or the redemption of Fund shares. |
| (c) | The Fund’s portfolio turnover rate is calculated in accordance with regulatory requirements, without regard to transactions involving short term investments. If such transactions were included, the Fund’s portfolio turnover rate may be higher. |
| 64 | The accompanying notes are an integral part of these financial statements. |
GOLDMAN SACHS FOCUSED VALUE FUND
Financial Highlights (continued)
Selected Share Data for a Share Outstanding Throughout Each Year
| Goldman Sachs Focused Value Fund | ||||||||||||||||||||||
| Investor Shares | ||||||||||||||||||||||
| Year Ended August 31, | ||||||||||||||||||||||
| 2021 | 2020 | 2019 | 2018 | 2017 | ||||||||||||||||||
| Per Share Data |
| |||||||||||||||||||||
Net asset value, beginning of year | $ | 11.26 | $ | 10.69 | $ | 11.13 | $ | 11.13 | $ | 9.91 | ||||||||||||
Net investment income(a) | 0.09 | 0.11 | 0.11 | 0.08 | 0.13 | |||||||||||||||||
Net realized and unrealized gain | 3.77 | 0.63 | 0.07 | 0.88 | 1.22 | |||||||||||||||||
Total from investment operations | 3.86 | 0.74 | 0.18 | 0.96 | 1.35 | |||||||||||||||||
Distributions to shareholders from net investment income | (0.10 | ) | (0.06 | ) | (0.11 | ) | (0.10 | ) | (0.13 | ) | ||||||||||||
Distributions to shareholders from net realized gains | (0.14 | ) | (0.11 | ) | (0.51 | ) | (0.86 | ) | — | |||||||||||||
Total distributions | (0.24 | ) | (0.17 | ) | (0.62 | ) | (0.96 | ) | (0.13 | ) | ||||||||||||
Net asset value, end of year | $ | 14.88 | $ | 11.26 | $ | 10.69 | $ | 11.13 | $ | 11.13 | ||||||||||||
| Total Return(b) | 34.71 | % | 6.92 | % | 2.26 | % | 9.01 | % | 13.65 | % | ||||||||||||
Net assets, end of year (in 000’s) | $ | 13 | $ | 34 | $ | 32 | $ | 31 | $ | 28 | ||||||||||||
Ratio of net expenses to average net assets | 0.80 | % | 0.85 | % | 0.85 | % | 0.87 | % | 0.88 | % | ||||||||||||
Ratio of total expenses to average net assets | 2.61 | % | 4.81 | % | 7.79 | % | 4.77 | % | 7.61 | % | ||||||||||||
Ratio of net investment income to average net assets | 0.69 | % | 1.04 | % | 1.05 | % | 0.72 | % | 1.20 | % | ||||||||||||
Portfolio turnover rate(c) | 78 | % | 102 | % | 122 | % | 204 | % | 126 | % | ||||||||||||
| (a) | Calculated based on the average shares outstanding methodology. |
| (b) | Assumes investment at the NAV at the beginning of the year, reinvestment of all dividends and distributions, a complete redemption of the investment at the NAV at the end of the year and no sales or redemption charges (if any). Total returns would be reduced if a sales or redemption charge was taken into account. Returns do not reflect the impact of taxes to shareholders relating to Fund distributions or the redemption of Fund shares. |
| (c) | The Fund’s portfolio turnover rate is calculated in accordance with regulatory requirements, without regard to transactions involving short term investments. If such transactions were included, the Fund’s portfolio turnover rate may be higher. |
| The accompanying notes are an integral part of these financial statements. | 65 |
GOLDMAN SACHS FOCUSED VALUE FUND
Financial Highlights (continued)
Selected Share Data for a Share Outstanding Throughout Each Year
| Goldman Sachs Focused Value Fund | ||||||||||||||||||||||
| Class R6 Shares | ||||||||||||||||||||||
| Year Ended August 31, | ||||||||||||||||||||||
| 2021 | 2020 | 2019 | 2018 | 2017 | ||||||||||||||||||
| Per Share Data |
| |||||||||||||||||||||
Net asset value, beginning of year | $ | 11.27 | $ | 10.71 | $ | 11.14 | $ | 11.15 | $ | 9.92 | ||||||||||||
Net investment income(a) | 0.10 | 0.12 | 0.12 | 0.10 | 0.15 | |||||||||||||||||
Net realized and unrealized gain | 3.77 | 0.62 | 0.09 | 0.87 | 1.22 | |||||||||||||||||
Total from investment operations | 3.87 | 0.74 | 0.21 | 0.97 | 1.37 | |||||||||||||||||
Distributions to shareholders from net investment income | (0.11 | ) | (0.07 | ) | (0.13 | ) | (0.12 | ) | (0.14 | ) | ||||||||||||
Distributions to shareholders from net realized gains | (0.14 | ) | (0.11 | ) | (0.51 | ) | (0.86 | ) | — | |||||||||||||
Total distributions | (0.25 | ) | (0.18 | ) | (0.64 | ) | (0.98 | ) | (0.14 | ) | ||||||||||||
Net asset value, end of year | $ | 14.89 | $ | 11.27 | $ | 10.71 | $ | 11.14 | $ | 11.15 | ||||||||||||
| Total Return(b) | 34.79 | % | 6.92 | % | 2.52 | % | 9.06 | % | 13.91 | % | ||||||||||||
Net assets, end of year (in 000’s) | $ | 13 | $ | 34 | $ | 32 | $ | 31 | $ | 28 | ||||||||||||
Ratio of net expenses to average net assets | 0.72 | % | 0.75 | % | 0.72 | % | 0.72 | % | 0.71 | % | ||||||||||||
Ratio of total expenses to average net assets | 2.48 | % | 4.67 | % | 7.64 | % | 4.64 | % | 7.46 | % | ||||||||||||
Ratio of net investment income to average net assets | 0.77 | % | 1.13 | % | 1.16 | % | 0.87 | % | 1.37 | % | ||||||||||||
Portfolio turnover rate(c) | 78 | % | 102 | % | 122 | % | 204 | % | 126 | % | ||||||||||||
| (a) | Calculated based on the average shares outstanding methodology. |
| (b) | Assumes investment at the NAV at the beginning of the year, reinvestment of all dividends and distributions, a complete redemption of the investment at the NAV at the end of the year and no sales or redemption charges (if any). Total returns would be reduced if a sales or redemption charge was taken into account. Returns do not reflect the impact of taxes to shareholders relating to Fund distributions or the redemption of Fund shares. |
| (c) | The Fund’s portfolio turnover rate is calculated in accordance with regulatory requirements, without regard to transactions involving short term investments. If such transactions were included, the Fund’s portfolio turnover rate may be higher. |
| 66 | The accompanying notes are an integral part of these financial statements. |
GOLDMAN SACHS FOCUSED VALUE FUND
Financial Highlights (continued)
Selected Share Data for a Share Outstanding Throughout Each Year
| Goldman Sachs Focused Value Fund | ||||||||||||||||||||||
| Class R Shares | ||||||||||||||||||||||
| Year Ended August 31, | ||||||||||||||||||||||
| 2021 | 2020 | 2019 | 2018 | 2017 | ||||||||||||||||||
| Per Share Data |
| |||||||||||||||||||||
Net asset value, beginning of year | $ | 11.20 | $ | 10.65 | $ | 11.07 | $ | 11.09 | $ | 9.88 | ||||||||||||
Net investment income(a) | 0.03 | 0.06 | 0.06 | 0.02 | 0.07 | |||||||||||||||||
Net realized and unrealized gain | 3.74 | 0.61 | 0.09 | 0.87 | 1.22 | |||||||||||||||||
Total from investment operations | 3.77 | 0.67 | 0.15 | 0.89 | 1.29 | |||||||||||||||||
Distributions to shareholders from net investment income | (0.07 | ) | (0.01 | ) | (0.06 | ) | (0.05 | ) | (0.08 | ) | ||||||||||||
Distributions to shareholders from net realized gains | (0.14 | ) | (0.11 | ) | (0.51 | ) | (0.86 | ) | — | |||||||||||||
Total distributions | (0.21 | ) | (0.12 | ) | (0.57 | ) | (0.91 | ) | (0.08 | ) | ||||||||||||
Net asset value, end of year | $ | 14.76 | $ | 11.20 | $ | 10.65 | $ | 11.07 | $ | 11.09 | ||||||||||||
| Total Return(b) | 34.04 | % | 6.27 | % | 1.91 | % | 8.35 | % | 13.08 | % | ||||||||||||
Net assets, end of year (in 000’s) | $ | 43 | $ | 33 | $ | 31 | $ | 30 | $ | 28 | ||||||||||||
Ratio of net expenses to average net assets | 1.29 | % | 1.35 | % | 1.35 | % | 1.37 | % | 1.38 | % | ||||||||||||
Ratio of total expenses to average net assets | 2.69 | % | 5.31 | % | 8.29 | % | 5.27 | % | 8.12 | % | ||||||||||||
Ratio of net investment income to average net assets | 0.23 | % | 0.55 | % | 0.54 | % | 0.22 | % | 0.70 | % | ||||||||||||
Portfolio turnover rate(c) | 78 | % | 102 | % | 122 | % | 204 | % | 126 | % | ||||||||||||
| (a) | Calculated based on the average shares outstanding methodology. |
| (b) | Assumes investment at the NAV at the beginning of the year, reinvestment of all dividends and distributions, a complete redemption of the investment at the NAV at the end of the year and no sales or redemption charges (if any). Total returns would be reduced if a sales or redemption charge was taken into account. Returns do not reflect the impact of taxes to shareholders relating to Fund distributions or the redemption of Fund shares. |
| (c) | The Fund’s portfolio turnover rate is calculated in accordance with regulatory requirements, without regard to transactions involving short term investments. If such transactions were included, the Fund’s portfolio turnover rate may be higher. |
| The accompanying notes are an integral part of these financial statements. | 67 |
GOLDMAN SACHS FOCUSED VALUE FUND
Financial Highlights (continued)
Selected Share Data for a Share Outstanding Throughout Each Period
| Goldman Sachs Focused Value Fund | ||||||||||||||||||
| Class P Shares | ||||||||||||||||||
| Year Ended August 31, | Period Ended August 31, 2018(a) | |||||||||||||||||
| 2021 | 2020 | 2019 | ||||||||||||||||
| Per Share Data |
| |||||||||||||||||
Net asset value, beginning of period | $ | 11.28 | $ | 10.71 | $ | 11.15 | $ | 10.54 | ||||||||||
Net investment income(b) | 0.11 | 0.12 | 0.12 | 0.04 | ||||||||||||||
Net realized and unrealized gain | 3.76 | 0.63 | 0.08 | 0.57 | ||||||||||||||
Total from investment operations | 3.87 | 0.75 | 0.20 | 0.61 | ||||||||||||||
Distributions to shareholders from net investment income | (0.11 | ) | (0.07 | ) | (0.13 | ) | — | |||||||||||
Distributions to shareholders from net realized gains | (0.14 | ) | (0.11 | ) | (0.51 | ) | — | |||||||||||
Total distributions | (0.25 | ) | (0.18 | ) | (0.64 | ) | — | |||||||||||
Net asset value, end of period | $ | 14.90 | $ | 11.28 | $ | 10.71 | $ | 11.15 | ||||||||||
| Total Return(c) | 34.76 | % | 7.03 | % | 2.44 | % | 5.79 | % | ||||||||||
Net assets, end of period (in 000’s) | $ | 33,202 | $ | 8,657 | $ | 4,739 | $ | 5,652 | ||||||||||
Ratio of net expenses to average net assets | 0.72 | % | 0.74 | % | 0.72 | % | 0.72 | %(d) | ||||||||||
Ratio of total expenses to average net assets | 1.80 | % | 4.45 | % | 7.47 | % | 5.91 | %(d) | ||||||||||
Ratio of net investment income to average net assets | 0.82 | % | 1.16 | % | 1.16 | % | 0.89 | %(d) | ||||||||||
Portfolio turnover rate(e) | 78 | % | 102 | % | 122 | % | 204 | % | ||||||||||
| (a) | Commenced operations on April 17, 2018. |
| (b) | Calculated based on the average shares outstanding methodology. |
| (c) | Assumes investment at the NAV at the beginning of the period, reinvestment of all dividends and distributions, a complete redemption of the investment at the NAV at the end of the period and no sales or redemption charges (if any). Total returns would be reduced if a sales or redemption charge was taken into account. Returns do not reflect the impact of taxes to shareholders relating to Fund distributions or the redemption of Fund shares. Total returns for periods less than one full year are not annualized. |
| (d) | Annualized. |
| (e) | The Fund’s portfolio turnover rate is calculated in accordance with regulatory requirements, without regard to transactions involving short term investments. If such transactions were included, the Fund’s portfolio turnover rate may be higher. |
| 68 | The accompanying notes are an integral part of these financial statements. |
GOLDMAN SACHS LARGE CAP VALUE FUND
Financial Highlights (continued)
Selected Share Data for a Share Outstanding Throughout Each Year
| (a) | Calculated based on the average shares outstanding methodology. |
| (b) | Assumes investment at the NAV at the beginning of the year, reinvestment of all dividends and distributions, a complete redemption of the investment at the NAV at the end of the year and no sales or redemption charges (if any). Total returns would be reduced if a sales or redemption charge was taken into account. Returns do not reflect the impact of taxes to shareholders relating to Fund distributions or the redemption of Fund shares. |
| (c) | The Fund’s portfolio turnover rate is calculated in accordance with regulatory requirements, without regard to transactions involving short term investments. If such transactions were included, the Fund’s portfolio turnover rate may be higher. |
| The accompanying notes are an integral part of these financial statements. | 69 |
GOLDMAN SACHS LARGE CAP VALUE FUND
Financial Highlights (continued)
Selected Share Data for a Share Outstanding Throughout Each Year
| Goldman Sachs Large Cap Value Fund | ||||||||||||||||||||||
| Class C Shares | ||||||||||||||||||||||
| Year Ended August 31, | ||||||||||||||||||||||
| 2021 | 2020 | 2019 | 2018 | 2017 | ||||||||||||||||||
| Per Share Data |
| |||||||||||||||||||||
Net asset value, beginning of year | $ | 13.12 | $ | 13.64 | $ | 15.32 | $ | 16.51 | $ | 15.43 | ||||||||||||
Net investment income(a) | | — | | 0.05 | 0.05 | 0.01 | 0.07 | |||||||||||||||
Net realized and unrealized gain (loss) | 4.06 | 0.17 | (0.22 | ) | 1.29 | 1.19 | ||||||||||||||||
Total from investment operations | 4.06 | 0.22 | (0.17 | ) | 1.30 | 1.26 | ||||||||||||||||
Distributions to shareholders from net investment income | (0.05 | ) | (0.07 | ) | — | (0.13 | ) | (0.18 | ) | |||||||||||||
Distributions to shareholders from net realized gains | (0.33 | ) | (0.67 | ) | (1.51 | ) | (2.36 | ) | — | |||||||||||||
Total distributions | (0.38 | ) | (0.74 | ) | (1.51 | ) | (2.49 | ) | (0.18 | ) | ||||||||||||
Net asset value, end of year | $ | 16.80 | $ | 13.12 | $ | 13.64 | $ | 15.32 | $ | 16.51 | ||||||||||||
| Total Return(b) | 31.59 | % | 1.21 | % | (0.28 | )% | 8.46 | % | 8.18 | % | ||||||||||||
Net assets, end of year (in 000’s) | $ | 12,948 | $ | 17,422 | $ | 21,481 | $ | 36,819 | $ | 39,403 | ||||||||||||
Ratio of net expenses to average net assets | 1.79 | % | 1.82 | % | 1.86 | % | 1.86 | % | 1.89 | % | ||||||||||||
Ratio of total expenses to average net assets | 1.99 | % | 2.03 | % | 2.03 | % | 1.99 | % | 1.97 | % | ||||||||||||
Ratio of net investment income to average net assets | 0.00 | % | 0.39 | % | 0.35 | % | 0.06 | % | 0.41 | % | ||||||||||||
Portfolio turnover rate(c) | 53 | % | 64 | % | 62 | % | 171 | % | 124 | % | ||||||||||||
| (a) | Calculated based on the average shares outstanding methodology. |
| (b) | Assumes investment at the NAV at the beginning of the year, reinvestment of all dividends and distributions, a complete redemption of the investment at the NAV at the end of the year and no sales or redemption charges (if any). Total returns would be reduced if a sales or redemption charge was taken into account. Returns do not reflect the impact of taxes to shareholders relating to Fund distributions or the redemption of Fund shares. |
| (c) | The Fund’s portfolio turnover rate is calculated in accordance with regulatory requirements, without regard to transactions involving short term investments. If such transactions were included, the Fund’s portfolio turnover rate may be higher. |
| 70 | The accompanying notes are an integral part of these financial statements. |
GOLDMAN SACHS LARGE CAP VALUE FUND
Financial Highlights (continued)
Selected Share Data for a Share Outstanding Throughout Each Year
| Goldman Sachs Large Cap Value Fund | ||||||||||||||||||||||
| Institutional Shares | ||||||||||||||||||||||
| Year Ended August 31, | ||||||||||||||||||||||
| 2021 | 2020 | 2019 | 2018 | 2017 | ||||||||||||||||||
| Per Share Data |
| |||||||||||||||||||||
Net asset value, beginning of year | $ | 14.08 | $ | 14.58 | $ | 16.32 | $ | 17.42 | $ | 16.25 | ||||||||||||
Net investment income(a) | 0.17 | 0.20 | 0.21 | 0.19 | 0.25 | |||||||||||||||||
Net realized and unrealized gain (loss) | 4.37 | 0.19 | (0.26 | ) | 1.36 | 1.27 | ||||||||||||||||
Total from investment operations | 4.54 | 0.39 | (0.05 | ) | 1.55 | 1.52 | ||||||||||||||||
Distributions to shareholders from net investment income | (0.21 | ) | (0.22 | ) | (0.18 | ) | (0.28 | ) | (0.35 | ) | ||||||||||||
Distributions to shareholders from net realized gains | (0.33 | ) | (0.67 | ) | (1.51 | ) | (2.37 | ) | — | |||||||||||||
Total distributions | (0.54 | ) | (0.89 | ) | (1.69 | ) | (2.65 | ) | (0.35 | ) | ||||||||||||
Net asset value, end of year | $ | 18.08 | $ | 14.08 | $ | 14.58 | $ | 16.32 | $ | 17.42 | ||||||||||||
| Total Return(b) | 33.08 | % | 2.26 | % | 0.69 | % | 9.65 | % | 9.41 | % | ||||||||||||
Net assets, end of year (in 000’s) | $ | 181,806 | $ | 140,814 | $ | 177,613 | $ | 174,803 | $ | 645,552 | ||||||||||||
Ratio of net expenses to average net assets | 0.73 | % | 0.76 | % | 0.79 | % | 0.79 | % | 0.78 | % | ||||||||||||
Ratio of total expenses to average net assets | 0.87 | % | 0.90 | % | 0.89 | % | 0.85 | % | 0.82 | % | ||||||||||||
Ratio of net investment income to average net assets | 1.04 | % | 1.43 | % | 1.42 | % | 1.13 | % | 1.46 | % | ||||||||||||
Portfolio turnover rate(c) | 53 | % | 64 | % | 62 | % | 171 | % | 124 | % | ||||||||||||
| (a) | Calculated based on the average shares outstanding methodology. |
| (b) | Assumes investment at the NAV at the beginning of the year, reinvestment of all dividends and distributions, a complete redemption of the investment at the NAV at the end of the year and no sales or redemption charges (if any). Total returns would be reduced if a sales or redemption charge was taken into account. Returns do not reflect the impact of taxes to shareholders relating to Fund distributions or the redemption of Fund shares. |
| (c) | The Fund’s portfolio turnover rate is calculated in accordance with regulatory requirements, without regard to transactions involving short term investments. If such transactions were included, the Fund’s portfolio turnover rate may be higher. |
| The accompanying notes are an integral part of these financial statements. | 71 |
GOLDMAN SACHS LARGE CAP VALUE FUND
Financial Highlights (continued)
Selected Share Data for a Share Outstanding Throughout Each Year
| Goldman Sachs Large Cap Value Fund | ||||||||||||||||||||||
| Service Shares | ||||||||||||||||||||||
| Year Ended August 31, | ||||||||||||||||||||||
| 2021 | 2020 | 2019 | 2018 | 2017 | ||||||||||||||||||
| Per Share Data |
| |||||||||||||||||||||
Net asset value, beginning of year | $ | 13.86 | $ | 14.36 | $ | 16.03 | $ | 17.14 | $ | 15.99 | ||||||||||||
Net investment income(a) | 0.09 | 0.13 | 0.13 | 0.10 | 0.17 | |||||||||||||||||
Net realized and unrealized gain (loss) | 4.29 | 0.19 | (0.24 | ) | 1.35 | 1.23 | ||||||||||||||||
Total from investment operations | 4.38 | 0.32 | (0.11 | ) | 1.45 | 1.40 | ||||||||||||||||
Distributions to shareholders from net investment income | (0.13 | ) | (0.15 | ) | (0.05 | ) | (0.20 | ) | (0.25 | ) | ||||||||||||
Distributions to shareholders from net realized gains | (0.33 | ) | (0.67 | ) | (1.51 | ) | (2.36 | ) | — | |||||||||||||
Total distributions | (0.46 | ) | (0.82 | ) | (1.56 | ) | (2.56 | ) | (0.25 | ) | ||||||||||||
Net asset value, end of year | $ | 17.78 | $ | 13.86 | $ | 14.36 | $ | 16.03 | $ | 17.14 | ||||||||||||
| Total Return(b) | 32.36 | % | 1.80 | % | 0.20 | % | 9.15 | % | 8.80 | % | ||||||||||||
Net assets, end of year (in 000’s) | $ | 846 | $ | 836 | $ | 1,004 | $ | 1,201 | $ | 2,914 | ||||||||||||
Ratio of net expenses to average net assets | 1.23 | % | 1.26 | % | 1.29 | % | 1.29 | % | 1.28 | % | ||||||||||||
Ratio of total expenses to average net assets | 1.37 | % | 1.40 | % | 1.39 | % | 1.35 | % | 1.32 | % | ||||||||||||
Ratio of net investment income to average net assets | 0.55 | % | 0.94 | % | 0.91 | % | 0.64 | % | 1.01 | % | ||||||||||||
Portfolio turnover rate(c) | 53 | % | 64 | % | 62 | % | 171 | % | 124 | % | ||||||||||||
| (a) | Calculated based on the average shares outstanding methodology. |
| (b) | Assumes investment at the NAV at the beginning of the year, reinvestment of all dividends and distributions, a complete redemption of the investment at the NAV at the end of the year and no sales or redemption charges (if any). Total returns would be reduced if a sales or redemption charge was taken into account. Returns do not reflect the impact of taxes to shareholders relating to Fund distributions or the redemption of Fund shares. |
| (c) | The Fund’s portfolio turnover rate is calculated in accordance with regulatory requirements, without regard to transactions involving short term investments. If such transactions were included, the Fund’s portfolio turnover rate may be higher. |
| 72 | The accompanying notes are an integral part of these financial statements. |
GOLDMAN SACHS LARGE CAP VALUE FUND
Financial Highlights (continued)
Selected Share Data for a Share Outstanding Throughout Each Year
| Goldman Sachs Large Cap Value Fund | ||||||||||||||||||||||
| Investor Shares | ||||||||||||||||||||||
| Year Ended August 31, | ||||||||||||||||||||||
| 2021 | 2020 | 2019 | 2018 | 2017 | ||||||||||||||||||
| Per Share Data |
| |||||||||||||||||||||
Net asset value, beginning of year | $ | 13.93 | $ | 14.43 | $ | 16.17 | $ | 17.28 | $ | 16.11 | ||||||||||||
Net investment income(a) | 0.16 | 0.19 | 0.20 | 0.17 | 0.25 | |||||||||||||||||
Net realized and unrealized gain (loss) | 4.31 | 0.19 | (0.26 | ) | 1.36 | 1.23 | ||||||||||||||||
Total from investment operations | 4.47 | 0.38 | (0.06 | ) | 1.53 | 1.48 | ||||||||||||||||
Distributions to shareholders from net investment income | (0.20 | ) | (0.21 | ) | (0.17 | ) | (0.27 | ) | (0.31 | ) | ||||||||||||
Distributions to shareholders from net realized gains | (0.33 | ) | (0.67 | ) | (1.51 | ) | (2.37 | ) | — | |||||||||||||
Total distributions | (0.53 | ) | (0.88 | ) | (1.68 | ) | (2.64 | ) | (0.31 | ) | ||||||||||||
Net asset value, end of year | $ | 17.87 | $ | 13.93 | $ | 14.43 | $ | 16.17 | $ | 17.28 | ||||||||||||
| Total Return(b) | 32.92 | % | 2.22 | % | 0.64 | % | 9.61 | % | 9.26 | % | ||||||||||||
Net assets, end of year (in 000’s) | $ | 3,559 | $ | 3,460 | $ | 4,191 | $ | 7,447 | $ | 6,516 | ||||||||||||
Ratio of net expenses to average net assets | 0.79 | % | 0.82 | % | 0.86 | % | 0.86 | % | 0.88 | % | ||||||||||||
Ratio of total expenses to average net assets | 0.99 | % | 1.03 | % | 1.03 | % | 0.99 | % | 0.97 | % | ||||||||||||
Ratio of net investment income to average net assets | 0.99 | % | 1.37 | % | 1.35 | % | 1.06 | % | 1.47 | % | ||||||||||||
Portfolio turnover rate(c) | 53 | % | 64 | % | 62 | % | 171 | % | 124 | % | ||||||||||||
| (a) | Calculated based on the average shares outstanding methodology. |
| (b) | Assumes investment at the NAV at the beginning of the year, reinvestment of all dividends and distributions, a complete redemption of the investment at the NAV at the end of the year and no sales or redemption charges (if any). Total returns would be reduced if a sales or redemption charge was taken into account. Returns do not reflect the impact of taxes to shareholders relating to Fund distributions or the redemption of Fund shares. |
| (c) | The Fund’s portfolio turnover rate is calculated in accordance with regulatory requirements, without regard to transactions involving short term investments. If such transactions were included, the Fund’s portfolio turnover rate may be higher. |
| The accompanying notes are an integral part of these financial statements. | 73 |
GOLDMAN SACHS LARGE CAP VALUE FUND
Financial Highlights (continued)
Selected Share Data for a Share Outstanding Throughout Each Year
| Goldman Sachs Large Cap Value Fund | ||||||||||||||||||||||
| Class R6 Shares | ||||||||||||||||||||||
| Year Ended August 31, | ||||||||||||||||||||||
| 2021 | 2020 | 2019 | 2018 | 2017 | ||||||||||||||||||
| Per Share Data |
| |||||||||||||||||||||
Net asset value, beginning of year | $ | 14.43 | $ | 14.92 | $ | 16.66 | $ | 17.45 | $ | 16.25 | ||||||||||||
Net investment income(a) | 0.17 | 0.21 | 0.22 | 0.18 | 0.21 | |||||||||||||||||
Net realized and unrealized gain (loss) | 4.48 | 0.19 | (0.26 | ) | 1.39 | 1.34 | ||||||||||||||||
Total from investment operations | 4.65 | 0.40 | (0.04 | ) | 1.57 | 1.55 | ||||||||||||||||
Distributions to shareholders from net investment income | (0.21 | ) | (0.22 | ) | (0.19 | ) | — | (0.35 | ) | |||||||||||||
Distributions to shareholders from net realized gains | (0.33 | ) | (0.67 | ) | (1.51 | ) | (2.36 | ) | — | |||||||||||||
Total distributions | (0.54 | ) | (0.89 | ) | (1.70 | ) | (2.36 | ) | (0.35 | ) | ||||||||||||
Net asset value, end of year | $ | 18.54 | $ | 14.43 | $ | 14.92 | $ | 16.66 | $ | 17.45 | ||||||||||||
| Total Return(b) | 33.05 | % | 2.29 | % | 0.73 | % | 9.67 | % | 9.63 | % | ||||||||||||
Net assets, end of year (in 000’s) | $ | 1,958 | $ | 1,636 | $ | 2,172 | $ | 1,106 | $ | 11 | ||||||||||||
Ratio of net expenses to average net assets | 0.72 | % | 0.75 | % | 0.78 | % | 0.78 | % | 0.76 | % | ||||||||||||
Ratio of total expenses to average net assets | 0.86 | % | 0.89 | % | 0.89 | % | 0.85 | % | 0.79 | % | ||||||||||||
Ratio of net investment income to average net assets | 1.06 | % | 1.43 | % | 1.44 | % | 1.12 | % | 1.27 | % | ||||||||||||
Portfolio turnover rate(c) | 53 | % | 64 | % | 62 | % | 171 | % | 124 | % | ||||||||||||
| (a) | Calculated based on the average shares outstanding methodology. |
| (b) | Assumes investment at the NAV at the beginning of the year, reinvestment of all dividends and distributions, a complete redemption of the investment at the NAV at the end of the year and no sales or redemption charges (if any). Total returns would be reduced if a sales or redemption charge was taken into account. Returns do not reflect the impact of taxes to shareholders relating to Fund distributions or the redemption of Fund shares. |
| (c) | The Fund’s portfolio turnover rate is calculated in accordance with regulatory requirements, without regard to transactions involving short term investments. If such transactions were included, the Fund’s portfolio turnover rate may be higher. |
| 74 | The accompanying notes are an integral part of these financial statements. |
GOLDMAN SACHS LARGE CAP VALUE FUND
Financial Highlights (continued)
Selected Share Data for a Share Outstanding Throughout Each Year
| Goldman Sachs Large Cap Value Fund | ||||||||||||||||||||||
| Class R Shares | ||||||||||||||||||||||
| Year Ended August 31, | ||||||||||||||||||||||
| 2021 | 2020 | 2019 | 2018 | 2017 | ||||||||||||||||||
| Per Share Data |
| |||||||||||||||||||||
Net asset value, beginning of year | $ | 13.47 | $ | 13.97 | $ | 15.71 | $ | 16.86 | $ | 15.73 | ||||||||||||
Net investment income(a) | 0.07 | 0.12 | 0.12 | 0.09 | 0.15 | |||||||||||||||||
Net realized and unrealized gain (loss) | 4.18 | 0.17 | (0.25 | ) | 1.32 | 1.22 | ||||||||||||||||
Total from investment operations | 4.25 | 0.29 | (0.13 | ) | 1.41 | 1.37 | ||||||||||||||||
Distributions to shareholders from net investment income | (0.12 | ) | (0.12 | ) | (0.10 | ) | (0.20 | ) | (0.24 | ) | ||||||||||||
Distributions to shareholders from net realized gains | (0.33 | ) | (0.67 | ) | (1.51 | ) | (2.36 | ) | — | |||||||||||||
Total distributions | (0.45 | ) | (0.79 | ) | (1.61 | ) | (2.56 | ) | (0.24 | ) | ||||||||||||
Net asset value, end of year | $ | 17.27 | $ | 13.47 | $ | 13.97 | $ | 15.71 | $ | 16.86 | ||||||||||||
| Total Return(b) | 32.32 | % | 1.70 | % | 0.12 | % | 9.05 | % | 8.73 | % | ||||||||||||
Net assets, end of year (in 000’s) | $ | 3,269 | $ | 2,932 | $ | 4,008 | $ | 5,252 | $ | 6,204 | ||||||||||||
Ratio of net expenses to average net assets | 1.29 | % | 1.32 | % | 1.36 | % | 1.36 | % | 1.39 | % | ||||||||||||
Ratio of total expenses to average net assets | 1.49 | % | 1.53 | % | 1.53 | % | 1.49 | % | 1.47 | % | ||||||||||||
Ratio of net investment income to average net assets | 0.49 | % | 0.89 | % | 0.85 | % | 0.56 | % | 0.90 | % | ||||||||||||
Portfolio turnover rate(c) | 53 | % | 64 | % | 62 | % | 171 | % | 124 | % | ||||||||||||
| (a) | Calculated based on the average shares outstanding methodology. |
| (b) | Assumes investment at the NAV at the beginning of the year, reinvestment of all dividends and distributions, a complete redemption of the investment at the NAV at the end of the year and no sales or redemption charges (if any). Total returns would be reduced if a sales or redemption charge was taken into account. Returns do not reflect the impact of taxes to shareholders relating to Fund distributions or the redemption of Fund shares. |
| (c) | The Fund’s portfolio turnover rate is calculated in accordance with regulatory requirements, without regard to transactions involving short term investments. If such transactions were included, the Fund’s portfolio turnover rate may be higher. |
| The accompanying notes are an integral part of these financial statements. | 75 |
GOLDMAN SACHS LARGE CAP VALUE FUND
Financial Highlights (continued)
Selected Share Data for a Share Outstanding Throughout Each Period
| Goldman Sachs Large Cap Value Fund | ||||||||||||||||||
| Class P Shares | ||||||||||||||||||
| Year Ended August 31, | Period Ended August 31, 2018(a) | |||||||||||||||||
| 2021 | 2020 | 2019 | ||||||||||||||||
| Per Share Data |
| |||||||||||||||||
Net asset value, beginning of period | $ | 14.43 | $ | 14.92 | $ | 16.66 | $ | 15.81 | ||||||||||
Net investment income(b) | 0.17 | 0.21 | 0.21 | 0.08 | ||||||||||||||
Net realized and unrealized gain (loss) | 4.48 | 0.19 | (0.25 | ) | 0.77 | |||||||||||||
Total from investment operations | 4.65 | 0.40 | (0.04 | ) | 0.85 | |||||||||||||
Distributions to shareholders from net investment income | (0.21 | ) | (0.22 | ) | (0.19 | ) | — | |||||||||||
Distributions to shareholders from net realized gains | (0.33 | ) | (0.67 | ) | (1.51 | ) | — | |||||||||||
Total distributions | (0.54 | ) | (0.89 | ) | (1.70 | ) | — | |||||||||||
Net asset value, end of period | $ | 18.54 | $ | 14.43 | $ | 14.92 | $ | 16.66 | ||||||||||
| Total Return(c) | 33.05 | % | 2.29 | % | 0.74 | % | 5.38 | % | ||||||||||
Net assets, end of period (in 000’s) | $ | 207,926 | $ | 154,720 | $ | 180,475 | $ | 248,012 | ||||||||||
Ratio of net expenses to average net assets | 0.72 | % | 0.75 | % | 0.78 | % | 0.78 | %(d) | ||||||||||
Ratio of total expenses to average net assets | 0.86 | % | 0.89 | % | 0.88 | % | 0.85 | %(d) | ||||||||||
Ratio of net investment income to average net assets | 1.05 | % | 1.45 | % | 1.43 | % | 1.26 | %(d) | ||||||||||
Portfolio turnover rate(e) | 53 | % | 64 | % | 62 | % | 171 | % | ||||||||||
| (a) | Commenced operations on April 17, 2018. |
| (b) | Calculated based on the average shares outstanding methodology. |
| (c) | Assumes investment at the NAV at the beginning of the period, reinvestment of all dividends and distributions, a complete redemption of the investment at the NAV at the end of the period and no sales or redemption charges (if any). Total returns would be reduced if a sales or redemption charge was taken into account. Returns do not reflect the impact of taxes to shareholders relating to Fund distributions or the redemption of Fund shares. Total returns for periods less than one full year are not annualized. |
| (d) | Annualized. |
| (e) | The Fund’s portfolio turnover rate is calculated in accordance with regulatory requirements, without regard to transactions involving short term investments. If such transactions were included, the Fund’s portfolio turnover rate may be higher. |
| 76 | The accompanying notes are an integral part of these financial statements. |
GOLDMAN SACHS MID CAP VALUE FUND
Financial Highlights (continued)
Selected Share Data for a Share Outstanding Throughout Each Year
| (a) | Calculated based on the average shares outstanding methodology. |
| (b) | Assumes investment at the NAV at the beginning of the year, reinvestment of all dividends and distributions, a complete redemption of the investment at the NAV at the end of the year and no sales or redemption charges (if any). Total returns would be reduced if a sales or redemption charge was taken into account. Returns do not reflect the impact of taxes to shareholders relating to Fund distributions or the redemption of Fund shares. |
| (c) | The Fund’s portfolio turnover rate is calculated in accordance with regulatory requirements, without regard to transactions involving short term investments. If such transactions were included, the Fund’s portfolio turnover rate may be higher. |
| The accompanying notes are an integral part of these financial statements. | 77 |
GOLDMAN SACHS MID CAP VALUE FUND
Financial Highlights (continued)
Selected Share Data for a Share Outstanding Throughout Each Year
| Goldman Sachs Mid Cap Value Fund | ||||||||||||||||||||||
| Class C Shares | ||||||||||||||||||||||
| Year Ended August 31, | ||||||||||||||||||||||
| 2021 | 2020 | 2019 | 2018 | 2017 | ||||||||||||||||||
| Per Share Data |
| |||||||||||||||||||||
Net asset value, beginning of year | $ | 27.00 | $ | 28.10 | $ | 32.59 | $ | 34.68 | $ | 32.00 | ||||||||||||
Net investment loss(a) | (0.24 | ) | (0.02 | ) | (0.07 | ) | (0.17 | ) | (0.09 | ) | ||||||||||||
Net realized and unrealized gain (loss) | 11.77 | (0.24 | ) | 0.29 | 3.33 | 2.92 | ||||||||||||||||
Total from investment operations | 11.53 | (0.26 | ) | 0.22 | 3.16 | 2.83 | ||||||||||||||||
Distributions to shareholders from net investment income | — | — | — | — | (0.15 | ) | ||||||||||||||||
Distributions to shareholders from net realized gains | — | (0.81 | ) | (4.71 | ) | (5.25 | ) | — | ||||||||||||||
Distributions to shareholders from return of capital | — | (0.03 | ) | — | — | — | ||||||||||||||||
Total distributions | — | (0.84 | ) | (4.71 | ) | (5.25 | ) | (0.15 | ) | |||||||||||||
Net asset value, end of year | $ | 38.53 | $ | 27.00 | $ | 28.10 | $ | 32.59 | $ | 34.68 | ||||||||||||
| Total Return(b) | 42.70 | % | (1.14 | )% | 2.58 | % | 9.86 | % | 8.86 | % | ||||||||||||
Net assets, end of year (in 000’s) | $ | 12,836 | $ | 16,230 | $ | 28,175 | $ | 78,897 | $ | 102,928 | ||||||||||||
Ratio of net expenses to average net assets | 1.96 | % | 1.99 | % | 1.98 | % | 1.97 | % | 1.92 | % | ||||||||||||
Ratio of total expenses to average net assets | 1.96 | % | 1.99 | % | 1.98 | % | 1.97 | % | 1.92 | % | ||||||||||||
Ratio of net investment loss to average net assets | (0.73 | )% | (0.07 | )% | (0.24 | )% | (0.53 | )% | (0.25 | )% | ||||||||||||
Portfolio turnover rate(c) | 66 | % | 87 | % | 82 | % | 137 | % | 124 | % | ||||||||||||
| (a) | Calculated based on the average shares outstanding methodology. |
| (b) | Assumes investment at the NAV at the beginning of the year, reinvestment of all dividends and distributions, a complete redemption of the investment at the NAV at the end of the year and no sales or redemption charges (if any). Total returns would be reduced if a sales or redemption charge was taken into account. Returns do not reflect the impact of taxes to shareholders relating to Fund distributions or the redemption of Fund shares. |
| (c) | The Fund’s portfolio turnover rate is calculated in accordance with regulatory requirements, without regard to transactions involving short term investments. If such transactions were included, the Fund’s portfolio turnover rate may be higher. |
| 78 | The accompanying notes are an integral part of these financial statements. |
GOLDMAN SACHS MID CAP VALUE FUND
Financial Highlights (continued)
Selected Share Data for a Share Outstanding Throughout Each Year
| Goldman Sachs Mid Cap Value Fund | ||||||||||||||||||||||
| Institutional Shares | ||||||||||||||||||||||
| Year Ended August 31, | ||||||||||||||||||||||
| 2021 | 2020 | 2019 | 2018 | 2017 | ||||||||||||||||||
| Per Share Data |
| |||||||||||||||||||||
Net asset value, beginning of year | $ | 31.65 | $ | 32.76 | $ | 37.06 | $ | 38.68 | $ | 35.64 | ||||||||||||
Net investment income(a) | 0.15 | 0.26 | 0.29 | 0.21 | 0.34 | |||||||||||||||||
Net realized and unrealized gain (loss) | 13.80 | (0.19 | ) | 0.39 | 3.77 | 3.25 | ||||||||||||||||
Total from investment operations | 13.95 | 0.07 | 0.68 | 3.98 | 3.59 | |||||||||||||||||
Distributions to shareholders from net investment income | (0.26 | ) | (0.30 | ) | (0.27 | ) | (0.26 | ) | (0.55 | ) | ||||||||||||
Distributions to shareholders from net realized gains | — | (0.84 | ) | (4.71 | ) | (5.34 | ) | — | ||||||||||||||
Distributions to shareholders from return of capital | — | (0.04 | ) | — | — | — | ||||||||||||||||
Total distributions | (0.26 | ) | (1.18 | ) | (4.98 | ) | (5.60 | ) | (0.55 | ) | ||||||||||||
Net asset value, end of year | $ | 45.34 | $ | 31.65 | $ | 32.76 | $ | 37.06 | $ | 38.68 | ||||||||||||
| Total Return(b) | 44.27 | % | (0.03 | )% | 3.78 | % | 11.13 | % | 10.12 | % | ||||||||||||
Net assets, end of year (in 000’s) | $ | 331,383 | $ | 271,283 | $ | 346,004 | $ | 555,930 | $ | 1,424,886 | ||||||||||||
Ratio of net expenses to average net assets | 0.84 | % | 0.86 | % | 0.84 | % | 0.83 | % | 0.77 | % | ||||||||||||
Ratio of total expenses to average net assets | 0.84 | % | 0.86 | % | 0.84 | % | 0.83 | % | 0.77 | % | ||||||||||||
Ratio of net investment income to average net assets | 0.38 | % | 0.82 | % | 0.89 | % | 0.58 | % | 0.91 | % | ||||||||||||
Portfolio turnover rate(c) | 66 | % | 87 | % | 82 | % | 137 | % | 124 | % | ||||||||||||
| (a) | Calculated based on the average shares outstanding methodology. |
| (b) | Assumes investment at the NAV at the beginning of the year, reinvestment of all dividends and distributions, a complete redemption of the investment at the NAV at the end of the year and no sales or redemption charges (if any). Total returns would be reduced if a sales or redemption charge was taken into account. Returns do not reflect the impact of taxes to shareholders relating to Fund distributions or the redemption of Fund shares. |
| (c) | The Fund’s portfolio turnover rate is calculated in accordance with regulatory requirements, without regard to transactions involving short term investments. If such transactions were included, the Fund’s portfolio turnover rate may be higher. |
| The accompanying notes are an integral part of these financial statements. | 79 |
GOLDMAN SACHS MID CAP VALUE FUND
Financial Highlights (continued)
Selected Share Data for a Share Outstanding Throughout Each Year
| Goldman Sachs Mid Cap Value Fund | ||||||||||||||||||||||
| Service Shares | ||||||||||||||||||||||
| Year Ended August 31, | ||||||||||||||||||||||
| 2021 | 2020 | 2019 | 2018 | 2017 | ||||||||||||||||||
| Per Share Data |
| |||||||||||||||||||||
Net asset value, beginning of year | $ | 30.50 | $ | 31.58 | $ | 35.89 | $ | 37.61 | $ | 34.63 | ||||||||||||
Net investment income(a) | (0.04 | ) | 0.13 | 0.12 | 0.04 | 0.15 | ||||||||||||||||
Net realized and unrealized gain (loss) | 13.31 | (0.23 | ) | 0.38 | 3.65 | 3.15 | ||||||||||||||||
Total from investment operations | 13.27 | (0.10 | ) | 0.50 | 3.69 | 3.30 | ||||||||||||||||
Distributions to shareholders from net investment income | (0.08 | ) | (0.11 | ) | (0.10 | ) | (0.12 | ) | (0.32 | ) | ||||||||||||
Distributions to shareholders from net realized gains | — | (0.84 | ) | (4.71 | ) | (5.29 | ) | — | ||||||||||||||
Distributions to shareholders from return of capital | — | (0.03 | ) | — | — | — | ||||||||||||||||
Total distributions | (0.08 | ) | (0.98 | ) | (4.81 | ) | (5.41 | ) | (0.32 | ) | ||||||||||||
Net asset value, end of year | $ | 43.69 | $ | 30.50 | $ | 31.58 | $ | 35.89 | $ | 37.61 | ||||||||||||
| Total Return(b) | 43.57 | % | (0.52 | )% | 3.25 | % | 10.58 | % | 9.56 | % | ||||||||||||
Net assets, end of year (in 000’s) | $ | 34,851 | $ | 30,424 | $ | 47,597 | $ | 65,727 | $ | 87,438 | ||||||||||||
Ratio of net expenses to average net assets | 1.34 | % | 1.36 | % | 1.34 | % | 1.33 | % | 1.27 | % | ||||||||||||
Ratio of total expenses to average net assets | 1.34 | % | 1.36 | % | 1.34 | % | 1.33 | % | 1.28 | % | ||||||||||||
Ratio of net investment income to average net assets | (0.12 | )% | 0.43 | % | 0.38 | % | 0.11 | % | 0.40 | % | ||||||||||||
Portfolio turnover rate(c) | 66 | % | 87 | % | 82 | % | 137 | % | 124 | % | ||||||||||||
| (a) | Calculated based on the average shares outstanding methodology. |
| (b) | Assumes investment at the NAV at the beginning of the year, reinvestment of all dividends and distributions, a complete redemption of the investment at the NAV at the end of the year and no sales or redemption charges (if any). Total returns would be reduced if a sales or redemption charge was taken into account. Returns do not reflect the impact of taxes to shareholders relating to Fund distributions or the redemption of Fund shares. |
| (c) | The Fund’s portfolio turnover rate is calculated in accordance with regulatory requirements, without regard to transactions involving short term investments. If such transactions were included, the Fund’s portfolio turnover rate may be higher. |
| 80 | The accompanying notes are an integral part of these financial statements. |
GOLDMAN SACHS MID CAP VALUE FUND
Financial Highlights (continued)
Selected Share Data for a Share Outstanding Throughout Each Year
| Goldman Sachs Mid Cap Value Fund | ||||||||||||||||||||||
| Investor Shares | ||||||||||||||||||||||
| Year Ended August 31, | ||||||||||||||||||||||
| 2021 | 2020 | 2019 | 2018 | 2017 | ||||||||||||||||||
| Per Share Data |
| |||||||||||||||||||||
Net asset value, beginning of year | $ | 30.44 | $ | 31.55 | $ | 35.89 | $ | 37.57 | $ | 34.63 | ||||||||||||
Net investment income(a) | 0.10 | 0.22 | 0.23 | 0.17 | 0.27 | |||||||||||||||||
Net realized and unrealized gain (loss) | 13.28 | (0.19 | ) | 0.37 | 3.63 | 3.17 | ||||||||||||||||
Total from investment operations | 13.38 | 0.03 | 0.60 | 3.80 | 3.44 | |||||||||||||||||
Distributions to shareholders from net investment income | (0.22 | ) | (0.26 | ) | (0.23 | ) | (0.18 | ) | (0.50 | ) | ||||||||||||
Distributions to shareholders from net realized gains | — | (0.84 | ) | (4.71 | ) | (5.30 | ) | — | ||||||||||||||
Distributions to shareholders from return of capital | — | (0.04 | ) | — | — | — | ||||||||||||||||
Total distributions | (0.22 | ) | (1.14 | ) | (4.94 | ) | (5.48 | ) | (0.50 | ) | ||||||||||||
Net asset value, end of year | $ | 43.60 | $ | 30.44 | $ | 31.55 | $ | 35.89 | $ | 37.57 | ||||||||||||
| Total Return(b) | 44.11 | % | (0.16 | )% | 3.63 | % | 10.98 | % | 9.94 | % | ||||||||||||
Net assets, end of year (in 000’s) | $ | 42,206 | $ | 33,249 | $ | 41,809 | $ | 51,375 | $ | 77,446 | ||||||||||||
Ratio of net expenses to average net assets | 0.96 | % | 0.99 | % | 0.97 | % | 0.97 | % | 0.92 | % | ||||||||||||
Ratio of total expenses to average net assets | 0.96 | % | 0.99 | % | 0.98 | % | 0.97 | % | 0.92 | % | ||||||||||||
Ratio of net investment income to average net assets | 0.26 | % | 0.72 | % | 0.74 | % | 0.47 | % | 0.73 | % | ||||||||||||
Portfolio turnover rate(c) | 66 | % | 87 | % | 82 | % | 137 | % | 124 | % | ||||||||||||
| (a) | Calculated based on the average shares outstanding methodology. |
| (b) | Assumes investment at the NAV at the beginning of the year, reinvestment of all dividends and distributions, a complete redemption of the investment at the NAV at the end of the year and no sales or redemption charges (if any). Total returns would be reduced if a sales or redemption charge was taken into account. Returns do not reflect the impact of taxes to shareholders relating to Fund distributions or the redemption of Fund shares. |
| (c) | The Fund’s portfolio turnover rate is calculated in accordance with regulatory requirements, without regard to transactions involving short term investments. If such transactions were included, the Fund’s portfolio turnover rate may be higher. |
| The accompanying notes are an integral part of these financial statements. | 81 |
GOLDMAN SACHS MID CAP VALUE FUND
Financial Highlights (continued)
Selected Share Data for a Share Outstanding Throughout Each Year
| Goldman Sachs Mid Cap Value Fund | ||||||||||||||||||||||
| Class R6 Shares | ||||||||||||||||||||||
| Year Ended August 31, | ||||||||||||||||||||||
| 2021 | 2020 | 2019 | 2018 | 2017 | ||||||||||||||||||
| Per Share Data |
| |||||||||||||||||||||
Net asset value, beginning of year | $ | 31.62 | $ | 32.74 | $ | 37.04 | $ | 38.66 | $ | 35.64 | ||||||||||||
Net investment income(a) | 0.15 | 0.25 | 0.27 | 0.22 | 0.36 | |||||||||||||||||
Net realized and unrealized gain (loss) | 13.80 | (0.18 | ) | 0.41 | 3.76 | 3.22 | ||||||||||||||||
Total from investment operations | 13.95 | 0.07 | 0.68 | 3.98 | 3.58 | |||||||||||||||||
Distributions to shareholders from net investment income | (0.26 | ) | (0.27 | ) | (0.27 | ) | (0.27 | ) | (0.56 | ) | ||||||||||||
Distributions to shareholders from net realized gains | — | (0.84 | ) | (4.71 | ) | (5.33 | ) | — | ||||||||||||||
Distributions to shareholders from return of capital | — | (0.08 | ) | — | — | — | ||||||||||||||||
Total distributions | (0.26 | ) | (1.19 | ) | (4.98 | ) | (5.60 | ) | (0.56 | ) | ||||||||||||
Net asset value, end of year | $ | 45.31 | $ | 31.62 | $ | 32.74 | $ | 37.04 | $ | 38.66 | ||||||||||||
| Total Return(b) | 44.33 | % | (0.05 | )% | 3.79 | % | 11.10 | % | 10.13 | % | ||||||||||||
Net assets, end of year (in 000’s) | $ | 80,114 | $ | 54,633 | $ | 50,538 | $ | 39,520 | $ | 73,505 | ||||||||||||
Ratio of net expenses to average net assets | 0.83 | % | 0.85 | % | 0.82 | % | 0.82 | % | 0.75 | % | ||||||||||||
Ratio of total expenses to average net assets | 0.83 | % | 0.85 | % | 0.83 | % | 0.82 | % | 0.75 | % | ||||||||||||
Ratio of net investment income to average net assets | 0.39 | % | 0.82 | % | 0.85 | % | 0.60 | % | 0.97 | % | ||||||||||||
Portfolio turnover rate(c) | 66 | % | 87 | % | 82 | % | 137 | % | 124 | % | ||||||||||||
| (a) | Calculated based on the average shares outstanding methodology. |
| (b) | Assumes investment at the NAV at the beginning of the year, reinvestment of all dividends and distributions, a complete redemption of the investment at the NAV at the end of the year and no sales or redemption charges (if any). Total returns would be reduced if a sales or redemption charge was taken into account. Returns do not reflect the impact of taxes to shareholders relating to Fund distributions or the redemption of Fund shares. |
| (c) | The Fund’s portfolio turnover rate is calculated in accordance with regulatory requirements, without regard to transactions involving short term investments. If such transactions were included, the Fund’s portfolio turnover rate may be higher. |
| 82 | The accompanying notes are an integral part of these financial statements. |
GOLDMAN SACHS MID CAP VALUE FUND
Financial Highlights (continued)
Selected Share Data for a Share Outstanding Throughout Each Year
| Goldman Sachs Mid Cap Value Fund | ||||||||||||||||||||||
| Class R Shares | ||||||||||||||||||||||
| Year Ended August 31, | ||||||||||||||||||||||
| 2021 | 2020 | 2019 | 2018 | 2017 | ||||||||||||||||||
| Per Share Data |
| |||||||||||||||||||||
Net asset value, beginning of year | $ | 30.09 | $ | 31.20 | $ | 35.52 | $ | 37.28 | $ | 34.38 | ||||||||||||
Net investment income (loss)(a) | (0.09 | ) | 0.10 | 0.08 | (0.01 | ) | 0.09 | |||||||||||||||
Net realized and unrealized gain (loss) | 13.14 | (0.24 | ) | 0.37 | 3.61 | 3.13 | ||||||||||||||||
Total from investment operations | 13.05 | (0.14 | ) | 0.45 | 3.60 | 3.22 | ||||||||||||||||
Distributions to shareholders from net investment income | (0.05 | ) | (0.10 | ) | (0.06 | ) | (0.09 | ) | (0.32 | ) | ||||||||||||
Distributions to shareholders from net realized gains | — | (0.84 | ) | (4.71 | ) | (5.27 | ) | — | ||||||||||||||
Distributions to shareholders from return of capital | — | (0.03 | ) | — | — | — | ||||||||||||||||
Total distributions | (0.05 | ) | (0.97 | ) | (4.77 | ) | (5.36 | ) | (0.32 | ) | ||||||||||||
Net asset value, end of year | $ | 43.09 | $ | 30.09 | $ | 31.20 | $ | 35.52 | $ | 37.28 | ||||||||||||
| Total Return(b) | 43.41 | % | (0.65 | )% | 3.10 | % | 10.43 | % | 9.40 | % | ||||||||||||
Net assets, end of year (in 000’s) | $ | 21,249 | $ | 17,015 | $ | 21,916 | $ | 28,103 | $ | 34,193 | ||||||||||||
Ratio of net expenses to average net assets | 1.46 | % | 1.49 | % | 1.47 | % | 1.47 | % | 1.42 | % | ||||||||||||
Ratio of total expenses to average net assets | 1.46 | % | 1.49 | % | 1.48 | % | 1.47 | % | 1.43 | % | ||||||||||||
Ratio of net investment income (loss) to average net assets | (0.23 | )% | 0.32 | % | 0.25 | % | (0.03 | )% | 0.25 | % | ||||||||||||
Portfolio turnover rate(c) | 66 | % | 87 | % | 82 | % | 137 | % | 124 | % | ||||||||||||
| (a) | Calculated based on the average shares outstanding methodology. |
| (b) | Assumes investment at the NAV at the beginning of the year, reinvestment of all dividends and distributions, a complete redemption of the investment at the NAV at the end of the year and no sales or redemption charges (if any). Total returns would be reduced if a sales or redemption charge was taken into account. Returns do not reflect the impact of taxes to shareholders relating to Fund distributions or the redemption of Fund shares. |
| (c) | The Fund’s portfolio turnover rate is calculated in accordance with regulatory requirements, without regard to transactions involving short term investments. If such transactions were included, the Fund’s portfolio turnover rate may be higher. |
| The accompanying notes are an integral part of these financial statements. | 83 |
GOLDMAN SACHS MID CAP VALUE FUND
Financial Highlights (continued)
Selected Share Data for a Share Outstanding Throughout Each Period
| Goldman Sachs Mid Cap Value Fund | ||||||||||||||||||
| Class P Shares | ||||||||||||||||||
| Year Ended August 31, | Period Ended August 31, 2018(a) | |||||||||||||||||
| 2021 | 2020 | 2019 | ||||||||||||||||
| Per Share Data |
| |||||||||||||||||
Net asset value, beginning of period | $ | 31.62 | $ | 32.73 | $ | 37.04 | $ | 35.64 | ||||||||||
Net investment income(b) | 0.15 | 0.26 | 0.29 | 0.13 | ||||||||||||||
Net realized and unrealized gain (loss) | 13.79 | (0.19 | ) | 0.39 | 1.27 | |||||||||||||
Total from investment operations | 13.94 | 0.07 | 0.68 | 1.40 | ||||||||||||||
Distributions to shareholders from net investment income | (0.26 | ) | (0.33 | ) | (0.28 | ) | — | |||||||||||
Distributions to shareholders from net realized gains | — | (0.84 | ) | (4.71 | ) | — | ||||||||||||
Distributions to shareholders from return of capital | — | (0.01 | ) | — | — | |||||||||||||
Total distributions | (0.26 | ) | (1.18 | ) | (4.99 | ) | — | |||||||||||
Net asset value, end of period | $ | 45.30 | $ | 31.62 | $ | 32.73 | $ | 37.04 | ||||||||||
| Total Return(c) | 44.30 | % | (0.02 | )% | 3.80 | % | 3.93 | % | ||||||||||
Net assets, end of period (in 000’s) | $ | 191,790 | $ | 129,680 | $ | 141,460 | $ | 172,003 | ||||||||||
Ratio of net expenses to average net assets | 0.83 | % | 0.85 | % | 0.83 | % | 0.86 | %(d) | ||||||||||
Ratio of total expenses to average net assets | 0.83 | % | 0.85 | % | 0.83 | % | 0.86 | %(d) | ||||||||||
Ratio of net investment income to average net assets | 0.39 | % | 0.82 | % | 0.89 | % | 0.94 | %(d) | ||||||||||
Portfolio turnover rate(e) | 66 | % | 87 | % | 82 | % | 137 | % | ||||||||||
| (a) | Commenced operations on April 17, 2018. |
| (b) | Calculated based on the average shares outstanding methodology. |
| (c) | Assumes investment at the NAV at the beginning of the period, reinvestment of all dividends and distributions, a complete redemption of the investment at the NAV at the end of the period and no sales or redemption charges (if any). Total returns would be reduced if a sales or redemption charge was taken into account. Returns do not reflect the impact of taxes to shareholders relating to Fund distributions or the redemption of Fund shares. Total returns for periods less than one full year are not annualized. |
| (d) | Annualized. |
| (e) | The Fund’s portfolio turnover rate is calculated in accordance with regulatory requirements, without regard to transactions involving short term investments. If such transactions were included, the Fund’s portfolio turnover rate may be higher. |
| 84 | The accompanying notes are an integral part of these financial statements. |
GOLDMAN SACHS SMALL CAP VALUE FUND
Financial Highlights (continued)
Selected Share Data for a Share Outstanding Throughout Each Year
| (a) | Calculated based on the average shares outstanding methodology. |
| (b) | Assumes investment at the NAV at the beginning of the year, reinvestment of all dividends and distributions, a complete redemption of the investment at the NAV at the end of the year and no sales or redemption charges (if any). Total returns would be reduced if a sales or redemption charge was taken into account. Returns do not reflect the impact of taxes to shareholders relating to Fund distributions or the redemption of Fund shares. |
| (c) | The Fund’s portfolio turnover rate is calculated in accordance with regulatory requirements, without regard to transactions involving short term investments. If such transactions were included, the Fund’s portfolio turnover rate may be higher. |
| The accompanying notes are an integral part of these financial statements. | 85 |
GOLDMAN SACHS SMALL CAP VALUE FUND
Financial Highlights (continued)
Selected Share Data for a Share Outstanding Throughout Each Year
| Goldman Sachs Small Cap Value Fund | ||||||||||||||||||||||
| Class C Shares | ||||||||||||||||||||||
| Year Ended August 31, | ||||||||||||||||||||||
| 2021 | 2020 | 2019 | 2018 | 2017 | ||||||||||||||||||
| Per Share Data |
| |||||||||||||||||||||
Net asset value, beginning of year | $ | 28.68 | $ | 33.97 | $ | 45.37 | $ | 44.50 | $ | 41.75 | ||||||||||||
Net investment loss(a) | (0.33 | ) | (0.02 | ) | (0.13 | ) | (0.31 | ) | (0.20 | ) | ||||||||||||
Net realized and unrealized gain (loss) | 14.28 | (3.21 | ) | (5.43 | ) | 7.49 | 4.70 | |||||||||||||||
Total from investment operations | 13.95 | (3.23 | ) | (5.56 | ) | 7.18 | 4.50 | |||||||||||||||
Distributions to shareholders from net realized gains | — | (2.06 | ) | (5.84 | ) | (6.31 | ) | (1.75 | ) | |||||||||||||
Net asset value, end of year | $ | 42.63 | $ | 28.68 | $ | 33.97 | $ | 45.37 | $ | 44.50 | ||||||||||||
| Total Return(b) | 48.69 | % | (10.61 | )% | (11.83 | )% | 17.26 | % | 10.72 | % | ||||||||||||
Net assets, end of year (in 000’s) | $ | 2,204 | $ | 3,220 | $ | 8,867 | $ | 37,157 | $ | 37,357 | ||||||||||||
Ratio of net expenses to average net assets | 2.05 | % | 2.09 | % | 2.09 | % | 2.08 | % | 2.09 | % | ||||||||||||
Ratio of total expenses to average net assets | 2.11 | % | 2.12 | % | 2.11 | % | 2.11 | % | 2.13 | % | ||||||||||||
Ratio of net investment loss to average net assets | (0.89 | )% | (0.05 | )% | (0.36 | )% | (0.69 | )% | (0.45 | )% | ||||||||||||
Portfolio turnover rate(c) | 64 | % | 75 | % | 47 | % | 55 | % | 68 | % | ||||||||||||
| (a) | Calculated based on the average shares outstanding methodology. |
| (b) | Assumes investment at the NAV at the beginning of the year, reinvestment of all dividends and distributions, a complete redemption of the investment at the NAV at the end of the year and no sales or redemption charges (if any). Total returns would be reduced if a sales or redemption charge was taken into account. Returns do not reflect the impact of taxes to shareholders relating to Fund distributions or the redemption of Fund shares. |
| (c) | The Fund’s portfolio turnover rate is calculated in accordance with regulatory requirements, without regard to transactions involving short term investments. If such transactions were included, the Fund’s portfolio turnover rate may be higher. |
| 86 | The accompanying notes are an integral part of these financial statements. |
GOLDMAN SACHS SMALL CAP VALUE FUND
Financial Highlights (continued)
Selected Share Data for a Share Outstanding Throughout Each Year
| Goldman Sachs Small Cap Value Fund | ||||||||||||||||||||||
| Institutional Shares | ||||||||||||||||||||||
| Year Ended August 31, | ||||||||||||||||||||||
| 2021 | 2020 | 2019 | 2018 | 2017 | ||||||||||||||||||
| Per Share Data |
| |||||||||||||||||||||
Net asset value, beginning of year | $ | 44.52 | $ | 51.56 | $ | 64.90 | $ | 60.78 | $ | 56.20 | ||||||||||||
Net investment income(a) | 0.11 | 0.35 | 0.43 | 0.28 | 0.41 | |||||||||||||||||
Net realized and unrealized gain (loss) | 22.22 | (4.87 | ) | (7.71 | ) | 10.46 | 6.34 | |||||||||||||||
Total from investment operations | 22.33 | (4.52 | ) | (7.28 | ) | 10.74 | 6.75 | |||||||||||||||
Distributions to shareholders from net investment income | (0.27 | ) | (0.46 | ) | (0.22 | ) | (0.31 | ) | (0.42 | ) | ||||||||||||
Distributions to shareholders from net realized gains | — | (2.06 | ) | (5.84 | ) | (6.31 | ) | (1.75 | ) | |||||||||||||
Total distributions | (0.27 | ) | (2.52 | ) | (6.06 | ) | (6.62 | ) | (2.17 | ) | ||||||||||||
Net asset value, end of year | $ | 66.58 | $ | 44.52 | $ | 51.56 | $ | 64.90 | $ | 60.78 | ||||||||||||
| Total Return(b) | 50.29 | % | (9.60 | )% | (10.81 | )% | 18.62 | % | 12.00 | % | ||||||||||||
Net assets, end of year (in 000’s) | $ | 2,331,482 | $ | 2,454,781 | $ | 3,114,853 | $ | 4,304,041 | $ | 4,393,986 | ||||||||||||
Ratio of net expenses to average net assets | 0.96 | % | 0.96 | % | 0.95 | % | 0.94 | % | 0.94 | % | ||||||||||||
Ratio of total expenses to average net assets | 0.99 | % | 0.99 | % | 0.97 | % | 0.97 | % | 0.98 | % | ||||||||||||
Ratio of net investment income to average net assets | 0.19 | % | 0.74 | % | 0.78 | % | 0.45 | % | 0.69 | % | ||||||||||||
Portfolio turnover rate(c) | 64 | % | 75 | % | 47 | % | 55 | % | 68 | % | ||||||||||||
| (a) | Calculated based on the average shares outstanding methodology. |
| (b) | Assumes investment at the NAV at the beginning of the year, reinvestment of all dividends and distributions, a complete redemption of the investment at the NAV at the end of the year and no sales or redemption charges (if any). Total returns would be reduced if a sales or redemption charge was taken into account. Returns do not reflect the impact of taxes to shareholders relating to Fund distributions or the redemption of Fund shares. |
| (c) | The Fund’s portfolio turnover rate is calculated in accordance with regulatory requirements, without regard to transactions involving short term investments. If such transactions were included, the Fund’s portfolio turnover rate may be higher. |
| The accompanying notes are an integral part of these financial statements. | 87 |
GOLDMAN SACHS SMALL CAP VALUE FUND
Financial Highlights (continued)
Selected Share Data for a Share Outstanding Throughout Each Year
| Goldman Sachs Small Cap Value Fund | ||||||||||||||||||||||
| Service Shares | ||||||||||||||||||||||
| Year Ended August 31, | ||||||||||||||||||||||
| 2021 | 2020 | 2019 | 2018 | 2017 | ||||||||||||||||||
| Per Share Data |
| |||||||||||||||||||||
Net asset value, beginning of year | $ | 39.10 | $ | 45.50 | $ | 58.10 | $ | 55.04 | $ | 51.10 | ||||||||||||
Net investment income (loss)(a) | (0.15 | ) | 0.16 | 0.14 | (0.03 | ) | 0.09 | |||||||||||||||
Net realized and unrealized gain (loss) | 19.51 | (4.35 | ) | (6.90 | ) | 9.42 | 5.77 | |||||||||||||||
Total from investment operations | 19.36 | (4.19 | ) | (6.76 | ) | 9.39 | 5.86 | |||||||||||||||
Distributions to shareholders from net investment income | (0.02 | ) | (0.15 | ) | — | (0.02 | ) | (0.17 | ) | |||||||||||||
Distributions to shareholders from net realized gains | — | (2.06 | ) | (5.84 | ) | (6.31 | ) | (1.75 | ) | |||||||||||||
Total distributions | (0.02 | ) | (2.21 | ) | (5.84 | ) | (6.33 | ) | (1.92 | ) | ||||||||||||
Net asset value, end of year | $ | 58.44 | $ | 39.10 | $ | 45.50 | $ | 58.10 | $ | 55.04 | ||||||||||||
| Total Return(b) | 49.53 | % | (10.04 | )% | (11.26 | )% | 18.02 | % | 11.44 | % | ||||||||||||
Net assets, end of year (in 000’s) | $ | 27,102 | $ | 39,295 | $ | 75,860 | $ | 110,636 | $ | 145,996 | ||||||||||||
Ratio of net expenses to average net assets | 1.46 | % | 1.46 | % | 1.45 | % | 1.44 | % | 1.44 | % | ||||||||||||
Ratio of total expenses to average net assets | 1.49 | % | 1.49 | % | 1.47 | % | 1.47 | % | 1.48 | % | ||||||||||||
Ratio of net investment income (loss) to average net assets | (0.31 | )% | 0.39 | % | 0.29 | % | (0.06 | )% | 0.17 | % | ||||||||||||
Portfolio turnover rate(c) | 64 | % | 75 | % | 47 | % | 55 | % | 68 | % | ||||||||||||
| (a) | Calculated based on the average shares outstanding methodology. |
| (b) | Assumes investment at the NAV at the beginning of the year, reinvestment of all dividends and distributions, a complete redemption of the investment at the NAV at the end of the year and no sales or redemption charges (if any). Total returns would be reduced if a sales or redemption charge was taken into account. Returns do not reflect the impact of taxes to shareholders relating to Fund distributions or the redemption of Fund shares. |
| (c) | The Fund’s portfolio turnover rate is calculated in accordance with regulatory requirements, without regard to transactions involving short term investments. If such transactions were included, the Fund’s portfolio turnover rate may be higher. |
| 88 | The accompanying notes are an integral part of these financial statements. |
GOLDMAN SACHS SMALL CAP VALUE FUND
Financial Highlights (continued)
Selected Share Data for a Share Outstanding Throughout Each Year
| Goldman Sachs Small Cap Value Fund | ||||||||||||||||||||||
| Investor Shares | ||||||||||||||||||||||
| Year Ended August 31, | ||||||||||||||||||||||
| 2021 | 2020 | 2019 | 2018 | 2017 | ||||||||||||||||||
| Per Share Data |
| |||||||||||||||||||||
Net asset value, beginning of year | $ | 40.26 | $ | 46.84 | $ | 59.60 | $ | 56.32 | $ | 52.23 | ||||||||||||
Net investment income(a) | 0.05 | 0.27 | 0.32 | 0.18 | 0.29 | |||||||||||||||||
Net realized and unrealized gain (loss) | 20.09 | (4.39 | ) | (7.09 | ) | 9.64 | 5.90 | |||||||||||||||
Total from investment operations | 20.14 | (4.12 | ) | (6.77 | ) | 9.82 | 6.19 | |||||||||||||||
Distributions to shareholders from net investment income | (0.22 | ) | (0.40 | ) | (0.15 | ) | (0.23 | ) | (0.35 | ) | ||||||||||||
Distributions to shareholders from net realized gains | — | (2.06 | ) | (5.84 | ) | (6.31 | ) | (1.75 | ) | |||||||||||||
Total distributions | (0.22 | ) | (2.46 | ) | (5.99 | ) | (6.54 | ) | (2.10 | ) | ||||||||||||
Net asset value, end of year | $ | 60.18 | $ | 40.26 | $ | 46.84 | $ | 59.60 | $ | 56.32 | ||||||||||||
| Total Return(b) | 50.14 | % | (9.70 | )% | (10.94 | )% | 18.44 | % | 11.84 | % | ||||||||||||
Net assets, end of year (in 000’s) | $ | 140,918 | $ | 115,491 | $ | 132,434 | $ | 173,176 | $ | 168,986 | ||||||||||||
Ratio of net expenses to average net assets | 1.04 | % | 1.09 | % | 1.09 | % | 1.08 | % | 1.09 | % | ||||||||||||
Ratio of total expenses to average net assets | 1.11 | % | 1.12 | % | 1.11 | % | 1.11 | % | 1.13 | % | ||||||||||||
Ratio of net investment income to average net assets | 0.09 | % | 0.64 | % | 0.64 | % | 0.31 | % | 0.53 | % | ||||||||||||
Portfolio turnover rate(c) | 64 | % | 75 | % | 47 | % | 55 | % | 68 | % | ||||||||||||
| (a) | Calculated based on the average shares outstanding methodology. |
| (b) | Assumes investment at the NAV at the beginning of the year, reinvestment of all dividends and distributions, a complete redemption of the investment at the NAV at the end of the year and no sales or redemption charges (if any). Total returns would be reduced if a sales or redemption charge was taken into account. Returns do not reflect the impact of taxes to shareholders relating to Fund distributions or the redemption of Fund shares. |
| (c) | The Fund’s portfolio turnover rate is calculated in accordance with regulatory requirements, without regard to transactions involving short term investments. If such transactions were included, the Fund’s portfolio turnover rate may be higher. |
| The accompanying notes are an integral part of these financial statements. | 89 |
GOLDMAN SACHS SMALL CAP VALUE FUND
Financial Highlights (continued)
Selected Share Data for a Share Outstanding Throughout Each Year
| Goldman Sachs Small Cap Value Fund | ||||||||||||||||||||||
| Class R6 Shares | ||||||||||||||||||||||
| Year Ended August 31, | ||||||||||||||||||||||
| 2021 | 2020 | 2019 | 2018 | �� | 2017 | |||||||||||||||||
| Per Share Data |
| |||||||||||||||||||||
Net asset value, beginning of year | $ | 44.50 | $ | 51.53 | $ | 64.88 | $ | 60.77 | $ | 56.19 | ||||||||||||
Net investment income(a) | 0.11 | 0.35 | 0.42 | 0.27 | 0.38 | |||||||||||||||||
Net realized and unrealized gain (loss) | 22.22 | (4.85 | ) | (7.70 | ) | 10.47 | 6.39 | |||||||||||||||
Total from investment operations | 22.33 | (4.50 | ) | (7.28 | ) | 10.74 | 6.77 | |||||||||||||||
Distributions to shareholders from net investment income | (0.28 | ) | (0.47 | ) | (0.23 | ) | (0.32 | ) | (0.44 | ) | ||||||||||||
Distributions to shareholders from net realized gains | — | (2.06 | ) | (5.84 | ) | (6.31 | ) | (1.75 | ) | |||||||||||||
Total distributions | (0.28 | ) | (2.53 | ) | (6.07 | ) | (6.63 | ) | (2.19 | ) | ||||||||||||
Net asset value, end of year | $ | 66.55 | $ | 44.50 | $ | 51.53 | $ | 64.88 | $ | 60.77 | ||||||||||||
| Total Return(b) | 50.31 | % | (9.58 | )% | (10.81 | )% | 18.63 | % | 12.03 | % | ||||||||||||
Net assets, end of year (in 000’s) | $ | 1,436,954 | $ | 1,229,047 | $ | 1,302,069 | $ | 1,146,132 | $ | 759,095 | ||||||||||||
Ratio of net expenses to average net assets | 0.95 | % | 0.95 | % | 0.94 | % | 0.93 | % | 0.92 | % | ||||||||||||
Ratio of total expenses to average net assets | 0.98 | % | 0.98 | % | 0.96 | % | 0.96 | % | 0.96 | % | ||||||||||||
Ratio of net investment income to average net assets | 0.19 | % | 0.74 | % | 0.77 | % | 0.44 | % | 0.63 | % | ||||||||||||
Portfolio turnover rate(c) | 64 | % | 75 | % | 47 | % | 55 | % | 68 | % | ||||||||||||
| (a) | Calculated based on the average shares outstanding methodology. |
| (b) | Assumes investment at the NAV at the beginning of the year, reinvestment of all dividends and distributions, a complete redemption of the investment at the NAV at the end of the year and no sales or redemption charges (if any). Total returns would be reduced if a sales or redemption charge was taken into account. Returns do not reflect the impact of taxes to shareholders relating to Fund distributions or the redemption of Fund shares. |
| (c) | The Fund’s portfolio turnover rate is calculated in accordance with regulatory requirements, without regard to transactions involving short term investments. If such transactions were included, the Fund’s portfolio turnover rate may be higher. |
| 90 | The accompanying notes are an integral part of these financial statements. |
GOLDMAN SACHS SMALL CAP VALUE FUND
Financial Highlights (continued)
Selected Share Data for a Share Outstanding Throughout Each Year
| Goldman Sachs Small Cap Value Fund | ||||||||||||||||||||||
| Class R Shares | ||||||||||||||||||||||
| Year Ended August 31, | ||||||||||||||||||||||
| 2021 | 2020 | 2019 | 2018 | 2017 | ||||||||||||||||||
| Per Share Data |
| |||||||||||||||||||||
Net asset value, beginning of year | $ | 39.48 | $ | 45.96 | $ | 58.69 | $ | 55.60 | $ | 51.62 | ||||||||||||
Net investment income (loss)(a) | (0.21 | ) | 0.13 | 0.07 | (0.11 | ) | 0.02 | |||||||||||||||
Net realized and unrealized gain (loss) | 19.71 | (4.42 | ) | (6.96 | ) | 9.51 | 5.82 | |||||||||||||||
Total from investment operations | 19.50 | (4.29 | ) | (6.89 | ) | 9.40 | 5.84 | |||||||||||||||
Distributions to shareholders from net investment income | — | (0.13 | ) | — | — | (0.11 | ) | |||||||||||||||
Distributions to shareholders from net realized gains | — | (2.06 | ) | (5.84 | ) | (6.31 | ) | (1.75 | ) | |||||||||||||
Total distributions | — | (2.19 | ) | (5.84 | ) | (6.31 | ) | (1.86 | ) | |||||||||||||
Net asset value, end of year | $ | 58.98 | $ | 39.48 | $ | 45.96 | $ | 58.69 | $ | 55.60 | ||||||||||||
| Total Return(b) | 49.39 | % | (10.16 | )% | 11.37 | % | 17.85 | % | 11.28 | % | ||||||||||||
Net assets, end of year (in 000’s) | $ | 62,339 | $ | 57,272 | $ | 84,684 | $ | 123,288 | $ | 124,039 | ||||||||||||
Ratio of net expenses to average net assets | 1.55 | % | 1.59 | % | 1.59 | % | 1.58 | % | 1.59 | % | ||||||||||||
Ratio of total expenses to average net assets | 1.61 | % | 1.62 | % | 1.61 | % | 1.61 | % | 1.63 | % | ||||||||||||
Ratio of net investment income (loss) to average net assets | (0.40 | )% | 0.30 | % | 0.15 | % | (0.19 | )% | 0.04 | % | ||||||||||||
Portfolio turnover rate(c) | 64 | % | 75 | % | 47 | % | 55 | % | 68 | % | ||||||||||||
| (a) | Calculated based on the average shares outstanding methodology. |
| (b) | Assumes investment at the NAV at the beginning of the year, reinvestment of all dividends and distributions, a complete redemption of the investment at the NAV at the end of the year and no sales or redemption charges (if any). Total returns would be reduced if a sales or redemption charge was taken into account. Returns do not reflect the impact of taxes to shareholders relating to Fund distributions or the redemption of Fund shares. |
| (c) | The Fund’s portfolio turnover rate is calculated in accordance with regulatory requirements, without regard to transactions involving short term investments. If such transactions were included, the Fund’s portfolio turnover rate may be higher. |
| The accompanying notes are an integral part of these financial statements. | 91 |
GOLDMAN SACHS SMALL CAP VALUE FUND
Financial Highlights (continued)
Selected Share Data for a Share Outstanding Throughout Each Period
| Goldman Sachs Small Cap Value Fund | ||||||||||||||||||
| Class P Shares | ||||||||||||||||||
| Year Ended August 31, | Period Ended August 31, 2018(a) | |||||||||||||||||
| 2021 | 2020 | 2019 | ||||||||||||||||
| Per Share Data |
| |||||||||||||||||
Net asset value, beginning of period | $ | 44.50 | $ | 51.53 | $ | 64.88 | $ | 60.80 | ||||||||||
Net investment income(b) | 0.11 | 0.34 | 0.43 | 0.11 | ||||||||||||||
Net realized and unrealized gain (loss) | 22.22 | (4.85 | ) | (7.71 | ) | 3.97 | ||||||||||||
Total from investment operations | 22.33 | (4.51 | ) | (7.28 | ) | 4.08 | ||||||||||||
Distributions to shareholders from net investment income | (0.28 | ) | (0.46 | ) | (0.23 | ) | — | |||||||||||
Distributions to shareholders from net realized gains | — | (2.06 | ) | (5.84 | ) | — | ||||||||||||
Total distributions | (0.28 | ) | (2.52 | ) | (6.07 | ) | — | |||||||||||
Net asset value, end of period | $ | 66.55 | $ | 44.50 | $ | 51.53 | $ | 64.88 | ||||||||||
| Total Return(c) | 50.28 | % | (9.56 | )% | (10.80 | )% | 6.71 | % | ||||||||||
Net assets, end of period (in 000’s) | $ | 333,524 | $ | 206,370 | $ | 231,930 | $ | 317,224 | ||||||||||
Ratio of net expenses to average net assets | 0.95 | % | 0.95 | % | 0.94 | % | 0.93 | %(d) | ||||||||||
Ratio of total expenses to average net assets | 0.98 | % | 0.98 | % | 0.96 | % | 0.97 | %(d) | ||||||||||
Ratio of net investment income to average net assets | 0.18 | % | 0.74 | % | 0.79 | % | 0.46 | %(d) | ||||||||||
Portfolio turnover rate(e) | 64 | % | 75 | % | 47 | % | 55 | % | ||||||||||
| (a) | Commenced operations on April 17, 2018. |
| (b) | Calculated based on the average shares outstanding methodology. |
| (c) | Assumes investment at the NAV at the beginning of the period, reinvestment of all dividends and distributions, a complete redemption of the investment at the NAV at the end of the period and no sales or redemption charges (if any). Total returns would be reduced if a sales or redemption charge was taken into account. Returns do not reflect the impact of taxes to shareholders relating to Fund distributions or the redemption of Fund shares. Total returns for periods less than one full year are not annualized. |
| (d) | Annualized. |
| (e) | The Fund’s portfolio turnover rate is calculated in accordance with regulatory requirements, without regard to transactions involving short term investments. If such transactions were included, the Fund’s portfolio turnover rate may be higher. |
| 92 | The accompanying notes are an integral part of these financial statements. |
GOLDMAN SACHS SMALL/MID CAP VALUE FUND
Financial Highlights (continued)
Selected Share Data for a Share Outstanding Throughout Each Year
| (a) | Calculated based on the average shares outstanding methodology. |
| (b) | Assumes investment at the NAV at the beginning of the year, reinvestment of all dividends and distributions, a complete redemption of the investment at the NAV at the end of the year and no sales or redemption charges (if any). Total returns would be reduced if a sales or redemption charge was taken into account. Returns do not reflect the impact of taxes to shareholders relating to Fund distributions or the redemption of Fund shares. |
| (c) | The Fund’s portfolio turnover rate is calculated in accordance with regulatory requirements, without regard to transactions involving short term investments. If such transactions were included, the Fund’s portfolio turnover rate may be higher. |
| The accompanying notes are an integral part of these financial statements. | 93 |
GOLDMAN SACHS SMALL/MID CAP VALUE FUND
Financial Highlights (continued)
Selected Share Data for a Share Outstanding Throughout Each Year
| Goldman Sachs Small/Mid Cap Value Fund | ||||||||||||||||||||||
| Class C Shares | ||||||||||||||||||||||
| Year Ended August 31, | ||||||||||||||||||||||
| 2021 | 2020 | 2019 | 2018 | 2017 | ||||||||||||||||||
| Per Share Data |
| |||||||||||||||||||||
Net asset value, beginning of year | $ | 11.17 | $ | 11.67 | $ | 13.30 | $ | 12.14 | $ | 11.01 | ||||||||||||
Net investment loss(a) | (0.10 | ) | (0.01 | ) | (0.02 | ) | (0.06 | ) | (0.02 | ) | ||||||||||||
Net realized and unrealized gain (loss) | 5.61 | (0.49 | ) | (0.85 | ) | 1.69 | 1.17 | |||||||||||||||
Total from investment operations | 5.51 | (0.50 | ) | (0.87 | ) | 1.63 | 1.15 | |||||||||||||||
Distributions to shareholders from net investment income | — | — | — | — | (0.02 | ) | ||||||||||||||||
Distributions to shareholders from net realized gains | — | — | (0.76 | ) | (0.47 | ) | — | |||||||||||||||
Total distributions | — | — | (0.76 | ) | (0.47 | ) | (0.02 | ) | ||||||||||||||
Net asset value, end of year | $ | 16.68 | $ | 11.17 | $ | 11.67 | $ | 13.30 | $ | 12.14 | ||||||||||||
| Total Return(b) | 49.46 | % | (4.36 | )% | (6.07 | )% | 13.63 | % | 10.48 | % | ||||||||||||
Net assets, end of year (in 000’s) | $ | 1,483 | $ | 948 | $ | 994 | $ | 1,140 | $ | 1,126 | ||||||||||||
Ratio of net expenses to average net assets | 1.96 | % | 1.98 | % | 1.98 | % | 1.98 | % | 1.99 | % | ||||||||||||
Ratio of total expenses to average net assets | 2.17 | % | 2.24 | % | 2.31 | % | 2.22 | % | 2.47 | % | ||||||||||||
Ratio of net investment loss to average net assets | (0.69 | )% | (0.07 | )% | (0.15 | )% | (0.44 | )% | (0.17 | )% | ||||||||||||
Portfolio turnover rate(c) | 78 | % | 76 | % | 73 | % | 105 | % | 108 | % | ||||||||||||
| (a) | Calculated based on the average shares outstanding methodology. |
| (b) | Assumes investment at the NAV at the beginning of the year, reinvestment of all dividends and distributions, a complete redemption of the investment at the NAV at the end of the year and no sales or redemption charges (if any). Total returns would be reduced if a sales or redemption charge was taken into account. Returns do not reflect the impact of taxes to shareholders relating to Fund distributions or the redemption of Fund shares. |
| (c) | The Fund’s portfolio turnover rate is calculated in accordance with regulatory requirements, without regard to transactions involving short term investments. If such transactions were included, the Fund’s portfolio turnover rate may be higher. |
| 94 | The accompanying notes are an integral part of these financial statements. |
GOLDMAN SACHS SMALL/MID CAP VALUE FUND
Financial Highlights (continued)
Selected Share Data for a Share Outstanding Throughout Each Year
| Goldman Sachs Small/Mid Cap Value Fund | ||||||||||||||||||||||
| Institutional Shares | ||||||||||||||||||||||
| Year Ended August 31, | ||||||||||||||||||||||
| 2021 | 2020 | 2019 | 2018 | 2017 | ||||||||||||||||||
| Per Share Data |
| |||||||||||||||||||||
Net asset value, beginning of year | $ | 11.67 | $ | 12.18 | $ | 13.74 | $ | 12.50 | $ | 11.29 | ||||||||||||
Net investment income(a) | 0.07 | 0.09 | 0.12 | 0.08 | 0.12 | |||||||||||||||||
Net realized and unrealized gain (loss) | 5.87 | (0.47 | ) | (0.88 | ) | 1.75 | 1.20 | |||||||||||||||
Total from investment operations | 5.94 | (0.38 | ) | (0.76 | ) | 1.83 | 1.32 | |||||||||||||||
Distributions to shareholders from net investment income | (0.10 | ) | (0.13 | ) | (0.04 | ) | (0.12 | ) | (0.11 | ) | ||||||||||||
Distributions to shareholders from net realized gains | — | — | (0.76 | ) | (0.47 | ) | — | |||||||||||||||
Total distributions | (0.10 | ) | (0.13 | ) | (0.80 | ) | (0.59 | ) | (0.11 | ) | ||||||||||||
Net asset value, end of year | $ | 17.51 | $ | 11.67 | $ | 12.18 | $ | 13.74 | $ | 12.50 | ||||||||||||
| Total Return(b) | 51.16 | % | (3.26 | )% | (5.00 | )% | 14.93 | % | 11.71 | % | ||||||||||||
Net assets, end of year (in 000’s) | $ | 18,472 | $ | 7,054 | $ | 6,223 | $ | 5,666 | $ | 42,085 | ||||||||||||
Ratio of net expenses to average net assets | 0.84 | % | 0.85 | % | 0.84 | % | 0.84 | % | 0.84 | % | ||||||||||||
Ratio of total expenses to average net assets | 1.05 | % | 1.12 | % | 1.17 | % | 1.08 | % | 1.35 | % | ||||||||||||
Ratio of net investment income to average net assets | 0.44 | % | 0.78 | % | 0.99 | % | 0.58 | % | 0.97 | % | ||||||||||||
Portfolio turnover rate(c) | 78 | % | 76 | % | 73 | % | 105 | % | 108 | % | ||||||||||||
| (a) | Calculated based on the average shares outstanding methodology. |
| (b) | Assumes investment at the NAV at the beginning of the year, reinvestment of all dividends and distributions, a complete redemption of the investment at the NAV at the end of the year and no sales or redemption charges (if any). Total returns would be reduced if a sales or redemption charge was taken into account. Returns do not reflect the impact of taxes to shareholders relating to Fund distributions or the redemption of Fund shares. |
| (c) | The Fund’s portfolio turnover rate is calculated in accordance with regulatory requirements, without regard to transactions involving short term investments. If such transactions were included, the Fund’s portfolio turnover rate may be higher. |
| The accompanying notes are an integral part of these financial statements. | 95 |
GOLDMAN SACHS SMALL/MID CAP VALUE FUND
Financial Highlights (continued)
Selected Share Data for a Share Outstanding Throughout Each Year
| Goldman Sachs Small/Mid Cap Value Fund | ||||||||||||||||||||||
| Investor Shares | ||||||||||||||||||||||
| Year Ended August 31, | ||||||||||||||||||||||
| 2021 | 2020 | 2019 | 2018 | 2017 | ||||||||||||||||||
| Per Share Data |
| |||||||||||||||||||||
Net asset value, beginning of year | $ | 11.59 | $ | 12.09 | $ | 13.67 | $ | 12.44 | $ | 11.23 | ||||||||||||
Net investment income(a) | 0.07 | 0.08 | 0.10 | 0.08 | 0.10 | |||||||||||||||||
Net realized and unrealized gain (loss) | 5.82 | (0.47 | ) | (0.88 | ) | 1.73 | 1.19 | |||||||||||||||
Total from investment operations | 5.89 | (0.39 | ) | (0.78 | ) | 1.81 | 1.29 | |||||||||||||||
Distributions to shareholders from net investment income | (0.07 | ) | (0.11 | ) | (0.04 | ) | (0.11 | ) | (0.08 | ) | ||||||||||||
Distributions to shareholders from net realized gains | — | — | (0.76 | ) | (0.47 | ) | — | |||||||||||||||
Total distributions | (0.07 | ) | (0.11 | ) | (0.80 | ) | (0.58 | ) | (0.08 | ) | ||||||||||||
Net asset value, end of year | $ | 17.41 | $ | 11.59 | $ | 12.09 | $ | 13.67 | $ | 12.44 | ||||||||||||
| Total Return(b) | 50.98 | % | (3.32 | )% | (5.19 | )% | 14.82 | % | 11.52 | % | ||||||||||||
Net assets, end of year (in 000’s) | $ | 13,553 | $ | 1,435 | $ | 3,253 | $ | 5,541 | $ | 3,250 | ||||||||||||
Ratio of net expenses to average net assets | 0.96 | % | 0.98 | % | 0.98 | % | 0.98 | % | 0.99 | % | ||||||||||||
Ratio of total expenses to average net assets | 1.15 | % | 1.26 | % | 1.30 | % | 1.22 | % | 1.48 | % | ||||||||||||
Ratio of net investment income to average net assets | 0.40 | % | 0.74 | % | 0.85 | % | 0.61 | % | 0.82 | % | ||||||||||||
Portfolio turnover rate(c) | 78 | % | 76 | % | 73 | % | 105 | % | 108 | % | ||||||||||||
| (a) | Calculated based on the average shares outstanding methodology. |
| (b) | Assumes investment at the NAV at the beginning of the year, reinvestment of all dividends and distributions, a complete redemption of the investment at the NAV at the end of the year and no sales or redemption charges (if any). Total returns would be reduced if a sales or redemption charge was taken into account. Returns do not reflect the impact of taxes to shareholders relating to Fund distributions or the redemption of Fund shares. |
| (c) | The Fund’s portfolio turnover rate is calculated in accordance with regulatory requirements, without regard to transactions involving short term investments. If such transactions were included, the Fund’s portfolio turnover rate may be higher. |
| 96 | The accompanying notes are an integral part of these financial statements. |
GOLDMAN SACHS SMALL/MID CAP VALUE FUND
Financial Highlights (continued)
Selected Share Data for a Share Outstanding Throughout Each Year
| Goldman Sachs Small/Mid Cap Value Fund | ||||||||||||||||||||||
| Class R6 Shares | ||||||||||||||||||||||
| Year Ended August 31, | ||||||||||||||||||||||
| 2021 | 2020 | 2019 | 2018 | 2017 | ||||||||||||||||||
| Per Share Data |
| |||||||||||||||||||||
Net asset value, beginning of year | $ | 11.66 | $ | 12.16 | $ | 13.75 | $ | 12.51 | $ | 11.29 | ||||||||||||
Net investment income(a) | 0.07 | 0.09 | 0.12 | 0.10 | 0.12 | |||||||||||||||||
Net realized and unrealized gain (loss) | 5.87 | (0.46 | ) | (0.89 | ) | 1.73 | 1.21 | |||||||||||||||
Total from investment operations | 5.94 | (0.37 | ) | (0.77 | ) | 1.83 | 1.33 | |||||||||||||||
Distributions to shareholders from net investment income | (0.10 | ) | (0.13 | ) | (0.06 | ) | (0.12 | ) | (0.11 | ) | ||||||||||||
Distributions to shareholders from net realized gains | — | — | (0.76 | ) | (0.47 | ) | — | |||||||||||||||
Total distributions | (0.10 | ) | (0.13 | ) | (0.82 | ) | (0.59 | ) | (0.11 | ) | ||||||||||||
Net asset value, end of year | $ | 17.50 | $ | 11.66 | $ | 12.16 | $ | 13.75 | $ | 12.51 | ||||||||||||
| Total Return(b) | 51.12 | % | (3.17 | )% | (5.06 | )% | 14.94 | % | 11.80 | % | ||||||||||||
Net assets, end of year (in 000’s) | $ | 97,324 | $ | 52,507 | $ | 57,055 | $ | 60,931 | $ | 61,251 | ||||||||||||
Ratio of net expenses to average net assets | 0.83 | % | 0.84 | % | 0.83 | % | 0.83 | % | 0.83 | % | ||||||||||||
Ratio of total expenses to average net assets | 1.04 | % | 1.11 | % | 1.16 | % | 1.07 | % | 1.08 | % | ||||||||||||
Ratio of net investment income to average net assets | 0.44 | % | 0.79 | % | 1.00 | % | 0.75 | % | 0.97 | % | ||||||||||||
Portfolio turnover rate(c) | 78 | % | 76 | % | 73 | % | 105 | % | 108 | % | ||||||||||||
| (a) | Calculated based on the average shares outstanding methodology. |
| (b) | Assumes investment at the NAV at the beginning of the year, reinvestment of all dividends and distributions, a complete redemption of the investment at the NAV at the end of the year and no sales or redemption charges (if any). Total returns would be reduced if a sales or redemption charge was taken into account. Returns do not reflect the impact of taxes to shareholders relating to Fund distributions or the redemption of Fund shares. |
| (c) | The Fund’s portfolio turnover rate is calculated in accordance with regulatory requirements, without regard to transactions involving short term investments. If such transactions were included, the Fund’s portfolio turnover rate may be higher. |
| The accompanying notes are an integral part of these financial statements. | 97 |
GOLDMAN SACHS SMALL/MID CAP VALUE FUND
Financial Highlights (continued)
Selected Share Data for a Share Outstanding Throughout Each Year
| Goldman Sachs Small/Mid Cap Value Fund | ||||||||||||||||||||||
| Class R Shares | ||||||||||||||||||||||
| Year Ended August 31, | ||||||||||||||||||||||
| 2021 | 2020 | 2019 | 2018 | 2017 | ||||||||||||||||||
| Per Share Data |
| |||||||||||||||||||||
Net asset value, beginning of year | $ | 11.46 | $ | 11.96 | $ | 13.56 | $ | 12.35 | $ | 11.15 | ||||||||||||
Net investment income (loss)(a) | (0.03 | ) | 0.03 | 0.04 | 0.01 | 0.04 | ||||||||||||||||
Net realized and unrealized gain (loss) | 5.78 | (0.49 | ) | (0.87 | ) | 1.72 | 1.19 | |||||||||||||||
Total from investment operations | 5.75 | (0.46 | ) | (0.83 | ) | 1.73 | 1.23 | |||||||||||||||
Distributions to shareholders from net investment income | — | (0.04 | ) | (0.01 | ) | (0.05 | ) | (0.03 | ) | |||||||||||||
Distributions to shareholders from net realized gains | — | — | (0.76 | ) | (0.47 | ) | — | |||||||||||||||
Total distributions | — | (0.04 | ) | (0.77 | ) | (0.52 | ) | (0.03 | ) | |||||||||||||
Net asset value, end of year | $ | 17.21 | $ | 11.46 | $ | 11.96 | $ | 13.56 | $ | 12.35 | ||||||||||||
| Total Return(c) | 50.17 | % | (3.85 | )% | (5.65 | )% | 14.20 | % | 11.06 | % | ||||||||||||
Net assets, end of year (in 000’s) | $ | 99 | $ | 74 | $ | 160 | $ | 207 | $ | 131 | ||||||||||||
Ratio of net expenses to average net assets | 1.46 | % | 1.48 | % | 1.48 | % | 1.48 | % | 1.49 | % | ||||||||||||
Ratio of total expenses to average net assets | 1.67 | % | 1.76 | % | 1.81 | % | 1.72 | % | 2.00 | % | ||||||||||||
Ratio of net investment income (loss) to average net assets | (0.19 | )% | 0.29 | % | 0.36 | % | 0.09 | % | 0.32 | % | ||||||||||||
Portfolio turnover rate(d) | 78 | % | 76 | % | 73 | % | 105 | % | 108 | % | ||||||||||||
| (a) | Calculated based on the average shares outstanding methodology. |
| (b) | Amount is less than $0.005 per share. |
| (c) | Assumes investment at the NAV at the beginning of the year, reinvestment of all dividends and distributions, a complete redemption of the investment at the NAV at the end of the year and no sales or redemption charges (if any). Total returns would be reduced if a sales or redemption charge was taken into account. Returns do not reflect the impact of taxes to shareholders relating to Fund distributions or the redemption of Fund shares. |
| (d) | The Fund’s portfolio turnover rate is calculated in accordance with regulatory requirements, without regard to transactions involving short term investments. If such transactions were included, the Fund’s portfolio turnover rate may be higher. |
| 98 | The accompanying notes are an integral part of these financial statements. |
GOLDMAN SACHS SMALL/MID CAP VALUE FUND
Financial Highlights (continued)
Selected Share Data for a Share Outstanding Throughout Each Period
| Goldman Sachs Small/Mid Cap Value Fund | ||||||||||||||||||
| Class P Shares | ||||||||||||||||||
| Year Ended August 31, | Period Ended August 31, 2018(a) | |||||||||||||||||
| 2021 | 2020 | 2019 | ||||||||||||||||
| Per Share Data |
| |||||||||||||||||
Net asset value, beginning of period | $ | 11.66 | $ | 12.16 | $ | 13.75 | $ | 13.26 | ||||||||||
Net investment income(b) | 0.07 | 0.09 | 0.12 | 0.05 | ||||||||||||||
Net realized and unrealized gain (loss) | 5.86 | (0.46 | ) | (0.89 | ) | 0.44 | ||||||||||||
Total from investment operations | 5.93 | (0.37 | ) | (0.77 | ) | 0.49 | ||||||||||||
Distributions to shareholders from net investment income | (0.10 | ) | (0.13 | ) | (0.06 | ) | — | |||||||||||
Distributions to shareholders from net realized gains | — | — | (0.76 | ) | — | |||||||||||||
Total distributions | (0.10 | ) | (0.13 | ) | (0.82 | ) | — | |||||||||||
Net asset value, end of period | $ | 17.49 | $ | 11.66 | $ | 12.16 | $ | 13.75 | ||||||||||
| Total Return(c) | 51.04 | % | (3.17 | )% | (5.05 | )% | 3.70 | % | ||||||||||
Net assets, end of period (in 000’s) | $ | 92,056 | $ | 38,153 | $ | 48,725 | $ | 54,660 | ||||||||||
Ratio of net expenses to average net assets | 0.83 | % | 0.84 | % | 0.83 | % | 0.83 | %(d) | ||||||||||
Ratio of total expenses to average net assets | 1.04 | % | 1.11 | % | 1.16 | % | 1.09 | %(d) | ||||||||||
Ratio of net investment income to average net assets | 0.44 | % | 0.79 | % | 1.00 | % | 0.99 | %(d) | ||||||||||
Portfolio turnover rate(e) | 78 | % | 76 | % | 73 | % | 105 | % | ||||||||||
| (a) | Commenced operations on April 17, 2018. |
| (b) | Calculated based on the average shares outstanding methodology. |
| (c) | Assumes investment at the NAV at the beginning of the period, reinvestment of all dividends and distributions, a complete redemption of the investment at the NAV at the end of the period and no sales or redemption charges (if any). Total returns would be reduced if a sales or redemption charge was taken into account. Returns do not reflect the impact of taxes to shareholders relating to Fund distributions or the redemption of Fund shares. Total returns for periods less than one full year are not annualized. |
| (d) | Annualized. |
| (e) | The Fund’s portfolio turnover rate is calculated in accordance with regulatory requirements, without regard to transactions involving short term investments. If such transactions were included, the Fund’s portfolio turnover rate may be higher. |
| The accompanying notes are an integral part of these financial statements. | 99 |
GOLDMAN SACHS FUNDAMENTAL EQUITY VALUE FUNDS
August 31, 2021
| 1. ORGANIZATION |
Goldman Sachs Trust (the “Trust”) is a Delaware statutory trust registered under the Investment Company Act of 1940, as amended (the “Act”), as an open-end management investment company. The following table lists those series of the Trust that are included in this report (collectively, the “Funds” or individually a “Fund”), along with their corresponding share classes and respective diversification status under the Act:
| Fund | Share Classes Offered | Diversified/ Non-Diversified | ||
Focused Value | A, C, Institutional, Investor, P, R and R6 | Non-Diversified | ||
Equity Income, Large Cap Value, Mid Cap Value, Small Cap Value | A, C, Institutional, Service, Investor, P, R and R6 | Diversified | ||
Small/Mid Cap Value | A, C, Institutional, Investor, P, R and R6 | Diversified |
Class A Shares are sold with a front-end sales charge of up to 5.50%. Class C Shares are sold with a contingent deferred sales charge (“CDSC”) of 1.00%, which is imposed on redemptions made within 12 months of purchase. Institutional, Service, Investor, Class R6, Class R and Class P Shares are not subject to a sales charge.
Goldman Sachs Asset Management, L.P. (“GSAM”), an affiliate of Goldman Sachs & Co. LLC (“Goldman Sachs”), serves as investment adviser to the Funds pursuant to a management agreement (the “Agreement”) with the Trust.
| 2. SIGNIFICANT ACCOUNTING POLICIES |
The financial statements have been prepared in accordance with accounting principles generally accepted in the United States of America (“GAAP”) and require management to make estimates and assumptions that may affect the reported amounts and disclosures. Actual results may differ from those estimates and assumptions. Each Fund is an investment company under GAAP and follows the accounting and reporting guidance applicable to investment companies.
A. Investment Valuation — The Funds’ valuation policy is to value investments at fair value.
B. Investment Income and Investments — Investment income includes interest income, dividend income and securities lending income, if any. Interest income is accrued daily and adjusted for amortization of premiums and accretion of discounts. Dividend income is recognized on ex-dividend date or, for certain foreign securities, as soon as such information is obtained subsequent to the ex-dividend date. Non-cash dividends, if any, are recorded at the fair market value of the securities received. Investment transactions are reflected on trade date. Realized gains and losses are calculated using identified cost. Investment transactions are recorded on the following business day for daily net asset value (“NAV”) calculations. Investment income is recorded net of any foreign withholding taxes, less any amounts reclaimable. The Funds may file withholding tax reclaims in certain jurisdictions to recover a portion of amounts previously withheld. These reclaims if any, are recorded when the amount is known and there are no significant uncertainties on collectability. Such amounts recovered if any, are reflected as other income in the Statements of Operations. Any foreign capital gains tax is accrued daily based upon net unrealized gains, and is payable upon sale of such investments. Distributions received from the Funds’ investments in U.S. real estate investment trusts (“REITs”) may be characterized as ordinary income, net capital gain and/or a return of capital. A return of capital is recorded by the Funds as a reduction to the cost basis of the REIT.
C. Class Allocations and Expenses — Investment income, realized and unrealized gain (loss), if any, and non-class specific expenses of each Fund are allocated daily based upon the proportion of net assets of each class. Non-class specific expenses directly incurred by a Fund are charged to that Fund, while such expenses incurred by the Trust are allocated across the applicable Funds on a straight-line and/or pro-rata basis depending upon the nature of the expenses. Class specific expenses, where applicable, are borne by the respective share classes and include Distribution and Service, Transfer Agency and Service and Shareholder Administration fees.
D. Federal Taxes and Distributions to Shareholders — It is each Fund’s policy to comply with the requirements of the Internal Revenue Code of 1986, as amended (the “Code”), applicable to regulated investment companies and to distribute each
100
GOLDMAN SACHS FUNDAMENTAL EQUITY VALUE FUNDS
| 2. SIGNIFICANT ACCOUNTING POLICIES (continued) |
year substantially all of its investment company taxable income and capital gains to its shareholders. Accordingly, each Fund is not required to make any provisions for the payment of federal income tax. Distributions to shareholders are recorded on the ex-dividend date. Income and capital gains distributions, if any, are declared and paid according to the following schedule:
| Fund | Income Distributions Declared/Paid | Capital Gains Distributions Declared/Paid | ||||
Equity Income | Quarterly | Annually | ||||
Focused Value, Large Cap Value, Mid Cap Value, | Annually | Annually |
Net capital losses, if any, are carried forward to future fiscal years and may be used to the extent allowed by the Code to offset any future capital gains. Losses that are carried forward will retain their character as either short-term or long-term capital losses. Utilization of capital loss carryforwards will reduce the requirement of future capital gains distributions.
The characterization of distributions to shareholders for financial reporting purposes is determined in accordance with federal income tax rules, which may differ from GAAP. The source of each Fund’s distributions may be shown in the accompanying financial statements as either from distributable earnings or capital. Certain components of the Funds’ net assets on the Statements of Assets and Liabilities reflect permanent GAAP/tax differences based on the appropriate tax character.
E. Foreign Currency Translation — The accounting records and reporting currency of the Funds are maintained in U.S. dollars. Assets and liabilities denominated in foreign currencies are translated into U.S. dollars using the current exchange rates at the close of each business day. The effect of changes in foreign currency exchange rates on investments is included within net realized and unrealized gain (loss) on investments. Changes in the value of other assets and liabilities as a result of fluctuations in foreign exchange rates are included in the Statements of Operations within net change in unrealized gain (loss) on foreign currency translation. Transactions denominated in foreign currencies are translated into U.S. dollars on the date the transaction occurred, the effects of which are included within net realized gain (loss) on foreign currency transactions.
| 3. INVESTMENTS AND FAIR VALUE MEASUREMENTS |
U.S. GAAP defines the fair value of a financial instrument as the amount that would be received to sell an asset or paid to transfer a liability in an orderly transaction between market participants at the measurement date (i.e., the exit price); the Funds’ policy is to use the market approach. GAAP establishes a fair value hierarchy that prioritizes the inputs to valuation techniques used to measure fair value. The hierarchy gives the highest priority to unadjusted quoted prices in active markets for identical assets or liabilities (Level 1 measurements) and the lowest priority to unobservable inputs (Level 3 measurements). The level in the fair value hierarchy within which the fair value measurement in its entirety falls shall be determined based on the lowest level input that is significant to the fair value measurement in its entirety. The levels used for classifying investments are not necessarily an indication of the risk associated with investing in these investments. The three levels of the fair value hierarchy are described below:
Level 1 — Unadjusted quoted prices in active markets that are accessible at the measurement date for identical, unrestricted assets or liabilities;
Level 2 — Quoted prices in markets that are not active or financial instruments for which significant inputs are observable
(including, but not limited to, quoted prices for similar investments, interest rates, foreign exchange rates, volatility and credit spreads), either directly or indirectly;
Level 3 — Prices or valuations that require significant unobservable inputs (including GSAM’s assumptions in determining fair value measurement).
The Board of Trustees (“Trustees”) has approved Valuation Procedures that govern the valuation of the portfolio investments held by the Funds, including investments for which market quotations are not readily available. The Trustees have delegated to GSAM
101
GOLDMAN SACHS FUNDAMENTAL EQUITY VALUE FUNDS
Notes to Financial Statements (continued)
August 31, 2021
| 3. INVESTMENTS AND FAIR VALUE MEASUREMENTS (continued) |
day-to-day responsibility for implementing and maintaining internal controls and procedures related to the valuation of the Funds’ investments. To assess the continuing appropriateness of pricing sources and methodologies, GSAM regularly performs price verification procedures and issues challenges as necessary to third party pricing vendors or brokers, and any differences are reviewed in accordance with the Valuation Procedures.
A. Level 1 and Level 2 Fair Value Investments — The valuation techniques and significant inputs used in determining the fair values for investments classified as Level 1 and Level 2 are as follows:
Equity Securities — Equity securities traded on a United States (“U.S.”) securities exchange or the NASDAQ system, or those located on certain foreign exchanges, including but not limited to the Americas, are valued daily at their last sale price or official closing price on the principal exchange or system on which they are traded. If there is no sale or official closing price or such price is believed by GSAM to not represent fair value, equity securities will be valued at the valid closing bid price for long positions and at the valid closing ask price for short positions (i.e. where there is sufficient volume, during normal exchange trading hours). If no valid bid/ask price is available, the equity security will be valued pursuant to the Valuation Procedures approved by the Trustees and consistent with applicable regulatory guidance. To the extent these investments are actively traded, they are classified as Level 1 of the fair value hierarchy, otherwise they are generally classified as Level 2. Certain equity securities containing unique attributes may be classified as Level 2.
Unlisted equity securities for which market quotations are available are valued at the last sale price on the valuation date, or if no sale occurs, at the last bid price for long positions or the last ask price for short positions, and are generally classified as Level 2. Securities traded on certain foreign securities exchanges are valued daily at fair value determined by an independent fair value service (if available) under Fair Valuation Procedures approved by the Trustees and consistent with applicable regulatory guidance. The independent fair value service takes into account multiple factors including, but not limited to, movements in the securities markets, certain depositary receipts, futures contracts and foreign currency exchange rates that have occurred subsequent to the close of the foreign securities exchange. These investments are generally classified as Level 2 of the fair value hierarchy.
Underlying Funds (including Money Market Funds) — Underlying funds (“Underlying Funds”) include other investment companies and exchange-traded funds (“ETFs”). Investments in the Underlying Funds (except ETFs) are valued at the NAV per share on the day of valuation. ETFs are valued daily at the last sale price or official closing price on the principal exchange or system on which the investment is traded. Because the Funds invest in Underlying Funds that fluctuate in value, the Funds’ shares will correspondingly fluctuate in value. To the extent these investments are actively traded, they are classified as Level 1 of the fair value hierarchy, otherwise they are generally classified as Level 2. For information regarding an Underlying Fund’s accounting policies and investment holdings, please see the Underlying Fund’s shareholder report.
B. Level 3 Fair Value Investments — To the extent that significant inputs to valuation models and other alternative pricing sources are unobservable, or if quotations are not readily available, or if GSAM believes that such quotations do not accurately reflect fair value, the fair value of a Fund’s investments may be determined under Valuation Procedures approved by the Trustees. GSAM, consistent with its procedures and applicable regulatory guidance, may make an adjustment to the most recent valuation prices of either domestic or foreign securities in light of significant events to reflect what it believes to be the fair value of the securities at the time of determining a Fund’s NAV. To the extent investments are valued using single source broker quotations obtained directly from the broker or passed through from third party pricing vendors, such investments are classified as Level 3 investments.
102
GOLDMAN SACHS FUNDAMENTAL EQUITY VALUE FUNDS
| 3. INVESTMENTS AND FAIR VALUE MEASUREMENTS (continued) |
C. Fair Value Hierarchy — The following is a summary of the Funds’ investments classified in the fair value hierarchy as of August 31, 2021:
| EQUITY INCOME FUND |
| |||||||||||
| Investment Type | Level 1 | Level 2 | Level 3 | |||||||||
| Assets | ||||||||||||
Common Stock and/or Other Equity Investments(a) | ||||||||||||
Asia | $ | 2,700,860 | $ | — | $ | — | ||||||
Europe | 16,896,291 | — | — | |||||||||
North America | 398,353,597 | — | — | |||||||||
Oceania | 6,130,291 | — | — | |||||||||
Investment Company | 809,595 | — | — | |||||||||
| Total | $ | 424,890,634 | $ | — | $ | — | ||||||
| FOCUSED VALUE FUND | ||||||||||||
| Investment Type | Level 1 | Level 2 | Level 3 | |||||||||
| Assets | ||||||||||||
Common Stock and/or Other Equity Investments(a) | ||||||||||||
North America | $ | 39,199,229 | $ | — | $ | — | ||||||
Investment Company | 426,826 | — | — | |||||||||
| Total | $ | 39,626,055 | $ | — | $ | — | ||||||
| LARGE CAP VALUE FUND | ||||||||||||
| Investment Type | Level 1 | Level 2 | Level 3 | |||||||||
| Assets | ||||||||||||
Common Stock and/or Other Equity Investments(a) | ||||||||||||
Asia | $ | 2,991,813 | $ | — | $ | — | ||||||
Europe | 4,992,858 | — | — | |||||||||
North America | 485,895,458 | — | — | |||||||||
Investment Company | 5,056,208 | — | — | |||||||||
| Total | $ | 498,936,337 | $ | — | $ | — | ||||||
| MID CAP VALUE FUND | ||||||||||||
| Investment Type | Level 1 | Level 2 | Level 3 | |||||||||
| Assets | ||||||||||||
Common Stock and/or Other Equity Investments(a) | ||||||||||||
Europe | $ | 22,160,652 | $ | — | $ | — | ||||||
North America | 1,217,638,113 | — | — | |||||||||
Investment Company | 10,084,240 | — | — | |||||||||
| Total | $ | 1,249,883,005 | $ | — | $ | — | ||||||
| (a) | Amounts are disclosed by continent to highlight the impact of time zone differences between local market close and the calculation of NAV. Security valuations are based on the principal exchange or system on which they are traded, which may differ from country of domicile noted in table. |
103
GOLDMAN SACHS FUNDAMENTAL EQUITY VALUE FUNDS
Notes to Financial Statements (continued)
August 31, 2021
| 3. INVESTMENTS AND FAIR VALUE MEASUREMENTS (continued) |
| SMALL CAP VALUE FUND | ||||||||||||
| Investment Type | Level 1 | Level 2 | Level 3 | |||||||||
| Assets | ||||||||||||
Common Stock and/or Other Equity Investments(a) | ||||||||||||
North America | $ | 4,798,053,539 | $ | — | $ | — | ||||||
Investment Company | 5,404,503 | — | — | |||||||||
Securities Lending Reinvestment Vehicle | 26,189,986 | — | — | |||||||||
| Total | $ | 4,829,648,028 | $ | — | $ | — | ||||||
| SMALL/MID CAP VALUE FUND | ||||||||||||
| Investment Type | Level 1 | Level 2 | Level 3 | |||||||||
| Assets | ||||||||||||
Common Stock and/or Other Equity Investments(a) | ||||||||||||
North America | $ | 223,902,980 | $ | — | $ | — | ||||||
Investment Company | 583,228 | — | — | |||||||||
Securities Lending Reinvestment Vehicle | 764,357 | — | — | |||||||||
| Total | $ | 225,250,565 | $ | — | $ | — | ||||||
| (a) | Amounts are disclosed by continent to highlight the impact of time zone differences between local market close and the calculation of NAV. Security valuations are based on the principal exchange or system on which they are traded, which may differ from country of domicile noted in table. |
For further information regarding security characteristics, see the Schedules of Investments.
| 4. AGREEMENTS AND AFFILIATED TRANSACTIONS |
A. Management Agreement — Under the Agreement, GSAM manages the Funds, subject to the general supervision of the Trustees.
As compensation for the services rendered pursuant to the Agreement, the assumption of the expenses related thereto and administration of the Funds’ business affairs, including providing facilities, GSAM is entitled to a management fee, accrued daily and paid monthly, equal to an annual percentage rate of each Fund’s average daily net assets.
As of August 31, 2021, contractual and effective net management fees with GSAM were at the following rates:
| Contractual Management Rate | Effective Contractual Management Rate | Effective Net Management Rate# | ||||||||||||||||||||||||||||
| Fund | First $1 billion | Next $1 billion | Next $3 billion | Next $3 billion | Over $8 billion | |||||||||||||||||||||||||
Equity Income | 0.69 | % | 0.62 | % | 0.59 | % | 0.58 | % | 0.57 | % | 0.69 | % | 0.69 | % | ||||||||||||||||
Focused Value | 0.69 | 0.62 | 0.59 | 0.58 | 0.57 | 0.69 | 0.69 | |||||||||||||||||||||||
Large Cap Value | 0.75 | 0.68 | 0.65 | 0.64 | 0.63 | 0.75 | 0.69 | * | ||||||||||||||||||||||
Mid Cap Value | 0.75 | 0.75 | 0.68 | 0.65 | 0.64 | 0.75 | 0.75 | |||||||||||||||||||||||
Small Cap Value | 0.98 | 0.98 | 0.88 | 0.84 | 0.82 | 0.92 | 0.92 | |||||||||||||||||||||||
Small/Mid Cap Value | 0.80 | 0.80 | 0.72 | 0.68 | 0.67 | 0.80 | 0.80 | |||||||||||||||||||||||
| # | The Effective Net Management Rate includes the impact of management fee waivers of affiliated underlying funds, if any. The Effective Net Management Rate may not correlate to the Contractual Management Rate as a result of management fee waivers that may be in effect from time to time. |
104
GOLDMAN SACHS FUNDAMENTAL EQUITY VALUE FUNDS
| 4. AGREEMENTS AND AFFILIATED TRANSACTIONS (continued) |
| * | Effective December 29, 2020, GSAM agreed to waive a portion of its management fee with respect to the Large Cap Value Fund in order to achieve an effective net management fee rate of 0.69% as an annual percentage of the Fund’s average daily net assets. This arrangement will remain in effect through at least December 29, 2021, and prior to such date, GSAM may not terminate the arrangement without the approval of the Board of Trustees. |
The Funds invest in Institutional Shares of the Goldman Sachs Financial Square Government Fund (“Government Money Market Fund”), which is an affiliated Underlying Fund. GSAM has agreed to waive a portion of its management fee payable by the Funds in an amount equal to the management fee it earns as an investment adviser to the affiliated Underlying Fund in which the Funds invest, except those management fees it earns from the Funds’ investments of cash collateral received in connection with securities lending transactions in the Government Money Market Fund. For the fiscal year ended August 31, 2021, the management fee waived by GSAM for each Fund was as follows:
| Fund | Management Fee Waived | |||||
Equity Income | $ | 2,303 | ||||
Focused Value | 626 | |||||
Large Cap Value | 4,361 | |||||
Mid Cap Value | 5,613 | |||||
Small Cap Value | 24,394 | |||||
Small/Mid Cap Value | 2,036 | |||||
B. Distribution and/or Service (12b-1) Plans — The Trust, on behalf of Class A and Class R Shares of each applicable Fund, has adopted Distribution and Service Plans subject to Rule 12b-1 under the Act. Under the Distribution and Service Plans, Goldman Sachs, which serves as distributor (the “Distributor”), is entitled to a fee accrued daily and paid monthly for distribution services and personal and account maintenance services, which may then be paid by Goldman Sachs to authorized dealers. These fees are equal to an annual percentage rate of the average daily net assets attributable to Class A or Class R Shares of the Funds, as applicable, as set forth below.
The Trust, on behalf of Class C Shares of each applicable Fund, has adopted a Distribution Plan subject to Rule 12b-1 under the Act. Under the Distribution Plan, Goldman Sachs as Distributor is entitled to a fee accrued daily and paid monthly for distribution services, which may then be paid by Goldman Sachs to authorized dealers. These fees are equal to an annual percentage rate of the average daily net assets attributable to Class C Shares of the Funds, as set forth below.
The Trust, on behalf of Service Shares of each applicable Fund, has adopted a Service Plan subject to Rule 12b-1 under the Act to allow Service Shares to compensate service organizations (including Goldman Sachs) for providing personal and account maintenance services to their customers who are beneficial owners of such shares. The Service Plan provides for compensation to the service organizations equal to an annual percentage rate of the average daily net assets attributable to Service Shares of the Funds, as set forth below.
| Distribution and/or Service Plan Rates | ||||||||||||||||
| Class A* | Class C | Service | Class R* | |||||||||||||
Distribution and/or Service Plan | 0.25 | % | 0.75 | % | 0.25 | % | 0.50 | % | ||||||||
| * | With respect to Class A and Class R Shares, the Distributor at its discretion may use compensation for distribution services paid under the Distribution and/or Service Plans to compensate service organizations for personal and account maintenance services and expenses as long as such total compensation does not exceed the maximum cap on “service fees” imposed by the Financial Industry Regulatory Authority. |
105
GOLDMAN SACHS FUNDAMENTAL EQUITY VALUE FUNDS
Notes to Financial Statements (continued)
August 31, 2021
| 4. AGREEMENTS AND AFFILIATED TRANSACTIONS (continued) |
C. Distribution Agreement — Goldman Sachs, as Distributor of the shares of the Funds pursuant to a Distribution Agreement, may retain a portion of the Class A Shares’ front end sales charge and Class C Shares’ CDSC. During the fiscal year ended August 31, 2021, Goldman Sachs retained the following amounts:
| Front End Sales Charge | Contingent Deferred Sales Charge | |||||||||
| Fund | Class A | Class C | ||||||||
Equity Income | $ | 9,566 | $ | — | ||||||
Focused Value | 432 | — | ||||||||
Large Cap Value | 3,411 | — | ||||||||
Mid Cap Value | 12,601 | — | ||||||||
Small Cap Value | 5,369 | — | ||||||||
Small/Mid Cap Value | 1,584 | — | ||||||||
D. Service and Shareholder Administration Plans — The Trust, on behalf of each applicable Fund, has adopted Service Plans to allow Class C Shares and Shareholder Administration Plans to allow Service Shares, respectively, to compensate service organizations (including Goldman Sachs) for providing varying levels of personal and account maintenance or shareholder administration services to their customers who are beneficial owners of such shares. The Service and Shareholder Administration Plans each provide for compensation to the service organizations equal to an annual percentage rate of 0.25% of the average daily net assets attributable to Class C and Service Shares of the Funds, respectively.
E. Transfer Agency Agreement — Goldman Sachs also serves as the transfer agent of the Funds for a fee pursuant to the Transfer Agency Agreement. The fees charged for such transfer agency services are accrued daily and paid monthly at annual rates as follows: 0.16% of the average daily net assets of Class A, Class C, Investor and Class R Shares; 0.03% of the average daily net assets of Class R6 and Class P Shares; and 0.04% of the average daily net assets of Institutional and Service Shares.
For the fiscal year ended August 31, 2021, the transfer agency fee waivers were as follows:
| Transfer Agency Waivers (Class A, Class C, Investor, and Class R Shares) | ||||||||||
| Fund | Before December 29, 2020 | As of December 29, 2020* | ||||||||
Large Cap Value Fund | 0.07 | % | 0.06 | % | ||||||
Equity Income Fund | 0.04 | % | 0.06 | % | ||||||
Focused Value Fund | 0.04 | % | 0.06 | % | ||||||
Small Cap Value Fund | — | 0.05 | % | |||||||
| * | These arrangements will remain in effect through at least December 29, 2021, and prior to such date, Goldman Sachs may not terminate the arrangement without the approval of the Board of Trustees. |
F. Other Expense Agreements and Affiliated Transactions — GSAM has agreed to reduce or limit certain “Other Expenses” of the Funds (excluding acquired fund fees and expenses, transfer agency fees and expenses, service fees and shareholder administration fees (as applicable), taxes, interest, brokerage fees, expenses of shareholder meetings, litigation and indemnification, and extraordinary expenses) to the extent such expenses exceed, on an annual basis, a percentage rate of the average daily net assets of each Fund. Such Other Expense reimbursements, if any, are accrued daily and paid monthly. In addition, the Funds are not obligated to reimburse GSAM for prior fiscal year expense reimbursements, if any. The Other Expense limitations as an annual percentage rate of average daily net assets for Equity Income, Focused Value, Large Cap Value, Small Cap Value and Small/Mid Cap Value Funds is 0.004% and for Mid Cap Value Fund is 0.104%. These Other Expense limitations will
106
GOLDMAN SACHS FUNDAMENTAL EQUITY VALUE FUNDS
| 4. AGREEMENTS AND AFFILIATED TRANSACTIONS (continued) |
remain in place through at least December 29, 2021, and prior to such date GSAM may not terminate the arrangements without the approval of the Trustees. In addition, the Funds have entered into certain offset arrangements with the transfer agent, which may result in a reduction of the Funds’ expenses and are received irrespective of the application of the “Other Expense” limitations described above.
Goldman Sachs may voluntarily waive a portion of any payments under a Fund’s Distribution and Service Plan, Service Plan and Shareholder Administration Plan, and Transfer Agency Agreement, and these waivers are in addition to what is stipulated in any contractual fee waiver arrangements (as applicable). These temporary waivers may be modified or terminated at any time at the option of Goldman Sachs without shareholder approval.
For the fiscal year ended August 31, 2021, these expense reductions, including any fee waivers and Other Expense reimbursements, were as follows:
| Fund | Management Fee Waiver | Transfer Agency Fee Waiver/Credits | Other Expense Reimbursements | Total Expense Reductions | ||||||||||||||
Equity Income | $ | 2,303 | $ | 178,014 | $ | 382,892 | $ | 563,209 | ||||||||||
Focused Value | 626 | 204 | 260,215 | 261,045 | ||||||||||||||
Large Cap Value | 275,417 | 67,270 | 340,349 | 683,036 | ||||||||||||||
Mid Cap Value | 5,613 | — | — | 5,613 | ||||||||||||||
Small Cap Value | 24,394 | 239,961 | 1,231,888 | 1,496,243 | ||||||||||||||
Small/Mid Cap Value | 2,036 | — | 332,317 | 334,353 | ||||||||||||||
G. Line of Credit Facility — As of August 31, 2021, the Funds participated in a $1,000,000,000 committed, unsecured revolving line of credit facility (the “facility”) together with other funds of the Trust and certain registered investment companies having management agreements with GSAM or its affiliates. This facility is to be used for temporary emergency purposes, or to allow for an orderly liquidation of securities to meet redemption requests. The interest rate on borrowings is based on the federal funds rate. The facility also requires a fee to be paid by the Funds based on the amount of the commitment that has not been utilized. For the fiscal year ended August 31, 2021, the Funds did not have any borrowings under the facility. Prior to April 26, 2021, the facility was $700,000,000.
H. Other Transactions with Affiliates — The table below shows the transactions in and earnings from investments in the Government Money Market Fund — Institutional Shares for the fiscal year ended August 31, 2021:
| Fund | Beginning Value as of August 31, 2020 | Purchases at Cost | Proceeds from Sales | Ending Value as of August 31, 2021 | Shares as of August 31, 2021 | Dividend Income | ||||||||||||||||||||
Equity Income | $ | 1,485,827 | $ | 32,491,645 | $ | (33,167,877 | ) | $ | 809,595 | 809,595 | $ | 526 | ||||||||||||||
Focused Value | 116,661 | 17,508,727 | (17,198,562 | ) | 426,826 | 426,826 | 153 | |||||||||||||||||||
Large Cap Value | 3,050,807 | 51,204,932 | (49,199,531 | ) | 5,056,208 | 5,056,208 | 993 | |||||||||||||||||||
Mid Cap Value | — | 215,061,529 | (204,977,289 | ) | 10,084,240 | 10,084,240 | 1,455 | |||||||||||||||||||
Small Cap Value | 4,535,074 | 1,115,998,080 | (1,115,128,651 | ) | 5,404,503 | 5,404,503 | 7,005 | |||||||||||||||||||
Small/Mid Cap Value | — | 64,941,400 | (64,358,172 | ) | 583,228 | 583,228 | 575 | |||||||||||||||||||
107
GOLDMAN SACHS FUNDAMENTAL EQUITY VALUE FUNDS
Notes to Financial Statements (continued)
August 31, 2021
| 4. AGREEMENTS AND AFFILIATED TRANSACTIONS (continued) |
As of August 31, 2021, The Goldman Sachs Group, Inc. was the beneficial owner of 5% or more of outstanding shares of the following Funds:
| Fund | Class A | Class C | Institutional | Investor | Class P | Class R | Class R6 | |||||||||||||||||||||||
Focused Value | — | % | 27 | % | — | % | 100 | % | — | % | 31 | % | 100 | % | ||||||||||||||||
Small/Mid Cap Value | — | — | — | — | — | 16 | — | |||||||||||||||||||||||
For the fiscal year ended August 31, 2021, Goldman Sachs earned $283, $38, $4,338, $142 in brokerage commissions from portfolio transactions, on behalf of the Focused Value, Large Cap Value, Small Cap Value and Small/Mid Cap Value Funds, respectively.
| 5. PORTFOLIO SECURITIES TRANSACTIONS |
The cost of purchases and proceeds from sales and maturities of long-term securities for the fiscal year ended August 31, 2021, were as follows:
| Fund | Purchases | Sales and Maturities | Purchases In-Kind | Sales and Maturities In-Kind | ||||||||||||||
Equity Income | $ | 166,433,122 | $ | 173,696,304 | — | — | ||||||||||||
Focused Value | 41,665,495 | 18,517,195 | — | — | ||||||||||||||
Large Cap Value | 235,272,252 | 256,364,177 | — | — | ||||||||||||||
Mid Cap Value | 732,373,527 | 856,305,359 | — | — | ||||||||||||||
Small Cap Value | 3,149,218,157 | 4,596,123,481 | — | 316,189,611 | ||||||||||||||
Small/Mid Cap Value | 189,912,169 | 122,228,530 | — | — | ||||||||||||||
| 6. SECURITIES LENDING |
The Funds may lend their securities through a securities lending agent, the Bank of New York Mellon (“BNYM”), to certain qualified borrowers. In accordance with the Funds’ securities lending procedures, the Funds receive cash collateral at least equal to the market value of the securities on loan. The market value of the loaned securities is determined at the close of business of the Funds, at their last sale price or official closing price on the principal exchange or system on which they are traded, and any additional required collateral is delivered to the Funds on the next business day. As with other extensions of credit, the Funds may experience delay in the recovery of their securities or incur a loss should the borrower of the securities breach its agreement with the Funds or become insolvent at a time when the collateral is insufficient to cover the cost of repurchasing securities on loan. Dividend income received from securities on loan may not be subject to withholding taxes and therefore withholding taxes paid may differ from the amounts listed in the Statements of Operations. Loans of securities are terminable at any time and as such 1) the remaining contractual maturities of the outstanding securities lending transactions are considered to be overnight and continuous and 2) the borrower, after notice, is required to return borrowed securities within the standard time period for settlement of securities transactions.
The Funds invest the cash collateral received in connection with securities lending transactions in the Government Money Market Fund, an affiliated series of the Goldman Sachs Trust. The Government Money Market Fund is registered under the Act as an open end investment company, is subject to Rule 2a-7 under the Act, and is managed by GSAM, for which GSAM may receive a management fee of up to 0.16% on an annualized basis of the average daily net assets of the Government Money Market Fund.
108
GOLDMAN SACHS FUNDAMENTAL EQUITY VALUE FUNDS
| 6. SECURITIES LENDING (continued) |
In the event of a default by a borrower with respect to any loan, BNYM may exercise any and all remedies provided under the applicable borrower agreement to make the Funds whole. These remedies include purchasing replacement securities by applying the collateral held from the defaulting broker against the purchase cost of the replacement securities. If BNYM is unable to purchase replacement securities, BNYM will indemnify the Funds by paying the Funds an amount equal to the market value of the securities loaned minus the value of cash collateral received from the borrower for the loan, subject to an exclusion for any shortfalls resulting from a loss of value in such cash collateral due to reinvestment risk. The Funds’ master netting agreements with certain borrowers provide the right, in the event of a default (including bankruptcy or insolvency), for the non-defaulting party to liquidate the collateral and calculate net exposure to the defaulting party or request additional collateral. However, in the event of a default by a borrower, a resolution authority could determine that such rights are not enforceable due to the restrictions or prohibitions against the right of set-off that may be imposed in accordance with a particular jurisdiction’s bankruptcy or insolvency laws. The Funds’ loaned securities were all subject to enforceable Securities Lending Agreements and the value of the collateral was at least equal to the value of the cash received. The amounts of the Funds’ overnight and continuous agreements, which represent the gross amounts of recognized liabilities for securities lending transactions outstanding as of August 31, 2021, are disclosed as “Payable upon return of securities loaned” on the Statements of Assets and Liabilities, where applicable.
Each of the Funds and BNYM received compensation relating to the lending of the Funds’ securities. The amounts earned, if any, by the Funds for the fiscal year ended August 31, 2021, are reported under Investment Income on the Statements of Operations.
The following table provides information about the Funds’ investments in the Government Money Market Fund for the fiscal year ended August 31, 2021:
| Fund | Beginning Value as of August 31, 2020 | Purchases at Cost | Proceeds from Sales | Ending Value as of August 31, 2021 | ||||||||||||||
Equity Income | $ | 600,080 | $ | 19,668,312 | $ | (20,268,392 | ) | $ | — | |||||||||
Mid Cap Value | 6,163,823 | 18,354,911 | (24,518,734 | ) | — | |||||||||||||
Small Cap Value | 25,114,389 | 255,369,419 | (254,293,822 | ) | 26,189,986 | |||||||||||||
Small/Mid Cap Value | 219,900 | 8,039,673 | (7,495,216 | ) | 764,357 | |||||||||||||
| 7. TAX INFORMATION |
The tax character of distributions paid during the fiscal year ended August 31, 2021 was as follows:
| Equity Income | Focused Value | Large Cap Value | Mid Cap Value | Small Cap Value | Small/ Mid Cap Value | |||||||||||||||||||
Distributions paid from: | ||||||||||||||||||||||||
Ordinary Income | $ | 5,224,240 | $ | 113,569 | $ | 5,316,686 | $ | 5,537,175 | $ | 23,638,788 | $ | 843,660 | ||||||||||||
Net long-term capital gains | — | 132,959 | 9,286,554 | — | — | — | ||||||||||||||||||
Total taxable distributions | $ | 5,224,240 | $ | 246,528 | $ | 14,603,240 | $ | 5,537,175 | $ | 23,638,788 | $ | 843,660 | ||||||||||||
109
GOLDMAN SACHS FUNDAMENTAL EQUITY VALUE FUNDS
Notes to Financial Statements (continued)
August 31, 2021
| 7. TAX INFORMATION (continued) |
The tax character of distributions paid during the fiscal year ended August 31, 2020 was as follows:
| Equity Income | Focused Value | Large Cap Value | Mid Cap Value | Small Cap Value | Small/ Mid Cap Value | |||||||||||||||||||
Distributions paid from: | ||||||||||||||||||||||||
Ordinary Income | $ | 6,141,484 | $ | 125,297 | $ | 6,302,681 | $ | 15,160,337 | $ | 47,033,894 | $ | 1,216,243 | ||||||||||||
Net long-term capital gains | 14,362,341 | 32,331 | 19,757,517 | 21,933,533 | 221,084,593 | — | ||||||||||||||||||
Total taxable distributions | $ | 20,503,825 | $ | 157,628 | $ | 26,060,198 | $ | 37,093,870 | $ | 268,118,487 | $ | 1,216,243 | ||||||||||||
Return of Capital | $ | — | $ | — | $ | — | $ | 1,173,962 | $ | — | $ | — | ||||||||||||
As of August 31, 2021, the components of accumulated earnings (losses) on a tax basis were as follows:
| Equity Income* | Focused Value | Large Cap Value | Mid Cap Value | Small Cap Value* | Small/ Mid Cap Value* | |||||||||||||||||||
Undistributed ordinary income — net | $ | 1,331,944 | $ | 1,284,553 | $ | 20,585,621 | $ | 68,241,056 | $ | 237,233,429 | $ | 3,782,310 | ||||||||||||
Undistributed long-term capital gains | 26,388,898 | 773,982 | 23,027,900 | 91,384,144 | 443,366,281 | 4,766,756 | ||||||||||||||||||
Total undistributed earnings | $ | 27,720,842 | $ | 2,058,535 | $ | 43,613,521 | $ | 159,625,200 | $ | 680,599,710 | $ | 8,549,066 | ||||||||||||
Unrealized gains (losses) — net | 98,358,192 | 5,045,789 | 119,354,158 | 327,804,672 | 1,282,142,272 | 43,791,140 | ||||||||||||||||||
Total accumulated earnings (losses) — net | $ | 126,079,034 | $ | 7,104,324 | $ | 162,967,679 | $ | 487,429,872 | $ | 1,962,741,982 | $ | 52,340,206 | ||||||||||||
| * | Equity Income Fund, Small Cap Value Fund, and Small/Mid Cap Value Fund utilized $2,090,486, $46,420,689, and $1,546,844, respectively of capital losses in the current fiscal year. |
As of August 31, 2021, the Funds’ aggregate security unrealized gains and losses based on cost for U.S. federal income tax purposes were as follows:
| Equity Income | Focused Value | Large Cap Value | Mid Cap Value | Small Cap Value | Small/ Mid Cap Value | |||||||||||||||||||
Tax Cost | $ | 326,532,442 | $ | 34,580,266 | $ | 379,582,276 | $ | 922,078,333 | $ | 3,547,505,756 | $ | 181,459,425 | ||||||||||||
Gross unrealized gain | 105,678,211 | 5,598,458 | 126,734,514 | 342,259,176 | 1,421,178,948 | 48,488,293 | ||||||||||||||||||
Gross unrealized loss | (7,320,019 | ) | (552,669 | ) | (7,380,356 | ) | (14,454,504 | ) | (139,036,676 | ) | (4,697,153 | ) | ||||||||||||
Net unrealized gains (losses) | $ | 98,358,192 | $ | 5,045,789 | $ | 119,354,158 | $ | 327,804,672 | $ | 1,282,142,272 | $ | 43,791,140 | ||||||||||||
The difference between GAAP-basis and tax basis unrealized gains (losses) is attributable primarily to wash sales.
The Mid Cap Value Fund reclassed $826,752 from paid-in capital to distributable earnings and the Small Cap Value Fund reclassed $195,804,649 from distributable earnings to paid-in capital. In order to present certain components of the Funds’ capital accounts on a tax-basis, certain reclassifications have been recorded to the Funds’ accounts. These reclassifications have no impact on the net asset value of the Funds’ and result primarily from prior year taxable overdistributions, redemptions utilized as distributions and redemptions in-kind transactions.
GSAM has reviewed the Funds’ tax positions for all open tax years (the current and prior three years, as applicable) and has concluded that no provision for income tax is required in the Funds’ financial statements. Such open tax years remain subject to examination and adjustment by tax authorities.
110
GOLDMAN SACHS FUNDAMENTAL EQUITY VALUE FUNDS
| 8. OTHER RISKS |
The Funds’ risks include, but are not limited to, the following:
Dividend-Paying Investments Risk — A Fund’s investments in dividend-paying securities could cause a Fund to underperform other funds. Securities that pay dividends, as a group, can fall out of favor with the market, causing such securities to underperform securities that do not pay dividends. Depending upon market conditions and political and legislative responses to such conditions, dividend-paying securities that meet a Fund’s investment criteria may not be widely available and/or may be highly concentrated in only a few market sectors. In addition, issuers that have paid regular dividends or distributions to shareholders may not continue to do so at the same level or at all in the future. This may limit the ability of a Fund to produce current income.
Foreign and Emerging Countries Risk — Investing in foreign markets may involve special risks and considerations not typically associated with investing in the U.S. Foreign securities may be subject to risk of loss because of more or less foreign government regulation; less public information; less stringent investor protections; less stringent accounting, corporate governance, financial reporting and disclosure standards; and less economic, political and social stability in the countries in which a Fund invests. The imposition of exchange controls (including repatriation restrictions), confiscation of assets and property, trade restrictions (including tariffs) and other government restrictions by the U.S. or other governments, or problems with registration, settlement or custody, may also result in losses. Foreign risk also involves the risk of negative foreign currency rate fluctuations, which may cause the value of securities denominated in such foreign currency (or other instruments through which a Fund has exposure to foreign currencies) to decline in value. Currency exchange rates may fluctuate significantly over short periods of time.
Foreign Custody Risk — The Funds may invest in foreign securities, and as such the Funds may hold such securities and cash with foreign banks, agents, and securities depositories appointed by each Fund’s custodian (each a “Foreign Custodian”). Some foreign custodians may be recently organized or new to the foreign custody business. In some countries, Foreign Custodians may be subject to little or no regulatory oversight over, or independent evaluation of, their operations. Further, the laws of certain countries may place limitations on a Fund’s ability to recover its assets if a Foreign Custodian enters bankruptcy. Investments in emerging markets may be subject to even greater custody risks than investments in more developed markets. Custody services in emerging market countries are very often undeveloped and may be considerably less well regulated than in more developed countries, and thus may not afford the same level of investor protection as would apply in developed countries.
Investments in Other Investment Companies Risk — As a shareholder of another investment company, a Fund will indirectly bear its proportionate share of any net management fees and other expenses paid by such other investment companies, in addition to the fees and expenses regularly borne by the Fund.
Large Shareholder Transactions Risk — A Fund may experience adverse effects when certain large shareholders, such as other funds, institutional investors (including those trading by use of non-discretionary mathematical formulas), financial intermediaries (who may make investment decisions on behalf of underlying clients and/or include a Fund in their investment model), individuals, accounts and Goldman Sachs affiliates, purchase or redeem large amounts of shares of a Fund. Such large shareholder redemptions, which may occur rapidly or unexpectedly, may cause a Fund to sell portfolio securities at times when it would not otherwise do so, which may negatively impact a Fund’s NAV and liquidity. These transactions may also accelerate the realization of taxable income to shareholders if such sales of investments resulted in gains, and may also increase transaction costs. In addition, a large redemption could result in a Fund’s current expenses being allocated over a smaller asset base, leading to an increase in the Fund’s expense ratio. Similarly, large Fund share purchases may adversely affect a Fund’s performance to the extent that the Fund is delayed in investing new cash or otherwise maintains a larger cash position than it ordinarily would.
Liquidity Risk — A Fund may make investments that are illiquid or that may become less liquid in response to market developments or adverse investor perceptions. Illiquid investments may be more difficult to value. Liquidity risk may also refer to the risk that a Fund will not be able to pay redemption proceeds within the allowable time period or without significant dilution to remaining investors’ interests because of unusual market conditions, an unusually high volume of redemption requests, or other reasons. To meet redemption requests, a Fund may be forced to sell investments at an unfavorable time and/or under unfavorable conditions. If a Fund is forced to sell securities at an unfavorable time and/or under unfavorable conditions, such sales may adversely affect the Fund’s NAV and dilute remaining investors’ interests. These risks may be more pronounced in connection
111
GOLDMAN SACHS FUNDAMENTAL EQUITY VALUE FUNDS
Notes to Financial Statements (continued)
August 31, 2021
| 8. OTHER RISKS (continued) |
with the Funds’ investments in securities of issuers located in emerging market countries. Redemptions by large shareholders may have a negative impact on a Fund’s liquidity.
Market and Credit Risks — In the normal course of business, a Fund trades financial instruments and enters into financial transactions where risk of potential loss exists due to changes in the market (market risk). The value of the securities in which a Fund invests may go up or down in response to the prospects of individual companies, particular sectors or governments and/or general economic conditions throughout the world due to increasingly interconnected global economies and financial markets. Events such as war, acts of terrorism, social unrest, natural disasters, the spread of infectious illness or other public health threats could also significantly impact a Fund and its investments. Additionally, a Fund may also be exposed to credit risk in the event that an issuer or guarantor fails to perform or that an institution or entity with which the Fund has unsettled or open transactions defaults.
Non-Diversification Risk — The Focused Value Fund is non-diversified, meaning that it is permitted to invest a larger percentage of its assets in one or more issuers or fewer issuers than diversified mutual funds. Thus, the Fund may be more susceptible to adverse developments affecting any single issuer held in its portfolio, and may be more susceptible to greater losses because of these developments.
| 9. INDEMNIFICATIONS |
Under the Trust’s organizational documents, its Trustees, officers, employees and agents are indemnified, to the extent permitted by the Act and state law, against certain liabilities that may arise out of performance of their duties to the Funds. Additionally, in the course of business, the Funds enter into contracts that contain a variety of indemnification clauses. The Funds’ maximum exposure under these arrangements is unknown, as this would involve future claims that may be made against the Funds that have not yet occurred. However, GSAM believes the risk of loss under these arrangements to be remote.
| 10. SUBSEQUENT EVENTS |
Subsequent events after the Statements of Assets and Liabilities date have been evaluated, and GSAM has concluded that there is no impact requiring adjustment or disclosure in the financial statements.
112
GOLDMAN SACHS FUNDAMENTAL EQUITY VALUE FUNDS
| 11. SUMMARY OF SHARE TRANSACTIONS |
Share activity is as follows:
| Equity Income Fund | ||||||||||||||||
|
| |||||||||||||||
| For the Fiscal Year Ended August 31, 2021 | For the Fiscal Year Ended August 31, 2020 | |||||||||||||||
|
| |||||||||||||||
| Shares | Dollars | Shares | Dollars | |||||||||||||
|
| |||||||||||||||
| Class A Shares | ||||||||||||||||
Shares sold | 155,231 | $ | 6,592,880 | 229,198 | $ | 8,334,088 | ||||||||||
Reinvestment | 97,564 | 4,022,902 | 447,033 | 17,177,416 | ||||||||||||
Shares redeemed | (861,842 | ) | (36,162,254 | ) | (991,362 | ) | (36,324,580 | ) | ||||||||
| (609,047 | ) | (25,546,472 | ) | (315,131 | ) | (10,813,076 | ) | |||||||||
| Class C Shares | ||||||||||||||||
Shares sold | 33,026 | 1,364,079 | 19,753 | 694,804 | ||||||||||||
Reinvestment | 881 | 34,582 | 9,369 | 345,797 | ||||||||||||
Shares redeemed | (51,543 | ) | (2,050,249 | ) | (95,896 | ) | (3,260,186 | ) | ||||||||
| (17,636 | ) | (651,588 | ) | (66,774 | ) | (2,219,585 | ) | |||||||||
| Institutional Shares | ||||||||||||||||
Shares sold | 295,751 | 12,080,551 | 152,713 | 5,725,739 | ||||||||||||
Reinvestment | 10,545 | 444,680 | 29,967 | 1,167,826 | ||||||||||||
Shares redeemed | (191,746 | ) | (7,887,747 | ) | (100,115 | ) | (3,717,733 | ) | ||||||||
| 114,550 | 4,637,484 | 82,565 | 3,175,832 | |||||||||||||
| Service Shares | ||||||||||||||||
Shares sold | — | — | 3 | 100 | ||||||||||||
Reinvestment | 34 | 1,353 | 216 | 8,319 | ||||||||||||
Shares redeemed | (2,083 | ) | (85,486 | ) | (455 | ) | (18,051 | ) | ||||||||
| (2,049 | ) | (84,133 | ) | (236 | ) | (9,632 | ) | |||||||||
| Investor Shares | ||||||||||||||||
Shares sold | 59,768 | 2,292,195 | 27,234 | 981,695 | ||||||||||||
Reinvestment | 1,162 | 47,164 | 3,885 | 148,693 | ||||||||||||
Shares redeemed | (59,364 | ) | (2,405,016 | ) | (27,845 | ) | (980,116 | ) | ||||||||
| 1,566 | (65,657 | ) | 3,274 | 150,272 | ||||||||||||
| Class R6 Shares | ||||||||||||||||
Shares sold | 35,637 | 1,564,651 | 22,265 | 831,682 | ||||||||||||
Reinvestment | 2,242 | 94,517 | 9,024 | 352,619 | ||||||||||||
Shares redeemed | (32,034 | ) | (1,334,620 | ) | (42,762 | ) | (1,547,746 | ) | ||||||||
| 5,845 | 324,548 | (11,473 | ) | (363,445 | ) | |||||||||||
| Class R Shares | ||||||||||||||||
Shares sold | 1,469 | 60,884 | 3,070 | 115,279 | ||||||||||||
Reinvestment | 332 | 13,611 | 1,600 | 61,245 | ||||||||||||
Shares redeemed | (3,324 | ) | (145,641 | ) | (14,039 | ) | (475,013 | ) | ||||||||
| (1,523 | ) | (71,146 | ) | (9,369 | ) | (298,489 | ) | |||||||||
| Class P Shares | ||||||||||||||||
Shares sold | 339,311 | 14,793,109 | 285,806 | 10,334,223 | ||||||||||||
Reinvestment | 10,775 | 459,964 | 19,541 | 751,373 | ||||||||||||
Shares redeemed | (47,396 | ) | (2,079,651 | ) | (65,131 | ) | (2,240,188 | ) | ||||||||
| 302,690 | 13,173,422 | 240,216 | 8,845,408 | |||||||||||||
NET DECREASE | (205,604 | ) | $ | (8,283,542 | ) | (76,928 | ) | $ | (1,532,715 | ) | ||||||
113
GOLDMAN SACHS FUNDAMENTAL EQUITY VALUE FUNDS
Notes to Financial Statements (continued)
August 31, 2021
| 11. SUMMARY OF SHARE TRANSACTIONS (continued) |
| Focused Value Fund | ||||||||||||||||
|
| |||||||||||||||
| For the Fiscal Year Ended August 31, 2021 | For the Fiscal Year Ended August 31, 2020 | |||||||||||||||
|
| |||||||||||||||
| Shares | Dollars | Shares | Dollars | |||||||||||||
|
| |||||||||||||||
| Class A Shares | ||||||||||||||||
Shares sold | 13,820 | $ | 187,410 | 10,516 | $ | 103,695 | ||||||||||
Reinvestment | 233 | 2,864 | 78 | 896 | ||||||||||||
Shares redeemed | (2,372 | ) | (29,891 | ) | (3,328 | ) | (35,000 | ) | ||||||||
| 11,681 | 160,383 | 7,266 | 69,591 | |||||||||||||
| Class C Shares | ||||||||||||||||
Shares sold | 4,449 | 56,724 | — | — | ||||||||||||
Reinvestment | 32 | 390 | 28 | 328 | ||||||||||||
Shares redeemed | (4,012 | ) | (53,213 | ) | — | — | ||||||||||
| 469 | 3,901 | 28 | 328 | |||||||||||||
| Institutional Shares | ||||||||||||||||
Shares sold | 461,883 | 5,966,246 | 3,678 | 36,000 | ||||||||||||
Reinvestment | 1,558 | 19,225 | 1,167 | 13,526 | ||||||||||||
Shares redeemed | (138,463 | ) | (1,851,275 | ) | — | — | ||||||||||
| 324,978 | 4,134,196 | 4,845 | 49,526 | |||||||||||||
| Investor Shares | ||||||||||||||||
Reinvestment | 58 | 715 | 45 | 521 | ||||||||||||
Shares redeemed | (2,160 | ) | (27,117 | ) | — | — | ||||||||||
| (2,102 | ) | (26,402 | ) | 45 | 521 | |||||||||||
| Class R6 Shares | ||||||||||||||||
Reinvestment | 61 | 749 | 48 | 557 | ||||||||||||
Shares redeemed | (2,182 | ) | (27,410 | ) | — | — | ||||||||||
| (2,121 | ) | (26,661 | ) | 48 | 557 | |||||||||||
| Class R Shares | ||||||||||||||||
Shares sold | 2,009 | 25,005 | — | — | ||||||||||||
Reinvestment | 85 | 1,033 | 31 | 358 | ||||||||||||
Shares redeemed | (2,087 | ) | (26,067 | ) | — | — | ||||||||||
| 7 | (29 | ) | 31 | 358 | ||||||||||||
| Class P Shares | ||||||||||||||||
Shares sold | 1,680,361 | 22,219,682 | 493,259 | 5,137,927 | ||||||||||||
Reinvestment | 17,987 | 221,552 | 12,220 | 141,442 | ||||||||||||
Shares redeemed | (237,498 | ) | (3,121,295 | ) | (180,182 | ) | (1,719,963 | ) | ||||||||
| 1,460,850 | 19,319,939 | 325,297 | 3,559,406 | |||||||||||||
NET INCREASE | 1,793,762 | $ | 23,565,327 | 337,560 | $ | 3,680,287 | ||||||||||
114
GOLDMAN SACHS FUNDAMENTAL EQUITY VALUE FUNDS
| 11. SUMMARY OF SHARE TRANSACTIONS (continued) |
| Large Cap Value Fund | ||||||||||||||||
|
| |||||||||||||||
| For the Fiscal Year Ended August 31, 2021 | For the Fiscal Year Ended August 31, 2020 | |||||||||||||||
|
| |||||||||||||||
| Shares | Dollars | Shares | Dollars | |||||||||||||
|
| |||||||||||||||
| Class A Shares |
| |||||||||||||||
Shares sold | 349,972 | $ | 5,579,387 | 386,613 | $ | 5,266,125 | ||||||||||
Reinvestment | 162,305 | 2,413,491 | 298,925 | 4,482,803 | ||||||||||||
Shares redeemed | (976,224 | ) | (15,456,763 | ) | (1,203,250 | ) | (16,167,723 | ) | ||||||||
| (463,947 | ) | (7,463,885 | ) | (517,712 | ) | (6,418,795 | ) | |||||||||
| Class C Shares | ||||||||||||||||
Shares sold | 33,158 | 494,929 | 33,194 | 431,506 | ||||||||||||
Reinvestment | 33,099 | 462,331 | 76,995 | 1,087,870 | ||||||||||||
Shares redeemed | (623,860 | ) | (9,457,795 | ) | (356,987 | ) | (4,573,900 | ) | ||||||||
| (557,603 | ) | (8,500,535 | ) | (246,798 | ) | (3,054,524 | ) | |||||||||
| Institutional Shares | ||||||||||||||||
Shares sold | 1,375,088 | 22,207,339 | 1,320,839 | 17,273,248 | ||||||||||||
Reinvestment | 361,313 | 5,436,359 | 579,508 | 8,786,383 | ||||||||||||
Shares redeemed | (1,677,335 | ) | (27,508,892 | ) | (4,081,453 | ) | (57,927,064 | ) | ||||||||
| 59,066 | 134,806 | (2,181,106 | ) | (31,867,433 | ) | |||||||||||
| Service Shares | ||||||||||||||||
Shares sold | 3,136 | 48,786 | 6,329 | 87,929 | ||||||||||||
Reinvestment | 692 | 10,246 | 1,053 | 15,722 | ||||||||||||
Shares redeemed | (16,547 | ) | (259,774 | ) | (17,011 | ) | (233,542 | ) | ||||||||
| (12,719 | ) | (200,742 | ) | (9,629 | ) | (129,891 | ) | |||||||||
| Investor Shares | ||||||||||||||||
Shares sold | 24,135 | 376,684 | 50,524 | 714,528 | ||||||||||||
Reinvestment | 7,936 | 118,038 | 15,988 | 239,744 | ||||||||||||
Shares redeemed | (81,344 | ) | (1,249,105 | ) | (108,501 | ) | (1,478,132 | ) | ||||||||
| (49,273 | ) | (754,383 | ) | (41,989 | ) | (523,860 | ) | |||||||||
| Class R6 Shares | ||||||||||||||||
Shares sold | 52,133 | 862,049 | 20,426 | 282,346 | ||||||||||||
Reinvestment | 4,213 | 65,011 | 7,116 | 110,527 | ||||||||||||
Shares redeemed | (64,052 | ) | (1,054,244 | ) | (59,729 | ) | (841,724 | ) | ||||||||
| (7,706 | ) | (127,184 | ) | (32,187 | ) | (448,851 | ) | |||||||||
| Class R Shares | ||||||||||||||||
Shares sold | 40,768 | 647,742 | 48,042 | 601,189 | ||||||||||||
Reinvestment | 6,647 | 95,537 | 14,096 | 204,395 | ||||||||||||
Shares redeemed | (75,778 | ) | (1,189,156 | ) | (131,311 | ) | (1,708,958 | ) | ||||||||
| (28,363 | ) | (445,877 | ) | (69,173 | ) | (903,374 | ) | |||||||||
| Class P Shares | ||||||||||||||||
Shares sold | 1,071,554 | 18,047,504 | 1,252,345 | 14,676,899 | ||||||||||||
Reinvestment | 372,659 | 5,747,842 | 683,416 | 10,614,391 | ||||||||||||
Shares redeemed | (950,225 | ) | (15,406,066 | ) | (3,307,653 | ) | (43,660,114 | ) | ||||||||
| 493,988 | 8,389,280 | (1,371,892 | ) | (18,368,824 | ) | |||||||||||
NET DECREASE | (566,557 | ) | $ | (8,968,520 | ) | (4,470,486 | ) | $ | (61,715,552 | ) | ||||||
115
GOLDMAN SACHS FUNDAMENTAL EQUITY VALUE FUNDS
Notes to Financial Statements (continued)
August 31, 2021
| 11. SUMMARY OF SHARE TRANSACTIONS (continued) |
| Mid Cap Value Fund | ||||||||||||||||
|
| |||||||||||||||
| For the Fiscal Year Ended August 31, 2021 | For the Fiscal Year Ended August 31, 2020 | |||||||||||||||
|
| |||||||||||||||
| Shares | Dollars | Shares | Dollars | |||||||||||||
|
| |||||||||||||||
| Class A Shares |
| |||||||||||||||
Shares sold | 1,031,436 | $ | 40,336,696 | 1,462,153 | $ | 44,185,577 | ||||||||||
Reinvestment | 44,871 | 1,625,681 | 448,655 | 15,125,065 | ||||||||||||
Shares redeemed | (2,690,532 | ) | (101,945,991 | ) | (4,599,003 | ) | (140,817,910 | ) | ||||||||
| (1,614,225 | ) | (59,983,614 | ) | (2,688,195 | ) | (81,507,268 | ) | |||||||||
| Class C Shares | ||||||||||||||||
Shares sold | 35,182 | 1,171,604 | 59,183 | 1,562,938 | ||||||||||||
Reinvestment | — | — | 21,940 | 639,105 | ||||||||||||
Shares redeemed | (303,124 | ) | (10,089,221 | ) | (482,559 | ) | (12,808,402 | ) | ||||||||
| (267,942 | ) | (8,917,617 | ) | (401,436 | ) | (10,606,359 | ) | |||||||||
| Institutional Shares | ||||||||||||||||
Shares sold | 1,155,486 | 46,128,697 | 1,799,443 | 52,742,609 | ||||||||||||
Reinvestment | 47,467 | 1,739,185 | 297,359 | 10,160,261 | ||||||||||||
Shares redeemed | (2,467,004 | ) | (92,066,490 | ) | (4,087,541 | ) | (127,141,314 | ) | ||||||||
| (1,264,051 | ) | (44,198,608 | ) | (1,990,739 | ) | (64,238,444 | ) | |||||||||
| Service Shares | ||||||||||||||||
Shares sold | 109,090 | 4,268,167 | 125,414 | 3,600,498 | ||||||||||||
Reinvestment | 1,886 | 66,820 | 35,593 | 1,171,369 | ||||||||||||
Shares redeemed | (310,922 | ) | (11,312,414 | ) | (670,629 | ) | (20,177,249 | ) | ||||||||
| (199,946 | ) | (6,977,427 | ) | (509,622 | ) | (15,405,382 | ) | |||||||||
| Investor Shares | ||||||||||||||||
Shares sold | 171,226 | 6,545,668 | 184,165 | 5,476,121 | ||||||||||||
Reinvestment | 6,094 | 214,953 | 44,223 | 1,454,013 | ||||||||||||
Shares redeemed | (301,636 | ) | (10,961,443 | ) | (461,350 | ) | (13,655,472 | ) | ||||||||
| (124,316 | ) | (4,200,822 | ) | (232,962 | ) | (6,725,338 | ) | |||||||||
| Class R6 Shares | ||||||||||||||||
Shares sold | 454,732 | 17,604,466 | 625,333 | 18,941,033 | ||||||||||||
Reinvestment | 11,214 | 410,672 | 48,892 | 1,669,401 | ||||||||||||
Shares redeemed | (425,465 | ) | (16,518,630 | ) | (490,436 | ) | (15,224,407 | ) | ||||||||
| 40,481 | 1,496,508 | 183,789 | 5,386,027 | |||||||||||||
| Class R Shares | ||||||||||||||||
Shares sold | 234,713 | 8,995,740 | 195,531 | 5,217,356 | ||||||||||||
Reinvestment | 729 | 25,504 | 18,303 | 594,695 | ||||||||||||
Shares redeemed | (307,787 | ) | (11,513,139 | ) | (350,810 | ) | (10,017,755 | ) | ||||||||
| (72,345 | ) | (2,491,895 | ) | (136,976 | ) | (4,205,704 | ) | |||||||||
| Class P Shares | ||||||||||||||||
Shares sold | 526,646 | 20,616,514 | 1,148,507 | 36,315,245 | ||||||||||||
Reinvestment | 28,656 | 1,049,073 | 132,360 | 4,519,458 | ||||||||||||
Shares redeemed | (423,122 | ) | (15,846,115 | ) | (1,501,890 | ) | (47,505,869 | ) | ||||||||
| 132,180 | 5,819,472 | (221,023 | ) | (6,671,166 | ) | |||||||||||
NET DECREASE | (3,370,164 | ) | $ | (119,454,003 | ) | (5,997,164 | ) | $ | (183,973,634 | ) | ||||||
116
GOLDMAN SACHS FUNDAMENTAL EQUITY VALUE FUNDS
| 11. SUMMARY OF SHARE TRANSACTIONS (continued) |
| Small Cap Value Fund | ||||||||||||||||
|
| |||||||||||||||
| For the Fiscal Year Ended August 31, 2021 | For the Fiscal Year Ended August 31, 2020 | |||||||||||||||
|
| |||||||||||||||
| Shares | Dollars | Shares | Dollars | |||||||||||||
|
| |||||||||||||||
| Class A Shares |
| |||||||||||||||
Shares sold | 1,230,906 | $ | 67,319,753 | 1,596,036 | $ | 64,703,525 | ||||||||||
Reinvestment | 15,527 | 780,234 | 489,214 | 24,251,852 | ||||||||||||
Shares redeemed | (3,721,510 | ) | (196,881,407 | ) | (4,497,850 | ) | (191,651,785 | ) | ||||||||
| (2,475,077 | ) | (128,781,420 | ) | (2,412,600 | ) | (102,696,408 | ) | |||||||||
| Class C Shares | ||||||||||||||||
Shares sold | 25,903 | 972,425 | 17,457 | 551,502 | ||||||||||||
Reinvestment | — | — | 9,946 | 348,108 | ||||||||||||
Shares redeemed | (86,499 | ) | (3,056,637 | ) | (176,111 | ) | (5,227,096 | ) | ||||||||
| (60,596 | ) | (2,084,212 | ) | (148,708 | ) | (4,327,486 | ) | |||||||||
| Institutional Shares | ||||||||||||||||
Shares sold | 9,341,548 | 554,439,718 | 12,946,460 | 564,333,088 | ||||||||||||
Reinvestment | 238,033 | 13,094,190 | 2,681,940 | 145,860,418 | ||||||||||||
Shares redeemed | (29,696,072 | ) | (1,786,075,531 | ) | (20,910,025 | ) | (975,609,347 | ) | ||||||||
| (20,116,491 | ) | (1,218,541,623 | ) | (5,281,625 | ) | (265,415,841 | ) | |||||||||
| Service Shares | ||||||||||||||||
Shares sold | 251,396 | 12,665,663 | 273,152 | 10,478,056 | ||||||||||||
Reinvestment | 362 | 17,550 | 55,828 | 2,662,203 | ||||||||||||
Shares redeemed | (793,000 | ) | (40,000,177 | ) | (991,281 | ) | (43,692,687 | ) | ||||||||
| (541,242 | ) | (27,316,964 | ) | (662,301 | ) | (30,552,428 | ) | |||||||||
| Investor Shares | ||||||||||||||||
Shares sold | 1,283,937 | 69,289,196 | 1,164,040 | 47,831,966 | ||||||||||||
Reinvestment | 11,766 | 585,347 | 143,535 | 7,062,623 | ||||||||||||
Shares redeemed | (1,822,724 | ) | (99,813,142 | ) | (1,266,322 | ) | (53,884,434 | ) | ||||||||
| (527,021 | ) | (29,938,599 | ) | 41,253 | 1,010,155 | |||||||||||
| Class R6 Shares | ||||||||||||||||
Shares sold | 6,802,883 | 402,384,039 | 9,345,715 | 430,038,206 | ||||||||||||
Reinvestment | 130,800 | 7,191,362 | 1,180,724 | 64,189,653 | ||||||||||||
Shares redeemed | (12,958,106 | ) | (758,278,892 | ) | (8,174,988 | ) | (369,771,737 | ) | ||||||||
| (6,024,423 | ) | (348,703,491 | ) | 2,351,451 | 124,456,122 | |||||||||||
| Class R Shares | ||||||||||||||||
Shares sold | 263,888 | 14,384,017 | 337,273 | 12,358,142 | ||||||||||||
Reinvestment | — | — | 73,604 | 3,545,103 | ||||||||||||
Shares redeemed | (657,475 | ) | (33,897,526 | ) | (803,072 | ) | (33,210,279 | ) | ||||||||
| (393,587 | ) | (19,513,509 | ) | (392,195 | ) | (17,307,034 | ) | |||||||||
| Class P Shares | ||||||||||||||||
Shares sold | 1,036,383 | 61,390,650 | 1,361,647 | 57,615,257 | ||||||||||||
Reinvestment | 24,327 | 1,337,472 | 199,821 | 10,863,518 | ||||||||||||
Shares redeemed | (686,123 | ) | (40,319,485 | ) | (1,425,012 | ) | (63,261,974 | ) | ||||||||
| 374,587 | 22,408,637 | 136,456 | 5,216,801 | |||||||||||||
NET DECREASE | (29,763,850 | ) | $ | (1,752,471,181 | ) | (6,368,269 | ) | $ | (289,616,119 | ) | ||||||
117
GOLDMAN SACHS FUNDAMENTAL EQUITY VALUE FUNDS
Notes to Financial Statements (continued)
August 31, 2021
| 11. SUMMARY OF SHARE TRANSACTIONS (continued) |
| Small/Mid Cap Value Fund | ||||||||||||||||
|
| |||||||||||||||
| For the Fiscal Year Ended August 31, 2021 | For the Fiscal Year Ended August 31, 2020 | |||||||||||||||
|
| |||||||||||||||
| Shares | Dollars | Shares | Dollars | |||||||||||||
|
| |||||||||||||||
| Class A Shares | ||||||||||||||||
Shares sold | 55,184 | $ | 864,878 | 29,384 | $ | 354,871 | ||||||||||
Reinvestment | 302 | 4,187 | 550 | 7,146 | ||||||||||||
Shares redeemed | (23,483 | ) | (325,941 | ) | (66,412 | ) | (738,596 | ) | ||||||||
| 32,003 | 543,124 | (36,478 | ) | (376,579 | ) | |||||||||||
| Class C Shares | ||||||||||||||||
Shares sold | 23,361 | 347,476 | 17,292 | 194,135 | ||||||||||||
Reinvestment | — | — | — | — | ||||||||||||
Shares redeemed | (19,317 | ) | (288,737 | ) | (17,578 | ) | (190,853 | ) | ||||||||
| 4,044 | 58,739 | (286 | ) | 3,282 | ||||||||||||
| Institutional Shares | ||||||||||||||||
Shares sold | 580,268 | 8,963,655 | 203,391 | 2,221,517 | ||||||||||||
Reinvestment | 4,243 | 59,578 | 4,849 | 63,819 | ||||||||||||
Shares redeemed | (134,272 | ) | (2,032,908 | ) | (114,906 | ) | (1,293,991 | ) | ||||||||
| 450,239 | 6,990,325 | 93,334 | 991,345 | |||||||||||||
| Investor Shares | ||||||||||||||||
Shares sold | 709,366 | 11,793,257 | 25,034 | 288,631 | ||||||||||||
Reinvestment | 540 | 7,543 | 2,288 | 29,922 | ||||||||||||
Shares redeemed | (55,116 | ) | (788,661 | ) | (172,493 | ) | (1,873,035 | ) | ||||||||
| 654,790 | 11,012,139 | (145,171 | ) | (1,554,482 | ) | |||||||||||
| Class R6 Shares | ||||||||||||||||
Shares sold | 2,544,113 | 40,710,040 | 1,153,473 | 12,846,150 | ||||||||||||
Reinvestment | 31,315 | 439,348 | 46,058 | 605,200 | ||||||||||||
Shares redeemed | (1,517,091 | ) | (23,566,994 | ) | (1,386,202 | ) | (15,813,637 | ) | ||||||||
| 1,058,337 | 17,582,394 | (186,671 | ) | (2,362,287 | ) | |||||||||||
| Class R Shares | ||||||||||||||||
Shares sold | 1,131 | 17,646 | 938 | 9,766 | ||||||||||||
Reinvestment | — | — | 45 | 584 | ||||||||||||
Shares redeemed | (1,788 | ) | (27,296 | ) | (7,957 | ) | (76,904 | ) | ||||||||
| (657 | ) | (9,650 | ) | (6,974 | ) | (66,554 | ) | |||||||||
| Class P Shares | ||||||||||||||||
Shares sold | 2,217,823 | 35,958,146 | 347,145 | 4,046,413 | ||||||||||||
Reinvestment | 23,673 | 332,143 | 38,695 | 508,457 | ||||||||||||
Shares redeemed | (252,700 | ) | (3,824,460 | ) | (1,119,273 | ) | (11,034,437 | ) | ||||||||
| 1,988,796 | 32,465,829 | (733,433 | ) | (6,479,567 | ) | |||||||||||
NET INCREASE/(DECREASE) | 4,187,552 | $ | 68,642,900 | (1,015,679 | ) | $ | (9,844,842 | ) | ||||||||
118
Report of Independent Registered Public
Accounting Firm
To the Board of Trustees of Goldman Sachs Trust and Shareholders of Goldman Sachs Equity Income Fund, Goldman Sachs Focused Value Fund, Goldman Sachs Large Cap Value Fund, Goldman Sachs Mid Cap Value Fund, Goldman Sachs Small Cap Value Fund, and Goldman Sachs Small/Mid Cap Value Fund
Opinions on the Financial Statements
We have audited the accompanying statements of assets and liabilities, including the schedules of investments, of Goldman Sachs Equity Income Fund, Goldman Sachs Focused Value Fund, Goldman Sachs Large Cap Value Fund, Goldman Sachs Mid Cap Value Fund, Goldman Sachs Small Cap Value Fund, and Goldman Sachs Small/Mid Cap Value Fund (six of the funds constituting Goldman Sachs Trust, hereafter collectively referred to as the “Funds”) as of August 31, 2021, the related statements of operations for the year ended August 31, 2021, the statements of changes in net assets for each of the two years in the period ended August 31, 2021, including the related notes, and the financial highlights for each of the periods indicated therein (collectively referred to as the “financial statements”). In our opinion, the financial statements present fairly, in all material respects, the financial position of each of the Funds as of August 31, 2021, the results of each of their operations for the year then ended, the changes in each of their net assets for each of the two years in the period ended August 31, 2021 and each of the financial highlights for each of the periods indicated therein in conformity with accounting principles generally accepted in the United States of America.
Basis for Opinions
These financial statements are the responsibility of the Funds’ management. Our responsibility is to express an opinion on the Funds’ financial statements based on our audits. We are a public accounting firm registered with the Public Company Accounting Oversight Board (United States) (PCAOB) and are required to be independent with respect to the Funds in accordance with the U.S. federal securities laws and the applicable rules and regulations of the Securities and Exchange Commission and the PCAOB.
We conducted our audits of these financial statements in accordance with the standards of the PCAOB. Those standards require that we plan and perform the audit to obtain reasonable assurance about whether the financial statements are free of material misstatement, whether due to error or fraud.
Our audits included performing procedures to assess the risks of material misstatement of the financial statements, whether due to error or fraud, and performing procedures that respond to those risks. Such procedures included examining, on a test basis, evidence regarding the amounts and disclosures in the financial statements. Our audits also included evaluating the accounting principles used and significant estimates made by management, as well as evaluating the overall presentation of the financial statements. Our procedures included confirmation of securities owned as of August 31, 2021 by correspondence with the custodian, transfer agent and brokers; when replies were not received from brokers, we performed other auditing procedures. We believe that our audits provide a reasonable basis for our opinions.
/s/ PricewaterhouseCoopers LLP
Boston, Massachusetts
October 26, 2021
We have served as the auditor of one or more investment companies in the Goldman Sachs fund complex since 2000.
119
GOLDMAN SACHS FUNDAMENTAL EQUITY VALUE FUNDS
Fund Expenses — Six Month Period Ended August 31, 2021 (Unaudited)
As a shareholder of Class A, Class C, Institutional, Service, Investor, Class R6, Class R and Class P Shares of a Fund, you incur two types of costs: (1) transaction costs, including sales charges on purchase payments (with respect to Class A Shares), contingent deferred sales charges on redemptions (with respect to Class C Shares), and (2) ongoing costs, including management fees; distribution and/or service (12b-1) fees (with respect to Class A, Class C, Service Class R Shares); and other Fund expenses. This example is intended to help you understand your ongoing costs (in dollars) of investing in Class A, Class C, Institutional, Service, Investor, Class R6, Class R and Class P Shares of the Funds and to compare these costs with the ongoing costs of investing in other mutual funds.
The example is based on an investment of $1,000 invested at the beginning of the period and held for the entire period from March 1, 2021 through August 31, 2021, which represents a period of 184 days of a 365 day year.
Actual Expenses — The first line under each share class in the table below provides information about actual account values and actual expenses. You may use the information in this line, together with the amount you invested, to estimate the expenses that you paid over the period. Simply divide your account value by $1,000 (for example, an $8,600 account value divided by $1,000=8.6), then multiply the result by the number in the first line under the heading entitled “Expenses Paid” to estimate the expenses you paid on your account during this period.
Hypothetical Example for Comparison Purposes — The second line under each share class in the table below provides information about hypothetical account values and hypothetical expenses based on the Funds’ actual net expense ratios and an assumed rate of return of 5% per year before expenses, which is not the Funds’ actual return. The hypothetical account values and expenses may not be used to estimate the actual ending account balance or expenses you paid for the period. You may use this information to compare the ongoing costs of investing in the Funds and other funds. To do so, compare this 5% hypothetical example with the 5% hypothetical examples that appear in the shareholder reports of the other funds.
Please note that the expenses shown in the table are meant to highlight your ongoing costs only and do not reflect any transactional costs, such as sales charges, redemption fees, or exchange fees. Therefore, the second line of the table is useful in comparing ongoing costs only, and will not help you determine the relative total costs of owning different funds. In addition, if these transactional costs were included, your costs would have been higher:
| Equity Income Fund | Focused Value Fund | Large Cap Value Fund | ||||||||||||||||||||||||||||||||||
| Share Class | Beginning Account Value 3/1/21 | Ending Account Value 8/31/21 | Expenses Paid for the 6 months ended 8/31/2021* | Beginning Account Value 3/1/21 | Ending Account Value 8/31/21 | Expenses Paid for the 6 months ended 8/31/2021* | Beginning Account Value 3/1/21 | Ending Account Value 8/31/21 | Expenses Paid for the 6 months ended 8/31/2021* | |||||||||||||||||||||||||||
| Class A | ||||||||||||||||||||||||||||||||||||
Actual | $ | 1,000.00 | $ | 1,141.84 | $ | 5.61 | $ | 1,000.00 | $ | 1,138.70 | $ | 5.62 | $ | 1,000.00 | $ | 1,138.31 | $ | 5.62 | ||||||||||||||||||
Hypothetical 5% return | 1,000.00 | 1,019.97 | + | 5.29 | 1,000.00 | 1,019.95 | + | 5.31 | 1,000.00 | 1,019.95 | + | 5.31 | ||||||||||||||||||||||||
| Class C | ||||||||||||||||||||||||||||||||||||
Actual | 1,000.00 | 1,137.53 | 9.64 | 1,000.00 | 1,133.90 | 9.64 | 1,000.00 | 1,134.37 | 9.64 | |||||||||||||||||||||||||||
Hypothetical 5% return | 1,000.00 | 1,016.19 | + | 9.09 | 1,000.00 | 1,016.17 | + | 9.11 | 1,000.00 | 1,016.17 | + | 9.11 | ||||||||||||||||||||||||
| Institutional | ||||||||||||||||||||||||||||||||||||
Actual | 1,000.00 | 1,143.69 | 3.94 | 1,000.00 | 1,139.80 | 3.96 | 1,000.00 | 1,139.98 | 3.95 | |||||||||||||||||||||||||||
Hypothetical 5% return | 1,000.00 | 1,021.53 | + | 3.72 | 1,000.00 | 1,021.51 | + | 3.74 | 1,000.00 | 1,021.51 | + | 3.73 | ||||||||||||||||||||||||
| Service | ||||||||||||||||||||||||||||||||||||
Actual | 1,000.00 | 1,140.71 | 6.63 | N/A | N/A | N/A | 1,000.00 | 1,137.56 | 6.64 | |||||||||||||||||||||||||||
Hypothetical 5% return | 1,000.00 | 1,019.01 | + | 6.26 | N/A | N/A | N/A | 1,000.00 | 1,018.99 | + | 6.27 | |||||||||||||||||||||||||
| Investor | ||||||||||||||||||||||||||||||||||||
Actual | 1,000.00 | 1,143.42 | 4.26 | 1,000.00 | 1,139.36 | 4.31 | 1,000.00 | 1,139.67 | 4.27 | |||||||||||||||||||||||||||
Hypothetical 5% return | 1,000.00 | 1,021.23 | + | 4.02 | 1,000.00 | 1,021.17 | + | 4.08 | 1,000.00 | 1,021.21 | + | 4.04 | ||||||||||||||||||||||||
| Class R6 | ||||||||||||||||||||||||||||||||||||
Actual | 1,000.00 | 1,143.74 | 3.89 | 1,000.00 | 1,139.25 | 3.89 | 1,000.00 | 1,140.22 | 3.90 | |||||||||||||||||||||||||||
Hypothetical 5% return | 1,000.00 | 1,021.58 | + | 3.67 | 1,000.00 | 1,021.57 | + | 3.68 | 1,000.00 | 1,021.56 | + | 3.68 | ||||||||||||||||||||||||
| Class R | ||||||||||||||||||||||||||||||||||||
Actual | 1,000.00 | 1,140.32 | 6.96 | 1,000.00 | 1,136.26 | 6.96 | 1,000.00 | 1,136.93 | 6.96 | |||||||||||||||||||||||||||
Hypothetical 5% return | 1,000.00 | 1,018.71 | + | 6.56 | 1,000.00 | 1,018.69 | + | 6.58 | 1,000.00 | 1,018.69 | + | 6.58 | ||||||||||||||||||||||||
| Class P | ||||||||||||||||||||||||||||||||||||
Actual | 1,000.00 | 1,143.78 | 3.89 | 1,000.00 | 1,140.02 | 3.90 | 1,000.00 | 1,140.22 | 3.90 | |||||||||||||||||||||||||||
Hypothetical 5% return | 1,000.00 | 1,021.58 | + | 3.67 | 1,000.00 | 1,021.56 | + | 3.69 | 1,000.00 | 1,021.56 | + | 3.68 | ||||||||||||||||||||||||
| + | Hypothetical expenses are based on each Fund’s actual annualized net expense ratios and an assumed rate of return of 5% per year before expenses. |
| * | Expenses for each share class are calculated using each Fund’s annualized net expense ratio for each class, which represents the ongoing expenses as a percentage of net assets for the six months ended August 31, 2021. Expenses are calculated by multiplying the annualized net expense ratio by the average account value for the period; then multiplying the result by the number of days in the most recent fiscal half year; and then dividing that result by the number of days in the fiscal year. The annualized net expense ratios for the period were as follows: |
| Fund | Class A Shares | Class C Shares | Institutional Shares | Service Shares | Investor Shares | Class R6 Shares | Class R Shares | Class P Shares | ||||||||||||||||||||||||
Equity Income Fund | 1.04 | % | 1.79 | % | 0.73 | % | 1.23 | % | 0.79 | % | 0.72 | % | 1.29 | % | 0.72 | % | ||||||||||||||||
Focused Value Fund | 1.04 | 1.79 | 0.73 | N/A | 0.80 | 0.72 | 1.29 | 0.72 | ||||||||||||||||||||||||
Large Cap Value Fund | 1.04 | 1.79 | 0.73 | 1.23 | 0.79 | 0.72 | 1.29 | 0.72 | ||||||||||||||||||||||||
120
GOLDMAN SACHS FUNDAMENTAL EQUITY VALUE FUNDS
Fund Expenses — Six Month Period Ended August 31, 2021 (Unaudited) (continued)
| Mid Cap Value Fund | Small Cap Value Fund | Small/Mid Cap Value Fund | ||||||||||||||||||||||||||||||||||
| Share Class | Beginning Value 3/1/21 | Ending Value 8/31/21 | Expenses Paid for the 6 months ended 8/31/2021* | Beginning Value 3/1/21 | Ending Value 8/31/21 | Expenses Paid for the 6 months ended 8/31/2021* | Beginning Value 3/1/21 | Ending Value 8/31/21 | Expenses Paid for the 6 months ended 8/31/2021* | |||||||||||||||||||||||||||
| Class A | ||||||||||||||||||||||||||||||||||||
Actual | $ | 1,000.00 | $ | 1,140.24 | $ | 6.49 | $ | 1,000.00 | $ | 1,072.07 | $ | 6.69 | $ | 1,000.00 | $ | 1,120.78 | $ | 6.48 | ||||||||||||||||||
Hypothetical 5% return | 1,000.00 | 1,019.14 | + | 6.12 | 1,000.00 | 1,018.74 | + | 6.52 | 1,000.00 | 1,019.09 | + | 6.17 | ||||||||||||||||||||||||
| Class C | ||||||||||||||||||||||||||||||||||||
Actual | 1,000.00 | 1,135.91 | 10.52 | 1,000.00 | 1,068.15 | 10.59 | 1,000.00 | 1,115.72 | 10.46 | |||||||||||||||||||||||||||
Hypothetical 5% return | 1,000.00 | 1,015.36 | + | 9.92 | 1,000.00 | 1,014.96 | + | 10.32 | 1,000.00 | 1,015.31 | + | 9.97 | ||||||||||||||||||||||||
| Institutional | ||||||||||||||||||||||||||||||||||||
Actual | 1,000.00 | 1,142.07 | 4.50 | 1,000.00 | 1,073.87 | 5.03 | 1,000.00 | 1,123.08 | 4.51 | |||||||||||||||||||||||||||
Hypothetical 5% return | 1,000.00 | 1,021.00 | + | 4.24 | 1,000.00 | 1,020.36 | + | 4.90 | 1,000.00 | 1,020.96 | + | 4.29 | ||||||||||||||||||||||||
| Service | ||||||||||||||||||||||||||||||||||||
Actual | 1,000.00 | 1,139.24 | 7.19 | 1,000.00 | 1,071.11 | 7.63 | N/A | N/A | N/A | |||||||||||||||||||||||||||
Hypothetical 5% return | 1,000.00 | 1,018.48 | + | 6.78 | 1,000.00 | 1,017.84 | + | 7.43 | N/A | N/A | N/A | |||||||||||||||||||||||||
| Investor | ||||||||||||||||||||||||||||||||||||
Actual | 1,000.00 | 1,141.36 | 5.15 | 1,000.00 | 1,073.30 | 5.39 | 1,000.00 | 1,122.50 | 5.15 | |||||||||||||||||||||||||||
Hypothetical 5% return | 1,000.00 | 1,020.40 | + | 4.85 | 1,000.00 | 1,020.01 | + | 5.25 | 1,000.00 | 1,020.35 | + | 4.90 | ||||||||||||||||||||||||
| Class R6 | ||||||||||||||||||||||||||||||||||||
Actual | 1,000.00 | 1,142.17 | 4.45 | 1,000.00 | 1,073.91 | 4.97 | 1,000.00 | 1,122.51 | 4.45 | |||||||||||||||||||||||||||
Hypothetical 5% return | 1,000.00 | 1,021.06 | + | 4.19 | 1,000.00 | 1,020.41 | + | 4.85 | 1,000.00 | 1,021.01 | + | 4.24 | ||||||||||||||||||||||||
| Class R | ||||||||||||||||||||||||||||||||||||
Actual | 1,000.00 | 1,138.44 | 7.83 | 1,000.00 | 1,070.81 | 7.99 | 1,000.00 | 1,118.99 | 7.81 | |||||||||||||||||||||||||||
Hypothetical 5% return | 1,000.00 | 1,017.88 | + | 7.39 | 1,000.00 | 1,017.48 | + | 7.79 | 1,000.00 | 1,017.84 | + | 7.44 | ||||||||||||||||||||||||
| Class P | ||||||||||||||||||||||||||||||||||||
Actual | 1,000.00 | 1,142.21 | 4.45 | 1,000.00 | 1,073.91 | 4.97 | 1,000.00 | 1,122.59 | 4.45 | |||||||||||||||||||||||||||
Hypothetical 5% return | 1,000.00 | 1,021.06 | + | 4.19 | 1,000.00 | 1,020.41 | + | 4.85 | 1,000.00 | 1,021.01 | + | 4.24 | ||||||||||||||||||||||||
| + | Hypothetical expenses are based on each Fund’s actual annualized net expense ratios and an assumed rate of return of 5% per year before expenses. |
| * | Expenses for each share class are calculated using each Fund’s annualized net expense ratio for each class, which represents the ongoing expenses as a percentage of net assets for the six months ended August 31, 2021. Expenses are calculated by multiplying the annualized net expense ratio by the average account value for the period; then multiplying the result by the number of days in the most recent fiscal half year; and then dividing that result by the number of days in the fiscal year. The annualized net expense ratios for the period were as follows: |
| Fund | Class A Shares | Class C Shares | Institutional Shares | Service Shares | Investor Shares | Class R6 Shares | Class R Shares | Class P Shares | ||||||||||||||||||||||||
Mid Cap Value Fund | 1.20 | % | 1.95 | % | 0.83 | % | 1.33 | % | 0.95 | % | 0.82 | % | 1.45 | % | 0.82 | % | ||||||||||||||||
Small Cap Value Fund | 1.28 | 2.03 | 0.96 | 1.46 | 1.03 | 0.95 | 1.53 | 0.95 | ||||||||||||||||||||||||
Small/Mid Cap Value Fund | 1.21 | 1.96 | 0.84 | N/A | 0.96 | 0.83 | 1.46 | 0.83 | ||||||||||||||||||||||||
121
GOLDMAN SACHS FUNDAMENTAL EQUITY VALUE FUNDS
Statement Regarding Basis for Approval of Management Agreement (Unaudited)
Background
The Goldman Sachs Equity Income Fund, Goldman Sachs Focused Value Fund, Goldman Sachs Large Cap Value Fund, Goldman Sachs Mid Cap Value Fund, Goldman Sachs Small Cap Value Fund, and Goldman Sachs Small/Mid Cap Value Fund (the “Funds”) are investment portfolios of Goldman Sachs Trust (the “Trust”). The Board of Trustees oversees the management of the Trust and reviews the investment performance and expenses of the Funds at regularly scheduled meetings held throughout the year. In addition, the Board of Trustees determines annually whether to approve the continuance of the Trust’s investment management agreement (the “Management Agreement”) with Goldman Sachs Asset Management, L.P. (the “Investment Adviser”) on behalf of the Funds.
The Management Agreement was most recently approved for continuation until June 30, 2022 by the Board of Trustees, including those Trustees who are not parties to the Management Agreement or “interested persons” (as defined in the Investment Company Act of 1940, as amended) of any party thereto (the “Independent Trustees”), at a meeting held on June 15-16, 2021 (the “Annual Meeting”).
The review process undertaken by the Trustees spans the course of the year and culminates with the Annual Meeting. To assist the Trustees in their deliberations, the Trustees have established a Contract Review Committee (the “Committee”), comprised of the Independent Trustees. The Committee held two meetings over the course of the year since the Management Agreement was last approved. At those Committee meetings, regularly scheduled Board or other committee meetings, and/or the Annual Meeting, matters relevant to the renewal of the Management Agreement were considered by the Board, or the Independent Trustees, as applicable. With respect to each Fund, such matters included:
| (a) | the nature and quality of the advisory, administrative, and other services provided to the Fund by the Investment Adviser and its affiliates, including information about: |
| (i) | the structure, staff, and capabilities of the Investment Adviser and its portfolio management teams; |
| (ii) | the groups within the Investment Adviser and its affiliates that support the portfolio management teams or provide other types of necessary services, including fund services groups (e.g., accounting and financial reporting, tax, shareholder services, and operations); controls and risk management groups (e.g., legal, compliance, valuation oversight, credit risk management, internal audit, compliance testing, market risk analysis, finance, and central funding); sales and distribution support groups, and others (e.g., information technology and training); |
| (iii) | trends in employee headcount; |
| (iv) | the Investment Adviser’s financial resources and ability to hire and retain talented personnel and strengthen its operations; and |
| (v) | the parent company’s support of the Investment Adviser and its mutual fund business, as expressed by the firm’s senior management; |
| (b) | information on the investment performance of the Fund, including comparisons to the performance of similar mutual funds, as provided by a third-party mutual fund data provider engaged as part of the contract review process (the “Outside Data Provider”), a benchmark performance index, and (in the case of the Mid Cap Value Fund and Small Cap Value Fund) a composite of accounts with comparable investment strategies managed by the Investment Adviser; and information on general investment outlooks in the markets in which the Fund invests; |
| (c) | information provided by the Investment Adviser indicating the Investment Adviser’s views on whether the Fund’s peer group and/or benchmark index had high, medium, or low relevance given the Fund’s particular investment strategy; |
| (d) | the terms of the Management Agreement and other agreements with affiliated service providers entered into by the Trust on behalf of the Fund; |
| (e) | fee and expense information for the Fund, including: |
| (i) | the relative management fee and expense levels of the Fund as compared to those of comparable funds managed by other advisers, as provided by the Outside Data Provider; |
| (ii) | the Fund’s expense trends over time; and |
| (iii) | to the extent the Investment Adviser manages other types of accounts (such as bank collective trusts, private wealth management accounts, institutional separate accounts, sub-advised mutual funds, and non-U.S. funds) having investment objectives and policies similar to those of the Fund, comparative information on the advisory fees charged and services provided to those accounts by the Investment Adviser; |
| (f) | with respect to the extensive investment performance and expense comparison data provided by the Outside Data Provider, its processes in producing that data for the Fund; |
| (g) | the undertakings of the Investment Adviser and its affiliates to implement fee waivers and/or expense limitations; |
| (h) | information relating to the profitability of the Management Agreement and the transfer agency and distribution and service arrangements of the Fund to the Investment Adviser and its affiliates; |
122
GOLDMAN SACHS FUNDAMENTAL EQUITY VALUE FUNDS
Statement Regarding Basis for Approval of Management Agreement (Unaudited) (continued)
| (i) | whether the Fund’s existing management fee schedule adequately addressed any economies of scale; |
| (j) | a summary of the “fall-out” benefits derived by the Investment Adviser and its affiliates from their relationships with the Fund, including the fees received by the Investment Adviser’s affiliates from the Fund for transfer agency, portfolio trading, distribution and other services; |
| (k) | a summary of potential benefits derived by the Fund as a result of its relationship with the Investment Adviser; |
| (l) | information regarding commissions paid by the Fund and broker oversight, an update on the Investment Adviser’s soft dollars practices, other information regarding portfolio trading, and how the Investment Adviser carries out its duty to seek best execution; |
| (m) | portfolio manager ownership of Fund shares; the manner in which portfolio manager compensation is determined; and the number and types of accounts managed by the portfolio managers; |
| (n) | the nature and quality of the services provided to the Fund by its unaffiliated service providers, and the Investment Adviser’s general oversight and evaluation (including reports on due diligence) of those service providers as part of the administrative services provided under the Management Agreement; and |
| (o) | the Investment Adviser’s processes and policies addressing various types of potential conflicts of interest; its approach to risk management; the annual review of the effectiveness of the Fund’s compliance program; and periodic compliance reports. |
The Trustees also received an overview of the Funds’ distribution arrangements. They received information regarding the Funds’ assets, share purchase and redemption activity, and payment of distribution, service, and shareholder administration fees, as applicable. Information was also provided to the Trustees relating to revenue sharing payments made by and services provided by the Investment Adviser and its affiliates to intermediaries that promote the sale, distribution, and/or servicing of Fund shares. The Independent Trustees also discussed the broad range of other investment choices that are available to Fund investors, including the availability of comparable funds managed by other advisers.
The presentations made at the Board and Committee meetings and at the Annual Meeting encompassed the Funds and other mutual funds for which the Board of Trustees has responsibility. In evaluating the Management Agreement at the Annual Meeting, the Trustees relied upon their knowledge, resulting from their meetings and other interactions throughout the year, of the Investment Adviser and its affiliates, their services, and the Funds. In conjunction with these meetings, the Trustees received written materials and oral presentations on the topics covered, and the Investment Adviser addressed the questions and concerns of the Trustees, including concerns regarding the investment performance of certain of the funds they oversee. The Independent Trustees were advised by their independent legal counsel regarding their responsibilities and other regulatory requirements related to the approval and continuation of mutual fund investment management agreements under applicable law. In addition, the Investment Adviser and its affiliates provided the Independent Trustees with a written response to a formal request for information sent on behalf of the Independent Trustees by their independent legal counsel. During the course of their deliberations, the Independent Trustees met in executive sessions with their independent legal counsel, without representatives of the Investment Adviser or its affiliates present.
Nature, Extent, and Quality of the Services Provided Under the Management Agreement
As part of their review, the Trustees considered the nature, extent, and quality of the services provided to the Funds by the Investment Adviser. In this regard, the Trustees considered both the investment advisory services and non-advisory services that are provided by the Investment Adviser and its affiliates. The Trustees noted the transition in the leadership and changes in personnel of various of the Investment Adviser’s portfolio management teams that had occurred in recent periods, and the ongoing recruitment efforts aimed at bringing high quality investment talent to the Investment Adviser. They also noted the Investment Adviser’s commitment to maintaining high quality systems and expending substantial resources to respond to ongoing changes to the market, regulatory and control environment in which the Funds and their service providers operate, including changes associated with the COVID-19 pandemic, as well as the efforts of the Investment Adviser and its affiliates to combat cyber security risks. The Trustees also considered information regarding the Investment Adviser’s business continuity planning and remote operations capabilities. The Trustees concluded that the Investment Adviser continued to commit substantial financial and operational resources to the Funds and expressed confidence that the Investment Adviser would continue to do so in the future. The Trustees also recognized that the Investment Adviser had made significant commitments to address regulatory compliance requirements applicable to the Funds and the Investment Adviser and its affiliates.
Investment Performance
The Trustees also considered the investment performance of the Funds. In this regard, they compared the investment performance of each Fund to its peers using rankings and ratings compiled by the Outside Data Provider as of December 31, 2020,
123
GOLDMAN SACHS FUNDAMENTAL EQUITY VALUE FUNDS
Statement Regarding Basis for Approval of Management Agreement (Unaudited) (continued)
and updated performance information prepared by the Investment Adviser using the peer group identified by the Outside Data Provider as of March 31, 2021. The information on each Fund’s investment performance was provided for the one-, three-, five-, and ten-year periods ending on the applicable dates, to the extent that each Fund had been in existence for those periods. The Trustees also reviewed each Fund’s investment performance relative to its performance benchmark. As part of this review, they considered the investment performance trends of the Funds over time, and reviewed the investment performance of each Fund in light of its investment objective and policies and market conditions. The Trustees also received information comparing the Mid Cap Value Fund’s and Small Cap Value Fund’s performance to that of composites of accounts with comparable investment strategies managed by the Investment Adviser.
In addition, the Trustees considered materials prepared and presentations made by the Investment Adviser’s senior management and portfolio management personnel in which Fund performance was assessed. The Trustees also considered the Investment Adviser’s periodic reports with respect to the Funds’ risk profiles, and how the Investment Adviser’s approach to risk monitoring and management influences portfolio management.
The Trustees observed that the Equity Income Fund’s Institutional Shares had placed in the top half of the Fund’s peer group for the three-year period, in the third quartile for the five- and ten-year periods, and in the fourth quartile for the one-year period, and had underperformed the Fund’s benchmark index for the one-, three-, five-, and ten-year periods ended March 31, 2021. They considered that the Focused Value Fund’s Institutional Shares had placed in the top half of the Fund’s peer group and had outperformed the Fund’s benchmark index for the one-, three-, and five-year periods ended March 31, 2021. The Trustees noted that the Large Cap Value Fund’s Institutional Shares had placed in the in the top half of the Fund’s peer group for the three-year period, third quartile for the one- and five-year periods, and in the fourth quartile for the ten-year period, and had underperformed the Fund’s benchmark index for the one-, three-, five-, and ten-year periods ended March 31, 2021. They observed that the Mid Cap Value Fund’s Institutional Shares had placed in the top half of the Fund’s peer group for the three-year period and the third quartile for the one-, five-, and ten-year periods, and had outperformed the Fund’s benchmark index for the three- and five-year periods and underperformed for the one- and ten-year periods ended March 31, 2021. The Trustees noted that the Mid Cap Value Fund had experienced certain portfolio management changes in early 2021. They considered that the Small Cap Value Fund’s Institutional Shares had placed in the third quartile of the Fund’s peer group for the one- and ten-year periods and in the fourth quartile for the three- and five-year periods, and had underperformed the Fund’s benchmark index for the one-, three-, and five-year periods and outperformed for the ten-year period ended March 31, 2021. The Trustees observed that the Small/Mid Cap Value Fund’s Institutional Shares had placed in the top half of the Fund’s peer group for the one-year period and in the third quartile for the three- and five-year periods, and had outperformed the Fund’s benchmark index for the five-year period and underperformed for the one- and three-year periods ended March 31, 2021.
Costs of Services Provided and Competitive Information
The Trustees considered the contractual terms of the Management Agreement and the fee rates payable by each Fund thereunder. In this regard, the Trustees considered information on the services rendered by the Investment Adviser to the Funds, which included both advisory and administrative services that were directed to the needs and operations of the Funds as registered mutual funds.
In particular, the Trustees reviewed analyses prepared by the Outside Data Provider regarding the expense rankings of the Funds. The analyses provided a comparison of each Fund’s management fee and breakpoints to those of a relevant peer group and category universe; an expense analysis which compared each Fund’s overall net and gross expenses to a peer group and a category universe; and data comparing each Fund’s net expenses to the peer and category medians. The analyses also compared each Fund’s other expenses and fee waivers/reimbursements to those of the peer group and category medians. The Trustees concluded that the comparisons provided by the Outside Data Provider were useful in evaluating the reasonableness of the management fees and total expenses paid by the Funds.
In addition, the Trustees considered the Investment Adviser’s undertakings to implement fee waivers and/or expense limitations. The Trustees also noted that certain changes were being made to existing fee waiver or expense limitation arrangements of the Mid Cap Value Fund and Small/Mid Cap Value Fund that would have the effect of decreasing expenses of Class A, Class C, Investor, and Class R Shares of the Funds, with such changes taking effect in connection with the Funds’ next annual registration statement update. They also considered, to the extent that the Investment Adviser manages other types of accounts having investment objectives and policies similar to those of the Funds, comparative fee information for services provided by the Investment Adviser to those accounts, and information that indicated that services provided to the Funds differed in various significant respects from the services provided to other types of accounts which, in many cases, operated under less stringent legal and regulatory structures, required fewer services from the Investment Adviser to a smaller number of client contact points, and were less time-intensive.
124
GOLDMAN SACHS FUNDAMENTAL EQUITY VALUE FUNDS
Statement Regarding Basis for Approval of Management Agreement (Unaudited) (continued)
In addition, the Trustees noted that shareholders are able to redeem their Fund shares at any time if shareholders believe that the Fund fees and expenses are too high or if they are dissatisfied with the performance of the Fund.
Profitability
The Trustees reviewed each Fund’s contribution to the Investment Adviser’s revenues and pre-tax profit margins. In this regard the Trustees noted that they had received, among other things, profitability analyses and summaries, revenue and expense schedules by Fund and by function (i.e., investment management, transfer agency and distribution and service), and information on the Investment Adviser’s expense allocation methodology. They observed that the profitability and expense figures are substantially similar to those used by the Investment Adviser for many internal purposes, including compensation decisions among various business groups, and are thus subject to a vigorous internal debate about how certain revenue and expenses should be allocated. The Trustees also noted that the internal audit group within the Goldman Sachs organization periodically audits the expense allocation methodology and that the internal audit group was satisfied with the reasonableness, consistency, and accuracy of the Investment Adviser’s expense allocation methodology. Profitability data for each Fund was provided for 2020 and 2019, and the Trustees considered this information in relation to the Investment Adviser’s overall profitability.
Economies of Scale
The Trustees considered the information that had been provided regarding whether there have been economies of scale with respect to the management of the Funds. The Trustees also considered the breakpoints in the fee rate payable under the Management Agreement for each of the Funds at the following annual percentage rates of the average daily net assets of the Funds:
| Equity Income Fund | Focused Value Fund | Large Cap Value | Mid Cap Value | Small Cap Value | Small/ Mid Cap Value Fund | |||||||||||||||||||
| First $1 billion | 0.69 | % | 0.69 | % | 0.75 | % | 0.75 | % | 0.98 | % | 0.80 | % | ||||||||||||
| Next $1 billion | 0.62 | 0.62 | 0.68 | 0.75 | 0.98 | 0.80 | ||||||||||||||||||
| Next $3 billion | 0.59 | 0.59 | 0.65 | 0.68 | 0.88 | 0.72 | ||||||||||||||||||
| Next $3 billion | 0.58 | 0.58 | 0.64 | 0.65 | 0.84 | 0.68 | ||||||||||||||||||
| Over $8 billion | 0.57 | 0.57 | 0.63 | 0.64 | 0.82 | 0.67 | ||||||||||||||||||
The Trustees noted that the breakpoints were designed to share potential economies of scale, if any, with the Funds and their shareholders as assets under management reach those asset levels. The Trustees considered the amounts of assets in the Funds; the Funds’ recent share purchase and redemption activity; the information provided by the Investment Adviser relating to the costs of the services provided by the Investment Adviser and its affiliates and their realized profits; information comparing fee rates charged by the Investment Adviser with fee rates charged to other funds in the peer groups; and the Investment Adviser’s undertakings to waive a portion of its management fee for the Large Cap Value Fund and to limit certain expenses of the Funds that exceed specified levels, as well as Goldman Sachs & Co. LLC’s (“Goldman Sachs”) undertaking to waive a portion of the transfer agency fees paid by the Equity Income Fund’s, Focused Value Fund’s, Large Cap Value Fund’s, and Small Cap Value Fund’s Class A, Class C, Investor, and Class R Shares. Upon reviewing these matters at the Annual Meeting, the Trustees concluded that the fee breakpoints represented a means of assuring that benefits of scalability, if any, would be passed along to shareholders at the specified asset levels. They also noted that the Investment Adviser had passed along savings to shareholders of the Small Cap Value Fund, which had asset levels above at least the first breakpoint during the prior fiscal year.
Other Benefits to the Investment Adviser and Its Affiliates
The Trustees also considered the other benefits derived by the Investment Adviser and its affiliates from their relationships with the Funds as stated above, including: (a) transfer agency fees received by Goldman Sachs; (b) brokerage and futures commissions earned by Goldman Sachs for executing securities and futures transactions on behalf of the Funds; (c) research received by the Investment Adviser from broker-dealers in exchange for executing certain transactions on behalf of the Funds; (d) trading efficiencies resulting from aggregation of orders of the Funds with those for other funds or accounts managed by the Investment Adviser; (e) fees earned by the Investment Adviser for managing the fund in which the Funds’ securities lending cash collateral is invested; (f) the Investment Adviser’s ability to leverage the infrastructure designed to service the Funds on behalf of its other clients; (g) the Investment Adviser’s ability to cross-market other products and services to Fund shareholders; (h) Goldman Sachs’ retention of certain fees as Fund Distributor; (i) the Investment Adviser’s ability to negotiate better pricing with custodians on behalf of its other clients, as a result of the relationship with the Funds; (j) the investment of cash and cash
125
GOLDMAN SACHS FUNDAMENTAL EQUITY VALUE FUNDS
Statement Regarding Basis for Approval of Management Agreement (Unaudited) (continued)
collateral in money market funds managed by the Investment Adviser that will result in increased assets under management for those money market funds; (k) the investment in exchange-traded funds (“ETFs”) managed by the Investment Adviser that will result in increased assets under management for those ETFs and may facilitate the development of the Investment Adviser’s ETF advisory business; and (l) the possibility that the working relationship between the Investment Adviser and the Funds’ third-party service providers may cause those service providers to be more likely to do business with other areas of Goldman Sachs. In the course of considering the foregoing, the Independent Trustees requested and received further information quantifying certain of these fall-out benefits.
Other Benefits to the Funds and Their Shareholders
The Trustees also noted that the Funds receive certain other potential benefits as a result of their relationship with the Investment Adviser, including: (a) trading efficiencies resulting from aggregation of orders of the Funds with those of other funds or accounts managed by the Investment Adviser; (b) enhanced servicing from vendors due to the volume of business generated by the Investment Adviser and its affiliates; (c) enhanced servicing from broker-dealers due to the volume of business generated by the Investment Adviser and its affiliates; (d) the advantages received from the Investment Adviser’s knowledge and experience gained from managing other accounts and products; (e) the Investment Adviser’s ability to hire and retain qualified personnel to provide services to the Funds because of the reputation of the Goldman Sachs organization; (f) the Funds’ access, through the Investment Adviser, to certain firm-wide resources (e.g., proprietary risk management systems and databases), subject to certain restrictions; and (g) the Funds’ access to certain affiliated distribution channels. In addition, the Trustees noted the competitive nature of the mutual fund marketplace, and considered that many of the Funds’ shareholders invested in the Funds in part because of the Funds’ relationship with the Investment Adviser and that those shareholders have a general expectation that the relationship will continue.
Conclusion
In connection with their consideration of the Management Agreement, the Trustees gave weight to each of the factors described above, but did not identify any particular factor as controlling their decision. After deliberation and consideration of all of the information provided, including the factors described above, the Trustees concluded, in the exercise of their business judgment, that the management fees paid by each of the Funds were reasonable in light of the services provided to it by the Investment Adviser, the Investment Adviser’s costs and each Fund’s current and reasonably foreseeable asset levels. The Trustees unanimously concluded that the Investment Adviser’s continued management likely would benefit each Fund and its shareholders and that the Management Agreement should be approved and continued with respect to each Fund until June 30, 2022.
126
GOLDMAN SACHS FUNDAMENTAL EQUITY VALUE FUNDS
Trustees and Officers (Unaudited)
Independent Trustees
Name, Address and Age1 | Position(s) Held with the Trust | Term of Office and Length of Time Served2 | Principal Occupation(s) During Past 5 Years | Number of Portfolios in Fund Complex Overseen by Trustee3 | Other Directorships Held by Trustee4 | |||||
Jessica Palmer Age: 72 | Chair of the Board of Trustees | Since 2018 (Trustee since 2007) | Ms. Palmer is retired. She was formerly Consultant, Citigroup Human Resources Department (2007-2008); Managing Director, Citigroup Corporate and Investment Banking (previously, Salomon Smith Barney/ Salomon Brothers) (1984-2006). Ms. Palmer was a Member of the Board of Trustees of Indian Mountain School (private elementary and secondary school) (2004-2009).
Chair of the Board of Trustees — Goldman Sachs Trust and Goldman Sachs Variable Insurance Trust. | 109 | None | |||||
Dwight L. Bush Age: 64 | Trustee | Since 2020 | Ambassador Bush is President and CEO of D.L. Bush & Associates (a financial advisory and private investment firm) (2002-2014 and 2017- present); Director of MoneyLion Inc. (an operator of a data-driven, digital financial platform) (2021-present); and was formerly U.S. Ambassador to the Kingdom of Morocco (2014-2017) and a Member of the Board of Directors of Santander Bank, N.A. (2018-2019). Previously, Ambassador Bush served as an Advisory Board Member of Goldman Sachs Trust and Goldman Sachs Variable Insurance Trust (October 2019-January 2020).
Trustee — Goldman Sachs Trust and Goldman Sachs Variable Insurance Trust. | 109 | None | |||||
Kathryn A. Cassidy Age: 67 | Trustee | Since 2015 | Ms. Cassidy is retired. Formerly, she was Advisor to the Chairman (May 2014-December 2014); and Senior Vice President and Treasurer (2008-2014), General Electric Company & General Electric Capital Corporation (technology and financial services companies).
Trustee — Goldman Sachs Trust and Goldman Sachs Variable Insurance Trust. | 109 | None | |||||
Diana M. Daniels Age: 72 | Trustee | Since 2007 | Ms. Daniels is retired. Formerly, she was Vice President, General Counsel and Secretary, The Washington Post Company (1991-2006). Ms. Daniels is a Trustee Emeritus and serves as a Presidential Councillor of Cornell University (2013-Present); former Member of the Legal Advisory Board, New York Stock Exchange (2003- 2006) and of the Corporate Advisory Board, Standish Mellon Management Advisors (2006- 2007).
Trustee — Goldman Sachs Trust and Goldman Sachs Variable Insurance Trust. | 109 | None | |||||
Joaquin Delgado Age: 61 | Trustee | Since 2020 | Dr. Delgado is retired. He is Director, Hexion Inc. (a specialty chemical manufacturer) (2019-present); and Director, Stepan Company (a specialty chemical manufacturer) (2011-present); and was formerly Executive Vice President, Consumer Business Group of 3M Company (July 2016-July 2019); and Executive Vice President, Health Care Business Group of 3M Company (October 2012-July 2016). Previously, Dr. Delgado served as an Advisory Board Member of Goldman Sachs Trust and Goldman Sachs Variable Insurance Trust (October 2019-January 2020).
Trustee — Goldman Sachs Trust and Goldman Sachs Variable Insurance Trust. | 109 | Hexion Inc. (a specialty chemical manufacturer); Stepan Company (a specialty chemical manufacturer) | |||||
127
GOLDMAN SACHS FUNDAMENTAL EQUITY VALUE FUNDS
Trustees and Officers (Unaudited) (continued)
Independent Trustees
Name, Address and Age1 | Position(s) Held with the Trust | Term of Office and Length of Time Served2 | Principal Occupation(s) During Past 5 Years | Number of Portfolios in Fund Complex Overseen by Trustee3 | Other Directorships Held by Trustee4 | |||||
Roy W. Templin Age: 61 | Trustee | Since 2013 | Mr. Templin is retired. He is Director, Armstrong World Industries, Inc. (a designer and manufacturer of ceiling and wall systems) (2016-Present); and was formerly Chairman of the Board of Directors, Con- Way Incorporated (a transportation, logistics and supply chain management service company) (2014-2015); Executive Vice President and Chief Financial Officer, Whirlpool Corporation (an appliance manufacturer and marketer) (2004-2012).
Trustee — Goldman Sachs Trust and Goldman Sachs Variable Insurance Trust. | 109 | Armstrong World Industries, Inc. (a ceiling and wall systems manufacturer) | |||||
Gregory G. Weaver Age: 69 | Trustee | Since 2015 | Mr. Weaver is retired. He is Director, Verizon Communications Inc. (2015-Present); and was formerly Chairman and Chief Executive Officer, Deloitte & Touche LLP (a professional services firm) (2001-2005 and 2012-2014); and Member of the Board of Directors, Deloitte & Touche LLP (2006-2012).
Trustee — Goldman Sachs Trust and Goldman Sachs Variable Insurance Trust. | 109 | Verizon Communications Inc. | |||||
Interested Trustee*
Name, Address and Age1 | Position(s) Held with the Trust | Term of Office and Length of Time Served2 | Principal Occupation(s) During Past 5 Years | Number of Portfolios in Fund Complex Overseen by Trustee3 | Other Directorships Held by Trustee4 | |||||
James A. McNamara Age: 58 | President and Trustee | Since 2007 | Advisory Director, Goldman Sachs (January 2018-Present); Managing Director, Goldman Sachs (January 2000-December 2017); Director of Institutional Fund Sales, GSAM (April 1998- December 2000); and Senior Vice President and Manager, Dreyfus Institutional Service Corporation (January 1993- April 1998).
President and Trustee — Goldman Sachs Trust; Goldman Sachs Variable Insurance Trust; Goldman Sachs Trust II; Goldman Sachs MLP and Energy Renaissance Fund; Goldman Sachs ETF Trust; Goldman Sachs Credit Income Fund; and Goldman Sachs Real Estate Diversified Income Fund. | 166 | None | |||||
| * | Mr. McNamara is considered to be an “Interested Trustee” because he holds positions with Goldman Sachs and owns securities issued by The Goldman Sachs Group, Inc. Mr. McNamara holds comparable positions with certain other companies of which Goldman Sachs, GSAM or an affiliate thereof is the investment adviser, administrator and/or distributor. |
| 1 | Each Trustee may be contacted by writing to the Trustee, c/o Goldman Sachs, 200 West Street, New York, New York, 10282, Attn: Caroline Kraus. Information is provided as of August 31, 2021. |
| 2 | Subject to such policies as may be adopted by the Board from time-to-time, each Trustee holds office for an indefinite term, until the earliest of: (a) the election of his or her successor; (b) the date the Trustee resigns or is removed by the Board or shareholders, in accordance with the Trust’s Declaration of Trust; or (c) the termination of the Trust. The Board has adopted policies which provide that each Independent Trustee shall retire as of December 31st of the calendar year in which he or she reaches (a) his or her 75th birthday or (b) the 15th anniversary of the date he or she became a Trustee, whichever is earlier, unless a waiver of such requirements shall have been adopted by a majority of the other Trustees. These policies may be changed by the Trustees without shareholder vote. |
| 3 | The Goldman Sachs Fund Complex includes certain other companies listed above for each respective Trustee. As of August 31, 2021, Goldman Sachs Trust consisted of 92 portfolios (90 of which offered shares to the public); Goldman Sachs Variable Insurance Trust consisted of 17 portfolios (13 of which offered shares to the public); Goldman Sachs Trust II consisted of 18 portfolios (16 of which offered shares to the public); Goldman Sachs ETF Trust consisted of 36 portfolios (21 of which offered shares to the public); and Goldman Sachs MLP and Energy Renaissance Fund, Goldman Sachs Credit Income Fund and Goldman Sachs Real Estate Diversified Income Fund each consisted of one portfolio. Goldman Sachs Credit Income Fund did not offer shares to the public. |
| 4 | This column includes only directorships of companies required to report to the Securities and Exchange Commission under the Securities Exchange Act of 1934 (i.e., “public companies”) or other investment companies registered under the Act. |
Additional information about the Trustees is available in the Fund’s Statement of Additional Information, which can be obtained from Goldman Sachs free of charge by calling this toll-free number (in the United States of America): 1-800-526-7384.
128
GOLDMAN SACHS FUNDAMENTAL EQUITY VALUE FUNDS
Trustees and Officers (Unaudited) (continued)
Officers of the Trust*
Name, Address and Age1 | Positions Held with the Trust | Term of Office and Length of Time Served2 | Principal Occupation(s) During Past 5 Years | |||
James A. McNamara 200 West Street New York, NY 10282 Age: 58 | Trustee and President | Since 2007 | Advisory Director, Goldman Sachs (January 2018-Present); Managing Director, Goldman Sachs (January 2000-December 2017); Director of Institutional Fund Sales, GSAM (April 1998-December 2000); and Senior Vice President and Manager, Dreyfus Institutional Service Corporation (January 1993-April 1998).
President and Trustee — Goldman Sachs Trust; Goldman Sachs Variable Insurance Trust; Goldman Sachs Trust II; Goldman Sachs MLP and Energy Renaissance Fund; Goldman Sachs ETF Trust; Goldman Sachs Credit Income Fund; and Goldman Sachs Real Estate Diversified Income Fund. | |||
Caroline L. Kraus 200 West Street New York, NY 10282 Age: 44 | Secretary | Since 2012 | Managing Director, Goldman Sachs (January 2016-Present); Vice President, Goldman Sachs (August 2006-December 2015); Senior Counsel, Goldman Sachs (January 2020-Present); Associate General Counsel, Goldman Sachs (2012-December 2019); Assistant General Counsel, Goldman Sachs (August 2006-December 2011); and Associate, Weil, Gotshal & Manges, LLP (2002-2006).
Secretary — Goldman Sachs Trust (previously Assistant Secretary (2012)); Goldman Sachs Variable Insurance Trust (previously Assistant Secretary (2012)); Goldman Sachs Trust II; Goldman Sachs BDC, Inc.; Goldman Sachs Private Middle Market Credit LLC; Goldman Sachs Private Middle Market Credit II LLC; Goldman Sachs Middle Market Lending Corp.; Goldman Sachs MLP and Energy Renaissance Fund; Goldman Sachs ETF Trust; Goldman Sachs Credit Income Fund; and Goldman Sachs Real Estate Diversified Income Fund. | |||
Joseph F. DiMaria 30 Hudson Street Jersey City, NJ 07302 Age: 53 | Treasurer, Principal Financial Officer and Principal Accounting Officer | Since 2017 (Treasurer and Principal Financial Officer since 2019) | Managing Director, Goldman Sachs (November 2015-Present) and Vice President — Mutual Fund Administration, Columbia Management Investment Advisers, LLC (May 2010- October 2015).
Treasurer, Principal Financial Officer and Principal Accounting Officer — Goldman Sachs Trust (previously Assistant Treasurer (2016)); Goldman Sachs Variable Insurance Trust (previously Assistant Treasurer (2016)); Goldman Sachs Trust II (previously Assistant Treasurer (2017)); Goldman Sachs MLP and Energy Renaissance Fund (previously Assistant Treasurer (2017)); Goldman Sachs ETF Trust (previously Assistant Treasurer (2017)); Goldman Sachs Credit Income Fund; and Goldman Sachs Real Estate Diversified Income Fund. | |||
| * | Represents a partial list of officers of the Trust. Additional information about all the officers is available in the Fund’s Statement of Additional Information, which can be obtained from Goldman Sachs free of charge by calling this toll-free number (in the United States): 1-800-526-7384. |
| 1 | Information is provided as of August 31, 2021. |
| 2 | Officers hold office at the pleasure of the Board of Trustees or until their successors are duly elected and qualified. Each officer holds comparable positions with certain other companies of which Goldman Sachs, GSAM or an affiliate thereof is the investment adviser, administrator and/or distributor. |
Goldman Sachs Trust — Fundamental Equity Value Funds — Tax Information (Unaudited)
For the year ended August 31, 2021, 100%, 76.24%, 92.91%, 15.57%, 23.79% and 77.60%, respectively, of the dividends paid from net investment company taxable income by the Equity Income, Focused Value, Large Cap Value, Mid Cap Value, Small Cap Value and Small/Mid Cap Value Funds, respectively, qualify for the dividends received deduction available to corporations.
Pursuant to Section 852 of the Internal Revenue Code, the Focused Value, Large Cap Value and Small Cap Value Funds designate $132,959, $9,286,554 and $88,659,410 respectively or if different, the maximum amount allowable, as capital gain dividends paid during the fiscal year ended August 31, 2021.
For the year ended August 31, 2021, the Equity Income, Focused Value, Large Cap Value, Mid Cap Value, Small Cap Value and Small/Mid Cap Value Funds designate 100%, 100%, 100%, 100%, 100% and 100%, respectively, of the dividends paid from net investment company taxable income as qualifying for the reduced tax rate under the Jobs and Growth Tax Relief and Reconciliation Act of 2003.
During the fiscal year ended August 31, 2021, Focused Value, Mid Cap Value and Small Cap Value Funds designate $1,964, $2,680,463, and $3,840,426 respectively, as short-term capital gain dividends pursuant to Section 871(k) of the Internal Revenue Code.
129
FUNDS PROFILE
Goldman Sachs Funds
Goldman Sachs is a premier financial services firm, known since 1869 for creating thoughtful and customized investment solutions in complex global markets.
Today, the Asset Management Division of Goldman Sachs serves a diverse set of clients worldwide, including private institutions, public entities and individuals. With approximately $2.09 trillion in assets under supervision as of June 30, 2021, Goldman Sachs Asset Management has portfolio management teams located around the world and our investment professionals bring firsthand knowledge of local markets to every investment decision. Assets under supervision includes assets under management and other client assets for which Goldman Sachs does not have full discretion. Goldman Sachs Asset Management leverages the resources of Goldman Sachs & Co. LLC subject to legal, internal and regulatory restrictions.
Money Market
Financial Square FundsSM
| ∎ | Financial Square Treasury Solutions Fund1 |
| ∎ | Financial Square Government Fund1 |
| ∎ | Financial Square Money Market Fund2 |
| ∎ | Financial Square Prime Obligations Fund2 |
| ∎ | Financial Square Treasury Instruments Fund1 |
| ∎ | Financial Square Treasury Obligations Fund1 |
| ∎ | Financial Square Federal Instruments Fund1 |
Investor FundsSM
| ∎ | Investor Money Market Fund3 |
| ∎ | Investor Tax-Exempt Money Market Fund3 |
Fixed Income
Short Duration and Government
| ∎ | Enhanced Income Fund |
| ∎ | High Quality Floating Rate Fund |
| ∎ | Short-Term Conservative Income Fund |
| ∎ | Short Duration Government Fund |
| ∎ | Short Duration Bond Fund4 |
| ∎ | Government Income Fund |
| ∎ | Inflation Protected Securities Fund |
Multi-Sector
| ∎ | Bond Fund |
| ∎ | Core Fixed Income Fund |
| ∎ | Global Core Fixed Income Fund |
| ∎ | Income Fund |
| �� | Strategic Income Fund |
Municipal and Tax-Free
| ∎ | High Yield Municipal Fund |
| ∎ | Dynamic Municipal Income Fund |
| ∎ | Short Duration Tax-Free Fund |
| ∎ | Municipal Income Completion Fund |
Single Sector
| ∎ | Investment Grade Credit Fund |
| ∎ | U.S. Mortgages Fund |
| ∎ | High Yield Fund |
| ∎ | High Yield Floating Rate Fund |
| ∎ | Emerging Markets Debt Fund |
| ∎ | Local Emerging Markets Debt Fund |
Fixed Income Alternatives
| ∎ | Long Short Credit Strategies Fund |
Fundamental Equity
| ∎ | Equity Income Fund |
| ∎ | Small Cap Growth Fund |
| ∎ | Small Cap Value Fund |
| ∎ | Small/Mid Cap Value Fund |
| ∎ | Mid Cap Value Fund |
| ∎ | Large Cap Value Fund |
| ∎ | Focused Value Fund |
| ∎ | Capital Growth Fund |
| ∎ | Strategic Growth Fund |
| ∎ | Small/Mid Cap Growth Fund |
| ∎ | Flexible Cap Fund |
| ∎ | Concentrated Growth Fund |
| ∎ | Technology Opportunities Fund |
| ∎ | Growth Opportunities Fund |
| ∎ | Rising Dividend Growth Fund |
| ∎ | U.S. Equity ESG Fund |
| ∎ | Income Builder Fund |
Tax-Advantaged Equity
| ∎ | U.S. Tax-Managed Equity Fund |
| ∎ | International Tax-Managed Equity Fund |
| ∎ | U.S. Equity Dividend and Premium Fund |
| ∎ | International Equity Dividend and Premium Fund |
Equity Insights
| ∎ | Small Cap Equity Insights Fund |
| ∎ | U.S. Equity Insights Fund |
| ∎ | Small Cap Growth Insights Fund |
| ∎ | Large Cap Growth Insights Fund |
| ∎ | Large Cap Value Insights Fund |
| ∎ | Small Cap Value Insights Fund |
| ∎ | International Small Cap Insights Fund |
| ∎ | International Equity Insights Fund |
| ∎ | Emerging Markets Equity Insights Fund |
Fundamental Equity International
| ∎ | International Equity Income Fund |
| ∎ | International Equity ESG Fund |
| ∎ | China Equity Fund |
| ∎ | Emerging Markets Equity Fund |
| ∎ | ESG Emerging Markets Equity Fund |
Alternative
| ∎ | Real Estate Securities Fund |
| ∎ | International Real Estate Securities Fund |
| ∎ | Commodity Strategy Fund |
| ∎ | Global Real Estate Securities Fund |
| ∎ | Alternative Premia Fund |
| ∎ | Absolute Return Tracker Fund |
| ∎ | Managed Futures Strategy Fund |
| ∎ | MLP Energy Infrastructure Fund |
| ∎ | Energy Infrastructure Fund |
| ∎ | Multi-Manager Alternatives Fund |
| ∎ | Global Infrastructure Fund |
| ∎ | Clean Energy Income Fund |
| ∎ | Defensive Equity Fund |
Total Portfolio Solutions
| ∎ | Global Managed Beta Fund |
| ∎ | Multi-Manager Non-Core Fixed Income Fund |
| ∎ | Multi-Manager Global Equity Fund |
| ∎ | Multi-Manager International Equity Fund |
| ∎ | Tactical Tilt Overlay Fund |
| ∎ | Balanced Strategy Portfolio |
| ∎ | Multi-Manager U.S. Small Cap Equity Fund |
| ∎ | Multi-Manager Real Assets Strategy Fund |
| ∎ | Growth and Income Strategy Portfolio |
| ∎ | Growth Strategy Portfolio |
| ∎ | Dynamic Global Equity Fund |
| ∎ | Satellite Strategies Portfolio |
| ∎ | Enhanced Dividend Global Equity Portfolio |
| ∎ | Tax-Advantaged Global Equity Portfolio |
| ∎ | Strategic Factor Allocation Fund |
| ∎ | Strategic Volatility Premium Fund |
| ∎ | Target Date Retirement Portfolio |
| ∎ | Target Date 2025 Portfolio |
| ∎ | Target Date 2030 Portfolio |
| ∎ | Target Date 2035 Portfolio |
| ∎ | Target Date 2040 Portfolio |
| ∎ | Target Date 2045 Portfolio |
| ∎ | Target Date 2050 Portfolio |
| ∎ | Target Date 2055 Portfolio |
| ∎ | Target Date 2060 Portfolio |
| ∎ | GQG Partners International Opportunities Fund |
| 1 | You could lose money by investing in the Fund. Although the Fund seeks to preserve the value of your investment at $1.00 per share, it cannot guarantee it will do so. An investment in the Fund is not a deposit of a bank and is not insured or guaranteed by the Federal Deposit Insurance Corporation or any other government agency. The Fund’s sponsor has no legal obligation to provide financial support to the Fund, and you should not expect that the sponsor will provide financial support to the Fund at any time. |
| 2 | You could lose money by investing in the Fund. Because the share price of the Fund will fluctuate, when you sell your shares they may be worth more or less than what you originally paid for them. The Fund may impose a fee upon sale of your shares or may temporarily suspend your ability to sell shares if the Fund’s liquidity falls below required minimums because of market conditions or other factors. An investment in the Fund is not a deposit of a bank and is not insured or guaranteed by the Federal Deposit Insurance Corporation or any other government agency. The Fund’s sponsor has no legal obligation to provide financial support to the Fund, and you should not expect that the sponsor will provide financial support to the Fund at any time. |
| 3 | You could lose money by investing in the Fund. Although the Fund seeks to preserve the value of your investment at $1.00 per share, it cannot guarantee it will do so. The Fund may impose a fee upon sale of your shares or may temporarily suspend your ability to sell shares if the Fund’s liquidity falls below required minimums because of market conditions or other factors. An investment in the Fund is not a deposit of a bank and is not insured or guaranteed by the Federal Deposit Insurance Corporation or any other government agency. The Fund’s sponsor has no legal obligation to provide financial support to the Fund, and you should not expect that the sponsor will provide financial support to the Fund at any time. |
| 4 | Effective after the close of business on July 29, 2021, the Goldman Sachs Short Duration Income Fund was renamed the Goldman Sachs Short Duration Bond Fund. |
Financial Square FundsSM and Investor FundsSM are registered service marks of Goldman Sachs & Co. LLC.
| * | This list covers open-end funds only. Please visit our website at www.GSAMFUNDS.com to learn about our closed-end funds and exchange-traded funds. |
TRUSTEES Jessica Palmer, Chair Dwight L. Bush Kathryn A. Cassidy Diana M. Daniels Joaquin Delgado James A. McNamara Roy W. Templin Gregory G. Weaver | OFFICERS James A. McNamara, President Joseph F. DiMaria, Principal Financial Officer, Principal Accounting Officer and Treasurer Caroline L. Kraus, Secretary | |
GOLDMAN SACHS & CO. LLC Distributor and Transfer Agent | GOLDMAN SACHS ASSET MANAGEMENT, L.P. Investment Adviser | |
Visit our web site at www.GSAMFUNDS.com to obtain the most recent month-end returns.
Goldman Sachs Asset Management, L .P. 200 West Street, New York, New York 10282
The reports concerning the Funds included in this shareholder report may contain certain forward-looking statements about the factors that may affect the performance of the Funds in the future. These statements are based on Fund management’s predictions and expectations concerning certain future events and their expected impact on the Funds, such as performance of the economy as a whole and of specific industry sectors, changes in the levels of interest rates, the impact of developing world events, and other factors that may influence the future performance of the Funds. Management believes these forward-looking statements to be reasonable, although they are inherently uncertain and difficult to predict. Actual events may cause adjustments in portfolio management strategies from those currently expected to be employed.
A description of the policies and procedures that the Funds use to determine how to vote proxies relating to portfolio securities and information regarding how a Fund voted proxies relating to portfolio securities during the most recent 12-month period ended June 30 is available (i) without charge, upon request by calling 1-800-526-7384 (for Retail Shareholders) or 1-800-621-2550 (for Institutional Shareholders); and (ii) on the Securities and Exchange Commission (“SEC”) web site at http://www.sec.gov.
The Funds will file their portfolio holdings information for each month in a fiscal quarter within 60 days after the end of the relevant fiscal quarter on Form N-PORT. Portfolio holdings information for the third month of each fiscal quarter will be made available on the SEC’s web site at http://www.sec.gov. Portfolio holdings information may be obtained upon request and without charge by calling 1-800-526-7384 (for Retail Shareholders) or 1-800-621-2550 (for Institutional Shareholders).
Goldman Sachs & Co. LLC (‘‘Goldman Sachs’’) does not provide legal, tax or accounting advice. Any statement contained in this communication (including any attachments) concerning U.S. tax matters was not intended or written to be used, and cannot be used, for the purpose of avoiding penalties under the Internal Revenue Code, and was written to support the promotion or marketing of the transaction(s) or matter(s) addressed. Clients of Goldman Sachs should obtain their own independent tax advice based on their particular circumstances.
Fund holdings and allocations shown are as of August 31, 2021 and may not be representative of future investments. Fund holdings should not be relied on in making investment decisions and should not be construed as research or investment advice regarding particular securities. Current and future holdings are subject to risk.
The Global Industry Classification Standard (GICS) was developed by and is the exclusive property and a service mark of Morgan Stanley Capital International Inc. (MSCI) and Standard & Poor’s, a division of The McGraw-Hill Companies, Inc. (S&P) and is licensed for use by Goldman Sachs. Neither MSCI, S&P nor any other party involved in making or compiling the GICS or any GICS classifications makes any express or implied warranties or representations with respect to such standard or classification (or the results to be obtained by the use thereof), and all such parties hereby expressly disclaim all warranties of originality, accuracy, completeness, merchantability or fitness for a particular purpose with respect to any of such standard or classification. Without limiting any of the foregoing, in no event shall MSCI, S&P, any of their affiliates or any third party involved in making or compiling the GICS or any GICS classifications have any liability for any direct, indirect, special, punitive, consequential or any other damages (including lost profits) even if notified of the possibility of such damages.
The portfolio risk management process includes an effort to monitor and manage risk, but does not imply low risk.
This material is not authorized for distribution to prospective investors unless preceded or accompanied by a current Prospectus or summary prospectus, if applicable. Investors should consider a Fund’s objective, risks, and charges and expenses, and read the summary prospectus, if available, and/or the Prospectus carefully before investing or sending money. The summary prospectus, if available, and the Prospectus contain this and other information about a Fund and may be obtained from your Authorized Institution or from Goldman Sachs & Co. LLC by calling (retail – 1-800-526-7384) (institutional – 1-800-621-2550).
© 2021 Goldman Sachs. All rights reserved. 256211-OTU-1495628 EQVALAR-21
Goldman Sachs Funds

| Annual Report | August 31, 2021 | |||
Global Tax-Aware Equity Portfolios | ||||
Enhanced Dividend Global Equity Portfolio | ||||
Tax-Advantaged Global Equity Portfolio | ||||

Goldman Sachs Global Tax-Aware Equity Portfolios
| ∎ | ENHANCED DIVIDEND GLOBAL EQUITY PORTFOLIO |
| ∎ | TAX-ADVANTAGED GLOBAL EQUITY PORTFOLIO |
| 1 | ||||
| 5 | ||||
| 13 | ||||
| 14 | ||||
| 18 | ||||
| 21 | ||||
| 21 | ||||
| 25 | ||||
| 29 | ||||
| 45 | ||||
| 46 | ||||
| NOT FDIC-INSURED | May Lose Value | No Bank Guarantee | ||
MARKET REVIEW
Goldman Sachs Global Tax-Aware Equity Portfolios
| Investment Strategy |
| The Portfolios invest in a strategic mix of Underlying Funds and other securities with the goal of achieving long-term growth of capital (both Portfolios) and current income (Goldman Sachs Enhanced Dividend Global Equity Portfolio only). Under normal conditions, at least 80% of the Portfolios’ total assets measured at the time of purchase will be allocated among the Underlying Funds that currently exist or that may become available for investment in the future for which Goldman Sachs Asset Management (“GSAM”) or an affiliate, now or in the future, acts as investment adviser or principal underwriter. Some of the Underlying Funds invest primarily in fixed income or money market instruments and other Underlying Funds invest primarily in equity securities. The Portfolios may also invest directly in the Underlying Tactical Fund (as defined below) and other securities or instruments, including unaffiliated exchange-traded funds and derivatives, and can use these investments for implementing tactical tilts. Under normal circumstances, each of the Portfolios also has a small strategic allocation to U.S. investment grade corporate bonds, which is used to help fund the tactical tilts. |
During the 12 months ended August 31, 2021 (the “Reporting Period”), the performance of the financial markets were broadly influenced by the rollout of COVID-19 vaccines and spread of the Delta variant, recovering global economic growth, and monetary and fiscal stimulus by central banks and governments around the world. The global equities and fixed income markets generally produced positive returns, with global equities significantly outperforming fixed income.
Equity Markets
Global equities moved lower as the Reporting Period began in September 2020 amid a spike in COVID-19 cases around the world and increased investor uncertainty regarding the then-upcoming U.S. elections. The U.S. equity market experienced a broad-based sell-off, led by energy and technology stocks. The decline among technology stocks was fueled by concerns about stretched valuations, while there were also worries about the U.S. Congress failing to break an impasse on a fifth fiscal aid package. In Europe, equity markets were pressured by concerns about the direction of Brexit negotiations, and Japanese equities slowed on increasing U.S.-China tensions and strength in the Japanese yen. (Brexit refers to the U.K.’s exit from the European Union.) Within the emerging markets, Asia was a bright spot, although Chinese stocks declined.
During the fourth quarter of 2020, global equities rebounded, with cyclical, small-cap and value-oriented stocks generally outperforming growth-oriented names. The global equity market advanced on prospects of an end to the global COVID-19 pandemic and its weighty economic impact with the distribution of approved COVID-19 vaccines. While uncertainty surrounding the U.S. elections and other policy questions created the potential for higher market volatility, the Democrat victory for U.S. President in November proved positive for equity markets. Meanwhile, after a historically sharp but short recession in the spring of 2020, many major economies, including that of the U.S., entered an early-cycle phase of recovery. In Europe, equity markets faced some headwinds from rising COVID-19 cases and heightened lockdown restrictions, but spillover optimism from the U.S. election results provided a boost. The Japanese equity market gained, driven by global cues, particularly around COVID-19 vaccines and U.S. presidential election-related news. In the emerging markets, investor sentiment benefited from news of successful COVID-19 vaccine results, which drove strong investment inflows. However, the emergence in India of the new more contagious Delta variant then slightly dampened market sentiment and caused some countries to reinstate certain restrictions.
In the first quarter of 2021, global equity markets overcame bouts of volatility, reaching new highs during March. The advance was driven by two key themes — the accelerated rollout of COVID-19 vaccines globally and the ongoing commitment from central banks around the world to support economic recovery. Improving economic growth, normalizing inflation and rising bond yields laid the foundation for the “reflation trade,” as investors started to price in a brighter future. In the developed markets, investors took a sharp turn away from momentum stocks across the information technology, communication services, health care and consumer discretionary sectors toward cyclical sectors, such as financials, industrials, materials and energy, many of which were value-oriented. In the emerging markets, investor optimism and risk tolerance waned during the quarter as COVID-19 vaccine rollouts slowed in some countries and expectations of higher inflation and rising bond yields led to increased equity volatility in some markets.
1
MARKET REVIEW
Global equities continued to perform well during the second quarter of 2021 overall, as both COVID-19 vaccine availability and distribution continued to increase. Discussions centered on central bank liquidity tailwinds, fiscal stimulus, COVID-19 vaccine progress, economic reopening momentum, the strong corporate profit backdrop and robust investment inflows. In May, equity markets around the world had declined amid rising commodity prices, which stoked investor fears of an earlier than consensus expected rate hike from central banks, particularly the U.S. Federal Reserve (the “Fed”). However, global equities rallied in June following weaker than consensus expected U.S. payrolls data that eased concerns of a shift to tighter monetary policy and as markets anticipated an increase in inflationary pressure, driven by pent-up consumer demand and supply constraints.
Global equities were volatile in July 2021, with investors reacting to favorable second calendar quarter corporate earnings results and the spread of the Delta variant of COVID-19. In the developed markets, the focus remained on the possibility the U.S. Fed might not be as willing to let the U.S. economy run as “hot” as initially envisaged under its policy framework. Bullish narrative surrounding central bank liquidity tailwinds, excess savings from fiscal stimulus, economic reopening momentum, COVID-19 vaccine efficacy, upside corporate earnings surprises, elevated operating leverage, a corporate buyback boom and retail impulse prevailed. In the emerging markets, stocks retreated as the global spread of the Delta variant dampened economic recovery optimism and concerns grew over heightened regulation in China.
In August 2021, global equities rose slightly, supported by positive second calendar quarter corporate earnings, ongoing economic recovery and reassuring statements from the U.S. Fed. Emerging markets stocks further benefited from rising COVID-19 vaccination levels overall and declining infection rates in Asia.
Fixed Income Markets
When the Reporting Period began in September 2020, spread, or non-government bond, sectors broadly weakened amid a rise in risk-off investor sentiment, or reduced risk appetite. Renewed COVID-19 case growth in Europe, reduced prospects for further U.S. fiscal support and rising political uncertainty leading into the then-upcoming U.S. elections all contributed to increased market volatility and risk aversion. Meanwhile, the U.S. Fed kept its monetary policy and forward guidance unchanged as it awaited details on further U.S. government fiscal stimulus and the path of the COVID-19 pandemic. The Fed also extended its credit facilities, which had been set to expire in September, to the end of the 2020 calendar year, thereby elongating the policy tailwind for corporate credit markets.
Spread sector performance was mixed during the fourth quarter of 2020. Rising COVID-19 cases and renewed lockdowns dominated pandemic-related news flow early in the quarter. Then encouraging efficacy results for several COVID-19 vaccines helped lift market sentiment into the end of the calendar year. Risk sentiment was also bolstered late in the quarter by the removal of a few long-standing overhangs. Specifically, the U.S. presidential elections were resolved; the U.K. and European Union agreed to a post-Brexit deal; and another round of fiscal stimulus was provided by the U.S. federal government. Global economic conditions remained weak, with the inflation picture relatively benign due to slack in economic output and employment. Central banks around the world maintained their commitment to accommodative monetary policy. In the U.S., the Fed introduced dovish forward guidance at its December 2020 meeting, stating it would continue to increase its asset holdings “until substantial further progress has been made toward the Committee’s maximum employment and price stability goals.” (Dovish tends to suggest lower interest rates; opposite of hawkish.) Meanwhile, the U.S. Department of the Treasury decided to let several of the Fed’s emergency credit facilities expire at the end of 2020 and requested the Fed return unused funds. In Europe, the European Central Bank (“ECB”) announced a multi-pronged package of easing measures, in line with market expectations, extended the horizon for its pandemic emergency purchase program, and increased the level of its purchases.
During the first quarter of 2021, spread sector performance was largely negative. When the quarter began in January, the rollout of COVID-19 vaccines and the prospects for additional U.S. government fiscal stimulus pushed up U.S. interest rates. That said, positive COVID-19 vaccine rollout news was somewhat counteracted by the emergence of variant coronavirus strains and uncertainty over global vaccine supply. In February, the rise in interest rates became global in nature, as markets responded to recovering economic growth amid COVID-19 vaccine rollouts and concerns around upside inflation risks. To varying degrees, global central banks leaned against market expectations for earlier than previously anticipated policy normalization, indicating policy would remain accommodative, despite improvements in economic growth, given weak underlying inflation dynamics.
2
MARKET REVIEW
Although global interest rates continued to rise during March, central banks’ dovish stances helped to stabilize those rates. In the U.S., the Fed revised its economic growth and inflation projections higher but kept its median dot plot projection flat through 2023. (The dot plot shows interest rate projections of the members of the Federal Open Market Committee.) Fed policymakers also emphasized that they would focus on inflation outcomes rather than inflation outlooks. In Europe, the ECB increased the pace of its asset purchases in an effort to preserve favorable financing conditions and noted it would review the pace of purchases in the context of fresh inflation projections every quarter. Meanwhile, the new U.S. President signed the American Rescue Plan Act into law in March 2021, with the overall cost of this fifth fiscal stimulus package amounting to nearly $1.9 trillion.
For the second quarter of 2021, spread sectors broadly generated positive returns. At its April policy meeting, the U.S. Fed was upbeat as economic data continued to improve, but it did not hint at tapering its monthly purchases of U.S. Treasury securities and mortgage-backed securities, saying policymakers still needed to see “substantial progress” on employment and inflation goals. In May, remarkably strong U.S. inflation data, coupled with the release of a disappointing April U.S. jobs report, suggested that pandemic-related dynamics, such as economic reopening, policy support and temporary supply shortages, were likely to continue distorting economic data in the near term. This led to a recalibration in the market’s economic growth expectations, though the reassessment may also have reflected investors’ concerns about the spreading Delta variant and the potential of a sooner than consensus anticipated withdrawal of Fed policy support. Indeed, during June, Fed officials began to discuss when it might be appropriate to start tapering its asset purchases. The Fed’s median dot plot projection also forecast two interest rates hikes in 2023, sparking a hawkish market response that led to a flattening of the U.S. Treasury yield curve and a strengthening of the U.S. dollar. (Hawkish tends to imply higher interest rates. Yield curve is a spectrum of interest rates based on maturities of varying lengths. A flattening yield curve is one wherein the differential in yields between longer-term and shorter-term maturities narrows; opposite of a steepening yield curve.)
During July 2021, spread sector performance was rather flat, though relatively resilient, amid ongoing concerns about the spread of the Delta variant, especially in countries with low levels of COVID-19 vaccination, and its potential impact on the global economic recovery. Technical factors (i.e., supply and demand) also bolstered spread sectors. The U.S. Fed kept its monetary policy unchanged but noted the U.S. economy was “making progress” towards its price stability and employment goals. In Europe, the ECB strengthened its forward guidance, cementing its dovish policy stance for the near term.
The global economic recovery continued in August 2021 though markets remained focused on concerns around the Delta variant. The main macro event was the U.S. Fed’s Jackson Hole symposium during which Fed Chair Jerome Powell gave a dovish speech. He noted that substantial progress had been made on the Fed’s labor market mandate and reiterated the Fed’s view that an uptick in U.S. inflation was largely driven by temporary factors. These comments eased market nerves about the pace of monetary policy normalization and supported spread sectors, which recorded marginally positive performance overall during August.
Looking Ahead
At the end of the Reporting Period, we believed growth in major world economies was on an improving, though no longer accelerating, path. Overall, in our view, the global economic recovery was supported by the continued accommodative policy environment along with healthy corporate balance sheets and relaxation of some COVID-19-related restrictions as more people became vaccinated. However, we thought supply chain bottlenecks, the waning effects of global fiscal stimulus and the diminishing benefits of consumers’ previously pent-up spending demand could dampen economic growth in near term. In addition, we noted a slower services sector recovery due to the spread of the Delta variant, particularly in low-vaccination economies, and the potential for a moderate increase in COVID-19-induced restrictions later in 2021.
In our opinion, the evolution of the COVID-19 pandemic and the recovery of the global economy, the latter of which being affected by supply chain issues and the strength of labor markets, are likely to be the greatest influences on spread sector performance through year-end 2021. The Delta variant has demonstrated that vaccination is not a panacea, though a higher vaccination rate could support further relaxation of COVID-19 restrictions. As for the supply chain, we believed many of those challenging issues were likely to self-correct, over time, through high demand and rising prices. Higher wages could also attract more workers, in our view. Finally, enhanced U.S. unemployment benefits and the U.K.’s furlough scheme were scheduled to expire in September 2021. At the end of the Reporting Period, we believed these expirations would boost job growth in the near term, as long as the spread of the Delta variant was contained, though we were mindful of near-term labor market frictions.
3
MARKET REVIEW
We thought the increase in inflation in major advanced economies during the Reporting Period reflected price rises in a narrow set of categories related to pandemic or policy distortions, many of which we thought would subside in the coming months. Medium-term inflation indicators, such as spare capacity in the labor market as well as market and survey-based inflation expectations, broadly pointed to contained inflation, in our view. However, we planned to be watchful for strength in cyclical inflation components, such as rents, and the persistence of supply chain issues.
As for global monetary policy, we intended to monitor central banks closely as policymakers seek to balance their inflation objectives with their efforts to support an economic recovery. At the end of the Reporting Period, developed markets’ central banks remained broadly accommodative, holding monetary policy rates at or near all-time lows. We anticipated they would likely focus first on unwinding quantitative easing measures, with interest rate hikes coming further down the road. In our view, the U.S. Fed was likely to announce in November 2021 its plans to taper asset purchases, assuming there were no substantial downside data surprises. ECB officials have also hinted at a reduced pace of quantitative easing, given improving financing conditions in the Eurozone and stronger inflation. Meanwhile, in the emerging markets, we expected Chinese and Asian central banks to stay accommodative in support of economic growth, while interest rate hiking cycles were already underway for central banks with a focus on inflation, such as Russia, Brazil, the Czech Republic and Chile.
4
PORTFOLIO RESULTS
Goldman Sachs Enhanced Dividend
Global Equity Portfolio
Investment Objective
The Portfolio seeks long-term growth of capital and current income.
Portfolio Management Discussion and Analysis
Below, the Goldman Sachs Quantitative Investment Strategies Team discusses the Goldman Sachs Enhanced Dividend Global Equity Portfolio’s (the “Portfolio”) performance and positioning for the 12-month period ended August 31, 2021 (the “Reporting Period”).
| Q | How did the Portfolio perform during the Reporting Period? |
| A | During the Reporting Period, the Portfolio’s Class A, Institutional, Class R6 and Class P Shares generated average annual total returns, without sales charges, of 25.64%, 26.05%, 26.03% and 26.05%, respectively. These returns compare to the 26.85% average annual total return of the Portfolio’s blended benchmark, the Enhanced Dividend Global Equity Composite Index (“EDGE Composite Index”), over the same time period. The components of the EDGE Composite Index — the MSCI All Country World Index (ACWI) Investable Market Index (“MSCI ACWI IMI”) (90%) and the Bloomberg U.S. Aggregate Bond Index (10%) — returned 25.92% and -0.08%, respectively, during the Reporting Period. |
| Q | What key factors affected the Portfolio’s performance during the Reporting Period? |
| A | During the Reporting Period, the overall performance of the Underlying Funds detracted from the Portfolio’s returns versus the EDGE Composite Index. On the positive side, the Portfolio’s strategic weightings and our tactical asset allocation decisions (“tactical tilts”) added to relative performance. (The strategic weightings are based upon Goldman Sachs Investment Strategy Group’s (“ISG”) assumptions regarding long-term expected returns, expected volatilities and expected correlations as well as the investments views of Goldman Sachs ISG.) |
| Q | How were the Portfolio’s tactical asset allocation decisions managed during the Reporting Period? |
| A | In keeping with our investment process, we implement tactical tilts, based on Goldman Sachs ISG’s views about near-term expected market returns, in an attempt to enhance performance. These tactical tilts are implemented through an investment in the Goldman Sachs Tactical Tilt Overlay Fund (the “Underlying Tactical Fund”), which seeks long-term total return through the implementation of investment ideas that are generally derived from short-term or medium-term market views on a variety of asset classes and instruments. As mentioned previously, the Portfolio’s tactical tilts contributed positively to its performance during the Reporting Period. |
| Q | How did the Portfolio’s Underlying Funds perform relative to their respective benchmark indices during the Reporting Period? |
| A | To implement strategic weightings and our tactical tilts, the Portfolio invests in 10 Underlying Funds. Nine of these Underlying Funds may be used to implement strategic weightings (“Underlying Strategic Funds”). The Underlying Tactical Fund, as mentioned previously, is used to implement tactical tilts. |
During the Reporting Period, the Portfolio was invested in eight of the nine Underlying Strategic Funds, five of which underperformed their respective benchmark indices. (The Portfolio did not have an allocation to the Goldman Sachs Core Fixed Income Fund during the Reporting Period.) |
Two of the Underlying Strategic Funds that underperformed in relative terms — the Goldman Sachs U.S. Equity Dividend and Premium Fund and the Goldman Sachs International Equity Dividend and Premium Fund — are those in which the Portfolio invested a significant percentage of its equity allocation. The other Underlying Strategic Funds that underperformed their respective benchmark indices during the Reporting Period were the Goldman Sachs MLP Energy Infrastructure Fund, the Goldman Sachs Global Infrastructure Fund and the Goldman Sachs Real Estate Securities Fund. |
The Goldman Sachs Emerging Equity Insights Fund, the Goldman Sachs Small Cap Equity Insights Fund and the |
5
PORTFOLIO RESULTS
| Goldman Sachs International Small Cap Insights Fund outperformed their respective benchmark indices during the Reporting Period. |
The Portfolio’s Underlying Tactical Fund outperformed its cash benchmark index1 by 9.43%2 during the Reporting Period. |
| Q | How did call writing affect performance? |
| A | As mentioned above, the Portfolio’s two largest allocations were to the Goldman Sachs U.S. Equity Dividend and Premium Fund and the Goldman Sachs International Equity Dividend and Premium Fund, which earn premiums through an equity index call writing strategy. When equity markets are down, flat or modestly positive, these Underlying Strategic Funds tend to outperform their respective benchmark indices because of the premiums they earn from call writing. When equity markets rally strongly, these two Underlying Strategic Funds are likely to trail their respective benchmark indices. Although the Underlying Strategic Funds keep the premiums they earn from call writing, they can underperform when the call options are exercised. |
During the Reporting Period, the call writing strategies of the Goldman Sachs U.S. Equity Dividend and Premium Fund and the Goldman Sachs International Equity Dividend and Premium Fund detracted from their performance, as the U.S. and international equity markets generated gains. |
| Q | How did the Portfolio use derivatives and similar instruments during the Reporting Period? |
| A | During the Reporting Period, the Portfolio employed S&P 500® Index futures as part of its strategic weightings in U.S. large-cap growth stocks and U.S. large-cap value stocks, which had a positive impact on performance. The Portfolio also utilized forward foreign currency exchange contracts to take positions in the British pound, euro, Australian dollar, Swiss franc and Japanese yen. These currency hedging positions added to the Portfolio’s performance during the Reporting Period. |
In addition, some of the Portfolio’s Underlying Funds, including the Portfolio’s Underlying Tactical Fund, used derivatives during the Reporting Period to apply their active investment views with greater versatility or to afford greater risk management precision. As market conditions warranted during the Reporting Period, some of these Underlying Funds engaged in forward foreign currency exchange contracts, financial futures contracts, options and swap contracts to enhance portfolio return and for hedging purposes. |
| Q | What changes did you make during the Reporting Period within the Portfolio? |
| A | No significant changes were made within the Portfolio during the Reporting Period. |
| Q | What was the Portfolio’s strategy at the end of the Reporting Period? |
| A | Going forward, we plan to maintain a diversified equity portfolio that implements our strategic and tactical views as we continue to seek long-term growth of capital and current income. |
6
| 1 | ICE BofA 3-Month U.S. Treasury Bill Index (the “Index”). The Index is an unmanaged market index of U.S. Treasury securities maturing in 90 days that assumes reinvestment of all income. |
| 2 | Performance quoted is for Institutional Shares. |
PORTFOLIO BASICS
Enhanced Dividend Global Equity Portfolio
as of August 31, 2021
| OVERALL UNDERLYING FUND WEIGHTINGS1,2 | ||||
| Percentage of Net Assets | ||||
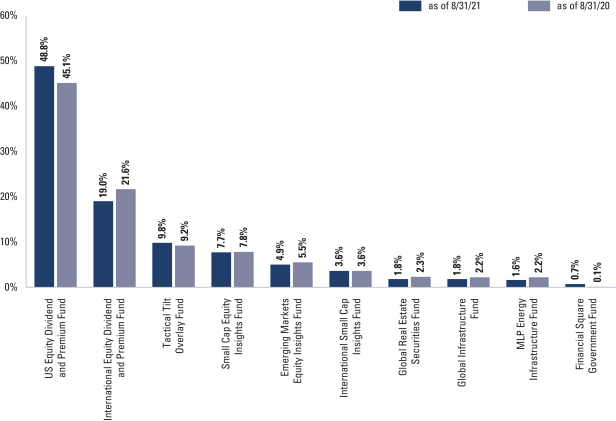
| 1 | The Portfolio is actively managed and, as such, its composition may differ over time. The percentage shown for each Underlying Fund reflects the value of that Underlying Fund as a percentage of net assets of the Portfolio. Figures in the graph above may not sum to 100% due to rounding and/or exclusion of other assets and liabilities. The above graph depicts the Portfolio’s investments but may not represent the Portfolio’s market exposure due to the exclusion of certain derivatives, if any, as listed in the Additional Investment Information section of the Schedule of Investments. |
| 2 | Represents affiliated funds. |
For more information about the Portfolio, please refer to www.GSAMFUNDS.com. There, you can learn more about the Portfolio’s investment strategies, holdings, and performance.
7
GOLDMAN SACHS ENHANCED DIVIDEND GLOBAL EQUITY PORTFOLIO
Performance Summary
August 31, 2021
The following graph shows the value, as of August 31, 2021, of a $1,000,000 investment made on September 1, 2011 in Institutional Shares at NAV. For comparative purposes, the performance of the Portfolio’s benchmark the Enhanced Dividend Global Equity Composite Index (“EDGE Composite Index”), which is comprised of 10% of the Bloomberg Barclays U.S. Aggregate Bond Index, and 90% of the Morgan Stanley Capital International (MSCI) All Country World Index (ACWI) Investable Market Index (IMI) (“MSCI ACWI IMI”) (Net, USD, Unhedged), is shown. Performance reflects applicable fee waivers and/or expense limitations currently in effect and in their absence, performance would be reduced. Returns do not reflect the deduction of taxes that a shareholder would pay on Portfolio distributions or the redemption of Portfolio shares. The returns set forth below represent past performance. Past performance does not guarantee future results. The Portfolio’s investment return and principal value will fluctuate so that an investor’s shares, when redeemed, may be worth more or less than their original cost. Current performance may be lower or higher than the performance quoted below. Please visit our web site at www.GSAMFUNDS.com to obtain the most recent month-end returns.
| Enhanced Dividend Global Equity Portfolio’s 10 Year Performance |
Performance of a $1,000,000 Investment, including any applicable sales charges, with distributions reinvested, from September 1, 2011 through August 31, 2021.
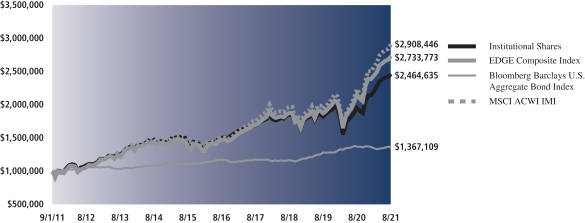
| Average Annual Total Return through August 31, 2021* | One Year | Five Years | Ten Years | Since Inception | ||||||||||
Class A | ||||||||||||||
Excluding sales charges | 25.64% | 10.00% | 9.01% | — | ||||||||||
Including sales charges | 18.77% | 8.76% | 8.39% | — | ||||||||||
| ||||||||||||||
Institutional | 26.05% | 10.42% | 9.43% | — | ||||||||||
| ||||||||||||||
Class R6 (Commenced December 29, 2017) | 26.03% | N/A | N/A | 9.08% | ||||||||||
| ||||||||||||||
Class P (Commenced April 17, 2018) | 26.05% | N/A | N/A | 9.75% | ||||||||||
| ||||||||||||||
| * | These returns assume reinvestment of all distributions at NAV and reflect a maximum initial sales charge of 5.50% for Class A Shares. Because Institutional, Class R6 and Class P Shares do not involve a sales charge, such a charge is not applied to their Average Annual Total Return. |
8
PORTFOLIO RESULTS
Goldman Sachs Tax-Advantaged
Global Equity Portfolio
Investment Objective
The Portfolio seeks long-term growth of capital.
Portfolio Management Discussion and Analysis
Below, the Goldman Sachs Quantitative Investment Strategies Team discusses the Goldman Sachs Tax-Advantaged Global Equity Portfolio’s (the “Portfolio”) performance and positioning for the 12-month period ended August 31, 2021 (the “Reporting Period”).
| Q | How did the Portfolio perform during the Reporting Period? |
| A | During the Reporting Period, the Portfolio’s Class A, Institutional, Class R6 and Class P Shares generated average annual total returns, without sales charges, of 28.29%, 28.81%, 28.84% and 28.87%, respectively. These returns compare to the 26.85% average annual total return of the Portfolio’s blended benchmark, the Tax-Advantaged Global Equity Composite Index (“TAG Composite Index”), over the same time period. The components of the TAG Composite Index — the MSCI All Country World Index (ACWI) Investable Market Index (“MSCI ACWI IMI”) (90%) and the Bloomberg U.S. Aggregate Bond Index (10%) — returned 25.92% and -0.08%, respectively, during the Reporting Period. |
| Q | What key factors affected the Portfolio’s performance during the Reporting Period? |
| A | During the Reporting Period, the Portfolio’s strategic weightings added to its performance versus the TAG Composite Index. (The strategic weightings are based upon Goldman Sachs Investment Strategy Group’s (“ISG”) assumptions regarding long-term expected returns, expected volatilities and expected correlations as well as the investments views of Goldman Sachs ISG.) Our tactical asset allocation decisions (“tactical tilts”) also contributed positively to the Portfolio’s relative returns. The overall performance of the Underlying Funds detracted from relative performance during the Reporting Period. |
| Q | How were the Portfolio’s tactical asset allocation decisions managed during the Reporting Period? |
| A | In keeping with our investment process, we implement tactical tilts, based on Goldman Sachs ISG’s views about near-term expected market returns, in an attempt to enhance performance. These tactical tilts are implemented through an |
investment in the Goldman Sachs Tactical Tilt Overlay Fund (the “Underlying Tactical Fund”), which seeks long-term total return through the implementation of investment ideas that are generally derived from short-term or medium-term market views on a variety of asset classes and instruments. As mentioned previously, the Portfolio’s tactical tilts added to performance during the Reporting Period. |
| Q | How did the Portfolio’s Underlying Funds perform relative to their respective benchmark indices during the Reporting Period? |
| A | To implement strategic weightings and our tactical tilts, the Portfolio invests in nine Underlying Funds. Eight of these Underlying Funds may be used to implement strategic asset allocation decisions (“Underlying Strategic Funds”). The Underlying Tactical Fund, as mentioned previously, is used to implement tactical tilts. |
| During the Reporting Period, the Portfolio was invested in seven of the eight Underlying Strategic Funds, four of which underperformed their respective benchmark indices. (The Portfolio did not have an allocation to the Goldman Sachs Core Fixed Income Fund during the Reporting Period.) |
| The Goldman Sachs MLP Energy Infrastructure Fund, the Goldman Sachs Global Infrastructure Fund and the Goldman Sachs Global Real Estate Securities Fund underperformed their respective benchmark indices during the Reporting Period. In addition, the Goldman Sachs U.S. Tax-Managed Equity Fund, one of the two Underlying Strategic Funds in which the Portfolio held its largest weightings, slightly underperformed its benchmark index during the Reporting Period. |
| The Goldman Sachs International Tax-Managed Equity Fund — the other Underlying Strategic Fund in which the Portfolio held its largest weightings — outperformed its benchmark index. The Goldman Sachs Emerging Markets |
9
PORTFOLIO RESULTS
Equity Insights Fund and the Goldman Sachs International Small Cap Insights Fund also outperformed their respective benchmark indices during the Reporting Period. |
| The Portfolio’s Underlying Tactical Fund outperformed its cash benchmark index1 by 9.43%2 during the Reporting Period. |
| Q | How did the Portfolio use derivatives and similar instruments during the Reporting Period? |
| A | During the Reporting Period, the Portfolio employed S&P 500® Index futures as part of its strategic weightings in U.S. large-cap growth stocks and U.S. large-cap value stocks, which had a positive impact on performance. The Portfolio also utilized forward foreign currency exchange contracts to take positions in the British pound, euro, Australian dollar, Swiss franc and Japanese yen. These currency hedging positions added to the Portfolio’s performance during the Reporting Period. |
| In addition, some of the Portfolio’s Underlying Funds, including the Portfolio’s Underlying Tactical Fund, used derivatives during the Reporting Period to apply their active investment views with greater versatility or to afford greater risk management precision. As market conditions warranted during the Reporting Period, some of these Underlying Funds engaged in forward foreign currency exchange contracts, financial futures contracts, options and swap contracts to enhance portfolio return and for hedging purposes. |
| Q | What changes did you make during the Reporting Period within the Portfolio? |
| A | No significant changes were made within the Portfolio during the Reporting Period. |
| Q | What was the Portfolio’s strategy at the end of the Reporting Period? |
| A | Going forward, we plan to maintain a diversified equity portfolio that implements our strategic and tactical views as we continue to seek long-term growth of capital. |
| 1 | ICE BofA 3-Month U.S. Treasury Bill Index (the “Index”). The Index is an unmanaged market index of U.S. Treasury securities maturing in 90 days that assumes reinvestment of all income. |
| 2 | Performance quoted is for Institutional Shares. |
10
PORTFOLIO BASICS
Tax-Advantaged Global Equity Portfolio
as of August 31, 2021
| OVERALL UNDERLYING FUND WEIGHTINGS1,2 | ||||
| Percentage of Net Assets | ||||
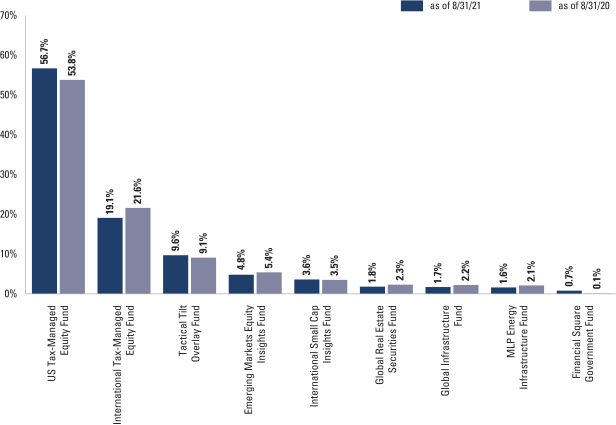
| 1 | The Portfolio is actively managed and, as such, its composition may differ over time. The percentage shown for each Underlying Fund reflects the value of that Underlying Fund as a percentage of net assets of the Portfolio. Figures in the graph above may not sum to 100% due to rounding and/or exclusion of other assets and liabilities. The above graph depicts the Portfolio’s investments but may not represent the Portfolio’s market exposure due to the exclusion of certain derivatives, if any, as listed in the Additional Investment Information section of the Schedule of Investments. |
| 2 | Represents affiliated funds. |
For more information about the Portfolio, please refer to www.GSAMFUNDS.com. There, you can learn more about the Portfolio’s investment strategies, holdings, and performance.
11
GOLDMAN SACHS TAX-ADVANTAGED GLOBAL EQUITY PORTFOLIO
Performance Summary
August 31, 2021
The following graph shows the value, as of August 31, 2021, of a $1,000,000 investment made on September 1, 2011 in Institutional Shares at NAV. For comparative purposes, the performance of the Portfolio’s benchmark the Goldman Sachs Tax-Advantaged Global Composite Index (“TAG Composite Index”), which is comprised of 10% of the Bloomberg Barclays U.S. Aggregate Bond Index, and 90% of the Morgan Stanley Capital International (MSCI) All Country World Index (ACWI) Investable Market Index (IMI) (“MSCI ACWI IMI”) (Net, USD, Unhedged), is shown. Performance reflects applicable fee waivers and/or expense limitations currently in effect and in their absence, performance would be reduced. Returns do not reflect the deduction of taxes that a shareholder would pay on Portfolio distributions or the redemption of Portfolio shares. The returns set forth below represent past performance. Past performance does not guarantee future results. The Portfolio’s investment return and principal value will fluctuate so that an investor’s shares, when redeemed, may be worth more or less than their original cost. Current performance may be lower or higher than the performance quoted below. Please visit our web site at www.GSAMFUNDS.com to obtain the most recent month-end returns.
| Tax-Advantaged Global Equity Portfolio’s 10 Year Performance |
Performance of a $1,000,000 Investment, including any applicable sales charges, with distributions reinvested, from September 1, 2011 through August 31, 2021.
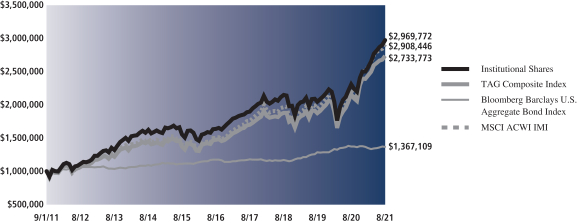
| Average Annual Total Return through August 31, 2021* | One Year | Five Years | Ten Years | Since Inception | ||||||||||
Class A | ||||||||||||||
Excluding sales charges | 28.29% | 12.21% | 11.05% | — | ||||||||||
Including sales charges | 21.22% | 10.95% | 10.43% | — | ||||||||||
| ||||||||||||||
Institutional | 28.81% | 12.66% | 11.49% | — | ||||||||||
| ||||||||||||||
Class R6 (Commenced December 29, 2017) | 28.84% | N/A | N/A | 10.88% | ||||||||||
| ||||||||||||||
Class P (Commenced April 17, 2018) | 28.87% | N/A | N/A | 11.39% | ||||||||||
| ||||||||||||||
| * | These returns assume reinvestment of all distributions at NAV and reflect a maximum initial sales charge of 5.50% for Class A Shares. Because Institutional, Class R6 and Class P Shares do not involve a sales charge, such a charge is not applied to their Average Annual Total Return. |
12
GOLDMAN SACHS GLOBAL TAX-AWARE EQUITY PORTFOLIOS
S&P 500® Index is a U.S. stock market index based on the market capitalizations of 500 large companies having common stock listed on the New York Stock Exchange or NASDAQ. The S&P 500® Index components and their weightings are determined by S&P Dow Jones Indices.
The EDGE Composite Index (“EDGE Composite”) is a composite representation prepared by the investment adviser of the performance of the Portfolio’s asset classes weighted according to their respective weightings in the Portfolio’s target range.
The EDGE Composite is comprised of MSCI ACWI IMI (90%) and the Bloomberg Barclays U.S. Aggregate Bond Index (10%).
The EDGE Composite figures do not reflect any deduction for fees, expenses or taxes.
The TAG Composite Index (“TAG Composite”) is a composite representation prepared by the investment adviser of the performance of the Portfolio’s asset classes weighted according to their respective weightings in the Portfolio’s target range.
The TAG Composite is comprised of the MSCI ACWI IMI (90%) and the Bloomberg Barclays U.S. Aggregate Bond Index (10%).
The TAG Composite figures do not reflect any deduction for fees, expenses or taxes.
The Bloomberg Barclays U.S. Aggregate Bond Index represents an unmanaged diversified portfolio of fixed income securities, including U.S. Treasuries, investment grade corporate bonds and mortgage backed and asset-backed securities.
The MSCI ACWI IMI captures large, mid and small cap representation across 23 developed markets and 26 emerging markets.
With 9,226 constituents, the MSCI ACWI IMI is comprehensive, covering approximately 99% of the global equity investment opportunity set. As of August 31, 2020, the 23 developed markets in the MSCI ACWI IMI include Australia, Austria, Belgium, Canada, Denmark, Finland, France, Germany, Hong Kong, Ireland, Israel, Italy, Japan, Netherlands, New Zealand, Norway, Portugal, Singapore, Spain, Sweden, Switzerland, the UK and the US The 26 emerging markets include Argentina, Brazil, Chile, China, Colombia, Czech Republic, Egypt, Greece, Hungary, India, Indonesia, Korea, Malaysia, Mexico, Pakistan, Peru, Philippines, Poland, Qatar, Russia, Saudi Arabia, South Africa, Taiwan, Thailand, Turkey and United Arab Emirates
It is not possible to invest directly in an unmanaged index.
13
GOLDMAN SACHS ENHANCED DIVIDEND GLOBAL EQUITY PORTFOLIO
August 31, 2021
| Shares | Description | Value | ||||||
| Underlying Funds (Class R6 Shares)(a) – 99.1% | ||||||||
| Equity – 99.1% | ||||||||
| 14,454,207 | Goldman Sachs US Equity Dividend and Premium Fund | $ | 238,205,328 | |||||
| 12,308,691 | Goldman Sachs International Equity Dividend and Premium Fund | 92,684,445 | ||||||
| 4,616,385 | Goldman Sachs Tactical Tilt Overlay Fund | 47,687,260 | ||||||
| 1,036,638 | Goldman Sachs Small Cap Equity Insights Fund | 37,609,230 | ||||||
| 1,910,210 | Goldman Sachs Emerging Markets Equity Insights Fund | 24,106,846 | ||||||
| 1,183,285 | Goldman Sachs International Small Cap Insights Fund | 17,701,945 | ||||||
| 705,997 | Goldman Sachs Global Real Estate Securities Fund | 8,768,488 | ||||||
| 656,584 | Goldman Sachs Global Infrastructure Fund | 8,686,612 | ||||||
| 341,479 | Goldman Sachs MLP Energy Infrastructure Fund | 7,888,167 | ||||||
|
| |||||||
| TOTAL UNDERLYING FUNDS (CLASS R6 SHARES) | ||||||||
| (Cost $309,727,414) | $ | 483,338,321 | ||||||
|
| |||||||
| Shares | Dividend Rate | Value | ||||||
| Investment Company(a) – 0.7% | ||||||||
| | Goldman Sachs Financial Square Government Fund – | | ||||||
| 3,321,545 | 0.026% | $ | 3,321,545 | |||||
| (Cost $3,321,545) | ||||||||
|
| |||||||
| TOTAL INVESTMENTS – 99.8% | ||||||||
| (Cost $313,048,959) | $ | 486,659,866 | ||||||
|
| |||||||
| | OTHER ASSETS IN EXCESS OF LIABILITIES – 0.2% | 1,159,837 | ||||||
|
| |||||||
| NET ASSETS – 100.0% | $ | 487,819,703 | ||||||
|
| |||||||
| The percentage shown for each investment and investment category reflects the value of the respective investment or category as a percentage of net assets. | ||
(a) | Represents an Affiliated Issuer. | |
| ||||
Currency Abbreviations: | ||||
AUD | —Australian Dollar | |||
CHF | —Swiss Franc | |||
EUR | —Euro | |||
GBP | —British Pound | |||
JPY | —Japanese Yen | |||
USD | —United States Dollar | |||
| ||||
| ADDITIONAL INVESTMENT INFORMATION |
FORWARD FOREIGN CURRENCY EXCHANGE CONTRACTS — At August 31, 2021, the Portfolio had the following forward foreign currency exchange contracts:
FORWARD FOREIGN CURRENCY EXCHANGE CONTRACTS WITH UNREALIZED GAIN
| Counterparty | Currency Purchased | Currency Sold | Settlement Date | Unrealized Gain | ||||||||||||||||
Morgan Stanley Co., Inc. | JPY | 30,000,000 | USD | 270,167 | 09/15/2021 | $ | 2,553 | |||||||||||||
| USD | 4,040,012 | AUD | 5,249,962 | 09/15/2021 | 199,094 | |||||||||||||||
| USD | 5,027,084 | CHF | 4,510,844 | 09/15/2021 | 99,562 | |||||||||||||||
| USD | 18,843,915 | EUR | 15,464,225 | 09/15/2021 | 579,790 | |||||||||||||||
| USD | 8,126,736 | GBP | 5,739,415 | 09/15/2021 | 235,637 | |||||||||||||||
| USD | 13,146,080 | JPY | 1,442,272,100 | 09/15/2021 | 34,876 | |||||||||||||||
| TOTAL |
| $ | 1,151,512 | |||||||||||||||||
FORWARD FOREIGN CURRENCY EXCHANGE CONTRACTS WITH UNREALIZED LOSS
| Counterparty | Currency Purchased | Currency Sold | Settlement Date | Unrealized Loss | ||||||||||||||||
Morgan Stanley Co., Inc. | USD | 508,583 | CHF | 470,000 | 09/15/2021 | $ | (4,832 | ) | ||||||||||||
| 14 | The accompanying notes are an integral part of these financial statements. |
GOLDMAN SACHS ENHANCED DIVIDEND GLOBAL EQUITY PORTFOLIO
| ADDITIONAL INVESTMENT INFORMATION (continued) |
FUTURES CONTRACTS — At August 31, 2021, the Portfolio had the following futures contracts:
| Description | Number of Contracts | Expiration Date | Notional Amount | Unrealized Appreciation/ (Depreciation) | ||||||||||||
Long position contracts: | ||||||||||||||||
S&P 500 E-Mini Index | 23 | 09/17/2021 | $ | 5,198,575 | $ | 326,298 | ||||||||||
| The accompanying notes are an integral part of these financial statements. | 15 |
GOLDMAN SACHS TAX-ADVANTAGED GLOBAL EQUITY PORTFOLIO
Schedule of Investments
August 31, 2021
| Shares | Description | Value | ||||||
| Underlying Funds (Class R6 Shares)(a) – 99.0% | ||||||||
| Equity – 99.0% | ||||||||
| 55,277,711 | Goldman Sachs US Tax-Managed Equity Fund | $ | 2,056,883,627 | |||||
| 54,640,201 | Goldman Sachs International Tax-Managed Equity Fund | 693,930,551 | ||||||
| 33,861,888 | Goldman Sachs Tactical Tilt Overlay Fund | 349,793,299 | ||||||
| 13,892,892 | Goldman Sachs Emerging Markets Equity Insights Fund | 175,328,302 | ||||||
| 8,673,853 | Goldman Sachs International Small Cap Insights Fund | 129,760,845 | ||||||
| 5,223,960 | Goldman Sachs Global Real Estate Securities Fund | 64,881,581 | ||||||
| 4,693,980 | Goldman Sachs Global Infrastructure Fund | 62,101,355 | ||||||
| 2,505,005 | Goldman Sachs MLP Energy Infrastructure Fund | 57,865,617 | ||||||
|
| |||||||
| TOTAL UNDERLYING FUNDS (CLASS R6 SHARES) | ||||||||
| (Cost $1,907,118,852) | $ | 3,590,545,177 | ||||||
|
| |||||||
| Shares | Dividend Rate | Value | ||||||
| Investment Company(a) – 0.7% | ||||||||
| | Goldman Sachs Financial Square Government Fund – | | ||||||
| 26,923,612 | 0.026% | $ | 26,923,612 | |||||
| (Cost $26,923,612) | ||||||||
|
| |||||||
| TOTAL INVESTMENTS – 99.7% | ||||||||
| (Cost $1,934,042,464) | $ | 3,617,468,789 | ||||||
|
| |||||||
| | OTHER ASSETS IN EXCESS OF LIABILITIES – 0.3% | 11,830,709 | ||||||
|
| |||||||
| NET ASSETS – 100.0% | $ | 3,629,299,498 | ||||||
|
| |||||||
| The percentage shown for each investment and investment category reflects the value of the respective investment or category as a percentage of net assets. | ||
(a) | Represents an Affiliated Issuer. | |
| ||||
Currency Abbreviations: | ||||
AUD | —Australian Dollar | |||
CHF | —Swiss Franc | |||
EUR | —Euro | |||
GBP | —British Pound | |||
JPY | —Japanese Yen | |||
USD | —United States Dollar | |||
| ||||
| ADDITIONAL INVESTMENT INFORMATION |
FORWARD FOREIGN CURRENCY EXCHANGE CONTRACTS — At August 31, 2021, the Portfolio had the following forward foreign currency exchange contracts:
FORWARD FOREIGN CURRENCY EXCHANGE CONTRACTS WITH UNREALIZED GAIN
| Counterparty | Currency Purchased | Currency Sold | Settlement Date | Unrealized Gain | ||||||||||||||||
Morgan Stanley Co., Inc. | USD | 29,000,498 | AUD | 37,554,774 | 09/15/2021 | $ | 1,525,098 | |||||||||||||
| USD | 34,933,425 | CHF | 31,332,984 | 09/15/2021 | 706,135 | |||||||||||||||
| USD | 134,941,488 | EUR | 110,703,958 | 09/15/2021 | 4,193,855 | |||||||||||||||
| USD | 58,092,185 | GBP | 41,061,169 | 09/15/2021 | 1,637,343 | |||||||||||||||
| USD | 91,858,169 | JPY | 10,063,154,282 | 09/15/2021 | 377,465 | |||||||||||||||
| TOTAL | $ | 8,439,896 | ||||||||||||||||||
FORWARD FOREIGN CURRENCY EXCHANGE CONTRACTS WITH UNREALIZED LOSS
| Counterparty | Currency Purchased | Currency Sold | Settlement Date | Unrealized Loss | ||||||||||||||||
Morgan Stanley Co., Inc. | USD | 4,717,916 | CHF | 4,360,000 | 09/15/2021 | $ | (44,828 | ) | ||||||||||||
| 16 | The accompanying notes are an integral part of these financial statements. |
GOLDMAN SACHS TAX-ADVANTAGED GLOBAL EQUITY PORTFOLIO
| ADDITIONAL INVESTMENT INFORMATION (continued) |
FUTURES CONTRACTS — At August 31, 2021, the Portfolio had the following futures contracts:
| Description | Number of Contracts | Expiration Date | Notional Amount | Unrealized Appreciation/ (Depreciation) | ||||||||||||
Long position contracts: | ||||||||||||||||
S&P 500 E-Mini Index | 166 | 09/17/2021 | $ | 37,520,150 | $ | 2,355,023 | ||||||||||
| The accompanying notes are an integral part of these financial statements. | 17 |
GOLDMAN SACHS GLOBAL TAX-AWARE EQUITY PORTFOLIOS
Statements of Assets and Liabilities
August 31, 2021
| Enhanced Dividend Global Equity Portfolio | Tax-Advantaged Global Equity Portfolio | |||||||||
| Assets: | ||||||||||
Investments in affiliated Underlying Funds, at value (cost $313,048,959 and $1,934,042,464) | $ | 486,659,866 | $ | 3,617,468,789 | ||||||
Cash | 365,747 | 2,752,477 | ||||||||
Foreign currencies, at value (cost $0 and $187,346) | — | 188,480 | ||||||||
Receivables: | ||||||||||
Portfolio shares sold | 400,845 | 915,965 | ||||||||
Collateral on certain derivative contracts(a) | 300,950 | 2,109,900 | ||||||||
Dividends | 122,067 | 895,431 | ||||||||
Investments sold | 37,308 | 279,934 | ||||||||
Reimbursement from investment adviser | 33,257 | 29,997 | ||||||||
Foreign tax reclaims | — | 2,914 | ||||||||
Unrealized gain on forward foreign currency exchange contracts | 1,151,512 | 8,439,896 | ||||||||
Other assets | 39,363 | 57,421 | ||||||||
| Total assets | 489,110,915 | 3,633,141,204 | ||||||||
| Liabilities: | ||||||||||
Variation margin on futures | 5,401 | 39,007 | ||||||||
Unrealized loss on forward foreign currency exchange contracts | 4,832 | 44,828 | ||||||||
Payables: | ||||||||||
Portfolio shares redeemed | 694,200 | 526,666 | ||||||||
Collateral on certain derivative contracts(a) | 350,000 | 2,600,000 | ||||||||
Management fees | 32,814 | 242,588 | ||||||||
Distribution and Service fees and Transfer Agency fees | 13,661 | 91,441 | ||||||||
Accrued expenses | 190,304 | 297,176 | ||||||||
| Total liabilities | 1,291,212 | 3,841,706 | ||||||||
| Net Assets: | ||||||||||
Paid-in capital | 313,702,999 | 2,011,339,198 | ||||||||
Total distributable earnings (loss) | 174,116,704 | 1,617,960,300 | ||||||||
| NET ASSETS | $ | 487,819,703 | $ | 3,629,299,498 | ||||||
Net Assets: | ||||||||||
Class A | $ | 3,800,610 | $ | 605,944 | ||||||
Institutional | 13,637,534 | 33,151,247 | ||||||||
Class R6 | 13,764 | 9,971,275 | ||||||||
Class P | 470,367,795 | 3,585,571,032 | ||||||||
Total Net Assets | $ | 487,819,703 | $ | 3,629,299,498 | ||||||
Shares outstanding $0.001 par value (unlimited shares authorized): | ||||||||||
Class A | 261,456 | 27,755 | ||||||||
Institutional | 927,354 | 1,505,006 | ||||||||
Class R6 | 938 | 458,820 | ||||||||
Class P | 32,068,675 | 164,959,291 | ||||||||
Net asset value, offering and redemption price per share:(b) | ||||||||||
Class A | $14.54 | $21.83 | ||||||||
Institutional | 14.71 | 22.03 | ||||||||
Class R6 | 14.68 | (c) | 21.73 | |||||||
Class P | 14.67 | 21.74 | ||||||||
| (a) | Segregated for initial margin and/or collateral on transactions as follows: |
| Portfolio | Forwards | Futures | ||||||
Enhanced Dividend Global Equity | $ | (350,000 | ) | $ | 300,950 | |||
Tax-Advantaged Global Equity | (2,600,000 | ) | 2,109,900 | |||||
| (b) | Maximum public offering price per share for Class A Shares of the Enhanced Dividend Global Equity and Tax-Advantaged Global Equity Portfolios is $15.39 and $23.10, respectively. |
| (c) | Net asset value may not recalculate due to rounding of fractional shares. |
| 18 | The accompanying notes are an integral part of these financial statements. |
GOLDMAN SACHS GLOBAL TAX-AWARE EQUITY PORTFOLIOS
Statements of Operations
For the Fiscal Year Ended August 31, 2021
| Enhanced Dividend Global Equity Portfolio | Tax-Advantaged Global Equity Portfolio | |||||||||
| Investment income: | ||||||||||
Dividends from affiliated Underlying Funds | $ | 9,597,004 | $ | 40,985,699 | ||||||
Dividends — unaffiliated issuers (net of foreign taxes withheld of $0 and $7,949) | — | 53,836 | ||||||||
| Total investment income | 9,597,004 | 41,039,535 | ||||||||
| Expenses: | ||||||||||
Management fees | 705,955 | 4,710,112 | ||||||||
Transfer Agency fees(a) | 147,970 | 945,827 | ||||||||
Professional fees | 107,164 | 109,312 | ||||||||
Custody, accounting and administrative services | 101,433 | 333,625 | ||||||||
Registration fees | 56,811 | 80,104 | ||||||||
Printing and mailing costs | 46,040 | 75,206 | ||||||||
Trustee fees | 19,811 | 23,835 | ||||||||
Distribution and Service (12b–1) fees | 10,227 | 1,329 | ||||||||
Other | 13,862 | 44,579 | ||||||||
| Total expenses | 1,209,273 | 6,323,929 | ||||||||
Less — expense reductions | (607,679 | ) | (2,424,641 | ) | ||||||
| Net expenses | 601,594 | 3,899,288 | ||||||||
| NET INVESTMENT INCOME | 8,995,410 | 37,140,247 | ||||||||
| Realized and unrealized gain (loss): | ||||||||||
Net realized gain (loss) from: | ||||||||||
Investments in affiliated Underlying Funds | 17,618,631 | 26,675,620 | ||||||||
Investments — unaffiliated issuers | 150 | 675,479 | ||||||||
Futures contracts | 1,650,175 | 10,353,626 | ||||||||
Forward foreign currency exchange contracts | (2,688,024 | ) | (16,391,066 | ) | ||||||
Foreign currency transactions | — | (4,966 | ) | |||||||
Capital gain distributions from affiliated Underlying Funds | 10,816,766 | 149,649 | ||||||||
Net change in unrealized gain (loss) on: | ||||||||||
Investments in affiliated Underlying Funds | 69,223,089 | 720,041,738 | ||||||||
Futures contracts | (362,543 | ) | (1,588,000 | ) | ||||||
Forward foreign currency exchange contracts | 3,688,759 | 22,920,184 | ||||||||
Foreign currency translation | — | (8,150 | ) | |||||||
| Net realized and unrealized gain | 99,947,003 | 762,824,114 | ||||||||
| NET INCREASE IN NET ASSETS RESULTING FROM OPERATIONS | $ | 108,942,413 | $ | 799,964,361 | ||||||
| (a) | Class specific Transfer Agency fees were as follows: |
| Transfer Agency Fees | ||||||||||||||||
Portfolio | Class A | Institutional | Class R6 | Class P | ||||||||||||
Enhanced Dividend Global Equity | $ | 6,545 | $ | 5,848 | $ | 4 | $ | 135,573 | ||||||||
Tax-Advantaged Global Equity | 851 | 12,490 | 2,392 | 930,094 | ||||||||||||
| The accompanying notes are an integral part of these financial statements. | 19 |
GOLDMAN SACHS GLOBAL TAX-AWARE EQUITY PORTFOLIOS
Statements of Changes in Net Assets
| Enhanced Dividend Global Equity Portfolio | Tax-Advantaged Global Equity Portfolio | |||||||||||||||||||||
| For the Fiscal Year Ended August 31, 2021 | For the Fiscal Year Ended August 31, 2020 | For the Fiscal Year Ended August 31, 2021 | For the Fiscal Year Ended August 31, 2020 | |||||||||||||||||||
| From operations: | ||||||||||||||||||||||
Net investment income | $ | 8,995,410 | $ | 10,251,549 | $ | 37,140,247 | $ | 35,565,081 | ||||||||||||||
Net realized gain (loss) | 27,397,698 | 1,167,191 | 21,458,342 | (26,849,863 | ) | |||||||||||||||||
Net change in unrealized gain | 72,549,305 | 5,865,666 | 741,365,772 | 278,676,219 | ||||||||||||||||||
| Net increase in net assets resulting from operations | 108,942,413 | 17,284,406 | 799,964,361 | 287,391,437 | ||||||||||||||||||
| Distributions to shareholders: | ||||||||||||||||||||||
From distributable earnings: | ||||||||||||||||||||||
Class A Shares | (64,411 | ) | (311,665 | ) | (4,264 | ) | (4,637 | ) | ||||||||||||||
Institutional Shares | (277,955 | ) | (1,087,162 | ) | (336,299 | ) | (648,419 | ) | ||||||||||||||
Class R6 Shares | (237 | ) | (476 | ) | (103,968 | ) | (158 | ) | ||||||||||||||
Class P Shares | (8,888,953 | ) | (25,246,149 | ) | (34,570,994 | ) | (42,914,283 | ) | ||||||||||||||
Return of capital | ||||||||||||||||||||||
Class A Shares | — | (8,162 | ) | — | — | |||||||||||||||||
Institutional Shares | — | (26,731 | ) | — | — | |||||||||||||||||
Class R6 Shares | — | (12 | ) | — | — | |||||||||||||||||
Class P Shares | — | (613,732 | ) | — | — | |||||||||||||||||
| Total distributions to shareholders | (9,231,556 | ) | (27,294,089 | ) | (35,015,525 | ) | (43,567,497 | ) | ||||||||||||||
| From share transactions: | ||||||||||||||||||||||
Proceeds from sales of shares | 38,842,005 | 26,713,852 | 339,367,529 | 307,373,807 | ||||||||||||||||||
Reinvestment of distributions | 9,207,895 | 26,879,858 | 34,861,505 | 43,449,706 | ||||||||||||||||||
Cost of shares redeemed | (124,107,392 | ) | (187,103,975 | ) | (255,063,368 | ) | (636,876,111 | ) | ||||||||||||||
| Net increase (decrease) in net assets resulting from share transactions | (76,057,492 | ) | (133,510,265 | ) | 119,165,666 | (286,052,598 | ) | |||||||||||||||
| TOTAL INCREASE (DECREASE) | 23,653,365 | (143,519,948 | ) | 884,114,502 | (42,228,658 | ) | ||||||||||||||||
| Net Assets: | ||||||||||||||||||||||
Beginning of year | 464,166,338 | 607,686,286 | 2,745,184,996 | 2,787,413,654 | ||||||||||||||||||
End of year | $ | 487,819,703 | $ | 464,166,338 | $ | 3,629,299,498 | $ | 2,745,184,996 | ||||||||||||||
| 20 | The accompanying notes are an integral part of these financial statements. |
GOLDMAN SACHS ENHANCED DIVIDEND GLOBAL EQUITY PORTFOLIO
Selected Data for a Share Outstanding Throughout Each Year
| (a) | Calculated based on the average shares outstanding methodology. |
| (b) | Recognition of net investment income by the Portfolio is affected by the timing of declaration of dividends by the Underlying Funds in which the Portfolio invests. |
| (c) | Assumes investment at the net asset value at the beginning of the year, reinvestment of all distributions, a complete redemption of the investment at the net asset value at the end of the year and no sales or redemption charges (if any). Total returns would be reduced if a sales or redemption charge was taken into account. Returns do not reflect the impact of taxes to shareholders relating to Portfolio distributions or the redemption of Portfolio shares. |
| (d) | Expense ratios exclude the expenses of the Underlying Funds in which the Portfolio invests. |
| (e) | The portfolio turnover rate is calculated in accordance with regulatory requirements, without regard to transactions involving short term investments and certain derivatives. If such transactions were included, the portfolio turnover rate may be higher. |
| The accompanying notes are an integral part of these financial statements. | 21 |
GOLDMAN SACHS ENHANCED DIVIDEND GLOBAL EQUITY PORTFOLIO
Financial Highlights (continued)
Selected Data for a Share Outstanding Throughout Each Year
| Goldman Sachs Enhanced Dividend Global Equity Portfolio | ||||||||||||||||||||||
| Institutional Shares | ||||||||||||||||||||||
| Year Ended August 31, | ||||||||||||||||||||||
| 2021 | 2020 | 2019 | 2018 | 2017 | ||||||||||||||||||
| Per Share Data | ||||||||||||||||||||||
Net asset value, beginning of year | $ | 11.90 | $ | 11.63 | $ | 12.48 | $ | 11.80 | $ | 10.76 | ||||||||||||
Net investment income(a)(b) | 0.25 | 0.22 | 0.23 | 0.17 | 0.22 | |||||||||||||||||
Net realized and unrealized gain (loss) | 2.81 | 0.59 | (0.44 | ) | 0.93 | 1.12 | ||||||||||||||||
Total from investment operations | 3.06 | 0.81 | (0.21 | ) | 1.10 | 1.34 | ||||||||||||||||
Distributions to shareholders from net investment income | (0.25 | ) | (0.26 | ) | (0.32 | ) | (0.28 | ) | (0.23 | ) | ||||||||||||
Distributions to shareholders from net realized gains | — | (0.27 | ) | (0.32 | ) | (0.14 | ) | (0.07 | ) | |||||||||||||
Distributions to shareholders from return of capital | — | (0.01 | ) | — | — | — | ||||||||||||||||
Total distributions | (0.25 | ) | (0.54 | ) | (0.64 | ) | (0.42 | ) | (0.30 | ) | ||||||||||||
Net asset value, end of year | $ | 14.71 | $ | 11.90 | $ | 11.63 | $ | 12.48 | $ | 11.80 | ||||||||||||
| Total return(c) | 26.05 | % | 7.17 | % | (1.46 | )% | 9.45 | % | 12.66 | % | ||||||||||||
Net assets, end of year (in 000s) | $ | 13,638 | $ | 19,695 | $ | 25,244 | $ | 33,490 | $ | 637,000 | ||||||||||||
Ratio of net expenses to average net assets(d) | 0.13 | % | 0.13 | % | 0.13 | % | 0.13 | % | 0.13 | % | ||||||||||||
Ratio of total expenses to average net assets(d) | 0.26 | % | 0.26 | % | 0.26 | % | 0.23 | % | 0.24 | % | ||||||||||||
Ratio of net investment income to average net assets(b) | 1.87 | % | 1.90 | % | 2.00 | % | 1.43 | % | 1.93 | % | ||||||||||||
Portfolio turnover rate(e) | 16 | % | 13 | % | 15 | % | 20 | % | 8 | % | ||||||||||||
| (a) | Calculated based on the average shares outstanding methodology. |
| (b) | Recognition of net investment income by the Portfolio is affected by the timing of declaration of dividends by the Underlying Funds in which the Portfolio invests. |
| (c) | Assumes investment at the net asset value at the beginning of the year, reinvestment of all distributions, a complete redemption of the investment at the net asset value at the end of the year and no sales or redemption charges (if any). Total returns would be reduced if a sales or redemption charge was taken into account. Returns do not reflect the impact of taxes to shareholders relating to Portfolio distributions or the redemption of Portfolio shares. |
| (d) | Expense ratios exclude the expenses of the Underlying Funds in which the Portfolio invests. |
| (e) | The portfolio turnover rate is calculated in accordance with regulatory requirements, without regard to transactions involving short term investments and certain derivatives. If such transactions were included, the portfolio turnover rate may be higher. |
| 22 | The accompanying notes are an integral part of these financial statements. |
GOLDMAN SACHS ENHANCED DIVIDEND GLOBAL EQUITY PORTFOLIO
Financial Highlights (continued)
Selected Data for a Share Outstanding Throughout Each Period
| Goldman Sachs Enhanced Dividend Global Equity Portfolio | ||||||||||||||||||||||
| Class R6 Shares | ||||||||||||||||||||||
| Year Ended August 31, | December 29, 2017*
| |||||||||||||||||||||
| 2021 | 2020 | 2019 | ||||||||||||||||||||
| Per Share Data | ||||||||||||||||||||||
Net asset value, beginning of period | $ | 11.88 | $ | 11.60 | $ | 12.46 | $ | 12.17 | ||||||||||||||
Net investment income(a)(b) | 0.25 | 0.21 | 0.23 | 0.10 | ||||||||||||||||||
Net realized and unrealized gain (loss) | 2.81 | 0.61 | (0.45 | ) | 0.31 | |||||||||||||||||
Total from investment operations | 3.06 | 0.82 | (0.22 | ) | 0.41 | |||||||||||||||||
Distributions to shareholders from net investment income | (0.26 | ) | (0.26 | ) | (0.32 | ) | (0.12 | ) | ||||||||||||||
Distributions to shareholders from net realized gains | — | (0.27 | ) | (0.32 | ) | — | ||||||||||||||||
Distributions to shareholders from return of capital | — | (0.01 | ) | — | — | |||||||||||||||||
Total distributions | (0.26 | ) | (0.54 | ) | (0.64 | ) | (0.12 | ) | ||||||||||||||
Net asset value, end of period | $ | 14.68 | $ | 11.88 | $ | 11.60 | $ | 12.46 | ||||||||||||||
| Total return(c) | 26.03 | % | 7.28 | % | (1.54 | )% | 3.39 | % | ||||||||||||||
Net assets, end of period (in 000s) | $ | 14 | $ | 11 | $ | 10 | $ | 10 | ||||||||||||||
Ratio of net expenses to average net assets(d) | 0.13 | % | 0.12 | % | 0.12 | % | 0.12 | %(e) | ||||||||||||||
Ratio of total expenses to average net assets(d) | 0.23 | % | 0.22 | % | 0.23 | % | 0.18 | %(e) | ||||||||||||||
Ratio of net investment income to average net assets(b) | 1.86 | % | 1.87 | % | 2.01 | % | 1.27 | %(e) | ||||||||||||||
Portfolio turnover rate(f) | 16 | % | 13 | % | 15 | % | 20 | % | ||||||||||||||
| * | Commencement of operations. |
| (a) | Calculated based on the average shares outstanding methodology. |
| (b) | Recognition of net investment income by the Portfolio is affected by the timing of declaration of dividends by the Underlying Funds in which the Portfolio invests. |
| (c) | Assumes investment at the net asset value at the beginning of the period, reinvestment of all distributions, a complete redemption of the investment at the net asset value at the end of the period and no sales or redemption charges (if any). Total returns would be reduced if a sales or redemption charge was taken into account. Returns do not reflect the impact of taxes to shareholders relating to Portfolio distributions or the redemption of Portfolio shares. Total returns for periods less than one full year are not annualized. |
| (d) | Expense ratios exclude the expenses of the Underlying Funds in which the Portfolio invests. |
| (e) | Annualized. |
| (f) | The portfolio turnover rate is calculated in accordance with regulatory requirements, without regard to transactions involving short term investments and certain derivatives. If such transactions were included, the portfolio turnover rate may be higher. |
| The accompanying notes are an integral part of these financial statements. | 23 |
GOLDMAN SACHS ENHANCED DIVIDEND GLOBAL EQUITY PORTFOLIO
Financial Highlights (continued)
Selected Data for a Share Outstanding Throughout Each Period
| Goldman Sachs Enhanced Dividend Global Equity Portfolio | ||||||||||||||||||||||
| Class P Shares | ||||||||||||||||||||||
| Year Ended August 31, | April 17, 2018*
| |||||||||||||||||||||
| 2021 | 2020 | 2019 | ||||||||||||||||||||
| Per Share Data | ||||||||||||||||||||||
Net asset value, beginning of period | $ | 11.87 | $ | 11.60 | $ | 12.45 | $ | 12.18 | ||||||||||||||
Net investment income(a)(b) | 0.25 | 0.22 | 0.23 | 0.11 | ||||||||||||||||||
Net realized and unrealized gain (loss) | 2.81 | 0.59 | (0.44 | ) | 0.23 | |||||||||||||||||
Total from investment operations | 3.06 | 0.81 | (0.21 | ) | 0.34 | |||||||||||||||||
Distributions to shareholders from net investment income | (0.26 | ) | (0.26 | ) | (0.32 | ) | (0.07 | ) | ||||||||||||||
Distributions to shareholders from net realized gains | — | (0.27 | ) | (0.32 | ) | — | ||||||||||||||||
Distributions to shareholders from return of capital | — | (0.01 | ) | — | — | |||||||||||||||||
Total distributions | (0.26 | ) | (0.54 | ) | (0.64 | ) | (0.07 | ) | ||||||||||||||
Net asset value, end of period | $ | 14.67 | $ | 11.87 | $ | 11.60 | $ | 12.45 | ||||||||||||||
| Total return(c) | 26.05 | % | 7.20 | % | (1.45 | )% | 2.80 | % | ||||||||||||||
Net assets, end of period (in 000s) | $ | 470,368 | $ | 438,960 | $ | 573,771 | $ | 636,733 | ||||||||||||||
Ratio of net expenses to average net assets(d) | 0.12 | % | 0.12 | % | 0.12 | % | 0.13 | %(e) | ||||||||||||||
Ratio of total expenses to average net assets(d) | 0.25 | % | 0.25 | % | 0.25 | % | 0.25 | %(e) | ||||||||||||||
Ratio of net investment income to average net assets(b) | 1.91 | % | 1.92 | % | 2.02 | % | 2.48 | %(e) | ||||||||||||||
Portfolio turnover rate(f) | 16 | % | 13 | % | 15 | % | 20 | % | ||||||||||||||
| * | Commencement of operations. |
| (a) | Calculated based on the average shares outstanding methodology. |
| (b) | Recognition of net investment income by the Portfolio is affected by the timing of declaration of dividends by the Underlying Funds in which the Portfolio invests. |
| (c) | Assumes investment at the net asset value at the beginning of the period, reinvestment of all distributions, a complete redemption of the investment at the net asset value at the end of the period and no sales or redemption charges (if any). Total returns would be reduced if a sales or redemption charge was taken into account. Returns do not reflect the impact of taxes to shareholders relating to Portfolio distributions or the redemption of Portfolio shares. Total returns for periods less than one full year are not annualized. |
| (d) | Expense ratios exclude the expenses of the Underlying Funds in which the Portfolio invests. |
| (e) | Annualized. |
| (f) | The portfolio turnover rate is calculated in accordance with regulatory requirements, without regard to transactions involving short term investments and certain derivatives. If such transactions were included, the portfolio turnover rate may be higher. |
| 24 | The accompanying notes are an integral part of these financial statements. |
GOLDMAN SACHS TAX-ADVANTAGED GLOBAL EQUITY PORTFOLIO
Financial Highlights (continued)
Selected Data for a Share Outstanding Throughout Each Year
| (a) | Calculated based on the average shares outstanding methodology. |
| (b) | Recognition of net investment income by the Portfolio is affected by the timing of declaration of dividends by the Underlying Funds in which the Portfolio invests. |
| (c) | Assumes investment at the net asset value at the beginning of the year, reinvestment of all distributions, a complete redemption of the investment at the net asset value at the end of the year and no sales or redemption charges (if any). Total returns would be reduced if a sales or redemption charge was taken into account. Returns do not reflect the impact of taxes to shareholders relating to Portfolio distributions or the redemption of Portfolio shares. |
| (d) | Expense ratios exclude the expenses of the Underlying Funds in which the Portfolio invests. |
| (e) | The portfolio turnover rate is calculated in accordance with regulatory requirements, without regard to transactions involving short term investments and certain derivatives. If such transactions were included, the portfolio turnover rate may be higher. |
| The accompanying notes are an integral part of these financial statements. | 25 |
GOLDMAN SACHS TAX-ADVANTAGED GLOBAL EQUITY PORTFOLIO
Financial Highlights (continued)
Selected Data for a Share Outstanding Throughout Each Year
| Goldman Sachs Tax-Advantaged Global Equity Portfolio | ||||||||||||||||||||||
| Institutional Shares | ||||||||||||||||||||||
| Year Ended August 31, | ||||||||||||||||||||||
| 2021 | 2020 | 2019 | 2018 | 2017 | ||||||||||||||||||
| Per Share Data | ||||||||||||||||||||||
Net asset value, beginning of year | $ | 17.30 | $ | 15.58 | $ | 16.46 | $ | 14.72 | $ | 12.86 | ||||||||||||
Net investment income(a)(b) | 0.23 | 0.22 | 0.20 | 0.17 | 0.17 | |||||||||||||||||
Net realized and unrealized gain (loss) | 4.71 | 1.74 | (0.96 | ) | 1.78 | 1.84 | ||||||||||||||||
Total from investment operations | 4.94 | 1.96 | (0.76 | ) | 1.95 | 2.01 | ||||||||||||||||
Distributions to shareholders from net investment income | (0.21 | ) | (0.20 | ) | (0.02 | ) | (0.21 | ) | (0.15 | ) | ||||||||||||
Distributions to shareholders from net realized gains | — | (0.04 | ) | (0.10 | ) | — | — | |||||||||||||||
Total distributions | (0.21 | ) | (0.24 | ) | (0.12 | ) | (0.21 | ) | (0.15 | ) | ||||||||||||
Net asset value, end of year | $ | 22.03 | $ | 17.30 | $ | 15.58 | $ | 16.46 | $ | 14.72 | ||||||||||||
| Total return(c) | 28.81 | % | 12.60 | % | (4.61 | )% | 13.32 | % | 15.74 | % | ||||||||||||
Net assets, end of year (in 000s) | $ | 33,151 | $ | 33,800 | $ | 43,565 | $ | 62,718 | $ | 2,207,827 | ||||||||||||
Ratio of net expenses to average net assets(d) | 0.13 | % | 0.13 | % | 0.13 | % | 0.13 | % | 0.13 | % | ||||||||||||
Ratio of total expenses to average net assets(d) | 0.21 | % | 0.21 | % | 0.22 | % | 0.21 | % | 0.21 | % | ||||||||||||
Ratio of net investment income to average net assets(b) | 1.17 | % | 1.41 | % | 1.28 | % | 1.06 | % | 1.26 | % | ||||||||||||
Portfolio turnover rate(e) | 16 | % | 12 | % | 14 | % | 17 | % | 8 | % | ||||||||||||
| (a) | Calculated based on the average shares outstanding methodology. |
| (b) | Recognition of net investment income by the Portfolio is affected by the timing of declaration of dividends by the Underlying Funds in which the Portfolio invests. |
| (c) | Assumes investment at the net asset value at the beginning of the year, reinvestment of all distributions, a complete redemption of the investment at the net asset value at the end of the year and no sales or redemption charges (if any). Total returns would be reduced if a sales or redemption charge was taken into account. Returns do not reflect the impact of taxes to shareholders relating to Portfolio distributions or the redemption of Portfolio shares. |
| (d) | Expense ratios exclude the expenses of the Underlying Funds in which the Portfolio invests. |
| (e) | The portfolio turnover rate is calculated in accordance with regulatory requirements, without regard to transactions involving short term investments and certain derivatives. If such transactions were included, the portfolio turnover rate may be higher. |
| 26 | The accompanying notes are an integral part of these financial statements. |
GOLDMAN SACHS TAX-ADVANTAGED GLOBAL EQUITY PORTFOLIO
Financial Highlights (continued)
Selected Data for a Share Outstanding Throughout Each Period
| Goldman Sachs Tax-Advantaged Global Equity Portfolio | ||||||||||||||||||||||
| Class R6 Shares | ||||||||||||||||||||||
| Year Ended August 31, | December 29, 2017*
| |||||||||||||||||||||
| 2021 | 2020 | 2019 | ||||||||||||||||||||
| Per Share Data | ||||||||||||||||||||||
Net asset value, beginning of period | $ | 17.07 | $ | 15.38 | $ | 16.46 | $ | 15.59 | ||||||||||||||
Net investment income (loss)(a)(b) | 0.26 | 0.20 | 0.19 | (0.01 | ) | |||||||||||||||||
Net realized and unrealized gain (loss) | 4.62 | 1.73 | (0.97 | ) | 0.88 | |||||||||||||||||
Total from investment operations | 4.88 | 1.93 | (0.78 | ) | 0.87 | |||||||||||||||||
Distributions to shareholders from net investment income | (0.22 | ) | (0.20 | ) | (0.20 | ) | — | |||||||||||||||
Distributions to shareholders from net realized gains | — | (0.04 | ) | (0.10 | ) | — | ||||||||||||||||
Total distributions | (0.22 | ) | (0.24 | ) | (0.30 | ) | — | |||||||||||||||
Net asset value, end of period | $ | 21.73 | $ | 17.07 | $ | 15.38 | $ | 16.46 | ||||||||||||||
| Total return(c) | 28.84 | % | 12.58 | % | (4.57 | )% | 5.58 | % | ||||||||||||||
Net assets, end of period (in 000s) | $ | 9,971 | $ | 11 | $ | 10 | $ | 11 | ||||||||||||||
Ratio of net expenses to average net assets(d) | 0.12 | % | 0.12 | % | 0.12 | % | 0.12 | %(e) | ||||||||||||||
Ratio of total expenses to average net assets(d) | 0.20 | % | 0.18 | % | 0.19 | % | 0.18 | %(e) | ||||||||||||||
Ratio of net investment income (loss) to average net assets(b) | 1.36 | % | 1.25 | % | 1.22 | % | (0.05 | )%(e) | ||||||||||||||
Portfolio turnover rate(f) | 16 | % | 12 | % | 14 | % | 17 | % | ||||||||||||||
| * | Commencement of operations. |
| (a) | Calculated based on the average shares outstanding methodology. |
| (b) | Recognition of net investment income by the Portfolio is affected by the timing of declaration of dividends by the Underlying Funds in which the Portfolio invests. |
| (c) | Assumes investment at the net asset value at the beginning of the period, reinvestment of all distributions, a complete redemption of the investment at the net asset value at the end of the period and no sales or redemption charges (if any). Total returns would be reduced if a sales or redemption charge was taken into account. Returns do not reflect the impact of taxes to shareholders relating to Portfolio distributions or the redemption of Portfolio shares. Total returns for periods less than one full year are not annualized. |
| (d) | Expense ratios exclude the expenses of the Underlying Funds in which the Portfolio invests. |
| (e) | Annualized. |
| (f) | The portfolio turnover rate is calculated in accordance with regulatory requirements, without regard to transactions involving short term investments and certain derivatives. If such transactions were included, the portfolio turnover rate may be higher. |
| The accompanying notes are an integral part of these financial statements. | 27 |
GOLDMAN SACHS TAX-ADVANTAGED GLOBAL EQUITY PORTFOLIO
Financial Highlights (continued)
Selected Data for a Share Outstanding Throughout Each Period
| Goldman Sachs Tax-Advantaged Global Equity Portfolio | ||||||||||||||||||||||
| Class P Shares | ||||||||||||||||||||||
| Year Ended August 31, | April 17, 2018*
| |||||||||||||||||||||
| 2021 | 2020 | 2019 | ||||||||||||||||||||
| Per Share Data | ||||||||||||||||||||||
Net asset value, beginning of period | $ | 17.07 | $ | 15.38 | $ | 16.47 | $ | 15.84 | ||||||||||||||
Net investment income(a)(b) | 0.23 | 0.20 | 0.19 | 0.01 | ||||||||||||||||||
Net realized and unrealized gain (loss) | 4.66 | 1.74 | (0.98 | ) | 0.62 | |||||||||||||||||
Total from investment operations | 4.89 | 1.94 | (0.79 | ) | 0.63 | |||||||||||||||||
Distributions to shareholders from net investment income | (0.22 | ) | (0.21 | ) | (0.20 | ) | — | |||||||||||||||
Distributions to shareholders from net realized gains | — | (0.04 | ) | (0.10 | ) | — | ||||||||||||||||
Total distributions | (0.22 | ) | (0.25 | ) | (0.30 | ) | — | |||||||||||||||
Net asset value, end of period | $ | 21.74 | $ | 17.07 | $ | 15.38 | $ | 16.47 | ||||||||||||||
| Total return(c) | 28.87 | % | 12.59 | % | (4.60 | )% | 3.98 | % | ||||||||||||||
Net assets, end of period (in 000s) | $ | 3,585,571 | $ | 2,710,904 | $ | 2,743,392 | $ | 2,797,271 | ||||||||||||||
Ratio of net expenses to average net assets(d) | 0.12 | % | 0.12 | % | 0.12 | % | 0.12 | %(e) | ||||||||||||||
Ratio of total expenses to average net assets(d) | 0.20 | % | 0.20 | % | 0.21 | % | 0.20 | %(e) | ||||||||||||||
Ratio of net investment income to average net assets(b) | 1.18 | % | 1.30 | % | 1.21 | % | 0.15 | %(e) | ||||||||||||||
Portfolio turnover rate(f) | 16 | % | 12 | % | 14 | % | 17 | % | ||||||||||||||
| * | Commencement of operations. |
| (a) | Calculated based on the average shares outstanding methodology. |
| (b) | Recognition of net investment income by the Portfolio is affected by the timing of declaration of dividends by the Underlying Funds in which the Portfolio invests. |
| (c) | Assumes investment at the net asset value at the beginning of the period, reinvestment of all distributions, a complete redemption of the investment at the net asset value at the end of the period and no sales or redemption charges (if any). Total returns would be reduced if a sales or redemption charge was taken into account. Returns do not reflect the impact of taxes to shareholders relating to Portfolio distributions or the redemption of Portfolio shares. Total returns for periods less than one full year are not annualized. |
| (d) | Expense ratios exclude the expenses of the Underlying Funds in which the Portfolio invests. |
| (e) | Annualized. |
| (f) | The portfolio turnover rate is calculated in accordance with regulatory requirements, without regard to transactions involving short term investments and certain derivatives. If such transactions were included, the portfolio turnover rate may be higher. |
| 28 | The accompanying notes are an integral part of these financial statements. |
GOLDMAN SACHS GLOBAL TAX-AWARE EQUITY PORTFOLIOS
August 31, 2021
| 1. ORGANIZATION |
Goldman Sachs Trust (the “Trust”) is a Delaware statutory trust registered under the Investment Company Act of 1940, as amended (the “Act”), as an open-end management investment company. The following table lists those series of the Trust that are included in this report (collectively, the “Portfolios” or individually a “Portfolio”), along with their corresponding share classes and respective diversification status under the Act:
| Portfolio | Share Classes Offered | Diversified/ Non-diversified | ||
Enhanced Dividend Global Equity and Tax-Advantaged Global Equity | A, Institutional, R6 and P | Diversified |
Class A Shares are sold with a front-end sales charge of up to 5.50%. Institutional, Class R6 and Class P Shares are not subject to a sales charge.
Goldman Sachs Asset Management, L.P. (“GSAM”), an affiliate of Goldman Sachs & Co. LLC (“Goldman Sachs”), serves as investment adviser to the Portfolios pursuant to a management agreement (the “Agreement”) with the Trust.
The Portfolios are expected to invest primarily in a combination of domestic and international equity and fixed income underlying funds (“Underlying Funds”) which are registered under the Act, for which GSAM acts as the investment adviser. Additionally, these Portfolios may invest a portion of their assets directly in other securities and instruments, including unaffiliated exchange traded funds.
| 2. SIGNIFICANT ACCOUNTING POLICIES |
The financial statements have been prepared in accordance with accounting principles generally accepted in the United States of America (“GAAP”) and require management to make estimates and assumptions that may affect the reported amounts and disclosures. Actual results may differ from those estimates and assumptions. Each Portfolio is an investment company under GAAP and follows the accounting and reporting guidance applicable to investment companies.
A. Investment Valuation — The valuation policy of the Portfolios and Underlying Funds is to value investments at fair value.
B. Investment Income and Investments — Investment income includes interest income, dividend income, and securities lending income, if any. Interest income is accrued daily and adjusted for amortization of premiums and accretion of discounts. Dividend income is recognized on ex-dividend date or, for certain foreign securities, as soon as such information is obtained subsequent to the ex-dividend date. Non-cash dividends, if any, are recorded at the fair market value of the securities received. Investment transactions are reflected on trade date. Realized gains and losses are calculated using identified cost. Investment transactions are recorded on the following business day for daily net asset value (“NAV”) calculations. Distributions from master limited partnerships (“MLPs”) are generally recorded based on the characterization reported on the MLP’s tax return. The Goldman Sachs MLP Energy Infrastructure Fund (the “Underlying MLP Fund”) records its pro-rata share of the income/loss and capital gains/losses, allocated from the underlying partnerships and adjusts the cost basis of the underlying partnerships accordingly. Income distributions are recognized as capital gains or income in the financial statements in accordance with the character that is distributed.
For derivative contracts, realized gains and losses are recorded upon settlement of the contract.
C. Class Allocations and Expenses — Investment income, realized and unrealized gain (loss), if any, and non-class specific expenses of each Portfolio are allocated daily based upon the proportion of net assets of each class. Non-class specific expenses directly incurred by a Portfolio are charged to that Portfolio, while such expenses incurred by the Trust are allocated across the applicable Portfolios on a straight-line and/or pro-rata basis depending upon the nature of the expenses. Class specific expenses, where applicable, are borne by the respective share classes and include Distribution and Service and Transfer Agency fees. Expenses included in the accompanying financial statements reflect the expenses of each Portfolio and do not include any expenses associated with the Underlying Funds. Because the Underlying Funds have varied expense and fee levels and the Portfolios may
29
GOLDMAN SACHS GLOBAL TAX-AWARE EQUITY PORTFOLIOS
Notes to Financial Statements (continued)
August 31, 2021
| 2. SIGNIFICANT ACCOUNTING POLICIES (continued) |
own different proportions of the Underlying Funds at different times, the amount of fees and expenses incurred indirectly by each Portfolio will vary.
D. Federal Taxes and Distributions to Shareholders — It is each Portfolio’s policy to comply with the requirements of the Internal Revenue Code of 1986, as amended (the “Code”), applicable to regulated investment companies and to distribute each year substantially all of its investment company taxable income and capital gains to its shareholders. Accordingly, each Portfolio is not required to make any provisions for the payment of federal income tax. Distributions to shareholders are recorded on the ex-dividend date. Income and capital gains distributions, if any, are declared and paid according to the following schedule:
| Portfolio | Income Distributions Declared/Paid | Capital Gains Distributions Declared/Paid | ||||
Enhanced Dividend Global Equity | Quarterly | Annually | ||||
Tax-Advantaged Global Equity | Annually | Annually |
Net capital losses, if any, are carried forward to future fiscal years and may be used to the extent allowed by the Code to offset any future capital gains. Losses that are carried forward will retain their character as either short-term or long-term capital losses. Utilization of capital loss carryforwards will reduce the requirement of future capital gains distributions.
The characterization of distributions to shareholders for financial reporting purposes is determined in accordance with federal income tax rules, which may differ from GAAP. The source of each Portfolio’s distributions may be shown in the accompanying financial statements as either from distributable earnings or capital. Certain components of the Portfolios’ net assets on the Statements of Assets and Liabilities reflect permanent GAAP/tax differences based on the appropriate tax character.
E. Foreign Currency Translation — The accounting records and reporting currency of a Portfolio are maintained in United States (“U.S.”) dollars. Assets and liabilities denominated in foreign currencies are translated into U.S. dollars using the current exchange rates at the close of each business day. The effect of changes in foreign currency exchange rates on investments is included within net realized and unrealized gain (loss) on investments. Changes in the value of other assets and liabilities as a result of fluctuations in foreign exchange rates are included in the Statements of Operations within net change in unrealized gain (loss) on foreign currency translation. Transactions denominated in foreign currencies are translated into U.S. dollars on the date the transaction occurred, the effects of which are included within net realized gain (loss) on foreign currency transactions.
| 3. INVESTMENTS AND FAIR VALUE MEASUREMENTS |
U.S. GAAP defines the fair value of a financial instrument as the amount that would be received to sell an asset or paid to transfer a liability in an orderly transaction between market participants at the measurement date (i.e., the exit price); the Portfolios’ policy is to use the market approach. GAAP establishes a fair value hierarchy that prioritizes the inputs to valuation techniques used to measure fair value. The hierarchy gives the highest priority to unadjusted quoted prices in active markets for identical assets or liabilities (Level 1 measurements) and the lowest priority to unobservable inputs (Level 3 measurements). The level in the fair value hierarchy within which the fair value measurement in its entirety falls shall be determined based on the lowest level input that is significant to the fair value measurement in its entirety. The levels used for classifying investments are not necessarily an indication of the risk associated with investing in these investments. The three levels of the fair value hierarchy are described below:
Level 1 — Unadjusted quoted prices in active markets that are accessible at the measurement date for identical, unrestricted assets or liabilities;
Level 2 — Quoted prices in markets that are not active or financial instruments for which significant inputs are observable (including, but not limited to, quoted prices for similar investments, interest rates, foreign exchange rates, volatility and credit spreads), either directly or indirectly;
30
GOLDMAN SACHS GLOBAL TAX-AWARE EQUITY PORTFOLIOS
| 3. INVESTMENTS AND FAIR VALUE MEASUREMENTS (continued) |
Level 3 — Prices or valuations that require significant unobservable inputs (including GSAM’s assumptions in determining fair value measurement).
The Board of Trustees (“Trustees”) has approved Valuation Procedures that govern the valuation of the portfolio investments held by the Portfolios, including investments for which market quotations are not readily available. The Trustees have delegated to GSAM day-to-day responsibility for implementing and maintaining internal controls and procedures related to the valuation of the Portfolios’ investments. To assess the continuing appropriateness of pricing sources and methodologies, GSAM regularly performs price verification procedures and issues challenges as necessary to third party pricing vendors or brokers, and any differences are reviewed in accordance with the Valuation Procedures.
A. Level 1 and Level 2 Fair Value Investments — The valuation techniques and significant inputs used in determining the fair values for investments classified as Level 1 and Level 2 are as follows:
Equity Securities — Equity securities traded on a U.S. securities exchange or the NASDAQ system, or those located on certain foreign exchanges, including but not limited to the Americas, are valued daily at their last sale price or official closing price on the principal exchange or system on which they are traded. If there is no sale or official closing price or such price is believed by GSAM to not represent fair value, equity securities will be valued at the valid closing bid price for long positions and at the valid closing ask price for short positions (i.e. where there is sufficient volume, during normal exchange trading hours). If no valid bid/ask price is available, the equity security will be valued pursuant to the Valuation Procedures approved by the Trustees and consistent with applicable regulatory guidance. To the extent these investments are actively traded, they are classified as Level 1 of the fair value hierarchy, otherwise they are generally classified as Level 2. Certain equity securities containing unique attributes may be classified as Level 2.
Unlisted equity securities for which market quotations are available are valued at the last sale price on the valuation date, or if no sale occurs, at the last bid price for long positions or the last ask price for short positions, and are generally classified as Level 2.
Underlying Funds (including Money Market Funds) — Investments in the Underlying Funds are valued at the NAV per share on the day of valuation. Because the Portfolios invest primarily in other mutual funds that fluctuate in value, the Portfolios’ shares will correspondingly fluctuate in value. These investments are generally classified as Level 1 of the fair value hierarchy. For information regarding an Underlying Fund’s accounting policies and investment holdings, please see the Underlying Fund’s shareholder report.
Derivative Contracts — A derivative is an instrument whose value is derived from underlying assets, indices, reference rates or a combination of these factors. A Portfolio enters into derivative transactions to hedge against changes in interest rates, securities prices, and/or currency exchange rates, to increase total return, or to gain access to certain markets or attain exposure to other underliers. For financial reporting purposes, cash collateral that has been pledged to cover obligations of a Portfolio and cash collateral received, if any, is reported separately on the Statements of Assets and Liabilities as receivables/payables for collateral on certain derivatives contracts. Non-cash collateral pledged by a Portfolio, if any, is noted in the Schedules of Investments.
Exchange-traded derivatives, including futures and options contracts, are generally valued at the last sale or settlement price on the exchange where they are principally traded. Exchange-traded options without settlement prices are generally valued at the midpoint of the bid and ask prices on the exchange where they are principally traded (or, in the absence of two-way trading, at the last bid price for long positions and the last ask price for short positions). Exchange-traded derivatives typically fall within Level 1 of the fair value hierarchy. Over-the-counter (“OTC”) and centrally cleared derivatives are valued using market transactions and other market evidence, including market-based inputs to models, calibration to market-clearing transactions, broker or dealer quotations, or other alternative pricing sources. Where models are used, the selection of a particular model to value OTC and centrally cleared derivatives depends upon the contractual terms of, and specific risks inherent in, the instrument, as well as the availability of pricing information in the market. Valuation models require a variety of inputs, including contractual terms, market prices, yield curves, credit curves, measures of volatility, voluntary and involuntary prepayment rates, loss severity rates and correlations of such inputs. For OTC and centrally cleared derivatives that trade in liquid markets, model inputs can generally be
31
GOLDMAN SACHS GLOBAL TAX-AWARE EQUITY PORTFOLIOS
Notes to Financial Statements (continued)
August 31, 2021
| 3. INVESTMENTS AND FAIR VALUE MEASUREMENTS (continued) |
verified and model selection does not involve significant management judgment. OTC and centrally cleared derivatives are classified within Level 2 of the fair value hierarchy when significant inputs are corroborated by market evidence.
i. Forward Contracts — A forward contract is a contract between two parties to buy or sell an asset at a specified price on a future date. A forward contract settlement can occur on a cash or delivery basis. Forward contracts are marked-to-market daily using independent vendor prices, and the change in value, if any, is recorded as an unrealized gain or loss. Cash and certain investments may be used to collateralize forward contracts.
A forward foreign currency exchange contract is a forward contract in which a Portfolio agrees to receive or deliver a fixed quantity of one currency for another, at a pre-determined price at a future date. All forward foreign currency exchange contracts are marked to market daily by using the outright forward rates or interpolating based upon maturity dates, where available. Non-deliverable forward foreign currency exchange contracts are settled with the counterparty in cash without the delivery of foreign currency.
ii. Futures Contracts — Futures contracts are contracts to buy or sell a standardized quantity of a specified commodity or security. Upon entering into a futures contract, a Portfolio deposits cash or securities in an account on behalf of the broker in an amount sufficient to meet the initial margin requirement. Subsequent payments are made or received by a Portfolio equal to the daily change in the contract value and are recorded as variation margin receivable or payable with a corresponding offset to unrealized gains or losses.
B. Level 3 Fair Value Investments — To the extent that significant inputs to valuation models and other alternative pricing sources are unobservable, or if quotations are not readily available, or if GSAM believes that such quotations do not accurately reflect fair value, the fair value of a Portfolio’s investments may be determined under Valuation Procedures approved by the Trustees. GSAM, consistent with its procedures and applicable regulatory guidance, may make an adjustment to the most recent valuation prices of either domestic or foreign securities in light of significant events to reflect what it believes to be the fair value of the securities at the time of determining a Portfolio’s NAV. To the extent investments are valued using single source broker quotations obtained directly from the broker or passed through from third party pricing vendors, such investments are classified as Level 3 investments.
C. Fair Value Hierarchy — The following is a summary of the Portfolios’ investments and derivatives classified in the fair value hierarchy as of August 31, 2021:
| ENHANCED DIVIDEND GLOBAL EQUITY | ||||||||||||
| Investment Type | Level 1 | Level 2 | Level 3 | |||||||||
| Assets | ||||||||||||
Underlying Equity Funds | $ | 483,338,321 | $ | — | $ | — | ||||||
Investment Company | 3,321,545 | — | — | |||||||||
| Total | $ | 486,659,866 | $ | — | $ | — | ||||||
| Derivative Type | ||||||||||||
| Assets(a) | ||||||||||||
Forward Foreign Currency Exchange Contracts | $ | — | $ | 1,151,512 | $ | — | ||||||
Futures Contracts | 326,298 | — | — | |||||||||
| Total | $ | 326,298 | $ | 1,151,512 | $ | — | ||||||
| Liabilities(a) | ||||||||||||
Forward Foreign Currency Exchange Contracts | $ | — | $ | (4,832 | ) | $ | — | |||||
| (a) | Amount shown represents unrealized gain (loss) at fiscal year end. |
32
GOLDMAN SACHS GLOBAL TAX-AWARE EQUITY PORTFOLIOS
| 3. INVESTMENTS AND FAIR VALUE MEASUREMENTS (continued) |
| TAX-ADVANTAGED GLOBAL EQUITY | ||||||||||||
| Investment Type | Level 1 | Level 2 | Level 3 | |||||||||
| Assets | ||||||||||||
Underlying Equity Funds | $ | 3,590,545,177 | $ | — | $ | — | ||||||
Investment Company | 26,923,612 | — | — | |||||||||
| Total | $ | 3,617,468,789 | $ | — | $ | — | ||||||
| Derivative Type | ||||||||||||
| Assets(a) | ||||||||||||
Forward Foreign Currency Exchange Contracts | $ | — | $ | 8,439,896 | $ | — | ||||||
Futures Contracts | 2,355,023 | — | — | |||||||||
| Total | $ | 2,355,023 | $ | 8,439,896 | $ | — | ||||||
| Liabilities(a) | ||||||||||||
| Forward Foreign Currency Exchange Contracts | $ | — | $ | (44,828 | ) | $ | — | |||||
| (a) | Amount shown represents unrealized gain (loss) at fiscal year end. |
For further information regarding security characteristics, see the Schedules of Investments.
| 4. INVESTMENTS IN DERIVATIVES |
The following tables set forth, by certain risk types, the gross value of derivative contracts (not considered to be hedging instruments for accounting disclosure purposes) as of August 31, 2021. These instruments were used as part of the Portfolios’ investment strategies and to obtain and/or manage exposure related to the risks below. The values in the tables below exclude the effects of cash collateral received or posted pursuant to these derivative contracts, and therefore are not representative of the Portfolios’ net exposure:
| Enhanced Dividend Global Equity | ||||||||||||
| Risk | Statements of Assets and Liabilities | Assets | Statements of Assets and Liabilities | Liabilities | ||||||||
Currency | Receivable for unrealized gain on forward foreign currency exchange contracts | $ | 1,151,512 | Payable for unrealized loss on forward foreign currency exchange contracts | $ | (4,832) | ||||||
Equity | Variation margin on futures contracts | 326,298 | (a) | — | — | |||||||
| Total | $ | 1,477,810 | $ | (4,832) | ||||||||
| Tax-Advantaged Global Equity | ||||||||||||
| Risk | Statements of Assets and Liabilities | Assets | Statements of Assets and Liabilities | Liabilities | ||||||||
Currency | Receivable for unrealized gain on forward foreign currency exchange contracts | $ | 8,439,896 | Payable for unrealized loss on forward foreign currency exchange contracts | $ | (44,828) | ||||||
Equity | Variation margin on futures contracts | 2,355,023 | (a) | — | — | |||||||
| Total | $ | 10,794,919 | $ | (44,828) | ||||||||
| (a) | Includes unrealized gain (loss) on futures contracts described in the Additional Investment Information sections of the Schedules of Investments. Only the variation margin as of August 31, 2021 is reported within the Statements of Assets and Liabilities. |
33
GOLDMAN SACHS GLOBAL TAX-AWARE EQUITY PORTFOLIOS
Notes to Financial Statements (continued)
August 31, 2021
| 4. INVESTMENTS IN DERIVATIVES (continued) |
The following tables set forth, by certain risk types, the Portfolios’ gains (losses) related to these derivatives and their indicative volumes for the fiscal year ended August 31, 2021. These gains (losses) should be considered in the context that these derivative contracts may have been executed to create investment opportunities and/or economically hedge certain investments, and accordingly, certain gains (losses) on such derivative contracts may offset certain (losses) gains attributable to investments. These gains (losses) are included in “Net realized gain (loss)” or “Net change in unrealized gain (loss)” on the Statements of Operations:
| Enhanced Dividend Global Equity | ||||||||||
| Risk | Statements of Operations | Net Realized Gain (Loss) | Net Change in Unrealized Gain (Loss) | |||||||
| Currency | Net realized gain (loss) from forward foreign currency exchange contracts/Net change in unrealized gain (loss) on forward foreign currency exchange contracts | $ | (2,688,024 | ) | $ | 3,688,759 | ||||
| Equity | Net realized gain (loss) from futures contracts/Net change in unrealized gain (loss) on futures contracts | 1,650,175 | (362,543 | ) | ||||||
| Total | $ | (1,037,849 | ) | $ | 3,326,216 | |||||
| Tax-Advantaged Global Equity | ||||||||||
| Risk | Statements of Operations | Net Realized Gain (Loss) | Net Change in Unrealized Gain (Loss) | |||||||
| Currency | Net realized gain (loss) from forward foreign currency exchange contracts/Net change in unrealized gain (loss) on forward foreign currency exchange contracts | $ | (16,391,066 | ) | $ | 22,920,184 | ||||
| Equity | Net realized gain (loss) from futures contracts/Net change in unrealized gain (loss) on futures contracts | 10,353,626 | (1,588,000 | ) | ||||||
| Total | $ | (6,037,440 | ) | $ | 21,332,184 | |||||
For the fiscal year ended August 31, 2021, the relevant values for each derivative type were as follows:
| Average number of Contracts or Notional Amounts(1) | ||||||
| Portfolio | Futures Contracts | Forward Contracts | ||||
Enhanced Dividend Global Equity | 25 | $ | 53,406,900 | |||
Tax-Advantaged Global Equity | 166 | 325,627,898 | ||||
| (1) | Amounts disclosed represent average number of contracts for futures contracts and notional amounts for forward contracts, based on absolute values, which is indicative of volume of this derivative type, for the months that each Portfolio held such derivatives during the fiscal year ended August 31, 2021. |
| 5. AGREEMENTS AND AFFILIATED TRANSACTIONS |
A. Management Agreement — Under the Agreement, GSAM manages the Portfolios, subject to the general supervision of the Trustees.
As compensation for the services rendered pursuant to the Agreement, the assumption of the expenses related thereto and administration of the Portfolios’ business affairs, including providing facilities, GSAM is entitled to a management fee, accrued daily and paid monthly, equal to an annual percentage rate of 0.15% of each Portfolio’s average daily net assets. GSAM has agreed
34
GOLDMAN SACHS GLOBAL TAX-AWARE EQUITY PORTFOLIOS
| 5. AGREEMENTS AND AFFILIATED TRANSACTIONS (continued) |
to waive a portion of its management fee in order to achieve an effective net rate of 0.08% as an annual percentage rate of average daily net assets of each Portfolio through at least December 29, 2021, and prior to such date, GSAM may not terminate the arrangements without the approval of the Trustees.
B. Distribution and/or Service (12b-1) Plan — The Trust, on behalf of Class A Shares of each applicable Portfolio, has adopted a Distribution and Service Plan subject to Rule 12b-1 under the Act. Under the Distribution and Service Plan, Goldman Sachs, which serves as distributor (the “Distributor”), is entitled to a fee accrued daily and paid monthly for distribution services and personal and account maintenance services, which may then be paid by Goldman Sachs to authorized dealers. These fees are equal to an annual percentage rate of 0.25% of the average daily net assets attributable to Class A Shares of the Portfolios.
C. Distribution Agreement — Goldman Sachs, as Distributor of the shares of the Portfolios pursuant to a Distribution Agreement, may retain a portion of the Class A Shares’ front end sales charge. During the fiscal year ended August 31, 2021, Goldman Sachs retained front-end sales charges of $64 for the Enhanced Dividend Global Equity Portfolio.
D. Transfer Agency Agreement — Goldman Sachs also serves as the transfer agent of the Portfolios for a fee pursuant to the Transfer Agency Agreement. The fees charged for such transfer agency services are accrued daily and paid monthly at annual rates as follows: 0.16% of the average daily net assets of Class A Shares; 0.03% of the average daily net assets of Class R6 and Class P Shares; and 0.04% of the average daily net assets of Institutional Shares.
E. Other Expense Agreements and Affiliated Transactions — GSAM has agreed to reduce or limit certain “Other Expenses” of the Portfolios (excluding acquired fund fees and expenses, transfer agency fees and expenses, service fees and shareholder administration fees (as applicable), taxes, interest, brokerage fees, expenses of shareholder meetings, litigation and indemnification, and extraordinary expenses) to the extent such expenses exceed, on an annual basis, a percentage rate of the average daily net assets of each Portfolio. Such Other Expense reimbursements, if any, are accrued daily and paid monthly. In addition, the Portfolios are not obligated to reimburse GSAM for prior fiscal year expense reimbursements, if any. The Other Expense limitations as an annual percentage rate of average daily net assets for the Portfolios is 0.014%. These Other Expense limitations will remain in place through at least December 29, 2021, and prior to such date GSAM may not terminate the arrangements without the approval of the Trustees. In addition, the Portfolios have entered into certain offset arrangements with the custodian and the transfer agent, which may result in a reduction of the Portfolios’ expenses and are received irrespective of the application of the “Other Expense” limitations described above.
For the fiscal year ended August 31, 2021, these expense reductions, including any fee waivers and Other Expense reimbursements, were as follows:
| Portfolio | Management Fee Waiver | Other Expense Reimbursement | Total Expense Reductions | |||||||||||
Enhanced Dividend Global Equity | $ | 329,445 | $ | 278,234 | $ | 607,679 | ||||||||
Tax-Advantaged Global Equity | 2,198,046 | 226,595 | 2,424,641 | |||||||||||
F. Line of Credit Facility — As of August 31, 2021, the Portfolios participated in a $1,000,000,000 committed, unsecured revolving line of credit facility (the “facility”) together with other funds of the Trust and certain registered investment companies having management agreements with GSAM or its affiliates. This facility is to be used for temporary emergency purposes, or to allow for an orderly liquidation of securities to meet redemption requests. The interest rate on borrowings is based on the federal funds rate. The facility also requires a fee to be paid by the Portfolios based on the amount of the commitment that has not been utilized. For the fiscal year ended August 31, 2021, the Portfolios did not have any borrowings under the facility. Prior to April 26, 2021, the facility was $700,000,000.
35
GOLDMAN SACHS GLOBAL TAX-AWARE EQUITY PORTFOLIOS
Notes to Financial Statements (continued)
August 31, 2021
| 5. AGREEMENTS AND AFFILIATED TRANSACTIONS (continued) |
G. Other Transactions with Affiliates — The Portfolios invest primarily in Class R6 Shares of the Underlying Funds. These Underlying Funds are considered to be affiliated with the Portfolios. The tables below show the transactions in and earnings from investments in these Underlying Funds for the fiscal year ended August 31, 2021:
| Enhanced Dividend Global Equity |
| |||||||||||||||||||||||||||||||||||||||
| Underlying Funds | Beginning Value as of August 31, 2020 | Purchases at Cost | Proceeds from Sales | Return of Capital on Dividends | Net Realized Gain/(Loss) from Affiliated Investment Companies | Change in Unrealized Appreciation/ (Depreciation) | Ending Value as of August 31, 2021 | Shares as of August 31, 2021 | Dividend Income | Capital Gain Distributions from Affiliated Investment Companies | ||||||||||||||||||||||||||||||
Goldman Sachs Emerging Markets Equity Insights Fund | $ | 25,446,938 | $ | 1,189,497 | $ | (8,356,787 | ) | $ | — | $ | 2,298,283 | $ | 3,528,915 | $ | 24,106,846 | 1,910,210 | $ | 308,683 | $ | — | ||||||||||||||||||||
Goldman Sachs Financial Square Government Fund (Institutional Shares) | 514,765 | 172,989,157 | (170,182,377 | ) | — | — | — | 3,321,545 | 3,321,545 | 575 | — | |||||||||||||||||||||||||||||
Goldman Sachs Global Infrastructure Fund | 10,278,772 | 1,726,985 | (4,622,976 | ) | (37,646 | ) | 350,570 | 990,907 | 8,686,612 | 656,584 | 165,562 | — | ||||||||||||||||||||||||||||
Goldman Sachs Global Real Estate Securities Fund | 10,759,811 | 808,350 | (5,202,978 | ) | (5,017 | ) | 87,836 | 2,320,486 | 8,768,488 | 705,997 | 135,844 | 23,711 | ||||||||||||||||||||||||||||
Goldman Sachs International Equity Dividend and Premium Fund | 100,181,603 | 7,155,300 | (29,786,468 | ) | (50,504 | ) | 1,355,150 | 13,829,364 | 92,684,445 | 12,308,691 | 2,861,690 | — | ||||||||||||||||||||||||||||
Goldman Sachs International Small Cap Insights Fund | 16,732,048 | 1,977,449 | (5,584,403 | ) | — | 927,273 | 3,649,578 | 17,701,945 | 1,183,285 | 322,519 | — | |||||||||||||||||||||||||||||
Goldman Sachs MLP Energy Infrastructure Fund | 10,116,597 | 2,338,214 | (8,542,977 | ) | (233,555 | ) | 671,992 | 3,537,896 | 7,888,167 | 341,479 | 460,883 | (a) | — | |||||||||||||||||||||||||||
Goldman Sachs Small Cap Equity Insights Fund | 36,379,358 | 1,991,407 | (15,760,181 | ) | — | 6,385,602 | 8,613,044 | 37,609,230 | 1,036,638 | 220,186 | — | |||||||||||||||||||||||||||||
Goldman Sachs Tactical Tilt Overlay Fund | 42,708,276 | 13,128,422 | (10,241,959 | ) | — | 73,928 | 2,018,593 | 47,687,260 | 4,616,385 | 2,117,479 | — | |||||||||||||||||||||||||||||
Goldman Sachs US Equity Dividend and Premium Fund | 209,334,068 | 44,529,992 | (51,846,669 | ) | (14,366 | ) | 5,467,997 | 30,734,306 | 238,205,328 | 14,454,207 | 3,003,583 | 10,793,055 | ||||||||||||||||||||||||||||
Total | $ | 462,452,236 | $ | 247,834,773 | $ | (310,127,775 | ) | $ | (341,088 | ) | $ | 17,618,631 | $ | 69,223,089 | $ | 486,659,866 | $ | 9,597,004 | $ | 10,816,766 | ||||||||||||||||||||
| (a) | Amount includes return of capital distributions of $(233,555), a portion of which represents the difference between the estimated amount related to the fiscal year ended August 31, 2020 and the final amount recorded during the fiscal year ended August 31, 2021. |
36
GOLDMAN SACHS GLOBAL TAX-AWARE EQUITY PORTFOLIOS
| 5. AGREEMENTS AND AFFILIATED TRANSACTIONS (continued) |
| Tax-Advantaged Global Equity |
| |||||||||||||||||||||||||||||||||||||||
| Underlying Funds | Beginning Value as of August 31, 2020 | Purchases at Cost | Proceeds from Sales | Return of Capital on Dividends | Net Realized Gain/(Loss) from Affiliated Investment Companies | Change in Unrealized Appreciation/ (Depreciation) | Ending Value as of August 31, 2021 | Shares as of August 31, 2021 | Dividend Income | Capital Gain Distributions from Affiliated Investment Companies | ||||||||||||||||||||||||||||||
Goldman Sachs Emerging Markets Equity Insights Fund | $ | 148,158,919 | $ | 14,587,671 | $ | (22,745,450 | ) | $ | — | $ | 2,515,659 | $ | 32,811,503 | $ | 175,328,302 | 13,892,892 | $ | 1,924,809 | $ | — | ||||||||||||||||||||
Goldman Sachs Financial Square Government Fund (Institutional Shares) | 4,042,158 | 1,226,841,128 | (1,203,959,674 | ) | — | — | — | 26,923,612 | 26,923,612 | 4,541 | — | |||||||||||||||||||||||||||||
Goldman Sachs Global Infrastructure Fund | 59,940,656 | 13,117,009 | (19,758,959 | ) | (219,292 | ) | 1,134,515 | 7,887,426 | 62,101,355 | 4,693,980 | 1,082,390 | — | ||||||||||||||||||||||||||||
Goldman Sachs Global Real Estate Securities Fund | 62,684,039 | 6,669,510 | (20,768,959 | ) | (28,256 | ) | 458,092 | 15,867,155 | 64,881,581 | 5,223,960 | 876,278 | 149,649 | ||||||||||||||||||||||||||||
Goldman Sachs International Small Cap Insights Fund | 97,321,206 | 20,338,878 | (17,914,769 | ) | — | 1,111,107 | 28,904,423 | 129,760,845 | 8,673,853 | 1,985,646 | — | |||||||||||||||||||||||||||||
Goldman Sachs International Tax-Managed Equity Fund | 593,013,649 | 64,539,034 | (104,422,069 | ) | — | 7,676,040 | 133,123,897 | 693,930,551 | 54,640,201 | 9,460,627 | — | |||||||||||||||||||||||||||||
Goldman Sachs MLP Energy Infrastructure Fund | 58,886,596 | 17,314,892 | (43,618,958 | ) | (1,444,161 | ) | (4,528,911 | ) | 31,256,159 | 57,865,617 | 2,505,005 | 3,245,404 | (a) | — | ||||||||||||||||||||||||||
Goldman Sachs Tactical Tilt Overlay Fund | 248,920,435 | 98,970,124 | (12,434,064 | ) | — | (98,976 | ) | 14,435,780 | 349,793,299 | 33,861,888 | 13,287,029 | — | ||||||||||||||||||||||||||||
Goldman Sachs US Tax-Managed Equity Fund | 1,475,649,105 | 254,704,073 | (145,794,004 | ) | (1,839,036 | ) | 18,408,094 | 455,755,395 | 2,056,883,627 | 55,277,711 | 9,118,975 | — | ||||||||||||||||||||||||||||
Total | $ | 2,748,616,763 | $ | 1,717,082,319 | $ | (1,591,416,906 | ) | $ | (3,530,745 | ) | $ | 26,675,620 | $ | 720,041,738 | $ | 3,617,468,789 | $ | 40,985,699 | $ | 149,649 | ||||||||||||||||||||
(a) Amount includes return of capital distributions of $(1,444,161), a portion of which represents the difference between the estimated amount related to the fiscal year ended August 31, 2020 and the final amount recorded during the fiscal year ended August 31, 2021.
37
GOLDMAN SACHS GLOBAL TAX-AWARE EQUITY PORTFOLIOS
Notes to Financial Statements (continued)
August 31, 2021
| 5. AGREEMENTS AND AFFILIATED TRANSACTIONS (continued) |
As of August 31, 2021, the Portfolios were beneficial owners of 5% or more of total outstanding shares of the following Funds:
| Underlying Funds | Enhanced Dividend Global Equity | Tax-Advantaged Global Equity | ||||||||
Goldman Sachs Emerging Markets Equity Insights Fund | — | % | 9 | % | ||||||
Goldman Sachs Global Infrastructure Fund | — | 23 | ||||||||
Goldman Sachs Global Real Estate Securities Fund | — | 37 | ||||||||
Goldman Sachs International Equity Dividend and Premium Fund | 49 | — | ||||||||
Goldman Sachs International Tax-Managed Equity Fund | — | 86 | ||||||||
Goldman Sachs MLP Energy Infrastructure Fund | — | 5 | ||||||||
Goldman Sachs Small Cap Equity Insights Fund | 6 | — | ||||||||
Goldman Sachs Tactical Tilt Overlay Fund | — | 9 | ||||||||
Goldman Sachs U.S. Equity Dividend and Premium Fund | 8 | — | ||||||||
Goldman Sachs U.S. Tax-Managed Equity Fund | — | 84 | ||||||||
As of August 31, 2021, The Goldman Sachs Group, Inc. was the beneficial owner of the following share class of the Portfolios:
| Portfolio | Class R6 | |||||
Enhanced Dividend Global Equity | 100 | % | ||||
| 6. PORTFOLIO SECURITIES TRANSACTIONS |
The cost of purchases and proceeds from sales and maturities of long-term securities for the fiscal year ended August 31, 2021 were as follows:
| Portfolio | Purchases | Sales | ||||||||
Enhanced Dividend Global Equity | $ | 74,845,614 | $ | 139,945,397 | ||||||
Tax-Advantaged Global Equity | 490,241,192 | 508,501,291 | ||||||||
| 7. TAX INFORMATION |
The tax character of distributions paid during the fiscal year ended August 31, 2021 was as follows:
Enhanced Dividend | Tax-Advantaged | |||||||
Distributions paid from: | ||||||||
Ordinary income | $ | 9,231,556 | $ | 35,015,525 | ||||
Net long-term capital gains | ||||||||
Total taxable distributions | $ | 9,231,556 | $ | 35,015,525 | ||||
38
GOLDMAN SACHS GLOBAL TAX-AWARE EQUITY PORTFOLIOS
| 7. TAX INFORMATION (continued) |
The tax character of distributions paid during the fiscal year ended August 31, 2020 was as follows:
| Enhanced Dividend Global Equity | Tax-Advantaged Global Equity | |||||||
Distributions paid from: | ||||||||
Ordinary income | $ | 12,642,191 | $ | 39,999,496 | ||||
Net long-term capital gains | 14,003,261 | 3,568,001 | ||||||
Return of capital distribution | 648,637 | — | ||||||
Total taxable distributions | $ | 27,294,089 | $ | 43,567,497 | ||||
As of August 31, 2021, the components of accumulated earnings (losses) on a tax-basis were as follows:
| Enhanced Dividend Global Equity | Tax-Advantaged Global Equity | |||||||
Undistributed ordinary income — net | $ | 3,132,050 | $ | 1,941,129 | ||||
Undistributed long-term capital gains | 18,450,536 | — | ||||||
Total undistributed earnings | $ | 21,582,586 | $ | 1,941,129 | ||||
Capital loss carryforwards:(1) | ||||||||
Perpetual Short-term | $ | — | $ | — | ||||
Perpetual Long-term | — | — | ||||||
Total capital loss carryforwards | $ | — | $ | — | ||||
Timing differences (Late Year Ordinary Loss Deferral) | — | (4,970 | ) | |||||
Unrealized gains — net | 152,534,118 | 1,616,024,141 | ||||||
Total accumulated earnings — net | $ | 174,116,704 | $ | 1,617,960,300 | ||||
| (1) | The Tax-Advantaged Global Equity Portfolio utilized $1,846,473 of capital losses in the current fiscal year. |
As of August 31, 2021, the Portfolios’ aggregate security unrealized gains and losses based on cost for U.S. federal income tax purposes were as follows:
| Enhanced Dividend Global Equity | Tax-Advantaged Global Equity | |||||||
Tax cost | $ | 335,598,726 | $ | 2,012,195,896 | ||||
Gross unrealized gain | 152,537,547 | 1,616,198,309 | ||||||
Gross unrealized loss | (3,429 | ) | (174,168 | ) | ||||
Net unrealized gain | $ | 152,534,118 | $ | 1,616,024,141 | ||||
The difference between GAAP-basis and tax-basis unrealized gains (losses) is attributable primarily to wash sales, net mark to market gains (losses) on regulated futures and net mark to market gains (loss) on foreign currency contracts.
The Enhanced Dividend Global Equity Portfolio reclassified $50,624 from paid in capital to distributable earnings for the year ending August 31, 2021. In order to present certain components of the Portfolio’s capital accounts on a tax-basis, certain reclassifications have been recorded to the Portfolio’s accounts. These reclassifications have no impact on the net asset value of the Portfolio and result primarily from return of capital distributions.
GSAM has reviewed the Portfolios’ tax positions for all open tax years (the current and prior three years, as applicable) and has concluded that no provision for income tax is required in the Portfolios’ financial statements. Such open tax years remain subject to examination and adjustment by tax authorities.
39
GOLDMAN SACHS GLOBAL TAX-AWARE EQUITY PORTFOLIOS
Notes to Financial Statements (continued)
August 31, 2021
| 8. OTHER RISKS |
The Portfolios’ and Underlying Funds’ risks include, but are not limited to, the following:
Derivatives Risk — The Portfolios’ use of derivatives may result in loss. Derivative instruments, which may pose risks in addition to and greater than those associated with investing directly in securities, currencies or other instruments, may be illiquid or less liquid, volatile, difficult to price and leveraged so that small changes in the value of the underlying instruments may produce disproportionate losses to the Portfolios. Derivatives are also subject to counterparty risk, which is the risk that the other party in the transaction will not fulfill its contractual obligation. The use of derivatives is a highly specialized activity that involves investment techniques and risks different from those associated with investments in more traditional securities and instruments. Losses from derivatives can also result from a lack of correlation between changes in the value of derivative instruments and the portfolio assets (if any) being hedged.
Dividend-Paying Investments Risk — A Portfolio’s investments in dividend-paying securities could cause a Portfolio to underperform other funds. Securities that pay dividends, as a group, can fall out of favor with the market, causing such securities to underperform securities that do not pay dividends. Depending upon market conditions and political and legislative responses to such conditions, dividend-paying securities that meet a Portfolio’s investment criteria may not be widely available and/or may be highly concentrated in only a few market sectors. In addition, issuers that have paid regular dividends or distributions to shareholders may not continue to do so at the same level or at all in the future. This may limit the ability of a Portfolio to produce current income.
Energy Sector Risk — The Underlying MLP Fund concentrates its investments in the energy sector, and will therefore be susceptible to adverse economic, environmental, business, regulatory or other occurrences affecting that sector. The energy sector has historically experienced substantial price volatility. MLPs and other companies operating in the energy sector are subject to specific risks, including, among others: fluctuations in commodity prices; reduced consumer demand for commodities such as oil, natural gas or petroleum products; reduced availability of natural gas or other commodities for transporting, processing, storing or delivering; slowdowns in new construction; extreme weather or other natural disasters; and threats of attack by terrorists on energy assets. Additionally, changes in the regulatory environment for energy companies may adversely impact their profitability. Over time, depletion of natural gas reserves and other energy reserves may also affect the profitability of energy companies.
Foreign and Emerging Countries Risk — Investing in foreign markets may involve special risks and considerations not typically associated with investing in the U.S. Foreign securities may be subject to risk of loss because of more or less foreign government regulation; less public information; less stringent investor protections; less stringent accounting, corporate governance, financial reporting and disclosure standards; and less economic, political and social stability in the countries in which a Portfolio or an Underlying Fund invests. The imposition of exchange controls (including repatriation restrictions), confiscations of assets and property, trade restrictions (including tariffs) and other government restrictions by the U.S. or other governments, or problems with registration, settlement or custody, may also result in losses. Foreign risk also involves the risk of negative foreign currency rate fluctuations, which may cause the value of securities denominated in such foreign currency (or other instruments through which a Portfolio or an Underlying Fund has exposure to foreign currencies) to decline in value. Currency exchange rates may fluctuate significantly over short periods of time. To the extent that a Portfolio or an Underlying Fund also invests in securities of issuers located in, or economically tied to, emerging markets, these risks may be more pronounced.
Investments in Other Investment Companies Risk — As a shareholder of another investment company, a Portfolio will indirectly bear its proportionate share of any net management fees and other expenses paid by such other investment companies, in addition to the fees and expenses regularly borne by the Portfolio.
Investments in the Underlying Funds — The Portfolios invest primarily in a combination of Underlying Funds, and are subject to the risk factors associated with the investments of those Underlying Funds in direct proportion to the amount of assets allocated to each. As of August 31, 2021, the Enhanced Dividend Global Equity Portfolio invested 48.8% and 19.0% of its net assets in the Goldman Sachs U.S. Equity Dividend and Premium Fund (the “U.S. Equity Dividend and Premium Fund”) and the Goldman Sachs International Equity Dividend and Premium Fund (the “International Equity Dividend and Premium Fund”), respectively. Because of the high concentration of its assets in these Underlying Funds, the Enhanced Dividend Global Equity
40
GOLDMAN SACHS GLOBAL TAX-AWARE EQUITY PORTFOLIOS
| 8. OTHER RISKS (continued) |
Portfolio has greater exposure to the risks associated with these Underlying Funds than it does to the risks associated with the other Underlying Funds in which it invests. The U.S. Equity Dividend and Premium Fund invests primarily in dividend paying equity investments in large-capitalization U.S. issuers, with public stock market capitalizations within the range of the market capitalization of the S&P 500® Index at the time of investment. This Underlying Fund expects that, under normal circumstances, it will write (sell) call options on the S&P 500® Index or related exchange-traded funds in an amount that is between 20% and 75% of the value of its portfolio. The International Equity Dividend and Premium Fund invests primarily in dividend-paying equity investments in non-U.S. issuers with public stock market capitalizations within the range of capitalization of the Morgan Stanley Capital International (“MSCI”) Europe, Australasia, Far East (“EAFE”) Index (“MSCI EAFE Index”) at the time of investment. This Underlying Fund expects that, under normal circumstances, it will write (sell) call options on the MSCI EAFE Index, other national or regional stock market indices or related exchange-traded funds in an amount that is between 20% and 75% of the value of its portfolio.
As of August 31, 2021, the Tax-Advantaged Global Equity Portfolio invested 56.7% and 19.1% of its net assets in the Goldman Sachs U.S. Tax-Managed Equity Fund (the “U.S. Tax-Managed Equity Fund”) and the Goldman Sachs International Tax-Managed Equity Fund (the “International Tax-Managed Equity Fund”), respectively. Because of the high concentration of its assets in these Underlying Funds, the Tax-Advantaged Global Equity Portfolio has greater exposure to the risks associated with these Underlying Funds than it does to the risks associated with the other Underlying Funds in which it invests. The U.S. Tax-Managed Equity Fund invests primarily in equity investments in U.S. issuers. This Underlying Fund will seek to maintain risk, style, capitalization and industry characteristics similar to the Russell 3000 Index. The International Tax-Managed Equity Fund invests primarily in equity investments in non-U.S. issuers. This Underlying Fund will seek to maintain risk, style, capitalization and industry characteristics similar to the MSCI EAFE Index. The investment adviser may seek tax-efficiency by offsetting gains and losses, limiting portfolio turnover or selling high tax basis securities for both Underlying Funds.
The Portfolios do not invest in the Underlying Funds for the purpose of exercising management or control; however, investments by the Portfolios within their principal investment strategies may represent a significant portion of an Underlying Fund’s net assets.
Large Shareholder Transactions Risk — A Portfolio or an Underlying Fund may experience adverse effects when certain large shareholders, such as other funds, institutional investors (including those trading by use of non-discretionary mathematical formulas), financial intermediaries (who may make investment decisions on behalf of underlying clients and/or include a Portfolio or an Underlying Fund in their investment model), individuals, accounts and Goldman Sachs affiliates, purchase or redeem large amounts of shares of a Portfolio or an Underlying Fund. Such large shareholder redemptions, which may occur rapidly or unexpectedly, may cause a Portfolio or an Underlying Fund to sell portfolio securities at times when it would not otherwise do so, which may negatively impact a Portfolio’s or an Underlying Fund’s NAV and liquidity. These transactions may also accelerate the realization of taxable income to shareholders if such sales of investments resulted in gains, and may also increase transaction costs. In addition, a large redemption could result in a Portfolio’s or an Underlying Fund’s current expenses being allocated over a smaller asset base, leading to an increase in the Portfolio’s or the Underlying Fund’s expense ratio. Similarly, large Portfolio or Underlying Fund share purchases may adversely affect a Portfolio’s or an Underlying Fund’s performance to the extent that the Portfolio or the Underlying Fund is delayed in investing new cash or otherwise maintains a larger cash position than it ordinarily would.
Liquidity Risk — A Portfolio or an Underlying Fund may make investments that are illiquid or that may become less liquid in response to market developments or adverse investor perceptions. Illiquid investments may be more difficult to value. Liquidity risk may also refer to the risk that a Portfolio or Underlying Fund will not be able to pay redemption proceeds within the allowable time period or without significant dilution to remaining investors’ interests because of unusual market conditions, an unusually high volume of redemption requests, or other reasons. To meet redemption requests, a Portfolio or Underlying Fund may be forced to sell investments at an unfavorable time and/or under unfavorable conditions. If a Portfolio or Underlying Fund is forced to sell securities at an unfavorable time and/or under unfavorable conditions, such sales may adversely affect the Portfolio’s or Underlying Fund’s NAV and dilute remaining investors’ interests. Liquidity risk may be the result of, among other things, the reduced number and capacity of traditional market participants to make a market in fixed income securities or the lack of an active
41
GOLDMAN SACHS GLOBAL TAX-AWARE EQUITY PORTFOLIOS
Notes to Financial Statements (continued)
August 31, 2021
| 8. OTHER RISKS (continued) |
market. The potential for liquidity risk may be magnified by a rising interest rate environment or other circumstances where investor redemptions from fixed income funds may be higher than normal, potentially causing increased supply in the market due to selling activity. These risks may be more pronounced in connection with a Portfolio’s investments in securities of issuers located in emerging market countries. Redemptions by large shareholders may have a negative impact on a Portfolio’s or Underlying Fund’s liquidity.
Market and Credit Risks — In the normal course of business, a Portfolio and an Underlying Fund trade financial instruments and enter into financial transactions where risk of potential loss exists due to changes in the market (market risk). The value of the securities in which a Portfolio and/or an Underlying Fund invests may go up or down in response to the prospects of individual companies, particular sectors or governments and/or general economic conditions throughout the world due to increasingly interconnected global economies and financial markets. Events such as war, acts of terrorism, social unrest, natural disasters, the spread of infectious illness or other public health threats could also significantly impact a Portfolio and/or an Underlying Fund and their investments. Additionally, a Portfolio and/or an Underlying Fund may also be exposed to credit risk in the event that an issuer or guarantor fails to perform or that an institution or entity with which the Portfolio and the Underlying Fund have unsettled or open transactions defaults.
| 9. INDEMNIFICATIONS |
Under the Trust’s organizational documents, its Trustees, officers, employees and agents are indemnified, to the extent permitted by the Act and state law, against certain liabilities that may arise out of performance of their duties to the Portfolios. Additionally, in the course of business, the Portfolios enter into contracts that contain a variety of indemnification clauses. The Portfolios’ maximum exposure under these arrangements is unknown, as this would involve future claims that may be made against the Portfolios that have not yet occurred. However, GSAM believes the risk of loss under these arrangements to be remote.
| 10. SUBSEQUENT EVENTS |
Subsequent events after the Statements of Assets and Liabilities date have been evaluated, and GSAM has concluded that there is no impact requiring adjustment or disclosure in the financial statements.
42
GOLDMAN SACHS GLOBAL TAX-AWARE EQUITY PORTFOLIOS
| 11. SUMMARY OF SHARE TRANSACTIONS |
Share activity is as follows:
| Enhanced Dividend Global Equity Portfolio | ||||||||||||||||
|
| |||||||||||||||
| For the Fiscal Year Ended August 31, 2021 | For the Fiscal Year Ended August 31, 2020 | |||||||||||||||
|
| |||||||||||||||
| Shares | Dollars | Shares | Dollars | |||||||||||||
|
| |||||||||||||||
| Class A Shares | ||||||||||||||||
Shares sold | 17,555 | $ | 227,046 | 37,935 | $ | 429,619 | ||||||||||
Reinvestment of distributions | 4,671 | 59,465 | 26,127 | 304,108 | ||||||||||||
Shares redeemed | (228,316 | ) | (2,786,408 | ) | (349,960 | ) | (3,934,449 | ) | ||||||||
| (206,090 | ) | (2,499,897 | ) | (285,898 | ) | (3,200,722 | ) | |||||||||
| Institutional Shares | ||||||||||||||||
Shares sold | 185,549 | 2,443,209 | 100,714 | 1,172,359 | ||||||||||||
Reinvestment of distributions | 20,337 | 259,240 | 61,169 | 715,382 | ||||||||||||
Shares redeemed | (933,666 | ) | (11,803,486 | ) | (678,244 | ) | (7,424,170 | ) | ||||||||
| (727,780 | ) | (9,101,037 | ) | (516,361 | ) | (5,536,429 | ) | |||||||||
| Class R6 Shares | ||||||||||||||||
Reinvestment of distributions | 19 | 237 | 42 | 487 | ||||||||||||
| 19 | 237 | 42 | 487 | |||||||||||||
| Class P Shares | ||||||||||||||||
Shares sold | 2,743,194 | 36,171,750 | 2,177,793 | 25,111,874 | ||||||||||||
Reinvestment of distributions | 690,231 | 8,888,953 | 2,213,900 | 25,859,881 | ||||||||||||
Shares redeemed | (8,347,079 | ) | (109,517,498 | ) | (16,881,525 | ) | (175,745,356 | ) | ||||||||
| (4,913,654 | ) | (64,456,795 | ) | (12,489,832 | ) | (124,773,601 | ) | |||||||||
NET DECREASE | (5,847,505 | ) | $ | (76,057,492 | ) | (13,292,049 | ) | $ | (133,510,265 | ) | ||||||
43
GOLDMAN SACHS GLOBAL TAX-AWARE EQUITY PORTFOLIOS
Notes to Financial Statements (continued)
August 31, 2021
| 11. SUMMARY OF SHARE TRANSACTIONS (continued) |
| Tax-Advantaged Global Equity Portfolio | ||||||||||||||||
|
| |||||||||||||||
For the Fiscal Year Ended August 31, 2021 | For the Fiscal Year Ended August 31, 2020 | |||||||||||||||
|
| |||||||||||||||
| Shares | Dollars | Shares | Dollars | |||||||||||||
|
| |||||||||||||||
| Class A Shares | ||||||||||||||||
Shares sold | 381 | $ | 7,519 | 94 | $ | 1,367 | ||||||||||
Reinvestment of distributions | 232 | 4,264 | 280 | 4,636 | ||||||||||||
Shares redeemed | (247 | ) | (4,982 | ) | (1,951 | ) | (29,834 | ) | ||||||||
| 366 | 6,801 | (1,577 | ) | (23,831 | ) | |||||||||||
| Institutional Shares | ||||||||||||||||
Shares sold | 126,637 | 2,141,685 | 25,375 | 373,510 | ||||||||||||
Reinvestment of distributions | 18,178 | 336,299 | 37,605 | 626,183 | ||||||||||||
Shares redeemed | (593,534 | ) | (10,630,812 | ) | (905,538 | ) | (12,132,909 | ) | ||||||||
| (448,719 | ) | (8,152,828 | ) | (842,558 | ) | (11,133,216 | ) | |||||||||
| Class R6 Shares | ||||||||||||||||
Shares sold | 516,402 | 9,050,583 | — | — | ||||||||||||
Reinvestment of distributions | 5,697 | 103,968 | 10 | 158 | ||||||||||||
Shares redeemed | (63,944 | ) | (1,324,008 | ) | — | — | ||||||||||
| 458,155 | 7,830,543 | 10 | 158 | |||||||||||||
| Class P Shares | ||||||||||||||||
Shares sold | 17,223,132 | 328,167,742 | 20,348,001 | 306,998,930 | ||||||||||||
Reinvestment of distributions | 1,885,862 | 34,416,974 | 2,605,468 | 42,818,729 | ||||||||||||
Shares redeemed | (12,918,851 | ) | (243,103,566 | ) | (42,560,000 | ) | (624,713,368 | ) | ||||||||
| 6,190,143 | 119,481,150 | (19,606,531 | ) | (274,895,709 | ) | |||||||||||
NET INCREASE (DECREASE) | 6,199,945 | $ | 119,165,666 | (20,450,656 | ) | $ | (286,052,598 | ) | ||||||||
44
Report of Independent Registered Public Accounting Firm
To the Board of Trustees of Goldman Sachs Trust and Shareholders of Goldman Sachs Enhanced Dividend Global Equity Portfolio and Goldman Sachs Tax-Advantaged Global Equity Portfolio
Opinions on the Financial Statements
We have audited the accompanying statements of assets and liabilities, including the schedules of investments, of Goldman Sachs Enhanced Dividend Global Equity Portfolio and Goldman Sachs Tax-Advantaged Global Equity Portfolio (two of the portfolios constituting Goldman Sachs Trust, hereafter collectively referred to as the “Portfolios”) as of August 31, 2021, the related statements of operations for the year ended August 31, 2021, the statements of changes in net assets for each of the two years in the period ended August 31, 2021, including the related notes, and the financial highlights for each of the periods indicated therein (collectively referred to as the “financial statements”). In our opinion, the financial statements present fairly, in all material respects, the financial position of each of the Portfolios as of August 31, 2021, the results of each of their operations for the year then ended, the changes in each of their net assets for each of the two years in the period ended August 31, 2021 and each of the financial highlights for each of the periods indicated therein in conformity with accounting principles generally accepted in the United States of America.
Basis for Opinions
These financial statements are the responsibility of the Portfolios’ management. Our responsibility is to express an opinion on the Portfolios’ financial statements based on our audits. We are a public accounting firm registered with the Public Company Accounting Oversight Board (United States) (PCAOB) and are required to be independent with respect to the Portfolios in accordance with the U.S. federal securities laws and the applicable rules and regulations of the Securities and Exchange Commission and the PCAOB.
We conducted our audits of these financial statements in accordance with the standards of the PCAOB. Those standards require that we plan and perform the audit to obtain reasonable assurance about whether the financial statements are free of material misstatement, whether due to error or fraud.
Our audits included performing procedures to assess the risks of material misstatement of the financial statements, whether due to error or fraud, and performing procedures that respond to those risks. Such procedures included examining, on a test basis, evidence regarding the amounts and disclosures in the financial statements. Our audits also included evaluating the accounting principles used and significant estimates made by management, as well as evaluating the overall presentation of the financial statements. Our procedures included confirmation of securities owned as of August 31, 2021 by correspondence with the transfer agent and brokers; when replies were not received from brokers, we performed other auditing procedures. We believe that our audits provide a reasonable basis for our opinions.
/s/ PricewaterhouseCoopers LLP
Boston, Massachusetts
October 26, 2021
We have served as the auditor of one or more investment companies in the Goldman Sachs fund complex since 2000.
45
GOLDMAN SACHS GLOBAL TAX-AWARE EQUITY PORTFOLIOS
Portfolio Expenses — Six Month Period Ended August 31, 2021 (Unaudited) | ||
As a shareholder of Class A, Institutional, Class R6 or Class P Shares of a Portfolio, you incur two types of costs: (1) transaction costs, including sales charges on purchase payments (with respect to Class A Shares), and (2) ongoing costs, including management fees; distribution and/or service (12b-1) fees (with respect to Class A Shares); and other Portfolio expenses. This example is intended to help you understand your ongoing costs (in dollars) of investing in Class A, Institutional, Class R6 and Class P Shares of the Portfolios and to compare these costs with the ongoing costs of investing in other mutual funds.
The example is based on an investment of $1,000 invested at the beginning of the period and held for the entire period from March 1, 2021 through August 31, 2021, which represents a period of 184 days of a 365 day year.
Actual Expenses — The first line under each share class in the table below provides information about actual account values and actual expenses. You may use the information in this line, together with the amount you invested, to estimate the expenses that you paid over the period. Simply divide your account value by $1,000 (for example, an $8,600 account value divided by $1,000=8.6), then multiply the result by the number in the first line under the heading entitled “Expenses Paid” to estimate the expenses you paid on your account during this period.
Hypothetical Example for Comparison Purposes — The second line under each share class in the table below provides information about hypothetical account values and hypothetical expenses based on the Portfolios’ actual net expense ratios and an assumed rate of return of 5% per year before expenses, which is not the Portfolios’ actual return. The hypothetical account values and expenses may not be used to estimate the actual ending account balance or expenses you paid for the period. You may use this information to compare the ongoing costs of investing in the Portfolios and other funds. To do so, compare this 5% hypothetical example with the 5% hypothetical examples that appear in the shareholder reports of the other funds.
Please note that the expenses shown in the table are meant to highlight your ongoing costs only and do not reflect any transactional costs, such as sales charges, redemption fees, or exchange fees and do not include expenses of Underlying Funds in which the Portfolios invest. Therefore, the second line of the table is useful in comparing ongoing costs only and will not help you determine the relative total costs of owning different funds. In addition, if these transactional costs were included, your costs would have been higher.
| Enhanced Dividend Global Equity Portfolio | Tax-Advantaged Global Equity Portfolio | |||||||||||||||||||||||
| Share Class | Beginning Account Value 3/01/21 | Ending Account Value 8/31/21 | Expenses Paid for the 6 Months Ended 8/31/21* | Beginning Account Value 3/01/21 | Ending Account Value 8/31/21 | Expenses Paid for the 6 Months Ended 8/31/21* | ||||||||||||||||||
| Class A | ||||||||||||||||||||||||
Actual | $ | 1,000 | $ | 1,116.80 | $ | 2.67 | $ | 1,000 | $ | 1,155.60 | $ | 2.72 | ||||||||||||
Hypothetical 5% return | 1,000 | 1,022.68 | + | 2.55 | 1,000 | 1,022.68 | + | 2.55 | ||||||||||||||||
| Institutional | ||||||||||||||||||||||||
Actual | 1,000 | 1,119.00 | 0.69 | 1,000 | 1,158.30 | 0.71 | ||||||||||||||||||
Hypothetical 5% return | 1,000 | 1,024.55 | + | 0.66 | 1,000 | 1,024.55 | + | 0.66 | ||||||||||||||||
| Class R6 | ||||||||||||||||||||||||
Actual | 1,000 | 1,119.30 | 0.64 | 1,000 | 1,157.70 | 0.65 | ||||||||||||||||||
Hypothetical 5% return | 1,000 | 1,024.60 | + | 0.61 | 1,000 | 1,024.60 | + | 0.61 | ||||||||||||||||
| Class P | ||||||||||||||||||||||||
Actual | 1,000 | 1,119.40 | 0.64 | 1,000 | 1,158.20 | 0.65 | ||||||||||||||||||
Hypothetical 5% return | 1,000 | 1,024.60 | + | 0.61 | 1,000 | 1,024.60 | + | 0.61 | ||||||||||||||||
| + | Hypothetical expenses are based on each Portfolio’s actual annualized net expense ratios and an assumed rate of return of 5% per year before expenses. |
| * | Expenses are calculated using each Portfolio’s annualized net expense ratio for each class, which represents the ongoing expenses as a percentage of net assets for the six months ended August 31, 2021. Expenses are calculated by multiplying the annualized net expense ratio by the average account value for the period; then multiplying the result by the number of days in the most recent fiscal half year; and then dividing that result by the number of days in the fiscal year. The annualized net expense ratios for the period were as follows: |
| Portfolio | Class A | Institutional | Class R6 | Class P | ||||||||||||
Enhanced Dividend Global Equity | 0.50 | % | 0.13 | % | 0.12 | % | 0.12 | % | ||||||||
Tax-Advantaged Global Equity | 0.50 | 0.13 | 0.12 | 0.12 | ||||||||||||
46
GOLDMAN SACHS GLOBAL TAX-AWARE EQUITY PORTFOLIOS
Statement Regarding Basis for Approval of Management Agreement (Unaudited)
Background
The Goldman Sachs Enhanced Dividend Global Equity Portfolio and Goldman Sachs Tax-Advantaged Global Equity Portfolio (the “Portfolios”) are investment portfolios of Goldman Sachs Trust (the “Trust”). The Board of Trustees oversees the management of the Trust and reviews the investment performance and expenses of the Portfolios at regularly scheduled meetings held throughout the year. In addition, the Board of Trustees determines annually whether to approve the continuance of the Trust’s investment management agreement (the “Management Agreement”) with Goldman Sachs Asset Management, L.P. (the “Investment Adviser”) on behalf of the Portfolios.
The Management Agreement was most recently approved for continuation until June 30, 2022 by the Board of Trustees, including those Trustees who are not parties to the Management Agreement or “interested persons” (as defined in the Investment Company Act of 1940, as amended) of any party thereto (the “Independent Trustees”), at a meeting held on June 15-16, 2021 (the “Annual Meeting”).
The review process undertaken by the Trustees spans the course of the year and culminates with the Annual Meeting. To assist the Trustees in their deliberations, the Trustees have established a Contract Review Committee (the “Committee”), comprised of the Independent Trustees. The Committee held two meetings over the course of the year since the Management Agreement was last approved. At those Committee meetings, regularly scheduled Board or other committee meetings, and/or the Annual Meeting, matters relevant to the renewal of the Management Agreement were considered by the Board, or the Independent Trustees, as applicable. With respect to each Portfolio, such matters included:
| (a) | the nature and quality of the advisory, administrative, and other services provided to the Portfolio and the underlying funds in which it invests (the “Underlying Funds”) by the Investment Adviser and its affiliates, including information about: |
| (i) | the structure, staff, and capabilities of the Investment Adviser and its portfolio management teams; |
| (ii) | the groups within the Investment Adviser and its affiliates that support the portfolio management teams or provide other types of necessary services, including fund services groups (e.g., accounting and financial reporting, tax, shareholder services, and operations); controls and risk management groups (e.g., legal, compliance, valuation oversight, credit risk management, internal audit, compliance testing, market risk analysis, finance, and central funding); sales and distribution support groups, and others (e.g., information technology and training); |
| (iii) | trends in employee headcount; |
| (iv) | the Investment Adviser’s financial resources and ability to hire and retain talented personnel and strengthen its operations; and |
| (v) | the parent company’s support of the Investment Adviser and its mutual fund business, as expressed by the firm’s senior management; |
| (b) | information on the investment performance of the Portfolio and the Underlying Funds, including comparisons to the performance of similar mutual funds, as provided by a third-party mutual fund data provider engaged as part of the contract review process (the “Outside Data Provider”), and a benchmark performance index; and information on general investment outlooks in the markets in which the Underlying Funds invest; |
| (c) | information provided by the Investment Adviser indicating the Investment Adviser’s views on whether the Portfolio’s peer group and/or benchmark index had high, medium, or low relevance given the Portfolio’s particular investment strategy; |
| (d) | the terms of the Management Agreement and other agreements with affiliated service providers entered into by the Trust on behalf of the Portfolio; |
| (e) | fee and expense information for the Portfolio, including: |
| (i) | the relative management fee and expense levels of the Portfolio as compared to those of comparable funds managed by other advisers, as provided by the Outside Data Provider; |
| (ii) | the Portfolio’s expense trends over time; and |
| (iii) | to the extent the Investment Adviser manages other types of accounts (such as bank collective trusts, private wealth management accounts, institutional separate accounts, sub-advised mutual funds, and non-U.S. funds) having investment objectives and policies similar to those of the Portfolio, comparative information on the advisory fees charged and services provided to those accounts by the Investment Adviser; |
| (f) | with respect to the extensive investment performance and expense comparison data provided by the Outside Data Provider, its processes in producing that data for the Portfolio; |
| (g) | the undertakings of the Investment Adviser and its affiliates to implement fee waivers and/or expense limitations with respect to the Portfolio and the Underlying Funds; |
47
GOLDMAN SACHS GLOBAL TAX-AWARE EQUITY PORTFOLIOS
Statement Regarding Basis for Approval of Management Agreement (Unaudited) (continued)
| (h) | information relating to the profitability of the Management Agreement and the transfer agency and distribution and service arrangements of the Portfolio to the Investment Adviser and its affiliates; |
| (i) | whether the Portfolio’s existing management fee schedule, together with the management fee schedules of the Underlying Funds, adequately addressed any economies of scale; |
| (j) | a summary of the “fall-out” benefits derived by the Investment Adviser and its affiliates from their relationships with the Portfolio and/or the Underlying Funds, including the fees received by the Investment Adviser’s affiliates from the Portfolio and/or the Underlying Funds for transfer agency, securities lending, portfolio trading, distribution and other services; |
| (k) | a summary of potential benefits derived by the Portfolio and/or the Underlying Funds as a result of their relationship with the Investment Adviser; |
| (l) | with respect to the applicable Underlying Funds, information regarding commissions paid by the Underlying Funds that are equity funds and broker oversight, an update on the Investment Adviser’s soft dollars practices, other information regarding portfolio trading, and how the Investment Adviser carries out its duty to seek best execution; |
| (m) | portfolio manager ownership of Portfolio shares; the manner in which portfolio manager compensation is determined; and the number and types of accounts managed by the portfolio managers; |
| (n) | the nature and quality of the services provided to the Portfolio and the Underlying Funds by their unaffiliated service providers, and the Investment Adviser’s general oversight and evaluation (including reports on due diligence) of those service providers as part of the administrative services provided under the Management Agreement; and |
| (o) | the Investment Adviser’s processes and policies addressing various types of potential conflicts of interest; its approach to risk management; the annual review of the effectiveness of the Portfolio’s compliance program; and periodic compliance reports. |
The Trustees also received an overview of the Portfolios’ distribution arrangements. They received information regarding the Portfolios’ assets, share purchase and redemption activity, and payment of distribution and service fees. Information was also provided to the Trustees relating to revenue sharing payments made by and services provided by the Investment Adviser and its affiliates to intermediaries that promote the sale, distribution, and/or servicing of Portfolio shares. The Independent Trustees also discussed the broad range of other investment choices that are available to Portfolio investors, including the availability of comparable funds managed by other advisers.
The presentations made at the Board and Committee meetings and at the Annual Meeting encompassed the Portfolios and other mutual funds for which the Board of Trustees has responsibility. In evaluating the Management Agreement at the Annual Meeting, the Trustees relied upon their knowledge, resulting from their meetings and other interactions throughout the year, of the Investment Adviser and its affiliates, their services, and the Portfolios. In conjunction with these meetings, the Trustees received written materials and oral presentations on the topics covered, and the Investment Adviser addressed the questions and concerns of the Trustees, including concerns regarding the investment performance of certain of the funds they oversee. The Independent Trustees were advised by their independent legal counsel regarding their responsibilities and other regulatory requirements related to the approval and continuation of mutual fund investment management agreements under applicable law. In addition, the Investment Adviser and its affiliates provided the Independent Trustees with a written response to a formal request for information sent on behalf of the Independent Trustees by their independent legal counsel. During the course of their deliberations, the Independent Trustees met in executive sessions with their independent legal counsel, without representatives of the Investment Adviser or its affiliates present.
Nature, Extent, and Quality of the Services Provided Under the Management Agreement
As part of their review, the Trustees considered the nature, extent, and quality of the services provided to the Portfolios and the Underlying Funds by the Investment Adviser. In this regard, the Trustees considered both the investment advisory services and non-advisory services that are provided by the Investment Adviser and its affiliates. The Trustees noted the transition in the leadership and changes in personnel of various of the Investment Adviser’s portfolio management teams that had occurred in recent periods, and the ongoing recruitment efforts aimed at bringing high quality investment talent to the Investment Adviser. They also noted the Investment Adviser’s commitment to maintaining high quality systems and expending substantial resources to respond to ongoing changes to the market, regulatory and control environment in which the Portfolios and the Underlying Funds and their service providers operate, including changes associated with the COVID-19 pandemic, as well as the efforts of the Investment Adviser and its affiliates to combat cyber security risks. The Trustees also considered information regarding the Investment Adviser’s business continuity planning and remote operations capabilities. The Trustees concluded that the Investment Adviser continued to commit substantial financial and operational resources to the Portfolios and expressed confidence that the Investment Adviser would continue to do so in the future. The Trustees also recognized that the Investment Adviser had made
48
GOLDMAN SACHS GLOBAL TAX-AWARE EQUITY PORTFOLIOS
Statement Regarding Basis for Approval of Management Agreement (Unaudited) (continued)
significant commitments to address regulatory compliance requirements applicable to the Portfolios, the Underlying Funds, and the Investment Adviser and its affiliates.
Investment Performance
The Trustees also considered the investment performance of the Portfolios and the Underlying Funds. In this regard, they compared the investment performance of each Portfolio to its peers using rankings and ratings compiled by the Outside Data Provider as of December 31, 2020, and updated performance information prepared by the Investment Adviser using the peer group identified by the Outside Data Provider as of March 31, 2021. The information on each Portfolio’s investment performance was provided for the one-, three-, five-, and ten-year periods ending on the applicable dates. The Trustees also reviewed each Portfolio’s investment performance relative to its performance benchmark. As part of this review, they considered the investment performance trends of the Portfolios over time, and reviewed the investment performance of each Portfolio in light of its investment objective and policies and market conditions.
In addition, the Trustees considered materials prepared and presentations made by the Investment Adviser’s senior management and portfolio management personnel in which Portfolio performance was assessed. The Trustees also considered the Investment Adviser’s periodic reports with respect to the Underlying Funds’ risk profiles, and how the Investment Adviser’s approach to risk monitoring and management influences portfolio management. They noted the efforts of the portfolio management teams of certain Underlying Funds to continue to enhance the investment models used in managing those Underlying Funds.
The Trustees observed that the Tax-Advantaged Global Equity Portfolio’s Institutional Shares had placed in the third quartile of the Portfolio’s peer group for the ten-year period and in the fourth quartile for the one-, three-, and five-year periods, and had underperformed the Portfolio’s benchmark index for the one-, three-, and five-year periods and outperformed for the ten-year period ended March 31, 2021. They observed that the Enhanced Dividend Global Equity Portfolio’s Institutional Shares had placed in the third quartile of the Portfolio’s peer group for the three-, five-, and ten-year periods and in the fourth quartile for the one-year period, and had underperformed the Portfolio’s benchmark index for the one-, three-, five-, and ten-year periods ended March 31, 2021. The Trustees noted that the Enhanced Dividend Global Equity Portfolio had certain significant differences from its peer group that caused the peer group to be an imperfect basis for comparison.
Costs of Services Provided and Competitive Information
The Trustees considered the contractual terms of the Management Agreement and the fee rates payable by each Portfolio thereunder. In this regard, the Trustees considered information on the services rendered by the Investment Adviser to the Portfolios, which included both advisory and administrative services that were directed to the needs and operations of the Portfolios as registered mutual funds.
In particular, the Trustees reviewed analyses prepared by the Outside Data Provider regarding the expense rankings of the Portfolios. The analyses provided a comparison of each Portfolio’s management fee to those of a relevant peer group and category universe; an expense analysis which compared each Portfolio’s overall net and gross expenses to a peer group and a category universe; and data comparing each Portfolio’s net expenses to the peer and category medians. The analyses also compared each Portfolio’s other expenses and fee waivers/reimbursements to those of the peer group and category medians. The Trustees concluded that the comparisons provided by the Outside Data Provider were useful in evaluating the reasonableness of the management fees and total expenses paid by the Portfolios.
In addition, the Trustees considered the Investment Adviser’s undertakings to implement fee waivers and/or expense limitations with respect to the Portfolios and the Underlying Funds. The Trustees also noted that certain changes were being made to existing fee waiver or expense limitation arrangements of the Enhanced Dividend Global Equity Portfolio that would have the effect of decreasing expenses of Class A Shares of the Portfolio, with such changes taking effect in connection with the Portfolio’s next annual registration statement update. They also considered, to the extent that the Investment Adviser manages other types of accounts having investment objectives and policies similar to those of the Portfolios, comparative fee information for services provided by the Investment Adviser to those accounts, and information that indicated that services provided to the Portfolios differed in various significant respects from the services provided to other types of accounts which, in many cases, operated under less stringent legal and regulatory structures, required fewer services from the Investment Adviser to a smaller number of client contact points, and were less time-intensive.
In addition, the Trustees noted that shareholders are able to redeem their Portfolio shares at any time if shareholders believe that the Portfolio fees and expenses are too high or if they are dissatisfied with the performance of the Portfolio.
49
GOLDMAN SACHS GLOBAL TAX-AWARE EQUITY PORTFOLIOS
Statement Regarding Basis for Approval of Management Agreement (Unaudited) (continued)
Profitability
The Trustees reviewed each Portfolio’s contribution to the Investment Adviser’s revenues and pre-tax profit margins. In this regard the Trustees noted that they had received, among other things, profitability analyses and summaries, revenue and expense schedules by Portfolio and by function (i.e., investment management, transfer agency and distribution and service), and information on the Investment Adviser’s expense allocation methodology. They observed that the profitability and expense figures are substantially similar to those used by the Investment Adviser for many internal purposes, including compensation decisions among various business groups, and are thus subject to a vigorous internal debate about how certain revenue and expenses should be allocated. The Trustees also noted that the internal audit group within the Goldman Sachs organization periodically audits the expense allocation methodology and that the internal audit group was satisfied with the reasonableness, consistency, and accuracy of the Investment Adviser’s expense allocation methodology. Profitability data for each Portfolio was provided for 2020 and 2019, and the Trustees considered this information in relation to the Investment Adviser’s overall profitability.
Economies of Scale
The Trustees considered the information that had been provided regarding whether there have been economies of scale with respect to the management of the Portfolios. The Trustees noted that, although the Portfolios themselves do not have breakpoints in their management fee schedules, any benefits of the breakpoints in the management fee schedules of certain Underlying Funds, when reached, would pass through to the shareholders in the Portfolios at the specified asset levels. The Trustees considered the amounts of assets in the Portfolios; the Portfolios’ recent purchase and redemption activity; the information provided by the Investment Adviser relating to the costs of the services provided by the Investment Adviser and its affiliates and the profits realized by them; information comparing the fee rates charged by the Investment Adviser with fee rates charged to other funds in the peer groups; and the Investment Adviser’s undertaking to limit certain expenses of the Portfolios and Underlying Funds that exceed specified levels. They also considered the services provided to the Portfolios under the Management Agreement and the fees and expenses borne by the Underlying Funds, and determined that the management fees payable by the Portfolios were not duplicative of the management fees paid at the Underlying Fund level.
Other Benefits to the Investment Adviser and Its Affiliates
The Trustees also considered the other benefits derived by the Investment Adviser and its affiliates from their relationships with the Portfolios and/or the Underlying Funds as stated above, including: (a) transfer agency fees received by Goldman Sachs & Co. LLC (“Goldman Sachs”); (b) brokerage and futures commissions earned by Goldman Sachs for executing securities and futures transactions on behalf of certain Underlying Funds; (c) research received by the Investment Adviser from broker-dealers in exchange for executing certain transactions on behalf of certain Underlying Funds; (d) trading efficiencies resulting from aggregation of orders of the Underlying Funds with those for other funds or accounts managed by the Investment Adviser; (e) fees earned by Goldman Sachs Agency Lending (“GSAL”), an affiliate of the Investment Adviser, as securities lending agent for certain Underlying Funds (and fees earned by the Investment Adviser for managing the fund in which those Underlying Funds’ cash collateral is invested); (f) the Investment Adviser’s ability to leverage the infrastructure designed to service the Portfolios on behalf of its other clients; (g) the Investment Adviser’s ability to cross-market other products and services to Portfolio shareholders; (h) Goldman Sachs’ retention of certain fees as Portfolio Distributor; (i) the Investment Adviser’s ability to negotiate better pricing with custodians on behalf of its other clients, as a result of the relationship with the Portfolios and Underlying Funds; (j) the investment of cash and cash collateral in money market funds managed by the Investment Adviser that will result in increased assets under management for those money market funds; (k) with respect to certain Underlying Funds, investment in exchange-traded funds (“ETFs”) managed by the Investment Adviser that will result in increased assets under management for those ETFs and may facilitate the development of the Investment Adviser’s ETF advisory business; and (l) the possibility that the working relationship between the Investment Adviser and the Portfolios’ and Underlying Funds’ third-party service providers may cause those service providers to be more likely to do business with other areas of Goldman Sachs. In the course of considering the foregoing, the Independent Trustees requested and received further information quantifying certain of these fall-out benefits.
Other Benefits to the Portfolios and Their Shareholders
The Trustees also noted that the Portfolios and/or the Underlying Funds receive certain other potential benefits as a result of their relationship with the Investment Adviser, including: (a) trading efficiencies resulting from aggregation of orders of the Underlying Funds with those of other funds or accounts managed by the Investment Adviser; (b) enhanced servicing from vendors due to the volume of business generated by the Investment Adviser and its affiliates; (c) with respect to the Underlying Funds, enhanced servicing from broker-dealers due to the volume of business generated by the Investment Adviser and its affiliates; (d) with respect to certain Underlying Funds, the Investment Adviser’s ability to negotiate favorable terms with derivatives
50
GOLDMAN SACHS GLOBAL TAX-AWARE EQUITY PORTFOLIOS
Statement Regarding Basis for Approval of Management Agreement (Unaudited) (continued)
counterparties as a result of the size and reputation of the Goldman Sachs organization; (e) the advantages received from the Investment Adviser’s knowledge and experience gained from managing other accounts and products; (f) the Investment Adviser’s ability to hire and retain qualified personnel to provide services to the Portfolios and the Underlying Funds because of the reputation of the Goldman Sachs organization; (g) the Portfolios’ and Underlying Funds’ access, through the Investment Adviser, to certain firm-wide resources (e.g., proprietary risk management systems and databases), subject to certain restrictions; (h) with respect to certain Underlying Funds, the ability to participate in the securities lending program administered by GSAL, as measured by the revenue received by the Underlying Funds in connection with the program; and (i) the Portfolios’ access to certain affiliated distribution channels. In addition, the Trustees noted the competitive nature of the mutual fund marketplace, and considered that many of the Portfolios’ shareholders invested in the Portfolios in part because of the Portfolios’ relationship with the Investment Adviser and that those shareholders have a general expectation that the relationship will continue.
Conclusion
In connection with their consideration of the Management Agreement, the Trustees gave weight to each of the factors described above, but did not identify any particular factor as controlling their decision. After deliberation and consideration of all of the information provided, including the factors described above, the Trustees concluded, in the exercise of their business judgment, that the management fees paid by each of the Portfolios were reasonable in light of the services provided to it by the Investment Adviser, the Investment Adviser’s costs and each Portfolio’s current and reasonably foreseeable asset levels. The Trustees unanimously concluded that the Investment Adviser’s continued management likely would benefit each Portfolio and its shareholders and that the Management Agreement should be approved and continued with respect to each Portfolio until June 30, 2022.
51
GOLDMAN SACHS GLOBAL TAX-AWARE EQUITY PORTFOLIOS
Trustees and Officers (Unaudited)
Independent Trustees
| Name, Address and Age1 | Position(s) Held with the Trust | Term of Office and | Principal Occupation(s) During Past 5 Years | Number of Portfolios in Fund Complex Overseen by Trustee3 | Other Directorships Held by Trustee4 | |||||
Jessica Palmer Age: 72 | Chair of the Board of Trustees | Since 2018 (Trustee since 2007) | Ms. Palmer is retired. She was formerly Consultant, Citigroup Human Resources Department (2007-2008); Managing Director, Citigroup Corporate and Investment Banking (previously, Salomon Smith Barney/Salomon Brothers) (1984-2006). Ms. Palmer was a Member of the Board of Trustees of Indian Mountain School (private elementary and secondary school) (2004-2009).
Chair of the Board of Trustees — Goldman Sachs Trust and Goldman Sachs Variable Insurance Trust. | 109 | None | |||||
Dwight L. Bush Age: 64 | Trustee | Since 2020 | Ambassador Bush is President and CEO of D.L. Bush & Associates (a financial advisory and private investment firm) (2002-2014 and 2017-present); Director of MoneyLion Inc. (an operator of a data-driven, digital financial platform (2021-present); and was formerly U.S. Ambassador to the Kingdom of Morocco (2014-2017) and a Member of the Board of Directors of Santander Bank, N.A. (2018-2019). Previously, Ambassador Bush served as an Advisory Board Member of Goldman Sachs Trust and Goldman Sachs Variable Insurance Trust (October 2019-January 2020).
Trustee — Goldman Sachs Trust and Goldman Sachs Variable Insurance Trust. | 109 | None | |||||
Kathryn A. Cassidy Age: 67 | Trustee | Since 2015 | Ms. Cassidy is retired. Formerly, she was Advisor to the Chairman (May 2014-December 2014); and Senior Vice President and Treasurer (2008-2014), General Electric Company & General Electric Capital Corporation (technology and financial services companies).
Trustee — Goldman Sachs Trust and Goldman Sachs Variable Insurance Trust. | 109 | None | |||||
Diana M. Daniels Age: 72 | Trustee | Since 2007 | Ms. Daniels is retired. Formerly, she was Vice President, General Counsel and Secretary, The Washington Post Company (1991-2006). Ms. Daniels is a Trustee Emeritus and serves as a Presidential Councillor of Cornell University (2013-Present); former Member of the Legal Advisory Board, New York Stock Exchange (2003-2006) and of the Corporate Advisory Board, Standish Mellon Management Advisors (2006-2007).
Trustee — Goldman Sachs Trust and Goldman Sachs Variable Insurance Trust. | 109 | None | |||||
Joaquin Delgado Age: 61 | Trustee | Since 2020 | Dr. Delgado is retired. He is Director, Hexion Inc. (a specialty chemical manufacturer) (2019-present); and Director, Stepan Company (a specialty chemical manufacturer) (2011-present); and was formerly Executive Vice President, Consumer Business Group of 3M Company (July 2016-July 2019); and Executive Vice President, Health Care Business Group of 3M Company (October 2012-July 2016). Previously, Dr. Delgado served as an Advisory Board Member of Goldman Sachs Trust and Goldman Sachs Variable Insurance Trust (October 2019-January 2020).
Trustee — Goldman Sachs Trust and Goldman Sachs Variable Insurance Trust. | 109 | Hexion Inc. (a specialty chemical manufacturer); Stepan Company (a specialty chemical manufacturer) | |||||
52
GOLDMAN SACHS GLOBAL TAX-AWARE EQUITY PORTFOLIOS
Trustees and Officers (Unaudited) (continued)
Independent Trustees
| Name, Address and Age1 | Position(s) Held with the Trust | Term of Office and | Principal Occupation(s) During Past 5 Years | Number of Portfolios in Fund Complex Overseen by Trustee3 | Other Directorships Held by Trustee4 | |||||
Roy W. Templin Age: 61 | Trustee | Since 2013 | Mr. Templin is retired. He is Director, Armstrong World Industries, Inc. (a designer and manufacturer of ceiling and wall systems) (2016-Present); and was formerly Chairman of the Board of Directors, Con-Way Incorporated (a transportation, logistics and supply chain management service company) (2014-2015); Executive Vice President and Chief Financial Officer, Whirlpool Corporation (an appliance manufacturer and marketer) (2004-2012).
Trustee — Goldman Sachs Trust and Goldman Sachs Variable Insurance Trust. | 109 | Armstrong World Industries, Inc. (a ceiling and wall systems manufacturer) | |||||
Gregory G. Weaver Age: 69 | Trustee | Since 2015 | Mr. Weaver is retired. He is Director, Verizon Communications Inc. (2015-Present); and was formerly Chairman and Chief Executive Officer, Deloitte & Touche LLP (a professional services firm) (2001-2005 and 2012-2014); and Member of the Board of Directors, Deloitte & Touche LLP (2006-2012).
Trustee — Goldman Sachs Trust and Goldman Sachs Variable Insurance Trust. | 109 | Verizon Communications Inc. | |||||
53
GOLDMAN SACHS GLOBAL TAX-AWARE EQUITY PORTFOLIOS
Trustees and Officers (Unaudited) (continued)
Interested Trustee*
| Name, Address and Age1 | Position(s) Held with the Trust | Term of Office and | Principal Occupation(s) During Past 5 Years | Number of Portfolios in Fund Complex Overseen by Trustee3 | Other Directorships Held by Trustee4 | |||||
James A. McNamara Age: 58 | Trustee and President | Since 2007 | Advisory Director, Goldman Sachs (January 2018-Present); Managing Director, Goldman Sachs (January 2000-December 2017); Director of Institutional Fund Sales, GSAM (April 1998-December 2000); and Senior Vice President and Manager, Dreyfus Institutional Service Corporation (January 1993-April 1998).
President and Trustee — Goldman Sachs Trust; Goldman Sachs Variable Insurance Trust; Goldman Sachs Trust II; Goldman Sachs MLP and Energy Renaissance Fund; Goldman Sachs ETF Trust; Goldman Sachs Credit Income Fund; and Goldman Sachs Real Estate Diversified Income Fund. | 166 | None | |||||
| * | Mr. McNamara is considered to be an “Interested Trustee” because he holds positions with Goldman Sachs and owns securities issued by The Goldman Sachs Group, Inc. Mr. McNamara holds comparable positions with certain other companies of which Goldman Sachs, GSAM or an affiliate thereof is the investment adviser, administrator and/or distributor. |
| 1 | Each Trustee may be contacted by writing to the Trustee, c/o Goldman Sachs, 200 West Street, New York, New York, 10282, Attn: Caroline Kraus. Information is provided as of August 31, 2021. |
| 2 | Subject to such policies as may be adopted by the Board from time-to-time, each Trustee holds office for an indefinite term, until the earliest of: (a) the election of his or her successor; (b) the date the Trustee resigns or is removed by the Board or shareholders, in accordance with the Trust’s Declaration of Trust; or (c) the termination of the Trust. The Board has adopted policies which provide that each Independent Trustee shall retire as of December 31st of the calendar year in which he or she reaches (a) his or her 75th birthday or (b) the 15th anniversary of the date he or she became a Trustee, whichever is earlier, unless a waiver of such requirements shall have been adopted by a majority of the other Trustees. These policies may be changed by the Trustees without shareholder vote. |
| 3 | The Goldman Sachs Fund Complex includes certain other companies listed above for each respective Trustee. As of August 31, 2021, Goldman Sachs Trust consisted of 92 portfolios (90 of which offered shares to the public); Goldman Sachs Variable Insurance Trust consisted of 17 portfolios (13 of which offered shares to the public); Goldman Sachs Trust II consisted of 18 portfolios (16 of which offered shares to the public); Goldman Sachs ETF Trust consisted of 36 portfolios (21 of which offered shares to the public); and Goldman Sachs MLP and Energy Renaissance Fund, Goldman Sachs Credit Income Fund and Goldman Sachs Real Estate Diversified Income Fund each consisted of one portfolio. Goldman Sachs Credit Income Fund did not offer shares to the public. |
| 4 | This column includes only directorships of companies required to report to the Securities and Exchange Commission under the Securities Exchange Act of 1934 (i.e., “public companies”) or other investment companies registered under the Act. |
Additional information about the Trustees is available in the Funds’ Statement of Additional Information, which can be obtained from Goldman Sachs free of charge by calling this toll-free number (in the United States of America): 1-800-526-7384.
54
GOLDMAN SACHS GLOBAL TAX-AWARE EQUITY PORTFOLIOS
Trustees and Officers (Unaudited) (continued)
Officers of the Trust*
| Name, Address and Age1 | Position(s) Held with the Trust | Term of Office and | Principal Occupation(s) During Past 5 Years | |||
James A. McNamara 200 West Street New York, NY 10282 Age: 58 | Trustee and President | Since 2007 | Advisory Director, Goldman Sachs (January 2018-Present); Managing Director, Goldman Sachs (January 2000-December 2017); Director of Institutional Fund Sales, GSAM (April 1998-December 2000); and Senior Vice President and Manager, Dreyfus Institutional Service Corporation (January 1993-April 1998).
President and Trustee — Goldman Sachs Trust; Goldman Sachs Variable Insurance Trust; Goldman Sachs Trust II; Goldman Sachs MLP and Energy Renaissance Fund; Goldman Sachs ETF Trust; Goldman Sachs Credit Income Fund; and Goldman Sachs Real Estate Diversified Income Fund. | |||
Caroline L. Kraus 200 West Street New York, NY 10282 Age: 44 | Secretary | Since 2012 | Managing Director, Goldman Sachs (January 2016-Present); Vice President, Goldman Sachs (August 2006-December 2015); Senior Counsel, Goldman Sachs (January 2020-Present); Associate General Counsel, Goldman Sachs (2012-December 2019); Assistant General Counsel, Goldman Sachs (August 2006-December 2011); and Associate, Weil, Gotshal & Manges, LLP (2002-2006).
Secretary — Goldman Sachs Trust (previously Assistant Secretary (2012)); Goldman Sachs Variable Insurance Trust (previously Assistant Secretary (2012)); Goldman Sachs Trust II; Goldman Sachs BDC, Inc.; Goldman Sachs Private Middle Market Credit LLC; Goldman Sachs Private Middle Market Credit II LLC; Goldman Sachs Middle Market Lending Corp.; Goldman Sachs MLP and Energy Renaissance Fund; Goldman Sachs ETF Trust; Goldman Sachs Credit Income Fund; and Goldman Sachs Real Estate Diversified Income Fund. | |||
Joseph F. DiMaria 30 Hudson Street Jersey City, NJ 07302 Age: 53 | Treasurer, Principal Financial Officer and Principal Accounting Officer | Since 2017 (Treasurer and Principal Financial Officer since 2019) | Managing Director, Goldman Sachs (November 2015-Present) and Vice President — Mutual Fund Administration, Columbia Management Investment Advisers, LLC (May 2010-October 2015).
Treasurer, Principal Financial Officer and Principal Accounting Officer — Goldman Sachs Trust (previously Assistant Treasurer (2016)); Goldman Sachs Variable Insurance Trust (previously Assistant Treasurer (2016)); Goldman Sachs Trust II (previously Assistant Treasurer (2017)); Goldman Sachs MLP and Energy Renaissance Fund (previously Assistant Treasurer (2017)); Goldman Sachs ETF Trust (previously Assistant Treasurer (2017)); Goldman Sachs Credit Income Fund; and Goldman Sachs Real Estate Diversified Income Fund. | |||
| * | Represents a partial list of officers of the Trust. Additional information about all the officers is available in the Funds’ Statement of Additional Information, which can be obtained from Goldman Sachs free of charge by calling this toll-free number (in the United States): 1-800-526-7384. |
| 1 | Information is provided as of August 31, 2021. |
| 2 | Officers hold office at the pleasure of the Board of Trustees or until their successors are duly elected and qualified. Each officer holds comparable positions with certain other companies of which Goldman Sachs, GSAM or an affiliate thereof is the investment adviser, administrator and/or distributor. |
55
GOLDMAN SACHS GLOBAL TAX-AWARE EQUITY PORTFOLIOS
Goldman Sachs Trust — Global Tax-Aware Equity Portfolios — Tax Information (Unaudited)
For the fiscal year ended August 31, 2021, 29.75% and 34.06% of the dividends paid from net investment company taxable income by the Enhanced Dividend Global Equity and Tax-Advantaged Global Equity Portfolios, respectively, qualify for the dividends received deduction available to corporations.
From distributions paid during the fiscal year ended August 31, 2021, the total amount of income received by the Enhanced Dividend Global Equity and Tax-Advantaged Global Equity Portfolios from sources within foreign countries and possessions of the United States was $0.1073 and $0.0835 per share, respectively, all of which is attributable to qualified passive income. The percentage of net investment income dividends paid from foreign sources by the Enhanced Dividend Global Equity and Tax-Advantaged Global Equity Portfolios was 37.61% and 32.27%, respectively. The total amount of taxes paid by the Enhanced Dividend Global Equity and Tax-Advantaged Global Equity Portfolios to such countries was $0.0139 and $0.0116 per share, respectively.
For the fiscal year ended August 31, 2021, the Enhanced Dividend Global Equity and Tax-Advantaged Global Equity Portfolios designate 77.84% and 73.98%, respectively, of the dividends paid from net investment company taxable income as qualifying for the reduced tax rate under the Jobs and Growth Tax Relief and Reconciliation Act of 2003.
During the fiscal year ended August 31, 2021, the Enhanced Dividend Global Equity Portfolio designates $167,230 as short-term capital gain dividends pursuant to Section 871(k) of the Internal Revenue Code.
56
FUNDS PROFILE
Goldman Sachs Funds
Goldman Sachs is a premier financial services firm, known since 1869 for creating thoughtful and customized investment solutions in complex global markets.
Today, the Asset Management Division of Goldman Sachs serves a diverse set of clients worldwide, including private institutions, public entities and individuals. With approximately $2.09 trillion in assets under supervision as of June 30, 2021, Goldman Sachs Asset Management has portfolio management teams located around the world and our investment professionals bring firsthand knowledge of local markets to every investment decision. Assets under supervision includes assets under management and other client assets for which Goldman Sachs does not have full discretion. Goldman Sachs Asset Management leverages the resources of Goldman Sachs & Co. LLC subject to legal, internal and regulatory restrictions.
Money Market
Financial Square FundsSM
| ∎ | Financial Square Treasury Solutions Fund1 |
| ∎ | Financial Square Government Fund1 |
| ∎ | Financial Square Money Market Fund2 |
| ∎ | Financial Square Prime Obligations Fund2 |
| ∎ | Financial Square Treasury Instruments Fund1 |
| ∎ | Financial Square Treasury Obligations Fund1 |
| ∎ | Financial Square Federal Instruments Fund1 |
Investor FundsSM
| ∎ | Investor Money Market Fund3 |
| ∎ | Investor Tax-Exempt Money Market Fund3 |
Fixed Income
Short Duration and Government
| ∎ | Enhanced Income Fund |
| ∎ | High Quality Floating Rate Fund |
| ∎ | Short-Term Conservative Income Fund |
| ∎ | Short Duration Government Fund |
| ∎ | Short Duration Bond Fund4 |
| ∎ | Government Income Fund |
| ∎ | Inflation Protected Securities Fund |
Multi-Sector
| ∎ | Bond Fund |
| ∎ | Core Fixed Income Fund |
| ∎ | Global Core Fixed Income Fund |
| ∎ | Income Fund |
| ∎ | Strategic Income Fund |
Municipal and Tax-Free
| ∎ | High Yield Municipal Fund |
| ∎ | Dynamic Municipal Income Fund |
| ∎ | Short Duration Tax-Free Fund |
| ∎ | Municipal Income Completion Fund |
Single Sector
| ∎ | Investment Grade Credit Fund |
| ∎ | U.S. Mortgages Fund |
| ∎ | High Yield Fund |
| ∎ | High Yield Floating Rate Fund |
| ∎ | Emerging Markets Debt Fund |
| ∎ | Local Emerging Markets Debt Fund |
Fixed Income Alternatives
| ∎ | Long Short Credit Strategies Fund |
Fundamental Equity
| ∎ | Equity Income Fund |
| ∎ | Small Cap Growth Fund |
| ∎ | Small Cap Value Fund |
| ∎ | Small/Mid Cap Value Fund |
| ∎ | Mid Cap Value Fund |
| ∎ | Large Cap Value Fund |
| ∎ | Focused Value Fund |
| ∎ | Capital Growth Fund |
| ∎ | Strategic Growth Fund |
| ∎ | Small/Mid Cap Growth Fund |
| ∎ | Flexible Cap Fund |
| ∎ | Concentrated Growth Fund |
| ∎ | Technology Opportunities Fund |
| ∎ | Growth Opportunities Fund |
| ∎ | Rising Dividend Growth Fund |
| ∎ | U.S. Equity ESG Fund |
| ∎ | Income Builder Fund |
Tax-Advantaged Equity
| ∎ | U.S. Tax-Managed Equity Fund |
| ∎ | International Tax-Managed Equity Fund |
| ∎ | U.S. Equity Dividend and Premium Fund |
| ∎ | International Equity Dividend and Premium Fund |
Equity Insights
| ∎ | Small Cap Equity Insights Fund |
| ∎ | U.S. Equity Insights Fund |
| ∎ | Small Cap Growth Insights Fund |
| ∎ | Large Cap Growth Insights Fund |
| ∎ | Large Cap Value Insights Fund |
| ∎ | Small Cap Value Insights Fund |
| ∎ | International Small Cap Insights Fund |
| ∎ | International Equity Insights Fund |
| ∎ | Emerging Markets Equity Insights Fund |
Fundamental Equity International
| ∎ | International Equity Income Fund |
| ∎ | International Equity ESG Fund |
| ∎ | China Equity Fund |
| ∎ | Emerging Markets Equity Fund |
| ∎ | ESG Emerging Markets Equity Fund |
Alternative
| ∎ | Real Estate Securities Fund |
| ∎ | International Real Estate Securities Fund |
| ∎ | Commodity Strategy Fund |
| ∎ | Global Real Estate Securities Fund |
| ∎ | Alternative Premia Fund |
| ∎ | Absolute Return Tracker Fund |
| ∎ | Managed Futures Strategy Fund |
| ∎ | MLP Energy Infrastructure Fund |
| ∎ | Energy Infrastructure Fund |
| ∎ | Multi-Manager Alternatives Fund |
| ∎ | Global Infrastructure Fund |
| ∎ | Clean Energy Income Fund |
| ∎ | Defensive Equity Fund |
Total Portfolio Solutions
| ∎ | Global Managed Beta Fund |
| ∎ | Multi-Manager Non-Core Fixed Income Fund |
| ∎ | Multi-Manager Global Equity Fund |
| ∎ | Multi-Manager International Equity Fund |
| ∎ | Tactical Tilt Overlay Fund |
| ∎ | Balanced Strategy Portfolio |
| ∎ | Multi-Manager U.S. Small Cap Equity Fund |
| ∎ | Multi-Manager Real Assets Strategy Fund |
| ∎ | Growth and Income Strategy Portfolio |
| ∎ | Growth Strategy Portfolio |
| ∎ | Dynamic Global Equity Fund |
| ∎ | Satellite Strategies Portfolio |
| ∎ | Enhanced Dividend Global Equity Portfolio |
| ∎ | Tax-Advantaged Global Equity Portfolio |
| ∎ | Strategic Factor Allocation Fund |
| ∎ | Strategic Volatility Premium Fund |
| ∎ | Target Date Retirement Portfolio |
| ∎ | Target Date 2025 Portfolio |
| ∎ | Target Date 2030 Portfolio |
| ∎ | Target Date 2035 Portfolio |
| ∎ | Target Date 2040 Portfolio |
| ∎ | Target Date 2045 Portfolio |
| ∎ | Target Date 2050 Portfolio |
| ∎ | Target Date 2055 Portfolio |
| ∎ | Target Date 2060 Portfolio |
| ∎ | GQG Partners International Opportunities Fund |
| 1 | You could lose money by investing in the Fund. Although the Fund seeks to preserve the value of your investment at $1.00 per share, it cannot guarantee it will do so. An investment in the Fund is not a deposit of a bank and is not insured or guaranteed by the Federal Deposit Insurance Corporation or any other government agency. The Fund’s sponsor has no legal obligation to provide financial support to the Fund, and you should not expect that the sponsor will provide financial support to the Fund at any time. |
| 2 | You could lose money by investing in the Fund. Because the share price of the Fund will fluctuate, when you sell your shares they may be worth more or less than what you originally paid for them. The Fund may impose a fee upon sale of your shares or may temporarily suspend your ability to sell shares if the Fund’s liquidity falls below required minimums because of market conditions or other factors. An investment in the Fund is not a deposit of a bank and is not insured or guaranteed by the Federal Deposit Insurance Corporation or any other government agency. The Fund’s sponsor has no legal obligation to provide financial support to the Fund, and you should not expect that the sponsor will provide financial support to the Fund at any time. |
| 3 | You could lose money by investing in the Fund. Although the Fund seeks to preserve the value of your investment at $1.00 per share, it cannot guarantee it will do so. The Fund may impose a fee upon sale of your shares or may temporarily suspend your ability to sell shares if the Fund’s liquidity falls below required minimums because of market conditions or other factors. An investment in the Fund is not a deposit of a bank and is not insured or guaranteed by the Federal Deposit Insurance Corporation or any other government agency. The Fund’s sponsor has no legal obligation to provide financial support to the Fund, and you should not expect that the sponsor will provide financial support to the Fund at any time. |
| 4 | Effective after the close of business on July 29, 2021, the Goldman Sachs Short Duration Income Fund was renamed the Goldman Sachs Short Duration Bond Fund. |
| * | This list covers open-end funds only. Please visit our website at www.GSAMFUNDS.com to learn about our closed-end funds and exchange-traded funds. |
TRUSTEES Jessica Palmer, Chair Dwight L. Bush Kathryn A. Cassidy Diana M. Daniels Joaquin Delgado James A. McNamara Roy W. Templin Gregory G. Weaver | OFFICERS James A. McNamara, President Joseph F. DiMaria, Principal Financial Officer, Principal Accounting Officer and Treasurer Caroline L. Kraus, Secretary | |
GOLDMAN SACHS & CO. LLC Distributor and Transfer Agent | GOLDMAN SACHS ASSET MANAGEMENT, L.P. Investment Adviser | |
Visit our web site at www.GSAMFUNDS.com to obtain the most recent month-end returns.
Goldman Sachs Asset Management, L.P., 200 West Street, New York, New York 10282
The reports concerning the Portfolios included in this shareholder report may contain certain forward-looking statements about the factors that may affect the performance of the Portfolios in the future. These statements are based on Portfolio management’s predictions and expectations concerning certain future events and their expected impact on the Portfolios, such as performance of the economy as a whole and of specific industry sectors, changes in the levels of interest rates, the impact of developing world events, and other factors that may influence the future performance of the Portfolios. Management believes these forward-looking statements to be reasonable, although they are inherently uncertain and difficult to predict. Actual events may cause adjustments in portfolio management strategies from those currently expected to be employed.
A description of the policies and procedures that the Portfolios use to determine how to vote proxies relating to portfolio securities and information regarding how a Portfolio voted proxies relating to portfolio securities during the most recent 12-month period ended June 30 is available (i) without charge, upon request by calling 1-800-526-7384 (for Retail Shareholders) or 1-800-621-2550 (for Institutional Shareholders); and (ii) on the Securities and Exchange Commission (“SEC”) web site at http://www.sec.gov.
The Portfolios will file portfolio holdings information for each month in a fiscal quarter within 60 days after the end of the relevant fiscal quarter on Form N-PORT. Portfolio holdings information for the third month of each fiscal quarter will be made available on the SEC’s web site at http://www.sec.gov. Portfolio holdings information may be obtained upon request and without charge by calling 1-800-526-7384 (for Retail Shareholders) or 1-800-621-2550 (for Institutional Shareholders).
Economic and market forecasts presented herein reflect our judgment as of the date of this report and are subject to change without notice. These forecasts do not take into account the specific investment objectives, restrictions, tax and financial situation or other needs of any specific client. Actual data will vary and may not be reflected here. These forecasts are subject to high levels of uncertainty that may affect actual performance. Accordingly, these forecasts should be viewed as merely representative of a broad range of possible outcomes. These forecasts are estimated, based on assumptions, and are subject to significant revision and may change materially as economic and market conditions change. Goldman Sachs has no obligation to provide updates or changes to these forecasts. Case studies and examples are for illustrative purposes only.
Goldman Sachs & Co. LLC (“Goldman Sachs”) does not provide legal, tax or accounting advice. Any statement contained in this communication (including any attachments) concerning U.S. tax matters was not intended or written to be used, and cannot be used, for the purpose of avoiding penalties under the Internal Revenue Code, and was written to support the promotion or marketing of the transaction(s) or matter(s) addressed. Clients of Goldman Sachs should obtain their own independent tax advice based on their particular circumstances.
Portfolio holdings and allocations shown are as of August 31, 2021 and may not be representative of future investments. Portfolio holdings should not be relied on in making investment decisions and should not be construed as research or investment advice regarding particular securities. Current and future holdings are subject to risk. Diversification does not protect an investor from market risk and does not ensure a profit.
This material is not authorized for distribution to prospective investors unless preceded or accompanied by a current Prospectus or summary prospectus, if applicable. Investors should consider a Portfolio’s objective, risks, and charges and expenses, and read the summary prospectus, if available, and/or the Prospectus carefully before investing or sending money. The summary prospectus, if available, and the Prospectus contain this and other information about a Portfolio and may be obtained from your authorized dealer or from Goldman Sachs & Co. LLC by calling (retail – 1-800-526-7384) (institutional – 1-800-621-2550).
Goldman Sachs & Co. LLC is the distributor of the Goldman Sachs Funds.
© 2021 Goldman Sachs. All rights reserved. 256213-OTU-1494830/TAGEDGAR-21
Goldman Sachs Funds

| Annual Report | August 31, 2021 | |||
Allocation Funds | ||||
Global Managed Beta Fund | ||||
Strategic Factor Allocation Fund | ||||
Strategic Volatility Premium Fund | ||||
Tactical Tilt Overlay Fund | ||||

Goldman Sachs Allocation Funds
| ∎ | GLOBAL MANAGED BETA FUND |
| ∎ | STRATEGIC FACTOR ALLOCATION FUND |
| ∎ | STRATEGIC VOLATILITY PREMIUM FUND |
| ∎ | TACTICAL TILT OVERLAY FUND |
| 5 | ||||
| 8 | ||||
| 25 | ||||
| 26 | ||||
| 58 | ||||
| 64 | ||||
| 64 | ||||
| 65 | ||||
| 68 | ||||
| 70 | ||||
| 73 | ||||
| 98 | ||||
| 99 | ||||
| NOT FDIC-INSURED | May Lose Value | No Bank Guarantee | ||
MARKET REVIEW
Goldman Sachs Allocation Funds
Market Review
During the 12-month period ended August 31, 2021 (the “Reporting Period”), the financial markets were most influenced by a rebound in global economic growth, the rollout of COVID-19 vaccines and the spread of the Delta variant, and monetary and fiscal stimulus measures.
In September 2020, when the Reporting Period began, the financial markets pulled back amid disappointment about the size of new U.S. fiscal stimulus and the resurgence of COVID-19 cases in parts of the U.S. and Europe. Meanwhile, economic activity continued to recover at a healthy pace in the U.S. and China, though the speed of that recovery moderated in Europe and Latin America. On the monetary policy front, the U.S. Federal Reserve (the “Fed”) kept its policy rate near zero and indicated the rate would remain unchanged until inflation moderately exceeded the Fed’s 2% target for some time. In the Eurozone, the European Central Bank (“ECB”) kept its policy rate on hold but committed to maintain an accommodative policy stance. Developed markets equities, as represented by the MSCI World Index, and emerging markets equities, as represented by the MSCI Emerging Markets Index, both fell, down 2.9% and 1.7%, respectively. Within developed markets, U.S. equities, as measured by the S&P 500® Index, and European equities, as measured by the EURO STOXX 50®, declined 3.8% and 2.3%, respectively. In fixed income, the 10-year U.S. Treasury yield fell two basis points, while the 10-year German government bond yield declined 12 basis points, reflecting the slower pace of recovery in the Euro area. (A basis point is 1/100th of a percentage point.)
During the fourth quarter of 2020, global economic activity remained resilient in spite of renewed worries about rising COVID-19 cases, delays in additional U.S. fiscal stimulus and general market uncertainty surrounding the possibility of a contested U.S. Presidential election. Although an increase in COVID-19 cases, especially in Europe and the U.S., drove heightened financial market volatility, the announcement that the Pfizer and Moderna COVID-19 vaccines had better than consensus expected efficacy appeared to be a huge relief for policymakers and market participants. Investor confidence was further bolstered by the strong economic data from Asia, and from China in particular. In addition, major global central banks appeared to reassure market participants by committing to accommodative monetary policies. In the U.S., the Fed introduced forward guidance for its asset purchases, stating it would continue to increase its U.S. Treasury and mortgage-backed securities purchases until substantial further progress was made towards its maximum employment and price stability goals. Similarly, the ECB committed to continued support for the Eurozone economy by expanding and extending its Pandemic Emergency Purchase Programme. Overall, this favorable mix of recovering global economies, positive news flow on COVID-19 vaccines and strong forward guidance from the major central banks was supportive of risk assets, particularly equities, in the fourth calendar quarter. Global equities, as represented by the MSCI ACWI Investable Market Index, rose 15.7%. U.S. equities, as measured by the S&P 500® Index, rose 12.15%. Developed markets equities, as represented by the MSCI World Index, and emerging markets equities, as represented by the MSCI Emerging Markets Index, rose approximately 13.9% and 19.7%, respectively. As for fixed income, the 10-year U.S. Treasury yield rose during the fourth quarter of 2020 but remained well below its highs seen near the beginning of the calendar year.
Global economic activity continued to improve in the first quarter of 2021, as ongoing unprecedented policy responses and an improving COVID-19 vaccine rollout set the stage for a significant economic recovery and a strong growth cycle. For example, in the U.S., an additional round of fiscal stimulus was approved early in the quarter, and government officials confirmed COVID-19 vaccines would be widely available for all American adults before the summer. Investor confidence grew and interest rates began to rise on market expectations for significantly stronger U.S. and global economic growth. Large-cap growth stocks, which had gained favor during the COVID-19 crisis, began to underperform large-cap value stocks, which stood to benefit, in many investors’ view, from a sustained cyclical upswing in global economic activity. For similar reasons, U.S. small-cap equities outperformed U.S. large-cap equities during the first calendar quarter.
Mid-year 2021 marked important mileposts for the post-pandemic investing landscape. By June, about half of the adult U.S. population had been vaccinated against COVID-19, and consumer behavior showed clear indications of normalization. The reality of the improving macro landscape produced a significant improvement in 2021 corporate earnings expectations, which, in turn, helped drive up second calendar quarter U.S. and global equity returns. The rapid pace and vigor of the economic rebound also seemed to increase inflationary pressures, sparking a broad debate about whether such pressures would be transitory or longer lasting.
1
MARKET REVIEW
July 2021 was a mixed month for risk assets. Market sentiment was broadly supported by reassuring comments from central bank officials and strong corporate earnings, which helped to outweigh growing concerns about the spread of the more infectious Delta variant of COVID-19 in numerous countries and a regulatory crackdown in China that led to a large equity sell-off in the Asian region. While developed markets equities, as represented by the MSCI World Index, gained 1.7%, emerging markets equities, as represented by the MSCI Emerging Markets Index, were down 6.5%, primarily due to a decline in Chinese equities. In fixed income, both the 10-year U.S. Treasury yield and the 10-year German government bond yield fell by approximately 20 basis points, although the consensus forecast had been for yields to grind higher. Investors may have changed their expectations about the timing of future interest rate hikes, even with higher than consensus expected inflation readings, because of increasing concerns about the Delta variant and reassurance by central bank officials about continued low interest rates. At its July meeting, the U.S. Fed kept its policy rates unchanged, in line with these expectations.
Two key focuses for market participants in August 2021 were worries about waning vaccine efficacy against more infectious COVID-19 variants and monetary policy guidance from the U.S. Fed. During August, Fed Chair Jerome Powell acknowledged strength in the labor market but highlighted downside risks from the Delta variant. He hinted at the possibility the Fed might start to taper its bond purchases in 2021 but indicated that interest rate hikes were further in the future, as the U.S. unemployment rate remained high and policymakers thought inflation was likely to be transient. Global equities witnessed a broad-based rally with developed markets equities, as measured by the MSCI World Index, and emerging markets equities, as measured by the MSCI Emerging Markets Index, rising 2.7% and 2.3%, respectively. Global bond yields generally increased during August.
U.S. Equities
U.S. equities moved lower as the Reporting Period began in September 2020, with the S&P 500® Index declining for the first time in five months. Shares of large-cap technology companies, which had been key drivers of the market’s powerful rally from its March 2020 lows, fell sharply in early September amid concerns about stretched valuations, among other factors. There were also worries about Congress failing to break an impasse on a fifth fiscal aid package, and it appeared there might well be strong division in advance of the then-upcoming U.S. Presidential elections. Still, corporate earnings were better than consensus expected.
In the fourth quarter of 2020, U.S. equities rebounded for the third consecutive quarter, extending a broad-based recovery from steep first quarter 2020 declines. Stocks rallied on prospects of an end to the global COVID-19 pandemic and its weighty economic impact with the distribution of approved COVID-19 vaccines. While uncertainty surrounding the U.S. elections and other policy questions created the potential for higher market volatility, the Democrat victory for U.S. President in November proved positive for equity markets during the quarter. After a historically sharp but short recession in the spring of 2020, many major economies, including that of the U.S., entered an early-cycle phase of recovery. Employment conditions improved as temporary job losses were regained, and U.S. manufacturing activity recovered. However, reminders of a COVID-19 ceiling for industries hit hardest by the restrictions caused by the pandemic persisted.
Rising bond yields and a value-led U.S. equity market dominated the first quarter of 2021. The key driver of this performance was the Democrat victory for Senators in Georgia in January, which, in turn, paved the way for additional massive U.S. fiscal stimulus and progress in the COVID-19 vaccine rollout. An increase in the 10-year U.S. Treasury yield benefited the financials sector and value stocks. The accelerating rollout of COVID-19 vaccines boosted investors’ hopes of a sustainable reopening of the economy. Small-cap stocks, which tend to be more cyclical and domestically focused, performed particularly well. The passage of a fiscal stimulus package led to upgrades in consensus forecasts for U.S. Gross Domestic Product growth for 2021. Some investors worried that the size of the fiscal stimulus could provoke an uptick in inflation. However, despite upgrading its economic growth forecasts and expecting unemployment to decline, the U.S. Federal Reserve (the “Fed”) stated it did not believe inflation would be meaningfully above target and did not expect to raise interest rates before 2024.
The U.S. equity market continued to perform well in the second quarter of 2021 overall. Discussions centered on the Fed liquidity tailwind, fiscal stimulus, COVID-19 vaccine progress, economic reopening momentum, strong corporate profit backdrop and robust equity inflows. While inflation concerns were fairly pervasive, the Fed remained consistent in its messaging around expectations that price pressures would be transitory. However, the peak inflation theme gained traction as the quarter progressed even as economists suggested the transitory period may be longer than initially expected. Corporate earnings season brought another round of outsized beats over consensus estimates, along with corporate commentary highlighting some input pressures
2
MARKET REVIEW
offset by above-average pricing power or productivity initiatives. Despite a late-quarter agreement between the White House and a bipartisan group of Senators on the framework of a physical infrastructure package, the path to additional fiscal stimulus remained complicated.
U.S. equities continued to move higher in July and August 2021. Bullish narrative surrounding central bank liquidity tailwinds, excess savings from fiscal stimulus, economic reopening momentum, COVID-19 vaccine efficacy, upside corporate earnings surprises, elevated operating leverage, corporate buyback boom and retail impulse prevailed. Discussions centered around the reflation trade and the spread of the Delta variant of COVID-19. Focus remained on the possibility the Fed may not be as willing to let the economy run as “hot” as initially envisioned under its policy framework and on the Fed tapering its asset purchases, though payroll growth remained a key input in the tapering discussion. The U.S. Senate passed a $1 trillion bipartisan infrastructure bill in August, though the path to additional fiscal stimulus continued to be complicated. By the end of August, the second calendar quarter corporate earnings season had largely closed out with a year-over-year earnings per share growth rate topping 90%.
Fixed Income
As for the fixed income markets, they broadly weakened in September 2020 amid a rise in risk-off investor sentiment, or reduced risk appetite. Renewed COVID-19 case growth in Europe, reduced prospects for further U.S. fiscal support and rising political uncertainty leading into the then-upcoming U.S. elections all contributed to increased market volatility and risk aversion. Meanwhile, the Fed kept its monetary policy and forward guidance unchanged as it awaited details on further U.S. government fiscal stimulus and the path of the COVID-19 pandemic. The Fed also extended its credit facilities, which had been set to expire in September, to the end of the 2020 calendar year, thereby elongating the policy tailwind for corporate credit markets.
Spread sector performance was mixed during the fourth quarter of 2020. Rising COVID-19 cases and renewed lockdowns dominated pandemic-related news flow early in the quarter. Then encouraging efficacy results for several COVID-19 vaccines helped lift market sentiment into the end of the calendar year. Risk sentiment was also bolstered late in the quarter by the removal of a few long-standing overhangs. Specifically, the U.S. presidential elections were resolved; the U.K. and European Union agreed to a post-Brexit deal; and another round of fiscal stimulus was provided by the U.S. federal government. (Brexit refers to the U.K.’s exit from the European Union.) Global economic conditions remained weak, with the inflation picture relatively benign due to slack in economic output and employment. Central banks around the world maintained their commitment to accommodative monetary policy. In the U.S., the Fed introduced dovish forward guidance at its December 2020 meeting, stating it would continue to increase its asset holdings “until substantial further progress has been made toward the Committee’s maximum employment and price stability goals.” (Dovish tends to suggest lower interest rates; opposite of hawkish.) Meanwhile, the U.S. Department of the Treasury decided to let several of the Fed’s emergency credit facilities expire at the end of 2020 and requested the Fed return unused funds. In Europe, the European Central Bank (“ECB”) announced a multi-pronged package of easing measures, in line with market expectations, extended the horizon for its pandemic emergency purchase program, and increased the level of its purchases.
During the first quarter of 2021, spread sector performance was largely negative. When the quarter began in January, the rollout of COVID-19 vaccines and the prospects for additional U.S. government fiscal stimulus pushed up U.S. interest rates. That said, positive COVID-19 vaccine rollout news was somewhat counteracted by the emergence of variant coronavirus strains and uncertainty over global vaccine supply. In February, the rise in interest rates became global in nature, as markets responded to recovering economic growth amid COVID-19 vaccine rollouts and concerns around upside inflation risks. To varying degrees, global central banks leaned against market expectations for earlier than previously anticipated policy normalization, indicating policy would remain accommodative, despite improvements in economic growth, given weak underlying inflation dynamics. Although global interest rates continued to rise during March, central banks’ dovish stances helped to stabilize those rates. In the U.S., the Fed revised its economic growth and inflation projections higher but kept its median dot plot projection flat through 2023. (The dot plot shows interest rate projections of the members of the Federal Open Market Committee.) Fed policymakers also emphasized they would focus on inflation outcomes rather than inflation outlooks. In Europe, the ECB increased the pace of its asset purchases in an effort to preserve favorable financing conditions and noted it would review the pace of purchases in the context of fresh inflation projections every quarter. Meanwhile, the new U.S. President signed the American Rescue Plan Act into law in March 2021, with the overall cost of this fifth fiscal stimulus package amounting to nearly $1.9 trillion.
3
MARKET REVIEW
For the second quarter of 2021, spread sectors broadly generated positive returns. At its April policy meeting, the Fed was upbeat as economic data continued to improve, but it did not hint at tapering its monthly purchases of U.S. Treasury securities and mortgage-backed securities, saying policymakers still needed to see “substantial progress” on employment and inflation goals. In May, remarkably strong U.S. inflation data, coupled with the release of a disappointing April U.S. jobs report, suggested that pandemic-related dynamics, such as economic reopening, policy support and temporary supply shortages, were likely to continue distorting economic data in the near term. This led to a recalibration in the market’s economic growth expectations, though the reassessment may also have reflected investors’ concerns about the spreading Delta variant and the potential of a sooner than consensus anticipated withdrawal of Fed policy support. Indeed, during June, Fed officials began to discuss when it might be appropriate to start tapering its asset purchases. The Fed’s median dot plot projection also forecast two interest rates hikes in 2023, sparking a hawkish market response that led to a flattening of the U.S. Treasury yield curve and a strengthening of the U.S. dollar. (Hawkish tends to imply higher interest rates. Yield curve is a spectrum of interest rates based on maturities of varying lengths. A flattening yield curve is one wherein the differential in yields between longer-term and shorter-term maturities narrows; opposite of a steepening yield curve.)
During July 2021, spread sector performance was rather flat, though relatively resilient, amid ongoing concerns about the spread of the Delta variant, especially in countries with low levels of vaccination, and its potential impact on the global economic recovery. Technical factors (i.e., supply and demand) also bolstered spread sectors. The Fed kept its monetary policy unchanged but noted the U.S. economy was “making progress” towards its price stability and employment goals. In Europe, the ECB strengthened its forward guidance, cementing its dovish policy stance for the near term.
The global economic recovery continued in August 2021 though markets remained focused on concerns around the Delta variant. The main macro event was the Fed’s Jackson Hole symposium during which Fed Chair Jerome Powell gave a dovish speech. He noted that substantial progress had been made on the Fed’s labor market mandate and reiterated the Fed’s view that an uptick in U.S. inflation was largely driven by temporary factors. These comments eased market nerves about the pace of monetary policy normalization and supported spread sectors, which recorded marginally positive performance overall during August.
4
PORTFOLIO RESULTS
Goldman Sachs Global Managed Beta Fund
Investment Objective
The Fund seeks to provide long-term capital growth.
Portfolio Management Discussion and Analysis
Below, the Goldman Sachs Multi-Asset Solutions (“MAS”) Group (formerly, the Goldman Sachs Global Portfolio Solutions Group) discusses the Goldman Sachs Global Managed Beta Fund’s (the “Fund”) performance and positioning for the 12-month period ended August 31, 2021 (the “Reporting Period”).
| Q | How did the Fund perform during the Reporting Period? |
| A | During the Reporting Period, the Fund’s Institutional Shares generated an average annual total return of 31.87%. This return compares to the 30.41% average annual total return of the Fund’s benchmark, the MSCI All Country World Index Investable Market Index (“ACWI IMI”) (Net, USD, 50% Non-US Developed Hedged to USD) (the “Index”), during the same time period. |
| Q | What key factors affected the Fund’s performance during the Reporting Period? |
| A | The Fund primarily seeks to achieve its investment objective by investing in a diversified portfolio of underlying asset classes that provide broad beta exposure to the global equity markets. (Beta refers to the component of returns that is attributable to market risk exposure, rather than manager skill.) The MAS Group determines allocations to the underlying asset classes — and within the underlying asset classes — based on its cycle-aware long-term strategic allocation model, which may include factor-based diversification. The factor-based diversification approach is implemented through a separately managed account composed of individual stock positions. In addition, the MAS Group uses an options-based strategy, which seeks to generate returns in moderately rising or moderately declining global equity markets where the realized volatility may be lower than the volatility implied by options prices. |
During the Reporting Period, the Fund outperformed the Index, driven mostly by its strategic allocation to a volatility selling strategy. (Volatility selling seeks to benefit from changes in the level of market implied volatility (i.e., expectations of future volatility) in equity markets.) This strategy, which had previously been hurt in March 2020 by COVID-19-related market turmoil, posted gains as volatility declined during the course of the Reporting Period. In addition, the Fund benefited from its exposure to equity market segments, especially small-cap stocks, that are sensitive to economic growth. These assets performed well amid the recovery in global economic growth and due to supportive measures by governments and central banks. |
On the negative side, the Fund’s factor-based strategies and its exposure to emerging markets equities detracted from performance during the Reporting Period. Our factor-based strategies are Momentum, Valuation, Quality and Volatility. The Momentum factor seeks to identify companies whose stock prices are expected to increase or decrease (by, among other things, evaluating each company’s recent performance results). The Valuation factor seeks to identify companies whose stock prices are trading at a discount to their fundamental or intrinsic value (by, among other things, comparing each company’s book value to market value). The Quality factor seeks to identify companies that are expected to generate higher returns on assets (i.e., more profitable). The Volatility factor seeks to identify companies whose stock prices are expected to have a relatively lower degree of fluctuation over time. |
| Q | How was the Fund positioned at the beginning of the Reporting Period? |
| A | In terms of its strategic allocation at the beginning of the Reporting Period, the Fund had 101.59% of its total net assets invested in equity-related investments, 0.27% in the macro hedging strategy, 4.75% in the volatility selling strategy and 0% in cash and cash equivalents. However, the Fund maintained a position in cash and cash equivalents to cover the exposure of various derivatives positions. This above sector breakout is inclusive of derivative exposure across all asset classes. |
5
PORTFOLIO RESULTS
| Q | How did you tactically manage the Fund’s allocations during the Reporting Period? |
| A | In January 2021, we adjusted the Fund’s strategic allocations to account for a lesser weighting in the macroeconomic hedge strategy through which we seek to diversify the Fund’s overall exposure to global equity asset classes. The Fund had taken profits on approximately two-thirds of its macroeconomic hedge strategy in March 2020 before the Reporting Period began. The adjustment led to slight increases in the Fund’s strategic allocation to the volatility selling strategy and its overall exposure to equities, both of which we increased again in February 2021 and then once more in May. |
During February 2021, we initiated a view that the Fund be overweight U.S. large-cap equities, which are sensitive to a cyclical economic recovery. We modestly increased the size of that overweight during April. In March and then again in June, we tactically increased the Fund’s allocation to the macroeconomic hedge strategy. As the market started to price in potential interest rate hikes in 2022-2023 and the U.S. Treasury yield curve steepened, the attractiveness of the macroeconomic hedge marginally increased, in our view, and we opportunistically added to the Fund’s allocation. (Yield curve is a spectrum of interest rates based on maturities of varying lengths. A steepening yield curve is one wherein the differential in yields between longer-term and shorter-term maturities widens; opposite of a flattening yield curve.) |
| Q | How did the Fund use derivatives and similar instruments during the Reporting Period? |
| A | During the Reporting Period, equity futures were employed to express our passive investment views with greater versatility. The use of these instruments to gain exposure to U.S. large-cap equities, U.S. small-cap equities and Canadian equities during the Reporting Period contributed positively to the Fund’s performance, as these positions generated returns similar to the asset classes they represented. In addition, the Fund employed currency forwards, interest rate options and total return swaps to afford greater risk management of macroeconomic and foreign exchange risks in the portfolio. Currency forwards added to the Fund’s returns due to strength in the U.S. dollar versus other developed markets currencies. Interest rate options also added to the Fund’s performance, as they broadly accomplished their intended purpose during periods of risk-off investor sentiment, or reduced risk appetite. Total return swaps marginally added to the Fund’s performance. Total return swaps were used to gain exposure to a custom-created basket of pro-cyclical equity securities. Also, the Fund used equity index options as part of the volatility selling strategy. The impact of equity index options on the Fund’s performance was positive as COVID-19-related market volatility subsided during the course of the Reporting Period. |
| Q | How was the Fund positioned at the end of the Reporting Period? |
| A | In terms of its strategic allocation at the end of the Reporting Period, the Fund had 105.40% of its total net assets invested in equity-related investments, 0.70% in the macro hedging strategy, 6.00% in the volatility selling strategy and 0% in cash and cash equivalents. However, the Fund maintained a position in cash and cash equivalents to cover the exposure of various derivatives positions. This above sector breakout is inclusive of derivative exposure across all asset classes. |
| Q | Were there any changes to the Fund’s portfolio management team during the Reporting Period? |
| A | Effective February 3, 2021, Kate El-Hillow no longer served as a portfolio manager of the Fund. At the end of the Reporting Period, Neill Nuttall and Siwen Wu served as portfolio managers of the Fund. By design, all investment decisions for the Fund are performed within a team structure, with multiple subject matter experts. This strategic decision making has been the cornerstone of our approach and ensures continuity in the Fund. |
| Q | What is the Fund’s tactical asset allocation view and strategy for the months ahead? |
| A | At the end of the Reporting Period, we were focused on three themes: 1) the economic speedbump created by the Delta variant of COVID-19, 2) supply bottlenecks, and 3) inflation that we believed would moderate from elevated levels. First, we thought the new wave of global COVID-19 infections due to the Delta variant would pose a headwind to the momentum of the global economic recovery. However, given the substantial progress on COVID-19 vaccinations, particularly in major developed countries and in China, we expected the economic impact to be temporary and limited in magnitude compared to the initial COVID-19 shock during the spring of 2020. Second, we believed a number of challenges, including semiconductor shortages, unemployment benefits in the U.S. and surges in COVID-19 infections in manufacturing hubs and ports, had increased the supply bottlenecks that have weighed on production globally. That said, at the end of the Reporting Period, a number of indicators showed that supplier delivery times and inventory levels may have started to stabilize, and we expected supply |
6
PORTFOLIO RESULTS
| bottlenecks to gradually fade following the Delta variant surge and as unemployment benefits expire. Third, the easing of the supply bottlenecks in product and labor markets should relieve the intense pressure on the prices of goods, in our view, although we expected moderately upward inflationary pressure to persist with a broadening of the demand recovery in the services sector. |
| In terms of positioning, the Fund was generally in line with its long-term strategic asset allocation at the end of the Reporting Period. Stock market exposures had been aligned with the broad theme of sustained cyclical expansion. If the economic recovery — supported by faster global vaccinations — continues, there should be further upside for equities, in our opinion. However, because of the largely unpredictable nature of COVID-19 and the more infectious Delta variant in particular, we planned to continue monitoring the pandemic overall, as well as other factors, such as the inflation outlook, quite closely. |
| At the asset class level at the end of the Reporting Period, we expected equity performance overall to be supported by solid corporate earnings growth in the near term. In addition, we thought the risk premium of stocks relative to U.S. Treasury securities remained attractive in the low interest rate environment. Nevertheless, we intended to balance these views against what we considered to be high absolute valuations. As for corporate credit, we noted the sector had benefited strongly during the Reporting Period from policy support and the improving economic growth backdrop, while default concerns had moderated significantly from 2020’s peak levels. Credit spreads (yield differentials between corporate bonds and U.S. Treasury securities of comparable maturity) had tightened to pre-COVID-19 levels, and the credit risk premium (a measure of expected excess returns) had remained low. Additionally, we expected long-term bond yields to be supported in the near term by market expectations of continued economic normalization beyond the short-term effects of COVID-19 variants, the likelihood of additional fiscal spending and the U.S. Fed’s movement toward the tapering of asset purchases. |
7
Global Managed Beta Fund
as of August 31, 2021
| FUND COMPOSITION1 | ||||
| Percentage of Net Assets | ||||

| 1 | Underlying sector allocations of exchange traded funds and investment companies held by the Fund are not reflected in the graph above. The percentage shown for each investment category reflects the value of investments in that category as a percentage of net assets. Figures in the graph may not sum to 100% due to the exclusion of other assets and liabilities. The graph depicts the Fund’s investments but may not represent the Fund’s market exposure due to the exclusion of certain derivatives, if any, as listed in the Additional Investment Information section of the Schedule of Investments. |
For more information about your Fund, please refer to www.GSAMFUNDS.com. There, you can learn more about your Fund’s investment strategies, holdings, and performance.
8
GOLDMAN SACHS GLOBAL MANAGED BETA FUND
Performance Summary
August 31, 2021
The following graph shows the value, as of August 31, 2021, of a $1,000,000 investment made on April 30, 2015 (commencement of operations) in Institutional Shares at NAV. The performance data in the graph for the Fund’s Institutional Shares, which do not impose an initial sales charge, do not reflect an initial sales charge for the period shown. For comparative purposes, the performance of the Fund’s benchmark, the MSCI All Country World Index Investable Market Index (Net, USD, 50% Non-US Developed Hedged to USD), is shown. Performance reflects applicable fee waivers and/or expense limitations in effect during the periods shown and in their absence, performance would be reduced. Returns do not reflect the deduction of taxes that a shareholder would pay on Fund distributions or the redemption of Fund shares. The returns set forth below represent past performance. Past performance does not guarantee future results. The Fund’s investment return and principal value will fluctuate so that an investor’s shares, when redeemed, may be worth more or less than their original cost. Current performance may be lower or higher than the performance quoted below. Please visit our web site at www.GSAMFUNDS.com to obtain the most recent month-end returns.
| Global Managed Beta Fund’s Lifetime Performance |
Performance of a $1,000,000 Investment, with distributions reinvested, from April 30, 2015 through August 31, 2021.
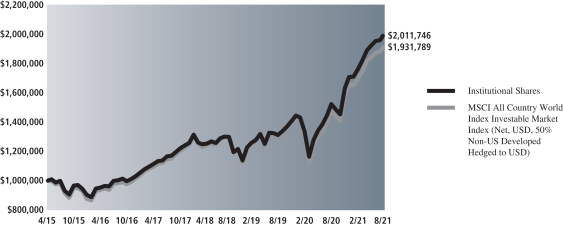
| Average Annual Total Return through August 31, 2021* | One Year | Five Years | Since Inception | |||||||
Institutional Shares (Commenced April 30, 2015) | 31.87% | 14.90% | 11.65% | |||||||
| ||||||||||
| * | Because Institutional Shares do not involve a sales charge, such a charge is not applied to its Average Annual Total Return. |
9
PORTFOLIO RESULTS
Goldman Sachs Strategic Factor Allocation Fund
Investment Objective
The Fund seeks long-term total return.
Portfolio Management Discussion and Analysis
Below, the Goldman Sachs Quantitative Investment Strategies Team (“QIS Team”) discusses the Goldman Sachs Strategic Factor Allocation Fund’s (the “Fund”) performance and positioning for the 12-month period ended August 31, 2021 (the “Reporting Period”).
| Q | How did the Fund perform during the Reporting Period? |
| A | During the Reporting Period, the Fund’s Institutional, Class R6 and Class P Shares generated average annual total returns of 15.01%, 15.08% and 15.09%, respectively. These returns compare to the 14.77% average annual total return of the Fund’s blended benchmark, the Strategic Factor Allocation Composite Index (the “Index”), which is composed 50% of the S&P 500® Index and 50% of the Bloomberg U.S. Aggregate Bond Index, during the same period. The components of the Fund’s blended benchmark, the S&P 500® Index and the Bloomberg U.S. Aggregate Bond Index, generated average annual total returns of 31.17% and -0.08%, respectively, during the Reporting Period. |
| Q | What key factors affected the Fund’s performance during the Reporting Period? |
| A | The Fund seeks to achieve its investment objective through the implementation of the Goldman Sachs Strategic Factor Allocation process (“Strategic Allocation”), which is derived from the Goldman Sachs Investment Strategy Group’s (“ISG”) market views on a variety of asset classes and instruments. The Strategic Allocation was developed to provide exposure to “factors,” which are academically derived drivers of investment returns that the Goldman Sachs ISG believes offer the potential for greater and more consistent returns in various market environments. These factors include, but are not limited to, Equity, Term, Flow and Volatility. The QIS Team implements the Strategic Allocation by investing in derivatives and pooled investment vehicles, including, but not limited to, investment companies, including exchange-traded funds (“ETFs”) (the “Underlying Funds”) and exchange-traded notes (“ETNs”). The Underlying Funds may include affiliated investment companies. The Strategic Allocation may also be implemented by investing in any one or a combination of the following asset classes: (i) U.S. and foreign equity securities, including common and preferred stocks; (ii) fixed income instruments, which include, among others, debt issued by governments (including the U.S. and foreign governments), their agencies, instrumentalities, sponsored entities, and political subdivisions, notes, debt participations and non-investment grade securities (commonly known as “junk bonds”); and (iii) foreign exchange contracts. |
During the Reporting Period, the Strategic Allocation added overall to the Fund’s performance. In relative terms, the Flow and Volatility factors contributed positively to returns, while the Equity and Term factors detracted from performance. On an absolute basis, the Equity, Flow and Volatility factors added to returns, while the Term factor detracted from results. The Equity factor seeks to capture the premium associated with equity risk. The Flow factor seeks to systematically capitalize on flows within and across asset classes. The Volatility factor seeks to capture the “fear premium” associated with equity risk. (The fear premium is the amount investors tend to overpay to preserve capital during periods of financial market volatility.) The Term factor seeks to capture the premium associated with interest rate and inflation risk. |
| Q | How was the Fund positioned at the beginning of the Reporting Period? |
| A | In terms of its Strategic Allocation at the beginning of the Reporting Period, the Fund maintained equal weightings in the Equity, Flow and Volatility factors. It had a relatively smaller weighting in the Term factor. |
In terms of underlying asset classes and instruments, the Fund maintained positions in U.S. equities, listed U.S. equity index options, listed U.S. fixed income options and U.S. fixed income. In terms of currencies, it held long positions versus the U.S. dollar in the Australian dollar and the New |
10
PORTFOLIO RESULTS
| Zealand dollar. It held short positions relative to the U.S. dollar in the Canadian dollar, euro and Swiss franc. The Fund did not hold positions versus the U.S. dollar in the British pound or Japanese yen at the start of the Reporting Period. |
| Q | How did the Fund use derivatives and similar instruments during the Reporting Period? |
| A | The Fund uses derivatives for both hedging and non-hedging purposes in the implementation of the Strategic Allocation. During the Reporting Period, the Fund employed listed equity index options and listed equity futures to implement views on the U.S. equity market, which had a positive impact on performance. It used bond futures and bond futures options to express views on the U.S. fixed income market, which had a positive impact on returns. In addition, forward foreign currency exchange contracts, which were used to take long and short positions in select developed markets currencies, had a positive impact overall on the Fund’s results during the Reporting Period. |
| Q | Were there any changes to the Fund’s portfolio management team during the Reporting Period? |
| A | Effective February 26, 2021, John Landers no longer served as a portfolio manager of the Fund and Patrick Harnett became a portfolio manager of the Fund. As of March 26, 2021, Nishank Modi no longer served as a portfolio manager of the Fund and James Park became a portfolio manager of the Fund. At the end of the Reporting Period, Federico Gilly, Patrick Harnett and James Park served as portfolio managers of the Fund. By design, all investment decisions for the Fund are performed within a team structure, with multiple subject matter experts. This strategic decision making has been the cornerstone of our approach and ensures continuity in the Fund. |
| Q | How was the Fund positioned at the end of the Reporting Period? |
| A | In terms of its Strategic Allocation at the end of the Reporting Period, the Fund had equal weightings in the Equity, Flow and Volatility factors. It maintained a relatively smaller weighting in the Term factor. |
In terms of underlying asset classes and instruments, the Fund held positions in U.S. equities, listed U.S. equity index options, U.S. fixed income and listed U.S. fixed income options. In terms of currencies, it had long positions versus the U.S. dollar in the Australian dollar and the New Zealand dollar. It had short positions relative to the U.S. dollar in the Canadian dollar, euro, Swiss franc and Japanese yen. The Fund did not hold a position versus the U.S. dollar in the British pound at the end of the Reporting Period. |
| Q | What was the Fund’s strategy at the end of the Reporting Period? |
| A | Going forward, the QIS Team plans to continue implementing the Goldman Sachs Strategic Factor Allocation process as it seeks long-term total return. |
11
FUND BASICS
Strategic Factor Allocation Fund
as of August 31, 2021
HOLDINGS AS OF 8/31/211 | ||||||||
Holding | % of Net Assets | Line of Business | ||||||
Goldman Sachs Financial Square Government Fund — Institutional Shares | 73.5 | % | Investment Companies | |||||
| 1 | The holdings may not be representative of the Fund’s future investments. Figures in the table above may not sum to 100% due to the exclusion of other assets and liabilities. The holdings may not represent the Fund’s market exposure due to the exclusion of certain derivatives, if any, as listed in the Additional Investment Information section of the Schedule of Investments. |
12
GOLDMAN SACHS STRATEGIC FACTOR ALLOCATION FUND
Performance Summary
August 31, 2021
The following graph shows the value, as of August 31, 2021, of a $1,000,000 investment made on May 31, 2016 (commencement of operations) in Institutional Shares at NAV. For comparative purposes, the performance of the Fund’s benchmark, the Strategic Factor Allocation Composite Index, which is comprised of 50% of the S&P 500® Index and 50% of the Bloomberg U.S. Aggregate Bond Index, is shown. Performance reflects applicable fee waivers and/or expense limitations in effect during the periods shown and in their absence, performance would be reduced. Returns do not reflect the deduction of taxes that a shareholder would pay on Fund distributions or the redemption of Fund shares. The returns set forth below represent past performance. Past performance does not guarantee future results. The Fund’s investment return and principal value will fluctuate so that an investor’s shares, when redeemed, may be worth more or less than their original cost. Current performance may be lower or higher than the performance quoted below. Please visit our web site at www.GSAMFUNDS.com to obtain the most recent month-end returns.
| Strategic Factor Allocation Fund’s Lifetime Performance |
Performance of a $1,000,000 Investment, including any applicable sales charges, with distributions reinvested, from May 31, 2016 through August 31, 2021.
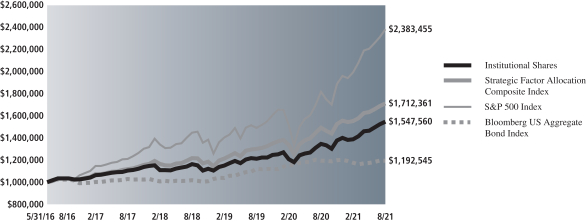
| Average Annual Total Return through August 31, 2021* | One Year | Five Years | Since Inception | |||||||
Institutional (Commenced May 31, 2016) | 15.01% | 8.39% | 8.66% | |||||||
| ||||||||||
Class R6 (Commenced December 29, 2017) | 15.08% | N/A | 8.53% | |||||||
| ||||||||||
Class P (Commenced April 17, 2018) | 15.09% | N/A | 10.10% | |||||||
| ||||||||||
| * | These returns assume reinvestment of all distributions at NAV. Because Institutional, Class R6 and Class P Shares do not involve a sales charge, such a charge is not applied to their Average Annual Total Return. |
13
PORTFOLIO RESULTS
Goldman Sachs Strategic Volatility Premium Fund
Investment objective
The Fund seeks long-term total return.
Portfolio Management Discussion and Analysis
Below, the Goldman Sachs Quantitative Investment Strategies Team (“QIS Team”) discusses the Goldman Sachs Strategic Volatility Premium Fund’s (the “Fund”) performance and positioning for the period since its inception on March 29, 2021 through August 31, 2021 (the “Reporting Period”).
| Q | How did the Fund perform during the Reporting Period? |
| A | During the Reporting Period, the Fund’s Institutional and Class P Shares generated cumulative total returns of 1.00% and 1.00%, respectively. These returns compare to the 0.35% cumulative total return of the Fund’s benchmark, the Bloomberg 1-5 Year U.S. Treasury Index, during the Reporting Period. |
| Q | What key factors affected the Fund’s performance during the Reporting Period? |
| A | The Fund seeks to achieve its investment objective through the implementation of a volatility overlay strategy (“Strategic Volatility Premium”), which is a “factor” within the Strategic Factor Allocation process of the Goldman Sachs Investment Strategy Group (“ISG”). The Strategic Allocation was developed to provide exposure to “factors,” which are academically derived drivers of investment returns the Goldman Sachs ISG believes offer the potential for greater and more consistent returns in various market environments. Through the Strategic Volatility Premium, the QIS Team seeks to enhance the returns of a fixed income allocation to U.S. Treasury securities by using an options-based overlay strategy and hedging with S&P 500® Index futures. The Fund may use futures contracts, primarily futures on indexes, options on indexes and options on futures to more effectively gain targeted exposure to the Strategic Volatility Premium, to equitize cash and to hedge the Fund’s portfolio if it is unable to purchase or write the necessary options for its overlay strategy. |
| During the Reporting Period, the Strategic Volatility Premium generated positive absolute returns that outperformed the Fund’s benchmark. |
| Q | How did the Fund’s options-based overlay strategy affect its performance? |
| A | Consistent with our investment approach, we construct the Fund’s options-based overlay by simultaneously selling out-of-the-money short-dated put options while buying further out-of-the-money longer-dated put options on the S&P 500® Index. To limit the downside risk of the written put options, further out-of-the-money long put options and S&P 500® Index futures are used to reduce the impact to the Fund if the S&P 500® Index approaches or falls past the strike price of the written put options. (“Out-of-the-money” is a term used to describe a put option with a strike price that is lower than the market price of the underlying asset. A put option is an option contract that gives the holder the right, but not the obligation, to sell a specified amount of an underlying asset at a specified price within a specified time.) The options-based overlay strategy is designed to provide the Fund with enhanced returns and additional income. The downside risk is mitigated to the extent of the difference between the strike price of a put option purchased and the strike price of a put option sold, as well as futures-based hedging positions. |
| As the seller of put options, the Fund will receive cash (the “premium”) from the purchaser. If the purchaser exercises the put option, the Fund pays the purchaser the difference between the strike price of the option and the price of the index at the time of exercise. The premium, the exercise price and the market price of the index determine the gain or loss realized by the Fund as the seller of put options. As the buyer of put options, the Fund will pay the “premium” to the seller. If the Fund exercises the put option, the seller will pay the Fund the difference between the strike price of the option and the price of the index at the time of exercise. The premium, the exercise price and the market price of the index determine the gain or loss realized by the Fund as the buyer of put options. |
14
PORTFOLIO RESULTS
| During periods in which expected volatility in the U.S. equity markets exceeds subsequent realized volatility, a portfolio of U.S. Treasury securities, with an options-based overlay strategy, may outperform the same portfolio without such an options-based overlay strategy. However, a portfolio with an options-based overlay strategy may underperform the same portfolio without such an options-based overlay if realized volatility in the U.S. equity markets exceeds expected volatility. |
| During the Reporting Period, expected volatility in the U.S. equity markets exceeded subsequent realized volatility, and thus the Fund’s options-based overlay strategy added to performance. |
| Q | How was the Fund positioned at the beginning of the Reporting Period? |
| A | At the start of the Reporting Period, the Fund maintained a long position in bond futures and a short position in equity options. |
| Q | How did the Fund use derivatives and similar instruments during the Reporting Period? |
| A | The Fund uses derivatives for both hedging and non-hedging purposes in the implementation of the Strategic Volatility Premium. During the Reporting Period, the Fund employed listed equity index futures and listed equity options to implement views on the U.S. equity market, which collectively had a positive impact on performance. It used bond futures to express views on the U.S. fixed income market, which had a positive impact on returns during the Reporting Period. |
| Q | Were there any changes to the Fund’s portfolio management team during the Reporting Period? |
| A | There were no changes to the Fund’s portfolio management team during the Reporting Period. |
| Q | How was the Fund positioned at the end of the Reporting Period? |
| A | At the end of the Reporting Period, the Fund maintained a long position in bond futures and a short position in equity options. It also held a small long position in equity index futures to hedge its short position in equity options. |
| Q | What was the Fund’s strategy at the end of the Reporting Period? |
| A | Going forward, the QIS Team plans to continue implementing the Strategic Volatility Premium as it seeks long-term total return. |
15
FUND BASICS
Strategic Volatility Premium Fund
as of August 31, 2021
| HOLDINGS AS OF 8/31/211 | ||||||||
| Holding | % of Net Assets | Line of Business | ||||||
| Goldman Sachs Financial Square Government Fund — Institutional Shares | 87.0 | % | Investment Companies | |||||
| 1 | The holdings may not be representative of the Fund’s future investments. Figures in the table above may not sum to 100% due to the exclusion of other assets and liabilities. The holdings may not represent the Fund’s market exposure due to the exclusion of certain derivatives, if any, as listed in the Additional Investment Information section of the Schedules of Investments. |
16
PORTFOLIO RESULTS
Goldman Sachs Tactical Tilt Overlay Fund
Investment Objective
The Fund seeks long-term total return.
Portfolio Management Discussion and Analysis
Effective July 29, 2021, the Goldman Sachs Tactical Tilt Overlay Fund’s (the “Fund”) benchmark index changed from the ICE BofAML U.S. Dollar Three-Month LIBOR Constant Maturity Index to the ICE BofA 3-Month U.S. Treasury Bill Index. No modifications were made to the Fund’s investment objective, strategy and policies in connection with this change. Below, the Goldman Sachs Multi-Asset Solutions (“MAS”) Group (formerly, the Goldman Sachs Global Portfolio Solutions Group) discusses the Fund’s performance and positioning for the 12-month period ended August 31, 2021 (the “Reporting Period”).
| Q | How did the Fund perform during the Reporting Period? |
| A | During the Reporting Period, the Fund’s Institutional, Class R6 and Class P Shares generated average annual total returns of 9.43%, 9.48% and 9.47%, respectively. These returns compare to the 0.08% average annual total return of the Fund’s benchmark, the ICE BofA 3-Month U.S. Treasury Bill Index (the “Index”), during the same time period. The Fund’s previous benchmark index, the ICE BofAML U.S. Dollar Three-Month LIBOR Constant Maturity Index, generated an average annual total return of 0.21% during the Reporting Period. |
References to the Fund’s benchmark and to other indices, if any, mentioned herein are for informational purposes only, and unless otherwise noted, are not indications of how the Fund is managed. The use of the Index as the Fund’s benchmark does not imply the Fund is being managed like cash and does not imply low risk or low volatility. |
| Q | What key factors affected the Fund’s performance during the Reporting Period? |
| A | The Fund seeks to achieve its investment objective through the implementation of investment ideas that are generally derived from short-term or medium-term market views on a variety of asset classes and instruments. |
During the Reporting Period, the Fund benefited from its long position in Eurozone banks, with most of the gains coming during the fourth quarter of 2020 when Eurozone banks outperformed the EURO STOXX 50® by approximately 24%. Rising global bond yields following positive COVID-19 vaccine trial results in November 2020 and consensus expectations that the European Central Bank (“ECB”) would lift bank dividend restrictions to some extent during 2021 helped Eurozone banks outperform significantly relative to the broad European equity market. In addition, the Fund’s long positions in energy master limited partnerships (“MLPs”) and U.S. energy stocks added to its performance during the Reporting Period overall. In the fourth quarter of 2020, these assets generated gains on mounting investor optimism about a global economic recovery and as a rotation into distressed market sectors accelerated. Energy MLPs, as represented by the Alerian MLP Index, and U.S. energy stocks, as represented by the S&P 500® Energy Index, were up 29% and 26%, respectively, during the fourth calendar quarter, outperforming U.S. large-cap stocks, as measured by the S&P 500® Index, and crude oil prices, as measured by West Texas Intermediate (“WTI”), which were up 12% and 18%, respectively, during the same time period. Energy MLPs seemed to benefit from their capital discipline, while energy equities were bolstered by expectations that oil demand would further recover and that OPEC+ would continue collaborating in support of crude oil prices in the near term. (OPEC+ is composed of OPEC countries and non-OPEC oil producing countries, most notably Russia. OPEC is the Organization of the Petroleum Exporting Countries.) In the first quarter of 2021, energy-related assets posted additional gains due to COVID-19 vaccine distribution and economic reopening prospects. Furthermore, a stronger macro fundamental environment pushed up commodity prices and bond yields, boosting value stocks, such as energy equities, significantly. Energy-related assets were also supported by rising energy prices, with WTI crude oil prices climbing 21.9% during the first calendar quarter to $60 per barrel — higher than they had been before the |
17
PORTFOLIO RESULTS
| emergence of COVID-19. Energy-related assets posted more gains during the second calendar quarter, although they weakened in July and August as value stocks continued to advance, economic activity continued to recover and crude oil prices rose amid the global rollout of COVID-19 vaccines. |
Among detractors during the Reporting Period was the Fund’s tactical WTI crude oil calendar spread. (A calendar spread is a derivatives strategy in which an investor takes a long and a short position on the same asset using derivatives contracts with different expiration dates. The goal is to profit from the difference in price on the underlying asset between the two expiration dates.) The position was initiated in October 2020 prior to news in early November of the development of a COVID-19 vaccine. Our investment thesis was predicated on investor concerns about oil demand in light of new lockdowns, OPEC supply issues and elevated global oil inventories. The Fund was intended to profit if the front-month WTI futures contract underperformed the WTI December 2021 futures contract, meaning that we expected the WTI futures curve to steepen. (Front month refers to the nearest expiration date for a futures or options contract. The WTI futures curve depicts contractual agreements for the price of oil for a range of specific dates in the future.) In a risk management move, we eliminated the position in early December 2020, as the prices of near-term WTI crude oil futures strengthened relative to December 2021 WTI futures prices amid positive COVID-19 vaccine news and strong demand. Also detracting from the Fund’s performance during the Reporting Period was exposure to investment grade corporate bonds, with most of the underperformance recorded during the first quarter of 2021. From the beginning of 2021, the market started to price in earlier than previously expected Federal Reserve (“Fed”) policy tightening as many observers feared a $1.9 trillion U.S. federal stimulus package and pent-up consumer demand due to increased savings could lead to a pickup in inflation. This was evidenced by a significant increase in the 10-year U.S. Treasury yield between the beginning of the Reporting Period and the end of the first quarter of 2021. As yields rose, bond prices broadly fell, including those of investment grade corporate bonds. |
| Q | How was the Fund positioned at the beginning of the Reporting Period? |
| A | At the beginning of the Reporting Period, the Fund had approximately 21.18% of its total net assets invested in long equity-related investments; approximately 15.05% of its total net assets invested in long fixed income-related investments; and 0.00% of its total net assets invested in long commodity related investments. In terms of currency-related investments, the Fund had a long position in the euro versus a short position in the Swiss franc (representing 1.58% of the Fund’s total net assets), a long position in the U.S. dollar versus a short position in the Chinese renminbi (representing 0.95% of its total net assets) and a long position in the U.S. dollar versus a short position in the Mexican peso (representing 0.85% of its total net assets). The Fund also had short positions of approximately -3.26% of its total net assets in a basket of large-cap equity related investments we believed might underperform the U.S. stock market. It held a short position in U.S. large-cap stocks (representing -1.31% of its total net assets), a short position in a S&P 500® Index put spread (representing -0.85% of its total net assets) and a short position in a Brazilian knock-out put option (representing -0.18% of its total net assets). (A knock-out option is an option with a built-in mechanism to expire worthless if a specified price level in the underlying asset is reached. A put option is an option contract giving the owner the right, but not the obligation, to sell a specified amount of an underlying asset at a specified price at the time of expiry.) As for currency-related investments, the Fund held a short position in the Mexican peso versus a long position in the U.S. dollar (representing -1.91% of its total net assets). The Fund had no short positions in fixed income-related investments or commodity-related investments at the start of the Reporting Period. |
The above sector breakout is inclusive of derivative exposure across all asset classes, but it does not necessarily include the cash held to support those positions. Derivatives positions are mostly supported by cash held in the Fund specifically to cover its exposure and any potential margin calls or future losses experienced. Given the line-up of positions held, most of them were derivatives-based, so the cash allocation at the beginning of the Reporting Period was high. |
| Q | How did you tactically manage the Fund’s allocations during the Reporting Period? |
| A | During the Reporting Period, in response to shifting macroeconomic and market dynamics, we made a number of tactical changes to the Fund’s exposures. |
In terms of equity-related exposures, we established a position in an S&P 500® Energy Index call option during October 2020. (A call option is an option that gives the holder the right to buy a certain quantity of an underlying security at an agreed-upon price at the time of expiry.) Energy stocks had underperformed the S&P 500® Index by a |
18
PORTFOLIO RESULTS
| large margin in 2020, so we believed there could be meaningful upside if they recovered even a fraction of their value. Also in October, we allowed the Fund’s position in Brazilian equity index options to expire. Since the inception of that tilt in August 2020, the U.S. dollar-denominated MSCI Brazil Index had fallen approximately 9.7%, and several catalysts that we had anticipated, such as the stalling of the government’s reform agenda and growing concerns about the country’s fiscal situation, had played out. In November, we added a short position in EURO STOXX 50® bank put options, which replaced part of the Fund’s previous outright long position in Eurozone bank stocks, because we considered Eurozone bank stocks undervalued. Additionally, during November, we established a short position in S&P 500® Index put options, seeking to take advantage of what we believed to be short-term market volatility. We also allowed the Fund’s S&P 500® Index put option spread to expire out of the money. (A put option spread is a strategy that involves purchasing put options at a specific strike price, while simultaneously selling the same number of put options on the same asset but at a lower strike price. “Out-of-the-money” is a term used to describe a put option with a strike price that is lower than the market price of the underlying asset.) Finally, we added a short position in a Russell 2000® put option, which expressed our view that U.S. small-cap stocks could appreciate if economic growth accelerated with the rollout of COVID-19 vaccines but could still face headwinds from uncertainty about the spread of the virus during the winter months. In December 2020, we implemented a relative value tilt, wherein the Fund held a long position in the U.S. health care sector versus a short position in the broader S&P 500® Index, as we saw strong relative valuations and the potential for growth in the health care sector as well as scope for policy risk to recede. That same month, we added a short position in S&P 500® Index put options, as we sought to position the Fund to participate in additional equity gains. During January 2021, we added a STOXX® Europe 600 Index options tilt, which consisted of a long position in a call option and a short position in a put option, because we thought accelerating global economic growth could potentially benefit European firms. We also removed the Fund’s long position in 2021 EURO STOXX 50® dividend futures, as we thought dividend payouts might be capped in the near term. We added a long position in S&P 500® Index put options amid a number of near-term event risks, such as a spike in COVID-19 infections and the outlook for new fiscal stimulus measures. In early February, as these risks dissipated, we allowed this long position in S&P 500® Index put options to expire. We also removed the Fund’s long position in S&P 500® Energy Index call options, taking profits, as energy stocks appreciated. During March 2021, we sold an S&P 500® Index put option because we thought the U.S. economic expansion was likely to continue in the near term. In May, we eliminated the Fund’s short position in EURO STOXX 50® bank put options as we believed they had achieved much of their maximum return potential. In July, we initiated a position in an S&P 500® Index put option spread based on the potential for several near-term event risks, such as a flare-up in U.S. COVID-19 infections due to the Delta variant and uncertainty around then-upcoming Fed messaging. During August, the Fund’s STOXX® Europe 600 Index options tilt was removed, reflecting the underlying index’s gains since the position was established in January, and it was replaced with a long position in FTSE 100 Index options. At the same time, we added a long position in Nikkei 225 options. Finally, we initiated an energy equity call spread, which consists of a long position in an out-of-the-money call option and a short position in an out-of-the-money call option in an effort to gain access to potential gains in the S&P 500® energy sector while also protecting the Fund from possible downside risk. (A call spread is an option spread strategy that is created when equal number of call options with different expiry dates are bought and sold simultaneously. “Out-of-the-money” is a term used to describe a call option with a strike price that is higher than the market price of the underlying asset.) |
Regarding fixed income-related exposures, in October 2020, we exited the Fund’s short position in a received swaption on one-year U.S. Treasury yields, which had been implemented in July 2020 as part of the Fund’s position in a 30-year U.S. interest rate options tilt. The elimination of the short position left the Fund with an outright long position in a payer swaption on 30-year U.S. Treasury yields that could potentially benefit from a continued rise in long-term interest rates. (Swaptions are options on interest rate swap contracts. In a receiver swaption, the purchaser has the option to enter into a swap contract wherein they will receive the fixed rate and pay the floating rate. In a payer swaption, the purchaser has the right but not the obligation to enter into a swap contract wherein they become the fixed-rate payer and the floating-rate receiver.) During December 2020, we initiated a long position in U.S. bank loans, as we believed they could enhance the Fund’s yield if interest rates started to normalize. |
In terms of currency-related exposures, we removed part of the Fund’s long U.S. dollar versus short Mexican peso tilt during September 2020. We had expected the Mexican peso |
19
PORTFOLIO RESULTS
| to depreciate versus the U.S. dollar on the back of demand for U.S. dollars from Mexican corporations, heavy investor positioning in the Mexican peso and political and economic deterioration in Mexico. However, these potential catalysts were overshadowed by the attractiveness of Mexico’s high nominal interest rates in an environment where investors were searching for yield. In November, we eliminated the tilt entirely because we believed the attractiveness of Mexico’s high interest rates and weakness in the U.S. dollar were working against the positioning. During December, we eliminated the Fund’s long position in the euro versus its short position in the Swiss franc, as investors generally decreased their exposure to euro-denominated assets and increased their exposure to the perceived safe haven of Swiss franc-denominated assets. We also allowed the Fund’s long position in the U.S. dollar versus its short position in the Chinese renminbi to expire given that the renminbi had appreciated. In March 2021, we added a long position in the U.S. dollar versus short positions in the euro, Japanese yen and Swiss franc because we thought 2021 U.S. economic growth was on pace to outperform that of the Eurozone, Japan and Switzerland. During the middle of April, we established a long position in the Brazilian real versus a short position in the U.S. dollar, as we believed the Brazilian real was undervalued. We removed this positioning in early May, as we believed part of our investment thesis had been realized, but we then reinitiated it in the form of a put option spread as the Brazilian real remained undervalued, in our view. During June, in a risk management move, we eliminated the position, taking profits. In July, we implemented a short position in the Chinese renminbi versus a long position in the U.S. dollar, as we believed the renminbi faced headwinds due to China’s slower economic growth and dovish central bank. (Dovish tends to suggest lower interest rates; opposite of hawkish.) |
As for commodities-related exposures, we implemented a short position in the WTI crude oil futures curve during October 2020, which was expressed through the Fund’s short position in a December 2020 New York Mercantile Exchange (“NYMEX”) WTI crude oil futures contract and the Fund’s long position in a December 2021 NYMEX WTI crude oil futures contract. Although crude oil prices had dropped from their summer 2020 peak levels, global oil inventories remained elevated and there were, in our view, inconsistent market expectations for higher WTI crude oil prices in the short term. In December, we removed the Fund’s short position in the WTI crude oil futures curve. Near-term oil prices had strengthened relative to longer-term prices as positive COVID-19 vaccine news and strong Asian oil demand offset the negative risk factors that had favored the tilt. During January 2021, we added a long position in WTI crude oil futures because we expected oil demand to strengthen as COVID-19 vaccine distribution reached a critical number of people. We eliminated this position, taking profits, during February. Also in February, we implemented a long position in a gold put option in response to a decline in gold prices, allowing the position to expire in July as gold prices rose. |
In July 2021, we introduced a new trend-based rotation tilt, a completely rules-based approach that selects from among 10 macro asset classes each month. Because this is the first rules-based tilt that rotates across macro asset classes, we started with a small initial allocation that could be upsized over time. |
| Q | How did the Fund use derivatives and similar instruments during the Reporting Period? |
| A | The Fund used derivatives and similar instruments as part of its investment strategy to express views implemented in the Fund. Positions were supported predominantly by cash held in the Fund specifically to cover its exposure to derivative instruments and any potential margin calls or future losses experienced. |
During the Reporting Period, the Fund employed equity and bond futures, equity index options, total return swaps, swaptions, options on commodity futures, forward foreign currency exchange contracts and options on forward foreign currency exchange contracts to express active investment views with greater versatility across regional equity markets, global market sectors, commodities markets and currency markets. The Fund’s use of equity futures to gain exposure to U.S. and European securities collectively detracted from performance. Bond futures, which the Fund employed to gain exposure to U.S. Treasury securities and other developed countries’ government bonds, detracted from results. To afford greater risk management precision, options on equity indices were employed to tactically adjust the amount of equity risk and downside risk in the Fund. The Fund’s use of equity options to gain exposure to the S&P 500® Index, S&P 500® Energy Index, EURO STOXX 50®, STOXX® Europe 600 Index, and U.K. and Japanese equities collectively added to performance. In addition, the Fund’s use of total return swaps within the systematic downside mitigation tactical tilt and the systematic upside improvement tilt, as well as to take both long and short positions on a basket of large-cap stocks and to gain exposure to European bank stocks, had a positive |
20
PORTFOLIO RESULTS
| impact on performance. (The systematic downside mitigation tactical tilt seeks to limit the Fund’s exposure to potential market declines through the shorting of U.S. large-cap stocks that we believed might underperform the broader U.S. stock market, while at the same time taking a long position in the broader U.S. stock market. The systematic upside improvement tilt seeks to identify stocks likely to outperform the market based on a variety of technical and fundamental ranking factors. The resulting long positions are then held against an equally-sized short position in the S&P 500® Index.) Swaptions, which were used to express our views on U.S. interest rates, added to performance. Additionally, the Fund used options on commodity futures to express our views of WTI crude oil and gold, which had a negative impact overall on performance. Forward foreign currency exchange contracts, which were used to express our views on developed and emerging markets currencies, detracted overall from the Fund’s performance. Options on forward foreign currency exchange contracts, employed to gain exposure to numerous non-U.S. currencies, had a neutral impact on results. |
| Q | How was the Fund positioned at the end of the Reporting Period? |
| A | At the end of the Reporting Period, the Fund had approximately 18.56% of its total net assets invested in long equity-related investments; approximately 23.55% of its total net assets invested in long fixed income-related investments; 0.00% of its total net assets invested in long currency-related investments; and 0.00% of its total net assets invested in long commodity-related investments. The Fund had a short position (representing approximately -5.27% of its total net assets) in equity-related investments. Specifically, the Fund held a short position (representing approximately -3.15% of its total net assets) in a basket of large-cap equity-related investments we believed might underperform the U.S. stock market, and it held a short position in S&P 500® Index options (representing approximately -2.12% of its total net assets) as part of relative value tilt wherein the Fund held a long position in the U.S. health care sector versus a short position in U.S. large-cap stocks. In addition, the Fund had a short position (representing approximately -2.34% of its total net assets) in currency-related investments. The Fund had no short positions in fixed income-related investments or commodity-related investments at the end of the Reporting Period. |
The above sector breakout is inclusive of derivative exposure across all asset classes, but it does not necessarily include the cash held to support those positions. Derivatives positions are mostly supported by cash held in the Fund specifically to cover its exposure and any potential margin calls or future losses experienced. Given the line-up of positions held, most of them were derivatives-based, so the cash allocation at the end of the Reporting Period was high. |
| Q | Were there any changes to the Fund’s portfolio management team during the Reporting Period? |
| A | There were no changes to the Fund’s portfolio management team during the Reporting Period. |
| Q | What is the Fund’s tactical asset allocation view and strategy for the months ahead? |
| A | At the end of the Reporting Period, we expected a strong pickup in global economic growth, as most countries continued to recover from their pandemic-induced recessions. In developed countries, the rollout of COVID-19 vaccinations had enabled most major economies to continue reopening, supporting their ongoing economic recovery. Nevertheless, the spread of the COVID-19 Delta variant represented a headwind, while supply bottlenecks across product and labor markets remain pronounced, holding back recovery somewhat. In our view, these supply constraints should begin to ease in the near term. We expected the U.S. economy to outperform its major developed markets peers in the short term, benefiting from an earlier reopening and firm consumer spending on the back of large fiscal stimulus. |
In the emerging markets, many economies had made substantial progress on recovery by the end of the Reporting Period, with most countries reporting activity levels in the first quarter of 2021 that were higher than pre-pandemic levels. COVID-19 vaccinations were progressing slowly but steadily, and we believed the populations of most emerging markets countries were on track to acquire a meaningful degree of protective immunity by the middle of 2022. Nevertheless, they remained exposed to new waves of infections at the end of the Reporting Period. |
As for inflation, we expected diminishing slack in the U.S., which would keep inflation slightly elevated in the short term. In contrast, we thought underlying price pressures in the Eurozone were likely to remain more muted through the end of 2021 following the reopening boost and base effects. (Base effects refers to the arithmetical impact of an increase or decrease in inflation rates between corresponding periods of time.) Accordingly, we noted a policy divergence between the U.S. Fed and the ECB at the end of the Reporting Period. The Fed, which has indicated it may not raise interest rates |
21
PORTFOLIO RESULTS
| until at least 2023, seemed to be on course to announce the tapering of its asset purchase program at one of its near-term policy meetings. Meanwhile, the ECB strengthened its dovish guidance on interest rates, effectively pledging to maintain an accommodative policy stance for a prolonged period. At the same time, inflationary pressures in certain emerging markets countries have led their central banks to hike interest rates. Meanwhile, most Asian economies are likely to see a continuation of accommodative monetary policies amid subdued inflation, in our opinion. |
As for the financial markets, we expected well-diversified portfolios with moderate risk to generate what we consider to be attractive returns for 2021 overall, led by global equities. That said, we saw an abundance of risks, with the two greatest being a deterioration in U.S.-China relations and a worsening of the pandemic through the emergence of new variants or setbacks in the COVID-19 vaccine rollout. |
22
FUND BASICS
Tactical Tilt Overlay Fund
as of August 31, 2021
| PORTFOLIO COMPOSITION1 |
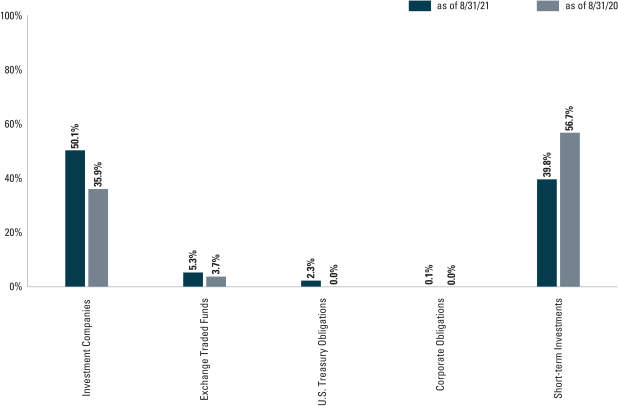
| 1 | The percentage shown for each investment category reflects the value of investments in that category as a percentage of net assets. Short-term investments represent certificate of deposit and commercial paper. Figures in the graph may not sum to 100% due to the exclusion of other assets and liabilities. The graph does not depict the investment in the securities lending reinvestment vehicle. The Investment in the securities lending reinvestment vehicle represented 0.1% of the Fund’s net assets as of August 31, 2021. The graph depicts the Fund’s investments but may not represent the Fund’s market exposure due to the exclusion of certain derivatives, if any, as listed in the Additional Investment Information section of the Consolidated Schedule of Investments. |
For more information about your Fund, please refer to www.GSAMFUNDS.com. There, you can learn more about your Fund’s investment strategies, holdings, and performance.
23
GOLDMAN SACHS TACTICAL TILT OVERLAY FUND
Performance Summary
August 31, 2021
The following graph shows the value, as of August 31, 2021, of a $1,000,000 investment made on July 31, 2014 (commencement of operations) in Institutional Shares at NAV. For comparative purposes, the performance of the Fund’s benchmark, the ICE® BofAML® Three-Month U.S. Treasury Bill Index and the Fund’s former benchmark, the ICE® BofAML® U.S. Dollar Three-Month LIBOR Constant Maturity Index are shown. Performance reflects applicable fee waivers and/or expense limitations in effect during the periods shown and in their absence, performance would be reduced. Returns do not reflect the deduction of taxes that a shareholder would pay on Fund distributions or the redemption of Fund shares. The returns set forth below represent past performance. Past performance does not guarantee future results. The Fund’s investment return and principal value will fluctuate so that an investor’s shares, when redeemed, may be worth more or less than their original cost. Current performance may be lower or higher than the performance quoted below. Please visit our web site at www.GSAMFUNDS.com to obtain the most recent month-end returns.
| Tactical Tilt Overlay Fund’s Lifetime Performance |
Performance of a $1,000,000 Investment, with distributions reinvested, from July 31, 2014 through August 31, 2021.
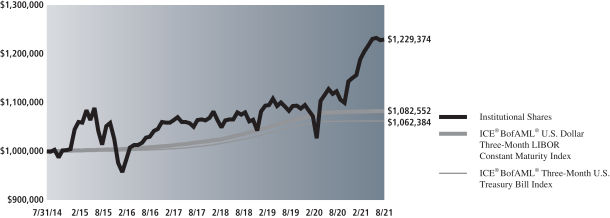
| Average Annual Total Return through August 31, 2021* | One Year | Five Years | Since Inception | |||||||
Institutional (Commenced July 31, 2014) | 9.43% | 3.64% | 2.95% | |||||||
| ||||||||||
Class R6 (Commenced December 29, 2017) | 9.48% | N/A | 3.88% | |||||||
| ||||||||||
Class P (Commenced April 17, 2018) | 9.47% | N/A | 4.38% | |||||||
| ||||||||||
| * | These returns assume reinvestment of all distributions at NAV. Because Institutional, Class R6 and Class P Shares do not involve a sales charge, such a charge is not applied to their Average Annual Total Return. |
24
PORTFOLIO RESULTS
Global Managed Beta Fund
The MSCI ACWI Investable Market Index (IMI) captures large-, mid- and small-cap representation across 23 developed markets countries and 27 emerging markets countries.
MSCI Emerging Markets Index captures large-cap and mid-cap representation across 27 emerging markets countries. The index covers approximately 85% of the free float-adjusted market capitalization in each country.
MSCI World Index is a broad global equity index that represents large and mid-cap equity performance across 23 developed markets countries. It covers approximately 85% of the free float-adjusted market capitalization in each country.
S&P 500® Index is a U.S. stock market index based on the market capitalizations of 500 large companies having common stock listed on the New York Stock Exchange or NASDAQ. The S&P 500® Index components and their weightings are determined by S&P Dow Jones Indices.
EURO STOXX 50® provides a blue-chip representation of super-sector leaders in the Eurozone. The index covers 50 stocks from eight Eurozone countries.
Russell 2000® Index measures the performance of the small-cap segment of the U.S. equity universe. The Russell 2000® Index is a subset of the Russell 3000® Index representing approximately 10% of the total market capitalization of that index. The Russell 2000® Index includes approximately 2000 of the smallest securities based on a combination of their market cap and current index membership. The Russell 2000® Index is constructed to provide a comprehensive and unbiased small-cap barometer and is completely reconstituted annually to ensure larger stocks do not distort the performance and characteristics of the true small-cap opportunity set.
Strategic Factor Allocation Fund
S&P 500® Index is a U.S. stock market index based on the market capitalizations of 500 large companies having common stock listed on the New York Stock Exchange or NASDAQ. The S&P 500® Index components and their weightings are determined by S&P Dow Jones Indices.
Bloomberg U.S. Aggregate Bond Index represents an unmanaged diversified portfolio of fixed income securities, including U.S. Treasuries, investment-grade corporate bonds and mortgage-backed and asset-backed securities. The Index figure does not reflect any deduction for fees, expenses or taxes. It is not possible to invest directly in an index.
Strategic Factor Volatility Fund
S&P 500® Index is a U.S. stock market index based on the market capitalizations of 500 large companies having common stock listed on the New York Stock Exchange or NASDAQ. The S&P 500® Index components and their weightings are determined by S&P Dow Jones Indices.
Tactical Tilt Overlay Fund
S&P 500® Index is a U.S. stock market index based on the market capitalizations of 500 large companies having common stock listed on the New York Stock Exchange or NASDAQ. The S&P 500® Index components and their weightings are determined by S&P Dow Jones Indices.
EURO STOXX 50® provides a blue-chip representation of super-sector leaders in the Eurozone. The index covers 50 stocks from eight Eurozone countries.
FTSE 100 Index, or the Financial Times Stock Exchange 100 Index, is a share index of the 100 companies listed on the London Stock Exchange with the highest market capitalization.
S&P 500® Energy Index comprises those companies included in the S&P 500® Index that are classified as members of the Global Industry Classification Standard, or GICS®, energy sector.
MSCI Brazil Index is designed to measure the performance of the large and mid cap segments of the Brazilian market.
Nikkei 225 is a price-weighted average of 225 top-rated Japanese companies listed in the First Section of the Tokyo Stock Exchange.
STOXX® Europe 600 Index derived from the STOXX® Europe Total Market Index and is a subset of the STOXX® Global 1800 Index. With a fixed number of 600 components, the STOXX® Europe 600 Index represents large, mid and small capitalization companies across 17 countries of the European region.
Alerian MLP Index is a float-adjusted, capitalization-weighted index, whose constituents represent approximately 85% of total float-adjusted market capitalization. It is disseminated real-time on a price-return basis (AMZ) and on a total-return basis (AMZX).
It is not possible to invest directly in an unmanaged index.
25
GOLDMAN SACHS GLOBAL MANAGED BETA FUND
August 31, 2021
| Shares | Description | Value | ||||||
| Common Stocks – 10.3% | ||||||||
| Aerospace & Defense – 0.1% | ||||||||
| 5,896 | BAE Systems PLC | $ | 46,063 | |||||
| 222 | Elbit Systems Ltd. | 32,296 | ||||||
| 376 | General Dynamics Corp. | 75,317 | ||||||
| 1,295 | Howmet Aerospace, Inc. | 41,116 | ||||||
| 814 | Huntington Ingalls Industries, Inc. | 166,194 | ||||||
| 643 | L3Harris Technologies, Inc. | 149,826 | ||||||
| 505 | Lockheed Martin Corp. | 181,699 | ||||||
| 782 | Northrop Grumman Corp. | 287,541 | ||||||
| 1,270 | Raytheon Technologies Corp. | 107,645 | ||||||
| 7,659 | Singapore Technologies Engineering Ltd. | 21,448 | ||||||
| 3,850 | Textron, Inc. | 279,780 | ||||||
| 297 | Thales SA | 30,166 | ||||||
| 234 | The Boeing Co.* | 51,363 | ||||||
|
| |||||||
| 1,470,454 | ||||||||
|
| |||||||
| Air Freight & Logistics – 0.1% | ||||||||
| 2,891 | C.H. Robinson Worldwide, Inc. | 260,363 | ||||||
| 10,499 | Deutsche Post AG | 738,175 | ||||||
| 643 | DSV PANALPINA A/S | 163,786 | ||||||
| 1,049 | Expeditors International of Washington, Inc. | 130,747 | ||||||
| 1,160 | FedEx Corp. | 308,200 | ||||||
| 2,164 | GXO Logistics, Inc.* | 176,994 | ||||||
| 1,570 | SG Holdings Co. Ltd. | 42,622 | ||||||
| 1,555 | United Parcel Service, Inc. Class B | 304,205 | ||||||
| 2,846 | Yamato Holdings Co. Ltd. | 72,355 | ||||||
|
| |||||||
| 2,197,447 | ||||||||
|
| |||||||
| Airlines* – 0.0% | ||||||||
| 360 | Southwest Airlines Co. | 17,921 | ||||||
|
| |||||||
| Auto Components – 0.0% | ||||||||
| 605 | Aptiv PLC* | 92,075 | ||||||
| 3,965 | BorgWarner, Inc. | 169,226 | ||||||
| 1,222 | Bridgestone Corp. | 56,253 | ||||||
| 235 | Cie Generale des Etablissements Michelin SCA | 38,046 | ||||||
| 799 | Denso Corp. | 55,925 | ||||||
| 311 | Lear Corp. | 49,741 | ||||||
| 1,244 | Magna International, Inc. | 98,236 | ||||||
| 1,887 | Sumitomo Electric Industries Ltd. | 25,202 | ||||||
| 502 | Toyota Industries Corp. | 42,384 | ||||||
|
| |||||||
| 627,088 | ||||||||
|
| |||||||
| Automobiles – 0.1% | ||||||||
| 637 | Bayerische Motoren Werke AG | 60,463 | ||||||
| 2,107 | Daimler AG | 177,736 | ||||||
| 300 | Ferrari NV | 65,076 | ||||||
| 29,715 | Ford Motor Co.* | 387,187 | ||||||
| 2,527 | General Motors Co.* | 123,848 | ||||||
| 4,700 | Honda Motor Co. Ltd. | 142,253 | ||||||
| 4,252 | Stellantis NV | 85,057 | ||||||
| 1,277 | Tesla, Inc.* | 939,515 | ||||||
| 2,703 | Toyota Motor Corp. | 235,413 | ||||||
| 64 | Volkswagen AG | 21,414 | ||||||
|
| |||||||
| 2,237,962 | ||||||||
|
| |||||||
| Common Stocks – (continued) | ||||||||
| Banks – 0.4% | ||||||||
| 7,095 | Australia & New Zealand Banking Group Ltd. | 143,604 | ||||||
| 4,450 | Bank Hapoalim BM | 38,282 | ||||||
| 15,743 | Bank Leumi Le-Israel BM | 130,056 | ||||||
| 19,788 | Bank of America Corp. | 826,149 | ||||||
| 1,831 | Bank of Montreal | 182,222 | ||||||
| 391 | Banque Cantonale Vaudoise | 33,155 | ||||||
| 35,149 | Barclays PLC | 89,117 | ||||||
| 2,077 | BNP Paribas SA | 131,578 | ||||||
| 29,118 | BOC Hong Kong Holdings Ltd. | 88,116 | ||||||
| 1,541 | Canadian Imperial Bank of Commerce | 177,276 | ||||||
| 5,315 | Citigroup, Inc. | 382,202 | ||||||
| 1,649 | Citizens Financial Group, Inc. | 72,210 | ||||||
| 3,112 | Commonwealth Bank of Australia | 226,747 | ||||||
| 3,311 | Credit Agricole SA | 47,790 | ||||||
| 1,725 | Danske Bank A/S | 28,946 | ||||||
| 4,329 | DBS Group Holdings Ltd. | 95,987 | ||||||
| 2,734 | DNB Bank ASA | 57,706 | ||||||
| 2,099 | Fifth Third Bancorp | 81,567 | ||||||
| 2,283 | FinecoBank Banca Fineco SpA* | 42,058 | ||||||
| 398 | First Republic Bank | 79,178 | ||||||
| 1,949 | Hang Seng Bank Ltd. | 34,843 | ||||||
| 15,412 | HSBC Holdings PLC | 81,389 | ||||||
| 2,966 | Huntington Bancshares, Inc. | 46,062 | ||||||
| 4,891 | ING Groep NV | 67,468 | ||||||
| 17,150 | Intesa Sanpaolo SpA | 48,532 | ||||||
| 10,673 | Israel Discount Bank Ltd. Class A* | 55,129 | ||||||
| 4,046 | Japan Post Bank Co. Ltd. | 35,380 | ||||||
| 9,358 | JPMorgan Chase & Co. | 1,496,812 | ||||||
| 381 | KBC Group NV | 32,019 | ||||||
| 2,230 | KeyCorp. | 45,314 | ||||||
| 439 | M&T Bank Corp. | 61,464 | ||||||
| 3,912 | Mediobanca Banca di Credito Finanziario SpA* | 46,117 | ||||||
| 21,923 | Mitsubishi UFJ Financial Group, Inc. | 118,942 | ||||||
| 2,319 | Mizrahi Tefahot Bank Ltd. | 77,148 | ||||||
| 3,878 | Mizuho Financial Group, Inc. | 54,338 | ||||||
| 4,993 | National Australia Bank Ltd. | 100,665 | ||||||
| 3,794 | National Bank of Canada | 301,138 | ||||||
| 7,738 | Natwest Group PLC | 22,595 | ||||||
| 4,118 | Nordea Bank Abp | 48,366 | ||||||
| 22,134 | Oversea-Chinese Banking Corp. Ltd. | 187,307 | ||||||
| 1,006 | Raiffeisen Bank International AG | 24,120 | ||||||
| 2,610 | Regions Financial Corp. | 53,322 | ||||||
| 7,526 | Resona Holdings, Inc. | 29,104 | ||||||
| 5,754 | Royal Bank of Canada | 591,066 | ||||||
| 5,390 | Skandinaviska Enskilda Banken AB Class A | 72,290 | ||||||
| 4,380 | Standard Chartered PLC | 27,314 | ||||||
| 6,873 | Sumitomo Mitsui Financial Group, Inc. | 237,227 | ||||||
| 1,315 | Sumitomo Mitsui Trust Holdings, Inc. | 42,952 | ||||||
| 164 | SVB Financial Group* | 91,758 | ||||||
| 4,564 | Svenska Handelsbanken AB Class A | 51,284 | ||||||
| 29,440 | The Bank of East Asia Ltd. | 49,360 | ||||||
| 2,606 | The Bank of Nova Scotia | 161,423 | ||||||
| 694 | The PNC Financial Services Group, Inc. | 132,623 | ||||||
|
| |||||||
| 26 | The accompanying notes are an integral part of these financial statements. |
GOLDMAN SACHS GLOBAL MANAGED BETA FUND
| Shares | Description | Value | ||||||
| Common Stocks – (continued) | ||||||||
| Banks – (continued) | ||||||||
| 2,903 | The Shizuoka Bank Ltd. | $ | 22,741 | |||||
| 6,279 | The Toronto-Dominion Bank | 407,751 | ||||||
| 1,413 | Truist Financial Corp. | 80,626 | ||||||
| 2,824 | U.S. Bancorp | 162,069 | ||||||
| 5,366 | United Overseas Bank Ltd. | 101,585 | ||||||
| 6,569 | Wells Fargo & Co. | 300,203 | ||||||
| 6,182 | Westpac Banking Corp. | 116,305 | ||||||
|
| |||||||
| 8,670,097 | ||||||||
|
| |||||||
| Beverages – 0.1% | ||||||||
| 290 | Anheuser-Busch InBev SA | 17,786 | ||||||
| 960 | Asahi Group Holdings Ltd. | 44,625 | ||||||
| 1,475 | Brown-Forman Corp. Class B | 103,575 | ||||||
| 433 | Carlsberg AS Class B | 75,630 | ||||||
| 2,126 | Coca-Cola Europacific Partners PLC | 122,755 | ||||||
| 1,097 | Coca-Cola HBC AG | 39,706 | ||||||
| 253 | Constellation Brands, Inc. Class A | 53,418 | ||||||
| 3,438 | Davide Campari-Milano NV | 47,548 | ||||||
| 1,934 | Diageo PLC | 92,973 | ||||||
| 509 | Heineken Holding NV | 47,216 | ||||||
| 440 | Heineken NV | 48,190 | ||||||
| 2,683 | Ito En Ltd. | 169,786 | ||||||
| 2,945 | Keurig Dr Pepper, Inc. | 105,048 | ||||||
| 1,169 | Kirin Holdings Co. Ltd. | 21,178 | ||||||
| 6,953 | Molson Coors Beverage Co. Class B | 330,476 | ||||||
| 3,384 | Monster Beverage Corp.* | 330,177 | ||||||
| 4,518 | PepsiCo, Inc. | 706,570 | ||||||
| 376 | Pernod Ricard SA | 79,151 | ||||||
| 349 | Remy Cointreau SA | 68,728 | ||||||
| 1,619 | Suntory Beverage & Food Ltd. | 64,895 | ||||||
| 190 | The Boston Beer Co., Inc. Class A* | 108,340 | ||||||
| 6,581 | The Coca-Cola Co. | 370,576 | ||||||
|
| |||||||
| 3,048,347 | ||||||||
|
| |||||||
| Biotechnology – 0.2% | ||||||||
| 5,675 | AbbVie, Inc. | 685,427 | ||||||
| 1,515 | Amgen, Inc. | 341,678 | ||||||
| 1,496 | Biogen, Inc.* | 507,009 | ||||||
| 862 | CSL Ltd. | 196,056 | ||||||
| 186 | Genmab A/S* | 88,114 | ||||||
| 4,868 | Gilead Sciences, Inc. | 354,293 | ||||||
| 2,486 | Grifols SA | 60,774 | ||||||
| 1,060 | Horizon Therapeutics PLC* | 114,575 | ||||||
| 3,263 | Incyte Corp.* | 249,587 | ||||||
| 667 | Moderna, Inc.* | 251,252 | ||||||
| 586 | Novavax, Inc.* | 139,785 | ||||||
| 298 | Regeneron Pharmaceuticals, Inc.* | 200,673 | ||||||
| 1,719 | Seagen, Inc.* | 288,104 | ||||||
| 1,269 | Vertex Pharmaceuticals, Inc.* | 254,168 | ||||||
|
| |||||||
| 3,731,495 | ||||||||
|
| |||||||
| Building Products – 0.1% | ||||||||
| 1,336 | A.O. Smith Corp. | 97,154 | ||||||
| 492 | AGC, Inc. | 23,768 | ||||||
| 1,749 | Allegion PLC | 251,838 | ||||||
| 1,075 | Assa Abloy AB Class B | 34,401 | ||||||
|
| |||||||
| Common Stocks – (continued) | ||||||||
| Building Products – (continued) | ||||||||
| 2,707 | Carrier Global Corp. | 155,923 | ||||||
| 3,123 | Cie de Saint-Gobain | 226,395 | ||||||
| 555 | Daikin Industries Ltd. | 138,498 | ||||||
| 1,121 | Fortune Brands Home & Security, Inc. | 109,152 | ||||||
| 122 | Geberit AG | 101,883 | ||||||
| 2,127 | Johnson Controls International PLC | 159,100 | ||||||
| 529 | Kingspan Group PLC | 60,409 | ||||||
| 794 | Lennox International, Inc. | 266,133 | ||||||
| 1,179 | Lixil Corp. | 34,311 | ||||||
| 5,980 | Masco Corp. | 363,106 | ||||||
| 6,008 | Nibe Industrier AB Class B | 83,741 | ||||||
| 2,425 | Owens Corning | 231,709 | ||||||
| 100 | Rockwool International A/S Class B | 52,903 | ||||||
| 790 | Trane Technologies PLC | 156,815 | ||||||
| 25,678 | Xinyi Glass Holdings Ltd. | 107,905 | ||||||
|
| |||||||
| 2,655,144 | ||||||||
|
| |||||||
| Capital Markets – 0.3% | ||||||||
| 1,266 | 3i Group PLC | 23,283 | ||||||
| 691 | Ameriprise Financial, Inc. | 188,581 | ||||||
| 258 | Amundi SA(a) | 24,418 | ||||||
| 2,706 | Apollo Global Management, Inc. | 161,765 | ||||||
| 938 | ASX Ltd. | 60,034 | ||||||
| 272 | BlackRock, Inc. | 256,575 | ||||||
| 2,913 | Blackstone, Inc. | 366,251 | ||||||
| 804 | Brookfield Asset Management, Inc. Class A | 44,729 | ||||||
| 462 | Cboe Global Markets, Inc. | 58,281 | ||||||
| 318 | CME Group, Inc. | 64,147 | ||||||
| 3,696 | Credit Suisse Group AG | 39,154 | ||||||
| 5,673 | Daiwa Securities Group, Inc. | 32,092 | ||||||
| 407 | Deutsche Boerse AG | 70,190 | ||||||
| 2,099 | EQT AB | 107,131 | ||||||
| 850 | FactSet Research Systems, Inc. | 323,187 | ||||||
| 1,041 | Franklin Resources, Inc. | 33,770 | ||||||
| 477 | Futu Holdings Ltd. ADR* | 45,406 | ||||||
| 8,717 | Hargreaves Lansdown PLC | 181,031 | ||||||
| 4,662 | Hong Kong Exchanges & Clearing Ltd. | 294,517 | ||||||
| 1,471 | IGM Financial, Inc. | 53,645 | ||||||
| 953 | Intercontinental Exchange, Inc. | 113,912 | ||||||
| 9,859 | Invesco Ltd. | 249,630 | ||||||
| 2,430 | Japan Exchange Group, Inc. | 57,872 | ||||||
| 2,337 | KKR & Co., Inc. | 150,246 | ||||||
| 341 | London Stock Exchange Group PLC | 37,354 | ||||||
| 683 | Macquarie Group Ltd. | 82,896 | ||||||
| 2,863 | Magellan Financial Group Ltd. | 90,289 | ||||||
| 428 | MarketAxess Holdings, Inc. | 203,694 | ||||||
| 1,598 | Moody’s Corp. | 608,470 | ||||||
| 5,831 | Morgan Stanley | 608,931 | ||||||
| 236 | MSCI, Inc. | 149,761 | ||||||
| 530 | Nasdaq, Inc. | 103,763 | ||||||
| 594 | Northern Trust Corp. | 70,401 | ||||||
| 160 | Partners Group Holding AG | 283,681 | ||||||
| 484 | Raymond James Financial, Inc. | 67,712 | ||||||
| 1,082 | S&P Global, Inc. | 480,213 | ||||||
| 645 | Schroders PLC | 33,534 | ||||||
|
| |||||||
| The accompanying notes are an integral part of these financial statements. | 27 |
GOLDMAN SACHS GLOBAL MANAGED BETA FUND
Schedule of Investments (continued)
August 31, 2021
| Shares | Description | Value | ||||||
| Common Stocks – (continued) | ||||||||
| Capital Markets – (continued) | ||||||||
| 1,766 | SEI Investments Co. | $ | 110,922 | |||||
| 33,802 | Singapore Exchange Ltd. | 248,099 | ||||||
| 1,810 | St. James’s Place PLC | 40,082 | ||||||
| 1,818 | State Street Corp. | 168,910 | ||||||
| 1,300 | T. Rowe Price Group, Inc. | 291,031 | ||||||
| 2,889 | The Bank of New York Mellon Corp. | 159,531 | ||||||
| 2,800 | The Carlyle Group, Inc. | 138,264 | ||||||
| 2,862 | The Charles Schwab Corp. | 208,497 | ||||||
| 498 | TMX Group Ltd. | 54,787 | ||||||
| 681 | Tradeweb Markets, Inc. Class A | 59,254 | ||||||
| 6,478 | UBS Group AG | 108,061 | ||||||
|
| |||||||
| 7,407,984 | ||||||||
|
| |||||||
| Chemicals – 0.2% | ||||||||
| 724 | Air Liquide SA | 129,771 | ||||||
| 281 | Air Products & Chemicals, Inc. | 75,732 | ||||||
| 1,103 | Akzo Nobel NV | 135,933 | ||||||
| 461 | Albemarle Corp. | 109,137 | ||||||
| 1,411 | Arkema SA | 187,529 | ||||||
| 908 | BASF SE | 70,242 | ||||||
| 359 | Celanese Corp. | 56,937 | ||||||
| 424 | CF Industries Holdings, Inc. | 19,258 | ||||||
| 453 | Chr Hansen Holding A/S | 41,803 | ||||||
| 1,919 | Corteva, Inc. | 84,378 | ||||||
| 852 | Covestro AG(a) | 55,216 | ||||||
| 937 | Croda International PLC | 117,951 | ||||||
| 1,346 | Dow, Inc. | 84,663 | ||||||
| 2,117 | DuPont de Nemours, Inc. | 156,700 | ||||||
| 1,290 | Eastman Chemical Co. | 145,976 | ||||||
| 817 | Ecolab, Inc. | 184,119 | ||||||
| 77 | EMS-Chemie Holding AG | 83,434 | ||||||
| 716 | Evonik Industries AG | 24,175 | ||||||
| 268 | FMC Corp. | 25,093 | ||||||
| 34 | Givaudan SA | 170,577 | ||||||
| 274 | International Flavors & Fragrances, Inc. | 41,511 | ||||||
| 914 | Johnson Matthey PLC | 36,952 | ||||||
| 1,243 | JSR Corp. | 43,070 | ||||||
| 490 | Koninklijke DSM NV | 104,320 | ||||||
| 798 | Linde PLC | 251,043 | ||||||
| 232 | LyondellBasell Industries NV Class A | 23,281 | ||||||
| 5,794 | Mitsubishi Chemical Holdings Corp. | 50,872 | ||||||
| 1,010 | Mitsubishi Gas Chemical Co., Inc. | 19,031 | ||||||
| 2,131 | Mitsui Chemicals, Inc. | 73,567 | ||||||
| 2,221 | Nippon Sanso Holdings Corp. | 53,825 | ||||||
| 771 | Nitto Denko Corp. | 58,489 | ||||||
| 898 | Novozymes A/S Class B | 72,592 | ||||||
| 2,160 | Nutrien Ltd. | 131,314 | ||||||
| 770 | PPG Industries, Inc. | 122,854 | ||||||
| 831 | RPM International, Inc. | 68,383 | ||||||
| 605 | Shin-Etsu Chemical Co. Ltd. | 99,927 | ||||||
| 376 | Sika AG | 135,475 | ||||||
| 312 | Solvay SA | 40,838 | ||||||
| 576 | Symrise AG | 81,971 | ||||||
| 4,908 | The Mosaic Co. | 157,939 | ||||||
| 1,016 | The Sherwin-Williams Co. | 308,529 | ||||||
| 3,799 | Toray Industries, Inc. | 25,616 | ||||||
| 693 | Yara International ASA | 34,804 | ||||||
|
| |||||||
| 3,994,827 | ||||||||
|
| |||||||
| Common Stocks – (continued) | ||||||||
| Commercial Services & Supplies – 0.1% | ||||||||
| 5,689 | Brambles Ltd. | 50,287 | ||||||
| 797 | Cintas Corp. | 315,429 | ||||||
| 1,032 | Copart, Inc.* | 148,938 | ||||||
| 1,156 | Dai Nippon Printing Co. Ltd. | 27,466 | ||||||
| 1,369 | GFL Environmental, Inc. | 48,232 | ||||||
| 5,644 | Rentokil Initial PLC | 45,087 | ||||||
| 861 | Republic Services, Inc. | 106,876 | ||||||
| 1,058 | Ritchie Bros Auctioneers, Inc. | 66,290 | ||||||
| 9,657 | Rollins, Inc. | 375,851 | ||||||
| 460 | Secom Co. Ltd. | 34,883 | ||||||
| 4,454 | Securitas AB Class B | 74,093 | ||||||
| 483 | Sohgo Security Services Co. Ltd. | 21,881 | ||||||
| 796 | Waste Connections, Inc. | 102,851 | ||||||
| 728 | Waste Management, Inc. | 112,920 | ||||||
|
| |||||||
| 1,531,084 | ||||||||
|
| |||||||
| Communications Equipment – 0.1% | ||||||||
| 238 | Arista Networks, Inc.* | 87,948 | ||||||
| 11,477 | Cisco Systems, Inc. | 677,373 | ||||||
| 1,409 | F5 Networks, Inc.* | 286,830 | ||||||
| 3,543 | Juniper Networks, Inc. | 102,676 | ||||||
| 508 | Motorola Solutions, Inc. | 124,064 | ||||||
| 7,364 | Nokia Oyj* | 44,236 | ||||||
| 6,541 | Telefonaktiebolaget LM Ericsson Class B | 77,479 | ||||||
|
| |||||||
| 1,400,606 | ||||||||
|
| |||||||
| Construction & Engineering – 0.1% | ||||||||
| 9,883 | ACS Actividades de Construccion y Servicios SA | 266,803 | ||||||
| 878 | Bouygues SA | 36,765 | ||||||
| 1,424 | Eiffage SA | 148,166 | ||||||
| 1,279 | Ferrovial SA | 37,039 | ||||||
| 2,597 | Obayashi Corp. | 21,369 | ||||||
| 6,199 | Skanska AB Class B | 178,705 | ||||||
| 1,724 | Vinci SA | 184,971 | ||||||
| 4,824 | WSP Global, Inc. | 629,856 | ||||||
|
| |||||||
| 1,503,674 | ||||||||
|
| |||||||
| Construction Materials – 0.0% | ||||||||
| 1,432 | CRH PLC | 75,861 | ||||||
| 1,006 | HeidelbergCement AG | 87,247 | ||||||
| 1,594 | LafargeHolcim Ltd. | 90,829 | ||||||
| 1,280 | James Hardie Industries PLC | 49,336 | ||||||
| 177 | Martin Marietta Materials, Inc. | 67,481 | ||||||
| 244 | Vulcan Materials Co. | 45,367 | ||||||
|
| |||||||
| 416,121 | ||||||||
|
| |||||||
| Consumer Finance – 0.1% | ||||||||
| 4,672 | Ally Financial, Inc. | 247,149 | ||||||
| 1,466 | American Express Co. | 243,297 | ||||||
| 1,298 | Capital One Financial Corp. | 215,429 | ||||||
| 1,855 | Discover Financial Services | 237,848 | ||||||
| 1 | Isracard Ltd. | 3 | ||||||
| 5,706 | Synchrony Financial | 283,874 | ||||||
|
| |||||||
| 1,227,600 | ||||||||
|
| |||||||
| 28 | The accompanying notes are an integral part of these financial statements. |
GOLDMAN SACHS GLOBAL MANAGED BETA FUND
| Shares | Description | Value | ||||||
| Common Stocks – (continued) | ||||||||
| Containers & Packaging – 0.1% | ||||||||
| 2,459 | Amcor PLC | $ | 31,598 | |||||
| 402 | Avery Dennison Corp. | 90,607 | ||||||
| 768 | Ball Corp. | 73,697 | ||||||
| 792 | CCL Industries, Inc. Class B | 45,211 | ||||||
| 1,243 | Crown Holdings, Inc. | 136,469 | ||||||
| 2,711 | International Paper Co. | 162,904 | ||||||
| 296 | Packaging Corp. of America | 44,903 | ||||||
| 672 | Sealed Air Corp. | 41,012 | ||||||
| 4,627 | Smurfit Kappa Group PLC | 265,191 | ||||||
| 3,985 | Westrock Co. | 207,380 | ||||||
|
| |||||||
| 1,098,972 | ||||||||
|
| |||||||
| Distributors – 0.0% | ||||||||
| 1,869 | Genuine Parts Co. | 228,373 | ||||||
| 6,659 | LKQ Corp.* | 350,863 | ||||||
| 763 | Pool Corp. | 377,151 | ||||||
|
| |||||||
| 956,387 | ||||||||
|
| |||||||
| Diversified Financial Services – 0.1% | ||||||||
| 4,442 | Berkshire Hathaway, Inc. Class B* | 1,269,390 | ||||||
| 692 | Equitable Holdings, Inc. | 21,459 | ||||||
| 342 | Groupe Bruxelles Lambert SA | 39,182 | ||||||
| 1,425 | Industrivarden AB Class A | 52,465 | ||||||
| 2,453 | Industrivarden AB Class C | 85,541 | ||||||
| 6,808 | Investor AB Class B | 162,838 | ||||||
| 2,216 | Kinnevik AB Class B* | 86,825 | ||||||
| 1,234 | L E Lundbergforetagen AB Class B | 78,844 | ||||||
| 13,335 | M&G PLC | 37,773 | ||||||
| 4,094 | ORIX Corp. | 76,384 | ||||||
| 186 | Sofina SA | 82,224 | ||||||
| 1,033 | Tokyo Century Corp. | 59,069 | ||||||
| 1,647 | Voya Financial, Inc. | 107,022 | ||||||
| 189 | Wendel SE | 27,427 | ||||||
|
| |||||||
| 2,186,443 | ||||||||
|
| |||||||
| Diversified Telecommunication Services – 0.1% | ||||||||
| 20,535 | AT&T, Inc. | 563,070 | ||||||
| 1,043 | BCE, Inc. | 54,397 | ||||||
| 1,059 | Cellnex Telecom SA(a) | 72,487 | ||||||
| 10,347 | Deutsche Telekom AG | 220,011 | ||||||
| 848 | Elisa Oyj | 54,349 | ||||||
| 37,703 | HKT Trust and HKT Ltd. | 51,411 | ||||||
| 240 | Iliad SA | 51,610 | ||||||
| 3,075 | Infrastrutture Wireless Italiane SpA(a) | 36,585 | ||||||
| 11,358 | Koninklijke KPN NV | 36,384 | ||||||
| 7,153 | Liberty Global PLC Class A* | 205,577 | ||||||
| 8,081 | Liberty Global PLC Class C* | 234,187 | ||||||
| 17,204 | Lumen Technologies, Inc. | 211,609 | ||||||
| 10,490 | Nippon Telegraph & Telephone Corp. | 279,483 | ||||||
| 3,682 | Orange SA | 41,861 | ||||||
| 15,280 | Singapore Telecommunications Ltd. | 26,398 | ||||||
| 14,275 | Spark New Zealand Ltd. | 49,016 | ||||||
| 153 | Swisscom AG | 89,801 | ||||||
| 86,846 | Telecom Italia SpA | 39,347 | ||||||
| 8,726 | Telefonica SA | 43,177 | ||||||
| 3,393 | Telenor ASA | 59,442 | ||||||
|
| |||||||
| Common Stocks – (continued) | ||||||||
| Diversified Telecommunication Services – (continued) | ||||||||
| 8,289 | Telia Co. AB | 35,637 | ||||||
| 16,665 | Telstra Corp. Ltd. | 46,721 | ||||||
| 2,320 | TELUS Corp. | 53,456 | ||||||
| 960 | United Internet AG | 41,494 | ||||||
| 10,412 | Verizon Communications, Inc. | 572,660 | ||||||
|
| |||||||
| 3,170,170 | ||||||||
|
| |||||||
| Electric Utilities – 0.1% | ||||||||
| 986 | Alliant Energy Corp. | 59,939 | ||||||
| 926 | American Electric Power Co., Inc. | 82,942 | ||||||
| 38,024 | AusNet Services Ltd. | 53,702 | ||||||
| 2,288 | Chubu Electric Power Co., Inc. | 27,667 | ||||||
| 3,420 | CLP Holdings Ltd. | 34,186 | ||||||
| 1,068 | Duke Energy Corp. | 111,777 | ||||||
| 438 | Edison International | 25,334 | ||||||
| 10,204 | EDP — Energias de Portugal SA | 56,015 | ||||||
| 285 | Elia Group SA | 35,795 | ||||||
| 930 | Emera, Inc. | 43,903 | ||||||
| 2,652 | Endesa SA | 63,760 | ||||||
| 11,616 | Enel SpA | 105,827 | ||||||
| 357 | Entergy Corp. | 39,488 | ||||||
| 743 | Evergy, Inc. | 50,858 | ||||||
| 578 | Eversource Energy | 52,442 | ||||||
| 2,468 | Exelon Corp. | 120,981 | ||||||
| 1,038 | Fortis, Inc. | 47,554 | ||||||
| 1,136 | Fortum Oyj | 34,529 | ||||||
| 32,706 | HK Electric Investments & HK Electric Investments Ltd. | 32,529 | ||||||
| 2,473 | Hydro One Ltd.(a) | 61,548 | ||||||
| 13,369 | Iberdrola SA | 165,661 | ||||||
| 11,187 | Mercury NZ Ltd. | 52,447 | ||||||
| 3,339 | NextEra Energy, Inc. | 280,443 | ||||||
| 8,570 | NRG Energy, Inc. | 391,392 | ||||||
| 739 | Orsted A/S(a) | 117,490 | ||||||
| 478 | Pinnacle West Capital Corp. | 36,758 | ||||||
| 3,998 | Power Assets Holdings Ltd. | 25,092 | ||||||
| 1,331 | PPL Corp. | 39,065 | ||||||
| 2,047 | Red Electrica Corp. SA | 40,824 | ||||||
| 1,906 | SSE PLC | 42,817 | ||||||
| 6,654 | Terna Rete Elettrica Nazionale | 52,634 | ||||||
| 1,224 | The Southern Co. | 80,454 | ||||||
| 619 | Verbund AG | 67,807 | ||||||
| 1,097 | Xcel Energy, Inc. | 75,419 | ||||||
|
| |||||||
| 2,609,079 | ||||||||
|
| |||||||
| Electrical Equipment – 0.1% | ||||||||
| 4,330 | ABB Ltd. | 160,187 | ||||||
| 823 | AMETEK, Inc. | 111,903 | ||||||
| 1,115 | Eaton Corp. PLC | 187,721 | ||||||
| 899 | Emerson Electric Co. | 94,844 | ||||||
| 471 | Fuji Electric Co. Ltd. | 20,376 | ||||||
| 312 | Generac Holdings, Inc.* | 136,338 | ||||||
| 726 | Legrand SA | 83,297 | ||||||
| 2,971 | Mitsubishi Electric Corp. | 40,617 | ||||||
| 837 | Nidec Corp. | 95,609 | ||||||
| 1,957 | Plug Power, Inc.* | 50,999 | ||||||
|
| |||||||
| The accompanying notes are an integral part of these financial statements. | 29 |
GOLDMAN SACHS GLOBAL MANAGED BETA FUND
Schedule of Investments (continued)
August 31, 2021
| Shares | Description | Value | ||||||
| Common Stocks – (continued) | ||||||||
| Electrical Equipment – (continued) | ||||||||
| 1,101 | Prysmian SpA | $ | 41,453 | |||||
| 642 | Rockwell Automation, Inc. | 208,939 | ||||||
| 1,076 | Schneider Electric SE | 192,245 | ||||||
| 1,259 | Sensata Technologies Holding PLC* | 74,508 | ||||||
| 1,063 | Siemens Energy AG* | 30,850 | ||||||
| 1,624 | Siemens Gamesa Renewable Energy SA* | 48,154 | ||||||
| 1,334 | Sunrun, Inc.* | 59,030 | ||||||
| 2,705 | Vestas Wind Systems A/S | 109,219 | ||||||
|
| |||||||
| 1,746,289 | ||||||||
|
| |||||||
| Electronic Equipment, Instruments & Components – 0.1% | ||||||||
| 1,540 | Amphenol Corp. Class A | 118,010 | ||||||
| 3,244 | Arrow Electronics, Inc.* | 393,238 | ||||||
| 1,258 | Azbil Corp. | 54,552 | ||||||
| 2,651 | CDW Corp. | 531,817 | ||||||
| 923 | Cognex Corp. | 81,796 | ||||||
| 2,660 | Corning, Inc. | 106,373 | ||||||
| 1,607 | Halma PLC | 66,362 | ||||||
| 569 | Hamamatsu Photonics KK | 33,163 | ||||||
| 6,672 | Hexagon AB Class B | 115,697 | ||||||
| 200 | Hirose Electric Co. Ltd. | 33,299 | ||||||
| 807 | Ibiden Co. Ltd. | 43,422 | ||||||
| 183 | IPG Photonics Corp.* | 31,235 | ||||||
| 342 | Keyence Corp. | 205,314 | ||||||
| 1,580 | Keysight Technologies, Inc.* | 283,421 | ||||||
| 634 | Kyocera Corp. | 39,414 | ||||||
| 1,314 | Murata Manufacturing Co. Ltd. | 108,323 | ||||||
| 994 | Omron Corp. | 93,661 | ||||||
| 253 | TDK Corp. | 26,517 | ||||||
| 970 | TE Connectivity Ltd. | 145,713 | ||||||
| 111 | Teledyne Technologies, Inc.* | 51,435 | ||||||
| 967 | Trimble, Inc.* | 91,111 | ||||||
| 2,472 | Venture Corp. Ltd. | 35,135 | ||||||
| 481 | Zebra Technologies Corp. Class A* | 282,429 | ||||||
|
| |||||||
| 2,971,437 | ||||||||
|
| |||||||
| Energy Equipment & Services – 0.0% | ||||||||
| 6,825 | Baker Hughes Co. | 155,473 | ||||||
| 6,220 | Halliburton Co. | 124,276 | ||||||
| 2,574 | Schlumberger N.V | 72,175 | ||||||
| 8,048 | Tenaris SA | 81,006 | ||||||
|
| |||||||
| 432,930 | ||||||||
|
| |||||||
| Entertainment – 0.1% | ||||||||
| 2,276 | Activision Blizzard, Inc. | 187,474 | ||||||
| 32,886 | Bollore SA | 194,917 | ||||||
| 3,070 | Capcom Co. Ltd. | 85,497 | ||||||
| 1,247 | Electronic Arts, Inc. | 181,077 | ||||||
| 2,446 | Embracer Group AB* | 55,680 | ||||||
| 932 | Koei Tecmo Holdings Co. Ltd. | 39,771 | ||||||
| 479 | Konami Holdings Corp. | 30,322 | ||||||
| 970 | Liberty Media Corp.-Liberty Formula One Class C* | 49,024 | ||||||
| 461 | Live Nation Entertainment, Inc.* | 39,969 | ||||||
| 797 | Netflix, Inc.* | 453,644 | ||||||
|
| |||||||
| Common Stocks – (continued) | ||||||||
| Entertainment – (continued) | ||||||||
| 1,675 | Nexon Co. Ltd. | 30,550 | ||||||
| 214 | Nintendo Co. Ltd. | 102,814 | ||||||
| 828 | Roku, Inc.* | 291,787 | ||||||
| 179 | Sea Ltd. ADR* | 60,559 | ||||||
| 1,122 | Square Enix Holdings Co. Ltd. | 65,228 | ||||||
| 758 | Take-Two Interactive Software, Inc.* | 122,205 | ||||||
| 2,535 | The Walt Disney Co.* | 459,595 | ||||||
| 834 | Toho Co. Ltd. | 36,133 | ||||||
| 1,312 | Ubisoft Entertainment SA* | 83,341 | ||||||
| 2,042 | Vivendi SE | 77,783 | ||||||
|
| |||||||
| 2,647,370 | ||||||||
|
| |||||||
| Equity Real Estate Investment Trusts (REITs) – 0.1% | ||||||||
| 526 | Alexandria Real Estate Equities, Inc. | 108,551 | ||||||
| 382 | American Tower Corp. | 111,609 | ||||||
| 10,532 | Ascendas Real Estate Investment Trust | 23,771 | ||||||
| 194 | AvalonBay Communities, Inc. | 44,538 | ||||||
| 629 | Boston Properties, Inc. | 71,071 | ||||||
| 1,496 | Camden Property Trust | 224,460 | ||||||
| 814 | Canadian Apartment Properties REIT | 39,427 | ||||||
| 466 | Crown Castle International Corp. | 90,726 | ||||||
| 10 | Daiwa House REIT Investment Corp. | 29,534 | ||||||
| 4,704 | Dexus | 36,607 | ||||||
| 1,606 | Digital Realty Trust, Inc. | 263,239 | ||||||
| 882 | Duke Realty Corp. | 46,314 | ||||||
| 109 | Equinix, Inc. | 91,936 | ||||||
| 487 | Equity LifeStyle Properties, Inc. | 41,429 | ||||||
| 484 | Equity Residential | 40,690 | ||||||
| 99 | Essex Property Trust, Inc. | 32,743 | ||||||
| 749 | Extra Space Storage, Inc. | 139,996 | ||||||
| 13 | GLP J-REIT | 23,598 | ||||||
| 6,503 | Goodman Group | 109,836 | ||||||
| 1,001 | Invitation Homes, Inc. | 41,221 | ||||||
| 2,073 | Iron Mountain, Inc. | 98,986 | ||||||
| 4 | Japan Real Estate Investment Corp. | 24,720 | ||||||
| 3,020 | Link REIT | 27,767 | ||||||
| 23,558 | Mapletree Logistics Trust | 35,438 | ||||||
| 1,154 | Medical Properties Trust, Inc. | 23,634 | ||||||
| 773 | Mid-America Apartment Communities, Inc. | 148,702 | ||||||
| 21 | Nippon Prologis REIT, Inc. | 75,517 | ||||||
| 1,059 | Prologis, Inc. | 142,605 | ||||||
| 604 | Public Storage | 195,460 | ||||||
| 583 | Realty Income Corp. | 42,104 | ||||||
| 955 | Regency Centers Corp. | 65,532 | ||||||
| 222 | SBA Communications Corp. | 79,691 | ||||||
| 5,894 | Segro PLC | 104,171 | ||||||
| 10,224 | Stockland | 34,454 | ||||||
| 764 | Sun Communities, Inc. | 153,938 | ||||||
| 528 | UDR, Inc. | 28,523 | ||||||
| 15 | United Urban Investment Corp. | 21,188 | ||||||
| 1,171 | Ventas, Inc. | 65,506 | ||||||
| 4,756 | VICI Properties, Inc. | 147,008 | ||||||
| 5,315 | Weyerhaeuser Co. | 191,340 | ||||||
| 433 | WP Carey, Inc. | 33,826 | ||||||
|
| |||||||
| 3,351,406 | ||||||||
|
| |||||||
| 30 | The accompanying notes are an integral part of these financial statements. |
GOLDMAN SACHS GLOBAL MANAGED BETA FUND
| Shares | Description | Value | ||||||
| Common Stocks – (continued) | ||||||||
| Food & Staples Retailing – 0.3% | ||||||||
| 2,009 | Aeon Co. Ltd. | $ | 53,184 | |||||
| 3,664 | Alimentation Couche-Tard, Inc. Class B | 148,053 | ||||||
| 7,061 | Carrefour SA | 140,571 | ||||||
| 16,643 | Coles Group Ltd. | 219,641 | ||||||
| 392 | Cosmos Pharmaceutical Corp. | 69,417 | ||||||
| 1,523 | Costco Wholesale Corp. | 693,711 | ||||||
| 11,664 | Empire Co. Ltd. Class A | 377,197 | ||||||
| 9,350 | Endeavour Group Ltd.* | 49,932 | ||||||
| 892 | Etablissements Franz Colruyt NV | 49,932 | ||||||
| 1,837 | George Weston Ltd. | 198,020 | ||||||
| 1,271 | ICA Gruppen AB | 63,230 | ||||||
| 58,395 | J Sainsbury PLC | 244,068 | ||||||
| 12,025 | Jeronimo Martins SGPS SA | 254,864 | ||||||
| 2,127 | Kesko Oyj Class B | 88,014 | ||||||
| 1,322 | Kobe Bussan Co. Ltd. | 51,426 | ||||||
| 15,057 | Koninklijke Ahold Delhaize NV | 507,985 | ||||||
| 1,322 | Lawson, Inc. | 63,583 | ||||||
| 3,630 | Loblaw Cos. Ltd. | 255,753 | ||||||
| 1,273 | Metro, Inc. | 64,848 | ||||||
| 2,493 | Seven & i Holdings Co. Ltd. | 108,785 | ||||||
| 3,184 | Sysco Corp. | 253,606 | ||||||
| 23,162 | Tesco PLC | 81,313 | ||||||
| 13,425 | The Kroger Co. | 617,953 | ||||||
| 1,474 | Tsuruha Holdings, Inc. | 185,070 | ||||||
| 4,897 | Walgreens Boots Alliance, Inc. | 248,523 | ||||||
| 6,579 | Walmart, Inc. | 974,350 | ||||||
| 5,988 | Welcia Holdings Co. Ltd. | 211,164 | ||||||
| 19,974 | Wm Morrison Supermarkets PLC | 79,448 | ||||||
| 9,350 | Woolworths Group Ltd. | 284,613 | ||||||
|
| |||||||
| 6,638,254 | ||||||||
|
| |||||||
| Food Products – 0.2% | ||||||||
| 4,941 | Ajinomoto Co., Inc. | 145,643 | ||||||
| 2,653 | Archer-Daniels-Midland Co. | 159,180 | ||||||
| 2,921 | Associated British Foods PLC | 79,644 | ||||||
| 16 | Barry Callebaut AG | 40,761 | ||||||
| 1,510 | Bunge Ltd. | 114,322 | ||||||
| 1,425 | Campbell Soup Co. | 59,465 | ||||||
| 5 | Chocoladefabriken Lindt & Spruengli AG | 58,804 | ||||||
| 5,477 | Conagra Brands, Inc. | 181,398 | ||||||
| 3,958 | Danone SA | 289,036 | ||||||
| 4,015 | General Mills, Inc. | 232,107 | ||||||
| 1,685 | Hormel Foods Corp. | 76,735 | ||||||
| 1,347 | JDE Peet’s NV | 46,283 | ||||||
| 1,263 | Kellogg Co. | 79,746 | ||||||
| 334 | Kerry Group PLC Class A | 48,981 | ||||||
| 531 | Kikkoman Corp. | 39,865 | ||||||
| 361 | Lamb Weston Holdings, Inc. | 23,519 | ||||||
| 1,075 | McCormick & Co., Inc. | 92,762 | ||||||
| 646 | MEIJI Holdings Co. Ltd. | 39,730 | ||||||
| 2,812 | Mondelez International, Inc. Class A | 174,541 | ||||||
| 7,464 | Nestle SA | 942,619 | ||||||
| 396 | Nissin Foods Holdings Co. Ltd. | 30,828 | ||||||
| 4,833 | Orkla ASA | 43,170 | ||||||
|
| |||||||
| Common Stocks – (continued) | ||||||||
| Food Products – (continued) | ||||||||
| 1,585 | Saputo, Inc. | 44,586 | ||||||
| 1,467 | The Hershey Co. | 260,686 | ||||||
| 1,587 | The J.M. Smucker Co. | 196,264 | ||||||
| 6,058 | The Kraft Heinz Co. | 218,027 | ||||||
| 628 | Toyo Suisan Kaisha Ltd. | 26,026 | ||||||
| 2,956 | Tyson Foods, Inc. Class A | 232,105 | ||||||
| 109,723 | WH Group Ltd.(a) | 95,170 | ||||||
| 28,291 | Wilmar International Ltd. | 86,882 | ||||||
|
| |||||||
| 4,158,885 | ||||||||
|
| |||||||
| Gas Utilities – 0.0% | ||||||||
| 2,083 | AltaGas Ltd. | 41,721 | ||||||
| 5,526 | APA Group | 37,002 | ||||||
| 423 | Atmos Energy Corp. | 41,247 | ||||||
| 1,419 | Enagas SA | 32,300 | ||||||
| 22,723 | Hong Kong & China Gas Co. Ltd. | 36,533 | ||||||
| 1,616 | Naturgy Energy Group SA | 41,568 | ||||||
| 1,345 | Osaka Gas Co. Ltd. | 25,212 | ||||||
| 8,515 | Snam SpA | 50,346 | ||||||
| 535 | Toho Gas Co. Ltd. | 24,940 | ||||||
| 6,761 | UGI Corp. | 313,102 | ||||||
|
| |||||||
| 643,971 | ||||||||
|
| |||||||
| Health Care Equipment & Supplies – 0.4% | ||||||||
| 3,321 | Abbott Laboratories | 419,675 | ||||||
| 945 | ABIOMED, Inc.* | 343,942 | ||||||
| 456 | Alcon, Inc. | 37,556 | ||||||
| 689 | Align Technology, Inc.* | 488,501 | ||||||
| 1,058 | Ambu A/S Class B | 33,460 | ||||||
| 1,170 | Asahi Intecc Co. Ltd. | 35,400 | ||||||
| 1,581 | Baxter International, Inc. | 120,504 | ||||||
| 562 | Becton Dickinson & Co. | 141,455 | ||||||
| 1,057 | BioMerieux | 129,457 | ||||||
| 2,004 | Boston Scientific Corp.* | 90,481 | ||||||
| 311 | Carl Zeiss Meditec AG | 68,718 | ||||||
| 1,085 | Cochlear Ltd. | 184,294 | ||||||
| 904 | Coloplast A/S Class B | 156,626 | ||||||
| 1,470 | Danaher Corp. | 476,515 | ||||||
| 884 | DENTSPLY SIRONA, Inc. | 54,543 | ||||||
| 362 | DexCom, Inc.* | 191,650 | ||||||
| 934 | DiaSorin SpA | 213,091 | ||||||
| 3,378 | Edwards Lifesciences Corp.* | 395,834 | ||||||
| 2,547 | Fisher & Paykel Healthcare Corp. Ltd. | 59,442 | ||||||
| 440 | GN Store Nord A/S | 33,121 | ||||||
| 1,754 | Hologic, Inc.* | 138,829 | ||||||
| 2,216 | Hoya Corp. | 357,849 | ||||||
| 1,031 | IDEXX Laboratories, Inc.* | 694,646 | ||||||
| 674 | Insulet Corp.* | 200,724 | ||||||
| 198 | Intuitive Surgical, Inc.* | 208,605 | ||||||
| 2,907 | Koninklijke Philips NV | 133,964 | ||||||
| 683 | Masimo Corp.* | 185,462 | ||||||
| 1,250 | Medtronic PLC | 166,850 | ||||||
| 1,735 | Novocure Ltd.* | 232,854 | ||||||
| 8,772 | Olympus Corp. | 184,321 | ||||||
| 1,448 | ResMed, Inc. | 420,687 | ||||||
| 803 | Siemens Healthineers AG(a) | 55,846 | ||||||
|
| |||||||
| The accompanying notes are an integral part of these financial statements. | 31 |
GOLDMAN SACHS GLOBAL MANAGED BETA FUND
Schedule of Investments (continued)
August 31, 2021
| Shares | Description | Value | ||||||
| Common Stocks – (continued) | ||||||||
| Health Care Equipment & Supplies – (continued) | ||||||||
| 6,236 | Smith & Nephew PLC | $ | 119,413 | |||||
| 146 | Sonova Holding AG | 56,264 | ||||||
| 433 | STERIS PLC | 93,099 | ||||||
| 125 | Straumann Holding AG | 241,530 | ||||||
| 679 | Stryker Corp. | 188,151 | ||||||
| 775 | Sysmex Corp. | 88,076 | ||||||
| 144 | Teleflex, Inc. | 56,946 | ||||||
| 1,202 | Terumo Corp. | 50,160 | ||||||
| 180 | The Cooper Cos., Inc. | 81,128 | ||||||
| 492 | West Pharmaceutical Services, Inc. | 222,197 | ||||||
| 332 | Zimmer Biomet Holdings, Inc. | 49,949 | ||||||
|
| |||||||
| 7,901,815 | ||||||||
|
| |||||||
| Health Care Providers & Services – 0.3% | ||||||||
| 1,678 | AmerisourceBergen Corp. | 205,068 | ||||||
| 733 | Amplifon SpA | 38,341 | ||||||
| 723 | Anthem, Inc. | 271,219 | ||||||
| 3,515 | Cardinal Health, Inc. | 184,502 | ||||||
| 2,915 | Centene Corp.* | 183,587 | ||||||
| 1,735 | Cigna Corp. | 367,213 | ||||||
| 6,115 | CVS Health Corp. | 528,275 | ||||||
| 2,262 | DaVita, Inc.* | 295,802 | ||||||
| 1,392 | Fresenius Medical Care AG & Co. KGaA | 107,031 | ||||||
| 2,336 | Fresenius SE & Co. KGaA | 121,456 | ||||||
| 1,310 | HCA Healthcare, Inc. | 331,404 | ||||||
| 3,162 | Henry Schein, Inc.* | 239,015 | ||||||
| 570 | Humana, Inc. | 231,089 | ||||||
| 1,455 | Laboratory Corp. of America Holdings* | 441,418 | ||||||
| 1,470 | McKesson Corp. | 300,086 | ||||||
| 3,205 | Medipal Holdings Corp. | 61,267 | ||||||
| 358 | Molina Healthcare, Inc.* | 96,220 | ||||||
| 452 | Oak Street Health, Inc.* | 21,122 | ||||||
| 1,559 | Quest Diagnostics, Inc. | 238,262 | ||||||
| 2,188 | Sonic Healthcare Ltd. | 69,270 | ||||||
| 2,952 | UnitedHealth Group, Inc. | 1,228,829 | ||||||
| 1,164 | Universal Health Services, Inc. Class B | 181,305 | ||||||
|
| |||||||
| 5,741,781 | ||||||||
|
| |||||||
| Health Care Technology – 0.0% | ||||||||
| 3,888 | Cerner Corp. | 296,849 | ||||||
| 1,242 | M3, Inc. | 83,298 | ||||||
| 242 | Teladoc Health, Inc.* | 34,950 | ||||||
| 879 | Veeva Systems, Inc. Class A* | 291,810 | ||||||
|
| |||||||
| 706,907 | ||||||||
|
| |||||||
| Hotels, Restaurants & Leisure – 0.1% | ||||||||
| 5,147 | Aramark | 179,064 | ||||||
| 1,836 | Aristocrat Leisure Ltd. | 60,938 | ||||||
| 68 | Booking Holdings, Inc.* | 156,378 | ||||||
| 745 | Caesars Entertainment, Inc.* | 75,714 | ||||||
| 80 | Chipotle Mexican Grill, Inc.* | 152,266 | ||||||
| 297 | Darden Restaurants, Inc. | 44,743 | ||||||
| 509 | Domino’s Pizza Enterprises Ltd. | 58,167 | ||||||
| 928 | Domino’s Pizza, Inc. | 479,674 | ||||||
| 7,042 | Entain PLC* | 187,147 | ||||||
|
| |||||||
| Common Stocks – (continued) | ||||||||
| Hotels, Restaurants & Leisure – (continued) | ||||||||
| 898 | Evolution AB(a) | 144,984 | ||||||
| 456 | Expedia Group, Inc.* | 65,892 | ||||||
| 382 | Flutter Entertainment PLC* | 74,263 | ||||||
| 919 | Hilton Worldwide Holdings, Inc.* | 114,746 | ||||||
| 6,142 | La Francaise des Jeux SAEM(a) | 317,844 | ||||||
| 740 | Marriott International, Inc. Class A* | 100,004 | ||||||
| 1,278 | McDonald’s Corp. | 303,474 | ||||||
| 779 | McDonald’s Holdings Co. Japan Ltd. | 37,157 | ||||||
| 1,751 | MGM Resorts International | 74,628 | ||||||
| 303 | Oriental Land Co. Ltd. | 45,843 | ||||||
| 1,792 | Starbucks Corp. | 210,542 | ||||||
| 5,559 | Tabcorp Holdings Ltd. | 19,361 | ||||||
| 85 | Vail Resorts, Inc.* | 25,912 | ||||||
| 2,750 | Yum! Brands, Inc. | 360,333 | ||||||
|
| |||||||
| 3,289,074 | ||||||||
|
| |||||||
| Household Durables – 0.1% | ||||||||
| 8,407 | Barratt Developments PLC | 85,513 | ||||||
| 413 | Berkeley Group Holdings PLC | 27,433 | ||||||
| 1,106 | D.R. Horton, Inc. | 105,756 | ||||||
| 4,867 | Electrolux AB Class B | 123,677 | ||||||
| 715 | Garmin Ltd. | 124,717 | ||||||
| 8,590 | Husqvarna AB Class B | 115,394 | ||||||
| 1,993 | Iida Group Holdings Co. Ltd. | 50,597 | ||||||
| 1,969 | Lennar Corp. Class A | 211,293 | ||||||
| 1,402 | Mohawk Industries, Inc.* | 277,260 | ||||||
| 5,046 | Newell Brands, Inc. | 128,219 | ||||||
| 25 | NVR, Inc.* | 129,498 | ||||||
| 5,756 | Panasonic Corp. | 68,813 | ||||||
| 2,135 | PulteGroup, Inc. | 114,991 | ||||||
| 247 | Rinnai Corp. | 26,552 | ||||||
| 2,053 | SEB SA | 323,166 | ||||||
| 3,934 | Sekisui House Ltd. | 78,378 | ||||||
| 2,749 | Sony Group Corp. | 284,234 | ||||||
| 688 | Whirlpool Corp. | 152,413 | ||||||
|
| |||||||
| 2,427,904 | ||||||||
|
| |||||||
| Household Products – 0.1% | ||||||||
| 1,266 | Church & Dwight Co., Inc. | 105,914 | ||||||
| 5,593 | Colgate-Palmolive Co. | 435,974 | ||||||
| 1,335 | Essity AB Class B | 42,850 | ||||||
| 565 | Henkel AG & Co. KGaA | 50,853 | ||||||
| 1,819 | Kimberly-Clark Corp. | 250,676 | ||||||
| 2,631 | Lion Corp. | 44,769 | ||||||
| 2,511 | Pigeon Corp. | 72,733 | ||||||
| 1,594 | Reckitt Benckiser Group PLC | 121,688 | ||||||
| 1,775 | The Clorox Co. | 298,289 | ||||||
| 5,715 | The Procter & Gamble Co. | 813,759 | ||||||
| 1,362 | Unicharm Corp. | 60,722 | ||||||
|
| |||||||
| 2,298,227 | ||||||||
|
| |||||||
| Independent Power and Renewable Electricity Producers – 0.0% | ||||||||
| 1,834 | EDP Renovaveis SA | 48,767 | ||||||
| 10,642 | Meridian Energy Ltd. | 39,305 | ||||||
| 1,643 | Northland Power, Inc. | 54,357 | ||||||
| 4,771 | The AES Corp. | 113,884 | ||||||
|
| |||||||
| 32 | The accompanying notes are an integral part of these financial statements. |
GOLDMAN SACHS GLOBAL MANAGED BETA FUND
| Shares | Description | Value | ||||||
| Common Stocks – (continued) | ||||||||
| Independent Power and Renewable Electricity Producers – (continued) | ||||||||
| 3,652 | Uniper SE | $ | 144,994 | |||||
| 17,160 | Vistra Corp. | 327,584 | ||||||
|
| |||||||
| 728,891 | ||||||||
|
| |||||||
| Industrial Conglomerates – 0.1% | ||||||||
| 1,292 | 3M Co. | 251,604 | ||||||
| 21,501 | CK Hutchison Holdings Ltd. | 156,745 | ||||||
| 253 | DCC PLC | 21,506 | ||||||
| 1,782 | General Electric Co | 187,841 | ||||||
| 3,116 | Hitachi Ltd. | 172,210 | ||||||
| 817 | Honeywell International, Inc. | 189,470 | ||||||
| 2,127 | Investment AB Latour Class B | 74,109 | ||||||
| 1,385 | Jardine Matheson Holdings Ltd. | 75,108 | ||||||
| 17,142 | Melrose Industries PLC | 39,583 | ||||||
| 226 | Roper Technologies, Inc. | 109,221 | ||||||
| 1,427 | Siemens AG | 236,732 | ||||||
|
| |||||||
| 1,514,129 | ||||||||
|
| |||||||
| Insurance – 0.3% | ||||||||
| 8,122 | Admiral Group PLC | 403,551 | ||||||
| 2,561 | Aflac, Inc. | 145,157 | ||||||
| 1,306 | Ageas SA | 65,265 | ||||||
| 19,958 | AIA Group Ltd. | 238,313 | ||||||
| 43 | Alleghany Corp.* | 29,098 | ||||||
| 1,201 | Allianz SE | 281,949 | ||||||
| 338 | American Financial Group, Inc. | 46,624 | ||||||
| 1,395 | Aon PLC Class A | 400,170 | ||||||
| 3,046 | Arch Capital Group Ltd.* | 125,191 | ||||||
| 1,384 | Arthur J. Gallagher & Co. | 198,770 | ||||||
| 7,809 | Assicurazioni Generali SpA | 159,312 | ||||||
| 525 | Assurant, Inc. | 89,308 | ||||||
| 2,337 | Athene Holding Ltd. Class A* | 156,509 | ||||||
| 20,657 | Aviva PLC | 114,814 | ||||||
| 4,282 | AXA SA | 120,296 | ||||||
| 475 | Baloise Holding AG | 75,745 | ||||||
| 5 | Brookfield Asset Management Reinsurance Partners, Ltd. Class A* | 305 | ||||||
| 1,605 | Brown & Brown, Inc. | 93,170 | ||||||
| 930 | Chubb Ltd. | 171,046 | ||||||
| 290 | Cincinnati Financial Corp. | 35,786 | ||||||
| 3,785 | CNP Assurances | 64,856 | ||||||
| 2,060 | Dai-ichi Life Holdings, Inc. | 40,762 | ||||||
| 22,196 | Direct Line Insurance Group PLC | 94,295 | ||||||
| 653 | Erie Indemnity Co. Class A | 115,640 | ||||||
| 237 | Everest Re Group Ltd. | 62,781 | ||||||
| 103 | Fairfax Financial Holdings Ltd. | 45,593 | ||||||
| 1,837 | Fidelity National Financial, Inc. | 89,701 | ||||||
| 4,939 | Gjensidige Forsikring ASA | 115,456 | ||||||
| 828 | Globe Life, Inc. | 79,546 | ||||||
| 4,402 | Great-West Lifeco, Inc. | 136,179 | ||||||
| 548 | Hannover Rueck SE | 100,847 | ||||||
| 4,252 | iA Financial Corp., Inc. | 235,778 | ||||||
| 7,993 | Insurance Australia Group Ltd. | 30,521 | ||||||
| 739 | Intact Financial Corp. | 100,648 | ||||||
| 7,225 | Japan Post Holdings Co. Ltd. | 62,097 | ||||||
| 23,802 | Legal & General Group PLC | 88,416 | ||||||
|
| |||||||
| Common Stocks – (continued) | ||||||||
| Insurance – (continued) | ||||||||
| 2,384 | Lincoln National Corp. | 163,662 | ||||||
| 383 | Loews Corp. | 21,398 | ||||||
| 5,208 | Manulife Financial Corp. | 101,423 | ||||||
| 28 | Markel Corp.* | 35,567 | ||||||
| 1,679 | Marsh & McLennan Cos., Inc. | 263,939 | ||||||
| 12,505 | Medibank Pvt. Ltd. | 32,398 | ||||||
| 3,382 | MetLife, Inc. | 209,684 | ||||||
| 1,397 | MS&AD Insurance Group Holdings, Inc. | 45,219 | ||||||
| 371 | Muenchener Rueckversicherungs-Gesellschaft AG in Muenchen | 108,283 | ||||||
| 2,321 | NN Group NV | 120,397 | ||||||
| 2,999 | Phoenix Group Holdings PLC | 25,697 | ||||||
| 6,961 | Poste Italiane SpA(a) | 94,377 | ||||||
| 8,464 | Power Corp. of Canada | 292,096 | ||||||
| 1,436 | Principal Financial Group, Inc. | 95,939 | ||||||
| 643 | Reinsurance Group of America, Inc. | 74,472 | ||||||
| 252 | RenaissanceRe Holdings Ltd. | 39,496 | ||||||
| 878 | Sompo Holdings, Inc. | 38,595 | ||||||
| 1,730 | Sun Life Financial, Inc. | 89,074 | ||||||
| 11,150 | Suncorp Group Ltd. | 101,454 | ||||||
| 352 | Swiss Life Holding AG | 183,472 | ||||||
| 267 | Swiss Re AG | 24,548 | ||||||
| 2,559 | The Allstate Corp. | 346,181 | ||||||
| 1,442 | The Hartford Financial Services Group, Inc. | 96,931 | ||||||
| 2,898 | The Progressive Corp. | 279,193 | ||||||
| 878 | The Travelers Cos., Inc. | 140,225 | ||||||
| 1,160 | Tokio Marine Holdings, Inc. | 56,758 | ||||||
| 1,146 | Tryg A/S | 28,375 | ||||||
| 494 | W.R. Berkley Corp. | 37,203 | ||||||
| 592 | Willis Towers Watson PLC | 130,666 | ||||||
| 380 | Zurich Insurance Group AG | 166,741 | ||||||
|
| |||||||
| 7,856,958 | ||||||||
|
| |||||||
| Interactive Media & Services – 0.4% | ||||||||
| 2,697 | Adevinta ASA* | 54,278 | ||||||
| 813 | Alphabet, Inc. Class A* | 2,352,781 | ||||||
| 877 | Alphabet, Inc. Class C* | 2,551,404 | ||||||
| 34,991 | Auto Trader Group PLC(a) | 302,589 | ||||||
| 7,528 | Facebook, Inc. Class A* | 2,855,973 | ||||||
| 353 | IAC/InterActiveCorp.* | 46,614 | ||||||
| 2,317 | Match Group, Inc.* | 318,448 | ||||||
| 2,339 | Pinterest, Inc. Class A* | 129,978 | ||||||
| 1,110 | REA Group Ltd. | 124,229 | ||||||
| 601 | Scout24 AG(a) | 50,528 | ||||||
| 1,680 | SEEK Ltd. | 39,796 | ||||||
| 2,631 | Snap, Inc. Class A* | 200,245 | ||||||
| 2,144 | Twitter, Inc.* | 138,288 | ||||||
| 9,699 | Z Holdings Corp. | 63,065 | ||||||
| 408 | Zillow Group, Inc. Class A* | 39,005 | ||||||
| 656 | Zillow Group, Inc. Class C* | 62,825 | ||||||
|
| |||||||
| 9,330,046 | ||||||||
|
| |||||||
| Internet & Direct Marketing Retail – 0.3% | ||||||||
| 1,389 | Amazon.com, Inc.* | 4,820,927 | ||||||
|
| |||||||
| The accompanying notes are an integral part of these financial statements. | 33 |
GOLDMAN SACHS GLOBAL MANAGED BETA FUND
Schedule of Investments (continued)
August 31, 2021
| Shares | Description | Value | ||||||
| Common Stocks – (continued) | ||||||||
| Internet & Direct Marketing Retail – (continued) | ||||||||
| 1,289 | Chewy, Inc. Class A* | $ | 113,587 | |||||
| 460 | Delivery Hero SE*(a) | 66,760 | ||||||
| 5,246 | eBay, Inc. | 402,578 | ||||||
| 1,392 | Etsy, Inc.* | 301,034 | ||||||
| 3,143 | HelloFresh SE* | 339,343 | ||||||
| 105 | MercadoLibre, Inc.* | 196,082 | ||||||
| 796 | Mercari, Inc.* | 39,277 | ||||||
| 887 | Prosus NV | 78,513 | ||||||
| 9,073 | Rakuten Group, Inc. | 94,906 | ||||||
| 1,794 | Wayfair, Inc. Class A* | 503,665 | ||||||
| 3,533 | Zalando SE*(a) | 391,721 | ||||||
| 7,864 | ZOZO, Inc. | 299,901 | ||||||
|
| |||||||
| 7,648,294 | ||||||||
|
| |||||||
| IT Services – 0.4% | ||||||||
| 2,719 | Accenture PLC Class A | 915,107 | ||||||
| 50 | Adyen NV*(a) | 161,604 | ||||||
| 669 | Afterpay Ltd.* | 65,073 | ||||||
| 897 | Akamai Technologies, Inc.* | 101,585 | ||||||
| 3,865 | Atos SE | 200,947 | ||||||
| 810 | Automatic Data Processing, Inc. | 169,322 | ||||||
| 507 | Bechtle AG | 36,658 | ||||||
| 619 | Broadridge Financial Solutions, Inc. | 106,604 | ||||||
| 976 | Capgemini SE | 219,392 | ||||||
| 2,194 | CGI, Inc.* | 196,089 | ||||||
| 910 | Cloudflare, Inc. Class A* | 109,873 | ||||||
| 4,893 | Cognizant Technology Solutions Corp. Class A | 373,385 | ||||||
| 654 | Edenred | 37,095 | ||||||
| 373 | EPAM Systems, Inc.* | 236,038 | ||||||
| 2,237 | Fidelity National Information Services, Inc. | 285,822 | ||||||
| 2,679 | Fiserv, Inc.* | 315,559 | ||||||
| 563 | FleetCor Technologies, Inc.* | 148,227 | ||||||
| 745 | Fujitsu Ltd. | 137,145 | ||||||
| 1,166 | Gartner, Inc.* | 359,991 | ||||||
| 1,030 | Global Payments, Inc. | 167,519 | ||||||
| 323 | GMO Payment Gateway, Inc. | 42,377 | ||||||
| 859 | GoDaddy, Inc. Class A* | 62,973 | ||||||
| 4,016 | International Business Machines Corp. | 563,606 | ||||||
| 1,107 | Itochu Techno-Solutions Corp. | 34,203 | ||||||
| 493 | Jack Henry & Associates, Inc. | 86,955 | ||||||
| 1,939 | Mastercard, Inc. Class A | 671,340 | ||||||
| 277 | MongoDB, Inc.* | 108,537 | ||||||
| 1,731 | NEC Corp. | 90,848 | ||||||
| 1,492 | Nomura Research Institute Ltd. | 55,951 | ||||||
| 2,940 | NTT Data Corp. | 52,911 | ||||||
| 376 | Obic Co. Ltd. | 71,391 | ||||||
| 496 | Okta, Inc.* | 130,746 | ||||||
| 522 | Otsuka Corp. | 27,022 | ||||||
| 1,624 | Paychex, Inc. | 185,899 | ||||||
| 2,155 | PayPal Holdings, Inc.* | 622,062 | ||||||
| 176 | Shopify, Inc. Class A* | 268,759 | ||||||
| 208 | Snowflake, Inc. Class A* | 63,305 | ||||||
| 846 | Square, Inc. Class A* | 226,787 | ||||||
| 8,664 | The Western Union Co. | 187,489 | ||||||
|
| |||||||
| Common Stocks – (continued) | ||||||||
| IT Services – (continued) | ||||||||
| 356 | Twilio, Inc. Class A* | 127,078 | ||||||
| 1,099 | VeriSign, Inc.* | 237,670 | ||||||
| 3,198 | Visa, Inc. Class A | 732,662 | ||||||
| 994 | Wix.com Ltd.* | 220,748 | ||||||
|
| |||||||
| 9,214,354 | ||||||||
|
| |||||||
| Leisure Products – 0.0% | ||||||||
| 712 | Bandai Namco Holdings, Inc. | 49,384 | ||||||
| 410 | Hasbro, Inc. | 40,307 | ||||||
| 740 | Peloton Interactive, Inc. Class A* | 74,140 | ||||||
| 170 | Shimano, Inc. | 49,888 | ||||||
|
| |||||||
| 213,719 | ||||||||
|
| |||||||
| Life Sciences Tools & Services – 0.1% | ||||||||
| 442 | 10X Genomics, Inc. Class A* | 77,757 | ||||||
| 1,359 | Agilent Technologies, Inc. | 238,464 | ||||||
| 191 | Bio-Rad Laboratories, Inc. Class A* | 153,721 | ||||||
| 340 | Charles River Laboratories International, Inc.* | 150,912 | ||||||
| 727 | Eurofins Scientific SE | 103,155 | ||||||
| 298 | Illumina, Inc.* | 136,234 | ||||||
| 512 | IQVIA Holdings, Inc.* | 132,982 | ||||||
| 110 | Lonza Group AG | 93,030 | ||||||
| 367 | Mettler-Toledo International, Inc.* | 569,888 | ||||||
| 865 | PerkinElmer, Inc. | 159,852 | ||||||
| 914 | PPD, Inc.* | 42,327 | ||||||
| 1,504 | QIAGEN NV* | 83,234 | ||||||
| 488 | Sartorius Stedim Biotech | 296,005 | ||||||
| 933 | Thermo Fisher Scientific, Inc. | 517,768 | ||||||
| 844 | Waters Corp.* | 349,433 | ||||||
|
| |||||||
| 3,104,762 | ||||||||
|
| |||||||
| Machinery – 0.2% | ||||||||
| 608 | Alfa Laval AB | 24,688 | ||||||
| 836 | Alstom SA | 35,942 | ||||||
| 1,301 | Atlas Copco AB Class A | 89,440 | ||||||
| 1,042 | Atlas Copco AB Class B | 60,343 | ||||||
| 1,123 | Caterpillar, Inc. | 236,807 | ||||||
| 6,038 | CNH Industrial NV | 99,813 | ||||||
| 1,232 | Cummins, Inc. | 290,727 | ||||||
| 502 | Daifuku Co. Ltd. | 44,307 | ||||||
| 808 | Deere & Co. | 305,448 | ||||||
| 779 | Dover Corp. | 135,827 | ||||||
| 4,408 | Epiroc AB Class A | 92,338 | ||||||
| 231 | FANUC Corp. | 50,326 | ||||||
| 640 | Fortive Corp. | 47,277 | ||||||
| 987 | GEA Group AG | 45,558 | ||||||
| 474 | Harmonic Drive Systems, Inc. | 26,171 | ||||||
| 339 | IDEX Corp. | 75,936 | ||||||
| 874 | Illinois Tool Works, Inc. | 203,520 | ||||||
| 868 | Ingersoll Rand, Inc.* | 46,021 | ||||||
| 866 | KION Group AG | 92,668 | ||||||
| 741 | Knorr-Bremse AG | 88,976 | ||||||
| 1,111 | Komatsu Ltd. | 27,023 | ||||||
| 770 | Kone Oyj Class B | 63,895 | ||||||
| 2,478 | Kubota Corp. | 51,200 | ||||||
|
| |||||||
| 34 | The accompanying notes are an integral part of these financial statements. |
GOLDMAN SACHS GLOBAL MANAGED BETA FUND
| Shares | Description | Value | ||||||
| Common Stocks – (continued) | ||||||||
| Machinery – (continued) | ||||||||
| 502 | Kurita Water Industries Ltd. | $ | 23,545 | |||||
| 2,964 | MISUMI Group, Inc. | 117,577 | ||||||
| 787 | Miura Co. Ltd. | 35,332 | ||||||
| 706 | Nabtesco Corp. | 27,919 | ||||||
| 224 | Nordson Corp. | 53,446 | ||||||
| 1,409 | Otis Worldwide Corp. | 129,938 | ||||||
| 959 | PACCAR, Inc. | 78,513 | ||||||
| 1,060 | Parker-Hannifin Corp. | 314,470 | ||||||
| 597 | Pentair PLC | 46,065 | ||||||
| 37 | Rational AG | 42,344 | ||||||
| 1,093 | Sandvik AB | 27,892 | ||||||
| 407 | Schindler Holding AG) | 129,231 | ||||||
| 65 | SMC Corp. | 41,590 | ||||||
| 1,517 | Snap-on, Inc. | 341,249 | ||||||
| 439 | Spirax-Sarco Engineering PLC | 97,351 | ||||||
| 588 | Stanley Black & Decker, Inc. | 113,643 | ||||||
| 12,552 | Techtronic Industries Co. Ltd. | 277,804 | ||||||
| 839 | Volvo AB Class A | 19,464 | ||||||
| 2,002 | Volvo AB Class B | 45,331 | ||||||
| 1,570 | Westinghouse Air Brake Technologies Corp. | 140,970 | ||||||
| 680 | Xylem, Inc. | 92,691 | ||||||
| 800 | Yaskawa Electric Corp. | 39,047 | ||||||
|
| |||||||
| 4,469,663 | ||||||||
|
| |||||||
| Marine – 0.1% | ||||||||
| 129 | AP Moller — Maersk A/S Class A | 349,581 | ||||||
| 122 | AP Moller — Maersk A/S Class B | 347,548 | ||||||
| 1,108 | Kuehne & Nagel International AG | 404,938 | ||||||
| 980 | Nippon Yusen KK | 78,807 | ||||||
|
| |||||||
| 1,180,874 | ||||||||
|
| |||||||
| Media – 0.2% | ||||||||
| 45 | Cable One, Inc. | 94,482 | ||||||
| 421 | Charter Communications, Inc. Class A* | 343,814 | ||||||
| 13,055 | Comcast Corp. Class A | 792,177 | ||||||
| 20,280 | CyberAgent, Inc. | 371,248 | ||||||
| 2,749 | Dentsu Group, Inc. | 102,189 | ||||||
| 7,658 | Discovery, Inc. Class A* | 220,857 | ||||||
| 9,343 | Discovery, Inc. Class C* | 257,773 | ||||||
| 6,246 | Fox Corp. Class A | 233,850 | ||||||
| 6,058 | Fox Corp. Class B | 209,789 | ||||||
| 2,474 | Hakuhodo DY Holdings, Inc. | 39,011 | ||||||
| 543 | Liberty Broadband Corp. Class A* | 100,873 | ||||||
| 592 | Liberty Broadband Corp. Class C* | 113,261 | ||||||
| 4,541 | Liberty Media Corp.-Liberty SiriusXM Class A* | 224,779 | ||||||
| 4,473 | Liberty Media Corp.-Liberty SiriusXM Class C* | 220,743 | ||||||
| 11,532 | News Corp. Class A | 259,124 | ||||||
| 2,338 | Omnicom Group, Inc. | 171,188 | ||||||
| 4,716 | Pearson PLC | 49,733 | ||||||
| 2,256 | Publicis Groupe SA | 148,106 | ||||||
| 1,596 | Quebecor, Inc. Class B | 39,822 | ||||||
| 871 | Schibsted ASA Class A | 46,469 | ||||||
| 2,073 | Schibsted ASA Class B | 96,470 | ||||||
|
| |||||||
| Common Stocks – (continued) | ||||||||
| Media – (continued) | ||||||||
| 11,214 | Sirius XM Holdings, Inc. | 70,312 | ||||||
| 6,456 | The Interpublic Group of Cos., Inc. | 240,357 | ||||||
| 4,879 | ViacomCBS, Inc. Class B | 202,235 | ||||||
| 9,200 | WPP PLC | 124,741 | ||||||
|
| |||||||
| 4,773,403 | ||||||||
|
| |||||||
| Metals & Mining – 0.2% | ||||||||
| 2,215 | Anglo American PLC | 93,552 | ||||||
| 3,152 | Antofagasta PLC | 63,140 | ||||||
| 11,926 | ArcelorMittal SA | 399,998 | ||||||
| 11,499 | B2Gold Corp. | 44,478 | ||||||
| 4,303 | Barrick Gold Corp. | 86,493 | ||||||
| 4,800 | BHP Group Ltd. | 158,816 | ||||||
| 3,782 | BHP Group PLC | 117,605 | ||||||
| 14,188 | BlueScope Steel Ltd. | 259,390 | ||||||
| 603 | Boliden AB | 21,053 | ||||||
| 18,176 | Evraz PLC | 147,847 | ||||||
| 3,082 | First Quantum Minerals Ltd. | 64,198 | ||||||
| 10,585 | Fortescue Metals Group Ltd. | 161,371 | ||||||
| 3,127 | Freeport-McMoRan, Inc. | 113,791 | ||||||
| 25,606 | Glencore PLC | 115,425 | ||||||
| 9,749 | Ivanhoe Mines, Ltd. Class A* | 78,663 | ||||||
| 8,985 | Kinross Gold Corp. | 54,053 | ||||||
| 1,262 | Kirkland Lake Gold Ltd. | 50,324 | ||||||
| 4,858 | Lundin Mining Corp. | 39,275 | ||||||
| 1,903 | Newcrest Mining Ltd. | 34,358 | ||||||
| 2,181 | Newmont Corp. | 126,476 | ||||||
| 16,842 | Norsk Hydro ASA | 116,264 | ||||||
| 3,676 | Northern Star Resources Ltd. | 26,151 | ||||||
| 2,217 | Nucor Corp. | 260,630 | ||||||
| 1,072 | Rio Tinto Ltd. | 87,223 | ||||||
| 1,918 | Rio Tinto PLC | 141,902 | ||||||
| 87,313 | South32 Ltd. | 198,990 | ||||||
| 1,153 | Steel Dynamics, Inc. | 77,816 | ||||||
| 818 | Sumitomo Metal Mining Co. Ltd. | 31,347 | ||||||
| 1,740 | Teck Resources Ltd. Class B | 39,237 | ||||||
| 4,129 | voestalpine AG | 187,436 | ||||||
| 8,134 | Yamana Gold, Inc. | 35,910 | ||||||
|
| |||||||
| 3,433,212 | ||||||||
|
| |||||||
| Mortgage Real Estate Investment Trusts (REITs) – 0.0% | ||||||||
| 7,026 | AGNC Investment Corp. | 114,594 | ||||||
| 15,267 | Annaly Capital Management, Inc. | 132,670 | ||||||
|
| |||||||
| 247,264 | ||||||||
|
| |||||||
| Multi-Utilities – 0.1% | ||||||||
| 15,326 | AGL Energy Ltd. | 72,105 | ||||||
| 1,530 | Algonquin Power & Utilities Corp. | 23,757 | ||||||
| 674 | Ameren Corp. | 59,123 | ||||||
| 954 | Canadian Utilities Ltd. Class A | 27,002 | ||||||
| 932 | CenterPoint Energy, Inc. | 23,384 | ||||||
| 890 | CMS Energy Corp. | 57,076 | ||||||
| 731 | Consolidated Edison, Inc. | 55,154 | ||||||
| 891 | Dominion Energy, Inc. | 69,355 | ||||||
| 533 | DTE Energy Co. | 64,141 | ||||||
| 5,759 | E.ON SE | 75,982 | ||||||
|
| |||||||
| The accompanying notes are an integral part of these financial statements. | 35 |
GOLDMAN SACHS GLOBAL MANAGED BETA FUND
Schedule of Investments (continued)
August 31, 2021
| Shares | Description | Value | ||||||
| Common Stocks – (continued) | ||||||||
| Multi-Utilities – (continued) | ||||||||
| 7,476 | Engie SA | $ | 107,130 | |||||
| 6,219 | National Grid PLC | 80,438 | ||||||
| 1,593 | NiSource, Inc. | 39,267 | ||||||
| 1,180 | Public Service Enterprise Group, Inc. | 75,449 | ||||||
| 3,727 | RWE AG | 145,531 | ||||||
| 354 | Sempra Energy | 46,855 | ||||||
| 7,265 | Suez SA | 168,561 | ||||||
| 2,467 | Veolia Environnement SA | 84,661 | ||||||
| 648 | WEC Energy Group, Inc. | 61,223 | ||||||
|
| |||||||
| 1,336,194 | ||||||||
|
| |||||||
| Multiline Retail – 0.1% | ||||||||
| 789 | Canadian Tire Corp. Ltd. Class A | 120,071 | ||||||
| 1,470 | Dollar General Corp. | 327,678 | ||||||
| 2,091 | Dollar Tree, Inc.* | 189,319 | ||||||
| 2,821 | Dollarama, Inc. | 128,635 | ||||||
| 2,234 | Next PLC | 242,950 | ||||||
| 1,184 | Pan Pacific International Holdings Corp. | 22,524 | ||||||
| 7,530 | Ryohin Keikaku Co. Ltd. | 161,232 | ||||||
| 3,622 | Target Corp. | 894,561 | ||||||
| 8,260 | Wesfarmers Ltd. | 360,768 | ||||||
|
| |||||||
| 2,447,738 | ||||||||
|
| |||||||
| Oil, Gas & Consumable Fuels – 0.1% | ||||||||
| 1,156 | Ampol Ltd. | 23,216 | ||||||
| 7,896 | BP PLC | 32,123 | ||||||
| 2,494 | Cameco Corp. | 46,079 | ||||||
| 1,111 | Canadian Natural Resources Ltd. | 36,765 | ||||||
| 936 | Cheniere Energy, Inc.* | 81,863 | ||||||
| 1,581 | Chevron Corp. | 152,993 | ||||||
| 924 | Devon Energy Corp. | 27,304 | ||||||
| 266 | DTE Midstream LLC* | 12,361 | ||||||
| 1,122 | Enbridge, Inc. | 44,154 | ||||||
| 15,230 | ENEOS Holdings, Inc. | 58,863 | ||||||
| 594 | EOG Resources, Inc. | 40,107 | ||||||
| 4,246 | Exxon Mobil Corp. | 231,492 | ||||||
| 11,859 | Kinder Morgan, Inc. | 192,946 | ||||||
| 922 | Koninklijke Vopak NV | 39,932 | ||||||
| 1,020 | Marathon Petroleum Corp. | 60,455 | ||||||
| 1,026 | Neste Oyj | 62,496 | ||||||
| 2,614 | Occidental Petroleum Corp. | 67,154 | ||||||
| 1,954 | OMV AG | 108,233 | ||||||
| 1,908 | Parkland Corp. | 56,969 | ||||||
| 6,516 | Repsol SA | 74,772 | ||||||
| 9,614 | Royal Dutch Shell PLC Class A | 190,544 | ||||||
| 8,927 | Royal Dutch Shell PLC Class B | 175,662 | ||||||
| 514 | TC Energy Corp. | 24,403 | ||||||
| 1,722 | The Williams Cos., Inc. | 42,516 | ||||||
| 221 | Thungela Resources, Ltd.* | 922 | ||||||
| 1,269 | TotalEnergies SE | 56,131 | ||||||
| 1,252 | Valero Energy Corp. | 83,020 | ||||||
| 2,338 | Washington H Soul Pattinson & Co. Ltd. | 60,960 | ||||||
|
| |||||||
| 2,084,435 | ||||||||
|
| |||||||
| Common Stocks – (continued) | ||||||||
| Paper & Forest Products – 0.0% | ||||||||
| 1,106 | Mondi PLC | 30,509 | ||||||
| 4,380 | Oji Holdings Corp. | 22,928 | ||||||
| 2,047 | Stora Enso Oyj Class R | 40,161 | ||||||
| 2,653 | Svenska Cellulosa AB SCA Class B | 46,888 | ||||||
| 1,282 | UPM-Kymmene Oyj | 52,227 | ||||||
| 1,209 | West Fraser Timber Co. Ltd. | 93,354 | ||||||
|
| |||||||
| 286,067 | ||||||||
|
| |||||||
| Personal Products – 0.1% | ||||||||
| 1,124 | Beiersdorf AG | 136,413 | ||||||
| 472 | Kao Corp. | 28,512 | ||||||
| 323 | Kobayashi Pharmaceutical Co. Ltd. | 25,282 | ||||||
| 902 | Kose Corp. | 108,857 | ||||||
| 1,303 | L’Oreal SA | 611,288 | ||||||
| 5,298 | Pola Orbis Holdings, Inc. | 115,581 | ||||||
| 2,341 | Shiseido Co. Ltd. | 155,159 | ||||||
| 1,777 | The Estee Lauder Cos., Inc. Class A | 605,051 | ||||||
| 3,793 | Unilever PLC | 211,194 | ||||||
|
| |||||||
| 1,997,337 | ||||||||
|
| |||||||
| Pharmaceuticals – 0.5% | ||||||||
| 11,771 | Astellas Pharma, Inc. | 198,340 | ||||||
| 2,903 | AstraZeneca PLC | 339,487 | ||||||
| 4,242 | AstraZeneca PLC ADR | 247,224 | ||||||
| 1,418 | Bausch Health Cos., Inc.* | 41,315 | ||||||
| 1,179 | Bayer AG | 65,589 | ||||||
| 8,431 | Bristol-Myers Squibb Co. | 563,697 | ||||||
| 808 | Catalent, Inc.* | 105,395 | ||||||
| 2,739 | Chugai Pharmaceutical Co. Ltd. | 107,021 | ||||||
| 3,015 | Daiichi Sankyo Co. Ltd. | 71,614 | ||||||
| 1,057 | Eisai Co. Ltd. | 87,170 | ||||||
| 894 | Elanco Animal Health, Inc.* | 29,842 | ||||||
| 2,834 | Eli Lilly & Co. | 731,994 | ||||||
| 12,934 | GlaxoSmithKline PLC | 260,175 | ||||||
| 2,520 | Hikma Pharmaceuticals PLC | 87,960 | ||||||
| 4,668 | Ipsen SA | 466,918 | ||||||
| 1,839 | Jazz Pharmaceuticals PLC* | 242,215 | ||||||
| 7,896 | Johnson & Johnson | 1,367,034 | ||||||
| 1,196 | Kyowa Kirin Co. Ltd. | 39,134 | ||||||
| 7,166 | Merck & Co., Inc. | 546,694 | ||||||
| 1,592 | Merck KGaA | 378,254 | ||||||
| 4,550 | Novartis AG | 420,833 | ||||||
| 5,249 | Novo Nordisk A/S Class B | 525,477 | ||||||
| 2,118 | Ono Pharmaceutical Co. Ltd. | 50,854 | ||||||
| 716 | Organon & Co | 24,265 | ||||||
| 3,855 | Orion Oyj Class B | 157,246 | ||||||
| 881 | Otsuka Holdings Co. Ltd. | 37,491 | ||||||
| 11,978 | Pfizer, Inc. | 551,826 | ||||||
| 2,657 | Recordati Industria Chimica e Farmaceutica SpA | 174,355 | ||||||
| 2,472 | Roche Holding AG | 996,193 | ||||||
| 758 | Royalty Pharma PLC Class A | 29,297 | ||||||
| 2,942 | Sanofi | 304,905 | ||||||
| 517 | Shionogi & Co. Ltd. | 32,483 | ||||||
| 7,289 | Sumitomo Dainippon Pharma Co. Ltd. | 130,838 | ||||||
|
| |||||||
| 36 | The accompanying notes are an integral part of these financial statements. |
GOLDMAN SACHS GLOBAL MANAGED BETA FUND
| Shares | Description | Value | ||||||
| Common Stocks – (continued) | ||||||||
| Pharmaceuticals – (continued) | ||||||||
| 1,029 | Taisho Pharmaceutical Holdings Co. Ltd. | $ | 60,019 | |||||
| 2,848 | Takeda Pharmaceutical Co. Ltd. | 94,797 | ||||||
| 18,440 | Teva Pharmaceutical Industries Ltd. ADR* | 173,705 | ||||||
| 1,539 | UCB SA | 176,075 | ||||||
| 17,127 | Viatris, Inc. | 250,568 | ||||||
| 1,414 | Zoetis, Inc. | 289,248 | ||||||
|
| |||||||
| 10,457,547 | ||||||||
|
| |||||||
| Professional Services – 0.2% | ||||||||
| 1,291 | Adecco Group AG | 71,815 | ||||||
| 2,358 | Booz Allen Hamilton Holding Corp. | 193,144 | ||||||
| 1,137 | Bureau Veritas SA | 37,788 | ||||||
| 480 | CoStar Group, Inc.* | 40,675 | ||||||
| 206 | Equifax, Inc. | 56,086 | ||||||
| 1,370 | Experian PLC | 60,431 | ||||||
| 1,003 | IHS Markit Ltd. | 120,962 | ||||||
| 483 | Intertek Group PLC | 35,021 | ||||||
| 1,040 | Jacobs Engineering Group, Inc. | 140,358 | ||||||
| 3,445 | Leidos Holdings, Inc. | 337,989 | ||||||
| 1,476 | Nihon M&A Center, Inc. | 44,015 | ||||||
| 5,442 | Persol Holdings Co. Ltd. | 127,046 | ||||||
| 2,621 | Randstad NV | 193,027 | ||||||
| 5,854 | Recruit Holdings Co. Ltd. | 344,696 | ||||||
| 6,032 | RELX PLC | 181,027 | ||||||
| 7,578 | Robert Half International, Inc. | 783,565 | ||||||
| 130 | SGS SA | 408,569 | ||||||
| 154 | Teleperformance | 68,127 | ||||||
| 460 | Thomson Reuters Corp. | 53,750 | ||||||
| 450 | TransUnion | 54,689 | ||||||
| 398 | Verisk Analytics, Inc. | 80,300 | ||||||
| 1,605 | Wolters Kluwer NV | 184,576 | ||||||
|
| |||||||
| 3,617,656 | ||||||||
|
| |||||||
| Real Estate Management & Development – 0.1% | ||||||||
| 390 | Azrieli Group Ltd. | 36,458 | ||||||
| 9,284 | CapitaLand Ltd. | 27,546 | ||||||
| 5,031 | CBRE Group, Inc. Class A* | 484,485 | ||||||
| 11,922 | CK Asset Holdings Ltd. | 77,637 | ||||||
| 972 | Daito Trust Construction Co. Ltd. | 106,751 | ||||||
| 1,604 | Deutsche Wohnen SE | 99,565 | ||||||
| 9,159 | ESR Cayman Ltd.*(a) | 27,902 | ||||||
| 490 | FirstService Corp. | 91,005 | ||||||
| 11,134 | Hang Lung Properties Ltd. | 26,738 | ||||||
| 6,848 | Henderson Land Development Co. Ltd. | 30,983 | ||||||
| 4,562 | Hongkong Land Holdings Ltd. | 19,142 | ||||||
| 378 | LEG Immobilien SE | 60,294 | ||||||
| 13,858 | Sino Land Co. Ltd. | 20,409 | ||||||
| 3,573 | Sun Hung Kai Properties Ltd. | 50,394 | ||||||
| 10,882 | Swire Pacific Ltd. Class A | 73,669 | ||||||
| 7,215 | Swire Properties Ltd. | 19,500 | ||||||
| 474 | Swiss Prime Site AG | 50,721 | ||||||
| 1,331 | Vonovia SE | 89,857 | ||||||
|
| |||||||
| 1,393,056 | ||||||||
|
| |||||||
| Common Stocks – (continued) | ||||||||
| Road & Rail – 0.1% | ||||||||
| 183 | AMERCO | 120,991 | ||||||
| 8,352 | Aurizon Holdings Ltd. | 22,978 | ||||||
| 984 | Canadian National Railway Co. | 115,742 | ||||||
| 1,590 | Canadian Pacific Railway Ltd. | 109,252 | ||||||
| 3,357 | CSX Corp. | 109,203 | ||||||
| 569 | J.B. Hunt Transport Services, Inc. | 100,941 | ||||||
| 386 | Kansas City Southern | 108,339 | ||||||
| 5,699 | Knight-Swift Transportation Holdings, Inc. | 295,949 | ||||||
| 3,927 | MTR Corp. Ltd. | 22,107 | ||||||
| 276 | Nippon Express Co. Ltd. | 18,767 | ||||||
| 647 | Norfolk Southern Corp. | 164,040 | ||||||
| 413 | Old Dominion Freight Line, Inc. | 119,241 | ||||||
| 948 | Uber Technologies, Inc.* | 37,105 | ||||||
| 1,016 | Union Pacific Corp. | 220,309 | ||||||
| 2,164 | XPO Logistics, Inc.* | 188,073 | ||||||
|
| |||||||
| 1,753,037 | ||||||||
|
| |||||||
| Semiconductors & Semiconductor Equipment – 0.4% | ||||||||
| 6,306 | Advanced Micro Devices, Inc.* | 698,200 | ||||||
| 1,298 | Advantest Corp. | 111,825 | ||||||
| 1,941 | Analog Devices, Inc. | 316,261 | ||||||
| 3,847 | Applied Materials, Inc. | 519,845 | ||||||
| 227 | ASM International NV | 88,074 | ||||||
| 774 | ASML Holding NV | 645,506 | ||||||
| 1,123 | Broadcom, Inc. | 558,367 | ||||||
| 82 | Disco Corp. | 23,821 | ||||||
| 499 | Enphase Energy, Inc.* | 86,691 | ||||||
| 1,962 | Infineon Technologies AG | 83,538 | ||||||
| 16,309 | Intel Corp. | 881,664 | ||||||
| 549 | KLA Corp. | 186,638 | ||||||
| 447 | Lam Research Corp. | 270,355 | ||||||
| 506 | Lasertec Corp. | 110,060 | ||||||
| 1,348 | Marvell Technology, Inc. | 82,484 | ||||||
| 1,086 | Microchip Technology, Inc. | 170,893 | ||||||
| 4,696 | Micron Technology, Inc.* | 346,095 | ||||||
| 243 | Monolithic Power Systems, Inc. | 120,268 | ||||||
| 5,992 | NVIDIA Corp. | 1,341,309 | ||||||
| 1,715 | NXP Semiconductors NV | 368,948 | ||||||
| 7,534 | ON Semiconductor Corp.* | 334,208 | ||||||
| 1,955 | Qorvo, Inc.* | 367,599 | ||||||
| 3,698 | QUALCOMM, Inc. | 542,460 | ||||||
| 7,939 | Renesas Electronics Corp.* | 85,010 | ||||||
| 815 | Skyworks Solutions, Inc. | 149,520 | ||||||
| 235 | SolarEdge Technologies, Inc.* | 68,098 | ||||||
| 1,881 | STMicroelectronics NV | 83,792 | ||||||
| 955 | Sumco Corp. | 20,105 | ||||||
| 2,813 | Teradyne, Inc. | 341,611 | ||||||
| 3,644 | Texas Instruments, Inc. | 695,676 | ||||||
| 316 | Tokyo Electron Ltd. | 135,357 | ||||||
| 1,257 | Xilinx, Inc. | 195,577 | ||||||
|
| |||||||
| 10,029,855 | ||||||||
|
| |||||||
| Software – 0.8% | ||||||||
| 1,518 | Adobe, Inc.* | 1,007,497 | ||||||
| 242 | ANSYS, Inc.* | 88,417 | ||||||
|
| |||||||
| The accompanying notes are an integral part of these financial statements. | 37 |
GOLDMAN SACHS GLOBAL MANAGED BETA FUND
Schedule of Investments (continued)
August 31, 2021
| Shares | Description | Value | ||||||
| Common Stocks – (continued) | ||||||||
| Software – (continued) | ||||||||
| 1,433 | Autodesk, Inc.* | $ | 444,359 | |||||
| 539 | Avalara, Inc.* | 96,858 | ||||||
| 511 | Bentley Systems, Inc. Class B | 32,954 | ||||||
| 1,650 | Black Knight, Inc.* | 124,855 | ||||||
| 5,587 | BlackBerry Ltd.* | 63,679 | ||||||
| 4,191 | Cadence Design Systems, Inc.* | 685,145 | ||||||
| 336 | Ceridian HCM Holding, Inc.* | 37,750 | ||||||
| 504 | Check Point Software Technologies Ltd.* | 63,318 | ||||||
| 2,790 | Citrix Systems, Inc. | 287,007 | ||||||
| 316 | Constellation Software, Inc. | 535,543 | ||||||
| 97 | Coupa Software, Inc.* | 23,747 | ||||||
| 584 | Crowdstrike Holdings, Inc. Class A* | 164,104 | ||||||
| 1,730 | Dassault Systemes SE | 98,811 | ||||||
| 608 | Datadog, Inc. Class A* | 83,782 | ||||||
| 949 | DocuSign, Inc.* | 281,132 | ||||||
| 9,355 | Dropbox, Inc. Class A* | 296,647 | ||||||
| 426 | Fair Isaac Corp.* | 195,849 | ||||||
| 1,548 | Fortinet, Inc.* | 487,837 | ||||||
| 609 | Guidewire Software, Inc.* | 72,142 | ||||||
| 247 | HubSpot, Inc.* | 169,064 | ||||||
| 1,263 | Intuit, Inc. | 714,997 | ||||||
| 301 | Lightspeed Commerce, Inc.* | 33,415 | ||||||
| 23,176 | Microsoft Corp. | 6,996,371 | ||||||
| 1,724 | Nemetschek SE | 168,967 | ||||||
| 492 | Nice Ltd.* | 142,876 | ||||||
| 7,611 | NortonLifeLock, Inc. | 202,148 | ||||||
| 797 | Open Text Corp. | 43,721 | ||||||
| 6,984 | Oracle Corp. | 622,484 | ||||||
| 1,339 | Palantir Technologies, Inc. Class A* | 35,269 | ||||||
| 465 | Palo Alto Networks, Inc.* | 214,384 | ||||||
| 98 | Paycom Software, Inc.* | 47,912 | ||||||
| 710 | PTC, Inc.* | 93,479 | ||||||
| 947 | RingCentral, Inc. Class A* | 238,890 | ||||||
| 2,555 | salesforce.com, Inc.* | 677,765 | ||||||
| 2,681 | SAP SE | 402,713 | ||||||
| 847 | ServiceNow, Inc.* | 545,163 | ||||||
| 2,620 | Sinch AB*(a) | 58,902 | ||||||
| 496 | Splunk, Inc.* | 75,824 | ||||||
| 4,599 | SS&C Technologies Holdings, Inc. | 347,960 | ||||||
| 1,020 | Synopsys, Inc.* | 338,885 | ||||||
| 19,516 | The Sage Group PLC | 199,308 | ||||||
| 1,390 | The Trade Desk, Inc. Class A* | 111,269 | ||||||
| 204 | Tyler Technologies, Inc.* | 99,083 | ||||||
| 276 | Unity Software, Inc.* | 34,983 | ||||||
| 1,189 | VMware, Inc. Class A* | 177,006 | ||||||
| 1,742 | WiseTech Global, Ltd. | 61,233 | ||||||
| 502 | Workday, Inc. Class A* | 137,126 | ||||||
| 722 | Xero Ltd.* | 79,856 | ||||||
| 739 | Zendesk, Inc.* | 91,340 | ||||||
| 618 | Zoom Video Communications, Inc. Class A* | 178,911 | ||||||
| 435 | Zscaler, Inc.* | 121,078 | ||||||
|
| |||||||
| 18,633,815 | ||||||||
|
| |||||||
| Common Stocks – (continued) | ||||||||
| Specialty Retail – 0.3% | ||||||||
| 1,043 | Advance Auto Parts, Inc. | 211,573 | ||||||
| 291 | AutoZone, Inc.* | 450,803 | ||||||
| 1,474 | Bath & Body Works, Inc. | 99,465 | ||||||
| 4,909 | Best Buy Co., Inc. | 571,948 | ||||||
| 622 | Burlington Stores, Inc.* | 186,283 | ||||||
| 548 | CarMax, Inc.* | 68,615 | ||||||
| 196 | Carvana Co.* | 64,300 | ||||||
| 24,085 | Chow Tai Fook Jewellery Group Ltd. | 48,724 | ||||||
| 240 | Fast Retailing Co. Ltd. | 158,083 | ||||||
| 10,189 | Hennes & Mauritz AB Class B* | 204,601 | ||||||
| 1,869 | Industria de Diseno Textil SA | 63,848 | ||||||
| 17,173 | JD Sports Fashion PLC | 238,468 | ||||||
| 18,754 | Kingfisher PLC | 90,301 | ||||||
| 3,804 | Lowe’s Cos., Inc. | 775,598 | ||||||
| 1,181 | Nitori Holdings Co. Ltd. | 220,971 | ||||||
| 686 | O’Reilly Automotive, Inc.* | 407,539 | ||||||
| 1,243 | Ross Stores, Inc. | 147,171 | ||||||
| 3,803 | The Home Depot, Inc. | 1,240,462 | ||||||
| 5,077 | The TJX Cos., Inc. | 369,199 | ||||||
| 2,043 | Tractor Supply Co. | 396,853 | ||||||
| 855 | Ulta Beauty, Inc.* | 331,150 | ||||||
| 491 | Victoria’s Secret & Co* | 32,553 | ||||||
| 17,757 | Yamada Holdings Co. Ltd. | 76,180 | ||||||
|
| |||||||
| 6,454,688 | ||||||||
|
| |||||||
| Technology Hardware, Storage & Peripherals – 0.5% | ||||||||
| 57,032 | Apple, Inc. | 8,659,169 | ||||||
| 3,222 | Brother Industries Ltd. | 66,121 | ||||||
| 1,951 | Canon, Inc. | 46,418 | ||||||
| 2,693 | Dell Technologies, Inc. Class C* | 262,460 | ||||||
| 3,575 | FUJIFILM Holdings Corp. | 294,194 | ||||||
| 2,983 | Hewlett Packard Enterprise Co. | 46,117 | ||||||
| 7,174 | HP, Inc. | 213,355 | ||||||
| 1,617 | Logitech International SA | 165,564 | ||||||
| 2,773 | NetApp, Inc. | 246,603 | ||||||
| 3,283 | Seagate Technology Holdings PLC | 287,558 | ||||||
| 2,067 | Seiko Epson Corp. | 38,497 | ||||||
| 514 | Western Digital Corp.* | 32,485 | ||||||
|
| |||||||
| 10,358,541 | ||||||||
|
| |||||||
| Textiles, Apparel & Luxury Goods – 0.2% | ||||||||
| 1,087 | adidas AG | 385,613 | ||||||
| 9,718 | Burberry Group PLC | 248,836 | ||||||
| 677 | Cie Financiere Richemont SA Class A | 74,721 | ||||||
| 626 | EssilorLuxottica SA | 123,003 | ||||||
| 623 | Gildan Activewear, Inc. | 23,949 | ||||||
| 374 | Hermes International | 550,456 | ||||||
| 231 | Kering SA | 183,996 | ||||||
| 1,485 | Lululemon Athletica, Inc.* | 594,253 | ||||||
| 885 | LVMH Moet Hennessy Louis Vuitton SE | 655,617 | ||||||
| 4,924 | Moncler SpA | 315,285 | ||||||
| 5,352 | NIKE, Inc. Class B | 881,689 | ||||||
| 2,701 | Pandora A/S | 323,753 | ||||||
| 2,198 | Puma SE | 266,870 | ||||||
|
| |||||||
| 38 | The accompanying notes are an integral part of these financial statements. |
GOLDMAN SACHS GLOBAL MANAGED BETA FUND
| Shares | Description | Value | ||||||
| Common Stocks – (continued) | ||||||||
| Textiles, Apparel & Luxury Goods – (continued) | ||||||||
| 947 | The Swatch Group AG (Textiles, Apparel & Luxury Goods) | $ | 84,344 | |||||
| 2,803 | VF Corp. | 214,345 | ||||||
|
| |||||||
| 4,926,730 | ||||||||
|
| |||||||
| Tobacco – 0.1% | ||||||||
| 2,448 | Altria Group, Inc. | 122,963 | ||||||
| 7,972 | British American Tobacco PLC | 299,056 | ||||||
| 8,138 | Imperial Brands PLC | 172,581 | ||||||
| 2,193 | Japan Tobacco, Inc. | 42,550 | ||||||
| 6,099 | Philip Morris International, Inc. | 628,197 | ||||||
| 25,280 | Swedish Match AB | 233,554 | ||||||
|
| |||||||
| 1,498,901 | ||||||||
|
| |||||||
| Trading Companies & Distributors – 0.1% | ||||||||
| 1,608 | Ashtead Group PLC | 125,702 | ||||||
| 2,195 | Brenntag SE | 221,516 | ||||||
| 1,401 | Bunzl PLC | 50,763 | ||||||
| 7,976 | Fastenal Co. | 445,460 | ||||||
| 2,572 | Ferguson PLC | 371,752 | ||||||
| 4,427 | ITOCHU Corp. | 133,169 | ||||||
| 24,929 | Marubeni Corp. | 198,343 | ||||||
| 2,883 | Mitsubishi Corp. | 86,757 | ||||||
| 2,277 | Mitsui & Co. Ltd. | 50,220 | ||||||
| 9,968 | MonotaRO Co. Ltd. | 220,919 | ||||||
| 2,728 | Reece, Ltd. | 41,517 | ||||||
| 3,884 | Sumitomo Corp. | 54,736 | ||||||
| 865 | Toromont Industries Ltd. | 72,729 | ||||||
| 3,740 | Toyota Tsusho Corp. | 165,375 | ||||||
| 775 | United Rentals, Inc.* | 273,304 | ||||||
| 885 | W.W. Grainger, Inc. | 383,824 | ||||||
|
| |||||||
| 2,896,086 | ||||||||
|
| |||||||
| Transportation Infrastructure – 0.0% | ||||||||
| 3,378 | Atlantia SpA* | 63,276 | ||||||
| 3,655 | Transurban Group | 37,830 | ||||||
|
| |||||||
| 101,106 | ||||||||
|
| |||||||
| Water Utilities – 0.0% | ||||||||
| 648 | American Water Works Co., Inc. | 118,098 | ||||||
| 880 | Essential Utilities, Inc. | 43,674 | ||||||
| 2,038 | Severn Trent PLC | 77,431 | ||||||
| 3,555 | United Utilities Group PLC | 51,699 | ||||||
|
| |||||||
| 290,902 | ||||||||
|
| |||||||
| Wireless Telecommunication Services – 0.0% | ||||||||
| 6,240 | KDDI Corp. | 190,728 | ||||||
| 635 | Rogers Communications, Inc. Class B | 32,353 | ||||||
| 6,634 | SoftBank Corp. | 88,781 | ||||||
| 1,854 | SoftBank Group Corp. | 104,480 | ||||||
| 1,511 | T-Mobile US, Inc.* | 207,037 | ||||||
| 2,727 | Tele2 AB Class B | 40,941 | ||||||
| 59,757 | Vodafone Group PLC | 100,366 | ||||||
|
| |||||||
| 764,686 | ||||||||
|
| |||||||
| | TOTAL COMMON STOCKS (Cost $138,188,816) | $ | 232,159,098 | |||||
|
| |||||||
| Shares | Dividend Rate | Value | ||||||
| Preferred Stocks – 0.0% | ||||||||
| Automobiles – 0.0% | ||||||||
Bayerische Motoren Werke AG | ||||||||
| EUR | 495 | 2.847% | $ | 41,440 | ||||
Porsche Automobil Holding SE | ||||||||
| 411 | 2.546 | 41,580 | ||||||
Volkswagen AG | ||||||||
| 333 | 2.476 | 79,206 | ||||||
|
| |||||||
| 162,226 | ||||||||
|
| |||||||
| Chemicals – 0.0% | ||||||||
Fuchs Petrolub SE | ||||||||
| 3,146 | 2.305 | 159,210 | ||||||
|
| |||||||
| Diversified Telecommunication Services – 0.0% | ||||||||
Telecom Italia SpA | ||||||||
| 78,061 | 7.073 | 37,714 | ||||||
|
| |||||||
| Health Care Equipment & Supplies – 0.0% | ||||||||
Sartorius AG | ||||||||
| 261 | 0.126 | 171,950 | ||||||
|
| |||||||
| Household Products – 0.0% | ||||||||
Henkel AG & Co. KGaA | ||||||||
| 615 | 2.342 | 60,087 | ||||||
|
| |||||||
| TOTAL PREFERRED STOCKS | ||||||||
| (Cost $483,445) | $ | 591,187 | ||||||
|
| |||||||
| Shares | Description | Value | ||||||
| Exchange Traded Funds – 77.3% | ||||||||
| 749,848 | Goldman Sachs ActiveBeta Emerging Markets Equity ETF(b) | 29,364,048 | ||||||
| 5,479,625 | Goldman Sachs MarketBeta International Equity ETF(b) | 316,708,078 | ||||||
| 5,162,182 | Goldman Sachs MarketBeta U.S. Equity ETF(b)(c) | 325,682,063 | ||||||
| 4,758,536 | iShares Core MSCI Emerging Markets ETF | 304,974,572 | ||||||
| 783 | iShares MSCI Canada ETF | 29,237 | ||||||
| 2,221,216 | iShares MSCI EAFE ETF | 179,118,858 | ||||||
| 1,613,243 | iShares MSCI EAFE Small-Cap ETF | 125,123,127 | ||||||
| 1,129,923 | Vanguard S&P 500 ETF | 468,974,541 | ||||||
|
| |||||||
| TOTAL EXCHANGE TRADED FUNDS | ||||||||
| (Cost $1,267,260,399) | $ | 1,749,974,524 | ||||||
|
| |||||||
| The accompanying notes are an integral part of these financial statements. | 39 |
GOLDMAN SACHS GLOBAL MANAGED BETA FUND
Schedule of Investments (continued)
August 31, 2021
| Shares | Dividend Rate | Value | ||||||
| Investment Company(b) – 8.5% | ||||||||
| | Goldman Sachs Financial Square Government Fund – | | ||||||
| 191,755,643 | 0.026% | $ | 191,755,643 | |||||
| (Cost $191,755,643) | ||||||||
|
| |||||||
| | TOTAL INVESTMENTS BEFORE SECURITIES LENDING REINVESTMENT | | ||||||
| (Cost $1,597,688,303) | $ | 2,174,480,452 | ||||||
|
| |||||||
| Securities Lending Reinvestment Vehicle(b) – 0.0% | ||||||||
| | Goldman Sachs Financial Square Government Fund – | | ||||||
| 961,050 | 0.026% | $ | 961,050 | |||||
| (Cost $961,050) | ||||||||
|
| |||||||
| TOTAL INVESTMENTS – 96.1% | ||||||||
| (Cost $1,598,649,353) | $ | 2,175,441,502 | ||||||
|
| |||||||
| | OTHER ASSETS IN EXCESS OF LIABILITIES – 3.9% | 87,153,829 | ||||||
|
| |||||||
| NET ASSETS – 100.0% | $ | 2,262,595,331 | ||||||
|
| |||||||
| The percentage shown for each investment category reflects the value of investments in that category as a percentage of net assets. | ||
* | Non-income producing security. | |
(a) | Exempt from registration under Rule 144A of the Securities Act of 1933. | |
(b) | Represents an affiliated fund. | |
(c) | All or a portion of security is on loan. | |
| ||
Currency Abbreviations: | ||
AUD | —Australian Dollar | |
CAD | —Canadian Dollar | |
CHF | —Swiss Franc | |
DKK | —Danish Krone | |
EUR | —Euro | |
GBP | —British Pound | |
HKD | —Hong Kong Dollar | |
ILS | —Israeli Shekel | |
JPY | —Japanese Yen | |
NOK | —Norwegian Krone | |
NZD | —New Zealand Dollar | |
SEK | —Swedish Krona | |
SGD | —Singapore Dollar | |
USD | —U.S. Dollar | |
Investment Abbreviations: | ||
ADR | —American Depositary Receipt | |
ETF | —Exchange Traded Fund | |
LLC | —Limited Liability Company | |
PLC | —Public Limited Company | |
REIT | —Real Estate Investment Trust | |
| ||
| ADDITIONAL INVESTMENT INFORMATION |
FORWARD FOREIGN CURRENCY EXCHANGE CONTRACTS — At August 31, 2021, the Fund had the following forward foreign currency exchange contracts:
FORWARD FOREIGN CURRENCY EXCHANGE CONTRACTS WITH UNREALIZED GAIN
| Counterparty | Currency Purchased | Currency Sold | Settlement Date | Unrealized Gain | ||||||||||||||||
MS & Co. Int. PLC | USD | 33,329,460 | AUD | 43,300,000 | 09/15/21 | $ | 1,650,400 | |||||||||||||
| USD | 41,382,647 | CHF | 37,140,000 | 09/15/21 | 809,700 | |||||||||||||||
| USD | 12,317,048 | DKK | 75,310,000 | 09/15/21 | 356,665 | |||||||||||||||
| USD | 155,125,768 | EUR | 127,400,000 | 09/15/21 | 4,652,470 | |||||||||||||||
| USD | 66,924,027 | GBP | 47,365,000 | 09/15/21 | 1,801,655 | |||||||||||||||
| USD | 13,422,000 | HKD | 104,140,000 | 09/15/21 | 31,456 | |||||||||||||||
| USD | 97,784,720 | JPY | 10,713,000,000 | 09/15/21 | 394,584 | |||||||||||||||
| USD | 2,746,818 | NOK | 22,900,000 | 09/15/21 | 112,813 | |||||||||||||||
| USD | 955,462 | NZD | 1,320,000 | 09/15/21 | 25,324 | |||||||||||||||
| USD | 18,142,268 | SEK | 151,125,000 | 09/15/21 | 627,549 | |||||||||||||||
| USD | 4,282,794 | SGD | 5,670,000 | 09/15/21 | 65,615 | |||||||||||||||
| TOTAL |
| $ | 10,528,231 | |||||||||||||||||
| 40 | The accompanying notes are an integral part of these financial statements. |
GOLDMAN SACHS GLOBAL MANAGED BETA FUND
| ADDITIONAL INVESTMENT INFORMATION (continued) |
FORWARD FOREIGN CURRENCY EXCHANGE CONTRACTS WITH UNREALIZED LOSS
| Counterparty | Currency Purchased | Currency Sold | Settlement Date | Unrealized Loss | ||||||||||||||||
MS & Co. Int. PLC | CAD | 32,370,000 | USD | 26,831,674 | 09/15/21 | $ | (1,175,486 | ) | ||||||||||||
| SGD | 80,000 | USD | 59,503 | 09/15/21 | (2 | ) | ||||||||||||||
| USD | 629,164 | AUD | 860,000 | 09/15/21 | (28 | ) | ||||||||||||||
| USD | 5,885,238 | CHF | 5,420,000 | 09/15/21 | (35,747 | ) | ||||||||||||||
| USD | 884,545 | DKK | 5,570,000 | 09/15/21 | (56 | ) | ||||||||||||||
| USD | 5,762,888 | EUR | 4,880,000 | 09/15/21 | (924 | ) | ||||||||||||||
| USD | 1,161,756 | GBP | 845,000 | 09/15/21 | (39 | ) | ||||||||||||||
| USD | 140,151 | HKD | 1,090,000 | 09/15/21 | (3 | ) | ||||||||||||||
| USD | 1,689,195 | ILS | 5,480,000 | 09/17/21 | (19,290 | ) | ||||||||||||||
| USD | 8,253,311 | JPY | 914,000,000 | 09/15/21 | (55,714 | ) | ||||||||||||||
| USD | 301,897 | NOK | 2,650,000 | 09/15/21 | (2,911 | ) | ||||||||||||||
| USD | 181,760 | NZD | 260,000 | 09/15/21 | (1,449 | ) | ||||||||||||||
| USD | 112,994 | SEK | 975,000 | 09/15/21 | (4 | ) | ||||||||||||||
| USD | 546,809 | SGD | 740,000 | 09/15/21 | (3,579 | ) | ||||||||||||||
| TOTAL |
| $ | (1,295,232 | ) | ||||||||||||||||
FUTURES CONTRACTS — At August 31, 2021, the Fund had the following futures contracts:
| Description | Number of Contracts | Expiration Date | Notional Amount | Unrealized Appreciation/ (Depreciation) | ||||||||||||
Long position contracts: | ||||||||||||||||
E-Mini Russell 2000 Index | 1,538 | 09/17/21 | $ | 174,655,280 | $ | (2,795,643 | ) | |||||||||
S&P Toronto Stock Exchange 60 Index | 296 | 09/16/21 | 57,710,205 | 1,459,033 | ||||||||||||
S&P 500 E-Mini Index | 638 | 09/17/21 | 144,203,950 | 8,842,523 | ||||||||||||
| TOTAL FUTURES CONTRACTS |
| $ | 7,505,913 | |||||||||||||
OVER THE COUNTER TOTAL RETURN SWAP CONTRACTS
| Reference Obligation/ Index(a) | Financing Rate Paid by the Fund(b) | Counterparty | Termination Date(c) | Notional Amount (000s) | Unrealized Appreciation/ (Depreciation)* | |||||||||
MSGSHBC Index | 0.500% | MS & Co. Int. PLC | 02/09/22 | $ | 26,664 | $ | (11,718 | ) | ||||||
| * | There are no upfront payments on the swap contracts, therefore the unrealized gain (loss) on the swap contracts is equal to their market value. |
| (a) | The top 50 components are shown below. |
| (b) | Payments made quarterly. |
| (c) | The Fund pays/receives annual coupon payments in accordance with the swap contract. On the termination date of the swap contract, the Fund will either receive from or pay to the counterparty an amount equal to the net of the accrued financing fees and the value of the reference security subtracted from the original notional cost (notional multiplied by the price change of the reference security, converted to U.S. Dollars). |
| The accompanying notes are an integral part of these financial statements. | 41 |
GOLDMAN SACHS GLOBAL MANAGED BETA FUND
Schedule of Investments (continued)
August 31, 2021
| ADDITIONAL INVESTMENT INFORMATION (continued) |
A basket (MSGSHBC) of common stocks
| Common Stocks | Sector | Shares | Value | Weight | ||||||||||
Cleveland-Cliffs Inc | Basic Materials | (17 | ) | $ | (406 | ) | 3.46 | % | ||||||
Alcoa Corp | Basic Materials | (8 | ) | (375 | ) | 3.20 | ||||||||
Freeport-McMoRan Inc | Basic Materials | (10 | ) | (356 | ) | 3.04 | ||||||||
LyondellBasell Industries NV | Basic Materials | (3 | ) | (286 | ) | 2.44 | ||||||||
Devon Energy Corp | Energy | (10 | ) | (282 | ) | 2.41 | ||||||||
Southwest Airlines Co | Consumer, Cyclical | (5 | ) | (269 | ) | 2.29 | ||||||||
United Rentals Inc | Consumer, Non-cyclical | (1 | ) | (268 | ) | 2.29 | ||||||||
Wynn Resorts Ltd | Consumer, Cyclical | (3 | ) | (261 | ) | 2.23 | ||||||||
Marathon Oil Corp | Energy | (22 | ) | (260 | ) | 2.22 | ||||||||
Applied Materials Inc | Technology | (2 | ) | (258 | ) | 2.21 | ||||||||
Delta Air Lines Inc | Consumer, Cyclical | (6 | ) | (256 | ) | 2.19 | ||||||||
Advanced Micro Devices Inc | Technology | (2 | ) | (253 | ) | 2.16 | ||||||||
Marathon Petroleum Corp | Energy | (4 | ) | (247 | ) | 2.11 | ||||||||
NXP Semiconductors NV | Technology | (1 | ) | (241 | ) | 2.06 | ||||||||
Parker-Hannifin Corp | Industrial | (1 | ) | (225 | ) | 1.92 | ||||||||
Stanley Black & Decker Inc | Industrial | (1 | ) | (223 | ) | 1.90 | ||||||||
Lam Research Corp | Technology | - | (219 | ) | 1.87 | |||||||||
ON Semiconductor Corp | Technology | (5 | ) | (209 | ) | 1.78 | ||||||||
Microchip Technology Inc | Technology | (1 | ) | (207 | ) | 1.77 | ||||||||
Occidental Petroleum Corp | Energy | (8 | ) | (207 | ) | 1.76 | ||||||||
Aptiv PLC | Consumer, Cyclical | (1 | ) | (203 | ) | 1.73 | ||||||||
Valero Energy Corp | Energy | (3 | ) | (200 | ) | 1.70 | ||||||||
Eastman Chemical Co | Basic Materials | (2 | ) | (193 | ) | 1.64 | ||||||||
TE Connectivity Ltd | Industrial | (1 | ) | (191 | ) | 1.63 | ||||||||
General Motors Co | Consumer, Cyclical | (4 | ) | (185 | ) | 1.58 | ||||||||
Micron Technology Inc | Technology | (2 | ) | (182 | ) | 1.56 | ||||||||
Whirlpool Corp | Consumer, Cyclical | (1 | ) | (179 | ) | 1.53 | ||||||||
Williams Cos Inc/The | Energy | (7 | ) | (178 | ) | 1.52 | ||||||||
Halliburton Co | Energy | (8 | ) | (161 | ) | 1.37 | ||||||||
JetBlue Airways Corp | Consumer, Cyclical | (10 | ) | (158 | ) | 1.35 | ||||||||
TransDigm Group Inc | Industrial | - | (148 | ) | 1.26 | |||||||||
Bank of New York Mellon Corp/The | Financial | (3 | ) | (144 | ) | 1.23 | ||||||||
Masco Corp | Industrial | (2 | ) | (141 | ) | 1.21 | ||||||||
MetLife Inc | Financial | (2 | ) | (141 | ) | 1.20 | ||||||||
Synchrony Financial | Financial | (3 | ) | (139 | ) | 1.19 | ||||||||
CDW Corp/DE | Communications | (1 | ) | (136 | ) | 1.16 | ||||||||
Teradyne Inc | Technology | (1 | ) | (133 | ) | 1.13 | ||||||||
Discover Financial Services | Financial | (1 | ) | (132 | ) | 1.12 | ||||||||
American International Group Inc | Financial | (2 | ) | (130 | ) | 1.11 | ||||||||
Wells Fargo & Co | Financial | (3 | ) | (129 | ) | 1.11 | ||||||||
Under Armour Inc | Consumer, Cyclical | (6 | ) | (129 | ) | 1.10 | ||||||||
ONEOK Inc | Energy | (2 | ) | (127 | ) | 1.09 | ||||||||
Axalta Coating Systems Ltd | Basic Materials | (4 | ) | (113 | ) | 0.97 | ||||||||
Ally Financial Inc | Financial | (2 | ) | (112 | ) | 0.95 | ||||||||
BorgWarner Inc | Consumer, Cyclical | (3 | ) | (110 | ) | 0.94 | ||||||||
Polaris Inc | Consumer, Cyclical | (1 | ) | (108 | ) | 0.92 | ||||||||
Brunswick Corp/DE | Consumer, Cyclical | (1 | ) | (106 | ) | 0.90 | ||||||||
Westinghouse Air Brake Technologies CorpIndustrial | Industrial | (1 | ) | (105 | ) | 0.90 | ||||||||
Hess Corp | Energy | (2 | ) | (104 | ) | 0.89 | ||||||||
Aramark | Consumer, Cyclical | (3 | ) | (103 | ) | 0.88 | ||||||||
| 42 | The accompanying notes are an integral part of these financial statements. |
GOLDMAN SACHS GLOBAL MANAGED BETA FUND
| ADDITIONAL INVESTMENT INFORMATION (continued) |
PURCHASED AND WRITTEN OPTIONS CONTRACTS — At August 31, 2021, the Fund had the following purchased and written options:
EXCHANGE TRADED OPTIONS ON FUTURES
| Description | Exercise Price | Expiration Date | Number of Contracts | Notional Amount | Market Value | Premiums Paid (Received) by Fund | Unrealized Appreciation/ (Depreciation) | |||||||||||||||||||
Purchased option contracts | ||||||||||||||||||||||||||
Calls | ||||||||||||||||||||||||||
Eurodollar Futures | $99.000 | 12/19/2022 | 4,624 | $ | 11,560,000 | $ | 7,138,300 | $ | 6,584,668 | $ | 553,632 | |||||||||||||||
Eurodollar Futures | 97.750 | 03/13/2023 | 868 | 2,170,000 | 3,802,925 | 3,823,220 | (20,295 | ) | ||||||||||||||||||
Eurodollar Futures | 97.750 | 06/19/2023 | 935 | 2,337,500 | 3,845,187 | 3,813,056 | 32,131 | |||||||||||||||||||
| Total purchased option contracts | 6,427 | $ | 16,067,500 | $ | 14,786,412 | $ | 14,220,944 | $ | 565,468 | |||||||||||||||||
EXCHANGE TRADED OPTIONS ON EQUITIES CONTRACTS
| Description | Exercise Price | Expiration Date | Number of Contracts | Notional Amount | Market Value | Premiums Paid (Received) by Fund | Unrealized Appreciation/ (Depreciation) | |||||||||||||||||||
Written option contracts | ||||||||||||||||||||||||||
Calls | ||||||||||||||||||||||||||
Euro Stoxx 50 Index | $ 4,125.000 | 09/17/2021 | (24 | ) | $ | (9,900,000 | ) | $ | (24,682 | ) | $ | (18,676 | ) | $ | (6,006 | ) | ||||||||||
Euro Stoxx 50 Index | 4,175.000 | 09/17/2021 | (28 | ) | (11,690,000 | ) | (16,927 | ) | (17,364 | ) | 437 | |||||||||||||||
Euro Stoxx 50 Index | 4,200.000 | 09/17/2021 | (33 | ) | (13,860,000 | ) | (14,183 | ) | (9,176 | ) | (5,007 | ) | ||||||||||||||
Euro Stoxx 50 Index | 4,225.000 | 09/17/2021 | (34 | ) | (14,365,000 | ) | (9,675 | ) | (12,885 | ) | 3,210 | |||||||||||||||
Euro Stoxx 50 Index | 4,275.000 | 09/17/2021 | (17 | ) | (7,267,500 | ) | (1,746 | ) | (5,654 | ) | 3,908 | |||||||||||||||
Euro Stoxx 50 Index | 4,325.000 | 09/17/2021 | (3 | ) | (1,297,500 | ) | (99 | ) | (622 | ) | 523 | |||||||||||||||
Euro Stoxx 50 Index | 4,225.000 | 10/15/2021 | (7 | ) | (2,957,500 | ) | (4,265 | ) | (4,378 | ) | 113 | |||||||||||||||
Euro Stoxx 50 Index | 4,250.000 | 10/15/2021 | (30 | ) | (12,750,000 | ) | (14,098 | ) | (14,587 | ) | 489 | |||||||||||||||
Euro Stoxx 50 Index | 4,275.000 | 10/15/2021 | (38 | ) | (16,245,000 | ) | (13,461 | ) | (14,712 | ) | 1,251 | |||||||||||||||
Euro Stoxx 50 Index | 4,300.000 | 10/15/2021 | (22 | ) | (9,460,000 | ) | (5,741 | ) | (10,130 | ) | 4,389 | |||||||||||||||
Euro Stoxx 50 Index | 4,350.000 | 10/15/2021 | (30 | ) | (13,050,000 | ) | (3,932 | ) | (11,001 | ) | 7,069 | |||||||||||||||
Euro Stoxx 50 Index | 4,300.000 | 11/19/2021 | (4 | ) | (1,720,000 | ) | (2,290 | ) | (2,339 | ) | 49 | |||||||||||||||
Euro Stoxx 50 Index | 4,325.000 | 11/19/2021 | (11 | ) | (4,757,500 | ) | (5,117 | ) | (5,346 | ) | 229 | |||||||||||||||
FTSE 100 Index | 7,100.000 | 09/17/2021 | (6 | ) | (4,260,000 | ) | (5,939 | ) | (5,597 | ) | (342 | ) | ||||||||||||||
FTSE 100 Index | 7,175.000 | 09/17/2021 | (7 | ) | (5,022,500 | ) | (3,368 | ) | (4,870 | ) | 1,502 | |||||||||||||||
FTSE 100 Index | 7,200.000 | 09/17/2021 | (4 | ) | (2,880,000 | ) | (1,430 | ) | (2,171 | ) | 741 | |||||||||||||||
FTSE 100 Index | 7,225.000 | 09/17/2021 | (8 | ) | (5,780,000 | ) | (2,090 | ) | (6,760 | ) | 4,670 | |||||||||||||||
FTSE 100 Index | 7,300.000 | 09/17/2021 | (5 | ) | (3,650,000 | ) | (481 | ) | (3,865 | ) | 3,384 | |||||||||||||||
FTSE 100 Index | 7,150.000 | 10/15/2021 | (1 | ) | (715,000 | ) | (1,341 | ) | (1,126 | ) | (215 | ) | ||||||||||||||
FTSE 100 Index | 7,250.000 | 10/15/2021 | (3 | ) | (2,175,000 | ) | (2,165 | ) | (2,369 | ) | 204 | |||||||||||||||
FTSE 100 Index | 7,275.000 | 10/15/2021 | (6 | ) | (4,365,000 | ) | (3,629 | ) | (4,651 | ) | 1,022 | |||||||||||||||
FTSE 100 Index | 7,300.000 | 10/15/2021 | (10 | ) | (7,300,000 | ) | (4,950 | ) | (6,756 | ) | 1,806 | |||||||||||||||
FTSE 100 Index | 7,350.000 | 10/15/2021 | (6 | ) | (4,410,000 | ) | (1,939 | ) | (5,169 | ) | 3,230 | |||||||||||||||
FTSE 100 Index | 7,300.000 | 11/19/2021 | (1 | ) | (730,000 | ) | (1,052 | ) | (1,204 | ) | 152 | |||||||||||||||
FTSE 100 Index | 7,350.000 | 11/19/2021 | (2 | ) | (1,470,000 | ) | (1,636 | ) | (1,910 | ) | 274 | |||||||||||||||
Nikkei 225 Index | 28,500.000 | 09/10/2021 | (1 | ) | (2,850,000 | ) | (1,000 | ) | (2,238 | ) | 1,238 | |||||||||||||||
Nikkei 225 Index | 28,750.000 | 09/10/2021 | (3 | ) | (8,625,000 | ) | (1,527 | ) | (8,552 | ) | 7,025 | |||||||||||||||
Nikkei 225 Index | 29,500.000 | 09/10/2021 | (4 | ) | (11,800,000 | ) | (254 | ) | (12,313 | ) | 12,059 | |||||||||||||||
Nikkei 225 Index | 29,625.000 | 09/10/2021 | (3 | ) | (8,887,500 | ) | (164 | ) | (3,553 | ) | 3,389 | |||||||||||||||
Nikkei 225 Index | 30,000.000 | 09/10/2021 | (3 | ) | (9,000,000 | ) | (82 | ) | (7,291 | ) | 7,209 | |||||||||||||||
Nikkei 225 Index | 30,125.000 | 09/10/2021 | (2 | ) | (6,025,000 | ) | (54 | ) | (6,594 | ) | 6,540 | |||||||||||||||
Nikkei 225 Index | 30,625.000 | 09/10/2021 | (1 | ) | (3,062,500 | ) | (18 | ) | (1,992 | ) | 1,974 | |||||||||||||||
Nikkei 225 Index | 28,250.000 | 10/08/2021 | (3 | ) | (8,475,000 | ) | (10,771 | ) | (5,325 | ) | (5,446 | ) | ||||||||||||||
| The accompanying notes are an integral part of these financial statements. | 43 |
GOLDMAN SACHS GLOBAL MANAGED BETA FUND
Schedule of Investments (continued)
August 31, 2021
| ADDITIONAL INVESTMENT INFORMATION (continued) |
EXCHANGE TRADED OPTIONS ON EQUITIES CONTRACTS (continued)
| Description | Exercise Price | Expiration Date | Number of Contracts | Notional Amount | Market Value | Premiums Paid (Received) by Fund | Unrealized Appreciation/ (Depreciation) | |||||||||||||||||||
Nikkei 225 Index | $ 28,375.000 | 10/08/2021 | (2 | ) | $ | (5,675,000 | ) | $ | (5,999 | ) | $ | (4,544 | ) | $ | (1,455 | ) | ||||||||||
Nikkei 225 Index | 28,500.000 | 10/08/2021 | (4 | ) | (11,400,000 | ) | (10,544 | ) | (13,734 | ) | 3,190 | |||||||||||||||
Nikkei 225 Index | 28,625.000 | 10/08/2021 | (3 | ) | (8,587,500 | ) | (6,818 | ) | (8,499 | ) | 1,681 | |||||||||||||||
Nikkei 225 Index | 28,750.000 | 10/08/2021 | (2 | ) | (5,750,000 | ) | (3,909 | ) | (7,332 | ) | 3,423 | |||||||||||||||
Nikkei 225 Index | 28,875.000 | 10/08/2021 | (4 | ) | (11,550,000 | ) | (6,363 | ) | (8,227 | ) | 1,864 | |||||||||||||||
Nikkei 225 Index | 29,750.000 | 10/08/2021 | (1 | ) | (2,975,000 | ) | (428 | ) | (1,687 | ) | 1,259 | |||||||||||||||
Nikkei 225 Index | 28,625.000 | 11/12/2021 | (1 | ) | (2,862,500 | ) | (4,590 | ) | (2,550 | ) | (2,040 | ) | ||||||||||||||
Nikkei 225 Index | 28,750.000 | 11/12/2021 | (2 | ) | (5,750,000 | ) | (8,272 | ) | (6,455 | ) | (1,817 | ) | ||||||||||||||
Nikkei 225 Index | 29,250.000 | 11/12/2021 | (1 | ) | (2,925,000 | ) | (2,545 | ) | (2,187 | ) | (358 | ) | ||||||||||||||
S&P 500 Index | 4,500.000 | 09/01/2021 | (21 | ) | (9,450,000 | ) | (64,785 | ) | (32,741 | ) | (32,044 | ) | ||||||||||||||
S&P 500 Index | 4,510.000 | 09/08/2021 | (21 | ) | (9,471,000 | ) | (70,455 | ) | (40,717 | ) | (29,738 | ) | ||||||||||||||
S&P 500 Index | 4,525.000 | 09/15/2021 | (21 | ) | (9,502,500 | ) | (74,025 | ) | (39,984 | ) | (34,041 | ) | ||||||||||||||
S&P 500 Index | 4,560.000 | 09/22/2021 | (21 | ) | (9,576,000 | ) | (57,120 | ) | (43,252 | ) | (13,868 | ) | ||||||||||||||
S&P 500 Index | 4,470.000 | 09/30/2021 | (4 | ) | (1,788,000 | ) | (39,320 | ) | (18,597 | ) | (20,723 | ) | ||||||||||||||
S&P 500 Index | 4,495.000 | 09/30/2021 | (1 | ) | (449,500 | ) | (7,920 | ) | (4,009 | ) | (3,911 | ) | ||||||||||||||
S&P 500 Index | 4,520.000 | 09/30/2021 | (3 | ) | (1,356,000 | ) | (18,495 | ) | (11,986 | ) | (6,509 | ) | ||||||||||||||
S&P 500 Index | 4,540.000 | 09/30/2021 | (6 | ) | (2,724,000 | ) | (29,400 | ) | (21,561 | ) | (7,839 | ) | ||||||||||||||
S&P 500 Index | 4,545.000 | 09/30/2021 | (10 | ) | (4,545,000 | ) | (46,050 | ) | (28,939 | ) | (17,111 | ) | ||||||||||||||
S&P 500 Index | 4,555.000 | 09/30/2021 | (3 | ) | (1,366,500 | ) | (12,120 | ) | (7,906 | ) | (4,214 | ) | ||||||||||||||
S&P 500 Index | 4,575.000 | 09/30/2021 | (1 | ) | (457,500 | ) | (3,040 | ) | (2,379 | ) | (661 | ) | ||||||||||||||
S&P 500 Index | 4,595.000 | 09/30/2021 | (17 | ) | (7,811,500 | ) | (37,655 | ) | (37,326 | ) | (329 | ) | ||||||||||||||
S&P 500 Index | 4,600.000 | 09/30/2021 | (17 | ) | (7,820,000 | ) | (34,510 | ) | (34,289 | ) | (221 | ) | ||||||||||||||
S&P 500 Index | 4,605.000 | 09/30/2021 | (17 | ) | (7,828,500 | ) | (31,705 | ) | (31,842 | ) | 137 | |||||||||||||||
S&P 500 Index | 4,610.000 | 09/30/2021 | (17 | ) | (7,837,000 | ) | (29,070 | ) | (28,807 | ) | (263 | ) | ||||||||||||||
S&P 500 Index | 4,615.000 | 09/30/2021 | (17 | ) | (7,845,500 | ) | (26,520 | ) | (26,549 | ) | 29 | |||||||||||||||
S&P 500 Index | 4,590.000 | 10/29/2021 | (3 | ) | (1,377,000 | ) | (17,280 | ) | (11,964 | ) | (5,316 | ) | ||||||||||||||
S&P 500 Index | 4,600.000 | 10/29/2021 | (4 | ) | (1,840,000 | ) | (21,040 | ) | (15,237 | ) | (5,803 | ) | ||||||||||||||
S&P 500 Index | 4,620.000 | 10/29/2021 | (5 | ) | (2,310,000 | ) | (21,750 | ) | (18,396 | ) | (3,354 | ) | ||||||||||||||
| (589 | ) | $ | (373,633,000 | ) | $ | (851,834 | ) | $ | (732,872 | ) | $ | (118,962 | ) | |||||||||||||
Puts | ||||||||||||||||||||||||||
Euro Stoxx 50 Index | 3,850.000 | 09/17/2021 | (24 | ) | (9,240,000 | ) | (2,069 | ) | (15,427 | ) | 13,358 | |||||||||||||||
Euro Stoxx 50 Index | 3,925.000 | 09/17/2021 | (60 | ) | (23,550,000 | ) | (7,013 | ) | (46,347 | ) | 39,334 | |||||||||||||||
Euro Stoxx 50 Index | 3,950.000 | 09/17/2021 | (15 | ) | (5,925,000 | ) | (1,966 | ) | (12,568 | ) | 10,602 | |||||||||||||||
Euro Stoxx 50 Index | 3,975.000 | 09/17/2021 | (5 | ) | (1,987,500 | ) | (744 | ) | (4,607 | ) | 3,863 | |||||||||||||||
Euro Stoxx 50 Index | 4,000.000 | 09/17/2021 | (18 | ) | (7,200,000 | ) | (3,039 | ) | (13,696 | ) | 10,657 | |||||||||||||||
Euro Stoxx 50 Index | 4,050.000 | 09/17/2021 | (12 | ) | (4,860,000 | ) | (2,678 | ) | (6,247 | ) | 3,569 | |||||||||||||||
Euro Stoxx 50 Index | 4,150.000 | 09/17/2021 | (3 | ) | (1,245,000 | ) | (1,303 | ) | (1,478 | ) | 175 | |||||||||||||||
Euro Stoxx 50 Index | 3,900.000 | 10/15/2021 | (7 | ) | (2,730,000 | ) | (2,504 | ) | (5,733 | ) | 3,229 | |||||||||||||||
Euro Stoxx 50 Index | 3,975.000 | 10/15/2021 | (45 | ) | (17,887,500 | ) | (20,882 | ) | (36,865 | ) | 15,983 | |||||||||||||||
Euro Stoxx 50 Index | 4,025.000 | 10/15/2021 | (22 | ) | (8,855,000 | ) | (12,287 | ) | (17,868 | ) | 5,581 | |||||||||||||||
Euro Stoxx 50 Index | 4,050.000 | 10/15/2021 | (23 | ) | (9,315,000 | ) | (14,122 | ) | (14,950 | ) | 828 | |||||||||||||||
Euro Stoxx 50 Index | 4,100.000 | 10/15/2021 | (30 | ) | (12,300,000 | ) | (22,423 | ) | (22,171 | ) | (252 | ) | ||||||||||||||
Euro Stoxx 50 Index | 3,950.000 | 11/19/2021 | (4 | ) | (1,580,000 | ) | (3,088 | ) | (4,066 | ) | 978 | |||||||||||||||
Euro Stoxx 50 Index | 4,000.000 | 11/19/2021 | (11 | ) | (4,400,000 | ) | (9,741 | ) | (10,092 | ) | 351 | |||||||||||||||
FTSE 100 Index | 6,700.000 | 09/17/2021 | (6 | ) | (4,020,000 | ) | (1,238 | ) | (6,595 | ) | 5,357 | |||||||||||||||
FTSE 100 Index | 6,750.000 | 09/17/2021 | (12 | ) | (8,100,000 | ) | (2,887 | ) | (17,292 | ) | 14,405 | |||||||||||||||
FTSE 100 Index | 6,825.000 | 09/17/2021 | (1 | ) | (682,500 | ) | (303 | ) | (1,589 | ) | 1,286 | |||||||||||||||
FTSE 100 Index | 6,850.000 | 09/17/2021 | (7 | ) | (4,795,000 | ) | (2,310 | ) | (10,143 | ) | 7,833 | |||||||||||||||
FTSE 100 Index | 6,925.000 | 09/17/2021 | (2 | ) | (1,385,000 | ) | (894 | ) | (2,106 | ) | 1,212 | |||||||||||||||
FTSE 100 Index | 7,050.000 | 09/17/2021 | (1 | ) | (705,000 | ) | (798 | ) | (824 | ) | 26 | |||||||||||||||
| 44 | The accompanying notes are an integral part of these financial statements. |
GOLDMAN SACHS GLOBAL MANAGED BETA FUND
| ADDITIONAL INVESTMENT INFORMATION (continued) |
EXCHANGE TRADED OPTIONS ON EQUITIES CONTRACTS (continued)
| Description | Exercise Price | Expiration Date | Number of Contracts | Notional Amount | Market Value | Premiums Paid (Received) by Fund | Unrealized Appreciation/ (Depreciation) | |||||||||||||||||||
FTSE 100 Index | $ 6,650.000 | 10/15/2021 | (1 | ) | $ | (665,000 | ) | $ | (591 | ) | $ | (1,476 | ) | $ | 885 | |||||||||||
FTSE 100 Index | 6,775.000 | 10/15/2021 | (3 | ) | (2,032,500 | ) | (2,351 | ) | (5,321 | ) | 2,970 | |||||||||||||||
FTSE 100 Index | 6,825.000 | 10/15/2021 | (6 | ) | (4,095,000 | ) | (5,320 | ) | (7,931 | ) | 2,611 | |||||||||||||||
FTSE 100 Index | 6,850.000 | 10/15/2021 | (5 | ) | (3,425,000 | ) | (4,709 | ) | (7,365 | ) | 2,656 | |||||||||||||||
FTSE 100 Index | 6,925.000 | 10/15/2021 | (5 | ) | (3,462,500 | ) | (5,706 | ) | (5,654 | ) | (52 | ) | ||||||||||||||
FTSE 100 Index | 6,975.000 | 10/15/2021 | (6 | ) | (4,185,000 | ) | (7,878 | ) | (7,658 | ) | (220 | ) | ||||||||||||||
FTSE 100 Index | 6,750.000 | 11/19/2021 | (1 | ) | (675,000 | ) | (1,402 | ) | (1,810 | ) | 408 | |||||||||||||||
FTSE 100 Index | 6,850.000 | 11/19/2021 | (2 | ) | (1,370,000 | ) | (3,369 | ) | (3,383 | ) | 14 | |||||||||||||||
Nikkei 225 Index | 26,625.000 | 09/10/2021 | (5 | ) | (13,312,500 | ) | (1,000 | ) | (18,357 | ) | 17,357 | |||||||||||||||
Nikkei 225 Index | 27,375.000 | 09/10/2021 | (4 | ) | (10,950,000 | ) | (2,400 | ) | (16,663 | ) | 14,263 | |||||||||||||||
Nikkei 225 Index | 27,750.000 | 09/10/2021 | (5 | ) | (13,875,000 | ) | (5,227 | ) | (28,345 | ) | 23,118 | |||||||||||||||
Nikkei 225 Index | 27,875.000 | 09/10/2021 | (3 | ) | (8,362,500 | ) | (4,363 | ) | (13,239 | ) | 8,876 | |||||||||||||||
Nikkei 225 Index | 28,250.000 | 09/10/2021 | (1 | ) | (2,825,000 | ) | (2,636 | ) | (7,387 | ) | 4,751 | |||||||||||||||
Nikkei 225 Index | 26,250.000 | 10/08/2021 | (8 | ) | (21,000,000 | ) | (10,544 | ) | (32,482 | ) | 21,938 | |||||||||||||||
Nikkei 225 Index | 26,500.000 | 10/08/2021 | (3 | ) | (7,950,000 | ) | (4,772 | ) | (15,857 | ) | 11,085 | |||||||||||||||
Nikkei 225 Index | 26,625.000 | 10/08/2021 | (2 | ) | (5,325,000 | ) | (3,545 | ) | (5,636 | ) | 2,091 | |||||||||||||||
Nikkei 225 Index | 26,875.000 | 10/08/2021 | (4 | ) | (10,750,000 | ) | (8,362 | ) | (16,099 | ) | 7,737 | |||||||||||||||
Nikkei 225 Index | 27,375.000 | 10/08/2021 | (1 | ) | (2,737,500 | ) | (3,136 | ) | (7,486 | ) | 4,350 | |||||||||||||||
Nikkei 225 Index | 26,125.000 | 11/12/2021 | (1 | ) | (2,612,500 | ) | (3,000 | ) | (6,380 | ) | 3,380 | |||||||||||||||
Nikkei 225 Index | 26,375.000 | 11/12/2021 | (2 | ) | (5,275,000 | ) | (6,726 | ) | (8,912 | ) | 2,186 | |||||||||||||||
Nikkei 225 Index | 26,750.000 | 11/12/2021 | (1 | ) | (2,675,000 | ) | (4,044 | ) | (3,475 | ) | (569 | ) | ||||||||||||||
S&P 500 Index | 4,340.000 | 09/01/2021 | (21 | ) | (9,114,000 | ) | (525 | ) | (101,500 | ) | 100,975 | |||||||||||||||
S&P 500 Index | 4,360.000 | 09/08/2021 | (21 | ) | (9,156,000 | ) | (6,090 | ) | (76,808 | ) | 70,718 | |||||||||||||||
S&P 500 Index | 4,360.000 | 09/15/2021 | (21 | ) | (9,156,000 | ) | (21,105 | ) | (90,931 | ) | 69,826 | |||||||||||||||
S&P 500 Index | 4,410.000 | 09/22/2021 | (21 | ) | (9,261,000 | ) | (47,670 | ) | (78,167 | ) | 30,497 | |||||||||||||||
S&P 500 Index | 4,160.000 | 09/30/2021 | (4 | ) | (1,664,000 | ) | (5,520 | ) | (29,921 | ) | 24,401 | |||||||||||||||
S&P 500 Index | 4,195.000 | 09/30/2021 | (1 | ) | (419,500 | ) | (1,540 | ) | (8,719 | ) | 7,179 | |||||||||||||||
S&P 500 Index | 4,220.000 | 09/30/2021 | (3 | ) | (1,266,000 | ) | (5,010 | ) | (23,248 | ) | 18,238 | |||||||||||||||
S&P 500 Index | 4,255.000 | 09/30/2021 | (6 | ) | (2,553,000 | ) | (11,220 | ) | (44,558 | ) | 33,338 | |||||||||||||||
S&P 500 Index | 4,290.000 | 09/30/2021 | (6 | ) | (2,574,000 | ) | (12,599 | ) | (44,815 | ) | 32,216 | |||||||||||||||
S&P 500 Index | 4,320.000 | 09/30/2021 | (4 | ) | (1,728,000 | ) | (9,320 | ) | (23,137 | ) | 13,817 | |||||||||||||||
S&P 500 Index | 4,335.000 | 09/30/2021 | (3 | ) | (1,300,500 | ) | (7,380 | ) | (17,476 | ) | 10,096 | |||||||||||||||
S&P 500 Index | 4,390.000 | 09/30/2021 | (1 | ) | (439,000 | ) | (3,030 | ) | (4,419 | ) | 1,389 | |||||||||||||||
S&P 500 Index | 4,440.000 | 09/30/2021 | (17 | ) | (7,548,000 | ) | (63,665 | ) | (67,974 | ) | 4,309 | |||||||||||||||
S&P 500 Index | 4,445.000 | 09/30/2021 | (17 | ) | (7,556,500 | ) | (65,110 | ) | (69,026 | ) | 3,916 | |||||||||||||||
S&P 500 Index | 4,450.000 | 09/30/2021 | (17 | ) | (7,565,000 | ) | (66,640 | ) | (70,745 | ) | 4,105 | |||||||||||||||
S&P 500 Index | 4,455.000 | 09/30/2021 | (17 | ) | (7,573,500 | ) | (68,255 | ) | (73,229 | ) | 4,974 | |||||||||||||||
S&P 500 Index | 4,460.000 | 09/30/2021 | (17 | ) | (7,582,000 | ) | (69,870 | ) | (74,153 | ) | 4,283 | |||||||||||||||
S&P 500 Index | 4,255.000 | 10/29/2021 | (1 | ) | (425,500 | ) | (4,355 | ) | (9,769 | ) | 5,414 | |||||||||||||||
S&P 500 Index | 4,280.000 | 10/29/2021 | (2 | ) | (856,000 | ) | (9,300 | ) | (16,115 | ) | 6,815 | |||||||||||||||
S&P 500 Index | 4,295.000 | 10/29/2021 | (4 | ) | (1,718,000 | ) | (19,380 | ) | (33,197 | ) | 13,817 | |||||||||||||||
S&P 500 Index | 4,350.000 | 10/29/2021 | (5 | ) | (2,175,000 | ) | (28,175 | ) | (35,115 | ) | 6,940 | |||||||||||||||
| (586 | ) | $ | (349,953,000 | ) | $ | (729,129 | ) | $ | (1,464,602 | ) | $ | 735,473 | ||||||||||||||
| Total written option contracts | (1,175 | ) | $ | (723,586,000 | ) | $ | (1,580,963 | ) | $ | (2,197,474 | ) | $ | 616,511 | |||||||||||||
| ||
Abbreviation: | ||
MS & Co. Int. PLC-Morgan Stanley & Co. International PLC | ||
| ||
| The accompanying notes are an integral part of these financial statements. | 45 |
GOLDMAN SACHS STRATEGIC FACTOR ALLOCATION FUND
Schedule of Investments
August 31, 2021
| Shares | Dividend Rate | Value | ||||||||
| Investment Company(a) – 73.5% | ||||||||||
| | Goldman Sachs Financial Square Government | | ||||||||
| 1,729,160,031 | 0.026 | % | $ | 1,729,160,031 | ||||||
| (Cost $1,729,160,031) | ||||||||||
|
| |||||||||
| | TOTAL INVESTMENTS – 73.5% (Cost $1,729,160,031) | $ | 1,729,160,031 | |||||||
|
| |||||||||
| | OTHER ASSETS IN EXCESS OF LIABILITIES – 26.5% | 622,652,212 | ||||||||
|
| |||||||||
| NET ASSETS – 100.0% | $ | 2,351,812,243 | ||||||||
|
| |||||||||
| The percentage shown for each investment category reflects the value of investments in that category as a percentage of net assets. | ||||
| (a) | Represents an affiliated fund. | |||
| ||
Currency Abbreviations: | ||
AUD | —Australian Dollar | |
CAD | —Canadian Dollar | |
CHF | —Swiss Franc | |
EUR | —Euro | |
JPY | —Japanese Yen | |
NZD | —New Zealand Dollar | |
USD | —U.S. Dollar | |
Investment Abbreviation: | ||
PLC | —Public Limited Company | |
| ||
| ADDITIONAL INVESTMENT INFORMATION |
FORWARD FOREIGN CURRENCY EXCHANGE CONTRACTS — At August 31, 2021, the Fund had the following forward foreign currency exchange contracts:
FORWARD FOREIGN CURRENCY EXCHANGE CONTRACTS WITH UNREALIZED GAIN
| Counterparty | Currency Purchased | Currency Sold | Settlement Date | Unrealized Gain | ||||||||||||||||
MS & Co. Int. PLC | CHF | 29,620,000 | USD | 32,321,650 | 09/23/21 | $ | 43,337 | |||||||||||||
| EUR | 11,040,000 | USD | 12,923,355 | 09/23/21 | 118,393 | |||||||||||||||
| NZD | 118,060,000 | USD | 82,378,717 | 09/23/21 | 812,277 | |||||||||||||||
| USD | 77,770,456 | CHF | 71,110,000 | 09/23/21 | 70,448 | |||||||||||||||
| USD | 58,450,787 | EUR | 49,430,000 | 09/23/21 | 58,249 | |||||||||||||||
| USD | 110,301,232 | JPY | 12,111,950,000 | 09/24/21 | 183,755 | |||||||||||||||
| TOTAL |
| $ | 1,286,459 | |||||||||||||||||
FORWARD FOREIGN CURRENCY EXCHANGE CONTRACTS WITH UNREALIZED LOSS
| Counterparty | Currency Purchased | Currency Sold | Settlement Date | Unrealized Loss | ||||||||||||||||
MS & Co. Int. PLC | AUD | 52,760,000 | USD | 38,602,951 | 09/23/21 | $ | (766 | ) | ||||||||||||
| JPY | 7,132,570,000 | USD | 65,035,214 | 09/24/21 | (188,463 | ) | ||||||||||||||
| USD | 10,694,149 | AUD | 14,980,000 | 09/23/21 | (266,062 | ) | ||||||||||||||
| USD | 179,599,768 | CAD | 228,190,000 | 09/23/21 | (1,259,702 | ) | ||||||||||||||
| TOTAL |
| $ | (1,714,993 | ) | ||||||||||||||||
FUTURES CONTRACTS — At August 31, 2021, the Fund had the following futures contracts:
| Description | Number of Contracts | Expiration Date | Notional Amount | Unrealized Appreciation/ (Depreciation) | ||||||||||||
Long position contracts: | ||||||||||||||||
S&P 500 E-Mini Index | 6,234 | 09/17/21 | $ | 1,409,039,850 | $ | 36,066,458 | ||||||||||
Ultra Long U.S. Treasury Bonds | 2,152 | 12/21/21 | 424,549,250 | 1,374,680 | ||||||||||||
| Total |
| $ | 37,441,138 | |||||||||||||
Short position contracts: | ||||||||||||||||
20 Year U.S. Treasury Bonds | (341 | ) | 12/21/21 | (55,572,344 | ) | (131,828 | ) | |||||||||
| TOTAL FUTURES CONTRACTS |
| $ | 37,309,310 | |||||||||||||
| 46 | The accompanying notes are an integral part of these financial statements. |
GOLDMAN SACHS STRATEGIC FACTOR ALLOCATION FUND
| ADDITIONAL INVESTMENT INFORMATION (continued) |
PURCHASED AND WRITTEN OPTIONS CONTRACTS — At August 31, 2021, the Fund had the following purchased and written options:
EXCHANGE TRADED OPTIONS ON FUTURES
| Description | Exercise Price | Expiration Date | Number of Contracts | Notional Amount | Market Value | Premiums Paid (Received) by Fund | Unrealized Appreciation/ (Depreciation) | |||||||||||||||||||
Written option contracts | ||||||||||||||||||||||||||
Puts | ||||||||||||||||||||||||||
U.S. Treasury Bonds | $157.000 | 09/24/2021 | (899 | ) | $ | (14,114,300 | ) | $ | (84,281 | ) | $ | (447,783 | ) | $ | 363,502 | |||||||||||
U.S. Treasury Bonds | 159.000 | 10/22/2021 | (912 | ) | (14,500,800 | ) | (641,255 | ) | (639,508 | ) | (1,747 | ) | ||||||||||||||
U.S. Treasury Bonds | 160.000 | 09/24/2021 | (896 | ) | (14,336,000 | ) | (392,000 | ) | (684,289 | ) | 292,289 | |||||||||||||||
| Total written option contracts | (2,707 | ) | $ | (42,951,100 | ) | $ | (1,117,536 | ) | $ | (1,771,580 | ) | $ | 654,044 | |||||||||||||
EXCHANGE TRADED OPTIONS ON EQUITIES CONTRACTS
| Description | Exercise Price | Expiration Date | Number of Contracts | Notional Amount | Market Value | Premiums Paid (Received) by Fund | Unrealized Appreciation/ (Depreciation) | |||||||||||||||||||
Purchased option contracts | ||||||||||||||||||||||||||
Puts | ||||||||||||||||||||||||||
S&P 500 Index | $4,035.000 | 09/01/2021 | 396 | $ | 159,786,000 | $ | 1,980 | $ | 48,325 | $ | (46,345 | ) | ||||||||||||||
S&P 500 Index | 2,900.000 | 09/03/2021 | 479 | 138,910,000 | 1,197 | 38,679 | (37,482 | ) | ||||||||||||||||||
S&P 500 Index | 3,100.000 | 09/03/2021 | 480 | 148,800,000 | 1,200 | 49,527 | (48,327 | ) | ||||||||||||||||||
S&P 500 Index | 3,150.000 | 09/03/2021 | 479 | 150,885,000 | 1,197 | 46,617 | (45,420 | ) | ||||||||||||||||||
S&P 500 Index | 3,000.000 | 09/10/2021 | 478 | 143,400,000 | 3,585 | 46,771 | (43,186 | ) | ||||||||||||||||||
S&P 500 Index | 3,050.000 | 09/10/2021 | 478 | 145,790,000 | 4,780 | 48,389 | (43,609 | ) | ||||||||||||||||||
S&P 500 Index | 3,150.000 | 09/10/2021 | 477 | 150,255,000 | 4,770 | 49,039 | (44,269 | ) | ||||||||||||||||||
S&P 500 Index | 3,250.000 | 09/10/2021 | 476 | 154,700,000 | 7,140 | 56,454 | (49,314 | ) | ||||||||||||||||||
S&P 500 Index | 2,930.000 | 09/17/2021 | 476 | 139,468,000 | 7,140 | 49,879 | (42,739 | ) | ||||||||||||||||||
S&P 500 Index | 2,950.000 | 09/17/2021 | 958 | 282,610,000 | 16,765 | 127,019 | (110,254 | ) | ||||||||||||||||||
S&P 500 Index | 2,980.000 | 09/17/2021 | 477 | 142,146,000 | 9,540 | 43,684 | (34,144 | ) | ||||||||||||||||||
S&P 500 Index | 3,025.000 | 09/17/2021 | 474 | 143,385,000 | 10,666 | 52,496 | (41,830 | ) | ||||||||||||||||||
S&P 500 Index | 2,900.000 | 09/24/2021 | 462 | 133,980,000 | 15,015 | 67,337 | (52,322 | ) | ||||||||||||||||||
S&P 500 Index | 3,000.000 | 09/24/2021 | 1,863 | 558,900,000 | 79,178 | 204,793 | (125,615 | ) | ||||||||||||||||||
S&P 500 Index | 3,050.000 | 09/30/2021 | 475 | 144,875,000 | 39,188 | 58,367 | (19,179 | ) | ||||||||||||||||||
S&P 500 Index | 3,160.000 | 09/30/2021 | 472 | 149,152,000 | 50,740 | 50,807 | (67 | ) | ||||||||||||||||||
S&P 500 Index | 3,200.000 | 09/30/2021 | 480 | 153,600,000 | 56,400 | 60,360 | (3,960 | ) | ||||||||||||||||||
| Total purchased option contracts | 9,880 | $ | 3,040,642,000 | $ | 310,481 | $ | 1,098,543 | $ | (788,062 | ) | ||||||||||||||||
Written option contracts |
| |||||||||||||||||||||||||
Puts | ||||||||||||||||||||||||||
S&P 500 Index | 4,155.000 | 09/01/2021 | (1,909 | ) | (793,189,500 | ) | (19,090 | ) | (416,162 | ) | 397,072 | |||||||||||||||
S&P 500 Index | 4,195.000 | 09/03/2021 | (1,911 | ) | (801,664,500 | ) | (85,995 | ) | (282,828 | ) | 196,833 | |||||||||||||||
S&P 500 Index | 4,335.000 | 09/07/2021 | (1,921 | ) | (832,753,500 | ) | (321,768 | ) | (334,802 | ) | 13,034 | |||||||||||||||
S&P 500 Index | 4,370.000 | 09/03/2021 | (1,898 | ) | (829,426,000 | ) | (199,290 | ) | (223,964 | ) | 24,674 | |||||||||||||||
| Total written option contracts | (7,639 | ) | $ | (3,257,033,500 | ) | $ | (626,143 | ) | $ | (1,257,756 | ) | $ | 631,613 | |||||||||||||
| TOTAL | 2,241 | $ | (216,391,500 | ) | $ | (315,662 | ) | $ | (159,213 | ) | $ | (156,449 | ) | |||||||||||||
| ||
Abbreviation: | ||
MS & Co. Int. PLC | —Morgan Stanley & Co. International PLC | |
| ||
| The accompanying notes are an integral part of these financial statements. | 47 |
GOLDMAN SACHS STRATEGIC VOLATILITY PREMIUM FUND
Schedule of Investments
August 31, 2021
| Shares | Dividend Rate | Value | ||||||||
| Investment Company(a) – 87.0% | ||||||||||
| | Goldman Sachs Financial Square Government | | ||||||||
| 368,029,368 | 0.026 | % | $ | 368,029,368 | ||||||
| (Cost $368,029,368) | ||||||||||
|
| |||||||||
| | TOTAL INVESTMENTS – 87.0% (Cost $368,029,368) | $ | 368,029,368 | |||||||
|
| |||||||||
| | OTHER ASSETS IN EXCESS OF LIABILITIES – 13.0% | 54,889,783 | ||||||||
|
| |||||||||
| NET ASSETS – 100.0% | $ | 422,919,151 | ||||||||
|
| |||||||||
| The percentage shown for each investment category reflects the value of investments in that category as a percentage of net assets. | ||||
| (a) | Represents an affiliated fund. | |||
| ADDITIONAL INVESTMENT INFORMATION |
FUTURES CONTRACTS — At August 31, 2021, the Fund had the following futures contracts:
| Description | Number of Contracts | Expiration Date | Notional Amount | Unrealized Appreciation/ (Depreciation) | ||||||||||||
Long position contracts: | ||||||||||||||||
S&P 500 E-Mini Index | 6 | 09/17/21 | $ | 1,356,150 | $ | 27,278 | ||||||||||
2 Year U.S. Treasury Notes | 1,194 | 12/31/21 | 263,071,782 | 164,222 | ||||||||||||
5 Year U.S. Treasury Notes | 1,104 | 12/31/21 | 136,585,500 | 396,648 | ||||||||||||
| TOTAL FUTURES CONTRACTS |
| $ | 588,148 | |||||||||||||
PURCHASED AND WRITTEN OPTIONS CONTRACTS — At August 31, 2021, the Fund had the following purchased and written options:
EXCHANGE TRADED OPTIONS ON EQUITIES CONTRACTS
| Description | Exercise Price | Expiration Date | Number of Contracts | Notional Amount | Market Value | Premiums Paid (Received) by Fund | Unrealized Appreciation/ (Depreciation) | |||||||||||||||||||
Purchased option contracts | ||||||||||||||||||||||||||
Puts | ||||||||||||||||||||||||||
S&P 500 Index | $2,900.000 | 09/03/2021 | 73 | $ | 21,170,000 | $ | 183 | $ | 5,895 | $ | (5,712 | ) | ||||||||||||||
S&P 500 Index | 3,100.000 | 09/03/2021 | 74 | 22,940,000 | 185 | 7,635 | (7,450 | ) | ||||||||||||||||||
S&P 500 Index | 3,150.000 | 09/03/2021 | 74 | 23,310,000 | 185 | 7,202 | (7,017 | ) | ||||||||||||||||||
S&P 500 Index | 3,000.000 | 09/10/2021 | 73 | 21,900,000 | 548 | 7,143 | (6,595 | ) | ||||||||||||||||||
S&P 500 Index | 3,050.000 | 09/10/2021 | 74 | 22,570,000 | 740 | 7,491 | (6,751 | ) | ||||||||||||||||||
S&P 500 Index | 3,150.000 | 09/10/2021 | 74 | 23,310,000 | 740 | 7,608 | (6,868 | ) | ||||||||||||||||||
S&P 500 Index | 3,250.000 | 09/10/2021 | 75 | 24,375,000 | 1,125 | 8,895 | (7,770 | ) | ||||||||||||||||||
S&P 500 Index | 2,930.000 | 09/17/2021 | 79 | 23,147,000 | 1,185 | 8,278 | (7,093 | ) | ||||||||||||||||||
S&P 500 Index | 2,950.000 | 09/17/2021 | 162 | 47,790,000 | 2,835 | 21,602 | (18,767 | ) | ||||||||||||||||||
S&P 500 Index | 2,980.000 | 09/17/2021 | 80 | 23,840,000 | 1,599 | 7,326 | (5,727 | ) | ||||||||||||||||||
S&P 500 Index | 3,025.000 | 09/17/2021 | 76 | 22,990,000 | 1,710 | 8,417 | (6,707 | ) | ||||||||||||||||||
S&P 500 Index | 2,900.000 | 09/24/2021 | 78 | 22,620,000 | 2,535 | 11,369 | (8,834 | ) | ||||||||||||||||||
S&P 500 Index | 3,000.000 | 09/24/2021 | 338 | 101,400,000 | 14,364 | 36,988 | (22,624 | ) | ||||||||||||||||||
S&P 500 Index | 3,050.000 | 09/30/2021 | 91 | 27,755,000 | 7,508 | 11,182 | (3,674 | ) | ||||||||||||||||||
S&P 500 Index | 3,160.000 | 09/30/2021 | 92 | 29,072,000 | 9,890 | 9,903 | (13 | ) | ||||||||||||||||||
S&P 500 Index | 3,200.000 | 09/30/2021 | 93 | 29,760,000 | 10,928 | 11,695 | (767 | ) | ||||||||||||||||||
| Total purchased option contracts | 1,606 | $ | 487,949,000 | $ | 56,260 | $ | 178,629 | $ | (122,369 | ) | ||||||||||||||||
| 48 | The accompanying notes are an integral part of these financial statements. |
GOLDMAN SACHS STRATEGIC VOLATILITY PREMIUM FUND
| ADDITIONAL INVESTMENT INFORMATION (continued) |
EXCHANGE TRADED OPTIONS ON EQUITIES CONTRACTS (continued)
| Description | Exercise Price | Expiration Date | Number of Contracts | Notional Amount | Market Value | Premiums Paid (Received) by Fund | Unrealized Appreciation/ (Depreciation) | |||||||||||||||||||
Written option contracts |
| |||||||||||||||||||||||||
Puts | ||||||||||||||||||||||||||
S&P 500 Index | $4,155.000 | 09/01/2021 | (347 | ) | $ | (144,178,500 | ) | $ | (3,470 | ) | $ | (75,646 | ) | $ | 72,176 | |||||||||||
S&P 500 Index | 4,195.000 | 09/03/2021 | (367 | ) | (153,956,500 | ) | (16,515 | ) | (54,316 | ) | 37,801 | |||||||||||||||
S&P 500 Index | 4,335.000 | 09/07/2021 | (372 | ) | (161,262,000 | ) | (62,310 | ) | (64,834 | ) | 2,524 | |||||||||||||||
S&P 500 Index | 4,370.000 | 09/03/2021 | (372 | ) | (162,564,000 | ) | (39,060 | ) | (43,896 | ) | 4,836 | |||||||||||||||
| Total written option contracts | (1,458 | ) | $ | (621,961,000 | ) | $ | (121,355 | ) | $ | (238,692 | ) | $ | 117,337 | |||||||||||||
| TOTAL | 148 | $ | (134,012,000 | ) | $ | (65,095 | ) | $ | (60,063 | ) | $ | (5,032 | ) | |||||||||||||
| The accompanying notes are an integral part of these financial statements. | 49 |
GOLDMAN SACHS TACTICAL TILT OVERLAY FUND
Consolidated Schedule of Investments
August 31, 2021
| Principal Amount | Interest Rate | Maturity Date | Value | |||||||||||
| Corporate Obligations – 0.1% | ||||||||||||||
| Banks – 0.1% | ||||||||||||||
Credit Industriel ET Commercial | ||||||||||||||
| $ | 5,000,000 | 0.010 | % | 04/07/22 | $ | 4,994,622 | ||||||||
| (Cost $4,993,644) | ||||||||||||||
|
| |||||||||||||
| U.S. Treasury Obligations(a) – 2.3% | ||||||||||||||
United States Cash Management Bill | ||||||||||||||
| $ | 35,000,000 | 0.000 | % | 11/23/21 | $ | 34,997,176 | ||||||||
United States Treasury Bills | ||||||||||||||
| 24,000,000 | 0.000 | 01/06/22 | 23,996,647 | |||||||||||
| 35,000,000 | 0.000 | 01/13/22 | 34,994,828 | |||||||||||
|
| |||||||||||||
| TOTAL U.S. TREASURY OBLIGATIONS | ||||||||||||||
| (Cost $93,985,218) | $ | 93,988,651 | ||||||||||||
|
| |||||||||||||
| Shares | Description | Value | ||||||||
| Exchange Traded Funds – 5.3% | ||||||||||
| 412,075 | Alerian MLP ETF(b) | $ | 13,334,747 | |||||||
| 1,297,367 | Energy Select Sector SPDR Fund | 62,792,563 | ||||||||
| 899,202 | | Health Care Select Sector SPDR Fund | | 121,581,102 | ||||||
| 15,694 | iShares Core S&P 500 ETF | 7,120,525 | ||||||||
| 38,186 | | iShares iBoxx $ Investment Grade Corporate Bond ETF | | 5,166,566 | ||||||
| 72,772 | | iShares iBoxx High Yield Corporate Bond ETF | | 6,410,485 | ||||||
|
| |||||||||
| | TOTAL EXCHANGE TRADED FUNDS (Cost $164,214,571) | $ | 216,405,988 | |||||||
|
| |||||||||
| Shares | Dividend Rate | Value | ||||||
| Investment Companies(c) – 50.1% | ||||||||
Goldman Sachs Financial Square Government Fund – Institutional Shares |
| |||||||
| 1,850,734,808 | 0.026 | % | $ | 1,850,734,808 | ||||
Goldman Sachs High Yield Floating Rate Fund – Class R6 |
| |||||||
| 11,207,748 | 3.514 | 104,904,518 | ||||||
Goldman Sachs Energy Infrastructure Fund – Class R6 |
| |||||||
| 8,216,763 | 4.177 | 76,333,727 | ||||||
Goldman Sachs MLP Energy Infrastructure Fund – Class R6 |
| |||||||
| 825,734 | 6.232 | 19,074,456 | ||||||
| ||||||||
| TOTAL INVESTMENT COMPANIES (Cost $2,009,356,401) |
| $ | 2,051,047,509 | |||||
| ||||||||
| TOTAL INVESTMENTS BEFORE SHORT-TERM INVESTMENT (Cost $2,272,549,834) |
| $ | 2,366,436,770 | |||||
| ||||||||
| Principal Amount | Interest Rate | Maturity Date | Value | |||||||||||
| Short-term Investments – 39.8% | ||||||||||||||
| Certificates of Deposit – 9.3% | ||||||||||||||
Alpine Securitization LLC(d) | ||||||||||||||
| $ | 15,000,000 | 0.210 | % | 10/12/21 | $ | 15,001,575 | ||||||||
Australia & New Zealand Banking Group Ltd.(d)(e) | ||||||||||||||
(3M USD LIBOR + 0.010%) | ||||||||||||||
| 5,000,000 | 0.200 | 11/29/21 | 5,000,450 | |||||||||||
(3M USD LIBOR + 0.030%) | ||||||||||||||
| 10,000,000 | 0.215 | 03/08/22 | 10,000,358 | |||||||||||
(SOFR + 0.120%) | ||||||||||||||
| 12,350,000 | 0.130 | 02/28/22 | 12,350,809 | |||||||||||
Banco Santander SA | ||||||||||||||
| 5,050,000 | 0.290 | 10/12/21 | 5,051,059 | |||||||||||
Bank of Montreal(e) | ||||||||||||||
(1M USD BSBY + 0.120%) | ||||||||||||||
| 11,000,000 | 0.189 | 12/01/21 | 10,997,800 | |||||||||||
(3M USD LIBOR + 0.040%) | ||||||||||||||
| 5,000,000 | 0.185 | 10/01/21 | 5,000,214 | |||||||||||
(3M USD LIBOR + 0.100%) | ||||||||||||||
| 3,500,000 | 0.224 | 11/17/21 | 3,501,026 | |||||||||||
Bank of Nova Scotia(e)(SOFR + 0.150%) | ||||||||||||||
| 10,000,000 | 0.200 | 03/17/22 | 10,002,072 | |||||||||||
Barclays Bank PLC | ||||||||||||||
| 5,000,000 | 0.350 | 12/31/21 | 5,003,381 | |||||||||||
Canadian Imperial Bank of Commerce(e) | ||||||||||||||
(1M USD BSBY + 0.100%) | ||||||||||||||
| 8,940,000 | 0.171 | 01/24/22 | 8,940,000 | |||||||||||
(3M USD LIBOR + 0.100%) | ||||||||||||||
| 5,000,000 | 0.219 | 12/13/21 | 5,001,385 | |||||||||||
(3M USD LIBOR + 0.110%) | ||||||||||||||
| 2,500,000 | 0.248 | 01/03/22 | 2,500,892 | |||||||||||
Commonwealth Bank of Australia(e) | ||||||||||||||
| 5,000,000 | 0.131 | 09/02/21 | 5,000,000 | |||||||||||
Cooperatieve Centrale | ||||||||||||||
| 5,400,000 | 0.160 | 12/10/21 | 5,400,847 | |||||||||||
Credit Industriel ET Commercial | ||||||||||||||
| 11,870,000 | 0.240 | 04/22/22 | 11,877,082 | |||||||||||
Credit Suisse New York | ||||||||||||||
| 800,000 | 0.340 | 11/01/21 | 800,287 | |||||||||||
| 8,000,000 | 0.340 | 11/19/21 | 8,003,494 | |||||||||||
Deutsche Bank AG | ||||||||||||||
| 6,846,000 | 0.720 | 11/08/21 | 6,853,258 | |||||||||||
First Abu Dhabi Bank USA NV(e) (3M USD LIBOR + 0.170%) | ||||||||||||||
| 10,032,000 | 0.289 | 12/14/21 | 10,033,944 | |||||||||||
HSBC Bank PLC | ||||||||||||||
| 2,000,000 | 0.330 | 12/24/21 | 2,001,391 | |||||||||||
Landesbank Hessen-Thuringen | ||||||||||||||
| 13,321,000 | 0.160 | 12/09/21 | 13,321,628 | |||||||||||
Lloyds Bank Corporate Markets PLC | ||||||||||||||
| 5,000,000 | 0.240 | 02/23/22 | 5,002,267 | |||||||||||
(SOFR + 0.190%) | ||||||||||||||
| 8,900,000 | 0.240 | (e) | 02/17/22 | 8,903,202 | ||||||||||
Macquarie Bank Ltd.(d)(e)(3M USD LIBOR + 0.030%) | ||||||||||||||
| 8,500,000 | 0.224 | 11/12/21 | 8,500,945 | |||||||||||
Mizuho Bank Ltd. | ||||||||||||||
| 3,000,000 | 0.190 | 02/28/22 | 3,000,451 | |||||||||||
| 23,800,000 | 0.230 | 11/10/21 | 23,806,988 | |||||||||||
| 7,000,000 | 0.230 | 11/17/21 | 7,002,152 | |||||||||||
|
| |||||||||||||
| 50 | The accompanying notes are an integral part of these financial statements. |
GOLDMAN SACHS TACTICAL TILT OVERLAY FUND
| Principal Amount | Interest Rate | Maturity Date | Value | |||||||||||
| Short-term Investments – (continued) | ||||||||||||||
| Certificates of Deposit – (continued) | ||||||||||||||
MUFG Bank Ltd. | ||||||||||||||
| $ | 10,000,000 | 0.230 | % | 10/28/21 | $ | 10,002,431 | ||||||||
National Bank Of Kuwait Sakp | ||||||||||||||
| 7,000,000 | 0.390 | 11/16/21 | 7,002,642 | |||||||||||
| 3,443,000 | 0.230 | 09/16/21 | 3,443,185 | |||||||||||
| 8,500,000 | 0.240 | 12/03/21 | 8,500,000 | |||||||||||
| 10,000,000 | 0.250 | 09/13/21 | 10,000,556 | |||||||||||
Natixis SA(e) | ||||||||||||||
(3M USD LIBOR + 0.030%) | ||||||||||||||
| 16,465,000 | 0.155 | 11/15/21 | 16,467,251 | |||||||||||
(3M USD LIBOR + 0.130%) | ||||||||||||||
| 1,001,000 | 0.253 | 12/09/21 | 1,001,345 | |||||||||||
Norinchukin Bank NY | ||||||||||||||
| 3,516,000 | 0.250 | 11/04/21 | 3,516,932 | |||||||||||
| 6,100,000 | 0.370 | 12/03/21 | 6,104,119 | |||||||||||
Royal Bank of Canada(e) (3M USD LIBOR + 0.090%) | ||||||||||||||
| 10,000,000 | 0.218 | 12/10/21 | 10,002,075 | |||||||||||
| | Skandinaviska Enskilda Banken AB/New York NY(e) (3M USD | | ||||||||||||
| 9,750,000 | 0.151 | 12/06/21 | 9,750,115 | |||||||||||
Societe Generale SA(d)(e) | ||||||||||||||
(3M USD LIBOR + 0.110%) | ||||||||||||||
| 5,000,000 | 0.344 | 01/18/22 | 5,001,679 | |||||||||||
(3M USD LIBOR + 0.120%) | ||||||||||||||
| 16,000,000 | 0.314 | 03/07/22 | 16,005,499 | |||||||||||
Standard Chartered Bank | ||||||||||||||
| 8,700,000 | 0.300 | 05/03/22 | 8,705,958 | |||||||||||
Svenska Handelsbanken(e) (3M USD LIBOR + 0.010%) | ||||||||||||||
| 11,000,000 | 0.137 | 02/11/22 | 11,000,386 | |||||||||||
Toronto Dominion Bank | ||||||||||||||
| 4,000,000 | 0.240 | (d) | 04/22/22 | 4,002,369 | ||||||||||
| 5,000,000 | 0.240 | 04/27/22 | 5,002,648 | |||||||||||
UBS AG London | ||||||||||||||
| 4,303,000 | 0.300 | 03/15/22 | 4,304,839 | |||||||||||
(3M USD LIBOR + 0.120%) | ||||||||||||||
| 15,000,000 | 0.350 | (d)(e) | 10/15/21 | 15,001,239 | ||||||||||
Westpac Banking Corp.(d)(e) (3M USD LIBOR + 0.020%) | ||||||||||||||
| 10,000,000 | 0.148 | 11/24/21 | 10,001,412 | |||||||||||
|
| |||||||||||||
| 382,675,637 | ||||||||||||||
|
| |||||||||||||
| Commercial Paper(a) – 30.5% | ||||||||||||||
Albion Capital Corp.(d) | ||||||||||||||
| 17,700,000 | 0.000 | 09/23/21 | 17,698,586 | |||||||||||
| 5,000,000 | 0.000 | 11/22/21 | 4,998,386 | |||||||||||
Antalis S.A(d) | ||||||||||||||
| 8,617,000 | 0.000 | 10/15/21 | 8,615,707 | |||||||||||
| 8,000,000 | 0.000 | 11/05/21 | 7,998,211 | |||||||||||
AT&T, Inc.(d) | ||||||||||||||
| 6,000,000 | 0.000 | 09/21/21 | 5,999,510 | |||||||||||
| 1,750,000 | 0.000 | 11/10/21 | 1,749,389 | |||||||||||
| 14,244,000 | 0.000 | 12/14/21 | 14,236,314 | |||||||||||
| 12,306,000 | 0.000 | 12/16/21 | 12,299,270 | |||||||||||
Atlantic Asset Securitization Corp.(d) | ||||||||||||||
| 6,200,000 | 0.000 | 09/14/21 | 6,199,785 | |||||||||||
| 10,463,000 | 0.000 | 11/18/21 | 10,460,337 | |||||||||||
|
| |||||||||||||
| Short-term Investments – (continued) | ||||||||||||||
| Commercial Paper(a) – (continued) | ||||||||||||||
Bank Amer Secs, Inc.(d) | ||||||||||||||
| 14,250,000 | 0.000 | 12/21/21 | 14,244,458 | |||||||||||
Barclays Capital, Inc.(d) | ||||||||||||||
| 15,000,000 | 0.000 | 01/24/22 | 14,991,483 | |||||||||||
BASF SE(d) | ||||||||||||||
| 20,000,000 | 0.000 | 09/23/21 | 19,998,467 | |||||||||||
BAT International Finance PLC(d) | ||||||||||||||
| 8,000,000 | 0.000 | 09/07/21 | 7,999,798 | |||||||||||
| 8,307,000 | 0.000 | 10/22/21 | 8,304,972 | |||||||||||
Bedford Row Funding Corp.(d) | ||||||||||||||
| 9,000,000 | 0.000 | 09/08/21 | 8,999,776 | |||||||||||
BNG Bank N.V.(d) | ||||||||||||||
| 25,000,000 | 0.000 | 01/31/22 | 24,985,019 | |||||||||||
BP Capital Markets PLC(d) | ||||||||||||||
| 10,383,000 | 0.000 | 01/18/22 | 10,376,943 | |||||||||||
| 4,307,000 | 0.000 | 02/22/22 | 4,303,483 | |||||||||||
Cafco LLC(d) | ||||||||||||||
| 20,000,000 | 0.000 | 11/03/21 | 19,996,053 | |||||||||||
Caisse Des Depots Et Consignations | ||||||||||||||
| 25,856,000 | 0.000 | 01/26/22 | 25,842,288 | |||||||||||
Caisse d’Amortissement de la Dette Sociale(d) | ||||||||||||||
| 2,500,000 | 0.000 | 11/01/21 | 2,499,608 | |||||||||||
CDP Financial, Inc.(d) | ||||||||||||||
| 17,000,000 | 0.000 | 04/26/22 | 16,986,626 | |||||||||||
| 5,000,000 | 0.000 | 05/11/22 | 4,995,467 | |||||||||||
CenterPoint Energy, Inc.(d) | ||||||||||||||
| 9,561,000 | 0.000 | 09/21/21 | 9,560,219 | |||||||||||
Chariot Funding LLC(d) | ||||||||||||||
| 8,000,000 | 0.000 | 09/13/21 | 7,999,769 | |||||||||||
Chevron Corp.(d) | ||||||||||||||
| 13,767,000 | 0.000 | 09/28/21 | 13,766,143 | |||||||||||
Ciesco LLC(d) | ||||||||||||||
| 10,000,000 | 0.000 | 02/07/22 | 9,993,644 | |||||||||||
CNPC Finance(d) | ||||||||||||||
| 21,000,000 | 0.000 | 09/07/21 | 20,999,673 | |||||||||||
Collateralized Commercial Paper FLEX Co. LLC(d) | ||||||||||||||
| 17,500,000 | 0.000 | 09/23/21 | 17,498,938 | |||||||||||
Collateralized Commercial Paper V Co. LLC | ||||||||||||||
| 10,000,000 | 0.000 | 01/18/22 | 9,994,672 | |||||||||||
Danaher Corp.(d) | ||||||||||||||
| 15,151,000 | 0.000 | 11/09/21 | 15,145,609 | |||||||||||
Dexia Credit Local SA(d) | ||||||||||||||
| 8,000,000 | 0.000 | 09/14/21 | 7,999,751 | |||||||||||
| 8,200,000 | 0.000 | 02/22/22 | 8,194,419 | |||||||||||
| 15,000,000 | 0.000 | 03/07/22 | 14,988,798 | |||||||||||
Dow Chemical Co. | ||||||||||||||
| 24,500,000 | 0.000 | 09/27/21 | 24,496,748 | |||||||||||
Duke Energy Corp.(d) | ||||||||||||||
| 7,000,000 | 0.000 | 09/08/21 | 6,999,830 | |||||||||||
Dupont De Nemours, Inc.(d) | ||||||||||||||
| 6,250,000 | 0.000 | 12/03/21 | 6,247,373 | |||||||||||
Electricite de France SA(d) | ||||||||||||||
| 10,000,000 | 0.000 | 10/12/21 | 9,998,390 | |||||||||||
| 10,000,000 | 0.000 | 10/26/21 | 9,997,371 | |||||||||||
Enel Finance America(d) | ||||||||||||||
| 8,250,000 | 0.000 | 11/05/21 | 8,247,338 | |||||||||||
|
| |||||||||||||
| The accompanying notes are an integral part of these financial statements. | 51 |
GOLDMAN SACHS TACTICAL TILT OVERLAY FUND
Consolidated Schedule of Investments (continued)
August 31, 2021
| Principal Amount | Interest Rate | Maturity Date | Value | |||||||||||
| Short-term Investments – (continued) | ||||||||||||||
| Commercial Paper(a) – (continued) | ||||||||||||||
Enel Finance America(d) – (continued) | ||||||||||||||
| $ | 6,850,000 | 0.000 | % | 02/16/22 | $ | 6,842,411 | ||||||||
| 5,000,000 | 0.000 | 02/17/22 | 4,994,404 | |||||||||||
Entergy Corp.(d) | ||||||||||||||
| 10,000,000 | 0.000 | 11/22/21 | 9,995,435 | |||||||||||
| 5,809,000 | 0.000 | 11/23/21 | 5,806,316 | |||||||||||
Equipment Intermediation(d) | ||||||||||||||
| 10,876,000 | 0.000 | 09/16/21 | 10,875,560 | |||||||||||
Erste Abwicklungsanstalt(d) | ||||||||||||||
| 12,925,000 | 0.000 | 02/14/22 | 12,916,246 | |||||||||||
Exxon Mobil Corp. | ||||||||||||||
| 7,850,000 | 0.000 | 09/01/21 | 7,849,987 | |||||||||||
| 10,800,000 | 0.000 | 09/07/21 | 10,799,874 | |||||||||||
| 17,500,000 | 0.000 | 09/23/21 | 17,499,329 | |||||||||||
Fairway Finance Corp.(d) | ||||||||||||||
| 5,200,000 | 0.000 | 10/22/21 | 5,199,099 | |||||||||||
Fidelity National Information Services, Inc.(d) | ||||||||||||||
| 14,500,000 | 0.000 | 09/03/21 | 14,499,850 | |||||||||||
| 7,000,000 | 0.000 | 09/07/21 | 6,999,823 | |||||||||||
General Dynamics Corp.(d) | ||||||||||||||
| 18,000,000 | 0.000 | 10/14/21 | 17,997,580 | |||||||||||
Gotham Funding Corp.(d) | ||||||||||||||
| 19,000,000 | 0.000 | 10/12/21 | 18,997,606 | |||||||||||
Honeywell International, Inc.(d) | ||||||||||||||
| 3,150,000 | 0.000 | 10/18/21 | 3,149,698 | |||||||||||
| 5,000,000 | 0.000 | 01/19/22 | 4,998,159 | |||||||||||
| 6,000,000 | 0.000 | 05/18/22 | 5,993,630 | |||||||||||
| 8,000,000 | 0.000 | 05/20/22 | 7,991,441 | |||||||||||
Ionic Capital II Trust | ||||||||||||||
| 15,041,000 | 0.000 | (d) | 09/23/21 | 15,040,087 | ||||||||||
| 15,000,000 | 0.000 | 10/05/21 | 14,998,542 | |||||||||||
J.P. Morgan Securities LLC(d) | ||||||||||||||
| 10,674,000 | 0.000 | 03/22/22 | 10,665,092 | |||||||||||
Keurig Dr Pepper, Inc. | ||||||||||||||
| 8,100,000 | 0.000 | (d) | 12/30/21 | 8,094,256 | ||||||||||
| 10,957,000 | 0.000 | 01/10/22 | 10,948,242 | |||||||||||
KFW International Finance, Inc.(d) | ||||||||||||||
| 31,400,000 | 0.000 | 01/25/22 | 31,384,742 | |||||||||||
Koch Inds, Inc. | ||||||||||||||
| 9,000,000 | 0.000 | 09/01/21 | 8,999,985 | |||||||||||
La Fayette Asset Securitization(d) | ||||||||||||||
| 20,000,000 | 0.000 | 10/27/21 | 19,996,580 | |||||||||||
Liberty Funding LLC(d) | ||||||||||||||
| 6,000,000 | 0.000 | 09/24/21 | 5,999,616 | |||||||||||
| 9,698,000 | 0.000 | 12/23/21 | 9,694,069 | |||||||||||
Lime Funding(d) | ||||||||||||||
| 6,250,000 | 0.000 | 09/10/21 | 6,249,854 | |||||||||||
| 12,192,000 | 0.000 | 12/09/21 | 12,187,834 | |||||||||||
LMA SA LMA Americas(d) | ||||||||||||||
| 5,000,000 | 0.000 | 09/02/21 | 4,999,978 | |||||||||||
| 8,613,000 | 0.000 | 09/03/21 | 8,612,943 | |||||||||||
| 4,900,000 | 0.000 | 09/23/21 | 4,899,703 | |||||||||||
| 7,000,000 | 0.000 | 02/11/22 | 6,995,376 | |||||||||||
LVMH Moet Hennessy Louis Vuitton SE(d) | ||||||||||||||
| 6,980,000 | 0.000 | 10/05/21 | 6,979,389 | |||||||||||
| 3,000,000 | 0.000 | 10/13/21 | 2,999,678 | |||||||||||
|
| |||||||||||||
| Short-term Investments – (continued) | ||||||||||||||
| Commercial Paper(a) – (continued) | ||||||||||||||
LVMH Moet Hennessy Louis Vuitton SE(d) – (continued) | ||||||||||||||
| 1,000,000 | 0.000 | 11/08/21 | 999,805 | |||||||||||
| 22,000,000 | 0.000 | 01/18/22 | 21,988,621 | |||||||||||
Massachusetts Mutual Life Insurance Co.(d) | ||||||||||||||
| 15,000,000 | 0.000 | 09/15/21 | 14,999,562 | |||||||||||
Matchpoint Finance PLC(d) | ||||||||||||||
| 17,779,000 | 0.000 | 10/08/21 | 17,777,123 | |||||||||||
| 5,000,000 | 0.000 | 11/08/21 | 4,998,917 | |||||||||||
| 7,000,000 | 0.000 | 11/23/21 | 6,998,073 | |||||||||||
Mccormick & Co.(d) | ||||||||||||||
| 13,000,000 | 0.000 | 09/15/21 | 12,999,296 | |||||||||||
National Bank of Canada(d) | ||||||||||||||
| 10,554,000 | 0.000 | 03/22/22 | 10,544,597 | |||||||||||
NatWest Markets PLC(d) | ||||||||||||||
| 6,000,000 | 0.000 | 01/18/22 | 5,996,103 | |||||||||||
| 8,050,000 | 0.000 | 01/19/22 | 8,044,735 | |||||||||||
Nederlandse Wtrschbnk(d) | ||||||||||||||
| 8,617,000 | 0.000 | 10/14/21 | 8,615,947 | |||||||||||
| 15,000,000 | 0.000 | 12/01/21 | 14,995,745 | |||||||||||
NextEra Energy Capital Holdings, Inc.(d) | ||||||||||||||
| 18,000,000 | 0.000 | 10/19/21 | 17,995,958 | |||||||||||
Nieuw Amsterdam Receivables Corp.(d) | ||||||||||||||
| 7,600,000 | 0.000 | 09/17/21 | 7,599,677 | |||||||||||
| 10,000,000 | 0.000 | 11/02/21 | 9,998,233 | |||||||||||
NRW Bank(d) | ||||||||||||||
| 15,000,000 | 0.000 | 10/27/21 | 14,997,672 | |||||||||||
Oesterreichische | ||||||||||||||
| 25,856,000 | 0.000 | 10/29/21 | 25,853,415 | |||||||||||
PPG Industries, Inc. | ||||||||||||||
| 14,000,000 | 0.000 | 09/20/21 | 13,998,927 | |||||||||||
Reckitt Benckiser Treasury Services PLC(d) | ||||||||||||||
| 20,800,000 | 0.000 | 09/09/21 | 20,799,064 | |||||||||||
| 11,000,000 | 0.000 | 10/12/21 | 10,997,562 | |||||||||||
Ridgefield Funding Co.(d) | ||||||||||||||
| 12,000,000 | 0.000 | 02/08/22 | 11,991,038 | |||||||||||
| 12,061,000 | 0.000 | 09/03/21 | 12,060,916 | |||||||||||
Salisbury Receivables Co.(d) | ||||||||||||||
| 6,658,000 | 0.000 | 09/10/21 | 6,657,852 | |||||||||||
Schwab Charles Corp.(d) | ||||||||||||||
| 17,000,000 | 0.000 | 11/16/21 | 16,996,509 | |||||||||||
Sheffield Receivables Corp.(d) | ||||||||||||||
| 10,000,000 | 0.000 | 12/09/21 | 9,996,583 | |||||||||||
Starbird Funding Corp.(d) | ||||||||||||||
| 9,000,000 | 0.000 | 11/10/21 | 8,997,977 | |||||||||||
| 10,000,000 | 0.000 | 12/01/21 | 9,996,908 | |||||||||||
Suncor Energy, Inc.(d) | ||||||||||||||
| 2,500,000 | 0.000 | 09/09/21 | 2,499,919 | |||||||||||
Svenska Handelsbanken AB(d) | ||||||||||||||
| 8,613,000 | 0.000 | 02/01/22 | 8,608,173 | |||||||||||
The Walt Disney Co.(d) | ||||||||||||||
| 2,000,000 | 0.000 | 01/27/22 | 1,998,601 | |||||||||||
Toronto Dominion Bank(d) | ||||||||||||||
| 5,000,000 | 0.000 | 04/26/22 | 4,995,075 | |||||||||||
Versailles CDS LLC(d) | ||||||||||||||
| 5,000,000 | 0.000 | 11/05/21 | 4,998,973 | |||||||||||
|
| |||||||||||||
| 52 | The accompanying notes are an integral part of these financial statements. |
GOLDMAN SACHS TACTICAL TILT OVERLAY FUND
| Principal Amount | Interest Rate | Maturity Date | Value | |||||||||||
| Short-term Investments – (continued) | ||||||||||||||
| Commercial Paper(a) – (continued) | ||||||||||||||
Victory Receivables Corp.(d) | ||||||||||||||
| $ | 20,000,000 | 0.000 | % | 10/26/21 | $ | 19,996,671 | ||||||||
Volkswagen Group of America Finance LLC(d) | ||||||||||||||
| 12,000,000 | 0.000 | 11/10/21 | 11,989,492 | |||||||||||
VW Cr, Inc.(d) | ||||||||||||||
| 5,000,000 | 0.000 | 09/17/21 | 4,999,686 | |||||||||||
Waste Management, Inc.(d) | ||||||||||||||
| 15,000,000 | 0.000 | 09/20/21 | 14,998,850 | |||||||||||
| 4,338,000 | 0.000 | 08/10/22 | 4,330,373 | |||||||||||
|
| |||||||||||||
| 1,247,373,663 | ||||||||||||||
|
| |||||||||||||
| TOTAL SHORT-TERM INVESTMENTS | ||||||||||||||
| (Cost $1,629,841,097) | $ | 1,630,049,300 | ||||||||||||
|
| |||||||||||||
| | TOTAL INVESTMENTS BEFORE SECURITIES LENDING REINVESTMENT | | ||||||||||||
| (Cost $3,902,390,931) | $ | 3,996,486,070 | ||||||||||||
|
| |||||||||||||
| Shares | Dividend Rate | Value | ||||||
| Securities Lending Reinvestment Vehicle(c) – 0.1% | ||||||||
| | Goldman Sachs Financial Square Government | | ||||||
| 5,522,825 | 0.026% | $ | 5,522,825 | |||||
| (Cost $5,522,825) | ||||||||
|
| |||||||
| | TOTAL INVESTMENTS – 97.7% (Cost $3,907,913,756) | $ | 4,002,008,895 | |||||
|
| |||||||
| | OTHER ASSETS IN EXCESS OF LIABILITIES – 2.3% | 95,470,196 | ||||||
|
| |||||||
| NET ASSETS – 100.0% | $ | 4,097,479,091 | ||||||
|
| |||||||
| The percentage shown for each investment category reflects the value of investments in that category as a percentage of net assets. | ||
(a) | Issued with a zero coupon. Income is recognized through the accretion of discount. | |
(b) | All or a portion of security is on loan. | |
(c) | Represents an affiliated fund. | |
(d) | Exempt from registration under Rule 144A of the Securities Act of 1933. | |
(e) | Variable rate security. Except for floating rate notes (for which final maturity is disclosed), maturity date disclosed is the next interest reset date. Interest rate disclosed is that which is in effect on August 31, 2021. | |
| ||
Currency Abbreviations: | ||
CHF | —Swiss Franc | |
CNH | —Chinese Yuan Renminbi Offshore | |
EUR | —Euro | |
JPY | —Japanese Yen | |
USD | —U.S. Dollar | |
Investment Abbreviations: | ||
BSBY | —Bloomberg Short-Term Bank Yield Index | |
ETF | —Exchange Traded Fund | |
LIBOR | —London Interbank Offered Rate | |
LLC | —Limited Liability Company | |
PLC | —Public Limited Company | |
SOFR | —Secured Overnight Funding Rate | |
| ||
| ADDITIONAL INVESTMENT INFORMATION |
FUTURES CONTRACTS — At August 31, 2021, the Fund had the following futures contracts:
| Description | Number of Contracts | Expiration Date | Notional Amount | Unrealized Appreciation/ (Depreciation) | ||||||||||||
Long position contracts: |
| |||||||||||||||
Euro Stoxx 600 Index | 237 | 09/17/21 | $ | 6,571,992 | $ | 225,144 | ||||||||||
2 Year U.S. Treasury Notes | 1,016 | 12/31/21 | 223,853,376 | 22,086 | ||||||||||||
5 Year U.S. Treasury Notes | 621 | 12/31/21 | 76,829,344 | 47,668 | ||||||||||||
10 Year U.S. Treasury Notes | 1,985 | 12/21/21 | 264,904,453 | (5,352 | ) | |||||||||||
| Total |
| $ | 289,546 | |||||||||||||
Short position contracts: | ||||||||||||||||
S&P 500 E-Mini Index | (385 | ) | 09/17/21 | (87,019,625 | ) | (5,614,709 | ) | |||||||||
| TOTAL FUTURES CONTRACTS |
| $ | (5,325,163 | ) | ||||||||||||
| The accompanying notes are an integral part of these financial statements. | 53 |
GOLDMAN SACHS TACTICAL TILT OVERLAY FUND
Consolidated Schedule of Investments (continued)
August 31, 2021
| ADDITIONAL INVESTMENT INFORMATION (continued) |
SWAP CONTRACTS — At August 31, 2021, the Fund had the following swap contracts:
OVER THE COUNTER TOTAL RETURN SWAP CONTRACTS
| Reference Obligation/ Index | Financing Rate (Received)/ Paid by the Fund | Counterparty | Termination Date(a) | Notional Amount (000s) | Unrealized Appreciation/ (Depreciation)* | |||||||||||
JPGSVENK Index(b) | 0.070 | %(c) | J.P. Morgan Securities LLC | 10/05/21 | $ | 124,908 | $ | (4,132,921 | ) | |||||||
MSGSSUIT Index(b) | 0.350(c) | MS & Co. Int. PLC | 10/05/21 | 124,917 | 2,665,649 | |||||||||||
SX7T Index | 0.150(d) | Barclays Bank PLC | 04/04/22 | EUR | 138,305 | 5,599,171 | ||||||||||
SX7T Index | (0.150)(d) | Barclays Bank PLC | 04/04/22 | 11,047 | (447,238 | ) | ||||||||||
| TOTAL |
| $ | 3,684,661 | |||||||||||||
| * | There are no upfront payments on the swap contracts, therefore the unrealized gain (loss) on the swap contracts is equal to their market value. |
| (a) | The Fund pays/receives annual coupon payments in accordance with the swap contract. On the termination date of the swap contract(s), the Fund will either receive from or pay to the counterparty an amount equal to the net of the accrued financing fees and the value of the reference security subtracted from the original notional cost (notional multiplied by the price change of the reference security, converted to U.S. Dollars). |
| (b) | The top 50 components are shown below. |
| (c) | Payments made monthly. |
| (d) | Payments made quarterly. |
A basket (JPGSVENK) of common stocks
| Common Stocks | Sector | Shares | Value | Weight | ||||||||||
Albemarle Corp | Financial | (362 | ) | $ | (85,766 | ) | 2.08 | % | ||||||
Carnival Corp | Consumer, Cyclical | (3,493 | ) | (84,317 | ) | 2.04 | ||||||||
McCormick & Co Inc/MD | Consumer, Non-cyclical | (891 | ) | (76,917 | ) | 1.86 | ||||||||
American Airlines Group Inc | Consumer, Cyclical | (3,737 | ) | (74,507 | ) | 1.80 | ||||||||
Hormel Foods Corp | Consumer, Non-cyclical | (1,609 | ) | (73,267 | ) | 1.77 | ||||||||
Aptiv PLC | Consumer, Cyclical | (447 | ) | (68,040 | ) | 1.65 | ||||||||
Catalent Inc | Consumer, Non-cyclical | (492 | ) | (64,172 | ) | 1.55 | ||||||||
Dexcom Inc | Consumer, Non-cyclical | (116 | ) | (61,296 | ) | 1.48 | ||||||||
Edwards Lifesciences Corp | Consumer, Non-cyclical | (523 | ) | (61,242 | ) | 1.48 | ||||||||
Paycom Software Inc | Technology | (125 | ) | (61,084 | ) | 1.48 | ||||||||
Align Technology Inc | Consumer, Non-cyclical | (85 | ) | (59,965 | ) | 1.45 | ||||||||
MGM Resorts International | Consumer, Cyclical | (1,337 | ) | (56,989 | ) | 1.38 | ||||||||
NVIDIA Corp | Technology | (253 | ) | (56,636 | ) | 1.37 | ||||||||
Netflix Inc | Communications | (97 | ) | (55,211 | ) | 1.34 | ||||||||
ServiceNow Inc | Technology | (85 | ) | (55,009 | ) | 1.33 | ||||||||
Royal Caribbean Cruises Ltd | Consumer, Cyclical | (662 | ) | (54,769 | ) | 1.33 | ||||||||
Norwegian Cruise Line Holdings Ltd | Consumer, Cyclical | (2,119 | ) | (54,758 | ) | 1.33 | ||||||||
Live Nation Entertainment Inc | Consumer, Cyclical | (632 | ) | (54,756 | ) | 1.32 | ||||||||
Monolithic Power Systems Inc | Technology | (110 | ) | (54,419 | ) | 1.32 | ||||||||
Bank of New York Mellon Corp/The | Financial | (974 | ) | (53,809 | ) | 1.30 | ||||||||
Charles Schwab Corp/The | Financial | (738 | ) | (53,739 | ) | 1.30 | ||||||||
Equifax Inc | Consumer, Non-cyclical | (193 | ) | (52,631 | ) | 1.27 | ||||||||
Pioneer Natural Resources Co | Energy | (351 | ) | (52,539 | ) | 1.27 | ||||||||
Tesla Inc | Consumer, Cyclical | (70 | ) | (51,803 | ) | 1.25 | ||||||||
Wynn Resorts Ltd | Consumer, Cyclical | (508 | ) | (51,656 | ) | 1.25 | ||||||||
Delta Air Lines Inc | Consumer, Cyclical | (1,267 | ) | (51,223 | ) | 1.24 | ||||||||
Chipotle Mexican Grill Inc | Consumer, Cyclical | (27 | ) | (51,012 | ) | 1.23 | ||||||||
Advanced Micro Devices Inc | Technology | (460 | ) | (50,931 | ) | 1.23 | ||||||||
Alaska Air Group Inc | Consumer, Cyclical | (881 | ) | (50,524 | ) | 1.22 | ||||||||
Archer-Daniels-Midland Co | Consumer, Non-cyclical | (842 | ) | (50,508 | ) | 1.22 | ||||||||
United Airlines Holdings Inc | Consumer, Cyclical | (1,085 | ) | (50,446 | ) | 1.22 | ||||||||
ConocoPhillips | Energy | (902 | ) | (50,105 | ) | 1.21 | ||||||||
MarketAxess Holdings Inc | Consumer, Non-cyclical | (104 | ) | (49,544 | ) | 1.20 | ||||||||
ANSYS Inc | Technology | (135 | ) | (49,392 | ) | 1.20 | ||||||||
Autodesk Inc | Technology | (155 | ) | (48,111 | ) | 1.16 | ||||||||
T-Mobile US Inc | Communications | (345 | ) | (47,249 | ) | 1.14 | ||||||||
Air Products and Chemicals Inc | Basic Materials | (173 | ) | (46,643 | ) | 1.13 | ||||||||
| 54 | The accompanying notes are an integral part of these financial statements. |
GOLDMAN SACHS TACTICAL TILT OVERLAY FUND
| ADDITIONAL INVESTMENT INFORMATION (continued) |
| A basket (JPGSVENK) of common stocks (continued) | ||||||||||||||
| Common Stocks | Sector | Shares | Value | Weight | ||||||||||
Expedia Group Inc | Communications | (314 | ) | $ | (45,358 | ) | 1.10 | % | ||||||
ABIOMED Inc | Consumer, Non-cyclical | (120 | ) | (43,748 | ) | 1.06 | ||||||||
Charles River Laboratories International | Consumer, Non-cyclical | (97 | ) | (43,192 | ) | 1.05 | ||||||||
Bio-Rad Laboratories Inc | Consumer, Non-cyclical | (54 | ) | (43,132 | ) | 1.04 | ||||||||
Danaher Corp | Consumer, Non-cyclical | (133 | ) | (43,073 | ) | 1.04 | ||||||||
West Pharmaceutical Services Inc | Consumer, Non-cyclical | (95 | ) | (42,928 | ) | 1.04 | ||||||||
ResMed Inc | Consumer, Non-cyclical | (147 | ) | (42,687 | ) | 1.03 | ||||||||
Cooper Cos Inc/The | Consumer, Non-cyclical | (93 | ) | (41,994 | ) | 1.02 | ||||||||
Intuitive Surgical Inc | Consumer, Non-cyclical | (40 | ) | (41,895 | ) | 1.01 | ||||||||
Medtronic PLC | Consumer, Non-cyclical | (301 | ) | (40,137 | ) | 0.97 | ||||||||
IPG Photonics Corp | Technology | (230 | ) | (39,213 | ) | 0.95 | ||||||||
Caesars Entertainment Inc | Consumer, Cyclical | (385 | ) | (39,143 | ) | 0.95 | ||||||||
STERIS PLC | Consumer, Non-cyclical | (181 | ) | (38,869 | ) | 0.94 | ||||||||
A basket (MSGSSUIT) of common stocks
Activision Blizzard Inc | Technology | 1,438 | 118,419 | 4.44 | ||||||||||
Bank of America Corp | Financial | 1,629 | 68,021 | 2.55 | ||||||||||
United Rentals Inc | Consumer, Non-cyclical | 190 | 66,846 | 2.51 | ||||||||||
Truist Financial Corp | Financial | 1,152 | 65,717 | 2.46 | ||||||||||
Citizens Financial Group Inc | Financial | 1,480 | 64,806 | 2.43 | ||||||||||
Capital One Financial Corp | Financial | 389 | 64,587 | 2.42 | ||||||||||
Globe Life Inc | Financial | 666 | 63,970 | 2.40 | ||||||||||
Mohawk Industries Inc | Consumer, Cyclical | 316 | 62,416 | 2.34 | ||||||||||
Alaska Air Group Inc | Consumer, Cyclical | 1,081 | 61,991 | 2.32 | ||||||||||
Occidental Petroleum Corp | Energy | 2,398 | 61,606 | 2.31 | ||||||||||
Citrix Systems Inc | Technology | 598 | 61,516 | 2.31 | ||||||||||
Stanley Black & Decker Inc | Industrial | 316 | 60,991 | 2.29 | ||||||||||
FedEx Corp | Industrial | 224 | 59,501 | 2.23 | ||||||||||
Ford Motor Co | Consumer, Cyclical | 4,446 | 57,933 | 2.17 | ||||||||||
Gap Inc/The | Consumer, Cyclical | 2,113 | 56,468 | 2.12 | ||||||||||
Bath & Body Works Inc | Consumer, Cyclical | 776 | 52,351 | 1.96 | ||||||||||
Fox Corp | Communications | 1,247 | 43,192 | 1.62 | ||||||||||
Discovery Inc | Communications | 1,506 | 41,555 | 1.56 | ||||||||||
Organon & Co | Consumer, Non-cyclical | 1,056 | 35,782 | 1.34 | ||||||||||
Huntington Bancshares Inc/OH | Financial | 2,197 | 34,113 | 1.28 | ||||||||||
Westrock Co | Industrial | 636 | 33,119 | 1.24 | ||||||||||
Regions Financial Corp | Financial | 1,618 | 33,059 | 1.24 | ||||||||||
Synchrony Financial | Financial | 660 | 32,837 | 1.23 | ||||||||||
JPMorgan Chase & Co | Financial | 205 | 32,719 | 1.23 | ||||||||||
People’s United Financial Inc | Financial | 1,967 | 32,324 | 1.21 | ||||||||||
Marathon Oil Corp | Energy | 2,748 | 32,293 | 1.21 | ||||||||||
Invesco Ltd | Financial | 1,272 | 32,195 | 1.21 | ||||||||||
Discover Financial Services | Financial | 251 | 32,129 | 1.20 | ||||||||||
W R Berkley Corp | Financial | 424 | 31,938 | 1.20 | ||||||||||
SVB Financial Group | Financial | 57 | 31,794 | 1.19 | ||||||||||
Caterpillar Inc | Industrial | 151 | 31,784 | 1.19 | ||||||||||
United Parcel Service Inc | Industrial | 162 | 31,684 | 1.19 | ||||||||||
Biogen Inc | Consumer, Non-cyclical | 93 | 31,595 | 1.19 | ||||||||||
Intel Corp | Technology | 580 | 31,344 | 1.18 | ||||||||||
AES Corp/The | Utilities | 1,312 | 31,317 | 1.17 | ||||||||||
CF Industries Holdings Inc | Basic Materials | 677 | 30,748 | 1.15 | ||||||||||
Halliburton Co | Energy | 1,537 | 30,715 | 1.15 | ||||||||||
Schlumberger NV | Energy | 1,090 | 30,559 | 1.15 | ||||||||||
Lamb Weston Holdings Inc | Consumer, Non-cyclical | 460 | 29,998 | 1.13 | ||||||||||
Newmont Corp | Basic Materials | 499 | 28,932 | 1.09 | ||||||||||
Fox Corp | Communications | 582 | 21,798 | 0.82 | ||||||||||
Discovery Inc | Communications | 709 | 20,438 | 0.77 | ||||||||||
Ulta Beauty Inc | Consumer, Cyclical | 46 | 17,782 | 0.67 | ||||||||||
Victoria’s Secret & Co | Consumer, Cyclical | 258 | 17,102 | 0.64 |
| The accompanying notes are an integral part of these financial statements. | 55 |
GOLDMAN SACHS TACTICAL TILT OVERLAY FUND
Consolidated Schedule of Investments (continued)
August 31, 2021
| ADDITIONAL INVESTMENT INFORMATION (continued) |
| A basket (MSGSSUIT) of common stocks (continued) | ||||||||||||||
| Common Stocks | Sector | Shares | Value | Weight | ||||||||||
Under Armour Inc | Consumer, Cyclical | 850 | $ | 17,061 | 0.64 | % | ||||||||
Tyson Foods Inc | Consumer, Non-cyclical | 217 | 17,017 | 0.64 | ||||||||||
Comerica Inc | Financial | 229 | 16,890 | 0.63 | ||||||||||
Assurant Inc | Financial | 99 | 16,763 | 0.63 | ||||||||||
Fifth Third Bancorp | Financial | 429 | 16,653 | 0.62 | ||||||||||
Chubb Ltd | Financial | 91 | 16,650 | 0.62 | ||||||||||
PURCHASED AND WRITTEN OPTIONS CONTRACTS — At August 31, 2021, the Fund had the following purchased and written options:
OVER-THE-COUNTER INTEREST RATE SWAPTIONS
| Description | Counterparty | Exercise Rate | Expiration Date | Number of Contracts | Notional Amount | Market Value | Premiums Paid (Received) by Fund | Unrealized Appreciation/ (Depreciation) | ||||||||||||||||||||||||
Purchased option contracts |
| |||||||||||||||||||||||||||||||
Puts |
| |||||||||||||||||||||||||||||||
6M IRS | Barclays Bank PLC | 2.000 | % | 12/09/2021 | 71,975,000 | $ | 71,975,000 | $ | 742,926 | $ | 2,663,968 | $ | (1,921,042 | ) | ||||||||||||||||||
Written option contracts |
| |||||||||||||||||||||||||||||||
Calls |
| |||||||||||||||||||||||||||||||
6M IRS | Barclays Bank PLC | 1.600 | 12/09/2021 | (71,975,000 | ) | (71,975,000 | ) | (2,057,506 | ) | (1,338,695 | ) | (718,811 | ) | |||||||||||||||||||
9M IRS | MS & Co. Int. PLC | 2.070 | 11/24/2021 | (108,400,000 | ) | (108,400,000 | ) | (11,568,621 | ) | (7,284,480 | ) | (4,284,141 | ) | |||||||||||||||||||
9M IRS | BofA Securities LLC | 1.999 | 01/18/2022 | (112,300,000 | ) | (112,300,000 | ) | (10,726,739 | ) | (7,153,510 | ) | (3,573,229 | ) | |||||||||||||||||||
| (292,675,000 | ) | $ | (292,675,000 | ) | $ | (24,352,866 | ) | $ | (15,776,685 | ) | $ | (8,576,181 | ) | |||||||||||||||||||
Puts |
| |||||||||||||||||||||||||||||||
6M IRS | Barclays Bank PLC | 2.300 | 12/09/2021 | (71,975,000 | ) | (71,975,000 | ) | (220,474 | ) | (1,159,730 | ) | 939,256 | ||||||||||||||||||||
| Total written option contracts |
| (364,650,000 | ) | $ | (364,650,000 | ) | $ | (24,573,340 | ) | $ | (16,936,415 | ) | $ | (7,636,925 | ) | |||||||||||||||||
| TOTAL | (292,675,000 | ) | $ | (292,675,000 | ) | $ | (23,830,414 | ) | $ | (14,272,447 | ) | $ | (9,557,967 | ) | ||||||||||||||||||
OVER-THE-COUNTER OPTIONS ON EQUITIES
| Description | Counterparty | Exercise Price | Expiration Date | Number of Contracts | Notional Amount | Market Value | Premiums Paid (Received) by Fund | Unrealized Appreciation/ (Depreciation) | ||||||||||||||||||||||
Purchased option contracts |
| |||||||||||||||||||||||||||||
Calls |
| |||||||||||||||||||||||||||||
FTSE 100 Index | BofA Securities LLC | $ | 7,573.990 | 03/18/2022 | 7,603 | $ | 5,758,504,597 | $ | 812,666 | $ | 1,108,464 | $ | (295,798 | ) | ||||||||||||||||
Nikkei 225 Index | Citibank NA | 28,691.210 | 12/30/2021 | 492,927 | 1,414,267,207,167 | 3,150,988 | 2,813,357 | 337,631 | ||||||||||||||||||||||
XLE Index | MS & Co. Int. PLC | 51.580 | 12/31/2021 | 2,741,058 | 14,138,377,164 | 4,345,388 | 3,891,206 | 454,182 | ||||||||||||||||||||||
| 3,241,588 | $ | 1,434,164,088,928 | $ | 8,309,042 | $ | 7,813,027 | $ | 496,015 | ||||||||||||||||||||||
Puts |
| |||||||||||||||||||||||||||||
S&P 500 Index | BNP Paribas SA | 4,348.600 | 09/30/2021 | 56,313 | 24,488,271,180 | 1,442,910 | 6,194,430 | (4,751,520 | ) | |||||||||||||||||||||
SX7E Index | MS & Co. Int. PLC | 68.565 | 11/12/2021 | 1,971,727 | 13,519,126,458 | 525,356 | 2,810,144 | (2,284,788 | ) | |||||||||||||||||||||
| 2,028,040 | $ | 38,007,397,638 | $ | 1,968,266 | $ | 9,004,574 | $ | (7,036,308 | ) | |||||||||||||||||||||
| Total purchased option contracts |
| 5,269,628 | $ | 1,472,171,486,566 | $ | 10,277,308 | $ | 16,817,601 | $ | (6,540,293 | ) | |||||||||||||||||||
| 56 | The accompanying notes are an integral part of these financial statements. |
GOLDMAN SACHS TACTICAL TILT OVERLAY FUND
| ADDITIONAL INVESTMENT INFORMATION (continued) |
OVER-THE-COUNTER OPTIONS ON EQUITIES (continued)
| Description | Counterparty | Exercise Price | Expiration Date | Number of Contracts | Notional Amount | Market Value | Premiums Paid (Received) by Fund | Unrealized Appreciation/ (Depreciation) | ||||||||||||||||||||||
Written option contracts |
| |||||||||||||||||||||||||||||
Calls |
| |||||||||||||||||||||||||||||
XLE Index | MS & Co. Int. PLC | $ | 56.790 | 12/31/2021 | (2,741,058 | ) | $ | (15,566,468,382 | ) | $ | (1,589,022 | ) | $ | (1,452,761 | ) | $ | (136,261 | ) | ||||||||||||
Puts |
| |||||||||||||||||||||||||||||
S&P 500 Index | Barclays Bank PLC | 3,520.209 | 12/31/2021 | (27,404 | ) | (9,646,781,566 | ) | (736,085 | ) | (7,265,549 | ) | 6,529,464 | ||||||||||||||||||
S&P 500 Index | Barclays Bank PLC | 3,756.126 | 12/31/2021 | (55,834 | ) | (20,971,953,908 | ) | (2,232,613 | ) | (11,720,003 | ) | 9,487,390 | ||||||||||||||||||
S&P 500 Index | BNP Paribas SA | 4,044.200 | 09/30/2021 | (56,313 | ) | (22,774,103,460 | ) | (513,551 | ) | (2,435,480 | ) | 1,921,929 | ||||||||||||||||||
FTSE 100 Index | BofA Securities LLC | 6,131.330 | 03/18/2022 | (7,603 | ) | (4,661,650,199 | ) | (1,269,341 | ) | (1,212,672 | ) | (56,669 | ) | |||||||||||||||||
S&P Index | BofA Securities LLC | 3,183.120 | 12/31/2021 | (82,040 | ) | (26,114,316,480 | ) | (1,278,857 | ) | (18,004,367 | ) | 16,725,510 | ||||||||||||||||||
SX7E Index | BofA Securities LLC | 68.565 | 11/12/2021 | (1,971,727 | ) | (13,519,126,458 | ) | (525,357 | ) | (21,451,190 | ) | 20,925,833 | ||||||||||||||||||
Nikkei 225 Index | Citibank NA | 23,725.430 | 12/30/2021 | (492,927 | ) | (1,169,490,503,361 | ) | (1,140,375 | ) | (1,680,545 | ) | 540,170 | ||||||||||||||||||
Russell 2000 Index | MS & Co. Int. PLC | 1,803.030 | 12/31/2021 | (110,313 | ) | (19,889,764,839 | ) | (2,355,951 | ) | (20,635,635 | ) | 18,279,684 | ||||||||||||||||||
| (2,804,161 | ) | $ | (1,287,068,200,271 | ) | $ | (10,052,130 | ) | $ | (84,405,441 | ) | $ | 74,353,311 | ||||||||||||||||||
| Total written option contracts |
| (5,545,219 | ) | $ | (1,302,634,668,653 | ) | $ | (11,641,152 | ) | $ | (85,858,202 | ) | $ | 74,217,050 | ||||||||||||||||
| TOTAL | (275,591 | ) | $ | 169,536,817,913 | $ | (1,363,844 | ) | $ | (69,040,601 | ) | $ | 67,676,757 | ||||||||||||||||||
OVER-THE-COUNTER OPTIONS ON FOREIGN CURRENCY
| Description | Counterparty | Exercise Price | Expiration Date | Number of Contracts | Notional Amount | Market Value | Premiums Paid (Received) by Fund | Unrealized Appreciation/ (Depreciation) | ||||||||||||||||||||||
Purchased option contracts |
| |||||||||||||||||||||||||||||
Calls |
| |||||||||||||||||||||||||||||
Call USD/Put CNH | BofA Securities LLC | $ | 6.511 | 10/14/2021 | 122,700,000 | $ | 122,700,000 | $ | 434,726 | $ | 1,011,784 | $ | (577,058 | ) | ||||||||||||||||
Call USD/Put CHF | BofA Securities LLC | 0.930 | 03/07/2023 | 43,640,000 | 43,640,000 | 792,764 | 1,420,264 | (627,500 | ) | |||||||||||||||||||||
Call USD/Put JPY | MS & Co. Int. PLC | 108.290 | 03/07/2023 | 43,640,000 | 43,640,000 | 1,531,764 | 1,481,578 | 50,186 | ||||||||||||||||||||||
| 209,980,000 | $ | 209,980,000 | $ | 2,759,254 | $ | 3,913,626 | $ | (1,154,372 | ) | |||||||||||||||||||||
Puts |
| |||||||||||||||||||||||||||||
Put EUR/Call USD | MS & Co. Int. PLC | 1.192 | 03/07/2023 | 36,490,000 | 36,490,000 | 1,220,443 | 1,405,395 | (184,952 | ) | |||||||||||||||||||||
| Total purchased option contracts | 246,470,000 | $ | 246,470,000 | $ | 3,979,697 | $ | 5,319,021 | $ | (1,339,324 | ) | ||||||||||||||||||||
| ||
Abbreviations: | ||
6M IRS | —6 Months Interest Rate Swaptions | |
9M IRS | —9 Months Interest Rate Swaptions | |
BofA Securities LLC | —Bank of America Securities LLC | |
MS & Co. Int. PLC | —Morgan Stanley & Co. International PLC | |
SX7E Index | —Euro STOXX Banks Index | |
SX7T Index | —Euro STOXX Banks Net Return Index | |
XLE Index | —Energy Select Sector SPDR Fund Index | |
| ||
| The accompanying notes are an integral part of these financial statements. | 57 |
GOLDMAN SACHS ALLOCATION FUNDS
Statements of Assets and Liabilities
August 31, 2021
Global Managed Beta Fund | Strategic Factor Allocation Fund | |||||||||
| Assets: | ||||||||||
Investments of unaffiliated issuers, at value (cost $897,742,887 and $0, respectively)(a) | $ | 1,310,970,620 | $ | — | ||||||
Investments of affiliated issuers, at value (cost $699,945,416 and $1,729,160,031, respectively) | 863,509,832 | 1,729,160,031 | ||||||||
Investments in securities lending reinvestment vehicle — affiliated issuer, at value, (cost $961,050 and $0, respectively) | 961,050 | — | ||||||||
Purchased options, at value (premium paid $14,220,944 and $1,098,543, respectively) | 14,786,412 | 310,481 | ||||||||
Cash | 34,310,556 | 214,063,725 | ||||||||
Foreign currencies, at value (cost $2,210,196 and $0, respectively) | 2,201,517 | — | ||||||||
Unrealized gain on forward foreign currency exchange contracts | 10,528,231 | 1,286,459 | ||||||||
Variation margin on futures contracts | 130,623 | — | ||||||||
Receivables: | ||||||||||
Investments sold | 40,468,481 | — | ||||||||
Collateral on certain derivative contracts(b) | 35,541,330 | 424,319,739 | ||||||||
Dividends and interest | 319,433 | 38,966 | ||||||||
Foreign tax reclaims | 221,248 | — | ||||||||
Reimbursement from investment adviser | 23,918 | — | ||||||||
Securities lending income | 910 | — | ||||||||
Fund shares sold | — | 3,161,000 | ||||||||
Due from broker | — | 334,802 | ||||||||
Other assets | 143,096 | 38,347 | ||||||||
| Total assets | 2,314,117,257 | 2,372,713,550 | ||||||||
| Liabilities: | ||||||||||
Unrealized loss on swap contracts | 11,718 | — | ||||||||
Unrealized loss on forward foreign currency exchange contracts | 1,295,232 | 1,714,993 | ||||||||
Variation margin on futures contracts | — | 15,421,353 | ||||||||
Written option contracts, at value (premium received $2,197,474 and $3,029,336, respectively) | 1,580,963 | 1,743,679 | ||||||||
Payables: | ||||||||||
Fund shares redeemed | 46,310,243 | 338,635 | ||||||||
Payable upon return of securities loaned | 961,050 | — | ||||||||
Management fees | 490,120 | 1,216,136 | ||||||||
Investments purchased | 444,717 | 99,326 | ||||||||
Transfer Agency fees | 38,083 | 58,967 | ||||||||
Accrued expenses | 389,800 | 308,218 | ||||||||
| Total liabilities | 51,521,926 | 20,901,307 | ||||||||
| Net Assets: | ||||||||||
Paid-in capital | 1,553,802,255 | 2,073,035,415 | ||||||||
Total distributable earnings | 708,793,076 | 278,776,828 | ||||||||
| NET ASSETS | $ | 2,262,595,331 | $ | 2,351,812,243 | ||||||
Net Assets: | ||||||||||
Institutional | $ | 2,262,595,331 | $ | 3,959,956 | ||||||
Class R6 | — | 13,513 | ||||||||
Class P | — | 2,347,838,774 | ||||||||
Total Net Assets | $ | 2,262,595,331 | $ | 2,351,812,243 | ||||||
Shares Outstanding $0.001 par value (unlimited number of shares authorized): | ||||||||||
Institutional | 135,395,905 | 310,341 | ||||||||
Class R6 | — | 1,070 | ||||||||
Class P | — | 186,054,026 | ||||||||
Net asset value, offering and redemption price per share: | ||||||||||
Institutional | $16.71 | $12.76 | ||||||||
Class R6 | — | 12.63 | ||||||||
Class P | — | 12.62 | ||||||||
| (a) | Includes loaned securities having market value of $941,531 and $0, respectively. |
| (b) | Segregated for initial margin and/or collateral as follows: |
| Fund | Futures | Forwards | Options | |||||||||
Global Managed Beta | $ | 9,482,907 | $ | 350,000 | $ | 25,708,423 | ||||||
Strategic Factor Allocation | 89,203,141 | 5,720,000 | 329,396,598 | |||||||||
| 58 | The accompanying notes are an integral part of these financial statements. |
GOLDMAN SACHS ALLOCATION FUNDS
Statements of Assets and Liabilities (continued)
August 31, 2021
| Strategic Volatility Premium Fund | Tactical Tilt Overlay Fund(a) | |||||||||
| Assets: | ||||||||||
Investments of unaffiliated issuers, at value (cost $0 and $1,893,034,530, respectively)(b) | $ | — | $ | 1,945,438,561 | ||||||
Investments of affiliated issuers, at value (cost $368,029,368 and $2,009,356,401, respectively) | 368,029,368 | 2,051,047,509 | ||||||||
Investments in securities lending reinvestment vehicle — affiliated issuer, at value, (cost $0 and $5,522,825, respectively) | — | 5,522,825 | ||||||||
Purchased options, at value (premium paid $178,629 and $24,800,590, respectively) | 56,260 | 14,999,931 | ||||||||
Cash | 6,316,335 | 67,546,641 | ||||||||
Foreign currencies, at value (cost $0 and $14,253,597, respectively) | — | 14,350,401 | ||||||||
Unrealized gain on swap contracts | — | 8,264,820 | ||||||||
Receivables: |
| |||||||||
Collateral on certain derivative contracts(c) | 46,558,289 | 37,230,717 | ||||||||
Fund shares sold | 2,135,000 | 12,415,724 | ||||||||
Due from broker | 98,827 | — | ||||||||
Deferred offering costs | 98,021 | — | ||||||||
Reimbursement from investment adviser | 48,861 | 4,112 | ||||||||
Dividends and interest | 15,861 | 649,057 | ||||||||
Securities lending income | — | 5,975 | ||||||||
Other assets | — | 72,892 | ||||||||
| Total assets | 423,356,822 | 4,157,549,165 | ||||||||
| Liabilities: | ||||||||||
Unrealized loss on swap contracts | — | 4,580,159 | ||||||||
Variation margin on futures contracts | 27,715 | 116,543 | ||||||||
Variation margin on swaps contracts | — | 13,760 | ||||||||
Written option contracts, at value (premium received $238,692 and $102,794,617, respectively) | 121,355 | 36,214,492 | ||||||||
Payables: |
| |||||||||
Management fees | 82,847 | 2,134,415 | ||||||||
Offering expense | 17,565 | — | ||||||||
Organization costs | 12,000 | — | ||||||||
Investments purchased | 11,695 | 8,850,831 | ||||||||
Transfer Agency fees | 9,140 | 102,675 | ||||||||
Fund shares redeemed | 7,325 | 665,718 | ||||||||
Payable upon return of securities loaned | — | 5,522,825 | ||||||||
Collateral on certain derivative contracts(d) | — | 1,250,000 | ||||||||
Accrued expenses | 148,029 | 618,656 | ||||||||
| Total liabilities | 437,671 | 60,070,074 | ||||||||
| Net Assets: | ||||||||||
Paid-in capital | 421,147,559 | 4,123,560,774 | ||||||||
Total distributable earnings (loss) | 1,771,592 | (26,081,683 | ) | |||||||
| NET ASSETS | $ | 422,919,151 | $ | 4,097,479,091 | ||||||
Net Assets: | ||||||||||
Institutional | $ | 349,554 | $ | 6,104,500 | ||||||
Class R6 | — | 1,054,147,223 | ||||||||
Class P | 422,569,597 | 3,037,227,368 | ||||||||
Total Net Assets | $ | 422,919,151 | $ | 4,097,479,091 | ||||||
Shares Outstanding $0.001 par value (unlimited number of shares authorized): | ||||||||||
Institutional | 34,621 | 572,638 | ||||||||
Class R6 | — | 102,085,741 | ||||||||
Class P | 41,855,456 | 294,114,590 | ||||||||
Net asset value, offering and redemption price per share: | ||||||||||
Institutional | $ | 10.10 | $ | 10.66 | ||||||
Class R6 | — | 10.33 | ||||||||
Class P | 10.10 | 10.33 | ||||||||
| (a) | Consolidated Statement of Assets and Liabilities for the Fund is consolidated and includes the balances of a wholly owned subsidiary, Cayman Commodity — TTIF, Ltd. Accordingly, all interfund balances and transactions have been eliminated. |
| (b) | Includes loaned securities having market value of $0 and $5,393,267, respectively. |
| (c) | Segregated for initial margin and/or collateral as follows: |
| Fund | Futures | Options | Swaps | |||||||||
Strategic Volatility Premium | $ | 1,493,976 | $ | 45,064,313 | $ | — | ||||||
Tactical Tilt Overlay | 8,810,717 | 3,210,000 | 25,210,000 | |||||||||
| (d) | Includes amount segregated for initial margin requirements and/or collateral on options. |
| The accompanying notes are an integral part of these financial statements. | 59 |
GOLDMAN SACHS ALLOCATION FUNDS
Statements of Operations
For the Fiscal Year Ended August 31, 2021
Global Managed Beta Fund | Strategic Factor Allocation Fund | |||||||||
| Investment income: |
| |||||||||
Dividends — unaffiliated issuers (net of foreign withholding taxes of $186,200 and $0, respectively.) | $ | 19,385,563 | $ | — | ||||||
Dividends — affiliated issuers | 10,939,977 | 384,184 | ||||||||
Securities lending income — unaffiliated issuers | 9,969 | — | ||||||||
| Total investment income | 30,335,509 | 384,184 | ||||||||
| Expenses: |
| |||||||||
Management fees | 5,670,669 | 14,306,515 | ||||||||
Transfer Agency fees(a) | 378,045 | 574,472 | ||||||||
Custody, accounting and administrative services | 259,762 | 201,800 | ||||||||
Professional fees | 137,800 | 126,599 | ||||||||
Printing and mailing costs | 41,504 | 47,777 | ||||||||
Registration fees | 34,528 | 52,085 | ||||||||
Trustee fees | 21,944 | 22,017 | ||||||||
Prime Broker Fees | 8,606 | 27,315 | ||||||||
Other | 46,121 | 46,970 | ||||||||
| Total expenses | 6,598,979 | 15,405,550 | ||||||||
Less — expense reductions | (2,795,610 | ) | (2,348,390 | ) | ||||||
| Net expenses | 3,803,369 | 13,057,160 | ||||||||
| NET INVESTMENT INCOME (LOSS) | 26,532,140 | (12,672,976 | ) | |||||||
| Realized and unrealized gain (loss): |
| |||||||||
Net realized gain (loss) from: | ||||||||||
Investments — unaffiliated issuers | 33,104,822 | 88 | ||||||||
Investment — affiliated issuers | (24,445 | ) | — | |||||||
Purchased options | 4,452,232 | (12,559,708 | ) | |||||||
Futures contracts | 96,704,779 | 258,494,521 | ||||||||
Written options | 10,472,575 | 62,917,486 | ||||||||
Swap contracts | 511,791 | — | ||||||||
Forward foreign currency exchange contracts | (13,054,134 | ) | 6,130,721 | |||||||
Foreign currency transactions | 5,456 | 964,133 | ||||||||
Net change in unrealized gain (loss) on: | ||||||||||
Investments — unaffiliated issuers | 222,560,886 | — | ||||||||
Investments — affiliated issuers | 133,195,001 | — | ||||||||
Purchased options | (8,578,122 | ) | (418,876 | ) | ||||||
Futures contracts | (11,702,298 | ) | (22,704,955 | ) | ||||||
Written options | 710,610 | 1,596,154 | ||||||||
Swap contracts | (11,718 | ) | — | |||||||
Forward foreign currency exchange contracts | 19,949,145 | (2,956,659 | ) | |||||||
Foreign currency translation | 37,904 | — | ||||||||
| Net realized and unrealized gain | 488,334,484 | 291,462,905 | ||||||||
| NET INCREASE IN NET ASSETS RESULTING FROM OPERATIONS | $ | 514,866,624 | $ | 278,789,929 | ||||||
| (a) | Class specific Transfer Agency fees were as follows: |
Fund | Institutional | Class R6 | Class P | |||||||||
Global Managed Beta | $ | 378,045 | $ | — | $ | — | ||||||
Strategic Factor Allocation | 1,675 | 4 | 572,793 | |||||||||
| 60 | The accompanying notes are an integral part of these financial statements. |
GOLDMAN SACHS ALLOCATION FUNDS
Statements of Operations (continued)
For the Fiscal Year Ended August 31, 2021
| Strategic Volatility Premium Fund(a) | Tactical Tilt Overlay Fund(b) | |||||||||
| Investment income: |
| |||||||||
Dividends — unaffiliated issuers | $ | — | $ | 5,539,385 | ||||||
Dividends — affiliated issuers | 15,512 | 9,680,384 | ||||||||
Interest — unaffiliated issuers | — | 5,421,359 | ||||||||
Securities lending income — unaffiliated issuers | — | 329,312 | ||||||||
| Total investment income | 15,512 | 20,970,440 | ||||||||
| Expenses: |
| |||||||||
Management fees | 380,163 | 27,142,405 | ||||||||
Professional fees | 91,020 | 212,250 | ||||||||
Amortization of offering costs | 72,348 | — | ||||||||
Custody, accounting and administrative services | 37,235 | 286,808 | ||||||||
Transfer Agency fees(c) | 22,821 | 1,046,026 | ||||||||
Printing and mailing costs | 17,017 | 58,675 | ||||||||
Organization costs | 12,000 | — | ||||||||
Trustee fees | 7,966 | 24,397 | ||||||||
Registration fees | — | 61,372 | ||||||||
Other | 8,000 | 54,268 | ||||||||
| Total expenses | 648,570 | 28,886,201 | ||||||||
Less — expense reductions | (367,680 | ) | (4,986,445 | ) | ||||||
| Net expenses | 280,890 | 23,899,756 | ||||||||
| NET INVESTMENT LOSS | (265,378 | ) | (2,929,316 | ) | ||||||
| Realized and unrealized gain (loss): |
| |||||||||
Net realized gain (loss) from: | ||||||||||
Investments — unaffiliated issuers | — | 44,016,432 | ||||||||
Investment — affiliated issuers | — | 10,906,205 | ||||||||
Purchased options | (302,896 | ) | 52,883,230 | |||||||
Futures contracts | (381,851 | ) | (47,161,754 | ) | ||||||
Written options | 2,121,888 | (4,263,715 | ) | |||||||
Swap contracts | — | 116,634,364 | ||||||||
Forward foreign currency exchange contracts | — | (3,561,482 | ) | |||||||
Foreign currency transactions | — | 1,700,671 | ||||||||
Net change in unrealized gain (loss) on: | ||||||||||
Investments — unaffiliated issuers | — | 51,155,250 | ||||||||
Investments — affiliated issuers | — | 38,461,039 | ||||||||
Purchased options | (122,369 | ) | (36,029,223 | ) | ||||||
Futures contracts | 588,148 | 6,385,064 | ||||||||
Written options | 117,337 | 85,701,122 | ||||||||
Swap contracts | — | (8,917,326 | ) | |||||||
Forward foreign currency exchange contracts | — | 1,745,724 | ||||||||
Foreign currency translation | — | (466,210 | ) | |||||||
| Net realized and unrealized gain | 2,020,257 | 309,189,391 | ||||||||
| NET INCREASE IN NET ASSETS RESULTING FROM OPERATIONS | $ | 1,754,879 | $ | 306,260,075 | ||||||
| (a) | Commenced operations on March 29, 2021. |
| (b) | Statement of Operations for the Fund is consolidated and includes the balances of a wholly owned subsidiary, Cayman Commodity — TTIF Ltd. Accordingly, all interfund balances and transactions have been eliminated. |
| (c) | Class specific Transfer Agency fees were as follows: |
Fund | Institutional | Class R6 | Class P | |||||||||
Strategic Volatility Premium | $ | 47 | $ | — | $ | 22,774 | ||||||
Tactical Tilt Overlay | 1,245 | 273,393 | 771,388 | |||||||||
| The accompanying notes are an integral part of these financial statements. | 61 |
GOLDMAN SACHS ALLOCATION FUNDS
Statements of Changes in Net Assets
| Global Managed Beta Fund | Strategic Factor Allocation Fund | |||||||||||||||||||||
| For the Fiscal Year Ended August 31, 2021 | For the Fiscal Year Ended August 31, 2020 | For the Fiscal Year Ended August 31, 2021 | For the Fiscal Year Ended August 31, 2020 | |||||||||||||||||||
| From operations: |
| |||||||||||||||||||||
Net investment income (loss) | $ | 26,532,140 | $ | 23,074,510 | $ | (12,672,976 | ) | $ | 2,409,683 | |||||||||||||
Net realized gain | 132,173,076 | 48,102,433 | 315,947,241 | 96,548,496 | ||||||||||||||||||
Net change in unrealized gain (loss) | 356,161,408 | 135,723,802 | (24,484,336 | ) | 55,906,543 | |||||||||||||||||
| Net increase in net assets resulting from operations | 514,866,624 | 206,900,745 | 278,789,929 | 154,864,722 | ||||||||||||||||||
| Distributions to shareholders: |
| |||||||||||||||||||||
From distributable earnings: | ||||||||||||||||||||||
Institutional Shares | (81,014,178 | ) | (47,547,059 | ) | (353,924 | ) | (106,078 | ) | ||||||||||||||
Class R6 Shares | — | — | (899 | ) | (289 | ) | ||||||||||||||||
Class P Shares | — | — | (125,892,465 | ) | (42,652,117 | ) | ||||||||||||||||
| Total distributions to shareholders | (81,014,178 | ) | (47,547,059 | ) | (126,247,288 | ) | (42,758,484 | ) | ||||||||||||||
| From share transactions: |
| |||||||||||||||||||||
Proceeds from sales of shares | 821,037,700 | 423,801,618 | 763,180,945 | 281,731,510 | ||||||||||||||||||
Reinvestment of distributions | 81,014,178 | 47,547,059 | 126,247,288 | 42,758,484 | ||||||||||||||||||
Cost of shares redeemed | (666,596,798 | ) | (188,792,678 | ) | (309,213,299 | ) | (388,930,874 | ) | ||||||||||||||
| Net increase (decrease) in net assets resulting from share transactions | 235,455,080 | 282,555,999 | 580,214,934 | (64,440,880 | ) | |||||||||||||||||
| TOTAL INCREASE | 669,307,526 | 441,909,685 | 732,757,575 | 47,665,358 | ||||||||||||||||||
| Net assets: |
| |||||||||||||||||||||
Beginning of year | 1,593,287,805 | 1,151,378,120 | 1,619,054,668 | 1,571,389,310 | ||||||||||||||||||
End of year | $ | 2,262,595,331 | $ | 1,593,287,805 | $ | 2,351,812,243 | $ | 1,619,054,668 | ||||||||||||||
| 62 | The accompanying notes are an integral part of these financial statements. |
GOLDMAN SACHS ALLOCATION FUNDS
Statements of Changes in Net Assets (continued)
| Strategic Volatility Premium Fund(a) | Tactical Tilt Overlay Fund(b) | |||||||||||||||||
For the Period Ended | For the Fiscal Year Ended August 31, 2021 | For the Fiscal Year Ended August 31, 2020 | ||||||||||||||||
| From operations: |
| |||||||||||||||||
Net investment income (loss) | $ | (265,378 | ) | $ | (2,929,316 | ) | $ | 26,187,988 | ||||||||||
Net realized gain (loss) | 1,437,141 | 171,153,951 | (16,125,503 | ) | ||||||||||||||
Net change in unrealized gain | 583,116 | 138,035,440 | 62,561,781 | |||||||||||||||
| Net increase in net assets resulting from operations | 1,754,879 | 306,260,075 | 72,624,266 | |||||||||||||||
| Distributions to shareholders: |
| |||||||||||||||||
From distributable earnings: | ||||||||||||||||||
Institutional Shares | — | (88,055 | ) | (88,497 | ) | |||||||||||||
Class R6 Shares | — | (41,354,663 | ) | (8,832,644 | ) | |||||||||||||
Class P Shares | — | (113,568,116 | ) | (33,423,852 | ) | |||||||||||||
| Total distributions to shareholders | — | (155,010,834 | ) | (42,344,993 | ) | |||||||||||||
| From share transactions: |
| |||||||||||||||||
Proceeds from sales of shares | 429,347,526 | 1,193,782,805 | 519,364,648 | |||||||||||||||
Reinvestment of distributions | — | 155,010,834 | 42,344,993 | |||||||||||||||
Cost of shares redeemed | (8,183,254 | ) | (431,948,453 | ) | (1,493,766,458 | ) | ||||||||||||
| Net increase (decrease) in net assets resulting from share transactions | 421,164,272 | 916,845,186 | (932,056,817 | ) | ||||||||||||||
| TOTAL INCREASE (DECREASE) | 422,919,151 | 1,068,094,427 | (901,777,544 | ) | ||||||||||||||
| Net assets: |
| |||||||||||||||||
Beginning of year | — | 3,029,384,664 | 3,931,162,208 | |||||||||||||||
End of year | $ | 422,919,151 | $ | 4,097,479,091 | $ | 3,029,384,664 | ||||||||||||
| (a) | Commenced operations on March 29, 2021. |
| (b) | Statement of Changes in Net Assets for the Fund is consolidated and includes the balances of a wholly owned subsidiary, Cayman Commodity — TTIF, Ltd. Accordingly, all interfund balances and transactions have been eliminated. |
| The accompanying notes are an integral part of these financial statements. | 63 |
GOLDMAN SACHS GLOBAL MANAGED BETA FUND
Selected Share Data for a Share Outstanding Throughout Each Period
| * | The Fund changed its fiscal year end from October 31 to August 31. |
| (a) | Calculated based on the average shares outstanding methodology. |
| (b) | Assumes investment at the NAV at the beginning of the period, reinvestment of all dividends and distributions, a complete redemption of the investment at the NAV at the end of the period and no sales or redemption charges (if any). Total returns would be reduced if a sales or redemption charge was taken into account. Returns do not reflect the impact of taxes to shareholders relating to Fund distributions or the redemption of Fund shares. Total returns for periods less than one full year are not annualized. |
| (c) | Expense ratios exclude the expenses of the Underlying Funds in which the Fund invests. |
| (d) | Annualized. |
| (e) | The Fund’s portfolio turnover rate is calculated in accordance with regulatory requirements, without regard to transactions involving short term investments and certain derivatives. If such transactions were included, the Fund’s portfolio turnover rate may be higher. |
| 64 | The accompanying notes are an integral part of these financial statements. |
GOLDMAN SACHS STRATEGIC FACTOR ALLOCATION FUND
Financial Highlights
Selected Share Data for a Share Outstanding Throughout Each Year
| (a) | Calculated based on the average shares outstanding methodology. |
| (b) | Amount is less than $0.005 per share. |
| (c) | Assumes investment at the NAV at the beginning of the year, reinvestment of all dividends and distributions, a complete redemption of the investment at the NAV at the end of the year and no sales or redemption charges (if any). Total returns would be reduced if a sales or redemption charge was taken into account. Returns do not reflect the impact of taxes to shareholders relating to Fund distributions or the redemption of Fund shares. |
| (d) | The Fund’s portfolio turnover rate is calculated in accordance with regulatory requirements, without regard to transactions involving short term investments and certain derivatives. If such transactions were included, the Fund’s portfolio turnover rate may be higher. |
| (e) | There were no long-term transactions for the year ended August 31, 2021 and August 31, 2020, respectively. |
| The accompanying notes are an integral part of these financial statements. | 65 |
GOLDMAN SACHS STRATEGIC FACTOR ALLOCATION FUND
Financial Highlights (continued)
Selected Share Data for a Share Outstanding Throughout Each Period
| Goldman Sachs Strategic Factor Allocation Fund | ||||||||||||||||||
| Class R6 Shares | ||||||||||||||||||
| Year Ended August 31, | Period Ended August 31, 2018(a) | |||||||||||||||||
| 2021 | 2020 | 2019 | ||||||||||||||||
| Per Share Data |
| |||||||||||||||||
Net asset value, beginning of period | $ | 11.87 | $ | 10.96 | $ | 11.26 | $ | 11.10 | ||||||||||
Net investment income (loss)(b) | (0.08 | ) | 0.02 | 0.12 | 0.04 | |||||||||||||
Net realized and unrealized gain | 1.75 | 1.19 | 0.28 | 0.12 | ||||||||||||||
Total from investment operations | 1.67 | 1.21 | 0.40 | 0.16 | ||||||||||||||
Distributions to shareholders from net investment income | — | (0.16 | ) | (0.09 | ) | — | ||||||||||||
Distributions to shareholders from net realized gains | (0.91 | ) | (0.14 | ) | (0.61 | ) | — | |||||||||||
Total distributions | (0.91 | ) | (0.30 | ) | (0.70 | ) | — | |||||||||||
Net asset value, end of period | $ | 12.63 | $ | 11.87 | $ | 10.96 | $ | 11.26 | ||||||||||
| Total return(c) | 15.08 | % | 11.12 | % | 4.14 | % | 1.44 | % | ||||||||||
Net assets, end of period (in 000s) | $ | 14 | $ | 12 | $ | 11 | $ | 10 | ||||||||||
Ratio of net expenses to average net assets | 0.66 | % | 0.66 | % | 0.68 | % | 0.69 | %(d) | ||||||||||
Ratio of total expenses to average net assets | 0.78 | % | 0.80 | % | 0.80 | % | 0.79 | %(d) | ||||||||||
Ratio of net investment income (loss) to average net assets | (0.64 | )% | 0.15 | % | 1.08 | % | 0.58 | %(d) | ||||||||||
Portfolio turnover rate(e) | — | %(f) | — | %(f) | 962 | % | 725 | % | ||||||||||
| (a) | Commenced operations on December 29, 2017. |
| (b) | Calculated based on the average shares outstanding methodology. |
| (c) | Assumes investment at the NAV at the beginning of the period, reinvestment of all distributions, a complete redemption of the investment at the NAV at the end of the period and no sales or redemption charges (if any). Total returns would be reduced if a sales or redemption charge was taken into account. Returns do not reflect the impact of taxes to shareholders relating to Fund distributions or the redemption of Fund shares. Total returns for periods less than one full year are not annualized. |
| (d) | Annualized. |
| (e) | The Fund’s portfolio turnover rate is calculated in accordance with regulatory requirements, without regard to transactions involving short term investments and certain derivatives. If such transactions were included, the Fund’s portfolio turnover rate may be higher. |
| (f) | There were no long-term transactions for the year ended August 31, 2021 and August 31, 2020, respectively. |
| 66 | The accompanying notes are an integral part of these financial statements. |
GOLDMAN SACHS STRATEGIC FACTOR ALLOCATION FUND
Financial Highlights (continued)
Selected Share Data for a Share Outstanding Throughout Each Period
| Goldman Sachs Strategic Factor Allocation Fund | ||||||||||||||||||
| Class P Shares | ||||||||||||||||||
| Year Ended August 31, | Period Ended August 31, 2018(a) | |||||||||||||||||
| 2021 | 2020 | 2019 | ||||||||||||||||
| Per Share Data |
| |||||||||||||||||
Net asset value, beginning of period | $ | 11.86 | $ | 10.96 | $ | 11.26 | $ | 10.83 | ||||||||||
Net investment income (loss)(b) | (0.08 | ) | 0.02 | 0.11 | 0.02 | |||||||||||||
Net realized and unrealized gain | 1.75 | 1.18 | 0.29 | 0.41 | ||||||||||||||
Total from investment operations | 1.67 | 1.20 | 0.40 | 0.43 | ||||||||||||||
Distributions to shareholders from net investment income | — | (0.16 | ) | (0.09 | ) | — | ||||||||||||
Distributions to shareholders from net realized gains | (0.91 | ) | (0.14 | ) | (0.61 | ) | — | |||||||||||
Total distributions | (0.91 | ) | (0.30 | ) | (0.70 | ) | — | |||||||||||
Net asset value, end of period | $ | 12.62 | $ | 11.86 | $ | 10.96 | $ | 11.26 | ||||||||||
| Total return(c) | 15.09 | % | 11.03 | % | 4.16 | % | 3.97 | % | ||||||||||
Net assets, end of period (in 000s) | $ | 2,347,839 | $ | 1,616,030 | $ | 1,565,955 | $ | 2,467,490 | ||||||||||
Ratio of net expenses to average net assets | 0.68 | % | 0.68 | % | 0.71 | % | 0.71 | %(d) | ||||||||||
Ratio of total expenses to average net assets | 0.81 | % | 0.82 | % | 0.82 | % | 0.80 | %(d) | ||||||||||
Ratio of net investment income (loss) to average net assets | (0.66 | )% | 0.15 | % | 1.07 | % | 0.40 | %(d) | ||||||||||
Portfolio turnover rate(e) | — | %(f) | — | %(f) | 962 | % | 725 | % | ||||||||||
| (a) | Commenced operations on April 17, 2018. |
| (b) | Calculated based on the average shares outstanding methodology. |
| (c) | Assumes investment at the NAV at the beginning of the period, reinvestment of all distributions, a complete redemption of the investment at the NAV at the end of the period and no sales or redemption charges (if any). Total returns would be reduced if a sales or redemption charge was taken into account. Returns do not reflect the impact of taxes to shareholders relating to Fund distributions or the redemption of Fund shares. Total returns for periods less than one full year are not annualized. |
| (d) | Annualized. |
| (e) | The Fund’s portfolio turnover rate is calculated in accordance with regulatory requirements, without regard to transactions involving short term investments and certain derivatives. If such transactions were included, the Fund’s portfolio turnover rate may be higher. |
| (f) | There were no long-term transactions for the year ended August 31, 2021 and August 31, 2020, respectively. |
| The accompanying notes are an integral part of these financial statements. | 67 |
GOLDMAN SACHS STRATEGIC VOLATILITY PREMIUM FUND
Financial Highlights
Selected Share Data for a Share Outstanding Throughout the Period
| (a) | Commenced operations on March 29, 2021. |
| (b) | Calculated based on the average shares outstanding methodology. |
| (c) | Assumes investment at the NAV at the beginning of the period, reinvestment of all dividends and distributions, a complete redemption of the investment at the NAV at the end of the period and no sales or redemption charges (if any). Total returns would be reduced if a sales or redemption charge was taken into account. Returns do not reflect the impact of taxes to shareholders relating to Fund distributions or the redemption of Fund shares. Total returns for periods less than one full year are not annualized. |
| (d) | Annualized. |
| (e) | The Fund’s portfolio turnover rate is calculated in accordance with regulatory requirements, without regard to transactions involving short term investments and certain derivatives. If such transactions were included, the Fund’s portfolio turnover rate may be higher. |
| (f) | There were no long-term transactions for the period ended August 31, 2021. |
| 68 | The accompanying notes are an integral part of these financial statements. |
GOLDMAN SACHS STRATEGIC VOLATILITY PREMIUM FUND
Financial Highlights (continued)
Selected Share Data for a Share Outstanding Throughout the Period
| Goldman Sachs Strategic Volatility Premium Fund | ||||||
| Class P Shares | ||||||
Period Ended August 31, 2021(a) | ||||||
| Per Share Data |
| |||||
Net asset value, beginning of period | $ | 10.00 | ||||
Net investment loss(b) | (0.01 | ) | ||||
Net realized and unrealized gain | 0.11 | |||||
Total from investment operations | 0.10 | |||||
Net asset value, end of period | $ | 10.10 | ||||
| Total return(c) | 1.00 | % | ||||
Net assets, end of period (in 000s) | $ | 422,570 | ||||
Ratio of net expenses to average net assets | 0.37 | %(d) | ||||
Ratio of total expenses to average net assets | 0.79 | %(d) | ||||
Ratio of net investment loss to average net assets | (0.35 | )%(d) | ||||
Portfolio turnover rate(e) | — | %(f) | ||||
| (a) | Commenced operations on March 29, 2021. |
| (b) | Calculated based on the average shares outstanding methodology. |
| (c) | Assumes investment at the NAV at the beginning of the period, reinvestment of all dividends and distributions, a complete redemption of the investment at the NAV at the end of the period and no sales or redemption charges (if any). Total returns would be reduced if a sales or redemption charge was taken into account. Returns do not reflect the impact of taxes to shareholders relating to Fund distributions or the redemption of Fund shares. Total returns for periods less than one full year are not annualized. |
| (d) | Annualized. |
| (e) | The Fund’s portfolio turnover rate is calculated in accordance with regulatory requirements, without regard to transactions involving short term investments and certain derivatives. If such transactions were included, the Fund’s portfolio turnover rate may be higher. |
| (f) | There were no long-term transactions for the period ended August 31, 2021. |
| The accompanying notes are an integral part of these financial statements. | 69 |
GOLDMAN SACHS TACTICAL TILT OVERLAY FUND
Consolidated Financial Highlights
Selected Share Data for a Share Outstanding Throughout Each Period
| * | The Fund changed its fiscal year end from October 31 to August 31. |
| (a) | Calculated based on the average shares outstanding methodology. |
| (b) | Assumes investment at the NAV at the beginning of the period, reinvestment of all dividends and distributions, a complete redemption of the investment at the NAV at the end of the period and no sales or redemption charges (if any). Total returns would be reduced if a sales or redemption charge was taken into account. Returns do not reflect the impact of taxes to shareholders relating to Fund distributions or the redemption of Fund shares. Total returns for periods less than one full year are not annualized. |
| (c) | Expense ratios exclude the expenses of the Underlying Funds in which the Fund invests. |
| (d) | Annualized. |
| (e) | The Fund’s portfolio turnover rate is calculated in accordance with regulatory requirements, without regard to transactions involving short term investments and certain derivatives. If such transactions were included, the Fund’s portfolio turnover rate may be higher. |
| 70 | The accompanying notes are an integral part of these financial statements. |
GOLDMAN SACHS TACTICAL TILT OVERLAY FUND
Consolidated Financial Highlights (continued)
Selected Share Data for a Share Outstanding Throughout Each Period
| Goldman Sachs Tactical Tilt Overlay Fund | ||||||||||||||||||
| Class R6 Shares | ||||||||||||||||||
| Year Ended August 31, | Period Ended August 31, 2018(a) | |||||||||||||||||
| 2021 | 2020 | 2019 | ||||||||||||||||
| Per Share Data |
| |||||||||||||||||
Net asset value, beginning of period | $ | 9.91 | $ | 9.67 | $ | 9.87 | $ | 9.81 | ||||||||||
Net investment income (loss)(b) | (0.01 | ) | 0.07 | 0.26 | 0.11 | |||||||||||||
Net realized and unrealized gain (loss) | 0.92 | 0.28 | (0.20 | ) | (0.05 | ) | ||||||||||||
Total from investment operations | 0.91 | 0.35 | 0.06 | 0.06 | ||||||||||||||
Distributions to shareholders from net investment income | (0.49 | ) | (0.11 | ) | (0.26 | ) | — | |||||||||||
Net asset value, end of period | $ | 10.33 | $ | 9.91 | $ | 9.67 | $ | 9.87 | ||||||||||
| Total return(c) | 9.48 | % | 3.80 | % | 0.58 | % | 0.61 | % | ||||||||||
Net assets, end of period (in 000s) | $ | 1,054,147 | $ | 736,643 | $ | 714,633 | $ | 343,370 | ||||||||||
Ratio of net expenses to average net assets(d) | 0.69 | % | 0.72 | % | 0.73 | % | 0.69 | %(e) | ||||||||||
Ratio of total expenses to average net assets(d) | 0.77 | % | 0.78 | % | 0.78 | % | 0.76 | %(e) | ||||||||||
Ratio of net investment income (loss) to average net assets | (0.09 | )% | 0.73 | % | 2.65 | % | 1.77 | %(e) | ||||||||||
Portfolio turnover rate(f) | 60 | % | 70 | % | 46 | % | 41 | % | ||||||||||
| (a) | Commenced operations on December 29, 2017. |
| (b) | Calculated based on the average shares outstanding methodology. |
| (c) | Assumes investment at the NAV at the beginning of the period, reinvestment of all dividends and distributions, a complete redemption of the investment at the NAV at the end of the period and no sales or redemption charges (if any). Total returns would be reduced if a sales or redemption charge was taken into account. Returns do not reflect the impact of taxes to shareholders relating to Fund distributions or the redemption of Fund shares. Total returns for periods less than one full year are not annualized. |
| (d) | Expense ratios exclude the expenses of the Underlying Funds in which the Fund invests. |
| (e) | Annualized. |
| (f) | The Fund’s portfolio turnover rate is calculated in accordance with regulatory requirements, without regard to transactions involving short term investments and certain derivatives. If such transactions were included, the Fund’s portfolio turnover rate may be higher. |
| The accompanying notes are an integral part of these financial statements. | 71 |
GOLDMAN SACHS TACTICAL TILT OVERLAY FUND
Consolidated Financial Highlights (continued)
Selected Share Data for a Share Outstanding Throughout Each Period
| Goldman Sachs Tactical Tilt Overlay Fund | ||||||||||||||||||
| Class P Shares | ||||||||||||||||||
| Year Ended August 31, | Period Ended October 31, 2018(a) | |||||||||||||||||
| 2021 | 2020 | 2019 | ||||||||||||||||
| Per Share Data |
| |||||||||||||||||
Net asset value, beginning of period | $ | 9.91 | $ | 9.66 | $ | 9.87 | $ | 9.76 | ||||||||||
Net investment income (loss)(b) | (0.01 | ) | 0.08 | 0.20 | 0.14 | |||||||||||||
Net realized and unrealized gain (loss) | 0.92 | 0.28 | (0.15 | ) | (0.03 | ) | ||||||||||||
Total from investment operations | 0.91 | 0.36 | 0.05 | 0.11 | ||||||||||||||
Distributions to shareholders from net investment income | (0.49 | ) | (0.11 | ) | (0.26 | ) | — | |||||||||||
Net asset value, end of period | $ | 10.33 | $ | 9.91 | $ | 9.66 | $ | 9.87 | ||||||||||
| Total return(c) | 9.47 | % | 3.79 | % | 0.59 | % | 1.13 | % | ||||||||||
Net assets, end of period (in 000s) | $ | 3,037,227 | $ | 2,291,061 | $ | 3,190,855 | $ | 4,045,246 | ||||||||||
Ratio of net expenses to average net assets(d) | 0.69 | % | 0.72 | % | 0.72 | % | 0.71 | %(e) | ||||||||||
Ratio of total expenses to average net assets(d) | 0.77 | % | 0.78 | % | 0.78 | % | 0.77 | %(e) | ||||||||||
Ratio of net investment income (loss) to average net assets | (0.08 | )% | 0.78 | % | 2.07 | % | 3.80 | %(e) | ||||||||||
Portfolio turnover rate(f) | 60 | % | 70 | % | 46 | % | 41 | % | ||||||||||
| (a) | Commenced operations on April 17, 2018. |
| (b) | Calculated based on the average shares outstanding methodology. |
| (c) | Assumes investment at the NAV at the beginning of the period, reinvestment of all dividends and distributions, a complete redemption of the investment at the NAV at the end of the period and no sales or redemption charges (if any). Total returns would be reduced if a sales or redemption charge was taken into account. Returns do not reflect the impact of taxes to shareholders relating to Fund distributions or the redemption of Fund shares. Total returns for periods less than one full year are not annualized. |
| (d) | Expense ratios exclude the expenses of the Underlying Funds in which the Fund invests. |
| (e) | Annualized. |
| (f) | The Fund’s portfolio turnover rate is calculated in accordance with regulatory requirements, without regard to transactions involving short term investments and certain derivatives. If such transactions were included, the Fund’s portfolio turnover rate may be higher. |
| 72 | The accompanying notes are an integral part of these financial statements. |
GOLDMAN SACHS ALLOCATION FUNDS
August 31, 2021
| 1. ORGANIZATION |
Goldman Sachs Trust (the “Trust”) is a Delaware statutory trust registered under the Investment Company Act of 1940, as amended (the “Act”), as an open-end management investment company. The following table lists those series of the Trust that are included in this report (collectively, the “Funds” or individually a “Fund”), along with their corresponding share classes and respective diversification status under the Act:
| Fund | Share Classes Offered | Diversified/ Non-diversified | ||
Global Managed Beta | Institutional | Diversified | ||
Strategic Factor Allocation | Institutional, R6 and P | Diversified | ||
Strategic Volatility Premium* | Institutional and P | Diversified | ||
Tactical Tilt Overlay | Institutional, R6 and P | Diversified |
| * | Commenced operations on March 29, 2021. |
Goldman Sachs Asset Management, L.P. (“GSAM”), an affiliate of Goldman Sachs & Co. LLC (“Goldman Sachs”), serves as investment adviser to each of the Global Managed Beta, Strategic Factor Allocation, Strategic Volatility Premium and Tactical Tilt Overlay Funds pursuant to management agreements (the “Agreement”) with the Trust.
| 2. SIGNIFICANT ACCOUNTING POLICIES |
The financial statements have been prepared in accordance with accounting principles generally accepted in the United States of America (“GAAP”) and require management to make estimates and assumptions that may affect the reported amounts and disclosures. Actual results may differ from those estimates and assumptions. Each Fund is an investment company under GAAP and follows the accounting and reporting guidance applicable to investment companies.
A. Basis of Consolidation for Goldman Sachs Tactical Tilt Overlay Fund — The Cayman Commodity – TTIF, LLC. (the “Subsidiary”), a Cayman Islands exempted company is currently a wholly-owned subsidiary of the Tactical Tilt Overlay Fund. The Subsidiary acts as an investment vehicle for the Fund to enable the Fund to gain exposure to certain types of commodity-linked derivative instruments. The Fund is the sole shareholder of the Subsidiary and it is intended that the Fund will remain the sole shareholder and will continue to control the Subsidiary. All inter-fund balances and transactions have been eliminated in consolidation. As of August 31, 2021, the Fund’s net assets were $4,097,479,091, of which, $485,315,332, or 11.8%, represented the Subsidiary’s net assets.
B. Investment Valuation — Each Fund’s valuation policies are to value investments at fair value.
C. Investment Income and Investments — Investment income includes interest income, dividend income and securities lending income, if any. Interest income is accrued daily and adjusted for amortization of premiums and accretion of discounts. Dividend income is recognized on ex-dividend date or, for certain foreign securities, as soon as such information is obtained subsequent to the ex-dividend date. Non-cash dividends, if any, are recorded at the fair market value of the securities received. Investment transactions are reflected on trade date. Realized gains and losses are calculated using identified cost. Investment transactions are recorded on the following business day for daily net asset value (“NAV”) calculations. Investment income is recorded net of any foreign withholding taxes, less any amounts reclaimable. The Funds may file withholding tax reclaims in certain jurisdictions to recover a portion of amounts previously withheld. For the Global Managed Beta Fund, these reclaims, if any, are recorded when the amount is known and there are no significant uncertainties on collectability. Such amounts recovered, if any, are reflected as other income in the Statement of Operations. Any foreign capital gains tax is accrued daily based upon net unrealized gains, and is payable upon sale of such investments. Distributions received from a Fund’s investments in U.S. real estate investment trusts (“REITs”) may be characterized as ordinary income, net capital gain and/or a return of capital. A return of capital is recorded by the Fund as a reduction to the cost basis of the REIT.
Distributions from master limited partnerships (“MLPs”) are generally recorded based on the characterization reported on the MLP’s tax return. A Fund records its pro-rata share of the income/loss and capital gains/losses, allocated from the underlying
73
GOLDMAN SACHS ALLOCATION FUNDS
Notes to Financial Statements (continued)
August 31, 2021
| 2. SIGNIFICANT ACCOUNTING POLICIES (continued) |
partnerships and adjusts the cost basis of the underlying partnerships accordingly. Income distributions are recognized as capital gains or income in the financial statements in accordance with the character that is distributed.
For derivative contracts, realized gains and losses are recorded upon settlement of the contract. Upfront payments, if any, are made or received upon entering into a swap agreement and are reflected in the Statements of Assets and Liabilities and Consolidated Statement of Assets and Liabilities. Upfront payments are recognized over the contract’s term/event as realized gains or losses, with the exception of forward starting swap contracts whose realized gains or losses are recognized from the effective start date. For securities with paydown provisions, principal payments received are treated as a proportionate reduction to the cost basis of the securities, and excess or shortfall amounts are recorded as income. For treasury inflation protected securities (“TIPS”), adjustments to principal due to inflation/deflation are reflected as increases/decreases to interest income with a corresponding adjustment to cost.
D. Class Allocations and Expenses for Tactical Tilt Overlay Fund, Strategic Factor Allocation Fund and Strategic Volatility Premium Fund — Investment income, realized and unrealized gain (loss), if any, and non-class specific expenses of each Fund are allocated daily based upon the proportion of net assets of each class. Non-class specific expenses directly incurred by a Fund are charged to that Fund, while such expenses incurred by the Trust are allocated across the applicable Fund on a straight-line and/or pro-rata basis depending upon the nature of the expenses. Class specific expenses, where applicable, are borne by the respective share classes and include Transfer Agency fees.
E. Expenses for Global Managed Beta Fund — Expenses incurred directly by the Fund are charged to the Fund, and certain expenses incurred by the Trust that may not solely relate to the Fund are allocated to the Fund and the other applicable funds of the Trust on a straight-line and/or pro-rata basis, depending upon the nature of the expenses, and are accrued daily.
F. Offering and Organization Costs — Offering costs paid in connection with the initial offering of shares of the Strategic Volatility Premium Fund are being amortized on a straight-line basis over 12 months from the date of commencement of operations. Organization costs paid in connection with the organization of the Strategic Volatility Premium Fund were expensed on the first day of operations.
G. Federal Taxes and Distributions to Shareholders — It is each Fund’s policy to comply with the requirements of the Internal Revenue Code of 1986, as amended (the “Code”), applicable to regulated investment companies and to distribute each year substantially all of its investment company taxable income and capital gains to its shareholders. Accordingly, each Fund is not required to make any provisions for the payment of federal income tax. Distributions to shareholders are recorded on the ex-dividend date. Income and capital gains distributions, if any, are declared and paid at least annually.
The Subsidiary is classified as a controlled foreign corporation under the Code. Therefore, the Tactical Tilt Overlay Fund is required to increase its taxable income by its share of the Subsidiary’s income. Net losses of the Subsidiary cannot be deducted by the Fund in the current period nor carried forward to offset taxable income in future periods.
Net capital losses, if any, are carried forward to future fiscal years and may be used to the extent allowed by the Code to offset any future capital gains. Losses that are carried forward will retain their character as either short-term or long-term capital losses. Utilization of capital loss carryforwards will reduce the requirement of future capital gains distributions.
The characterization of distributions to shareholders for financial reporting purposes is determined in accordance with federal income tax rules, which may differ from GAAP. The source of each Fund’s distributions may be shown in the accompanying financial statements as either from distributable earnings or capital. Certain components of the Fund’s net assets on the Statements of Assets and Liabilities and Consolidated Statement of Assets and Liabilities reflect permanent GAAP/tax differences based on the appropriate tax character.
H. Foreign Currency Translation — The accounting records and reporting currency of the Funds are maintained in U.S. dollars. Assets and liabilities denominated in foreign currencies are translated into U.S. dollars using the current exchange rates at the close of each business day. The effect of changes in foreign currency exchange rates on investments is included within net realized and unrealized gain (loss) on investments. Changes in the value of other assets and liabilities as a result of fluctuations in foreign exchange rates are included in the Statements of Operations and Consolidated Statement of Operations within net change in unrealized gain (loss) on foreign currency translation. Transactions denominated in foreign currencies are translated into U.S. dollars on the date the transaction occurred, the effects of which are included within net realized gain (loss) on foreign currency transactions.
74
GOLDMAN SACHS ALLOCATION FUNDS
| 3. INVESTMENTS AND FAIR VALUE MEASUREMENTS |
U.S. GAAP defines the fair value of a financial instrument as the amount that would be received to sell an asset or paid to transfer a liability in an orderly transaction between market participants at the measurement date (i.e., the exit price); the Funds’ policy is to use the market approach. GAAP establishes a fair value hierarchy that prioritizes the inputs to valuation techniques used to measure fair value. The hierarchy gives the highest priority to unadjusted quoted prices in active markets for identical assets or: liabilities (Level 1 measurements) and the lowest priority to unobservable inputs (Level 3 measurements). The level in the fair value hierarchy within which the fair value measurement in its entirety falls shall be determined based on the lowest level input that is significant to the fair value measurement in its entirety. The levels used for classifying investments are not necessarily an indication of the risk associated with investing in these investments. The three levels of the fair value hierarchy are described below:
Level 1 — Unadjusted quoted prices in active markets that are accessible at the measurement date for identical, unrestricted assets or liabilities;
Level 2 — Quoted prices in markets that are not active or financial instruments for which significant inputs are observable
(including, but not limited to, quoted prices for similar investments, interest rates, foreign exchange rates, volatility and credit spreads), either directly or indirectly;
Level 3 — Prices or valuations that require significant unobservable inputs (including GSAM’s assumptions in determining fair value measurement).
The Board of Trustees (“Trustees”) has approved Valuation Procedures that govern the valuation of the fund investments held by the Funds, including investments for which market quotations are not readily available. The Trustees have delegated to GSAM day-to-day responsibility for implementing and maintaining internal controls and procedures related to the valuation of the Funds’ investments. To assess the continuing appropriateness of pricing sources and methodologies, GSAM regularly performs price verification procedures and issues challenges as necessary to third party pricing vendors or brokers, and any differences are reviewed in accordance with the Valuation Procedures.
A. Level 1 and Level 2 Fair Value Investments — The valuation techniques and significant inputs used in determining the fair values for investments classified as Level 1 and Level 2 are as follows:
Equity Securities — Equity securities traded on a United States (“U.S.”) securities exchange or the NASDAQ system, or those located on certain foreign exchanges, including but not limited to the Americas, are valued daily at their last sale price or official closing price on the principal exchange or system on which they are traded. If there is no sale or official closing price or such price is believed by GSAM to not represent fair value, equity securities will be valued at the valid closing bid price for long positions and at the valid closing ask price for short positions (i.e. where there is sufficient volume, during normal exchange trading hours). If no valid bid/ask price is available, the equity security will be valued pursuant to the Valuation Procedures approved by the Trustees and consistent with applicable regulatory guidance. To the extent these investments are actively traded, they are classified as Level 1 of the fair value hierarchy, otherwise they are generally classified as Level 2. Certain equity securities containing unique attributes may be classified as Level 2.
Unlisted equity securities for which market quotations are available are valued at the last sale price on the valuation date, or if
no sale occurs, at the last bid price for long positions or the last ask price for short positions, and are generally classified as Level 2. Securities traded on certain foreign securities exchanges are valued daily at fair value determined by an independent fair value service (if available) under Fair Valuation Procedures approved by the Trustees and consistent with applicable regulatory guidance. The independent fair value service takes into account multiple factors including, but not limited to, movements in the securities markets, certain depositary receipts, futures contracts and foreign currency exchange rates that have occurred subsequent to the close of the foreign securities exchange. These investments are generally classified as Level 2 of the fair value hierarchy.
Underlying Funds (including Money Market Funds) — Underlying funds (“Underlying Funds”) include other investment companies and exchange-traded funds (“ETFs”). Investments in the Underlying Funds (except ETFs) are valued at the NAV per share on the day of valuation. ETFs are valued daily at the last sale price or official closing price on the principal exchange or system on which the investment is traded. Because the Funds invest in Underlying Funds that fluctuate in value, the Funds’ shares
75
GOLDMAN SACHS ALLOCATION FUNDS
Notes to Financial Statements (continued)
August 31, 2021
| 3. INVESTMENTS AND FAIR VALUE MEASUREMENTS (continued) |
will correspondingly fluctuate in value. Underlying funds are generally classified as Level 1 of the fair value hierarchy. To the extent that underlying ETFs are actively traded, they are classified as Level 1 of the fair value hierarchy, otherwise they are generally classified as Level 2. For information regarding an Underlying Fund’s accounting policies and investment holdings, please see the Underlying Fund’s shareholder report.
Debt Securities — Debt securities for which market quotations are readily available are valued daily on the basis of quotations supplied by dealers or an independent pricing service approved by the Trustees. The pricing services may use valuation models or matrix pricing, which consider: (i) yield or price with respect to bonds that are considered comparable in characteristics such as rating, interest rate and maturity date or (ii) quotations from securities dealers to determine current value. With the exception of treasury securities of G7 countries, which are generally classified as Level 1, these investments are generally classified as Level 2 of the fair value hierarchy.
i. Commercial Paper — Commercial paper normally represents short-term unsecured promissory notes issued in bearer form by banks or bank holding companies, corporations, finance companies and other issuers. Commercial paper consists of direct U.S. dollar-denominated obligations of domestic or foreign issuers. Asset-backed commercial paper is issued by a special purpose entity that is organized to issue the commercial paper and to purchase trade receivables or other financial assets.
Derivative Contracts — A derivative is an instrument whose value is derived from underlying assets, indices, reference rates or a combination of these factors. A Fund enters into derivative transactions to hedge against changes in interest rates, securities prices, and/or currency exchange rates, to increase total return, or to gain access to certain markets or attain exposure to other underliers. For financial reporting purposes, cash collateral that has been pledged to cover obligations of a Fund and cash collateral received, if any, is reported separately on the Statements of Assets and Liabilities and Consolidated Statement of Assets and Liabilities as receivables/payables for collateral on certain derivatives contracts. Non-cash collateral pledged by a Fund, if any, is noted in the Schedules and Consolidated Schedule of Investments.
Exchange-traded derivatives, including futures and options contracts, are generally valued at the last sale or settlement price on the exchange where they are principally traded. Exchange-traded options without settlement prices are generally valued at the midpoint of the bid and ask prices on the exchange where they are principally traded (or, in the absence of two-way trading, at the last bid price for long positions and the last ask price for short positions). Exchange-traded derivatives typically fall within Level 1 of the fair value hierarchy. Over-the-counter (“OTC”) and centrally cleared derivatives are valued using market transactions and other market evidence, including market-based inputs to models, calibration to market-clearing transactions, broker or dealer quotations, or other alternative pricing sources. Where models are used, the selection of a particular model to value OTC and centrally cleared derivatives depends upon the contractual terms of, and specific risks inherent in, the instrument, as well as the availability of pricing information in the market. Valuation models require a variety of inputs, including contractual terms, market prices, yield curves, credit curves, measures of volatility, voluntary and involuntary prepayment rates, loss severity rates and correlations of such inputs. For OTC and centrally cleared derivatives that trade in liquid markets, model inputs can generally be verified and model selection does not involve significant management judgment. OTC and centrally cleared derivatives are classified within Level 2 of the fair value hierarchy when significant inputs are corroborated by market evidence.
i. Forward Contracts — A forward contract is a contract between two parties to buy or sell an asset at a specified price on a future date. A forward contract settlement can occur on a cash or delivery basis. Forward contracts are marked-to-market daily using independent vendor prices, and the change in value, if any, is recorded as an unrealized gain or loss. Cash and certain investments may be used to collateralize forward contracts.
A forward foreign currency exchange contract is a forward contract in which a Fund agrees to receive or deliver a fixed quantity of one currency for another, at a pre-determined price at a future date. All forward foreign currency exchange contracts are marked to market daily by using the outright forward rates or interpolating based upon maturity dates, where available. Non-deliverable forward foreign currency exchange contracts are settled with the counterparty in cash without the delivery of foreign currency.
76
GOLDMAN SACHS ALLOCATION FUNDS
| 3. INVESTMENTS AND FAIR VALUE MEASUREMENTS (continued) |
ii. Futures Contracts — Futures contracts are contracts to buy or sell a standardized quantity of a specified commodity or security. Upon entering into a futures contract, a Fund deposits cash or securities in an account on behalf of the broker in an amount sufficient to meet the initial margin requirement. Subsequent payments are made or received by a Fund equal to the daily change in the contract value and are recorded as variation margin receivable or payable with a corresponding offset to unrealized gains or losses.
iii. Options — When a Fund writes call or put options, an amount equal to the premium received is recorded as a liability and is subsequently marked-to-market to reflect the current value of the option written. Swaptions are options on swap contracts.
Upon the purchase of a call option or a put option by a Fund, the premium paid is recorded as an investment and subsequently marked-to-market to reflect the current value of the option. Certain options may be purchased with premiums to be determined on a future date. The premiums for these options are based upon implied volatility parameters at specified terms.
iv. Swap Contracts — Bilateral swap contracts are agreements in which a Fund and a counterparty agree to exchange periodic payments on a specified notional amount or make a net payment upon termination. Bilateral swap transactions are privately negotiated in the OTC market and payments are settled through direct payments between a Fund and the counterparty. By contrast, certain swap transactions are subject to mandatory central clearing. These swaps are executed through a derivatives clearing member (“DCM”), acting in an agency capacity, and submitted to a central counterparty (“CCP”) (“centrally cleared swaps”), in which case all payments are settled with the CCP through the DCM. Swaps are marked-to-market daily using pricing vendor quotations, counterparty or clearinghouse prices or model prices, and the change in value, if any, is recorded as an unrealized gain or loss. Upon entering into a swap contract, a Fund is required to satisfy an initial margin requirement by delivering cash or securities to the counterparty (or in some cases, segregated in a triparty account on behalf of the counterparty), which can be adjusted by any mark-to-market gains or losses pursuant to bilateral or centrally cleared arrangements. For centrally cleared swaps the daily change in valuation, if any, is recorded as a receivable or payable for variation margin.
An interest rate swap is an agreement that obligates two parties to exchange a series of cash flows at specified intervals, based upon or calculated by reference to changes in interest rates on a specified notional principal amount. The payment flows are usually netted against each other, with the difference being paid by one party to the other.
A credit default swap is an agreement that involves one party (the buyer of protection) making a stream of payments to another party (the seller of protection) in exchange for the right to receive protection on a reference security or obligation, including a group of assets or exposure to the performance of an index. A Fund’s investment in credit default swaps may involve greater risks than if a Fund had invested in the referenced obligation directly. Credit events are contract specific but may include bankruptcy, failure to pay, restructuring and obligation acceleration. If a Fund buys protection through a credit default swap and no credit event occurs, its payments are limited to the periodic payments previously made to the counterparty. Upon the occurrence of a specified credit event, a Fund, as a buyer of credit protection, is entitled to receive an amount equal to the notional amount of the swap and deliver to the seller the defaulted reference obligation in a physically settled trade. A Fund may also receive a net settlement amount in the form of cash or securities equal to the notional amount of the swap reduced by the recovery value of the reference obligation in a cash settled trade.
As a seller of protection, a Fund generally receives a payment stream throughout the term of the swap, provided that there is no credit event. In addition, if a Fund sells protection through a credit default swap, a Fund could suffer a loss because the value of the referenced obligation and the premium payments received may be less than the notional amount of the swap paid to the buyer of protection. Upon the occurrence of a specified credit event, a Fund, as a seller of credit protection, may be required to take possession of the defaulted reference obligation and pay the buyer an amount equal to the notional amount of the swap in a physically settled trade. A Fund may also pay a net settlement amount in the form of cash or securities equal to the notional amount of the swap reduced by the recovery value of the reference obligation in a cash settled trade. Recovery values are at times established through the credit event auction process in which market participants are ensured that a transparent price has been set for the defaulted security or obligation. In addition, a Fund is entitled to a return of any assets, which have been pledged as collateral to the counterparty upon settlement.
77
GOLDMAN SACHS ALLOCATION FUNDS
Notes to Financial Statements (continued)
August 31, 2021
| 3. INVESTMENTS AND FAIR VALUE MEASUREMENTS (continued) |
The maximum potential amount of future payments (undiscounted) that a Fund as seller of protection could be required to make under a credit default swap would be an amount equal to the notional amount of the agreement. These potential amounts would be partially offset by any recovery values of the respective referenced obligations or net amounts received from a settlement of a credit default swap for the same reference security or obligation where the Fund bought credit protection.
A total return swap is an agreement that gives a Fund the right to receive or pay the appreciation or depreciation, as applicable, in the value of a specified security, an index, a basket of securities or indices or other instrument in return for a fee paid to the counterparty, which will typically be an agreed upon interest rate. If the underlying asset declines in value over the term of the swap, a Fund may also be required to pay the dollar value of that decline to the counterparty.
B. Level 3 Fair Value Investments — To the extent that significant inputs to valuation models and other alternative pricing sources are unobservable, or if quotations are not readily available, or if GSAM believes that such quotations do not accurately reflect fair value, the fair value of each Fund’s investments may be determined under Valuation Procedures approved by the Trustees. GSAM, consistent with its procedures and applicable regulatory guidance, may make an adjustment to the most recent valuation prices of either domestic or foreign securities in light of significant events to reflect what it believes to be the fair value of the securities at the time of determining a Fund’s NAV. To the extent investments are valued using single source broker quotations obtained directly from the broker or passed through from third party pricing vendors, such investments are classified as Level 3 investments.
C. Fair Value Hierarchy — The following is a summary of the Funds’ investments and derivatives classified in the fair value hierarchy as of August 31, 2021:
| GLOBAL MANAGED BETA | ||||||||||||
| Investment Type | Level 1 | Level 2 | Level 3 | |||||||||
| Assets | ||||||||||||
Common Stock and/or Other Equity Investments(a) | ||||||||||||
Africa | $ | 922 | $ | — | $ | — | ||||||
Asia | 636,694 | 17,871,667 | — | |||||||||
Australia and Oceania | 49,932 | 4,561,932 | — | |||||||||
Europe | 5,531,957 | 42,934,660 | — | |||||||||
North America | 161,071,479 | 27,902 | — | |||||||||
South America | — | 63,140 | — | |||||||||
Exchange Traded Funds | 1,749,974,524 | — | — | |||||||||
Investment Company | 191,755,643 | — | — | |||||||||
Securities Lending Reinvestment Vehicle | 961,050 | — | — | |||||||||
| Total | $ | 2,109,982,201 | $ | 65,459,301 | $ | — | ||||||
| Derivative Type | ||||||||||||
| Assets | ||||||||||||
Forward Foreign Currency Exchange Contracts(b) | $ | — | $ | 10,528,231 | $ | — | ||||||
Futures Contracts(b) | 10,301,556 | — | — | |||||||||
Purchased Option Contracts | 14,786,412 | — | — | |||||||||
| Total | $ | 25,087,968 | $ | 10,528,231 | $ | — | ||||||
| Liabilities | ||||||||||||
Forward Foreign Currency Exchange Contracts(b) | $ | — | $ | (1,295,232 | ) | $ | — | |||||
Futures Contracts(b) | (2,795,643 | ) | — | — | ||||||||
Total Return Swap Contracts(b) | — | (11,718 | ) | — | ||||||||
Written Option Contracts | (1,580,963 | ) | — | — | ||||||||
| Total | $ | (4,376,606 | ) | $ | (1,306,950 | ) | $ | — | ||||
| (a) | Amounts are disclosed by continent to highlight the impact of time zone differences between local market close and the calculation of net asset value. Security valuations are based on the principal exchange or system on which they are traded, which may differ from country of domicile. The Funds utilize fair value model prices provided by an independent fair value service for international equities, resulting in a Level 2 classification. |
| (b) | Amount shown represents unrealized gain (loss) at period end. |
78
GOLDMAN SACHS ALLOCATION FUNDS
| 3. INVESTMENTS AND FAIR VALUE MEASUREMENTS (continued) |
| STRATEGIC FACTOR ALLOCATION | ||||||||||||
| Investment Type | Level 1 | Level 2 | Level 3 | |||||||||
| Assets | ||||||||||||
Investment Company | $ | 1,729,160,031 | $ | — | $ | — | ||||||
| Derivative Type | ||||||||||||
| Assets | ||||||||||||
Forward Foreign Currency Exchange Contracts(a) | $ | — | $ | 1,286,459 | $ | — | ||||||
Futures Contracts(a) | 37,441,138 | — | — | |||||||||
Purchased Option Contracts | 310,481 | — | ||||||||||
| Total | $ | 37,751,619 | $ | 1,286,459 | $ | — | ||||||
| Liabilities | ||||||||||||
Forward Foreign Currency Exchange Contracts(a) | $ | — | $ | (1,714,993 | ) | $ | — | |||||
Futures Contracts(a) | (131,828 | ) | — | — | ||||||||
Written Option Contracts | (1,743,679 | ) | — | |||||||||
| Total | $ | (1,875,507 | ) | $ | (1,714,993 | ) | $ | — | ||||
| STRATEGIC VOLATILITY PREMIUM | ||||||||||||
| Investment Type | Level 1 | Level 2 | Level 3 | |||||||||
| Assets | ||||||||||||
Investment Company | $ | 368,029,368 | $ | — | $ | — | ||||||
| Derivative Type | ||||||||||||
| Assets | ||||||||||||
Futures Contracts(a) | $ | 588,148 | $ | — | $ | — | ||||||
Purchased Option Contracts | 56,260 | — | — | |||||||||
| Total | $ | 644,408 | $ | — | $ | — | ||||||
| Liabilities | ||||||||||||
Written Option Contracts | $ | (121,355 | ) | $ | — | $ | — | |||||
| (a) | Amount shown represents unrealized gain (loss) at period end. |
79
GOLDMAN SACHS ALLOCATION FUNDS
Notes to Financial Statements (continued)
August 31, 2021
| 3. INVESTMENTS AND FAIR VALUE MEASUREMENTS (continued) |
| TACTICAL TILT OVERLAY | ||||||||||||
| Investment Type | Level 1 | Level 2 | Level 3 | |||||||||
| Assets | ||||||||||||
Fixed Income | ||||||||||||
Corporate Obligations | $ | — | $ | 4,994,622 | $ | — | ||||||
U.S. Treasury Obligations | 93,988,651 | — | — | |||||||||
Exchange Traded Funds | 216,405,988 | — | — | |||||||||
Investment Companies | 2,051,047,509 | — | — | |||||||||
Short-term Investments | — | 1,630,049,300 | — | |||||||||
Securities Lending Reinvestment Vehicle | 5,522,825 | — | — | |||||||||
| Total | $ | 2,366,964,973 | $ | 1,635,043,922 | $ | — | ||||||
| Derivative Type | ||||||||||||
| Assets | ||||||||||||
Futures Contracts(a) | $ | 294,898 | $ | — | $ | — | ||||||
Total Return Swap Contracts(a) | — | 8,264,820 | — | |||||||||
Purchased Option Contracts | — | 14,999,931 | — | |||||||||
| Total | $ | 294,898 | $ | 23,264,751 | $ | — | ||||||
| Liabilities | ||||||||||||
Futures Contracts(a) | $ | (5,620,061 | ) | $ | — | $ | — | |||||
Total Return Swap Contracts(a) | — | (4,580,159 | ) | — | ||||||||
Written Option Contracts | — | (36,214,492 | ) | — | ||||||||
| Total | $ | (5,620,061 | ) | $ | (40,794,651 | ) | $ | — | ||||
| (a) | Amount shown represents unrealized gain (loss) at period end. |
For further information regarding security characteristics, see the Schedules and Consolidated Schedules of Investments.
| 4. INVESTMENTS IN DERIVATIVES |
The following tables set forth, by certain risk types, the gross value of derivative contracts (not considered to be hedging instruments for accounting disclosure purposes) as of August 31, 2021. These instruments were used as part of a Fund’s investment strategies and to obtain and/or manage exposure related to the risks below. The values in the tables below exclude the effects of
80
GOLDMAN SACHS ALLOCATION FUNDS
| 4. INVESTMENTS IN DERIVATIVES (continued) |
cash collateral received or posted pursuant to these derivative contracts, and therefore are not representative of a Fund’s net exposure.
| Global Managed Beta | ||||||||||||
| Risk | Statements of Assets and Liabilities | Assets | Statements of Assets and Liabilities | Liabilities | ||||||||
Equity | Variation margin on futures contracts | $ | 10,301,556 | (a) | Variation margin on futures contracts; Payable for unrealized loss on swap contracts; Written options, at value | $ | (4,388,324) | (a)(b) | ||||
Interest rate | Purchased options, at value | 14,786,412 | — | — | ||||||||
Currency | Receivable for unrealized gain on forward foreign currency exchange contracts | 10,528,231 | Payable for unrealized loss on forward foreign currency exchange contracts | (1,295,232) | ||||||||
| Total | $ | 35,616,199 | $ | (5,683,556) | ||||||||
| Strategic Factor Allocation | ||||||||||||
| Risk | Statements of Assets and Liabilities | Assets | Statements of Assets and Liabilities | Liabilities | ||||||||
Equity | Variation margin on futures contracts; Purchased options, at value | $ | 36,376,939 | (a) | Written options, at value | $ | (626,143) | |||||
Interest rate | Variation margin on futures contracts | 1,374,680 | (a) | Variation margin on futures contracts; Written options, at value | (1,249,364) | (a) | ||||||
Currency | Receivable for unrealized gain on forward foreign currency exchange contracts | 1,286,459 | Payable for unrealized loss on forward foreign currency exchange contracts | (1,714,993) | ||||||||
| Total | $ | 39,038,078 | $ | (3,590,500) | ||||||||
| Strategic Volatility Premium | ||||||||||||
| Risk | Statements of Assets and Liabilities | Assets | Statements of Assets and Liabilities | Liabilities | ||||||||
Equity | Variation margin on futures contracts; Purchased options, at value | $ | 83,538 | Written options, at value | $ | (121,355) | ||||||
Interest rate | Variation margin on futures contracts | 560,870 | (a) | — | — | |||||||
| Total | $ | 644,408 | $ | (121,355) | ||||||||
| (a) | Includes unrealized gain (loss) on futures contracts and centrally cleared swaps described in the Additional Investment Information sections of the Schedules of Investments. Only current day’s variation margin is reported within the Statements of Assets and Liabilities. |
| (b) | Aggregate of amounts include $11,718 for the Global Managed Beta Fund, which represents the payments to be made pursuant to bilateral agreements should counterparties exercise their “right to terminate” provisions based on, among others, the Fund’s performance, their failure to pay on their obligations or failure to pledge collateral. Such amount does not include incremental charges directly associated with the close-out of the agreements. It also does not reflect the fair value of any assets pledged as collateral which, through the daily margining process, substantially offsets the aforementioned amounts and for which the Fund is entitled to a full return. |
81
GOLDMAN SACHS ALLOCATION FUNDS
Notes to Financial Statements (continued)
August 31, 2021
| 4. INVESTMENTS IN DERIVATIVES (continued) |
| Tactical Tilt Overlay | ||||||||||||
| Risk | Consolidated Statement of Assets and Liabilities | Assets | Consolidated Statement of Assets and Liabilities | Liabilities | ||||||||
Equity | Variation margin on futures contracts; Receivable for unrealized gain on swap contracts; Purchased options, at value | $ | 18,767,272 | (a) | Variation margin on futures contracts; Payable for unrealized loss on swap contracts; Written options, at value | $ | (21,836,020) | (a)(b) | ||||
Interest rate | Variation margin on futures contracts; Purchased options, at value | 812,680 | (a) | Variation margin on futures contracts; Written options, at value | (24,578,692) | (a) | ||||||
Currency | Purchased options, at value | 3,979,697 | — | — | ||||||||
| Total | $ | 23,559,649 | $ | (46,414,712) | ||||||||
| (a) | Includes unrealized gain (loss) on futures contracts and centrally cleared swaps described in the Additional Investment Information sections of the Consolidated Schedule of Investments. Only current day’s variation margin is reported within the Consolidated Statement of Assets and Liabilities. |
| (b) | Aggregate of amounts include $4,580,159 for Tactical Tilt Overlay Fund which represents the payments to be made pursuant to bilateral agreements should counterparties exercise their “right to terminate” provisions based on, among others, the Fund’s performance, their failure to pay on their obligations or failure to pledge collateral. Such amount does not include incremental charges directly associated with the close-out of the agreements. It also does not reflect the fair value of any assets pledged as collateral which, through the daily margining process, substantially offsets the aforementioned amounts and for which the Fund is entitled to a full return. |
The following tables set forth, by certain risk types, each Fund’s gains (losses) related to these derivatives and their indicative volumes for the fiscal year ended August 31, 2021. These gains (losses) should be considered in the context that these derivative contracts may have been executed to create investment opportunities and/or economically hedge certain investments, and accordingly, certain gains (losses) on such derivative contracts may offset certain (losses) gains attributable to investments. These gains (losses) are included in “Net realized gain (loss)” or “Net change in unrealized gain (loss)” on the Statements and Consolidated Statement of Operations:
| Global Managed Beta | ||||||||||
| Risk | Statements of Operations | Net Realized Gain (Loss) | Net Change in Unrealized Gain (Loss) | |||||||
| Equity | Net realized gain (loss) from futures contracts, swap contracts and written options/Net change in unrealized gain (loss) on futures contracts, swap contracts and written options | $ | 102,910,665 | $(11,003,406) | ||||||
| Interest rate | Net realized gain (loss) from futures contracts and purchased options/Net change in unrealized gain (loss) on purchased options | | 9,230,712 | | (8,578,122 | ) | ||||
| Currency | Net realized gain (loss) from forward foreign currency exchange contracts/Net change in unrealized gain (loss) on forward foreign currency exchange contracts |
| (13,054,134 | ) | 19,949,145 | |||||
| Total | $ | 99,087,243 | $ 367,617 | |||||||
82
GOLDMAN SACHS ALLOCATION FUNDS
| 4. INVESTMENTS IN DERIVATIVES (continued) |
| Strategic Factor Allocation | ||||||||||
| Risk | Statement of Operations | Net Realized Gain (Loss) | Net Change in Unrealized Gain (Loss) | |||||||
| Equity | Net realized gain (loss) from futures contracts, purchased options and written options /Net change in unrealized gain (loss) on futures contracts, purchased options and written options | $ | 324,814,260 | $(25,520,477) | ||||||
| Interest rate | Net realized gain (loss) from futures contracts and written options /Net change in unrealized gain (loss) on futures contracts and written options | (15,961,961 | ) | 3,992,800 | ||||||
| Currency | Net realized gain (loss) from forward foreign currency exchange contracts /Net change in unrealized gain (loss) on forward foreign currency exchange contracts | 6,130,721 | (2,956,659) | |||||||
| Total | $ | 314,983,020 | $(24,484,336) | |||||||
| Strategic Volatility Premium | ||||||||||
| Risk | Statements of Operations | Net Realized Gain (Loss) | Net Change in Unrealized Gain (Loss) | |||||||
| Equity | Net realized gain (loss) from futures contracts, purchased options and written options/Net change in unrealized gain (loss) on futures contracts, purchased options and written options | $ | 1,606,294 | $ | 22,246 | |||||
| Interest rate | Net realized gain (loss) from futures contracts /Net change in unrealized gain (loss) on futures contracts | (169,153 | ) | 560,870 | ||||||
| Total | $ | 1,437,141 | $583,116 | |||||||
| Tactical Tilt Overlay | ||||||||||
| Risk | Consolidated Statement of Operations | Net Realized Gain (Loss) | Net Change in Unrealized Gain (Loss) | |||||||
| Equity | Net realized gain (loss) from futures contracts, swap contracts, purchased options and written options/Net change in unrealized gain (loss) on futures contracts, swap contracts, purchased options and written options | $ | 130,795,006 | $61,777,503 | ||||||
| Interest rate | Net realized gain (loss) from futures contracts, swap contracts, purchased options and written options /Net change in unrealized gain (loss) on futures contracts, purchased options and written options | 8,303,786 | (15,109,353) | |||||||
| Commodity | Net realized gain (loss) from futures contracts | (21,046,751 | ) | — | ||||||
| Currency | Net realized gain (loss) from forward foreign currency exchange contracts, purchased options and written options /Net change in unrealized gain (loss) on forward foreign currency exchange contracts, purchased options and written options | (3,521,398 | ) | 2,217,211 | ||||||
| Total | $ | 114,530,643 | $48,885,361 | |||||||
83
GOLDMAN SACHS ALLOCATION FUNDS
Notes to Financial Statements (continued)
August 31, 2021
| 4. INVESTMENTS IN DERIVATIVES (continued) |
For the year ended August 31, 2021, the relevant values for each derivative type was as follows:
| Average Number of Contracts, Notional Amounts, or Shares/Units(a) | ||||||||||||||||||||||||||||
| Fund | Futures contracts | Forward contracts | Swap Agreements | Purchased Options | Purchased Swaptions | Written Options | Written Swaptions | |||||||||||||||||||||
Global Managed Beta | 1,977 | $ | 385,009,309 | $ | 23,129,494 | 9,225,385 | $ | — | 49,365 | $ | — | |||||||||||||||||
Strategic Factor Allocation | 8,027 | 570,765,324 | — | 886,800 | — | 3,017,638 | — | |||||||||||||||||||||
Strategic Volatility Premium | 1,034 | — | — | 74,517 | — | 83,050 | — | |||||||||||||||||||||
Tactical Tilt Overlay | 8,690 | 116,616,462 | 494,796,068 | 218,612,732 | 182,987,500 | 38,536,214 | 294,997,500 | |||||||||||||||||||||
| (a) | Amounts disclosed represent average number of contracts for futures contracts, notional amounts for forward contracts, swap agreements, purchased and written swaptions, or shares/units outstanding for purchased options and written options, based on absolute values, which is indicative of volume for this derivative type, for the months that each Fund held such derivatives during the fiscal year ended August 31, 2021. |
In order to better define its contractual rights and to secure rights that will help a Fund mitigate its counterparty risk, a Fund may enter into an International Swaps and Derivatives Association, Inc. Master Agreement (“ISDA Master Agreement”) or similar agreement with its derivatives counterparties. An ISDA Master Agreement is a bilateral agreement between a Fund and a counterparty that governs OTC derivatives (including forward foreign currency exchange contracts, and certain options and swaps), and typically contains, among other things, collateral posting terms and netting provisions in the event of a default and/or termination event. The provisions of the ISDA Master Agreement typically permit a single net payment in the event of a default (close-out netting) or similar event, including the bankruptcy or insolvency of the counterparty.
Collateral and margin requirements differ between exchange traded derivatives and OTC derivatives. Margin requirements are
established by the broker or clearing house for exchange-traded and centrally cleared derivatives (financial futures contracts, options and centrally cleared swaps) pursuant to governing agreements for those instrument types. Brokers can ask for margin in excess of the minimum in certain circumstances. Collateral terms are contract-specific for OTC derivatives. For derivatives traded under an ISDA Master Agreement, the collateral requirements are typically calculated by netting the marked to market amount for each transaction under such agreement and comparing that amount to the value of any collateral currently pledged by a Fund and the counterparty. Additionally, a Fund may be required to post initial margin to the counterparty, the terms of which would be outlined in the confirmation of the OTC transaction.
Generally, the amount of collateral due from or to a counterparty must exceed a minimum transfer amount threshold before a transfer is required to be made. To the extent amounts due to a Fund from its counterparties are not fully collateralized, contractually or otherwise, a Fund bears the risk of loss from counterparty nonperformance. A Fund attempts to mitigate counterparty risk by only entering into agreements with counterparties that the Investment Adviser believes to be of good standing and by monitoring the financial stability of those counterparties.
Additionally, the netting of assets and liabilities and the offsetting of collateral pledged or received are based on contractual
netting/set-off provisions in the ISDA Master Agreement or similar agreements. However, in the event of a default or insolvency of a counterparty, a court could determine that such rights are not enforceable due to the restrictions or prohibitions against the right of setoff that may be imposed in accordance with a particular jurisdiction’s bankruptcy or insolvency laws.
84
GOLDMAN SACHS ALLOCATION FUNDS
| 4. INVESTMENTS IN DERIVATIVES (continued) |
The following table sets forth the Tactical Tilt Overlay Fund’s net exposure for derivative instruments that are subject to enforceable master netting arrangements or similar agreements as of August 31, 2021:
| Tactical Tilt Overlay Fund |
| |||||||||||||||||||||||||||||||||||
| Derivative Assets(1) | Derivative Liabilities(1) | Net Derivative | Collateral | Net | ||||||||||||||||||||||||||||||||
| Counterparty | Options Purchased | Swaps | Total | Options Written | Swaps | Total | ||||||||||||||||||||||||||||||
Barclays Bank PLC | $ | 742,926 | $ | 5,599,171 | $ | 6,342,097 | $ | (5,246,678 | ) | $ | (447,238 | ) | $ | (5,693,916 | ) | $ | 648,181 | $ | — | $ | 648,181 | |||||||||||||||
BNP Paribas SA | 1,442,910 | — | 1,442,910 | (513,551 | ) | — | (513,551 | ) | 929,359 | — | 929,359 | |||||||||||||||||||||||||
BofA Securities LLC | 2,040,156 | — | 2,040,156 | (13,800,294 | ) | — | (13,800,294 | ) | (11,760,138 | ) | 11,760,138 | — | ||||||||||||||||||||||||
Citibank NA | 3,150,988 | — | 3,150,988 | (1,140,375 | ) | — | (1,140,375 | ) | 2,010,613 | (1,250,000 | ) | 760,613 | ||||||||||||||||||||||||
J.P. Morgan Securities LLC | — | — | — | — | (4,132,921 | ) | (4,132,921 | ) | (4,132,921 | ) | 3,930,000 | (202,921 | ) | |||||||||||||||||||||||
MS & Co. Int. PLC | 7,622,951 | 2,665,649 | 10,288,600 | (15,513,594 | ) | — | (15,513,594 | ) | (5,224,994 | ) | 5,224,994 | — | ||||||||||||||||||||||||
Total | $ | 14,999,931 | $ | 8,264,820 | $ | 23,264,751 | $ | (36,214,492 | ) | $ | (4,580,159 | ) | $ | (40,794,651 | ) | $ | (17,529,900 | ) | $ | 19,665,132 | $ | 2,135,232 | ||||||||||||||
| (1) | Gross amounts available for offset but not netted in the Consolidated Statement of Assets and Liabilities. |
| (2) | Net amount represents the net amount due (to) from counterparty in the event of a default based on the contractual set-off rights under the agreement. Net amount excludes any over-collateralized amounts. |
| 5. AGREEMENTS AND AFFILIATED TRANSACTIONS |
A. Management Agreement — Under the Agreement, GSAM manages each Fund subject to the general supervision of the Trustees.
As compensation for the services rendered pursuant to the Agreement, the assumption of the expenses related thereto and administration of the Funds’ business affairs, including providing facilities, GSAM is entitled to a management fee, accrued daily and paid monthly, equal to an annual percentage rate of the Funds’ average daily net assets.
For the fiscal year ended August 31, 2021, contractual and effective net management fees with GSAM were at the following rates:
| Contractual Management Rate | Effective Net Management Fee Rate*^ | |||||||||||||||||||||||||
| Fund | First $2 billion | Next $3 billion | Next $3 billion | Over $8 billion | Effective Rate | |||||||||||||||||||||
Global Managed Beta | 0.30 | % | 0.30 | % | 0.30 | % | 0.30 | % | 0.30 | % | 0.15 | % | ||||||||||||||
Strategic Factor Allocation | 0.75 | % | 0.68 | % | 0.64 | % | 0.62 | % | 0.75 | % | 0.63 | % | ||||||||||||||
Strategic Volatility Premium | 0.50 | % | 0.45 | % | 0.43 | % | 0.42 | % | 0.50 | % | 0.28 | % | ||||||||||||||
Tactical Tilt Overlay | 0.75 | % | 0.68 | % | 0.64 | % | 0.62 | % | 0.72 | % | 0.64 | %(a) | ||||||||||||||
| * | GSAM has agreed to waive a portion of its management fee payable by the Fund in an amount equal to any management fee it earns as an investment adviser to any of the affiliated funds in which the Fund invests through at least December 29, 2021 (with respect to the Strategic Volatility Premium Fund, through at least March 28, 2022). Prior to such date GSAM may not terminate the arrangement without the approval of the Trustees. |
| ^ | Effective Net Management Rate includes the impact of management fee waivers of affiliated underlying funds, if any. |
| (a) | Reflects combined management fees paid to GSAM under the Agreement and the Subsidiary Agreement (as defined below) after waivers. |
GSAM has agreed to waive a portion of its management fee in order to achieve an effective net management fee rate of 0.40% as an annual percentage rate of the Strategic Volatility Premium Fund’s average daily net assets. This arrangement will remain in effect at least through March 28, 2022.
The Funds invest in Institutional Shares of the Goldman Sachs Financial Square Government Fund (“Government Money Market Fund”). The Tactical Tilt Overlay Fund invests in each of the Goldman Sachs Energy Infrastructure Fund, Goldman Sachs
85
GOLDMAN SACHS ALLOCATION FUNDS
Notes to Financial Statements (continued)
August 31, 2021
| 5. AGREEMENTS AND AFFILIATED TRANSACTIONS (continued) |
High Yield Floating Rate Fund and the Goldman Sachs MLP Energy Infrastructure Fund, and the Global Managed Beta Fund invests in each of the Goldman Sachs ActiveBeta Emerging Markets Equity ETF, Goldman Sachs MarketBeta International Equity ETF and the Goldman Sachs MarketBeta US Equity ETF, which are affiliated Underlying Funds. GSAM has agreed to waive a portion of its management fee payable by the Funds in an amount equal to the management fee it earns as an investment adviser to the affiliated Underlying Funds in which the Funds invest, except those management fees it earns from the Funds’ investment of cash collateral received in connection with securities lending transactions in the Government Money Market Fund. For the fiscal year ended August 31, 2021, GSAM waived $1,190,473, $2,348,390, $94,723 and $2,017,081 of the Global Managed Beta, Strategic Factor Allocation, Strategic Volatility Premium and Tactical Tilt Overlay Funds’ management fees, respectively.
GSAM had previously agreed to waive all management fees payable by the Global Managed Beta Fund, except those management fees it earns from the Fund’s investment of cash collateral received in connection with securities lending transactions in the Government Money Market Fund. This arrangement terminated on December 29, 2020. For the fiscal year ended August 31, 2021, GSAM waived $1,605,136 of the Global Managed Beta Fund’s management fees.
GSAM also provides management services to the Tactical Tilt Overlay Fund’s Subsidiary pursuant to a Subsidiary Management Agreement (the “Subsidiary Agreement”) and is entitled to a management fee accrued daily and paid monthly, equal to an annual percentage rate of 0.42% of the Subsidiary’s average daily net assets. In consideration of the Subsidiary’s management fee, and for as long as the Subsidiary Agreement remains in effect, GSAM has contractually agreed to waive irrevocably a portion of the Tactical Tilt Overlay Fund’s management fee in an amount equal to the management fee accrued and paid to GSAM by the Subsidiary under the Subsidiary Agreement. For the fiscal year ended August 31, 2021, GSAM waived $2,905,822 of the Tactical Tilt Overlay Fund’s management fee.
B. Transfer Agency Agreement — Goldman Sachs also serves as the transfer agent of the Funds for a fee pursuant to the Transfer Agency Agreement. The fees charged for such transfer agency services are accrued daily and paid monthly at annual rates of 0.04% of the average daily net assets of Institutional Shares for the Tactical Tilt Overlay Fund, Strategic Factor Allocation Fund and Strategic Volatility Premium Fund, 0.02% of the average daily net assets of Institutional Shares for the Global Managed Beta Fund and 0.03% of the average daily net assets of Class R6 Shares and Class P Shares for the Tactical Tilt Overlay Fund and Strategic Factor Allocation Fund and 0.03% of the average daily net assets of Class P Shares for the Strategic Volatility Premium Fund.
C. Other Expense Agreements and Affiliated Transactions — GSAM has agreed to reduce or limit certain “Other Expenses” of the Funds (excluding acquired fund fees and expenses, transfer agency fees and expenses, service fees and shareholder administration fees (as applicable), taxes, interest, brokerage fees, expenses of shareholder meetings, litigation and indemnification, and extraordinary expenses) to the extent such expenses exceed, on an annual basis, a percentage rate of the average daily net assets of the Funds. Such Other Expense reimbursements, if any, are accrued daily and paid monthly. In addition, the Funds are not obligated to reimburse GSAM for prior fiscal year expense reimbursements, if any. The Other Expense limitations as an annual percentage rate of average daily net assets for the Global Managed Beta, Strategic Factor Allocation, Strategic Volatility Premium and Tactical Tilt Overlay Funds are 0.204%, 0.164%, 0.064% and 0.164%, respectively. These Other Expense limitations will remain in place through at least December 29, 2021 for the Global Managed Beta, Strategic Factor Allocation and Tactical Tilt Overlay Funds, and through at least March 28, 2022 for the Strategic Volatility Premium Fund, and prior to such date GSAM may not terminate the arrangement without the approval of the Trustees. In addition, the Funds have entered into certain offset arrangements with the transfer agent, which may result in a reduction of the Funds expenses and are received irrespective of the application of the “Other Expense” limitations described above.
86
GOLDMAN SACHS ALLOCATION FUNDS
| 5. AGREEMENTS AND AFFILIATED TRANSACTIONS (continued) |
For the fiscal year ended August 31, 2021, these expense reductions, including any fee waivers and Other Expense reimbursements, were as follows:
| Fund | Management Fee Waiver | Other Expense Reimbursements | Total Expense Reductions | |||||||||||
Global Managed Beta | $ | 2,795,610 | $ | — | $ | 2,795,610 | ||||||||
Strategic Factor Allocation | 2,348,390 | — | 2,348,390 | |||||||||||
Strategic Volatility Premium | 170,755 | 196,925 | 367,680 | |||||||||||
Tactical Tilt Overlay | 4,922,904 | 63,541 | 4,986,445 | |||||||||||
D. Line of Credit Facility — As of August 31, 2021, the Funds participated in a $1,000,000,000 committed, unsecured revolving line of credit facility (the “facility”) together with other funds of the Trust and certain registered investment companies having management agreements with GSAM or its affiliates. This facility is to be used for temporary emergency purposes, or to allow for an orderly liquidation of securities to meet redemption requests. The interest rate on borrowings is based on the federal funds rate. The facility also requires a fee to be paid by the Funds based on the amount of the commitment that has not been utilized. For the fiscal year ended August 31, 2021, the Funds did not have any borrowings under the facility. Prior to April 26, 2021, the facility was $700,000,000.
E. Other Transactions with Affiliates — For the fiscal year ended August 31, 2021, Goldman Sachs earned $51,589, in brokerage commissions from fund transactions, including futures transactions executed with Goldman Sachs as the Futures Commission Merchant, on behalf of the Tactical Tilt Overlay Fund.
As of August 31, 2021, the following Portfolio was the beneficial owner of 5% or more of total outstanding shares of the following Fund:
| Portfolio | Goldman Sachs Tactical Tilt | |||||
Goldman Sachs Tax-Advantaged Global Equity Portfolio | 9 | % | ||||
As of August 31, 2021, The Goldman Sachs Group, Inc. was the beneficial owner of 5% or more of total outstanding shares of the following Funds:
| Fund | Institutional | Class R6 | ||||||||
Strategic Factor Allocation | — | % | 100 | % | ||||||
Strategic Volatility Premium | 14 | — | ||||||||
87
GOLDMAN SACHS ALLOCATION FUNDS
Notes to Financial Statements (continued)
August 31, 2021
| 5. AGREEMENTS AND AFFILIATED TRANSACTIONS (continued) |
The table below shows the transactions in and earnings from investments in the Underlying Funds for the fiscal year ended August 31, 2021:
| Global Managed Beta |
| |||||||||||||||||||||||||||||||
| Underlying Funds | Beginning Value as of August 31, 2020 | Purchases at Cost | Proceeds from Sales | Net Realized Gain/(Loss) | Change in Unrealized Gain/(Loss) | Ending Value as of August 31, 2021 | Shares as of August 31, 2021 | Dividend Income | ||||||||||||||||||||||||
Goldman Sachs ActiveBeta Emerging Markets Equity ETF | $ | 19,128,445 | $ | 6,730,268 | $ | — | $ | — | $ | 3,505,335 | $ | 29,364,048 | 749,848 | $ | 399,209 | |||||||||||||||||
Goldman Sachs Financial Square Government Fund — Institutional Shares | 122,254,978 | 922,278,588 | (852,777,923 | ) | — | — | 191,755,643 | 191,755,643 | 37,229 | |||||||||||||||||||||||
Goldman Sachs MarketBeta International Equity ETF | 240,516,709 | 35,928,660 | (15,072,253 | ) | (24,445 | ) | 55,359,407 | 316,708,078 | 5,479,625 | 6,653,480 | ||||||||||||||||||||||
Goldman Sachs MarketBeta U.S. Equity ETF | 251,351,804 | — | — | — | 74,330,259 | 325,682,063 | 5,162,182 | 3,850,059 | ||||||||||||||||||||||||
Total | $ | 633,251,936 | $ | 964,937,516 | $(867,850,176) | $ | (24,445 | ) | $ | 133,195,001 | $ | 863,509,832 | $ | 10,939,977 | ||||||||||||||||||
| Strategic Factor Allocation |
| |||||||||||||||||||||||
Underlying Funds | Beginning Value as of August 31, 2020 | Purchases at Cost | Proceeds from Sales | Ending Value as of August 31, 2021 | Shares as of August 31, 2021 | Dividend Income | ||||||||||||||||||
Goldman Sachs Financial Square Government Fund — Institutional Shares | $ | 1,268,839,085 | $ | 5,719,983,165 | $ | (5,259,662,219 | ) | $ | 1,729,160,031 | 1,729,160,031 | $ | 384,184 | ||||||||||||
| Strategic Volatility Premium |
| |||||||||||||||||||||||
| Underlying Funds | Beginning Value as of March 29, 2021* | Purchases at Cost | Proceeds from Sales | Ending Value as of August 31, 2021 | Shares as of August 31, 2021 | Dividend Income | ||||||||||||||||||
Goldman Sachs Financial Square Government Fund — Institutional Shares | $ | — | $ | 585,153,668 | $ | (217,124,300 | ) | $ | 368,029,368 | 368,029,368 | $ | 15,512 | ||||||||||||
| * | The Fund commenced operations on March 29, 2021. |
88
GOLDMAN SACHS ALLOCATION FUNDS
| 5. AGREEMENTS AND AFFILIATED TRANSACTIONS (continued) |
| Tactical Tilt Overlay |
| |||||||||||||||||||||||||||||||
| Underlying Funds | Beginning Value as of August 31, 2020 | Purchases at Cost | Proceeds from Sales | Net Realized Gain/(Loss) | Change in Unrealized Appreciation/ Depreciation | Ending Value as of August 31, 2021 | Shares as of August 31, 2021 | Dividend Income | ||||||||||||||||||||||||
Goldman Sachs Financial Square Government Fund — Institutional Shares | $ | 984,873,567 | $ | 3,027,519,435 | $ | (2,161,658,194 | ) | $ | — | $ | — | $ | 1,850,734,808 | 1,850,734,808 | $ | 345,100 | ||||||||||||||||
Goldman Sachs High Yield Floating Rate Fund — Class R6 | — | 103,813,054 | — | — | 1,091,464 | 104,904,518 | 11,207,748 | 2,536,161 | ||||||||||||||||||||||||
Goldman Sachs MLP Energy Infrastructure Fund — Class R6 | 49,912,135 | 3,203,828 | (58,900,000 | ) | 7,094,966 | 17,763,527 | 19,074,456 | 825,734 | 3,203,829 | |||||||||||||||||||||||
Goldman Sachs Energy Infrastructure Fund — Class R6 | 53,372,145 | 21,544,295 | (22,000,000 | ) | 3,811,239 | 19,606,048 | 76,333,727 | 8,216,763 | 3,595,294 | |||||||||||||||||||||||
Total | $ | 1,088,157,847 | $ | 3,156,080,612 | $ | (2,242,558,194 | ) | $ | 10,906,205 | 38,461,039 | $ | 2,051,047,509 | $ | 9,680,384 | ||||||||||||||||||
| 6. PORTFOLIO SECURITIES TRANSACTIONS |
The cost of purchases and proceeds from sales and maturities of long-term securities for the fiscal year ended August 31, 2021, were as follows:
| Fund | Purchases | Sales and Maturities | ||||||||
Global Managed Beta | $ | 659,493,220 | $ | 483,287,993 | ||||||
Tactical Tilt Overlay | 310,539,089 | 244,666,831 | ||||||||
For the fiscal year ended August 31, 2021, there were no purchases and proceeds from sales and maturities of long-term securities for the Strategic Factor Allocation and Strategic Volatility Premium Funds.
| 7. SECURITIES LENDING |
The Global Managed Beta Fund and Tactical Tilt Overlay Fund may lend their securities through a securities lending agent, the Bank of New York Mellon (“BNYM”), to certain qualified borrowers. In accordance with the Funds’ securities lending procedures, the Funds receive cash collateral at least equal to the market value of the securities on loan. The market value of the loaned securities is determined at the close of business of the Funds, at their last sale price or official closing price on the principal exchange or system on which they are traded, and any additional required collateral is delivered to the Funds on the next business day. As with other extensions of credit, the Funds may experience delay in the recovery of its securities or incur a loss should the borrower of the securities breach its agreement with the Funds or become insolvent at a time when the collateral is insufficient to cover the cost of repurchasing securities on loan. Dividend income received from securities on loan may not be subject to withholding taxes and therefore withholding taxes paid may differ from the amounts listed in the Statement and/or Consolidated Statement of Operations. Loans of securities are terminable at any time and as such 1) the remaining contractual maturities of the outstanding securities lending transactions are considered to be overnight and continuous and 2) the borrower, after notice, is required to return borrowed securities within the standard time period for settlement of securities transactions.
89
GOLDMAN SACHS ALLOCATION FUNDS
Notes to Financial Statements (continued)
August 31, 2021
| 7. SECURITIES LENDING (continued) |
The Funds invest the cash collateral received in connection with securities lending transactions in the Government Money Market Fund, an affiliated series of the Goldman Sachs Trust. The Government Money Market Fund is registered under the Act as an open end investment company, is subject to Rule 2a-7 under the Act, and is managed by GSAM, for which GSAM may receive a management fee of up to 0.16% on an annualized basis of the average daily net assets of the Government Money Market Fund.
In the event of a default by a borrower with respect to any loan, BNYM may exercise any and all remedies provided under the applicable borrower agreement to make the Funds whole. These remedies include purchasing replacement securities by applying the collateral held from the defaulting broker against the purchase cost of the replacement securities. If BNYM is unable to purchase replacement securities, BNYM will indemnify the Funds by paying the Funds an amount equal to the market value of the securities loaned minus the value of cash collateral received from the borrower for the loan, subject to an exclusion for any shortfalls resulting from a loss of value in such cash collateral due to reinvestment risk. The Funds’ master netting agreements with certain borrowers provide the right, in the event of a default (including bankruptcy or insolvency), for the non-defaulting party to liquidate the collateral and calculate net exposure to the defaulting party or request additional collateral. However, in the event of a default by a borrower, a resolution authority could determine that such rights are not enforceable due to the restrictions or prohibitions against the right of set-off that may be imposed in accordance with a particular jurisdiction’s bankruptcy or insolvency laws. The Funds’ loaned securities were all subject to enforceable Securities Lending Agreements and the value of the collateral was at least equal to the value of the cash received. The amounts of the Funds’ overnight and continuous agreements, which represent the gross amounts of recognized liabilities for securities lending transactions outstanding as of August 31, 2021, are disclosed as “Payable upon return of securities loaned” on the Statement and Consolidated Statement of Assets and Liabilities, where applicable.
Both the Funds and BNYM received compensation relating to the lending of the Funds’ securities. The amounts earned, if any, by the Fund’s for the fiscal year ended August 31, 2021, are reported under Investment Income on the Statement and Consolidated Statement of Operations.
The following table provides information about the Funds’ investment in the Government Money Market Fund for the fiscal year ended August 31, 2021.
| Fund | Beginning Value as of August 31, 2020 | Purchases at Cost | Proceeds from Sales | Ending Value as of | ||||||||||||||
Global Managed Beta | $ | — | $ | 291,211,465 | $ | (290,250,415 | ) | $ | 961,050 | |||||||||
Tactical Tilt Overlay | $ | 28,879,834 | 913,297,898 | (936,654,907 | ) | 5,522,825 | ||||||||||||
| 8. TAX INFORMATION |
The tax character of distributions paid during the fiscal year ended August 31, 2021 was as follows:
| Global Managed Beta | Strategic Factor Allocation | Strategic Volatility Premium | Tactical Tilt Overlay | |||||||||||||||
Distribution paid from: | ||||||||||||||||||
Ordinary income | $ | 51,809,640 | $ | 39,852,191 | $ | — | $ | 155,010,834 | ||||||||||
Net long-term capital gains | 29,204,538 | 86,395,097 | — | — | ||||||||||||||
Total taxable distributions | $ | 81,014,178 | $ | 126,247,288 | $ | — | $ | 155,010,834 | ||||||||||
90
GOLDMAN SACHS ALLOCATION FUNDS
| 8. TAX INFORMATION (continued) |
The tax character of distributions paid during the fiscal year ended August 31, 2020 was as follows:
| Global Managed Beta | Strategic Factor Allocation | Tactical Tilt Overlay | ||||||||||||
Distributions paid from: | ||||||||||||||
Ordinary income | $ | 38,921,480 | $ | 36,505,463 | $ | 42,344,993 | ||||||||
Net long-term capital gains | 8,625,579 | 6,253,021 | — | |||||||||||
Total taxable distributions | $ | 47,547,059 | $ | 42,758,484 | $ | 42,344,993 | ||||||||
As of August 31, 2021, the components of accumulated earnings (losses) on a tax basis were as follows:
| Global Managed Beta | Strategic Factor Allocation | Strategic Volatility Premium | Tactical Tilt Overlay | |||||||||||||
| Undistributed ordinary income — net | $ | 86,576,786 | $ | 106,376,414 | $ | 559,438 | $ | 81,285,629 | ||||||||
Undistributed long-term capital gains | 60,808,183 | 172,400,414 | 1,212,154 | — | ||||||||||||
Total undistributed earnings | $ | 147,384,969 | $ | 278,776,828 | $ | 1,771,592 | $ | 81,285,629 | ||||||||
Capital loss carryforwards: | ||||||||||||||||
Perpetual Long-Term | — | — | — | (20,953,789 | ) | |||||||||||
Perpetual Short-Term | — | — | — | (205,650,629 | ) | |||||||||||
Total capital loss carryforwards | $ | — | $ | — | $ | — | $ | (226,604,418 | ) | |||||||
Timing differences (Straddle Loss Deferral) | $ | (12,327,164 | ) | $ | — | $ | — | $ | (31,702,381 | ) | ||||||
Unrealized gains (losses) — net | 573,735,271 | — | — | 150,939,487 | ||||||||||||
Total accumulated earnings (losses) net | $ | 708,793,076 | $ | 278,776,828 | $ | 1,771,592 | $ | (26,081,683 | ) | |||||||
As of August 31, 2021, the Funds aggregate security unrealized gains and losses based on cost for U.S. federal income tax purposes were as follows:
| Global Managed Beta | Strategic Factor Allocation | Strategic Volatility Premium | Tactical Tilt Overlay | |||||||||||||
Tax Cost | $ | 1,633,845,666 | $ | 1,767,636,945 | $ | 368,791,113 | $ | 3,930,956,061 | ||||||||
Gross unrealized gain | 576,792,503 | 788,062 | 122,369 | 150,983,068 | ||||||||||||
Gross unrealized loss | (3,057,232 | ) | (788,062 | ) | (122,369 | ) | (43,581 | ) | ||||||||
Net unrealized gains (losses) | $ | 573,735,271 | $ | — | $ | — | $ | 150,939,487 | ||||||||
The difference between GAAP-basis and tax basis unrealized gains (losses) is attributable primarily to wash sales, net mark to market gains/(losses) on regulated futures contracts, options contracts, net mark to market gains/(losses) on foreign currency contracts, differences in the tax treatment of swap transactions, partnership investments, and passive foreign investment company investments.
The Strategic Volatility Premium Fund reclassed $16,713 from paid in capital to distributable earnings for the period ending August 31, 2021. In order to present certain components of the Fund’s capital accounts on a tax-basis, certain reclassifications have been recorded to the Fund’s accounts. These reclassifications have no impact on the net asset value of the Fund and result primarily from certain non-deductible expenses.
The Tactical Tilt Overlay Fund reclassed $10,915,292 from paid in capital to distributable earnings for the year ending August 31, 2021. In order to present certain components of the Fund’s capital accounts on a tax-basis, certain reclassifications have been recorded to the Fund’s accounts. These reclassifications have no impact on the net asset value of the Tactical Tilt Overlay Fund and result primarily from eliminating entries related to the Subsidiary.
91
GOLDMAN SACHS ALLOCATION FUNDS
Notes to Financial Statements (continued)
August 31, 2021
| 8. TAX INFORMATION (continued) |
GSAM has reviewed each Fund’s tax positions for all open tax years (the current and prior three years, as applicable) and has concluded that no provision for income tax is required in each Fund’s financial statements. Such open tax years remain subject to examination and adjustment by tax authorities.
| 9. OTHER RISKS |
The Funds’ risks include, but are not limited to, the following:
Credit/Default Risk — An issuer or guarantor of a security held by a Fund or a bank or other financial institution that has entered into a repurchase agreement with a Fund may default on its obligation to pay interest and repay principal or default on any other obligation. Additionally, the credit quality of securities may deteriorate rapidly, which may impair a Fund’s liquidity and cause significant deterioration in NAV.
Derivatives Risk – A Fund’s use of derivatives may result in loss. Derivative instruments, which may pose risks in addition to and greater than those associated with investing directly in securities, currencies or other instruments, may be illiquid or less liquid, volatile, difficult to price and leveraged so that small changes in the value of the underlying instruments may produce disproportionate losses to a Fund. Derivatives are also subject to counterparty risk, which is the risk that the other party in the transaction will not fulfill its contractual obligation. The use of derivatives is a highly specialized activity that involves investment techniques and risks different from those associated with investments in more traditional securities and instruments. Losses from derivatives can also result from a lack of correlation between changes in the value of derivative instruments and the portfolio assets (if any) being hedged.
Dividend-Paying Investments Risk — Each Fund’s investments in dividend-paying securities could cause the Fund to underperform other funds. Securities that pay dividends, as a group, can fall out of favor with the market, causing such securities to underperform securities that do not pay dividends. Depending upon market conditions and political and legislative responses to such conditions, dividend-paying securities that meet a Fund’s investment criteria may not be widely available and/or may be highly concentrated in only a few market sectors. In addition, issuers that have paid regular dividends or distributions to shareholders may not continue to do so at the same level or at all in the future. This may limit the ability of a Fund to produce current income.
Floating and Variable Rate Obligations Risk — Floating rate and variable rate obligations are debt instruments issued by companies or other entities with interest rates that reset periodically (typically, daily, monthly, quarterly, or semiannually) in response to changes in the market rate of interest on which the interest rate is based. For floating and variable rate obligations, there may be a lag between an actual change in the underlying interest rate benchmark and the reset time for an interest payment of such an obligation, which could harm or benefit a Fund, depending on the interest rate environment or other circumstances. In a rising interest rate environment, for example, a floating or variable rate obligation that does not reset immediately would prevent a Fund from taking full advantage of rising interest rates in a timely manner. However, in a declining interest rate environment, a Fund may benefit from a lag due to an obligation’s interest rate payment not being immediately impacted by a decline in interest rates.
On March 5, 2021, the United Kingdom’s Financial Conduct Authority (“FCA”) and ICE Benchmark Authority formally announced that certain LIBOR benchmarks will cease publication after December 31, 2021 while others will cease publication after June 30, 2023. The unavailability or replacement of LIBOR may affect the value, liquidity or return on certain Fund investments and may result in costs incurred in connection with closing out positions and entering into new trades. Any pricing adjustments to a Fund’s investments resulting from a substitute reference rate may also adversely affect a Fund’s performance and/or NAV.
Foreign and Emerging Countries Risk — Investing in foreign markets may involve special risks and considerations not typically associated with investing in the U.S. Foreign securities may be subject to risk of loss because of more or less foreign government regulation; less public information; less stringent investor protections; less stringent accounting, corporate governance, financial reporting and disclosure standards; and less economic, political and social stability in the countries in which a Fund invests. The imposition of exchange controls (including repatriation restrictions), confiscation of assets and property, trade restrictions (including tariffs) and other government restrictions by the U.S. or other governments, or problems with registration,
92
GOLDMAN SACHS ALLOCATION FUNDS
| 9. OTHER RISKS (continued) |
settlement or custody, may also result in losses. Foreign risk also involves the risk of negative foreign currency rate fluctuations, which may cause the value of securities denominated in such foreign currency (or other instruments through which a Fund has exposure to foreign currencies) to decline in value. Currency exchange rates may fluctuate significantly over short periods of time. To the extent that a Fund also invests in securities of issuers located in, or economically tied to, emerging markets, these risks may be more pronounced.
Foreign Custody Risk — Each Fund invests in foreign securities, and as such the Fund may hold such securities and cash with foreign banks, agents, and securities depositories appointed by a Fund’s custodian (each a “Foreign Custodian”). Some foreign custodians may be recently organized or new to the foreign custody business. In some countries, Foreign Custodians may be subject to little or no regulatory oversight over, or independent evaluation of, their operations. Further, the laws of certain countries may place limitations on a Fund’s ability to recover its assets if a Foreign Custodian enters bankruptcy. Investments in emerging markets may be subject to even greater custody risks than investments in more developed markets. Custody services in emerging market countries are very often undeveloped and may be considerably less well regulated than in more developed countries, and thus may not afford the same level of investor protection as would apply in developed countries.
Geographic Risk — If a Fund focuses its investments in securities of issuers located in a particular country or geographic region, a Fund may be subjected, to a greater extent than if its investments were less focused, to the risks of volatile economic cycles and/ or conditions and developments that may be particular to that country or region, such as: adverse securities markets; adverse exchange rates; adverse social, political, regulatory, economic, business, environmental or other developments; or natural disasters.
Interest Rate Risk— When interest rates increase, fixed income securities or instruments held by a Fund will generally decline in value. Long-term fixed income securities or instruments will normally have more price volatility because of this risk than short term fixed income securities or instruments. The risks associated with changing interest rates may have unpredictable effects on the markets and a Fund’s investments. Fluctuations in interest rates may also affect the liquidity of fixed income securities and instruments held by a Fund.
Investments in Other Investment Companies Risk — As a shareholder of another investment company, including an ETF, each Fund will indirectly bear its proportionate share of any net management fees and other expenses paid by such other investment companies, in addition to the fees and expenses regularly borne by a Fund. ETFs are subject to risks that do not apply to conventional mutual funds, including but not limited to the following: (i) the market price of the ETF’s shares may trade at a premium or a discount to their NAV; and (ii) an active trading market for an ETF’s shares may not develop or be maintained.
Investments in the Underlying Funds Risk — The investments of a Fund may be concentrated in one or more Underlying Funds (including ETFs and other registered investment companies) subject to statutory limitations prescribed by the Act or exemptive relief or regulations thereunder. A Fund’s investment performance is directly related to the investment performance of the Underlying Funds it holds. A Fund is subject to the risk factors associated with the investments of the Underlying Funds and will be affected by the investment policies and practices of the Underlying Funds in direct proportion to the amount of assets allocated to each. If a Fund has a relative concentration of its portfolio in a single Underlying Fund, it may be more susceptible to adverse developments affecting that Underlying Fund and may be more susceptible to losses because of these developments. A strategy used by the Underlying Funds may fail to produce the intended results.
Large Shareholder Transactions Risk — A Fund may experience adverse effects when certain large shareholders, such as other funds, institutional investors (including those trading by use of non-discretionary mathematical formulas), financial intermediaries (who may make investment decisions on behalf of underlying clients and/or include a Fund in their investment model), individuals, accounts and Goldman Sachs affiliates, purchase or redeem large amounts of shares of a Fund. Such large shareholder redemptions, which may occur rapidly or unexpectedly, may cause a Fund to sell securities at times when it would not otherwise do so, which may negatively impact a Fund’s NAV and liquidity. These transactions may also accelerate the realization of taxable income to shareholders if such sales of investments resulted in gains, and may also increase transaction costs. In addition, a large redemption could result in a Fund’s current expenses being allocated over a smaller asset base, leading to an
93
GOLDMAN SACHS ALLOCATION FUNDS
Notes to Financial Statements (continued)
August 31, 2021
| 9. OTHER RISKS (continued) |
increase in a Fund’s expense ratio. Similarly, large Fund share purchases may adversely affect a Fund’s performance to the extent that a Fund is delayed in investing new cash or otherwise maintains a larger cash position than it ordinarily would.
Liquidity Risk — A Fund or an Underlying Fund may make investments that are illiquid or that may become less liquid in response to market developments or adverse investor perceptions. Illiquid investments may be more difficult to value. To the extent a Fund engages in cash redemptions, then liquidity risk may also refer to the risk that a Fund or an Underlying Fund will not be able to pay redemption proceeds within the allowable time period or without significant dilution to remaining investors’ interests because of unusual market conditions, an unusually high volume of redemption requests, or other reasons. To meet redemption requests, a Fund or an Underlying Fund may be forced to sell investments at an unfavorable time and/or under unfavorable conditions. If a Fund or an Underlying Fund are forced to sell securities at an unfavorable time and/or under unfavorable conditions, such sales may adversely affect a Fund’s or an Underlying Fund’s NAV and dilute remaining investors’ interests. Liquidity risk may be the result of, among other things, the reduced number and capacity of traditional market participants to make a market in fixed income securities or the lack of an active market. The potential for liquidity risk may be magnified by a rising interest rate environment or other circumstances where investor redemptions from fixed income mutual funds may be higher than normal, potentially causing increased supply in the market due to selling activity. These risks may be more pronounced in connection with a Fund’s or an Underlying Fund’s investments in securities of issuers located in emerging market countries. Redemptions by large shareholders may have a negative impact on a Fund’s or an Underlying Fund’s liquidity.
Market and Credit Risks — In the normal course of business, a Fund trades financial instruments and enters into financial transactions where risk of potential loss exists due to changes in the market (market risk). The value of the securities in which a Fund invests may go up or down in response to the prospects of individual companies, particular sectors or governments and/or general economic conditions throughout the world due to increasingly interconnected global economies and financial markets. Events such as war, acts of terrorism, social unrest, natural disasters, the spread of infectious illness or other public health threats could also significantly impact a Fund and its investments. Additionally, a Fund may also be exposed to credit risk in the event that an issuer or guarantor fails to perform or that an institution or entity with which a Fund has unsettled or open transactions defaults.
Sector Risk — To the extent a Fund focuses its investments in securities of issuers in one or more sectors (such as the financial services or telecommunications sectors), a Fund may be subjected, to a greater extent than if its investments were diversified across different sectors, to the risks of volatile economic cycles and/or conditions and developments that may be particular to that sector, such as: adverse economic, business, political, environmental or other developments.
Short Position Risk — A Fund may enter into a short position through a futures contract, an option or swap agreement or through short sales of any instrument that a Fund may purchase for investment. Taking short positions involves leverage of a Fund’s assets and presents various risks, including counterparty risk. If the value of the underlying instrument or market in which a Fund has taken a short position increases, then a Fund will incur a loss equal to the increase in value from the time that the short position was entered into plus any related interest payments or other fees. Taking short positions involves the risk that losses may be disproportionate, may exceed the amount invested, and may be unlimited. To the extent that a Fund uses the proceeds it receives from a short position to take additional long positions, the risks associated with the short position, including leverage risks, may be heightened, because doing so increases the exposure of a Fund to the markets and therefore could magnify changes to a Fund’s NAV.
Tax Risk — The Tactical Tilt Overlay Fund will seek to gain exposure to the commodity markets primarily through investments in the Subsidiary and/or commodity index-linked structured notes, as applicable. Historically, the Internal Revenue Service (“IRS”) issued private letter rulings (“PLRs”) in which the IRS specifically concluded that income and gains from investments in commodity index linked structured notes (the “Notes Rulings”) or a wholly-owned foreign subsidiary that invests in commodity linked instruments are “qualifying income” for purposes of compliance with Subchapter M of the Code. However, the Tactical Tilt Overlay Fund has not received a PLR, and is not able to rely on PLRs issued to other taxpayers. The IRS recently issued final regulations that, would generally treat the Tactical Tilt Overlay Fund’s income inclusion with respect to a subsidiary as qualifying income either if (A) there is a distribution out of the earnings and profits of a subsidiary that are attributable to such income
94
GOLDMAN SACHS ALLOCATION FUNDS
| 9. OTHER RISKS (continued) |
inclusion or (B) such inclusion is derived with respect to the Tactical Tilt Overlay Fund’s business of investing in stock, securities, or currencies.
The IRS also issued a revenue procedure, which states that the IRS will not in the future issue PLRs that would require a determination of whether an asset (such as a commodity index-linked note) is a “security” under the Investment Company Act of 1940. In connection with issuing such revenue procedure, the IRS has revoked the Notes Ruling on a prospective basis. In light of the revocation of the Notes Rulings, the Tactical Tilt Overlay Fund has limited its investments in commodity index-linked structured notes. The Tactical Tilt Overlay Fund has obtained an opinion of counsel that the Fund’s income from investments in the Subsidiary should constitute “qualifying income.” However, no assurances can be provided that the IRS would not be able to successfully assert that the Tactical Tilt Overlay Fund’s income from such investments was not “qualifying income,” in which case the Tactical Tilt Overlay Fund would fail to qualify as a regulated investment company (“RIC”) under Subchapter M of the Code if over 10% of its gross income were derived from these investments. If the Tactical Tilt Overlay Fund failed to qualify as a RIC, it would be subject to federal and state income tax on all of its taxable income at regular corporate tax rates with no deduction for any distributions paid to shareholders, which would significantly adversely affect the returns to, and could cause substantial losses for, Tactical Tilt Overlay Fund shareholders.
| 10. INDEMNIFICATIONS |
Under the Trust’s organizational documents, its Trustees, officers, employees and agents are indemnified, to the extent permitted by the Act and state law, against certain liabilities that may arise out of performance of their duties to the Funds. Additionally, in the course of business, the Funds enter into contracts that contain a variety of indemnification clauses. The Funds’ maximum exposure under these arrangements is unknown, as this would involve future claims that may be made against the Funds that have not yet occurred. However, GSAM believes the risk of loss under these arrangements to be remote.
| 11. OTHER MATTERS |
In March 2020, the FASB issued Accounting Standard Update (“ASU”) No. 2020-04, “Reference Rate Reform (Topic 848): Facilitation of the Effects of Reference Rate Reform on Financial Reporting.” This ASU provides optional exceptions for applying GAAP to contract modifications, hedging relationships and other transactions affected reference rate reform if certain criteria are met. ASU 2020-04 is elective and is effective on March 12, 2020 through December 31, 2022. As of the financial reporting period, GSAM is currently evaluating the impact, if any, of applying ASU 2020-04.
| 12. SUBSEQUENT EVENTS |
Subsequent events after the Statements and Consolidated Statement of Assets and Liabilities date have been evaluated, and GSAM has concluded that there is no impact requiring adjustment or disclosure in the financial statements.
95
GOLDMAN SACHS ALLOCATION FUNDS
Notes to Financial Statements (continued)
August 31, 2021
| 13. SUMMARY OF SHARE TRANSACTIONS |
Share activity is as follows:
| Global Managed Beta Fund | ||||||||||||||||
| For the Fiscal Year Ended August 31, 2021 | For the Fiscal Year Ended August 31, 2020 | |||||||||||||||
|
| |||||||||||||||
| Shares | Dollars | Shares | Dollars | |||||||||||||
|
| |||||||||||||||
| Institutional Shares | ||||||||||||||||
Shares sold | 54,237,188 | $ | 821,037,700 | 34,576,181 | $ | 423,801,618 | ||||||||||
Reinvestment of distributions | 5,764,208 | 81,014,178 | 3,777,434 | 47,547,059 | ||||||||||||
Shares redeemed | (44,743,393 | ) | (666,596,798 | ) | (15,286,879 | ) | (188,792,678 | ) | ||||||||
NET INCREASE | 15,258,003 | $ | 235,455,080 | $ | 23,066,736 | $ | 282,555,999 | |||||||||
| Strategic Factor Allocation Fund | ||||||||||||||||
|
| |||||||||||||||
| For the Fiscal Year Ended August 31, 2021 | For the Fiscal Year Ended August 31, 2020 | |||||||||||||||
|
| |||||||||||||||
| Shares | Dollars | Shares | Dollars | |||||||||||||
|
| |||||||||||||||
| Institutional Shares | ||||||||||||||||
Shares sold | 187,646 | $ | 2,253,911 | 64,498 | $ | 728,383 | ||||||||||
Reinvestment of distributions | 31,128 | 353,924 | 9,508 | 106,078 | ||||||||||||
Shares redeemed | (159,843 | ) | (1,888,077 | ) | (312,978 | ) | (3,410,091 | ) | ||||||||
| 58,931 | 719,758 | (238,972 | ) | (2,575,630 | ) | |||||||||||
| Class R6 Shares | ||||||||||||||||
Reinvestment of distributions | 80 | 899 | 26 | 289 | ||||||||||||
| 80 | 899 | 26 | 289 | |||||||||||||
| Class P Shares | ||||||||||||||||
Shares sold | 64,661,223 | 760,927,034 | 25,293,706 | 281,003,127 | ||||||||||||
Reinvestment of distributions | 11,190,441 | 125,892,465 | 3,863,546 | 42,652,117 | ||||||||||||
Shares redeemed | (26,073,017 | ) | (307,325,222 | ) | (35,803,475 | ) | (385,520,783 | ) | ||||||||
| 49,778,647 | 579,494,277 | (6,646,223 | ) | (61,865,539 | ) | |||||||||||
NET INCREASE (DECREASE) | 49,837,658 | $ | 580,214,934 | (6,885,169 | ) | $ | (64,440,880 | ) | ||||||||
96
GOLDMAN SACHS ALLOCATION FUNDS
| 13. SUMMARY OF SHARE TRANSACTIONS (continued) |
| Strategic Volatility Premium Fund | ||||||||
|
| |||||||
| For the Period Ended August 31, 2021(a) | ||||||||
|
| |||||||
| Shares | Dollars | |||||||
|
| |||||||
| Institutional Shares | ||||||||
Shares sold | 34,622 | $ | 347,110 | |||||
Shares redeemed | (1 | ) | (10 | ) | ||||
| 34,621 | 347,100 | |||||||
| Class P Shares | ||||||||
Shares sold | 42,669,960 | 429,000,416 | ||||||
Shares redeemed | (814,504 | ) | (8,183,244 | ) | ||||
| 41,855,456 | 420,817,172 | |||||||
NET INCREASE | 41,890,077 | $ | 421,164,272 | |||||
| (a) | Commenced operations on March 29, 2021. |
| Tactical Tilt Overlay Fund | ||||||||||||||||
|
| |||||||||||||||
| For the Fiscal Year Ended August 31, 2021 | For the Fiscal Year Ended August 31, 2020 | |||||||||||||||
|
| |||||||||||||||
| Shares | Dollars | Shares | Dollars | |||||||||||||
|
| |||||||||||||||
| Institutional Shares | ||||||||||||||||
Shares sold | 550,145 | $ | 5,746,917 | 77,802 | $ | 781,025 | ||||||||||
Reinvestment of distributions | 8,823 | 88,055 | 8,903 | 88,497 | ||||||||||||
Shares redeemed | (151,058 | ) | (1,550,598 | ) | (2,504,302 | ) | (24,669,565 | ) | ||||||||
| 407,910 | 4,284,374 | (2,417,597 | ) | (23,800,043 | ) | |||||||||||
| Class R6 Shares | ||||||||||||||||
Shares sold | 28,297,761 | 284,154,037 | 13,977,972 | 136,094,944 | ||||||||||||
Reinvestment of distributions | 4,276,594 | 41,354,663 | 915,300 | 8,832,644 | ||||||||||||
Shares redeemed | (4,820,051 | ) | (48,576,023 | ) | (14,500,809 | ) | (135,252,936 | ) | ||||||||
| 27,754,304 | 276,932,677 | 392,463 | 9,674,652 | |||||||||||||
| Class P Shares | ||||||||||||||||
Shares sold | 89,171,451 | 903,881,851 | 39,399,977 | 382,488,679 | ||||||||||||
Reinvestment of distributions | 11,744,376 | 113,568,116 | 3,463,612 | 33,423,852 | ||||||||||||
Shares redeemed | (37,989,658 | ) | (381,821,832 | ) | (141,859,318 | ) | (1,333,843,957 | ) | ||||||||
| 62,926,169 | 635,628,135 | (98,995,729 | ) | (917,931,426 | ) | |||||||||||
NET INCREASE (DECREASE) | 91,088,383 | $ | 916,845,186 | (101,020,863 | ) | $ | (932,056,817 | ) | ||||||||
97
Report of Independent Registered Public
Accounting Firm
To the Board of Trustees of Goldman Sachs Trust and Shareholders of Goldman Sachs Global Managed Beta Fund, Goldman Sachs Strategic Factor Allocation Fund, Goldman Sachs Strategic Volatility Premium Fund, and Goldman Sachs Tactical Tilt Overlay Fund
Opinions on the Financial Statements
We have audited the accompanying statements of assets and liabilities, including the schedules of investments, of each of the funds indicated in the table below (four of the funds constituting Goldman Sachs Trust, hereafter collectively referred to as the “Funds”) as of August 31, 2021, the related statements of operations and of changes in net assets for each of the periods indicated in the table below, including the related notes, and the financial highlights for each of the periods indicated in the table below (collectively referred to as the “financial statements”). In our opinion, the financial statements present fairly, in all material respects, the financial position of each of the Funds as of August 31, 2021, the results of each of their operations, the changes in each of their net assets, and each of the financial highlights for each of the periods indicated in the table below, in conformity with accounting principles generally accepted in the United States of America.
| Fund | Statement of operations | Statements of changes in net assets | Financial highlights | |||
| Goldman Sachs Global Managed Beta Fund, Goldman Sachs Strategic Factor Allocation Fund, and Goldman Sachs Tactical Tilt Overlay Fund | For the year ended August 31, 2021 | For the two years ended August 31, 2021 | For each of the periods indicated therein | |||
| Goldman Sachs Strategic Volatility Premium Fund | For the period March 29, 2021 (commencement of operations) through August 31, 2021 | |||||
Basis for Opinions
These financial statements are the responsibility of the Funds’ management. Our responsibility is to express an opinion on the Funds’ financial statements based on our audits. We are a public accounting firm registered with the Public Company Accounting Oversight Board (United States) (PCAOB) and are required to be independent with respect to the Funds in accordance with the U.S. federal securities laws and the applicable rules and regulations of the Securities and Exchange Commission and the PCAOB.
We conducted our audits of these financial statements in accordance with the standards of the PCAOB. Those standards require that we plan and perform the audit to obtain reasonable assurance about whether the financial statements are free of material misstatement, whether due to error or fraud.
Our audits included performing procedures to assess the risks of material misstatement of the financial statements, whether due to error or fraud, and performing procedures that respond to those risks. Such procedures included examining, on a test basis, evidence regarding the amounts and disclosures in the financial statements. Our audits also included evaluating the accounting principles used and significant estimates made by management, as well as evaluating the overall presentation of the financial statements. Our procedures included confirmation of securities owned as of August 31, 2021 by correspondence with the custodian, transfer agent and brokers; when replies were not received from brokers, we performed other auditing procedures. We believe that our audits provide a reasonable basis for our opinions.
/s/ PricewaterhouseCoopers LLP
Boston, Massachusetts
October 26, 2021
We have served as the auditor of one or more investment companies in the Goldman Sachs fund complex since 2000.
98
GOLDMAN SACHS ALLOCATION FUNDS
Fund Expenses — Six Month Period Ended August 31, 2021 (Unaudited)
As a shareholder of Institutional, Class R6 and Class P Shares of the Fund you incur two types of costs: (1) transaction costs and (2) ongoing costs, including management fees and other Fund expenses. This example is intended to help you understand your ongoing costs (in dollars) of investing in Institutional, Class R6 and Class P Shares of the Fund and to compare these costs with the ongoing costs of investing in other mutual funds.
The example is based on an investment of $1,000 invested at the beginning of the period and held for the entire period from March 1, 2021, through August 31, 2021, which represents a period of 184 days in a 365-day year. The Strategic Volatility Premium Fund example is based on the period from March 29, 2021 through August 31, 2021, which represents a period of 154 days out of 365 days. The Strategic Volatility Premium Fund example for hypothetical expenses reflects projected activity for the period from March 1, 2021 through August 31, 2021 for the purposes of comparability. This projection assumes that annualized expense ratios were in effect during the period.
Actual Expenses — The first line in the table below provides information about actual account values and actual expenses. You may use the information in this line, together with the amount you invested, to estimate the expenses that you paid over the period. Simply divide your account value by $1,000 (for example, an $8,600 account value divided by $1,000=8.6), then multiply the result by the number in the first line under the heading entitled “Expenses Paid” to estimate the expenses you paid on your account during this period.
Hypothetical Example for Comparison Purposes — The second line in the table below provides information about hypothetical account values and hypothetical expenses based on the Funds’ actual net expense ratios and an assumed rate of return of 5% per year before expenses, which is not the Funds’ actual return. The hypothetical account values and expenses may not be used to estimate the actual ending account balance or expenses you paid for the period. You may use this information to compare the ongoing costs of investing in the Funds and other funds. To do so, compare this 5% hypothetical example with the 5% hypothetical examples that appear in the shareholder reports of the other funds.
Please note that the expenses shown in the table are meant to highlight your ongoing costs only and do not reflect any transactional costs, such as sales charges, redemption fees, or exchange fees. Therefore, the second line of the table is useful in comparing ongoing costs only, and will not help you determine the relative total costs of owning different funds. In addition, if these transactional costs were included, your costs would have been higher.
| Global Managed Beta Fund | Strategic Factor Allocation Fund | Strategic Volatility Premium Fund(a) | Tactical Tilt Overlay Fund | |||||||||||||||||||||||||||||||||||||||||||||
| Share Class | Beginning Account Value 3/1/21 | Ending Account Value 8/31/21 | Expenses Paid for the 6 months ended 8/31/21* | Beginning Account Value 3/1/21 | Ending Account Value 8/31/21 | Expenses Paid for the 6 months ended 8/31/21* | Beginning Account Value 3/1/21 | Ending Account Value 8/31/21 | Expenses Paid for the 6 months ended 8/31/21* | Beginning Account Value 3/1/21 | Ending Account Value 8/31/21 | Ending Account Value 8/31/21 | ||||||||||||||||||||||||||||||||||||
| Institutional | ||||||||||||||||||||||||||||||||||||||||||||||||
Actual | $ | 1,000.00 | $ | 1,140.60 | $ | 1.56 | $ | 1,000.00 | 1,115.40 | $ | 3.68 | $ | 1,000.00 | $ | 1,010.00 | $ | 1.62 | $ | 1,000.00 | $ | 1,033.90 | $ | 3.49 | |||||||||||||||||||||||||
Hypothetical 5% return | 1,000.00 | 1,023.74 | + | 1.48 | 1,000.00 | 1,021.73 | + | 3.52 | 1,000.00 | 1,019.62 | + | 1.63 | 1,000.00 | 1,021.78 | + | 3.47 | ||||||||||||||||||||||||||||||||
| Class R6 | ||||||||||||||||||||||||||||||||||||||||||||||||
Actual | — | — | — | 1,000.00 | 1,115.70 | 3.52 | — | — | — | 1,000.00 | 1,035.10 | 3.44 | ||||||||||||||||||||||||||||||||||||
Hypothetical 5% return | — | — | — | 1,000.00 | 1,021.88 | + | 3.36 | — | — | — | 1,000.00 | 1,021.73 | + | 3.41 | ||||||||||||||||||||||||||||||||||
| Class P | ||||||||||||||||||||||||||||||||||||||||||||||||
Actual | — | — | — | 1,000.00 | 1,115.80 | 3.63 | 1,000.00 | 1,010.10 | 1.58 | 1,000.00 | 1,035.10 | 3.44 | ||||||||||||||||||||||||||||||||||||
Hypothetical 5% return | — | — | — | 1,000.00 | 1,021.78 | + | 3.47 | 1,000.00 | 1,019.66 | + | 1.59 | 1,000.00 | 1,021.83 | + | 3.41 | |||||||||||||||||||||||||||||||||
| * | Expenses are calculated using the Fund’s annualized net expense ratio (excluding proxy fees) for each class, which represents the ongoing expenses as a percentage of net assets for the six months ended August 31, 2021. Expenses are calculated by multiplying the annualized net expense ratio (excluding proxy fees) by the average account value for the period; then multiplying the result by the number of days in the most recent fiscal half year; and then dividing that result by the number of days in the fiscal year. The annualized net expense ratios for the period were as follows: |
| + | Hypothetical expenses are based on Fund’s actual annualized net expense ratios (excluding proxy fees) and an assumed rate of return of 5% per year before expenses. |
| Fund | Institutional | Class R6 | Class P | |||||||||
Global Managed Beta | 0.29 | % | — | % | — | % | ||||||
Strategic Factor Allocation | 0.69 | 0.66 | 0.68 | |||||||||
Strategic Volatility Premium(a) | 0.38 | — | 0.37 | |||||||||
Tactical Tilt Overlay | 0.68 | 0.67 | 0.67 | |||||||||
| (a) | Commenced operations on March 29, 2021. |
99
GOLDMAN SACHS ALLOCATION FUNDS
Statement Regarding Basis for Approval of Management Agreement (Unaudited)
Background
The Goldman Sachs Global Managed Beta Fund, Goldman Sachs Strategic Factor Allocation Fund, and Goldman Sachs Tactical Tilt Overlay Fund (the “Funds”) are investment portfolios of Goldman Sachs Trust (the “Trust”). The Board of Trustees oversees the management of the Trust and reviews the investment performance and expenses of the Funds at regularly scheduled meetings held throughout the year. In addition, the Board of Trustees determines annually whether to approve the continuance of the Trust’s investment management agreement (the “Management Agreement”) with Goldman Sachs Asset Management, L.P. (the “Investment Adviser”) on behalf of the Funds.
The Management Agreement was most recently approved for continuation until June 30, 2022 by the Board of Trustees, including those Trustees who are not parties to the Management Agreement or “interested persons” (as defined in the Investment Company Act of 1940, as amended) of any party thereto (the “Independent Trustees”), at a meeting held on June 15-16, 2021 (the “Annual Meeting”).
The review process undertaken by the Trustees spans the course of the year and culminates with the Annual Meeting. To assist the Trustees in their deliberations, the Trustees have established a Contract Review Committee (the “Committee”), comprised of the Independent Trustees. The Committee held two meetings over the course of the year since the Management Agreement was last approved. At those Committee meetings, regularly scheduled Board or other committee meetings, and/or the Annual Meeting, matters relevant to the renewal of the Management Agreement was considered by the Board, or the Independent Trustees, as applicable. With respect to each Fund, such matters included:
| (a) | the nature and quality of the advisory, administrative, and other services provided to the Fund and the underlying funds in which the Tactical Tilt Overlay Fund invests (the “Underlying Funds”) by the Investment Adviser and its affiliates, including information about: |
| (i) | the structure, staff, and capabilities of the Investment Adviser and its portfolio management teams; |
| (ii) | the groups within the Investment Adviser and its affiliates that support the portfolio management teams or provide other types of necessary services, including fund services groups (e.g., accounting and financial reporting, tax, shareholder services, and operations); controls and risk management groups (e.g., legal, compliance, valuation oversight, credit risk management, internal audit, compliance testing, market risk analysis, finance, and central funding); sales and distribution support groups, and others (e.g., information technology and training); |
| (iii) | trends in employee headcount; |
| (iv) | the Investment Adviser’s financial resources and ability to hire and retain talented personnel and strengthen its operations; and |
| (v) | the parent company’s support of the Investment Adviser and its mutual fund business, as expressed by the firm’s senior management; |
| (b) | information on the investment performance of the Fund and the Underlying Funds, including comparisons to the performance of similar mutual funds, as provided by a third-party mutual fund data provider engaged as part of the contract review process (the “Outside Data Provider”), and a benchmark performance index; and information on general investment outlooks in the markets in which the Fund and the Underlying Funds invest; |
| (c) | information provided by the Investment Adviser indicating the Investment Adviser’s views on whether the Fund’s peer group and/or benchmark index had high, medium, or low relevance given the Fund’s particular investment strategy; |
| (d) | the terms of the Management Agreement and other agreements with affiliated service providers entered into by the Trust on behalf of the Fund; |
| (e) | fee and expense information for the Fund, including: |
| (i) | the relative management fee and expense levels of the Fund as compared to those of comparable funds managed by other advisers, as provided by the Outside Data Provider; |
| (ii) | the Fund’s expense trends over time; and |
| (iii) | to the extent the Investment Adviser manages other types of accounts (such as bank collective trusts, private wealth management accounts, institutional separate accounts, sub-advised mutual funds, and non-U.S. funds) having investment objectives and policies similar to those of the Fund, comparative information on the advisory fees charged and services provided to those accounts by the Investment Adviser; |
| (f) | with respect to the extensive investment performance and expense comparison data provided by the Outside Data Provider, its processes in producing that data for the Fund; |
| (g) | the undertakings of the Investment Adviser and its affiliates to implement fee waivers and/or expense limitations; |
| (h) | information relating to the profitability of the Management Agreement and the transfer agency and distribution and service arrangements of the Fund to the Investment Adviser and its affiliates; |
100
GOLDMAN SACHS ALLOCATION FUNDS
Statement Regarding Basis for Approval of Management Agreement (Unaudited) (continued)
| (i) | whether the Fund’s existing management fee schedule, together with the management fee schedules of the Underlying Funds, adequately addressed any economies of scale; |
| (j) | a summary of the “fall-out” benefits derived by the Investment Adviser and its affiliates from their relationships with the Fund and/or the Underlying Funds, including the fees received by the Investment Adviser’s affiliates from the Fund and/or the Underlying Funds for transfer agency, securities lending, portfolio trading, distribution and other services, as applicable; |
| (k) | a summary of potential benefits derived by the Fund and/or the Underlying Funds as a result of its relationship with the Investment Adviser; |
| (l) | information regarding commissions paid by the Fund and/or the Underlying Funds and broker oversight, an update on the Investment Adviser’s soft dollars practices, other information regarding portfolio trading, and how the Investment Adviser carries out its duty to seek best execution, as applicable; |
| (m) | portfolio manager ownership of Fund shares; the manner in which portfolio manager compensation is determined; and the number and types of accounts managed by the portfolio managers; |
| (n) | the nature and quality of the services provided to the Fund and the Underlying Funds by their unaffiliated service providers, and the Investment Adviser’s general oversight and evaluation (including reports on due diligence) of those service providers as part of the administrative services provided under the Management Agreement; and |
| (o) | the Investment Adviser’s processes and policies addressing various types of potential conflicts of interest; its approach to risk management; the annual review of the effectiveness of the Fund’s compliance program; and periodic compliance reports. |
The Trustees also received an overview of the Funds’ distribution arrangements. They received information regarding the Funds’ assets, share purchase and redemption activity. Information was also provided to the Trustees relating to revenue sharing payments made by and services provided by the Investment Adviser and its affiliates to intermediaries that promote the sale, distribution, and/or servicing of Fund shares. The Independent Trustees also discussed the broad range of other investment choices that are available to Fund investors, including the availability of comparable funds managed by other advisers.
The presentations made at the Board and Committee meetings and at the Annual Meeting encompassed the Funds and other mutual funds for which the Board of Trustees has responsibility. In evaluating the Management Agreement at the Annual Meeting, the Trustees relied upon their knowledge, resulting from their meetings and other interactions throughout the year, of the Investment Adviser and its affiliates, their services, and the Funds. In conjunction with these meetings, the Trustees received written materials and oral presentations on the topics covered, and the Investment Adviser addressed the questions and concerns of the Trustees, including concerns regarding the investment performance of certain of the funds they oversee. The Independent Trustees were advised by their independent legal counsel regarding their responsibilities and other regulatory requirements related to the approval and continuation of mutual fund investment management agreements under applicable law. In addition, the Investment Adviser and its affiliates provided the Independent Trustees with a written response to a formal request for information sent on behalf of the Independent Trustees by their independent legal counsel. During the course of their deliberations, the Independent Trustees met in executive sessions with their independent legal counsel, without representatives of the Investment Adviser or its affiliates present.
Nature, Extent, and Quality of the Services Provided Under the Management Agreement
As part of their review, the Trustees considered the nature, extent, and quality of the services provided to the Funds and the Underlying Funds by the Investment Adviser. In this regard, the Trustees considered both the investment advisory services and non-advisory services that are provided by the Investment Adviser and its affiliates. The Trustees noted the transition in the leadership and changes in personnel of various of the Investment Adviser’s portfolio management teams that had occurred in recent periods, and the ongoing recruitment efforts aimed at bringing high quality investment talent to the Investment Adviser. They also noted the Investment Adviser’s commitment to maintaining high quality systems and expending substantial resources to respond to ongoing changes to the market, regulatory and control environment in which the Funds, the Underlying Funds, and their service providers operate, including changes associated with the COVID-19 pandemic, as well as the efforts of the Investment Adviser and its affiliates to combat cyber security risks. The Trustees also considered information regarding the Investment Adviser’s business continuity planning and remote operations capabilities. The Trustees concluded that the Investment Adviser continued to commit substantial financial and operational resources to the Funds and expressed confidence that the Investment Adviser would continue to do so in the future. The Trustees also recognized that the Investment Adviser had made significant commitments to address regulatory compliance requirements applicable to the Funds, the Underlying Funds, and the Investment Adviser and its affiliates.
101
GOLDMAN SACHS ALLOCATION FUNDS
Statement Regarding Basis for Approval of Management Agreement (Unaudited) (continued)
Investment Performance
The Trustees also considered the investment performance of the Funds and the Underlying Funds. In this regard, they compared the investment performance of each Fund to its peers using rankings and ratings compiled by the Outside Data Provider as of December 31, 2020. The information on each Fund’s investment performance was provided for the one-, three-, and five-year periods ending on the applicable dates, to the extent that each Fund had been in existence for those periods. The Trustees also reviewed each Fund’s investment performance relative to its performance benchmark. As part of this review, they considered the investment performance trends of the Funds over time, and reviewed the investment performance of each Fund in light of its investment objective and policies and market conditions.
In addition, the Trustees considered materials prepared and presentations made by the Investment Adviser’s senior management and portfolio management personnel in which Fund performance was assessed. The Trustees also considered the Investment Adviser’s periodic reports with respect to the Funds’ and the Underlying Funds’ risk profiles, and how the Investment Adviser’s approach to risk monitoring and management influences portfolio management. For the Strategic Factor Allocation Fund, they noted the efforts of the Fund’s portfolio management team to continue to enhance the investment models used in managing the Fund.
The Trustees observed that the Global Managed Beta Fund’s Institutional Shares had placed in the top half of the Fund’s peer group for the one-, three-, and five-year periods ended December 31, 2020, and had outperformed the Fund’s benchmark index for the one-, three-, and five-year periods ended March 31, 2021. They noted that the Global Managed Beta Fund had experienced certain portfolio management changes in early 2021. The Trustees observed that the Strategic Factor Allocation Fund’s Institutional Shares had placed in the top half of the Fund’s peer group for the one- and three-year periods ended December 31, 2020, and had underperformed the Fund’s benchmark index for the one- and three-year periods ended March 31, 2021. They considered that the Strategic Factor Allocation Fund had experienced certain portfolio management changes in 2020 and early 2021. The Trustees observed that the Tactical Tilt Overlay Fund’s Institutional Shares had placed in the fourth quartile of the Fund’s peer group for the one-, three-, and five-year periods ended December 31, 2020, and had outperformed its LIBOR-based benchmark index by 16.77%, 2.90%, and 2.69%, respectively, for the one-, three-, and five-year periods ended March 31, 2021.
Costs of Services Provided and Competitive Information
The Trustees considered the contractual terms of the Management Agreement and the fee rates payable by each Fund thereunder. In this regard, the Trustees considered information on the services rendered by the Investment Adviser to the Funds, which included both advisory and administrative services that were directed to the needs and operations of the Funds as registered mutual funds.
In particular, the Trustees reviewed analyses prepared by the Outside Data Provider regarding the expense rankings of the Funds. The analyses provided a comparison of each Fund’s management fee and (in the case of the Strategic Factor Allocation Fund and Tactical Tilt Overlay Fund) breakpoints, to those of a relevant peer group and category universe; an expense analysis which compared each Fund’s overall net and gross expenses to a peer group and a category universe; and data comparing each Fund’s net expenses to the peer and category medians. The analyses also compared each Fund’s other expenses and fee waivers/reimbursements to those of the peer group and category medians. The Trustees concluded that the comparisons provided by the Outside Data Provider were useful in evaluating the reasonableness of the management fees and total expenses paid by the Funds.
In addition, the Trustees considered the Investment Adviser’s undertakings to implement fee waivers and/or expense limitations with respect to the Funds and the Underlying Funds. With respect to the Tactical Tilt Overlay Fund, the Trustees noted that the Investment Adviser had agreed to waive a portion of its management fee in an amount equal to the entire management fee paid to the Investment Adviser as the investment adviser to the Fund’s wholly-owned subsidiary. They also considered, to the extent that the Investment Adviser manages other types of accounts having investment objectives and policies similar to those of the Funds, comparative fee information for services provided by the Investment Adviser to those accounts, and information that indicated that services provided to the Funds differed in various significant respects from the services provided to other types of accounts which, in many cases, operated under less stringent legal and regulatory structures, required fewer services from the Investment Adviser to a smaller number of client contact points, and were less time-intensive.
In addition, the Trustees noted that shareholders are able to redeem their Fund shares at any time if shareholders believe that the Fund fees and expenses are too high or if they are dissatisfied with the performance of the Fund.
102
GOLDMAN SACHS ALLOCATION FUNDS
Statement Regarding Basis for Approval of Management Agreement (Unaudited) (continued)
Profitability
The Trustees reviewed each Fund’s contribution to the Investment Adviser’s revenues and pre-tax profit margins. In this regard the Trustees noted that they had received, among other things, profitability analyses and summaries, revenue and expense schedules by Fund and by function (i.e., investment management, transfer agency and distribution and service), and information on the Investment Adviser’s expense allocation methodology. They observed that the profitability and expense figures are substantially similar to those used by the Investment Adviser for many internal purposes, including compensation decisions among various business groups, and are thus subject to a vigorous internal debate about how certain revenue and expenses should be allocated. The Trustees also noted that the internal audit group within the Goldman Sachs organization periodically audits the expense allocation methodology and that the internal audit group was satisfied with the reasonableness, consistency, and accuracy of the Investment Adviser’s expense allocation methodology. Profitability data for each Fund was provided for 2020 and 2019, and the Trustees considered this information in relation to the Investment Adviser’s overall profitability.
Economies of Scale
The Trustees considered the information that had been provided regarding whether there have been economies of scale with respect to the management of the Funds. For the Strategic Factor Allocation Fund and Tactical Tilt Overlay Fund, the Trustees also considered the breakpoints in the fee rate payable under the Management Agreement at the following annual percentage rates of the average daily net assets of each Fund:
| Strategic Factor Allocation Fund | Tactical Tilt Overlay Fund | |||||||
First $2 billion | 0.75 | % | 0.75 | % | ||||
Next $3 billion | 0.68 | 0.68 | ||||||
Next $3 billion | 0.64 | 0.64 | ||||||
Over $8 billion | 0.62 | 0.62 | ||||||
The Trustees noted that the breakpoints were designed to share potential economies of scale, if any, with the Funds and their shareholders as assets under management reach those asset levels. The Trustees considered the amounts of assets in the Funds; the Funds’ recent share purchase and redemption activity; the information provided by the Investment Adviser relating to the costs of the services provided by the Investment Adviser and its affiliates and their realized profits; information comparing fee rates charged by the Investment Adviser with fee rates charged to other funds in the peer groups; and the Investment Adviser’s undertaking to limit certain expenses of the Funds that exceed specified levels. Upon reviewing these matters at the Annual Meeting, the Trustees concluded that the fee breakpoints for the Strategic Factor Allocation Fund and Tactical Tilt Overlay Fund represented a means of assuring that benefits of scalability, if any, would be passed along to shareholders at the specified asset levels. They also considered the services provided to the Tactical Tilt Overlay Fund under the Management Agreement and the fees and expenses borne by the Underlying Funds, and determined that the management fees payable by the Fund were not duplicative of the management fees paid at the Underlying Fund level. They also noted that the Investment Adviser had passed along savings to shareholders of the Tactical Tilt Overlay Fund, which had asset levels above at least the first breakpoint during the prior fiscal year.
With respect to Global Managed Beta Fund, the Trustees noted that the Fund does not have management fee breakpoints. They considered the asset levels in the Fund; the Fund’s recent purchase and redemption activity; the information provided by the Investment Adviser relating to the costs of the services provided by the Investment Adviser and its affiliates and their realized profits; information comparing the contractual fee rates charged by the Investment Adviser with fee rates charged to other funds in the peer group; and the Investment Adviser’s undertaking to limit certain expenses of the Fund that exceed a specified level.
Other Benefits to the Investment Adviser and Its Affiliates
The Trustees also considered the other benefits derived by the Investment Adviser and its affiliates from their relationships with the Funds and/or the Underlying Funds as stated above, including: (a) transfer agency fees received by Goldman Sachs & Co. LLC (“Goldman Sachs”); (b) brokerage and futures commissions earned by Goldman Sachs for executing securities and futures transactions on behalf of the Funds and certain Underlying Funds; (c) in the case of Global Managed Beta Fund and Tactical Tilt Overlay Fund, research received by the Investment Adviser from broker-dealers in exchange for executing certain transactions on behalf of the Funds and certain Underlying Funds; (d) trading efficiencies resulting from aggregation of orders of the Funds or Underlying Funds with those for other funds or accounts managed by the Investment Adviser; (e) in the case of Strategic Factor
103
GOLDMAN SACHS ALLOCATION FUNDS
Statement Regarding Basis for Approval of Management Agreement (Unaudited) (continued)
Allocation Fund, fees earned by Goldman Sachs Agency Lending (“GSAL”), an affiliate of the Investment Adviser, as securities lending agent (and fees earned by the Investment Adviser for managing the fund in which the each Fund’s and certain Underlying Funds’ securities lending cash collateral is invested); (f) the Investment Adviser’s ability to leverage the infrastructure designed to service the Funds on behalf of its other clients; (g) the Investment Adviser’s ability to cross-market other products and services to Fund shareholders; (h) Goldman Sachs’ retention of certain fees as Fund Distributor; (i) the Investment Adviser’s ability to negotiate better pricing with custodians on behalf of its other clients, as a result of the relationship with the Funds and the Underlying Funds; (j) the investment of cash and cash collateral in money market funds managed by the Investment Adviser that will result in increased assets under management for those money market funds; (k) the investment in exchange-traded funds (“ETFs”) managed by the Investment Adviser that will result in increased assets under management for those ETFs and may facilitate the development of the Investment Adviser’s ETF advisory business; and (l) the possibility that the working relationship between the Investment Adviser and the Funds’ and the Underlying Funds’ third-party service providers may cause those service providers to be more likely to do business with other areas of Goldman Sachs. In the course of considering the foregoing, the Independent Trustees requested and received further information quantifying certain of these fall-out benefits.
Other Benefits to the Funds and Their Shareholders
The Trustees also noted that the Funds and/or the Underlying Funds (as applicable) receive certain other potential benefits as a result of their relationship with the Investment Adviser, including: (a) trading efficiencies resulting from aggregation of orders of the Funds and/or the Underlying Funds with those of other funds or accounts managed by the Investment Adviser; (b) enhanced servicing from vendors due to the volume of business generated by the Investment Adviser and its affiliates; (c) enhanced servicing from broker-dealers due to the volume of business generated by the Investment Adviser and its affiliates; (d) the Investment Adviser’s ability to negotiate favorable terms with derivatives counterparties on behalf of the Funds and the Underlying Funds as a result of the size and reputation of the Goldman Sachs organization; (e) the advantages received from the Investment Adviser’s knowledge and experience gained from managing other accounts and products; (f) the Investment Adviser’s ability to hire and retain qualified personnel to provide services to the Funds and the Underlying Funds because of the reputation of the Goldman Sachs organization; (g) the Funds’ and Underlying Funds’ access, through the Investment Adviser, to certain firm-wide resources (e.g., proprietary risk management systems and databases), subject to certain restrictions; (h) the Strategic Factor Allocation Fund’s ability to participate in the securities lending program administered by GSAL, as measured by the revenue received by the Fund in connection with the program; and (i) the Funds’ access to certain affiliated distribution channels. In addition, the Trustees noted the competitive nature of the mutual fund marketplace, and considered that many of the Funds’ shareholders invested in the Funds in part because of the Funds’ relationship with the Investment Adviser and that those shareholders have a general expectation that the relationship will continue.
Conclusion
In connection with their consideration of the Management Agreement, the Trustees gave weight to each of the factors described above, but did not identify any particular factor as controlling their decision. After deliberation and consideration of all of the information provided, including the factors described above, the Trustees concluded, in the exercise of their business judgment, that the management fees paid by each of the Funds were reasonable in light of the services provided to it by the Investment Adviser, the Investment Adviser’s costs and each Fund’s current and reasonably foreseeable asset levels. The Trustees unanimously concluded that the Investment Adviser’s continued management likely would benefit each Fund and its shareholders and that the Management Agreement should be approved and continued with respect to each Fund until June 30, 2022.
104
GOLDMAN SACHS ALLOCATION FUNDS
Statement Regarding Basis for Approval of Management Agreement (Unaudited) (continued)
Background
The Goldman Sachs Strategic Volatility Premium Fund (the “Fund”) is a newly-organized investment portfolio of Goldman Sachs Trust (the “Trust”) that commenced investment operations on March 28, 2021. At a meeting held on February 10, 2021 (the “Meeting”) in connection with the Fund’s organization, the Board of Trustees, including all of the Trustees present who are not parties to the Fund’s investment management agreement (the “Management Agreement”) or “interested persons” (as defined in the Investment Company Act of 1940, as amended) of any party thereto (the “Independent Trustees”) approved the Management Agreement with Goldman Sachs Asset Management, L.P. (the “Investment Adviser”).
At the Meeting, the Trustees reviewed the Management Agreement, including information regarding the terms of the Management Agreement; the nature, extent and quality of the Investment Adviser’s anticipated services; the fees and expenses to be paid by the Fund; a comparison of the Fund’s anticipated expenses with those paid by other similar mutual funds; the Investment Adviser’s proposal to waive and/or reimburse the Fund’s expenses (with certain customary exceptions, such as taxes, brokerage fees, and extraordinary expenses); and potential benefits to be derived by the Investment Adviser and its affiliates from their relationships with the Fund. Various information was also provided at a prior meeting at which the Fund was discussed.
In connection with the Meeting, the Trustees received written materials and oral presentations on the topics covered. The Independent Trustees were advised by their independent legal counsel regarding their responsibilities under applicable law. In evaluating the Management Agreement at the Meeting, the Trustees relied upon information included in a presentation made by the Investment Adviser at the Meeting and information received at prior meetings of the Trustees, as well as on their knowledge of the Investment Adviser resulting from their meetings and other interactions over time.
Nature, Extent, and Quality of the Services to Be Provided under the Management Agreement
As part of their review, the Trustees considered the nature, extent, and quality of the services to be provided by the Investment Adviser. In this regard, the Trustees considered both the investment advisory services and non-advisory services that would be provided to the Fund by the Investment Adviser and its affiliates. The Trustees also considered information about the Fund’s structure, investment objective, strategies, and other characteristics. The Trustees considered the experience and capabilities of the investment team and noted that the Fund’s portfolio managers were currently managing other series of the Trust. The Trustees concluded that the Investment Adviser would be able to commit substantial financial and other resources to the Fund. In this regard, the Trustees noted that, although the Fund was new (and therefore had no performance data to evaluate), the Investment Adviser’s management of the Fund likely would benefit the Fund and its shareholders.
Costs of Services to Be Provided and Profitability
The Trustees considered the contractual terms of the Management Agreement and the fee rates to be payable by the Fund thereunder. In this regard, the Trustees considered information on the services to be rendered by the Investment Adviser to the Fund, which included both advisory and administrative services that were directed to the needs and operations of the Fund as a registered mutual fund.
In particular, the Trustees reviewed information on the proposed management fees and the Fund’s projected total operating expense ratios (both gross and net of expense limitations), and those were compared to similar information for comparable mutual funds advised by other, unaffiliated investment management firms, as well as the peer group and category medians. The comparisons of the Fund’s fee rates and total operating expense ratios were prepared by a third-party provider of mutual fund data. The Trustees believed that this information was useful in evaluating the reasonableness of the management fees and total expenses expected to be paid by the Fund.
The Trustees considered the Investment Adviser’s undertaking to limit certain expenses of the Fund that exceed a specified level. In addition, the Trustees recognized that there was not yet profitability data to evaluate for the Fund, but considered the Investment Adviser’s representations that (i) such data would be provided after the Fund commenced operations, and (ii) the Fund was not expected to be profitable to the Investment Adviser and its affiliates initially.
The Trustees noted the competitive nature of the fund marketplace, and that many of the Fund’s shareholders would be investing in the Fund in part because of the Fund’s relationship with the Investment Adviser. They also noted that shareholders would be able to redeem their Fund shares if they believe that the Fund fees and expenses are too high or if they are dissatisfied with the performance of the Fund.
105
GOLDMAN SACHS ALLOCATION FUNDS
Statement Regarding Basis for Approval of Management Agreement (Unaudited) (continued)
Economies of Scale
The Trustees considered the proposed breakpoints in the fee rates payable under the Management Agreement at the following annual percentage rates of the average daily net assets of the Fund:
| Average Daily Net Assets | Management Fee Annual Rate | |||
First $2 billion | 0.50 | % | ||
Next $3 billion | 0.45 | |||
Next $3 billion | 0.43 | |||
Over $8 billion | 0.42 | |||
The Trustees noted that the breakpoints were meant to share potential economies of scale, if any, with the Fund and its shareholders as assets under management reach those asset levels. The Trustees considered the Fund’s projected asset levels and information comparing fee rates charged by the Investment Adviser with fee rates charged to other funds in the peer group, as well as the Investment Adviser’s undertaking to limit certain expenses of the Fund that exceed a specified level. Upon reviewing these matters, the Trustees concluded that the fee breakpoints represented a means of assuring that benefits of scalability, if any, would be passed along to shareholders at the specified asset levels.
Other Benefits to the Investment Adviser and Its Affiliates
The Trustees also considered the other benefits expected to be derived by the Investment Adviser and its affiliates from their relationship with the Fund, including: (a) transfer agency fees received by Goldman Sachs & Co. LLC (“Goldman Sachs”); (b) futures commissions earned by Goldman Sachs for executing futures transactions on behalf of the Fund; (c) trading efficiencies resulting from aggregation of orders of the Fund with those for other funds or accounts managed by the Investment Adviser ; (d) the Investment Adviser’s ability to leverage the infrastructure designed to service the Fund on behalf of its other clients; (e) the Investment Adviser’s ability to cross-market other products and services to Fund shareholders; (f) Goldman Sachs’ retention of certain fees as Fund Distributor; (g) the Investment Adviser’s ability to negotiate better pricing with custodians on behalf of its other clients, as a result of the relationship with the Fund; (h) the investment by the Fund of cash and cash collateral in the Investment Adviser managed money market funds that will result in increased assets under management for those money market funds; and (i) the possibility that the working relationship between the Investment Adviser and the Fund’s third-party service providers may cause those service providers to be open to doing business with other areas of Goldman Sachs.
Conclusion
In connection with their consideration of the Management Agreement for the Fund at the Meeting, the Trustees gave weight to various factors, but did not identify any particular factor as controlling their decision. After deliberation and consideration of the information provided, including the factors described above, the Trustees concluded, in the exercise of their business judgment, that the management fee that would be payable by the Fund was reasonable in light of the services to be provided to it by the Investment Adviser, the Investment Adviser’s anticipated costs and the Fund’s reasonably anticipated asset levels. The Trustees unanimously concluded that the Investment Adviser’s management likely would benefit the Fund and its shareholders and that the Management Agreement should be approved with respect to the Fund.
106
GOLDMAN SACHS ALLOCATION FUNDS
Trustees and Officers (Unaudited)
Independent Trustees
Name, Address and Age1 | Position(s) Held with the Trust | Term of Office and Length of Time Served2 | Principal Occupation(s) During Past 5 Years | Number of Portfolios in Fund Complex Overseen by Trustee3 | Other Directorships Held by Trustee4 | |||||
Jessica Palmer Age: 72 | Chair of the Board of Trustees | Since 2018 (Trustee since 2007) | Ms. Palmer is retired. She was formerly Consultant, Citigroup Human Resources Department (2007-2008); Managing Director, Citigroup Corporate and Investment Banking (previously, Salomon Smith Barney/Salomon Brothers) (1984-2006). Ms. Palmer was a Member of the Board of Trustees of Indian Mountain School (private elementary and secondary school) (2004-2009).
Chair of the Board of Trustees — Goldman Sachs Trust and Goldman Sachs Variable Insurance Trust. | 109 | None | |||||
Dwight L. Bush Age: 64 | Trustee | Since 2020 | Ambassador Bush is President and CEO of D.L. Bush & Associates (a financial advisory and private investment firm) (2002-2014 and 2017-present); Director of MoneyLion Inc. (an operator of a data-driven, digital financial platform) (2021-present); and was formerly U.S. Ambassador to the Kingdom of Morocco (2014-2017) and a Member of the Board of Directors of Santander Bank, N.A. (2018-2019). Previously, Ambassador Bush served as an Advisory Board Member of Goldman Sachs Trust and Goldman Sachs Variable Insurance Trust (October 2019-January 2020).
Trustee — Goldman Sachs Trust and Goldman Sachs Variable Insurance Trust. | 109 | None | |||||
Kathryn A. Cassidy Age: 67 | Trustee | Since 2015 | Ms. Cassidy is retired. Formerly, she was Advisor to the Chairman (May 2014-December 2014); and Senior Vice President and Treasurer (2008-2014), General Electric Company & General Electric Capital Corporation (technology and financial services companies).
Trustee — Goldman Sachs Trust and Goldman Sachs Variable Insurance Trust. | 109 | None | |||||
Diana M. Daniels Age: 72 | Trustee | Since 2007 | Ms. Daniels is retired. Formerly, she was Vice President, General Counsel and Secretary, The Washington Post Company (1991-2006). Ms. Daniels is a Trustee Emeritus and serves as a Presidential Councillor of Cornell University (2013-Present); former Member of the Legal Advisory Board, New York Stock Exchange (2003-2006) and of the Corporate Advisory Board, Standish Mellon Management Advisors (2006-2007).
Trustee — Goldman Sachs Trust and Goldman Sachs Variable Insurance Trust. | 109 | None | |||||
Joaquin Delgado Age: 61 | Trustee | Since 2020 | Dr. Delgado is retired. He is Director, Hexion Inc. (a specialty chemical manufacturer) (2019-present); and Director, Stepan Company (a specialty chemical manufacturer) (2011-present); and was formerly Executive Vice President, Consumer Business Group of 3M Company (July 2016-July 2019); and Executive Vice President, Health Care Business Group of 3M Company (October 2012-July 2016). Previously, Dr. Delgado served as an Advisory Board Member of Goldman Sachs Trust and Goldman Sachs Variable Insurance Trust (October 2019-January 2020).
Trustee — Goldman Sachs Trust and Goldman Sachs Variable Insurance Trust | 109 | Hexion Inc. (a specialty chemical manufacturer); Stepan Company (a specialty chemical manufacturer) | |||||
Roy W. Templin Age: 61 | Trustee | Since 2013 | Mr. Templin is retired. He is Director, Armstrong World Industries, Inc. (a designer and manufacturer of ceiling and wall systems) (2016-Present); and was formerly Chairman of the Board of Directors, Con-Way Incorporated (a transportation, logistics and supply chain management service company) (2014-2015); Executive Vice President and Chief Financial Officer, Whirlpool Corporation (an appliance manufacturer and marketer) (2004-2012).
Trustee — Goldman Sachs Trust and Goldman Sachs Variable Insurance Trust. | 109 | Armstrong World Industries, Inc. (a ceiling and wall systems manufacturer) | |||||
Gregory G. Weaver Age: 69 | Trustee | Since 2015 | Mr. Weaver is retired. He is Director, Verizon Communications Inc. (2015-Present); and was formerly Chairman and Chief Executive Officer, Deloitte & Touche LLP (a professional services firm) (2001-2005 and 2012-2014); and Member of the Board of Directors, Deloitte & Touche LLP (2006-2012).
Trustee — Goldman Sachs Trust and Goldman Sachs Variable Insurance Trust. | 109 | Verizon Communications Inc. | |||||
107
GOLDMAN SACHS ALLOCATION FUNDS
Trustees and Officers (Unaudited) (continued)
Interested Trustee
Name, Address and Age1 | Position(s) Held with the Trust | Term of Office and Length of Time Served2 | Principal Occupation(s) During Past 5 Years | Number of Portfolios in Fund Complex Overseen by Trustee3 | Other Directorships Held by Trustee4 | |||||
James A. McNamara Age: 58 | President and Trustee | Since 2007 | Advisory Director, Goldman Sachs (January 2018-Present); Managing Director, Goldman Sachs (January 2000-December 2017); Director of Institutional Fund Sales, GSAM (April 1998-December 2000); and Senior Vice President and Manager, Dreyfus Institutional Service Corporation (January 1993- April 1998).
President and Trustee — Goldman Sachs Trust; Goldman Sachs Variable Insurance Trust; Goldman Sachs Trust II; Goldman Sachs MLP and Energy Renaissance Fund; Goldman Sachs ETF Trust; Goldman Sachs Credit Income Fund; and Goldman Sachs Real Estate Diversified Income Fund.
| 166 | None | |||||
| * | Mr. McNamara is considered to be an “Interested Trustee” because he holds positions with Goldman Sachs and owns securities issued by The Goldman Sachs Group, Inc. Mr. McNamara holds comparable positions with certain other companies of which Goldman Sachs, GSAM or an affiliate thereof is the investment adviser, administrator and/or distributor. |
| 1 | Each Trustee may be contacted by writing to the Trustee, c/o Goldman Sachs, 200 West Street, New York, New York, 10282, Attn: Caroline Kraus. Information is provided as of August 31, 2021. |
| 2 | Subject to such policies as may be adopted by the Board from time-to-time, each Trustee holds office for an indefinite term, until the earliest of: (a) the election of his or her successor; (b) the date the Trustee resigns or is removed by the Board or shareholders, in accordance with the Trust’s Declaration of Trust; or (c) the termination of the Trust. The Board has adopted policies which provide that each Independent Trustee shall retire as of December 31st of the calendar year in which he or she reaches (a) his or her 75th birthday or (b) the 15th anniversary of the date he or she became a Trustee, whichever is earlier, unless a waiver of such requirements shall have been adopted by a majority of the other Trustees. These policies may be changed by the Trustees without shareholder vote. |
| 3 | The Goldman Sachs Fund Complex includes certain other companies listed above for each respective Trustee. As of August 31, 2021, Goldman Sachs Trust consisted of 92 portfolios (90 of which offered shares to the public); Goldman Sachs Variable Insurance Trust consisted of 17 portfolios (13 of which offered shares to the public); Goldman Sachs Trust II consisted of 18 portfolios (16 of which offered shares to the public); Goldman Sachs ETF Trust consisted of 36 portfolios (21 of which offered shares to the public); and Goldman Sachs MLP and Energy Renaissance Fund, Goldman Sachs Credit Income Fund and Goldman Sachs Real Estate Diversified Income Fund each consisted of one portfolio. Goldman Sachs Credit Income Fund did not offer shares to the public. |
| 4 | This column includes only directorships of companies required to report to the Securities and Exchange Commission under the Securities Exchange Act of 1934 (i.e., “public companies”) or other investment companies registered under the Act. |
Additional information about the Trustees is available in the Funds’ Statement of Additional Information, which can be obtained from Goldman Sachs free of charge by calling this toll-free number (in the United States of America): 1-800-526-7384.
108
GOLDMAN SACHS ALLOCATION FUNDS
Trustees and Officers (Unaudited) (continued)
Officers of the Trust*
Name, Address and Age1 | Position(s) Held with the Trust | Term of Office and | Principal Occupation(s) During Past 5 Years | |||
James A. McNamara 200 West Street New York, NY 10282 Age: 58 | Trustee and President | Since 2007 | Advisory Director, Goldman Sachs (January 2018-Present); Managing Director, Goldman Sachs (January 2000-December 2017); Director of Institutional Fund Sales, GSAM (April 1998-December 2000); and Senior Vice President and Manager, Dreyfus Institutional Service Corporation (January 1993-April 1998).
President and Trustee — Goldman Sachs Trust; Goldman Sachs Variable Insurance Trust; Goldman Sachs Trust II; Goldman Sachs MLP and Energy Renaissance Fund; Goldman Sachs ETF Trust; Goldman Sachs Credit Income Fund; and Goldman Sachs Real Estate Diversified Income Fund. | |||
Caroline L. Kraus 200 West Street New York, NY 10282 Age: 44 | Secretary | Since 2012 | Managing Director, Goldman Sachs (January 2016-Present); Vice President, Goldman Sachs (August 2006-December 2015); Senior Counsel, Goldman Sachs (January 2020-Present); Associate General Counsel, Goldman Sachs (2012-December 2019); Assistant General Counsel, Goldman Sachs (August 2006-December 2011); and Associate, Weil, Gotshal & Manges, LLP (2002-2006).
Secretary — Goldman Sachs Trust (previously Assistant Secretary (2012)); Goldman Sachs Variable Insurance Trust (previously Assistant Secretary (2012)); Goldman Sachs Trust II; Goldman Sachs BDC, Inc.; Goldman Sachs Private Middle Market Credit LLC; Goldman Sachs Private Middle Market Credit II LLC; Goldman Sachs Middle Market Lending Corp.; Goldman Sachs MLP and Energy Renaissance Fund; Goldman Sachs ETF Trust; Goldman Sachs Credit Income Fund; and Goldman Sachs Real Estate Diversified Income Fund. | |||
Joseph F. DiMaria 30 Hudson Street Jersey City, NJ 07302 Age: 53 | Treasurer, Principal Financial Officer and Principal Accounting Officer | Since 2017 (Treasurer and Principal Financial Officer since 2019) | Managing Director, Goldman Sachs (November 2015-Present) and Vice President — Mutual Fund Administration, Columbia Management Investment Advisers, LLC (May 2010-October 2015).
Treasurer, Principal Financial Officer and Principal Accounting Officer — Goldman Sachs Trust (previously Assistant Treasurer (2016)); Goldman Sachs Variable Insurance Trust (previously Assistant Treasurer (2016)); Goldman Sachs Trust II (previously Assistant Treasurer (2017)); Goldman Sachs MLP and Energy Renaissance Fund (previously Assistant Treasurer (2017)); Goldman Sachs ETF Trust (previously Assistant Treasurer (2017)); Goldman Sachs Credit Income Fund; and Goldman Sachs Real Estate Diversified Income Fund. | |||
| * | Represents a partial list of officers of the Trust. Additional information about all the officers is available in the Funds’ Statement of Additional Information, which can be obtained from Goldman Sachs free of charge by calling this toll-free number (in the United States): 1-800-526-7384. |
| 1 | Information is provided as of August 31, 2021. |
| 2 | Officers hold office at the pleasure of the Board of Trustees or until their successors are duly elected and qualified. Each officer holds comparable positions with certain other companies of which Goldman Sachs, GSAM or an affiliate thereof is the investment adviser, administrator and/or distributor. |
Goldman Sachs Trust — Allocation Funds — Tax Information (Unaudited)
For the year ended August 31, 2021, 14.54%, and 0.98% of the dividends paid from net investment company taxable income by the Global Managed Beta, and Tactical Tilt Overlay Funds qualify for the dividends received deduction available to corporations.
From distributions paid during the fiscal year ended August 31, 2021, the total amount of income received by the Global Managed Beta Fund from sources within foreign countries and possessions of the United States was $0.0921 per share, all of which is attributable to qualified passive income. The percentage of net investment income dividends paid from foreign sources by the Global Managed Beta Fund was 21.77%. The total amount of taxes paid by the Global Managed Beta Fund to such countries was $0.0091.
For the year ended August 31, 2021, the Global Managed Beta and Tactical Tilt Overlay Funds designate 37.99%, and 0.66%, respectively, of the dividends paid from net investment company taxable income as qualifying for the reduced tax rate under the Jobs and Growth Tax Relief and Reconciliation Act of 2003.
Pursuant to Section 852 of the Internal Revenue Code, the Global Managed Beta and Strategic Factor Allocation Funds designate $29,204,538 and $86,395,097, or if different, the maximum amount allowable, as capital gain dividends paid during the fiscal year ended August 31, 2021.
During the year ended August 31, 2021, the Global Managed Beta and Strategic Factor Allocation Funds designate $29,425,368 and $39,852,191 respectively, as short-term capital gain dividends pursuant to Section 871(k) of the Internal Revenue Code.
109
FUNDS PROFILE
Goldman Sachs Funds
Goldman Sachs is a premier financial services firm, known since 1869 for creating thoughtful and customized investment solutions in complex global markets.
Today, the Asset Management Division of Goldman Sachs serves a diverse set of clients worldwide, including private institutions, public entities and individuals. With approximately $2.09 trillion in assets under supervision as of June 30, 2021, Goldman Sachs Asset Management has portfolio management teams located around the world and our investment professionals bring firsthand knowledge of local markets to every investment decision. Assets under supervision includes assets under management and other client assets for which Goldman Sachs does not have full discretion. Goldman Sachs Asset Management leverages the resources of Goldman Sachs & Co. LLC subject to legal, internal and regulatory restrictions.
Money Market
Financial Square FundsSM
| ∎ | Financial Square Treasury Solutions Fund1 |
| ∎ | Financial Square Government Fund1 |
| ∎ | Financial Square Money Market Fund2 |
| ∎ | Financial Square Prime Obligations Fund2 |
| ∎ | Financial Square Treasury Instruments Fund1 |
| ∎ | Financial Square Treasury Obligations Fund1 |
| ∎ | Financial Square Federal Instruments Fund1 |
Investor FundsSM
| ∎ | Investor Money Market Fund3 |
| ∎ | Investor Tax-Exempt Money Market Fund3 |
Fixed Income
Short Duration and Government
| ∎ | Enhanced Income Fund |
| ∎ | High Quality Floating Rate Fund |
| ∎ | Short-Term Conservative Income Fund |
| ∎ | Short Duration Government Fund |
| ∎ | Short Duration Bond Fund4 |
| ∎ | Government Income Fund |
| ∎ | Inflation Protected Securities Fund |
Multi-Sector
| ∎ | Bond Fund |
| ∎ | Core Fixed Income Fund |
| ∎ | Global Core Fixed Income Fund4 |
| ∎ | Strategic Income Fund |
| ∎ | Income Fund |
Municipal and Tax-Free
| ∎ | High Yield Municipal Fund |
| ∎ | Dynamic Municipal Income Fund |
| ∎ | Short Duration Tax-Free Fund |
| ∎ | Municipal Income Completion Fund |
Single Sector
| ∎ | Investment Grade Credit Fund |
| ∎ | U.S. Mortgages Fund |
| ∎ | High Yield Fund |
| ∎ | High Yield Floating Rate Fund |
| ∎ | Emerging Markets Debt Fund |
| ∎ | Local Emerging Markets Debt Fund |
Fixed Income Alternatives
| ∎ | Long Short Credit Strategies Fund |
Fundamental Equity
| ∎ | Equity Income Fund |
| ∎ | Small Cap Growth Fund |
| ∎ | Small Cap Value Fund |
| ∎ | Small/Mid Cap Value Fund |
| ∎ | Mid Cap Value Fund |
| ∎ | Large Cap Value Fund |
| ∎ | Focused Value Fund |
| ∎ | Capital Growth Fund |
| ∎ | Strategic Growth Fund |
| ∎ | Small/Mid Cap Growth Fund |
| ∎ | Flexible Cap Fund |
| ∎ | Concentrated Growth Fund |
| ∎ | Technology Opportunities Fund |
| ∎ | Growth Opportunities Fund |
| ∎ | Rising Dividend Growth Fund |
| ∎ | U.S. Equity ESG Fund |
| ∎ | Income Builder Fund |
Tax-Advantaged Equity
| ∎ | U.S. Tax-Managed Equity Fund |
| ∎ | International Tax-Managed Equity Fund |
| ∎ | U.S. Equity Dividend and Premium Fund |
| ∎ | International Equity Dividend and Premium Fund |
Equity Insights
| ∎ | Small Cap Equity Insights Fund |
| ∎ | U.S. Equity Insights Fund |
| ∎ | Small Cap Growth Insights Fund |
| ∎ | Large Cap Growth Insights Fund |
| ∎ | Large Cap Value Insights Fund |
| ∎ | Small Cap Value Insights Fund |
| ∎ | International Small Cap Insights Fund |
| ∎ | International Equity Insights Fund |
| ∎ | Emerging Markets Equity Insights Fund |
Fundamental Equity International
| ∎ | International Equity Income Fund |
| ∎ | International Equity ESG Fund |
| ∎ | China Equity Fund |
| ∎ | Emerging Markets Equity Fund |
| ∎ | ESG Emerging Markets Equity Fund |
Alternative
| ∎ | Real Estate Securities Fund |
| ∎ | International Real Estate Securities Fund |
| ∎ | Commodity Strategy Fund |
| ∎ | Global Real Estate Securities Fund |
| ∎ | Alternative Premia Fund |
| ∎ | Absolute Return Tracker Fund |
| ∎ | Managed Futures Strategy Fund |
| ∎ | MLP Energy Infrastructure Fund |
| ∎ | Energy Infrastructure Fund |
| ∎ | Multi-Manager Alternatives Fund |
| ∎ | Global Infrastructure Fund |
Total Portfolio Solutions
| ∎ | Global Managed Beta Fund |
| ∎ | Multi-Manager Non-Core Fixed Income Fund |
| ∎ | Multi-Manager U.S. Dynamic Equity Fund |
| ∎ | Multi-Manager Global Equity Fund |
| ∎ | Multi-Manager International Equity Fund |
| ∎ | Tactical Tilt Overlay Fund |
| ∎ | Balanced Strategy Portfolio |
| ∎ | Multi-Manager U.S. Small Cap Equity Fund |
| ∎ | Multi-Manager Real Assets Strategy Fund |
| ∎ | Growth and Income Strategy Portfolio |
| ∎ | Growth Strategy Portfolio |
| ∎ | Dynamic Global Equity Fund |
| ∎ | Satellite Strategies Portfolio |
| ∎ | Enhanced Dividend Global Equity Portfolio |
| ∎ | Tax-Advantaged Global Equity Portfolio |
| ∎ | Strategic Factor Allocation Fund |
| ∎ | Strategic Volatility Premium Fund |
| ∎ | Target Date Retirement Portfolio |
| ∎ | Target Date 2025 Portfolio |
| ∎ | Target Date 2030 Portfolio |
| ∎ | Target Date 2035 Portfolio |
| ∎ | Target Date 2040 Portfolio |
| ∎ | Target Date 2045 Portfolio |
| ∎ | Target Date 2050 Portfolio |
| ∎ | Target Date 2055 Portfolio |
| ∎ | Target Date 2060 Portfolio |
| ∎ | GQG Partners International Opportunities Fund |
| 1 | You could lose money by investing in the Fund. Although the Fund seeks to preserve the value of your investment at $1.00 per share, it cannot guarantee it will do so. An investment in the Fund is not a deposit of a bank and is not insured or guaranteed by the Federal Deposit Insurance Corporation or any other government agency. The Fund’s sponsor has no legal obligation to provide financial support to the Fund, and you should not expect that the sponsor will provide financial support to the Fund at any time. |
| 2 | You could lose money by investing in the Fund. Because the share price of the Fund will fluctuate, when you sell your shares they may be worth more or less than what you originally paid for them. The Fund may impose a fee upon sale of your shares or may temporarily suspend your ability to sell shares if the Fund’s liquidity falls below required minimums because of market conditions or other factors. An investment in the Fund is not a deposit of a bank and is not insured or guaranteed by the Federal Deposit Insurance Corporation or any other government agency. The Fund’s sponsor has no legal obligation to provide financial support to the Fund, and you should not expect that the sponsor will provide financial support to the Fund at any time. |
| 3 | You could lose money by investing in the Fund. Although the Fund seeks to preserve the value of your investment at $1.00 per share, it cannot guarantee it will do so. The Fund may impose a fee upon sale of your shares or may temporarily suspend your ability to sell shares if the Fund’s liquidity falls below required minimums because of market conditions or other factors. An investment in the Fund is not a deposit of a bank and is not insured or guaranteed by the Federal Deposit Insurance Corporation or any other government agency. The Fund’s sponsor has no legal obligation to provide financial support to the Fund, and you should not expect that the sponsor will provide financial support to the Fund at any time. |
| 4 | Effective after the close of business on July 29, 2021, the Goldman Sachs Short Duration Income Fund was renamed the Goldman Sachs Short Duration Bond Fund. |
| Financial Square FundsSM and Investor FundsSM are registered service marks of Goldman Sachs & Co. LLC. |
| * | This list covers open-end funds only. Please visit our website at www.GSAMFUNDS.com to learn about our closed-end funds and exchange-traded funds. |
TRUSTEES Jessica Palmer, Chair Dwight L. Bush Kathryn A. Cassidy Diana M. Daniels Joaquin Delgado James A. McNamara Roy W. Templin Gregory G. Weaver | OFFICERS James A. McNamara, President Joseph F. DiMaria, Principal Financial Officer, Principal Accounting Officer and Treasurer Caroline L. Kraus, Secretary | |
GOLDMAN SACHS & CO. LLC Distributor and Transfer Agent | GOLDMAN SACHS ASSET MANAGEMENT, L.P. Investment Adviser | |
Visit our web site at www.GSAMFUNDS.com to obtain the most recent month-end returns.
Goldman Sachs Asset Management, L.P., 200 West Street, New York, New York 10282
The reports concerning the Fund included in this shareholder report may contain certain forward-looking statements about the factors that may affect the performance of the Fund in the future. These statements are based on Fund management’s predictions and expectations concerning certain future events and their expected impact on the Fund, such as performance of the economy as a whole and of specific industry sectors, changes in the levels of interest rates, the impact of developing world events, and other factors that may influence the future performance of the Fund. Management believes these forward-looking statements to be reasonable, although they are inherently uncertain and difficult to predict. Actual events may cause adjustments in portfolio management strategies from those currently expected to be employed.
A description of the policies and procedures that the Fund uses to determine how to vote proxies relating to portfolio securities and information regarding how the Fund voted proxies relating to portfolio securities during the most recent 12-month period ended June 30 is available (i) without charge, upon request by calling 1-800-621-2550 (for Institutional Shareholders); and (ii) on the Securities and Exchange Commission (“SEC”) web site at http://www.sec.gov.
The website links provided are for your convenience only and are not an endorsement or recommendation by GSAM of any of these websites or the products or services offered. GSAM is not responsible for the accuracy and validity of the content of these websites.
The Fund will file portfolio holdings information for each month in a fiscal quarter within 60 days after the end of the relevant fiscal quarter on Form N-PORT. Portfolio holdings information for the third month of each fiscal quarter will be made available on the SEC’s web site at http://www.sec.gov. Portfolio holdings information may be obtained upon request and without charge by calling 1-800-621-2550 (for Institutional Shareholders).
Fund holdings and allocations shown are as of August 31, 2021 and may not be representative of future investments. Fund holdings should not be relied on in making investment decisions and should not be construed as research or investment advice regarding particular securities. Current and future holdings are subject to risk.
Economic and market forecasts presented herein reflect our judgment as of the date of this presentation and are subject to change without notice. These forecasts do not take into account the specific investment objectives, restrictions, tax and financial situation or other needs of any specific client. Actual data will vary and may not be reflected here. These forecasts are subject to high levels of uncertainty that may affect actual performance. Accordingly, these forecasts should be viewed as merely representative of a broad range of possible outcomes. These forecasts are estimated, based on assumptions, and are subject to significant revision and may change materially as economic and market conditions change. Goldman Sachs has no obligation to provide updates or changes to these forecasts. Case studies and examples are for illustrative purposes only.
Diversification does not protect an investor from market risk and does not ensure a profit.
This material is not authorized for distribution to prospective investors unless preceded or accompanied by a current Prospectus or summary prospectus, if applicable. Investors should consider the Fund’s objective, risks, and charges and expenses, and read the summary prospectus, if available, and/or the Prospectus carefully before investing or sending money. The summary prospectus, if available, and the Prospectus contain this and other information about the Fund and may be obtained from your authorized dealer or from Goldman Sachs & Co. LLC by calling 1-800-621-2550.
© 2021 Goldman Sachs. All rights reserved. 256205-OTU-1495636 ALLOCATEAR-21
| ITEM 2. | CODE OF ETHICS. |
(a) As of the end of the period covered by this report, the registrant has adopted a code of ethics that applies to the registrant’s principal executive officer, principal financial officer, principal accounting officer or controller, or persons performing similar functions, regardless of whether these individuals are employed by the registrant or a third party (the “Code of Ethics”).
(b) Not applicable.
(c) During the period covered by this report, no amendments were made to the provisions of the Code of Ethics.
(d) During the period covered by this report, the registrant did not grant any waivers, including an implicit waiver, from any provision of the Code of Ethics.
(e) Not applicable.
(f) A copy of the Code of Ethics is available as provided in Item 13(a)(1) of this report.
| ITEM 3. | AUDIT COMMITTEE FINANCIAL EXPERT. |
The registrant’s board of trustees has determined that the registrant has at least one “audit committee financial expert” (as defined in Item 3 of Form N-CSR) serving on its audit committee. Gregory G. Weaver is the “audit committee financial expert” and is “independent” (as each term is defined in Item 3 of Form N-CSR).
| ITEM 4. | PRINCIPAL ACCOUNTANT FEES AND SERVICES. |
Table 1 — Items 4(a) - 4(d). The accountant fees below reflect the aggregate fees billed by all of the Funds of the Goldman Sachs Trust and includes the Goldman Sachs Funds to which this certified shareholder report relates.
| 2021 | 2020 | Description of Services Rendered | ||||||||||
|
|
|
|
| ||||||||
Audit Fees: | ||||||||||||
| • PricewaterhouseCoopers LLP (“PwC”) | $ | 3,038,544 | $ | 3,807,235 | Financial Statement audits. | |||||||
Audit-Related Fees: | ||||||||||||
• PwC | $ | 571,408 | $ | 247,647 | Other attest services. | |||||||
Tax Fees: | ||||||||||||
• PwC | $ | 0 | $ | 290,614 | Tax compliance services provided in connection with the preparation and review of registrant’s tax returns and certain other tax-related services. | |||||||
Table 2 — Items 4(b)(c) & (d). Non-Audit Services to the Goldman Sachs Trust’s service affiliates* that were pre-approved by the Audit Committee of the Goldman Sachs Trust pursuant to Rule 2-01(c)(7)(ii) of Regulation S-X.
| 2021 | 2020 | Description of Services Rendered | ||||||||||
|
|
|
|
| ||||||||
Audit-Related Fees: | ||||||||||||
• PwC | $ | 1,906,448 | $ | 2,000,617 | Internal control review performed in accordance with Statement on Standards for Attestation Engagements No. 16 and Semi-Annual Updates related to withholding tax accrual for non-US Jurisdictions. These fees are borne by the Funds’ Adviser. | |||||||
| * | These include the advisor (excluding sub-advisors) and any entity controlling, controlled by or under common control with the advisor that provides ongoing services to the registrant (hereinafter referred to as “service affiliates”). |
Item 4(e)(1) — Audit Committee Pre-Approval Policies and Procedures
Pre-Approval of Audit and Non-Audit Services Provided to the Funds of the Goldman Sachs Trust. The Audit and Non-Audit Services Pre-Approval Policy (the “Policy”) adopted by the Audit Committee of Goldman Sachs Trust (“GST”) sets forth the procedures and the conditions pursuant to which services performed by an independent auditor for GST may be pre-approved. Services may be pre-approved specifically by the Audit Committee as a whole or, in certain circumstances, by the Audit Committee Chairman or the person designated as the Audit Committee Financial Expert. In addition, subject to specified cost limitations, certain services may be pre-approved under the provisions of the Policy. The Policy provides that the Audit Committee will consider whether the services provided by an independent auditor are consistent with the Securities and Exchange Commission’s rules on auditor independence. The Policy provides for periodic review and pre-approval by the Audit Committee of the services that may be provided by the independent auditor.
De Minimis Waiver. The pre-approval requirements of the Policy may be waived with respect to the provision of non-audit services that are permissible for an independent auditor to perform, provided (1) the aggregate amount of all such services provided constitutes no more than five percent of the total amount of revenues subject to pre-approval that was paid to the independent auditors during the fiscal year in which the services are provided; (2) such services were not recognized by GST at the time of the engagement to be non-audit services; and (3) such services are promptly brought to the attention of the Audit Committee and approved prior to the completion of the audit by the Audit Committee or by one or more members of the Audit Committee to whom authority to grant such approvals has been delegated by the Audit Committee, pursuant to the pre-approval provisions of the Policy.
Pre-Approval of Non-Audit Services Provided to GST’s Investment Advisers. The Policy provides that, in addition to requiring pre-approval of audit and non-audit services provided to GST, the Audit Committee will pre-approve those non-audit services provided to GST’s investment advisers (and entities controlling, controlled by or under common control with the investment advisers that provide ongoing services to GST) where the engagement relates directly to the operations or financial reporting of GST.
Item 4(e)(2) – 0% of the audit-related fees, tax fees and other fees listed in Table 1 were approved by GST’s Audit Committee pursuant to the “de minimis” exception of Rule 2-01(c)(7)(i)(C) of Regulation S-X. In addition, 0% of the non-audit services to the GST’s service affiliates listed in Table 2 were approved by GST’s Audit Committee pursuant to the “de minimis” exception of Rule 2-01(c)(7)(i)(C) of Regulation S-X.
Item 4(f) – Not applicable.
Item 4(g) Aggregate Non-Audit Fees Disclosure
The aggregate non-audit fees billed to GST by PwC for the twelve months ended August 31, 2021 and August 31, 2020 were approximately 571,408 and $538,261 respectively. The aggregate non-audit fees billed to GST’s adviser and service affiliates by PwC for non-audit services for the twelve months ended December 31, 2020 and December 31, 2019 were approximately $14.5 million and $14.7 million respectively. With regard to the aggregate non-audit fees billed to GST’s adviser and service affiliates, the 2020 and 2019 amounts include fees for non-audit services required to be pre-approved [see Table 2] and fees for non-audit services that did not require pre-approval since they did not directly relate to GST’s operations or financial reporting.
Item 4(h) — GST’s Audit Committee has considered whether the provision of non-audit services to GST’s investment adviser and service affiliates that did not require pre-approval pursuant to paragraph (c)(7)(ii) of Rule 2-01 of Regulation S-X is compatible with maintaining the auditors’ independence.
| ITEM 5. | AUDIT COMMITTEE OF LISTED REGISTRANTS. |
Not applicable. |
| ITEM 6. | SCHEDULE OF INVESTMENTS. |
Schedule of Investments is included as part of the Report to Shareholders filed under Item 1. |
| ITEM 7. | DISCLOSURE OF PROXY VOTING POLICIES AND PROCEDURES FOR CLOSED-END MANAGEMENT INVESTMENT COMPANIES. |
Not applicable. |
| ITEM 8. | PORTFOLIO MANAGERS OF CLOSED-END MANAGEMENT INVESTMENT COMPANIES. |
Not applicable. |
| ITEM 9. | PURCHASES OF EQUITY SECURITIES BY CLOSED-END MANAGEMENT INVESTMENT COMPANY AND AFFILIATED PURCHASERS. |
Not applicable. |
| ITEM 10. | SUBMISSION OF MATTERS TO A VOTE OF SECURITY HOLDERS. |
There have been no material changes to the procedures by which shareholders may recommend nominees to the registrant’s board of trustees. |
| ITEM 11. | CONTROLS AND PROCEDURES. |
| (a) | The registrant’s principal executive and principal financial officers, or persons performing similar functions have concluded that the registrant’s disclosure controls and procedures (as defined in Rule 30a-3(c) under the Investment Company Act of 1940, as amended (the “1940 Act”)) are effective as of a date within 90 days of the filing of this report that includes the disclosure required by this paragraph, based on the evaluation of these controls and procedures required by Rule 30a-3(b) under the 1940 Act and 15d-15(b) under the Securities Exchange Act of 1934, as amended. |
| (b) | There were no changes in the registrant’s internal control over financial reporting (as defined in Rule 30a-3(d) under the 1940 Act) that occurred during the period covered by this report that have materially affected, or are reasonably likely to materially affect, the registrant’s internal control over financial reporting. |
| ITEM 12. | DISCLOSURE OF SECURITIES LENDING ACTIVITIES FOR CLOSED-END MANAGEMENT INVESTMENT COMPANIES. |
Not applicable. |
| ITEM 13. | EXHIBITS. |
| (a)(1) | Goldman Sachs Trust’s Code of Ethics for Principal Executive and Senior Financial Officers is incorporated by reference to Exhibit 13(a)(1) of the registrant’s Form N-CSR filed on August 31, 2021. | |||
| (a)(2) | Exhibit 99.CERT | Certifications pursuant to Section 302 of the Sarbanes-Oxley Act of 2002 filed herewith. | ||
| (a)(3) | Not applicable to open-end investment companies. | |||
| (a)(4) | There was no change in the registrant’s independent public accountant for the period covered by this report. | |||
| (b) | Exhibit 99.906CERT | Certifications pursuant to Section 906 of the Sarbanes-Oxley Act of 2002 filed herewith. | ||
SIGNATURES
Pursuant to the requirements of the Securities Exchange Act of 1934 and the Investment Company Act of 1940, the registrant has duly caused this report to be signed on its behalf by the undersigned, thereunto duly authorized.
| Goldman Sachs Trust | ||
| By: | /s/ James A. McNamara | |
| ||
James A. McNamara | ||
| President/Chief Executive Officer | ||
| Goldman Sachs Trust | ||
| Date: | November 4, 2021 | |
Pursuant to the requirements of the Securities Exchange Act of 1934 and the Investment Company Act of 1940, this report has been signed below by the following persons on behalf of the registrant and in the capacities and on the dates indicated.
| By: | /s/ James A. McNamara | |
| ||
James A. McNamara | ||
| President/Chief Executive Officer | ||
| Goldman Sachs Trust | ||
| Date: | November 4, 2021 | |
| By: | /s/ Joseph F. DiMaria | |
| ||
Joseph F. DiMaria | ||
| Principal Financial Officer | ||
| Goldman Sachs Trust | ||
| Date: | November 4, 2021 | |