Exhibit 99.4 Forward-Looking Statements This document and accompanying oral presentation contain and other CHS Inc. internally and publicly available documents contain, and CHS officers and representatives may from time to time make, “forward–looking statements” within the meaning of the safe harbor provisions of the U.S. Private Securities Litigation Report Act of 1995. Forward– looking statements can be identified by words such as “anticipate,” “intend,” “plan,” “goal,” “seek,” “believe,” “project,” “estimate,” “expect,” “strategy,” “future,” “likely,” “may,” “should,” “will” and similar references to future periods. Forward– looking statements are neither historical facts nor assurances of future performance. Instead, they are based only on CHS current beliefs, expectations and assumptions regarding the future of its businesses, future plans and strategies, projections, anticipated events and trends, the economy and other future conditions. Because forward–looking statements relate to the future, they are subject to inherent uncertainties, risks and changes in circumstances that are difficult to predict and many of which are outside of CHS control. CHS actual results and financial condition may differ materially from those indicated in the forward–looking statements. Therefore, you should not place undue reliance on any of these forward–looking statements. Important factors that could cause CHS actual results and financial condition to differ materially from those indicated in the forward–looking statements are discussed or identified in CHS filings made with the U.S. Securities and Exchange Commission, including in the "Risk Factors" discussion in Item 1A of CHS Annual Report on Form 10–K for the fiscal year ended August 31, 2019. Any forward–looking statements made by CHS in this document are based only on information currently available to CHS and speak only as of the date on which the statement is made. CHS undertakes no obligation to update any forward–looking statement, whether written or oral, that may be made from time to time, whether as a result of new information, future developments or otherwise except as required by applicable law. © 2019 CHS Inc. Public 1
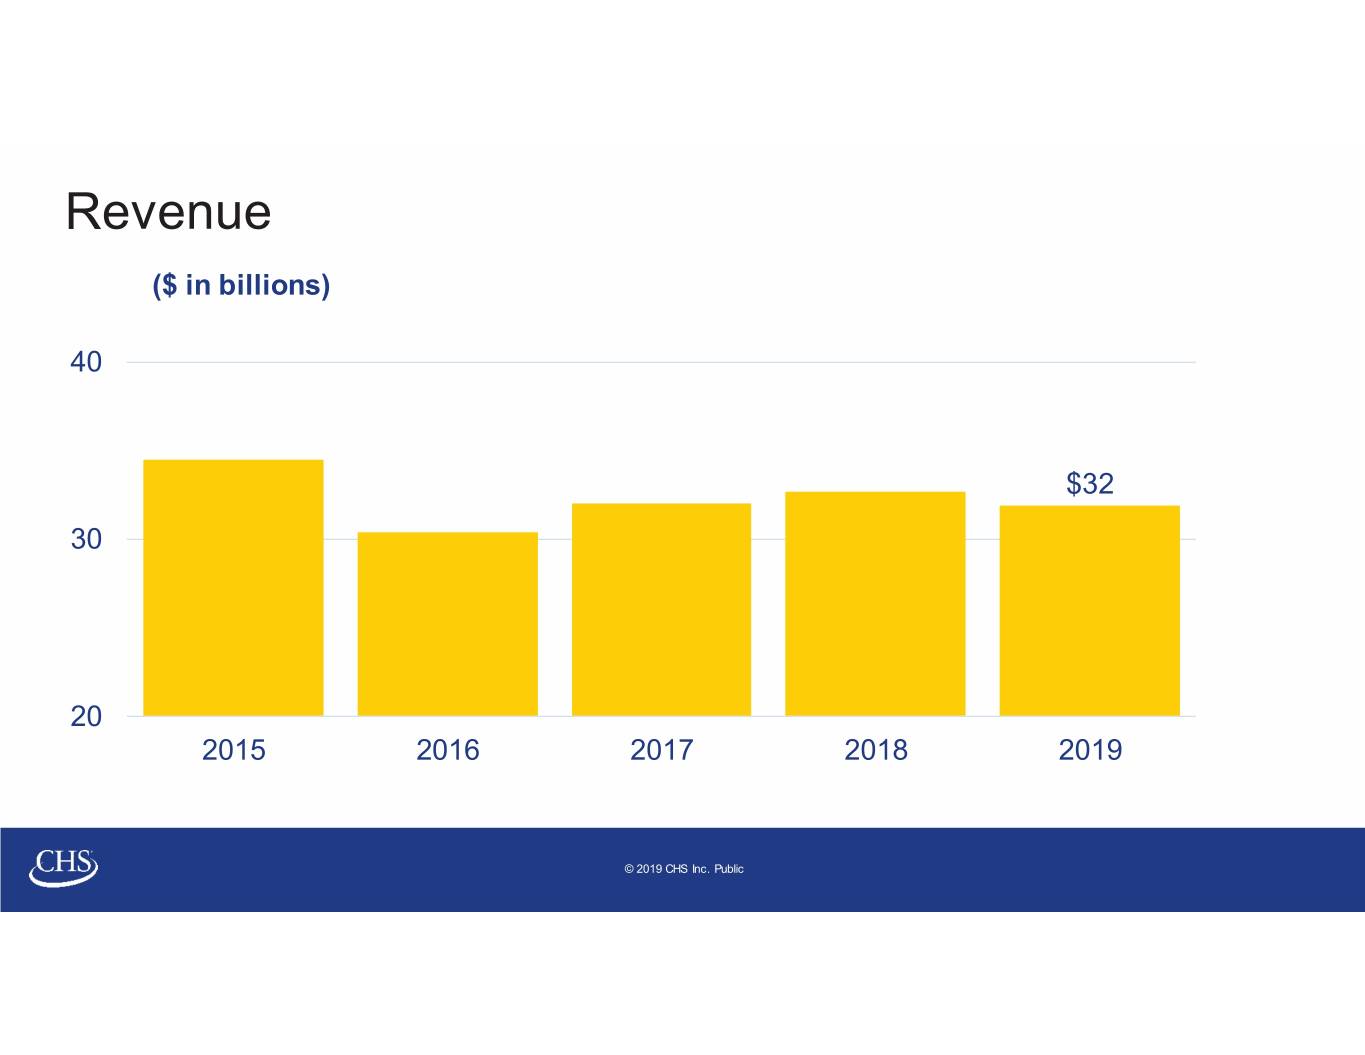
Revenue ($ in billions) 40 $32 30 20 2015 2016 2017 2018 2019 © 2019 CHS Inc. Public
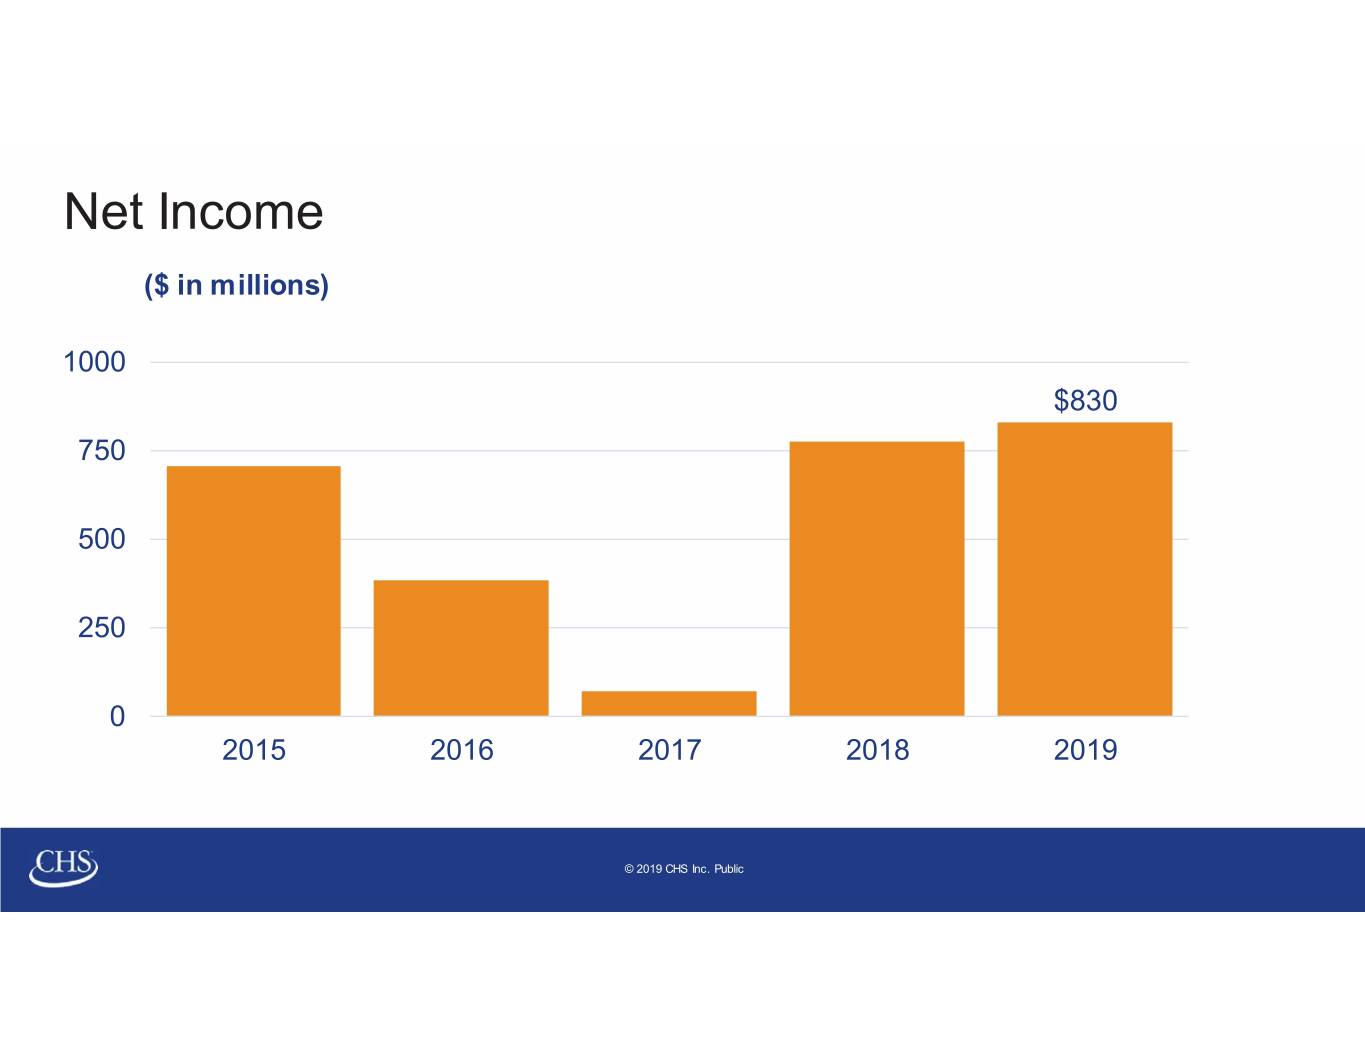
Net Income ($ in millions) 1000 $830 750 500 250 0 2015 2016 2017 2018 2019 © 2019 CHS Inc. Public
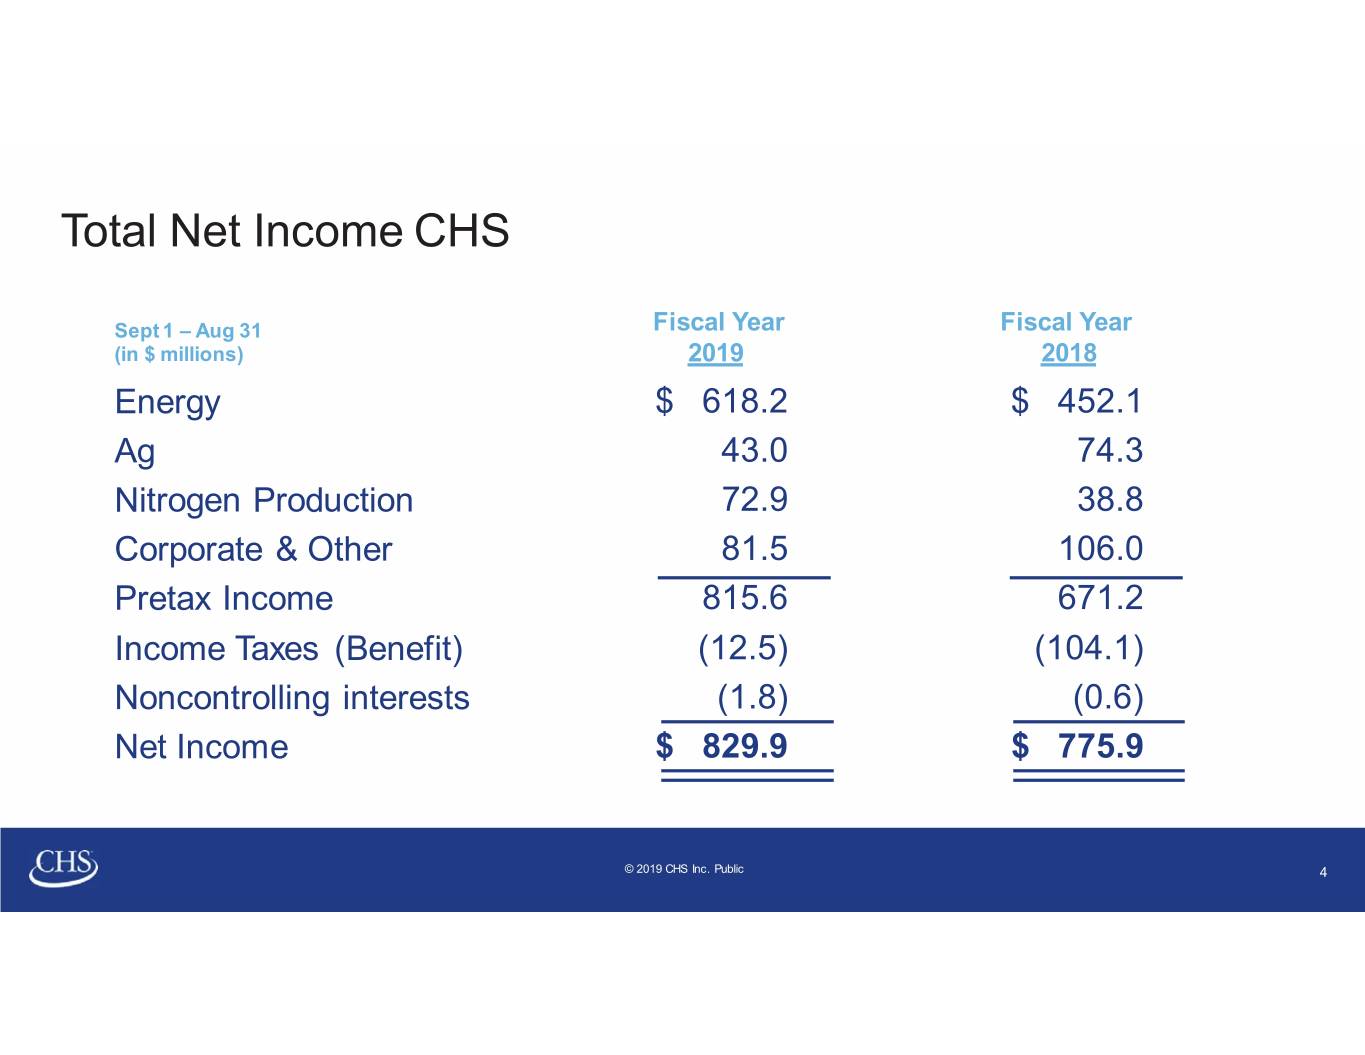
Total Net Income CHS Sept 1 – Aug 31 Fiscal Year Fiscal Year (in $ millions) 2019 2018 Energy $ 618.2 $ 452.1 Ag 43.0 74.3 Nitrogen Production 72.9 38.8 Corporate & Other 81.5 106.0 Pretax Income 815.6 671.2 Income Taxes (Benefit) (12.5) (104.1) Noncontrolling interests (1.8) (0.6) Net Income $ 829.9 $ 775.9 © 2019 CHS Inc. Public 4
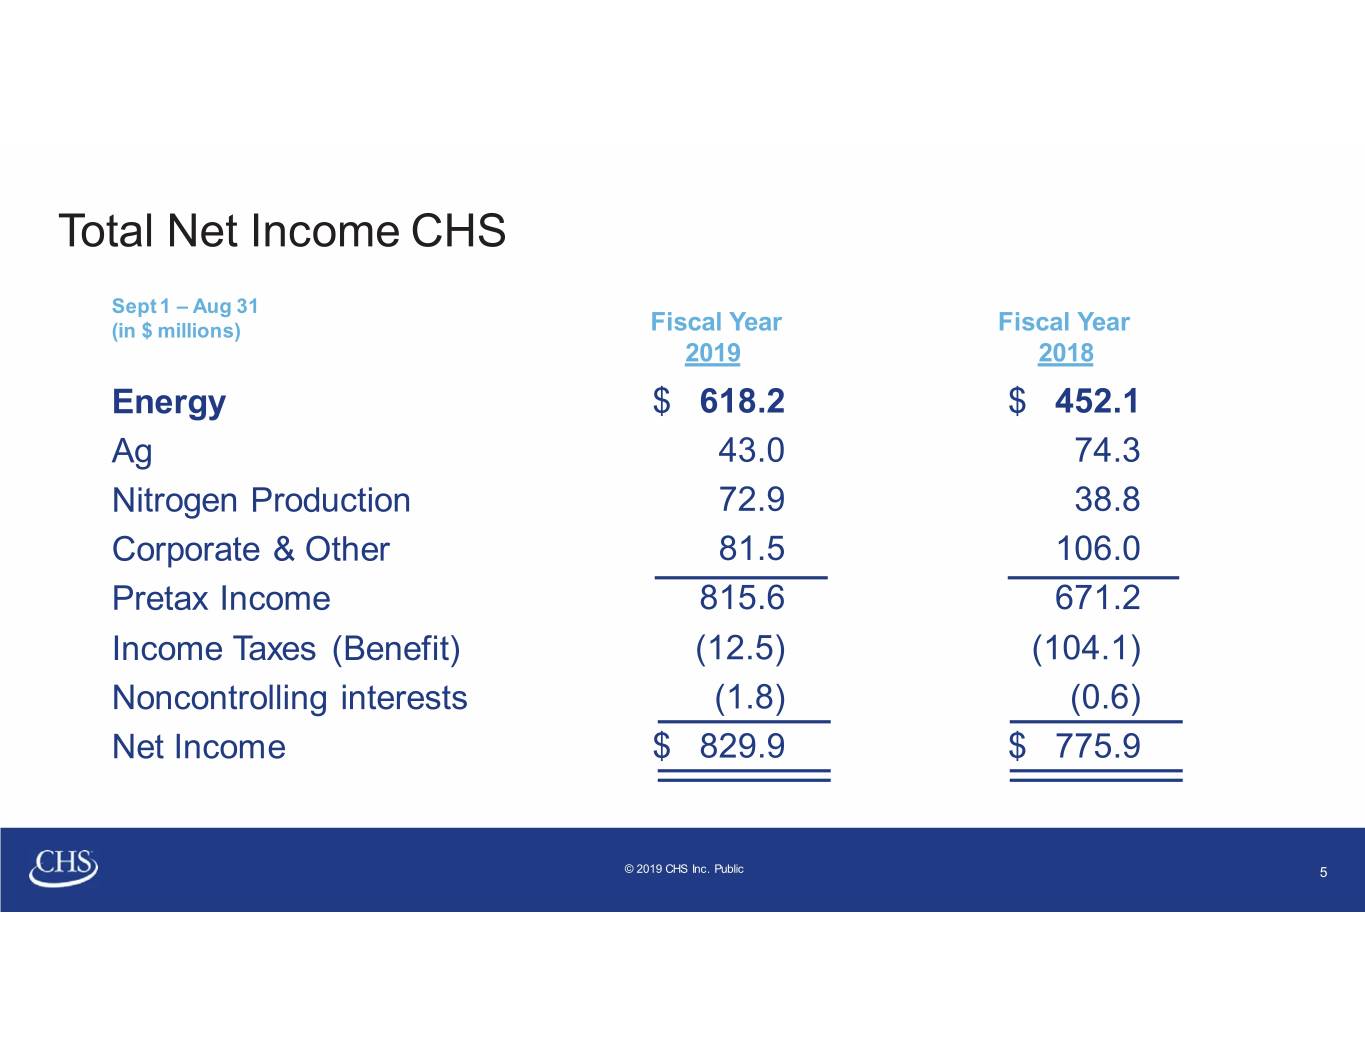
Total Net Income CHS Sept 1 – Aug 31 (in $ millions) Fiscal Year Fiscal Year 2019 2018 Energy $ 618.2 $ 452.1 Ag 43.0 74.3 Nitrogen Production 72.9 38.8 Corporate & Other 81.5 106.0 Pretax Income 815.6 671.2 Income Taxes (Benefit) (12.5) (104.1) Noncontrolling interests (1.8) (0.6) Net Income $ 829.9 $ 775.9 © 2019 CHS Inc. Public 5
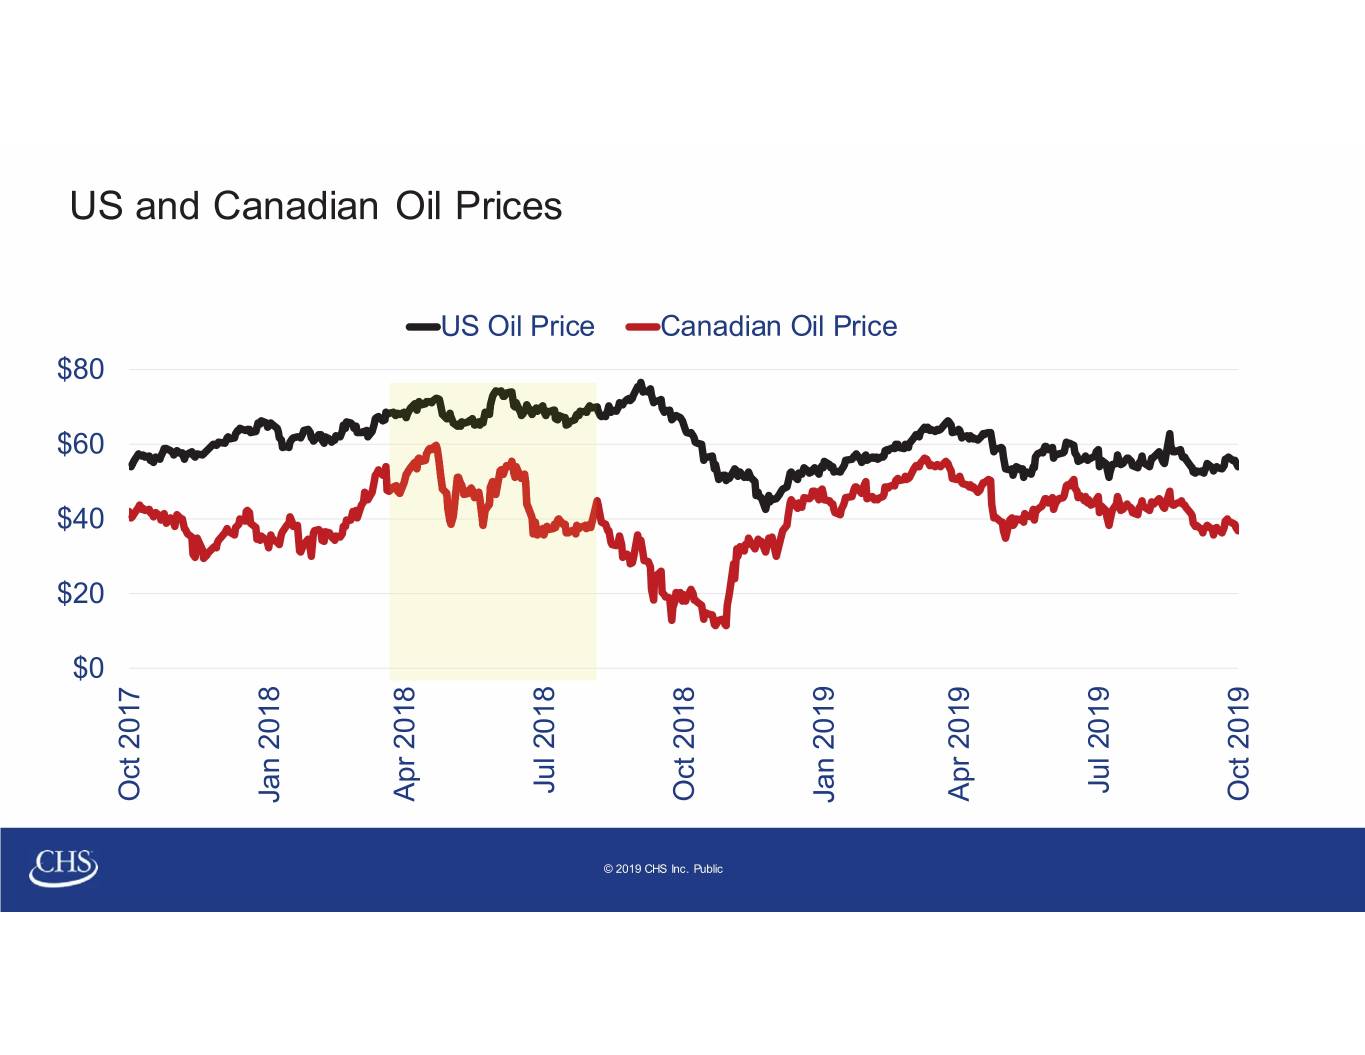
US and Canadian Oil Prices US Oil Price Canadian Oil Price $80 $60 $40 $20 $0 Jul Jul 2019 Jul 2018 Jul Oct 2019 Oct Oct 2017 Oct 2018 Oct Apr 2019 Apr Apr 2018 Apr Jan 2019 Jan Jan 2018 Jan © 2019 CHS Inc. Public
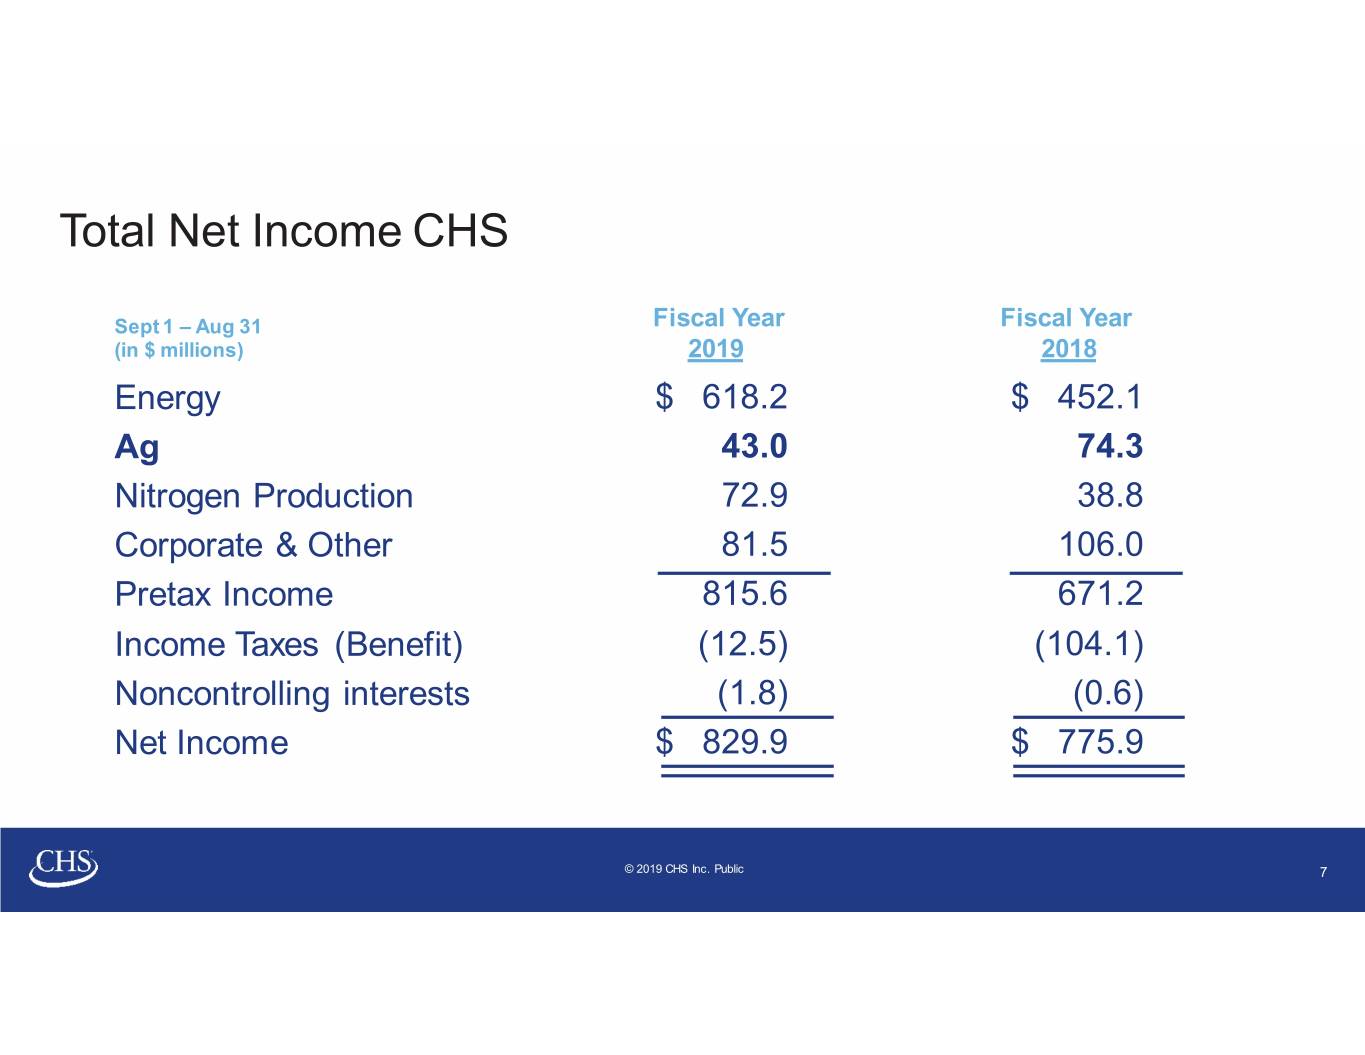
Total Net Income CHS Sept 1 – Aug 31 Fiscal Year Fiscal Year (in $ millions) 2019 2018 Energy $ 618.2 $ 452.1 Ag 43.0 74.3 Nitrogen Production 72.9 38.8 Corporate & Other 81.5 106.0 Pretax Income 815.6 671.2 Income Taxes (Benefit) (12.5) (104.1) Noncontrolling interests (1.8) (0.6) Net Income $ 829.9 $ 775.9 © 2019 CHS Inc. Public 7
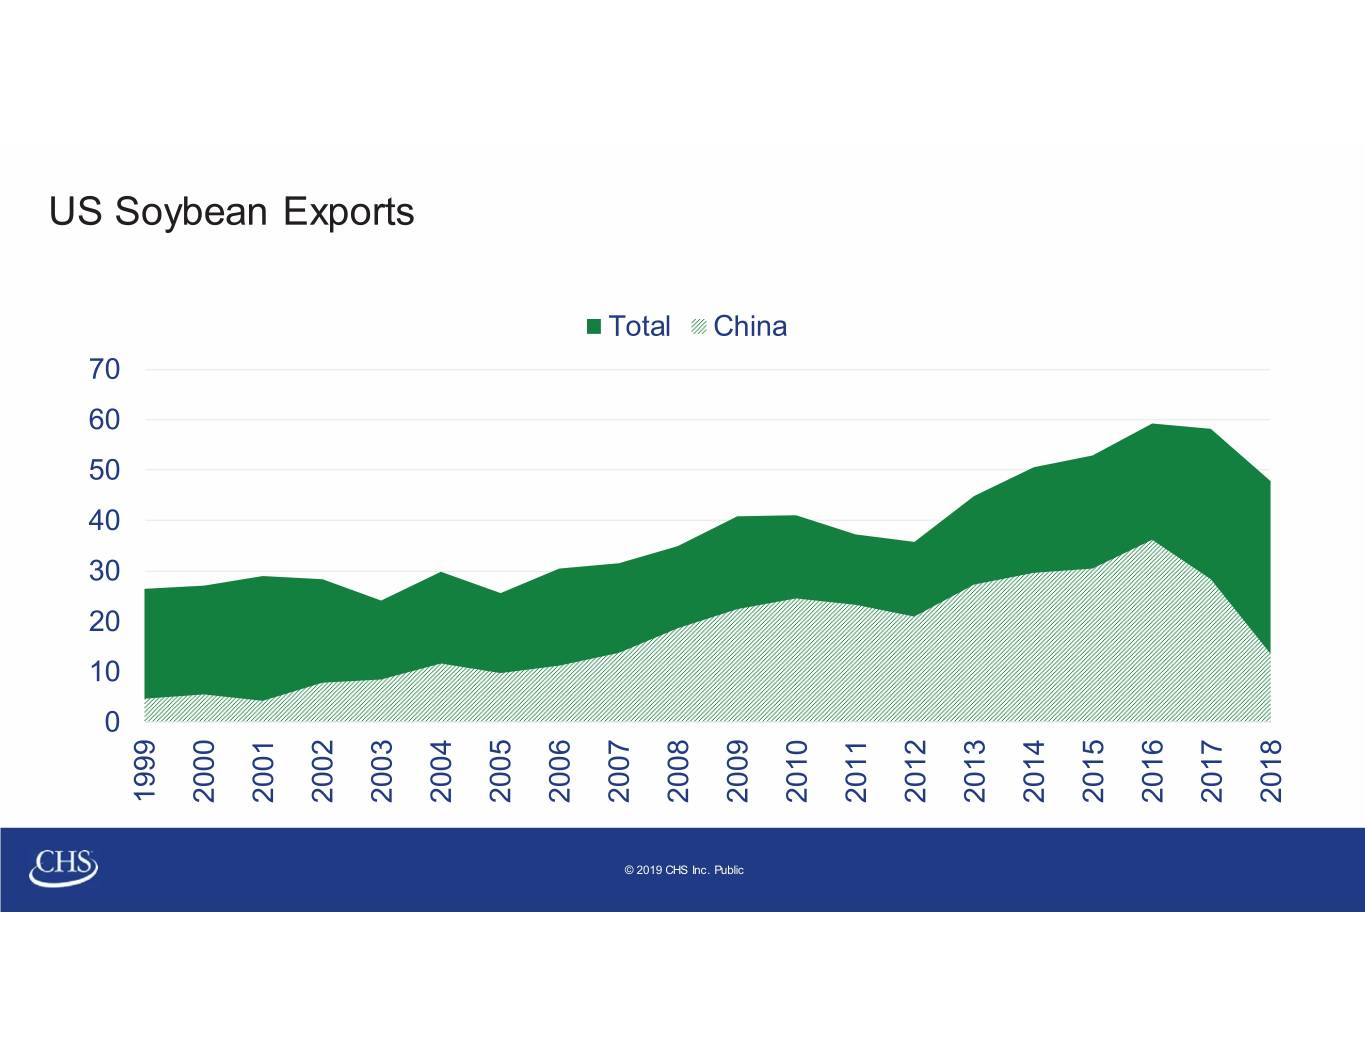
US Soybean Exports Total China 70 60 50 40 30 20 10 0 2017 2018 1999 2000 2001 2002 2003 2004 2005 2006 2007 2008 2009 2010 2011 2012 2013 2014 2015 2016 © 2019 CHS Inc. Public

Total Net Income CHS Sept 1 – Aug 31 Fiscal Year Fiscal Year (in $ millions) 2019 2018 Energy $ 618.2 $ 452.1 Ag 43.0 74.3 Nitrogen Production 72.9 38.8 Corporate & Other 81.5 106.0 Pretax Income 815.6 671.2 Income Taxes (Benefit) (12.5) (104.1) Noncontrolling interests (1.8) (0.6) Net Income $ 829.9 $ 775.9 © 2019 CHS Inc. Public 9
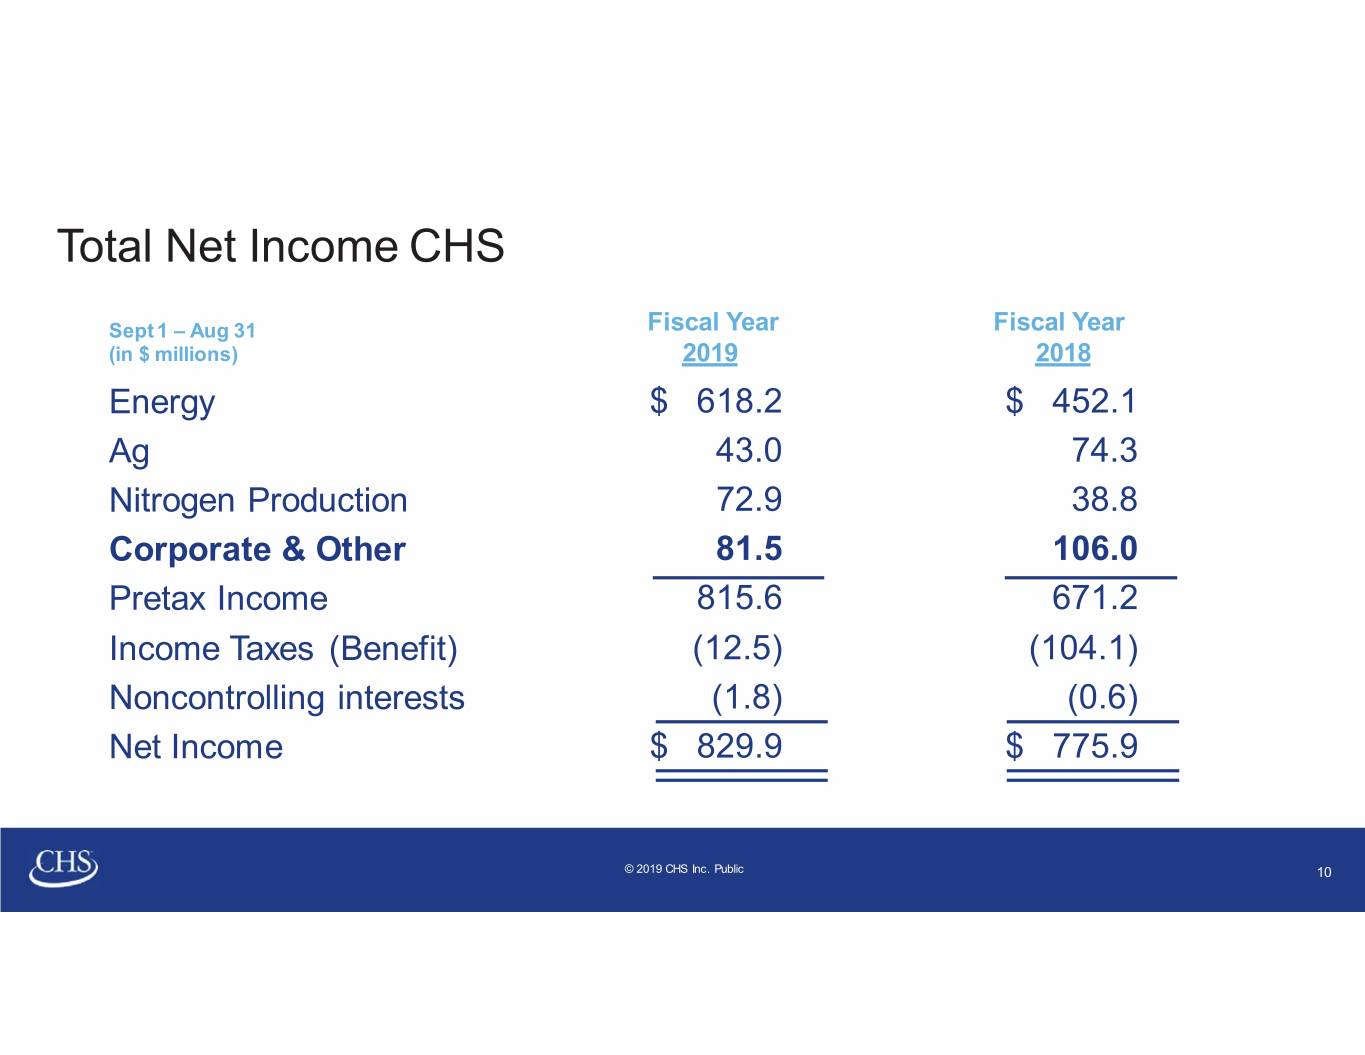
Total Net Income CHS Sept 1 – Aug 31 Fiscal Year Fiscal Year (in $ millions) 2019 2018 Energy $ 618.2 $ 452.1 Ag 43.0 74.3 Nitrogen Production 72.9 38.8 Corporate & Other 81.5 106.0 Pretax Income 815.6 671.2 Income Taxes (Benefit) (12.5) (104.1) Noncontrolling interests (1.8) (0.6) Net Income $ 829.9 $ 775.9 © 2019 CHS Inc. Public 10

Total Net Income CHS Sept 1 – Aug 31 Fiscal Year Fiscal Year (in $ millions) 2019 2018 Energy $ 618.2 $ 452.1 Ag 43.0 74.3 Nitrogen Production 72.9 38.8 Corporate & Other 81.5 106.0 Pretax Income 815.6 671.2 Income Taxes (Benefit) (12.5) (104.1) Noncontrolling interests (1.8) (0.6) Net Income $ 829.9 $ 775.9 © 2019 CHS Inc. Public 11
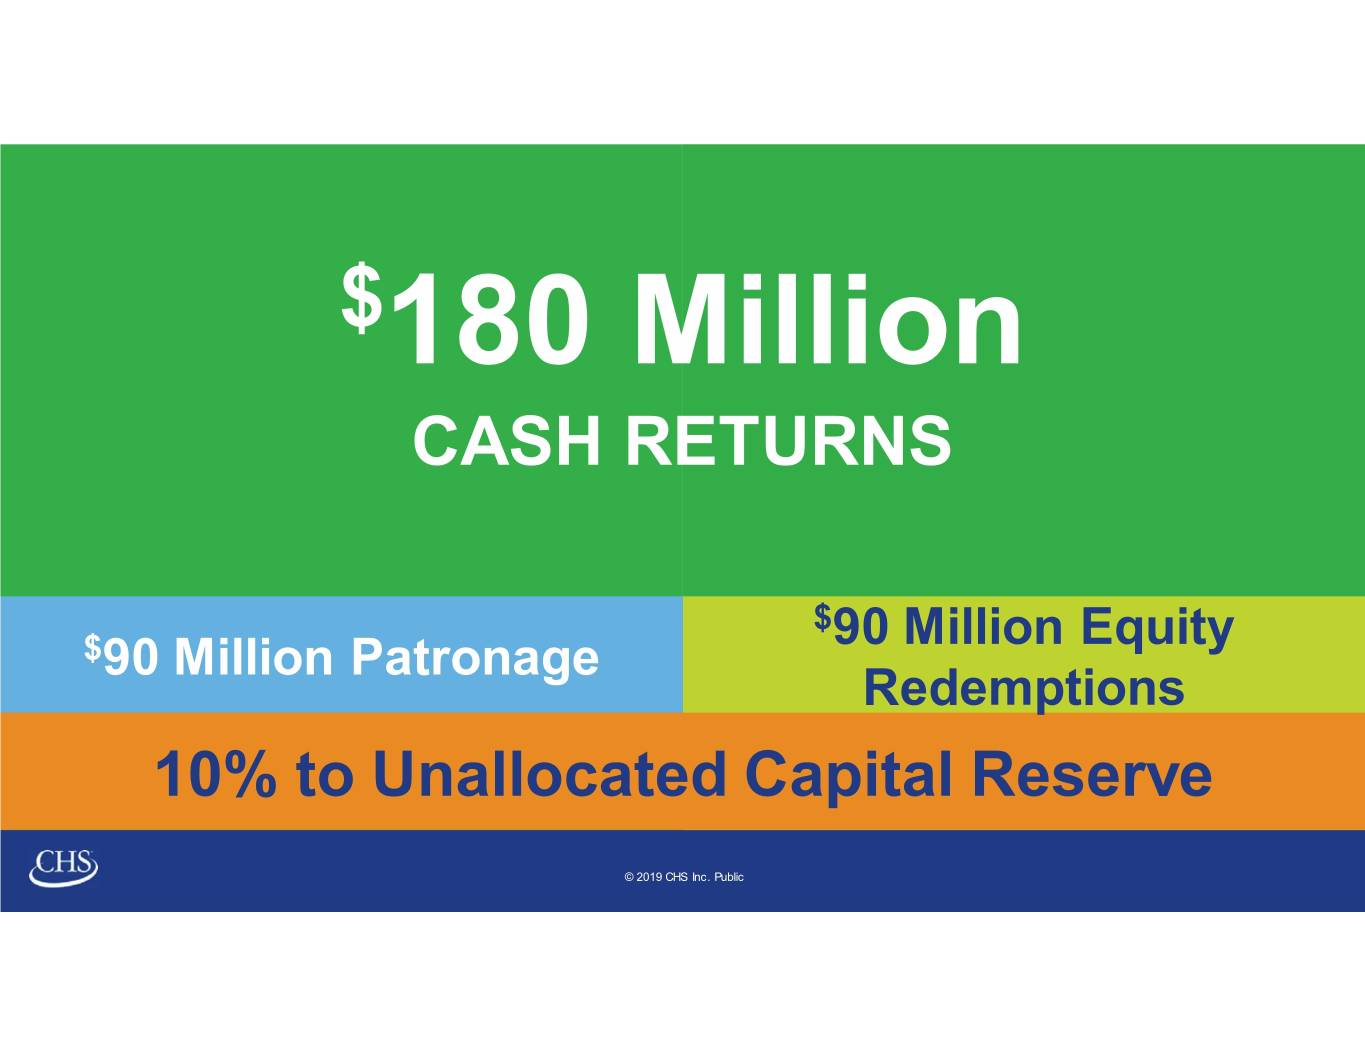
$180 Million CASH RETURNS $90 Million Equity $90 Million Patronage Redemptions 10% to Unallocated Capital Reserve © 2019 CHS Inc. Public
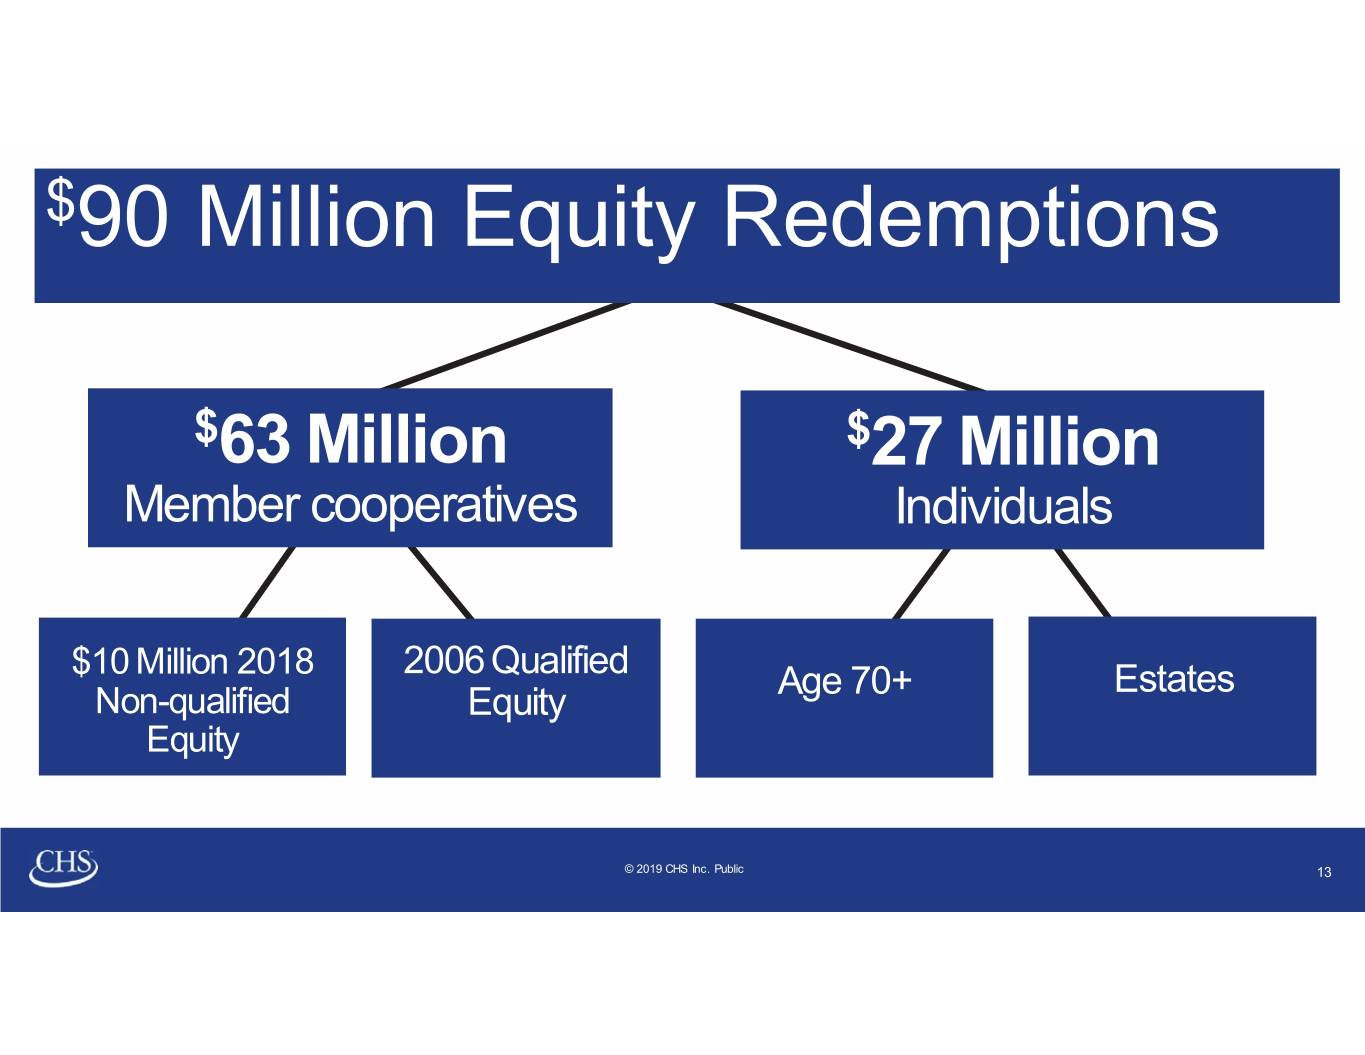
$90 Million Equity Redemptions $63 Million $27 Million Member cooperatives Individuals $10 Million 2018 2006 Qualified Age 70+ Estates Non-qualified Equity Equity © 2019 CHS Inc. Public 13
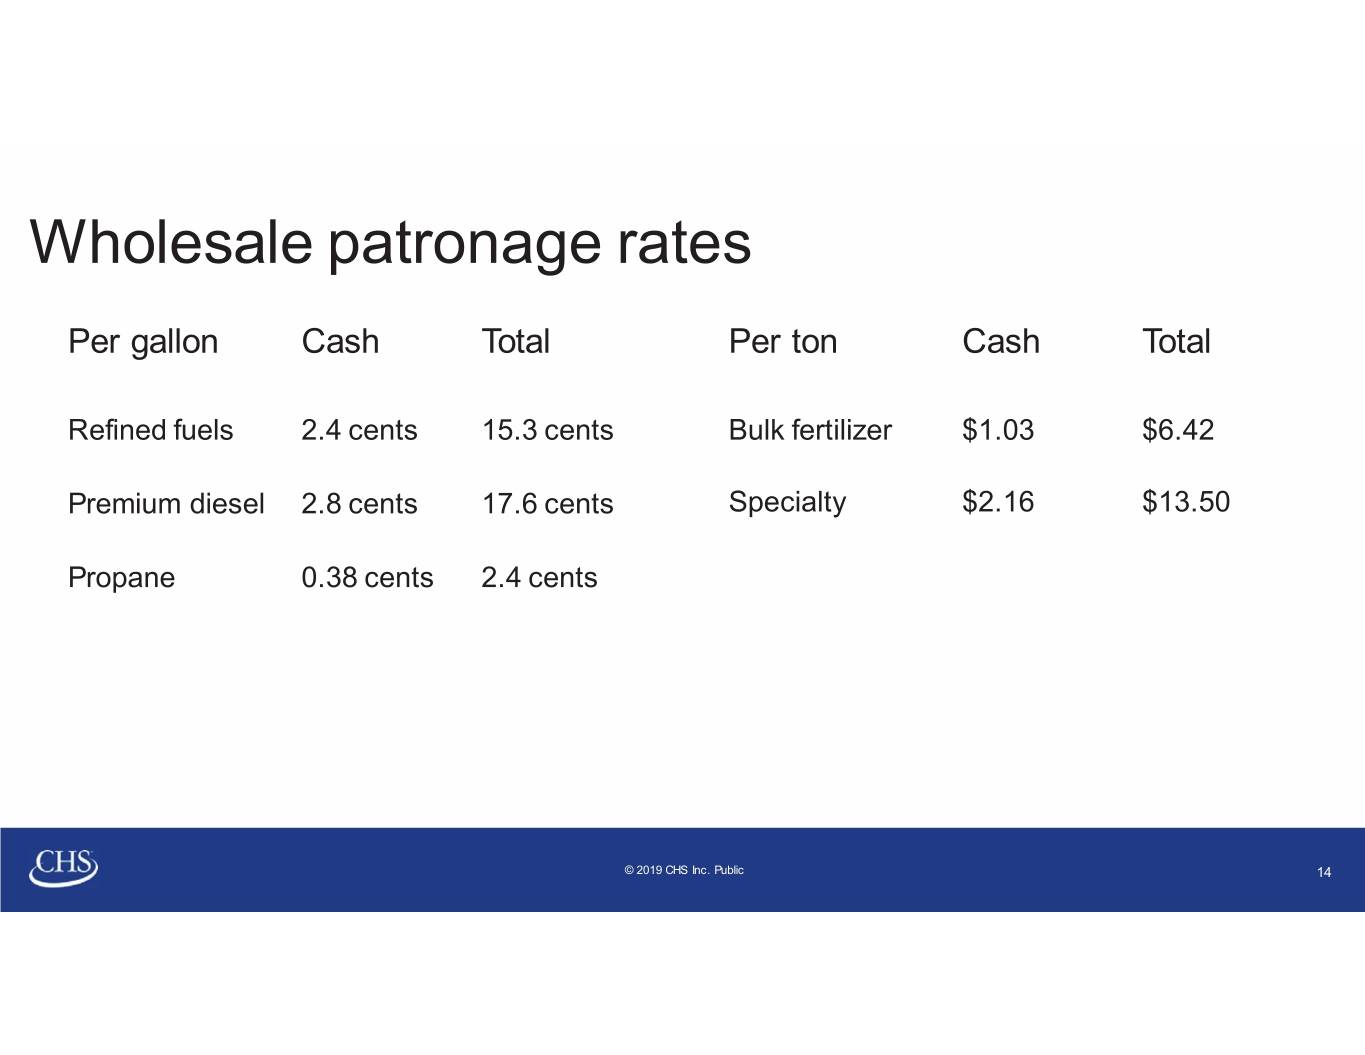
Wholesale patronage rates Per gallon Cash Tot al Per ton Cash Tot al Refined fuels 2.4 cents 15.3 cents Bulk fertilizer $1.03 $6.42 Premium diesel 2.8 cents 17.6 cents Specialty $2.16 $13.50 Propane 0.38 cents 2.4 cents © 2019 CHS Inc. Public 14


