Olivia Nelligan Executive Vice President & Chief Financial Officer

IMAG
FORWARD LOOKING STATEMENT This document and other CHS Inc. publicly available documents contain, and CHS officers and representatives may from time to time make, "forward‐looking statements" within the meaning of the safe harbor provisions of the U.S. Private Securities Litigation Reform Act of 1995. Forward‐looking statements can be identified by words such as "anticipate," "intend," "plan," "goal," "seek," "believe," "project," "estimate," "expect," "strategy," "future," "likely," "may," "should," "will" and similar references to future periods. Forward‐looking statements are neither historical facts nor assurances of future performance. Instead, they are based only on CHS current beliefs, expectations and assumptions regarding the future of its businesses, financial condition and results of operations, future plans and strategies, projections, anticipated events and trends, the economy and other future conditions. Because forward‐looking statements relate to the future, they are subject to inherent uncertainties, risks and changes in circumstances that are difficult to predict and many of which are outside of CHS control. CHS actual results and financial condition may differ materially from those indicated in the forward‐looking statements. Therefore, you should not place undue reliance on any of these forward‐looking statements. Important factors that could cause CHS actual results and financial condition to differ materially from those indicated in the forward‐looking statements are discussed or identified in CHS filings made with the U.S. Securities and Exchange Commission, including in the "Risk Factors" discussion in Item 1A of CHS Annual Report on Form 10‐K for the fiscal year ended August 31, 2021. These factors may include: changes in commodity prices; the impact of government policies, mandates, regulations and trade agreements; global and regional political, economic, legal and other risks of doing business globally; the impact of the ongoing COVID‐19 outbreak or other similar outbreaks; the impact of market acceptance of alternatives to refined petroleum products; consolidation among our suppliers and customers; nonperformance by contractual counterparties; changes in federal income tax laws or our tax status; the impact of compliance or noncompliance with applicable laws and regulations; the impact of any governmental investigations; the impact of environmental liabilities and litigation; actual or perceived quality, safety or health risks associated with our products; the impact of seasonality; the effectiveness of our risk management strategies; business interruptions and casualty losses; the impact of workforce factors; our funding needs and financing sources; financial institutions’ and other capital sources’ policies concerning energy‐related businesses; uncertainty regarding the transition away from LIBOR and the replacement of LIBOR with an alternative reference rate; technological improvements that decrease the demand for our agronomy and energy products; our ability to complete, integrate and benefit from acquisitions, strategic alliances, joint ventures, divestitures and other nonordinary course‐of‐business events; security breaches or other disruptions to our information technology systems or assets; the impact of our environmental, social and governance practices; the impairment of long‐lived assets; and other factors affecting our businesses generally. Any forward‐looking statements made by CHS in this document or the accompanying presentation are based only on information currently available to CHS and speak only as of the date on which the statement is made. CHS undertakes no obligation to update any forward‐looking statement, whether written or oral, that may be made from time to time, whether as a result of new information, future developments or otherwise except as required by applicable law.

Our Strategies Create an experience that empowers customers and makes CHS their first choice Grow market access to add value for our owners Evolve our core businesses by capitalizing on changing market dynamics Transform the business to unleash the enterprise
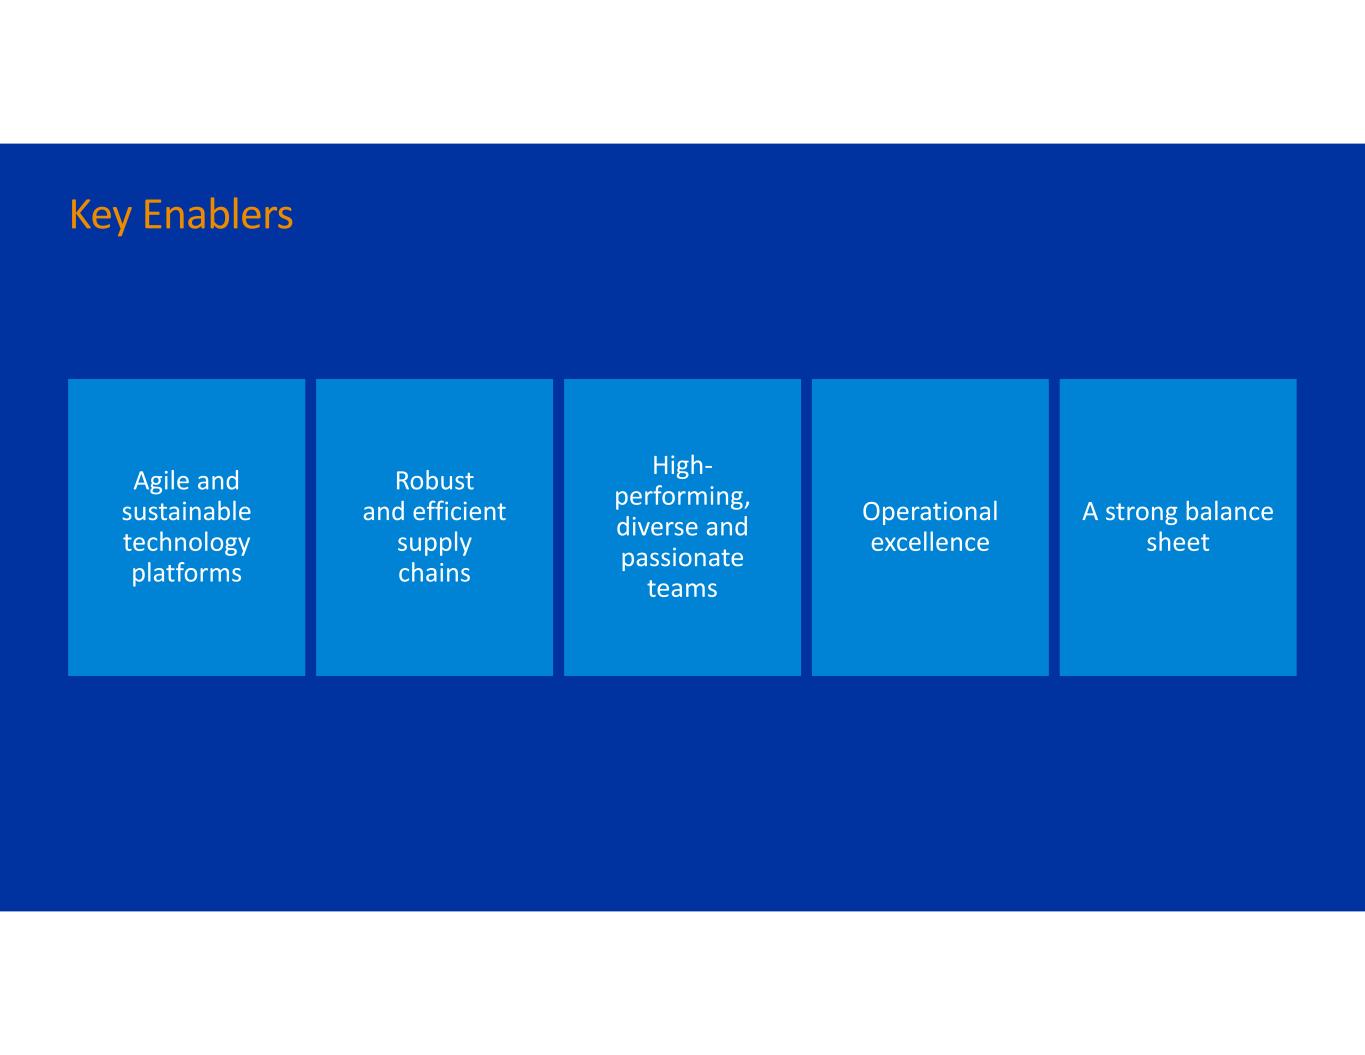
Key Enablers Agile and sustainable technology platforms Robust and efficient supply chains High‐ performing, diverse and passionate teams Operational excellence A strong balance sheet

$0 $10 $20 $30 $40 2017 2018 2019 2020 2021 Revenue ($ in billions) $38.4
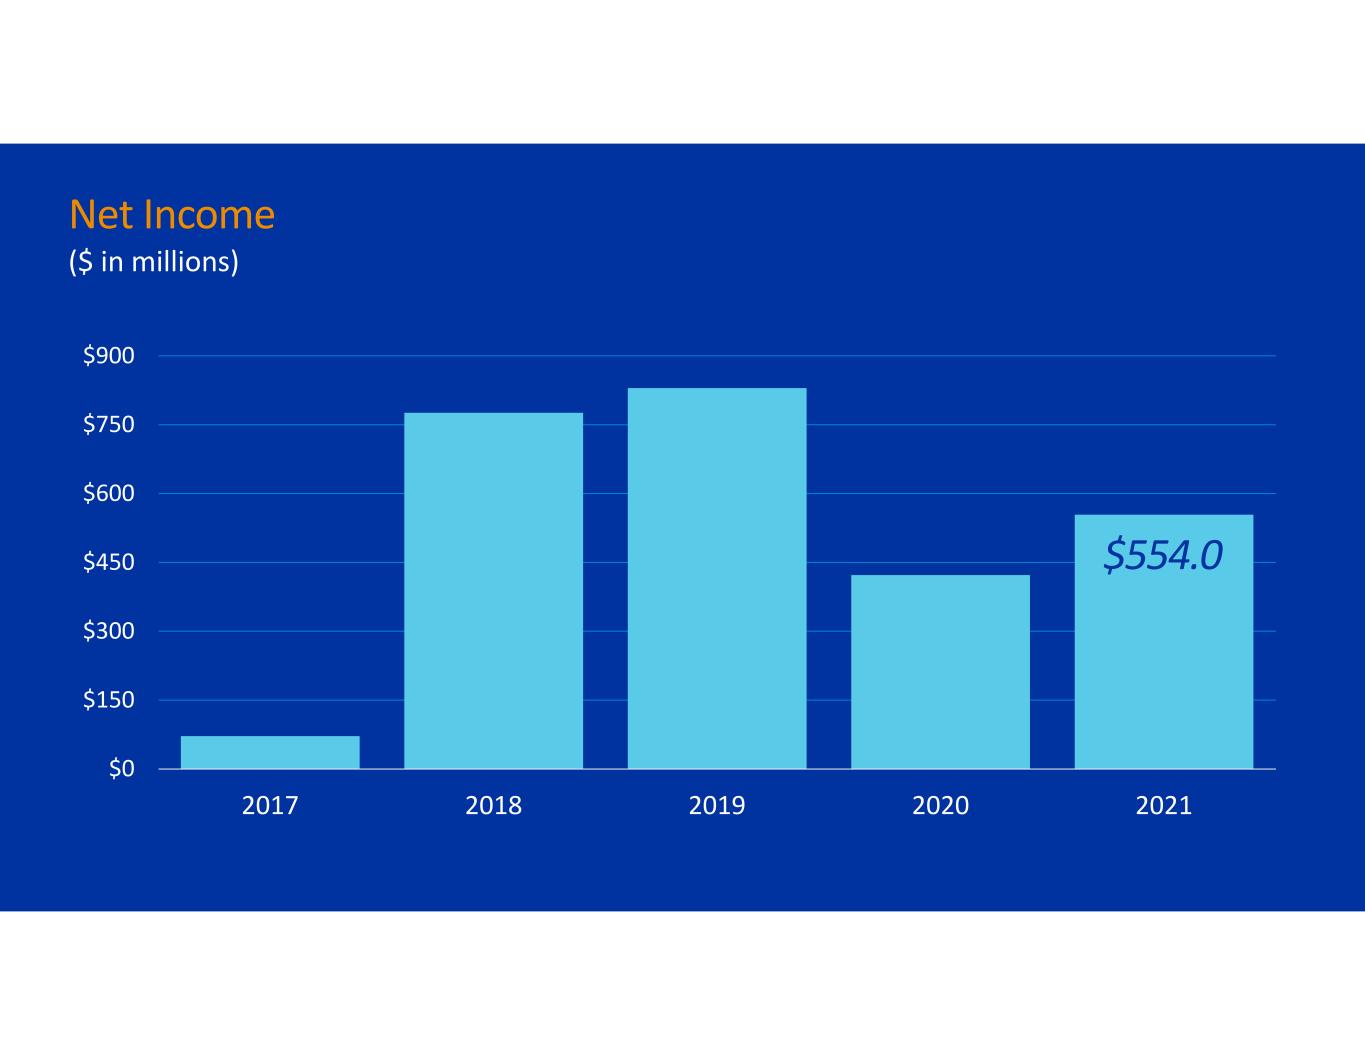
$0 $150 $300 $450 $600 $750 $900 2017 2018 2019 2020 2021 $554.0 Net Income ($ in millions)
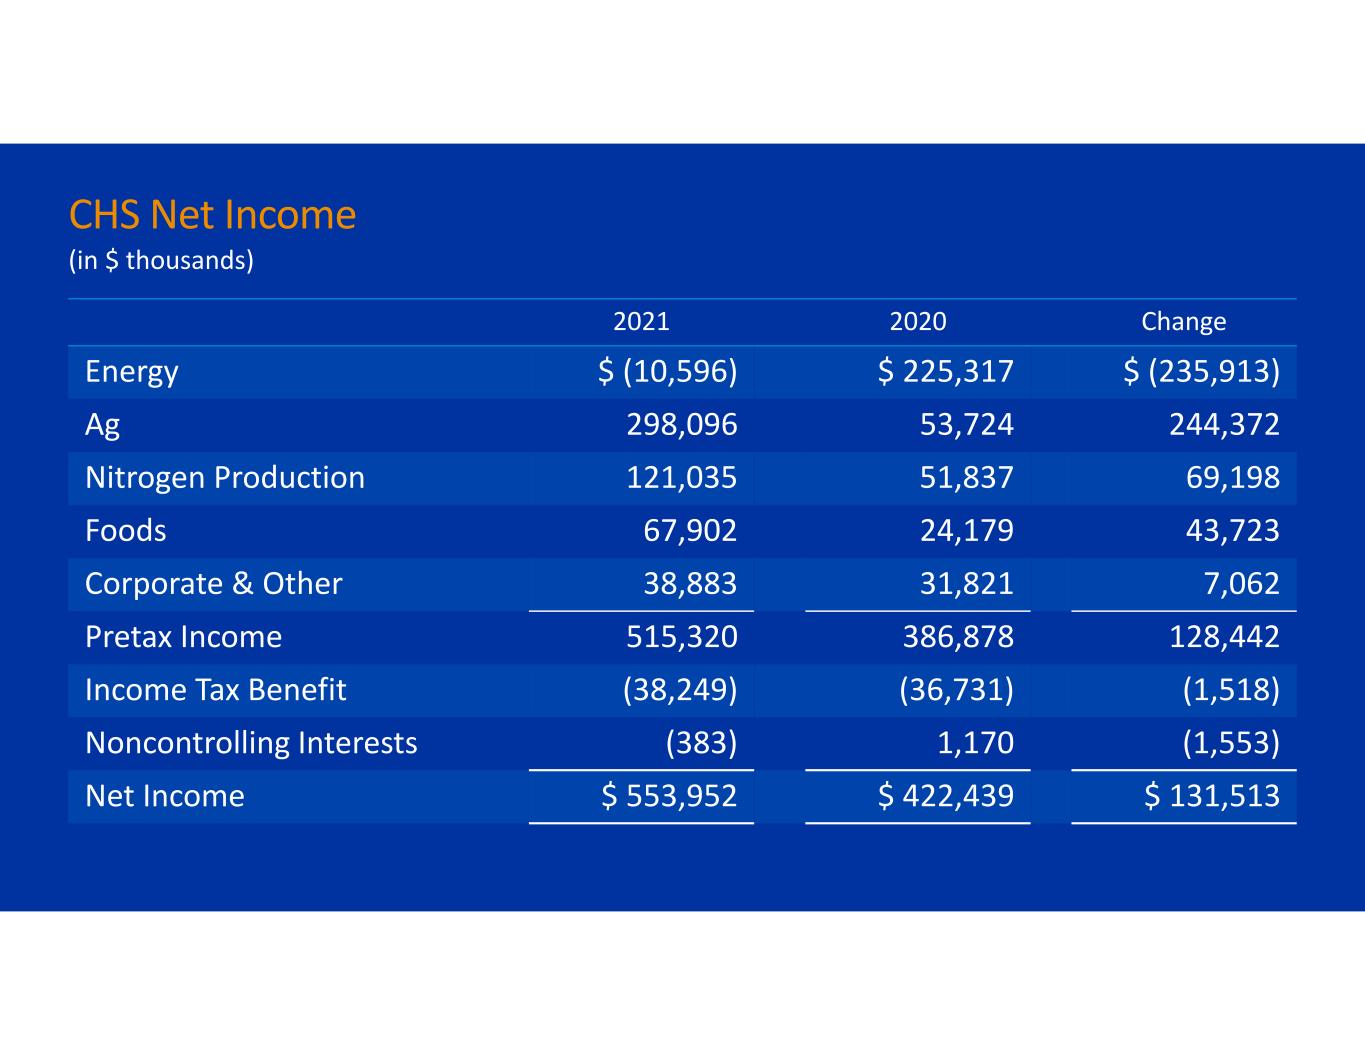
2021 2020 Change Energy $ (10,596) $ 225,317 $ (235,913) Ag 298,096 53,724 244,372 Nitrogen Production 121,035 51,837 69,198 Foods 67,902 24,179 43,723 Corporate & Other 38,883 31,821 7,062 Pretax Income 515,320 386,878 128,442 Income Tax Benefit (38,249) (36,731) (1,518) Noncontrolling Interests (383) 1,170 (1,553) Net Income $ 553,952 $ 422,439 $ 131,513 CHS Net Income (in $ thousands)
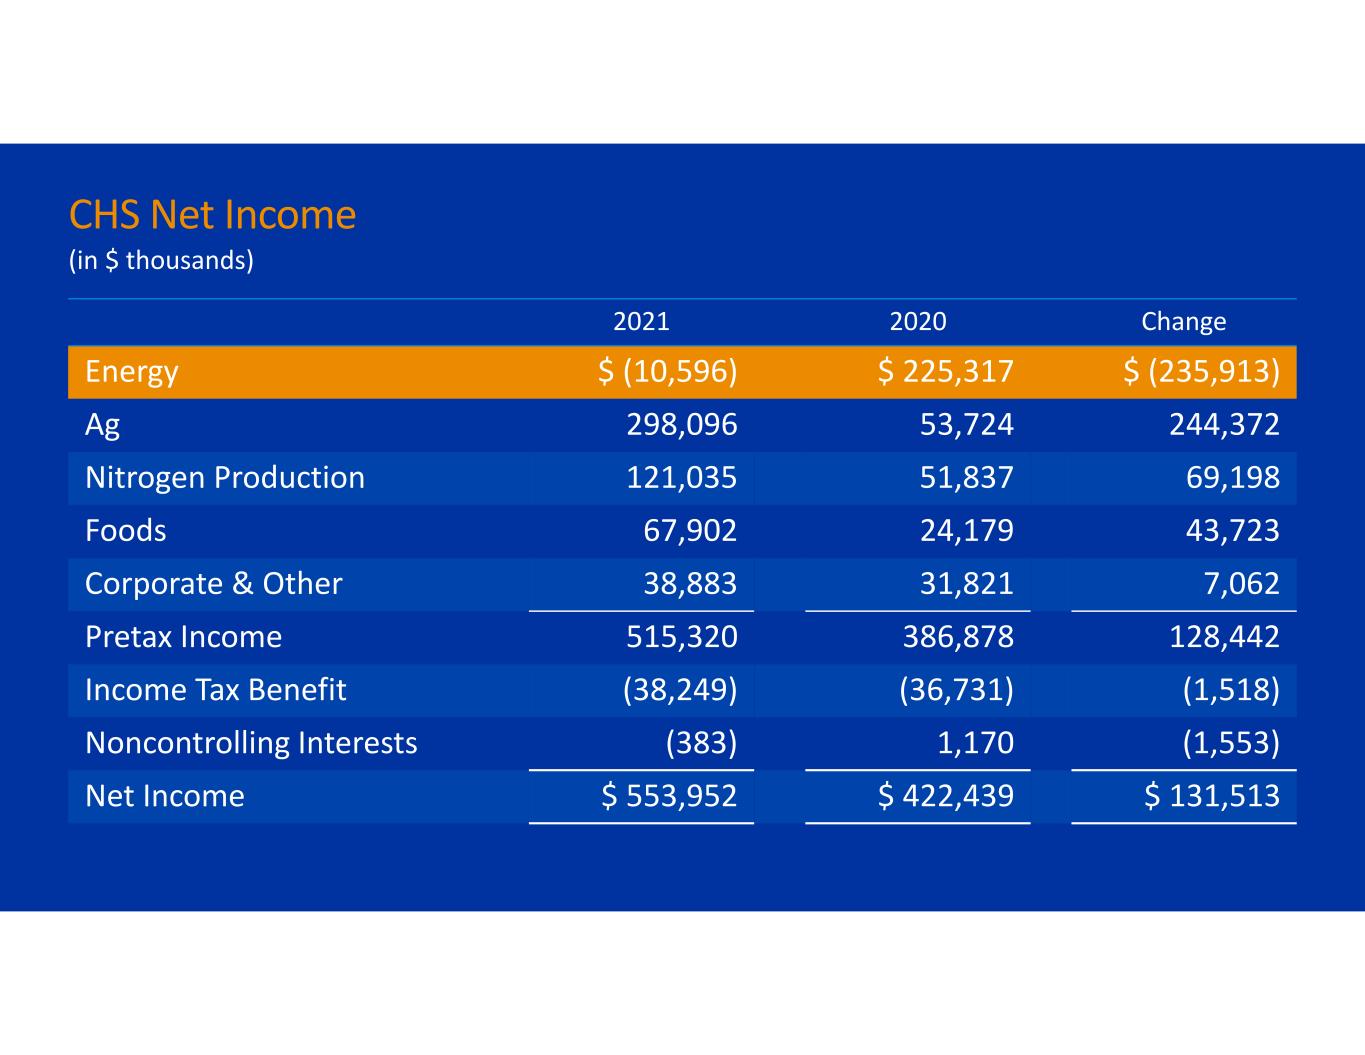
2021 2020 Change Energy $ (10,596) $ 225,317 $ (235,913) Ag 298,096 53,724 244,372 Nitrogen Production 121,035 51,837 69,198 Foods 67,902 24,179 43,723 Corporate & Other 38,883 31,821 7,062 Pretax Income 515,320 386,878 128,442 Income Tax Benefit (38,249) (36,731) (1,518) Noncontrolling Interests (383) 1,170 (1,553) Net Income $ 553,952 $ 422,439 $ 131,513 CHS Net Income (in $ thousands)
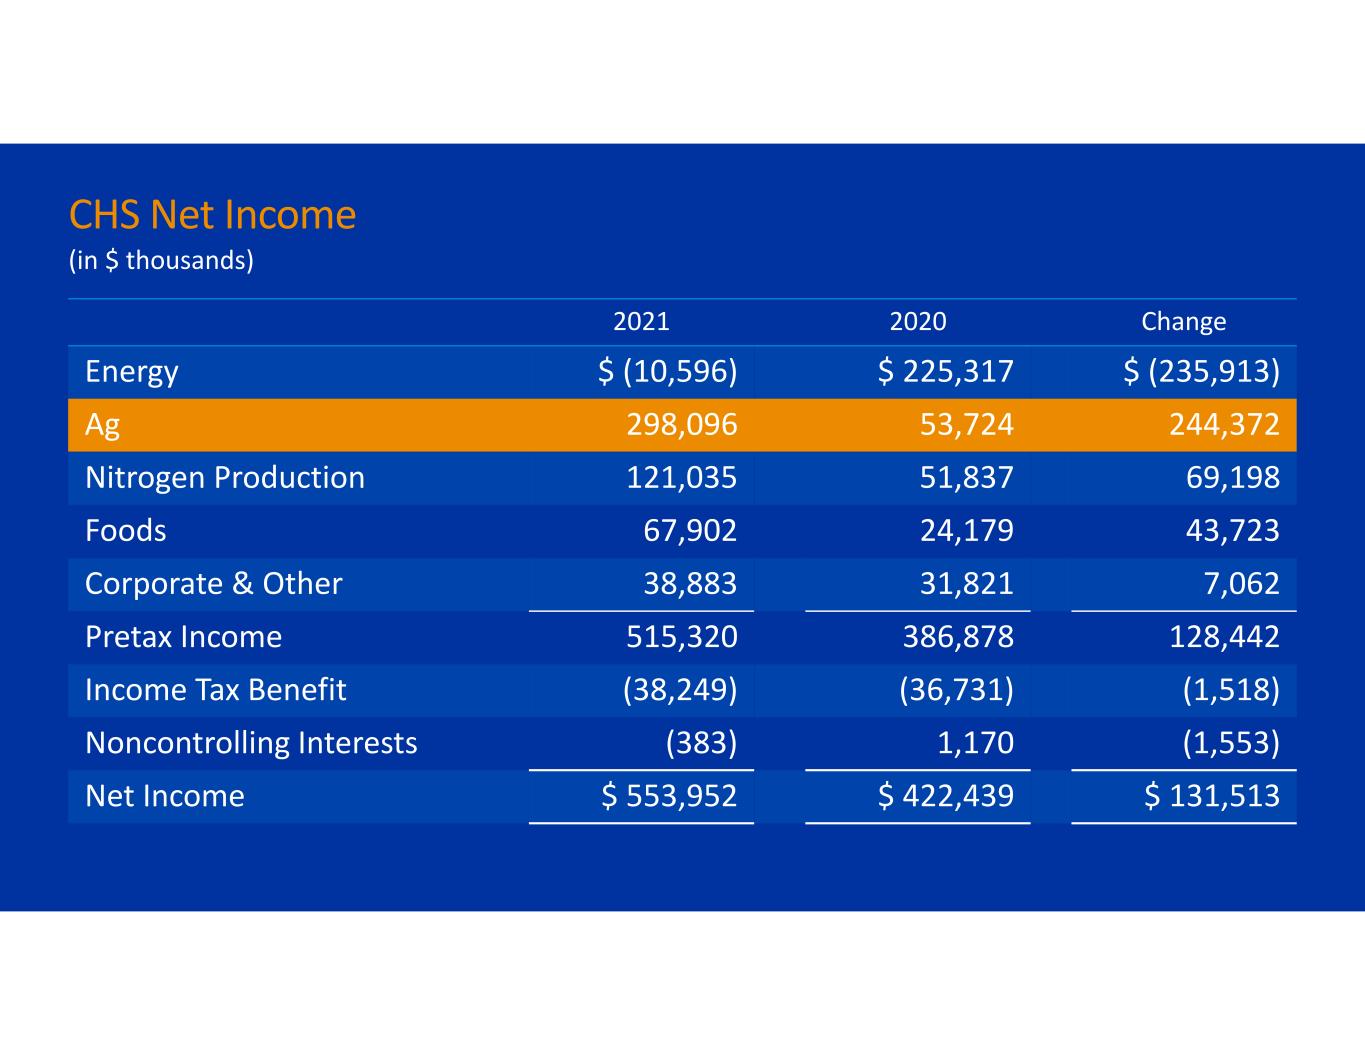
2021 2020 Change Energy $ (10,596) $ 225,317 $ (235,913) Ag 298,096 53,724 244,372 Nitrogen Production 121,035 51,837 69,198 Foods 67,902 24,179 43,723 Corporate & Other 38,883 31,821 7,062 Pretax Income 515,320 386,878 128,442 Income Tax Benefit (38,249) (36,731) (1,518) Noncontrolling Interests (383) 1,170 (1,553) Net Income $ 553,952 $ 422,439 $ 131,513 CHS Net Income (in $ thousands)
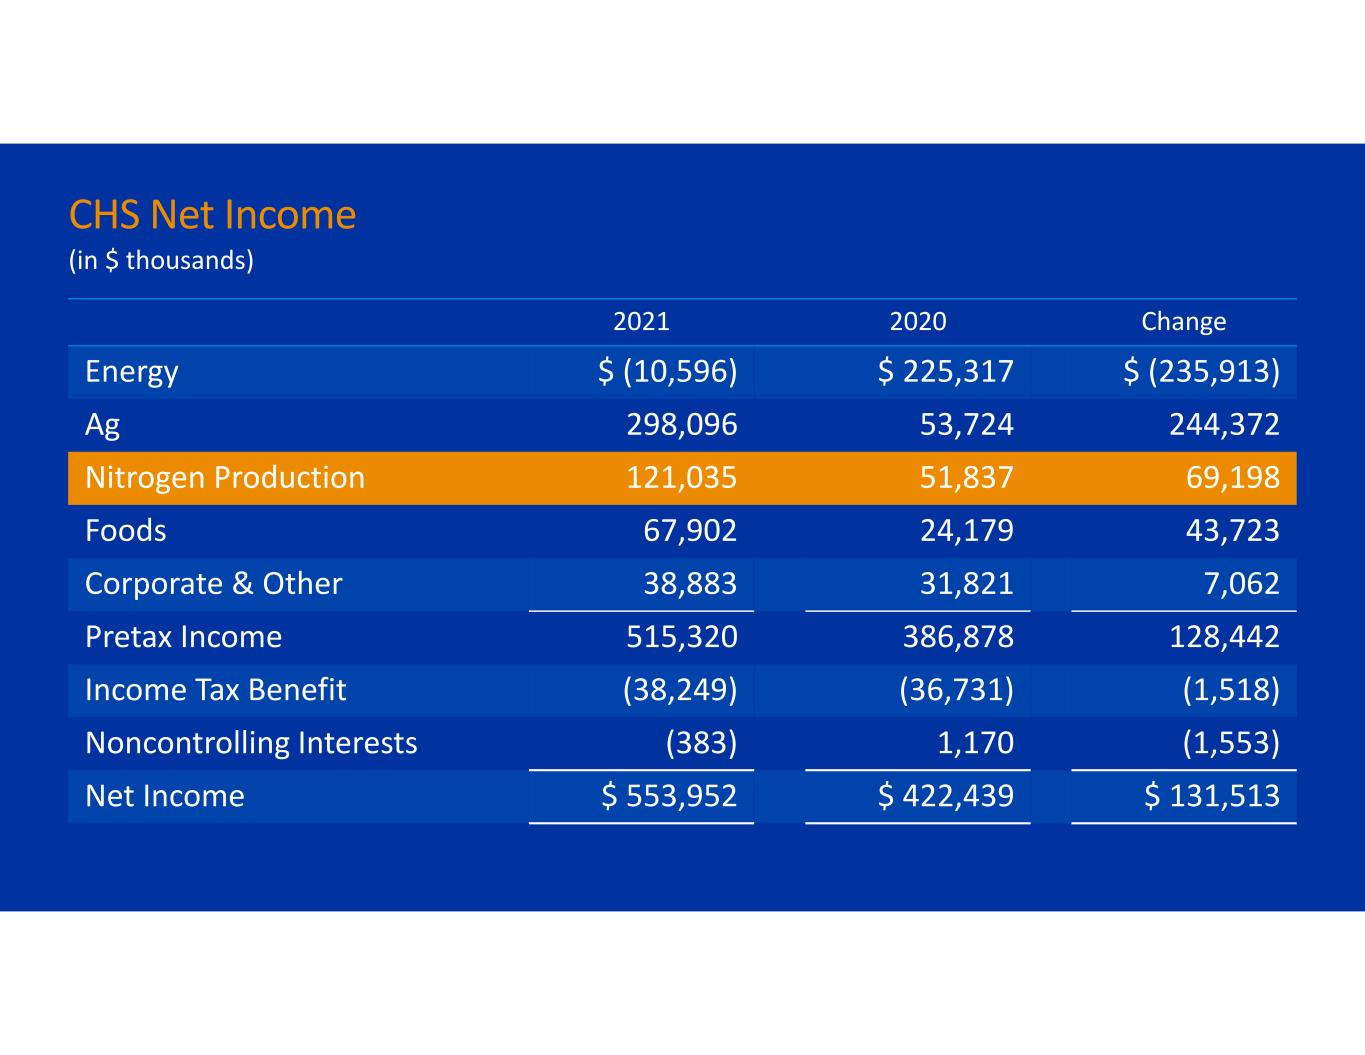
2021 2020 Change Energy $ (10,596) $ 225,317 $ (235,913) Ag 298,096 53,724 244,372 Nitrogen Production 121,035 51,837 69,198 Foods 67,902 24,179 43,723 Corporate & Other 38,883 31,821 7,062 Pretax Income 515,320 386,878 128,442 Income Tax Benefit (38,249) (36,731) (1,518) Noncontrolling Interests (383) 1,170 (1,553) Net Income $ 553,952 $ 422,439 $ 131,513 CHS Net Income (in $ thousands)
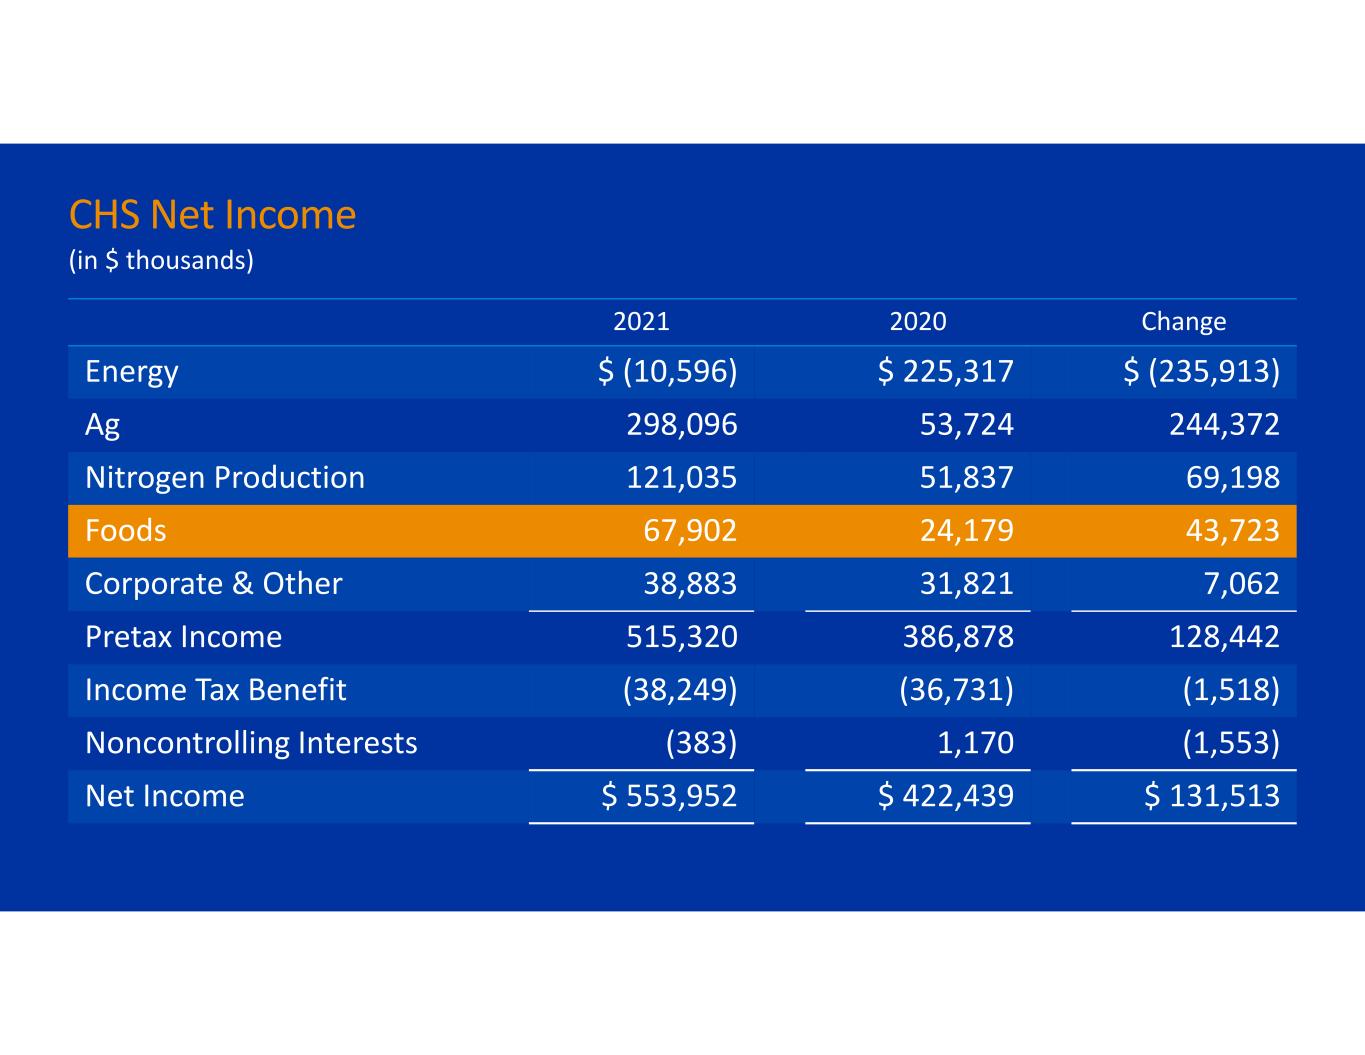
2021 2020 Change Energy $ (10,596) $ 225,317 $ (235,913) Ag 298,096 53,724 244,372 Nitrogen Production 121,035 51,837 69,198 Foods 67,902 24,179 43,723 Corporate & Other 38,883 31,821 7,062 Pretax Income 515,320 386,878 128,442 Income Tax Benefit (38,249) (36,731) (1,518) Noncontrolling Interests (383) 1,170 (1,553) Net Income $ 553,952 $ 422,439 $ 131,513 CHS Net Income (in $ thousands)

2021 2020 Change Energy $ (10,596) $ 225,317 $ (235,913) Ag 298,096 53,724 244,372 Nitrogen Production 121,035 51,837 69,198 Foods 67,902 24,179 43,723 Corporate & Other 38,883 31,821 7,062 Pretax Income 515,320 386,878 128,442 Income Tax Benefit (38,249) (36,731) (1,518) Noncontrolling Interests (383) 1,170 (1,553) Net Income $ 553,952 $ 422,439 $ 131,513 CHS Net Income (in $ thousands)
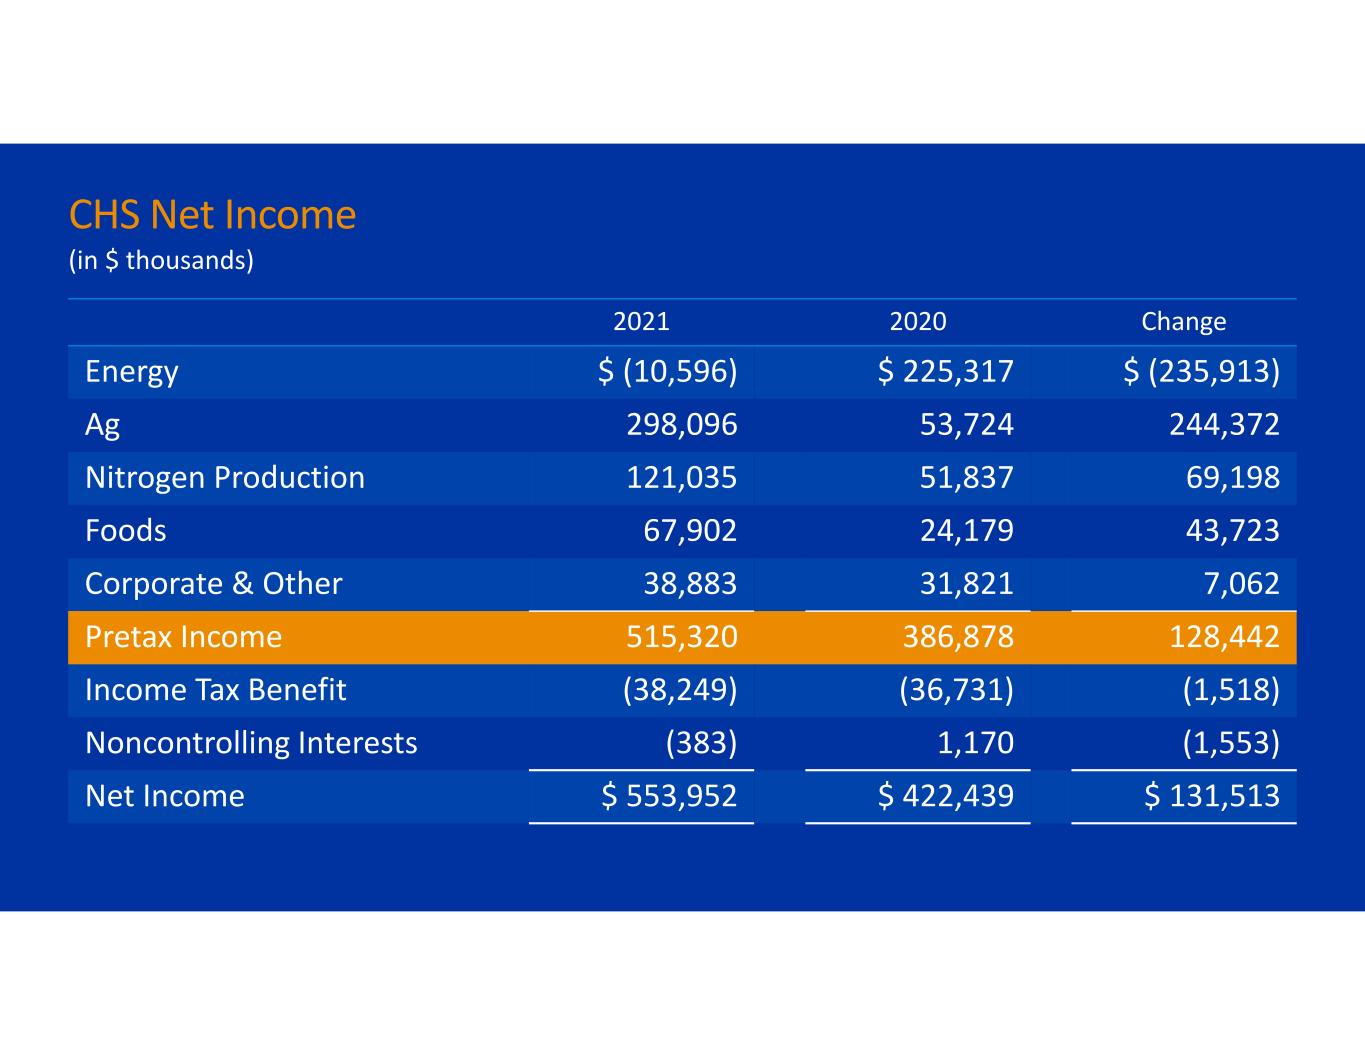
2021 2020 Change Energy $ (10,596) $ 225,317 $ (235,913) Ag 298,096 53,724 244,372 Nitrogen Production 121,035 51,837 69,198 Foods 67,902 24,179 43,723 Corporate & Other 38,883 31,821 7,062 Pretax Income 515,320 386,878 128,442 Income Tax Benefit (38,249) (36,731) (1,518) Noncontrolling Interests (383) 1,170 (1,553) Net Income $ 553,952 $ 422,439 $ 131,513 CHS Net Income (in $ thousands)
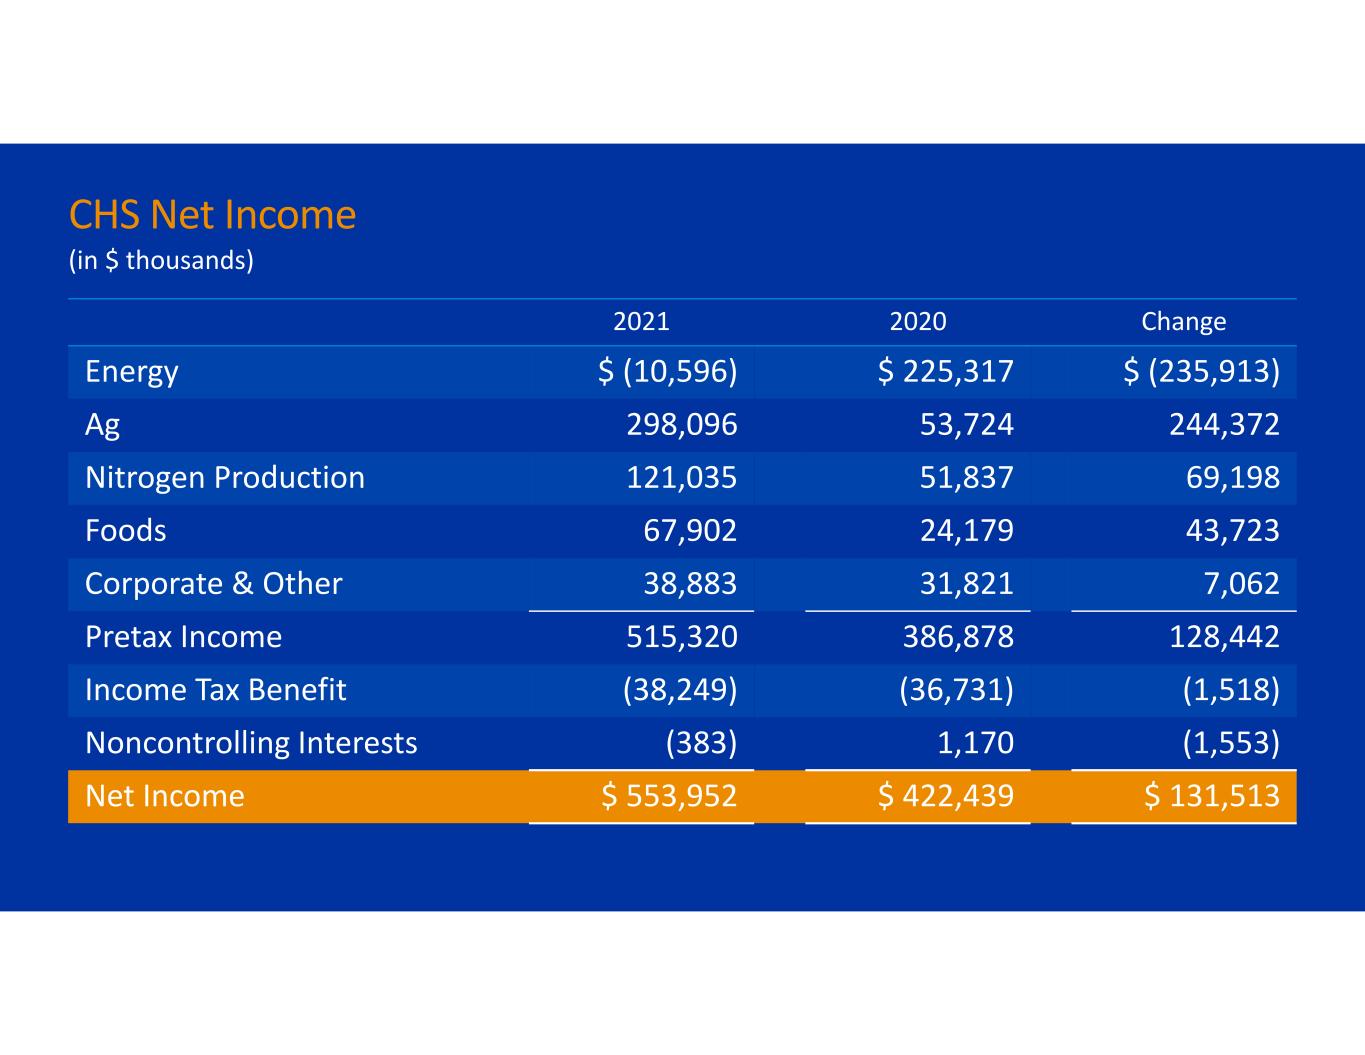
2021 2020 Change Energy $ (10,596) $ 225,317 $ (235,913) Ag 298,096 53,724 244,372 Nitrogen Production 121,035 51,837 69,198 Foods 67,902 24,179 43,723 Corporate & Other 38,883 31,821 7,062 Pretax Income 515,320 386,878 128,442 Income Tax Benefit (38,249) (36,731) (1,518) Noncontrolling Interests (383) 1,170 (1,553) Net Income $ 553,952 $ 422,439 $ 131,513 CHS Net Income (in $ thousands)

IMAG
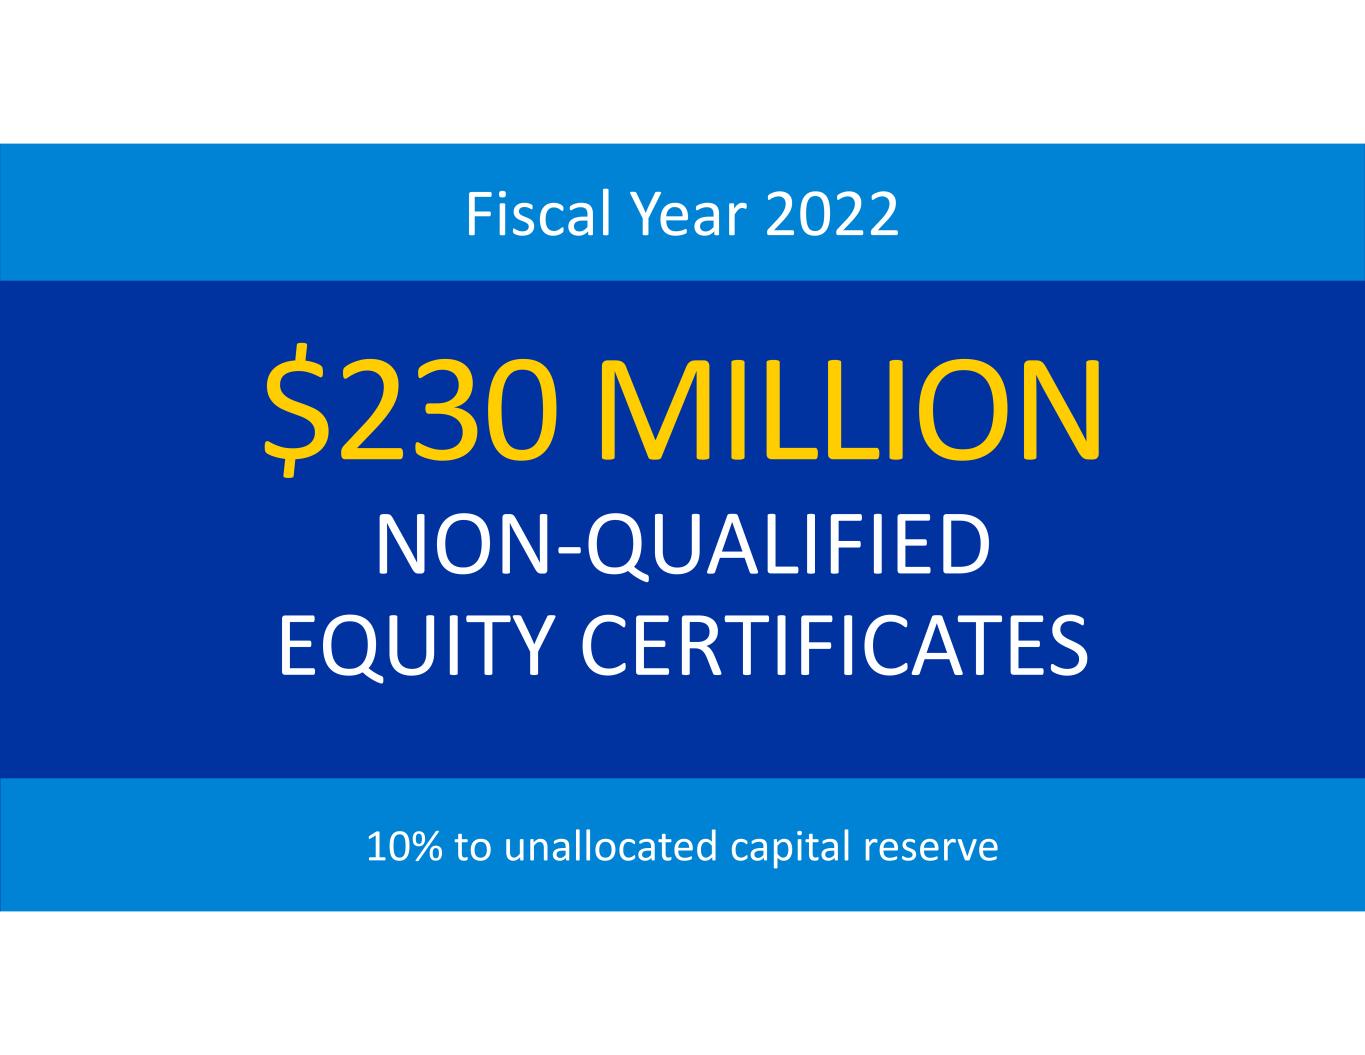
$230 MILLION NON‐QUALIFIED EQUITY CERTIFICATES Fiscal Year 2022 10% to unallocated capital reserve
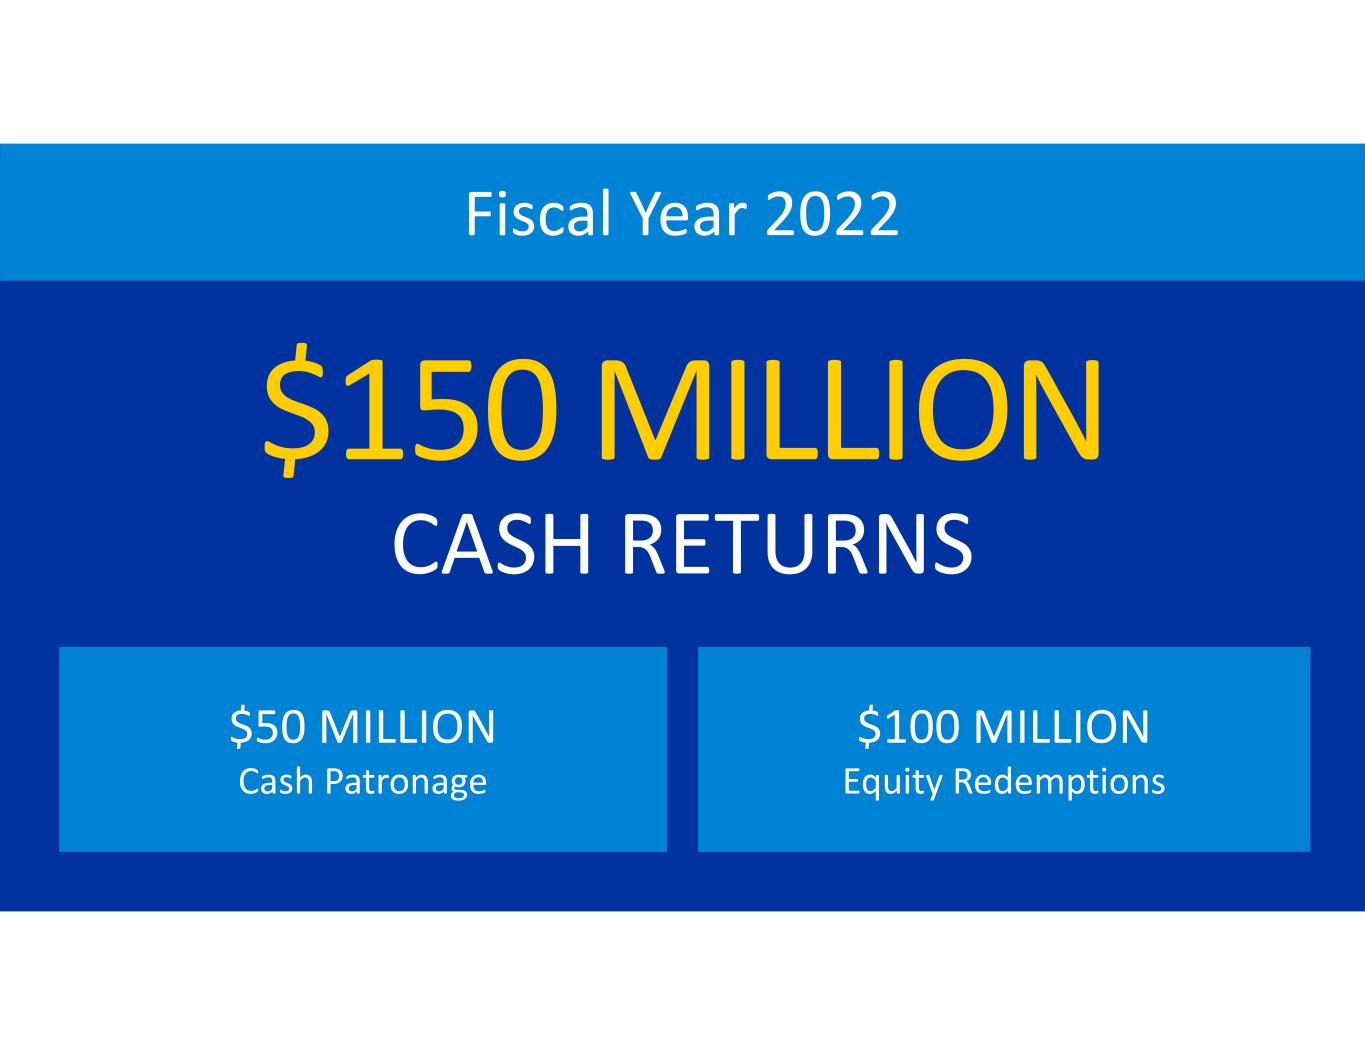
$150 MILLION CASH RETURNS Fiscal Year 2022 $50 MILLION Cash Patronage $100 MILLION Equity Redemptions
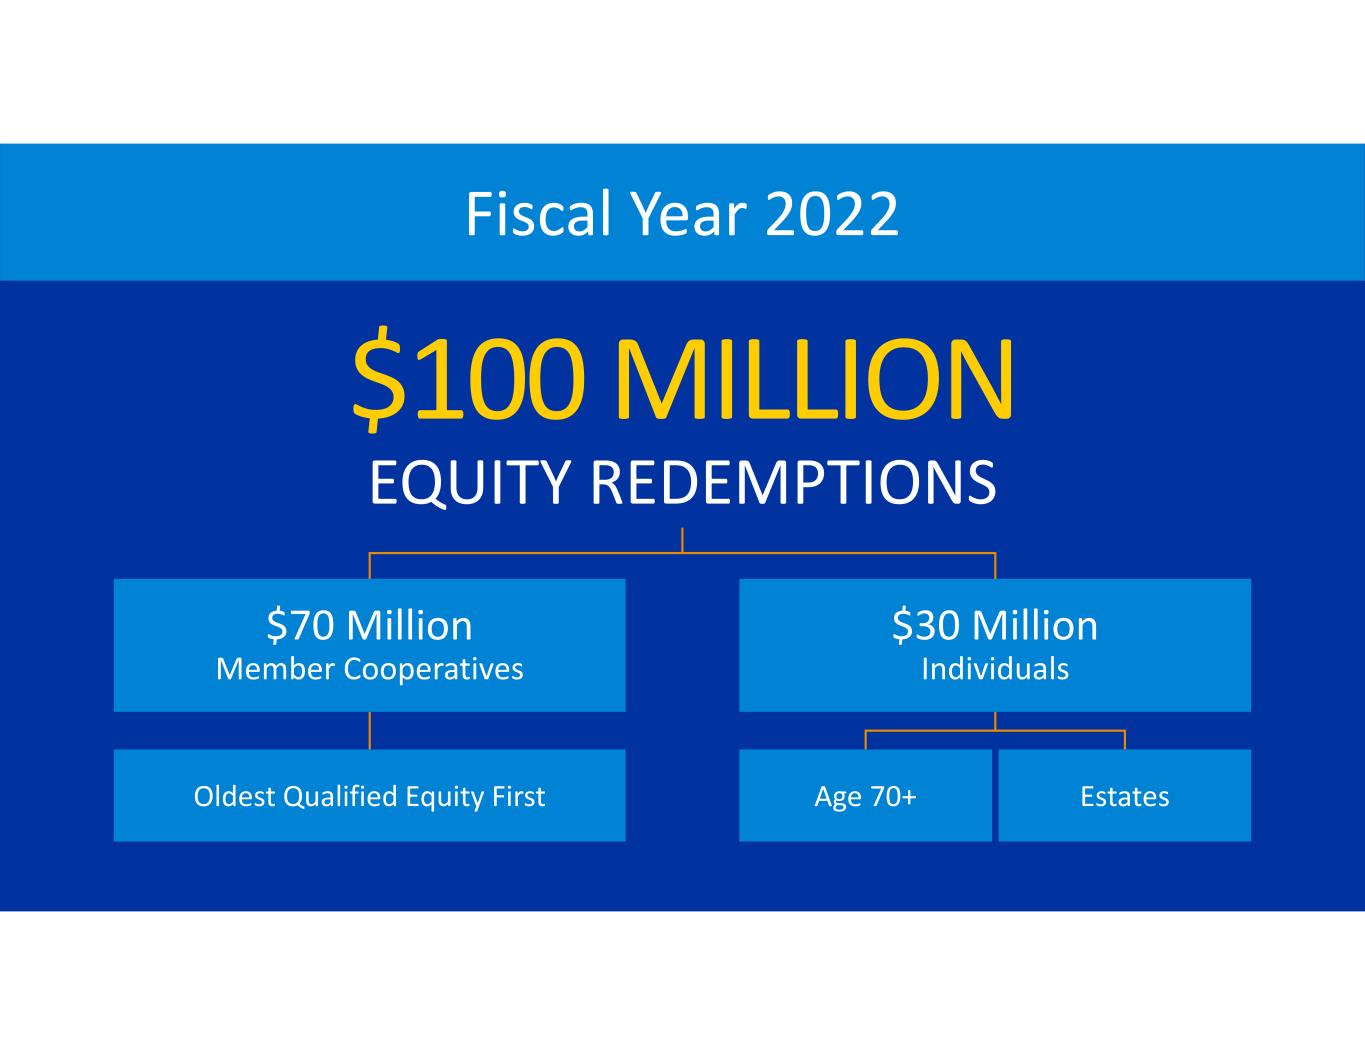
$70 Million Member Cooperatives $30 Million Individuals Age 70+ EstatesOldest Qualified Equity First Fiscal Year 2022 $100 MILLION EQUITY REDEMPTIONS
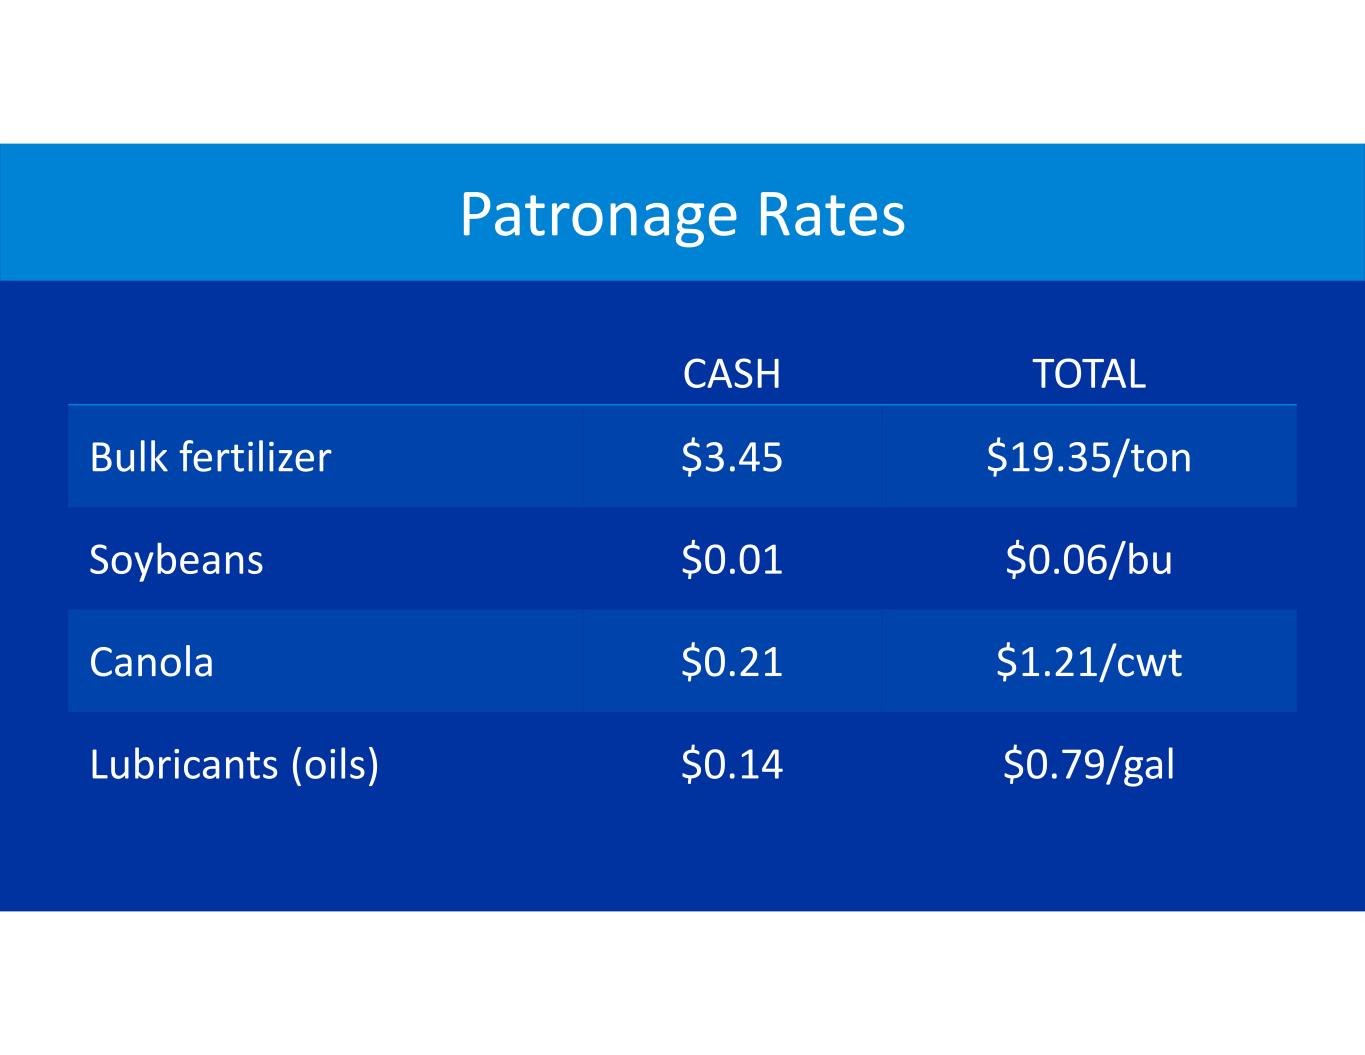
CASH TOTAL Bulk fertilizer $3.45 $19.35/ton Soybeans $0.01 $0.06/bu Canola $0.21 $1.21/cwt Lubricants (oils) $0.14 $0.79/gal Patronage Rates
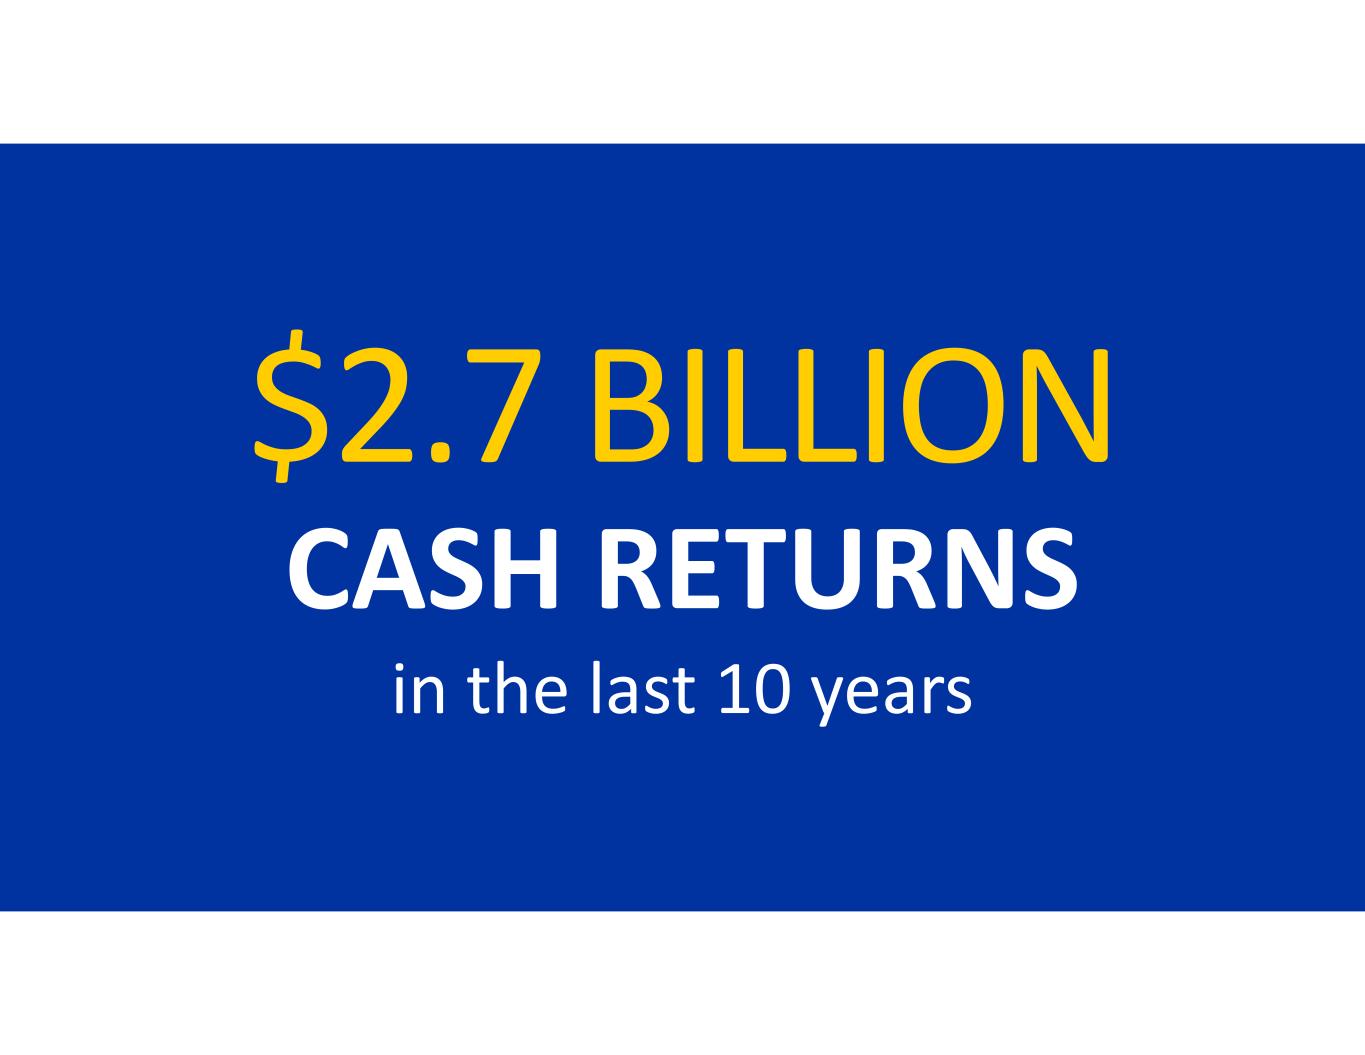
$2.7 BILLION CASH RETURNS in the last 10 years

IMAG
