UNITED STATES SECURITIES AND EXCHANGE COMMISSION
Washington, D.C. 20549
Form 10-K
| | | | | | | | | | | |
| ☑ | | ANNUAL REPORT PURSUANT TO SECTION 13 OR 15(d) OF THE SECURITIES EXCHANGE ACT OF 1934 |
| | | For the fiscal year ended | August 31, 2024 |
| or |
| ☐ | | TRANSITION REPORT PURSUANT TO SECTION 13 OR 15(d) OF THE SECURITIES EXCHANGE ACT OF 1934 |
| | | For the transition period from to |
Commission file number: 001-36079
CHS Inc.
(Exact name of registrant as specified in its charter) | | | | | | | | | | | | | | |
| Minnesota | | 41-0251095 |
(State or other jurisdiction of
incorporation or organization) | | (I.R.S. Employer
Identification Number) |
5500 Cenex Drive
Inver Grove Heights, Minnesota 55077
(Address of principal executive offices, including zip code)
(651) 355-6000
(Registrant's telephone number, including area code)
Securities registered pursuant to Section 12(b) of the Act:
| | | | | | | | |
| Title of each class | Trading Symbol(s) | Name of each exchange on which registered |
| 8% Cumulative Redeemable Preferred Stock | CHSCP | The Nasdaq Stock Market LLC |
| Class B Cumulative Redeemable Preferred Stock, Series 1 | CHSCO | The Nasdaq Stock Market LLC |
| Class B Reset Rate Cumulative Redeemable Preferred Stock, Series 2 | CHSCN | The Nasdaq Stock Market LLC |
| Class B Reset Rate Cumulative Redeemable Preferred Stock, Series 3 | CHSCM | The Nasdaq Stock Market LLC |
| Class B Cumulative Redeemable Preferred Stock, Series 4 | CHSCL | The Nasdaq Stock Market LLC |
Securities registered pursuant to section 12(g) of the Act: None
Indicate by check mark if the Registrant is a well-known seasoned issuer, as defined in Rule 405 of the Securities Act.
Yes ☐ No ☑
Indicate by check mark if the Registrant is not required to file reports pursuant to Section 13 or Section 15(d) of the Act.
Yes ☐ No ☑
Indicate by check mark whether the Registrant (1) has filed all reports required to be filed by Section 13 or 15(d) of the Securities Exchange Act of 1934 during the preceding 12 months (or for such shorter period that the Registrant was required to file such reports), and (2) has been subject to such filing requirements for the past 90 days.
Yes ☑ No ☐
Indicate by check mark whether the Registrant has submitted electronically every Interactive Data File required to be submitted pursuant to Rule 405 of Regulation S-T (§232.405 of this chapter) during the preceding 12 months (or for such shorter period that the Registrant was required to submit such files).
Yes ☑ No ☐
Indicate by check mark whether the Registrant is a large accelerated filer, an accelerated filer, a non-accelerated filer, a smaller reporting company, or an emerging growth company. See the definitions of "large accelerated filer," "accelerated filer," "smaller reporting company," and "emerging growth company" in Rule 12b-2 of the Exchange Act.
Large accelerated filer ☐ Accelerated filer ☐ Non-accelerated filer ☑ Smaller reporting company ☐ Emerging growth company ☐
If an emerging growth company, indicate by check mark if the Registrant has elected not to use the extended transition period for complying with any new or revised financial accounting standards provided pursuant to Section 13(a) of the Exchange Act. o
Indicate by check mark whether the Registrant has filed a report on and attestation to its management's assessment of the effectiveness of its internal control over financial reporting under Section 404(b) of the Sarbanes-Oxley Act (15 U.S.C. 7262(b)) by the registered public accounting firm that prepared or issued its audit report. o
If securities are registered pursuant to Section 12(b) of the Act, indicate by check mark whether the financial statements of the registrant included in the filing reflect the correction of an error to previously issued financial statements. o
Indicate by check mark whether any of those error corrections are restatements that required a recovery analysis of incentive-based compensation received by any of the registrant's executive officers during the relevant recovery period pursuant to §240.10D-1(b). o
Indicate by check mark whether the Registrant is a shell company (as defined in Rule 12b-2 of the Act).
Yes ☐ No ☑
State the aggregate market value of the voting and non-voting common equity held by non-affiliates computed by reference to the price at which the common equity was last sold, or the average bid and asked price of such common equity, as of the last business day of the Registrant’s most recently completed second fiscal quarter:
The Registrant has no voting or non-voting common equity (the Registrant is a member cooperative).
Indicate the number of shares outstanding of each of the Registrant's classes of common stock, as of the latest practicable date:
The Registrant has no common stock outstanding.
DOCUMENTS INCORPORATED BY REFERENCE
PART I
ITEM 1. BUSINESS
THE COMPANY
CHS Inc. (referred to herein as "CHS," "company," "we," "us" or "our") is the nation's leading integrated agricultural cooperative, providing grain, food, agronomy and energy resources to businesses and consumers on a global basis. As a cooperative, we are owned by farmers and ranchers and member cooperatives (referred to herein as "members") across the United States. We also have preferred shareholders who own shares of our five series of preferred stock, all of which are listed and traded on the Global Select Market of The Nasdaq Stock Market LLC. We buy commodities from and provide products and services to individual agricultural producers, local cooperatives and other companies (including our members and other nonmember customers), both domestically and internationally. We provide a wide variety of products and services, ranging from initial agricultural inputs such as fuels, farm supplies, crop nutrients and crop protection products to agricultural outputs that include grain and oilseed, processed grain and oilseed, renewable fuels and food products. A portion of our operations are conducted through equity investments and joint ventures whose operating results are not fully consolidated with our results; rather, a proportionate share of the income or loss from those equity investments and joint ventures is included as a component of our net income using the equity method of accounting. For the year ended August 31, 2024, our total revenues were $39.3 billion and net income attributable to CHS was $1.1 billion.
We have aligned our segments based on an assessment of how our businesses operate and the products and services they sell. Our Energy segment derives its revenues through refining, wholesaling and retailing of petroleum products. Our Ag segment derives its revenues through origination and marketing of grain, including service activities conducted at export terminals; through wholesale agronomy sales of crop nutrient and crop protection products; from sales of soybean meal, refined soy oil and soyflour products; through the production and marketing of renewable fuels; and through retail sales of petroleum and agronomy products, processed sunflowers, feed and farm supplies. Our Ag segment also records equity income from our grain export joint venture and other investments. Our Nitrogen Production segment consists of our equity method investment in CF Industries Nitrogen, LLC ("CF Nitrogen"), and allocated expenses. Our other business operations, primarily our financing and hedging businesses, are included in Corporate and Other because of the nature of their products and services, as well as the relative amount of revenues from those businesses. In addition, our nonconsolidated food production and distribution joint venture, Ventura Foods, LLC ("Ventura Foods"), and our nonconsolidated wheat milling joint venture, Ardent Mills, LLC ("Ardent Mills"), are included in Corporate and Other.
As required under our bylaws and Minnesota cooperative law, our earnings from cooperative business are required to be allocated to our members and to a limited extent to nonmembers with which we have agreed to do business on a patronage basis based on the volume of business they do with us. We allocate these earnings to our patrons in the form of patronage refunds, which are also called patronage dividends, and which may be in cash, patrons' equities in the form of capital equity certificates or both. Patrons' equities may be redeemed over time solely at the discretion of our Board of Directors. Earnings derived from nonmembers, which are not treated as patronage, are taxed at federal and state statutory corporate rates and are retained by us as unallocated capital reserves. We also receive patronage refunds from the cooperatives in which we are a member, if those cooperatives have earnings to distribute and if we qualify for patronage refunds from them.
Our origins date back to the early 1930s with the founding of our predecessor companies, Cenex, Inc., and Harvest States Cooperatives. CHS Inc. emerged as the result of the merger of those two entities in 1998 and is headquartered in Inver Grove Heights, Minnesota.
Our internet address is www.chsinc.com. Our periodic and current reports on Form 10-K, 10-Q, 8-K and other filings, including exhibits and supplemental schedules filed therewith, and amendments to those reports, filed with the Securities and Exchange Commission ("SEC") are available on our website as soon as reasonably practicable after they are electronically filed with or furnished to the SEC, free of charge. The information contained on our website is not part of, and is not incorporated into, this Annual Report on Form 10-K or any other report we file with or furnish to the SEC. In addition, the SEC maintains a website that contains reports and other information regarding issuers, where you may obtain a copy of all information we file publicly with the SEC. The SEC website address is www.sec.gov.
ENERGY
Overview
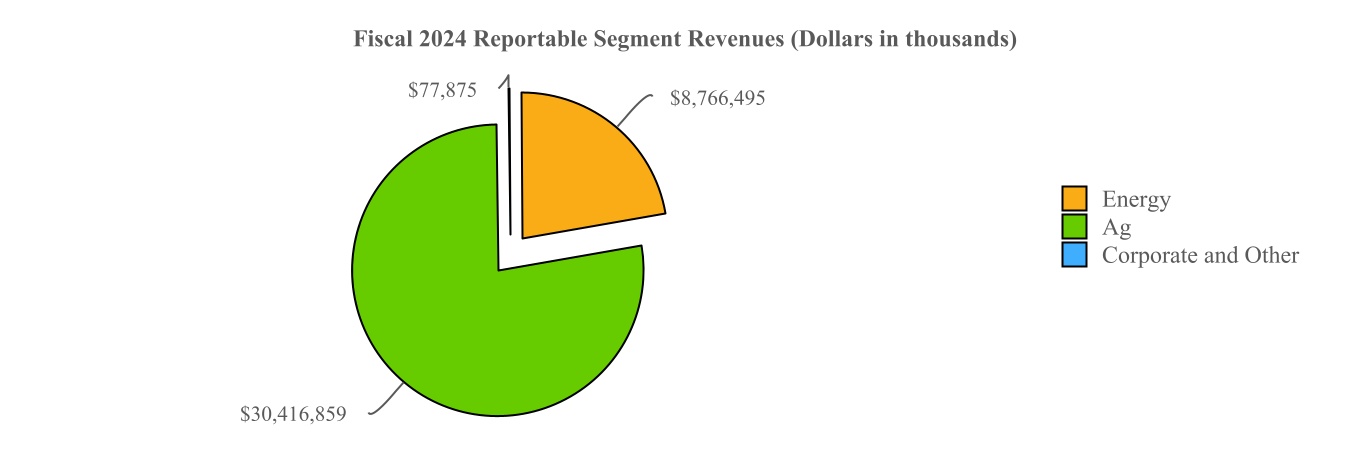
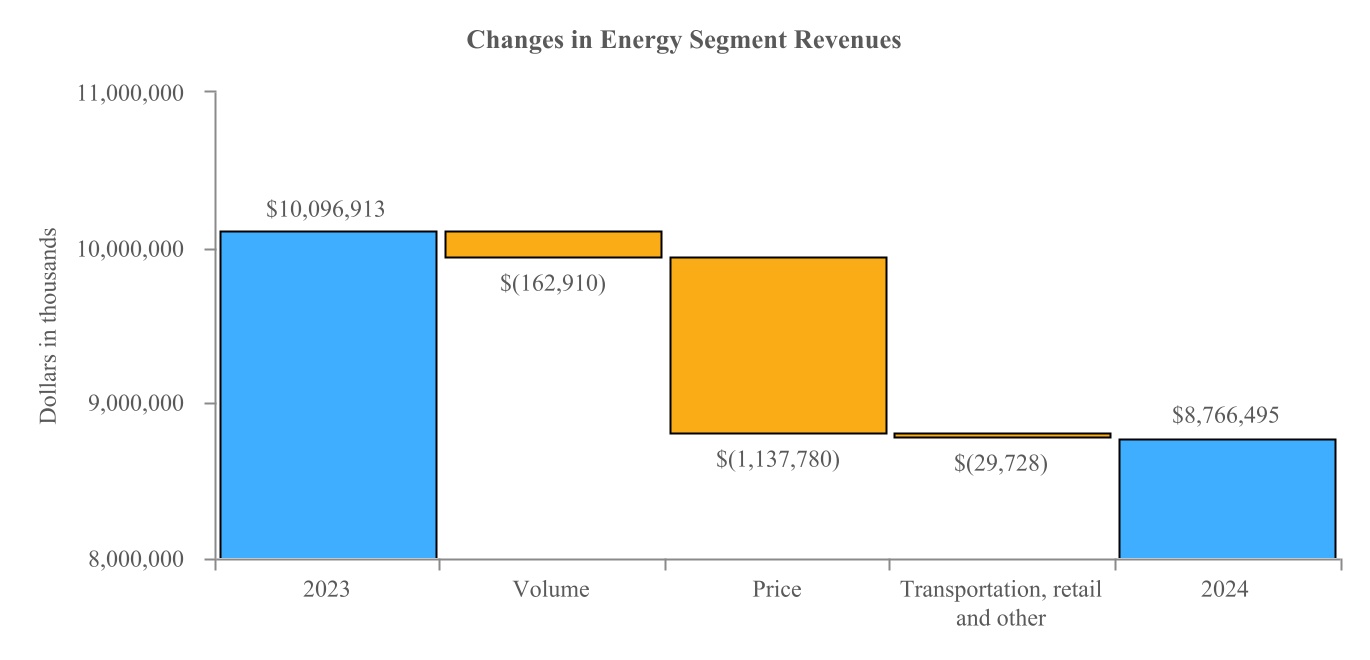
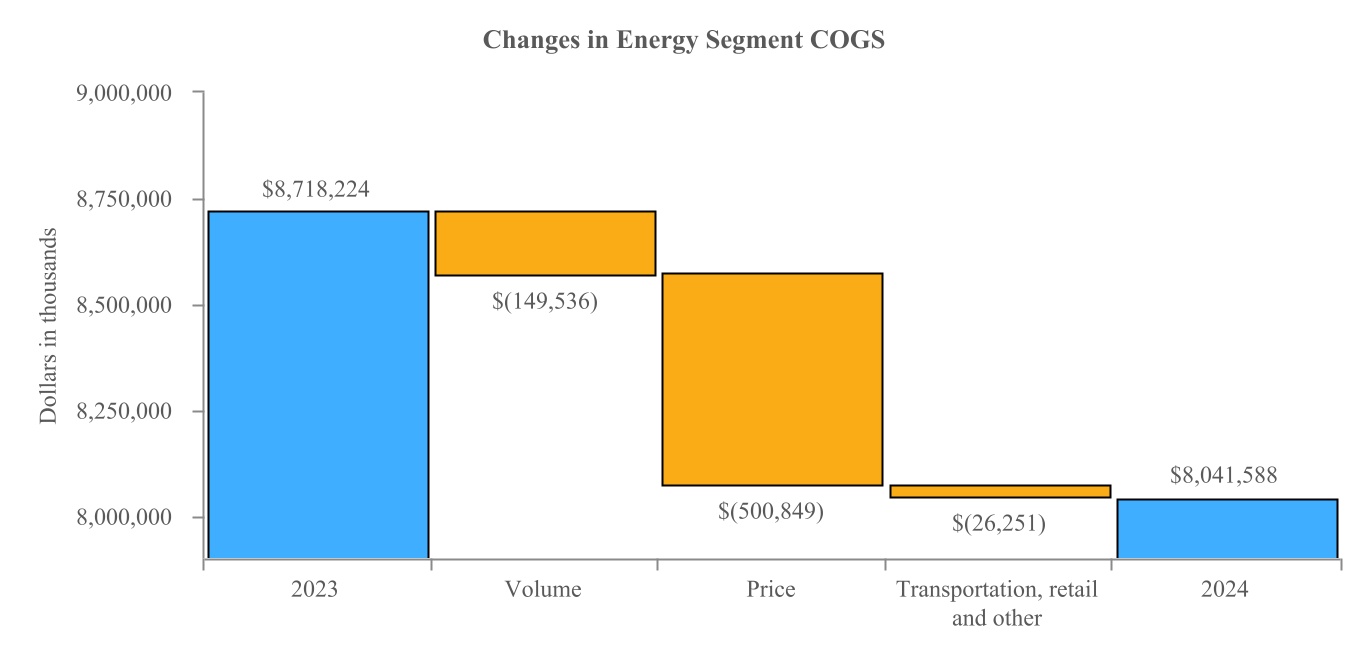
We are the nation's largest cooperative energy company based on revenues and identifiable assets, with operations that include petroleum refining and pipelines; supply, marketing and distribution of refined fuels (gasoline, diesel fuel and other energy products); blending, sale and distribution of lubricants; and wholesale supply of propane and other natural gas liquids. Our Energy segment processes crude oil into refined petroleum products at our refineries in Laurel, Montana, and McPherson, Kansas, and sells those products under the Cenex® brand to member cooperatives and other independent retailers through a network of nearly 1,250 sites, the majority of which are convenience stores marketing Cenex brand fuels and owned by our member cooperatives. For fiscal 2024, our Energy revenues, after elimination of intersegment revenues, were $8.8 billion and were primarily from gasoline, diesel fuel and propane.
Operations
Laurel refinery. Our Laurel, Montana, refinery processes medium- and high-sulfur crude oil into refined petroleum products that primarily include gasoline, diesel fuel, asphalt and petroleum coke. Our Laurel refinery sources approximately 95% of its crude oil supply from Canada, with the remaining balance obtained from domestic sources, and we have access to Canadian and northwest Montana crude oil through our wholly-owned Front Range Pipeline, LLC, and other common carrier pipelines. Our Laurel refinery also has access to Wyoming crude oil via common carrier pipelines from the south.
Our Laurel refinery processes approximately 65,000 barrels of crude oil per day to produce refined products that consist of approximately 38% gasoline, 43% diesel fuel and other distillates, 12% asphalt, 6% petroleum coke and 1% other products. Refined fuels produced at our Laurel refinery are available via railcars and via the Yellowstone Pipeline to western Montana terminals and to Spokane, Washington; south via common carrier pipelines to Wyoming terminals and Denver, Colorado; and east via our wholly-owned Cenex Pipeline, LLC, to Glendive, Montana, and to Minot, Prosper and Fargo, North Dakota.
McPherson refinery. Our McPherson, Kansas, refinery processes approximately 58% low- and medium-sulfur crude oil and approximately 42% heavy-sulfur crude oil into gasoline, diesel fuel and other distillates, petroleum coke and other products. The refinery sources its crude oil through its own pipelines, as well as through joint venture and common carrier pipelines. Low- and medium-sulfur crude oil is sourced from Kansas, Colorado, North Dakota, Oklahoma and Texas, and heavy-sulfur crude oil is sourced from Canada and Wyoming.
Our McPherson refinery processes approximately 114,000 barrels of crude oil per day to produce refined products that consist of approximately 49% gasoline, 45% diesel fuel and other distillates, 5% petroleum coke and 1% other products. These products are loaded into trucks at the McPherson refinery or shipped via common carrier pipelines to other markets.
Other energy operations. We operate nine propane terminals, four asphalt terminals, eight refined product terminals and two lubricants blending and packaging facilities. We also own and lease a fleet of liquid and pressure trailers and tractors, which transport refined fuels, propane, anhydrous ammonia and other products.
Products and Services
Our Energy segment produces and sells (primarily wholesale) gasoline, diesel fuel, propane, asphalt, lubricants and other related products, and also provides transportation services. In addition to selling products refined at our Laurel and McPherson refineries, we purchase refined petroleum products from third parties as the need arises. For fiscal 2024, we produced approximately 81% of the refined petroleum products we sold at our Laurel and McPherson refineries and obtained approximately 19% from third parties. The percentage of refined petroleum products that we obtain from third parties is dependent on refinery production volumes and will vary from year to year, primarily based on our planned major maintenance schedule.
Sales and Marketing: Customers
We market approximately 76% of our refined fuel products to members, with the balance sold to nonmembers. Sales are made wholesale to member cooperatives and through a network of independent retailers that operate convenience stores under the Cenex brand. We sold approximately 1.5 billion gallons of gasoline and approximately 1.7 billion gallons of diesel fuel in fiscal 2024. We also blend, package and wholesale auto and farm equipment lubricants to members and nonmembers. We are one of the nation's largest propane wholesalers based on revenues. Most of the propane sold in rural areas is for heating and agricultural use. Annual sales volumes of propane vary greatly depending on weather patterns and crop conditions.
Industry: Competition
The petroleum business is highly cyclical. Demand for crude oil and energy products is driven by the condition of local and worldwide economies, local and regional weather patterns and taxation relative to other energy sources, which can significantly affect the price of refined fuel products. Our Energy segment generally experiences higher volumes and revenues in certain operating areas, such as refined fuel products in the spring, summer and early fall when gasoline and diesel fuel use by our agricultural customers is highest and is subject to domestic supply and demand forces. Other energy products, such as propane, generally experience higher volumes and revenues during the winter heating and crop-drying seasons. More fuel-efficient equipment, reduced crop tillage, depressed prices for crops, weather conditions and government programs that encourage idle acres may all reduce demand for our energy products.
Regulation. Governmental regulations and policies, particularly in the areas of taxation, energy and the environment, have a significant impact on our Energy segment. Our Energy segment's operations are subject to laws and related regulations and rules designed to protect the environment that are administered by the U.S. Environmental Protection Agency ("EPA"), the U.S. Department of Transportation ("DOT"), the U.S. Department of Transportation Pipeline and Hazardous Materials Safety Administration, the Federal Energy Regulatory Commission and similar government agencies. These laws, regulations and rules govern, among other things, discharge of materials into the environment, including air and water; reporting storage of hazardous wastes and other hazardous materials; transportation, handling and disposal of wastes and other materials; labeling of pesticides and similar substances; and investigation and remediation of the release of hazardous materials. Failure to comply with these laws, regulations and rules could subject us to administrative penalties, injunctive relief, civil remedies and possible product recalls. Our hedging transactions and activities are subject to the rules and regulations of the exchanges we use and to governing bodies, such as the Chicago Mercantile Exchange ("CME"), the New York Mercantile Exchange ("NYMEX") and the U.S. Commodity Futures Trading Commission ("CFTC").
Competition. The petroleum refining and wholesale fuels business is highly competitive. Among our competitors are some of the world's largest integrated petroleum companies, which have their own crude oil supplies and distribution and marketing systems. We also compete with smaller domestic refiners and marketers in the midwestern and northwestern United States, with foreign refiners who import products into the United States and with producers and marketers in other industries supplying other forms of energy and fuels to consumers. Given the commodity nature of the end products, profitability in the industry depends largely on margins, operating efficiency, product mix and costs of product distribution and transportation. Our retail gasoline competitors are much larger than CHS and have greater brand recognition and distribution outlets throughout the country and world than we do. We also are experiencing increased competition from regional and unbranded retailers.
We market refined fuel products in five principal geographic regions. The first region includes the Midwest and Northern Plains. Competition at the wholesale level in this area includes major oil companies, as well as independent refiners and wholesale brokers and/or suppliers. This region has a robust spot market and is influenced by the large refinery center along the Gulf Coast.
A second unique marketing region centers near Chicago, Illinois, and includes Illinois, Indiana and eastern Wisconsin. In this region, we principally compete with the major oil companies, as well as independent refiners and wholesale brokers and/or suppliers.
Another market region includes Arkansas, Missouri and northern Texas. Competition in this region includes the major oil companies and independent refiners. This region is principally supplied by the Gulf Coast refinery center and is also driven by a strong spot market that reacts quickly to changes in the international and national supply balance.
Another geographic region includes Colorado, Idaho, Montana, western North Dakota, western South Dakota, Utah and Wyoming. Competition at the wholesale level in this region includes the major oil companies and independent refiners.
The fifth region includes much of Oregon and Washington. We compete with the major oil companies in this region, which is known for volatile prices and an active spot market.
AG
Overview
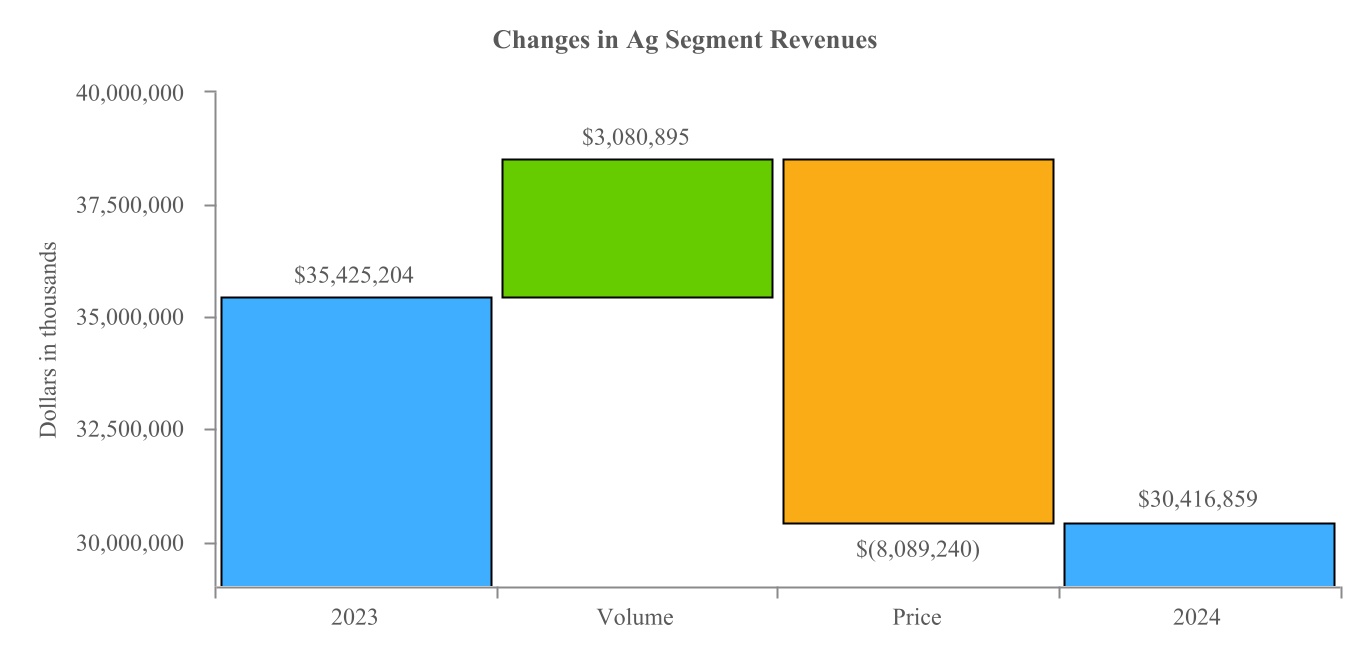
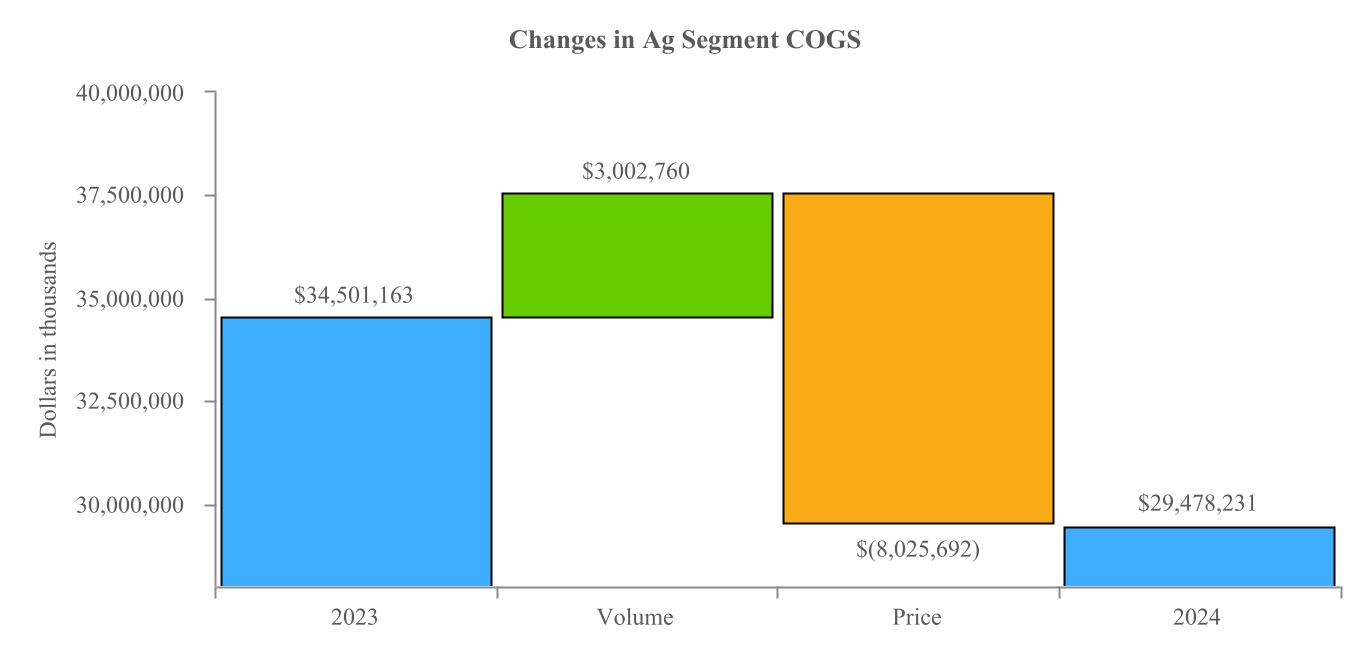
Our Ag segment includes global grain and processing, ag retail (formerly referred to as country operations) and wholesale agronomy businesses. These businesses work together to facilitate production, purchase, sale and eventual use of grain and other agricultural products within the United States and internationally. In fiscal 2024, revenues in our Ag segment were $30.4 billion after elimination of intersegment revenues.
Operations
Global grain and processing. We are the nation's largest cooperative marketer of grain and oilseed based on grain sales. Our global grain marketing operations purchase grain directly from agricultural producers and elevator operators primarily in the midwestern and western United States and indirectly through our ag retail business. Purchased grain is typically contracted for sale for future delivery at a specified location, and we are responsible for handling the grain and either arranging for or facilitating its transportation to that location. We own and operate export terminals, river terminals and elevators throughout the United States to handle and transport grain and grain products. We also maintain locations in Europe, the Middle East, the Pacific Rim and South America for marketing, merchandising and/or sourcing grains and crop nutrients. We primarily conduct our global grain marketing operations directly, but do conduct some of our operations through joint ventures, including TEMCO, LLC ("TEMCO"), a 50%-owned joint venture with Cargill, Incorporated ("Cargill"), that focuses on exports, primarily to Asia.
Our processing business includes our oilseed processing and renewable fuels production businesses. Oilseed processing is conducted at facilities that crush approximately 144 million bushels of soybeans and canola on an annual basis, producing approximately 3 million short tons of meal and flour and 1.9 billion pounds of edible and inedible oil annually. We purchase oilseeds to be processed from members, other CHS businesses and third parties that have tightly integrated connections with our global grain marketing operations and ag retail business. Our renewable fuels business produces 261 million gallons of fuel-grade ethanol, 70 million pounds of inedible corn oil and 658,000 tons of dried distillers grains with solubles ("DDGS") annually. Renewable fuels produced by our production plants are marketed by our global grain marketing business, along with more than 450 million gallons of ethanol and 5 million tons of DDGS annually under marketing agreements with ethanol production plants.
Ag retail. Our ag retail business operates 420 agri-operations locations through 27 business units dispersed throughout the midwestern and western United States. Most of these locations purchase grain from farmers and sell agronomy, energy, feed and seed products to those same producers and others, although not all locations provide every product and service. We also manufacture animal feed through nine owned plants and three limited liability companies.
Wholesale agronomy. Our wholesale agronomy business includes our wholesale crop nutrients and wholesale crop protection businesses. Our wholesale crop nutrients business delivers products directly to our customers and our ag retail business from the manufacturer or through our 11 warehouse terminals and other nonowned storage facilities located throughout the United States. To supplement what is purchased domestically, our Galveston, Texas, deepwater port and terminal receives fertilizer from vessels originating in Europe and Asia where significant volumes of urea are produced. The fertilizer is then shipped by rail to destinations within crop-producing regions of the United States. Our wholesale crop protection business operates out of our network of 28 warehouses from which we deliver products directly to our member cooperatives and independent retailers. We also operate a bulk chemical rail terminal in Brooten, Minnesota, where we handle and store crop protection products for some of the crop protection industry's largest chemical manufacturers. This facility has more than 6 million gallons of chemical storage capacity.
Products and Services
Our Ag segment provides member cooperatives and farmers with the inputs and services they need to produce grain and raise livestock. These include seed, crop nutrients, crop protection products, animal feed, animal health products, refined fuels and propane. We also buy and merchandise grain in both domestic and international markets. With a portion of the grain we purchase, we produce renewable fuels, including ethanol, and DDGS. We also produce refined soy and canola oils, soybean meal, canola meal and soyflour at our processing facilities.
Sales and Marketing: Customers
Our Ag segment provides products and services to a wide range of customers, primarily in the United States. These customers include member and nonmember producers, member cooperatives, elevators, grain dealers, grain processors and crop nutrient and crop protection retailers. We sell our edible soy and canola oils and soyflour to food companies and our inedible oils may be sold to energy companies. The soybean meal and canola meal we produce is sold to integrated livestock producers and feed mills. The ethanol and DDGS we produce are sold throughout the United States and to international customers.
Industry: Competition
Most of the business activities in our Ag segment are highly seasonal and, consequently, the operating results for our Ag segment vary throughout the year. For example, our ag retail business generally experiences higher volumes and revenues during the spring planting and fall harvest seasons and our agronomy business generally experiences higher volumes and revenues during the spring planting season. In addition, our Ag segment operations may be adversely affected by relative levels of supply and demand, both domestic and international, commodity price levels and transportation costs and conditions. Supply is affected by weather conditions, plant disease, insect damage, acreage planted, wars and civil unrest, and government regulations and policies. Demand may be affected by foreign governments and their programs, relationships of foreign countries with the United States, affluence of foreign countries, wars and civil unrest, currency exchange fluctuations and substitution of commodities. Demand may also be affected by changes in eating habits, population growth, per capita consumption of some products, federal and state policies, and renewable fuels production levels and state and federal incentives.
Regulation. Our Ag operations are subject to laws and related regulations and rules designed to protect the environment that are administered by the EPA, DOT and similar government agencies. These laws, regulations and rules govern, among other things, discharge of materials into the environment, including air and water; reporting storage of hazardous wastes and other hazardous materials; transportation, handling and disposal of wastes and other materials; labeling of pesticides and similar substances; and investigation and remediation of the release of hazardous materials. In addition, environmental laws impose a liability on owners and operators for investigation and remediation of contaminated property and on a party that sends hazardous materials to those contaminated properties for treatment, storage, disposal or recycling. In some instances, that liability exists regardless of fault. Our global grain and processing and ag retail businesses are also subject to laws and related regulations and rules administered by the U.S. Department of Agriculture, the U.S. Food and Drug Administration and other federal, state, local and foreign governmental agencies that govern processing, packaging, storage, distribution, advertising, labeling, and quality and safety of feed and grain products. Failure to comply with these laws, regulations and rules could subject us to administrative penalties, injunctive relief, civil remedies and possible product recalls. The hedging transactions and activities of our global grain and processing and ag retail businesses are subject to the rules and regulations of the exchanges we use and to the governing bodies, such as the CME, the Chicago Board of Trade ("CBOT"), the Minneapolis Grain Exchange ("MGEX") and the CFTC.
Competition. In our Ag segment, we have significant competition in the businesses in which we operate based principally on price, services, quality, patronage and alternative products. Our businesses depend on relationships with member cooperatives and private retailers; proximity to customers and producers; competitive pricing; and safety of food, feed and grain products. We compete with other large distributors of agricultural products, as well as with regional or local distributors, cooperatives, retailers and manufacturers.
NITROGEN PRODUCTION
Overview
Our Nitrogen Production segment consists of our approximate 8.4% membership interest (based on product tons) in CF Nitrogen, our strategic venture with CF Industries Holdings, Inc. ("CF Industries"), and allocated expenses. In connection with our investment in CF Nitrogen, we entered into a supply agreement with CF Nitrogen that entitles us to purchase up to 1.1 million tons of granular urea and 580,000 tons of urea ammonium nitrate ("UAN") annually for ratable delivery through fiscal 2096. We account for our CF Nitrogen investment using the hypothetical liquidation at book value method. On August 31, 2024, our investment was approximately $2.5 billion. See Note 6, Investments, of the notes to the consolidated financial statements that are included in this Annual Report on Form 10-K for additional information.
We believe our investment in CF Nitrogen positions CHS and our members for long-term, dependable fertilizer supply, supply chain efficiency and production economics. In addition, the ability to source products from CF Nitrogen production facilities under our supply agreement benefits our members and customers through strategically positioned access to essential fertilizer products.
Operations
CF Nitrogen has six production facilities located in Donaldsonville, Louisiana; Port Neal, Iowa; Medicine Hat, Alberta, Canada; Yazoo City, Mississippi; and Woodward and Verdigris, Oklahoma. Natural gas is the principal raw material and primary fuel source used in the ammonia production process. CF Nitrogen has access to competitively priced natural gas through a reliable network of pipelines connected to major natural gas trading hubs near its production facilities.
Products and Services
CF Nitrogen produces nitrogen-based products, including methanol, UAN, urea and related products.
Sales and Marketing: Customers
CF Nitrogen has three customers, which are CHS and two consolidated subsidiaries of CF Industries.
Industry: Competition
Regulation. CF Nitrogen is subject to laws and related regulations and rules designed to protect the environment administered by the EPA and similar government agencies. These laws, regulations and rules govern, among other things, discharge of materials into the environment, including air and water; reporting storage of hazardous wastes and other hazardous materials; handling and disposal of wastes and other materials; and investigation and remediation of the release of hazardous materials. In addition, environmental laws impose a liability on owners and operators for investigation and remediation of contaminated property and on a party that sends hazardous materials to those contaminated properties for treatment, storage, disposal or recycling. In some instances, that liability exists regardless of fault.
Competition. CF Nitrogen competes primarily on delivered price and, to a lesser extent, on customer service and product quality. CF Nitrogen competes domestically with large companies in the fertilizer industry. There is also significant competition from products sourced from other regions of the world.
CORPORATE AND OTHER
CHS Capital. Our wholly-owned financing subsidiary, CHS Capital, LLC ("CHS Capital"), provides member cooperatives with loans that meet commercial agriculture needs. These loans include operating, term, revolving and other short- and long-term options. CHS Capital also provides loans to individual producers for crop inputs, feed and hedging-related margin calls. Producer operating loans are also offered in strategic geographic regions.
CHS Hedging. Our wholly-owned commodity brokerage subsidiary, CHS Hedging, LLC ("CHS Hedging"), is a registered, CFTC-regulated futures commission merchant ("FCM") and a clearing member of the CBOT, CME, NYMEX and MGEX. CHS Hedging provides consulting services and commodity risk management services primarily in the grains, oilseeds, fertilizer, livestock, dairy and energy markets. CHS Hedging is also the FCM for the majority of our commodity futures trading.
Foods. Ventura Foods is a joint venture between CHS and Mitsui & Co., with each company owning 50% interest. Ventura Foods produces and distributes edible oil-based products. We account for our investment in Ventura Foods using the equity method of accounting, and the investment balance was equal to $511.2 million on August 31, 2024. See Note 6, Investments, of the notes to the consolidated financial statements that are included in this Annual Report on Form 10-K for additional information.
Wheat milling. Ardent Mills, the largest flour miller in the United States, is a joint venture of CHS, Cargill and Conagra Brands, Inc. ("Conagra"). In connection with the Ardent Mills joint venture, CHS, Cargill and Conagra have various ancillary and noncompete agreements including, among other things, an agreement for us to supply Ardent Mills with certain wheat and durum products. We hold a 12% interest in Ardent Mills and account for our investment as an equity method investment due to our ability to exercise significant influence by appointing a member of the board of shareholders and board of managers of Ardent Mills. On August 31, 2024, our investment in Ardent Mills was $234.0 million. See Note 6, Investments, of the notes to the consolidated financial statements that are included in this Annual Report on Form 10-K for additional information.
HUMAN CAPITAL RESOURCES
Our human capital resources objectives include identifying, attracting, retaining, developing, incentivizing and onboarding our current and new employees. We monitor our progress toward these objectives by measuring human capital metrics such as engagement, total and regrettable turnover, hiring statistics and overall cost of human resources delivery. In addition to these objectives, we also promote a culture focused on our value of inclusion, provide learning and development opportunities, help maintain the health and safety of our employees, encourage community involvement and offer competitive pay and benefits. Additional information regarding our employee population and human capital strategies is described below.
Employee population. On August 31, 2024, we had 10,730 full-time, part-time, temporary and seasonal employees, primarily in the United States. Of that total, 2,426 were employed in our Energy segment, 5,859 were employed in our Ag segment and 2,445 were employed in Corporate and Other. In addition to those individuals directly employed by us, many individuals work for or support our joint ventures, including CF Nitrogen in our Nitrogen Production segment and Ventura Foods and Ardent Mills in our Corporate and Other category, and are not included in these totals. As of August 31, 2024, we had 11 collective bargaining agreements with unions covering approximately 8% of our employees in the United States and expiring on various dates through May 31, 2027. We believe our relations with our employees are strong. We value our employees and believe that employee passion for our work and employee engagement are key elements of our operating performance.
Inclusion and diversity. The CHS value of inclusion compels us to create a work environment where excellence and growth stem from diverse thinking. Our goal is to foster a workplace where diverse thinking, voices and backgrounds yield better employee experiences, business performance and business outcomes. In addition to working on modeling inclusive behaviors that positively impact our workplace and communities, we follow our enterprisewide strategic plan to improve inclusion and diversity at CHS. We sponsor and support employee resource groups made up of individuals who join together to promote inclusion and diversity, while providing our employees opportunities to strengthen relationships, learn through educational and networking opportunities that focus on development, help local communities and engage with others across CHS. These employee resource groups include Harvest Pride, which promotes a safe, connected and empowered LGBTQA+ community across CHS; Mozaiko, which promotes ethnic diversity and inclusion at CHS while supporting an inclusive environment for all employees; VERG, which provides support, camaraderie and resources for employees formerly or currently serving in the military and their families; Women in Leadership, which supports women in the workplace to grow personally and professionally; and CultivateHER, a cohort within Women in Leadership, which supports women across our Ag segment.
Learning and development. We are committed to investing in our employees to help them build knowledge, develop skills and achieve their career goals. In addition to regular performance evaluations and annual development plans that provide employees with feedback and growth opportunities, employees at CHS have access to learning tools, programs and other opportunities for growth. These include access to on-demand learning modules; internal and external training programs that cover topics such as continuous improvement, public speaking, professional sales skills and change management; participation in a mentoring program and development coaching; tuition and professional certification reimbursement; as well as other opportunities focused on developing current and future leaders of CHS.
Health and safety. Safety is one of our core values. At CHS, safety is about more than just following the rules; it is about doing things the right way and remembering that no job is so critical that it warrants safety risks. In addition to safety programs designed specifically for individual facilities with operational hazards related to grain, feed, seed, agronomy, petroleum, warehouses and retail operations, we also provide certain employee groups with additional training opportunities such as a defensive driving program. Beyond developing defined safety programs and training opportunities, we monitor our incident rates in comparison to previous years and industry averages, as published by the Bureau of Labor Statistics. During fiscal 2024, our Occupational Safety and Health Administration ("OSHA") incident rate was 2.7 incidents per 100 full-time workers, as compared to an average of 2.9 incidents per 100 full-time workers during the three previous years, a reduction of 8%. Additionally, our lost-time injury rate was 0.9 incidents per 100 full-time workers, which matches our three-year average, and our DOT crash rate remained in the top 10% (most favorable) of all carriers in our industry segment for the third consecutive year.
Community involvement. As a cooperative, we are committed to making a measurable impact in our communities through our giving investments. In addition to our charitable foundation and annual giving campaign, which provide financial support to our communities, eligible employees also receive paid time off to make a difference in our communities through volunteer activities. During fiscal 2024, we gave approximately $7.3 million in charitable donations through our charitable foundation and corporate giving activities.
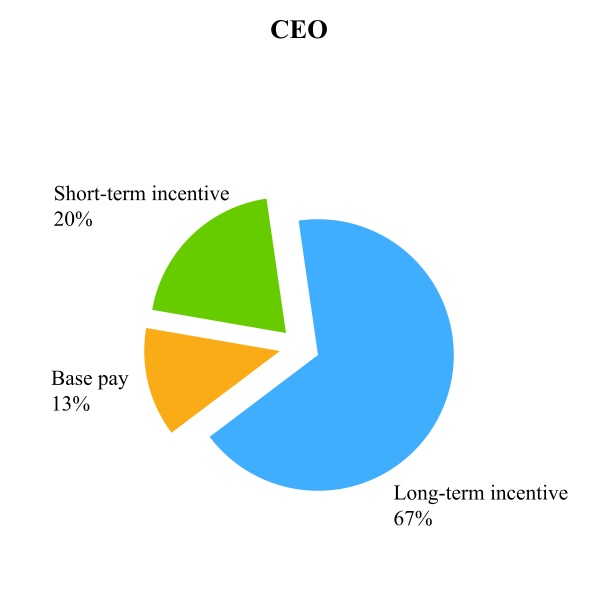
Compensation and benefits. We have designed our compensation and benefits programs to attract and retain qualified employees and to motivate employees to optimize member-owner returns and to achieve our short- and long-term strategies. In addition to offering competitive compensation that includes annual variable pay linked to company and individual employee performance, we also offer a wide array of benefits programs that include health insurance and wellness benefits; retirement benefits, including a company-matched 401(k) contribution and a pension for qualifying employees; paid time off and family leave; and employee assistance programs, including adoption assistance.
CHS AUTHORIZED CAPITAL
We are an agricultural membership cooperative organized under Minnesota cooperative law to do business with member and nonmember patrons.
ITEM 1A. RISK FACTORS
CAUTIONARY STATEMENT FOR PURPOSES OF THE SAFE HARBOR PROVISIONS
OF THE PRIVATE SECURITIES LITIGATION REFORM ACT OF 1995
This Annual Report on Form 10-K contains and our other publicly available documents may contain, and our officers, directors and other representatives may from time to time make, "forward-looking statements" within the meaning of the safe harbor provisions of the U.S. Private Securities Litigation Reform Act of 1995. Forward-looking statements can be identified by words such as "anticipate," "intend," "plan," "goal," "seek," "believe," "project," "estimate," "expect," "strategy," "future," "likely," "may," "should," "will" and similar references to future periods. Forward-looking statements are neither historical facts nor assurances of future performance. Instead, they are based only on our current beliefs, expectations and assumptions regarding the future of our businesses, financial condition and results of operations, future plans and strategies, projections, anticipated events and trends, the economy and other future conditions. Because forward-looking statements relate to the future, they are subject to inherent uncertainties, risks and changes in circumstances that are difficult to predict and many of which are outside our control. Our actual results and financial condition may differ materially from those indicated in the forward-looking statements. Therefore, you should not place undue reliance on any forward-looking statements. Important factors that could cause our actual results and financial condition to differ materially from those indicated in the forward-looking statements are discussed or identified in our public filings made with the SEC, including in this "Risk Factors" discussion. Any forward-looking statements made by us in this Annual Report on Form 10-K are based only on information currently available to us and speak only as of the date on which the statement is made. We undertake no obligation to publicly update any forward-looking statement, whether written or oral, that may be made from time to time, whether as a result of new information, future developments or otherwise, except as required by applicable law.
Reference to this cautionary statement (the "Cautionary Statement") in the context of a forward-looking statement shall be deemed to be a statement that any one or more of the following factors may cause actual results to differ materially from those indicated in the forward-looking statement.
The following risk factors are in addition to any other cautionary statements, written or oral, which may be made or referred to in connection with any particular forward-looking statement. The following risk factors should not be construed as exhaustive. Additional risks and uncertainties not currently known to us or that we currently view to be immaterial may also materially and adversely affect our business, financial condition or results of operations.
Risks Related to Operating Our Business
Our revenues, results of operations and cash flows could be materially and adversely affected by changes in commodity prices.
Our revenues, results of operations and cash flows are affected by market prices for commodities such as crude oil, natural gas, ethanol, fertilizer, grain, oilseed, flour, and crude and refined vegetable oils. Commodity prices generally are affected by a wide range of factors beyond our control, including weather, plant disease, insect damage, drought, availability and adequacy of supply, availability of reliable rail and river transportation networks, industry labor availability, outbreaks of disease, inflation, government regulation and policies, global trade disputes, international conflicts and general political and economic conditions. We are also exposed to fluctuating commodity prices as the result of our inventories of commodities, typically grain, fertilizer and petroleum products, and purchase and sale contracts at fixed or partially fixed prices. At any time, our inventory levels and unfulfilled fixed or partially fixed price contract obligations may be substantial. We have processes in place to monitor exposures to these risks and engage in strategies, such as hedging, to manage these risks. If these controls and strategies are not successful in mitigating our exposure to these fluctuations, we could be materially and adversely affected. For
example, fluctuations in commodity prices may result in significant noncash losses being incurred on our commodity-based derivatives, which may in turn materially and adversely affect our operating results. In addition, changes in market prices for commodities that we purchase without a corresponding change in the selling prices of those products can affect revenues and operating earnings. Similarly, increased or decreased sales volumes without a corresponding change in the purchase and/or selling prices of those products can affect revenues and operating earnings.
In our energy operations, profitability depends largely on the margin between the cost of crude oil that we refine and the selling prices we obtain for our refined products. The prices for crude oil and for gasoline, diesel fuel and other refined petroleum products fluctuate widely. Factors influencing these prices, many of which are beyond our control, include:
•levels of worldwide and domestic supplies;
•capacities of domestic and foreign refineries;
•ability of members of the Organization of Petroleum Exporting Countries ("OPEC") and other countries that are significant producers of oil to agree to and maintain oil price and production controls, and the price and level of imports;
•disruption in supply;
•political instability or conflict in oil-producing regions;
•levels of energy conservation efforts;
•level of demand from consumers, agricultural producers and other customers;
•price and availability of alternative fuels;
•availability of pipeline capacity; and
•domestic and foreign governmental regulations and taxes.
Many of these factors have resulted in significant volatility in crude oil, refined petroleum products and natural gas supplies and prices. We expect that volatility to continue in fiscal 2025. The long-term effects of this volatility and other conditions on the prices of crude oil, refined petroleum products and natural gas are uncertain and ever-changing. Increases in crude oil prices without a corresponding increase in the prices of our refined petroleum products, and decreases in crude oil prices with larger corresponding decreases in the prices of our refined petroleum products, would reduce our net income. Accordingly, we expect our margins and the profitability of our energy business to fluctuate, possibly significantly, over time. Our renewable fuels business produces ethanol, which is closely related to, or may be substituted for, petroleum products, and may be blended into gasoline to increase octane content. Therefore, the selling price of ethanol can be impacted by the selling prices of gasoline, diesel fuel and other octane enhancers. A significant decrease in the price of gasoline, diesel fuel or other octane enhancers could result in a significant decrease in the selling price of ethanol, which could adversely affect our revenues and operating earnings. In addition, we expect the volume of renewable fuels produced by our competitors to increase going forward. As the market for renewable fuels becomes more competitive, or if there are changes in the regulations, policies or standards affecting the demand for renewable fuels, our renewable fuels business may experience increased volatility in product margins, which could adversely affect our operating earnings.
We are subject to political, economic, legal and other risks of doing business globally.
We are a global business and are exposed to risks associated with having global operations. These risks include, but are not limited to, risks relating to terrorism, war or civil unrest; changes in a country's or region's social, economic or political conditions; changes in local labor conditions and regulations; changes in safety and environmental regulations; changes in regulatory or legal environments; expropriation or impoundment of assets; restrictions on currency exchange activities and currency exchange fluctuations; price and export controls or bans on commodities; taxes; doing business in countries or regions with inadequate infrastructure; and logistics challenges. In addition, some countries where we operate lack well-developed legal systems or have not adopted clear legal and regulatory frameworks. This lack of legal certainty exposes our operations to increased risks, including increased difficulty in enforcing our agreements in those jurisdictions and increased risk of adverse actions by local government authorities, such as unilateral or forced renegotiation, modification or nullification of existing agreements or expropriations.
Ongoing wars and global conflicts may adversely affect our business, financial condition and results of operations.
In February 2022, Russia invaded Ukraine and in October 2023, conflict escalated in the Middle East between Israel and Hamas, along with the Red Sea. The war between Russia and Ukraine and escalation of conflict in the Middle East have resulted in significant uncertainty and instability in the global commodities markets, including agricultural commodities and crude oil. In response to the Russia-Ukraine war, the United States and other North Atlantic Treaty Organization ("NATO") member states, as well as nonmember states, announced economic sanctions targeting Russia and certain Russian citizens and enterprises, including several large banks. Continuation of the war may trigger a series of additional economic and other
sanctions enacted by the United States, other NATO member states and other countries. In response, Russia has announced export bans on various products, including agricultural commodities. Although we do not maintain operations in Russia, it is a significant source of fertilizer for global markets. Such sanctions have caused inflationary pressures and impacted our ability to purchase fertilizer in the global market. If our ability to purchase fertilizer in the global market continues to be impacted by those sanctions or by other factors, it could have a material adverse effect on our business and operations. In addition, such sanctions put us at increased risk of inadvertently trading with a sanctioned partner.
We maintain limited operations in Ukraine, which is a key international grain-originating region. Our operations in Ukraine have been dramatically disrupted because of the war; however, we continue to originate grain in Ukraine for safe transit through our Romanian export channels. The ongoing war could cause harm to our employees and otherwise impair their ability to work for extended periods of time, as well as disrupt telecommunications systems, banks and other critical infrastructure necessary to conduct business in Ukraine.
The risk of cybersecurity incidents has also increased in connection with the ongoing war between Russia and Ukraine, including cyberattacks against the Ukrainian government and other countries in the region. It is possible that these attacks could have collateral effects on additional critical infrastructure and financial institutions globally, which could adversely affect our operations. Proliferation of malware from the war into systems unrelated to the war, or cyberattacks against U.S. companies in retaliation for U.S. sanctions against Russia or U.S. support of Ukraine, could also adversely affect our operations.
The war between Russia and Ukraine and escalation of conflict in the Middle East could also draw military or other intervention from additional countries, which could lead to much larger wars, conflicts and/or additional sanctions imposed by the United States government and other governments that restrict business with specific persons, organizations or countries with respect to certain products or services. If such escalation should occur or such sanctions are imposed, supply chains, trade routes and markets currently served by us could be adversely affected, which in turn could materially adversely affect our business operations and financial performance. Furthermore, the actions undertaken by western nations in response to Russia's actions have had, and may continue to have, adverse impacts on global financial markets.
We may also experience negative reactions from our members, shareholders, lenders, employees, customers or other stakeholders as a result of our action or inaction related to the war between Russia and Ukraine or the escalation of conflict in the Middle East.
Even if the war and global conflicts moderate or resolutions are reached, we expect that we will continue to experience ongoing financial and operational impacts resulting from these conflicts for the foreseeable future. Additionally, certain of the economic and other sanctions imposed, or that may be imposed, against participants in the war and global conflicts and its citizens and enterprises may continue for a period of time after any resolution has been reached.
Our business and operations and demand for our products are highly dependent on certain global and regional factors that are outside our control and could adversely impact our business.
Demand for our products is affected by global and regional demographics and macroeconomic conditions, including population growth rates and changes in standards of living. A significant downturn in global economic growth or recessionary conditions in major geographic regions may lead to reduced demand for our products and services, which could have a material adverse effect on our business, financial condition, liquidity, results of operations and prospects. Weak global economic conditions and adverse conditions in financial and capital markets may adversely impact the financial condition and liquidity of some of our customers, suppliers, the financial institutions that serve as our lenders and other counterparties, which could have a material adverse effect on our customers' abilities to pay for our products and on our business, financial condition, liquidity, results of operations and prospects.
Additionally, planted acreage and consequently the volume of crop nutrient and crop protection products applied, is partially dependent on government programs, grain prices and the perception held by producers of demand for production, all of which are outside our control. Moreover, our business and operations may be affected by fluctuations in freight and logistics costs, disruptions in supply channels between parties and locations that include our suppliers, production and storage facilities, tolling and packaging partners, distributors and customers, and weather conditions, including those due to climate change, that are outside our control. The following are examples of factors that could impact our businesses.
•Weather conditions during the spring planting season and early summer crop nutrient and crop protection application season affect agronomy product volumes and profitability.
•Adverse weather conditions, such as drought, heavy snowfall or rainfall and any flooding that results, may cause transportation delays and increased transportation costs or damage physical assets, especially facilities in low-lying areas near coasts and riverbanks or situated in hurricane-prone and/or rain-susceptible regions.
•Changes in weather patterns may shift periods of demand for products or regions in which our products are produced or distributed, which could require us to revise our procurement and distribution processes.
•Significant changes in water levels (up or down, as a result of flooding, drought or otherwise), including recent low water levels in the U.S. river system and in the Panama Canal (which have delayed shipping in these locations resulting in an increase in shipping costs), may cause changes in agricultural activity, which could require changes to our operating and distribution activities, as well as significant capital improvements to our facilities.
•Climate change may cause changes in weather patterns and conditions, including changes in rainfall and storm patterns and intensities, water shortages, changes in sea levels and changes in temperature levels, all of which could adversely impact our costs and business operations; the location, cost and competitiveness of commodity agricultural production; related storage and processing facilities; dock availability; and demand for agricultural commodities, and may result in incidents of stranded physical assets. The frequency and severity of the effects of climate change and changes in weather patterns have been increasing. These effects could significantly reduce demand for the products we sell to or buy from agricultural producers and local cooperatives, and therefore could adversely impact our results of operations, liquidity or capital resources.
•We may experience increased insurance premiums and deductibles or decreases in available coverage for our assets in areas subject to adverse weather conditions.
Additionally, there will likely be increased strains on and risks to the integrity, reliability and resilience of electrical grids and increased volatility and tightness in natural gas and electricity supplies across the world. These events could negatively affect the cost, reliability, and availability of our natural gas and electricity supplies and may cause sporadic outages disrupting our operations. Growing electrification and rapidly developing and increasing technology use (such as artificial intelligence, computer processing, cryptocurrency mining and cloud storage and the data centers and power supplies required to support these activities) will also likely increase the intermittency and decrease the reliability of electricity supplies, particularly for grids highly dependent upon wind and solar power, which would exacerbate the foregoing challenges. Emerging sustainability, new regulations and other environmental priorities outside our control could also affect agricultural practices and future demand for agronomy products applied to crops and the volume of any such application. These priorities could also impact demand for our grain and energy products, and may require us to incur additional costs for increased due diligence and reporting. Accordingly, factors outside our control could materially and adversely affect our revenues, results of operations and cash flows.
Inflation may result in increased costs, which could have a material and adverse effect on our results of operations.
We have experienced and anticipate continued effects of inflation on costs such as labor, freight, natural gas and materials. In response to global inflationary pressures, the U.S. Federal Reserve and foreign equivalents have maintained higher interest rates, which has resulted in continued uncertainty and volatility in global financial markets and increased borrowing costs under certain of our credit facilities, including our five-year revolving credit facility and our 10-year term loan facility. Inflation and its impacts, many of which are beyond our control, could escalate in the future. To mitigate commodity cost increases, we have implemented various strategies that include, among other things, entering into contracted pricing with certain vendors, procuring commodities in periods of favorable market conditions and entering into various derivative instruments. These actions may, in part, mitigate these increased costs, but even by increasing our product prices and passing some or all of our increased costs to customers or implementing cost saving efforts, we may not be able to fully offset these increased costs. Additionally, increased prices may not be sustainable over time and may result in reduced sales volumes. Accordingly, inflationary pressures could have a material and adverse effect on our results of operations. There can be no guarantee that our efforts to mitigate commodity cost increases due to inflationary pressures will be effective or, if they are effective, that they will have a material impact on maintaining or reducing costs.
We participate in highly competitive business markets and we may not be able to continue to compete successfully, which could have a material adverse effect on us.
We operate in highly competitive business segments and our competitors may succeed in developing new or enhanced products that are better than ours, may be more successful in marketing and selling their products than we are, or may have more effective supply chain capabilities than we have. Competitive factors include price, service level, proximity to markets, access to transportation, product quality, marketing and risk management. In particular, competitive pressures may restrict our ability to increase prices and maintain those price increases, including price increases made in response to commodity and other cost increases. We may experience delays between the time that we take inflation-related pricing actions and the time that we realize the impact of those actions on our margins and results of operations. In our business segments, we compete with companies that are larger and better known than we are and have greater marketing, financial, personnel and other resources than we do. For example, in conjunction with the recent increase in demand for renewable diesel feedstocks, we have experienced added competition for soybean oil refining capacity from traditional petroleum companies. As a result, we may not
be able to continue to compete successfully, which could have a material adverse effect on our business, financial condition, liquidity, results of operations and prospects.
Our revenues, margins, results of operations and cash flows could be materially and adversely affected if our members were to do business with other companies rather than with us.
We do not have an exclusive relationship with our members, and our members are not obligated to supply us with their products or purchase products from us. Our members often have a variety of distribution outlets and product sources available to them. If our members were to sell their products to other purchasers or purchase products from other sellers, our revenues and margins would decline and our results of operations and cash flows could be materially and adversely affected.
If our customers choose alternatives to our refined petroleum products, our revenues, results of operations and cash flows could be materially and adversely affected.
Numerous energy sources could serve as alternatives to our gasoline, diesel fuel and other refined petroleum products. If any of these alternative products become more economically viable or preferable to our customers for environmental or other reasons, demand for our energy products would decline. In addition, many governments have imposed, and in the future may impose, policies and regulations aimed at decreasing reliance on petroleum-based products, which could reduce demand for our energy products. In addition, a number of companies have announced their intention to phase out production of gasoline- and diesel-powered light-duty vehicles by the mid-2030s. While these phaseouts primarily impact light-duty vehicles outside our primary markets, they are expected to accelerate the decline in demand for gasoline, diesel fuel and other refined petroleum products. Declining demand for our energy products, particularly diesel fuel sold for farming and other heavy-duty equipment applications, could materially and adversely affect our revenues, results of operations and cash flows.
Consolidation among producers of products we purchase and customers for products we sell could materially and adversely affect our revenues, results of operations and cash flows.
Consolidation has occurred among the producers and manufacturers of products we sell and purchase, including crude oil, crop nutrients and grain, and it is highly likely this consolidation will continue in the future. Consolidation could allow producers to negotiate pricing, supply availability and other contract terms that are less favorable to us. In addition, consolidation may increase the likelihood that consumers or end users of these products enter into supply relationships with a smaller number of producers, resulting in potentially higher prices for the products we purchase.
Consolidation has occurred among member cooperatives that are the primary wholesale customers of our products, which has resulted in a smaller wholesale and retail customer base for our products and has intensified the competition for these customers. It is highly likely this consolidation will continue in the future. Ongoing consolidation among distributors and brokers of food products and food retailers has altered the buying patterns of those businesses, as they have increasingly elected to work with product suppliers who can meet their needs nationwide or globally, rather than just regionally or locally. If these cooperatives, distributors, brokers and retailers elect to not purchase our products, our revenues, results of operations and cash flows could be materially and adversely affected.
In seed, crop nutrient and crop protection markets, consolidation at both the producer and wholesale customer levels has increased potential for direct sales from input manufacturers to cooperative customers and/or individual agricultural producers, which would remove us from the supply chain and could have a material and adverse effect on our revenues, results of operations and cash flows.
We are exposed to risk of nonperformance and nonpayment by counterparties.
We are exposed to risk of nonperformance and nonpayment by counterparties, whether pursuant to contracts or otherwise. Risk of nonperformance and nonpayment by counterparties includes the inability or refusal of a counterparty to pay us; the inability or refusal to perform because of a counterparty's financial condition and liquidity, operational failures, labor issues, cybersecurity events, outbreaks of disease or for any other reason; and risk that the counterparty will refuse to perform a contract during a period of price fluctuations where contract prices are significantly different than current market prices. In the event we experience significant nonperformance or nonpayment by counterparties, our financial condition, results of operations and cash flows could be materially and adversely affected. For example, we store inventory in third-party warehouses, and the operators of these warehouses may not adequately store or secure our inventory, or they may improperly sell that inventory to someone else, which could expose us to loss of the value of that inventory. In the event we experience any such nonperformance by a third-party warehouse operator, our financial condition, results of operations and cash flows could be materially and adversely affected. As another example, if any of our counterparties experience a cybersecurity breach or system
failure or does not respond or perform effectively in connection with such cybersecurity breach or system failure, their businesses could be negatively impacted, and it may result in disruption to our supply chain or distribution channels, which could have a material adverse effect on our business.
Our business, profitability and liquidity may be adversely affected by deterioration in the credit quality of, or defaults by, third parties who owe us money.
We extend credit to, make loans to and engage in other financing arrangements with individual producers, local cooperatives and other third parties around the world. We incur credit risk and the risk of losses if our borrowers and others to which we extend credit do not repay their loans or perform their obligations to pay us the money they owe. These parties may default on their obligations to us due to bankruptcy, lack of liquidity, operational failure or for other reasons. If these counterparties do not pay us back and we experience significant defaults on their payment obligations to us, our financial condition, results of operations or cash flows could be materially and adversely affected.
We are also subject to the risk that our rights against borrowers and other third parties that owe us money may not be enforceable in all circumstances. For example, a borrower or third-party may declare bankruptcy. In addition, the credit quality of borrowers and other third parties whose obligations we hold could deteriorate due to a number of factors, including deterioration in the value of collateral posted by those parties to secure their obligations to us pursuant to purchase contracts, loan agreements or other contracts. If deterioration occurs, the material adverse effects of third parties not performing their repayment obligations may be exacerbated if the collateral held by us cannot be realized or is liquidated at prices not sufficient to recover the full amount owed to us. For example, certain loans and other financing arrangements we undertake with agricultural producers are typically secured by the counterparty's crops planted in the current year. There is a risk that the value of the crop will not be sufficient to satisfy the counterparty's repayment obligations under the financing arrangement as a result of weather; crop-growing conditions; other factors that influence the price, supply and demand for agricultural commodities; or for other reasons.
In addition, disputes may arise as to the amount of collateral we are entitled to receive and the value of pledged assets. Termination of contracts and foreclosure on collateral may subject us to claims for improper exercise of our rights. Default rates, downgrades and disputes with counterparties as to the valuation of collateral increase significantly in times of market stress and illiquidity.
With respect to our lending activity, we evaluate the collectability of commercial and producer loans on a specific identification basis based on the amount and quality of the collateral obtained and record specific loan loss reserves when appropriate. Consistent with accounting principles generally accepted in the United States ("U.S. GAAP"), we maintain a general reserve based on our best estimate of expected credit losses. For other forms of credit, we establish reserves as appropriate and consistent with U.S. GAAP. The reserves represent our best estimate based on current facts and circumstances. Future developments or changes in assumptions may cause us to record adjustments to the reserves that could materially and adversely affect our results of operations.
Our risk management strategies may not be effective.
Our business is affected by fluctuations in commodity prices, transportation costs, energy prices, foreign currency exchange rates and interest rates. We monitor position limits, accounts receivables and other exposures and engage in other strategies and controls to manage these risks. Our monitoring efforts may not be effective at detecting a significant risk exposure and our controls and strategies may not be effective in adequately managing against occurrence of a significant loss relating to a risk exposure. If our controls and strategies are not successful in mitigating or preventing our financial exposure to losses due to the fluctuations or failures mentioned above, it could significantly and adversely affect our operating results.
Actual or perceived quality, safety or health risks associated with our products could subject us to significant liability and damage our business and reputation.
If any of our food or animal feed products were to become adulterated or misbranded, we may need to recall those items and could experience product liability claims if either consumers or customers' livestock or pets were injured or were claimed to be injured as a result. A widespread product recall or a significant product liability judgment could cause our products to be unavailable for a period of time or could cause a loss of consumer or customer confidence in our products. Even if a product liability claim were unsuccessful or were not fully pursued, the negative publicity surrounding any assertion that our products caused illness or injury could adversely affect our business and reputation with existing and potential consumers and customers and our corporate and brand image. The growing use of social and digital media by consumers has greatly increased the speed and extent that information or misinformation and opinions can be shared. Negative posts or comments
about us, our brands or our products on social or digital media could seriously damage our brands and reputation. Moreover, product liability claims or liabilities might not be covered by our insurance or by any rights of indemnity or contribution that we may have against others. In addition, general public perceptions regarding the quality, safety or health risks associated with particular food or animal feed products, such as concerns regarding genetically modified crops, could reduce demand and prices for some of the products associated with our businesses. To the extent that consumer preferences evolve away from products produced by CHS or our members for health or other reasons, such as the growing demand for organic food products and products that are sustainably grown and made, including low-carbon grain and oilseed, and we are unable to develop or procure products that satisfy new consumer preferences, there will be decreased demand for our products, which could have a material adverse effect on our business, financial condition, liquidity, results of operations and prospects.
Our operations are subject to business interruptions, casualty losses and supply chain issues. We do not insure against all potential losses and could be seriously harmed by unanticipated liabilities.
Our operations are subject to business interruptions due to unanticipated events such as explosions, fires, other natural disasters, war, terrorism, cyberattacks, industrial accidents, pipeline interruptions, transportation delays, equipment failures, crude oil or refined product spills, adverse weather conditions and labor disputes. The following statements are examples of potential interruptions or losses.
•Our oil refineries and other facilities are potential targets for terrorist attacks that could halt or discontinue production.
•Our inability to negotiate acceptable contracts with unionized workers in our operations could result in strikes or work stoppages.
•Our corporate headquarters, the facilities we own and the inventories we carry could be damaged or destroyed by catastrophic events, adverse weather conditions or contamination.
•Our transportation operations, equipment and services could experience disruptions such as adverse operating conditions on the inland waterway system or on the seas with respect to oceangoing vessels.
•Someone may accidentally or intentionally introduce malware to our information technology systems or breach our computer systems or other cybersecurity resources.
•Occurrence of a pandemic or epidemic disease, such as the COVID-19 pandemic, could affect a substantial part of our workforce or our customers and interrupt our business operations.
The effects of any of these events could be significant. We maintain insurance coverage against many, but not all, potential losses or liabilities arising from these operating hazards, but uninsured losses or losses above our coverage limits are possible. Uninsured losses and liabilities arising from operating hazards could have a material adverse effect on us. In addition, our insurance premiums could increase or insurance coverage may become unavailable to us, particularly if we experience insurable events.
We may also be impacted by supply chain issues, due to factors largely beyond our control, which could escalate in future periods. Any such issues could result in higher costs or operational disruptions, which could have an adverse impact on our business, financial condition and results of operations.
Our business and operations have been, and may in the future, be adversely affected by epidemics, pandemics, outbreaks of disease and other adverse public health developments.
Epidemics, pandemics, outbreaks of novel diseases and other adverse public health developments in countries and states where we operate may arise at any time. Such developments could have an adverse effect on our business, financial condition and results of operations. These effects include a potentially negative impact on the availability of our key personnel; labor shortages and increased turnover; temporary closures of our facilities or facilities of our members, business partners, customers, suppliers, third-party service providers or other vendors; and interruption of domestic and global supply chains, distribution channels and liquidity and capital or financial markets. In particular, restrictions on or disruptions of transportation, port closures or increased border controls or closures, or other impacts on domestic and global supply chains or distribution channels could increase our costs for raw materials and commodity costs, increase demand for raw materials and commodities from competing purchasers, limit our ability to meet customer demand or otherwise have a material adverse effect on our business, financial condition and results of operations or cash flows. Precautionary measures we may take in the future intended to limit the impact of any epidemic, pandemic, disease outbreak or other public health development, may result in additional costs. In addition, such epidemics, pandemics, disease outbreaks or other public health developments may adversely affect economies and financial markets throughout the world, which may affect our ability to obtain additional financing for our businesses and demand for our products and services. The impact of such developments may also exacerbate the other risks discussed in this Item 1A, any of which could have a material effect on us.
We are subject to workforce factors that could adversely affect our business and financial condition.
Like most companies in the agricultural industry, we are continuously challenged to hire, develop and retain a sufficient number of employees to operate our businesses throughout our operating geographies. We may have difficulty recruiting and retaining employees with adequate qualifications and experience. The challenge of hiring new employees is exacerbated by the rural nature of our business, which provides a smaller pool of skilled employable candidates. A number of other factors may adversely affect the labor force available to us, including changes in the labor market as a result of the COVID-19 pandemic and other socioeconomic and demographic changes, high employment levels, federal unemployment subsidies and other government regulations, unemployment programs and volatility in macroeconomic factors impacting the labor market. Moreover, there continues to be a tight labor market despite the COVID-19 pandemic having largely subsided. Increases in remote work opportunities have also amplified the competition for employees and contractors. To hire new employees, we may be forced to pay higher wages or offer other benefits that might impact our cost of labor. Furthermore, when we hire new employees, lengthy training and orientation periods might be required before they are able to achieve necessary productivity levels, and we may be unable to successfully transfer our other employees' institutional knowledge and skills to them or fail to execute on internal succession plans. In addition, a competitive labor market may lead to increased turnover rates within our employee base. Increased employee turnover results in significant time and expense relating to identifying recruiting, hiring, relocating and integrating qualified individuals. High employee turnover of key personnel may further deplete our institutional knowledge base and erode our competitiveness. These or other workforce factors could negatively impact our business, financial condition or results of operations.
Technological improvements and sustainability initiatives could decrease demand for our agronomy and energy products.
Technological advances in agriculture, as well as sustainability initiatives and practices, could decrease the demand for crop nutrients, energy and other crop input products and services we provide. Genetically engineered seeds that resist disease and insects, or that meet certain nutritional requirements, could affect the demand for our seed, crop nutrients and crop protection products. Demand for fuel we sell could decline as technology allows for more efficient usage of equipment or should alternative energy sources become more viable due to technological advances. Declining demand for our products could materially and adversely affect our revenues, results of operations and cash flows.
We utilize information technology systems to support our business. The ongoing multiyear implementation of an enterprisewide resource planning system, reliance on multiple legacy business systems as well as third-party data management providers and other vendors, security breaches or other disruptions to our information technology systems or assets could interfere with our operations, compromise the security of our customers' or suppliers' information and expose us to liability that could adversely impact our business and reputation.
Our operations rely on certain key information technology ("IT") systems, many of which are legacy in nature or may depend on third-party services to provide critical connections of data, information and services for internal and external users.
Over the past several years, we have been implementing a new enterprise resource planning system ("ERP"), and we expect this ERP implementation to continue for the next several years. This ERP implementation has required and will continue to require significant capital and human resources to deploy. Changes we have experienced in the implementation timeline and scope likely have impacted the capital and operating expense amounts required to complete the implementation, and there can be no assurance that the actual costs for completing the ERP implementation will not exceed our current estimates or that the ERP will not take longer to implement than we currently expect. In addition, potential flaws in implementing the ERP or in the failure of any portion/module of the ERP to meet our needs or provide appropriate controls may pose risks to our ability to operate successfully and efficiently and with an effective system of internal controls.
There may be other challenges and risks to both our aging and current IT systems over time due to any number of causes, such as catastrophic events, availability of resources, power outages, security breaches or social engineering and cyberattacks. Additionally, development of new technologies such as generative artificial intelligence ("AI") is progressing at an unprecedented pace, which brings risks that could subject us to loss through various technical, legal and opportunistic-related risks. These challenges and risks could result in legal claims or proceedings, liability or penalties, disruption in operations, loss of valuable data, increased costs and damage to our reputation, all of which could adversely affect our business. Our ongoing IT investments include those relating to cybersecurity, including technology, hired expertise and cybersecurity risk mitigation actions. In addition, IT investments in new technology that could result in greater operational efficiency may further expose our IT systems to the risk of cyberattacks, especially as use of AI increases sophistication and effectiveness of social engineering and cyberattacks.
The third-party data management providers and other vendors we rely on and cloud-based services we utilize may have or may develop security problems or security vulnerabilities which may also affect our systems or data. We cannot guarantee a data security or privacy breach of their systems or other form of cyber-based attack will not occur in the future. The increase in hybrid working situations, where employees, including third-party employees, access technology infrastructure remotely, increases information technology and data security risks. Like many companies, we continue to experience an increase in the number of sophisticated attempts by external parties to access and/or disrupt our networks without authorization, such as denial of service attacks, attempted malware infections, scanning activity and phishing e-mails. There is no assurance the measures we have taken to protect our information systems will prevent or limit the impact of a future cybersecurity incident. We may incur significant costs protecting against or remediating cyber-based attacks or other cybersecurity incidents and may suffer representational harm. While we maintain a cybersecurity insurance policy that provides coverage for security incidents, we cannot be certain our coverage will be adequate for liabilities actually incurred, that insurance will continue to be available to us on financially reasonable terms or at all, or that any insurer will not deny coverage as to any future claim.
In addition, we are subject to laws and regulations in the United States and other jurisdictions regarding privacy, data protection and data security, including those related to collection, storage, handling, use, disclosure, transfer and security of personal data. These laws and regulations pose increasingly complex compliance challenges and will require us to incur costs to achieve and maintain compliance; some of those costs may be significant. Any violation of such laws and regulations, including as a result of a security or privacy breach or as a result of adoption of emerging technologies, such as AI, could subject us to legal claims, regulatory penalties and damage to our reputation. For example, the SEC recently adopted the rule, "Cybersecurity Risk Management, Strategy, Governance and Incident Disclosure," enhances and standardizes disclosures regarding cybersecurity risk management and governance, as well as material cybersecurity incidents. Under the new rule, we will be required to identify any material cybersecurity incidents on a Form 8-K and make annual disclosures describing our processes for identifying and managing material cybersecurity risks, management's role in assessing and managing such risks and the Board of Directors' oversight of cybersecurity risks. We expect to face increased costs to comply with this new SEC cybersecurity rule, including increased costs for cybersecurity training and management. Furthermore, the requirement to report cybersecurity incidents within such a short time frame could mean there will be insufficient time to halt a breach before having to report it, potentially giving hackers an advantage, and failure to promptly disclose such material incidents as required by law may result in additional financial or regulatory consequences.
Increasing scrutiny and changing expectations from stakeholders with respect to our environmental, social and governance practices may expose us to new or additional risks.
Companies across all industries are facing increasing scrutiny from stakeholders related to their environmental, social and governance ("ESG") practices and disclosures, including practices and disclosures related to climate change, human capital management, diversity and inclusion, social and community impact, corporate culture and governance standards. Investor advocacy groups, private litigants, government agencies, certain institutional investors, lenders, investment funds and other influential investors are also increasingly focused on ESG practices and disclosures and in recent years have placed increasing importance on the implications and social cost of their investments and whether companies should engage in ESG activities. Across industries, investors' and other stakeholders' increased focus and activism related to ESG and similar matters may hinder access to capital or financing, as investors or lenders may determine to reallocate capital or not commit capital as a result of their assessment of a company's ESG practices and disclosures. In addition, following recent Supreme Court decisions regarding diversity and inclusion activities those opposed to ESG initiatives have begun challenging ESG activities of other companies. If we do not adapt or comply with investor, lender, private litigant, government agency or stakeholder ESG expectations and standards, which are evolving, or if we are perceived to have not responded appropriately to the growing focus on ESG issues and opposition to ESG issues, regardless of whether there is a legal requirement to do so, we may suffer reputational damage and our business or financial condition could be materially and adversely affected. Conversely, if we comply with evolving investor, lender and stakeholder ESG expectations and standards, doing so could result in higher costs, disruption and diversion of management attention, increased strain on our resources and heightened legal and regulatory risk, and could also threaten our credibility with other investors, lenders, private litigants, government agencies and stakeholders. Investors, lenders and other stakeholders are also increasingly focused on issues related to environmental justice. This may result in increased scrutiny, protests and negative publicity with respect to our business and operations, which in turn could adversely affect our reputation, business and financial performance. In addition, ESG has become an increasingly politically charged issue, and "anti-ESG" sentiment and increased scrutiny and skepticism of ESG policies and practices have resulted in, and could continue to result in, additional demands and strains on companies.
Failures or delays in achieving our strategies or expectations related to climate change and other environmental matters could adversely affect our business, operations and reputation, and increase risk of litigation.
Our ability to achieve any of our strategies or expectations related to climate change and other environmental matters is subject to numerous factors and conditions, many of which are outside our control. Examples of such factors include, but are not limited to, evolving regulatory and other standards, processes and assumptions; the pace of scientific and technological
developments; increased costs and the availability of requisite financing; market trends that may alter business opportunities; conduct of third-party counterparties; constraint or disruptions to our supply chain; and changes in carbon markets or carbon taxes. We may be required to expend significant resources to achieve these strategies and expectations, which could significantly increase our operational costs. There can be no assurance of the extent to which any of our strategies or expectations will be achieved or that any future investments we make in furtherance of achieving these strategies or expectations will meet customer or investor expectations.
While we continue to take steps toward mitigation of climate risk and impact on climate change, transitioning our business to adapt to and comply with evolving policy, legal, and regulatory changes may impose substantial operational and compliance burdens. As a result, climate change could negatively affect our business and operations. Collecting, measuring and analyzing information relating to such matters can be costly, time-consuming, dependent on third-party cooperation and unreliable. Furthermore, methodologies for measuring, tracking and reporting on such matters continue to change over time, which requires our processes and controls for such data to evolve. Additionally, we may face increased pressure from customers, consumers, investors, activists, lenders and other stakeholders to modify our products or operations away from ingredients or activities that are considered to have greater negative impact on climate change.
Such changes to methodologies or lack of progress and failures or delays in our strategies, whether actual or perceived, in achieving our strategies or expectations related to climate change and other environmental matters could adversely affect our business, operations and reputation, and increase risk of litigation.
Acquisitions, strategic alliances, joint ventures, mergers, divestitures and other nonordinary course-of-business events resulting from portfolio management actions and other evolving business strategies could affect future results.
We monitor our business portfolio and organizational structure and have made and may continue to make acquisitions, strategic alliances, joint ventures, mergers, divestitures and changes to our organizational structure. With respect to acquisitions or mergers, future results will be affected by our ability to identify suitable acquisition or merger candidates, to adequately finance any acquisitions or mergers and to integrate acquired or merged businesses quickly and obtain the anticipated financial returns, including synergies. Our ability to successfully complete a divestiture will depend on, among other things, our ability to identify buyers that are prepared to acquire such assets or businesses on acceptable terms and to adjust and optimize our retained businesses following the divestiture. Additionally, we may fail to consummate proposed acquisitions, mergers, divestitures, joint ventures or strategic alliances after incurring expenses and devoting substantial resources, including management time, to such transactions or foregoing other strategic opportunities.
Several parts of our business, including our nitrogen production business, our foods business and portions of our global grain marketing and wheat milling operations, are operated through joint ventures with third parties where we do not have majority control of the venture. By operating a business through a joint venture, we have less control over business decisions than we have in our subsidiaries and limited liability companies in which we have a controlling interest. In particular, we generally cannot act on major business initiatives in our joint ventures without the consent of the other party or parties in those ventures. Investments in joint ventures may, under certain circumstances, involve risks not present when a third party is not involved, including the possibility that co-venturers might experience business or financial stresses that impact their ability to effectively operate the joint venture or might become bankrupt or fail to fund their share of the business; in which case the joint venture may be unable to access needed growth capital without funding from us and/or any other remaining co-venturers. Co-venturers may have economic, tax or other business interests or goals that are inconsistent with our business interests or goals and may be in a position to take actions contrary to our policies or objectives. Our co-venturers may take actions that are not within our control and that may expose our investments in joint ventures to the risk of lower values or returns. Joint venture investments may also lead to impasses. Disputes between us and co-venturers may result in litigation or arbitration that would increase our expenses and prevent our officers and/or directors from focusing their time and efforts on our day-to-day business. In addition, we may in certain circumstances, be liable for the actions of our co-venturers. Each of these matters could have a material adverse effect on us.
We have made certain assumptions and projections regarding the future of the markets served by our joint venture investments that include projected raw materiality availability and pricing, production costs, market pricing and demand for the joint venture's products. These assumptions were an integral part of the economics used to evaluate these joint venture investment opportunities prior to consummation. To the extent that actual market performance varies from our models, our ability to achieve projected returns on our joint venture investments may be impacted in a materially adverse manner. For example, assumptions we made in connection with our investment in CF Nitrogen may not align with future demand for nitrogen-based products or the cost or availability of natural gas, the primary feedstock utilized for CF Nitrogen's nitrogen-based products.
Risks Related to Laws and Regulations
Government policies, mandates, regulations and trade agreements could adversely affect our operations and profitability.
Our business is subject to numerous government policies, mandates and regulations that could have an adverse effect on our operations or profitability. For example, government policies, mandates and regulations related to genetically modified organisms, traceability standards, sustainable practices, product safety and labeling, and renewable and low-carbon fuels could have an adverse effect on our operations or profitability by, among other things, influencing planting of certain crops, location and extent of crop production, trade of processed and unprocessed commodity products, volumes and types of imports and exports, availability and competitiveness of feedstocks as raw materials, and viability and volume of certain of our products. In our Energy segment, government policies, mandates and regulations designed to stop or impede development or production of petroleum-based products, such as those limiting or banning use of hydraulic fracturing, drilling or oilsands production or restricting the sale of new combustion-engine vehicles, could adversely affect our operations and profitability.
We could be the target of claims of false or deceptive advertising under U.S. federal and state laws, as well as foreign laws, including consumer protection statutes of some states. Food product marketing has come under increased regulatory scrutiny in recent years, and the food industry has been subject to an increasing number of proceedings and claims relating to alleged false or deceptive labeling and marketing under federal, state and foreign laws or regulations. Changes in legal or regulatory requirements (such as new food safety requirements and revised nutrition facts labeling, including front-of-pack labeling and serving size regulations) or evolving interpretations of existing legal or regulatory requirements may result in increased compliance costs, capital expenditures and other financial obligations that could adversely affect our business or financial results. If we are found to be out of compliance with applicable laws and regulations in these areas, we could be subject to civil remedies, including fines, injunctions, termination of necessary licenses or permits, or recalls, as well as potential criminal sanctions, any of which could have a material adverse effect on our business. The EU deforestation-free regulation ("EUDR"), effective December 2024, will require companies trading in certain commodities, including soybeans, as well as products derived from these commodities, to ensure these commodities and related products do not result from deforestation, forest degradation or breaches of local laws after December 31, 2020, in order to sell such products in the European Union. Failure to comply with the regulation could have serious consequences, including civil, administrative and criminal penalties, as well as negative impact on our reputation, business, cash flows and results of operations.
In addition, changes in international trade agreements and trade disputes can adversely affect commodity trade flows by limiting or disrupting trade between countries or regions. In many countries around the world, historical free trade relationships are being challenged, and it is unclear what changes, if any, will be made to international trade agreements that are relevant to our business activities. These actions and uncertainties have led to significant volatility in commodity prices, disruptions in historical trade flows and shifts in planting patterns in the United States and South America, all of which have resulted in reduced volumes of grain exports overall and have presented challenges and uncertainties for our business. Changes in trade policy, withdrawals from or material modifications to relevant international trade agreements and continued uncertainty could depress economic activity and restrict our access to suppliers and customers, and we cannot predict the effects of future trade policies, disputes or agreements on our business. Tariffs and trade restrictions that are implemented on products that we buy and/or sell could increase the cost of those products or adversely affect market access. These cost increases and market changes could adversely affect demand for our products and reduce margins, which could have a material adverse effect on our business and our earnings. In addition, the U.S. government can prevent or restrict us from doing business in or with other countries, such as the economic sanctions that were imposed by the U.S. government on Russia and certain of its citizens and enterprises in connection with Russia's war with Ukraine. These restrictions and those of other governments could limit our ability to gain access to business opportunities in various countries.
Changes in federal income tax laws or in our tax status, or changes to tax rules in jurisdictions in which we operate, could increase our tax liability and reduce our net income significantly.
Current federal income tax laws, regulations and interpretations, including those specific to taxation of cooperatives, provide us certain income tax benefits such as allowing us to exclude income generated through business with or for a member (patronage-sourced income) from our taxable income to the extent it is distributed back to our members. We continue to monitor potential changes to federal income tax laws, regulations or interpretations, such as the Inflation Reduction Act of 2022, H.R. 5376, to evaluate their potential impact on our business, tax position and financial results. If in the future, for example, we were to be subject to a corporate alternative minimum tax, or we were not eligible to be taxed as a cooperative, our tax liability would significantly increase and our net income would significantly decrease.
We incur significant costs in complying with applicable laws and regulations. Any failure to comply with these laws and regulations, or to make capital or other investments necessary to comply with these laws and regulations, could expose us to unanticipated expenditures and liabilities.
We are subject to numerous federal, state and local provisions regulating our business and operations. We incur and expect to incur significant capital and operating expenses to comply with these laws and regulations. We may be unable to pass on those expenses to customers without experiencing volume and margin losses. For example, the compliance burden and impact on our operations and profitability as a result of the enactment of the Dodd-Frank Wall Street Reform and Consumer Protection Act ("Dodd-Frank") and related regulations continue to evolve, as federal agencies have implemented and continue to implement the act's many provisions through regulation. These efforts to change regulation of financial markets subject users of derivatives, such as CHS, to extensive oversight and regulation by the CFTC. Such initiatives have imposed and may continue to impose additional costs on us, including operating and compliance costs, and the cost of fines or penalties in the event we do not comply, and could materially affect the availability, as well as the cost and terms, of certain transactions. Certain federal regulations addressing Dodd-Frank are still being implemented and others are being finalized. We will continue to monitor these developments. In addition, new laws and regulations that are applicable to us or our businesses may be adopted, and a change in the U.S. government's administration and its policies may increase the likelihood of such legal and regulatory developments. If new laws or regulations become applicable to us or our businesses, our compliance costs could increase. Any of the above matters could have a material adverse effect on our business, financial condition, liquidity, results of operations and prospects.
We establish reserves for the future cost of known compliance obligations, such as remediation of identified environmental issues. However, these reserves may prove inadequate to meet our actual liability. Moreover, amended, new or more stringent requirements, stricter interpretations of existing requirements or discovery of currently unknown compliance issues may require us to make material expenditures or subject us to liabilities that we currently do not anticipate. Furthermore, our failure to comply with applicable laws and regulations could subject us to administrative penalties and injunctive relief, civil remedies, including fines and injunctions, criminal fines and penalties, and recalls of our products. For example, we regularly maintain hedges to manage price risks associated with our commercial operations. These transactions typically take place on exchanges such as the CME. Our hedging transactions and activities are subject to the rules and regulations of the exchanges we use and governing bodies, including the CME, NYMEX, CBOT, MGEX and CFTC. All exchanges have broad powers to review required records, to investigate and enforce compliance and to punish noncompliance by entities subject to their jurisdiction. Failure to comply with such rules and regulations could lead to restrictions on our trading activities or subject us to enforcement action by the CFTC or a disciplinary action by the exchanges, which could lead to substantial fines or penalties or limitations on our related operations. In addition, any investigation or proceeding by an exchange or the CFTC, whether successful or unsuccessful, could result in substantial costs, diversion of resources, including management time, and potential harm to our reputation, all of which could have a material adverse effect on our business financial condition, liquidity, results of operations and prospects.
We are subject to extensive anti-corruption, anti-bribery, anti-kickback and trade laws and regulations, and any noncompliance with those laws and regulations could have a material adverse effect on our business, financial condition and results of operations.
We operate on a global basis and are subject to anti-corruption, anti-bribery and anti-kickback laws and regulations, including the Foreign Corrupt Practices Act of 1977 as amended ("FCPA"). The FCPA and other similar anti-corruption, anti-bribery and anti-kickback laws and regulations in other jurisdictions generally prohibit companies and their intermediaries or agents from making improper payments to government officials or any other persons for the purpose of obtaining or retaining business. We operate and sell our products in many parts of the world that have experienced governmental corruption to some degree, and in certain circumstances strict compliance with anti-corruption, anti-bribery and anti-kickback laws and regulations may conflict with local customs and practices. In addition, in certain countries, we engage third-party agents or intermediaries to act on our behalf and/or conduct all or a portion of our operations through joint venture partners, including in those countries with a high risk of corruption. If any of these third parties violate applicable anti-corruption, anti-bribery or anti-kickback laws or regulations, we may be liable for those violations. We have policies in place prohibiting employees from making or authorizing improper payments; we train our employees regarding compliance with anti-corruption, anti-bribery and anti-kickback laws and regulations; and we utilize procedures to identify and mitigate risks of such misconduct by our employees, third-party agents, intermediaries and joint venture partners. However, we cannot provide assurances that our employees, third-party agents, intermediaries or joint venture partners will comply with those policies, laws and regulations. If we are found liable for violations of the FCPA or other similar anti-corruption, anti-bribery or anti-kickback laws or regulations, either due to our own acts or out of inadvertence or due to the acts or inadvertence of others, we could suffer criminal or civil fines or penalties or other repercussions, including reputational harm, which could have a material adverse effect on our business, financial condition and results of operations.
Due to the international scope of our operations, we are subject to a complex system of import- and export-related laws and regulations, including U.S. regulations issued by Customs and Border Protection, the Bureau of Industry and Security, the Office of Antiboycott Compliance, the Directorate of Defense Trade Controls and the Office of Foreign Assets Control, as well as the counterparts of these agencies in other countries. Any alleged or actual violation of these laws or regulations by us or our employees may subject us to government scrutiny, investigation, and civil and criminal penalties, and may limit our import and export abilities. Furthermore, embargoes and sanctions imposed by the United States and other governments restricting or prohibiting sales to specific persons or countries or based on product classification may expose us to potential criminal or civil sanctions. We cannot predict the nature, scope or effect of future regulatory requirements to which our operations might be subject or the way existing laws and regulations might be administered or interpreted.
Environmental and energy laws and regulations may result in increased operating costs and capital expenditures, and may have a material and adverse effect on us.
New and current environmental and energy laws and regulations, including regulations relating to alternative energy sources and the risk of global climate change, new interpretations of existing environmental and energy laws and regulations, increased governmental enforcement of environmental and energy laws and regulations, or other developments in these areas could require us to make additional unforeseen expenditures on technologies and/or other assets to continue our operations or cause unforeseen changes to our operations, either of which could adversely affect us. For example, in December 2015, 195 countries adopted a new international agreement known as the Paris Agreement. The Paris Agreement is intended to provide a framework pursuant to which the parties to the agreement will attempt to hold the increase in global average temperatures below 2 degrees Celsius above preindustrial levels and to pursue efforts to limit the temperature increase to 1.5 degrees Celsius above preindustrial levels. Participation in the Paris Agreement is subject to the concurrence of the United States government executive branch administration then in office. As a result, adherence to the Paris Agreement may vary by administration. The current administration is supportive of the Paris Agreement. Executive orders issued by the current administration, actions by various U.S. federal regulatory agencies, enactment of the Inflation Reduction Act of 2022 and the current administration's announced goal of halving U.S. greenhouse gas ("GHG") emissions by 2030 and reaching net-zero emissions by 2050 are also evidence of the current United States administration's intent to undertake numerous initiatives in an effort to reduce GHGs. New federal legislation or regulatory programs that restrict emissions of GHGs, such as cap and trade regimes, carbon taxes, windfall taxes, penalties on fossil fuel companies, restrictive permitting, increased fuel efficiency standards or mandates for renewable energy, or comparable new state legislation or programs or customer requirements in areas where we or our customers conduct business could adversely affect our operations and the demand for our energy products, which could have a material adverse effect on our business, financial condition, liquidity, results of operations and prospects. Some customers and third-parties we do business with have begun requesting product-specific GHG emissions disclosures from us in connection with their own GHG emissions reporting.
In addition, new legislation, regulatory programs, reporting requirements or customer or other stakeholder expectations could require substantial expenditures for installation and operation of systems and equipment or for substantial modifications to existing equipment, as well as increased compliance costs. We are or may be obligated to comply with new climate-related reporting requirements under SEC rules, laws of member states of the European Union implementing the EU Corporate Sustainability Reporting Directive ("CSRD") and other laws and regulations, which may require us to provide, at least annually, detailed public disclosures about the greenhouse gas emissions and other climate-related effects our activities produce, the climate-related operating and financial risks we face and the strategies we pursue to reduce and adapt to the impacts of climate change. If we fail to compile, assess and report the required operating and accounting information in a timely manner and in accordance with mandatory reporting standards, we could be exposed to fines and other sanctions and sustain harm to our reputation. Pursuant to the Energy Independence and Security Act of 2007, the EPA has promulgated the Renewable Fuel Standard ("RFS"), which requires refiners to blend renewable fuels, such as ethanol and biodiesel, with their petroleum fuels or purchase renewable energy credits, known as Renewable Identification Numbers ("RINs"), in lieu of blending. The EPA generally establishes new annual renewable fuel percentage standards for each compliance year in the preceding year, which affects the domestic market for ethanol. We generate RINs through our blending activities, but we cannot generate enough RINs to meet the needs of our refining capacity, and RINs must be purchased on the open market. In recent years, the price of RINs has been extremely volatile. Continued RIN volatility could have a negative impact on our future refined fuels margins. In addition, certain states have established proposed laws around low-carbon fuel standards that require refiners to sell fuel with carbon intensity values at certain established benchmarks or purchase a sufficient number of credits on the open market to meet the benchmark.
Environmental liabilities and litigation could have a material adverse effect on us.
Many of our current and former facilities have been in operation for many years. Over that time, we and other operators of those facilities have generated, used, stored and disposed of substances or wastes, including liquid fertilizers,
chemicals and fuels stored in underground and aboveground tanks, that are or might be considered hazardous under applicable or future environmental laws. Any past or future actions in violation of applicable environmental laws could subject us to administrative penalties, fines, injunctions or other costs, such as capital expenditures. In addition, an owner or operator of contaminated property and a party that sends hazardous materials to such a site for treatment, storage, disposal or recycling can be liable for the cost of investigation and remediation under environmental laws. In some instances, such liability exists regardless of fault. Moreover, future or unknown past releases of hazardous substances could subject us to private lawsuits claiming damages, including for bodily injury or property damage, and to adverse publicity, which could have a material adverse effect on us. Liabilities, including legal costs, related to remediation of contaminated properties are not recognized by us until the related costs are considered probable and can be reasonably estimated.
We have noted a trend in public and private lawsuits filed on behalf of states, counties, cities and utilities alleging harm to the general public and the environment, including waterways and watersheds, as a result of the use of agricultural chemicals, such as fertilizers. If we become a party to any such lawsuits, we could be required to pay damages or penalties or have other remedies imposed upon us, which could have a material and adverse effect on our results of operations and financial condition.
We face increased climate-change-related litigation risk with respect to our operations. In particular, governmental and other entities in various U.S. states have filed lawsuits against companies in the coal, oil and gas industries, alleging damages as a result of climate change, with the plaintiffs in such lawsuits seeking damages and abatement under various tort theories. Additionally, governmental and other entities are increasingly filing lawsuits or initiating regulatory action based on allegations that certain public statements regarding ESG-related matters and practices by companies are false or misleading greenwashing that violate deceptive trade practices and consumer protection statutes. Similar issues can also arise relating to aspirational statements such as net-zero or carbon reduction targets that are made without adequate basis to support such statements. Although we are not currently a party to any of these lawsuits, they present a high degree of uncertainty regarding the extent to which we face increased risk of liability stemming from climate change or ESG disclosures and practices.
Risks Related to Our Financial Position and Financing Our Business
Our financial results are susceptible to seasonality.
Many of our business activities are highly seasonal and operating results vary throughout the year. Our revenues generally trend lower during the second and fourth fiscal quarters and are highest during the first and third fiscal quarters. For example, in our Ag segment, our ag retail business generally experiences higher volumes and revenues during the fall harvest and spring planting seasons and our agronomy business generally experiences higher volumes and revenues during the spring planting season. Our global grain and processing operations are subject to fluctuations in volume and revenues based on producer harvests, world grain prices and demand, and international trade relationships. Our Energy segment generally experiences higher volumes and revenues in certain operating areas, such as refined products, in the spring, summer and early fall when gasoline and diesel fuel use by agricultural producers is highest and is subject to global supply and demand forces. Other energy products, such as propane, generally experience higher volumes and revenues during the winter-heating and crop-drying seasons.
If any of our long-lived assets become impaired, we could be required to record a significant impairment charge, which would negatively impact our results of operations.
All our long-lived assets, including property, plant and equipment, goodwill, investments in unconsolidated affiliates and other identifiable intangibles, are evaluated for impairment in accordance with U.S. GAAP at least annually for goodwill and whenever events or changes in circumstances indicate the carrying amount of a long-lived asset or asset group may not be recoverable. The process of evaluating for impairment involves a number of judgments and estimates. If the judgments and estimates used in our analyses are not realized or change due to external factors, then actual results may not be consistent with these judgments and estimates, and our long-lived assets may become impaired in future periods. We have in the past, and may in the future, be required to write down the value of our long-lived assets. Any future impairment of our long-lived assets could require us to record a significant impairment charge, which would negatively impact our results of operations.
Our business is capital-intensive and we rely on cash generated from our operations and external financing to fund our strategies and ongoing capital needs.
We require significant capital, including access to credit markets from time to time, to operate our businesses and fund our strategies. Our working capital requirements are directly affected by the price of commodities, which may fluctuate significantly and quickly. We also require substantial capital to maintain and upgrade our extensive network of facilities to keep
pace with competitive developments, technological advances, regulatory changes and changing safety standards. In addition, the expansion of our business and pursuit of acquisitions or other business opportunities has required, and may in the future require, significant amounts of capital. If we are unable to generate sufficient cash flow or maintain access to adequate external financing, including as a result of significant disruptions in the global credit markets, it could restrict our current operations and our growth opportunities, which could adversely affect our operating results and restrict our ability to repay our existing debts.
Our access to capital could be affected by financial institutions' and other capital sources' policies concerning energy-related businesses.
Public concern regarding the potential effects of climate change have directed increased attention toward the funding sources of energy-related businesses. As a result, some financial institutions, funds and other sources of capital have reduced or restricted lending to, or investing in, companies that operate in the energy industry. Limiting energy-related businesses' access to capital could make it more difficult for us to secure external financing, which could in turn restrict our current operations and growth opportunities, adversely affect our operating results and restrict our ability to repay our existing debts.
Our cooperative structure limits our ability to access equity capital.
As a cooperative, we may not sell common stock in our company. In addition, existing laws and our articles of incorporation and bylaws limit dividends on any preferred stock we may issue to 8% per annum. These limitations may restrict our ability to raise equity capital and may adversely affect our ability to compete with enterprises that do not face similar restrictions.
ITEM 1B. UNRESOLVED STAFF COMMENTS
Not applicable.
ITEM 1C. CYBERSECURITY
Risk Management and Strategy
We have established processes for identifying, assessing and managing material risks from cybersecurity threats associated with our key information technology systems. These processes have been integrated into our overall risk management strategies, as overseen by our Board of Directors, primarily through the board's Corporate Risk Committee and Audit Committee. These processes also include identifying and overseeing risks from cybersecurity threats associated with the use of third-party service providers. We conduct security assessments of certain third-party providers before engagement and have established monitoring procedures to mitigate risks related to data breaches or other security incidents originating from third parties. In addition, we conduct employee training on information security topics designed to address phishing and e-mail security, password security and data-handling security. We use e-mail security, endpoint security, logging and monitoring, remote access, application security and other tools to deter threat actors, block malicious/phishing e-mails and avoid IT system interruptions. From time to time, we engage third-party consultants, legal advisors, and audit firms to evaluate and test our risk management systems and assess and remediate cybersecurity threats and incidents as appropriate. Additionally, our Enterprise Risk Management ("ERM") team analyzes cybersecurity risks, emerging industry trends and identification of mitigation, as part of a holistic analysis of risks across CHS.
Governance
Management
Under the oversight of the Corporate Risk Committee of our Board of Directors, the chief information officer ("CIO") and chief information security officer ("CISO") are primarily responsible for assessment and management of material cybersecurity risks, with the CIO being responsible for strategic direction and management of information technology systems and the CISO being responsible for security of such systems, as described further below. The CIO has more than 30 years of experience with global technology organizations across multiple industries. The CISO has more than 20 years of experience in information security, risk management and compliance and is a certified information systems security professional. The CIO and CISO are also supported by an incident response team ("IRT") comprised of selected members of senior management and responsible for providing cross-functional support and response facilitation for cybersecurity incidents.
Our CISO oversees our cybersecurity incident response plan and related processes that are designed to assess and manage material risks from cybersecurity threats, including aligning programs with industry standards, conducting tabletop
exercises, providing education/training and taking other preventive measures. Our CISO coordinates with legal counsel and third party experts to assess and manage material risks from cybersecurity threats. Our CISO is informed about and monitors the prevention, detection, mitigation and remediation of cybersecurity incidents pursuant to criteria set forth in our incident response plan and related processes. Our CISO or a delegate informs the IRT of cybersecurity incidents that may potentially be determined to be material pursuant to escalation criteria set forth in our incident response plan and related processes. The CISO, in collaboration with legal counsel, is primarily responsible for advising our chief executive officer ("CEO") and chief financial officer ("CFO") regarding cybersecurity disclosures in public filings. The CISO also notifies the Audit Committee chair of any material cybersecurity incident.
As of the date of this Annual Report on Form 10-K, we have not detected any cybersecurity incidents that have materially affected or are reasonably likely to materially affect the company, including its business strategy, results of operations or financial condition. For further discussion of the risks associated with cybersecurity incidents, refer to Item 1A. Risk Factors in this Annual Report on Form 10-K.
Board of Directors
The Corporate Risk Committee of our Board of Directors oversees our information technology systems, including information security, compliance and privacy. Additionally, the Audit Committee of our Board of Directors oversees adequacy and effectiveness of our controls and procedures, including those designed to assess, identify and manage material risks from cybersecurity threats and incidents. Further, at least once per quarter, our CIO and/or CISO report on cybersecurity matters to the Corporate Risk Committee, and updates are provided to our Board of Directors at regular board meetings. The CIO also provides updates annually or more frequently as appropriate to our Board of Directors. Our ERM team reports annually on the company's risks to our Board of Directors, which includes progress related to mitigation activities and risk conditions.
ITEM 2. PROPERTIES
We own or lease energy, agronomy, grain-handling and processing facilities and other real estate throughout the United States and internationally. Below is a summary of these locations by segment and related business, the majority of which are owned. | | | | | |
| Description | Location(s) |
| Energy | |
| Refineries | Laurel, Montana, and McPherson, Kansas |
| Propane terminals | 9 locations in Colorado, Iowa, Minnesota, Missouri, North Dakota, Washington and Wisconsin |
| Transportation terminals/repair facilities | 12 locations in Iowa, Kansas, Minnesota, Montana, North Dakota, South Dakota, Washington and Wisconsin |
| Petroleum and asphalt terminals/storage facilities | 12 locations in Kansas, Montana, North Dakota and Wisconsin |
| Pipelines: | |
| Cenex Pipeline, LLC | Laurel, Montana, to Fargo, North Dakota |
| Front Range Pipeline, LLC | Canadian border to Laurel, Montana |
| Jayhawk Pipeline, LLC | Throughout Kansas, with branches in Nebraska, Oklahoma and Texas |
| Conway Pipeline | McPherson, Kansas, to Conway, Kansas |
| Kaw Pipe Line Company | Locations throughout Kansas |
| Osage Pipe Line Company, LLC | Oklahoma to Kansas (50% owned by CHS) |
| Zip Trip corporate headquarters | Spokane, Washington |
| Convenience stores/gas stations | 39 locations in Colorado, Minnesota, Montana, Nebraska, North Dakota, South Dakota and Wyoming |
| Lubricant plants/warehouses | 3 locations in Inver Grove Heights, Minnesota; Kenton, Ohio; and Amarillo, Texas |
| | | | | |
| Description | Location(s) |
| Ag | |
| Global Grain and Processing | |
| Grain terminals | 14 locations in the United States, including sites in Illinois, Iowa, Louisiana, Minnesota, Mississippi, Texas and Wisconsin
5 locations in Brazil
3 locations in Europe, including in Hungary and Romania |
| Fertilizer terminal | Argentina |
| Grain marketing offices | 2 locations in the United States, including in Minnesota and Nebraska
16 locations in South America, including in Argentina, Brazil and Uruguay
8 locations in Europe, including in Bulgaria, Hungary, Italy, Romania, Serbia, Spain, Switzerland and Ukraine
4 locations in Asia, including in China, Singapore, South Korea and Taiwan |
| Oilseed facilities | Fairmont, Hallock and Mankato, Minnesota |
| Sunflower processing plants | Fargo and Grandin, North Dakota |
| Storage and warehouse facilities | Joliette, North Dakota; and Winkler, Canada |
| Ethanol plants | Annawan and Rochelle, Illinois |
| Ag Retail | |
| Agri-operations facilities | Approximately 420 community locations located in Colorado, Idaho, Illinois, Iowa, Kansas, Minnesota, Montana, Nebraska, North Dakota, Oklahoma, Oregon, South Dakota, Texas, Washington and Wisconsin |
| Feed manufacturing facilities | 9 locations in Iowa, Montana, North Dakota, Oregon and South Dakota |
| Wholesale Agronomy | |
| Deepwater port | Galveston, Texas |
| Terminals | 11 locations in Illinois, Iowa, Kentucky, Louisiana, Minnesota, South Dakota and Texas |
| Bulk chemical rail terminal facility | Brooten, Minnesota |
| Distribution warehouses | 28 locations in Arkansas, Idaho, Illinois, Iowa, Kansas, Michigan, Minnesota, Montana, Nebraska, North Dakota, Oklahoma, South Dakota, Texas, Washington and Wisconsin |
| Research and development center | Randolph, Minnesota |
| Corporate and Other | |
| Corporate headquarters | A 33-acre campus in Inver Grove Heights, Minnesota, consisting of a building with approximately 320,000 square feet of office space and two smaller buildings with approximately 13,400 and 9,000 square feet of space |
| Office facilities | Washington, District of Columbia |
ITEM 3. LEGAL PROCEEDINGS
For a description of our material pending legal proceedings, please see Note 17, Commitments and Contingencies, of the notes to the consolidated financial statements that are included in this Annual Report on Form 10-K.
ITEM 4. MINE SAFETY DISCLOSURES
Not applicable.
PART II
ITEM 5. MARKET FOR REGISTRANT'S COMMON EQUITY, RELATED STOCKHOLDER MATTERS AND ISSUER PURCHASES OF EQUITY SECURITIES
As a cooperative, we do not have common stock that is traded or otherwise outstanding. We did not sell any equity securities during the three years ended August 31, 2024, that were not registered under the Securities Act of 1933.
ITEM 6. [RESERVED]
ITEM 7. MANAGEMENT'S DISCUSSION AND ANALYSIS OF FINANCIAL CONDITION AND RESULTS OF OPERATIONS
This Management's Discussion and Analysis of Financial Condition and Results of Operations ("MD&A") is intended to provide a reader of our financial statements with a narrative from the perspective of our management regarding our financial condition and results of operations, liquidity and certain other factors that may affect our future results. Our MD&A is presented in the following sections:
•Overview
•Business Strategy
•Fiscal 2024 Highlights
•Fiscal 2025 Outlook
•Operating Metrics
•Results of Operations
•Liquidity and Capital Resources
•Critical Accounting Policies
•Recent Accounting Pronouncements
Our MD&A should be read in conjunction with the accompanying audited financial statements and notes to those financial statements and the Cautionary Statement regarding forward-looking statements found in Part I, Item 1A of this Annual Report on Form 10-K.
Overview
CHS Inc. is a diversified company that provides grain, food, agronomy and energy resources to businesses and consumers on a global scale. As a cooperative, we are owned by farmers, ranchers and member cooperatives across the United States. We also have preferred shareholders who own our five series of preferred stock, all of which are listed and traded on the Global Select Market of The Nasdaq Stock Market LLC. We operate in the following three reportable segments:
•Energy. Produces and provides primarily for wholesale distribution and transportation of petroleum products.
•Ag. Purchases and further processes or resells grain and oilseed originated by our ag retail and global grain and processing businesses, by our member cooperatives and by third parties. It also includes our renewable fuels business and serves as a wholesaler and retailer of agronomy products.
•Nitrogen Production. Produces and distributes nitrogen fertilizer. It consists of our equity method investment in CF Nitrogen and allocated expenses.
In addition, our financing and hedging businesses, along with our nonconsolidated food production and distribution and wheat milling joint ventures, have been aggregated within our Corporate and Other category.
The consolidated financial statements include the accounts of CHS and all subsidiaries and limited liability companies in which we have control. The effects of all significant intercompany transactions have been eliminated.
Corporate administrative expenses and interest are allocated to each reportable segment and Corporate and Other, based on direct use of services, such as information technology and legal, and other factors or considerations relevant to the costs incurred.
Management's Focus. When evaluating our operating performance, management focuses on gross profit and income before income taxes ("IBIT"). As a company that operates heavily in global commodities, there is significant unpredictability and volatility in pricing, costs and global trade volumes. Consequently, we focus on managing the margin we can earn and the resulting IBIT. We also focus on ensuring balance sheet strength through appropriate management of financial liquidity, leverage, capital allocation and cash flow optimization.
Seasonality. Many of our business activities are highly seasonal and our operating results vary throughout the year. Our revenues and IBIT generally trend lower during the second fiscal quarter and increase in the third fiscal quarter. For example, in our Ag segment, our ag retail business generally experiences higher volumes and revenues during the fall harvest and spring planting seasons, which generally correspond to our first and third fiscal quarters, respectively. Additionally, our agronomy business generally experiences higher volumes and revenues during the spring planting season. Our global grain and processing operations are subject to fluctuations in volumes and revenues based on producer harvests, world grain prices, global demand and international trade relationships. Our Energy segment generally experiences higher volumes and revenues in
certain operating areas, such as refined products, in the spring, summer and early fall when gasoline and diesel fuel use by agricultural producers is highest and is subject to global supply and demand forces. Other energy products, such as propane, generally experience higher volumes and revenues during the winter heating and fall crop-drying seasons. The graphs below depict the seasonality inherent in our businesses.
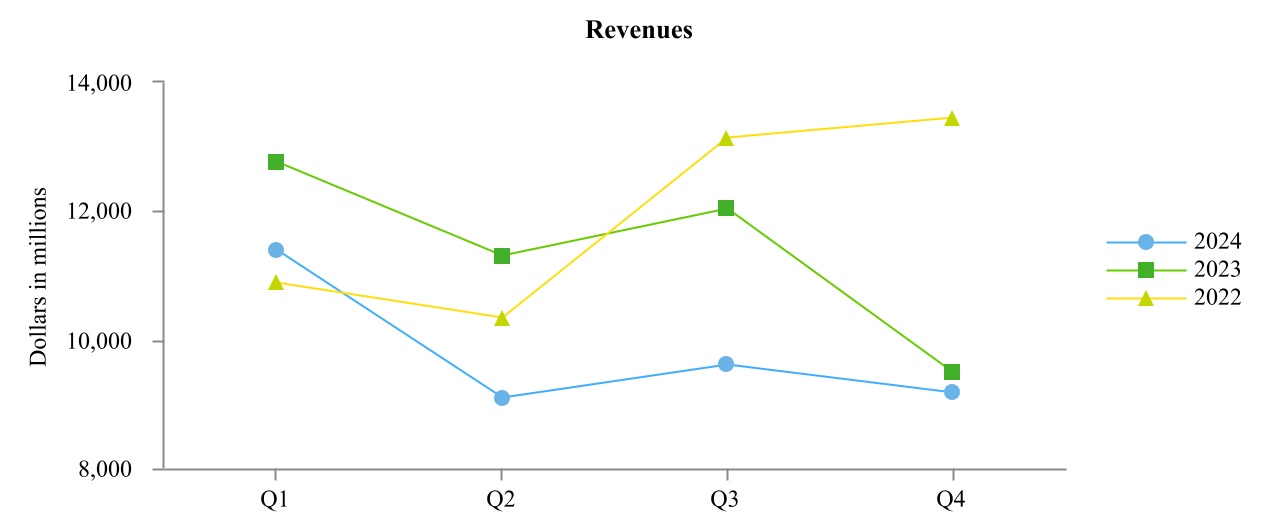
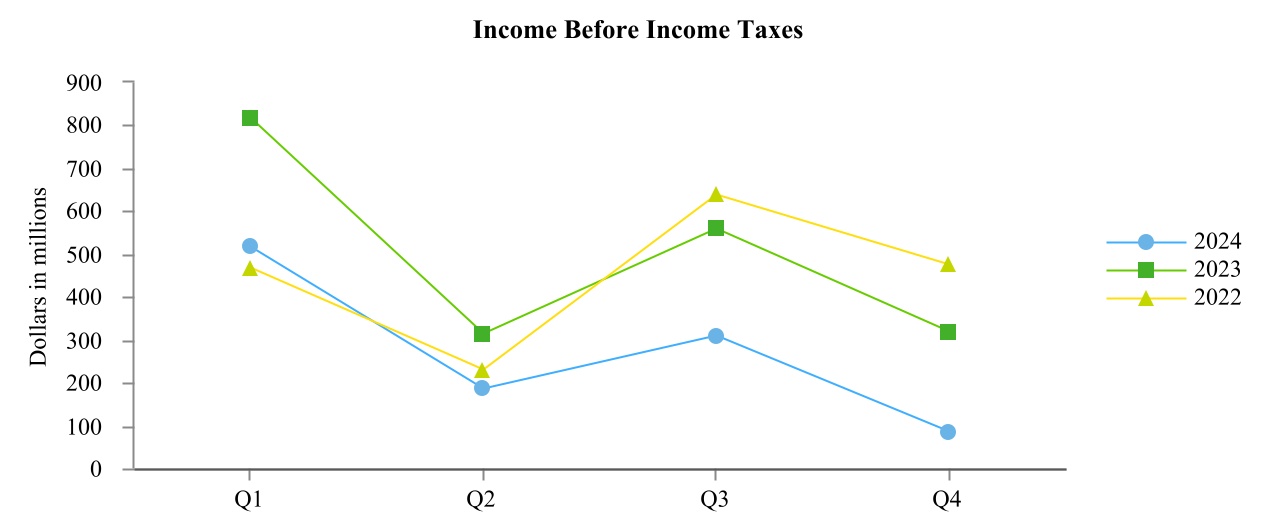
Pricing and Volumes. Our revenues, assets and cash flows can be significantly affected by global market prices and sales volumes of commodities such as petroleum products, natural gas, grain, oilseed products and agronomy products. Changes in market prices for commodities we purchase without a corresponding change in the selling prices of those products can affect revenues and operating earnings. Similarly, increased or decreased sales volumes without a corresponding change in the purchase and selling prices of those products can affect revenues and operating earnings. Commodity prices and sales volumes are affected by a wide range of factors beyond our control, including weather, crop damage due to plant disease or insects, drought, availability/adequacy of supply of a commodity, availability of reliable rail and river transportation networks, disease outbreaks, government regulations and policies, global trade disputes, wars and civil unrest, and general political and/or economic conditions.
Business Strategy
Our business strategies focus on an enterprisewide effort to create an experience that empowers customers to make CHS their first choice, expand market access to add value for our owners and transform and evolve our core businesses by capitalizing on changing market dynamics. To execute these strategies, we are focused on implementing agile, efficient and sustainable technology platforms; building robust and efficient supply chains; hiring, developing and retaining high-performing, diverse and passionate teams; achieving operational excellence and continuous improvement; and maintaining a strong balance sheet.
Fiscal 2024 Highlights
•Financial performance remained solid across our segments, although down from historically strong results in the prior year.
•Our Energy segment results declined from the prior year due to evolving market conditions, including the impact of less favorable refining margins.
•In our Ag segment, earnings declined compared to the prior year as a result of softening oilseed crush margins and global market conditions that drove down margins for U.S. grain and oilseed exports.
•Equity method investments continued to perform well, with our CF Nitrogen investment being the largest contributor.
Fiscal 2025 Outlook
Our segments operate in cyclical environments in which market conditions can change rapidly with significant positive or negative impacts on our results. We anticipate various macroeconomic factors will continue to drive uncertainty and instability in global energy and agricultural commodity markets, as well as global financial markets, which could have a significant impact on each of our segments during fiscal 2025. These factors include, among others, the ongoing war between Russia and Ukraine and further escalation of conflict in the Middle East, shifts in global trade flows for commodities, including global competitiveness giving rise to a weak export market for U.S. sourced agricultural products, potential changes in U.S. trade policy following the U.S. general election in November, a changing interest rate environment, and continued pricing pressures impacting costs of labor, freight and materials. These factors, or any form of them, could cause significant margin pressure and lower profitability. In addition to these broad macroeconomic factors, other factors could impact demand and pricing for agricultural inputs and outputs, as well as our ability to supply those inputs and outputs while remaining profitable. These include regional factors, such as unpredictable weather conditions, including those due to climate change. We currently expect global supply and demand factors impacting energy and agricultural commodities to be less favorable for us in fiscal 2025. Further, in light of increasing uncertainty in the markets we serve, we are unable to predict how long the current environment will last or the significance of the financial and operational impacts to us; however, we currently expect the trend of reduced margins for energy and agricultural commodities to persist in fiscal 2025. Refer to Item 1A of this Annual Report on Form 10-K for additional consideration these risks may have on our business operations and financial performance.
We will continue to execute our enterprise priorities for fiscal 2025, including pursuing growth through strategic investments and cooperative connections and leveraging our financial strength and resilience as we navigate less favorable market conditions for energy and agricultural commodities.
Operating Metrics
Energy
Our Energy segment operations primarily include our refineries in Laurel, Montana, and McPherson, Kansas, which process crude oil to produce refined products, including gasolines, distillates and other products. To ensure the reliability of our refineries, we perform major maintenance activities every two to five years, which require a temporary shutdown of operations. These planned shutdowns allow us to extend the life, increase the capacity and improve the safety and efficiency of our refinery processing assets. They also minimize unplanned business interruptions and are essential to the long-term reliability and profitability of our Energy segment.
During periods of maintenance, utilization rates, throughput volumes and refined fuel yields are lower, and we may purchase refined petroleum products from third parties to meet the needs of our customers. These third-party purchases may result in lower margins than for products produced by our refineries, which reduces our profitability. The following table provides information about our consolidated refinery operations: | | | | | | | | | | | |
| Years Ended August 31, |
| 2024 | | 2023 |
| Refinery throughput volumes* | (Barrels per day) |
| Heavy, high-sulfur crude oil | 108,713 | | | 94,692 | |
| All other crude oil | 69,137 | | | 70,397 | |
| Other feedstocks and blendstocks | 11,574 | | | 11,804 | |
| Total refinery throughput volumes | 189,424 | | | 176,893 | |
| Refined fuel yields | | | |
| Gasolines | 85,210 | | | 81,006 | |
| Distillates | 84,739 | | | 76,613 | |
*Lower refinery throughput volumes and refined fuel yields experienced during fiscal 2023 were primarily due to a planned shutdown to perform major
maintenance at our Laurel, Montana, refinery.
We are subject to the Renewable Fuel Standard that requires refiners to blend renewable fuels (e.g., ethanol and biodiesel) into their finished transportation fuels or purchase renewable energy credits, known as renewable identification numbers ("RINs"), in lieu of blending. The U.S. Environmental Protection Agency ("EPA") generally establishes new annual renewable fuel percentage standards for each compliance year in the preceding year. In June 2023, the EPA issued a final renewable volume obligation ("RVO") for calendar years 2020 through 2025. We generate RINs through our blending activities, but we cannot generate enough RINs to meet the needs of our refining capacity; therefore, RINs must be purchased on the open market. The price of RINs can be volatile, with prices for D6 ethanol RINs and D4 biodiesel RINs decreasing by 57% and 58%, respectively, during fiscal 2024 compared to the prior year, which positively impacted our earnings. Estimates of our RIN expenses are calculated using an average RIN price each month.
In addition to our internal operational reliability, the profitability of our Energy segment is largely driven by crack spreads (i.e., the price differential between refined products and crude oil inputs) and Western Canadian Select ("WCS") crude oil discounts (i.e., the price discount for WCS crude oil relative to West Texas Intermediate ("WTI") crude oil), which are driven by supply and demand of refined products. Crack spreads and WCS crude oil discounts both decreased in fiscal 2024, compared to the prior year, contributing to decreased IBIT for the Energy segment. The table below provides information about average market reference prices and differentials that impacted our Energy segment: | | | | | | | | | | | |
| Years Ended August 31, |
| 2024 | | 2023 |
| Market indicators* | | | |
| WTI crude oil (dollars per barrel) | $ | 79.41 | | | $ | 78.25 | |
| WTI - WCS crude oil discount (dollars per barrel) | $ | 17.24 | | | $ | 19.94 | |
| Group 3 2:1:1 crack spread (dollars per barrel) | $ | 21.97 | | | $ | 36.17 | |
| Group 3 5:3:2 crack spread (dollars per barrel) | $ | 20.60 | | | $ | 34.25 | |
| D6 ethanol RIN (dollars per RIN) | $ | 0.6801 | | | $ | 1.5725 | |
| D4 biodiesel RIN (dollars per RIN) | $ | 0.6829 | | | $ | 1.6380 | |
*Market source information represents the average month-end price during the period. Group 3 refers to the oil refining and distribution system serving the Midwest markets from the Gulf Coast through the Plains states.
Ag
Our Ag segment operations work together to facilitate the production, purchase, sale and eventual use of grain and other agricultural commodities within the United States and internationally. Profitability in our Ag segment is largely driven by throughput and production volumes, as well as commodity price spreads; however, revenues and cost of goods sold ("COGS") are largely affected by market-driven commodity prices outside our control. The table below provides information about average market prices for agricultural commodities, as well as sales and throughput volumes that impacted our Ag segment for the years ended August 31, 2024 and 2023: | | | | | | | | | | | | | | | | | |
| | | Years Ended August 31, |
| Market Source* | | 2024 | | 2023 |
| Commodity prices | | | | | |
| Corn (dollars per bushel) | Chicago Board of Trade | | $ | 4.37 | | | $ | 6.19 | |
| Soybeans (dollars per bushel) | Chicago Board of Trade | | $ | 11.88 | | | $ | 14.50 | |
| Wheat (dollars per bushel) | Chicago Board of Trade | | $ | 5.76 | | | $ | 7.17 | |
| Urea (dollars per ton) | Green Markets NOLA | | $ | 332.46 | | | $ | 420.06 | |
| Urea ammonium nitrate (dollars per ton) | Green Markets NOLA | | $ | 238.84 | | | $ | 349.87 | |
| Ethanol (dollars per gallon) | Chicago Platts | | $ | 1.83 | | | $ | 2.36 | |
| | | | | |
| Volumes | | | | | |
| Grain and oilseed (thousands of bushels) | | 2,382,219 | | | 2,108,183 | |
| North American grain and oilseed port throughput (thousands of bushels) | | 664,025 | | | 557,414 | |
| Wholesale crop nutrients (thousands of tons) | | 7,245 | | | 6,628 | |
| Ethanol (thousands of gallons) | | 711,451 | | | 968,516 | |
*Market source information represents the average week-end or month-end price during the period.
Results of Operations
Consolidated Statements of Operations | | | | | | | | | | | | | | | | | | | | | | | |
| Years Ended August 31, |
| 2024 | | 2023 |
| Dollars | | % of Revenues* | | Dollars | | % of Revenues* |
| (In thousands) | | | | (In thousands) | | |
| Revenues | $ | 39,261,229 | | | 100.0 | % | | $ | 45,590,004 | | | 100.0 | % |
| Cost of goods sold | 37,509,902 | | | 95.5 | | | 43,213,739 | | | 94.8 | |
| Gross profit | 1,751,327 | | | 4.5 | | | 2,376,265 | | | 5.2 | |
| Marketing, general and administrative expenses | 1,166,969 | | | 3.0 | | | 1,032,765 | | | 2.3 | |
| Operating earnings | 584,358 | | | 1.5 | | | 1,343,500 | | | 2.9 | |
| Interest expense | 104,064 | | | 0.3 | | | 137,442 | | | 0.3 | |
| Other income | (137,630) | | | (0.4) | | | (112,131) | | | (0.2) | |
| Equity income from investments | (479,863) | | | (1.2) | | | (689,590) | | | (1.5) | |
| Income before income taxes | 1,097,787 | | | 2.8 | | | 2,007,779 | | | 4.4 | |
| Income tax (benefit) expense | (4,872) | | | — | | | 107,655 | | | 0.2 | |
| Net income | 1,102,659 | | | 2.8 | | | 1,900,124 | | | 4.2 | |
| Net loss attributable to noncontrolling interests | 340 | | | — | | | (314) | | | — | |
| Net income attributable to CHS Inc. | $ | 1,102,319 | | | 2.8 | % | | $ | 1,900,438 | | | 4.2 | % |
*Amounts less than 0.1% are shown as zero percent. Percentage subtotals may differ due to rounding.
The charts below detail revenues, net of intersegment revenues, and IBIT by reportable segment for fiscal 2024. Our Nitrogen Production reportable segment represents an equity method investment that records earnings and allocated expenses, but not revenues.
Income Before Income Taxes by Segment
Energy | | | | | | | | | | | | | | | | | | | | | | | |
| Years Ended August 31, | | Change |
| 2024 | | 2023 | | Dollars | | Percent |
| | (Dollars in thousands) | | |
| Income before income taxes | $ | 429,053 | | | $ | 1,075,443 | | | $ | (646,390) | | | (60.1) | % |
The following waterfall analysis and commentary presents the changes in our Energy segment IBIT for the year ended August 31, 2024, compared to the prior year:
*See commentary related to these changes in the marketing, general and administrative expenses, interest expense, other income and equity income from investments sections of this Results of Operations.
The change in Energy segment IBIT for fiscal 2024 reflects the following:
•Lower crack spreads and decreased WCS crude oil discounts resulted from global market conditions, which contributed to an $803.8 million decrease of IBIT.
•Increased repairs and maintenance expense primarily due to unplanned maintenance at our Laurel, Montana, and McPherson, Kansas refineries contributed to $44.2 million of decreased IBIT.
•Lower margins from premiums on seasonal refined fuels products contributed $28.0 million of decreased IBIT.
•The overall IBIT decrease was partially offset by lower costs for RINs in our refined fuels business, which contributed to a $247.2 million cost reduction.
Ag | | | | | | | | | | | | | | | | | | | | | | | |
| Years Ended August 31, | | Change |
| 2024 | | 2023 | | Dollars | | Percent |
| | (Dollars in thousands) | | |
| Income before income taxes | $ | 342,677 | | | $ | 411,808 | | | $ | (69,131) | | | (16.8) | % |
The following waterfall analysis and commentary presents the changes in our Ag segment IBIT for the year ended August 31, 2024, compared to the prior year:
*See commentary related to these changes in the marketing, general and administrative expenses, interest expense, other income and equity income from investments sections of this Results of Operations.
The change in Ag segment IBIT for fiscal 2024 reflects the following:
•Decreased margins of $120.2 million for oilseed processing due to a higher supply of canola and soybean meal and oil across global markets, resulting in lower crush margins and decreased margins of $34.1 million for grain and oilseed due to competitive global grain markets that compressed margins, compared to the prior year.
•The margin decrease was partially offset by increased margins for wholesale and retail agronomy products driven by improved market conditions, which contributed to a $61.3 million increase of IBIT.
•Higher volumes of wholesale and retail agronomy products contributed to a $27.2 million increase of IBIT due to increased demand as prices declined due to global market conditions.
•Higher volumes for grain and oilseed and oilseed processing products collectively contributed to $52.2 million of increased IBIT as a result of favorable weather conditions and logistical and operational efficiencies at the oilseed crush plants.
All Other Segments | | | | | | | | | | | | | | | | | | | | | | | |
| Years Ended August 31, | | Change |
| 2024 | | 2023 | | Dollars | | Percent |
| | (Dollars in thousands) | | |
| Nitrogen Production IBIT* | $ | 151,235 | | | $ | 260,760 | | | $ | (109,525) | | | (42.0) | % |
| | | | | | | |
| Corporate and Other IBIT | $ | 174,822 | | | $ | 259,768 | | | $ | (84,946) | | | (32.7) | % |
*See Note 6, Investments, of the notes to the consolidated financial statements included in this Annual Report on Form 10-K for additional information.
Our Nitrogen Production segment IBIT decreased from the prior year as a result of lower equity income attributed to decreased selling prices of urea and UAN, which was partially offset by decreased natural gas costs, all due to global supply and demand factors. Corporate and Other IBIT decreased primarily due to lower equity income from our Ventura Foods investment as a result of less favorable market conditions for oil-based food products experienced during the current year compared to the prior year and a gain associated with the sale of certain assets in the prior year that did not recur in the current year.
Revenues by Segment
Energy | | | | | | | | | | | | | | | | | | | | | | | |
| Years Ended August 31, | | Change |
| 2024 | | 2023 | | Dollars | | Percent |
| | (Dollars in thousands) | | |
| Revenues | $ | 8,766,495 | | | $ | 10,096,913 | | | $ | (1,330,418) | | | (13.2) | % |
The following waterfall analysis and commentary presents the changes in our Energy segment revenues for the year ended August 31, 2024, compared to the prior year:
The change in Energy segment revenues for fiscal 2024 reflects the following:
•Decreased selling prices resulting from global market conditions contributed to $1.0 billion and $121.3 million
decreases in revenues for refined fuels and propane, respectively.
•Lower propane and refined fuels volumes contributed to $93.9 million and $64.0 million decreases in revenues, respectively, primarily driven by lower demand as a result of unfavorable weather conditions across much of our trade territory.
Ag | | | | | | | | | | | | | | | | | | | | | | | |
| Years Ended August 31, | | Change |
| 2024 | | 2023 | | Dollars | | Percent |
| | (Dollars in thousands) | | |
| Revenues | $ | 30,416,859 | | | $ | 35,425,204 | | | $ | (5,008,345) | | | (14.1) | % |
The following waterfall analysis and commentary presents the changes in our Ag segment revenues for the year ended August 31, 2024, compared to the prior year:
The change in Ag segment revenues for fiscal 2024 reflects the following:
•Decreased selling prices across all of our Ag segment product categories due to global market conditions during fiscal 2024, including:
◦$6.0 billion decrease for grain and oilseed;
◦$1.2 billion decrease for wholesale and retail agronomy products;
◦$484.1 million decrease for oilseed processing; and
◦$331.6 million decrease for renewable fuels.
•Increased volumes for grain and oilseed contributed to a $3.1 billion increase in revenues, primarily due to more favorable weather conditions in fiscal 2024.
All Other Segments* | | | | | | | | | | | | | | | | | | | | | | | |
| Years Ended August 31, | | Change |
| 2024 | | 2023 | | Dollars | | Percent |
| | (Dollars in thousands) | | |
| | | | | | | |
| | | | | | | |
| Corporate and Other revenues | $ | 77,875 | | | $ | 67,887 | | | $ | 9,988 | | | 14.7 | % |
*Our Nitrogen Production reportable segment represents an equity method investment that records earnings and allocated expenses, but not revenues.
Corporate and Other revenues increased during fiscal 2024 compared to the prior year primarily as a result of increased interest income in our financing business due to higher interest rates and a larger average notes receivable balance.
Cost of Goods Sold by Segment
Energy | | | | | | | | | | | | | | | | | | | | | | | |
| Years Ended August 31, | | Change |
| 2024 | | 2023 | | Dollars | | Percent |
| | (Dollars in thousands) | | |
| Cost of goods sold | $ | 8,041,588 | | | $ | 8,718,224 | | | $ | (676,636) | | | (7.8) | % |
The following waterfall analysis and commentary presents the changes in our Energy segment COGS for the year ended August 31, 2024, compared to the prior year:
The change in Energy segment COGS for fiscal 2024 reflects the following:
•Global market conditions, including reduced RIN costs, contributed to decreased costs for refined fuels and propane that drove $368.1 million and $124.7 million decreases in COGS, respectively.
•Lower propane and refined fuels volumes contributed to $90.5 million and $54.7 million decreases in COGS, respectively, primarily driven by lower demand as a result of unfavorable weather conditions across much of our trade territory.
Ag | | | | | | | | | | | | | | | | | | | | | | | |
| Years Ended August 31, | | Change |
| 2024 | | 2023 | | Dollars | | Percent |
| | (Dollars in thousands) | | |
| Cost of goods sold | $ | 29,478,231 | | | $ | 34,501,163 | | | $ | (5,022,932) | | | (14.6) | % |
The following waterfall analysis and commentary presents the changes in our Ag segment COGS for the year ended August 31, 2024, compared to the prior year:
The change in Ag segment COGS for fiscal 2024 reflects the following:
•Lower costs across all of our Ag segment product categories due to global market conditions during fiscal 2024, including:
◦$5.9 billion decrease for grain and oilseed;
◦$1.3 billion decrease for wholesale and retail agronomy products;
◦$376.1 million decrease for renewable fuels; and
◦$363.8 million decrease for oilseed processing.
•Increased volumes for grain and oilseed contributed to a $3.1 billion increase in COGS, primarily due to more favorable weather conditions in fiscal 2024.
All Other Segments | | | | | | | | | | | | | | | | | | | | | | | |
| Years Ended August 31, | | Change |
| 2024 | | 2023 | | Dollars | | Percent |
| | (Dollars in thousands) | | |
| Nitrogen Production COGS | $ | 138 | | | $ | 1,693 | | | $ | (1,555) | | | (91.8)% |
| | | | | | | |
| Corporate and Other COGS | $ | (10,055) | | | $ | (7,341) | | | $ | (2,714) | | | (37.0)% |
There were no significant changes on a dollar basis to COGS for our Nitrogen Production segment or Corporate and Other during fiscal 2024 compared to the prior year.
Marketing, General and Administrative Expenses | | | | | | | | | | | | | | | | | | | | | | | |
| Years Ended August 31, | | Change |
| 2024 | | 2023 | | Dollars | | Percent |
| | (Dollars in thousands) | | |
| Marketing, general and administrative expenses | $ | 1,166,969 | | | $ | 1,032,765 | | | $ | 134,204 | | | 13.0 | % |
Marketing, general and administrative expenses increased during fiscal 2024 primarily due to higher compensation and benefit expenses, as well as higher consulting expenses primarily associated with our enterprise resource planning system implementation and other technologies to advance our operating model.
Interest Expense | | | | | | | | | | | | | | | | | | | | | | | |
| Years Ended August 31, | | Change |
| 2024 | | 2023 | | Dollars | | Percent |
| | (Dollars in thousands) | | |
| Interest expense | $ | 104,064 | | | $ | 137,442 | | | $ | (33,378) | | | (24.3) | % |
Interest expense decreased during fiscal 2024 as a result of decreased notes payable balances compared to the prior year, which was partially offset by higher interest rates compared to the prior year.
Other Income | | | | | | | | | | | | | | | | | | | | | | | |
| Years Ended August 31, | | Change |
| 2024 | | 2023 | | Dollars | | Percent |
| | (Dollars in thousands) | | |
| Other income | $ | 137,630 | | | $ | 112,131 | | | $ | 25,499 | | | 22.7 | % |
Other income increased during fiscal 2024 primarily as a result of increased interest income due to a larger average cash balance and higher interest rates.
Equity Income from Investments | | | | | | | | | | | | | | | | | | | | | | | |
| Years Ended August 31, | | Change |
| 2024 | | 2023 | | Dollars | | Percent |
| | (Dollars in thousands) | | |
| Equity income from investments* | $ | 479,863 | | | $ | 689,590 | | | $ | (209,727) | | | (30.4) | % |
*See Note 6, Investments, of the notes to the consolidated financial statements that are included in this Annual Report on Form 10-K for additional information.
Equity income from investments decreased during fiscal 2024 compared to the prior year, primarily due to lower income associated with our equity method investments in CF Nitrogen and Ventura Foods. Equity income decreased for CF Nitrogen as a result of lower selling prices for urea and UAN due to global supply and demand factors. Equity income decreased for Ventura Foods as a result of less favorable market conditions for oil-based food products and a gain associated with the sale of certain assets in the prior year that did not reoccur in the current year.
Income Tax (Benefit) Expense | | | | | | | | | | | | | | | | | | | | | | | |
| Years Ended August 31, | | Change |
| 2024 | | 2023 | | Dollars | | Percent |
| | (Dollars in thousands) | | |
| Income tax (benefit) expense | $ | (4,872) | | | $ | 107,655 | | | $ | (112,527) | | | (104.5) | % |
Lower income tax expense during fiscal 2024 resulted primarily from lower nonpatronage income compared to fiscal 2023, recognition of research and development tax credits during fiscal 2024 and increased Domestic Production Activities Deduction ("DPAD") benefit. Effective tax rates for the years ended August 31, 2024 and 2023, were (0.4)% and 5.4%, respectively. Federal and state statutory rate of 24.5% was applied to nonpatronage business activity for the years ended August 31, 2024 and 2023. Income taxes and effective tax rates vary each year based upon profitability and nonpatronage business activity.
Comparison of Results of Operations for the Years Ended August 31, 2023 and 2022
For a discussion of results of operations for fiscal 2023 compared to fiscal 2022, please refer to Part II, Item 7, Management's Discussion and Analysis of Financial Condition and Results of Operations in our Annual Report on Form 10-K for the year ended August 31, 2023, filed with the SEC on November 8, 2023.
Liquidity and Capital Resources
In assessing our financial condition, we consider factors such as working capital, internal benchmarking related to our applicable covenants and other financial information. The following financial information is used when assessing our liquidity and capital resources to meet our capital allocation priorities, which include maintaining the safety and compliance of our operations, paying interest on debt and preferred stock dividends, returning cash to our member-owners in the form of cash patronage and equity redemptions, and taking advantage of strategic opportunities that benefit our member-owners:
| | | | | | | | | | | |
| August 31, |
| 2024 | | 2023 |
| | (Dollars in thousands) |
| Cash and cash equivalents | $ | 794,865 | | | $ | 1,765,286 | |
| Notes payable | 306,831 | | | 547,923 | |
| Long-term debt including current maturities | 2,161,460 | | | 1,827,658 | |
| Total equities | 10,761,924 | | | 10,452,389 | |
| Working capital | 3,307,969 | | | 3,229,455 | |
| Current ratio* | 1.6 | | | 1.5 | |
*Current ratio is defined as current assets divided by current liabilities.
Summary of Our Major Sources of Cash and Cash Equivalents
We fund our current operations primarily through our cash flows from operations and with short-term borrowings through our committed and uncommitted revolving credit facilities, including our securitization facility with certain unaffiliated financial institutions ("Securitization Facility"). We fund certain of our long-term capital needs, primarily those related to acquisitions of property, plant and equipment, with cash flows from operations and by issuing long-term debt. On April 18, 2024, we entered into a Note Purchase Agreement to borrow $700.0 million of debt in the form of notes; the funding of these notes took place on July 16, 2024. On October 29, 2024, we amended our 10-year term loan facility reducing the size to $300.0 million and adding a converting revolver feature. See Note 9, Notes Payable and Long-Term Debt, of the notes to the consolidated financial statements that are included in this Annual Report on Form 10-K for additional information on our short-term borrowings and long-term debt, including tables with summarized long-term debt outstanding. We will continue to consider opportunities to further diversify and enhance our sources and amounts of liquidity.
Summary of Our Major Uses of Cash and Cash Equivalents
Annually, our Board of Directors approves our capital expenditure budget. Our fiscal 2025 capital expenditure priorities include maintaining our assets through repairs and maintenance; complying with environmental, health and safety requirements; enhancing information technology capabilities; improving productivity; and growth. Our refining business requires continued investment in our refining process to maintain its safety, operational reliability and profitability. In addition, our Board of Directors approved our cash patronage and equity redemptions to be paid in fiscal 2025, based on fiscal 2024 financial performance. The following is a summary of our primary expected cash requirements for fiscal 2025:
•Capital expenditures. We expect total capital expenditures for fiscal 2025 to be approximately $837.3 million, compared to capital expenditures of $808.8 million in fiscal 2024, as we continue to invest in capital expenditures projects to meet the evolving needs of our owners and customers, enhance value for the cooperative system and unlock growth during fiscal 2025. In addition, we expect over $200.0 million of incremental expenditures for potential business acquisitions during fiscal 2025.
•Major maintenance. We expect total major maintenance for fiscal 2025 to be approximately $256.9 million, compared to major maintenance of $22.7 million in fiscal 2024. Increased major maintenance expectation for fiscal 2025 is due to a scheduled turnaround at our McPherson refinery during fiscal 2025 compared to minimal turnaround activities at our refineries during fiscal 2024.
•Preferred stock dividends. We had approximately $2.3 billion of preferred stock outstanding as of August 31, 2024. We expect to pay dividends on our preferred stock of approximately $168.7 million during fiscal 2025.
•Patronage. Our Board of Directors authorized approximately $300.0 million of our fiscal 2024 patronage-sourced earnings to be paid to our member-owners during fiscal 2025.
•Equity redemptions. Our Board of Directors authorized approximately $300.0 million of equity redemptions to be distributed in fiscal 2025 in the form of redemptions of qualified and nonqualified equity owned by individual producer-members and association members. The Board of Directors will continue to periodically evaluate the level of equity redemption activity throughout fiscal 2025 with respect to the amounts it has authorized for redemption during the fiscal year.
We believe cash generated by operating and investing activities, along with available borrowing capacity under our credit facilities, will be sufficient to support our short-term (the next 12 months) and long-term operations (beyond the next 12 months). Our notes payable and long-term debt are subject to various restrictive requirements for maintenance of minimum consolidated net worth and other financial ratios. We were in compliance with all our debt covenants and restrictions as of August 31, 2024. Based on our current 2025 projections, we expect continued covenant compliance.
Working Capital
We measure working capital as current assets less current liabilities as each amount appears on our Consolidated Balance Sheets. We believe this information is meaningful to investors as a measure of operational efficiency and short-term financial health. Working capital is not defined under U.S. GAAP and may not be computed the same as similarly titled measures used by other companies. Working capital as of August 31, 2024 and 2023, was as follows:
| | | | | | | | | | | | | | | | | |
| 2024 | | 2023 | | Change |
| | (Dollars in thousands) |
| Current assets | $ | 8,708,783 | | | $ | 9,128,649 | | | $ | (419,866) | |
| Less current liabilities | (5,400,814) | | | (5,899,194) | | | 498,380 | |
| Working capital | $ | 3,307,969 | | | $ | 3,229,455 | | | $ | 78,514 | |
As of August 31, 2024, working capital increased by $78.5 million compared with August 31, 2023. Current asset balance changes decreased working capital by $419.9 million, primarily driven by a decrease in our cash balance due to a decline in cash provided by operations from year end 2023, which was partially offset by increases in receivables. Current liabilities balance changes increased working capital by $498.4 million, primarily due to a decrease in accounts and notes payable, which were driven by changes in working capital needs and lower commodity prices.
We finance our working capital needs through committed and uncommitted lines of credit with domestic and international banks. We believe our current cash balances and available capacity on our committed and uncommitted lines of credit will provide adequate liquidity to meet our working capital needs.
Contractual Obligations
Our estimated future contractual obligations as of August 31, 2024, include both current and long-term obligations. During fiscal 2025, we have a current obligation to repay $330.6 million of long-term debt, as well as $101.7 million of interest related to long-term debt. Beyond fiscal 2025, our long-term debt obligation is $1.8 billion and interest payments related to long-term debt of $747.4 million. For finance leases, we have a current and long-term obligation of $9.0 million and $49.3 million, respectively. For operating leases, we have a current and long-term obligation of $71.3 million and $176.0 million, respectively. See Note 9, Notes Payable and Long-Term Debt, and Note 19, Leases, of the notes to the consolidated financial statements that are included in this Annual Report on Form 10-K for additional information on our long-term debt and leases, respectively. We enter into purchase obligations that are legally binding and enter into enforceable agreements to purchase goods or services that specify all significant terms, including fixed or minimum quantities to be purchased and fixed or estimated prices to be paid at the time of settlement. Our current and long-term obligation for such arrangements is $4.8 billion and $569.8 million, respectively.
Cash Flows | | | | | | | | | | | | | | | | | |
| Years Ended August 31, | | |
| 2024 | | 2023 | | Change |
| | (Dollars in thousands) |
| Net cash provided by operating activities | $ | 1,272,880 | | | $ | 3,284,182 | | | $ | (2,011,302) | |
| Net cash used in investing activities | (1,431,588) | | | (950,191) | | | (481,397) | |
| Net cash used in financing activities | (814,253) | | | (1,395,468) | | | 581,215 | |
| Effect of exchange rate changes on cash and cash equivalents | 2,236 | | | 2,590 | | | (354) | |
| Net (decrease) increase in cash and cash equivalents and restricted cash | $ | (970,725) | | | $ | 941,113 | | | $ | (1,911,838) | |
Cash flows from operating activities can fluctuate significantly from period to period as a result of various factors, including seasonality and timing differences associated with purchases, sales, taxes and other business decisions. The $2.0 billion decrease in cash provided by operating activities in fiscal 2024 primarily reflects decreased net income, as well as decreased cash provided by receivables and inventories during fiscal 2024.
The $481.4 million increase in cash used in investing activities in fiscal 2024 reflects increased investments and higher expenditures for property, plant and equipment during fiscal 2024 compared to fiscal 2023.
The $581.2 million decrease in cash used in financing activities in fiscal 2024 primarily reflects increased net proceeds from long-term debt and decreased cash outflows for patronage paid and equity redemptions during fiscal 2024 compared to fiscal 2023.
Critical Accounting Policies
Our consolidated financial statements are prepared in conformity with U.S. GAAP. Preparation of these consolidated financial statements requires use of estimates, as well as management's judgments and assumptions regarding matters that are subjective, uncertain or involve a high degree of complexity, all of which affect the results of operations and financial condition for the periods presented. We believe the following accounting policies are critical to our consolidated financial statements and may involve a higher degree of estimates, judgments and complexity.
Inventory Valuation and Reserves
Grain, processed grain, oilseed, processed oilseed and other minimally processed soy-based inventories are stated at net realizable value. All other inventories are stated at the lower of cost or net realizable value. The costs of certain energy inventories (wholesale refined products, crude oil and asphalt) are determined on the last-in, first-out ("LIFO") method; all other inventories of nongrain products purchased for resale are valued on the first-in, first-out ("FIFO") and average cost methods. Estimates are used in determining the net realizable values of grain and oilseed and processed grain and oilseed inventories. These estimates include using inputs that are generally based on exchange-traded prices and/or recent market bids and offers, including location-specific adjustments. If estimates regarding the valuation of inventories are less favorable than management's assumptions, write-downs of inventories may be required.
Derivative Financial Instruments
We enter into exchange-traded commodity futures and options contracts to hedge our exposure to price fluctuations on energy, grain and oilseed transactions to the extent considered practicable for minimizing risk. Futures and options contracts used for hedging are purchased and sold through regulated commodity exchanges. We also use over-the-counter instruments to hedge our exposure on fixed-price contracts. Fluctuations in inventory valuations, however, may not be completely hedged due in part to the absence of satisfactory hedging facilities for certain commodities and geographical areas and in part to our assessment of our exposure from expected price fluctuations. We also manage our risks by entering into fixed-price purchase contracts with preapproved producers and establishing appropriate limits for individual suppliers. Fixed-price sales contracts are entered into with customers of acceptable creditworthiness, as internally evaluated. The fair values of futures and options contracts are determined primarily from quotes listed on regulated commodity exchanges. Fixed-price purchase and sales contracts are with various counterparties, and the fair values of such contracts are determined from the market price of the underlying product. We are exposed to loss in the event of nonperformance by the counterparties to the contracts and, therefore, contract values are reviewed and adjusted to reflect potential nonperformance. Risk of nonperformance by counterparties includes the inability to perform because of a counterparty's financial condition and a risk that the counterparty will refuse to
perform on a contract during periods of price fluctuations where contract prices are significantly different from the current market prices.
Pension and Other Postretirement Benefits
Pension and other postretirement benefits costs and obligations depend on assumptions used in calculating such amounts. These assumptions include discount rates, health care cost trend rates, benefits earned, interest costs, expected return on plan assets, mortality rates and other factors. In accordance with U.S. GAAP, actual results that differ from the assumptions are accumulated and amortized over future periods and therefore generally affect recognized expenses and the recorded obligations in future periods. While our management believes the assumptions used are appropriate, differences in actual experience or changes in assumptions may affect our pension and other postretirement obligations and future expenses.
Deferred Tax Assets and Uncertain Tax Positions
We assess whether a valuation allowance is necessary to reduce our deferred tax assets to the amount we believe is more likely than not to be realized. While we have considered future taxable income, as well as other factors, in assessing the need for the valuation allowance, in the event that we were to determine that we would not be able to realize all or part of our net deferred tax assets in the future, an adjustment to our deferred tax assets would be charged to income in the period such determination was made. We are also significantly impacted by utilization of tax credits, some of which were passed to us from the McPherson refinery, related to refinery upgrades that enable us to produce ultra-low-sulfur fuels. Our tax credit carryforwards are available to offset future federal and state tax liabilities with the tax credits becoming unavailable to us if not used by their expiration date. Our net operating loss carryforwards for tax purposes are available to offset future taxable income. If our loss carryforwards are not used, they will expire.
Tax benefits related to uncertain tax positions are recognized in our financial statements if it is more likely than not the position would be sustained upon examination by a tax authority that has full knowledge of all relevant information. The benefits are measured using a cumulative probability approach. Under this approach, we record in our financial statements the greatest amount of tax benefits that have a more than 50% probability of being realized upon final settlement with the tax authorities. In determining these tax benefits, we assign probabilities to a range of outcomes that we feel we could ultimately settle on with the tax authorities using all relevant facts and information available at the reporting date. Due to the complexity of these uncertainties, the ultimate resolution may result in a benefit that is materially different than our current estimate.
Long-Lived Assets
Property, plant and equipment is depreciated or amortized over the expected useful lives of individual or groups of assets based on the straight-line method. Economic circumstances or other factors may cause management's estimates of expected useful lives to differ from actual useful lives.
All long-lived assets, including property, plant and equipment, goodwill, investments in unconsolidated affiliates and other identifiable intangibles, are evaluated for impairment in accordance with U.S. GAAP, at least annually for goodwill, and whenever events or changes in circumstances indicate the carrying amount of a long-lived asset or asset group may not be recoverable. For goodwill, our annual impairment testing occurs in our fourth quarter. An impaired asset is written down to its estimated fair value based on the best information available. Fair value is generally measured by discounting estimated future cash flows. Considerable management judgment is necessary to estimate discounted future cash flows and our estimates may differ from actual results.
We have asset retirement obligations with respect to certain of our refineries and other assets due to various legal obligations to clean and/or dispose of the component parts at the time they are retired. In most cases, these assets can be used for extended and indeterminate periods of time, as long as they are properly maintained and/or upgraded. It is our practice and current intent to maintain refineries and related assets and to continue making improvements to those assets based on technological advances. As a result, we believe our refineries and related assets have indeterminate lives for purposes of estimating asset retirement obligations because dates or ranges of dates upon which we would retire a refinery and related assets cannot reasonably be estimated at this time. When a date or range of dates can reasonably be estimated for the retirement of any component part of a refinery or other asset, we will estimate the cost of performing the retirement activities and record a liability for the fair value of that future cost.
We have other assets that we may be obligated to dismantle at the end of corresponding lease terms subject to the lessor's discretion for which we have recorded asset retirement obligations. Based on our estimates of the timing, cost and probability of removal, these obligations are not material.
Recent Accounting Pronouncements
See Note 1, Organization, Basis of Presentation and Significant Accounting Policies, of the notes to the consolidated financial statements that are included in this Annual Report on Form 10-K for information concerning new accounting standards and the impact of implementation of those standards on our financial statements.
ITEM 7A. QUANTITATIVE AND QUALITATIVE DISCLOSURES ABOUT MARKET RISK
Commodity Price Risk
When we enter into a commodity purchase or sales commitment, we incur risks related to price changes and performance including delivery, quality, quantity and shipment period. In the event that market prices decrease, we are exposed to risk of loss for the market value of inventory and purchase contracts with fixed or partially fixed prices. Conversely, we are exposed to risk of loss on our fixed- or partially fixed-price sales contracts in the event that market prices increase.
Our use of hedging reduces exposure to price volatility by protecting against adverse short-term price movements but also limits the benefits of favorable short-term price movements. To reduce the price risk associated with fixed-price commitments, we generally enter into commodity derivative contracts, to the extent practical, to achieve a net commodity position within the formal position limits we have established and deemed prudent for each commodity. These contracts are primarily transacted through our FCM on regulated commodity futures exchanges but may include over-the-counter derivative instruments when deemed appropriate. These contracts are recorded at fair values based on quotes listed on regulated commodity exchanges or the market prices of the underlying products listed on the exchanges, except that certain contracts are accounted for as normal purchase and normal sales transactions. For commodities where there is no liquid derivative contract, risk is managed through the use of forward sales contracts, other pricing arrangements and, to some extent, futures contracts in highly correlated commodities. These contracts are economic hedges of price risk but are not designated as hedging instruments for accounting purposes. Unrealized gains and losses on these contracts are recognized in cost of goods sold in our Consolidated Statements of Operations.
When a futures position is established, the initial margin must be deposited with the applicable exchange or broker. The amount of margin required varies by commodity and is set by the applicable exchange at its sole discretion. If the market price relative to a short futures position increases, an additional margin deposit would be required. Similarly, a margin deposit would be required if the market price relative to a long futures position decreases. Conversely, if the market price increases relative to a long futures position or decreases relative to a short futures position, margin deposits may be returned by the applicable exchange or broker.
Our policy is to manage our commodity price risk exposure according to internal policies and in alignment with our tolerance for risk. It is our policy that our profitability should come from operations, primarily derived from margins on products sold and grain merchandised, not from hedging transactions. At any one time, inventory and purchase contracts for delivery to us may be substantial. We have risk management policies and procedures that include established net physical position limits. These limits are defined for each commodity and business unit, and business units may include both trader and management limits as appropriate. The limits policy is overseen at a high level by our corporate middle office and compliance team, with day-to-day monitoring procedures being implemented within each individual business unit to ensure any limits overages are explained and exposures reduced, or a temporary limit increase is established if needed. The position limits are reviewed at least annually with our senior leadership and Board of Directors. We monitor current market conditions and may expand or reduce our net position limits or procedures in response to changes in those conditions.
The use of hedging instruments does not protect against nonperformance by counterparties to cash contracts. We evaluate counterparty exposure by reviewing contracts and adjusting the values to reflect potential nonperformance. Risk of nonperformance by counterparties includes the inability to perform because of a counterparty's financial condition and the risk that the counterparty will refuse to perform on a contract during periods of price fluctuations where contract prices are significantly different from current market prices. We manage these risks by entering into fixed-price purchase and sales contracts with preapproved producers and by establishing appropriate limits for individual suppliers. Fixed-price contracts are entered into with customers of acceptable creditworthiness, as internally evaluated. Regarding our use of derivatives, we transact in exchange traded instruments or enter into over-the-counter derivatives that primarily clear through our FCM, which limits our counterparty exposure relative to hedging activities. Historically, we have not experienced significant events of nonperformance on open contracts. Accordingly, we only adjust the estimated fair values of specifically identified contracts for nonperformance. Although we have established policies and procedures, we make no assurances that historical nonperformance experience will carry forward to future periods.
Based on our net fair market value calculation as of August 31, 2024, a 10% adverse change in market prices would not materially affect our results of operations. While we use commodity futures and forward contracts as economic hedges of price risk, and our operations have effective economic hedging requirements as a general practice, we cannot ensure that these risk management activities will offset all financial impact resulting from an adverse change in market prices. Factors that could impact the effectiveness of our hedging activities include the accuracy of our forecasts, volatility of the commodity markets and availability of hedging instruments. Utilization of derivatives and hedging activities is described more fully in Note 15, Derivative Financial Instruments and Hedging Activities, and Note 16, Fair Value Measurements, of the notes to our consolidated financial statements included in this Annual Report on Form 10-K.
Interest Rate Risk
Debt used to finance our working capital needs is represented by short-term notes payable, so our blended interest rate for all such notes approximates current market rates. The table below provides information about our outstanding debt that is sensitive to changes in interest rates. The table presents scheduled contractual principal payments and related weighted average interest rates for the fiscal years presented. | | | | | | | | | | | | | | | | | | | | | | | | | | | | | | | | | | | | | | | | | | | | | | | |
| Expected Maturity Date | | Total | | Fair Value
Liability |
| 2025 | | 2026 | | 2027 | | 2028 | | 2029 | | Thereafter | | |
| | (Dollars in thousands) |
| Liabilities: | | | | | | | | | | | | | | | |
Variable rate miscellaneous
short-term notes payable | $ | 163,136 | | $ | — | | | $ | — | | | $ | — | | | $ | — | | | $ | — | | | $ | 163,136 | | $ | 163,136 | |
| Average interest rate | 3.6 | % | | — | | | — | | | — | | | — | | | — | | | 3.6 | % | | — | |
| Variable rate CHS Capital short-term notes payable | $ | 143,695 | | $ | — | | | $ | — | | | $ | — | | | $ | — | | | $ | — | | | $ | 143,695 | | $ | 143,695 | |
| Average interest rate | 4.3 | % | | — | | | — | | | — | | | — | | | — | | | 4.3 | % | | — | |
| Fixed rate long-term debt | $ | 330,620 | | $ | 80,620 | | $ | 58,621 | | $ | 190,600 | | $ | 150 | | $ | 1,455,000 | | $ | 2,115,611 | | $ | 2,144,170 | |
| Average interest rate | 4.2 | % | | 4.8 | % | | 4.7 | % | | 4.0 | % | | 3.9 | % | | 5.3 | % | | 5.0 | % | | — | |
| Variable rate long-term debt | $ | — | | | $ | 1,000 | | | $ | — | | | $ | — | | $ | — | | | $ | — | | | $ | 1,000 | | $ | 1,016 | |
Average interest rate (a) | — | | | 6.8 | % | | — | | | — | | | — | | | — | | | 6.8 | % | | — | |
(a) Borrowings are variable under the agreement and bear interest at a base rate plus an applicable margin.
Foreign Currency Risk
We were exposed to risk regarding foreign currency fluctuations during fiscal 2024 and in prior years even though a substantial amount of our international sales were denominated in U.S. dollars. In addition to specific transactional exposure, foreign currency fluctuations can impact the ability of foreign buyers to purchase U.S. agricultural products and competitiveness of U.S. agricultural products compared to the same products offered by alternative sources of world supply. From time to time, we enter into foreign currency hedge contracts to minimize the impact of currency fluctuations on our transactional exposures. The notional amount of our foreign exchange derivative contracts was $1.5 billion and $1.9 billion as of August 31, 2024 and 2023.
ITEM 8. FINANCIAL STATEMENTS AND SUPPLEMENTARY DATA
The financial statements listed in Item 15(a)(1) of this Annual Report on Form 10-K are set forth beginning on page F-1. Financial statement schedules are included in Schedule II in Item 15(a)(2) of this Annual Report on Form 10-K.
ITEM 9. CHANGES IN AND DISAGREEMENTS WITH ACCOUNTANTS ON ACCOUNTING AND FINANCIAL DISCLOSURE
None.
ITEM 9A. CONTROLS AND PROCEDURES
Disclosure Controls and Procedures
Under the supervision and with the participation of our management, including our CEO and CFO, we evaluated the effectiveness of our disclosure controls and procedures (as defined in Rule 13a-15(e) under the Securities Exchange Act of
1934, as amended ("Exchange Act")), as of August 31, 2024. Based on that evaluation, our CEO and CFO concluded that, as of that date, our disclosure controls and procedures were effective.
Management's Annual Report on Internal Control Over Financial Reporting
Our management is responsible for establishing and maintaining adequate internal control over financial reporting.
Our internal control system is a process designed to provide reasonable assurance regarding the reliability of financial reporting and the preparation of financial statements for external purposes in accordance with generally accepted accounting principles. Because of its inherent limitations, internal control over financial reporting may not prevent or detect misstatements. Also, projecting any evaluation of effectiveness to future periods is subject to the risk that controls may become inadequate because of changes in conditions or that the degree of compliance with the policies or procedures may deteriorate.
Management assessed the effectiveness of our internal control over financial reporting using the criteria set forth by the Committee of Sponsoring Organizations of the Treadway Commission in Internal Control - Integrated Framework (2013). Based on management's assessment using this framework, management concluded that, as of August 31, 2024, our internal control over financial reporting was effective.
This Annual Report on Form 10-K does not include an attestation report of our independent registered public accounting firm regarding internal control over financial reporting. Management's report was not subject to attestation by our independent registered public accounting firm pursuant to the Financial Reform Bill passed in July 2010 that permits us to provide only management's report in this Annual Report on Form 10-K.
Changes in Internal Control Over Financial Reporting
There have been no changes in internal control over financial reporting (as defined in Rule 13a-15(f) under the Exchange Act) during the quarter ended August 31, 2024, that materially affected, or are reasonably likely to materially affect, our internal control over financial reporting.
ITEM 9B. OTHER INFORMATION
During the three months ended August 31, 2024, no director or officer of the company adopted, modified or terminated a "Rule 10b5-1 trading arrangement" or "non-rule 10b5-1 trading arrangement," as each term is defined in Item 408(a) or Regulation S-K.
ITEM 9C. DISCLOSURE REGARDING FOREIGN JURISDICTIONS THAT PREVENT INSPECTIONS
Not applicable.
PART III
ITEM 10. DIRECTORS, EXECUTIVE OFFICERS AND CORPORATE GOVERNANCE
BOARD OF DIRECTORS
The table below provides certain information regarding each of our directors, as of August 31, 2024: | | | | | | | | | | | | | | | | | | | | |
| Name | | Age | | Director
Region | | Director Since |
| David Beckman | | 64 | | 8 | | 2018 |
| Clinton J. Blew | | 47 | | 8 | | 2010 |
| Hal Clemensen | | 64 | | 4 | | 2019 |
| Scott Cordes | | 63 | | 1 | | 2017 |
| Jon Erickson | | 64 | | 3 | | 2011 |
| Mark Farrell | | 65 | | 5 | | 2016 |
| Steve Fritel | | 69 | | 3 | | 2003 |
| Alan Holm | | 64 | | 1 | | 2013 |
| David Johnsrud | | 70 | | 1 | | 2012 |
| Tracy Jones | | 61 | | 5 | | 2017 |
| David Kayser | | 65 | | 4 | | 2006 |
| Russell Kehl | | 49 | | 6 | | 2017 |
| Anthony Rossman | | 52 | | 1 | | 2023 |
| Daniel Schurr | | 59 | | 7 | | 2006 |
| Jerrad Stroh | | 54 | | 8 | | 2022 |
| Kevin Throener | | 52 | | 3 | | 2019 |
| Cortney Wagner | | 46 | | 2 | | 2020 |
As a cooperative, members of our Board of Directors are nominated and elected by our members as required by our bylaws. As described below under "Director Elections and Voting," to ensure geographic representation of our members, the Board of Directors represents eight regions in which our members are located. The members in each region nominate and elect the number of directors for that region as set forth in our bylaws. Neither management nor the incumbent directors have any control over the nominating process for directors. As described below under "Director Elections and Voting," to be eligible for service as a director, a nominee must, among other things, (i) be an active farmer or rancher, (ii) be a Class A individual member of CHS or a member of a cooperative association member and (iii) reside in the geographic region from which he or she is nominated. In general, our directors operate large commercial agricultural enterprises, which require expertise in all areas of management, including financial oversight. Nearly all directors also have experience serving on local cooperative association boards and all participate in a variety of agricultural and community organizations. Our directors complete the National Association of Corporate Directors comprehensive Director Professionalism course and earn the Certificate of Director Education. We believe that each of our directors meets the aforementioned eligibility requirements and qualifications described under "Director Elections and Voting" to serve on the Board of Directors.
David Beckman has been a member of the CHS Board of Directors since 2018. He is chair of the Audit Committee and a member of the Capital Committee. He is a former secretary of the Nebraska Cooperative Council and former board chair for Central Valley Ag Cooperative in York, Nebraska. He holds a bachelor's degree in agronomy from the University of Nebraska-Lincoln. Mr. Beckman's principal occupation has been farming for more than five years. In partnership with his family, he raises irrigated corn and soybeans and operates a custom hog-feeding operation near Elgin, Nebraska.
Clinton J. Blew, First Vice Chair, has been a member of the CHS Board of Directors since 2010. He serves on the Governance and Corporate Risk committees. Mr. Blew has also served as second vice chair of the Executive Committee of the Board. He is a former member of the board of directors of Mid Kansas Coop, Moundridge, Kansas, and is a member of the Arthur Capper Cooperative Center Advisory Council, CoBank board restructuring committee, Hutchinson Community College Ag Advisory Board, Kansas Livestock Association and Red Angus Association of America. He holds an applied science degree in farm and ranch management from Hutchinson (Kansas) Community College. Mr. Blew's principal occupation has been farming for more than five years, and he farms and ranches in a family partnership in south-central Kansas.
Hal Clemensen has been a member of the CHS Board of Directors since 2019. He is chair of the Government Relations Committee and vice chair of the Capital Committee. He is a former member of the Agtegra Cooperative board and previously served as a director of the South Dakota Value Added Agriculture Development Center, South Dakota Soybean Association and Redfield Farmers Union Oil Company and has served on the Avera Rural Cancer Advisory Board. He holds a bachelor's degree in agricultural economics and agricultural business from South Dakota State University. Mr. Clemensen's principal occupation has been farming for more than five years. He and his wife raise corn, soybeans and wheat in Brown and Spink counties in South Dakota.
Scott Cordes, Second Vice Chair, has been a member of the CHS Board of Directors since 2017. He is a member of the Corporate Risk and Governance committees. He serves as a director and past chair of Security State Bank of Wanamingo. Previously, he served as a director of Cooperative Network, the Minneapolis Grain Exchange and National Futures Association. He holds a bachelor's degree in agricultural economics from the University of Minnesota. Mr. Cordes' principal occupation has been farming for more than five years. Prior to his current occupation, he was a CHS employee from 1995 to 2016, serving as president of CHS Hedging, LLC, a commodities brokerage subsidiary of CHS from 2000 to 2016. He co-owns and operates a corn and soybean farm near Wanamingo, Minnesota.
Jon Erickson has been a member of the CHS Board of Directors since 2011. He is a member of the Audit and Corporate Risk committees and previously served as second vice chair of the Executive Committee of the Board. He is an advisory board member for the Quentin Burdick Center for Cooperatives, a member of the Grand Farm board of directors, a board member of the State Historical Society of North Dakota Foundation, a council member of Rural Leadership North Dakota and a member of the North Dakota Farmers Union and North Dakota Stockmen's Association. He holds a bachelor's degree in agricultural economics from North Dakota State University. Mr. Erickson's principal occupation has been farming for more than five years, and he raises grain and oilseed and operates a commercial Hereford-Angus cow-calf business near Minot, North Dakota.
Mark Farrell has been a member of the CHS Board of Directors since 2016. He is vice chair of the CHS Foundation Board of Trustees and a member of the Governance Committee. Previously, he served as a director and president of the Premier Cooperative board and as a director of Mount Horeb Farmers Co-op and United Ethanol. He graduated from the University of Wisconsin-Madison Agricultural & Life Sciences Farm & Industry Short Course. Mr. Farrell's principal occupation has been farming for more than five years. He raises corn and soybeans in Dane County, Wisconsin.
Steve Fritel has been a member of the CHS Board of Directors since 2003. He chairs the Corporate Risk Committee and is a member of the Audit Committee. Mr. Fritel previously served as first vice chair, second vice chair and secretary-treasurer of the Executive Committee of the Board. He earned an associate degree from North Dakota State College of Science. Mr. Fritel's principal occupation has been farming for more than five years. He raises spring wheat, durum wheat, soybeans, edible beans, corn and canola near Rugby, North Dakota, selling some of his edible beans to local family-owned restaurants. He also runs a family business providing on-farm grain storage equipment.
Alan Holm, Assistant Secretary-Treasurer, has been a member of the CHS Board of Directors since 2013. Since 2021, he has been assistant secretary-treasurer of the Executive Committee of the Board. He is vice chair of the Government Relations Committee and a member of the Capital Committee. He also serves on the board for Citizens Bank of Minnesota and is former board chair of River Region Cooperative. He holds an associate degree in machine tool technology from Mankato (Minnesota) Technical College. Mr. Holm's principal occupation has been farming for more than five years. He raises corn, soybeans, sweet corn, peas and hay and owns and manages a cow-calf operation near Sleepy Eye, Minnesota.
David Johnsrud has been a member of the CHS Board of Directors since 2012. He serves as chair of the Capital Committee and as a member of the Government Relations Committee. Previously, he served as board chair of AgCountry Farm Credit Services and as board chair of the Cooperative Network and on the boards of the Minnesota Farm Credit Legislative Committee, Farmers Union Oil, CHS Prairie Lakes, Mid-Minnesota Association and Minnesota State Co-op Directors Association, including terms as board secretary for Farmers Union Oil and CHS Prairie Lakes. Mr. Johnsrud's principal occupation has been farming for more than five years. He raises corn and soybeans near Starbuck, Minnesota.
Tracy Jones has been a member of the CHS Board of Directors since 2017. He is chair of the Governance Committee and a member of the Capital Committee. He has served on the DeKalb County Board and on the boards of CHS Elburn, the former Elburn Co-op, DeKalb County Farm Bureau, DeKalb Kane Cattlemen's Association and DeKalb County Corn Growers. He earned an associate degree in farm management from Kishwaukee College in Malta, Illinois. Mr. Jones' principal occupation has been farming for more than five years. He operates a fourth-generation family farm near Kirkland, Illinois, that raises corn, soybeans and wheat and feeds cattle.
David Kayser has been a member of the CHS Board of Directors since 2006. He serves as vice chair of the Corporate Risk Committee and as a member of the Governance Committee. Mr. Kayser is a previous director and chair of CHS Farmers Alliance and South Dakota Association of Cooperatives and former chair of the Mitchell (South Dakota) Technical College
Foundation Board. Mr. Kayser's principal occupation has been farming for more than five years. He raises corn, soybeans and hay near Alexandria, South Dakota, and operates a cow-calf and feeder-calf business.
Russell Kehl, Secretary-Treasurer, has been a member of the CHS Board of Directors since 2017. Since 2019, Mr. Kehl has served as secretary-treasurer of the Executive Committee of the Board. He is vice chair of the Governance Committee and a member of the Capital Committee. He previously was a director of CHS SunBasin Growers and vice chair of the Columbia Basin Seed Association. Mr. Kehl's primary occupation has been farming for more than five years. He and his family operate a farm near Quincy, Washington, that produces crops, primarily potatoes and dry beans, and includes a cow-calf herd. His family also owns and operates dry bean processing facilities, a custom farming business and a trucking and logistics company.
Anthony Rossman has been a member of the CHS Board of Directors since 2023. He is a member of the Audit Committee and the CHS Foundation Board of Trustees. Mr. Rossman previously served as president of the CHS ag retail producer board based in Rochester, Minnesota. He is active in emerging technology and sustainability initiatives for production agriculture and is a member of state corn and soybean growers associations. He holds a bachelor's degree in animal science from North Dakota State University. Mr. Rossman's principal occupation has been farming for more than five years. He operates and manages a crop and livestock operation near Oronoco, Minnesota, and manages genetic alliances in the beef industry.
Daniel Schurr, Chair, has been a member of the CHS Board of Directors since 2006. Since 2017, Mr. Schurr has served as chair of the Executive Committee of the Board. He serves on the Blackhawk Bank and Trust board and audit and loan committees and previously served on the Silos and Smokestacks National Heritage Area board. He holds a bachelor's degree in agricultural business with a minor in economics from Iowa State University. Mr. Schurr's principal occupation has been farming for more than five years. He raises corn and soybeans near LeClaire, Iowa, and operates a commercial trucking business.
Jerrad Stroh has been a member of the CHS Board of Directors since 2022. He is vice chair of the Audit Committee and is a member of the CHS Foundation Board of Trustees. He serves on the board of Cooperative Producers, Inc., and has completed the Nebraska Cooperative Council Director Certification Program. Mr. Stroh’s principal occupation has been farming for more than five years. He and his family raise corn and soybeans near Juniata, Nebraska.
Kevin Throener has been a member of the CHS Board of Directors since 2019. He chairs the CHS Foundation Board of Trustees and is a member of the Audit Committee. He has served on the board of directors of CHS Dakota Plains and has been a member of Full Circle Ag, James Valley Ag and Agtegra cooperatives. He is an advisory board member for the Quentin Burdick Center for Cooperatives and a member of the North Dakota Stockmen's Association. He attended North Dakota State University, majoring in agricultural systems management. Mr. Throener's principal occupation has been farming for more than five years. He and his wife and family raise corn, soybeans, alfalfa and cattle near Cogswell, North Dakota, and they also operate a beef backgrounding and finishing enterprise and a custom forage harvesting business.
Cortney Wagner has been a member of the CHS Board of Directors since 2020. She is a member of the Corporate Risk and Government Relations committees. She serves on the board of the Montana Council of Cooperatives. She holds a real estate license and has served as a trust associate at 1st National Bank and Trust Company. She earned an associate of arts degree from Williston State College and attended the University of North Dakota, majoring in business finance and psychology. Ms. Wagner's principal occupation has been farming for more than five years. She is a first-generation cattle and hay producer based near Hardin, Montana.
Director Elections and Voting
Director elections are for three-year terms and are open to any qualified candidate. Qualifications for the office of director are as follows:
•At the time of declaration of candidacy, the individual (except in the case of an incumbent) must have the written endorsement of a locally elected producer board that is part of the CHS system and located within the region from which the individual is to be a candidate.
•At the time of the election, the individual must be less than 68 years old.
The remaining qualifications set forth below must be met at all times commencing six months prior to the time of election and while the individual holds office:
•The individual must be a Class A individual member of CHS or a member of a cooperative association member.
•The individual must reside in the region from which he or she is to be elected.
•The individual must be an active farmer or rancher. "Active farmer or rancher" means an individual whose primary occupation is that of a farmer or rancher, excluding anyone who is an employee of CHS or of a cooperative association member.
The following positions on the Board of Directors will be up for election at the 2024 Annual Meeting of Members: | | | | | | | | |
| Region | | Incumbent |
| Region 3 (North Dakota) | | Open Seat |
| Region 4 (South Dakota) | | David Kayser |
| Region 6 (Alaska, Arizona, California, Hawaii, Idaho, Nevada, Oregon, Washington and Utah) | | Russell Kehl |
| Region 7 (Alabama, Arkansas, Florida, Georgia, Iowa, Louisiana, Mississippi, Missouri, North Carolina, South Carolina and Tennessee) | | Open Seat |
| Region 8 (Colorado, Kansas, Nebraska, New Mexico, Oklahoma and Texas) | | David Beckman |
Voting rights, including those in regard to director elections, arise by virtue of membership in CHS, not because of ownership of any equity or debt instruments; therefore, our preferred shareholders cannot recommend nominees to our Board of Directors nor vote in regard to director elections unless they are also Class A or Class C members of CHS.
EXECUTIVE OFFICERS
The table below lists our executive officers as appointed by the CHS Board of Directors as of August 31, 2024: | | | | | | | | | | | | | | |
| Name | | Age | | Position |
| Jay Debertin | | 64 | | President and Chief Executive Officer |
| David Black | | 58 | | Executive Vice President, Enterprise Transformation and Chief Information Officer |
| Richard Dusek | | 60 | | Executive Vice President, Ag Retail, Distribution and Transportation |
| John Griffith | | 55 | | Executive Vice President, Ag Business and CHS Hedging |
| Gary Halvorson | | 51 | | Executive Vice President, Enterprise Customer Development |
| Darin Hunhoff | | 54 | | Executive Vice President, Energy |
| Mary Kaul-Hottinger | | 60 | | Executive Vice President, Chief Human Resources Officer |
| Olivia Nelligan | | 49 | | Executive Vice President, Chief Financial Officer and Chief Strategy Officer |
| Brandon Smith | | 44 | | Executive Vice President, General Counsel |
Jay Debertin has been president and chief executive officer ("CEO") of CHS since May 2017. Mr. Debertin joined CHS in 1984 in the petroleum division and held a variety of positions in its energy marketing operations before being named vice president of crude oil supply in 1998. In 2001, his responsibilities expanded to include crude oil supply, refining, pipelines and terminals, trading and risk management, and transportation. From 2005 to 2010, Mr. Debertin was executive vice president and chief operating officer for processing at CHS. From 2010 to 2017, he served as executive vice president and chief operating officer of energy and foods, where he led energy, transportation and processing at CHS. Mr. Debertin serves as chair of the board for Ventura Foods, LLC, and the National Council of Farmer Cooperatives. He also serves on the board of directors for the Federal Reserve Bank of Minneapolis and Securian Financial. He earned a bachelor's degree in economics from the University of North Dakota and a master of business administration degree from the University of Wisconsin-Madison.
David Black has been executive vice president, enterprise transformation, and chief information officer for CHS since December 2022. He is responsible for enterprise transformation, marketing and communications, innovation, facilities and CHS global information technology. Mr. Black leads enterprise transformation efforts, driving ongoing companywide efficiency and opportunities for profitable growth, as well as strategy, implementation, delivery and operation of information technology for all CHS businesses worldwide. He also oversees our owner and employee communications, advertising and public relations. Mr. Black serves on the boards of Ventura Foods and Cooperative Ventures, a venture capital fund joint venture between CHS and Growmark that focuses on innovative solutions and emerging technologies that positively impact farming. He is former board chair of Ag Gateway, a nonprofit consortium of 300-plus businesses, which strives to promote, enable and expand e-business in agriculture. Mr. Black joined CHS in 2014 and previously worked at Monsanto Company, where he served as vice president, information technology, overseeing all aspects of information technology for its global commercial businesses. During his 20 years with Monsanto, he also served as vice president, corporate strategy, and president, Monsanto Agro-Services, LLC, and was responsible for new business development. Mr. Black earned a bachelor's degree in computer science from Tarkio College.
Richard Dusek has been executive vice president, ag retail, distribution and transportation, since November 2017. He leads CHS ag retail operations and wholesale distribution assets that serve as a critical channel for our core businesses, aligning
an enterprise supply chain for energy, agronomy, animal nutrition and grain product lines to serve our owners, and driving growth and efficiency through a customer-focused solutions platform. Mr. Dusek also oversees the enterprise transportation function, which includes all modes serving our product lines. He is a former board member of The Fertilizer Institute and the Minneapolis Grain Exchange. He joined CHS in 1988 as a wheat trader. Prior to leading our ag retail business, Mr. Dusek held roles as vice president in our grain marketing and agronomy divisions. He earned a bachelor of science degree in agricultural economics from North Dakota State University and is a graduate of the Harvard Business School Advanced Management Program.
John Griffith has been executive vice president, ag business and CHS Hedging, since January 2021. He leads CHS trading and risk management for global grain, oilseeds, crop nutrients and crop protection. Mr. Griffith also serves as board chair for CHS Hedging, a commodities brokerage subsidiary of CHS, and represents CHS on the CF Nitrogen Board of Managers. He previously chaired the North American Export Grain Association board and served on the Minneapolis Grain Exchange board of directors. Mr. Griffith worked for CHS early in his career as a grain merchandiser and rejoined CHS at a leadership level in January 2013. Since that time, he has held various leadership roles within global grain marketing, including senior vice president, CHS global grain marketing and CHS Hedging, and vice president, grain marketing North America. He earned a bachelor's degree from St. John's University and a master of business administration degree from Rockhurst University.
Gary Halvorson has been executive vice president, enterprise customer development, since December 2022. He is responsible for efforts across all product lines to deliver a focused and coordinated customer experience for owners and customers. Mr. Halvorson serves on the advisory council for Cooperative Ventures, a venture capital fund joint venture between CHS and Growmark that focuses on innovative solutions and emerging technologies that positively impact farming. Mr. Halvorson has served on the National FFA Sponsors Board, the Agricultural Retailers Association board of directors and The Fertilizer Institute (TFI) board of directors. He joined CHS more than 20 years ago. Most recently, he led the CHS agronomy business. Prior to that, Mr. Halvorson held various leadership roles with CHS at locations in North Dakota before becoming general manager for CHS Ag Services in Warren, Minnesota. Mr. Halvorson also served as vice president of farm supply for CHS country operations. He earned a bachelor's degree in business from Concordia University.
Darin Hunhoff has been executive vice president, energy, since May 2017. He leads CHS energy operations including refineries, pipelines and terminals, as well as refined fuels, propane and lubricants product lines. In addition, he oversees sustainability at CHS, which is focused on a long-term view on people, communities, economic viability and environmental success, as well as the CHS strategic sourcing function. Mr. Hunhoff previously served on the board of directors for Ardent Mills. He joined CHS more than 25 years ago as a petroleum specialist. He has also been chief strategy officer for CHS and has spent several years in energy leadership roles, including time as senior vice president of refined fuels and vice president of propane. He earned a bachelor's degree in marketing and business management from Southwest Minnesota State University.
Mary Kaul-Hottinger has been executive vice president, chief human resources officer, for CHS since January 2023. Ms. Kaul-Hottinger sets direction and strategy to help CHS achieve key priorities with a focus on helping the organization attract, develop and retain high-performing and diverse talent to drive business growth and the company’s strategies. She also has responsibility for the company’s community giving and employee volunteerism. Ms. Kaul-Hottinger has more than 38 years of experience in human resources. She joined CHS in 2018 as the senior vice president, chief human resources officer, after serving 11 years at Ecolab as vice president of human resources for Ecolab’s global businesses, where she and her team supported multiple business units with more than 30,000 employees in the Americas, Europe, the Middle East, Africa and Asia Pacific. Prior to joining Ecolab in 2007, she served in human resources leadership roles supporting operating divisions at General Mills and Pillsbury. She also held human resources roles at Securian Financial, formerly Minnesota Life. Ms. Kaul-Hottinger serves as board co-chair of Together We Grow, a consortium of major agribusiness and food interests building the workforce of tomorrow, and on the board of directors for the Greater Twin Cities United Way. She earned a bachelor’s degree in business administration from the University of St. Thomas.
Olivia Nelligan is executive vice president, chief financial officer and chief strategy officer for CHS, joining the organization in January 2020. She leads all finance and strategic planning activities across CHS, being a key advisor to the CEO and the CHS Board of Directors. Ms. Nelligan serves on the Board of Directors for Ardent Mills, a strategic joint venture of CHS and a leading flour milling and food ingredient manufacturer. She also serves on the board of directors for Cooperative Ventures, a CHS joint venture and corporate venture capital fund that focuses on innovative solutions and emerging technologies that positively impact farming. Before joining CHS, Ms. Nelligan held executive positions in multiple organizations. Her past experience includes serving as chief executive officer of Nasco, LLC, a private equity-owned company. Ms. Nelligan spent more than a decade with Kerry Group plc, serving as global chief financial and strategic planning officer of its Taste and Nutrition division. She holds a bachelor's degree in civil law and a higher diploma in business and financial information systems from University College Cork, Ireland, and a master of business administration degree from the University of Wisconsin-Madison. She is a fellow of Chartered Accountants Ireland and an associate member of the Institute of Taxation in Ireland.
Brandon Smith has been executive vice president, general counsel for CHS since March 2021. He provides counsel to CHS leadership and the Board of Directors on company strategy, government affairs, corporate governance, corporate compliance, federal securities reporting and compliance, and disclosure and investor communications. Mr. Smith also oversees the CHS internal audit department. He previously worked at Tenneco Inc., a multinational industrial company based in Lake Forest, Illinois, for more than 12 years in various legal and leadership roles, most recently as senior vice president, general counsel and corporate secretary. Prior to joining Tenneco, Mr. Smith worked for the Kirkland & Ellis LLP law firm in Chicago, Illinois. He earned a juris doctor degree from Cornell Law School and a bachelor's degree in business management from Hiram College.
None of our directors, executive officers or control persons has been involved in any of the legal proceedings required to be disclosed in Item 401 of Regulation S-K, during the past five years.
DELINQUENT SECTION 16(a) REPORTS
Section 16(a) of the Exchange Act requires our executive officers, directors and persons who beneficially own more than 10% of any class of our preferred stock to file initial reports of ownership and reports of changes in ownership with the SEC. Such executive officers, directors and greater than 10% beneficial owners are required by the regulations of the SEC to furnish us with copies of all Section 16(a) reports they file.
Based solely on a review of copies of reports on Forms 3 and 4 and amendments thereto filed electronically with the SEC during, and reports on Form 5 and amendments thereto filed electronically with the SEC with respect to the fiscal year ended August 31, 2024, and based further upon written representations received by us with respect to the need to file reports on Form 5, no persons filed late reports required by Section 16(a) of the Exchange Act during fiscal 2024.
CODE OF ETHICS
We have adopted a code of ethics within the meaning of Item 406(b) of Regulation S-K promulgated by the SEC. This code of ethics applies to all of our directors, officers and employees, including our principal executive officer, principal financial officer and principal accounting officer. It is part of our broader CHS Code of Conduct, which is posted on our website, www.chsinc.com. We intend to disclose any amendment to, or waiver from, a provision of the code of ethics that applies to our principal executive officer, principal financial officer or principal accounting officer on the our website. The information contained on our website is not part of, and is not incorporated in, this report or any other report we file with or furnish to the SEC.
AUDIT COMMITTEE MATTERS
The Board of Directors has a separately designated standing Audit Committee for the purpose of overseeing our accounting and financial reporting processes and audits of our financial statements. In fiscal 2024, the Audit Committee was comprised of Mr. Beckman (chair from December 8, 2023, to present), Mr. Erickson, Mr. Fritel and Mr. Meyer (chair and member from September 1, 2023 to December 7, 2023), Mr. Rossman (from December 8, 2023, to present), Mr. Stroh and Mr. Throener, each of whom was an independent director during service on the Audit Committee. The Audit Committee has oversight responsibility to our member-owners relating to our financial statements and the financial reporting process, preparation of the financial reports and other financial information provided by us to any governmental or regulatory body, the systems of internal accounting and financial controls, the internal audit function and the annual independent audit of our financial statements. The Audit Committee assures that the corporate information gathering and reporting systems developed by management represent a good faith attempt to provide senior management and the Board of Directors with information regarding material acts, events and conditions within CHS. In addition, the Audit Committee is directly responsible for the appointment, compensation and oversight of the independent registered public accounting firm.
We do not believe any member of the Audit Committee is an "audit committee financial expert" as defined in the Sarbanes-Oxley Act of 2002 and the rules and regulations thereunder. As a cooperative, members of our Board of Directors are nominated and elected by our members. To ensure geographic representation of our members, the Board of Directors represents eight regions in which our members are located. The voting members in each region nominate and elect the number of directors for that region as set forth in our bylaws. To be eligible for service as a director, a nominee must among other things, (i) be an active farmer or rancher, (ii) be a Class A individual member of CHS or member of a cooperative association and (iii) reside in the geographic region from which he or she is nominated. Neither management nor the incumbent directors have any control over the nominating process for directors. Because of the nomination procedure and the election process, we cannot ensure that an elected director serving on our Audit Committee will be an audit committee financial expert. However, many of our directors, including all of the Audit Committee members, are financially sophisticated and have experience or background in
which they have had significant financial management or oversight responsibilities. The current Audit Committee includes directors who have served as presidents or chairs of local cooperative association boards. Members of the Board of Directors, including the Audit Committee, also operate large commercial enterprises requiring expertise in all areas of management, including financial oversight.
ITEM 11. EXECUTIVE COMPENSATION
Compensation Discussion and Analysis
Executive Compensation
Overview
This Compensation Discussion and Analysis describes the material elements of compensation awarded to each of the following executive officers ("Named Executive Officers") during the year ended August 31, 2024:
| | | | | | | | |
| Name | | Position |
| Jay Debertin | | President and Chief Executive Officer |
| Olivia Nelligan | | Executive Vice President, Chief Financial Officer and Chief Strategy Officer |
| Brandon Smith | | Executive Vice President, General Counsel |
| Darin Hunhoff | | Executive Vice President, Energy |
| John Griffith | | Executive Vice President, Ag Business and CHS Hedging |
CHS creates connections to empower agriculture for our producer and member cooperative owners and the communities in which we and our owners live and operate. Our executive compensation program is intentionally aligned with both operational objectives and long-term business strategy. The following discussion and analysis outlines the objectives and principles underlying our executive compensation and benefit programs and explains the compensation decisions impacting the CEO and other Named Executive Officers in fiscal 2024.
Compensation Philosophy and Objectives
The CHS executive compensation philosophy focuses on these key objectives:
•Attract and retain exceptional talent who demonstrate the CHS capabilities and values and are engaged and committed to the long-term success of CHS by providing market-competitive compensation and benefit programs;
•Align executive rewards to quantifiable annual and long-term performance goals that drive enterprise results and provide competitive returns to our member-owners;
•Emphasize pay for performance by linking executive performance goals to business strategy and differentiating rewards based on company and individual performance; and
•Ensure compliance with government mandates and regulations.
Our overall compensation philosophy and practices are grounded in our commitment to fair and equitable pay. This includes a regular review of employee compensation as well as compensation practices.
Governance of Executive Compensation
The Governance Committee and the Executive Committee of our Board of Directors have engaged a third-party consultant, Pay Governance LLC, to advise on the executive compensation program applicable to our executives, including our Named Executive Officers.
The Executive Committee oversees the design and administration of the CEO's compensation. Pay Governance, LLC provides guidance to the Executive Committee regarding market-competitive levels of base pay, short-term incentive, long-term incentive and the overall compensation package for our CEO. The data and analysis are shared with the Executive Committee, who consider these elements as part of the CEO pay review. The Executive Committee recommends to our Board of Directors pay actions relative to our CEO and approves annual and long-term incentive awards for our CEO based on individual performance and company performance against the preestablished financial goals. The Board of Directors makes final decisions regarding our CEO's base pay, short-term incentive pay and long-term incentive pay, as well as the allocation of these components. There are no formal policies for allocation between long-term and short-term compensation other than the intention to be competitive with the external market for comparable positions and to be consistent with our compensation philosophy and objectives. Our CEO is not involved with the selection of the third-party consultant and does not participate in or observe Executive Committee meetings that concern CEO compensation matters.
The Governance Committee assists the Board of Directors in fulfilling its responsibilities regarding matters that relate to governing the organization, including reviewing and making recommendations to the Board with respect to the establishment,
material modification to, or amendment of incentive, bonus or other similar compensation plans in which Named Executive Officers are eligible participants. Annually, the Governance Committee recommends incentive plan goals applicable to the Named Executive Officers under the incentive compensation plans to which they and other employees are eligible. The Board of Directors makes final decisions regarding these incentive plan goals.
Based on compensation market data provided by our human resources department (survey sources and methodology are explained below under "Components of Executive Compensation and Benefits") and with input from the third-party consultant if necessary, our CEO makes compensation decisions for the other Named Executive Officers and communicates them accordingly. The day-to-day design and administration of compensation and benefit plans are managed by our human resources, finance and legal departments.
Components of Executive Compensation and Benefits
Our executive compensation and benefit program consists of five components.
| | | | | | | | | | | | | | |
| Pay Component | | Description | | Objective |
| Base Pay | | Competitive salary considering market benchmarks and internal pay structure and relative to individual skills, experience, knowledge and contributions | | Provide the fixed element of compensation for the core duties, scope and level of responsibilities of the job |
| Short-Term Incentive | | Short-term performance-based variable pay incentive for achieving predetermined annual financial and individual performance goals | | Provide a direct link between pay and annual business performance, achievement of critical business initiatives and financial results |
| Long-Term Incentive | | Long-term performance-based variable pay incentive for achieving predetermined three-year Return on Invested Capital ("ROIC") goals | | Provide a direct link between executive pay and long-term business performance to align management and member-owner interests while driving executive retention |
| Profit Sharing | | Performance-based annual award for achieving predetermined enterprise-level financial goals | | Reward employees for company profitability |
| Benefits | | Medical, dental, vision, life insurance, short-term disability and long-term disability, qualified and non-qualified retirement plans, and other benefits | | Provide competitive total rewards program to attract and retain executives |
Market Competitiveness of Executive Compensation
Each component is designed to be competitive with the external market. In determining competitive compensation levels, we analyze independent compensation survey information, including comparable industries, markets, revenues and companies that compete with us for executive talent. In fiscal 2024, information from the following sources was considered:
•Willis Towers Watson General Industry Executive (U.S.)
•Willis Towers Watson Custom Peer Comparator Group Executive (U.S.; includes the portion of the 17 peer companies that elected to participate in the survey)
•US Mercer Benchmark Database/Total Remuneration Survey (Executive)
•Radford/Aon Global Compensation Database (Executive)
The survey and database data include a range of competitive pay levels, including median market rates for base salary, short-term incentive, total cash compensation, long-term incentive and total direct compensation. Companies included in the surveys and databases vary by industry, revenue and number of employees, and represent both public and private ownership, as well as nonprofit, government and mutual organizations.
In determining competitive compensation levels for the CEO, various factors were considered including market data from surveys and publicly available proxy compensation data from a specific comparator group of peer companies, which consists of 17 public companies in the agriculture, energy, food and transportation industries. Our Board annually reviews the peer group comparator companies and adjusts as needed to ensure the comparator group represents a reasonable external perspective for pay benchmarking. The Board approved the following changes to the comparator group for 2024:
•Removal of three private companies (Cargill, Koch Industries and Land O’ Lakes) due to lack of publicly disclosed pay data
•Removal of Williams Companies due to decreased relevance in business scope
•Addition of five companies based on industry and business mix, size and overall reasonableness for pay benchmarking
| | | | | | | | | | | | | | |
| 2024 Comparator Group |
| ADM | C.H. Robinson* | HF Sinclair Corporation | Marathon Petroleum | Valero Energy |
| Bayer* | Conagra Brands | Hormel Foods* | Mosaic | |
| Bunge | Corteva* | Ingredion Incorporated* | Nutrien | |
| CF Industries | General Mills | Kinder Morgan | Phillips 66 | |
*New company added to the comparator group for 2024
The objective is to provide our executives with an overall total compensation package that is competitive in comparable industries, companies and markets. We target around market median compensation levels for base pay, target total cash and target total direct compensation, and around the 75th percentile for actual total direct compensation when our performance is well above target goals and below market median levels if performance is below target goals.
For the Named Executive Officers excluding the CEO in 2024, target total compensation was, on average, aligned to the desired competitive range. Base pay, on average, was slightly below the market median while total cash compensation and total direct compensation yielded around 75th percentile of market, on average, due to actual earned short-term incentive awards at the maximum level of performance and actual earned long-term incentive awards for the fiscal 2022-2024 performance period at the superior level of performance.
For fiscal 2024, the CEO's base pay, target total cash compensation and target total direct compensation were set to be aligned to the desired competitive range. Based on a review of the market benchmarks, consideration of the CEO's outstanding sustained performance and long service, and to further emphasize performance-based incentive award opportunities, target pay was increased for fiscal 2024 primarily in the long-term incentive target award opportunity to align to our multi-year performance. From an actual pay perspective, with strong company performance over the past three fiscal years (2022 - 2024), his actual total direct compensation for fiscal 2024 was above both target levels and market median due to outperformance of the preestablished goals.
Target Pay Mix
The objectives of our executive compensation program require a suitable mix of base pay, short-term incentive and long-term incentive that will engage the executive officers to achieve both short-term results as well as strategic results that benefit our member-owners' interests over the long term while maintaining alignment with the competitive talent market.
The charts below illustrate the mix of base salary, short-term incentive target pay and long-term incentive target pay based on the 2024 Grants of Plan-Based Awards values (see the Summary Compensation Table) for our CEO and the other Named Executive Officers as a group. The increase in the CEO's target award opportunity for the long-term incentive for performance periods beginning with the award granted in fiscal 2024 resulted in a shift to the pay mix with more of his target total compensation weighted towards long-term business performance, which aligns with our overall executive compensation objectives and market practices.
Base Pay
Base pay of our Named Executive Officers represents a fixed element of compensation paid as a salary on a semimonthly basis. Salaries are generally set around the median level of market data collected through our benchmarking process against other equivalent positions of comparable companies. The individual's actual salary relative to the market median is based on a number of factors, which include, but are not limited to, scope and level of responsibilities, individual skills, experience and performance.
Salaries for our Named Executive Officers are reviewed on an annual basis or at the time of significant changes in scope and level of responsibilities. Changes in salaries are determined through review of competitive market data, as well as individual performance and contribution, internal equity and other factors. Changes are not governed by preestablished weighting factors or a specific merit matrix. Our CEO is responsible for the annual salary review process for the other Named Executive Officers. The Executive Committee is responsible for the annual salary review process for our CEO.
Mr. Debertin received an approximate 6.2% salary increase effective December 1, 2023. Our Board of Directors approved the increase to reward Mr. Debertin for exceptional performance and align his base pay relative to market considering his long tenure as CEO. Ms. Nelligan, Mr. Smith, Mr. Hunhoff, and Mr. Griffith received salary increases of 5%, 3.5%, 3% and 4%, respectively, to reward them for strong performance and maintain market pay competitiveness.
Overview of Performance-Based Incentive Plans
We operate our diversified global businesses to maximize value, in the near-term and long-term, for our member cooperatives, farmer-owners and customers. Our executive compensation program reflects this key objective by emphasizing performance-based incentive opportunities, through the short-term and long-term incentive plans that are discussed in detail below, with awards earned commensurate with financial results. The actual payouts for the incentive cycles ended in fiscal 2024 reflect the team's outstanding execution relative to our business strategy in key areas including revenues, earnings and capital management, which are, collectively, captured in our primary financial measure of ROIC.
Short-Term Incentive Pay
Named Executive Officers participate in the same CHS Annual Variable Pay Plan ("Annual Variable Pay Plan" or "AVP") as other management and professional employees, and based on the plan provisions, when they are hired or retire they receive awards prorated to the period of time they were eligible. Each Named Executive Officer was eligible to participate in the AVP for the entirety of fiscal 2024. Target AVP award levels are set with reference to various factors including internal equity
and competitive market compensation levels and are intended to motivate our executives by providing short-term incentive awards for the achievement of annual goals. For fiscal 2024, the AVP incentive was weighted 70% on enterprise-level financial performance and 30% on individual performance.
•The financial performance component was based on preestablished ROIC goals at the enterprise level. The threshold, target and maximum ROIC goals approved by the Board of Directors for fiscal 2024 are set forth in the table below.
•The individual performance component was based on achievement of specific goals relating to areas such as business profitability, execution of strategic initiatives and/or talent acquisition, development and retention. In conjunction with the annual performance review process for our CEO, the Board of Directors reviews the individual goals and, in turn, determines and approves this portion of the short-term incentive award based upon completion or partial completion of the previously specified goals and principal job accountabilities. Likewise, our CEO uses a similar process for determining individual goal achievement for the other Named Executive Officers.
CHS financial performance goals and award opportunities under our fiscal 2024 AVP were as follows:
| | | | | | | | | | | | | | | | | |
| Performance Level | | CHS ROIC Goal | | | Target Award Multiple |
| Maximum | | 9.0% | | | 2.0x |
| Target | | 7.5% | | | 1.0x |
| Threshold | | 6.0% | | | 0.5x |
| Below threshold | | <6.0% | | | 0.0x |
ROIC is not defined under U.S. GAAP. Therefore, it should not be considered a substitute for other measures prepared in accordance with U.S. GAAP and may not be comparable to similarly titled measures used by other companies.
ROIC is a measurement of how efficiently we use capital and the level of return on that capital. It is calculated by dividing adjusted net operating profit after tax by average funded debt plus beginning equity. We define adjusted net operating profit after tax as earnings before taxes excluding the impact of certain non-recurring business events, plus net interest generated from investing and financing activities, and the result is multiplied by the effective tax rate. For purposes of the fiscal 2024 AVP, we define funded debt as the sum of the average of beginning and end of year long-term debt, including the current portion thereof, plus any guarantees thereof, using balances as of July 31, 2023 and 2024, respectively, and the total beginning of year equity as of July 31, 2023, respectively. Further, for purposes of the fiscal 2024 AVP, we excluded the impacts of a pension plan withdrawal liability, an impairment charge and a severance accrual as non-recurring events.
ROIC results for fiscal 2024 were 9.5%, resulting in award payouts at 2.0x target for the financial performance component. Although adjusted net operating profit after tax decreased in fiscal 2024 from the record results in the previous year due to the commodity cycle downturn, profitability was elevated from historical averages. The less favorable market conditions negatively impacted refining margins in our Energy segment and oilseed crush margins in our Ag segment, but both segments still performed well and were able to deliver solid financial results. Mr. Debertin, the other Named Executive Officers, and our other CHS employees were able to consistently execute to meet the needs of our customers and member-owners. The CEO and each Named Executive Officer's performance was determined by the Board of Directors or the CEO, respectively, to have been strong against their individual goals, and therefore, each Named Executive Officer was awarded an above target payout for the 30% individual performance component. Short-term incentive awards that were earned under the AVP for fiscal 2024 for the Named Executive Officers are as follows:
| | | | | | | | | | | | | | |
| Name | | Position | | 2024 AVP Awards |
| | | | (Dollars) |
| Jay Debertin | | President and Chief Executive Officer | | $ | 4,350,000 | |
| Olivia Nelligan | | Executive Vice President, Chief Financial Officer and Chief Strategy Officer | | 1,569,992 | |
| Brandon Smith | | Executive Vice President, General Counsel | | 1,431,731 | |
| Darin Hunhoff | | Executive Vice President, Energy | | 1,402,657 | |
| John Griffith | | Executive Vice President, Ag Business and CHS Hedging | | 1,392,144 | |
Long-Term Incentive Pay
Each Named Executive Officer was eligible to participate in the CHS Inc. Executive Long-Term Incentive Plan ("ELTIP"). The purpose of the ELTIP is to align executive pay with long-term business performance, maximize long-term value for our member-owners and retain key executives. The ELTIP consists of three-year performance periods to ensure consideration
is made for our long-term financial performance and strategic execution, with a new performance period beginning every fiscal year. Our Board of Directors approves the ELTIP goals for each three-year period.
Earned awards from the ELTIP are contributed to the Deferred Compensation Plan after the end of each performance period. These awards vest over an additional 28-month period following the performance period end date. Participants who leave CHS prior to retirement for reasons other than death or disability forfeit all unearned and unvested ELTIP award balances. Participants who meet retirement criteria, die or become disabled receive prorated awards following the ELTIP provisions. Like the AVP, target award levels for the ELTIP are set with regard to various factors including internal equity and market competitive considerations. The target ELTIP award is 1.25x base salary for Named Executive Officers other than Mr. Debertin for performance periods beginning on or after September 1, 2021 (including the three-year ELTIP performance period ending in fiscal 2024). Mr. Debertin's target ELTIP award is 3.0x his base salary for performance periods beginning on or after September 1, 2021 (including the three-year ELTIP performance period ending in fiscal 2024) and increases to 5.0x his base salary for performance periods beginning on or after September 1, 2023.
For the three-year ELTIP period ended in fiscal 2024, the ELTIP performance measure was ROIC. As stated above in the AVP section, ROIC is a measurement of how efficiently we use capital and the level of return on that capital and is calculated by dividing adjusted net operating profit after tax by average funded debt plus total equity at the beginning of the year. For purposes of the fiscal 2022-2024 performance period, we define funded debt as the sum of the average of long-term debt at the beginning and end of the year, including the current portion thereof, plus any guarantees thereof, using balances as of July 31, 2021, 2022, 2023 and 2024, respectively, and the total beginning of year equity as of July 31, 2021, 2022, and 2023, respectively. Further, for purposes of calculating adjusted net operating profit for the fiscal 2022-2024 performance period, we excluded the impacts of a pension plan withdrawal liability, an impairment charge and a severance accrual as non-recurring events.
Award opportunities for the fiscal 2022-2024 ELTIP performance period are expressed as a multiple of a participant's average base salary as of August 31 for each of the three years in the performance period. We must meet a three-year period threshold level of ROIC performance for any participant to earn an award. As indicated in the table below, the threshold, target, maximum and superior maximum ROIC goals for the fiscal 2022-2024 performance period are as follows:
| | | | | | | | | | | | | | |
| Performance Level | | CHS Three-Year ROIC Goal | | Target Award Multiple |
Superior Maximum (1) | | 9.7% | | 4.0x (1) |
| Maximum | | 7.7% | | 2.0x |
| Target | | 6.7% | | 1.0x |
| Threshold | | 5.7% | | 0.5x |
| Below threshold | | <5.7% | | 0.0x |
(1) The Superior Maximum performance level and target award multiple do not apply to the CEO.
Business conditions in the agriculture and energy industries were favorable during the 2022-2024 performance period. Our ability to execute in this environment with strong operational performance resulted in ROIC of 16.1%, 16.4% and 9.5% in fiscal 2022, fiscal 2023 and fiscal 2024, respectively. Overall ROIC performance for the fiscal 2022-2024 performance period was 13.9%, resulting in superior maximum performance level awards equivalent to 4.0x the target for Named Executive Officers other than the CEO and a maximum performance level award equivalent to 2.0x the target for the CEO. ELTIP payments for the fiscal 2022-2024 ELTIP for the Named Executive Officers are as follows:
| | | | | | | | | | | | | | |
| Name | | Position | | 2022-2024 ELTIP Award |
| | | | (Dollars) |
| Jay Debertin | | President and Chief Executive Officer | | $ | 8,257,328 | |
| Olivia Nelligan | | Executive Vice President, Chief Financial Officer and Chief Strategy Officer | | 3,255,000 | |
| Brandon Smith | | Executive Vice President, General Counsel | | 3,049,452 | |
| Darin Hunhoff | | Executive Vice President, Energy | | 3,049,172 | |
| John Griffith | | Executive Vice President, Ag Business and CHS Hedging | | 2,948,334 | |
The fiscal 2024 award grant values associated with the fiscal 2024-2026 ELTIP performance period, which continue to measure three-year ROIC, are provided in the "2024 Grants of Plan-Based Awards" table.
Profit-Sharing
Each Named Executive Officer was eligible to participate in our Profit-Sharing Plan, which is also available to other employees. The purpose of the Profit-Sharing Plan is to reward employees for our profitability. Annual profit-sharing contributions for executives are calculated as a percent of base pay and annual variable pay (total calendar year earnings) and are made to the CHS Inc. 401(k) Plan ("401(k) Plan") account and CHS Inc. Deferred Compensation Plan ("Deferred Compensation Plan") account of each Named Executive Officer. The profit-sharing amount varies in relation to CHS ROIC performance. The fiscal 2024 Profit-Sharing Plan ROIC goals and contribution as a percent of total earnings are displayed in the following table:
| | | | | | | | |
| Performance Level | CHS ROIC Goal | Profit-Sharing Award |
| Maximum | 9.0% | 5% |
| 8.3% | 4% |
| Target | 7.5% | 3% |
| 6.8% | 2% |
| Threshold | 6.0% | 1% |
ROIC results for fiscal 2024 were 9.5%. Accordingly, each Named Executive Officer earned a 5% Profit-Sharing award.
Retirement Benefits
We provide the following retirement and deferral programs to Named Executive Officers:
•CHS Inc. Pension Plan
•CHS Inc. 401(k) Plan
•CHS Inc. Supplemental Executive Retirement Plan
•CHS Inc. Deferred Compensation Plan
CHS Inc. Pension Plan
The CHS Inc. Pension Plan ("Pension Plan") is a tax-qualified defined benefit pension plan. All Named Executive Officers participate in the Pension Plan. A Named Executive Officer is fully vested in the Pension Plan after three years of vesting service. The Pension Plan provides for a lump sum payment of the participant’s account balance once the Named Executive Officer reaches normal retirement age (or, alternatively, for a monthly annuity for the Named Executive Officer's lifetime if elected by the Named Executive Officer). The normal form of benefit for a single Named Executive Officer is a life annuity, and for a married Named Executive Officer, the normal form of benefit is a 50% joint and survivor annuity. Other annuity forms are also available on an actuarial equivalent basis. Compensation and benefits are limited based on limits imposed by the Internal Revenue Code.
A Named Executive Officer's benefit under the Pension Plan depends on pay credits to his or her account, which are based on the Named Executive Officer's total salary and annual variable pay for each year of employment, date of hire, age at date of hire and the length of service, and investment credits, which are computed using the interest crediting rate and the Named Executive Officer's account balance at the beginning of the plan year.
The amount of pay credits added to a Named Executive Officer's account each year is a percentage of the Named Executive Officer’s base salary and annual variable pay plus compensation reduction pursuant to the 401(k) Plan and any pretax contribution to any of our welfare benefit plans, paid vacations, paid leaves of absence and pay received if away from work due to a sickness or injury. The pay credits percentage received is determined on a yearly basis, based on the years of benefit service completed as of December 31 of each year. A Named Executive Officer receives one year of benefit service for every calendar year of employment in which the Named Executive Officer completed at least 1,000 hours of service.
Pay credits are earned according to the following schedules:
Regular Pay Credits
| | | | | | | | | | | | | | |
| | Regular Pay Credit |
| Years of Benefit Service | | Pay Below Social Security Taxable Wage Base | | Pay Above Social Security Taxable Wage Base |
| 1-3 years | | 3% | | 6% |
| 4-7 years | | 4% | | 8% |
| 8-11 years | | 5% | | 10% |
| 12-15 years | | 6% | | 12% |
| 16 years or more | | 7% | | 14% |
Mid-Career Pay Credits
Employees hired after age 40 qualify for the following minimum pay credit:
| | | | | | | | | | | | | | |
| | | Minimum Pay Credit |
| Age at Date of Hire | | Pay Below Social Security Taxable Wage Base | | Pay Above Social Security Taxable Wage Base |
| Age 40-44 | | 4% | | 8% |
| Age 45-49 | | 5% | | 10% |
| Age 50 or higher | | 6% | | 12% |
Investment Credits
We credit a Named Executive Officer's account at the end of the calendar year with an investment credit based on the balance at the beginning of the year. The investment credit is based on the average return for one-year Treasury bills for the four-month period from August 1 through November 30 of the prior year. The minimum interest rate under the Pension Plan is 4.65%, and the maximum is 10%.
CHS Inc. 401(k) Plan
The 401(k) Plan is a tax-qualified, defined contribution retirement plan. Most full-time, nonunion CHS employees are eligible to participate in the 401(k) Plan, including each Named Executive Officer. Participants may contribute between 1% and 50% of their pay on a pretax basis. We match 100% of the first 1% and 50% of the next 5% of pay contributed each year (maximum 3.5%). Our Board of Directors may elect to reduce or eliminate matching contributions for any year or any portion thereof. Participants are 100% vested in their own contributions and are fully vested after two years of service in matching contributions made on the participant’s behalf by us.
CHS Inc. Supplemental Executive Retirement Plan and CHS Inc. Deferred Compensation Plan
Because the Internal Revenue Code limits the benefits that may be paid from the Pension Plan and the 401(k) Plan, the CHS Inc. Supplemental Executive Retirement Plan ("SERP") and the Deferred Compensation Plan ("DCP") were established to provide certain employees participating in the qualified plans with supplemental benefits such that, in the aggregate, they equal the benefits they would have been entitled to receive under the qualified plan had these limits not been in effect. The SERP also includes compensation deferred under the DCP that is excluded under the qualified retirement plan. All Named Executive Officers are eligible to participate in the SERP.
Compensation includes total salary and annual variable pay without regard to limitations on compensation imposed by the Internal Revenue Code. Company contributions under the Pension Plan and 401(k) Plan are not eligible for pay credits.
Certain Named Executive Officers may have accumulated nonqualified plan balances or benefits that have been carried over from predecessor companies as a result of past mergers and acquisitions. Benefits from the SERP are primarily funded in a rabbi trust, with a balance as of August 31, 2024, of $37.5 million. Benefits from the plan do not qualify for special tax treatment under the Internal Revenue Code.
The DCP allows eligible Named Executive Officers to voluntarily defer receipt of up to 75% of their base salary and up to 100% of their annual variable pay. The election must occur prior to the beginning of the calendar year in which the compensation will be paid. During the year ended August 31, 2024, all of the Named Executive Officers were eligible to participate in the DCP. Mr. Debertin, Ms. Nelligan and Mr. Griffith participated in the elective portion of the DCP.
Benefits from the DCP are primarily funded in a rabbi trust, with a balance as of August 31, 2024, of $162.5 million. Benefits from the plan do not qualify for special tax treatment under the Internal Revenue Code.
Health and Welfare Benefits
The Named Executive Officers are eligible to participate in benefits under our comprehensive health and welfare program on the same basis as other eligible full-time employees. The health and welfare program includes benefits such as medical, dental, vision, life insurance, short-term disability, spending accounts, travel accident and identity theft protection. Like non-executive full-time employees, participation in some of these benefit plans varies based on each Named Executive Officer's annual benefit elections.
Additional Benefits
Additional benefits such as executive long-term disability, executive physical examinations and limited financial and tax planning assistance are also available to our Named Executive Officers. These are provided as part of an overall executive rewards package that strives to be competitive and retain executive talent. More details can be found in the "All Other Compensation" section of the Summary Compensation Table.
Incentive Compensation Recovery Policy
On September 6, 2023, our Board of Directors approved an amendment to our Incentive Compensation Recovery Policy ("Recovery Policy") effective as of December 1, 2023. The purpose of the amendment to the Recovery Policy was to bring the Recovery Policy into compliance with newly adopted listing rule 5608 by Nasdaq and to provide general updates to the policy to reflect what we believe are best practices. Specifically, the Recovery Policy applies to our current and former directors, employees, and employees who are or were identified by us as an "officer" which for purposes of the Recovery Policy includes any person that performs policy-making functions for CHS or any subsidiary of CHS ("Recovery Party").
The Recovery Policy provides that, in the event of a required restatement of our previously issued financial statements to reflect the correction of one or more errors that are material to those financial statements, we will require reimbursement or forfeiture of any excess incentive compensation received by any Covered Employee during the three completed fiscal years immediately preceding the earlier of (i) the date our Board of Directors (including a committee of our Board of Directors) concludes or reasonably should have concluded, that CHS is required to prepare an accounting restatement or (ii) the date a court, regulator or other legally authorized body directs CHS to prepare an accounting restatement. The amount of excess incentive compensation will be equal to the amount by which the Covered Recovery Party's incentive compensation for the relevant period exceeded the amount that would have been earned or awarded based on the restated financial results, as determined by our Board of Directors. The method used to recover the applicable excess incentive compensation will be determined by our Board of Directors, in its sole discretion, and may include requiring reimbursement of cash incentive compensation that was previously paid, forfeiting any incentive compensation contribution made under the Deferred Compensation Plan, offsetting the recovered amount from any compensation or incentive compensation that may be earned or awarded in the future or taking any other remedial or recovery action permitted by law.
Detrimental Conduct Policy
On September 6, 2023, our Board of Directors approved the adoption of a detrimental conduct policy (the "Detrimental Conduct Policy") effective as of December 1, 2023. The Detrimental Conduct Policy applies to current and former officers and employees of CHS and its affiliated companies (each a "Covered Person").
The Detrimental Conduct Policy also provides that, in the event our Board of Directors determines in good faith that a Covered Person has engaged in detrimental conduct, we may, (i) require the Covered Person reimburse or forfeit all or a portion of the Covered Person's incentive compensation with such forfeited amounts to be determined by our Board of Directors, (ii) conduct disciplinary action, up to, and including termination and (iii) report such Covered Person to applicable governmental authorities for possible criminal prosecution. For purposes of the Detrimental Conduct Policy, detrimental conduct includes:
•deliberate and continued failure, after delivery of notice to such Covered Person by us, by a Covered Person to substantially perform his or her duties and responsibilities in a manner that has an adverse effect on us;
•knowing and willful violation of any law, government regulation or company code of conduct or policy;
•knowingly encouraging or directing others to violate any law, government regulation or company code of conduct or policy;
•fraud or dishonesty resulting or intended to result in personal enrichment at our expense;
•the commission of any felony or gross misconduct in the performance of duties that results in economic harm to us;
•violation of any company policies regarding substance abuse and/or illegal drug use;
•knowingly encouraging or directing others to violate safety measures resulting, or intended to result, in harm to any person or destruction or damage to any property of ours or other parties;
•knowing and willful engagement in discrimination or harassment (whether sexual or otherwise) in violation of any of our policies prohibiting discrimination and/or harassment;
•knowingly encouraging or directing others to violate any of CHS's policies prohibiting discrimination and harassment (whether sexual or otherwise); and
•failing to cooperate with CHS in the investigation of any potential violations of the Code of Conduct or other applicable policies.
Agreements With Named Executive Officers
Mr. Debertin
On May 22, 2017, Mr. Debertin was elected as our President and CEO, and in connection therewith entered into an employment agreement with us on that date (the "Employment Agreement"). The Employment Agreement, as amended, has a term expiring August 31, 2026, provided that the Employment Agreement will thereafter automatically renew for an additional one-year period, unless either party notifies the other in writing, at least 120 days in advance of the relevant renewal date, of its intent not to renew the agreement for the additional one-year period.
Pursuant to the terms of the amended Employment Agreement Mr. Debertin is entitled to, among other things:
•an annual base salary of $1,150,000, which has subsequently been increased by our Board of Directors to $1,450,000 and which is subject to further increase by our Board of Directors from time to time;
•a target annual incentive compensation opportunity of 1.5x his annual base salary with a maximum opportunity equal to twice the target opportunity, based on achievement of performance goals set by our Board of Directors;
•a target long-term incentive compensation award opportunity of 3.0x his average annual base salary over each three-year performance period applicable to that award opportunity, with a threshold opportunity equal to one-half of the target opportunity and a maximum opportunity equal to twice the target opportunity. Prior to the execution of Employment Agreement Amendment No. 2, the Employment Agreement provided Mr. Debertin with a target long-term incentive compensation award opportunity of 1.5x his average annual base salary over each three-year performance period applicable to that award opportunity with a maximum opportunity equal to three and one-third times his target award opportunity; and
•welfare benefit continuation for two years following the termination of his employment, if Mr. Debertin chooses to retire from the Company on or after August 31, 2025.
Pursuant to an amendment in November 2023, in order to, among other things, recognize his outstanding performance and long tenure and to further emphasize performance-based incentive award opportunities that can be earned for long term strategy execution as reflected in our results relative to goals set at the start of the multi-year performance period, we agreed to provide Mr. Debertin the following for ELTIP awards for the 2024-2026 performance period (and any ELTIP performance period thereafter):
•a target ELTIP award opportunity of 5x his average annual base salary over each three-year performance period applicable to that award opportunity, with a threshold ELTIP award opportunity equal to one-half of the target ELTIP award opportunity and a maximum ELTIP award opportunity equal to twice the target ELTIP award opportunity; and
•if Mr. Debertin's employment ends due to death or permanent disability (as defined in our ELTIP) or if he is employed for at least 6 months of such a performance period and his employment ends due to retirement approved (such approval not to be unreasonably withheld) by our Board of Directors, then upon completion and certification of performance results for such performance period, he will be eligible for a vested full grant participation in the applicable ELTIP award with the payout factor calculated at the same time as other participants.
The Employment Agreement and the compensation payable thereunder is subject to the Recovery Policy and the Detrimental Conduct Policy, each of which is described above.
The severance pay and benefits to which Mr. Debertin would be entitled under the Employment Agreement if we terminated his employment without cause or, if he terminated his employment for "good reason" are described below under "Post Employment."
Ms. Nelligan
Ms. Nelligan's compensation is set forth in a letter agreement we entered into with her on January 7, 2020 (the "Nelligan Letter Agreement"). The Nelligan Letter Agreement provides that Ms. Nelligan's initial target award for purposes of the Annual Variable Pay Plan will be equal to 1.15x her annual base salary on August 31 of each year. The Nelligan Letter Agreement and the compensation payable thereunder is subject to the Recovery Policy and the Detrimental Conduct Policy, each of which is described above.
The severance pay and benefits to which Ms. Nelligan would be entitled under the Nelligan Letter Agreement if we terminated her employment without cause or if she terminated her employment for "good reason" are described below under "Post Employment."
Mr. Smith
Mr. Smith's compensation is set forth in a letter agreement we entered into with him on January 1, 2021 (the "Smith Letter Agreement"). The Smith Letter Agreement provides Mr. Smith with an initial annual base salary of $570,000 and a hiring bonus in the gross amount of $1,500,000 ("Hiring Bonus"). The Smith Letter Agreement provides for the payment of the Hiring Bonus in three installments of $400,000, which were paid in previous years, and a final installment of $300,000 paid in 2024.
The Smith Letter Agreement provides that Mr. Smith's initial target award for purposes of the Annual Variable Pay Plan will be equal to 1.15x his annual base salary on August 31 of each year. The Smith Letter Agreement also provides that Mr. Smith's initial target award for purposes of the ELTIP will be equal to 1.15x the average of his annual base salary on August 31 of each year in the applicable three-year performance period, and that any award he receives under the ELTIP will be prorated by the number of full months (credited to September 1, 2020) he is eligible for participation in the ELTIP during the respective three-year performance period.
The Smith Letter Agreement and the compensation payable thereunder is subject to the Recovery Policy and the Detrimental Conduct Policy, each of which is described above.
The severance pay and benefits to which Mr. Smith would be entitled under the Smith Letter Agreement if we terminated his employment without cause or if he terminated his employment for "good reason" are described below under "Post Employment."
Tax Considerations
Section 162(m) of the Internal Revenue Code ("Section 162(m)") generally limits us to a deduction for federal income tax purposes of no more than $1 million of compensation paid to certain current and former executive officers in a taxable year.
We believe that Section 162(m) is only one of several relevant considerations in setting compensation. We also believe that Section 162(m) should not be permitted to compromise our ability to design and maintain executive compensation arrangements that, among other things, are intended to attract and retain highly qualified executives in a competitive environment. As a result, we retain the flexibility to provide compensation that we determine to be in our best interests and the best interests of our member-owners, even if that compensation ultimately is not deductible for tax purposes.
Insider Trading Policy
CHS is committed to promoting high standards of ethical business conduct and compliance with applicable laws, rules and regulations. As part of this commitment, we have an Insider Trading Policy governing the purchase, sale and/or other dispositions of our securities by our directors, officers, employees and third-party contractors, that we believe is reasonably designed to promote compliance with insider trading laws, rules and regulations, and the exchange listing standards applicable to us. A copy of our Insider Trading Policy is filed as Exhibit 19.1 to this Annual Report on Form 10-K.
Shareholder Advisory Votes on Executive Compensation
Because we are not subject to Section 14A of the Securities Exchange Act of 1934, we are not required to, and do not, conduct shareholder advisory votes on executive compensation.
Summary Compensation Table
| | | | | | | | | | | | | | | | | | | | | | | | | | | | |
| Name and Principal Position | Year | Salary | Bonus (1) | Nonequity Incentive Plan Compensation (2) | Change in Pension Value and Nonqualified Deferred Compensation Earnings (3) | All Other Compensation (4-10) | Total | | | | | |
| | (Dollars) | | | | | |
| Jay Debertin President and Chief Executive Officer | 2024 | $ | 1,428,900 | | — | | $ | 12,607,328 | | $ | 1,255,762 | | $ | 483,074 | | $ | 15,775,064 | | | | | | |
| 2023 | 1,348,088 | | — | | 10,685,281 | | 1,109,326 | | 458,759 | | 13,601,454 | | | | | | |
| 2022 | 1,300,316 | | — | | 12,145,152 | | 661,879 | | 372,610 | | 14,479,957 | | | | | | |
| Olivia Nelligan Executive Vice President, Chief Financial Officer and Chief Strategy Officer | 2024 | 684,750 | | — | | 4,824,992 | | 212,287 | | 205,169 | | 5,927,198 | | | | | | |
| 2023 | 640,000 | | — | | 4,324,000 | | 146,672 | | 177,920 | | 5,288,592 | | | | | | |
| 2022 | 590,000 | | — | | 3,677,444 | | 114,130 | | 139,019 | | 4,520,593 | | | | | | |
Brandon Smith
Executive Vice President, General Counsel | 2024 | 626,628 | | 300,000 | | 4,481,183 | | 190,030 | | 181,590 | | 5,779,431 | | | | | | |
| 2023 | 602,767 | | 400,000 | | 4,114,852 | | 138,124 | | 176,677 | | 5,432,420 | | | | | | |
| 2022 | 581,400 | | 400,000 | | 3,124,550 | | 121,053 | | 241,139 | | 4,468,142 | | | | | | |
Darin Hunhoff
Executive Vice President, Energy | 2024 | 624,134 | | — | | 4,451,829 | | 477,198 | | 192,954 | | 5,746,115 | | | | | | |
| 2023 | 603,730 | | — | | 4,124,032 | | 228,585 | | 176,585 | | 5,132,932 | | | | | | |
| 2022 | 584,659 | | — | | 4,391,964 | | 49,859 | | 150,806 | | 5,177,288 | | | | | | |
| John Griffith Executive Vice President, Ag Business and CHS Hedging | 2024 | 618,000 | | — | | 4,340,478 | | 364,125 | | 183,925 | | 5,506,528 | | | | | | |
| 2023 | 581,667 | | — | | 3,902,332 | | 230,942 | | 169,553 | | 4,884,494 | | | | | | |
| 2022 | 545,000 | | — | | 3,357,742 | | 54,067 | | 124,456 | | 4,081,265 | | | | | | |
(1) Includes hiring bonus payments to Mr. Smith of $400,000 in 2022, $400,000 in 2023 and $300,000 in 2024.
(2) Amounts include retention awards earned in fiscal 2022, annual variable pay awards and long-term incentive awards.
The Board of Directors approved a retention award for certain senior officers, including each of the Named Executive Officers who were both active participants in the 2016-2018 ELTIP and active employees on the date the retention award was approved. Pursuant to its original terms, the retention award would generally be earned only if the participant continued active employment through January 1, 2021. In November 2020, our Board of Directors modified the terms of the retention award to provide that it would generally only be earned if the applicable participant continued active employment through January 1, 2022. The actual retention award value was distributed as follows in fiscal 2022: Mr. Debertin, $1,768,125, Mr. Hunhoff, $371,000 and Mr. Griffith, $180,400. Because Ms. Nelligan and Mr. Smith were not active participants in the 2016-2018 ELTIP or actively employed by us on the date the retention award was approved, they were not granted a retention award.
The actual annual variable pay award value was as follows in fiscal 2024, 2023 and 2022, respectively: Mr. Debertin, $4,350,000,$4,096,800 and $3,939,192; Ms. Nelligan, $1,569,992, $1,518,000 and $1,380,000; Mr. Smith, $1,431,731, $1,404,380 and $1,350,330; Mr. Hunhoff, $1,402,657, $1,403,920 and $1,357,900; and Mr. Griffith, $1,392,144, $1,380,000 and $1,253,500.
The actual long-term incentive award value was as follows in fiscal 2024, 2023 and 2022, respectively: Mr. Debertin, $8,257,328, $6,588,481 and $6,437,835; Ms. Nelligan, $3,255,000, $2,806,000 and $2,297,444; Mr. Smith, $3,049,452, $2,710,472 and $1,774,220; Mr. Hunhoff, $3,049,172, $2,720,112 and $2,663,064; and Mr. Griffith, $2,948,334, $2,522,332 and $1,923,842.
(3) This column represents both changes in pension value and above-market earnings on deferred compensation. Change in pension value is the aggregate change in the actuarial present value of the Named Executive Officer's benefit under his or her retirement program and nonqualified earnings, if applicable.
The aggregate change in the actuarial present value was as follows in fiscal 2024, 2023 and 2022, respectively: Mr. Debertin, $1,255,762, $973,758 and $334,447; Ms. Nelligan, $212,287, $135,559 and $88,098; Mr. Smith, $190,030, $129,192 and $112,719; Mr. Hunhoff, $477,198, $210,620 and $(320,238); and Mr. Griffith, $364,125, $228,368 and $48,145. Negative values are not reflected in the sum reported in the column.
Above-market earnings on deferred compensation represent earnings exceeding 120% of the Federal Reserve long-term rate as determined by the Internal Revenue Service ("IRS") on applicable funds and were as follows in fiscal 2024, 2023 and 2022, respectively: Mr. Debertin,
$0, $135,568 and $327,432; Ms. Nelligan, $0, $11,113 and $26,032; Mr. Smith, $0, $8,932 and $8,334; Mr. Hunhoff, $0, $17,965 and $49,859; and Mr. Griffith, $0, $2,574 and $5,922.
(4) Includes fiscal 2024 employer contributions to the Deferred Compensation Plan: Mr. Debertin, $446,752; Ms. Nelligan, $167,214; Mr. Smith, $153,275, Mr. Hunhoff, $153,197; and Mr. Griffith, $150,320.
(5) Includes fiscal 2024 employer contribution to the 401(k) Plan: Mr. Debertin, $18,296; Ms. Nelligan, $18,233; Mr. Smith, $18,400; Mr. Hunhoff, $18,675; and Mr. Griffith, $15,375.
(6) For fiscal 2024, includes executive LTD, travel accident insurance, executive physical, financial planning, commemorative gift and companion travel for Mr. Debertin.
(7) For fiscal 2024, includes executive LTD, travel accident insurance, executive physical, financial planning and wellness program incentive for Ms. Nelligan.
(8) For fiscal 2024, includes executive LTD, travel accident insurance and wellness program incentive for Mr. Smith.
(9) For fiscal 2024, includes executive LTD, travel accident insurance, executive physical, financial planning, wellness program incentive, and companion travel for Mr. Hunhoff.
(10) For fiscal 2024, includes executive LTD, travel accident insurance, executive physical, financial planning, wellness program incentive and companion travel for Mr. Griffith.
2024 Grants of Plan-Based Awards
| | | | | | | | | | | | | | |
| | Estimated Future Payouts Under Nonequity Incentive Plan Awards |
| Name and Principal Position | Grant Date | Threshold | Target | Maximum |
| | (Dollars) |
Jay Debertin
President and Chief Executive Officer | 9/7/2023 (1) | $ | 1,024,200 | | $ | 2,048,400 | | $ | 4,096,800 | |
9/7/2023 (2) | 3,414,000 | | 6,828,000 | | 13,656,000 | |
Olivia Nelligan
Executive Vice President, Chief Financial Officer and Chief Strategy Officer | 9/7/2023 (3) | 379,500 | | 759,000 | | 1,518,000 | |
9/7/2023 (4) | 412,500 | | 825,000 | | 3,300,000 | |
Brandon Smith
Executive Vice President, General Counsel | 9/7/2023 (3) | 351,095 | | 702,190 | | 1,404,380 | |
9/7/2023 (4) | 381,625 | | 763,250 | | 3,053,000 | |
Darin Hunhoff
Executive Vice President, Energy | 9/7/2023 (3) | 350,980 | | 701,960 | | 1,403,920 | |
9/7/2023 (4) | 381,500 | | 763,000 | | 3,052,000 | |
John Griffith
Executive Vice President, Ag Business and CHS Hedging | 9/7/2023 (3) | 345,000 | | 690,000 | | 1,380,000 | |
9/7/2023 (4) | 375,000 | | 750,000 | | 3,000,000 | |
(1) Represents range of possible awards under our fiscal 2024 Annual Variable Pay Plan for Mr. Debertin based on target award opportunity at 1.5x base salary.
(2) Represents range of possible awards under our ELTIP for the fiscal 2024-2026 performance period for Mr. Debertin. Values for Mr. Debertin reflect the amendments to his long-term incentive compensation opportunity made pursuant to Employment Agreement Amendment No. 4, including ELTIP target award opportunity at 5.0x base salary. Awards are measured over a three-year period and vest over an additional 28-month period.
(3) Represents range of possible awards under our fiscal 2024 Annual Variable Pay Plan for the other NEOs based on target award opportunity at 1.15x base salary.
(4) Represents range of possible awards under our ELTIP for the fiscal 2024-2026 performance period for the other NEOs. Values include ELTIP target award opportunity at 1.25x base salary. Awards are measured over a three-year period and vest over an additional 28-month period.
The material terms of annual variable pay and long-term incentive awards that are disclosed in the above table, including the vesting schedule, are described under "Compensation Discussion and Analysis" above.
2024 Pension Benefits
| | | | | | | | | | | |
| Name and Principal Position | Plan Name | Years of Credited Service | Present Value of Accumulated Benefits |
| | (Years) | (Dollars) |
Jay Debertin(1) President and Chief Executive Officer | Pension Plan | 40.2500 | $ | 1,444,574 | |
| SERP | 40.2500 | 7,792,347 | |
Olivia Nelligan
Executive Vice President, Chief Financial Officer and Chief Strategy Officer | Pension Plan | 4.5833 | 73,809 | |
| SERP | 4.5833 | 518,530 | |
Brandon Smith
Executive Vice President, General Counsel | Pension Plan | 3.4167 | 57,437 | |
| SERP | 3.4167 | 402,547 | |
Darin Hunhoff
Executive Vice President, Energy | Pension Plan | 32.2500 | 899,939 | |
| SERP | 32.2500 | 1,842,161 | |
John Griffith(1) Executive Vice President, Ag Business and CHS Hedging | Pension Plan | 23.1667 | 427,684 | |
| SERP | 23.1667 | 1,018,068 | |
(1) Mr. Debertin and Mr. Griffith are eligible for early retirement in both the Pension Plan and the SERP.
The above table shows the present value of accumulated retirement benefits that Named Executive Officers are entitled to under the Pension Plan and the SERP.
For a discussion of the material terms and conditions of the Pension Plan and the SERP, see "Compensation Discussion and Analysis" above.
The present value of accumulated benefits is determined in accordance with the same assumptions outlined in Note 13, Benefit Plans, of the notes to the consolidated financial statements that are included in this Annual Report on Form 10-K:
•a discount rate of 5.04% for the Pension Plan and 4.75% for the SERP;
•each Named Executive Officer is assumed to retire at the earliest retirement age at which unreduced benefits are available (age 65). The early retirement benefit under the cash balance plan formula is equal to the participant’s account balance; and
•payments under the cash balance formula of the Pension Plan assume a lump sum payment. SERP benefits are payable as a lump sum.
The normal form of benefit for a single Named Executive Officer is a life-only annuity, and for a married Named Executive Officer the normal form of benefit is a 50% joint and survivor annuity. Other annuity forms are also available on an actuarial equivalent basis. A lump sum option is also available.
All Named Executive Officers' retirement benefits at normal retirement age will be equal to their accumulated benefits under the Pension Plan and the SERP, as described under "Compensation Discussion and Analysis" above.
2024 Nonqualified Deferred Compensation
| | | | | | | | | | | | | | | | | |
| Name and Principal Position | Executive Contributions in Last Fiscal Year (1) | Registrant Contributions in Last Fiscal Year (2) | Aggregate Earnings in Last Fiscal Year (3) | Aggregate Withdrawals/ Distributions (4) | Aggregate Balance at Last Fiscal Year End (5) |
| (Dollars) |
Jay Debertin
President and Chief Executive Officer | $ | 4,332,528 | | $ | 7,024,734 | | $ | 5,008,208 | | $ | 8,806,418 | | $ | 44,275,940 | |
Olivia Nelligan
Executive Vice President, Chief Executive Officer and Chief Strategy Officer | 161,700 | | 2,966,641 | | 1,272,344 | | — | | 9,706,639 | |
Brandon Smith
Executive Vice President, General Counsel | — | | 2,856,997 | | 224,613 | | — | | 5,639,589 | |
Darin Hunhoff
Executive Vice President, Energy | — | | 2,866,542 | | 2,046,305 | | — | | 16,293,910 | |
John Griffith
Executive Vice President, Ag Business and CHS Hedging | 138,000 | | 2,665,921 | | 990,117 | | — | | 9,405,426 | |
(1) Includes contributions into the Deferred Compensation Plan by the Named Executive Officers representing deferred salary and deferred annual incentive pay from September 1, 2023 through August 31, 2024. Deferred salary contributions were reported as fiscal 2024 compensation in the Summary Compensation Table, and deferred annual incentive pay was reported as fiscal 2023 compensation in the Summary Compensation Table.
(2) Includes contributions made by us into the Deferred Compensation Plan on behalf of Named Executive Officers representing retirement contributions for Profit-Sharing and 401(k) match on amounts exceeding IRS compensation limits (which were reported as fiscal 2024 compensation in the Summary Compensation Table) and ELTIP contributions (which were reported as fiscal 2023 compensation in the Summary Compensation Table) from September 1, 2023 through August 31, 2024.
(3) Includes aggregate earnings on Named Executive Officer Deferred Compensation Plan accounts from September 1, 2023 through August 31, 2024, which are not required to be reported as compensation in the Summary Compensation Table. Deferred Compensation Plan earnings are based on investment elections made by the Named Executive Officer from thirteen market-based notional investments and a fixed rate fund. The investment returns for fiscal 2024 were as follows:
| | | | | |
| Fund Name | Investment Return |
| Vanguard Federal Money Market Fund | 5.42% |
| Vanguard LifeStrategy Income Fund | 10.17% |
| Vanguard LifeStrategy Conservative Growth Fund | 13.30% |
| Vanguard LifeStrategy Moderate Growth Fund | 16.39% |
| Vanguard LifeStrategy Growth Fund | 19.53% |
| Vanguard International Value Fund | 13.28% |
| PRIMECAP Fund Admiral | 22.92% |
| International Growth Fund Admiral | 16.70% |
| Institutional Index Fund Institutional Plus | 27.11% |
| Extended Market Index Institutional | 20.42% |
| Total International Stock Index Fund Institutional Shares | 17.76% |
| Janus Henderson Triton Fund Class N | 15.52% |
| American Century Small Cap Value Fund R6 Class | 17.33% |
| Fixed Rate Fund | 5.00 | % |
(4) Includes payments of previously deferred amounts made in accordance with elections by the Named Executive Officer and in accordance with Section 409A under the Internal Revenue Code. Payments under the Deferred Compensation Plan may be made at a specified date elected by the Named Executive Officer or deferred until retirement, disability, or death.
(5) Represents the aggregate balance of non-qualified deferred compensation as of August 31, 2024. Amounts vary by Named Executive Officer in accordance with individual pension plan provisions and voluntary employee deferrals and withdrawals over time. To the extent that an executive was an NEO for a reported year, these amounts, other than the portion attributable to earnings, were disclosed as compensation in the year of the NEO’s deferral or registrant’s contribution, as applicable.
For a discussion of the material terms and conditions of the Deferred Compensation Plan, see "Compensation Discussion and Analysis" above.
Post Employment
Pursuant to the terms of his Employment Agreement, Mr. Debertin, our President and CEO, is entitled to severance in the event that his employment is terminated by us without cause or by him with "good reason." Specifically, severance under the Employment Agreement would consist of:
•The annual incentive compensation Mr. Debertin would have been entitled to receive for the year in which his termination occurred as if he had continued until the end of that fiscal year, determined based on our actual performance for that fiscal year relative to the performance goals applicable to Mr. Debertin (with that portion of the annual incentive compensation based on completion or partial completion of previously specified personal goals equal to 30% of the target annual incentive), prorated for the number of days in the fiscal year through Mr. Debertin’s termination date and generally payable in a cash lump sum at the time that incentive awards are payable to other participants;
•Two times Mr. Debertin's base salary plus two times his target annual incentive compensation, payable in three equal installments with the first installment payable 60 days following termination and the second and third installments payable on the first and second anniversary dates of termination, respectively; and
•Health and welfare benefits continuation for two years following termination.
The Nelligan Letter Agreement provides for severance in the event Ms. Nelligan's employment is terminated by us without cause or by her with "good reason" in the amount of one year of base pay and prorated annual variable pay, payable as a lump sum.
The Smith Letter Agreement provides for severance in the event Mr. Smith's employment is terminated by us without cause or by him with "good reason" in the amount of one year of base pay and prorated annual variable pay, payable as a lump sum.
During fiscal 2024, Mr. Hunhoff and Mr. Griffith were covered by a broad-based employee severance program that provides executives with a lump sum payment of 26 weeks of pay, plus one week of pay per year of service, with a 12-month cap, in the event their positions are eliminated.
The severance pay that the Named Executive Officers would have been entitled to in the specific events noted above, in each case, as of the last business day of fiscal 2024 is as follows:
| | | | | | | | |
| Name | Position | Severance Pay Amount |
| | (Dollars) |
Jay Debertin (1)(2) | President and Chief Executive Officer | $ | 7,306,448 | |
Olivia Nelligan (3) | Executive Vice President, Chief Financial Officer and Chief Strategy Officer | 1,489,950 | |
Brandon Smith (3) | Executive Vice President, General Counsel | 1,358,738 | |
| Darin Hunhoff | Executive Vice President, Energy | 592,440 | |
| John Griffith | Executive Vice President, Ag Business and CHS Hedging | 444,000 | |
(1) Includes the value of health and welfare benefits based on current monthly rates.
(2) For purposes of calculating the prorated portion of Mr. Debertin's unpaid annual variable pay award for the fiscal year in which the termination occurred, assumes an annual variable pay award at target performance for the entire fiscal year.
(3) Assumes an annual variable pay award at target performance for the entire fiscal year.
There are no other severance benefits offered to our Named Executive Officers, except for up to 12 months of career transition services and government mandated benefits such as COBRA. Except as otherwise set forth above, the method of payment would be a lump sum. Named Executive Officers not covered by employment agreements are not offered any special postretirement health and welfare benefits that are not offered to other similarly situated (i.e., age and service) salaried employees. The compensation payable to the Named Executive Officers is subject to the Recovery Policy and the Detrimental Conduct Policy, as applicable.
CEO Pay Ratio
The following pay ratio and supporting information compares the annual total compensation of our CEO to our median employee, as required by Section 953(b) of the Dodd-Frank Wall Street Reform and Consumer Protection Act. The pay ratio is a reasonable estimate calculated in a manner consistent with Item 402(u) of Regulation S-K promulgated by the SEC. For fiscal 2024:
•The median employee's compensation, calculated in accordance with the requirements of Item 402(c)(2)(x) of Regulation S-K promulgated by the SEC, was $86,345. This calculation includes a reasonable assumption regarding the median employee's achievement of individual performance goals for a portion of the annual incentive award based on historical performance.
•The annual total compensation of our CEO, as reported in the Summary Compensation Table set forth above, was $15,775,064.
•The ratio of the annual total compensation of our CEO to the median employee was 183:1.
A new median employee was selected for 2024. We identified our median employee as of June 1, 2024 by analyzing the regular, bonus and overtime wages (or their equivalents) paid in the prior 12 months for the entire employee population excluding the CEO and certain international employees as permitted by the SEC de minimus exclusion rule (details below). We changed to this process of using the entire population instead of using a statistical sampling methodology because we believe it is a more accurate approach to identifying the median employee.
As of June 1, 2024, our employee population consisted of approximately 10,662 individuals, 9,872 of whom were located in the United States and 790 of whom were located outside of the United States. This population consisted of our full-time, part-time, temporary and seasonal employees. From this population, we excluded 363 individuals who were located in the following countries: Argentina (49), Bulgaria (5), Canada (5), China (32), Hungary (18), Italy (5), Mexico (3), Romania (122), Serbia (6), Singapore (18), South Korea (3), Spain (34), Switzerland (19), Taiwan (3), Ukraine (28) and Uruguay (13). Excluding these employees, our employee population that was used to determine the median employee consisted of 10,299 individuals.
In adopting the pay ratio rule, the SEC expressly sought to provide flexibility to each company to determine the methodology that best suits its own facts and circumstances. Our pay ratio should not be compared to other companies' pay ratios, because it is based on a methodology specific to us, and certain material assumptions, adjustments and estimates have been made in the calculation of the ratio.
Director Compensation
Overview
Our Board of Directors met seven times during the fiscal year ended August 31, 2024. Each director (other than the chair of the Board) is a member of two Board committees. At a minimum, each Board committee meets during each of the Board's five regular meetings. For fiscal 2024, each non-employee director was provided compensation as follows:
•a monthly retainer equivalent to $93,700 per year from September 1, 2023, through December 31, 2023, and equivalent to $98,500 per year from January 1, 2024, through August 31, 2024, paid in 12 monthly payments;
•actual expenses and a travel allowance;
•additional annual compensation, as applicable, for board leadership, including $24,000 for the chair of the Board, $9,000 for the first vice chair and the secretary-treasurer, $9,000 for all Board committee chairs, and $6,000 for members of the Executive Committee who are not eligible for other premiums;
•a per diem meeting fee of $500 plus actual expenses and travel allowance for each day spent at meetings other than regular Board meetings and the CHS Annual Meeting; and
•a meeting fee of $250 for conference calls or other short virtual meetings other than regular Board meetings.
The number of days spent at meetings other than regular Board meetings and the CHS Annual Meeting may not exceed 55 days annually for purposes of the per diem meeting fee, except that the chair of the Board is exempt from this limit. There is no cap on meeting fees permitted for conference calls or other short virtual meetings.
The non-employee director compensation package was determined based on the market analysis of director compensation conducted for the Governance Committee by Mercer (U.S.), a global compensation consulting firm, in fiscal 2019. Each year thereafter, market updates have been provided by Mercer, and annual adjustments have been considered. Effective as of January 1, 2024, our Board of Directors approved increasing annual director compensation from $93,700 to $98,500, increasing the first vice chair and secretary-treasurer additional annual compensation from $6,000 to $9,000 and increasing the additional annual compensation for members of the Executive Committee who are not eligible for other premiums from $3,000 to $6,000.
Further, directors are eligible to participate in the Deferred Compensation Plan. Other than direct contributions, contributions to a retirement plan account in the Deferred Compensation Plan are made based on our three-year ROIC performance, with ROIC defined in the same manner as for the ELTIP. Driven by our unique cooperative structure, we believe that using the ROIC performance metric for this purpose aligns the interests of our directors with the interests of our management and member-owners. The ROIC performance goal levels are established and approved by our Board of Directors prior to each three-year performance period. Deferred Compensation Plan credits are based on ROIC performance results, as detailed on the following pages.
The amounts paid to our Board of Directors are subject to the Recovery Policy.
Director Retirement and Health Care Benefits
Members of our Board of Directors were eligible for certain retirement and health care benefits in fiscal 2024 based on their election date.
Directors elected prior to September 1, 2011 participate in a defined benefit retirement plan that provides for a monthly benefit for the director's lifetime, beginning at age 60. Benefits are immediately vested, and the monthly benefit is determined according to the following formula: $250 times years of service on the Board (up to a maximum of 15 years). Under no event will the benefit payment be payable for less than 120 months. Payment is made to the retired director's beneficiary in the event of the director's death before 120 payments are made. Effective August 31, 2011, future accruals under the director retirement plan were frozen. Retirement benefits are funded by a rabbi trust, with a balance of $7.2 million as of August 31, 2024.
Directors and their eligible dependents were eligible to participate in our medical, dental and vision plans in fiscal 2024. We paid 100% of the premium for each director and their eligible dependents while the director was actively serving on
the Board. Directors who departed the Board before September 1, 2024 and prior to Medicare eligibility were eligible to continue participation in our medical plan, along with their eligible dependents, with premiums paid up to 100% by CHS depending on the director's years of service to the Board.
Director Deferred Compensation Plan
Directors are eligible to participate in the Deferred Compensation Plan. Each participating director may elect to defer up to 100% of his or her monthly director fees into the Deferred Compensation Plan. This must be done prior to the beginning of the calendar year in which the fees will be earned, or in the case of newly elected directors, upon election to the Board. During fiscal 2024, the following directors deferred Board fees pursuant to the Deferred Compensation Plan: Mr. Beckman, Mr. Clemensen, Mr. Erickson, Mr. Fritel, Mr. Johnsrud, Mr. Kehl, Mr. Meyer and Mr. Throener.
In addition to any voluntary director deferrals, the company may also credit a retirement contribution to each director's Deferred Compensation Plan. The fiscal 2024 credit to each director's retirement plan account was based on the following ROIC performance goals for fiscal years 2022-2024:
| | | | | | | | |
| Performance Level | Amount Credited* | CHS Three-Year ROIC Goal |
| Superior Maximum | $100,000 | 9.7% |
| Maximum | $50,000 | 7.7% |
| Target | $25,000 | 6.7% |
*The amount credited for the fiscal 2022-2024 performance period was required to be mathematically interpolated when results occurred between the superior performance, maximum and target ROIC performance levels. If results had been less than the target ROIC performance level, the amount credited would have been $25,000.
Actual ROIC performance for the fiscal 2022-2024 performance period was 13.9% and, accordingly, $100,000 was credited for fiscal 2024 to each director's retirement plan account under the Deferred Compensation Plan, except $66,667 was credited for newly elected director Mr. Rossman and $8,333 was credited for former director Mr. Meyer. This amount is reflected in the Director Compensation table.
Upon leaving our Board of Directors during fiscal 2024, a director's credit for that partial fiscal year is the target amount ($25,000) prorated through the end of the month in which the director departs. Directors who joined our Board of Directors during fiscal 2024 received credit for that partial fiscal year based on the actual ROIC performance for the performance period ending in fiscal 2024, prorated from the first of the month following the month in which the director joined our Board of Directors to the end of the fiscal year.
Benefits are funded in a rabbi trust. The Deferred Compensation Plan rabbi trust balance reported elsewhere in this Annual Report on Form 10-K includes amounts deferred by the directors.
2024 Director Compensation
| | | | | | | | | | | | | | |
| Name | Fees Earned or Paid in Cash (1) | Change in Pension Value and Nonqualified Deferred Compensation Earnings (2) | All Other Compensation (3) | Total |
| (Dollars) |
| David Beckman | $125,275 | $— | $120,220 | $245,495 |
| Clinton J. Blew | 143,900 | 2,198 | 129,659 | 275,757 |
| Hal Clemensen | 135,150 | — | 120,653 | 255,803 |
| Scott Cordes | 128,150 | — | 100,670 | 228,820 |
| Jon Erickson | 109,150 | — | 120,557 | 229,707 |
| Mark Farrell | 115,150 | — | 101,419 | 216,569 |
| Steve Fritel | 131,150 | 1,988 | 120,459 | 253,597 |
| Alan Holm | 127,400 | — | 120,630 | 248,030 |
| David Johnsrud | 123,400 | — | 117,692 | 241,092 |
| Tracy Jones | 127,900 | — | 126,547 | 254,447 |
| David Kayser | 113,650 | 2,473 | 129,869 | 245,992 |
| Russell Kehl | 136,150 | — | 127,875 | 264,025 |
| Perry Meyer | 36,733 | — | 15,129 | 51,862 |
| Anthony Rossman | 93,975 | — | 86,725 | 180,700 |
| Daniel Schurr | 149,900 | 17,699 | 122,721 | 290,320 |
| Jerrad Stroh | 126,400 | — | 130,201 | 256,601 |
| Kevin Throener | 129,650 | — | 129,879 | 259,529 |
| Cortney Wagner | 125,733 | — | 100,399 | 226,132 |
(1) Of this amount, the following directors deferred the succeeding amounts to the Deferred Compensation Plan: Mr. Beckman, $13,000; Mr. Clemensen, $16,000; Mr. Erickson, $8,000; Mr. Fritel, $70,200; Mr. Johnsrud, $24,000; Mr. Kehl, $28,000; Mr. Meyer, $4,000; and Mr. Throener, $10,000.
(2) This column represents both changes in pension value and above-market earnings on deferred compensation. Change in pension value is the aggregate change in the actuarial present value of the director's benefit under his retirement program, and nonqualified earnings, if applicable. The change in pension value will vary by director based on several factors including age, service, pension benefit elected (lump sum or annuity), discount rate and mortality factor used to calculate the benefit due. Future accruals under the plan were frozen as of August 31, 2011, as stated above. The following directors had the following changes in pension values during fiscal 2024: Mr. Blew, $2,198; Mr. Fritel, $1,988; Mr. Kayser, $2,473; and Mr. Schurr, $17,699.
Above-market earnings represent earnings exceeding 120% of the Federal Reserve long-term rate on applicable funds as determined by the IRS. No directors had above-market earnings during fiscal 2024.
(3) All other compensation includes health insurance premiums, travel accident insurance and related companion travel expenses for trips made with a director on CHS business. Total amounts vary primarily due to the variations in health insurance premiums, which are due to the number of dependents covered. The health insurance premiums paid were less than $25,000 for each director, other than Mr. Blew, Mr. Jones, Mr. Kayser, Mr. Kehl, Mr. Stroh and Mr. Throener, for whom we paid health insurance premiums of $29,260, $26,148, $29,260, $27,476, $29,260 and $29,260, respectively.
All other compensation also includes fiscal 2024 director retirement plan Deferred Compensation Plan contributions of $100,000 for each director, except for newly elected director Mr. Rossman, $66,667; and for former director, Mr. Meyer, $8,333.
Compensation Committee Interlocks and Insider Participation
Our Board of Directors does not have a compensation committee. The Executive Committee performs the equivalent functions of a compensation committee with respect to our CEO, and the Governance Committee performs the equivalent functions of a compensation committee, other than with respect to our CEO.
During fiscal 2024, the members of the Executive Committee were Messrs. Schurr (chair), Blew (first vice chair), Cordes (second vice chair), Holm and Kehl, and the members of the Governance Committee were Mr. Jones (chair), Mr. Kehl (vice chair), and Messrs. Blew, Cordes, Farrell and Kayser. During fiscal 2024, no executive officer of CHS served on the compensation committee (or other board committee performing equivalent functions) or board of directors of any other entity
that had any executive officer who also served on the Executive Committee, the Governance Committee or our Board of Directors. None of the directors who served as a member of the Executive Committee or Governance Committee during fiscal 2024 are, or have been, officers or employees of CHS, other than Mr. Cordes, who was an employee of CHS Hedging until 2016.
See Item 13, Certain Relationships and Related Transactions, and Director Independence, of this Annual Report on Form 10-K for directors, including Messrs. Cordes, Clemensen, Erickson, Fritel, Johnsrud, Jones, Kayser, Kehl, Rossman, Throener and Schurr who were a party to related-person transactions.
Compensation Committee Report
The Executive Committee (the committee of our Board of Directors that performs the equivalent functions of a compensation committee with respect to our CEO) and the Governance Committee (the committee of our Board of Directors that performs the equivalent functions of a compensation committee, other than with respect to our CEO) have each reviewed and discussed the Compensation Discussion and Analysis required by Item 402(b) of Regulation S-K promulgated by the SEC with management and, based on such review and discussions, the Executive Committee and the Governance Committee each recommended to our Board of Directors that the Compensation Discussion and Analysis be included in this Annual Report on Form 10-K.
Respectfully submitted,
Executive Committee
Daniel Schurr, Chair
Clinton J. Blew
Scott Cordes
Alan Holm
Russell Kehl
Governance Committee
Tracy Jones, Chair
Clinton J. Blew
Scott Cordes
Mark Farrell
David Kayser
Russell Kehl
ITEM 12. SECURITY OWNERSHIP OF CERTAIN BENEFICIAL OWNERS AND MANAGEMENT AND RELATED STOCKHOLDER MATTERS
Beneficial ownership of our equity securities by each member of our Board of Directors, each of our Named Executive Officers and all members of our Board of Directors and executive officers as a group as of October 16, 2024, is shown below. Except as indicated in the footnotes to the following table, each person has sole voting and investment power with respect to all shares attributable to such person. | | | | | | | | | | | | | | | | | | | | | | | | | | |
| | Title of Class |
| | 8% Cumulative Redeemable
Preferred Stock | | Class B Cumulative Redeemable Preferred Stock |
| Name of Beneficial Owner | | Amount of
Beneficial Ownership | | % of Class (1) | | Amount of
Beneficial Ownership | | % of Class (2) |
| Directors: | | (Shares) | | | | (Shares) | | |
| David Beckman | | — | | | * | | — | | | * |
| Clinton J. Blew | | — | | | * | | — | | | * |
| Hal Clemensen | | — | | | * | | — | | | * |
Scott Cordes (3) | | — | | | * | | 14,850 | | | * |
| Jon Erickson | | — | | | * | | — | | | * |
| Mark Farrell | | 3,000 | | | * | | — | | | * |
| Steven Fritel | | — | | | * | | — | | | * |
| Alan Holm | | — | | | * | | — | | | * |
| David Johnsrud | | — | | | * | | 1,650 | | | * |
| Tracy Jones | | — | | | * | | — | | | * |
| David Kayser | | — | | | * | | 630 | | | * |
| Russell Kehl | | — | | | * | | — | | | * |
| Anthony Rossman | | — | | | * | | — | | | * |
| Daniel Schurr | | — | | | * | | — | | | * |
| Jerrad Stroh | | — | | | * | | — | | | * |
| Kevin Throener | | — | | | * | | — | | | * |
| Cortney Wagner | | — | | | * | | — | | | * |
| Named Executive Officers: | | | | | | | | |
Jay Debertin (3) | | 1,200 | | | * | | — | | | * |
| John Griffith | | — | | | * | | — | | | * |
| Darin Hunhoff | | 676 | | | * | | — | | | * |
| Olivia Nelligan | | — | | | * | | — | | | * |
| Brandon Smith | | — | | | * | | — | | | * |
| All other executive officers | | — | | | * | | — | | | * |
| Directors and executive officers as a group | | 4,876 | | | * | | 17,130 | | | * |
*Less than 1%.
(1) As of October 16, 2024, there were 12,272,003 shares of 8% Cumulative Redeemable Preferred Stock outstanding.
(2) As of October 16, 2024, there were 78,659,066 shares of Class B Cumulative Redeemable Preferred Stock outstanding with 21,459,066, 16,800,000, 19,700,000 and 20,700,000 attributed to Series 1, Series 2, Series 3 and Series 4, respectively.
(3) Includes shares held by spouse, children and Individual Retirement Accounts.
We have no compensation plans under which our equity securities are authorized for issuance.
To our knowledge, there is no person or group who is a beneficial owner of more than 5% of any class or series of our preferred stock.
ITEM 13. CERTAIN RELATIONSHIPS AND RELATED TRANSACTIONS, AND DIRECTOR INDEPENDENCE
Because our directors must be active patrons of CHS or of an affiliated association, transactions between us and our directors are customary and expected. Transactions include the sales of commodities to us and the purchases of products and services from us, as well as patronage refunds and equity redemptions received from us. During the year ended August 31, 2024, the value of those transactions between a particular director (and any immediate family member of a director, which includes any child, stepchild, parent, stepparent, spouse, sibling, mother-in-law, father-in-law, son-in-law, daughter-in-law, brother-in-law or sister-in-law and any person (other than a tenant or employee) sharing the household of such director) and us in which the total amount involved exceeded $120,000 is shown below. | | | | | | | | | | | | | | |
| | Transaction Type |
| Name | | Transactions with CHS | | Cash Patronage Dividends |
| | (Dollars) |
| Scott Cordes | | $ | 618,611 | | | $ | 1,036 | |
| Jon Erickson | | 422,186 | | | 5,083 | |
| David Johnsrud | | 3,089,318 | | | 24,125 | |
| Tracy Jones | | 3,774,558 | | | 35,748 | |
| David Kayser | | 1,148,643 | | | 8,314 | |
| Russell Kehl | | 9,598,957 | | | 33,919 | |
| Perry Meyer | | 588,041 | | | 2,334 | |
| Anthony Rossman | | 1,746,701 | | | 23,521 | |
| Kevin Throener | | 2,150,121 | | | 17,369 | |
Clemensen Farms, Inc., which is owned by our director Hal Clemensen, entered into two crop input loans with CHS Capital in November 2022 ("2022 Clemensen Loans") and one crop input loan in November 2023 ("2023 Clemensen Loan"). The 2022 Clemensen Loans have an interest rate of 0% per annum, and mature in February 2025. The 2023 Clemensen Loan has an interest rate of 0% per annum and matures in February 2025. The largest aggregate amount of principal outstanding under the 2022 Clemensen Loans during the year ended August 31, 2024, was $148,902, and the balance on August 31, 2024, was $109,147. The largest aggregate amount of principal outstanding under the 2023 Clemensen Loan during the year ended August 31, 2024, and the balance outstanding on August 31, 2024, was $57,256. During the year ended August 31, 2024, no principal or interest was paid on the 2022 Clemensen Loans or the 2023 Clemensen Loan.
Jones Farm Partnership, which is owned by our director Tracy Jones, entered into three 2024 crop inputs loans with CHS Capital in January 2024 ("Jones Loans"). The Jones Loans accrue interest at the rates of 5.0%, 1.9% and 0% per annum, payable upon maturity in January 2025. The largest aggregate amount of principal outstanding under the Jones Loans during the year ended August 31, 2024, and the balance on August 31, 2024 was $804,852. During the year ended August 31, 2024, no principal or interest was paid on the Jones Loans.
Our director David Kayser entered into a crop input loan with CHS Capital in December 2021 with a maturity date of January 2025 ("Kayser Loan"). The Kayser Loan accrues interest at the rate of 1.9% per annum, payable upon maturity. The largest aggregate amount of principal outstanding under the Kayser Loan during the year ended August 31, 2024 and the balance on August 31, 2024, was $140,000. During the year ended August 31, 2024, no principal or interest was paid on the Kayser Loan.
Kehl Farms, LLC, which is owned by our director Russell Kehl, entered into three 2024 crop inputs loans with CHS Capital in April 2024 with a maturity date of March 2025 ("Kehl Loans"). The Kehl Loans accrue interest at the rates of 11.4%, 5.0% and 1.9% per annum. During the year ended August 31, 2024, $1,425 in interest was paid on the Kehl Loans. The largest aggregate amount of principal outstanding under the Kehl Loans during the year ended August 31, 2024, and the balance on August 31, 2024, was $6,848,732.
In December 2021, our director Kevin Throener entered into two crop inputs loans with CHS Capital with a maturity date in December 2024 ("Throener Loans"). The Throener Loans accrue interest at the rates of 1.9% per annum. The largest aggregate amount of principal outstanding under the Throener Loan during the year ended August 31, 2024, and the balance on August 31, 2024, was $250,000. During the year ended August 31, 2024, no principal or interest was paid on the Throener Loans.
The terms of these financing arrangements were provided pursuant to financing programs widely available to our qualified customers.
Our wholly-owned subsidiary, CHS Hedging, LLC, is a clearing broker, and from time to time our directors and their affiliates may place orders and clear trades with CHS Hedging in the ordinary course of business. CHS Hedging handles such trades on substantially the same terms and conditions as other similarly situated individuals who are not directors.
Review, Approval or Ratification of Related Party Transactions
Pursuant to its amended and restated charter, our Audit Committee has responsibility for review and approval of all transactions between CHS and any related parties or affiliates of CHS, including its officers and directors, other than transactions in the ordinary course of business and on market terms.
Related persons include any of our directors or executive officers and any of their immediate family members, as defined by the SEC. In evaluating related person transactions, the committee members apply the same standards they apply to their general responsibilities as members of the Audit Committee. The committee will approve a related person transaction when, in its good faith judgment, the transaction is in the best interest of CHS. To identify related person transactions, each year we require our directors and officers to complete a questionnaire identifying any transactions with CHS in which the officers or directors or their immediate family members have an interest. We also review our business records to identify potentially qualifying transactions between a related party and us. In addition, we have a written policy addressing related persons (included in our Code of Conduct) that describes our expectation that all directors, officers and employees who may have a potential or apparent conflict of interest will notify our legal department of any such transactions.
Director Independence
We are a Minnesota cooperative corporation managed by a Board of Directors made up of 17 members. Nomination and election of the directors is done by eight separate regions. In addition to meeting other requirements for directorship, candidates must reside in the region from which they are elected. Directors are elected for three-year terms. The terms of directors are staggered and no more than seven director positions are elected at an annual meeting of members. Nominations for director elections are made by the voting members at each regional caucus held during our annual meeting of members. Neither the Board of Directors nor management of CHS participates in the nomination process. Accordingly, we have no nominating committee.
The following directors satisfy the definition of director independence set forth in the rules of The Nasdaq: | | | | | | | | |
| Independent Directors |
| David Beckman | Steve Fritel | Daniel Schurr |
| Clinton J. Blew | Alan Holm | Jerrad Stroh |
| Hal Clemensen | David Kayser | Kevin Throener |
| Jon Erickson | Russell Kehl | Cortney Wagner |
| Mark Farrell | Anthony Rossman | |
Further, although we do not need to rely upon an exemption for the Board of Directors as a whole, we are exempt pursuant to The Nasdaq rules from The Nasdaq director independence requirements as they relate to the makeup of the Board of Directors as a whole and the makeup of the committee performing the functions of a compensation committee. The Nasdaq exemption applies to cooperatives that are structured to comply with relevant state law and federal tax law and that do not have a publicly traded class of common stock. All of the members of our Audit Committee are independent. All of the members of our Governance Committee and Executive Committee (the committees of our Board of Directors that perform the equivalent functions of a compensation committee) are independent other than Mr. Cordes and Mr. Jones.
Independence of CEO and Board Chair Positions
Our bylaws prohibit any employee of CHS from serving on the Board of Directors. Accordingly, our CEO may not serve as chair of the Board or in any CHS Board capacity. We believe this leadership structure creates independence between the Board and management and is an important feature of appropriate checks and balances in the governance of CHS.
Board of Directors' Role in Risk Oversight
It is senior management's responsibility to identify, assess and manage our exposures to risk. Our Board of Directors plays an important and significant role in overseeing the overall risk management approach, including the review and, where appropriate, approval of guidelines and policies that govern our risk management process. Our management and Board of Directors have jointly identified multiple broad categories of risk exposure, each of which could impact operations and affect results at an enterprise level. Each such significant enterprise level risk is reviewed periodically by management with the Board of Directors and/or a committee of the Board as appropriate. The review includes an analysis by management of the continued applicability of the risk, our performance in managing or mitigating the risk, and possible additional or emerging risks to consider. As additional areas of risk are identified, our Board of Directors and/or a committee of the Board provide a review and oversight of management's actions to identify, assess and manage that risk. We continue to develop a formal enterprise risk management program intended to support integration of the risk assessment and management discipline and controls into major decision-making and business processes. The Corporate Risk Committee is involved in reviewing and approving the enterprise risk management framework and is responsible for overseeing its effectiveness on an ongoing basis. When appropriate, the Corporate Risk Committee meets jointly with the Audit Committee to discuss common financial or other risks across CHS that may have potential material impact to our financial statements.
ITEM 14. PRINCIPAL ACCOUNTANT FEES AND SERVICES
The following table shows the aggregate fees billed to us by PricewaterhouseCoopers LLP for services rendered during the years ended August 31, 2024 and 2023: | | | | | | | | | | | |
| 2024 | | 2023 |
| (Dollars in thousands) |
Audit fees (1) | $ | 5,370 | | | $ | 5,270 | |
Audit-related fees (2) | 86 | | | 57 | |
Tax fees (3) | 544 | | | 1,137 | |
All other fees (4) | 2 | | | 5 | |
| Total | $ | 6,002 | | | $ | 6,469 | |
(1) Includes fees for audit of annual financial statements and reviews of the related quarterly financial statements and certain statutory audits.
(2) Includes fees for employee benefit plan audits, due diligence on acquisitions and internal control and system audit procedures.
(3) Includes fees related to tax compliance, tax advice and tax planning.
(4) Includes fees related to other professional services performed.
In accordance with the CHS Inc. Audit Committee Charter, as amended, our Audit Committee adopted the following policies and procedures for the approval of the engagement of an independent registered public accounting firm for audit, review or attest services and for preapproval of certain permissible nonaudit services, all to ensure auditor independence.
Our independent registered public accounting firm will provide audit, review and attest services only at the direction of, and pursuant to engagement fees and terms approved by our Audit Committee. Our Audit Committee approves in advance all nonaudit services to be performed by the independent auditors and the fees and compensation to be paid to the independent auditors. Our Audit Committee approved 100% of the services listed above in advance.
PART IV
ITEM 15. EXHIBIT AND FINANCIAL STATEMENT SCHEDULES
(a)(1) FINANCIAL STATEMENTS
The following financial statements are filed as part of this Annual Report on Form 10-K.
(a)(2) FINANCIAL STATEMENT SCHEDULES
SCHEDULE II — VALUATION AND QUALIFYING ACCOUNTS AND RESERVES | | | | | | | | | | | | | | | | | | | | | | | | | | |
| | Balance at
Beginning
of Year | | Additions:
Charged to Costs
and Expenses* | | Deductions:
Write-offs, Net
of Recoveries | | Balance at
End
of Year |
| | | (Dollars in thousands) |
| Allowances for doubtful accounts | | | | | | | | |
| 2024 | | $ | 76,627 | | | $ | 8,359 | | | $ | (5,177) | | | $ | 79,809 | |
| 2023 | | 127,917 | | | 2,348 | | | (53,638) | | | 76,627 | |
| 2022 | | 143,722 | | | 25,289 | | | (41,094) | | | 127,917 | |
| | | | | | | | |
| Valuation allowance for deferred tax assets | | | | | | | | |
| 2024 | | $ | 182,466 | | | $ | 6,745 | | | $ | (22,621) | | | $ | 166,590 | |
| 2023 | | 189,685 | | | 9,705 | | | (16,924) | | | 182,466 | |
| 2022 | | 208,810 | | | 18,341 | | | (37,466) | | | 189,685 | |
*Net of reserve adjustments.
(a)(3) EXHIBITS
EXHIBIT INDEX | | | | | |
| 2.1 | |
| 3.1 | |
| 3.2 | |
| 4.1 | |
| 4.2 | |
| 4.3 | |
| 4.4 | |
| 4.5 | |
| 4.6 | |
| 4.7 | |
| 4.8 | |
| 4.9 | |
| 4.10 | |
| 4.11 | |
| 4.12 | |
| 4.13 | |
| 4.14 | |
| 4.15 | |
| 10.1 | |
| 10.1A | |
| | | | | |
| 10.1B | |
| 10.1C | |
| 10.1D | |
| 10.2 | |
| 10.3 | |
| 10.4 | |
| 10.5 | |
| 10.5A | |
| 10.5B | |
| 10.6 | |
| 10.7 | |
| 10.7A | |
| 10.7B | |
| 10.7C | |
| 10.7D | |
| 10.7E | |
| 10.7F | |
| 10.8 | |
| 10.9 | |
| 10.10 | |
| 10.11 | Agreement Regarding Distribution of Assets, by and among CHS Inc., United Country Brands, LLC, Land O'Lakes, Inc. and Winfield Solutions, LLC, made as of September 4, 2007. (Incorporated by reference to our Form 10-K for the year ended August 31, 2007, filed November 20, 2007). |
| 10.12 | |
| 10.12A | |
| 10.12B | |
| | | | | |
| 10.12C | |
| 10.12D | |
| 10.12E | |
| 10.12F | |
| 10.13 | |
| 10.13A | |
| 10.14 | |
| 10.14A | |
| 10.15 | |
| 10.15A | |
| 10.15B | |
| 10.15C | |
| 10.15D | |
| 10.15E | |
| 10.16 | |
| 10.17 | |
| 10.18 | 2023 Third Amended and Restated Credit Agreement (5-Year Revolving Loan), dated as of April 21, 2023, by and between CHS Inc., CoBank, ACB, for its own benefit as a lender and as the administrative agent and the bid agent for the benefit of the present and future lenders, Sumitomo Mitsui Banking Corporation, for its own benefit as a lender and as the syndication agent, and the other lenders thereto. (Incorporated by reference to our Current Report on Form 8-K, filed April 25, 2023). |
| 10.19 | 2019 Amended and Restated Credit Agreement (5-Year Revolving Loan), dated as of July 16, 2019, by and between CHS Inc., CoBank, ACB, for its own benefit as a syndication party and as the administrative agent for the benefit of the present and future syndication parties, Coöperatieve Rabobank U.A., New York Branch and Sumitomo Mitsui Banking Corporation, for their own benefit as syndication parties and as syndication agents, and the other syndication parties party thereto. (Incorporated by reference to our Current Report on Form 8-K, filed July 19, 2019). |
| 10.20 | |
| | | | | |
| 10.20A | Amendment No. 1 to 2015 Credit Agreement (10-Year Term Loan), dated as of June 30, 2016, by and between CHS Inc., CoBank, ACB, as a syndication party and as the administrative agent for the benefit of all present and future syndication parties, and the other syndication parties thereto. (Incorporated by reference to our Form 10-Q for the quarterly period ended May 31, 2016, filed July 7, 2016). |
| 10.20B | |
| 10.20C | |
| 10.20D | |
| 10.20E | |
| 10.21 | |
| 10.22 | |
| 10.23 | |
| 10.24 | |
| 10.25 | |
| 10.25A | Omnibus Amendment No. 1, dated as of February 14, 2017, by and among Cofina Funding, LLC, as seller, CHS Inc., as servicer and as an originator, CHS Capital, LLC, as an originator, the conduit purchasers, committed purchasers and purchaser agents set forth on the signature pages thereto, the Bank of Tokyo-Mitsubishi UFJ, Ltd., New York Branch, as administrative agent, and U.S. Bank National Association, as custodian. (Incorporated by reference to our Current Report on 8-K, filed February 15, 2017). |
| 10.25B | Omnibus Amendment No. 2, dated as of July 18, 2017, by and among Cofina Funding, LLC, as seller, CHS Inc., as servicer and as an originator, CHS Capital, LLC, as an originator, the conduit purchasers, committed purchasers and purchaser agents set forth on the signature pages thereto, the Bank of Tokyo-Mitsubishi UFJ, Ltd., New York Branch, as administrative agent, and U.S. Bank National Association, as custodian. (Incorporated by reference to our Form 10-K for the year ended August 31, 2017, filed November 9, 2017). |
| 10.25C | Omnibus Amendment No. 3, dated as of September 4, 2018, by and among Cofina Funding, LLC, as seller, CHS Inc., as servicer and as an originator, CHS Capital, LLC, as an originator, the conduit purchasers, committed purchasers and purchaser agents set forth on the signature pages thereto, the Bank of Tokyo-Mitsubishi UFJ, Ltd., New York Branch, as administrative agent, and U.S. Bank National Association, as custodian. (Incorporated by reference to our Form 10-K for the year ended August 31, 2018, filed December 3, 2018). |
| 10.25D | Omnibus Amendment No. 5, dated as of June 27, 2019, by and among Cofina Funding, LLC, as seller, CHS Inc., as servicer and as an originator, CHS Capital, LLC, as an originator, PNC Bank, National Association, as an alternate purchaser and as a purchaser agent, each of the other conduit purchasers, committed purchasers and purchaser agents set forth on the signature pages thereto and MUFG Bank Ltd. f/k/a The Bank of Tokyo-Mitsubishi UFJ, Ltd., New York Branch, as administrative agent. (Incorporated by reference to our Form 10-K for the year ended August 31, 2019, filed November 6, 2019). |
| 10.25E | Omnibus Amendment No. 6, dated as of May 1, 2020, by and among Cofina Funding, LLC, as seller, CHS Inc., as servicer and as an originator, CHS Capital, LLC, as an originator, each of the conduit purchasers, committed purchasers and purchaser agents set forth on the signature pages thereto and MUFG Bank Ltd. f/k/a The Bank of Tokyo-Mitsubishi UFJ, Ltd., New York Branch, as administrative agent. (Incorporated by reference to our Form 10-Q for the quarterly period ended May 31, 2020, filed July 7, 2020). |
| | | | | |
| 10.25F | Omnibus Amendment No. 7, dated as of June 26, 2020, by and among Cofina Funding, LLC, as seller, CHS Inc., as servicer and as an originator, CHS Capital, LLC, as an originator, each of the conduit purchasers, committed purchasers and purchaser agents set forth on the signature pages thereto and MUFG Bank Ltd. f/k/a The Bank of Tokyo-Mitsubishi UFJ, Ltd., New York Branch, as administrative agent. (Incorporated by reference to our Form 10-K for the year ended August 31, 2020, filed November 5, 2020). |
| 10.25G | Omnibus Amendment No. 8, dated as of September 24, 2020, by and among Cofina Funding, LLC, as seller, CHS Inc., as servicer and as an originator, CHS Capital, LLC, as an originator, each of the conduit purchasers, committed purchasers and purchaser agents set forth on the signature pages thereto and MUFG Bank Ltd. f/k/a The Bank of Tokyo-Mitsubishi UFJ, Ltd., New York Branch, as administrative agent. (Incorporated by reference to our Form 10-K for the year ended August 31, 2020, filed November 5, 2020). |
| 10.25H | Omnibus Amendment No. 9, dated as of July 30, 2021, by and among Cofina Funding, LLC, as seller, CHS Inc., as servicer and as an originator, CHS Capital, LLC, as an originator, each of the conduit purchasers, committed purchasers and purchaser agents set forth on the signature pages thereto and MUFG Bank Ltd. f/k/a The Bank of Tokyo-Mitsubishi UFJ, Ltd., New York Branch, as administrative agent. (Incorporated by reference to our Form 10-K for the year ended August 31, 2021, filed November 4, 2021). |
| 10.25I | Omnibus Amendment No. 10, dated as of August 31, 2021, by and among Cofina Funding, LLC, as seller, CHS Inc., as servicer and as an originator, CHS Capital, LLC, as an originator, each of the conduit purchasers, committed purchasers and purchaser agents set forth on the signature pages thereto and MUFG Bank Ltd. f/k/a The Bank of Tokyo-Mitsubishi UFJ, Ltd., New York Branch, as administrative agent. (Incorporated by reference to our Form 10-K for the year ended August 31, 2021, filed November 4, 2021). |
| 10.26 | Receivables Financing Agreement dated July 22, 2016, by and among CHS Inc., individually and as a Servicer, Cofina Funding, LLC, as Seller, Victory Receivables Corporation and Nieuw Amsterdam Receivables Corporation B.V., as Conduit Purchasers, Coöperatieve Rabobank U.A., as a Committed Purchaser, Coöperatieve Rabobank U.A., New York Branch, as Purchaser Agent, and the Bank of Tokyo-Mitsubishi UFJ, Ltd., New York Branch, as a Committed Purchaser, Purchaser Agent and as Administrative Agent. (Incorporated by reference to our Form 10-K for the year ended August 31, 2016, filed November 3, 2016). |
| 10.26A | Amended and Restated Receivables Purchase Agreement dated July 18, 2017, by and among CHS Inc., individually and as a Servicer, Cofina Funding, LLC, as Seller, Victory Receivables Corporation and Nieuw Amsterdam Receivables Corporation B.V., as Conduit Purchasers, Coöperatieve Rabobank U.A., as a Committed Purchaser, Coöperatieve Rabobank U.A., New York Branch, as Purchaser Agent, and the Bank of Tokyo-Mitsubishi UFJ, Ltd., New York Branch, as a Committed Purchaser, Purchaser Agent and as Administrative Agent. (Incorporated by reference to our Form 10-K for the year ended August 31, 2017, filed November 9, 2017). |
| 10.26B | First Amendment to Amended and Restated Receivables Purchase Agreement, dated as of June 28, 2018, by and among Cofina Funding, LLC, as Seller, CHS Inc., as Servicer, the Conduit Purchasers, Committed Purchasers and Purchaser Agents set forth on the signature pages thereto and MUFG Bank Ltd. (f/k/a The Bank of Tokyo-Mitsubishi UFJ, Ltd.), as Administrative Agent. (Incorporated by reference to our Current Report on Form 8-K, filed July 5, 2018). |
| 10.26C | Eleventh Amendment to Amended and Restated Receivables Purchase Agreement, dated as of August 30, 2022, by and among Cofina Funding, LLC, as seller, CHS Inc., as servicer and as an originator, CHS Capital, LLC, as an originator, each of the conduit purchasers, committed purchasers and purchaser agents set forth on the signature pages thereto and MUFG Bank Ltd. f/k/a The Bank of Tokyo-Mitsubishi UFJ, Ltd., New York Branch, as administrative agent. (Incorporated by reference to our Form 10-K for the year ended August 31, 2022, filed November 2, 2022). |
| 10.26D | Twelfth Amendment and Restated Receivables Purchase Agreement, dated as of July 11, 2023, by and among Cofina Funding, LLC, as seller, CHS Inc., as servicer and as originator, CHS Capital, LLC, as an originator, each of the conduit purchasers, committed purchasers and purchaser agents set forth on the signature pages thereto and MUFG Bank Ltd. f/k/a The Bank of Tokyo-Mitsubishi UFJ. Ltd., New York Branch, as administrative agent. (Incorporated by reference to our Form 10-Q for the quarterly report ended May 31, 2023, filed July 13, 2023). |
| 10.26E | Thirteenth Amendment and Restated Receivables Purchase Agreement, dated as of August 29, 2023, by and among Cofina Funding, LLC, as seller, CHS Inc., as servicer. (Incorporated by reference to our Form 10-K for the year ended August 31, 2023, filed November 8, 2023). |
| 10.26F | |
| 10.27 | |
| | | | | |
| 10.27A | Reaffirmation of Performance Guaranty dated July 18, 2017, by and among CHS Inc., individually and as a Servicer, Cofina Funding, LLC, as Seller, Victory Receivables Corporation and Nieuw Amsterdam Receivables Corporation B.V., as Conduit Purchasers, Coöperatieve Rabobank U.A., as a Committed Purchaser, Coöperatieve Rabobank U.A., New York Branch, as Purchaser Agent, and the Bank of Tokyo-Mitsubishi UFJ, Ltd., New York Branch, as a Committed Purchaser, Purchaser Agent and as Administrative Agent. (Incorporated by reference to our Form 10-K for the year ended August 31, 2017, filed November 9, 2017). |
| 10.28 | Master Framework Agreement, dated as of September 4, 2018 (the "Framework Agreement"), by and among MUFG Bank, Ltd. (f/k/a The Bank of Tokyo-Mitsubishi UFJ, Ltd.) and each other financial institution from time to time party thereto, as MFA Buyers, MUFG Bank, Ltd., as agent for the MFA Buyers, CHS Inc. and CHS Capital, LLC, as sellers, and CHS Inc., as agent for the sellers. (Incorporated by reference to our Form 10-K for the year ended August 31, 2018, filed December 3, 2018). |
| 10.28A | |
| 10.28B | |
| 10.28C | |
| 10.28D | |
| 10.28E | |
| 10.28F | |
| 10.29 | Master Framework Agreement, dated as of July 11, 2023 (the "Framework Agreement), by and among Coöperatieve Rabobank, U.A., New York Branch, a Dutch coöperatieve acting through its New York Branch, as buyer, CHS Inc. and CHS Capital, LLC, as sellers, and CHS Inc., as agent for the sellers. (Incorporated by reference to our Form 10-Q for the quarterly report ended May 31, 2023, filed July 13, 2023). |
| 10.29A | Amendment No. 1 to Master Framework Agreement, dated as of July 8, 2024 (the "Framework Agreement"), by and among Coöperatieve Rabobank, U.A., New York Branch, a Dutch coöperatieve acting through its New York Branch, as buyer, CHS Inc. and CHS Capital, LLC, as sellers, and CHS Inc., as agent for the sellers. (Incorporated by reference to our Form 10-Q for the quarterly period ended May 31, 2024, filed July 10, 2024). |
| 10.29B | Amendment No. 2 to Master Framework Agreement, dated as of August 28, 2024 (the "Framework Agreement"), by and among Coöperatieve Rabobank, U.A., New York Branch, a Dutch coöperatieve acting through its New York Branch, as buyer, CHS Inc. and CHS Capital, LLC, as sellers, and CHS Inc., as agent for the sellers. (*) |
| 10.30 | |
| 10.30A | |
| 10.31 | |
| 10.31A | Amendment No. 1 to 1996 SIFMA Master Repurchase Agreement, dated as of June 26, 2020, between CHS Capital, LLC, as seller, CHS Inc., as guarantor, and MUFG Bank Ltd., as buyer. (Incorporated by reference to our Form 10-K for the year ended August 31, 2020, filed November 5, 2020). |
| 10.32 | |
| 10.33 | |
| 10.34 | |
| 19.1 | |
| 21.1 | |
| 23.1 | |
| 24.1 | |
| 31.1 | |
| | | | | |
| 31.2 | |
| 32.1 | |
| 32.2 | |
| 97.1 | |
| 101.INS | XBRL Instance Document (the instance document does not appear in the Interactive Data File because its XBRL tags are embedded within the Inline XBRL document). |
| 101.SCH | XBRL Taxonomy Extension Schema Document. (*) |
| 101.CAL | XBRL Taxonomy Extension Calculation Linkbase Document. (*) |
| 101.DEF | XBRL Taxonomy Extension Definition Linkbase Document. (*) |
| 101.LAB | XBRL Taxonomy Extension Labels Linkbase Document. (*) |
| 101.PRE | XBRL Taxonomy Extension Presentation Linkbase Document. (*) |
| 104 | Cover Page Interactive Data File (formatted as Inline XBRL and contained in Exhibit 101). |
(*) Filed herewith.
(**) Portions of Exhibits 2.1 and 10.17 have been omitted pursuant to a confidential treatment order under the Exchange Act.
(+) Indicates management contract or compensatory plan or arrangement.
(b) EXHIBITS
The exhibits shown in Item 15(a)(3) of this Annual Report on Form 10-K are being filed herewith.
(c) SCHEDULES
None.
ITEM 16. FORM 10-K SUMMARY
None.
SIGNATURES
Pursuant to the requirements of Section 13 or 15(d) of the Securities Exchange Act of 1934, the registrant has duly caused this report to be signed on its behalf by the undersigned, thereunto duly authorized, on November 6, 2024.
CHS INC. | | | | | | | | |
| | By: | /s/ Jay D. Debertin |
| | Jay D. Debertin |
| | President and Chief Executive Officer |
Pursuant to the requirements of the Securities Exchange Act of 1934, this report has been signed below by the following persons on behalf of the registrant and in the capacities indicated on November 6, 2024: | | | | | | | | |
| Signature | | Title |
| | | |
| /s/ Jay D. Debertin | | President and Chief Executive Officer
(principal executive officer) |
| Jay D. Debertin | |
| | |
| /s/ Olivia Nelligan | | Executive Vice President, Chief Financial Officer and Chief Strategy Officer (principal financial officer) |
| Olivia Nelligan | |
| | |
| /s/ Daniel Lehmann | | Senior Vice President Finance, Corporate Controller
and Chief Accounting Officer
(principal accounting officer) |
| Daniel Lehmann | |
| | |
| * | | Chair of the Board of Directors |
| Daniel Schurr | |
| | |
| * | | Director |
| David Beckman | |
| | |
| * | | Director |
| Clinton J. Blew | |
| | |
| * | | Director |
| Hal Clemensen | |
| | |
| * | | Director |
| Scott A. Cordes | |
| | |
| * | | Director |
| Jon Erickson | |
| | |
| * | | Director |
| Mark Farrell | |
| | | |
| * | | Director |
| Steve Fritel | |
| | |
| * | | Director |
| Alan Holm | |
| | |
| | | | | | | | |
| * | | Director |
| David Johnsrud | |
| | |
| * | | Director |
| Tracy G. Jones | |
| | |
| * | | Director |
| David R. Kayser | |
| | |
| * | | Director |
| Russell A. Kehl | |
| | |
| * | | Director |
| Anthony Rossman | |
| | |
| * | | Director |
| Jerrad Stroh | |
| | |
| * | | Director |
| Kevin Throener | |
| | |
| * | | Director |
| Cortney Wagner | |
| | |
| | | | | | | | |
| *By | /s/ Jay D. Debertin | |
| Jay D. Debertin Attorney-in-fact | |
Report of Independent Registered Public Accounting Firm
To the Board of Directors and Shareholders of CHS Inc.
Opinion on the Financial Statements
We have audited the accompanying consolidated balance sheets of CHS Inc. and its subsidiaries (the "Company") as of August 31, 2024 and 2023, and the related consolidated statements of operations, of comprehensive income, of changes in equities and of cash flows for each of the three years in the period ended August 31, 2024, including the related notes and schedule of valuation and qualifying accounts and reserves for each of the three years in the period ended August 31, 2024, appearing under Item 15(a)(2) (collectively referred to as the "consolidated financial statements"). In our opinion, the consolidated financial statements present fairly, in all material respects, the financial position of the Company as of August 31, 2024 and 2023, and the results of its operations and its cash flows for each of the three years in the period ended August 31, 2024, in conformity with accounting principles generally accepted in the United States of America.
Basis for Opinion
These consolidated financial statements are the responsibility of the Company's management. Our responsibility is to express an opinion on the Company's consolidated financial statements based on our audits. We are a public accounting firm registered with the Public Company Accounting Oversight Board (United States) (PCAOB) and are required to be independent with respect to the Company in accordance with the U.S. federal securities laws and the applicable rules and regulations of the Securities and Exchange Commission and the PCAOB.
We conducted our audits of these consolidated financial statements in accordance with the standards of the PCAOB. Those standards require that we plan and perform the audits to obtain reasonable assurance about whether the consolidated financial statements are free of material misstatement, whether due to error or fraud. The Company is not required to have, nor were we engaged to perform, an audit of its internal control over financial reporting. As part of our audits we are required to obtain an understanding of internal control over financial reporting but not for the purpose of expressing an opinion on the effectiveness of the Company's internal control over financial reporting. Accordingly, we express no such opinion.
Our audits included performing procedures to assess the risks of material misstatement of the consolidated financial statements, whether due to error or fraud, and performing procedures that respond to those risks. Such procedures included examining, on a test basis, evidence regarding the amounts and disclosures in the consolidated financial statements. Our audits also included evaluating the accounting principles used and significant estimates made by management, as well as evaluating the overall presentation of the consolidated financial statements. We believe that our audits provide a reasonable basis for our opinion.
Critical Audit Matters
The critical audit matter communicated below is a matter arising from the current period audit of the consolidated financial statements that was communicated or required to be communicated to the audit committee and that (i) relates to accounts or disclosures that are material to the consolidated financial statements and (ii) involved our especially challenging, subjective, or complex judgments. The communication of critical audit matters does not alter in any way our opinion on the consolidated financial statements, taken as a whole, and we are not, by communicating the critical audit matter below, providing a separate opinion on the critical audit matter or on the accounts or disclosures to which it relates.
Valuation of Grain and Oilseed Inventories and Grain and Oilseed Forward Commodity Purchase and Sales Contracts
As described in Notes 4, 15, and 16 to the consolidated financial statements, the Company's grain and oilseed inventories were $888.8 million as of August 31, 2024, and commodity derivatives in an asset and liability position were $165.7 million and $221.8 million, respectively, as of August 31, 2024, of which grain and oilseed make up the majority of forward commodity purchase and sales contracts. Management enters into various derivative instruments to manage the Company's exposure to movements primarily associated with agricultural and energy commodity prices. The net realizable value of grain and oilseed inventories and fair value of grain and oilseed forward commodity purchase and sales contracts are determined using inputs that are generally based on exchange traded prices and/or recent market bids and offers, including location-specific adjustments. Location-specific inputs are driven by local market supply and demand and are generally based on broker or dealer quotations or market transactions in either listed or over-the-counter markets.
The principal considerations for our determination that performing procedures relating to the valuation of grain and oilseed inventories and grain and oilseed forward commodity purchase and sales contracts is a critical audit matter are (i) the significant judgment by management to determine the net realizable value of grain and oilseed inventories and the fair value of grain and oilseed forward commodity purchase and sales contracts and (ii) a high degree of auditor judgment, subjectivity and effort in performing procedures and evaluating management's inputs related to exchange traded prices and/or recent market bids and offers, including location-specific adjustments.
Addressing the matter involved performing procedures and evaluating audit evidence in connection with forming our overall opinion on the consolidated financial statements. These procedures included, among others, (i) testing management's process for determining the net realizable value of grain and oilseed inventories and the fair value of grain and oilseed forward commodity purchase and sales contracts; (ii) evaluating the appropriateness of the valuation models; (iii) testing the accuracy of the underlying data used in the valuations; and (iv) evaluating the reasonableness of inputs used by management related to the exchange traded prices and/or recent market bids and offers, including location-specific adjustments. Evaluating management's inputs related to the exchange traded prices and/or recent market bids and offers, including location-specific adjustments involved (i) comparing the exchange traded prices and/or recent market bids and location-specific inputs to third-party information; and (ii) comparing the location-specific adjustments to broker or dealer quotations or market transactions in either listed or over-the-counter markets.
/s/ PricewaterhouseCoopers LLP
Minneapolis, Minnesota
November 6, 2024
We have served as the Company's auditor since 1998.
CHS INC. AND SUBSIDIARIES
CONSOLIDATED BALANCE SHEETS
| | | | | | | | | | | |
| | August 31, |
| | 2024 | | 2023 |
| | (Dollars in thousands) |
| ASSETS | | | |
| Current assets: | | | |
| Cash and cash equivalents | $ | 794,865 | | | $ | 1,765,286 | |
| Receivables | 3,549,917 | | | 3,105,811 | |
| Inventories | 3,067,415 | | | 3,215,179 | |
| Other current assets | 1,296,586 | | | 1,042,373 | |
| Total current assets | 8,708,783 | | | 9,128,649 | |
| Investments | 3,780,967 | | | 3,828,872 | |
| Property, plant and equipment | 5,177,355 | | | 4,869,373 | |
| Other assets | 1,047,970 | | | 1,130,524 | |
| Total assets | $ | 18,715,075 | | | $ | 18,957,418 | |
| LIABILITIES AND EQUITIES | | | |
| Current liabilities: | | | |
| Notes payable | $ | 306,831 | | | $ | 547,923 | |
| Current portion of long-term debt | 337,266 | | | 7,839 | |
| Accounts payable | 2,697,290 | | | 2,930,607 | |
| Accrued expenses | 783,945 | | | 773,054 | |
| Other current liabilities | 1,275,482 | | | 1,639,771 | |
| Total current liabilities | 5,400,814 | | | 5,899,194 | |
| Long-term debt | 1,824,194 | | | 1,819,819 | |
| Other liabilities | 728,143 | | | 786,016 | |
| Commitments and contingencies (Note 17) | | | |
| Equities: | | | |
| Preferred stock | 2,264,038 | | | 2,264,038 | |
| Equity certificates | 5,982,369 | | | 5,911,649 | |
| Accumulated other comprehensive loss | (296,542) | | | (265,395) | |
| Capital reserves | 2,805,526 | | | 2,537,486 | |
| Total CHS Inc. equities | 10,755,391 | | | 10,447,778 | |
| Noncontrolling interests | 6,533 | | | 4,611 | |
| Total equities | 10,761,924 | | | 10,452,389 | |
| Total liabilities and equities | $ | 18,715,075 | | | $ | 18,957,418 | |
The accompanying notes are an integral part of the consolidated financial statements.
CHS INC. AND SUBSIDIARIES
CONSOLIDATED STATEMENTS OF OPERATIONS
| | | | | | | | | | | | | | | | | |
| | Years Ended August 31, |
| | 2024 | | 2023 | | 2022 |
| | (Dollars in thousands) |
| Revenues | $ | 39,261,229 | | | $ | 45,590,004 | | | $ | 47,791,666 | |
| Cost of goods sold | 37,509,902 | | | 43,213,739 | | | 45,664,745 | |
| Gross profit | 1,751,327 | | | 2,376,265 | | | 2,126,921 | |
| Marketing, general and administrative expenses | 1,166,969 | | | 1,032,765 | | | 997,835 | |
| Operating earnings | 584,358 | | | 1,343,500 | | | 1,129,086 | |
| Interest expense | 104,064 | | | 137,442 | | | 114,156 | |
| Other income | (137,630) | | | (112,131) | | | (23,760) | |
| Equity income from investments | (479,863) | | | (689,590) | | | (771,327) | |
| Income before income taxes | 1,097,787 | | | 2,007,779 | | | 1,810,017 | |
| Income tax (benefit) expense | (4,872) | | | 107,655 | | | 132,116 | |
| Net income | 1,102,659 | | | 1,900,124 | | | 1,677,901 | |
| Net income (loss) attributable to noncontrolling interests | 340 | | | (314) | | | (861) | |
| Net income attributable to CHS Inc. | $ | 1,102,319 | | | $ | 1,900,438 | | | $ | 1,678,762 | |
The accompanying notes are an integral part of the consolidated financial statements.
CHS INC. AND SUBSIDIARIES
CONSOLIDATED STATEMENTS OF COMPREHENSIVE INCOME
| | | | | | | | | | | | | | | | | |
| Years Ended August 31, |
| 2024 | | 2023 | | 2022 |
| | (Dollars in thousands) |
| Net income | $ | 1,102,659 | | | $ | 1,900,124 | | | $ | 1,677,901 | |
| Other comprehensive (loss) income, net of tax: | | | | | |
| Pension and other postretirement benefits | (22,048) | | | (5,285) | | | (27,255) | |
| Cash flow hedges | (255) | | | (6,811) | | | 4,019 | |
| Foreign currency translation adjustment | (8,844) | | | 2,036 | | | (15,708) | |
| Other comprehensive loss, net of tax | (31,147) | | | (10,060) | | | (38,944) | |
| Comprehensive income | 1,071,512 | | | 1,890,064 | | | 1,638,957 | |
| Comprehensive income (loss) attributable to noncontrolling interests | 340 | | | (314) | | | (861) | |
| Comprehensive income attributable to CHS Inc. | $ | 1,071,172 | | | $ | 1,890,378 | | | $ | 1,639,818 | |
The accompanying notes are an integral part of the consolidated financial statements.
CHS INC. AND SUBSIDIARIES
CONSOLIDATED STATEMENTS OF CHANGES IN EQUITIES
| | | | | | | | | | | | | | | | | | | | | | | | | | | | | | | | | | | | | | | | | | | | | | | | | |
| Years Ended August 31, 2024, 2023 and 2022 |
| | Equity Certificates | | | | Accumulated
Other
Comprehensive
Loss | | | | | | | | |
| Capital
Equity
Certificates | | Nonpatronage
Equity
Certificates | | Nonqualified Equity Certificates | | Preferred
Stock | | | | | Capital
Reserves | | Noncontrolling
Interests | | Total
Equities |
| | (Dollars in thousands) |
| Balances, August 31, 2021 | $ | 3,583,911 | | | $ | 28,431 | | | $ | 1,634,896 | | | $ | 2,264,038 | | | $ | (216,391) | | | | | $ | 1,713,976 | | | $ | 8,465 | | | $ | 9,017,326 | |
| Reversal of prior year patronage and redemption estimates | 100,000 | | | — | | | (230,290) | | | — | | | — | | | | | 280,290 | | | — | | | 150,000 | |
| Distribution of 2021 patronage refunds | — | | | — | | | 235,576 | | | — | | | — | | | | | (286,602) | | | — | | | (51,026) | |
| Redemptions of equities | (101,420) | | | (501) | | | (9,897) | | | — | | | — | | | | | — | | | — | | | (111,818) | |
| | | | | | | | | | | | | | | | | |
| | | | | | | | | | | | | | | | | |
| Preferred stock dividends | — | | | — | | | — | | | — | | | — | | | | | (168,668) | | | — | | | (168,668) | |
| Other, net | (4,163) | | | 3 | | | (7,971) | | | — | | | — | | | | | 585 | | | (1,959) | | | (13,505) | |
| Net income (loss) | — | | | — | | | — | | | — | | | — | | | | | 1,678,762 | | | (861) | | | 1,677,901 | |
| Other comprehensive loss, net of tax | — | | | — | | | — | | | — | | | (38,944) | | | | | — | | | — | | | (38,944) | |
| | | | | | | | | | | | | | | | | |
| Estimated 2022 patronage refunds | 508,803 | | | — | | | 153,858 | | | — | | | — | | | | | (1,162,661) | | | — | | | (500,000) | |
| Estimated 2022 equity redemptions | (500,000) | | | — | | | — | | | — | | | — | | | | | — | | | — | | | (500,000) | |
| Balances, August 31, 2022 | 3,587,131 | | | 27,933 | | | 1,776,172 | | | 2,264,038 | | | (255,335) | | | | | 2,055,682 | | | 5,645 | | | 9,461,266 | |
| Reversal of prior year patronage and redemption estimates | (8,803) | | | — | | | (153,858) | | | — | | | — | | | | | 1,162,661 | | | — | | | 1,000,000 | |
| Distribution of 2022 patronage refunds | 516,415 | | | — | | | 154,548 | | | — | | | — | | | | | (1,174,020) | | | — | | | (503,057) | |
| Redemptions of equities | (482,662) | | | (331) | | | (12,797) | | | — | | | — | | | | | — | | | — | | | (495,790) | |
| | | | | | | | | | | | | | | | | |
| | | | | | | | | | | | | | | | | |
| Preferred stock dividends | — | | | — | | | — | | | — | | | — | | | | | (168,668) | | | — | | | (168,668) | |
| | | | | | | | | | | | | | | | | |
| Other, net | (1,821) | | | (44) | | | (518) | | | — | | | — | | | | | 1,677 | | | (720) | | | (1,426) | |
| Net income (loss) | — | | | — | | | — | | | — | | | — | | | | | 1,900,438 | | | (314) | | | 1,900,124 | |
| Other comprehensive loss, net of tax | — | | | — | | | — | | | — | | | (10,060) | | | | | — | | | — | | | (10,060) | |
| Estimated 2023 patronage refunds | 706,125 | | | — | | | 169,159 | | | — | | | — | | | | | (1,240,284) | | | — | | | (365,000) | |
| Estimated 2023 equity redemptions | (365,000) | | | — | | | — | | | — | | | — | | | | | — | | | — | | | (365,000) | |
| Balances, August 31, 2023 | 3,951,385 | | | 27,558 | | | 1,932,706 | | | 2,264,038 | | | (265,395) | | | | | 2,537,486 | | | 4,611 | | | 10,452,389 | |
| Reversal of prior year patronage and redemption estimates | (341,125) | | | — | | | (169,159) | | | — | | | — | | | | | 1,240,284 | | | — | | | 730,000 | |
| Distribution of 2023 patronage refunds | 708,106 | | | — | | | 169,232 | | | — | | | — | | | | | (1,243,350) | | | — | | | (366,012) | |
| Redemptions of equities | (342,298) | | | (288) | | | (13,339) | | | — | | | — | | | | | — | | | — | | | (355,925) | |
| Preferred stock dividends | — | | | — | | | — | | | — | | | — | | | | | (168,668) | | | — | | | (168,668) | |
| Other, net | 13 | | | (9) | | | (106) | | | — | | | — | | | | | (2,852) | | | 1,582 | | | (1,372) | |
| Net income | — | | | — | | | — | | | — | | | — | | | | | 1,102,319 | | | 340 | | | 1,102,659 | |
| Other comprehensive loss, net of tax | — | | | — | | | — | | | — | | | (31,147) | | | | | — | | | — | | | (31,147) | |
| Estimated 2024 patronage refunds | 77,262 | | | — | | | 282,431 | | | — | | | — | | | | | (659,693) | | | — | | | (300,000) | |
| Estimated 2024 equity redemptions | (300,000) | | | — | | | — | | | — | | | — | | | | | — | | | — | | | (300,000) | |
| Balances, August 31, 2024 | $ | 3,753,343 | | | $ | 27,261 | | | $ | 2,201,765 | | | $ | 2,264,038 | | | $ | (296,542) | | | | | $ | 2,805,526 | | | $ | 6,533 | | | $ | 10,761,924 | |
The accompanying notes are an integral part of the consolidated financial statements.
CHS INC. AND SUBSIDIARIES
CONSOLIDATED STATEMENTS OF CASH FLOWS
| | | | | | | | | | | | | | | | | |
| | Years Ended August 31, |
| | 2024 | | 2023 | | 2022 |
| | (Dollars in thousands) |
| Cash flows from operating activities: | | | | | |
| Net income | $ | 1,102,659 | | | $ | 1,900,124 | | | $ | 1,677,901 | |
| Adjustments to reconcile net income to net cash provided by (used in) operating activities: | | | | | |
| Depreciation and amortization, including amortization of deferred major maintenance | 569,891 | | | 539,521 | | | 536,493 | |
| Equity income from investments, net of distributions received | 64,332 | | | (81,272) | | | (48,847) | |
| Provision for current expected credit losses | 5,631 | | | (15,624) | | | 19,920 | |
| Gain/recovery on sale of business | — | | | 300 | | | (13,083) | |
| | | | | |
| Deferred taxes | (109,846) | | | (6,429) | | | 39,548 | |
| Other, net | (35,427) | | | (44,546) | | | (17,833) | |
| Changes in operating assets and liabilities, net of acquisitions: | | | | | |
| Receivables | (335,974) | | | 645,781 | | | (547,564) | |
| Inventories | 147,764 | | | 437,692 | | | (317,918) | |
| Accounts payable and accrued expenses | (213,788) | | | (127,399) | | | 555,446 | |
| Other, net | 77,638 | | | 36,034 | | | 62,455 | |
| Net cash provided by operating activities | 1,272,880 | | | 3,284,182 | | | 1,946,518 | |
| Cash flows from investing activities: | | | | | |
| Acquisition of property, plant and equipment | (808,763) | | | (564,522) | | | (354,444) | |
| Proceeds from disposition of property, plant and equipment | 15,819 | | | 29,645 | | | 14,318 | |
| Expenditures for major maintenance | (22,748) | | | (217,413) | | | (24,768) | |
| Proceeds from sale of business | — | | | 64 | | | 73,152 | |
| Purchases of investments | (500,179) | | | — | | | — | |
| Changes in CHS Capital notes receivable, net | (100,184) | | | (203,843) | | | (161,340) | |
| | | | | |
| | | | | |
| Other investing activities, net | (15,533) | | | 5,878 | | | (4,002) | |
| Net cash used in investing activities | (1,431,588) | | | (950,191) | | | (457,084) | |
| Cash flows from financing activities: | | | | | |
| Proceeds from notes payable and long-term debt | 3,842,339 | | | 7,183,395 | | | 20,730,750 | |
| Payments on notes payable, long-term debt and finance lease obligations | (3,768,121) | | | (7,385,813) | | | (21,515,920) | |
| Preferred stock dividends paid | (168,668) | | | (168,668) | | | (168,668) | |
| Redemptions of equities | (355,925) | | | (495,790) | | | (111,818) | |
| Cash patronage dividends paid | (366,012) | | | (503,057) | | | (51,026) | |
| Other financing activities, net | 2,134 | | | (25,535) | | | 2,994 | |
| Net cash used in financing activities | (814,253) | | | (1,395,468) | | | (1,113,688) | |
| Effect of exchange rate changes on cash and cash equivalents | 2,236 | | | 2,590 | | | (14,756) | |
| (Decrease) increase in cash and cash equivalents and restricted cash | (970,725) | | | 941,113 | | | 360,990 | |
| Cash and cash equivalents and restricted cash at beginning of period | 1,844,587 | | | 903,474 | | | 542,484 | |
| Cash and cash equivalents and restricted cash at end of period | $ | 873,862 | | | $ | 1,844,587 | | | $ | 903,474 | |
| Supplemental cash flow information: | | | | | |
| Cash paid for interest | $ | 100,542 | | | $ | 139,424 | | | $ | 113,726 | |
| Cash paid for income taxes, net of refunds | 129,065 | | | 184,444 | | | 19,712 | |
| Other significant noncash investing and financing transactions: | | | | | |
| Capital expenditures and major maintenance incurred but not yet paid | $ | 54,807 | | | $ | 66,492 | | | $ | 55,214 | |
| Finance lease obligations incurred | 8,772 | | | 16,505 | | | 18,875 | |
| Accrual of patronage dividends and equity redemptions | 600,000 | | | 730,000 | | | 1,000,000 | |
| | | | | |
The accompanying notes are an integral part of the consolidated financial statements.
NOTES TO CONSOLIDATED FINANCIAL STATEMENTS
Note 1 Organization, Basis of Presentation and Significant Accounting Policies
Organization
CHS Inc. (referred to herein as "CHS," "company," "we," "us" or "our") is the nation's leading integrated agricultural cooperative. As a cooperative, CHS is owned by farmers and ranchers and member cooperatives ("members") across the United States. We also have preferred shareholders who own shares of our five series of preferred stock, all of which are listed and traded on the Global Select Market of The Nasdaq Stock Market LLC ("The Nasdaq"). See Note 12, Equities, for more detailed information.
We buy commodities from and provide products and services to individual agricultural producers, local cooperatives and other companies (including member and other nonmember customers), both domestically and internationally. Those products and services include initial agricultural inputs such as fuels, farm supplies, crop nutrients and crop protection products, as well as agricultural outputs that include grains and oilseeds, processed grains and oilseeds, renewable fuels and food products. A portion of our operations are conducted through equity investments and joint ventures whose operating results are not fully consolidated with our results; rather, a proportionate share of the income or loss from those entities is included as a component in our net income under the equity method of accounting.
Basis of Presentation
The consolidated financial statements include the accounts of CHS and all our subsidiaries and limited liability companies in which we have control. The effects of all significant intercompany transactions have been eliminated.
The notes to our consolidated financial statements refer to our Energy, Ag and Nitrogen Production reportable segments, as well as our Corporate and Other category, which represents an aggregation of individually immaterial operating segments. The Nitrogen Production reportable segment consists of our investment in CF Industries Nitrogen, LLC ("CF Nitrogen"), and allocated expenses. See Note 14, Segment Reporting, for more information.
Use of Estimates
The preparation of financial statements in conformity with U.S. GAAP requires management to make estimates and assumptions that affect the reported amounts of assets and liabilities and disclosure of contingent assets and liabilities at the date of the financial statements and the reported amounts of revenues and expenses during the reporting period. We base our estimates on assumptions that are believed to be reasonable, the results of which form the basis for making judgments about the carrying values of assets and liabilities. Due to the inherent uncertainty involved in making estimates, actual results could differ from those estimates. We evaluate our estimates and assumptions on an ongoing basis.
Significant Accounting Policies
Significant accounting policies are summarized below or within the related notes to our consolidated financial statements.
Cash and Cash Equivalents and Restricted Cash
Cash equivalents include short-term, highly liquid investments with original maturities of three months or less at the date of acquisition. The carrying value of cash and cash equivalents approximates the fair value due to the short-term nature of the instruments.
Restricted cash is included in our Consolidated Balance Sheets within other current assets and primarily relates to customer deposits for futures and option contracts associated with regulated commodities held in separate accounts as required under federal and other regulations. Pursuant to the requirements of the Commodity Exchange Act, such funds must be carried in separate accounts that are designated as segregated customer accounts, as applicable. Restricted cash also includes funds held in escrow pursuant to applicable regulations limiting their use.
The following table provides a reconciliation of cash and cash equivalents and restricted cash as reported within our Consolidated Balance Sheets that aggregates to the amount presented in our Consolidated Statements of Cash Flows. | | | | | | | | | | | | | | | | | |
| August 31, |
| 2024 | | 2023 | | 2022 |
| (Dollars in thousands) |
| Cash and cash equivalents | $ | 794,865 | | | $ | 1,765,286 | | | $ | 793,957 | |
| Restricted cash included in other current assets | 78,997 | | | 79,301 | | | 109,517 | |
| | | | | |
| Total cash and cash equivalents and restricted cash | $ | 873,862 | | | $ | 1,844,587 | | | $ | 903,474 | |
Recent Accounting Pronouncements
In November 2023, the Financial Accounting Standards Board (the "FASB") issued Accounting Standards Update ("ASU") 2023-07, Segment Reporting (Topic 280): Improvements to Reportable Segment Disclosures, which enhances the disclosures required for operating segments in our annual and interim consolidated financial statements. This ASU is effective on a retrospective basis for our annual reporting beginning in fiscal 2025 and for interim period reporting beginning in fiscal 2026. We are currently evaluating the impact of adopting this ASU on our consolidated financial statements.
In December 2023, the FASB issued ASU 2023-09, Income Taxes (Topic 740): Improvements to Income Tax Disclosures, which provides additional transparency for income tax disclosures. This ASU is effective for our annual reporting for fiscal 2026 on a prospective basis. We are currently evaluating the impact of adopting this ASU on our consolidated financial statements.
In November 2024, the FASB issued ASU 2024-03, Income Statement—Reporting Comprehensive Income (Topic 220): Expense Disaggregation Disclosures, which requires additional disclosure about certain costs and expenses in the notes to financial statements. This ASU is effective for our annual reporting for fiscal 2028 on either a prospective or retrospective basis and for interim reporting periods beginning in fiscal 2029. We are currently evaluating the impact of adopting this ASU on our consolidated financial statements.
Note 2 Revenues
We provide a wide variety of products and services, from agricultural inputs such as fuels, farm supplies and agronomy products, to agricultural outputs that include grain and oilseed, processed grains and oilseeds and food products, and renewable fuels production and marketing. We primarily conduct our operations and derive revenues within our Energy and Ag segments. Our Energy segment derives its revenues through refining, wholesaling and retailing of petroleum products. Our Ag segment derives its revenues through origination and marketing of grain, including service activities conducted at export terminals; through wholesale agronomy sales of crop nutrient and crop protection products; from sales of soybean meal, refined soy oil and soyflour products; through production and marketing of renewable fuels; and through retail sales of petroleum and agronomy products, processed sunflowers, and feed and farm supplies. Corporate and Other primarily consists of our financing and hedging businesses.
Revenue is recognized when performance obligations under the terms of a contract with a customer are satisfied, which generally occurs when control of the goods has transferred to the customer in accordance with the underlying contract. For the majority of our contracts with customers, control transfers to customers at a point in time when goods and/or services have been delivered, as that is generally when legal title, physical possession and risks and rewards of ownership of the goods and/or services transfer to the customer. In limited arrangements, control transfers over time as the customer simultaneously receives and consumes the benefits of the service as we complete our performance obligation(s). Revenue is recognized as the transaction price we expect to be entitled to in exchange for transferring goods or services to a customer, excluding amounts collected on behalf of third parties. For physically settled derivative sales contracts that are outside the scope of the revenue guidance, we recognize revenue when control of the inventory is transferred. Revenues arising from our financing business are recognized in accordance with Accounting Standards Codification ("ASC") Topic 470, Debt ("ASC Topic 470") and fall outside the scope of ASC Topic 606, Revenue from Contracts with Customers ("ASC Topic 606").
Shipping and Handling Costs
Shipping and handling amounts billed to a customer as part of a sales transaction under ASC Topic 606 are included in revenues, and the related costs are included in cost of goods sold. Shipping and handling is treated as a fulfillment activity, rather than a promised service, and therefore is not considered a separate performance obligation.
Taxes Collected from Customers and Remitted to Governmental Authorities
Revenues are recorded net of taxes collected from customers that are remitted to governmental authorities, with the collected taxes recorded as current liabilities until remitted to the relevant governmental authority.
Contract Costs
Commissions related to contracts with a duration of less than one year are expensed as incurred. We recognize incremental costs of obtaining contracts as an expense when incurred if the amortization period of the assets we otherwise would have recognized is one year or less.
Disaggregation of Revenues
The following table presents revenues recognized under ASC Topic 606, disaggregated by reportable segment, as well as the amount of revenues recognized under ASC Topic 815, Derivatives and Hedging ("ASC Topic 815"), and other applicable accounting guidance for the years ended August 31, 2024, 2023 and 2022. Other applicable accounting guidance primarily includes revenues recognized under ASC Topic 470 and ASC Topic 842, Leases ("ASC Topic 842"), that fall outside the scope of ASC Topic 606. | | | | | | | | | | | | | | | | | | | | | | | | | | |
| | Year ended August 31, 2024 |
| Reportable Segment* | | ASC Topic 606 | | ASC Topic 815 | | Other Guidance | | Total Revenues |
| | (Dollars in thousands) |
| Energy | | $ | 7,882,666 | | | $ | 883,829 | | | $ | — | | | $ | 8,766,495 | |
| Ag | | 8,833,872 | | | 21,571,954 | | | 11,033 | | | 30,416,859 | |
| Corporate and Other | | 24,649 | | | — | | | 53,226 | | | 77,875 | |
| Total revenues | | $ | 16,741,187 | | | $ | 22,455,783 | | | $ | 64,259 | | | $ | 39,261,229 | |
| | | | | | | | |
| | Year ended August 31, 2023 |
| Reportable Segment* | | ASC Topic 606 | | ASC Topic 815 | | Other Guidance | | Total Revenues |
| | (Dollars in thousands) |
| Energy | | $ | 8,996,149 | | | $ | 1,100,764 | | | $ | — | | | $ | 10,096,913 | |
| Ag | | 9,808,664 | | | 25,606,485 | | | 10,055 | | | 35,425,204 | |
| Corporate and Other | | 26,001 | | | — | | | 41,886 | | | 67,887 | |
| Total revenues | | $ | 18,830,814 | | | $ | 26,707,249 | | | $ | 51,941 | | | $ | 45,590,004 | |
| | | | | | | | |
| | Year ended August 31, 2022 |
| Reportable Segment* | | ASC Topic 606 | | ASC Topic 815 | | Other Guidance | | Total Revenues |
| | (Dollars in thousands) |
| Energy | | $ | 9,302,400 | | | $ | 992,374 | | | $ | — | | | $ | 10,294,774 | |
| Ag | | 10,784,831 | | | 26,646,003 | | | 29,377 | | | 37,460,211 | |
| Corporate and Other | | 16,625 | | | — | | | 20,056 | | | 36,681 | |
| Total revenues | | $ | 20,103,856 | | | $ | 27,638,377 | | | $ | 49,433 | | | $ | 47,791,666 | |
*Our Nitrogen Production reportable segment represents an equity method investment that records earnings and allocated expenses but not revenues.
Less than 1% of revenues accounted for under ASC Topic 606 included within the table above are recorded over time and relate primarily to service contracts.
Contract Assets and Contract Liabilities
Contract assets relate to unbilled amounts arising from goods that have already been transferred to the customer where the right to payment is not conditional on the passage of time. This results in recognition of an asset, as the amount of revenue recognized at a certain point in time exceeds the amount billed to customers. Contract assets are recorded in receivables within our Consolidated Balance Sheets and were $34.7 million and $16.2 million as of August 31, 2024 and 2023, respectively.
Contract liabilities relate to advance payments received from customers for goods and services that we have yet to provide. Contract liabilities of $248.8 million and $240.0 million as of August 31, 2024 and 2023, respectively, are recorded within other current liabilities on our Consolidated Balance Sheets, and are recognized as revenues within the next respective fiscal year.
Note 3 Receivables
Receivables as of August 31, 2024 and 2023, are as follows: | | | | | | | | | | | |
| 2024 | | 2023 |
| | (Dollars in thousands) |
| Trade accounts receivable | $ | 2,232,203 | | | $ | 2,010,162 | |
| CHS Capital short-term notes receivable | 944,861 | | | 845,192 | |
| | | |
| Other | 452,662 | | | 327,084 | |
| Gross receivables | 3,629,726 | | | 3,182,438 | |
| Less allowances and reserves | 79,809 | | | 76,627 | |
| Total receivables | $ | 3,549,917 | | | $ | 3,105,811 | |
Trade Accounts Receivable
Trade accounts receivable are recorded at net realizable value, which includes an allowance for expected credit losses in accordance with ASC Topic 326, Financial Instruments - Credit Losses ("ASC Topic 326"). The allowance for expected credit losses is based on our best estimate of expected credit losses in existing receivable balances and is determined using historical write-off experience, adjusted for various industry and regional data and current expectations of future credit losses. Receivables from related parties are disclosed in Note 18, Related Party Transactions. No third-party customer accounted for more than 10% of the total receivables balance as of August 31, 2024 or 2023.
CHS Capital Notes Receivable
Notes Receivable
CHS Capital, LLC ("CHS Capital"), our wholly-owned subsidiary, has short-term notes receivable from commercial and producer borrowers. The short-term notes receivable have maturity terms of 12 months or less and are reported at their outstanding unpaid principal balances, less an allowance for expected credit losses, as CHS Capital has the intent and ability to hold the applicable loans for the foreseeable future or until maturity or payoff. The carrying value of CHS Capital short-term notes receivable approximates fair value given the notes' short-term duration and use of market pricing adjusted for risk.
Notes receivable from commercial borrowers are collateralized by various combinations of mortgages, personal property, accounts and notes receivable, inventories and assignments of certain regional cooperatives' capital stock. These loans are primarily originated in the states of Minnesota and North Dakota. CHS Capital also has loans receivable from producer borrowers that are collateralized by various combinations of growing crops, livestock, inventories, accounts receivable, personal property and supplemental mortgages and are primarily originated in the same states as the commercial notes, as well as South Dakota.
In addition to the short-term balances included in the table above, CHS Capital had long-term notes receivable, with durations of generally not more than 10 years, totaling $74.6 million and $61.1 million as of August 31, 2024 and 2023, respectively. The long-term notes receivable are included in other assets on our Consolidated Balance Sheets. As of August 31, 2024 and 2023, commercial notes represented 18% and 15%, respectively, and producer notes represented 82% and 85%, respectively, of total CHS Capital notes receivable.
CHS Capital has commitments to extend credit to customers if there are no violations of any contractually established conditions. As of August 31, 2024, CHS Capital customers had additional available credit of $1.2 billion.
Allowance for Loan Losses
CHS Capital maintains an allowance for loan losses that is an estimate of current expected losses inherent in the loans receivable portfolio. In accordance with ASC Topic 326, the allowance for loan losses is based on our current expectation for future losses, which takes into consideration historical loss experience, third-party industry forecasts, as well as other quantitative and qualitative factors addressing operational risks and industry trends. Additions to the allowance for loan losses are reflected within marketing, general and administrative expenses in the Consolidated Statements of Operations. The portion of loans receivable deemed uncollectible is charged off against the allowance for loan losses. Recoveries of previously charged off amounts increase the allowance for loan losses. No significant amounts of CHS Capital notes were past due as of August 31, 2024 or 2023, and the allowance for loan losses related to CHS Capital notes were not material as of either date.
Interest Income
Interest income is recognized on the accrual basis using a method that computes simple interest on a daily basis. Accrual of interest on commercial loans receivable is discontinued at the time the receivable is 90 days past due unless the loan is well-collateralized and in process of collection. Past due status is based on contractual terms of the loan. Producer loans receivable are placed in nonaccrual status based on estimates and analysis due to the annual debt service terms inherent to CHS Capital producer loans. In all cases, loans are placed in nonaccrual status or charged off at an earlier date if collection of principal or interest is considered doubtful.
Troubled Debt Restructurings
Restructuring of a loan constitutes a troubled debt restructuring, or restructured loan, if the creditor, for economic reasons related to the debtor's financial difficulties, grants a concession to the debtor that it would otherwise not consider. Concessions vary by program and borrower. Concessions may include interest rate reductions, term extensions, payment deferrals or the acceptance of additional collateral in lieu of payments. In limited circumstances, principal may be forgiven. When a restructured loan constitutes a troubled debt restructuring, CHS includes these loans within its impaired loans. CHS Capital had no significant troubled debt restructurings during the years ended August 31, 2024, 2023 and 2022, and no third-party borrowers that accounted for more than 10% of the total CHS Capital notes receivable or total receivables as of August 31, 2024 or 2023.
Loan Participations
For the years ended August 31, 2024 and 2023, CHS Capital sold $47.9 million and $60.8 million of notes receivable, respectively, to various counterparties under a master participation agreement. The sales resulted in the removal of notes receivable from the Consolidated Balance Sheets. CHS Capital has no retained interests in the transferred notes receivable, other than collection and administrative services. Proceeds from sales of notes receivable have been included in investing activities in the Consolidated Statements of Cash Flows. Fees received related to the servicing of notes receivable are recorded in other income in the Consolidated Statements of Operations. We consider the fees received adequate compensation for services rendered and, accordingly, have recorded no servicing asset or liability.
Other Receivables
Other receivables are comprised of certain other amounts recorded in the normal course of business, including receivables related to vendor rebates, value-added taxes, certain financing receivables and pre-crop financing, primarily to Brazilian farmers, to finance a portion of supplier production costs. We receive volume-based rebates from certain vendors during the year. These vendor rebates are accounted for in accordance with ASC 705, Cost of Sales and Services, based on the terms of the volume rebate program. For rebates that meet the definition of a binding arrangement and are both probable and estimable, we estimate the amount of the rebate we will receive and accrue it as a reduction of the cost of inventory and cost of goods sold over the period in which the rebate is earned. For pre-crop financing arrangements, we do not bear costs or operational risks associated with the related growing crops, although our ability to be paid depends on the crops being produced. The financing is collateralized by future crops, land and physical assets of the farmers, carries a local market interest rate and settles when the farmer's crop is harvested and sold. No significant troubled debt restructurings occurred during the years ended August 31, 2024, 2023 and 2022, and no third-party customer or borrower accounted for more than 10% of the total receivables balance as of August 31, 2024 or 2023.
Note 4 Inventories
Inventories as of August 31, 2024 and 2023, are as follows: | | | | | | | | | | | |
| 2024 | | 2023 |
| | (Dollars in thousands) |
| Grain and oilseed | $ | 888,768 | | | $ | 1,099,956 | |
| Energy | 720,636 | | | 645,333 | |
| Agronomy | 1,126,916 | | | 1,111,477 | |
| Processed grain and oilseed | 124,686 | | | 141,360 | |
| Other | 206,409 | | | 217,053 | |
| Total inventories | $ | 3,067,415 | | | $ | 3,215,179 | |
Grain, processed grain, oilseed, processed oilseed and other minimally processed soy-based inventories are accounted for in accordance with ASC Topic 330, Inventory, and are stated at net realizable value. These inventories are agricultural commodity inventories that are readily convertible to cash because of their commodity characteristics, widely available markets and international pricing mechanisms. The net realizable value of agricultural commodity inventories is determined using inputs that are generally based on exchange traded prices and/or recent market bids and offers, including location-specific adjustments. Location-specific inputs are driven by local market supply and demand and are generally based on broker or dealer quotations or market transactions in either listed or over-the-counter ("OTC") markets. Changes in the net realizable value of agricultural commodity inventories are recognized in earnings as a component of cost of goods sold.
All other inventories are stated at the lower of cost or net realizable value. Costs for inventories produced or modified by us through a manufacturing process include fixed and variable production and raw material costs, and inbound freight costs for raw materials. Costs for inventories purchased for resale include the cost of products and freight incurred to place the products at our points of sale. The costs of certain energy inventories (wholesale refined products, crude oil and asphalt) are determined on the last-in, first-out ("LIFO") method; all other inventories of nongrain products purchased for resale are valued on the first-in, first-out ("FIFO") and average cost methods.
As of August 31, 2024 and 2023, we valued approximately 18% and 16%, respectively, of inventories, primarily crude oil and refined fuels within our Energy segment, using the lower of cost, determined on the LIFO method, or net realizable value. If the FIFO method of accounting had been used, inventories would have been higher than the reported amount by $456.3 million and $589.0 million as of August 31, 2024 and 2023, respectively. There were no liquidations of LIFO inventories during fiscal 2024 or fiscal 2023.
Note 5 Other Current Assets
Other current assets as of August 31, 2024 and 2023, are as follows: | | | | | | | | | | | |
| 2024 | | 2023 |
| | (Dollars in thousands) |
| Short-term investments | $ | 500,921 | | | $ | — | |
| Derivative assets (Note 15) | 177,111 | | | 320,119 | |
| Margin and related deposits | 176,821 | | | 342,872 | |
| Prepaid expenses | 202,392 | | | 149,682 | |
| Supplier advance payments | 133,678 | | | 136,304 | |
| Restricted cash (Note 1) | 78,997 | | | 79,301 | |
| Other | 26,666 | | | 14,095 | |
| Total other current assets | $ | 1,296,586 | | | $ | 1,042,373 | |
Short-Term Investments
Our short-term investments balance is comprised of time deposits with a maturity of greater than 90 days and less than 12 months at the date of acquisition.
Margin and Related Deposits
Many of our derivative contracts with futures and options brokers require us to make margin deposits of cash or other assets. Subsequent margin deposits may also be necessary when changes in commodity prices result in a loss on the contract value to comply with applicable regulations. Our margin and related deposit assets are generally held in separate accounts to support the associated derivative contracts and may be used to fund or partially fund the settlement of those contracts as they expire. Similar to our derivative financial instruments, margin and related deposits are reported on a gross basis.
Prepaid Expenses and Supplier Advance Payments
Prepaid expenses and supplier advance payments are typically for periods less than 12 months and include amounts paid in advance for products and services. Supplier advance payments are primarily for grain purchases from suppliers and amounts paid to crop nutrient and crop protection product suppliers to lock in future supply, pricing and discounts.
Note 6 Investments
Investments as of August 31, 2024 and 2023, are as follows: | | | | | | | | | | | |
| 2024 | | 2023 |
| | (Dollars in thousands) |
| Equity method investments | | | |
| CF Industries Nitrogen, LLC | $ | 2,544,530 | | | $ | 2,577,391 | |
| Ventura Foods, LLC | 511,231 | | | 519,169 | |
| Ardent Mills, LLC | 234,021 | | | 265,146 | |
| | | |
| Other equity method investments | 353,413 | | | 337,281 | |
| Other investments | 137,772 | | | 129,885 | |
| Total investments | $ | 3,780,967 | | | $ | 3,828,872 | |
Joint ventures and other investments in which we have significant ownership and influence but not control, are accounted for in our consolidated financial statements using the equity method of accounting. Our significant equity method investments consist of CF Nitrogen and Ventura Foods, LLC ("Ventura Foods"), which are summarized below. In addition to the recognition of our share of income from our equity method investments, our equity method investments are evaluated for indicators of other-than-temporary impairment on an ongoing basis in accordance with U.S. GAAP. We had approximately $612.2 million of cumulative undistributed earnings from our equity method investees included in the investments balance as of August 31, 2024.
All equity securities that do not result in consolidation and are not accounted for under the equity method are measured at fair value with changes therein reflected in net income. We have elected to use the measurement alternative for equity investments that do not have readily determinable fair values and measure these investments at cost less impairment plus or minus observable price changes in orderly transactions. Our share in the income or loss of our equity method investments is recorded within equity income from investments in the Consolidated Statements of Operations. Other investments consist primarily of investments in cooperatives without readily determinable fair values and are generally recorded at cost, unless an impairment or other observable market price change occurs requiring an adjustment. Investments in other cooperatives are recorded in a manner similar to equity investments without readily determinable fair values, plus patronage dividends received in the form of capital stock and other equities. Patronage dividends are recorded as a reduction to cost of goods sold at the time qualified written notices of allocation are received. Investments in debt and equity instruments are carried at amounts that approximate fair values.
CF Nitrogen
We have a $2.5 billion investment in CF Nitrogen, a strategic venture with CF Industries Holdings, Inc. The investment consists of an approximate 8.4% membership interest (based on product tons) in CF Nitrogen. At the time we entered into the strategic venture, we also entered into a supply agreement that entitles us to purchase up to 1.1 million tons of granular urea and 580,000 tons of urea ammonium nitrate ("UAN") annually from CF Nitrogen for ratable delivery through fiscal 2096. Our purchases under the supply agreement are based on prevailing market prices and we receive semiannual cash distributions (in January and July of each year) from CF Nitrogen via our membership interest. These distributions are based on actual volumes purchased from CF Nitrogen under the strategic venture and will have the effect of reducing our investment to
zero over 80 years on a straight-line basis. We account for this investment using the hypothetical liquidation at book value method, recognizing our share of the earnings and losses of CF Nitrogen as equity income from investments in our Nitrogen Production segment based on our contractual claims on the entity's net assets pursuant to the liquidation provisions of the CF Nitrogen Limited Liability Company Agreement, adjusted for the semiannual cash distributions. Cash distributions received from CF Nitrogen for the years ended August 31, 2024, 2023 and 2022, were $308.4 million, $458.9 million and $618.7 million, respectively.
The following tables provide aggregate summarized financial information for CF Nitrogen for balance sheets as of August 31, 2024 and 2023, and statements of operations for the 12 months ended August 31, 2024, 2023 and 2022:
| | | | | | | | | | | |
| 2024 | | 2023 |
| | (Dollars in thousands) |
| Current assets | $ | 604,466 | | | $ | 899,246 | |
| Noncurrent assets | 4,929,772 | | | 5,355,732 | |
| Current liabilities | 244,867 | | | 281,153 | |
| Noncurrent liabilities | 1,935 | | | 1,128 | |
| | | | | | | | | | | | | | | | | |
| 2024 | | 2023 | | 2022 |
| | (Dollars in thousands) |
| Net sales | $ | 3,588,649 | | | $ | 5,070,489 | | | $ | 6,609,758 | |
| Gross profit | 1,232,346 | | | 2,194,363 | | | 3,318,189 | |
| Net earnings | 1,186,890 | | | 2,173,715 | | | 3,249,005 | |
| Earnings attributable to CHS Inc. | 275,531 | | | 394,678 | | | 593,182 | |
Ventura Foods
We have a 50% interest in Ventura Foods, a joint venture with Mitsui & Co., that produces and distributes edible oil-based products. We account for Ventura Foods as an equity method investment and our share of the results of Ventura Foods is included in Corporate and Other.
The following tables provide aggregate summarized financial information for our equity method investment in Ventura Foods for balance sheets as of August 31, 2024 and 2023, and statements of operations for the 12 months ended August 31, 2024, 2023 and 2022: | | | | | | | | | | | |
| 2024 | | 2023 |
| | (Dollars in thousands) |
| Current assets | $ | 792,468 | | | $ | 1,041,799 | |
| Noncurrent assets | 886,673 | | | 609,021 | |
| Current liabilities | 426,281 | | | 335,000 | |
| Noncurrent liabilities | 256,126 | | | 303,209 | |
| | | | | | | | | | | | | | | | | |
| 2024 | | 2023 | | 2022 |
| | (Dollars in thousands) |
| Net sales | $ | 3,172,061 | | | $ | 3,552,194 | | | $ | 3,386,998 | |
| Gross profit | 468,028 | | | 547,107 | | | 333,368 | |
| Net earnings | 216,042 | | | 406,271 | | | 117,666 | |
| Earnings attributable to CHS Inc. | 108,021 | | | 203,136 | | | 58,833 | |
Our investments in other equity method investees are not significant in relation to our consolidated financial statements, either individually or in the aggregate.
Note 7 Property, Plant and Equipment
Major classes of property, plant and equipment, including finance lease assets, are summarized in the table below as of August 31, 2024 and 2023. | | | | | | | | | | | |
| 2024 | | 2023 |
| | (Dollars in thousands) |
| Land and land improvements | $ | 404,465 | | | $ | 350,703 | |
| Buildings | 1,394,911 | | | 1,242,913 | |
| Machinery and equipment | 8,223,650 | | | 7,979,164 | |
| Office equipment and other | 548,368 | | | 498,430 | |
| Construction in progress | 859,039 | | | 630,542 | |
| Gross property, plant and equipment | 11,430,433 | | | 10,701,752 | |
| Less accumulated depreciation and amortization | 6,253,078 | | | 5,832,379 | |
| Total property, plant and equipment | $ | 5,177,355 | | | $ | 4,869,373 | |
Property, plant and equipment are stated at cost less accumulated depreciation and amortization. Depreciation and amortization are provided on the straight-line method by charges to operations at rates based on the expected useful lives of individual or groups of assets (generally 15 to 20 years for land improvements, 20 to 40 years for buildings, five to 20 years for machinery and equipment, and three to 10 years for office equipment and other). Expenditures for maintenance and minor repairs and renewals are expensed. We also capitalize and amortize eligible costs to acquire or develop internal-use software that are incurred during the application development stage. When assets are sold or otherwise disposed of, the cost and related accumulated depreciation and amortization are removed from the related accounts and resulting gains or losses are reflected in operations.
Depreciation expense, including amortization of finance lease assets, for the years ended August 31, 2024, 2023 and 2022, was $474.8 million, $457.9 million and $458.2 million, respectively.
Property, plant and equipment and other long-lived assets are reviewed for impairment when events or changes in circumstances indicate that the carrying amounts may not be recoverable in accordance with U.S. GAAP. This evaluation of recoverability is based on various indicators, including the nature, future economic benefits and geographic locations of the assets, historical or future profitability measures and other external market conditions. If these indicators suggest the carrying amounts of an asset or asset group may not be recoverable, potential impairment is evaluated using undiscounted, estimated future cash flows. Should the sum of the expected future net cash flows be less than the carrying value, an impairment loss would be recognized. An impairment loss would be measured as the amount by which the carrying value of the asset or asset group exceeds its fair value. No significant impairments were identified during fiscal 2024, fiscal 2023 or fiscal 2022.
We have asset retirement obligations with respect to certain of our refineries and other assets due to various legal obligations to clean and/or dispose of the component parts at the time they are retired. In most cases, these assets can be used for extended and indeterminate periods of time if they are properly maintained and/or upgraded. It is our practice and current intent to maintain refineries and related assets and to continue making improvements to those assets based on technological advances. As a result, we believe our refineries and related assets have indeterminate lives for purposes of estimating asset retirement obligations because dates or ranges of dates upon which we would retire a refinery and related assets cannot reasonably be estimated at this time. When a date or range of dates can reasonably be estimated for the retirement of any component part of a refinery or other asset, we estimate the cost of performing the retirement activities and record a liability for the fair value of that future cost.
We have other assets that we may be obligated to dismantle at the end of corresponding lease terms subject to the lessor's discretion for which we have recorded asset retirement obligations. Based on our estimates of timing, cost and probability of removal, these obligations are not material.
Note 8 Other Assets
Other assets as of August 31, 2024 and 2023, are as follows: | | | | | | | | | | | |
| 2024 | | 2023 |
| | (Dollars in thousands) |
| Goodwill | $ | 179,976 | | | $ | 179,976 | |
| Customer lists, trademarks and other intangible assets | 42,105 | | | 46,980 | |
| Notes receivable (Note 3) | 94,325 | | | 76,919 | |
| Long-term derivative assets (Note 15) | 2,853 | | | 1,119 | |
| Prepaid pension and other benefits (Note 13) | 75,935 | | | 78,819 | |
| Capitalized major maintenance | 223,119 | | | 289,377 | |
| Cash value life insurance | 152,772 | | | 134,126 | |
| Operating lease right of use assets (Note 19) | 218,844 | | | 254,844 | |
| Other | 58,041 | | | 68,364 | |
| Total other assets | $ | 1,047,970 | | | $ | 1,130,524 | |
Goodwill and Other Intangible Assets
Goodwill represents the excess of cost over the fair value of identifiable assets acquired. Goodwill is assessed for impairment on an annual basis as of July 31, either by first assessing qualitative factors to determine whether a quantitative goodwill impairment test is necessary or by proceeding directly to the quantitative test. The quantitative test may be required more frequently if triggering events or other circumstances occur that could indicate impairment. Goodwill is assessed for impairment at the reporting unit level, which has been determined to be our operating segments or one level below our operating segments in certain instances.
There were no changes in the net carrying amount of goodwill during fiscal 2024 or fiscal 2023.
No goodwill has been allocated to our Nitrogen Production segment, which consists of a single investment accounted for under the equity method of accounting, and allocated expenses.
No goodwill impairments were identified as a result of our annual goodwill analyses performed as of July 31, 2024, 2023 or 2022. Management will continue to monitor the results and projected cash flows for each of our businesses to assess whether any reserves or impairments may be necessary in the future.
Intangible assets subject to amortization primarily include customer lists, trademarks and noncompete agreements, and are amortized over their respective useful lives (ranging from two to 30 years). We have no material intangible assets with indefinite useful lives. All long-lived assets, including other identifiable intangible assets, are also assessed for impairment in accordance with U.S. GAAP and evaluated for impairment whenever triggering events or other circumstances indicate the carrying amount of an asset group or reporting unit may not be recoverable. Information regarding intangible assets is as follows: | | | | | | | | | | | | | | | | | | | | | | | | | | | | | | | | | | | |
| August 31, 2024 | | August 31, 2023 |
| Carrying Amount | | Accumulated Amortization | | Net | | Carrying Amount | | Accumulated Amortization | | Net |
| (Dollars in thousands) |
| Customer lists | $ | 86,389 | | | $ | (46,480) | | | $ | 39,909 | | | $ | 85,341 | | | $ | (41,374) | | | $ | 43,967 | |
| Trademarks and other intangible assets | 11,051 | | | (8,855) | | | 2,196 | | | 11,332 | | | (8,319) | | | 3,013 | |
| Total intangible assets | $ | 97,440 | | | $ | (55,335) | | | $ | 42,105 | | | $ | 96,673 | | | $ | (49,693) | | | $ | 46,980 | |
Intangible asset amortization expense for the years ended August 31, 2024, 2023 and 2022, was $6.9 million, $6.7 million and $6.8 million, respectively. The estimated annual amortization expense related to intangible assets subject to amortization for future years is as follows: | | | | | |
| (Dollars in thousands) |
| 2025 | $ | 6,694 | |
| 2026 | 6,513 | |
| 2027 | 6,458 | |
| 2028 | 6,341 | |
| 2029 | 4,706 | |
| Thereafter | 11,393 | |
| Total | $ | 42,105 | |
Capitalized Major Maintenance
Activity related to capitalized major maintenance costs at our refineries for the years ended August 31, 2024, 2023 and 2022, is summarized below: | | | | | | | | | | | | | | | | | | | | | | | | | |
| Balance at
Beginning
of Year | | Cost
Deferred | | Amortization | | | | Balance at
End of Year |
| | (Dollars in thousands) |
| 2024 | $ | 289,377 | | | $ | 21,909 | | | $ | (88,167) | | | | | $ | 223,119 | |
| 2023 | 147,521 | | | 216,762 | | | (74,906) | | | | | 289,377 | |
| 2022 | 196,641 | | | 25,401 | | | (74,521) | | | | | 147,521 | |
Within our Energy segment, major maintenance activities are regularly performed at our Laurel, Montana, and McPherson, Kansas, refineries. Major maintenance activities are the planned and required shutdowns of refinery processing units, which include replacement or overhaul of equipment that has experienced decreased efficiency in resource conversion. Because major maintenance activities are performed to extend the life, increase the capacity and/or improve the safety or efficiency of refinery processing assets, we follow the deferral method of accounting for major maintenance activities. Expenditures for major maintenance activities are capitalized (deferred) when incurred and amortized on a straight-line basis over a period of two to five years, which is the estimated time lapse between major maintenance activities. Should the estimated time between major maintenance activities change, we may be required to amortize the remaining cost of the major maintenance activities over a shorter period, which would result in higher depreciation and amortization costs. Amortization expense related to the capitalized major maintenance costs is included in cost of goods sold in our Consolidated Statements of Operations.
Selection of the deferral method, as opposed to expensing major maintenance activity costs when incurred, results in deferring recognition of major maintenance activity expenditures. The deferral method also results in classification of related cash outflows as investing activities in our Consolidated Statements of Cash Flows, whereas expensing these costs as incurred would result in classifying the cash outflows as operating activities. Repair, maintenance and related labor costs are expensed as incurred and are included in operating cash flows.
Note 9 Notes Payable and Long-Term Debt
Our notes payable and long-term debt are subject to various restrictive requirements for maintenance of minimum consolidated net worth and other financial ratios. We were in compliance with our debt covenants as of August 31, 2024.
Notes Payable
Notes payable as of August 31, 2024 and 2023, consisted of the following: | | | | | | | | | | | | | | | | | | | | | | | | | | |
| | Weighted-Average Interest Rate | | | | |
| | 2024 | | 2023 | | 2024 | | 2023 |
| | | | | | | (Dollars in thousands) |
| Notes payable | | 3.64% | | 5.37% | | $ | 163,136 | | | $ | 375,932 | |
| CHS Capital notes payable | | 4.34% | | 4.24% | | 143,695 | | | 171,991 | |
| Total notes payable | | $ | 306,831 | | | $ | 547,923 | |
Our primary line of credit is a five-year unsecured revolving credit facility with a syndicate of domestic and international banks. The credit facility provides a committed amount of $2.8 billion that expires on April 21, 2028. There were no borrowings outstanding on this facility as of August 31, 2024. We also maintain certain uncommitted bilateral facilities to support our working capital needs.
In addition to our facilities referenced above, our international subsidiaries have lines of credit with $162.7 million outstanding as of August 31, 2024.
CHS Capital Notes Payable
We have a receivables and loans securitization facility ("Securitization Facility") with certain unaffiliated financial institutions ("Purchasers"). Under the Securitization Facility, we and certain of our subsidiaries ("Originators") sell trade accounts and notes receivable ("Receivables") to Cofina Funding, LLC ("Cofina"), a wholly-owned, bankruptcy-remote, indirect subsidiary of CHS. Cofina in turn transfers the Receivables to the Purchasers, and this arrangement is accounted for as secured financing. We use the proceeds from the sale of Receivables under the Securitization Facility for general corporate purposes, and settlements are made on a monthly basis. The amount available under the Securitization Facility fluctuates over time based on the total amount of eligible Receivables generated during the normal course of business. The Securitization Facility consists of a committed portion with a maximum availability of $850.0 million and an uncommitted portion with a maximum availability of $250.0 million. As of August 31, 2024, total availability under the Securitization Facility was $778.4 million, of which no amount was utilized.
We also have a repurchase facility ("Repurchase Facility"). Under the Repurchase Facility, we can obtain repurchase agreement financing up to $200.0 million for certain eligible receivables and notes receivables of the Originators. No balance was outstanding under the Repurchase Facility as of August 31, 2024.
On August 28, 2024, we amended both the Securitization and Repurchase Facilities to extend the terms of the facilities to August 27, 2025.
CHS Capital sells loan commitments it has originated to Compeer Financial, PCA, d/b/a ProPartners Financial on a recourse basis. The total commitments under the program were $100.0 million; however, no amounts were borrowed under these commitments as of August 31, 2024.
CHS Capital borrows funds under short-term notes issued as part of a surplus funds program. Borrowings under this program are unsecured and are due upon demand. Borrowings under these notes totaled $143.7 million as of August 31, 2024.
Long-Term Debt
During the year ended August 31, 2024, we repaid approximately $366.1 million of long-term debt consisting of scheduled debt maturities and optional prepayments. On April 18, 2024, we entered into a Note Purchase Agreement to borrow $700.0 million of long-term debt in the form of notes; the funding of these notes took place on July 16, 2024. Amounts included in long-term debt on our Consolidated Balance Sheets as of August 31, 2024 and 2023, are presented in the table below: | | | | | | | | | | | | | | | | | |
| | | 2024 | | 2023 |
| | | (Dollars in thousands) |
| 3.85% unsecured notes $80 million face amount, due in fiscal 2025 | | $ | 80,000 | | | $ | 80,000 | |
| 3.80% unsecured notes $100 million face amount, due in fiscal 2025 | | 100,000 | | | 100,000 | |
| 4.58% unsecured notes $150 million face amount, due in fiscal 2025 | | 150,000 | | | 150,000 | |
| 4.82% unsecured notes $80 million face amount, due in fiscal 2026 | | 80,000 | | | 80,000 | |
| 4.69% unsecured notes $58 million face amount, due in fiscal 2027 | | 58,000 | | | 58,000 | |
| 3.24% unsecured notes $95 million face amount, due in fiscal 2028 | | 95,000 | | | 95,000 | |
| 4.74% unsecured notes $95 million face amount, due in fiscal 2028 | | 95,000 | | | 95,000 | |
| 5.68% unsecured notes $150 million face amount, due in fiscal 2030 | | 150,000 | | | 150,000 | |
| 3.48% unsecured notes $100 million face amount, due in fiscal 2031 | | 100,000 | | | 100,000 | |
| 4.89% unsecured notes $100 million face amount, due in fiscal 2031 | | 100,000 | | | 100,000 | |
| 5.84% unsecured notes $150 million face amount, due in fiscal 2032 | | 150,000 | | | — | |
| 3.58% unsecured notes $65 million face amount, due in fiscal 2033 | | 65,000 | | | 65,000 | |
| 4.71% unsecured notes $100 million face amount, due in fiscal 2033 | | 100,000 | | | 100,000 | |
| 5.93% unsecured notes $150 million face amount, due in fiscal 2034 | | 150,000 | | | — | |
| 3.73% unsecured notes $115 million face amount, due in fiscal 2036 | | 115,000 | | | 115,000 | |
| 5.40% unsecured notes $125 million face amount, due in fiscal 2036 | | 125,000 | | | 125,000 | |
| 6.05% unsecured notes $150 million face amount, due in fiscal 2037 | | 150,000 | | | — | |
| 6.13% unsecured notes $250 million face amount, due in fiscal 2039 | | 250,000 | | | — | |
| Private placement debt | | 2,113,000 | | | 1,413,000 | |
| 6.85% unsecured term loan from cooperative and other banks, due in fiscal 2026 (a) | | 1,000 | | | 366,000 | |
| Term loan | | 1,000 | | | 366,000 | |
| Finance lease liabilities | | 49,511 | | | 49,235 | |
| | | | |
| Deferred financing costs | | (4,562) | | | (3,127) | |
| Other, including notes and contracts with interest rates from 3.9% to 9.0% | | 2,511 | | | 2,550 | |
| Total long-term debt | | 2,161,460 | | | 1,827,658 | |
| Less current portion | | 337,266 | | | 7,839 | |
| Long-term portion | | $ | 1,824,194 | | | $ | 1,819,819 | |
| (a) Borrowings are variable under the agreement and bear interest at a base rate plus an applicable margin. | | | | |
As of August 31, 2024, the fair value of our long-term debt is estimated to be $2.1 billion based on quoted market prices of similar debt (a Level 2 fair value measurement based on the classification hierarchy of ASC Topic 820, Fair Value Measurement).
On October 29, 2024, we amended our 10-year term loan facility (the “Facility”). The amendment reduced the size of the Facility to $300.0 million, and converted it into a revolving loan, which can be paid down and readvanced in an amount up to the referenced $300.0 million until October 29, 2025. On October 29, 2025, the total funded loan balance outstanding reverts to a nonrevolving term loan that is payable on October 29, 2029. The Facility does have an option to extend the revolving period for an additional year at our choosing. Any extension would not change the final payable date of October 29, 2029. There was $1.0 million outstanding under this facility as of August 31, 2024.
Long-term debt outstanding as of August 31, 2024, has aggregate maturities, excluding fair value adjustments and finance leases (see Note 19, Leases, for a schedule of minimum future lease payments under finance leases), as follows: | | | | | |
| | (Dollars in thousands) |
| 2025 | $ | 330,620 | |
| 2026 | 81,620 | |
| 2027 | 58,621 | |
| 2028 | 190,600 | |
| 2029 | 150 | |
| Thereafter | 1,455,000 | |
| Total | $ | 2,116,611 | |
Interest expense for the years ended August 31, 2024, 2023 and 2022, was $104.1 million, $137.4 million and $114.2 million, respectively, net of capitalized interest of $25.7 million, $14.0 million and $6.1 million, respectively.
Note 10 Other Current Liabilities
Other current liabilities as of August 31, 2024 and 2023, are as follows: | | | | | | | | | | | |
| 2024 | | 2023 |
| (Dollars in thousands) |
| Customer margin deposits and credit balances | $ | 95,369 | | | $ | 197,315 | |
| Customer advance payments | 337,045 | | | 356,760 | |
| Derivative liabilities (Note 15) | 243,068 | | | 355,696 | |
| Dividends and equity payable (Note 12) | 600,000 | | | 730,000 | |
| Total other current liabilities | $ | 1,275,482 | | | $ | 1,639,771 | |
Note 11 Income Taxes
CHS is a nonexempt agricultural cooperative and files a consolidated federal income tax return within our tax return period. We are subject to tax on income from nonpatronage sources, nonqualified patronage distributions and undistributed patronage-sourced income. Income tax expense (benefit) is primarily the current tax payable for the period and the change during the period in certain deferred tax assets and liabilities. Deferred income taxes reflect the impact of temporary differences between the amounts of assets and liabilities recognized under U.S. GAAP and such amounts recognized for federal and state income tax purposes, based on enacted tax laws and statutory tax rates applicable to the periods in which the differences are expected to affect taxable income.
The provision for (benefit from) income taxes for the years ended August 31, 2024, 2023 and 2022 is as follows: | | | | | | | | | | | | | | | | | |
| 2024 | | 2023 | | 2022 |
| | (Dollars in thousands) |
| Current: | | | | | |
| Federal | $ | 21,608 | | | $ | 66,672 | | | $ | 56,582 | |
| State | 23,750 | | | 36,925 | | | 24,224 | |
| Foreign | 30,338 | | | 3,735 | | | 9,833 | |
| Total current | 75,696 | | | 107,332 | | | 90,639 | |
| Deferred: | | | | | |
| Federal | (63,605) | | | 7,799 | | | 41,710 | |
| State | (15,686) | | | (7,661) | | | 491 | |
| Foreign | (1,277) | | | 185 | | | (724) | |
| Total deferred | (80,568) | | | 323 | | | 41,477 | |
| Total | $ | (4,872) | | | $ | 107,655 | | | $ | 132,116 | |
Domestic income before income taxes was $1.0 billion, $2.0 billion and $1.8 billion for the years ended August 31, 2024, 2023 and 2022, respectively. Foreign income (loss) before income taxes was $66.9 million, $55.4 million and ($4.9) million for the years ended August 31, 2024, 2023 and 2022, respectively.
Deferred tax assets and liabilities as of August 31, 2024 and 2023, are as follows: | | | | | | | | | | | |
| 2024 | | 2023 |
| | (Dollars in thousands) |
| Deferred tax assets: | | | |
| Accrued expenses | $ | 56,062 | | | $ | 51,960 | |
| Postretirement health care and deferred compensation | 58,866 | | | 51,635 | |
| Tax credit carryforwards | 91,114 | | | 97,730 | |
| Loss carryforwards | 88,887 | | | 111,963 | |
| Nonqualified equity | 533,784 | | | 467,519 | |
| Lease obligations | 52,980 | | | 62,225 | |
| Capitalized research and development | 69,556 | | | 17,941 | |
| Other | 19,592 | | | 25,223 | |
| Deferred tax assets valuation allowance | (166,590) | | | (182,466) | |
| Total deferred tax assets | 804,251 | | | 703,730 | |
| Deferred tax liabilities: | | | |
| Pension costs | 7,003 | | | 10,596 | |
| Investments | 130,171 | | | 129,683 | |
| | | |
| Property, plant and equipment | 618,419 | | | 625,403 | |
| Lease right of use assets | 51,872 | | | 60,501 | |
| | | |
| Total deferred tax liabilities | 807,465 | | | 826,183 | |
| Net deferred tax liabilities | $ | 3,214 | | | $ | 122,453 | |
We had total gross loss carryforwards of $275.5 million, as of August 31, 2024, of which $62.8 million will expire over periods ranging from fiscal 2025 to fiscal 2035. The remainder will carry forward indefinitely. Based on estimates of future taxable profits and losses in certain foreign tax jurisdictions, as well as consideration of other factors, we assessed whether a valuation allowance was necessary to reduce specific foreign loss carryforwards to amounts we believe are more likely than not to be realized as of August 31, 2024. If our estimates prove inaccurate, adjustments to the valuation allowances may be required in the future with gains or losses being charged to income in the period such determination is made. Our McPherson refinery's gross state tax credit carryforwards for income tax were approximately $115.3 million and $116.6 million as of August 31, 2024 and 2023, respectively. The refinery's valuation allowance on Kansas state credits is necessary due to the limited amount of taxable income generated in Kansas by the combined group on an annual basis. Our state tax credits of $115.3 million will begin to expire during fiscal 2025.
The reconciliation of the statutory federal income tax rates to the effective tax rates for the years ended August 31, 2024, 2023 and 2022 is as follows: | | | | | | | | | | | | | | | | | |
| 2024 | | 2023 | | 2022 |
| Statutory federal income tax rate | 21.0 | % | | 21.0 | % | | 21.0 | % |
| State and local income taxes, net of federal income tax benefit | 0.5 | | | 1.1 | | | 1.1 | |
| Patronage earnings | (12.6) | | | (13.0) | | | (13.6) | |
| Domestic production activities deduction | (6.8) | | | (3.2) | | | (3.2) | |
| Export activities at rates other than the U.S. statutory rate | 1.4 | | | (0.2) | | | 0.4 | |
| Intercompany transfer of business assets | — | | | — | | | (0.1) | |
| Increase in unrecognized tax benefits | 2.7 | | | — | | | — | |
| Valuation allowance | (0.1) | | | — | | | 0.2 | |
| Tax credits | (6.2) | | | — | | | — | |
| Other | (0.3) | | | (0.3) | | | 1.5 | |
| Effective tax rate | (0.4) | % | | 5.4 | % | | 7.3 | % |
Primary drivers of fiscal 2024 income tax benefit were decreased nonpatronage earnings compared to fiscal 2023, recognition of research and development tax credits and the current Domestic Production Activities Deduction ("DPAD") benefit. Primary drivers of the fiscal 2023 and 2022 income tax expense were increased nonpatronage earnings and other nondeductible items, which were partially offset by the current DPAD benefit.
We file income tax returns in the U.S. federal jurisdiction, as well as various state and foreign jurisdictions. Our uncertain tax positions are affected by the tax years that are under audit or remain subject to examination by the relevant taxing authorities. Fiscal years 2017 and 2019 remain subject to examination for certain issues.
Reserves are recorded against unrecognized tax benefits when we believe certain fully supportable tax return positions are likely to be challenged and we may or may not prevail. If we determine that a tax position is more likely than not to be sustained upon audit, based on the technical merits of the position, we recognize the benefit by measuring the amount that is greater than 50% likely of being realized. We reevaluate the technical merits of our tax positions and recognize an uncertain tax benefit, or derecognize a previously recorded tax benefit, when there is (i) completion of a tax audit, (ii) effective settlement of an issue, (iii) a change in applicable tax law including a tax case or legislative guidance, or (iv) expiration of the applicable statute of limitations. Significant judgment is required in accounting for tax reserves. A reconciliation of the gross beginning and ending amounts of unrecognized tax benefits for the periods is presented as follows: | | | | | | | | | | | | | | | | | |
| 2024 | | 2023 | | 2022 |
| | (Dollars in thousands) |
| Balance at beginning of period | $ | 125,853 | | | $ | 124,959 | | | $ | 122,149 | |
| Additions attributable to current year tax positions | 2,027 | | | — | | | — | |
| Additions attributable to prior year tax positions | 32,569 | | | 894 | | | 2,810 | |
| Reductions attributable to prior year tax positions | (85,513) | | | — | | | — | |
| Reductions attributable to statute expiration | (9,821) | | | — | | | — | |
| Balance at end of period | $ | 65,115 | | | $ | 125,853 | | | $ | 124,959 | |
If we were to prevail on all positions taken in relation to uncertain tax positions, $65.1 million of the unrecognized tax benefits would ultimately benefit our effective tax rate. It is reasonably possible that the total amount of unrecognized tax benefits could significantly change in the next 12 months.
We recognize interest and penalties related to unrecognized tax benefits in our provision for income taxes. We recognized benefits of $2.1 million, $0.8 million and $0.7 million for interest and penalties related to unrecognized tax benefits in our Consolidated Statements of Operations for the years ended August 31, 2024, 2023 and 2022, respectively, and a related $6.2 million and $3.7 million interest payable on our Consolidated Balance Sheets as of August 31, 2024 and 2023, respectively.
Note 12 Equities
Patronage and Equity Redemptions
In accordance with our bylaws and by action of the Board of Directors, annual net earnings from patronage sources are distributed to consenting patrons following the close of each fiscal year and are based on amounts using financial statement earnings. The cash portion of the qualified patronage distribution, if any, is determined annually by the Board of Directors, with the balance issued in the form of qualified and/or nonqualified capital equity certificates. Total patronage distributions for fiscal 2024 are estimated to be $659.7 million, with the qualified cash portion estimated to be $300.0 million, estimated qualified equity distributions of $77.3 million and estimated nonqualified equity distributions of $282.4 million.
The following table presents estimated patronage distributions for the year ending August 31, 2024, and actual patronage distributions for the years ended August 31, 2023, 2022 and 2021: | | | | | | | | | | | | | | | | | | | | | | | |
| 2025 | | 2024 | | 2023 | | 2022 |
| | (Dollars in millions) |
| Patronage distributed in cash | $ | 300.0 | | | $ | 366.0 | | | $ | 503.1 | | | $ | 51.0 | |
| Patronage distributed in equity | 359.7 | | | 877.3 | | | 670.9 | | | 235.6 | |
| Total patronage distributed | $ | 659.7 | | | $ | 1,243.3 | | | $ | 1,174.0 | | | $ | 286.6 | |
Annual net earnings from patronage or other sources may be added to the unallocated capital reserve or, upon action by the Board of Directors, may be allocated to members in the form of nonpatronage equity certificates. The Board of Directors authorized, in accordance with our bylaws, that 10% of the earnings from patronage business for fiscal 2024, 2023 and 2022 be added to our capital reserves.
Redemptions of outstanding equity are at the discretion of the Board of Directors. Redemptions of capital equity certificates approved by the Board of Directors are divided into two pools, one for nonindividuals (primarily member cooperatives) who may participate in an annual redemption program for qualified equities held by them and another for individual members who are eligible for equity redemptions at age 70 or upon death. In accordance with authorization from the Board of Directors, we expect total redemptions related to the year ended August 31, 2024, which will be distributed in fiscal 2025, to be approximately $300.0 million. This amount is classified as a current liability on our August 31, 2024, Consolidated Balance Sheet. During the years ended August 31, 2024, 2023 and 2022, we redeemed in cash, outstanding owners' equities in accordance with authorization from the Board of Directors, in the amounts of $355.9 million, $495.8 million and $111.8 million, respectively.
Preferred Stock
The following is a summary of our outstanding preferred stock as of August 31, 2024, all shares of which are listed on the Global Select Market of The Nasdaq: | | | | | | | | | | | | | | | | | | | | | | | | | | | | | | | | | | | | | | | | | | | | | | | | | | |
| | Nasdaq Symbol | | Issuance Date | | Shares Outstanding | | Redemption Value | | Net Proceeds (a) | | Dividend Rate
(b) (c) | | Dividend Payment Frequency | | Redeemable Beginning (d) |
| | | | | | | | (Dollars in millions) | | | | | | |
| 8% Cumulative Redeemable | | CHSCP | | (e) | | 12,272,003 | | | $ | 306.8 | | | $ | 311.2 | | | 8.00 | % | | Quarterly | | 7/18/2023 |
| Class B Cumulative Redeemable, Series 1 | | CHSCO | | (f) | | 21,459,066 | | | 536.5 | | | 569.3 | | | 7.875 | % | | Quarterly | | 9/26/2023 |
| Class B Reset Rate Cumulative Redeemable, Series 2 | | CHSCN | | 3/11/2014 | | 16,800,000 | | | 420.0 | | | 406.2 | | | 7.10 | % | | Quarterly | | 3/31/2024 |
| Class B Reset Rate Cumulative Redeemable, Series 3 | | CHSCM | | 9/15/2014 | | 19,700,000 | | | 492.5 | | | 476.7 | | | 6.75 | % | | Quarterly | | 9/30/2024 |
| Class B Cumulative Redeemable, Series 4 | | CHSCL | | 1/21/2015 | | 20,700,000 | | | 517.5 | | | 501.0 | | | 7.50 | % | | Quarterly | | 1/21/2025 |
(a) Includes patron equities redeemed with preferred stock.
(b) The Class B Reset Rate Cumulative Redeemable Preferred Stock, Series 2 accumulated dividends at a rate of 7.10% per year until March 31, 2024, and subsequently fixed at a rate of 7.10%, based on the terms of the contract and application of the Adjustable Rate (LIBOR) Act.
(c) The Class B Reset Rate Cumulative Redeemable Preferred Stock, Series 3 accumulated dividends at a rate of 6.75% per year until September 30, 2024, and subsequently fixed at a rate of 6.75%,based on the terms of the contract and application of the Adjustable Rate (LIBOR) Act.
(d) All series of preferred stock are redeemable for cash at our option, in whole or in part, at a per share price equal to the per share liquidation preference of $25.00 per share, plus all dividends accumulated and unpaid on that share to and including the date of redemption, beginning on the dates set forth in this column.
(e) The 8% Cumulative Redeemable Preferred Stock was issued at various times from 2003 through 2010.
(f) Shares of Class B Cumulative Redeemable Preferred Stock, Series 1 were issued on September 26, 2013; August 25, 2014; March 31, 2016; and March 30, 2017.
Preferred Stock Dividends
We made dividend payments on our preferred stock of $168.7 million during each of the years ended August 31, 2024, 2023 and 2022. As of August 31, 2024, the Board of Directors had not authorized the issuance of any preferred shares that were not outstanding.
The following is a summary of dividends per share by series of preferred stock for the years ended August 31, 2024 and 2023: | | | | | | | | | | | | | | | | | |
| | | Years Ended August 31, |
| Nasdaq Symbol | | 2024 | | 2023 |
| | | (Dollars per share) |
| 8% Cumulative Redeemable | CHSCP | | $ | 2.00 | | | $ | 2.00 | |
| Class B Cumulative Redeemable, Series 1 | CHSCO | | 1.97 | | | 1.97 | |
| Class B Reset Rate Cumulative Redeemable, Series 2 | CHSCN | | 1.78 | | | 1.78 | |
| Class B Reset Rate Cumulative Redeemable, Series 3 | CHSCM | | 1.69 | | | 1.69 | |
| Class B Cumulative Redeemable, Series 4 | CHSCL | | 1.88 | | | 1.88 | |
Accumulated Other Comprehensive Loss
Changes in accumulated other comprehensive income (loss) by component, for the years ended August 31, 2024, 2023 and 2022 are as follows: | | | | | | | | | | | | | | | | | | | | | | | |
| Pension and Other Postretirement Benefits | | Cash Flow Hedges | | Foreign Currency Translation Adjustment | | Total |
| (Dollars in thousands) |
| Balance as of August 31, 2021, net of tax | $ | (141,385) | | | $ | 4,824 | | | $ | (79,830) | | | $ | (216,391) | |
| Other comprehensive income (loss), before tax: | | | | | | | |
| Amounts before reclassifications | (52,163) | | | (2,161) | | | (15,809) | | | (70,133) | |
| Amounts reclassified out | 22,240 | | | 7,455 | | | — | | | 29,695 | |
| Total other comprehensive income (loss), before tax | (29,923) | | | 5,294 | | | (15,809) | | | (40,438) | |
| Tax effect | 2,668 | | | (1,275) | | | 101 | | | 1,494 | |
| Other comprehensive income (loss), net of tax | (27,255) | | | 4,019 | | | (15,708) | | | (38,944) | |
| Balance as of August 31, 2022, net of tax | (168,640) | | | 8,843 | | | (95,538) | | | (255,335) | |
| Other comprehensive income (loss), before tax: | | | | | | | |
| Amounts before reclassifications | (13,596) | | | (25,024) | | | 1,829 | | | (36,791) | |
| Amounts reclassified out | 93 | | | 16,044 | | | — | | | 16,137 | |
| Total other comprehensive income (loss), before tax | (13,503) | | | (8,980) | | | 1,829 | | | (20,654) | |
| Tax effect | 8,218 | | | 2,169 | | | 207 | | | 10,594 | |
| Other comprehensive income (loss), net of tax | (5,285) | | | (6,811) | | | 2,036 | | | (10,060) | |
| Balance as of August 31, 2023, net of tax | (173,925) | | | 2,032 | | | (93,502) | | | (265,395) | |
| Other comprehensive income (loss), before tax: | | | | | | | |
| Amounts before reclassifications | (29,445) | | | 14,950 | | | (10,249) | | | (24,744) | |
| Amounts reclassified out | 180 | | | (15,287) | | | 1,227 | | | (13,880) | |
| Total other comprehensive loss, before tax | (29,265) | | | (337) | | | (9,022) | | | (38,624) | |
| Tax effect | 7,217 | | | 82 | | | 178 | | | 7,477 | |
| Other comprehensive loss, net of tax | (22,048) | | | (255) | | | (8,844) | | | (31,147) | |
| Balance as of August 31, 2024, net of tax | $ | (195,973) | | | $ | 1,777 | | | $ | (102,346) | | | $ | (296,542) | |
| | | | | | | |
| | | | | | | |
Amounts reclassified from accumulated other comprehensive income (loss) were related to pension and other postretirement benefits, cash flow hedges and foreign currency translation adjustments. Pension and other postretirement reclassifications include amortization of net actuarial loss, prior service credit and transition amounts and are recorded as cost of goods sold and marketing, general and administrative expenses (see Note 13, Benefit Plans, for further information). As described in Note 15, Derivative Financial Instruments and Hedging Activities, amounts reclassified from accumulated other comprehensive loss for cash flow hedges are recorded in cost of goods sold. Gains or losses on foreign currency translation reclassifications are recorded in other income.
Note 13 Benefit Plans
We have various pension and other defined benefits as well as defined contribution plans in which substantially all employees may participate. We also have nonqualified supplemental executive and Board retirement plans. We provide defined life insurance and health care benefits for certain retired employees and Board of Directors participants. The plan is contributory based on years of service and family status, with retiree contributions adjusted annually.
Financial information on changes in projected benefit obligation, plan assets funded and balance sheet status as of August 31, 2024 and 2023, is as follows: | | | | | | | | | | | | | | | | | | | | | | | | | | | | | | | | | | | |
| Qualified
Pension Benefits | | Nonqualified
Pension Benefits | | Other Benefits |
| | 2024 | | 2023 | | 2024 | | 2023 | | 2024 | | 2023 |
| | (Dollars in thousands) |
| Change in benefit obligation: | | | | | | | | | | | |
| Projected benefit obligation at beginning of period | $ | 708,511 | | | $ | 759,173 | | | $ | 20,980 | | | $ | 18,257 | | | $ | 22,572 | | | $ | 24,524 | |
| Service cost | 37,391 | | | 38,579 | | | 1,968 | | | 1,840 | | | 650 | | | 670 | |
| Interest cost | 35,928 | | | 30,588 | | | 1,043 | | | 741 | | | 1,144 | | | 1,035 | |
| Actuarial loss (gain): | | | | | | | | | | | |
| Experience study and mortality updates | 2,988 | | | 2,573 | | | 244 | | | 159 | | | — | | | — | |
| Other demographic experience* | 18,647 | | | 5,181 | | | 3,217 | | | 1,999 | | | 1,465 | | | (553) | |
| Discount rate change | 21,372 | | | (45,216) | | | 626 | | | (876) | | | 681 | | | (1,312) | |
| Plan amendments | 223 | | | 490 | | | — | | | — | | | — | | | — | |
| | | | | | | | | | | |
| Benefits paid | (64,297) | | | (82,857) | | | (1,635) | | | (1,140) | | | (1,725) | | | (1,792) | |
| Projected benefit obligation at end of period | $ | 760,763 | | | $ | 708,511 | | | $ | 26,443 | | | $ | 20,980 | | | $ | 24,787 | | | $ | 22,572 | |
| Change in plan assets: | | | | | | | | | | | |
| Fair value of plan assets at beginning of period | $ | 736,150 | | | $ | 787,422 | | | $ | — | | | $ | — | | | $ | — | | | $ | — | |
| Actual (loss) gain on plan assets | 67,559 | | | (8,415) | | | — | | | — | | | — | | | — | |
| Company contributions | 42,000 | | | 40,000 | | | 1,635 | | | 1,140 | | | 1,725 | | | 1,792 | |
| | | | | | | | | | | |
| Benefits paid | (64,297) | | | (82,857) | | | (1,635) | | | (1,140) | | | (1,725) | | | (1,792) | |
| Fair value of plan assets at end of period | $ | 781,412 | | | $ | 736,150 | | | $ | — | | | $ | — | | | $ | — | | | $ | — | |
| Funded status at end of period | $ | 20,649 | | | $ | 27,639 | | | $ | (26,443) | | | $ | (20,980) | | | $ | (24,787) | | | $ | (22,572) | |
| Amounts recognized on balance sheet: | | | | | | | | | | | |
| Noncurrent assets | $ | 20,649 | | | $ | 27,639 | | | $ | — | | | $ | — | | | $ | — | | | $ | — | |
| Accrued benefit cost: | | | | | | | | | | | |
| Current liabilities | — | | | — | | | (3,950) | | | (2,880) | | | (2,080) | | | (2,170) | |
| Noncurrent liabilities | — | | | — | | | (22,493) | | | (18,100) | | | (22,707) | | | (20,402) | |
| Ending balance | $ | 20,649 | | | $ | 27,639 | | | $ | (26,443) | | | $ | (20,980) | | | $ | (24,787) | | | $ | (22,572) | |
| Amounts recognized in accumulated other comprehensive loss (pretax): | | | | | | | | | | | |
| Prior service cost (credit) | $ | 1,216 | | | $ | 1,172 | | | $ | (47) | | | $ | (160) | | | $ | (935) | | | $ | (1,380) | |
| Net loss (gain) | 269,122 | | | 247,609 | | | 8,001 | | | 4,294 | | | (14,335) | | | (18,096) | |
| Ending balance | $ | 270,338 | | | $ | 248,781 | | | $ | 7,954 | | | $ | 4,134 | | | $ | (15,270) | | | $ | (19,476) | |
*Other demographic experience is comprised of all demographic experience different than anticipated, including terminations, retirements, deaths, pay, etc.
The accumulated benefit obligation of the qualified pension plans was $727.9 million and $678.4 million as of August 31, 2024 and 2023, respectively. The accumulated benefit obligation of the nonqualified pension plans was $26.2 million and $20.9 million as of August 31, 2024 and 2023, respectively.
Information for the pension plans with an accumulated benefit obligation in excess of plan assets is set forth below: | | | | | | | | | | | |
| Years Ended August 31, |
| 2024 | | 2023 |
| (Dollars in thousands) |
| Projected benefit obligation | $ | 26,443 | | | $ | 20,980 | |
| Accumulated benefit obligation | 26,173 | | | 20,908 | |
| | | |
Components of net periodic benefit costs for the years ended August 31, 2024, 2023 and 2022, are as follows: | | | | | | | | | | | | | | | | | | | | | | | | | | | | | | | | | | | | | | | | | | | | | | | | | | | | | |
| Qualified
Pension Benefits | | Nonqualified
Pension Benefits | | Other Benefits |
| 2024 | | 2023 | | 2022 | | 2024 | | 2023 | | 2022 | | 2024 | | 2023 | | 2022 |
| (Dollars in thousands) |
| Components of net periodic benefit costs: | | | | | | | | | | | | | | | | | |
| Service cost | $ | 37,391 | | | $ | 38,579 | | | $ | 46,275 | | | $ | 1,968 | | | $ | 1,840 | | | $ | 926 | | | $ | 650 | | | $ | 670 | | | $ | 996 | |
| Interest cost | 35,928 | | | 30,588 | | | 17,167 | | | 1,043 | | | 741 | | | 281 | | | 1,144 | | | 1,035 | | | 503 | |
| Expected return on assets | (47,860) | | | (43,129) | | | (43,958) | | | — | | | — | | | — | | | — | | | — | | | — | |
| | | | | | | | | | | | | | | | | |
| Prior service cost (credit) amortization | 178 | | | 149 | | | 174 | | | (114) | | | (114) | | | (114) | | | (445) | | | (445) | | | (445) | |
| Actuarial loss (gain) amortization | 1,796 | | | 1,872 | | | 23,406 | | | 380 | | | 245 | | | 478 | | | (1,616) | | | (1,615) | | | (1,259) | |
| Net periodic benefit cost (benefit) | $ | 27,433 | | | $ | 28,059 | | | $ | 43,064 | | | $ | 3,277 | | | $ | 2,712 | | | $ | 1,571 | | | $ | (267) | | | $ | (355) | | | $ | (205) | |
Components of net periodic benefit costs and amounts recognized in other comprehensive loss (income) for the years ended August 31, 2024, 2023 and 2022, are as follows: | | | | | | | | | | | | | | | | | | | | | | | | | | | | | | | | | | | | | | | | | | | | | | | | | | | | | |
| Qualified
Pension Benefits | | Nonqualified
Pension Benefits | | Other Benefits |
| | 2024 | | 2023 | | 2022 | | 2024 | | 2023 | | 2022 | | 2024 | | 2023 | | 2022 |
| | (Dollars in thousands) |
| Other comprehensive loss (income): | | | | | | | | | | | | | | | | | |
| Prior service cost | $ | 223 | | | $ | 490 | | | $ | 132 | | | $ | — | | | $ | — | | | $ | — | | | $ | — | | | $ | — | | | $ | — | |
| Net actuarial loss (gain) | 23,309 | | | 14,082 | | | 59,020 | | | 4,087 | | | 1,282 | | | (1,537) | | | 2,145 | | | (1,865) | | | (4,243) | |
| Amortization of actuarial (gain) loss | (1,796) | | | (1,872) | | | (23,406) | | | (380) | | | (245) | | | (478) | | | 1,616 | | | 1,615 | | | 1,259 | |
| Amortization of prior service (credit) costs | (178) | | | (149) | | | (174) | | | 114 | | | 114 | | | 114 | | | 445 | | | 445 | | | 445 | |
| Settlement of retiree obligations (a) | — | | | — | | | — | | | — | | | — | | | (307) | | | — | | | — | | | — | |
| | | | | | | | | | | | | | | | | |
| Total recognized in other comprehensive loss (income) | $ | 21,558 | | | $ | 12,551 | | | $ | 35,572 | | | $ | 3,821 | | | $ | 1,151 | | | $ | (2,208) | | | $ | 4,206 | | | $ | 195 | | | $ | (2,539) | |
(a) Reflects amounts reclassified from accumulated other comprehensive loss (income) to net earnings.
Estimated amortization in fiscal 2025 from accumulated other comprehensive loss into net periodic benefit cost is as follows: | | | | | | | | | | | | | | | | | |
| Qualified
Pension Benefits | | Nonqualified
Pension Benefits | | Other
Benefits |
| | (Dollars in thousands) |
| Amortization of prior service costs (credit) | $ | 199 | | | $ | (47) | | | $ | (445) | |
| Amortization of actuarial loss (gain) | 12,815 | | | 799 | | | (1,192) | |
Plan assumptions for the years ended August 31, 2024, 2023 and 2022, are as follows: | | | | | | | | | | | | | | | | | | | | | | | | | | | | | | | | | | | | | | | | | | | | | | | | | | | | | |
| Qualified
Pension Benefits | | Nonqualified
Pension Benefits | | Other Benefits |
| 2024 | | 2023 | | 2022 | | 2024 | | 2023 | | 2022 | | 2024 | | 2023 | | 2022 |
| Weighted-average assumptions to determine the net periodic benefit cost: | | | | | | | | | | | | | | | | | |
| Interest credit rate | 4.80 | % | | 4.65 | % | | 4.65 | % | | 4.80 | % | | 4.65 | % | | 4.65 | % | | N/A | | N/A | | N/A |
| Discount rate | 5.38 | % | | 4.69 | % | | 2.80 | % | | 5.22 | % | | 4.48 | % | | 2.04 | % | | 5.33 | % | | 4.64 | % | | 2.57 | % |
| Expected return on plan assets | 5.64 | % | | 4.88 | % | | 4.88 | % | | N/A | | N/A | | N/A | | N/A | | N/A | | N/A |
| Rate of compensation increase | 4.98 | % | | 4.93 | % | | 4.79 | % | | 4.98 | % | | 4.93 | % | | 4.79 | % | | N/A | | N/A | | N/A |
| Weighted-average assumptions to determine the benefit obligations: | | | | | | | | | | | | | | | | | |
| Interest credit rate | 4.68 | % | | 4.80 | % | | 4.65 | % | | 4.68 | % | | 4.80 | % | | 4.65 | % | | N/A | | N/A | | N/A |
| Discount rate | 5.09 | % | | 5.38 | % | | 4.69 | % | | 4.78 | % | | 5.23 | % | | 4.49 | % | | 5.01 | % | | 5.33 | % | | 4.64 | % |
| Rate of compensation increase | 4.98 | % | | 4.98 | % | | 4.93 | % | | 4.98 | % | | 4.98 | % | | 4.93 | % | | N/A | | N/A | | N/A |
A significant assumption for pension costs and obligations is the discount rate. We use a full-yield curve approach by applying the specific spot rates along the yield curve used in the determination of the benefit obligation to the relevant projected cash flows. The discount rate reflects the rate at which the associated benefits could be effectively settled as of the measurement date. In estimating this rate, we look at rates of return on fixed-income investments of similar duration to the liabilities in the plans that receive high investment-grade ratings by recognized ratings agencies.
An annual analysis of the risk versus the return of the investment portfolio is conducted to justify the expected long-term rate of return assumption. We generally use long-term historical return information for the targeted asset mix identified in asset and liability studies. Adjustments are made to the expected long-term rate of return assumption when deemed necessary, based upon revised expectations of future investment performance of the overall investment markets.
For measurement purposes, an 8.7% annual rate of increase in the per capita cost of covered health care benefits was assumed for the year ended August 31, 2024. The rate was assumed to decrease gradually to 4.5% by 2034 and remain at that level thereafter. Assumed health care cost trend rates have a significant effect on the amounts reported for the health care plans. A one-percentage-point change in the assumed health care cost trend rates would have the following effects: | | | | | | | | | | | |
| 1% Increase | | 1% Decrease |
| | (Dollars in thousands) |
| Effect on total of service and interest cost components | $ | 190 | | | $ | 160 | |
| Effect on postretirement benefit obligation | 1,600 | | | 1,400 | |
Contributions depend primarily on market returns on the pension plan assets and minimum funding level requirements. During fiscal 2024, we made a discretionary contribution of $42.0 million to the pension plans. Based on the funded status of the qualified pension plans as of August 31, 2024, we do not currently believe we will be required to contribute to these plans in fiscal 2025, although we may voluntarily elect to do so. We expect to pay $6.0 million to participants of the nonqualified pension and postretirement benefit plans during fiscal 2025.
Our retiree benefit payments, which reflect expected future service, are anticipated to be paid as follows: | | | | | | | | | | | | | | | | | | | |
| | Qualified
Pension Benefits | | Nonqualified
Pension Benefits | | Other Benefits | | |
| | (Dollars in thousands) |
| 2025 | $ | 69,800 | | | $ | 3,950 | | | $ | 2,080 | | | |
| 2026 | 72,100 | | | 4,080 | | | 2,020 | | | |
| 2027 | 73,200 | | | 3,870 | | | 1,990 | | | |
| 2028 | 75,900 | | | 3,560 | | | 1,870 | | | |
| 2029 | 78,600 | | | 3,330 | | | 1,780 | | | |
| 2030-2034 | 366,500 | | | 14,350 | | | 8,690 | | | |
We have trusts that hold the assets for the defined benefit plans. CHS has a qualified plan committee that sets investment guidelines with the assistance of external consultants. Investment objectives for the plans' assets are as follows:
•Optimize the long-term returns on plan assets at an acceptable level of risk;
•Maintain broad diversification across asset classes and among investment managers; and
•Focus on long-term return objectives.
Asset allocation targets promote optimal expected return and volatility characteristics given the long-term time horizon for fulfilling the obligations of the pension plans. The investment portfolio contains a diversified portfolio of investment categories, including equities, fixed-income securities and real estate. Securities are also diversified in terms of domestic and international securities, short- and long-term securities, growth and value equities, large and small cap stocks, as well as active and passive management styles. Our pension plans' investment policy strategy is such that liabilities match assets. This is being accomplished through the asset portfolio mix by reducing volatility and de-risking the plans. The plans' target allocation percentages range between 45% and 80% for fixed income securities and range between 20% and 55% for equity securities.
The qualified plan committee believes that with prudent risk tolerance and asset diversification, the plans should be able to meet pension obligations in the future.
Our pension plans' recurring fair value measurements by asset category as of August 31, 2024 and 2023, are presented in the tables below: | | | | | | | | | | | | | | | | | | | | | | | |
| | 2024 |
| | Level 1 | | Level 2 | | Level 3 | | Total |
| | (Dollars in thousands) |
| Cash and cash equivalents | $ | 12,416 | | | $ | — | | | $ | — | | | $ | 12,416 | |
| Equities: | | | | | | | |
| | | | | | | |
Common/collective trust at net asset value (1) | — | | | — | | | — | | | 156,462 | |
| Fixed income securities: | | | | | | | |
| Other investments | 31,298 | | | 93,763 | | | — | | | 125,061 | |
Common/collective trust at net asset value (1) | — | | | — | | | — | | | 464,611 | |
Partnership and joint venture interests measured at net asset value (1) | — | | | — | | | — | | | 22,862 | |
| | | | | | | |
| Total | $ | 43,714 | | | $ | 93,763 | | | $ | — | | | $ | 781,412 | |
| | | | | | | | | | | | | | | | | | | | | | | |
| | 2023 |
| | Level 1 | | Level 2 | | Level 3 | | Total |
| | (Dollars in thousands) |
| Cash and cash equivalents | $ | 12,505 | | | $ | — | | | $ | — | | | $ | 12,505 | |
| Equities: | | | | | | | |
Common/collective trust at net asset value (1) | — | | | — | | | — | | | 127,225 | |
| Fixed income securities: | | | | | | | |
| Other investments | 25,143 | | | 86,315 | | | — | | | 111,458 | |
Common/collective trust at net asset value (1) | — | | | — | | | — | | | 425,180 | |
Partnership and joint venture interests measured at net asset value (1) | — | | | — | | | — | | | 59,782 | |
| | | | | | | |
| Total | $ | 37,648 | | | $ | 86,315 | | | $ | — | | | $ | 736,150 | |
(1) In accordance with ASC Topic 820-10, Fair Value Measurement, certain assets that are measured at fair value using the net asset value per share (or its equivalent) practical expedient have not been categorized in the fair value hierarchy. The fair value amounts presented in the tables above are intended to permit reconciliation of the fair value hierarchy to the amounts presented in the "Financial information on changes in projected benefit obligation, plan assets funded and balance sheet status" table above.
Definitions for valuation levels are found in Note 16, Fair Value Measurements. We use the following valuation methodologies for assets measured at fair value:
Common/collective trusts. Common/collective trusts primarily consist of equity and fixed income funds and are valued using other significant observable inputs, including quoted prices for similar investments, interest rates, prepayment speeds,
credit risks, referenced indices, quoted prices in inactive markets, adjusted quoted prices in active markets, adjusted quoted prices on foreign equity securities that were adjusted in accordance with pricing procedures approved by the trust, etc. Common/collective trust investments can be redeemed daily and without restriction. Redemption of the entire investment balance generally requires a 45- to 60-day notice period. The equity funds provide exposure to large-, mid- and small-cap U.S. equities, international large- and small-cap equities and emerging market equities. The fixed income funds provide exposure to U.S., international and emerging market debt securities.
Other investments. Other investments are comprised primarily of investments in U.S. Treasury securities which are valued using quoted market prices and classified within Level 1, as well as various government agency obligations and corporate, foreign government and municipal issue fixed income marketable securities which are valued using institutional bond or broker quotes along with various other market and industry inputs and classified within Level 2.
Partnership and joint venture interests. The net asset value of shares held by the plan at year-end is used to value these assets as a practical expedient for fair value. The net asset value is based on the fair value of the underlying assets owned by the trust, minus its liabilities, then divided by the number of units outstanding. Redemptions of these interests generally require a 45- to 60-day notice period.
During fiscal 2024 we ceased our participation in the Co-op Retirement Plan, which is a defined benefit plan constituting a multiple employer plan under the Internal Revenue Code of 1986, as amended, and a multiemployer plan under the accounting standards.
We have other contributory defined contribution plans covering substantially all employees. Total contributions by us to these plans were $43.5 million, $38.7 million and $35.0 million, for the years ended August 31, 2024, 2023 and 2022, respectively.
Note 14 Segment Reporting
We are an integrated agricultural cooperative, providing grain, food, agronomy and energy resources to businesses and consumers on a global basis. We provide a wide variety of products and services, from initial agricultural inputs such as fuels, farm supplies, crop nutrients and crop protection products, to agricultural outputs that include grain and oilseed, processed grain and oilseed, renewable fuels and food products. We define our operating segments in accordance with ASC Topic 280, Segment Reporting, to reflect the manner in which our chief operating decision maker, our Chief Executive Officer, evaluates performance and allocates resources in managing the business. We have aggregated those operating segments into three reportable segments: Energy, Ag and Nitrogen Production.
Our Energy segment produces and provides primarily for the wholesale distribution of petroleum products and transportation of those products. Our Ag segment purchases and further processes or resells grain and oilseed originated by our ag retail (formerly referred to as country operations) business, by our member cooperatives and by third parties; serves as a wholesaler and retailer of crop inputs; and produces and markets ethanol. Our Nitrogen Production segment consists of our equity method investment in CF Nitrogen that records earnings and allocated expenses but not revenues. Our supply agreement with CF Nitrogen entitles us to purchase up to a specified quantity of granular urea and UAN annually from CF Nitrogen. Corporate and Other represents our financing and hedging businesses, which primarily consists of a U.S. Commodity Futures Trading Commission-regulated futures commission merchant ("FCM") for commodities hedging and financial services related to crop production. Our nonconsolidated investments in Ventura Foods and Ardent Mills, LLC ("Ardent Mills") are also included in our Corporate and Other category.
Corporate administrative expenses and interest are allocated to each reportable segment and Corporate and Other, based on direct use of services, such as information technology and legal, and other factors or considerations relevant to the costs incurred.
Many of our business activities are highly seasonal and our operating results vary throughout the year. Our revenues and IBIT generally trend lower during the second fiscal quarter and increase in the third fiscal quarter. For example, in our Ag segment, our ag retail business generally experiences higher volumes and revenues during the fall harvest and spring planting seasons, which generally correspond to our first and third fiscal quarters, respectively. Additionally, our agronomy business generally experiences higher volumes and revenues during the spring planting season. Our global grain and processing operations are subject to fluctuations in volume and revenues based on producer harvests, world grain prices, demand and international trade relationships. Our Energy segment generally experiences higher volumes and revenues in certain operating areas, such as refined products, in the spring, summer and early fall when gasoline and diesel fuel use by agricultural producers is highest and is subject to global supply and demand forces. Other energy products, such as propane, generally experience higher volumes and revenues during the winter heating and fall crop-drying seasons.
Our revenues, assets and cash flows can be significantly affected by global market prices for commodities such as petroleum products, natural gas, grain, oilseed, crop nutrients and flour. Changes in market prices for commodities that we purchase without a corresponding change in the selling prices of those products can affect revenues and operating earnings. Commodity prices are affected by a wide range of factors beyond our control, including weather, crop damage due to plant disease or insects, drought, availability and adequacy of supply, availability of reliable rail and river transportation networks, outbreaks of disease, government regulations and policies, global trade disputes, wars and civil unrest, and general political and economic conditions.
While our revenues and operating results are derived primarily from businesses and operations that are wholly-owned or subsidiaries and limited liability companies in which we have a controlling interest, a portion of our business operations are conducted through companies in which we hold ownership interests of 50% or less or do not control the operations. We account for these investments primarily using the equity method of accounting, wherein we record our proportionate share of income or loss reported by the entity as equity income from investments, without consolidating the revenues and expenses of the entity in our Consolidated Statements of Operations. In our Ag segment, this includes our 50% interest in TEMCO, LLC ("TEMCO") and our 50% interest in Producer Ag, LLC ("Producer Ag"). In our Nitrogen Production segment, this consists of our approximate 8.4% membership interest (based on product tons) in CF Nitrogen. In Corporate and Other, this principally includes our 50% ownership in Ventura Foods and our 12% ownership in Ardent Mills. See Note 6, Investments, for more information related to our equity method investments.
Reconciling amounts represent the elimination of revenues between segments. Such transactions are executed at market prices to more accurately evaluate the profitability of the individual business segments.
Segment information for the years ended August 31, 2024, 2023 and 2022, is presented in the tables below. | | | | | | | | | | | | | | | | | | | | | | | | | | | | | | | | | | | |
| Energy | | Ag | | Nitrogen Production | | Corporate
and Other | | Reconciling
Amounts | | Total |
| Year ended August 31, 2024 | (Dollars in thousands) |
| Revenues, including intersegment revenues | $ | 9,339,079 | | | $ | 30,432,758 | | | $ | — | | | $ | 94,113 | | | $ | (604,721) | | | $ | 39,261,229 | |
| Intersegment revenues | (572,584) | | | (15,899) | | | — | | | (16,238) | | | 604,721 | | | — | |
| Revenues, net of intersegment revenues | $ | 8,766,495 | | | $ | 30,416,859 | | | $ | — | | | $ | 77,875 | | | $ | — | | | $ | 39,261,229 | |
| Operating earnings (loss) | 403,854 | | | 241,327 | | | (71,530) | | | 10,707 | | | — | | | 584,358 | |
| | | | | | | | | | | |
| Interest expense | (16,773) | | | 61,982 | | | 61,942 | | | 22,027 | | | (25,114) | | | 104,064 | |
| Other income | (11,283) | | | (98,142) | | | (9,176) | | | (44,143) | | | 25,114 | | | (137,630) | |
| Equity (income) losses from investments | 2,857 | | | (65,190) | | | (275,531) | | | (141,999) | | | — | | | (479,863) | |
| Income before income taxes | $ | 429,053 | | | $ | 342,677 | | | $ | 151,235 | | | $ | 174,822 | | | $ | — | | | $ | 1,097,787 | |
| | | | | | | | | | | |
| Capital expenditures | $ | 204,151 | | | $ | 426,291 | | | $ | — | | | $ | 178,321 | | | $ | — | | | $ | 808,763 | |
| Depreciation and amortization | $ | 255,795 | | | $ | 178,400 | | | $ | — | | | $ | 47,529 | | | $ | — | | | $ | 481,724 | |
| Total assets as of August 31, 2024 | $ | 4,262,974 | | | $ | 7,279,846 | | | $ | 2,544,530 | | | $ | 4,627,725 | | | $ | — | | | $ | 18,715,075 | |
| | | | | | | | | | | | | | | | | | | | | | | | | | | | | | | | | | | |
| Energy | | Ag | | Nitrogen Production | | Corporate
and Other | | Reconciling
Amounts | | Total |
| Year ended August 31, 2023 | (Dollars in thousands) |
| Revenues, including intersegment revenues | $ | 10,761,503 | | | $ | 35,456,969 | | | $ | — | | | $ | 82,107 | | | $ | (710,575) | | | $ | 45,590,004 | |
| Intersegment revenues | (664,590) | | | (31,765) | | | — | | | (14,220) | | | 710,575 | | | — | |
| Revenues, net of intersegment revenues | $ | 10,096,913 | | | $ | 35,425,204 | | | $ | — | | | $ | 67,887 | | | $ | — | | | $ | 45,590,004 | |
| Operating earnings (loss) | 1,071,492 | | | 346,137 | | | (73,828) | | | (301) | | | — | | | 1,343,500 | |
| Interest expense | 7,672 | | | 71,115 | | | 60,090 | | | 31,487 | | | (32,922) | | | 137,442 | |
| Other income | (19,456) | | | (88,061) | | | — | | | (37,536) | | | 32,922 | | | (112,131) | |
| Equity (income) losses from investments | 7,833 | | | (48,725) | | | (394,678) | | | (254,020) | | | — | | | (689,590) | |
| Income before income taxes | $ | 1,075,443 | | | $ | 411,808 | | | $ | 260,760 | | | $ | 259,768 | | | $ | — | | | $ | 2,007,779 | |
| | | | | | | | | | | |
| Capital expenditures | $ | 204,003 | | | $ | 308,690 | | | $ | — | | | $ | 51,829 | | | $ | — | | | $ | 564,522 | |
| Depreciation and amortization | $ | 254,115 | | | $ | 166,982 | | | $ | — | | | $ | 43,518 | | | $ | — | | | $ | 464,615 | |
| Total assets as of August 31, 2023 | $ | 4,313,240 | | | $ | 7,095,283 | | | $ | 2,577,391 | | | $ | 4,971,504 | | | $ | — | | | $ | 18,957,418 | |
| | | | | | | | | | | | | | | | | | | | | | | | | | | | | | | | | | | |
| Energy | | Ag | | Nitrogen Production | | Corporate
and Other | | Reconciling
Amounts | | Total |
| Year ended August 31, 2022 | (Dollars in thousands) |
| Revenues, including intersegment revenues | $ | 10,964,304 | | | $ | 37,489,203 | | | $ | — | | | $ | 45,278 | | | $ | (707,119) | | | $ | 47,791,666 | |
| Intersegment revenues | (669,530) | | | (28,992) | | | — | | | (8,597) | | | 707,119 | | | — | |
| Revenues, net of intersegment revenues | $ | 10,294,774 | | | $ | 37,460,211 | | | $ | — | | | $ | 36,681 | | | $ | — | | | $ | 47,791,666 | |
| Operating earnings (loss) | 633,832 | | | 588,070 | | | (55,600) | | | (37,216) | | | — | | | 1,129,086 | |
| Interest expense | 6,768 | | | 59,118 | | | 48,110 | | | 5,105 | | | (4,945) | | | 114,156 | |
| Other (income) expense | (3,474) | | | (46,277) | | | 11,487 | | | 9,559 | | | 4,945 | | | (23,760) | |
| Equity (income) losses from investments | 13,987 | | | (82,357) | | | (593,182) | | | (109,775) | | | — | | | (771,327) | |
| Income before income taxes | $ | 616,551 | | | $ | 657,586 | | | $ | 477,985 | | | $ | 57,895 | | | $ | — | | | $ | 1,810,017 | |
| | | | | | | | | | | |
| Capital expenditures | $ | 116,136 | | | $ | 203,851 | | | $ | — | | | $ | 34,457 | | | $ | — | | | $ | 354,444 | |
| Depreciation and amortization | $ | 250,972 | | | $ | 173,488 | | | $ | — | | | $ | 37,512 | | | $ | — | | | $ | 461,972 | |
We have international sales, which are predominantly in our Ag segment. The following table presents our sales, based on the geographic location of the subsidiary making the sale, for the years ended August 31, 2024, 2023 and 2022: | | | | | | | | | | | | | | | | | |
| 2024 | | 2023 | | 2022 |
| | (Dollars in thousands) |
North America (a) | $ | 36,876,847 | | | $ | 43,376,177 | | | $ | 45,039,981 | |
| South America | 515,177 | | | 378,021 | | | 371,493 | |
| Europe, Middle East and Africa (EMEA) | 693,454 | | | 930,052 | | | 1,093,974 | |
| Asia Pacific (APAC) | 1,175,751 | | | 905,754 | | | 1,286,218 | |
| Total | $ | 39,261,229 | | | $ | 45,590,004 | | | $ | 47,791,666 | |
(a) Revenues in North America are substantially all attributed to revenues from the United States.
Tangible long-lived assets include our property, plant and equipment, finance lease assets and capitalized major maintenance costs. The following table presents tangible long-lived assets by geographical region based on physical location: | | | | | | | | | | | |
| 2024 | | 2023 |
| | (Dollars in thousands) |
| United States | $ | 5,330,168 | | | $ | 5,088,366 | |
| International | 70,306 | | | 70,384 | |
| Total | $ | 5,400,474 | | | $ | 5,158,750 | |
Note 15 Derivative Financial Instruments and Hedging Activities
We enter into various derivative instruments to manage our exposure to movements primarily associated with agricultural and energy commodity prices and, to a lesser degree, foreign currency exchange rates and interest rates. Except for certain cash-settled swaps related to future crude oil purchases and refined product sales, which are accounted for as cash flow hedges, our derivative instruments represent economic hedges of price risk for which hedge accounting under ASC Topic 815 is not applied. Rather, the derivative instruments are recorded on our Consolidated Balance Sheets at fair value with changes in fair value being recorded directly to earnings, primarily within cost of goods sold in our Consolidated Statements of Operations. See Note 16, Fair Value Measurements, for additional information. The majority of our exchange traded agricultural commodity futures are settled daily through CHS Hedging, LLC, our wholly-owned FCM.
Derivatives Not Designated as Hedging Instruments
The following tables present the gross fair values of derivative assets, derivative liabilities and related margin deposits (cash collateral) recorded on our Consolidated Balance Sheets, along with related amounts permitted to be offset in accordance with U.S. GAAP. Although we have certain netting arrangements for our exchange-traded futures and options contracts and certain OTC contracts, we have elected to report our derivative instruments on a gross basis on our Consolidated Balance Sheets under ASC Topic 210-20, Balance Sheet - Offsetting. | | | | | | | | | | | | | | | | | | | | | | | |
| August 31, 2024 |
| | | Amounts Not Offset on the Consolidated Balance Sheet but Eligible for Offsetting | | |
| Gross Amounts Recognized | | Cash Collateral | | Derivative Instruments | | Net Amounts |
| | (Dollars in thousands) |
| Derivative assets | | | | | | | |
| Commodity derivatives | $ | 165,709 | | | $ | — | | | $ | 2,522 | | | $ | 163,187 | |
| Foreign exchange derivatives | 9,029 | | | — | | | 7,100 | | | 1,929 | |
| | | | | | | |
| | | | | | | |
| | | | | | | |
| Total | $ | 174,738 | | | $ | — | | | $ | 9,622 | | | $ | 165,116 | |
| Derivative liabilities | | | | | | | |
| Commodity derivatives | $ | 221,803 | | | $ | 1,601 | | | $ | 2,522 | | | $ | 217,680 | |
| Foreign exchange derivatives | 24,476 | | | — | | | 7,100 | | | 17,376 | |
| | | | | | | |
| | | | | | | |
| Total | $ | 246,279 | | | $ | 1,601 | | | $ | 9,622 | | | $ | 235,056 | |
| | | | | | | | | | | | | | | | | | | | | | | |
| August 31, 2023 |
| | | Amounts Not Offset on the Consolidated Balance Sheet but Eligible for Offsetting | | |
| Gross Amounts Recognized | | Cash Collateral | | Derivative Instruments | | Net Amounts |
| | (Dollars in thousands) |
| Derivative assets | | | | | | | |
| Commodity derivatives | $ | 280,440 | | | $ | — | | | $ | 4,866 | | | $ | 275,574 | |
| Foreign exchange derivatives | 32,402 | | | — | | | 12,330 | | | 20,072 | |
| | | | | | | |
| | | | | | | |
| | | | | | | |
| Total | $ | 312,842 | | | $ | — | | | $ | 17,196 | | | $ | 295,646 | |
| Derivative liabilities | | | | | | | |
| Commodity derivatives | $ | 349,131 | | | $ | 1,505 | | | $ | 4,866 | | | $ | 342,760 | |
| Foreign exchange derivatives | 13,799 | | | — | | | 12,330 | | | 1,469 | |
| | | | | | | |
| | | | | | | |
| Total | $ | 362,930 | | | $ | 1,505 | | | $ | 17,196 | | | $ | 344,229 | |
Derivative assets and liabilities with maturities of less than 12 months are recorded in other current assets and other current liabilities, respectively, on our Consolidated Balance Sheets. Derivative assets and liabilities with maturities greater than 12 months are recorded in other assets and other liabilities, respectively, on our Consolidated Balance Sheets. The amount of long-term derivative assets recorded on our Consolidated Balance Sheets as of August 31, 2024 and 2023, was $2.9 million and $1.1 million, respectively. The amount of long-term derivative liabilities recorded on our Consolidated Balance Sheets as of August 31, 2024 and 2023, was $6.0 million and $12.6 million, respectively.
The following table sets forth the pretax (losses) gains on derivatives not accounted for as hedging instruments that have been included in our Consolidated Statements of Operations for the years ended August 31, 2024, 2023 and 2022: | | | | | | | | | | | | | | | | | | | | | | | | | | |
| Derivative Type | | Location of
(Loss) Gain | | 2024 | | 2023 | | 2022 |
| | | | | (Dollars in thousands) |
| Commodity derivatives | | Cost of goods sold | | $ | 5,380 | | | $ | (360,937) | | | $ | (568,877) | |
| Foreign exchange derivatives | | Cost of goods sold | | (31,874) | | | (30,898) | | | 9,587 | |
| Foreign exchange derivatives | | Marketing, general and administrative expenses | | (2,897) | | | (530) | | | 577 | |
| | | | | | | | |
| Other derivatives | | Other income | | — | | | — | | | 2,057 | |
| Total | | | | $ | (29,391) | | | $ | (392,365) | | | $ | (556,656) | |
Commodity Contracts
When we enter into a commodity purchase or sales commitment, we incur risks related to price changes and performance, including delivery, quality, quantity and shipment period. In the event that market prices decrease, we are exposed to risk of loss for the market value of inventory and purchase contracts with fixed or partially fixed prices. Conversely, we are exposed to risk of loss on our fixed- or partially fixed-price sales contracts in the event that market prices increase.
Our use of hedging reduces exposure to price volatility by protecting against adverse short-term price movements but also limits the benefits of favorable short-term price movements. To reduce the price risk associated with fixed-price commitments, we generally enter into commodity derivative contracts, to the extent practical, to achieve a net commodity position within the formal position limits we have established and deemed prudent for each commodity. These contracts are primarily transacted through our FCM on regulated commodity futures exchanges, but may include OTC derivative instruments when deemed appropriate. These contracts are recorded at fair values based on quotes listed on regulated commodity exchanges or the market prices of the underlying products listed on the exchanges, except that certain contracts are accounted for as normal purchase and normal sales transactions. For commodities where there is no liquid derivative contract, risk is managed through the use of forward sales contracts, other pricing arrangements and, to some extent, futures contracts in highly correlated commodities. These contracts are economic hedges of price risk, but are not designated as hedging instruments for accounting purposes. Unrealized gains and losses on these contracts are recognized in cost of goods sold in our Consolidated Statements of Operations.
When a futures position is established, initial margin must be deposited with the applicable exchange or broker. The amount of margin required varies by commodity and is set by the applicable exchange at its sole discretion. If the market price
relative to a short futures position increases, an additional margin deposit would be required. Similarly, a margin deposit would be required if the market price relative to a long futures position decreases. Conversely, if the market price increases relative to a long futures position or decreases relative to a short futures position, margin deposits may be returned by the applicable exchange or broker.
Our policy is to manage our commodity price risk exposure according to internal policies and in alignment with our tolerance for risk. It is our policy that our profitability should come from operations, primarily derived from margins on products sold and grain merchandised, not from hedging transactions. At any one time, inventory and purchase contracts for delivery to us may be substantial. We have risk management policies and procedures that include established net physical position limits. These limits are defined for each commodity and business unit, and business units may include both trader and management limits as appropriate. The limits policy is overseen at a high level by our corporate middle office and compliance team, with day-to-day monitoring procedures being implemented within each individual business unit to ensure any limits overage is explained and exposures reduced, or a temporary limit increase is established if needed. The position limits are reviewed at least annually with our senior leadership and Board of Directors. We monitor current market conditions and may expand or reduce our net position limits or procedures in response to changes in those conditions.
The use of hedging instruments does not protect against nonperformance by counterparties to cash contracts. We evaluate counterparty exposure by reviewing contracts and adjusting the values to reflect potential nonperformance. Risk of nonperformance by counterparties includes the inability to perform because of a counterparty's financial condition and the risk that the counterparty will refuse to perform on a contract during periods of price fluctuations where contract prices are significantly different from the current market prices. We manage these risks by entering into fixed-price purchase and sales contracts with preapproved producers and by establishing appropriate limits for individual suppliers. Fixed-price contracts are entered into with customers of acceptable creditworthiness, as internally evaluated. Regarding our use of derivatives, we transact in exchange traded instruments or enter into over-the-counter derivatives that primarily clear through our FCM, which limits our counterparty exposure relative to hedging activities. Historically, we have not experienced significant events of nonperformance on open contracts. Accordingly, we only adjust the estimated fair values of specifically identified contracts for nonperformance. Although we have established policies and procedures, we make no assurances that historical nonperformance experience will carry forward to future periods.
As of August 31, 2024 and 2023, we had outstanding commodity futures and options contracts that were used as economic hedges, as well as fixed-price forward contracts related to physical purchases and sales of commodities. The table below presents the notional volumes for all outstanding commodity contracts: | | | | | | | | | | | | | | | | | | | | | | | | | | |
| | | 2024 | | 2023 |
| Derivative Type | | Long | | Short | | Long | | Short |
| | | (Units in thousands) |
| Grain and oilseed (bushels) | | 385,426 | | | 517,883 | | | 506,654 | | 630,803 |
| Energy products (barrels) | | 8,438 | | | 5,014 | | | 11,839 | | 8,085 |
| Processed grain and oilseed (tons) | | 3,600 | | | 6,193 | | | 7,380 | | 9,437 |
| Crop nutrients (tons) | | 73 | | | 14 | | | 70 | | 10 |
| Ocean freight (metric tons) | | — | | | — | | | 40 | | — |
| Natural gas (MMBtu) | | 2,350 | | | 500 | | | 460 | | | — | |
Foreign Exchange Contracts
We conduct a substantial portion of our business in U.S. dollars, but we are exposed to risks relating to foreign currency fluctuations primarily due to global grain marketing transactions in South America, the Asia Pacific region and Europe, and purchases of products from Canada. We use foreign currency derivative instruments to mitigate the impact of exchange rate fluctuations. Although CHS has some risk exposure relating to foreign currency transactions, a larger impact with exchange rate fluctuations is the ability of foreign buyers to purchase U.S. agricultural products and the competitiveness of U.S. agricultural products compared to the same products offered by alternative sources of world supply. The notional amount of our foreign exchange derivative contracts was $1.5 billion and $1.9 billion as of August 31, 2024 and 2023.
Derivatives Designated as Cash Flow Hedging Strategies
Certain pay-fixed, receive-variable, cash-settled swaps are designated as cash flow hedges of future crude oil purchases in our Energy segment. We also designate certain pay-variable, receive-fixed, cash-settled swaps as cash flow hedges of future refined energy product sales. These hedging instruments and the related hedged items are exposed to significant market price risk and potential volatility. As part of our risk management strategy, we look to hedge a portion of our expected future crude oil needs and the resulting refined product output based on prevailing futures prices, management's expectations about future commodity price changes and our risk appetite. We may also elect to dedesignate certain derivative instruments previously designated as cash flow hedges as part of our risk management strategy. Amounts recorded in other comprehensive income for these dedesignated derivative instruments remain in other comprehensive income and are recognized in earnings in the period in which the underlying transactions affect earnings. As of August 31, 2024 and 2023, the aggregate notional amount of cash flow hedges was 5.5 million and 4.1 million barrels, respectively.
The following table presents the fair value of our commodity derivative instruments designated as cash flow hedges and the line items on our Consolidated Balance Sheets in which they are recorded as of August 31, 2024 and 2023: | | | | | | | | | | | | | | | | | | | | | | | | | | | | | | | | |
| | Derivative Assets | | | | Derivative Liabilities |
| Balance Sheet Location | | 2024 | | 2023 | | Balance Sheet Location | | 2024 | | 2023 |
| | (Dollars in thousands) | | | | (Dollars in thousands) |
| Other current assets | | $ | 5,226 | | | $ | 8,395 | | | Other current liabilities | | $ | 2,781 | | | $ | 5,345 | |
The following table presents the pretax losses recorded in other comprehensive income relating to cash flow hedges for the years ended August 31, 2024, 2023 and 2022: | | | | | | | | | | | | | | | | | | | | |
| | 2024 | | 2023 | | 2022 |
| | | (Dollars in thousands) |
| Commodity derivatives | | $ | (605) | | | $ | (12,285) | | | $ | (2,071) | |
The following table presents the pretax gains (losses) relating to our existing cash flow hedges that were reclassified from accumulated other comprehensive loss into our Consolidated Statements of Operations for the years ended August 31, 2024, 2023 and 2022: | | | | | | | | | | | | | | | | | | | | | | | |
| Location of
Gain (Loss) | | 2024 | | 2023 | | 2022 |
| | | | (Dollars in thousands) |
| Commodity derivatives | Cost of goods sold | | $ | 16,454 | | | $ | (14,853) | | | $ | (6,254) | |
Note 16 Fair Value Measurements
ASC Topic 820, Fair Value Measurement, defines fair value as the price that would be received for an asset or paid to transfer a liability (an exit price) in the principal or most advantageous market for the asset or liability in an orderly transaction between market participants on the measurement date.
We determine fair values of derivative instruments and certain other assets, based on the fair value hierarchy established in ASC Topic 820, which requires an entity to maximize the use of observable inputs and minimize the use of unobservable inputs when measuring fair value. Observable inputs are inputs that reflect the assumptions market participants would use in pricing the asset or liability based on the best information available in the circumstances. ASC Topic 820 describes three levels within its hierarchy that may be used to measure fair value, and our assessment of relevant instruments within those levels is as follows:
Level 1. Values are based on unadjusted quoted prices in active markets for identical assets or liabilities. These assets and liabilities may include exchange-traded derivative instruments, rabbi trust investments, segregated investments and marketable securities.
Level 2. Values are based on quoted prices for similar assets or liabilities in active markets, quoted prices for identical or similar assets or liabilities in markets that are not active or other inputs that are observable or can be corroborated by observable market data for substantially the full term of the assets or liabilities. These assets and liabilities include interest rate, foreign exchange and commodity swaps; forward commodity contracts with a fixed-price component; and other OTC derivatives whose values are determined with inputs that are based on exchange traded prices, adjusted for location-specific
inputs that are primarily observable in the market or can be derived principally from, or corroborated by, observable market data.
Level 3. Values are generated from unobservable inputs that are supported by little or no market activity and that are a significant component of the fair value of the assets or liabilities. These unobservable inputs would reflect our own estimates of assumptions that market participants would use in pricing related assets or liabilities. Valuation techniques might include the use of pricing models, discounted cash flow models or similar techniques.
The following tables present assets and liabilities, included on our Consolidated Balance Sheets, that are recognized at fair value on a recurring basis and indicate the fair value hierarchy utilized to determine these fair values. Assets and liabilities are classified in their entirety based on the lowest level of input that is a significant component of the fair value measurement. The lowest level of input is considered Level 3. Our assessment of the significance of a particular input to the fair value measurement requires judgment and may affect the classification of fair value assets and liabilities within the fair value hierarchy levels.
Recurring fair value measurements as of August 31, 2024 and 2023, are as follows: | | | | | | | | | | | | | | | | | | | | | | | |
| 2024 |
| Quoted Prices in Active Markets
for Identical Assets
(Level 1) | | Significant Other Observable
Inputs
(Level 2) | | Significant
Unobservable
Inputs
(Level 3) | | Total |
| | (Dollars in thousands) |
| Assets | | | | | | | |
| Commodity derivatives | $ | 2,454 | | | $ | 168,481 | | | $ | — | | | $ | 170,935 | |
| Foreign currency derivatives | — | | | 9,029 | | | — | | | 9,029 | |
| | | | | | | |
| | | | | | | |
| | | | | | | |
| Segregated investments and marketable securities | 15,069 | | | 136,258 | | | — | | | 151,327 | |
| Time deposits | — | | | 500,921 | | | — | | | 500,921 | |
| Other assets | 83,008 | | | — | | | — | | | 83,008 | |
| Total | $ | 100,531 | | | $ | 814,689 | | | $ | — | | | $ | 915,220 | |
| Liabilities | | | | | | | |
| Commodity derivatives | $ | 1,641 | | | $ | 222,943 | | | $ | — | | | $ | 224,584 | |
| Foreign currency derivatives | — | | | 24,476 | | | — | | | 24,476 | |
| | | | | | | |
| Total | $ | 1,641 | | | $ | 247,419 | | | $ | — | | | $ | 249,060 | |
| | | | | | | | | | | | | | | | | | | | | | | |
| | 2023 |
| Quoted Prices in Active Markets
for Identical Assets
(Level 1) | | Significant Other Observable
Inputs
(Level 2) | | Significant
Unobservable
Inputs
(Level 3) | | Total |
| | (Dollars in thousands) |
| Assets | | | | | | | |
| Commodity derivatives | $ | 5,344 | | | $ | 283,491 | | | $ | — | | | $ | 288,835 | |
| Foreign currency derivatives | — | | | 32,402 | | | — | | | 32,402 | |
| | | | | | | |
| | | | | | | |
| | | | | | | |
| Segregated investments and marketable securities | 225,715 | | | — | | | — | | | 225,715 | |
| Other assets | 89,592 | | | — | | | — | | | 89,592 | |
| Total | $ | 320,651 | | | $ | 315,893 | | | $ | — | | | $ | 636,544 | |
| Liabilities | | | | | | | |
| Commodity derivatives | $ | 7,501 | | | $ | 346,975 | | | $ | — | | | $ | 354,476 | |
| Foreign currency derivatives | — | | | 13,799 | | | — | | | 13,799 | |
| | | | | | | |
| Total | $ | 7,501 | | | $ | 360,774 | | | $ | — | | | $ | 368,275 | |
Commodity and foreign currency derivatives. Exchange-traded futures and options contracts are valued based on unadjusted quoted prices in active markets and are classified within Level 1. Our forward commodity purchase and sales contracts with fixed-price components, select ocean freight contracts and other OTC derivatives are determined using inputs that are generally based on exchange-traded prices and/or recent market bids and offers, including location-specific adjustments, and are classified within Level 2. Location-specific inputs are driven by local market supply and demand and are generally based on broker or dealer quotations or market transactions in either listed or OTC markets. Changes in the fair values of these contracts are recognized in our Consolidated Statements of Operations as a component of cost of goods sold.
Segregated investments and marketable securities, time deposits and other assets. Our segregated investments and marketable securities and other assets are comprised primarily of investments in U.S. Treasury securities, money market funds, various government agencies, time deposits and rabbi trust assets. U.S. Treasury securities and money market funds are valued using quoted market prices and classified within Level 1. Investments in various government agency obligations, time deposits and rabbit trust assets are valued using quoted prices for similar assets in active markets, quoted prices for identical or similar assets in markets that are not active or other inputs that are observable or can be corroborated by observable market data for substantially the full term of the assets and classified within Level 2.
Note 17 Commitments and Contingencies
Environmental
We are required to comply with various environmental laws and regulations incidental to our normal business operations. To meet our compliance requirements, we establish reserves for future costs of remediation associated with identified issues that are both probable and can be reasonably estimated. Estimates of environmental costs are based on current available facts, existing technology, undiscounted site-specific costs and currently enacted laws and regulations and are included in cost of goods sold and marketing, general and administrative expenses in our Consolidated Statements of Operations. Recoveries, if any, are recorded in the period in which recovery is received. Liabilities are monitored and adjusted as new facts or changes in law or technology occur. The resolution of any such matters may affect consolidated net income for any fiscal period; however, we currently believe any resulting liabilities, individually or in the aggregate, will not have a material effect on our consolidated financial position, results of operations or cash flows during any fiscal year.
Other Litigation and Claims
We are involved as a defendant in various lawsuits, claims and disputes, which are in the normal course of our business. The resolution of any such matters may affect consolidated net income for any fiscal period; however, we currently believe any resulting liabilities, individually or in the aggregate, will not have a material effect on our consolidated financial position, results of operations or cash flows during any fiscal year.
Guarantees
We are a guarantor for lines of credit and performance obligations of related, nonconsolidated companies. Our bank covenants allow maximum guarantees of $1.1 billion, of which $70.2 million were outstanding as of August 31, 2024. We have collateral for a portion of these contingent obligations. We have not recorded a liability related to the contingent obligations as we do not expect to pay out any cash related to them, and the fair values are considered immaterial. The underlying loans to the counterparties for which we provide these guarantees are current as of August 31, 2024.
Credit Commitments
CHS Capital has commitments to extend credit to customers if there are no violations of any contractually established conditions. As of August 31, 2024, CHS Capital customers had additional available credit of $1.2 billion.
Unconditional Purchase Obligations
Unconditional purchase obligations are commitments to transfer funds in the future for fixed or minimum amounts or quantities of goods or services at fixed or minimum prices. Our long-term unconditional purchase obligations primarily relate to pipeline and grain handling take-or-pay and throughput agreements and are not recorded on our Consolidated Balance Sheets. As of August 31, 2024, minimum future payments required under long-term commitments that are noncancelable and that third
parties have used to secure financing for facilities that will provide contracted goods, are as follows: | | | | | | | | | | | | | | | | | | | | | | | | | | | | | | | | | | | | | | | | | |
| | Payments Due by Period |
| Total | | 2025 | | 2026 | | 2027 | | 2028 | | 2029 | | Thereafter |
| | (Dollars in thousands) |
| Long-term unconditional purchase obligations | $ | 447,231 | | | $ | 85,140 | | | $ | 79,357 | | | $ | 64,942 | | | $ | 57,748 | | | $ | 55,115 | | | $ | 104,929 | |
Total payments under these arrangements were $84.6 million, $77.8 million and $75.2 million for the years ended August 31, 2024, 2023 and 2022, respectively.
Note 18 Related Party Transactions
We purchase and sell grain and other agricultural commodity products from certain equity investees, primarily CF Nitrogen, Ventura Foods, Ardent Mills, TEMCO and Producer Ag. Sales to and purchases from related parties for the years ended August 31, 2024, 2023 and 2022, are as follows: | | | | | | | | | | | | | | | | | |
| 2024 | | 2023 | | 2022 |
| | (Dollars in thousands) |
| Sales | $ | 2,396,916 | | | $ | 1,653,125 | | | $ | 1,511,532 | |
| Purchases | 1,590,955 | | | 1,697,780 | | | 2,040,357 | |
Receivables due from and payables due to related parties as of August 31, 2024 and 2023, are as follows: | | | | | | | | | | | |
| 2024 | | 2023 |
| | (Dollars in thousands) |
| Due from related parties | $ | 334,778 | | | $ | 80,510 | |
| Due to related parties | 113,081 | | | 90,267 | |
As a cooperative, we are owned by farmers and ranchers and member cooperatives, which are referred to as members. We buy commodities from and provide products and services to our members. Individually, our members do not have a significant ownership in CHS.
Note 19 Leases
We assess arrangements at inception to determine whether they contain a lease. An arrangement is considered to contain a lease if it conveys the right to control the use of an asset for a period of time in exchange for consideration. The right to control the use of an asset must include both (i) the right to obtain substantially all economic benefits associated with an identified asset and (ii) the right to direct how and for what purpose the identified asset is used. Certain service agreements may provide us with the right to use an identified asset; however, most of these arrangements are not considered to represent a lease as we do not control how and for what purpose the identified asset is used.
We lease property, plant and equipment used in our operations primarily under operating lease agreements and, to a lesser extent, under finance lease agreements. Our leases are primarily for railcars, equipment, vehicles and office space, many of which contain renewal options and escalation clauses. Renewal options are included as part of the right of use asset and liability when it is reasonably certain that we will exercise the renewal option; however, renewal options are generally not included as we are not reasonably certain to exercise such options.
Right of use assets and liabilities for operating and finance leases are recognized under ASC Topic 842 at the lease commencement date for leases in excess of 12 months based on the present value of lease payments over the lease term. For measurement and classification of lease agreements, lease and nonlease components are grouped into a single lease component for all asset classes. Variable lease payments are excluded from measurement of right of use assets and liabilities and generally include payments for nonlease components such as maintenance costs, payments for leased assets beyond their noncancelable lease term and payments for other nonlease components such as sales tax. The discount rate used to calculate present value is our collateralized incremental borrowing rate or, if available, the rate implicit in the lease. The incremental borrowing rate is determined for each lease based primarily on its lease term. Certain lease arrangements include rental payments adjusted annually based on changes in an inflation index. Our lease arrangements generally do not contain residual value guarantees or material restrictive covenants.
Lease expense is recognized on a straight-line basis over the lease term. The components of lease expense recognized in our Consolidated Statements of Operations as of August 31, 2024, 2023 and 2022, are as follows: | | | | | | | | | | | | | | | | | | | | | |
| 2024 | | 2023 | | 2022 | | | | |
| (Dollars in thousands) | | | | |
| Operating lease expense | $ | 84,826 | | | $ | 77,588 | | | $ | 71,209 | | | | | |
| Finance lease expense: | | | | | | | | | |
| Amortization of assets | 9,506 | | | 8,966 | | | 8,967 | | | | | |
| Interest on lease liabilities | 1,964 | | | 1,646 | | | 1,469 | | | | | |
| Short-term lease expense | 25,753 | | | 20,068 | | | 16,915 | | | | | |
| Variable lease expense | 833 | | | 650 | | | 1,699 | | | | | |
| Total net lease expense* | $ | 122,882 | | | $ | 108,918 | | | $ | 100,259 | | | | | |
*Income related to sublease activity is not material and has been excluded from the table above.
Supplemental balance sheet information related to operating and finance leases as of August 31, 2024 and 2023, is as follows: | | | | | | | | | | | | | | | | | |
| Balance Sheet Location | | 2024 | | 2023 |
| | | (Dollars in thousands) |
| Operating leases | | | | | |
| Assets | | | | | |
| Operating lease right of use assets | Other assets | | $ | 218,844 | | | $ | 254,844 | |
| Liabilities | | | | | |
| Current operating lease liabilities | Accrued expenses | | $ | 61,796 | | | $ | 61,094 | |
| Long-term operating lease liabilities | Other liabilities | | 161,494 | | | 200,758 | |
| Total operating lease liabilities | | $ | 223,290 | | | $ | 261,852 | |
| | | | | |
| Finance leases | | | | | |
| Assets | | | | | |
| Finance lease assets | Property, plant and equipment | | $ | 63,229 | | | $ | 64,381 | |
| Liabilities | | | | | |
| Current finance lease liabilities | Current portion of long-term debt | | $ | 7,116 | | | $ | 6,797 | |
| Long-term finance lease liabilities | Long-term debt | | 42,395 | | | 42,438 | |
| Total finance lease liabilities | | $ | 49,511 | | | $ | 49,235 | |
Information related to the lease term and discount rate for operating and finance leases as of August 31, 2024 and 2023, is as follows: | | | | | | | | | | | |
| 2024 | | 2023 |
| Weighted average remaining lease term (in years) | | | |
| Operating leases | 5.1 | | 7.0 |
| Finance leases | 8.6 | | 9.6 |
| Weighted average discount rate | | | |
| Operating leases | 3.85 | % | | 3.50 | % |
| Finance leases | 3.99 | % | | 3.78 | % |
Supplemental cash flow and other information related to operating and finance leases as of August 31, 2024, 2023 and 2022, is as follows: | | | | | | | | | | | | | | | | | |
| 2024 | | 2023 | | 2022 |
| (Dollars in thousands) |
| Cash paid for amounts included in measurement of lease liabilities: | | | | | |
| Operating cash flows from operating leases | $ | 78,614 | | | $ | 71,798 | | | $ | 61,750 | |
| Operating cash flows from finance leases | 1,964 | | | 1,646 | | | 1,469 | |
| Financing cash flows from finance leases | 7,716 | | | 8,571 | | | 9,171 | |
| | | | | |
| Supplemental noncash information: | | | | | |
| Right of use assets obtained in exchange for lease liabilities | $ | 73,183 | | | $ | 69,837 | | | $ | 54,199 | |
| Right of use asset modifications | 12,277 | | | 28,614 | | | 12,887 | |
Maturities of lease liabilities by fiscal year as of August 31, 2024, were as follows: | | | | | | | | | | | |
| August 31, 2024 |
| Finance Leases | | Operating Leases |
| (Dollars in thousands) |
| 2025 | $ | 8,956 | | | $ | 71,326 | |
| 2026 | 8,308 | | | 60,192 | |
| 2027 | 7,648 | | | 43,430 | |
| 2028 | 7,037 | | | 28,675 | |
| 2029 | 6,320 | | | 15,907 | |
| Thereafter | 19,992 | | | 27,770 | |
| Total maturities of lease liabilities | 58,261 | | | 247,300 | |
| Less amounts representing interest | 8,750 | | | 24,010 | |
| Present value of future minimum lease payments | 49,511 | | | 223,290 | |
| Less current obligations | 7,116 | | | 61,796 | |
| Long-term obligations | $ | 42,395 | | | $ | 161,494 | |