                                  UNITED STATES
                       SECURITIES AND EXCHANGE COMMISSION
                             WASHINGTON, D. C. 20549

                                   FORM N-CSRS

Investment Company Act file number 811-5357

                             SCUDDER BLUE CHIP FUND
                             ----------------------
               (Exact Name of Registrant as Specified in Charter)

                  222 South Riverside Plaza, Chicago, IL 60606
                  --------------------------------------------
               (Address of Principal Executive Offices) (Zip Code)

        Registrant's Telephone Number, including Area Code: (212) 454-7190
                                                            --------------

                                  Paul Schubert
                                 345 Park Avenue
                               New York, NY 10154
                     ---------------------------------------
                     (Name and Address of Agent for Service)

Date of fiscal year end:        10/31

Date of reporting period:       04/30/2005


ITEM 1.  REPORT TO STOCKHOLDERS
Scudder Blue Chip Fund
|
| |
| Semiannual Report to Shareholders |
| April 30, 2005 |
This report must be preceded or accompanied by a prospectus. To obtain a prospectus for any of our funds, refer to the Account Management Resources information provided in the back of this booklet. We advise you to consider the fund's objectives, risks, charges and expenses carefully before investing. The prospectus contains this and other important information about the fund. Please read the prospectus carefully before you invest.
Investments in mutual funds involve risk. Some funds have more risk than others. This fund is subject to stock market risk. The fund may invest in various industries and certain economic sectors, thereby increasing its vulnerability to any single economic, political or regulatory development. This may result in greater share price volatility. Please read this fund's prospectus for specific details regarding its investments and risk profile.
Scudder Investments is part of Deutsche Asset Management, which is the marketing name in the US for the asset management activities of Deutsche Bank AG, Deutsche Investment Management Americas Inc., Deutsche Asset Management Inc., Deutsche Asset Management Investment Services Ltd., Deutsche Bank Trust Company Americas and Scudder Trust Company.
Fund shares are not FDIC-insured and are not deposits or other obligations of, or guaranteed by, any bank. Fund shares involve investment risk, including possible loss of principal.
Performance Summary April 30, 2005 |
|
Classes A, B, C and Institutional
All performance shown is historical, assumes reinvestment of all dividends and capital gain distributions and does not guarantee future results. Investment return and principal value fluctuate with changing market conditions so that, when redeemed, shares may be worth more or less than their original cost. Current performance may be lower or higher than the performance quoted. Please visit scudder.com for the Fund's most recent month-end performance.
The maximum sales charge for Class A shares is 5.75%. For Class B shares, the maximum contingent deferred sales charge (CDSC) is 4% within the first year after purchase, declining to 0% after six years. Class C shares have no adjustment for front-end sales charges but redemptions within one year of purchase may be subject to a CDSC of 1%. Unadjusted returns do not reflect sales charges and would have been lower if they had. Institutional Class shares are not subject to sales charges.
To discourage short-term trading, shareholders redeeming shares held less than 15 days will have a lower total return due to the effect of the 2% short-term redemption fee.
Returns during all periods shown for Classes B, C and Institutional Class and for the 5- and 10- year periods shown for Class A reflect a fee waiver and/or expense reimbursement. Without this waiver/reimbursement, returns would have been lower.
Performance figures do not reflect the deduction of taxes that a shareholder would pay on fund distributions or the redemption of fund shares. Returns and rankings may differ by share class.
Average Annual Total Returns (Unadjusted for Sales Charge) as of 4/30/05 |
Scudder Blue Chip Fund | 6-Month* | 1-Year | 3-Year | 5-Year | 10-Year |
Class A | 4.40% | 9.86% | 5.09% | -2.97% | 8.87% |
Class B | 3.91% | 8.90% | 4.21% | -3.78% | 7.96% |
Class C | 3.99% | 9.00% | 4.23% | -3.73% | 8.03% |
Russell 1000 Index+ | 4.04% | 7.20% | 4.75% | -2.67% | 10.44% |
S&P 500 Index++ | 3.28% | 6.34% | 4.24% | -2.94% | 10.26% |
Scudder Blue Chip Fund | 6-Month* | 1-Year | 3-Year | 5-Year | Life of Class* |
Institutional Class | 4.63% | 10.36% | 5.54% | -2.54% | 8.14% |
Russell 1000 Index+ | 4.04% | 7.20% | 4.75% | -2.67% | 8.92% |
S&P 500 Index++ | 3.28% | 6.34% | 4.24% | -2.94% | 8.85% |
Sources: Lipper Inc. and Deutsche Investment Management Americas Inc.
* Total returns shown for periods less than one year are not annualized.
* Institutional Class shares commenced operations on November 22, 1995. Index returns begin November 30, 1995.
Growth of an Assumed $10,000 Investment (Adjusted for Maximum Sales Charge) |
[] Scudder Blue Chip Fund — Class A [] Russell 1000 Index+ [] S&P 500 Index++ |
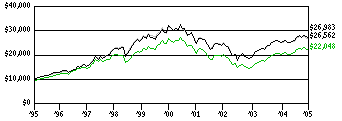 |
Yearly periods ended April 30 |
The Fund's growth of an assumed $10,000 investment is adjusted for the maximum sales charge of 5.75%. This results in a net initial investment of $9,425.
Comparative Results (Adjusted for Maximum Sales Charge) as of 4/30/05 |
Scudder Blue Chip Fund | 1-Year | 3-Year | 5-Year | 10-Year |
Class A | Growth of $10,000 | $10,354 | $10,940 | $8,107 | $22,048 |
Average annual total return | 3.54% | 3.04% | -4.11% | 8.23% |
Class B | Growth of $10,000 | $10,590 | $11,117 | $8,168 | $21,518 |
Average annual total return | 5.90% | 3.59% | -3.97% | 7.96% |
Class C | Growth of $10,000 | $10,900 | $11,324 | $8,271 | $21,640 |
Average annual total return | 9.00% | 4.23% | -3.73% | 8.03% |
Russell 1000 Index+ | Growth of $10,000 | $10,720 | $11,495 | $8,735 | $26,983 |
Average annual total return | 7.20% | 4.75% | -2.67% | 10.44% |
S&P 500 Index++ | Growth of $10,000 | $10,634 | $11,328 | $8,614 | $26,562 |
Average annual total return | 6.34% | 4.24% | -2.94% | 10.26% |
The growth of $10,000 is cumulative.
+ The Russell 1000 Index measures the performance of the 1,000 largest companies in the Russell 3000 Index, which represents approximately 92% of the total market capitalization of the Russell 3000 Index.
++ The Standard & Poor's 500 (S&P 500) Index is an unmanaged capitalization-weighted index of 500 stocks. The index is designed to measure performance of the broad domestic economy through changes in the aggregate market value of 500 stocks representing all major industries.
Index returns assume reinvestment of dividends and, unlike Fund returns, do not reflect any fees or expenses. It is not possible to invest directly into an index.
Comparative Results as of 4/30/05 |
Scudder Blue Chip Fund | 1-Year | 3-Year | 5-Year | Life of Class* |
Institutional Class | Growth of $1,000,000 | $1,103,600 | $1,175,700 | $879,300 | $2,091,500 |
Average annual total return | 10.36% | 5.54% | -2.54% | 8.14% |
Russell 1000 Index+ | Growth of $1,000,000 | $1,072,000 | $1,149,500 | $873,500 | $2,235,400 |
Average annual total return | 7.20% | 4.75% | -2.67% | 8.92% |
S&P 500 Index++ | Growth of $1,000,000 | $1,063,400 | $1,132,800 | $861,400 | $2,223,100 |
Average annual total return | 6.34% | 4.24% | -2.94% | 8.85% |
The growth of $1,000,000 is cumulative.
The minimum initial investment for the Institutional Class is $1,000,000.
* Institutional Class commenced operations on November 22, 1995. Index returns begin November 30, 1995.
+ The Russell 1000 Index measures the performance of the 1,000 largest companies in the Russell 3000 Index, which represents approximately 92% of the total market capitalization of the Russell 3000 Index.
++ The Standard & Poor's 500 (S&P 500) Index is an unmanaged capitalization-weighted index of 500 stocks. The index is designed to measure performance of the broad domestic economy through changes in the aggregate market value of 500 stocks representing all major industries.
Index returns assume reinvestment of dividends and, unlike Fund returns, do not reflect any fees or expenses. It is not possible to invest directly into an index.
Net Asset Value and Distribution Information |
| Class A | Class B | Class C | Institutional Class |
Net Asset Value: 4/30/05 | $ 18.01 | $ 17.01 | $ 17.19 | $ 18.59 |
10/31/04 | $ 17.30 | $ 16.37 | $ 16.53 | $ 17.90 |
Distribution Information: Six Months: Income Dividends as of 4/30/05 | $ .05 | $ — | $ — | $ .14 |
Class A Lipper Rankings — Multi-Cap Core Funds Category as of 4/30/05 |
Period | Rank | | Number of Funds Tracked | Percentile Ranking |
1-Year | 85 | of | 739 | 12 |
3-Year | 162 | of | 527 | 31 |
5-Year | 241 | of | 367 | 66 |
10-Year | 80 | of | 126 | 63 |
Source: Lipper Inc. Rankings are historical and do not guarantee future results. Rankings are based on total return unadjusted for sales charges with distributions reinvested. If sales charges had been included, rankings might have been less favorable. Rankings are for Class A shares; other share classes may vary.
Information About Your Fund's Expenses |
|
 As an investor of the Fund, you incur two types of costs: ongoing expenses and transaction costs. Ongoing expenses include management fees, distribution and service (12b-1) fees and other Fund expenses. Examples of transaction costs include sales charges (loads), redemption fees and account maintenance fees, which are not shown in this section. The following tables are intended to help you understand your ongoing expenses (in dollars) of investing in the Fund and to help you compare these expenses with the ongoing expenses of investing in other mutual funds. In the most recent six-month period, the Fund limited these expenses; had it not done so, expenses would have been higher for Class B, C and Institutional shares. The tables are based on an investment of $1,000 made at the beginning of the six-month period ended April 30, 2005.
The tables illustrates your Fund's expenses in two ways:
Actual Fund Return. This helps you estimate the actual dollar amount of ongoing expenses (but not transaction costs) paid on a $1,000 investment in the Fund using the Fund's actual return during the period. To estimate the expenses you paid over the period, simply divide your account value by $1,000 (for example, an $8,600 account value divided by $1,000 = 8.6), then multiply the result by the number in the "Expenses Paid per $1,000" line under the share class you hold.
Hypothetical 5% Fund Return. This helps you to compare your Fund's ongoing expenses (but not transaction costs) with those of other mutual funds using the Fund's actual expense ratio and a hypothetical rate of return of 5% per year before expenses. Examples using a 5% hypothetical fund return may be found in the shareholder reports of other mutual funds. The hypothetical account values and expenses may not be used to estimate the actual ending account balance or expenses you paid for the period.
Please note that the expenses shown in these tables are meant to highlight your ongoing expenses only and do not reflect any transaction costs. The "Expenses Paid per $1,000" line of the tables is useful in comparing ongoing expenses only and will not help you determine the relative total expense of owning different funds. If these transaction costs had been included, your costs would have been higher.
Expenses and Value of a $1,000 Investment
for the six months ended April 30, 2005 |
Actual Fund Return | Class A | Class B | Class C | Class S** | Institutional Class |
Beginning Account Value 11/1/04 | $ 1,000.00 | $ 1,000.00 | $ 1,000.00 | $ 1,000.00 | $ 1,000.00 |
Ending Account Value 4/30/05 | $ 1,044.00 | $ 1,039.10 | $ 1,039.90 | $ 977.20 | $ 1,046.30 |
Expenses Paid per $1,000* | $ 5.93 | $ 10.16 | $ 10.12 | $ 2.05 | $ 3.70 |
Hypothetical 5% Fund Return | Class A | Class B | Class C | Class S** | Institutional Class |
Beginning Account Value 11/1/04 | $ 1,000.00 | $ 1,000.00 | $ 1,000.00 | $ 1,000.00 | $ 1,000.00 |
Ending Account Value 4/30/05 | $ 1,018.99 | $ 1,014.83 | $ 1,014.88 | $ 1,009.98 | $ 1,021.17 |
Expenses Paid per $1,000* | $ 5.86 | $ 10.04 | $ 9.99 | $ 2.08 | $ 3.66 |
* Expenses are equal to the Fund's annualized expense ratio for each share class, multiplied by the average account value over the period, multiplied by the number of days in the most recent six-month period, then divided by 365.
Annualized Expense Ratios | Class A | Class B | Class C | Class S** | Institutional Class |
Scudder Blue Chip Fund | 1.17% | 2.01% | 2.00% | .86% | .73% |
** For the period February 1, 2005 (commencement of operations) to April 30, 2005.
For more information, please refer to the Fund's prospectuses.
Portfolio Management Review |
|
 In the following interview, Lead Portfolio Managers Janet Campagna and Robert Wang discuss Scudder Blue Chip Fund's performance, management's strategy and the market environment during the six-month period ended April 30, 2005.
Q: How would you describe the market environment over the last six months?
A: The US stock market ended the period quite close to where it began, but there was considerable movement in between. The market rallied in the last two months of 2004, as uncertainty surrounding the presidential election was resolved; oil prices fell slightly; and there was increasing evidence of continued economic growth. In the early months of 2005, however, economic trends appeared less encouraging. Concern mounted about whether rising energy prices would spark more-generalized inflation. Overall economic growth was sluggish in the first calendar quarter, as both consumer spending and business investment were relatively weak. The trade deficit was higher than expected in February, and there were disappointing reports on job creation and consumer confidence. These factors created considerable uncertainty about future trends in economic growth and corporate earnings, pushing the market lower in March and April.
During the semiannual period, stocks of smaller companies generally underperformed stocks of large companies: the Russell 2000 Index had a return of - -0.15%, compared with the Standard & Poor's 500 Index (the S&P 500), which had a return of 3.28%.1 Within the large-capitalization category, value performed better than growth: the Russell 1000 Value Index had a return of 6.72%, compared with a 1.14% return for the Russell 1000 Growth Index.2
1 The Russell 2000 Index is an unmanaged, capitalization-weighted measure of approximately 2,000 of the smallest stocks in the Russell 3000 Index.
The Standard & Poor's 500 (S&P 500) Index is an unmanaged capitalization-weighted index of 500 stocks. The index is designed to measure performance of the broad domestic economy through changes in the aggregate market value of 500 stocks representing all major industries.
Index returns assume reinvestment of dividends and, unlike fund returns, do not reflect any fees or expenses. It is not possible to invest directly into an index.
2 The Russell 1000 Value Index is an unmanaged index that consists of those stocks in the Russell 1000 Index with lower price-to-book ratios and lower forecasted growth values. The Russell 1000 Growth Index is an unmanaged index that consists of those stocks in the Russell 1000 Index with higher price-to-book ratios and higher forecasted growth values. Index returns assume reinvestment of dividends and, unlike fund returns, do not reflect any fees or expenses. It is not possible to invest directly in an index.
3 Source: Lipper Inc. Lipper's Multi-Cap Core Funds category includes portfolios that invest in a variety of market capitalization ranges, without concentrating 75% of their equity assets in any one market capitalization range over an extended period. Multi-Cap Core funds have wide latitude in the companies in which they invest. These portfolios will normally have an average price-to-earnings ratio, price-to-book ratio and 3-year earnings growth figure, compared with the US diversified multi-cap equity funds universe average. It is not possible to invest directly in the Lipper category.
Q: How did the fund perform during this period?
A: Scudder Blue Chip Fund (Class A shares) produced a total return of 4.40% for the six months ended April 30, 2005. (Returns are unadjusted for sales charges. If sales charges had been included, returns would have been lower. Past performance is no guarantee of future results. Please see pages 3 through 5 for complete performance information.) The fund outperformed its benchmarks, the S&P 500 Index, which returned 3.28% for the period, and the Russell 1000 Index, which had a return of 4.04%. For the six months, the fund finished ahead of its peer group, the Lipper Multi-Cap Core Funds category, which posted an average return of 3.01%.3
Q: How is this fund managed?
A: Our investment process is focused on stock selection, using a combination of quantitative processes and fundamental analysis.
We use a quantitative screening process to identify attractively valued stocks with above-average capital appreciation potential from the fund's potential investment universe of approximately 1,000 blue chip companies. Blue chip companies are large, well-known companies that typically have an established earnings and dividends history, easy access to credit, solid positions in their industry and strong management. We begin by sorting the universe of 1,000 stocks into 24 clearly defined industry groups. Next, we compare the stocks based on current and historical data, including valuation, a measure of how expensive a stock is; earnings growth and growth potential; and market sentiment, which enables us to pinpoint short-term price movements outside of fundamental analysis.
Using all of this information, our model ranks stocks by their expected level of outperformance. Our model also creates an "optimal" portfolio, suggesting which stocks should be included in the fund and which ones should be omitted, as well as proportions of individual stocks to be held. We carefully analyze our model's suggestions, double-checking data and seeking additional information about each potential holding. This step-by-step approach leads to a portfolio of roughly 130 stocks. By diversifying holdings among a large number of stocks, we seek to reduce the risk associated with each individual stock.
We believe this model makes it possible to analyze far more stocks than can most traditional active portfolio managers, who rely primarily on their own talent and experience as well as the analytic skills of research professionals to assess each stock. Our approach, we believe, helps to reduce risk by helping us to choose stocks that are attractively valued in an objective, consistent and repeatable manner.
Q: What decisions enabled the fund to outperform its benchmark over the last six months?
A: As described above, our investment strategy is focused almost entirely on stock selection, and our strong performance resulted from stock selection, particularly in the health care equipment and services, materials and energy groups. Our favorable stock selection in these groups was mainly the outcome of using forward-looking indicators as part of the selection process. One of our best-performing forward indicators was earnings yield. Earnings yield is a measure of analysts' forecasts of future earnings divided by price. We employ a proprietary smart-estimate methodology, which evaluates an analyst's past accuracy in predicting earnings as well as the timeliness of the estimate. Estimates from analysts with demonstrated predictability and estimates submitted recently receive a higher emphasis in forming the final earnings view about a company. A high forward-earnings-to-price ratio should translate to higher future returns from the stock.
Q: Which holdings had the biggest impact on performance?
A: In the materials category, United States Steel Corp. added value. The company's strong position in raw materials, strengthening balance sheet, and ability to raise its dividend and buy back stock all added to its strong performance. Similarly, several holdings in the energy group, benefiting from high oil prices, were able to improve their balance sheets and increase capital spending. Energy holdings that contributed to performance include Valero Energy Corp., an oil refining and marketing company, and Apache Corp. and Devon Energy Corp., both of which are oil and gas exploration and development companies.
The share price of American Eagle Outfitters, Inc. moved higher, responding to earnings momentum that resulted from the company's offering a desirable assortment of products with an eye on value. Stock of mobile phone service provider Nextel Partners, Inc. moved up on the company's December agreement to merge with Sprint Communications, Inc., as this strategic combination has the potential for cost savings and accelerated growth.
In health care, strong performers included UnitedHealth Group, Inc. and Coventry Health Care, Inc., which are leading providers of managed care services. Both companies have been able to generate returns on invested capital well in excess of their cost of capital. Another stock that helped performance was Monsanto Co. The agricultural products company completed its acquisition of Seminis, the world's largest fruit and vegetable seed company, and also increased its guidance for second-quarter and full-year 2005 earnings.
On the negative side, underweight positions in tobacco giant Altria Group, Inc. and General Electric Co. hurt performance. In the technology sector, detractors included Computer Sciences Corp., which offers systems integration and business process services, and semiconductor producer Cree, Inc., which reported disappointing earnings. We reduced our position in Computer Sciences in April, but we remain overweight in the stock because the company has strong cash flows and solid growth prospects relative to its industry peers. We exited our position in Cree as its earnings-related indicators started to deteriorate relative to its peers.
Q: Do you have other comments for shareholders?
A: We are pleased with the fund's performance, which we believe provides solid evidence of the validity of our security selection process. We evaluate stocks using nine discrete factors that have a low correlation to one another. Using this methodology means that at times when certain factors do not work well as predictors of performance, others can prove more effective. For example, in recent months, forward-looking indicators such as earnings yield have been good predictors of performance, while the market has not seemed to respond to factors based on past experience, such as earnings quality. Market volatility has increased in the last few months but is still quite low in a historical context. In this environment, well-defined methods of stock selection can be especially valuable. We believe that our system, based on a combination of quantitative techniques and classic fundamentals, will continue to help this fund's performance.
The views expressed in this report reflect those of the portfolio managers only through the end of the period of the report as stated on the cover. The managers' views are subject to change at any time based on market and other conditions and should not be construed as a recommendation.
Portfolio Summary April 30, 2005 |
|
Asset Allocation (Excludes Securities Lending Collateral) | 4/30/05 | 10/31/04 |
|
Common Stocks | 98% | 98% |
Cash Equivalents | 2% | 2% |
| 100% | 100% |
Sector Diversification (As a % of Common Stocks) | 4/30/05 | 10/31/04 |
|
Financials | 18% | 20% |
Health Care | 15% | 14% |
Consumer Discretionary | 14% | 12% |
Information Technology | 14% | 15% |
Industrials | 11% | 14% |
Energy | 9% | 7% |
Consumer Staples | 8% | 7% |
Materials | 4% | 4% |
Telecommunication Services | 4% | 4% |
Utilities | 3% | 3% |
| 100% | 100% |
Asset allocation and sector diversification are subject to change.
Ten Largest Equity Holdings at April 30, 2005 (22.3% of Net Assets) |
1. General Electric Co. Industrial conglomerate | 3.3% |
2. Johnson & Johnson Provider of health care products | 3.1% |
3. Bank of America Corp. Provider of commercial banking services | 3.1% |
4. Intel Corp. Designer, manufacturer and seller of computer components and related products | 2.1% |
5. International Business Machines Corp. Manufacturer of computers and provider of information processing services | 2.0% |
6. Microsoft Corp. Developer of computer software | 1.9% |
7. Verizon Communications, Inc. Provider of wireline voice and data services | 1.8% |
8. ExxonMobil Corp. Explorer and producer of oil and gas | 1.7% |
9. Dell, Inc. Provider of computer products and customer service | 1.7% |
10. American Express Co. Provider of travel-related, financial advisory and international banking services | 1.6% |
Portfolio holdings are subject to change.
For more complete details about the Fund's investment portfolio, see page 16. A quarterly Fact Sheet is available upon request. Information concerning portfolio holdings of the Fund as of month end will be posted to scudder.com on the 15th of the following month. Please see the Account Management Resources section for contact information.
Following the Fund's fiscal first and third quarter-end, a complete portfolio holdings listing is filed with the SEC on Form N-Q. The form will be available on the SEC's Web site at www.sec.gov, and it also may be reviewed and copied at the SEC's Public Reference Room in Washington, D.C. Information on the operation of the SEC's Public Reference Room may be obtained by calling (800) SEC-0330.
Investment Portfolio as of April 30, 2005 (Unaudited) |  |  |
|
|
Shares
| Value ($) |
| |
Common Stocks 98.2% |
Consumer Discretionary 14.0% |
Auto Components 0.7% |
American Axle & Manufacturing Holdings, Inc. | 55,800 | 1,113,768 |
Autoliv, Inc. | 75,600 | 3,345,300 |
| 4,459,068 |
Hotels Restaurants & Leisure 2.1% |
McDonald's Corp. | 311,000 | 9,115,410 |
Starbucks Corp.* | 93,700 | 4,640,024 |
| 13,755,434 |
Household Durables 0.3% |
Ryland Group, Inc. | 27,300 | 1,676,220 |
Internet & Catalog Retail 0.3% |
eBay, Inc.* | 67,200 | 2,132,256 |
Media 4.6% |
Cablevision Systems Corp. (New York Group) "A"* | 158,300 | 4,107,885 |
John Wiley & Sons, Inc. "A" | 10,200 | 368,832 |
McGraw-Hill Companies, Inc. | 114,100 | 9,935,828 |
Omnicom Group, Inc. | 88,900 | 7,369,810 |
Walt Disney Co. | 290,700 | 7,674,480 |
| 29,456,835 |
Multiline Retail 0.4% |
Dillard's, Inc. "A" | 101,600 | 2,364,232 |
Specialty Retail 5.1% |
Abercrombie & Fitch Co. "A" | 104,400 | 5,632,380 |
American Eagle Outfitters, Inc. | 187,400 | 4,913,628 |
Best Buy Co., Inc. | 29,200 | 1,469,928 |
Michaels Stores, Inc. | 158,600 | 5,265,520 |
Pacific Sunwear of California, Inc.* | 34,800 | 786,828 |
PETCO Animal Supplies, Inc.* | 96,600 | 3,023,580 |
Staples, Inc. | 258,150 | 4,922,921 |
The Gap, Inc. | 315,100 | 6,727,385 |
| 32,742,170 |
Textiles, Apparel & Luxury Goods 0.5% |
NIKE, Inc. "B" | 28,700 | 2,204,447 |
VF Corp. | 12,800 | 724,352 |
| 2,928,799 |
Consumer Staples 7.4% |
Beverages 0.2% |
Molson Coors Brewing Co. "B" | 19,700 | 1,216,475 |
Food & Staples Retailing 1.2% |
7-Eleven, Inc.* | 45,100 | 1,054,889 |
Safeway, Inc.* | 322,800 | 6,872,412 |
| 7,927,301 |
Food Products 3.4% |
Hershey Foods Corp. | 147,800 | 9,444,420 |
Pilgrim's Pride Corp. | 95,600 | 3,450,204 |
William Wrigley Jr. Co. | 127,600 | 8,820,988 |
| 21,715,612 |
Household Products 0.9% |
Clorox Co. | 54,000 | 3,418,200 |
Kimberly-Clark Corp. | 38,400 | 2,398,080 |
| 5,816,280 |
Personal Products 1.3% |
Avon Products, Inc. | 48,400 | 1,939,872 |
Gillette Co. | 117,900 | 6,088,356 |
| 8,028,228 |
Tobacco 0.4% |
Altria Group, Inc. | 30,800 | 2,001,692 |
Loews Corp. — Carolina Group | 24,300 | 765,450 |
| 2,767,142 |
Energy 9.2% |
Oil, Gas & Consumable Fuels |
Apache Corp. | 153,800 | 8,657,402 |
Burlington Resources, Inc. | 202,700 | 9,853,247 |
Devon Energy Corp. | 224,100 | 10,122,597 |
El Paso Corp. | 409,400 | 4,089,906 |
ExxonMobil Corp. | 191,786 | 10,937,556 |
Kerr-McGee Corp. | 90,600 | 7,030,560 |
Sunoco, Inc. | 78,700 | 7,811,762 |
Valero Energy Corp. | 1,800 | 123,354 |
XTO Energy, Inc. | 1 | 30 |
| 58,626,414 |
Financials 17.8% |
Banks 6.4% |
Bank of America Corp. | 432,300 | 19,470,792 |
Golden West Financial Corp. | 75,300 | 4,693,449 |
US Bancorp. | 201,300 | 5,616,270 |
Wachovia Corp. | 86,400 | 4,421,952 |
Wells Fargo & Co. | 110,500 | 6,623,370 |
| 40,825,833 |
Capital Markets 3.5% |
Bear Stearns Companies, Inc. | 22,700 | 2,148,782 |
Lehman Brothers Holdings, Inc. | 51,900 | 4,760,268 |
Morgan Stanley | 101,600 | 5,346,192 |
The Goldman Sachs Group, Inc. | 93,600 | 9,995,544 |
| 22,250,786 |
Consumer Finance 2.1% |
American Express Co. | 196,900 | 10,376,630 |
Providian Financial Corp.* | 196,500 | 3,275,655 |
| 13,652,285 |
Diversified Financial Services 0.8% |
Citigroup, Inc. | 113,666 | 5,337,755 |
Insurance 3.7% |
Allstate Corp. | 3,000 | 168,480 |
American International Group, Inc. | 57,200 | 2,908,620 |
First American Corp. | 42,800 | 1,532,240 |
Genworth Financial, Inc."A" | 70,900 | 1,981,655 |
Loews Corp. | 46,200 | 3,274,656 |
MetLife, Inc. | 113,000 | 4,395,700 |
Odyssey Re Holdings Corp. (d) | 400 | 9,096 |
W.R. Berkley Corp. | 286,612 | 9,314,890 |
| 23,585,337 |
Real Estate 1.3% |
Apartment Investment & Management Co. "A" (REIT) | 26,300 | 1,002,556 |
Avalonbay Communities, Inc. (REIT) | 12,400 | 892,800 |
Boston Properties, Inc. (REIT) | 14,800 | 983,756 |
Equity Office Properties Trust (REIT) | 61,800 | 1,944,846 |
Equity Residential (REIT) | 52,400 | 1,799,940 |
Hospitality Properties Trust (REIT) | 20,100 | 839,778 |
Liberty Property Trust (REIT) | 13,200 | 525,756 |
| 7,989,432 |
Health Care 15.0% |
Biotechnology 2.0% |
Amgen, Inc.* | 159,000 | 9,255,390 |
Charles River Laboratories International, Inc.* | 70,000 | 3,315,900 |
| 12,571,290 |
Health Care Equipment & Supplies 2.3% |
Baxter International, Inc. | 59,000 | 2,188,900 |
Becton, Dickinson & Co. | 141,200 | 8,263,024 |
Dade Behring Holdings, Inc.* | 37,100 | 2,287,957 |
Kinetic Concepts, Inc.* | 30,300 | 1,861,935 |
| 14,601,816 |
Health Care Providers & Services 3.3% |
Covance, Inc.* | 45,600 | 2,081,184 |
Coventry Health Care, Inc.* | 24,200 | 1,656,006 |
HCA, Inc. | 104,700 | 5,846,448 |
Lincare Holdings, Inc.* | 36,700 | 1,566,356 |
UnitedHealth Group, Inc. | 108,000 | 10,207,080 |
| 21,357,074 |
Pharmaceuticals 7.4% |
Andrx Corp.* | 152,300 | 3,032,293 |
Barr Pharmaceuticals, Inc.* | 152,300 | 7,898,278 |
Bristol-Myers Squibb Co. | 14,900 | 387,400 |
Endo Pharmaceuticals Holdings, Inc.* | 99,400 | 1,973,090 |
Johnson & Johnson | 291,550 | 20,009,076 |
Merck & Co., Inc. | 139,100 | 4,715,490 |
Pfizer, Inc. | 332,800 | 9,042,176 |
| 47,057,803 |
Industrials 11.1% |
Aerospace & Defense 2.6% |
Boeing Co. | 120,100 | 7,148,352 |
General Dynamics Corp. | 47,800 | 5,021,390 |
Raytheon Co. | 121,800 | 4,580,898 |
| 16,750,640 |
Air Freight & Logistics 2.0% |
FedEx Corp. | 59,400 | 5,046,030 |
Ryder System, Inc. | 211,300 | 7,803,309 |
| 12,849,339 |
Commercial Services & Supplies 1.4% |
Cendant Corp. | 427,700 | 8,515,507 |
Corporate Executive Board Co. | 4,700 | 308,931 |
| 8,824,438 |
Industrial Conglomerates 4.5% |
3M Co. | 95,300 | 7,287,591 |
General Electric Co. | 583,000 | 21,104,600 |
| 28,392,191 |
Road & Rail 0.6% |
Yellow Roadway Corp.* (d) | 75,100 | 3,679,900 |
Information Technology 13.4% |
Communications Equipment 0.2% |
Cisco Systems, Inc.* | 77,800 | 1,344,384 |
Computers & Peripherals 5.4% |
Apple Computer, Inc.* | 178,000 | 6,418,680 |
Dell, Inc.* | 310,700 | 10,821,681 |
International Business Machines Corp. | 169,300 | 12,931,134 |
Western Digital Corp.* | 317,800 | 4,032,882 |
| 34,204,377 |
Internet Software & Services 0.2% |
Yahoo!, Inc.* | 41,900 | 1,445,969 |
IT Consulting & Services 1.2% |
Alliance Data Systems Corp.* | 60,400 | 2,440,160 |
Computer Sciences Corp.* | 99,700 | 4,334,956 |
Unisys Corp.* | 91,300 | 592,537 |
| 7,367,653 |
Semiconductors & Semiconductor Equipment 3.4% |
Broadcom Corp. "A"* | 147,100 | 4,399,761 |
Intel Corp. | 579,800 | 13,636,896 |
MEMC Electronic Materials, Inc.* | 317,800 | 3,727,794 |
| 21,764,451 |
Software 3.0% |
Adobe Systems, Inc. | 36,500 | 2,170,655 |
Citrix Systems, Inc.* (d) | 121,700 | 2,738,250 |
Microsoft Corp. | 491,100 | 12,424,830 |
Symantec Corp.* | 86,400 | 1,622,592 |
| 18,956,327 |
Materials 3.7% |
Chemicals 0.7% |
Monsanto Co. | 75,800 | 4,443,396 |
Containers & Packaging 0.1% |
Owens-Illinois, Inc.* | 35,000 | 858,200 |
Metals & Mining 2.9% |
Nucor Corp. | 41,600 | 2,125,760 |
Phelps Dodge Corp. | 63,000 | 5,408,550 |
Southern Peru Copper Corp. (d) | 102,500 | 5,241,850 |
United States Steel Corp. | 131,300 | 5,614,388 |
| 18,390,548 |
Telecommunication Services 4.2% |
Diversified Telecommunication Services 4.0% |
AT&T Corp. | 233,900 | 4,474,507 |
Citizens Communications Co. | 274,700 | 3,502,425 |
Sprint Corp. | 275,100 | 6,123,726 |
Verizon Communications, Inc. | 319,500 | 11,438,100 |
| 25,538,758 |
Wireless Telecommunication Services 0.2% |
Nextel Partners, Inc. "A"* | 58,100 | 1,366,512 |
Utilities 2.4% |
Electric Utilities 1.3% |
Exelon Corp. | 35,000 | 1,732,500 |
TXU Corp. | 77,000 | 6,605,830 |
| 8,338,330 |
Gas Utilities 0.3% |
Questar Corp. | 25,300 | 1,477,520 |
Multi-Utilities 0.8% |
Duke Energy Corp. | 178,700 | 5,216,253 |
Total Common Stocks (Cost $581,508,968) | 626,051,063 |
| Principal Amount ($) | Value ($) |
| |
US Government Backed 0.2% |
US Treasury Bill, 2.869%**, 7/21/2005 (c) (Cost $1,377,148) | 1,387,000 | 1,378,463 |
|
Shares
| Value ($) |
| |
Securities Lending Collateral 1.4% |
Scudder Daily Assets Fund Institutional, 2.94% (e) (f) (Cost $8,561,360) | 8,561,360 | 8,561,360 |
|
Cash Equivalents 1.7% |
Scudder Cash Management QP Trust, 2.81% (b) (Cost $10,815,997) | 10,815,997 | 10,815,997 |
| % of Net Assets | Value ($) |
| |
Total Investment Portfolio (Cost $602,263,473) (a) | 101.5 | 646,806,883 |
Other Assets and Liabilities, Net | (1.5) | (9,347,643) |
Net Assets | 100.0 | 637,459,240 |
* Non-income producing security.
** Annualized yield at time of purchase; not a coupon rate.
(a) The cost for federal income tax purposes was $604,295,673. At April 30, 2005, net unrealized appreciation for all securities based on tax cost was $42,511,210. This consisted of aggregate gross unrealized appreciation for all securities in which there was an excess of value over tax cost of $58,521,724 and aggregate gross unrealized depreciation for all securities in which there was an excess of tax cost over value of $16,010,514.
(b) Scudder Cash Management QP Trust is managed by Deutsche Investment Management Americas Inc. The rate shown is the annualized seven-day yield at period end.
(c) At April 30, 2005, this security has been pledged to cover, in whole or part, initial margin requirements for open futures contracts.
(d) All or a portion of these securities were on loan. The value of all securities loaned at April 30, 2005 amounted to $8,294,760, which is 1.3% of net assets.
(e) Represents collateral held in connection with securities lending.
(f) Scudder Daily Assets Fund Institutional, an affiliated fund, is managed by Deutsche Asset Management, Inc. The rate shown is the annualized seven-day yield at period end.
REIT: Real Estate Investment Trust
At April 30, 2005, open futures contracts purchased were as follows:
Futures | Expiration Date | Contracts | Aggregate Face Value ($) | Value ($) | Unrealized Depreciation ($) |
S&P 500 Index | 6/16/2005 | 42 | 12,605,154 | 12,164,250 | (440,904) |
The accompanying notes are an integral part of the financial statements.
Statement of Assets and Liabilities as of April 30, 2005 (Unaudited) |
Assets |
Investments: Investments in securities, at value (cost $582,886,116) — including $8,294,760 of securities loaned | $ 627,429,526 |
Investment in Scudder Daily Asset Fund Institutional (cost $8,561,360)* | 8,561,360 |
Investment in Scudder Cash Management QP Trust (cost $10,815,997) | 10,815,997 |
Total investments in securities, at value (cost $602,263,473) | 646,806,883 |
Cash | 1,059,133 |
Dividends receivable | 672,609 |
Interest receivable | 57,716 |
Receivable for Fund shares sold | 260,626 |
Receivable for daily variation margin on open futures contracts | 161,700 |
Other assets | 69,163 |
Total assets | 649,087,830 |
Liabilities |
Payable for investments purchased | 1,059,133 |
Payable upon return of securities loaned | 8,561,360 |
Payable for Fund shares redeemed | 1,125,505 |
Accrued management fee | 283,057 |
Other accrued expenses and payables | 599,535 |
Total liabilities | 11,628,590 |
Net assets, at value | $ 637,459,240 |
Net Assets |
Net assets consist of: Undistributed net investment income | 654,355 |
Net unrealized appreciation (depreciation) on: Investments | 44,543,410 |
Futures | (440,904) |
Accumulated net realized gain (loss) | (53,953,087) |
Paid-in capital | 646,655,466 |
Net assets, at value | $ 637,459,240 |
* Represents collateral on securities loaned.
The accompanying notes are an integral part of the financial statements.
Statement of Assets and Liabilities as of April 30, 2005 (Unaudited) (continued) |
Net Asset Value |
Class A Net Asset Value and redemption price(a) per share ($398,634,904 ÷ 22,136,258 outstanding shares of beneficial interest, $.01 par value, unlimited number of shares authorized) | $ 18.01 |
Maximum offering price per share (100 ÷ 94.25 of $18.01) | $ 19.11 |
Class B Net Asset Value, offering and redemption price(a) (subject to contingent deferred sales charge) per share ($117,107,391 ÷ 6,883,756 outstanding shares of beneficial interest, $.01 par value, unlimited number of shares authorized) | $ 17.01 |
Class C Net Asset Value, offering and redemption price(a) (subject to contingent deferred sales charge) per share ($45,342,447 ÷ 2,638,375 outstanding shares of beneficial interest, $.01 par value, unlimited number of shares authorized) | $ 17.19 |
Class S Net Asset Value, offering and redemption price(a) (subject to contingent deferred sales charge) per share ($571,323 ÷ 31,701 outstanding shares of beneficial interest, $.01 par value, unlimited number of shares authorized) | $ 18.02 |
Institutional Class Net Asset Value, offering and redemption price(a) per share ($75,803,175 ÷ 4,077,651 outstanding shares of beneficial interest, $.01 par value, unlimited number of shares authorized) | $ 18.59 |
(a) Redemption price per share for shares held less than 15 days is equal to net asset value less a 2% redemption fee.
The accompanying notes are an integral part of the financial statements.
Statement of Operations for the six months ended April 30, 2005 (Unaudited) |
Investment Income |
Income: Dividends | $ 5,751,468 |
Interest — Scudder Cash Management QP Trust | 191,745 |
Interest | 15,787 |
Securities lending income, including income from Scudder Daily Assets Fund Institutional, net of borrower rebates | 48,278 |
Total Income | 6,007,278 |
Expenses: Management fee | 1,817,537 |
Services to shareholders | 1,188,230 |
Custodian | 15,180 |
Distribution service fees | 1,363,807 |
Auditing | 25,564 |
Legal | 12,992 |
Trustees' fees and expenses | 18,216 |
Reports to shareholders | 51,123 |
Registration fees | 31,647 |
Other | 21,826 |
Total expenses, before expense reductions | 4,546,122 |
Expense reductions | (143,277) |
Total expenses, after expense reductions | 4,402,845 |
Net investment income (loss) | 1,604,433 |
Realized and Unrealized Gain (Loss) on Investment Transactions |
Net realized gain (loss) from: Investments | 44,961,229 |
Futures | 1,041,468 |
| 46,002,697 |
Net unrealized appreciation (depreciation) during the period on: Investments | (20,343,414) |
Futures | (610,674) |
| (20,954,088) |
Net gain (loss) on investment transactions | 25,048,609 |
Net increase (decrease) in net assets resulting from operations | $ 26,653,042 |
The accompanying notes are an integral part of the financial statements.
Statement of Changes in Net Assets |
Increase (Decrease) in Net Assets | Six Months Ended April 30, 2005 (Unaudited) | Year Ended October 31, 2004 |
Operations: Net investment income (loss) | $ 1,604,433 | $ 678,934 |
Net realized gain (loss) on investment transactions | 46,002,697 | 82,539,882 |
Net unrealized appreciation (depreciation) during the period on investment transactions | (20,954,088) | (10,632,187) |
Net increase (decrease) in net assets resulting from operations | 26,653,042 | 72,586,629 |
Distributions to shareholders from: Net investment income: Class A | (1,145,670) | — |
Institutional Class | (454,946) | — |
Fund share transactions: Proceeds from shares sold | 91,765,887 | 213,144,074 |
Reinvestment of distributions | 1,529,305 | — |
Cost of shares redeemed | (96,153,988) | (244,315,635) |
Redemption fees | 6,828 | — |
Net increase (decrease) in net assets from Fund share transactions | (2,851,968) | (31,171,561) |
Increase (decrease) in net assets | 22,200,458 | 41,415,068 |
Net assets at beginning of period | 615,258,782 | 573,843,714 |
Net assets at end of period (including undistributed net investment income of $654,355 and $650,538, respectively) | $ 637,459,240 | $ 615,258,782 |
The accompanying notes are an integral part of the financial statements.
Class A |
Years Ended October 31, | 2005a | 2004 | 2003 | 2002 | 2001 | 2000 |
Selected Per Share Data |
Net asset value, beginning of period | $ 17.30 | $ 15.24 | $ 12.92 | $ 15.03 | $ 21.76 | $ 20.76 |
Income (loss) from investment operations: Net investment income (loss)b | .06 | .06 | .04 | .03 | (.03) | (.03) |
Net realized and unrealized gain (loss) on investment transactions | .70 | 2.00 | 2.28 | (2.14) | (6.10) | 1.78 |
Total from investment operations | .76 | 2.06 | 2.32 | (2.11) | (6.13) | 1.75 |
Less distributions from: Net investment income | (.05) | — | — | — | — | — |
Net realized gains on investment transactions | — | — | — | — | (.60) | (.75) |
Total distributions | (.05) | — | — | — | (.60) | (.75) |
Redemption fees | .00*** | — | — | — | — | — |
Net asset value, end of period | $ 18.01 | $ 17.30 | $ 15.24 | $ 12.92 | $ 15.03 | $ 21.76 |
Total Return (%)c | 4.40** | 13.52 | 17.96 | (14.04) | (28.71) | 8.51 |
Ratios to Average Net Assets and Supplemental Data |
Net assets, end of period ($ millions) | 399 | 382 | 349 | 308 | 430 | 651 |
Ratio of expenses before expense reductions (%) | 1.17* | 1.13 | 1.19 | 1.09 | 1.23d | 1.17 |
Ratio of expenses after expense reductions (%) | 1.17* | 1.13 | 1.19 | 1.09 | 1.22d | 1.16 |
Ratio of net investment income (loss) (%) | .57* | .42 | .34 | .21 | (.14) | (.14) |
Portfolio turnover rate (%) | 232* | 222 | 185 | 143 | 124 | 89 |
a For the six months ended April 30, 2005 (Unaudited). b Based on average shares outstanding during the period. c Total return does not reflect the effect of any sales charges. d The ratios of operating expenses excluding costs incurred with a fund complex reorganization before and after expense reductions were 1.20% and 1.20%, respectively. * Annualized ** Not annualized *** Amount is less than $.005. |
|
Class B |
Years Ended October 31, | 2005a | 2004 | 2003 | 2002 | 2001 | 2000 |
Selected Per Share Data |
Net asset value, beginning of period | $ 16.37 | $ 14.55 | $ 12.43 | $ 14.58 | $ 21.30 | $ 20.50 |
Income (loss) from investment operations: Net investment income (loss)b | (.01) | (.06) | (.05) | (.09) | (.16) | (.20) |
Net realized and unrealized gain (loss) on investment transactions | .65 | 1.88 | 2.17 | (2.06) | (5.96) | 1.75 |
Total from investment operations | .64 | 1.82 | 2.12 | (2.15) | (6.12) | 1.55 |
Less distributions from: Net realized gains on investment transactions | — | — | — | — | (.60) | (.75) |
Redemption fees | .00*** | — | — | — | — | — |
Net asset value, end of period | $ 17.01 | $ 16.37 | $ 14.55 | $ 12.43 | $ 14.58 | $ 21.30 |
Total Return (%)c | 3.91d** | 12.51d | 17.06 | (14.75) | (29.30) | 7.62 |
Ratios to Average Net Assets and Supplemental Data |
Net assets, end of period ($ millions) | 117 | 138 | 178 | 197 | 293 | 454 |
Ratio of expenses before expense reductions (%) | 2.20* | 2.09 | 2.00 | 1.93 | 2.04e | 1.98 |
Ratio of expenses after expense reductions (%) | 2.01* | 2.01 | 2.00 | 1.93 | 2.02e | 1.97 |
Ratio of net investment income (loss) (%) | (.27)* | (.46) | (.47) | (.63) | (.93) | (.95) |
Portfolio turnover rate (%) | 232* | 222 | 185 | 143 | 124 | 89 |
a For the six months ended April 30, 2005 (Unaudited). b Based on average shares outstanding during the period. c Total return does not reflect the effect of any sales charges. d Total return would have been lower had certain expenses not been reduced. e The ratios of operating expenses excluding costs incurred with a fund complex reorganization before and after expense reductions were 1.99% and 1.99%, respectively. * Annualized ** Not annualized *** Amount is less than $.005. |
|
Class C |
Years Ended October 31, | 2005a | 2004 | 2003 | 2002 | 2001 | 2000 |
Selected Per Share Data |
Net asset value, beginning of period | $ 16.53 | $ 14.69 | $ 12.55 | $ 14.72 | $ 21.47 | $ 20.64 |
Income (loss) from investment operations: Net investment income (loss)b | (.01) | (.07) | (.06) | (.09) | (.15) | (.20) |
Net realized and unrealized gain (loss) on investment transactions | .67 | 1.91 | 2.20 | (2.08) | (6.00) | 1.78 |
Total from investment operations | .66 | 1.84 | 2.14 | (2.17) | (6.15) | 1.58 |
Less distributions from: Net realized gains on investment transactions | — | — | — | — | (.60) | (.75) |
Redemption fees | .00*** | — | — | — | — | — |
Net asset value, end of period | $ 17.19 | $ 16.53 | $ 14.69 | $ 12.55 | $ 14.72 | $ 21.47 |
Total Return (%)c | 3.99d** | 12.53d | 17.05 | (14.74) | (29.21) | 7.72 |
Ratios to Average Net Assets and Supplemental Data |
Net assets, end of period ($ millions) | 45 | 46 | 47 | 44 | 59 | 75 |
Ratio of expenses before expense reductions (%) | 2.07* | 2.06 | 1.99 | 1.90 | 1.95e | 1.93 |
Ratio of expenses after expense reductions (%) | 2.00* | 2.00 | 1.99 | 1.90 | 1.92e | 1.93 |
Ratio of net investment income (loss) (%) | (.26)* | (.45) | (.46) | (.60) | (.84) | (.91) |
Portfolio turnover rate (%) | 232* | 222 | 185 | 143 | 124 | 89 |
a For the six months ended April 30, 2005 (Unaudited). b Based on average shares outstanding during the period. c Total return does not reflect the effect of any sales charges. d Total return would have been lower had certain expenses not been reduced. e The ratios of operating expenses excluding costs incurred with a fund complex reorganization before and after expense reductions were 1.92% and 1.92%, respectively. * Annualized ** Not annualized *** Amount is less than $.005. |
|
Class S |
| 2005a |
Selected Per Share Data |
Net asset value, beginning of period | $ 18.44 |
Income (loss) from investment operations: Net investment income (loss)b | .13 |
Net realized and unrealized gain (loss) on investment transactions | (.55) |
Total from investment operations | (.42) |
Redemption fees | .00*** |
Net asset value, end of period | $ 18.02 |
Total Return (%) | (2.28)** |
Ratios to Average Net Assets and Supplemental Data |
Net assets, end of period ($ millions) | .6 |
Ratio of expenses (%) | .86* |
Ratio of net investment income (loss) (%) | .74* |
Portfolio turnover rate (%) | 232* |
a For the period from February 1, 2005 (commencement of operations of Class S shares) to April 30, 2005 (Unaudited). b Based on average shares outstanding during the period. * Annualized ** Not annualized *** Amount is less than $.005. |
|
Institutional Class |
Years Ended October 31, | 2005a | 2004 | 2003 | 2002 | 2001 | 2000 |
Selected Per Share Data |
Net asset value, beginning of period | $ 17.90 | $ 15.70 | $ 13.25 | $ 15.36 | $ 22.11 | $ 20.99 |
Income (loss) from investment operations: Net investment income (loss)b | .10 | .12 | .11 | .09 | .07 | .08 |
Net realized and unrealized gain (loss) on investment transactions | .73 | 2.08 | 2.34 | (2.20) | (6.22) | 1.79 |
Total from investment operations | .83 | 2.20 | 2.45 | (2.11) | (6.15) | 1.87 |
Less distributions from: Net investment income | (.14) | — | — | — | — | — |
Net realized gains on investment transactions | — | — | — | — | (.60) | (.75) |
Total distributions | (.14) | — | — | — | (.60) | (.75) |
Redemption fees | .00*** | — | — | — | — | — |
Net asset value, end of period | $ 18.59 | $ 17.90 | $ 15.70 | $ 13.25 | $ 15.36 | $ 22.11 |
Total Return (%) | 4.63c** | 14.01c | 18.49 | (13.74) | (28.34) | 9.01 |
Ratios to Average Net Assets and Supplemental Data |
Net assets, end of period ($ millions) | 76 | 50 | .2 | 3 | 6 | 10 |
Ratio of expenses before expense reductions (%) | .74* | .74 | .72 | .66 | .70d | .69 |
Ratio of expenses after expense reductions (%) | .73* | .74 | .72 | .66 | .70d | .68 |
Ratio of net investment income (loss) (%) | 1.12* | .81 | .81 | .64 | .39 | .34 |
Portfolio turnover rate (%) | 232* | 222 | 185 | 143 | 124 | 89 |
a For the six months ended April 30, 2005 (Unaudited). b Based on average shares outstanding during the period. c Total return would have been lower had certain expenses not been reduced. d The ratios of operating expenses excluding costs incurred with a fund complex reorganization before and after expense reductions were .69% and .69%, respectively. * Annualized ** Not annualized *** Amount is less than $.005. |
Notes to Financial Statements (Unaudited) |
|
 A. Significant Accounting Policies
Scudder Blue Chip Fund (the ``Fund'') is registered under the Investment Company Act of 1940, as amended (the ``1940 Act''), as an open-end, diversified management investment company organized as a Massachusetts business trust.
The Fund offers multiple classes of shares which provide investors with different purchase options. Class A shares are offered to investors subject to an initial sales charge. Class B shares are offered without an initial sales charge but are subject to higher ongoing expenses than Class A shares and a contingent deferred sales charge payable upon certain redemptions. Class B shares automatically convert to Class A shares six years after issuance. Class C shares are offered without an initial sales charge but are subject to higher ongoing expenses than Class A shares and a contingent deferred sales charge payable upon certain redemptions within one year of purchase. Class C shares do not convert into another class. Institutional Class shares are offered to a limited group of investors, are not subject to initial or contingent deferred sales charges and have lower ongoing expenses than other classes. On February 1, 2005, the Fund commenced offering Class S shares which are no longer available to new investors except under certain circumstances. (Please refer to the Fund's Statement of Additional Information.) Class S shares are not subject to initial or contingent deferred sales charges.
Investment income, realized and unrealized gains and losses, and certain fund-level expenses and expense reductions, if any, are borne pro rata on the basis of relative net assets by the holders of all classes of shares, except that each class bears certain expenses unique to that class such as distribution service fees, services to shareholders and certain other class specific expenses. Differences in class-level expenses may result in payment of different per share dividends by class. All shares of the Fund have equal rights with respect to voting subject to class-specific arrangements.
The Fund's financial statements are prepared in accordance with accounting principles generally accepted in the United States of America which require the use of management estimates. Actual results could differ from those estimates. The policies described below are followed consistently by the Fund in the preparation of its financial statements.
Security Valuation. Investments are stated at value determined as of the close of regular trading on the New York Stock Exchange on each day the exchange is open for trading. Equity securities are valued at the most recent sale price or official closing price reported on the exchange (US or foreign) or over-the-counter market on which the security is traded most extensively. Securities for which no sales are reported are valued at the calculated mean between the most recent bid and asked quotations on the relevant market or, if a mean cannot be determined, at the most recent bid quotation.
Money market instruments purchased with an original or remaining maturity of sixty days or less, maturing at par, are valued at amortized cost. Investments in open-end investment companies and Scudder Cash Management QP Trust are valued at their net asset value each business day.
Securities and other assets for which market quotations are not readily available or for which the above valuation procedures are deemed not to reflect fair value are valued in a manner that is intended to reflect their fair value as determined in accordance with procedures approved by the Trustees.
Securities Lending. The Fund may lend securities to financial institutions. The Fund retains beneficial ownership of the securities it has loaned and continues to receive interest and dividends paid by the securities and to participate in any changes in their market value. The Fund requires the borrowers of the securities to maintain collateral with the Fund consisting of liquid, unencumbered assets having a value at least equal to the value of the securities loaned. The Fund may invest the cash collateral into a joint trading account in an affiliated money market fund pursuant to Exemptive Orders issued by the SEC. The Fund receives compensation for lending its securities either in the form of fees or by earning interest on invested cash collateral net of fees paid to a lending agent. Either the Fund or the borrower may terminate the loan. The Fund is subject to all investment risks associated with the value of any cash collateral received, including, but not limited to, interest rate, credit and liquidity risk associated with such investments.
Futures Contracts. A futures contract is an agreement between a buyer or seller and an established futures exchange or its clearinghouse in which the buyer or seller agrees to take or make a delivery of a specific amount of a financial instrument at a specified price on a specific date (settlement date). The Fund may enter into futures contracts as a hedge against anticipated interest rate, currency or equity market changes, and for duration management, risk management and return enhancement purposes.
Upon entering into a futures contract, the Fund is required to deposit with a financial intermediary an amount ("initial margin") equal to a certain percentage of the face value indicated in the futures contract. Subsequent payments ("variation margin") are made or received by the Fund dependent upon the daily fluctuations in the value of the underlying security and are recorded for financial reporting purposes as unrealized gains or losses by the Fund. When entering into a closing transaction, the Fund will realize a gain or loss equal to the difference between the value of the futures contract to sell and the futures contract to buy. Futures contracts are valued at the most recent settlement price.
Certain risks may arise upon entering into futures contracts, including the risk that an illiquid secondary market will limit the Fund's ability to close out a futures contract prior to the settlement date and that a change in the value of a futures contract may not correlate exactly with the changes in the value of the securities or currencies hedged. When utilizing futures contracts to hedge, the Fund gives up the opportunity to profit from favorable price movements in the hedged positions during the term of the contract.
Federal Income Taxes. The Fund's policy is to comply with the requirements of the Internal Revenue Code, as amended, which are applicable to regulated investment companies, and to distribute all of its taxable income to its shareholders. Accordingly, the Fund paid no federal income taxes and no federal income tax provision was required.
At October 31, 2004, the Fund had a net tax basis capital loss carryforward of approximately $97,228,000 which may be applied against any realized net taxable capital gains of each succeeding year until fully utilized or until October 31, 2009 ($37,660,000), October 31, 2010 ($56,710,000) and October 31, 2011 ($2,858,000), the respective expiration dates, whichever occurs first.
Distribution of Income and Gains. Net investment income of the Fund, if any, is distributed to shareholders annually. Net realized gains from investment transactions, in excess of available capital loss carryforwards, would be taxable to the Fund if not distributed, and, therefore, will be distributed to shareholders at least annually.
The timing and characterization of certain income and capital gains distributions are determined annually in accordance with federal tax regulations which may differ from accounting principles generally accepted in the United States of America. These differences primarily relate to certain securities sold at a loss. As a result, net investment income (loss) and net realized gain (loss) on investment transactions for a reporting period may differ significantly from distributions during such period. Accordingly, the Fund may periodically make reclassifications among certain of its capital accounts without impacting the net asset value of the Fund.
The tax character of current year distributions will be determined at the end of the current fiscal year.
Redemption Fees. Effective February 1, 2005, the Fund imposes a redemption fee of 2% of the total redemption amount on the Fund shares redeemed or exchanged within 15 days of buying them, either by purchase or exchange. This fee is assessed and retained by the Fund for the benefit of the remaining shareholders. The redemption fee is accounted for as an addition to paid-in capital.
Contingencies. In the normal course of business, the Fund may enter into contracts with service providers that contain general indemnification clauses. The Fund's maximum exposure under these arrangements is unknown as this would involve future claims that may be made against the Fund that have not yet been made. However, based on experience, the Fund expects the risk of loss to be remote.
Other. Investment transactions are accounted for on a trade date plus one basis for daily net asset value calculations. However, for financial reporting purposes, investment transactions are reported on trade date. Interest income is recorded on the accrual basis. Dividend income is recorded on the ex-dividend date net of foreign withholding taxes. Certain dividends from foreign securities may be recorded subsequent to the ex-dividend date as soon as the Fund is informed of such dividends. Realized gains and losses from investment transactions are recorded on an identified cost basis.
B. Purchases and Sales of Securities
During the six months ended April 30, 2005, purchases and sales of investment securities (excluding short-term instruments) aggregated $734,675,582 and $733,429,289, respectively.
C. Related Parties
Management Agreement. Under the Management Agreement with Deutsche Investment Management Americas Inc. ("DeIM" or the "Advisor"), an indirect, wholly owned subsidiary of Deutsche Bank AG, the Advisor directs the investments of the Fund in accordance with its investment objectives, policies and restrictions. The Advisor determines the securities, instruments and other contracts relating to investments to be purchased, sold or entered into by the Fund. In addition to portfolio management services, the Advisor provides certain administrative services in accordance with the Management Agreement. The Fund pays a monthly investment management fee of 1/12 of the annual rate of 0.58% of the first $250,000,000 of the Fund's average daily net assets, 0.55% of the next $750,000,000 of such net assets, 0.53% of the next $1,500,000,000 of such net assets, 0.51% of the next $2,500,000,000 of such net assets, 0.48% of the next $2,500,000,000 of such net assets, 0.46% of the next $2,500,000,000 of such net assets, 0.44% of the next $2,500,000,000 of such net assets and 0.42% of such net assets in excess of $12,500,000,000, computed and accrued daily and payable monthly. Accordingly, for the six months ended April 30, 2005, the fee pursuant to the Management Agreement was equivalent to an annualized effective rate of 0.56% of the Fund's average daily net assets.
Effective October 1, 2003 through January 31, 2006 (Class S commencement of operations February 1, 2005 through January 31, 2006), the Advisor has agreed to contractually waive all or a portion of its management fee and reimburse or pay certain operating expenses of the Fund to the extent necessary to maintain the operating expenses at 0.990%, 1.010%, 1.000%, 0.990% and 0.725% for Class A, B, C, S and Institutional Class shares, respectively (excluding certain expenses such as extraordinary expenses, taxes, brokerage, interest, Rule 12b-1 distribution and/or service fees, trustees and trustee counsel fees and organizational and offering expenses).
Service Provider Fees. Scudder Investments Service Company ("SISC"), an affiliate of the Advisor, is the transfer, shareholder service and dividend-paying agent for Class A, B, C and Institutional Class of the Fund. Scudder Service Corporation ("SSC"), a subsidiary of the Advisor, is the transfer, shareholder service and dividend-paying agent for Class S shares of the Fund. Pursuant to a sub-transfer agency agreement among SISC, SSC and DST Systems, Inc. ("DST"), SISC and SSC have delegated certain transfer agent and dividend-paying agent functions to DST. SISC and SSC compensate DST out of the shareholder servicing fee they receive from the Fund. For the six months ended April 30, 2005, the amounts charged to the Fund by SISC and SSC were as follows:
Service to Shareholders | Total Aggregated | Waived | Unpaid at April 30, 2005 |
Class A | $ 480,509 | $ — | $ 17,720 |
Class B | 325,941 | 121,921 | 171,273 |
Class C | 91,247 | 16,168 | 52,273 |
Institutional Class | 16,869 | 1,179 | 6,109 |
Class S | 88 | — | 70 |
| $ 914,654 | $ 139,268 | $ 247,445 |
Distribution Service Agreement. Under the Distribution Service Agreement, in accordance with Rule 12b-1 under the 1940 Act, Scudder Distributors, Inc., ("SDI"), an affiliate of the Advisor, receives a fee ("Distribution Fee") of 0.75% of average daily net assets of Class B and C shares. Pursuant to the agreement, SDI enters into related selling group agreements with various firms at various rates for sales of Class B and C shares. For the six months ended April 30, 2005, the Distribution Fee was as follows:
Distribution Fee | Total Aggregated | Unpaid at April 30, 2005 |
Class B | $ 493,245 | $ 70,042 |
Class C | 176,193 | 28,065 |
| $ 669,438 | $ 98,107 |
In addition, SDI provides information and administrative services ("Service Fee") to Class A, B and C shareholders at an annual rate of up to 0.25% of average daily net assets for each such class. SDI in turn has various agreements with financial services firms that provide these services and pays these fees based upon the assets of shareholder accounts the firms service. For the six months ended April 30, 2005, the Service Fee was as follows:
Service Fee | Total Aggregated | Unpaid at April 30, 2005 | Annualized Effective Rate |
Class A | $ 476,032 | $ 69,857 | .24% |
Class B | 161,415 | 28,232 | .25% |
Class C | 56,922 | 9,451 | .24% |
| $ 694,369 | $ 107,540 | |
Underwriting Agreement and Contingent Deferred Sales Charge. SDI is the principal underwriter for the Fund. Underwriting commissions paid in connection with the distribution of Class A and Class C shares for the six months ended April 30, 2005 aggregated $26,275 and $0, respectively.
In addition, SDI receives any contingent deferred sales charge ("CDSC") from Class B share redemptions occurring within six years of purchase and Class C share redemptions occurring within one year of purchase. There is no such charge upon redemption of any share appreciation or reinvested dividends. The CDSC is based on declining rates ranging from 4% to 1% for Class B and 1% for Class C, of the value of shares redeemed. For the six months ended April 30, 2005, the CDSC for Class B and C shares aggregated $255,105 and $841, respectively. A deferred sales charge of up to 1% is assessed on certain redemptions of Class A shares. For the six months ended April 30, 2005, SDI received $0.
Trustees' Fees and Expenses. The Fund pays each Trustee not affiliated with the Advisor retainer fees plus specified amounts for attended board and committee meetings.
Scudder Cash Management QP Trust. Pursuant to an Exemptive Order issued by the SEC, the Fund may invest in the Scudder Cash Management QP Trust (the "QP Trust") and other affiliated funds managed by the Advisor. The QP Trust seeks to provide as high a level of current income as is consistent with the preservation of capital and the maintenance of liquidity. The QP Trust does not pay the Advisor a management fee for the affiliated funds' investments in the QP Trust.
Insurance Brokerage Commissions. The Fund paid insurance premiums to an unaffiliated insurance broker in 2002 and 2003. This broker in turn paid a portion of its commissions to an affiliate of the Advisor, which performed certain insurance brokerage services for the broker. The Advisor has reimbursed the Fund for the portion of commissions (plus interest) paid to the affiliate of the Advisor attributable to the premiums paid by the Fund. The amounts for 2002 and 2003 were $198 and $174, respectively.
D. Expense Reductions
For the six months ended April 30, 2005, the Advisor agreed to reimburse the Fund $3,917, which represents a portion of the fee savings expected to be realized by the Advisor related to the outsourcing by the Advisor of certain administrative services to an unaffiliated service provider.
In addition, the Fund has entered into an arrangement with its custodian whereby credits realized as a result of uninvested cash balances are used to reduce a portion of the Fund's custodian expenses. During the six months ended April 30, 2005, the custodian fee was reduced by $92 for custodian credits earned.
E. Line of Credit
The Fund and several other affiliated funds (the ``Participants'') share in a $1.1 billion revolving credit facility administered by J.P. Morgan Chase Bank for temporary or emergency purposes, including the meeting of redemption requests that otherwise might require the untimely disposition of securities. The Participants are charged an annual commitment fee which is allocated, based upon net assets, among each of the Participants. Interest is calculated at the Federal Funds Rate plus 0.5 percent. The Fund may borrow up to a maximum of 33 percent of its net assets under the agreement.
F. Share Transactions
The following table summarizes share and dollar activity in the Fund:
| Six Months Ended
April 30, 2005 | Year Ended
October 31, 2004 |
| Shares | Dollars | Shares | Dollars |
Shares sold |
Class A | 2,997,971 | $ 55,108,786 | 5,245,266 | $ 86,367,470 |
Class B | 341,102 | 5,910,241 | 1,749,585 | 27,306,248 |
Class C | 363,714 | 6,383,735 | 735,484 | 11,603,808 |
Institutional Class* | 1,273,508 | 23,775,852 | 5,140,202 | 87,866,548 |
Class S** | 31,861 | 587,273 | — | — |
| | $ 91,765,887 | | $ 213,144,074 |
Shares issued to shareholders in reinvestment of distributions |
Class A | 58,258 | $ 1,074,359 | — | $ — |
Class B | — | — | — | — |
Class C | — | — | — | — |
Institutional Class* | 23,932 | 454,946 | — | — |
Class S** | — | — | — | — |
| | $ 1,529,305 | | $ — |
Shares redeemed |
Class A | (2,973,646) | $ (54,519,215) | (6,062,517) | $ (100,027,713) |
Class B | (1,867,165) | (32,389,610) | (5,551,834) | (86,715,690) |
Class C | (498,863) | (8,767,755) | (1,182,658) | (18,713,691) |
Institutional Class* | (24,998) | (474,404) | (2,346,517) | (38,858,541) |
Class S** | (160) | (3,004) | — | — |
| | $ (96,153,988) | | $ (244,315,635) |
Redemption fees | $ 6,828 | | $ — |
Net increase (decrease) |
Class A | 82,583 | $ 1,668,632 | (817,251) | $ (13,660,243) |
Class B | (1,526,063) | (26,479,234) | (3,802,249) | (59,409,442) |
Class C | (135,149) | (2,382,029) | (447,174) | (7,109,883) |
Institutional Class* | 1,272,442 | 23,756,394 | 2,793,685 | 49,008,007 |
Class S** | 31,701 | 584,269 | — | — |
| | $ (2,851,968) | | $ (31,171,561) |
* On August 13, 2004, Class I shares of the Fund were renamed to Institutional Class.
** For the period from February 1, 2005 (commencement of operations of Class S shares) to April 30, 2005.
G. Regulatory Matters and Litigation
Since at least July 2003, federal, state and industry regulators have been conducting ongoing inquiries and investigations ("inquiries") into the mutual fund industry, and have requested information from numerous mutual fund companies, including Scudder Investments. It is not possible to determine what the outcome of these inquiries will be or what the effect, if any, would be on the funds or their advisors. Publicity about mutual fund practices arising from these industry-wide inquiries serves as the general basis of a number of private lawsuits against the Scudder funds. These lawsuits, which previously have been reported in the press, involve purported class action and derivative lawsuits, making various allegations and naming as defendants various persons, including certain Scudder funds, the funds' investment advisors and their affiliates, certain individuals, including in some cases fund Trustees/Directors, officers, and other parties. Each Scudder fund's investment advisor has agreed to indemnify the applicable Scudder funds in connection with these lawsuits, or other lawsuits or regulatory actions that may be filed making allegations similar to these lawsuits regarding market timing, revenue sharing, fund valuation or other subjects arising from or related to the pending inquiries. Based on currently available information, the funds' investment advisors believe the likelihood that the pending lawsuits will have a material adverse financial impact on a Scudder fund is remote and such actions are not likely to materially affect their ability to perform under their investment management agreements with the Scudder funds.
Account Management Resources |
|
For shareholders of Classes A, B,C Institutional
Automated Information Lines | ScudderACCESS (800) 972-3060 Personalized account information, information on other Scudder funds and services via touchtone telephone and for Classes A, B, and C only, the ability to exchange or redeem shares. |
Web Site | scudder.com View your account transactions and balances, trade shares, monitor your asset allocation, and change your address, 24 hours a day. Obtain prospectuses and applications, blank forms, interactive worksheets, news about Scudder funds, subscription to fund updates by e-mail, retirement planning information, and more. |
For More Information | (800) 621-1048 To speak with a Scudder service representative. |
Written Correspondence | Scudder Investments PO Box 219356
Kansas City, MO 64121-9356 |
Proxy Voting | A description of the fund's policies and procedures for voting proxies for portfolio securities and information about how the fund voted proxies related to its portfolio securities during the 12-month period ended June 30 is available on our Web site — scudder.com (type "proxy voting" in the search field) — or on the SEC's Web site — www.sec.gov. To obtain a written copy of the fund's policies and procedures without charge, upon request, call us toll free at (800) 621-1048. |
Principal Underwriter | If you have questions, comments or complaints, contact: Scudder Distributors, Inc. 222 South Riverside Plaza
Chicago, IL 60606-5808 (800) 621-1148 |
| Class A | Class B | Class C | Institutional Class |
Nasdaq Symbol | KBCAX | KBCBX | KBCCX | KBCIX |
CUSIP Number | 81111P-100 | 81111P-209 | 81111P-308 | 81111P-407 |
Fund Number | 031 | 231 | 331 | 1431 |
For shareholders of Class S
| Scudder Class S Shareholders |
Automated Information Lines | SAILTM (800) 343-2890 |
| Personalized account information, the ability to exchange or redeem shares, and information on other Scudder funds and services via touchtone telephone. |
Web Sites | myScudder.com |
| View your account transactions and balances, trade shares, monitor your asset allocation, and change your address, 24 hours a day. Obtain prospectuses and applications, blank forms, interactive worksheets, news about Scudder funds, subscription to fund updates by e-mail, retirement planning information, and more. |
For More Information | (800) SCUDDER To speak with a Scudder service representative. |
Written Correspondence | Scudder Investments PO Box 219669
Kansas City, MO 64121-9669 |
Proxy Voting | A description of the fund's policies and procedures for voting proxies for portfolio securities and information about how the fund voted proxies related to its portfolio securities during the 12-month period ended June 30 is available on our Web sites — aarp.scudder.com or myScudder.com (type "proxy voting" in the search field) — or on the SEC's Web site — www.sec.gov. To obtain a written copy of the fund's policies and procedures without charge, upon request, call your service representative. |
Principal Underwriter | If you have questions, comments or complaints, contact: Scudder Distributors, Inc. 222 South Riverside Plaza
Chicago, IL 60606-5808 (800) 621-1148 |
| Class S |
Nasdaq Symbol | KBCSX |
Fund Number | 331 |
This privacy statement is issued by Deutsche Investment Management Americas Inc., Deutsche Asset Management, Inc., Scudder Distributors, Inc., Scudder Investor Services, Inc., Scudder Trust Company and the Scudder Funds.
We never sell customer lists or individual client information. We consider privacy fundamental to our client relationships and adhere to the policies and practices described below to protect current and former clients' information. Internal policies are in place to protect confidentiality, while allowing client needs to be served. Only individuals who need to do so in carrying out their job responsibilities may access client information. We maintain physical, electronic and procedural safeguards that comply with federal and state standards to protect confidentiality. These safeguards extend to all forms of interaction with us, including the Internet.
In the normal course of business, clients give us nonpublic personal information on applications and other forms, on our websites, and through transactions with us or our affiliates. Examples of the nonpublic personal information collected are name, address, Social Security number and transaction and balance information. To be able to serve our clients, certain of this client information is shared with affiliated and nonaffiliated third party service providers such as transfer agents, custodians, and broker-dealers to assist us in processing transactions and servicing your account with us. In addition, we may disclose all of the information we collect to companies that perform marketing services on our behalf or to other financial institutions with which we have joint marketing agreements. The organizations described above that receive client information may only use it for the purpose designated by the Scudder Companies listed above.
We may also disclose nonpublic personal information about you to other parties as required or permitted by law. For example, we are required or we may provide information to government entities or regulatory bodies in response to requests for information or subpoenas, to private litigants in certain circumstances, to law enforcement authorities, or any time we believe it necessary to protect the firm.
Questions on this policy may be sent to:
Scudder Investments,
Attention: Correspondence — Chicago
P.O. Box 219415, Kansas City, MO 64121-9415
For Class S only:
Scudder Investments
Attention: Correspondence,
P.O. Box 219669, Kansas City, MO 64121-9669
September 2004

ITEM 2.         CODE OF ETHICS.

                Not applicable.

ITEM 3.         AUDIT COMMITTEE FINANCIAL EXPERT.

                Not applicable.

ITEM 4.         PRINCIPAL ACCOUNTANT FEES AND SERVICES.

                Not applicable.

ITEM 5.         AUDIT COMMITTEE OF LISTED REGISTRANTS

                Not Applicable

ITEM 6.         SCHEDULE OF INVESTMENTS

                Not Applicable

ITEM 7.         DISCLOSURE OF PROXY VOTING POLICIES AND PROCEDURES FOR
                CLOSED-END MANAGEMENT INVESTMENT COMPANIES.

                Not applicable.

ITEM 8.         PORTFOLIO MANAGERS OF CLOSED-END MANAGEMENT INVESTMENT COMPANIES.

                Not applicable.

ITEM 9.         PURCHASES OF EQUITY SECURITIES BY CLOSED-END MANAGEMENT
                INVESTMENT COMPANY AND AFFILIATED PURCHASERS

                Not Applicable.

ITEM 10.        SUBMISSION OF MATTERS TO A VOTE OF SECURITY HOLDERS.

The primary function of the Nominating and Governance Committee is to identify
and recommend individuals for membership on the Board and oversee the
administration of the Board Governance Procedures and Guidelines. Shareholders
may recommend candidates for Board positions by forwarding their correspondence
by U.S. mail or courier service to the Fund's Secretary for the attention of the
Chairman of the Nominating and Governance Committee, Two International Place,
Boston, MA 02110. Suggestions for candidates must include a resume of the
candidate.

ITEM 11.        CONTROLS AND PROCEDURES.

(a) The Chief Executive and Financial Officers concluded that the Registrant's
Disclosure Controls and Procedures are effective based on the evaluation of the
Disclosure Controls and Procedures as of a date within 90 days of the filing
date of this report.

(b) There have been no changes in the registrant's internal control over
financial reporting that occurred during the registrant's last half-year (the
registrant's second fiscal half-year in the case of the annual report) that has
materially affected, or is reasonably likely to materially affect, the
registrant's internal controls over financial reporting.

ITEM 12.        EXHIBITS.

(a)(1)   Certification  pursuant to Rule 30a-2(a) under the  Investment  Company
         Act of 1940 (17 CFR  270.30a-2(a))  is filed  and  attached  hereto  as
         Exhibit 99.CERT.

(b)      Certification  pursuant to Rule 30a-2(b) under the  Investment  Company
         Act of 1940 (17 CFR  270.30a-2(b))  is furnished and attached hereto as
         Exhibit 99.906CERT.


Form N-CSR Item F

                                   SIGNATURES

Pursuant to the requirements of the Securities Exchange Act of 1934 and the
Investment Company Act of 1940, the registrant has duly caused this report to be
signed on its behalf by the undersigned, thereunto duly authorized.

Registrant:                         Scudder Blue Chip Fund


By:                                 /s/Julian Sluyters
                                     -------------------------------------------
                                    Julian Sluyters
                                    Chief Executive Officer

Date:                               June 29, 2005


Pursuant to the requirements of the Securities Exchange Act of 1934 and the
Investment Company Act of 1940, this report has been signed below by the
following persons on behalf of the registrant and in the capacities and on the
dates indicated.

Registrant:                         Scudder Blue Chip Fund


By:                                 /s/Julian Sluyters
                                     -------------------------------------------
                                    Julian Sluyters
                                    Chief Executive Officer

Date:                               June 29, 2005


By:                                 /s/Paul Schubert
                                    -----------------------------------
                                    Paul Schubert
                                    Chief Financial Officer

Date:                               June 29, 2005