UNITED STATES
SECURITIES AND EXCHANGE COMMISSION
Washington, D.C. 20549
FORM N-CSR
CERTIFIED SHAREHOLDER REPORT OF REGISTERED
MANAGEMENT INVESTMENT COMPANIES
Investment Company Act file number 811-05361
Variable Insurance Products Fund V
(Exact name of registrant as specified in charter)
245 Summer St., Boston, Massachusetts 02210
(Address of principal executive offices) (Zip code)
Scott C. Goebel, Secretary
245 Summer St.
Boston, Massachusetts 02210
(Name and address of agent for service)
Registrant's telephone number, including area code: 617-563-7000
Date of fiscal year end: | December 31 |
| |
Date of reporting period: | December 31, 2013 |
This report on Form N-CSR relates solely to the Registrant's Asset Manager Portfolio, Asset Manager: Growth Portfolio, Freedom 2005 Portfolio, Freedom 2010 Portfolio, Freedom 2015 Portfolio, Freedom 2020 Portfolio, Freedom 2025 Portfolio, Freedom 2030 Portfolio, Freedom 2035 Portfolio, Freedom 2040 Portfolio, Freedom 2045 Portfolio, Freedom 2050 Portfolio, Freedom Income Portfolio, Freedom Lifetime Income I Portfolio, Freedom Lifetime Income II Portfolio, Freedom Lifetime Income III Portfolio, FundsManager 20% Portfolio, FundsManager 50% Portfolio, FundsManager 60%, FundsManager 70% Portfolio, FundsManager 85% Portfolio, Investment Grade Bond Portfolio, Investor Freedom 2005 Portfolio, Investor Freedom 2010 Portfolio, Investor Freedom 2015 Portfolio, Investor Freedom 2020 Portfolio, Investor Freedom 2025 Portfolio, Investor Freedom 2030 Portfolio, Investor Freedom Income Portfolio, Strategic Income Portfolio and VIP Target Volatility Portfolio series (each, a "Fund" and collectively, the "Funds").
Item 1. Reports to Stockholders
Fidelity® Variable Insurance Products:
Asset Manager Portfolio
Annual Report
December 31, 2013
(Fidelity Cover Art)
Contents
Performance | (Click Here) | How the fund has done over time. |
Management's Discussion of Fund Performance | (Click Here) | The Portfolio Manager's review of fund performance and strategy. |
Shareholder Expense Example | (Click Here) | An example of shareholder expenses. |
Investment Changes | (Click Here) | A summary of major shifts in the fund's investments over the past six months. |
Investments | (Click Here) | A complete list of the fund's investments with their market values. |
Financial Statements | (Click Here) | Statements of assets and liabilities, operations, and changes in net assets, as well as financial highlights. |
Notes | (Click Here) | Notes to the financial statements. |
Report of Independent Registered Public Accounting Firm | (Click Here) | |
Trustees and Officers | (Click Here) | |
Distributions | (Click Here) | |
Board Approval of Investment Advisory Contracts and Management Fees | (Click Here) | |
To view a fund's proxy voting guidelines and proxy voting record for the 12-month period ended June 30, visit http://www.fidelity.com/proxyvotingresults or visit the Securities and Exchange Commission's (SEC) web site at http://www.sec.gov. You may also call 1-877-208-0098 to request a free copy of the proxy voting guidelines.
Fidelity Variable Insurance Products are separate account options which are purchased through a variable insurance contract.
Standard & Poor's, S&P and S&P 500 are registered service marks of The McGraw-Hill Companies, Inc. and have been licensed for use by Fidelity Distributors Corporation.
Other third-party marks appearing herein are the property of their respective owners.
All other marks appearing herein are registered or unregistered trademarks or service marks of FMR LLC or an affiliated company. © 2014 FMR LLC. All rights reserved.
This report and the financial statements contained herein are submitted for the general information of the shareholders of the fund. This report is not authorized for distribution to prospective investors in the fund unless preceded or accompanied by an effective prospectus.
A fund files its complete schedule of portfolio holdings with the SEC for the first and third quarters of each fiscal year on Form N-Q. Forms N-Q are available on the SEC's web site at http://www.sec.gov. A fund's Forms N-Q may be reviewed and copied at the SEC's Public Reference Room in Washington, DC. Information regarding the operation of the SEC's Public Reference Room may be obtained by calling 1-800-SEC-0330. For a complete list of a fund's portfolio holdings, view the most recent holdings listing, semiannual report, or annual report on Fidelity's web site at http://www.fidelity.com, http://www.advisor.fidelity.com, or http://www.401k.com, as applicable.
NOT FDIC INSURED • MAY LOSE VALUE • NO BANK GUARANTEE
Neither the fund nor Fidelity Distributors Corporation is a bank.
Annual Report
Average annual total return reflects the change in the value of an investment, assuming reinvestment of the class' distributions from dividend income and capital gains (the profits earned upon the sale of securities that have grown in value, if any) and assuming a constant rate of performance each year. During periods of reimbursement by Fidelity, a fund's total return will be greater than it would be had the reimbursement not occurred. Performance numbers are net of all underlying fund operating expenses, but do not include any insurance charges imposed by your insurance company's separate account. If performance information included the effect of these additional charges, the total returns would have been lower. How a fund did yesterday is no guarantee of how it will do tomorrow.
Average Annual Total Returns
Periods ended December 31, 2013 | Past 1
year | Past 5
years | Past 10
years |
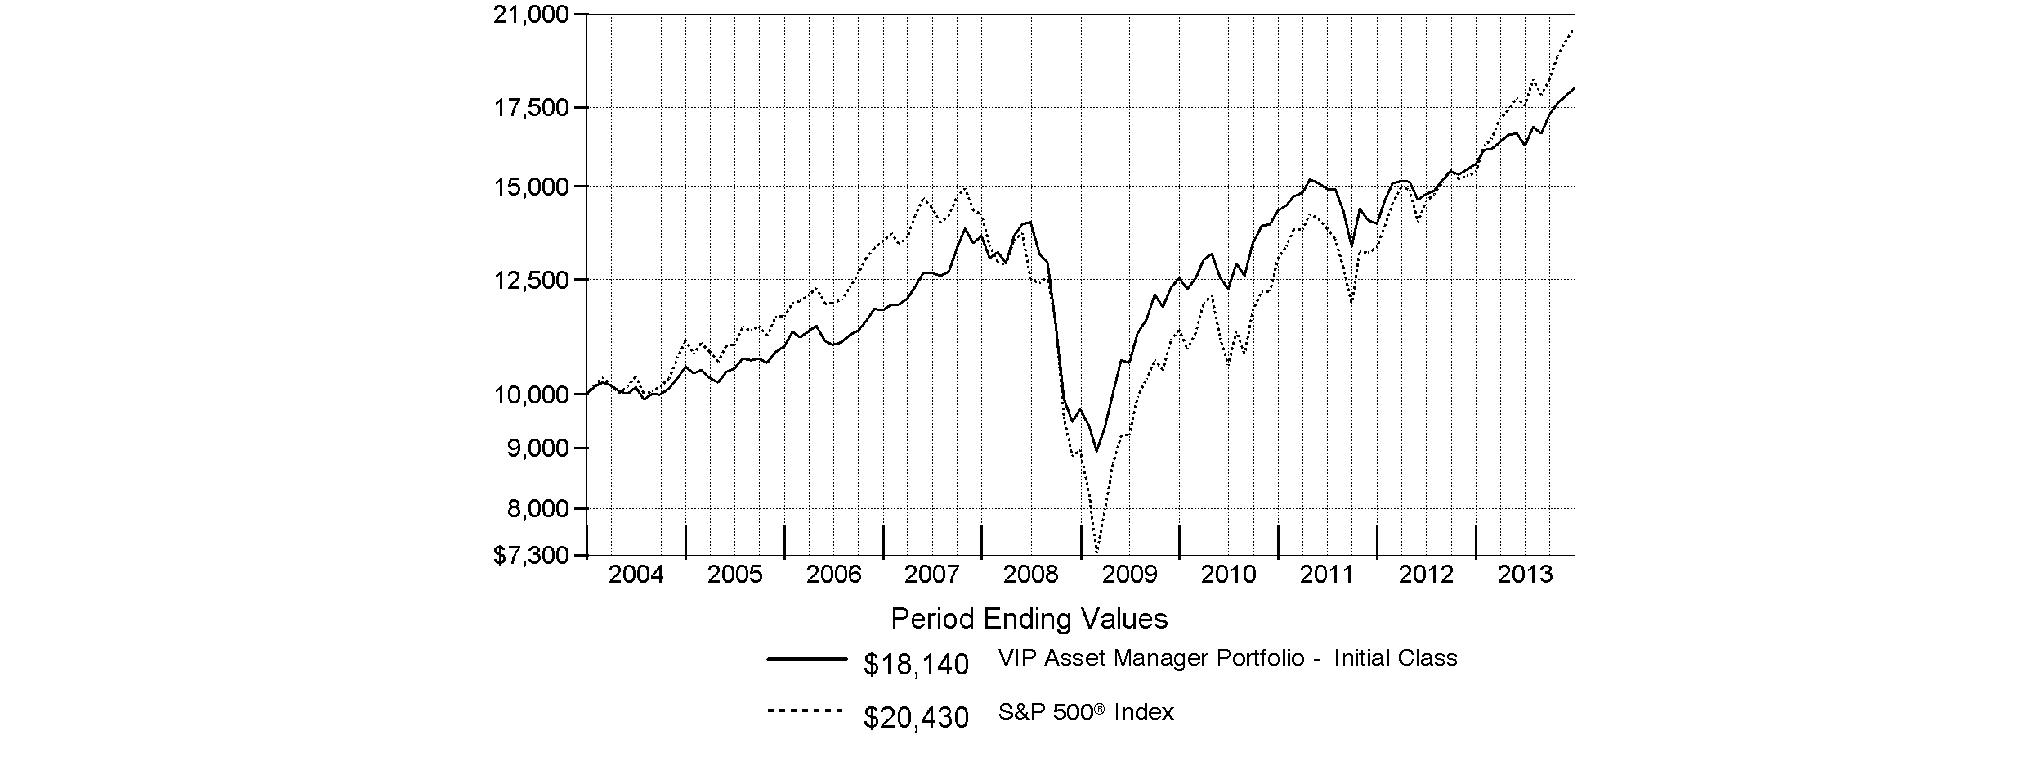
VIP Asset Manager Portfolio - Initial Class | 15.71% | 13.35% | 6.14% |
VIP Asset Manager Portfolio - Service Class | 15.53% | 13.22% | 6.02% |
VIP Asset Manager Portfolio - Service Class 2 | 15.34% | 13.04% | 5.86% |
VIP Asset Manager Portfolio - Investor Class A | 15.62% | 13.25% | 6.04% |
A The initial offering of Investor Class shares took place on July 21, 2005. Returns prior to July 21, 2005, are those of Initial Class. Had Investor Class's transfer agent fee been reflected, returns prior to July 21, 2005, would have been lower.
$10,000 Over 10 Years
Let's say hypothetically that $10,000 was invested in VIP Asset Manager Portfolio - Initial Class on December 31, 2003. The chart shows how the value of your investment would have changed, and also shows how the S&P 500® Index performed over the same period.
Annual Report
Market Recap: Global equity markets remained upbeat for the 12 months ending December 31, 2013, propelling the MSCI® ACWI® (All Country World Index) Index to a 23.24% return. Midyear turbulence gave way by autumn when policymakers in the U.S. and China had made clear their intentions to maintain accommodative monetary policies. That stance, combined with modest cyclical improvement around the globe and generally low valuations, underpinned the broad rally in equities, although the relative strength of the U.S. dollar generally tempered gains for U.S. investors holding foreign securities based in local currencies. During the period, the broad-market S&P 500® Index set a series of new highs, finishing the year up 32.39%. For the first time since 1995, the S&P® scored a "perfect 10," with all 10 economic sectors gaining at least 10% for the year. A resurgence in growth-oriented stocks lifted the Nasdaq Composite Index® to a 40.12% result for 2013, while the blue-chip Dow Jones Industrial AverageSM notched a relatively more modest 29.65% gain. International developed-markets equities rose in concert with their U.S. counterparts, with the MSCI® EAFE® Index gaining 22.92% for the period. Meanwhile, foreign exchange and commodity weakness curbed results in resource-heavy emerging markets (EM), especially in the year's waning months. More generally, concern over EM's slowing growth, its declining share of global trade and uncertainty surrounding U.S. central bank intentions were all factors hampering performance. The MSCI Emerging Markets Index returned -2.27% for the period. On the bond side, U.S. high-yield securities rallied with equities for much of the period, with The BofA Merrill LynchSM US High Yield Constrained Index returning 7.41% for 2013. The more rate-sensitive U.S. investment-grade bond category faced headwinds though, as reflected in the -2.02% return of the Barclays® U.S. Aggregate Bond Index. Within the Barclays index, investment-grade corporate credit returned -2.01%, while ultra-safe U.S. Treasuries saw a -2.75% result. Major non-U.S. developed markets performed only slightly better, with the Citigroup Non-USD Group-of-Seven (G7) Equal Weighted Index logging a -1.59% result. After several years of strong advances, EM debt reversed course in 2013, with the J.P. Morgan Emerging Markets Bond Index Global returning -6.58%.
Comments from Geoff Stein, Lead Portfolio Manager of VIP Asset Manager Portfolio: For the year, the fund's share classes outpaced the 13.41% return of the Fidelity Asset Manager 50% Composite IndexSM. (For specific portfolio results, please see the performance section of this report.) Strong domestic stock picks fueled the fund's performance versus the index, complemented by solid investment-grade bond selections. The domestic equity subportfolio, which is run by Bob Bertelson, outpaced the S&P 500® Index by a healthy margin. A strong, upwardly trending market rewarded Bob's emphasis on companies with the potential for rapid earnings growth. Moreover, he did a great job selecting stocks across multiple sectors, most notably in financials, industrials and health care. From an asset-allocation perspective, underweighting cash and overweighting U.S. stocks provided the biggest boost, followed by a lighter-than-benchmark stake in investment-grade bonds. The fund's developed-markets equities positioning - overweighting domestic and underweighting foreign - helped, but having a meaningful allocation to poor-performing emerging-markets (EM) stocks during the period's first half mostly negated the benefit of this positioning. As for our fixed-income allocation strategy, underweighting investment-grade bonds and cash provided the biggest boost, but was partially offset by a poor result in Treasury Inflation-Protected Securities (TIPS). In May and June, as interest rates rose and inflation expectations fell, TIPS sold off relative to Treasuries of comparable maturity, leading me to reduce the fund's TIPS position. Other allocation shifts included reducing the fund's EM equities stake to about 1% of the portfolio and redeploying those proceeds to increase our foreign developed-markets equities allocation. Additionally, following the May-to-June bond market sell-off, I increased our investment-grade bond allocation to roughly 38% of the portfolio, which is slightly below neutral versus the index.
The views expressed above reflect those of the portfolio manager(s) only through the end of the period as stated on the cover of this report and do not necessarily represent the views of Fidelity or any other person in the Fidelity organization. Any such views are subject to change at any time based upon market or other conditions and Fidelity disclaims any responsibility to update such views. These views may not be relied on as investment advice and, because investment decisions for a Fidelity fund are based on numerous factors, may not be relied on as an indication of trading intent on behalf of any Fidelity fund.
Annual Report
As a shareholder of the Fund, you incur two types of costs: (1) transaction costs, and (2) ongoing costs, including management fees, distribution and/or service (12b-1) fees and other Fund expenses. This Example is intended to help you understand your ongoing costs (in dollars) of investing in the Fund and to compare these costs with the ongoing costs of investing in other mutual funds.
The Example is based on an investment of $1,000 invested at the beginning of the period and held for the entire period (July 1, 2013 to December 31, 2013).
Actual Expenses
The first line of the accompanying table for each class of the Fund provides information about actual account values and actual expenses. You may use the information in this line, together with the amount you invested, to estimate the expenses that you paid over the period. Simply divide your account value by $1,000.00 (for example, an $8,600 account value divided by $1,000.00 = 8.6), then multiply the result by the number in the first line for a class of the Fund under the heading entitled "Expenses Paid During Period" to estimate the expenses you paid on your account during this period. The estimate of expenses does not include any fees or other expenses of any variable annuity or variable life insurance product. If they were, the estimate of expenses you paid during the period would be higher, and your ending account value would be lower. In addition, the Fund, as a shareholder in the underlying Fidelity Central Funds, will indirectly bear its pro-rata share of the fees and expenses incurred by the underlying Fidelity Central Funds. These fees and expenses are not included in the Fund's annualized expense ratio used to calculate the expense estimate in the table below.
Hypothetical Example for Comparison Purposes
The second line of the accompanying table for each class of the Fund provides information about hypothetical account values and hypothetical expenses based on a Class' actual expense ratio and an assumed rate of return of 5% per year before expenses, which is not the Class' actual return. The hypothetical account values and expenses may not be used to estimate the actual ending account balance or expenses you paid for the period. You may use this information to compare the ongoing costs of investing in the Fund and other funds. To do so, compare this 5% hypothetical example with the 5% hypothetical examples that appear in the shareholder reports of the other funds. The estimate of expenses does not include any fees or other expenses of any variable annuity or variable life insurance product. If they were, the estimate of expenses you paid during the period would be higher, and your ending account value would be lower. In addition, the Fund, as a shareholder in the underlying Fidelity Central Funds, will indirectly bear its pro-rata share of the fees and expenses incurred by the underlying Fidelity Central Funds. These fees and expenses are not included in the Fund's annualized expense ratio used to calculate the expense estimate in the table below.
Please note that the expenses shown in the table are meant to highlight your ongoing costs only and do not reflect any transaction costs. Therefore, the second line of the table is useful in comparing ongoing costs only, and will not help you determine the relative total costs of owning different funds.
| Annualized
Expense Ratio B | Beginning
Account Value
July 1, 2013 | Ending
Account Value
December 31, 2013 | Expenses Paid
During Period*
July 1, 2013 to
December 31, 2013 |
Initial Class | .61% | | | |
Actual | | $ 1,000.00 | $ 1,117.70 | $ 3.26 |
HypotheticalA | | $ 1,000.00 | $ 1,022.13 | $ 3.11 |
Service Class | .73% | | | |
Actual | | $ 1,000.00 | $ 1,117.20 | $ 3.90 |
HypotheticalA | | $ 1,000.00 | $ 1,021.53 | $ 3.72 |
Service Class 2 | .87% | | | |
Actual | | $ 1,000.00 | $ 1,116.40 | $ 4.64 |
HypotheticalA | | $ 1,000.00 | $ 1,020.82 | $ 4.43 |
Investor Class | .70% | | | |
Actual | | $ 1,000.00 | $ 1,117.50 | $ 3.74 |
HypotheticalA | | $ 1,000.00 | $ 1,021.68 | $ 3.57 |
A 5% return per year before expenses
B Annualized expense ratio reflects expenses net of applicable fee waivers.
* Expenses are equal to each Class' annualized expense ratio, multiplied by the average account value over the period, multiplied by 184/365 (to reflect the one-half year period). The fees and expenses of the underlying Fidelity Central Funds in which the Fund invests are not included in each Class' annualized expense ratio.
In addition to the expenses noted above, the Fund also indirectly bears its proportional share of the expenses of the underlying Fidelity Central Funds. Annualized expenses of the underlying non-money market Fidelity Central Funds as of their most recent fiscal half year ranged from less than .01% to .16%.
Annual Report
Investment Changes (Unaudited)
The information in the following tables is based on the combined investments of the Fund and its pro-rata share of the investments of Fidelity's Central Funds, other than the Money Market Central Funds. |
Top Five Stocks as of December 31, 2013 |
| % of fund's
net assets | % of fund's net assets
6 months ago |
Apple, Inc. | 1.8 | 1.9 |
Bank of America Corp. | 0.9 | 0.9 |
Gilead Sciences, Inc. | 0.9 | 0.8 |
Google, Inc. Class A | 0.7 | 1.0 |
Comcast Corp. Class A | 0.7 | 0.7 |
| 5.0 | |
Top Five Bond Issuers as of December 31, 2013 |
(with maturities greater than one year) | % of fund's
net assets | % of fund's net assets
6 months ago |
U.S. Treasury Obligations | 12.5 | 15.9 |
Fannie Mae | 4.0 | 7.2 |
Ginnie Mae | 2.1 | 2.2 |
Freddie Mac | 2.0 | 1.8 |
Wachovia Bank Commercial Mortgage Trust | 0.7 | 0.4 |
| 21.3 | |
Top Five Market Sectors as of December 31, 2013 |
| % of fund's
net assets | % of fund's net assets
6 months ago |
Financials | 15.0 | 13.4 |
Consumer Discretionary | 14.4 | 14.9 |
Health Care | 8.9 | 9.7 |
Information Technology | 7.2 | 6.4 |
Energy | 7.2 | 7.6 |
Asset Allocation (% of fund's net assets) |
As of December 31, 2013* | As of June 30, 2013** |
 | Stock Class and
Equity Futures 54.7% | | | Stock Class and
Equity Futures 52.8% | |
 | Bond Class 41.5% | | | Bond Class 44.8% | |
 | Short-Term Class 3.8% | | | Short-Term Class 2.4% | |
* Foreign investments | 23.0% | | ** Foreign investments | 19.6% | |

Asset allocations in the pie charts reflect the categorization of assets as defined in the Fund's prospectus in effect as of the time periods indicated above. Financial Statement categorizations conform to accounting standards and will differ from the pie chart. Percentages are adjusted for the effect of futures contracts and swap contracts, if applicable. |
Percentages in the above tables are adjusted for the effect of TBA Sale Commitments. |
An unaudited holdings listing for the Fund, which presents direct holdings as well as the pro-rata share of any securities and other investments held indirectly through its investment in underlying non-money market Fidelity Central Funds, is available at advisor.fidelity.com. |
Annual Report
Investments December 31, 2013
Showing Percentage of Net Assets
Common Stocks - 38.1% |
| Shares | | Value |
CONSUMER DISCRETIONARY - 10.9% |
Auto Components - 0.5% |
BorgWarner, Inc. | 37,400 | | $ 2,091,034 |
Delphi Automotive PLC | 88,600 | | 5,327,518 |
| | 7,418,552 |
Automobiles - 0.3% |
General Motors Co. (a) | 96,600 | | 3,948,042 |
Diversified Consumer Services - 0.2% |
Estacio Participacoes SA | 251,400 | | 2,194,449 |
Hotels, Restaurants & Leisure - 0.8% |
Alsea S.A.B. de CV | 383,600 | | 1,207,998 |
Chipotle Mexican Grill, Inc. (a) | 10,000 | | 5,327,800 |
Fiesta Restaurant Group, Inc. (a) | 31,600 | | 1,650,784 |
Las Vegas Sands Corp. | 29,600 | | 2,334,552 |
| | 10,521,134 |
Household Durables - 1.5% |
Barratt Developments PLC | 168,900 | | 976,118 |
Bellway PLC | 60,500 | | 1,572,904 |
D.R. Horton, Inc. | 210,400 | | 4,696,128 |
KB Home (d) | 227,700 | | 4,162,356 |
PulteGroup, Inc. | 255,100 | | 5,196,387 |
Taylor Morrison Home Corp. | 54,400 | | 1,221,280 |
Toll Brothers, Inc. (a) | 68,700 | | 2,541,900 |
| | 20,367,073 |
Internet & Catalog Retail - 0.5% |
priceline.com, Inc. (a) | 5,600 | | 6,509,440 |
Media - 3.6% |
AMC Networks, Inc. Class A (a) | 11,600 | | 790,076 |
CBS Corp. Class B | 110,900 | | 7,068,766 |
Comcast Corp. Class A | 173,100 | | 8,995,142 |
Interpublic Group of Companies, Inc. | 114,700 | | 2,030,190 |
ITV PLC | 807,500 | | 2,594,128 |
Naspers Ltd. Class N | 27,900 | | 2,915,031 |
Sirius XM Holdings, Inc. | 814,100 | | 2,841,209 |
The Walt Disney Co. | 75,500 | | 5,768,200 |
Time Warner, Inc. | 89,300 | | 6,225,996 |
Twenty-First Century Fox, Inc. Class A | 199,500 | | 7,018,410 |
Viacom, Inc. Class A | 22,600 | | 1,983,602 |
| | 48,230,750 |
Multiline Retail - 0.4% |
Macy's, Inc. | 94,300 | | 5,035,620 |
Specialty Retail - 1.7% |
Cabela's, Inc. Class A (a) | 40,900 | | 2,726,394 |
Conn's, Inc. (a)(d) | 49,900 | | 3,931,621 |
GNC Holdings, Inc. | 83,500 | | 4,880,575 |
Home Depot, Inc. | 36,300 | | 2,988,942 |
Lowe's Companies, Inc. | 35,300 | | 1,749,115 |
TJX Companies, Inc. | 112,500 | | 7,169,625 |
| | 23,446,272 |
|
| Shares | | Value |
Textiles, Apparel & Luxury Goods - 1.4% |
adidas AG | 16,700 | | $ 2,128,329 |
Coach, Inc. | 10,000 | | 561,300 |
Deckers Outdoor Corp. (a) | 49,500 | | 4,180,770 |
Michael Kors Holdings Ltd. (a) | 66,263 | | 5,379,893 |
Prada SpA | 148,400 | | 1,320,506 |
PVH Corp. | 15,700 | | 2,135,514 |
VF Corp. | 52,800 | | 3,291,552 |
| | 18,997,864 |
TOTAL CONSUMER DISCRETIONARY | | 146,669,196 |
CONSUMER STAPLES - 1.0% |
Beverages - 0.5% |
Fomento Economico Mexicano S.A.B. de CV unit | 75,800 | | 739,691 |
Monster Beverage Corp. (a) | 101,500 | | 6,878,655 |
| | 7,618,346 |
Food Products - 0.5% |
Green Mountain Coffee Roasters, Inc. | 85,200 | | 6,439,416 |
TOTAL CONSUMER STAPLES | | 14,057,762 |
ENERGY - 4.1% |
Energy Equipment & Services - 0.4% |
Halliburton Co. | 72,300 | | 3,669,225 |
Helmerich & Payne, Inc. | 25,100 | | 2,110,408 |
| | 5,779,633 |
Oil, Gas & Consumable Fuels - 3.7% |
Anadarko Petroleum Corp. | 78,500 | | 6,226,620 |
Cabot Oil & Gas Corp. | 85,900 | | 3,329,484 |
Cimarex Energy Co. | 29,600 | | 3,105,336 |
Cobalt International Energy, Inc. (a) | 66,000 | | 1,085,700 |
Concho Resources, Inc. (a) | 65,200 | | 7,041,600 |
Continental Resources, Inc. (a) | 51,600 | | 5,806,032 |
EOG Resources, Inc. | 41,500 | | 6,965,360 |
Genel Energy PLC (a) | 94,800 | | 1,687,579 |
Hess Corp. | 58,700 | | 4,872,100 |
Pioneer Natural Resources Co. | 41,400 | | 7,620,498 |
Sanchez Energy Corp. (a) | 40,700 | | 997,557 |
| | 48,737,866 |
TOTAL ENERGY | | 54,517,499 |
FINANCIALS - 5.3% |
Capital Markets - 1.9% |
Apollo Global Management LLC Class A | 189,700 | | 5,996,417 |
BlackRock, Inc. Class A | 14,500 | | 4,588,815 |
Charles Schwab Corp. | 40,700 | | 1,058,200 |
KKR & Co. LP | 158,500 | | 3,857,890 |
Morgan Stanley | 166,100 | | 5,208,896 |
The Blackstone Group LP | 159,700 | | 5,030,550 |
| | 25,740,768 |
Common Stocks - continued |
| Shares | | Value |
FINANCIALS - continued |
Commercial Banks - 0.3% |
Societe Generale Series A | 40,100 | | $ 2,329,090 |
UniCredit SpA | 169,200 | | 1,252,294 |
| | 3,581,384 |
Consumer Finance - 0.1% |
Springleaf Holdings, Inc. | 65,900 | | 1,665,952 |
Diversified Financial Services - 1.6% |
Bank of America Corp. | 791,800 | | 12,328,326 |
CBOE Holdings, Inc. | 51,400 | | 2,670,744 |
Citigroup, Inc. | 127,400 | | 6,638,814 |
| | 21,637,884 |
Real Estate Investment Trusts - 0.2% |
American Tower Corp. | 41,300 | | 3,296,566 |
Real Estate Management & Development - 0.6% |
Altisource Asset Management Corp. (a) | 2,200 | | 2,046,000 |
Altisource Portfolio Solutions SA | 20,800 | | 3,299,504 |
Altisource Residential Corp. Class B | 67,766 | | 2,040,434 |
| | 7,385,938 |
Thrifts & Mortgage Finance - 0.6% |
Ocwen Financial Corp. (a) | 136,100 | | 7,546,745 |
TOTAL FINANCIALS | | 70,855,237 |
HEALTH CARE - 6.9% |
Biotechnology - 4.9% |
Acorda Therapeutics, Inc. (a) | 52,700 | | 1,538,840 |
Actelion Ltd. | 18,611 | | 1,572,041 |
Aegerion Pharmaceuticals, Inc. (a) | 41,000 | | 2,909,360 |
Alexion Pharmaceuticals, Inc. (a) | 40,300 | | 5,362,318 |
Alnylam Pharmaceuticals, Inc. (a) | 200 | | 12,866 |
Amgen, Inc. | 58,000 | | 6,621,280 |
ARIAD Pharmaceuticals, Inc. (a) | 215,600 | | 1,470,392 |
Biogen Idec, Inc. (a) | 29,500 | | 8,252,625 |
BioMarin Pharmaceutical, Inc. (a) | 35,900 | | 2,522,693 |
Celldex Therapeutics, Inc. (a) | 38,000 | | 919,980 |
Clovis Oncology, Inc. (a) | 11,400 | | 687,078 |
Genmab A/S (a) | 25,300 | | 989,092 |
Gilead Sciences, Inc. (a) | 159,600 | | 11,993,940 |
Infinity Pharmaceuticals, Inc. (a) | 18,800 | | 259,628 |
Intercept Pharmaceuticals, Inc. (a) | 19,210 | | 1,311,659 |
InterMune, Inc. (a) | 110,400 | | 1,626,192 |
KYTHERA Biopharmaceuticals, Inc. (a) | 30,900 | | 1,151,025 |
Medivation, Inc. (a) | 110,400 | | 7,045,728 |
Pharmacyclics, Inc. (a) | 18,300 | | 1,935,774 |
Regeneron Pharmaceuticals, Inc. (a) | 8,000 | | 2,201,920 |
Synageva BioPharma Corp. (a) | 41,100 | | 2,659,992 |
United Therapeutics Corp. (a) | 18,200 | | 2,058,056 |
| | 65,102,479 |
Health Care Equipment & Supplies - 0.1% |
Edwards Lifesciences Corp. (a) | 15,000 | | 986,400 |
|
| Shares | | Value |
Health Care Providers & Services - 0.2% |
Community Health Systems, Inc. | 62,300 | | $ 2,446,521 |
Health Care Technology - 0.1% |
athenahealth, Inc. (a) | 6,200 | | 833,900 |
Medidata Solutions, Inc. (a) | 11,200 | | 678,384 |
| | 1,512,284 |
Life Sciences Tools & Services - 0.3% |
Illumina, Inc. (a) | 38,000 | | 4,203,560 |
Pharmaceuticals - 1.3% |
Actavis PLC (a) | 13,900 | | 2,335,200 |
Jazz Pharmaceuticals PLC (a) | 28,800 | | 3,644,928 |
Pacira Pharmaceuticals, Inc. (a) | 51,300 | | 2,949,237 |
Salix Pharmaceuticals Ltd. (a) | 23,600 | | 2,122,584 |
Shire PLC sponsored ADR | 15,100 | | 2,133,479 |
Valeant Pharmaceuticals International (Canada) (a) | 42,450 | | 4,980,107 |
| | 18,165,535 |
TOTAL HEALTH CARE | | 92,416,779 |
INDUSTRIALS - 3.0% |
Aerospace & Defense - 0.8% |
European Aeronautic Defence and Space Co. (EADS) NV | 34,900 | | 2,679,546 |
The Boeing Co. | 55,700 | | 7,602,493 |
| | 10,282,039 |
Airlines - 1.8% |
American Airlines Group, Inc. (a)(d) | 346,100 | | 8,739,025 |
Copa Holdings SA Class A | 10,400 | | 1,665,144 |
Delta Air Lines, Inc. | 184,525 | | 5,068,902 |
Southwest Airlines Co. | 171,100 | | 3,223,524 |
United Continental Holdings, Inc. (a) | 130,570 | | 4,939,463 |
| | 23,636,058 |
Electrical Equipment - 0.3% |
Eaton Corp. PLC | 49,700 | | 3,783,164 |
Professional Services - 0.1% |
Bureau Veritas SA | 66,200 | | 1,934,811 |
TOTAL INDUSTRIALS | | 39,636,072 |
INFORMATION TECHNOLOGY - 5.7% |
Communications Equipment - 0.1% |
Alcatel-Lucent SA sponsored ADR | 478,000 | | 2,103,200 |
Computers & Peripherals - 2.1% |
3D Systems Corp. (a)(d) | 11,500 | | 1,068,695 |
Apple, Inc. | 42,500 | | 23,847,174 |
Nimble Storage, Inc. | 25,500 | | 1,155,150 |
SanDisk Corp. | 32,000 | | 2,257,280 |
| | 28,328,299 |
Internet Software & Services - 2.0% |
Bankrate, Inc. (a) | 155,400 | | 2,787,876 |
Cornerstone OnDemand, Inc. (a) | 49,800 | | 2,656,332 |
Common Stocks - continued |
| Shares | | Value |
INFORMATION TECHNOLOGY - continued |
Internet Software & Services - continued |
Facebook, Inc. Class A (a) | 121,021 | | $ 6,615,008 |
Google, Inc. Class A (a) | 8,400 | | 9,413,964 |
Kakaku.com, Inc. | 32,300 | | 567,395 |
Naver Corp. | 3,465 | | 2,376,243 |
Tencent Holdings Ltd. | 25,200 | | 1,607,356 |
Twitter, Inc. (d) | 10,200 | | 649,230 |
| | 26,673,404 |
IT Services - 1.1% |
Cognizant Technology Solutions Corp. Class A (a) | 29,800 | | 3,009,204 |
FleetCor Technologies, Inc. (a) | 34,800 | | 4,077,516 |
QIWI PLC Class B sponsored ADR | 23,100 | | 1,293,600 |
Visa, Inc. Class A | 26,400 | | 5,878,752 |
| | 14,259,072 |
Semiconductors & Semiconductor Equipment - 0.3% |
Freescale Semiconductor Holdings I Ltd. (a) | 108,900 | | 1,747,845 |
NXP Semiconductors NV (a) | 51,100 | | 2,347,023 |
| | 4,094,868 |
Software - 0.1% |
CommVault Systems, Inc. (a) | 11,300 | | 846,144 |
TOTAL INFORMATION TECHNOLOGY | | 76,304,987 |
MATERIALS - 0.9% |
Chemicals - 0.9% |
Eastman Chemical Co. | 50,700 | | 4,091,490 |
Huntsman Corp. | 73,400 | | 1,805,640 |
LyondellBasell Industries NV Class A | 70,800 | | 5,683,824 |
| | 11,580,954 |
TELECOMMUNICATION SERVICES - 0.3% |
Wireless Telecommunication Services - 0.3% |
SBA Communications Corp. Class A (a) | 29,700 | | 2,668,248 |
SoftBank Corp. | 17,400 | | 1,526,863 |
| | 4,195,111 |
TOTAL COMMON STOCKS (Cost $327,358,247) |
510,233,597
|
Fixed-Income Funds - 44.1% |
| Shares | | Value |
Fidelity Emerging Markets Debt Central Fund (f) | 527,294 | | $ 5,241,303 |
Fidelity Floating Rate Central Fund (f) | 367,682 | | 39,514,745 |
Fidelity High Income Central Fund 1 (f) | 273,629 | | 28,287,764 |
Fidelity Inflation-Protected Bond Index Central Fund (f) | 134,774 | | 13,098,693 |
Fidelity VIP Investment Grade Central Fund (f) | 4,875,246 | | 503,515,456 |
TOTAL FIXED-INCOME FUNDS (Cost $580,652,742) |
589,657,961
|
Equity Funds - 14.8% |
| | | |
International Equity Funds - 14.8% |
Fidelity Emerging Markets Equity Central Fund (f) | 68,996 | | 14,500,197 |
Fidelity International Equity Central Fund (f) | 2,210,274 | | 182,657,069 |
TOTAL EQUITY FUNDS (Cost $192,882,480) |
197,157,266
|
U.S. Treasury Obligations - 0.1% |
| Principal Amount | | |
U.S. Treasury Bills, yield at date of purchase 0.01% to 0.07% 1/2/14 to 2/27/14 (e)
(Cost $1,519,979) | | $ 1,520,000 | |
1,519,989
|
Money Market Funds - 4.0% |
| Shares | | |
Fidelity Cash Central Fund, 0.11% (b) | 39,353,052 | | 39,353,052 |
Fidelity Money Market Central Fund, 0.24% (b) | 22,378 | | 22,378 |
Fidelity Securities Lending Cash Central Fund, 0.11% (b)(c) | 14,549,125 | | 14,549,125 |
TOTAL MONEY MARKET FUNDS (Cost $53,924,555) |
53,924,555
|
TOTAL INVESTMENT PORTFOLIO - 101.1% (Cost $1,156,338,003) | | 1,352,493,368 |
NET OTHER ASSETS (LIABILITIES) - (1.1)% | | (14,409,571) |
NET ASSETS - 100% | $ 1,338,083,797 |
Futures Contracts |
| Expiration Date | | Underlying Face Amount at Value | | Unrealized
Appreciation/
(Depreciation) |
Purchased |
Equity Index Contracts |
166 CME E-mini S&P 500 Index Contracts (United States) | March 2014 | | $ 15,281,130 | | $ 602,885 |
140 NYSE E-mini MSCI EAFE Index Contracts (United States) | March 2014 | | 13,424,600 | | 580,734 |
TOTAL EQUITY INDEX CONTRACTS | | $ 28,705,730 | | $ 1,183,619 |
|
The face value of futures purchased as a percentage of net assets is 2.1% |
Legend |
(a) Non-income producing |
(b) Affiliated fund that is generally available only to investment companies and other accounts managed by Fidelity Investments. The rate quoted is the annualized seven-day yield of the fund at period end. A complete unaudited listing of the fund's holdings as of its most recent quarter end is available upon request. In addition, each Fidelity Central Fund's financial statements, which are not covered by the Fund's Report of Independent Registered Public Accounting Firm, are available on the SEC's website or upon request. |
(c) Investment made with cash collateral received from securities on loan. |
(d) Security or a portion of the security is on loan at period end. |
(e) Security or a portion of the security was pledged to cover margin requirements for futures contracts. At period end, the value of securities pledged amounted to $1,519,989. |
(f) Affiliated fund that is generally available only to investment companies and other accounts managed by Fidelity Investments. A complete unaudited schedule of portfolio holdings for each Fidelity Central Fund is filed with the SEC for the first and third quarters of each fiscal year on Form N-Q and is available upon request or at the SEC's website at www.sec.gov. An unaudited holdings listing for the Fund, which presents direct holdings as well as the pro-rata share of securities and other investments held indirectly through its investment in underlying non-money market Fidelity Central Funds, is available at advisor.fidelity.com. In addition, each Fidelity Central Fund's financial statements, which are not covered by the Fund's Report of Independent Registered Public Accounting Firm, are available on the SEC's website or upon request. |
Affiliated Central Funds |
Information regarding fiscal year to date income earned by the Fund from investments in Fidelity Central Funds is as follows: |
Fund | Income earned |
Fidelity Cash Central Fund | $ 56,495 |
Fidelity Emerging Markets Debt Central Fund | 354,845 |
Fidelity Emerging Markets Equity Central Fund | 588,892 |
Fidelity Floating Rate Central Fund | 1,773,715 |
Fidelity High Income Central Fund 1 | 1,773,264 |
Fidelity Inflation-Protected Bond Index Central Fund | 8 |
Fidelity International Equity Central Fund | 3,377,131 |
Fidelity Money Market Central Fund | 8,806 |
Fidelity Securities Lending Cash Central Fund | 155,241 |
Fidelity VIP Investment Grade Central Fund | 12,628,108 |
Total | $ 20,716,505 |
Additional information regarding the Fund's fiscal year to date purchases and sales, including the ownership percentage, of the non Money Market Central Funds is as follows: |
Fund | Value,
beginning of
period | Purchases | Sales
Proceeds | Value,
end of
period | % ownership,
end of
period |
Fidelity Commodity Strategy Central Fund | $ 12,545,365 | $ - | $ 12,015,779 | $ - | 0.0% |
Fidelity Emerging Markets Debt Central Fund | 6,467,629 | 493,035 | 969,058 | 5,241,303 | 6.9% |
Fidelity Emerging Markets Equity Central Fund | 52,978,373 | 588,891 | 36,210,629 | 14,500,197 | 6.4% |
Fidelity Floating Rate Central Fund | 50,838,245 | 8,069,246 | 20,355,446 | 39,514,745 | 2.8% |
Fidelity High Income Central Fund 1 | 38,097,411 | 1,773,265 | 11,831,821 | 28,287,764 | 6.5% |
Fidelity Inflation-Protected Bond Index Central Fund | 49,805,151 | 14,021,664 | 48,450,698 | 13,098,693 | 6.6% |
Fidelity International Equity Central Fund | 105,633,406 | 49,728,573 | 1,572,340 | 182,657,069 | 6.1% |
Fidelity VIP Investment Grade Central Fund | 439,718,435 | 104,601,780 | 17,804,926 | 503,515,456 | 12.8% |
Total | $ 756,084,015 | $ 179,276,454 | $ 149,210,697 | $ 786,815,227 | |
Other Information |
The following is a summary of the inputs used, as of December 31, 2013, involving the Fund's assets and liabilities carried at fair value. The inputs or methodology used for valuing securities may not be an indication of the risk associated with investing in those securities. For more information on valuation inputs, and their aggregation into the levels used in the table below, please refer to the Investment Valuation section in the accompanying Notes to Financial Statements. |
Valuation Inputs at Reporting Date: |
Description | Total | Level 1 | Level 2 | Level 3 |
Investments in Securities: | | | | |
Equities: | | | | |
Consumer Discretionary | $ 146,669,196 | $ 143,266,749 | $ 3,402,447 | $ - |
Consumer Staples | 14,057,762 | 13,318,071 | 739,691 | - |
Energy | 54,517,499 | 54,517,499 | - | - |
Financials | 70,855,237 | 70,855,237 | - | - |
Health Care | 92,416,779 | 92,416,779 | - | - |
Industrials | 39,636,072 | 39,636,072 | - | - |
Information Technology | 76,304,987 | 75,737,592 | 567,395 | - |
Materials | 11,580,954 | 11,580,954 | - | - |
Telecommunication Services | 4,195,111 | 2,668,248 | 1,526,863 | - |
U.S. Government and Government Agency Obligations | 1,519,989 | - | 1,519,989 | - |
Fixed-Income Funds | 589,657,961 | 589,657,961 | - | - |
Money Market Funds | 53,924,555 | 53,924,555 | - | - |
Equity Funds | 197,157,266 | 197,157,266 | - | - |
Total Investments in Securities: | $ 1,352,493,368 | $ 1,344,736,983 | $ 7,756,385 | $ - |
Derivative Instruments: | | | | |
Assets | | | | |
Futures Contracts | $ 1,183,619 | $ 1,183,619 | $ - | $ - |
Value of Derivative Instruments |
The following table is a summary of the Fund's value of derivative instruments by primary risk exposure as of December 31, 2013. For additional information on derivative instruments, please refer to the Derivative Instruments section in the accompanying Notes to Financial Statements. |
Primary Risk Exposure /
Derivative Type | Value |
| Asset | Liability |
Equity Risk | | |
Futures Contracts (a) | $ 1,183,619 | $ - |
Total Value of Derivatives | $ 1,183,619 | $ - |
(a) Reflects gross cumulative appreciation (depreciation) on futures contracts as presented in the Schedule of Investments. Only the period end receivable or payable for daily variation margin and net unrealized appreciation (depreciation) are presented in the Statement of Assets and Liabilities. |
Other Information |
The information in the following tables is based on the combined investments of the Fund and its pro-rata share of the investments of Fidelity's Central Funds, other than the Money Market Central Funds. Percentages in the below tables are adjusted for the effect of TBA Sale Commitments. |
The composition of credit quality ratings as a percentage of net assets is as follows (Unaudited): |
U.S. Government and U.S. Government Agency Obligations | 20.6% |
AAA,AA,A | 6.4% |
BBB | 9.2% |
BB | 1.9% |
B | 2.9% |
CCC,CC,C | 0.8% |
D | 0.0%* |
Not Rated | 0.3% |
Equities | 52.1% |
Short-Term Investments and Net Other Assets | 5.8% |
| 100.0% |
* Amount represents less than 0.1%. |
We have used ratings from Moody's Investors Service, Inc. Where Moody's® ratings are not available, we have used S&P® ratings. All ratings are as of the date indicated and do not reflect subsequent changes. Percentages are adjusted for the effect of futures contracts, if applicable. |
Distribution of investments by country or territory of incorporation, as a percentage of total net assets, is as follows (Unaudited): |
United States of America | 77.0% |
United Kingdom | 4.0% |
Japan | 2.0% |
Netherlands | 1.6% |
Germany | 1.6% |
France | 1.5% |
Ireland | 1.0% |
Australia | 1.0% |
Switzerland | 1.0% |
Others (Individually Less Than 1%) | 9.3% |
| 100.0% |
See accompanying notes which are an integral part of the financial statements.
Annual Report
Statement of Assets and Liabilities
| December 31, 2013 |
| | |
Assets | | |
Investment in securities, at value (including securities loaned of $14,443,286) - See accompanying schedule: Unaffiliated issuers (cost $328,878,226) | $ 511,753,586 | |
Fidelity Central Funds (cost $827,459,777) | 840,739,782 | |
Total Investments (cost $1,156,338,003) | | $ 1,352,493,368 |
Cash | | 2,479 |
Receivable for investments sold | | 517,323 |
Receivable for fund shares sold | | 445,494 |
Dividends receivable | | 187,323 |
Distributions receivable from Fidelity Central Funds | | 54,872 |
Receivable for daily variation margin for derivative instruments | | 91,620 |
Prepaid expenses | | 2,694 |
Other receivables | | 67,640 |
Total assets | | 1,353,862,813 |
| | |
Liabilities | | |
Payable for investments purchased | $ 12,882 | |
Payable for fund shares redeemed | 429,285 | |
Accrued management fee | 551,221 | |
Distribution and service plan fees payable | 7,076 | |
Other affiliated payables | 128,731 | |
Other payables and accrued expenses | 100,696 | |
Collateral on securities loaned, at value | 14,549,125 | |
Total liabilities | | 15,779,016 |
| | |
Net Assets | | $ 1,338,083,797 |
Net Assets consist of: | | |
Paid in capital | | $ 1,065,119,710 |
Distributions in excess of net investment income | | (61,953) |
Accumulated undistributed net realized gain (loss) on investments and foreign currency transactions | | 75,687,122 |
Net unrealized appreciation (depreciation) on investments and assets and liabilities in foreign currencies | | 197,338,918 |
Net Assets | | $ 1,338,083,797 |
Statement of Assets and Liabilities - continued
| December 31, 2013 |
| | |
Initial Class:
Net Asset Value, offering price and redemption price per share ($1,160,092,773 ÷ 67,280,988 shares) | | $ 17.24 |
| | |
Service Class:
Net Asset Value, offering price and redemption price per share ($7,969,603 ÷ 465,236 shares) | | $ 17.13 |
| | |
Service Class 2:
Net Asset Value, offering price and redemption price per share ($31,119,177 ÷ 1,836,663 shares) | | $ 16.94 |
| | |
Investor Class:
Net Asset Value, offering price and redemption price per share ($138,902,244 ÷ 8,089,716 shares) | | $ 17.17 |
See accompanying notes which are an integral part of the financial statements.
Annual Report
Financial Statements - continued
Statement of Operations
| Year ended December 31, 2013 |
| | |
Investment Income | | |
Dividends | | $ 5,271,665 |
Interest | | 624 |
Income from Fidelity Central Funds | | 20,716,505 |
Total income | | 25,988,794 |
| | |
Expenses | | |
Management fee | $ 6,505,402 | |
Transfer agent fees | 1,006,292 | |
Distribution and service plan fees | 83,811 | |
Accounting and security lending fees | 526,576 | |
Custodian fees and expenses | 34,791 | |
Independent trustees' compensation | 5,157 | |
Appreciation in deferred trustee compensation account | 282 | |
Audit | 52,519 | |
Legal | 8,085 | |
Miscellaneous | 10,622 | |
Total expenses before reductions | 8,233,537 | |
Expense reductions | (101,997) | 8,131,540 |
Net investment income (loss) | | 17,857,254 |
Realized and Unrealized Gain (Loss) Net realized gain (loss) on: | | |
Investment securities: | | |
Unaffiliated issuers | 72,080,251 | |
Fidelity Central Funds | 9,510,871 | |
Foreign currency transactions | (21,141) | |
Futures contracts | 2,443,189 | |
Capital gain distributions from Fidelity Central Funds | 4,880,860 | |
Total net realized gain (loss) | | 88,894,030 |
Change in net unrealized appreciation (depreciation) on: Investment securities | 80,939,220 | |
Assets and liabilities in foreign currencies | 536 | |
Futures contracts | 922,885 | |
Total change in net unrealized appreciation (depreciation) | | 81,862,641 |
Net gain (loss) | | 170,756,671 |
Net increase (decrease) in net assets resulting from operations | | $ 188,613,925 |
Statement of Changes in Net Assets
| Year ended
December 31,
2013 | Year ended
December 31,
2012 |
Increase (Decrease) in Net Assets | | |
Operations | | |
Net investment income (loss) | $ 17,857,254 | $ 19,922,007 |
Net realized gain (loss) | 88,894,030 | 38,436,996 |
Change in net unrealized appreciation (depreciation) | 81,862,641 | 92,574,785 |
Net increase (decrease) in net assets resulting from operations | 188,613,925 | 150,933,788 |
Distributions to shareholders from net investment income | (20,026,284) | (19,181,825) |
Distributions to shareholders from net realized gain | (3,134,591) | (9,275,331) |
Total distributions | (23,160,875) | (28,457,156) |
Share transactions - net increase (decrease) | (91,770,023) | (110,410,297) |
Total increase (decrease) in net assets | 73,683,027 | 12,066,335 |
| | |
Net Assets | | |
Beginning of period | 1,264,400,770 | 1,252,334,435 |
End of period (including distributions in excess of net investment income of $61,953 and undistributed net investment income of $186,415, respectively) | $ 1,338,083,797 | $ 1,264,400,770 |
See accompanying notes which are an integral part of the financial statements.
Annual Report
Financial Highlights - Initial Class
Years ended December 31, | 2013 | 2012 | 2011 | 2010 | 2009 |
Selected Per-Share Data | | | | | |
Net asset value, beginning of period | $ 15.17 | $ 13.80 | $ 14.54 | $ 13.00 | $ 10.31 |
Income from Investment Operations | | | | | |
Net investment income (loss) C | .23 | .23 | .28 | .23 | .26 |
Net realized and unrealized gain (loss) | 2.15 | 1.49 | (.66) | 1.62 | 2.73 |
Total from investment operations | 2.38 | 1.72 | (.38) | 1.85 | 2.99 |
Distributions from net investment income | (.26) | (.24) | (.29) | (.24) | (.28) |
Distributions from net realized gain | (.04) | (.11) | (.07) | (.07) | (.02) |
Total distributions | (.31) G | (.35) | (.36) | (.31) | (.30) |
Net asset value, end of period | $ 17.24 | $ 15.17 | $ 13.80 | $ 14.54 | $ 13.00 |
Total Return A, B | 15.71% | 12.48% | (2.56)% | 14.26% | 29.11% |
Ratios to Average Net Assets D, F | | | | | |
Expenses before reductions | .62% | .63% | .63% | .63% | .67% |
Expenses net of fee waivers, if any | .62% | .63% | .63% | .63% | .67% |
Expenses net of all reductions | .61% | .62% | .62% | .62% | .66% |
Net investment income (loss) | 1.40% | 1.57% | 1.91% | 1.72% | 2.31% |
Supplemental Data | | | | | |
Net assets, end of period (000 omitted) | $ 1,160,093 | $ 1,114,021 | $ 1,108,494 | $ 1,279,306 | $ 1,249,955 |
Portfolio turnover rate E | 41% | 47% | 56% | 54% | 95% |
A Total returns do not reflect charges attributable to your insurance company's separate account. Inclusion of these charges would reduce the total returns shown.
B Total returns would have been lower if certain expenses had not been reduced during the applicable periods shown.
C Calculated based on average shares outstanding during the period.
D Fees and expenses of any underlying Fidelity Central Funds are not included in the Fund's expense ratio. The Fund indirectly bears its proportionate share of the expenses of any underlying Fidelity Central Funds. Based on their most recent shareholder report date, the expenses of any underlying non-money market Fidelity Central Funds ranged from less than .01% to .13%.
E Amount does not include the portfolio activity of any underlying Fidelity Central Funds.
F Expense ratios reflect operating expenses of the class. Expenses before reductions do not reflect amounts reimbursed by the investment adviser or reductions from brokerage service arrangements or reductions from other expense offset arrangements and do not represent the amount paid by the class during periods when reimbursements or reductions occur. Expenses net of fee waivers reflect expenses after reimbursement by the investment adviser but prior to reductions from brokerage service arrangements or other expense offset arrangements. Expenses net of all reductions represent the net expenses paid by the class.
G Total distributions of $.31 per share is comprised of distributions from net investment income of $.264 and distributions from net realized gain of $.041 per share.
Financial Highlights - Service Class
Years ended December 31, | 2013 | 2012 | 2011 | 2010 | 2009 |
Selected Per-Share Data | | | | | |
Net asset value, beginning of period | $ 15.08 | $ 13.71 | $ 14.45 | $ 12.92 | $ 10.25 |
Income from Investment Operations | | | | | |
Net investment income (loss) C | .21 | .21 | .26 | .22 | .25 |
Net realized and unrealized gain (loss) | 2.13 | 1.49 | (.65) | 1.60 | 2.71 |
Total from investment operations | 2.34 | 1.70 | (.39) | 1.82 | 2.96 |
Distributions from net investment income | (.24) | (.22) | (.28) | (.22) | (.27) |
Distributions from net realized gain | (.04) | (.11) | (.07) | (.07) | (.02) |
Total distributions | (.29) G | (.33) | (.35) | (.29) | (.29) |
Net asset value, end of period | $ 17.13 | $ 15.08 | $ 13.71 | $ 14.45 | $ 12.92 |
Total Return A, B | 15.53% | 12.43% | (2.69)% | 14.14% | 28.94% |
Ratios to Average Net Assets D, F | | | | | |
Expenses before reductions | .74% | .74% | .75% | .75% | .79% |
Expenses net of fee waivers, if any | .73% | .74% | .74% | .74% | .79% |
Expenses net of all reductions | .73% | .73% | .74% | .73% | .78% |
Net investment income (loss) | 1.28% | 1.45% | 1.79% | 1.60% | 2.18% |
Supplemental Data | | | | | |
Net assets, end of period (000 omitted) | $ 7,970 | $ 8,429 | $ 8,042 | $ 8,613 | $ 8,230 |
Portfolio turnover rate E | 41% | 47% | 56% | 54% | 95% |
A Total returns do not reflect charges attributable to your insurance company's separate account. Inclusion of these charges would reduce the total returns shown.
B Total returns would have been lower if certain expenses had not been reduced during the applicable periods shown.
C Calculated based on average shares outstanding during the period.
D Fees and expenses of any underlying Fidelity Central Funds are not included in the Fund's expense ratio. The Fund indirectly bears its proportionate share of the expenses of any underlying Fidelity Central Funds. Based on their most recent shareholder report date, the expenses of any underlying non-money market Fidelity Central Funds ranged from less than .01% to .13%.
E Amount does not include the portfolio activity of any underlying Fidelity Central Funds.
F Expense ratios reflect operating expenses of the class. Expenses before reductions do not reflect amounts reimbursed by the investment adviser or reductions from brokerage service arrangements or reductions from other expense offset arrangements and do not represent the amount paid by the class during periods when reimbursements or reductions occur. Expenses net of fee waivers reflect expenses after reimbursement by the investment adviser but prior to reductions from brokerage service arrangements or other expense offset arrangements. Expenses net of all reductions represent the net expenses paid by the class.
G Total distributions of $.29 per share is comprised of distributions from net investment income of $.244 and distributions from net realized gain of $.041 per share.
See accompanying notes which are an integral part of the financial statements.
Annual Report
Financial Highlights - Service Class 2
Years ended December 31, | 2013 | 2012 | 2011 | 2010 | 2009 |
Selected Per-Share Data | | | | | |
Net asset value, beginning of period | $ 14.92 | $ 13.57 | $ 14.30 | $ 12.79 | $ 10.15 |
Income from Investment Operations | | | | | |
Net investment income (loss) C | .18 | .19 | .24 | .19 | .23 |
Net realized and unrealized gain (loss) | 2.10 | 1.47 | (.65) | 1.59 | 2.68 |
Total from investment operations | 2.28 | 1.66 | (.41) | 1.78 | 2.91 |
Distributions from net investment income | (.22) | (.19) | (.25) | (.20) | (.25) |
Distributions from net realized gain | (.04) | (.11) | (.07) | (.07) | (.02) |
Total distributions | (.26) | (.31) G | (.32) | (.27) | (.27) |
Net asset value, end of period | $ 16.94 | $ 14.92 | $ 13.57 | $ 14.30 | $ 12.79 |
Total Return A, B | 15.34% | 12.24% | (2.82)% | 13.96% | 28.76% |
Ratios to Average Net Assets D, F | | | | | |
Expenses before reductions | .88% | .89% | .90% | .90% | .93% |
Expenses net of fee waivers, if any | .88% | .89% | .89% | .89% | .93% |
Expenses net of all reductions | .88% | .88% | .89% | .88% | .92% |
Net investment income (loss) | 1.14% | 1.30% | 1.64% | 1.46% | 2.04% |
Supplemental Data | | | | | |
Net assets, end of period (000 omitted) | $ 31,119 | $ 29,966 | $ 32,508 | $ 39,148 | $ 39,475 |
Portfolio turnover rate E | 41% | 47% | 56% | 54% | 95% |
A Total returns do not reflect charges attributable to your insurance company's separate account. Inclusion of these charges would reduce the total returns shown.
B Total returns would have been lower if certain expenses had not been reduced during the applicable periods shown.
C Calculated based on average shares outstanding during the period.
D Fees and expenses of any underlying Fidelity Central Funds are not included in the Fund's expense ratio. The Fund indirectly bears its proportionate share of the expenses of any underlying Fidelity Central Funds. Based on their most recent shareholder report date, the expenses of any underlying non-money market Fidelity Central Funds ranged from less than .01% to .13%.
E Amount does not include the portfolio activity of any underlying Fidelity Central Funds.
F Expense ratios reflect operating expenses of the class. Expenses before reductions do not reflect amounts reimbursed by the investment adviser or reductions from brokerage service arrangements or reductions from other expense offset arrangements and do not represent the amount paid by the class during periods when reimbursements or reductions occur. Expenses net of fee waivers reflect expenses after reimbursement by the investment adviser but prior to reductions from brokerage service arrangements or other expense offset arrangements. Expenses net of all reductions represent the net expenses paid by the class.
G Total distributions of $.31 per share is comprised of distributions from net investment income of $.194 and distributions from net realized gain of $.113 per share.
Financial Highlights - Investor Class
Years ended December 31, | 2013 | 2012 | 2011 | 2010 | 2009 |
Selected Per-Share Data | | | | | |
Net asset value, beginning of period | $ 15.11 | $ 13.74 | $ 14.49 | $ 12.96 | $ 10.28 |
Income from Investment Operations | | | | | |
Net investment income (loss) C | .21 | .22 | .27 | .22 | .25 |
Net realized and unrealized gain (loss) | 2.14 | 1.49 | (.67) | 1.61 | 2.73 |
Total from investment operations | 2.35 | 1.71 | (.40) | 1.83 | 2.98 |
Distributions from net investment income | (.25) | (.22) | (.28) | (.23) | (.28) |
Distributions from net realized gain | (.04) | (.11) | (.07) | (.07) | (.02) |
Total distributions | (.29) | (.34) G | (.35) | (.30) | (.30) |
Net asset value, end of period | $ 17.17 | $ 15.11 | $ 13.74 | $ 14.49 | $ 12.96 |
Total Return A, B | 15.62% | 12.44% | (2.72)% | 14.16% | 29.01% |
Ratios to Average Net Assets D, F | | | | | |
Expenses before reductions | .71% | .71% | .71% | .72% | .77% |
Expenses net of fee waivers, if any | .70% | .71% | .71% | .71% | .77% |
Expenses net of all reductions | .70% | .70% | .70% | .70% | .76% |
Net investment income (loss) | 1.31% | 1.48% | 1.82% | 1.63% | 2.21% |
Supplemental Data | | | | | |
Net assets, end of period (000 omitted) | $ 138,902 | $ 111,985 | $ 103,290 | $ 98,171 | $ 67,641 |
Portfolio turnover rate E | 41% | 47% | 56% | 54% | 95% |
A Total returns do not reflect charges attributable to your insurance company's separate account. Inclusion of these charges would reduce the total returns shown.
B Total returns would have been lower if certain expenses had not been reduced during the applicable periods shown.
C Calculated based on average shares outstanding during the period.
D Fees and expenses of any underlying Fidelity Central Funds are not included in the Fund's expense ratio. The Fund indirectly bears its proportionate share of the expenses of any underlying Fidelity Central Funds. Based on their most recent shareholder report date, the expenses of any underlying non-money market Fidelity Central Funds ranged from less than .01% to .13%.
E Amount does not include the portfolio activity of any underlying Fidelity Central Funds.
F Expense ratios reflect operating expenses of the class. Expenses before reductions do not reflect amounts reimbursed by the investment adviser or reductions from brokerage service arrangements or reductions from other expense offset arrangements and do not represent the amount paid by the class during periods when reimbursements or reductions occur. Expenses net of fee waivers reflect expenses after reimbursement by the investment adviser but prior to reductions from brokerage service arrangements or other expense offset arrangements. Expenses net of all reductions represent the net expenses paid by the class.
G Total distributions of $.34 per share is comprised of distributions from net investment income of $.223 and distributions from net realized gain of $.113 per share.
See accompanying notes which are an integral part of the financial statements.
Annual Report
Notes to Financial Statements
For the period ended December 31, 2013
1. Organization.
VIP Asset Manager Portfolio (the Fund) is a fund of Variable Insurance Products Fund V (the Trust) and is authorized to issue an unlimited number of shares. The Trust is registered under the Investment Company Act of 1940, as amended (the 1940 Act), as an open-end management investment company organized as a Massachusetts business trust. Shares of the Fund may only be purchased by insurance companies for the purpose of funding variable annuity or variable life insurance contracts. The Fund offers the following classes of shares: Initial Class shares, Service Class shares, Service Class 2 shares and Investor Class shares. All classes have equal rights and voting privileges, except for matters affecting a single class.
2. Investments in Fidelity Central Funds.
The Fund invests in Fidelity Central Funds, which are open-end investment companies generally available only to other investment companies and accounts managed by the investment adviser and its affiliates. The Fund's Schedule of Investments lists each of the Fidelity Central Funds held as of period end, as an investment of the Fund, but does not include the underlying holdings of each Fidelity Central Fund. As an Investing Fund, the Fund indirectly bears its proportionate share of the expenses of the underlying Fidelity Central Funds.
Based on its investment objective, each Fidelity Central Fund may invest or participate in various investment vehicles or strategies that are similar to those of the Fund. These strategies are consistent with the investment objectives of the Fund and may involve certain economic risks which may cause a decline in value of each of the Fidelity Central Funds and thus a decline in the value of the Fund. The following summarizes the Fund's investment in each Fidelity Central Fund.
Fidelity Central Fund | Investment Manager | Investment Objective | Investment Practices | Expense Ratio* |
Fidelity Emerging Markets Debt Central Fund | FMR Co., Inc. (FMRC) | Seeks high total return by normally investing in debt securities of issuers in emerging markets and other debt investments that are tied economically to emerging markets. | Foreign Securities Loans & Direct Debt Instruments Restricted Securities | .01% |
Fidelity Emerging Markets Equity Central Fund | FMRC | Seeks capital appreciation by investing primarily in equity securities of issuers in emerging markets. | Foreign Securities Futures Repurchase Agreements Restricted Securities | .13% |
Fidelity International Equity Central Fund | FMRC | Seeks capital appreciation by investing primarily in non-U.S. based common stocks, including securities of issuers located in emerging markets. | Foreign Securities Futures Repurchase Agreements | .01% |
Fidelity Floating Rate Central Fund | FMRC | Seeks a high level of income by normally investing in floating rate loans and other floating rate securities. | Loans & Direct Debt Instruments Repurchase Agreements Restricted Securities | .00%** |
Fidelity High Income Central Fund 1 | FMRC | Seeks a high level of income and may also seek capital appreciation by investing primarily in debt securities, preferred stocks, and convertible securities, with an emphasis on lower-quality debt securities. | Delayed Delivery & When Issued Securities Loans & Direct Debt Instruments Repurchase Agreements Restricted Securities | .00%** |
Fidelity Inflation-Protected Bond Index Central Fund | Fidelity Investment Money Management, Inc. (FIMM) | Seeks to provide investment results that correspond to the performance of the inflation-protected United States Treasury market, and may invest in derivatives. | Repurchase Agreements | .00%** |
VIP Investment Grade Central Fund | FIMM | Seeks a high level of current income by normally investing in investment-grade debt securities and repurchase agreements. | Delayed Delivery & When Issued Securities Repurchase Agreements Restricted Securities Swaps | .00%** |
Fidelity Money Market Central Funds | FIMM | Seeks to obtain a high level of current income consistent with the preservation of capital and liquidity. | Short-term Investments | .00%** |
* Expenses expressed as a percentage of average net assets and are as of each underlying Central Fund's most recent annual or semi-annual shareholder report.
** Amount represents less than .01%.
An unaudited holdings listing for the Fund, which presents direct holdings as well as the pro-rata share of any securities and other investments held indirectly through its investment in underlying non-money market Fidelity Central Funds, is available at advisor.fidelity.com. A complete unaudited list of holdings for each Fidelity Central Fund is available upon request or at the Securities and Exchange Commission (the SEC) website at www.sec.gov. In addition, the financial statements of the Fidelity Central Funds which contain the significant accounting policies (including investment valuation policies) of those funds, which are not covered by the Fund's Report of Independent Registered Public Accounting Firm, are available on the SEC website or upon request.
Annual Report
3. Significant Accounting Policies.
The financial statements have been prepared in conformity with accounting principles generally accepted in the United States of America (GAAP), which require management to make certain estimates and assumptions at the date of the financial statements. Actual results could differ from those estimates. Subsequent events, if any, through the date that the financial statements were issued have been evaluated in the preparation of the financial statements. The following summarizes the significant accounting policies of the Fund:
Investment Valuation. Investments are valued as of 4:00 p.m. Eastern time on the last calendar day of the period. In accordance with valuation policies and procedures approved by the Board of Trustees (the Board), the Fund attempts to obtain prices from one or more third party pricing vendors or brokers to value its investments. When current market prices, quotations or currency exchange rates are not readily available or reliable, investments will be fair valued in good faith by the Fidelity Management & Research Company (FMR) Fair Value Committee (the Committee), in accordance with procedures adopted by the Board. Factors used in determining fair value vary by investment type and may include market or investment specific events, changes in interest rates and credit quality. The frequency with which these procedures are used cannot be predicted and they may be utilized to a significant extent. The Committee oversees the Fund's valuation policies and procedures and is responsible for approving and reporting to the Board all fair value determinations.
The Fund categorizes the inputs to valuation techniques used to value its investments into a disclosure hierarchy consisting of three levels as shown below:
Level 1 - quoted prices in active markets for identical investments
Level 2 - other significant observable inputs (including quoted prices for similar investments, interest rates, prepayment speeds, etc.)
Level 3 - unobservable inputs (including the Fund's own assumptions based on the best information available)
Valuation techniques used to value the Fund's investments by major category are as follows:
Equity securities, including restricted securities, for which market quotations are readily available, are valued at the last reported sale price or official closing price as reported by a third party pricing vendor on the primary market or exchange on which they are traded and are categorized as Level 1 in the hierarchy. In the event there were no sales during the day or closing prices are not available, securities are valued at the last quoted bid price or may be valued using the last available price and are generally categorized as Level 2 in the hierarchy. For foreign equity securities, when market or security specific events arise, comparisons to the valuation of American Depositary Receipts (ADRs), futures contracts, Exchange-Traded Funds (ETFs) and certain indexes as well as quoted prices for similar securities may be used and would be categorized as Level 2 in the hierarchy. Utilizing these techniques may result in transfers between Level 1 and Level 2. For equity securities, including restricted securities, where observable inputs are limited, assumptions about market activity and risk are used and these securities may be categorized as Level 3 in the hierarchy.
Debt securities, including restricted securities, are valued based on evaluated prices received from third party pricing vendors or from brokers who make markets in such securities. U.S. government and government agency obligations, are valued by pricing vendors who utilize matrix pricing which considers yield or price of bonds of comparable quality, coupon, maturity and type or by broker-supplied prices. When independent prices are unavailable or unreliable, debt securities may be valued utilizing pricing methodologies which consider similar factors that would be used by third party pricing vendors. Debt securities are generally categorized as Level 2 in the hierarchy but may be Level 3 depending on the circumstances.
Futures contracts are valued at the settlement price established each day by the board of trade or exchange on which they are traded and are categorized as Level 1 in the hierarchy. Investments in open-end mutual funds, including the Fidelity Central Funds, are valued at their closing net asset value (NAV) each business day and are categorized as Level 1 in the hierarchy.
Changes in valuation techniques may result in transfers in or out of an assigned level within the disclosure hierarchy. The aggregate value of investments by input level, as of December 31, 2013, is included at the end of the Fund's Schedule of Investments.
Foreign Currency. The Fund may use foreign currency contracts to facilitate transactions in foreign-denominated securities. Gains and losses from these transactions may arise from changes in the value of the foreign currency or if the counterparties do not perform under the contracts' terms.
Foreign-denominated assets, including investment securities, and liabilities are translated into U.S. dollars at the exchange rates at period end. Purchases and sales of investment securities, income and dividends received and expenses denominated in foreign currencies are translated into U.S. dollars at the exchange rate in effect on the transaction date.
The effects of exchange rate fluctuations on investments are included with the net realized and unrealized gain (loss) on investment securities. Other foreign currency transactions resulting in realized and unrealized gain (loss) are disclosed separately.
Investment Transactions and Income. For financial reporting purposes, the Fund's investment holdings and NAV include trades executed through the end of the last business day of the period. The NAV per share for processing shareholder transactions is calculated as of the close of business of the New York Stock Exchange (NYSE), normally 4:00 p.m. Eastern time and includes trades executed through the end of the prior business day. Gains and
Annual Report
Notes to Financial Statements - continued
3. Significant Accounting Policies - continued
Investment Transactions and Income - continued
losses on securities sold are determined on the basis of identified cost and may include proceeds received from litigation. Dividend income is recorded on the ex-dividend date, except for certain dividends from foreign securities where the ex-dividend date may have passed, which are recorded as soon as the Fund is informed of the ex-dividend date. Non-cash dividends included in dividend income, if any, are recorded at the fair market value of the securities received. Distributions received on securities that represent a return of capital or capital gain are recorded as a reduction of cost of investments and/or as a realized gain. Subsequent to ex-dividend date the Fund determines the components of these distributions, based upon receipt of tax filings or other correspondence relating to the underlying investment. Interest income and distributions from the Fidelity Central Funds are accrued as earned. Interest income includes coupon interest and amortization of premium and accretion of discount on debt securities. Investment income is recorded net of foreign taxes withheld where recovery of such taxes is uncertain.
Class Allocations and Expenses. Investment income, realized and unrealized capital gains and losses, common expenses of the Fund, and certain fund-level expense reductions, if any, are allocated daily on a pro-rata basis to each class based on the relative net assets of each class to the total net assets of the Fund. Each class differs with respect to transfer agent and distribution and service plan fees incurred. Certain expense reductions may also differ by class. For the reporting period, the allocated portion of income and expenses to each class as a percent of its average net assets may vary due to the timing of recording these transactions in relation to fluctuating net assets of the classes. Expenses directly attributable to a fund are charged to that fund. Expenses attributable to more than one fund are allocated among the respective funds on the basis of relative net assets or other appropriate methods. Expense estimates are accrued in the period to which they relate and adjustments are made when actual amounts are known. Expenses included in the accompanying financial statements reflect the expenses of the Fund and do not include any expenses of the Fidelity Central Funds. Although not included in the Fund's expenses, the Fund indirectly bears its proportionate share of the Fidelity Central Funds' expenses through the impact of these expenses on each Fidelity Central Fund's NAV.
Deferred Trustee Compensation. Under a Deferred Compensation Plan (the Plan), independent Trustees may elect to defer receipt of a portion of their annual compensation. Deferred amounts are invested in a cross-section of Fidelity funds, are marked-to-market and remain in the Fund until distributed in accordance with the Plan. The investment of deferred amounts and the offsetting payable to the Trustees are included in the accompanying Statement of Assets and Liabilities.
Income Tax Information and Distributions to Shareholders. Each year, the Fund intends to qualify as a regulated investment company under Subchapter M of the Internal Revenue Code, including distributing substantially all of its taxable income and realized gains. As a result, no provision for U.S. Federal income taxes is required. As of December 31, 2013, the Fund did not have any unrecognized tax benefits in the financial statements; nor is the Fund aware of any tax positions for which it is reasonably possible that the total amounts of unrecognized tax benefits will significantly change in the next twelve months. The Fund files a U.S. federal tax return, in addition to state and local tax returns as required. The Fund's federal income tax returns are subject to examination by the Internal Revenue Service (IRS) for a period of three fiscal years after they are filed. State and local tax returns may be subject to examination for an additional fiscal year depending on the jurisdiction. Foreign taxes are provided for based on the Fund's understanding of the tax rules and rates that exist in the foreign markets in which it invests.
Distributions are declared and recorded on the ex-dividend date. Income dividends and capital gain distributions are declared separately for each class. Income and capital gain distributions are determined in accordance with income tax regulations, which may differ from GAAP.
Capital accounts within the financial statements are adjusted for permanent book-tax differences. These adjustments have no impact on net assets or the results of operations. Capital accounts are not adjusted for temporary book-tax differences which will reverse in a subsequent period.
Book-tax differences are primarily due to short-term gains distributions from Fidelity Central Funds, futures contracts, foreign currency transactions, partnerships (including allocations from Fidelity Central Funds), in-kind transactions, deferred trustees compensation, capital loss carryforwards and losses deferred due to wash sales.
The federal tax cost of investment securities and unrealized appreciation (depreciation) as of period end were as follows:
Gross unrealized appreciation | $ 253,475,122 |
Gross unrealized depreciation | (20,795,898) |
Net unrealized appreciation (depreciation) on securities and other investments | $ 232,679,224 |
| |
Tax Cost | $ 1,119,814,144 |
Annual Report
3. Significant Accounting Policies - continued
Income Tax Information and Distributions to Shareholders - continued
The tax-based components of distributable earnings as of period end were as follows:
Undistributed long-term capital gain | $ 52,653,442 |
Net unrealized appreciation (depreciation) | $ 232,679,158 |
The tax character of distributions paid was as follows:
| December 31, 2013 | December 31, 2012 |
Ordinary Income | $ 21,969,175 | $ 28,457,156 |
Long-term Capital Gains | 1,191,700 | - |
Total | $ 23,160,875 | $ 28,457,156 |
4. Derivative Instruments.
Risk Exposures and the Use of Derivative Instruments. The Fund's investment objective allows the Fund to enter into various types of derivative contracts, including futures contracts. Derivatives are investments whose value is primarily derived from underlying assets, indices or reference rates and may be transacted on an exchange or over-the-counter (OTC). Derivatives may involve a future commitment to buy or sell a specified asset based on specified terms, to exchange future cash flows at periodic intervals based on a notional principal amount, or for one party to make one or more payments upon the occurrence of specified events in exchange for periodic payments from the other party.
The Fund used derivatives to increase returns and to manage exposure to certain risks as defined below. The success of any strategy involving derivatives depends on analysis of numerous economic factors, and if the strategies for investment do not work as intended, the Fund may not achieve its objectives.
The Fund's use of derivatives increased or decreased its exposure to the following risk:
Equity Risk | Equity risk relates to the fluctuations in the value of financial instruments as a result of changes in market prices (other than those arising from interest rate risk or foreign exchange risk), whether caused by factors specific to an individual investment, its issuer, or all factors affecting all instruments traded in a market or market segment. |
The Fund is also exposed to additional risks from investing in derivatives, such as liquidity risk and counterparty credit risk. Liquidity risk is the risk that the Fund will be unable to close out the derivative in the open market in a timely manner. Counterparty credit risk is the risk that the counterparty will not be able to fulfill its obligation to the Fund. Counterparty credit risk related to exchange-traded futures contracts may be mitigated by the protection provided by the exchange on which they trade.
Investing in derivatives may involve greater risks than investing in the underlying assets directly and, to varying degrees, may involve risk of loss in excess of any initial investment and collateral received and amounts recognized in the Statement of Assets and Liabilities. In addition, there may be the risk that the change in value of the derivative contract does not correspond to the change in value of the underlying instrument.
Futures Contracts. A futures contract is an agreement between two parties to buy or sell a specified underlying instrument for a fixed price at a specified future date. The Fund used futures contracts to manage its exposure to the stock market.
Upon entering into a futures contract, a fund is required to deposit either cash or securities (initial margin) with a clearing broker in an amount equal to a certain percentage of the face value of the contract. Futures contracts are marked-to-market daily and subsequent daily payments (variation margin) are made or received by a fund depending on the daily fluctuations in the value of the futures contracts and are recorded as unrealized appreciation or (depreciation). This receivable and/or payable, if any, is included in daily variation margin for derivative instruments in the Statement of Assets and Liabilities. Realized gain or (loss) is recorded upon the expiration or closing of a futures contract.
Any open futures contracts at period end are presented in the Schedule of Investments under the caption "Futures Contracts." The underlying face amount at value reflects each contract's exposure to the underlying instrument or index at period end and is representative of volume of activity during the period. Securities deposited to meet initial margin requirements are identified in the Schedule of Investments.
During the period the Fund recognized net realized gain (loss) of $2,443,189 and a change in net unrealized appreciation (depreciation) of $922,885 related to its investment in futures contracts. These amounts are included in the Statement of Operations.
Annual Report
Notes to Financial Statements - continued
5. Purchases and Sales of Investments.
Purchases and sales of securities (including the Equity and Fixed-Income Central Funds), other than short-term securities, aggregated $514,054,400 and $608,339,435, respectively.
6. Fees and Other Transactions with Affiliates.
Management Fee. Fidelity Management & Research Company (the investment adviser) and its affiliates provide the Fund with investment management related services for which the Fund pays a monthly management fee. The management fee is the sum of an individual fund fee rate that is based on an annual rate of .25% of the Fund's average net assets and an annualized group fee rate that averaged .25% during the period. The group fee rate is based upon the average net assets of all the mutual funds advised by the investment adviser, including any mutual funds previously advised by the investment adviser that are currently advised by Fidelity SelectCo, LLC, an affiliate of the investment adviser. The group fee rate decreases as assets under management increase and increases as assets under management decrease. For the reporting period, the total annual management fee rate was .50% of the Fund's average net assets.
The investment adviser pays a portion of the management fees received from the Fund to the Fidelity Central Funds' investment advisers, who are also affiliates, for managing the assets of the Fidelity Central Funds.
Distribution and Service Plan Fees. In accordance with Rule 12b-1 of the 1940 Act, the Fund has adopted separate 12b-1 Plans for each Service Class of shares. Each Service Class pays Fidelity Distributors Corporation (FDC), an affiliate of the investment adviser, a service fee. For the period, the service fee is based on an annual rate of .10% of Service Class' average net assets and .25% of Service Class 2's average net assets.
For the period, total fees, all of which were re-allowed to insurance companies for the distribution of shares and providing shareholder support services were as follows:
Service Class | $ 8,125 |
Service Class 2 | 75,686 |
| $ 83,811 |
Transfer Agent Fees. Fidelity Investments Institutional Operations Company, Inc. (FIIOC), an affiliate of the investment adviser, is the Fund's transfer, dividend disbursing, and shareholder servicing agent. FIIOC receives an asset-based fee with respect to each class. Each class (with the exception of Investor Class) pays a transfer agent fee, excluding out of pocket expenses, equal to an annual rate of .07% of average net assets. Investor Class pays a monthly asset-based transfer agent fee of .15% of average net assets. In addition, FIIOC receives an asset-based fee of .0035% of average net assets for typesetting, printing and mailing of shareholder reports, except proxy statements. FIIOC voluntarily agreed to reimburse or waive this fee for the period January 1, 2013 through December 31, 2013 (see Expense Reductions note). For the period, transfer agent fees for each class, including printing and out of pocket expenses, were as follows:
Initial Class | $ 785,035 |
Service Class | 6,777 |
Service Class 2 | 24,424 |
Investor Class | 190,056 |
| $ 1,006,292 |
Effective February 1, 2014, the Board of Trustees approved an amendment to the transfer agent fee agreement whereby each class (with the exception of Investor Class) pays a single fee of .07% of average net assets for transfer agent services, typesetting, printing and mailing of shareholder reports, excluding mailing of proxy statements and out of pocket expenses. Investor Class pays a single fee of .15% of average net assets.
Accounting and Security Lending Fees. Fidelity Service Company, Inc. (FSC), an affiliate of the investment adviser, maintains the Fund's accounting records. The accounting fee is based on the level of average net assets for each month. Under a separate contract, FSC administers the security lending program. The security lending fee is based on the number and duration of lending transactions.
Brokerage Commissions. The Fund placed a portion of its portfolio transactions with brokerage firms which are affiliates of the investment adviser. Brokerage commissions are included in net realized gain (loss) and change in net unrealized appreciation (depreciation) in the Statement of Operations. The commissions paid to these affiliated firms were $14,477 for the period.
7. Committed Line of Credit.
The Fund participates with other funds managed by the investment adviser or an affiliate in a $4.25 billion credit facility (the "line of credit") to be utilized for temporary or emergency purposes to fund shareholder redemptions or for other short-term liquidity purposes. The Fund has agreed to pay commitment fees on its pro-rata portion of the line of credit, which amounted to $2,796 and is reflected in Miscellaneous expenses on the Statement of Operations. During the period, there were no borrowings on this line of credit.
Annual Report
8. Security Lending.
The Fund lends portfolio securities through a lending agent from time to time in order to earn additional income. For equity securities, a lending agent is used and may loan securities to certain qualified borrowers, including Fidelity Capital Markets (FCM), a broker-dealer affiliated with the Fund. On the settlement date of the loan, the Fund receives collateral (in the form of U.S. Treasury obligations, letters of credit and/or cash) against the loaned securities and maintains collateral in an amount not less than 100% of the market value of the loaned securities during the period of the loan. The market value of the loaned securities is determined at the close of business of the Fund and any additional required collateral is delivered to the Fund on the next business day. If the borrower defaults on its obligation to return the securities loaned because of insolvency or other reasons, the Fund may apply collateral received from the borrower against the obligation. The Fund may experience delays and costs in recovering the securities loaned. Any cash collateral received is invested in the Fidelity Securities Lending Cash Central Fund. The value of loaned securities and cash collateral at period end are disclosed on the Fund's Statement of Assets and Liabilities. At period end, there were no security loans outstanding with FCM. Security lending income represents the income earned on investing cash collateral, less rebates paid to borrowers and any lending agent fees associated with the loan, plus any premium payments received for lending certain types of securities. Security lending income is presented in the Statement of Operations as a component of income from Fidelity Central Funds. Total security lending income during the period amounted to $155,241, including $29,096 from securities loaned to FCM.
9. Expense Reductions.
The investment adviser or its affiliates agreed to reimburse or waive certain fees during the period as noted in the table below.
Initial Class | $ 44,359 |
Service Class | 319 |
Service Class 2 | 1,190 |
Investor Class | 4,900 |
| $ 50,768 |
Commissions paid to certain brokers with whom the investment adviser, or its affiliates, places trades on behalf of the Fund include an amount in addition to trade execution, which may be rebated back to the Fund to offset certain expenses. This amount totaled $51,211 for the period. In addition, through arrangements with the Fund's custodian, credits realized as a result of uninvested cash balances were used to reduce the Fund's expenses. During the period, these credits reduced the Fund's custody expenses by $18.
10. Distributions to Shareholders.
Distributions to shareholders of each class were as follows:
Years ended December 31, | 2013 | 2012 |
From net investment income | | |
Initial Class | $ 17,529,160 | $ 17,052,128 |
Service Class | 113,871 | 114,427 |
Service Class 2 | 401,405 | 392,929 |
Investor Class | 1,981,848 | 1,622,341 |
Total | $ 20,026,284 | $ 19,181,825 |
From net realized gain | | |
Initial Class | $ 2,718,458 | $ 8,164,790 |
Service Class | 19,098 | 59,587 |
Service Class 2 | 74,370 | 228,871 |
Investor Class | 322,665 | 822,083 |
Total | $ 3,134,591 | $ 9,275,331 |
11. Share Transactions.
Transactions for each class of shares were as follows:
| Shares | Dollars |
Years ended December 31, | 2013 | 2012 | 2013 | 2012 |
Initial Class | | | | |
Shares sold | 1,776,839 | 2,183,168 | $ 28,728,652 | $ 32,447,664 |
Reinvestment of distributions | 1,203,663 | 1,678,889 | 20,247,618 | 25,216,918 |
Shares redeemed | (9,115,467) | (10,780,089) | (147,555,356) | (160,348,899) |
Net increase (decrease) | (6,134,965) | (6,918,032) | $ (98,579,086) | $ (102,684,317) |
Annual Report
Notes to Financial Statements - continued
11. Share Transactions - continued
| Shares | Dollars |
Years ended December 31, | 2013 | 2012 | 2013 | 2012 |
Service Class | | | | |
Shares sold | 38,656 | 105,187 | $ 630,181 | $ 1,549,922 |
Reinvestment of distributions | 7,957 | 11,663 | 132,969 | 174,014 |
Shares redeemed | (140,439) | (144,367) | (2,266,901) | (2,118,322) |
Net increase (decrease) | (93,826) | (27,517) | $ (1,503,751) | $ (394,386) |
Service Class 2 | | | | |
Shares sold | 208,837 | 275,190 | $ 3,330,187 | $ 4,055,076 |
Reinvestment of distributions | 28,784 | 42,127 | 475,775 | 621,800 |
Shares redeemed | (409,882) | (704,421) | (6,530,674) | (10,322,539) |
Net increase (decrease) | (172,261) | (387,104) | $ (2,724,712) | $ (5,645,663) |
Investor Class | | | | |
Shares sold | 1,350,799 | 927,759 | $ 21,846,353 | $ 13,650,637 |
Reinvestment of distributions | 137,555 | 163,397 | 2,304,513 | 2,444,424 |
Shares redeemed | (808,215) | (1,196,468) | (13,113,340) | (17,780,992) |
Net increase (decrease) | 680,139 | (105,312) | $ 11,037,526 | $ (1,685,931) |
12. Other.
The Fund's organizational documents provide former and current trustees and officers with a limited indemnification against liabilities arising in connection with the performance of their duties to the Fund. In the normal course of business, the Fund may also enter into contracts that provide general indemnifications. The Fund's maximum exposure under these arrangements is unknown as this would be dependent on future claims that may be made against the Fund. The risk of material loss from such claims is considered remote.
At the end of the period, the investment adviser or its affiliates were the owners of record of 33% of the total outstanding shares of the Fund and two otherwise unaffiliated shareholders were the owners of record of 28% of the total outstanding shares of the Fund.
Annual Report
Report of Independent Registered Public Accounting Firm
To the Trustees of Variable Insurance Products Fund V and Shareholders of VIP Asset Manager Portfolio:
We have audited the accompanying statement of assets and liabilities of VIP Asset Manager Portfolio (the Fund), a fund of Variable Insurance Products Fund V, including the schedule of investments, as of December 31, 2013, and the related statement of operations for the year then ended, the statement of changes in net assets for each of the two years in the period then ended, and the financial highlights for each of the five years in the period then ended. These financial statements and financial highlights are the responsibility of the Fund's management. Our responsibility is to express an opinion on these financial statements and financial highlights based on our audits.
We conducted our audits in accordance with the standards of the Public Company Accounting Oversight Board (United States). Those standards require that we plan and perform the audit to obtain reasonable assurance about whether the financial statements and financial highlights are free of material misstatement. The Fund is not required to have, nor were we engaged to perform, an audit of its internal control over financial reporting. Our audits included consideration of internal control over financial reporting as a basis for designing audit procedures that are appropriate in the circumstances, but not for the purpose of expressing an opinion on the effectiveness of the Fund's internal control over financial reporting. Accordingly, we express no such opinion. An audit also includes examining, on a test basis, evidence supporting the amounts and disclosures in the financial statements, assessing the accounting principles used and significant estimates made by management, as well as evaluating the overall financial statement presentation. Our procedures included confirmation of securities owned as of December 31, 2013, by correspondence with the custodians and brokers; where replies were not received from brokers, we performed other auditing procedures. We believe that our audits provide a reasonable basis for our opinion.
In our opinion, the financial statements and financial highlights referred to above present fairly, in all material respects, the financial position of VIP Asset Manager Portfolio as of December 31, 2013, the results of its operations for the year then ended, the changes in its net assets for each of the two years in the period then ended, and the financial highlights for each of the five years in the period then ended, in conformity with accounting principles generally accepted in the United States of America.
DELOITTE & TOUCHE LLP
Boston, Massachusetts
February 19, 2014
Annual Report
The Trustees and officers of the trust and fund, as applicable, are listed below. The Board of Trustees governs the fund and is responsible for protecting the interests of shareholders. The Trustees are experienced executives who meet periodically throughout the year to oversee the fund's activities, review contractual arrangements with companies that provide services to the fund, oversee management of the risks associated with such activities and contractual arrangements, and review the fund's performance. Except for Elizabeth S. Acton and James C. Curvey each of the Trustees oversees 223 funds. Elizabeth S. Acton oversees 205 funds. James C. Curvey oversees 396 funds.
The Trustees hold office without limit in time except that (a) any Trustee may resign; (b) any Trustee may be removed by written instrument, signed by at least two-thirds of the number of Trustees prior to such removal; (c) any Trustee who requests to be retired or who has become incapacitated by illness or injury may be retired by written instrument signed by a majority of the other Trustees; and (d) any Trustee may be removed at any special meeting of shareholders by a two-thirds vote of the outstanding voting securities of the trust. Each Trustee who is not an interested person (as defined in the 1940 Act) of the trust and the fund (Independent Trustee), shall retire not later than the last day of the month in which his or her 75th birthday occurs. The Independent Trustees may waive this mandatory retirement age policy with respect to individual Trustees. The officers hold office without limit in time, except that any officer may resign or may be removed by a vote of a majority of the Trustees at any regular meeting or any special meeting of the Trustees. Except as indicated, each individual has held the office shown or other offices in the same company for the past five years.
Experience, Skills, Attributes, and Qualifications of the Fund's Trustees. The Governance and Nominating Committee has adopted a statement of policy that describes the experience, qualifications, attributes, and skills that are necessary and desirable for potential Independent Trustee candidates (Statement of Policy). The Board believes that each Trustee satisfied at the time he or she was initially elected or appointed a Trustee, and continues to satisfy, the standards contemplated by the Statement of Policy. The Governance and Nominating Committee also engages professional search firms to help identify potential Independent Trustee candidates who have the experience, qualifications, attributes, and skills consistent with the Statement of Policy. From time to time, additional criteria based on the composition and skills of the current Independent Trustees, as well as experience or skills that may be appropriate in light of future changes to board composition, business conditions, and regulatory or other developments, have also been considered by the professional search firms and the Governance and Nominating Committee. In addition, the Board takes into account the Trustees' commitment and participation in Board and committee meetings, as well as their leadership of standing and ad hoc committees throughout their tenure.
In determining that a particular Trustee was and continues to be qualified to serve as a Trustee, the Board has considered a variety of criteria, none of which, in isolation, was controlling. The Board believes that, collectively, the Trustees have balanced and diverse experience, qualifications, attributes, and skills, which allow the Board to operate effectively in governing the fund and protecting the interests of shareholders. Information about the specific experience, skills, attributes, and qualifications of each Trustee, which in each case led to the Board's conclusion that the Trustee should serve (or continue to serve) as a trustee of the fund, is provided below.
Board Structure and Oversight Function. Abigail P. Johnson is an interested person (as defined in the 1940 Act) and currently serves as Chairman. The Trustees have determined that an interested Chairman is appropriate and benefits shareholders because an interested Chairman has a personal and professional stake in the quality and continuity of services provided to the fund. Independent Trustees exercise their informed business judgment to appoint an individual of their choosing to serve as Chairman, regardless of whether the Trustee happens to be independent or a member of management. The Independent Trustees have determined that they can act independently and effectively without having an Independent Trustee serve as Chairman and that a key structural component for assuring that they are in a position to do so is for the Independent Trustees to constitute a substantial majority for the Board. The Independent Trustees also regularly meet in executive session. Albert R. Gamper, Jr. serves as Chairman of the Independent Trustees and as such (i) acts as a liaison between the Independent Trustees and management with respect to matters important to the Independent Trustees and (ii) with management prepares agendas for Board meetings.
Fidelity funds are overseen by different Boards of Trustees. The fund's Board oversees Fidelity's investment-grade bond, money market, and asset allocation funds and another Board oversees Fidelity's equity and high income funds. The asset allocation funds may invest in Fidelity funds that are overseen by such other Board. The use of separate Boards, each with its own committee structure, allows the Trustees of each group of Fidelity funds to focus on the unique issues of the funds they oversee, including common research, investment, and operational issues. On occasion, the separate Boards establish joint committees to address issues of overlapping consequences for the Fidelity funds overseen by each Board.
The Trustees operate using a system of committees to facilitate the timely and efficient consideration of all matters of importance to the Trustees, the fund, and fund shareholders and to facilitate compliance with legal and regulatory requirements and oversight of the fund's activities and associated risks. The Board, acting through its committees, has charged FMR and its affiliates with (i) identifying events or circumstances the occurrence of which could have demonstrably adverse effects on the fund's business and/or reputation; (ii) implementing processes and controls to lessen the possibility that such events or circumstances occur or to mitigate the effects of such events or circumstances if they do occur; and (iii) creating and maintaining a system designed to evaluate continuously business and market conditions in order to facilitate the identification and implementation processes described in (i) and (ii) above. Because the day-to-day operations and activities of the fund are carried out by or through FMR its affiliates, and other service providers, the fund's exposure to risks is mitigated but not eliminated by the processes overseen by the Trustees. While each of the Board's committees has responsibility for overseeing different aspects of the fund's activities, oversight is exercised primarily through the Operations and Audit Committees. In addition, an ad hoc Board committee of Independent Trustees has worked with FMR to enhance the Board's oversight of investment and financial risks, legal and regulatory risks, technology risks, and operational risks, including the development of additional risk reporting to the Board. Appropriate personnel, including but not limited to the fund's Chief Compliance Officer (CCO), FMR's internal auditor, the independent accountants, the fund's Treasurer and portfolio management personnel, make periodic reports to the Board's committees, as appropriate, including an annual review of FMR's risk management program for the Fidelity funds. The responsibilities of each standing committee, including their oversight responsibilities, are described further under "Standing Committees of the Fund's Trustees."
Annual Report
The fund's Statement of Additional Information (SAI) includes more information about the Trustees. To request a free copy, call Fidelity at 1-877-208-0098.
Interested Trustees*:
Correspondence intended for each Trustee who is an interested person may be sent to Fidelity Investments, 245 Summer Street, Boston, Massachusetts 02210.
Name, Year of Birth; Principal Occupations and Other Relevant Experience+ |
James C. Curvey (1935) |
Year of Election or Appointment: 2007 Trustee |
| Mr. Curvey also serves as Trustee of other Fidelity funds. Mr. Curvey is a Director of Fidelity Investments Money Management, Inc. (2009-present), Director of Fidelity Research & Analysis Co. (2009-present) and Director of FMR and FMR Co., Inc. (2007-present). Mr. Curvey is also Vice Chairman (2007-present) and Director of FMR LLC. In addition, Mr. Curvey serves as an Overseer for the Boston Symphony Orchestra and a member of the Trustees of Villanova University. Previously, Mr. Curvey was the Vice Chairman (2006-2007) and Director (2000-2007) of FMR Corp. |
Abigail P. Johnson (1961) |
Year of Election or Appointment: 2009 Trustee Chairman of the Board of Trustees |
| Ms. Johnson also serves as Trustee of other Fidelity funds. Ms. Johnson serves as President of FMR LLC (2013-present), President of Fidelity Financial Services (2012-present) and President of Personal, Workplace and Institutional Services (2005-present). Ms. Johnson is Chairman and Director of FMR Co., Inc. (2011-present), Chairman and Director of FMR (2011-present), and the Vice Chairman and Director (2007-present) of FMR LLC. Previously, Ms. Johnson served as President and a Director of FMR (2001-2005), a Trustee of other investment companies advised by FMR, Fidelity Investments Money Management, Inc., and FMR Co., Inc. (2001-2005), Senior Vice President of the Fidelity funds (2001-2005), and managed a number of Fidelity funds. Ms. Abigail P. Johnson and Mr. Arthur E. Johnson are not related. |
* Trustees have been determined to be "Interested Trustees" by virtue of, among other things, their affiliation with the trust or various entities under common control with FMR.
+ The information above includes each Trustee's principal occupation during the last five years and other information relating to the experience, attributes, and skills relevant to each Trustee's qualifications to serve as a Trustee, which led to the conclusion that each Trustee should serve as a Trustee for the fund.
Independent Trustees:
Correspondence intended for each Independent Trustee (that is, the Trustees other than the Interested Trustees) may be sent to Fidelity Investments, P.O. Box 55235, Boston, Massachusetts 02205-5235.
Name, Year of Birth; Principal Occupations and Other Relevant Experience+ |
Elizabeth S. Acton (1951) |
Year of Election or Appointment: 2013 Trustee |
| Ms. Acton also serves as Trustee or Member of the Advisory Board of other Fidelity funds. Prior to her retirement in April 2012, Ms. Acton was Executive Vice President, Finance (2011-2012), Executive Vice President, Chief Financial Officer (2002-2011), and Treasurer (2004-2005) of Comerica Incorporated (financial services). Prior to joining Comerica, Ms. Acton held a variety of positions at Ford Motor Company (1983-2002), including Vice President and Treasurer (2000-2002) and Executive Vice President and Chief Financial Officer of Ford Motor Credit Company (1998-2000). Ms. Acton currently serves as a member of the Board of Directors and Audit and Finance Committees of Beazer Homes USA, Inc. (homebuilding, 2012-present). |
Albert R. Gamper, Jr. (1942) |
Year of Election or Appointment: 2006 Trustee Chairman of the Independent Trustees |
| Mr. Gamper also serves as Trustee of other Fidelity funds. Prior to his retirement in December 2004, Mr. Gamper served as Chairman of the Board of CIT Group Inc. (commercial finance). During his tenure with CIT Group Inc. Mr. Gamper served in numerous senior management positions, including Chairman (1987-1989; 1999-2001; 2002-2004), Chief Executive Officer (1987-2004), and President (2002-2003). Mr. Gamper currently serves as a member of the Board of Directors of Public Service Enterprise Group (utilities, 2000-present), a member of the Board of Trustees, Rutgers University (2004-present), and Chairman of the Board of Barnabas Health Care System. Previously, Mr. Gamper served as Vice Chairman of the Independent Trustees of certain Fidelity funds (2011-2012) and as Chairman of the Board of Governors, Rutgers University (2004-2007). |
Robert F. Gartland (1951) |
Year of Election or Appointment: 2010 Trustee |
| Mr. Gartland also serves as Trustee of other Fidelity funds. Mr. Gartland is Chairman and an investor in Gartland and Mellina Group Corp. (consulting, 2009-present). Previously, Mr. Gartland served as a partner and investor of Vietnam Partners LLC (investments and consulting, 2008-2011). Prior to his retirement, Mr. Gartland held a variety of positions at Morgan Stanley (financial services, 1979-2007) including Managing Director (1987-2007). |
Arthur E. Johnson (1947) |
Year of Election or Appointment: 2008 Trustee |
| Mr. Johnson also serves as Trustee of other Fidelity funds. Mr. Johnson serves as a member of the Board of Directors of Eaton Corporation (diversified power management, 2009-present), AGL Resources, Inc. (holding company, 2002-present) and Booz Allen Hamilton (management consulting, 2011-present). Prior to his retirement, Mr. Johnson served as Senior Vice President of Corporate Strategic Development of Lockheed Martin Corporation (defense contractor, 1999-2009). He previously served on the Board of Directors of IKON Office Solutions, Inc. (1999-2008) and Delta Airlines (2005-2007). Mr. Arthur E. Johnson is not related to Ms. Abigail P. Johnson. |
Michael E. Kenneally (1954) |
Year of Election or Appointment: 2009 Trustee |
| Mr. Kenneally also serves as Trustee of other Fidelity funds. Mr. Kenneally served as a Member of the Advisory Board for certain Fidelity funds before joining the Board of Trustees (2008-2009). Prior to his retirement, Mr. Kenneally served as Chairman and Global Chief Executive Officer of Credit Suisse Asset Management. Before joining Credit Suisse, he was an Executive Vice President and Chief Investment Officer for Bank of America Corporation. Earlier roles at Bank of America included Director of Research, Senior Portfolio Manager and Research Analyst, and Mr. Kenneally was awarded the Chartered Financial Analyst (CFA) designation in 1991. |
James H. Keyes (1940) |
Year of Election or Appointment: 2007 Trustee |
| Mr. Keyes also serves as Trustee of other Fidelity funds. Mr. Keyes serves as a member of the Board and Non-Executive Chairman of Navistar International Corporation (manufacture and sale of trucks, buses, and diesel engines, since 2002). Previously, Mr. Keyes served as a member of the Board of Pitney Bowes, Inc. (integrated mail, messaging, and document management solutions, 1998-2013). Prior to his retirement, Mr. Keyes served as Chairman (1993-2002) and Chief Executive Officer (1988-2002) of Johnson Controls (automotive, building, and energy) and as a member of the Board of LSI Logic Corporation (semiconductor technologies, 1984-2008). |
Marie L. Knowles (1946) |
Year of Election or Appointment: 2001 Trustee Vice Chairman of the Independent Trustees |
| Ms. Knowles also serves as Trustee of other Fidelity funds. Prior to Ms. Knowles' retirement in June 2000, she served as Executive Vice President and Chief Financial Officer of Atlantic Richfield Company (ARCO) (diversified energy, 1996-2000). From 1993 to 1996, she was a Senior Vice President of ARCO and President of ARCO Transportation Company. She served as a Director of ARCO from 1996 to 1998. Ms. Knowles currently serves as a Director and Chairman of the Audit Committee of McKesson Corporation (healthcare service, since 2002). Ms. Knowles is a member of the Board of the Catalina Island Conservancy and of the Santa Catalina Island Company (2009-present). She also serves as a member of the Advisory Board for the School of Engineering of the University of Southern California. Previously, Ms. Knowles served as a Director of Phelps Dodge Corporation (copper mining and manufacturing, 1994-2007), URS Corporation (engineering and construction, 2000-2003) and America West (airline, 1999-2002). |
Kenneth L. Wolfe (1939) |
Year of Election or Appointment: 2005 Trustee |
| Mr. Wolfe also serves as Trustee of other Fidelity funds. Prior to his retirement, Mr. Wolfe served as Chairman and a Director (2007-2009) and Chairman and Chief Executive Officer (1994-2001) of Hershey Foods Corporation. He also served as a member of the Boards of Adelphia Communications Corporation (telecommunications, 2003-2006), Bausch & Lomb, Inc. (medical/pharmaceutical, 1993-2007), and Revlon, Inc. (personal care products, 2004-2009). Mr. Wolfe previously served as Chairman of the Independent Trustees of other Fidelity funds (2008-2012). |
+ The information above includes each Trustee's principal occupation during the last five years and other information relating to the experience, attributes, and skills relevant to each Trustee's qualifications to serve as a Trustee, which led to the conclusion that each Trustee should serve as a Trustee for the fund.
Officers:
Correspondence intended for each officer may be sent to Fidelity Investments, 245 Summer Street, Boston, Massachusetts 02210.
Officers appear below in alphabetical order.
Name, Year of Birth; Principal Occupation |
Elizabeth Paige Baumann (1968) |
Year of Election or Appointment: 2012 Anti-Money Laundering (AML) Officer |
| Ms. Baumann also serves as AML Officer of other funds. She is Chief AML Officer of FMR LLC (2012-present) and is an employee of Fidelity Investments. Previously, Ms. Baumann served as Vice President and Deputy Anti-Money Laundering Officer (2007-2012). |
Robert P. Brown (1963) |
Year of Election or Appointment: 2012 Vice President of Fidelity's Bond Funds |
| Mr. Brown also serves as Vice President of other funds. Mr. Brown serves as Executive Vice President of Fidelity Investments Money Management, Inc. (FIMM) (2010-present), President, Bond Group of FMR (2011-present), Director and Managing Director, Research of Fidelity Management & Research (U.K.) Inc. (2008-present), and is an employee of Fidelity Investments. Previously, Mr. Brown served as President, Money Market Group of FMR (2010-2011) and Vice President of Fidelity's Money Market Funds (2010-2012). |
Marc Bryant (1966) |
Year of Election or Appointment: 2013 Assistant Secretary |
| Mr. Bryant also serves as an officer of other funds. He is Senior Vice President and Deputy General Counsel of FMR LLC. Prior to joining Fidelity Investments, Mr. Bryant served as a Senior Vice President and the Head of Global Retail Legal for AllianceBernstein L.P. (2006-2010), and as the General Counsel for ProFund Advisors LLC (2001-2006). |
Jonathan Davis (1968) |
Year of Election or Appointment: 2010 Assistant Treasurer |
| Mr. Davis also serves as Assistant Treasurer of other funds. Mr. Davis is an employee of Fidelity Investments. Previously, Mr. Davis served as Vice President and Associate General Counsel of FMR LLC (2003-2010). |
Adrien E. Deberghes (1967) |
Year of Election or Appointment: 2010 Assistant Treasurer |
| Mr. Deberghes also serves as an officer of other funds. He is an employee of Fidelity Investments (2008-present). Prior to joining Fidelity Investments, Mr. Deberghes was Senior Vice President of Mutual Fund Administration at State Street Corporation (2007-2008), Senior Director of Mutual Fund Administration at Investors Bank & Trust (2005-2007), and Director of Finance for Dunkin' Brands (2000-2005). |
Stephanie J. Dorsey (1969) |
Year of Election or Appointment: 2013 President and Treasurer |
| Ms. Dorsey also serves as an officer of other funds. She is an employee of Fidelity Investments (2008-present) and has served in other fund officer roles. Prior to joining Fidelity Investments, Ms. Dorsey served as Treasurer (2004-2008) of the JPMorgan Mutual Funds and Vice President (2004-2008) of JPMorgan Chase Bank. |
Scott C. Goebel (1968) |
Year of Election or Appointment: 2008 Secretary and Chief Legal Officer (CLO) |
| Mr. Goebel serves as Secretary and CLO of other funds. Mr. Goebel also serves as Secretary of Fidelity Investments Money Management, Inc. (FIMM) (2010-present) and Fidelity Research and Analysis Company (FRAC) (2010-present); General Counsel, Secretary, and Senior Vice President of FMR (2008-present) and FMR Co., Inc. (2008-present); Chief Legal Officer of Fidelity Management & Research (Hong Kong) Limited (2008-present) and Assistant Secretary of Fidelity Management & Research (Japan) Inc. (2008-present), and Fidelity Management & Research (U.K.) Inc. (2008-present). Previously, Mr. Goebel served as Secretary and CLO of other Fidelity funds (2008-2013), Assistant Secretary of FIMM (2008-2010), FRAC (2008-2010), and certain funds (2007-2008); and as Vice President and Secretary of Fidelity Distributors Corporation (FDC) (2005-2007). Mr. Goebel has been employed by FMR LLC or an affiliate since 2001. |
Bruce T. Herring (1965) |
Year of Election or Appointment: 2013 Vice President of Fidelity's Asset Allocation Funds |
| Mr. Herring also serves as Vice President of other funds. He serves as Chief Investment Officer of Fidelity Global Asset Allocation (GAA) (2013-present), Group Chief Investment Officer of FMR, and President of Fidelity Research & Analysis Company (2010-present). Previously, Mr. Herring served as Chief Investment Officer and Director of Fidelity Management & Research (U.K.) Inc. (2010-2013), Vice President (2005-2006) and Senior Vice President (2006-2007) of Fidelity Management & Research Company, Vice President of FMR Co., Inc. (2001-2007), and as a portfolio manager for Fidelity U.S. Equity Funds. |
Chris Maher (1972) |
Year of Election or Appointment: 2013 Assistant Treasurer |
| Mr. Maher serves as Assistant Treasurer of other funds. Mr. Maher is Vice President of Valuation Oversight and is an employee of Fidelity Investments. Previously, Mr. Maher served as Vice President of Asset Management Compliance (2013), Vice President of FMR's Program Management Group (2010-2013), and Vice President of Valuation Oversight (2008-2010). |
Charles S. Morrison (1960) |
Year of Election or Appointment: 2012 Vice President |
| Mr. Morrison also serves as Vice President of other funds. He serves as President, Fixed Income and is an employee of Fidelity Investments. Previously, Mr. Morrison served as Vice President of Fidelity's Money Market Funds (2005-2009), President, Money Market Group Leader of FMR (2009), and Senior Vice President, Money Market Group of FMR (2004-2009). Mr. Morrison also served as Vice President of Fidelity's Bond Funds (2002-2005), certain Balanced Funds (2002-2005), and certain Asset Allocation Funds (2002-2007), and as Senior Vice President (2002-2005) of Fidelity's Fixed Income Division. |
Nancy D. Prior (1967) |
Year of Election or Appointment: 2012 Vice President of Fidelity's Money Market Funds |
| Ms. Prior also serves as Vice President of other funds. Ms. Prior serves as President, Money Market Group of FMR (2011-present) and is an employee of Fidelity Investments (2002-present). Previously, Ms. Prior served as Managing Director of Research (2009-2011), Senior Vice President and Deputy General Counsel (2007-2009), and Assistant Secretary of other Fidelity funds (2008-2009). |
Christine Reynolds (1958) |
Year of Election or Appointment: 2008 Chief Financial Officer |
| Ms. Reynolds also serves as Chief Financial Officer of other funds. Ms. Reynolds became President of Fidelity Pricing and Cash Management Services (FPCMS) in August 2008. Ms. Reynolds served as Chief Operating Officer of FPCMS (2007-2008). Previously, Ms. Reynolds served as President, Treasurer, and Anti-Money Laundering officer of the Fidelity funds (2004-2007). |
Kenneth B. Robins (1969) |
Year of Election or Appointment: 2009 Assistant Treasurer |
| Mr. Robins also serves as an officer of other funds. Mr. Robins serves as Executive Vice President of Fidelity Investments Money Management, Inc. (FIMM) (2013-present) and is an employee of Fidelity Investments (2004-present). Previously, Mr. Robins served in other fund officer roles. |
Gary W. Ryan (1958) |
Year of Election or Appointment: 2005 Assistant Treasurer |
| Mr. Ryan also serves as Assistant Treasurer of other funds. Mr. Ryan is an employee of Fidelity Investments and has served in other fund officer roles. Previously, Mr. Ryan served as Vice President of Fund Reporting in Fidelity Pricing and Cash Management Services (FPCMS) (1999-2005). |
Stephen Sadoski (1971) |
Year of Election or Appointment: 2013 Deputy Treasurer |
| Mr. Sadoski also serves as Deputy Treasurer of other funds. He is an employee of Fidelity Investments (2012-present) and has served in another fund officer role. Prior to joining Fidelity Investments, Mr. Sadoski served as an assistant chief accountant in the Division of Investment Management of the Securities and Exchange Commission (SEC) (2009-2012) and as a senior manager at Deloitte & Touche LLP (1997-2009). |
Stacie M. Smith (1974) |
Year of Election or Appointment: 2013 Assistant Treasurer |
| Ms. Smith also serves as an officer of other funds. She is an employee of Fidelity Investments (2009-present) and has served in other fund officer roles. Prior to joining Fidelity Investments, Ms. Smith served as Senior Audit Manager of Ernst & Young LLP (1996-2009). |
Renee Stagnone (1975) |
Year of Election or Appointment: 2013 Deputy Treasurer |
| Ms. Stagnone also serves as Deputy Treasurer of other funds. Ms. Stagnone is an employee of Fidelity Investments. |
Michael H. Whitaker (1967) |
Year of Election or Appointment: 2008 Chief Compliance Officer |
| Mr. Whitaker also serves as Chief Compliance Officer of other funds. Mr. Whitaker is an employee of Fidelity Investments (2007-present). Prior to joining Fidelity Investments, Mr. Whitaker worked at MFS Investment Management where he served as Senior Vice President and Chief Compliance Officer (2004-2006), and Assistant General Counsel. |
Derek L. Young (1964) |
Year of Election or Appointment: 2009 Vice President of Fidelity's Asset Allocation Funds |
| Mr. Young also serves as Trustee or an officer of other funds. He is President and a Director of Strategic Advisers, Inc. (2011-present), President of Fidelity Global Asset Allocation (GAA) (2011-present), and Vice Chairman of Pyramis Global Advisors, LLC (2011-present). Previously, Mr. Young served as Chief Investment Officer of GAA (2009-2011) and as a portfolio manager. |
Joseph F. Zambello (1957) |
Year of Election or Appointment: 2011 Deputy Treasurer |
| Mr. Zambello also serves as Deputy Treasurer of other funds. Mr. Zambello is an employee of Fidelity Investments. Previously, Mr. Zambello served as Vice President of FMR's Program Management Group (2009-2011) and Vice President of the Transfer Agent Oversight Group (2005-2009). |
Annual Report
The Board of Trustees of VIP II Asset Manager Portfolio voted to pay to shareholders of record at the opening of business on record date, the following distributions per share derived from capital gains realized from sales of portfolio securities:
Fund | Pay Date | Record Date | Capital Gains |
Initial Class | 02/14/14 | 02/14/14 | $0.683 |
Service Class | 02/14/14 | 02/14/14 | $0.683 |
Service Class 2 | 02/14/14 | 02/14/14 | $0.683 |
Investor Class | 02/14/14 | 02/14/14 | $0.683 |
The fund hereby designates as a capital gain dividend with respect to the taxable year ended December 31, 2013, $53,845,142, or, if subsequently determined to be different, the net capital gain of such year.
A total of 8.2321% of the dividends distributed during the fiscal year was derived from interest on U.S. Government securities which is generally exempt from state income tax.
Initial Class designates 13%; Service Class designates 14%; Service Class 2 designates 16%; and Investor Class designates 14%; of the dividends distributed in December 2013, during the fiscal year as qualifying for the dividends-received deduction for corporate shareholders.
Annual Report
Board Approval of Investment Advisory Contracts and Management Fees
VIP Asset Manager Portfolio
Each year, the Board of Trustees, including the Independent Trustees (together, the Board), votes on the renewal of the management contract with Fidelity Management & Research Company (FMR) and the sub-advisory agreements (together, the Advisory Contracts) for the fund. The Board, assisted by the advice of fund counsel and Independent Trustees' counsel, requests and considers a broad range of information relevant to the renewal of the Advisory Contracts throughout the year.
The Board meets regularly and, at each of its meetings, covers an extensive agenda of topics and materials and considers factors that are relevant to its annual consideration of the renewal of the fund's Advisory Contracts, including the services and support provided to the fund and its shareholders. The Board has established four standing committees, Operations, Audit, Fair Valuation, and Governance and Nominating, each composed of and chaired by Independent Trustees with varying backgrounds, to which the Board has assigned specific subject matter responsibilities in order to enhance effective decision-making by the Board. The Operations Committee, of which all of the Independent Trustees are members, meets regularly throughout the year and, among other matters, considers matters specifically related to the annual consideration of the renewal of the fund's Advisory Contracts. The Board, acting directly and through its Committees, requests and receives information concerning the annual consideration of the renewal of the fund's Advisory Contracts. The Board also meets as needed to consider matters specifically related to the Board's annual consideration of the renewal of Advisory Contracts. Members of the Board may also meet with trustees of other Fidelity funds through ad hoc joint committees to discuss certain matters relevant to the Fidelity funds.
At its September 2013 meeting, the Board, including the Independent Trustees, unanimously determined to renew the fund's Advisory Contracts. In reaching its determination, the Board considered all factors it believed relevant, including (i) the nature, extent, and quality of the services to be provided to the fund and its shareholders (including the investment performance of the fund); (ii) the competitiveness of the fund's management fee and total expense ratio relative to peer funds; (iii) the total costs of the services to be provided by and the profits to be realized by Fidelity from its relationship with the fund; (iv) the extent to which economies of scale exist and would be realized as the fund grows; and (v) whether fee levels reflect these economies of scale, if any, for the benefit of fund shareholders.
In considering whether to renew the Advisory Contracts for the fund, the Board reached a determination, with the assistance of fund counsel and Independent Trustees' counsel and through the exercise of its business judgment, that the renewal of the Advisory Contracts was in the best interests of the fund and its shareholders and that the compensation payable under the Advisory Contracts was fair and reasonable. The Board's decision to renew the Advisory Contracts was not based on any single factor, but rather was based on a comprehensive consideration of all the information provided to the Board at its meetings throughout the year. The Board, in reaching its determination to renew the Advisory Contracts, was aware that shareholders in the fund have a broad range of investment choices available to them, including a wide choice among mutual funds offered by Fidelity's competitors, and that the fund's shareholders, who have the opportunity to review and weigh the disclosure provided by the fund in its prospectus and other public disclosures, have chosen to invest in this fund, which is part of the Fidelity family of funds.
Nature, Extent, and Quality of Services Provided. The Board considered Fidelity's staffing as it relates to the fund, including the backgrounds of investment personnel of FMR and the sub-advisers (together, the Investment Advisers), and also considered the fund's investment objective, strategies, and related investment philosophy. The Independent Trustees also had discussions with senior management of Fidelity's investment operations and investment groups. The Board considered the structure of the portfolio manager compensation program and whether this structure provides appropriate incentives to act in the best interests of the fund.
Resources Dedicated to Investment Management and Support Services. The Board reviewed the general qualifications and capabilities of Fidelity's investment staff, including its size, education, experience, and resources, as well as Fidelity's approach to recruiting, managing, and compensating investment personnel. The Board noted that Fidelity has continued to increase the resources devoted to non-U.S. offices, including expansion of Fidelity's global investment organization. The Board also noted that Fidelity's analysts have extensive resources, tools and capabilities that allow them to conduct sophisticated quantitative and fundamental analysis, as well as credit analysis of issuers, counterparties and guarantors. Further, the Board believes that Fidelity's investment professionals have sufficient access to global information and data so as to provide competitive investment results over time, and that those professionals also have access to sophisticated tools that permit them to assess portfolio construction and risk and performance attribution characteristics continuously, as well as to transmit new information and research conclusions rapidly around the world. Additionally, in its deliberations, the Board considered Fidelity's trading and risk management capabilities and resources, which are an integral part of the investment management process.
Shareholder and Administrative Services. The Board considered (i) the nature, extent, quality, and cost of advisory, administrative, and shareholder services performed by the Investment Advisers and their affiliates under the Advisory Contracts and under separate agreements covering transfer agency, pricing and bookkeeping, and securities lending services for the fund; (ii) the nature and extent of the supervision of third party service providers, principally custodians and subcustodians; and (iii) the resources devoted to, and the record of compliance with, the fund's compliance policies and procedures. The Board also reviewed the allocation of fund brokerage, including allocations to brokers affiliated with the Investment Advisers, the use of brokerage commissions to pay fund expenses, and the use of "soft" commission dollars to pay for research services.
Annual Report
The Board noted that the growth of fund assets over time across the complex allows Fidelity to reinvest in the development of services designed to enhance the value or convenience of the Fidelity funds as investment vehicles. These services include 24-hour access to account information and market information through telephone representatives and over the Internet, investor education materials and asset allocation tools, and the expanded availability of Fidelity Investor Centers.
Investment in a Large Fund Family. The Board considered the benefits to shareholders of investing in a Fidelity fund, including the benefits of investing in a fund that is part of a large family of funds offering a variety of investment disciplines and providing a large variety of mutual fund investor services. The Board noted that Fidelity had taken, or had made recommendations that resulted in the Fidelity funds taking, a number of actions over the previous year that benefited particular funds, including (i) continuing to dedicate additional resources to investment research and to the support of the senior management team that oversees asset management; (ii) persisting in efforts to enhance Fidelity's global research capabilities; (iii) launching new funds and making other enhancements to meet client needs for global and income-oriented solutions; (iv) continuing to launch dedicated lower cost underlying funds to meet portfolio construction needs related to expanding underlying fund options for Fidelity funds of funds, specifically for the Freedom Fund product lines; (v) rationalizing product lines and gaining increased efficiencies through the combination of several funds with other funds; (vi) strengthening Fidelity's index fund offerings by reducing investment minimums and adopting or lowering existing expense caps for certain funds and classes; (vii) enhancing Global Asset Allocation product offerings by launching new funds and strategies, including "open architecture" target date funds that utilize affiliated and unaffiliated sub-advisers; (viii) modifying the eligibility criteria for Institutional Class shares of Advisor funds to increase their marketability to a portion of the defined contribution plan market; (ix) creating a new low-cost retirement share class for certain Advisor funds to appeal to large retirement plans; (x) transitioning the management of certain Fidelity commodity funds to Geode Capital Management LLC, a registered commodity pool operator, while retaining administrative responsibilities for the funds; and (xi) taking steps toward establishing a new Fidelity adviser to manage sector-based funds and products.
Investment Performance. The Board considered whether the fund has operated in accordance with its investment objective, as well as its record of compliance with its investment restrictions and its performance history.
The Board took into account discussions with the Investment Advisers about fund investment performance that occur at Board meetings throughout the year. In this regard the Board noted that as part of regularly scheduled fund reviews and other reports to the Board on fund performance, the Board periodically considers annualized return information for the fund for different time periods, measured against one or more securities market indices, including a customized blended index representative of the fund's asset classes (each a "benchmark index") and a peer group of mutual funds with similar objectives ("peer group"). In its evaluation of fund investment performance at meetings throughout the year, the Board gave particular attention to information indicating underperformance of certain Fidelity funds for specific time periods and the Investment Advisers' explanations for such underperformance.
In addition to reviewing absolute and relative fund performance, the Independent Trustees periodically consider the appropriateness of fund performance metrics in evaluating the results achieved. In general, the Independent Trustees believe that fund performance should be evaluated based on gross performance (before fees and expenses but after transaction costs) compared to appropriate benchmark indices, over appropriate time periods that may include full market cycles, and on net performance (after fees and expenses) compared to peer groups, as applicable, over the same periods, taking into account relevant factors including the following: general market conditions; expectations for interest rate levels and credit conditions; issuer-specific information including credit quality; tactical opportunities for investment; and fund cash flows and other factors. Depending on the circumstances, the Independent Trustees may be satisfied with a fund's performance notwithstanding that it lags its benchmark index or peer group for certain periods.
The Independent Trustees recognize that shareholders evaluate performance on a net basis over their own holding periods, for which one-, three-, and five-year periods are often used as a proxy. For this reason, the performance information reviewed by the Board also included net cumulative calendar year total return information for the fund and an appropriate benchmark index and peer group for the most recent one-, three-, and five-year periods.
Based on its review, the Board concluded that the nature, extent, and quality of services provided to the fund under the Advisory Contracts should benefit the fund's shareholders.
Competitiveness of Management Fee and Total Expense Ratio. The Board considered the fund's management fee and total expense ratio compared to "mapped groups" of competitive funds and classes. Fidelity creates "mapped groups" by combining similar Lipper investment objective categories that have comparable investment mandates. Combining Lipper investment objective categories aids the Board's management fee and total expense ratio comparisons by broadening the competitive group used for comparison and by reducing the number of universes to which various Fidelity funds are compared.
Management Fee. The Board considered two proprietary management fee comparisons for the 12-month periods shown in the chart below. The group of Lipper funds used by the Board for management fee comparisons is referred to below as the "Total Mapped Group." The Total Mapped Group comparison focuses on a fund's standing in terms of gross management fees before expense reimbursements or caps relative to the total universe of funds with comparable investment mandates, regardless of whether their management fee structures also are comparable. "TMG %" represents the percentage of funds in the Total Mapped Group that had management fees that were lower than the fund's. For example, a hypothetical TMG % of 50% would mean that half of the funds in the Total Mapped Group had higher, and half had lower, management fees than the fund. The fund's actual TMG %s are in the chart below. The "Asset-Size Peer Group" (ASPG) comparison focuses on a fund's standing relative to a subset of non-Fidelity funds within the Total Mapped Group that are similar in size and management fee structure. For example, if a fund is in the first quartile of the ASPG, the fund's management fee ranks in the least expensive or lowest 25% of funds in the ASPG. The ASPG represents at least 15% of the funds in the Total Mapped Group with comparable asset size and management fee structures, subject to a minimum of 50 funds (or all funds in the Total Mapped Group if fewer than 50). Additional information, such as the ASPG quartile in which the fund's management fee rate ranked, is also included in the chart and considered by the Board.
Annual Report
Board Approval of Investment Advisory Contracts and Management Fees - continued
VIP Asset Manager Portfolio
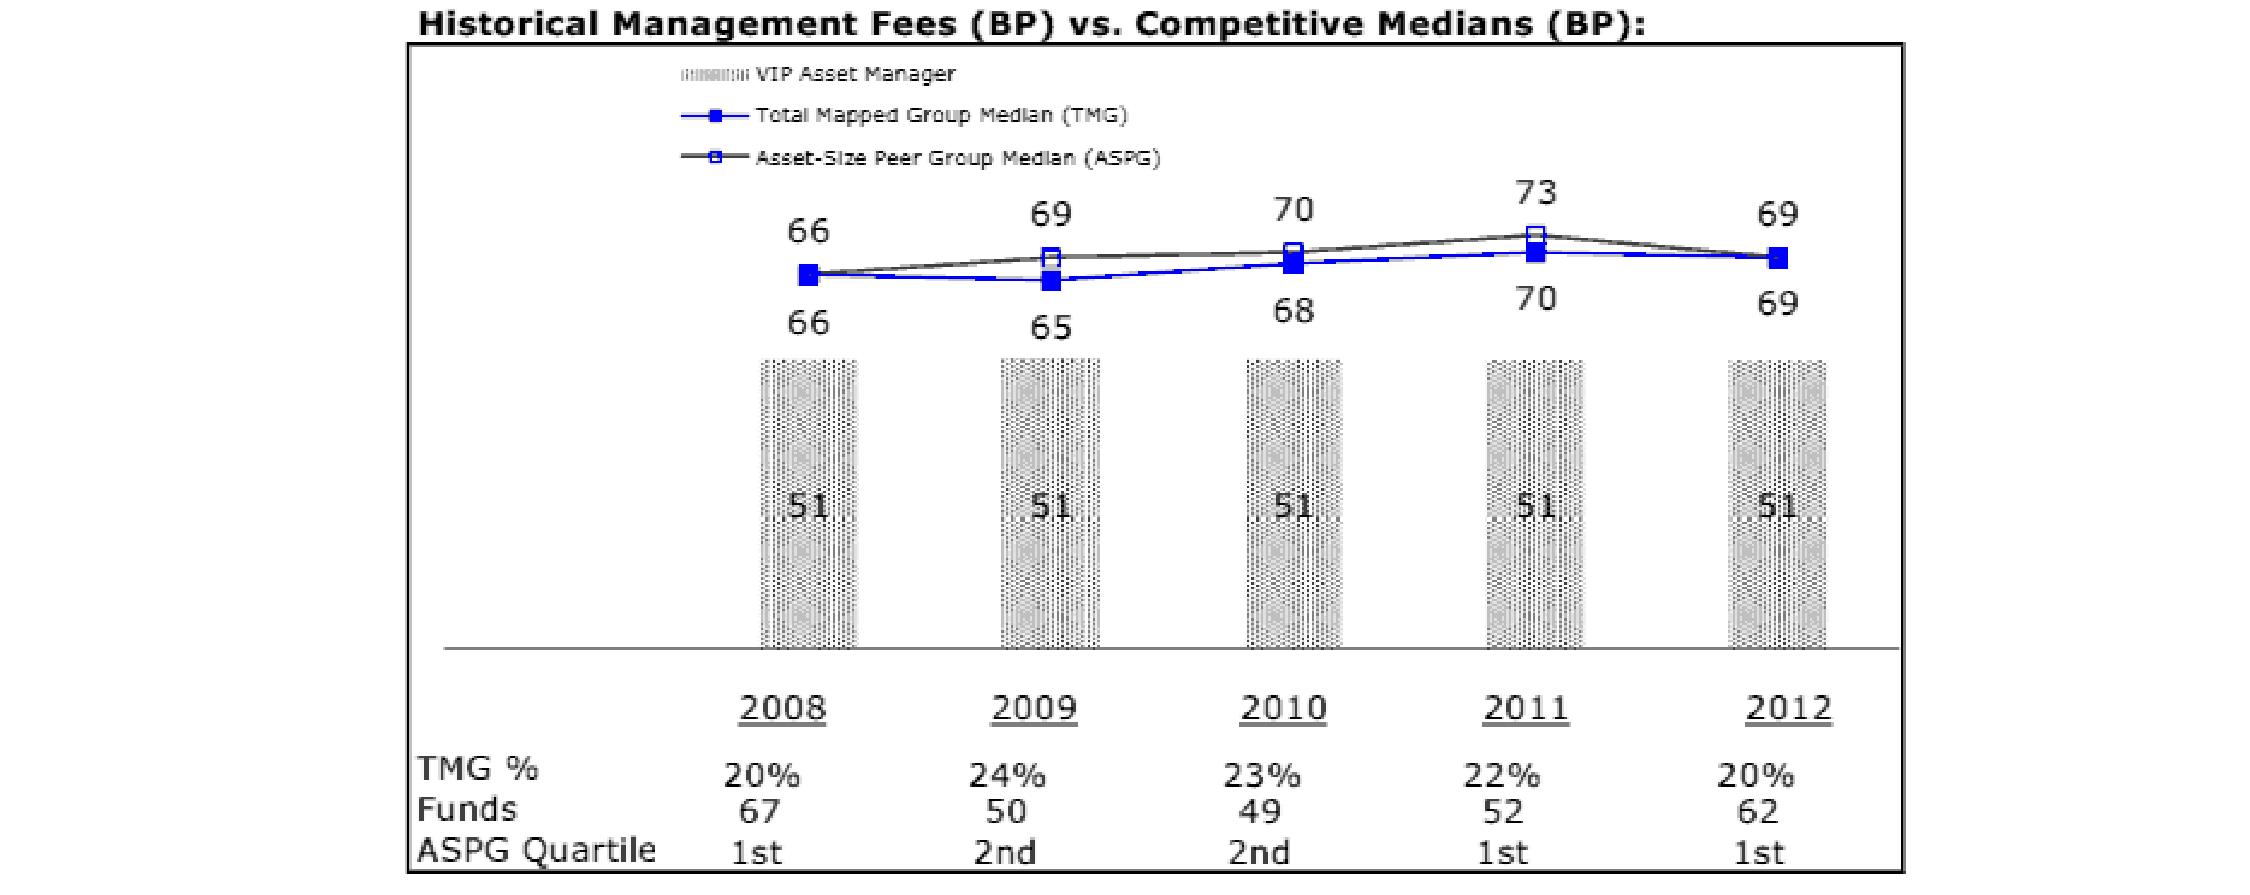
The Board noted that the fund's management fee rate ranked below the median of its Total Mapped Group and below the median of its ASPG for 2012.
Based on its review, the Board concluded that the fund's management fee is fair and reasonable in light of the services that the fund receives and the other factors considered.
Total Expense Ratio. In its review of each class's total expense ratio, the Board considered the fund's management fee as well as other fund or class expenses, as applicable, such as transfer agent fees, pricing and bookkeeping fees, fund-paid 12b-1 fees, and custodial, legal, and audit fees. The Board also noted the effects of any waivers and reimbursements on fees and expenses. As part of its review, the Board also considered the current and historical total expense ratios of each class of the fund compared to competitive fund median expenses. Each class of the fund is compared to those funds and classes in the Total Mapped Group (used by the Board for management fee comparisons) that have a similar sales load structure.
The Board noted that the total expense ratio of each of Initial Class, Investor Class, and Service Class ranked below its competitive median for 2012 and the total expense ratio of Service Class 2 ranked equal to its competitive median for 2012.
Fees Charged to Other Fidelity Clients. The Board also considered Fidelity fee structures and other information with respect to clients of Fidelity, such as other mutual funds advised or subadvised by Fidelity, pension plan clients, and other institutional clients. The Board noted the findings of the 2013 ad hoc joint committee (created with the board of other Fidelity funds), which reviewed and compared Fidelity's institutional investment advisory business with its business of providing services to the Fidelity funds, including the differences in services provided, fees charged, and costs incurred, as well as competition in their respective marketplaces.
Based on its review of total expense ratios and fees charged to other Fidelity clients, the Board concluded that the total expense ratio of each class of the fund was reasonable in light of the services that the fund and its shareholders receive and the other factors considered.
Costs of the Services and Profitability. The Board considered the revenues earned and the expenses incurred by Fidelity in conducting the business of developing, marketing, distributing, managing, administering and servicing the fund and servicing the fund's shareholders. The Board also considered the level of Fidelity's profits in respect of all the Fidelity funds.
On an annual basis, Fidelity presents to the Board Fidelity's profitability for the fund. Fidelity calculates the profitability for each fund, as well as aggregate profitability for groups of Fidelity funds and all Fidelity funds, using a series of detailed revenue and cost allocation methodologies which originate with the books and records of Fidelity on which Fidelity's audited financial statements are based. The Audit Committee of the Board reviews any significant changes from the prior year's methodologies.
Annual Report
PricewaterhouseCoopers LLP (PwC), independent registered public accounting firm and auditor to Fidelity and certain Fidelity funds, has been engaged annually by the Board as part of the Board's assessment of Fidelity's profitability analysis. PwC's engagement includes the review and assessment of the methodologies used by Fidelity in determining the revenues and expenses attributable to Fidelity's mutual fund business, and completion of agreed-upon procedures surrounding the mathematical accuracy of fund profitability and its conformity to allocation methodologies. After considering PwC's reports issued under the engagement and information provided by Fidelity, the Board concluded that while other allocation methods may also be reasonable, Fidelity's profitability methodologies are reasonable in all material respects.
The Board also reviewed Fidelity's non-fund businesses and fall-out benefits related to the mutual fund business as well as cases where Fidelity's affiliates may benefit from or be related to the fund's business.
The Board considered the costs of the services provided by and the profits realized by Fidelity in connection with the operation of the fund and was satisfied that the profitability was not excessive in the circumstances.
Economies of Scale. The Board considered whether there have been economies of scale in respect of the management of the Fidelity funds, whether the Fidelity funds (including the fund) have appropriately benefited from any such economies of scale, and whether there is potential for realization of any further economies of scale. The Board considered the extent to which the fund will benefit from economies of scale through increased services to the fund, through waivers or reimbursements, or through fee or expense reductions. The Board also noted that in 2009, it and the board of other Fidelity funds created an ad hoc committee (the Economies of Scale Committee) to analyze whether Fidelity attains economies of scale in respect of the management and servicing of the Fidelity funds, whether the Fidelity funds have appropriately benefited from such economies of scale, and whether there is potential for realization of any further economies of scale.
The Board recognized that the fund's management contract incorporates a "group fee" structure, which provides for lower group fee rates as total fund assets under FMR's management increase, and for higher group fee rates as total fund assets under FMR's management decrease. FMR calculates the group fee rates based on a tiered asset "breakpoint" schedule that varies based on asset class. The Board considered that the group fee is designed to deliver the benefits of economies of scale to fund shareholders when total Fidelity fund assets increase, even if assets of any particular fund are unchanged or have declined, because some portion of Fidelity's costs are attributable to services provided to all Fidelity funds, and all funds benefit if those costs can be allocated among more assets. The Board concluded that, given the group fee structure, fund shareholders will benefit from lower management fees as assets under FMR's management increase at the fund complex level, regardless of whether Fidelity achieves any such economies of scale.
The Board concluded, taking into account the analysis of the Economies of Scale Committee, that economies of scale, if any, are being appropriately shared between fund shareholders and Fidelity.
Amendment to Description of Group Fee Rate. At its September 2013 meeting, the Board voted to approve an amendment to the fund's management contract to modify the description of the "group fee rate." The Board noted that under the prior description in the contract, the group fee rate was based on the average net assets of all registered investment companies with which FMR has management contracts. Under the contract's tiered asset breakpoint schedule, the group fee rate is lower as total fund assets under FMR's management increase, and higher as total fund assets under FMR's management decrease. The Board considered that the prior description would have excluded the assets of 64 Fidelity sector funds from the group fee rate calculation once Fidelity SelectCo, LLC, an affiliate of FMR, assumed management responsibilities for those funds. The Board noted that modifying the description of the group fee rate to continue to include the assets of those 64 funds for purposes of determining group fee rate breakpoints would avoid an immediate adverse impact on the group fee rate for any fund.
Additional Information Requested by the Board. In order to develop fully the factual basis for consideration of the Fidelity funds' Advisory Contracts, the Board requested and received additional information on certain topics, including: (i) Fidelity's fund profitability methodology, profitability trends for certain funds, and the impact of certain factors on fund profitability results; (ii) portfolio manager changes that have occurred during the past year and the amount of the investment that each portfolio manager has made in the Fidelity fund(s) that he or she manages; (iii) Fidelity's compensation structure for portfolio managers, research analysts, and other key personnel, including its effects on fund profitability, the rationale for the compensation structure, and the extent to which current market conditions have affected retention and recruitment; (iv) the arrangements with and compensation paid to certain fund sub-advisers on behalf of the Fidelity funds; (v) Fidelity's fee structures, including the group fee structure and definition of group assets, and the rationale for recommending different fees among different categories of funds and classes; (vi) Fidelity's voluntary waiver of its fees to maintain minimum yields for certain money market funds and classes as well as contractual waivers in place for certain funds; (vii) the methodology with respect to competitive fund data and peer group classifications; (viii) Fidelity's transfer agent fee, expense, and service structures for different funds and classes, and the impact of the increased use of omnibus accounts; and (ix) explanations regarding the relative total expense ratios of certain funds and classes, total expense competitive trends and methodologies for total expense competitive comparisons, and actions that might be taken by Fidelity to reduce total expense ratios for certain funds and classes or to achieve further economies of scale.
Based on its evaluation of all of the conclusions noted above, and after considering all factors it believed relevant, the Board ultimately concluded that the advisory fee structures are fair and reasonable, and that the fund's Advisory Contracts should be renewed.
Annual Report
Investment Adviser
Fidelity Management & Research Company
Boston, MA
Investment Sub-Advisers
FMR Co., Inc.
Fidelity Management & Research (U.K.) Inc.
Fidelity Investments Money Management, Inc.
Fidelity Management & Research
(Hong Kong) Limited
Fidelity Management & Research
(Japan) Inc.
General Distributor
Fidelity Distributors Corporation
Smithfield, RI
Transfer and Service Agents
Fidelity Investments Institutional Operations Company, Inc.
Boston, MA
Fidelity Service Company, Inc.
Boston, MA
Custodian
JPMorgan Chase Bank
New York, NY
VIPAM-ANN-0214
1.540206.116
Fidelity® Variable Insurance Products:
Asset Manager: Growth Portfolio
Annual Report
December 31, 2013
(Fidelity Cover Art)
Contents
Performance | (Click Here) | How the fund has done over time. |
Management's Discussion of Fund Performance | (Click Here) | The Portfolio Manager's review of fund performance and strategy. |
Shareholder Expense Example | (Click Here) | An example of shareholder expenses. |
Investment Changes | (Click Here) | A summary of major shifts in the fund's investments over the past six months. |
Investments | (Click Here) | A complete list of the fund's investments with their market values. |
Financial Statements | (Click Here) | Statements of assets and liabilities, operations, and changes in net assets, as well as financial highlights. |
Notes | (Click Here) | Notes to the financial statements. |
Report of Independent Registered Public Accounting Firm | (Click Here) | |
Trustees and Officers | (Click Here) | |
Distributions | (Click Here) | |
Board Approval of Investment Advisory Contracts and Management Fees | (Click Here) | |
To view a fund's proxy voting guidelines and proxy voting record for the 12-month period ended June 30, visit http://www.fidelity.com/proxyvotingresults or visit the Securities and Exchange Commission's (SEC) web site at http://www.sec.gov. You may also call 1-877-208-0098 to request a free copy of the proxy voting guidelines.
Fidelity Variable Insurance Products are separate account options which are purchased through a variable insurance contract.
Standard & Poor's, S&P and S&P 500 are registered service marks of The McGraw-Hill Companies, Inc. and have been licensed for use by Fidelity Distributors Corporation.
Other third-party marks appearing herein are the property of their respective owners.
All other marks appearing herein are registered or unregistered trademarks or service marks of FMR LLC or an affiliated company. © 2014 FMR LLC. All rights reserved.
This report and the financial statements contained herein are submitted for the general information of the shareholders of the fund. This report is not authorized for distribution to prospective investors in the fund unless preceded or accompanied by an effective prospectus.
A fund files its complete schedule of portfolio holdings with the SEC for the first and third quarters of each fiscal year on Form N-Q. Forms N-Q are available on the SEC's web site at http://www.sec.gov. A fund's Forms N-Q may be reviewed and copied at the SEC's Public Reference Room in Washington, DC. Information regarding the operation of the SEC's Public Reference Room may be obtained by calling 1-800-SEC-0330. For a complete list of a fund's portfolio holdings, view the most recent holdings listings, semiannual report, or annual report on Fidelity's web site at http://www.fidelity.com, http://www.advisor.fidelity.com, or http://www.401k.com, as applicable.
NOT FDIC INSURED • MAY LOSE VALUE • NO BANK GUARANTEE
Neither the fund nor Fidelity Distributors Corporation is a bank.
Annual Report
Average annual total return reflects the change in the value of an investment, assuming reinvestment of the class' distributions from dividend income and capital gains (the profits earned upon the sale of securities that have grown in value, if any) and assuming a constant rate of performance each year. During periods of reimbursement by Fidelity, a fund's total return will be greater than it would be had the reimbursement not occurred. Performance numbers are net of all underlying fund operating expenses, but do not include any insurance charges imposed by your insurance company's separate account. If performance information included the effect of these additional charges, the total returns would have been lower. How a fund did yesterday is no guarantee of how it will do tomorrow.
Average Annual Total Returns
Periods ended December 31, 2013 | Past 1
year | Past 5
years | Past 10
years |
VIP Asset Manager: Growth Portfolio - Initial Class | 22.41% | 15.44% | 6.31% |
VIP Asset Manager: Growth Portfolio - Service Class | 22.34% | 15.33% | 6.20% |
VIP Asset Manager: Growth Portfolio - Service Class 2 | 22.09% | 15.12% | 6.00% |
VIP Asset Manager: Growth Portfolio - Investor Class A | 22.30% | 15.33% | 6.21% |
A The initial offering of Investor Class shares took place on July 21, 2005. Returns prior to July 21, 2005, are those of Initial Class. Had Investor Class's transfer agent fee been reflected, returns prior to July 21, 2005, would have been lower.
$10,000 Over 10 Years
Let's say hypothetically that $10,000 was invested in VIP Asset Manager: Growth Portfolio - Initial Class on December 31, 2003. The chart shows how the value of your investment would have changed, and also shows how the S&P 500® Index performed over the same period.
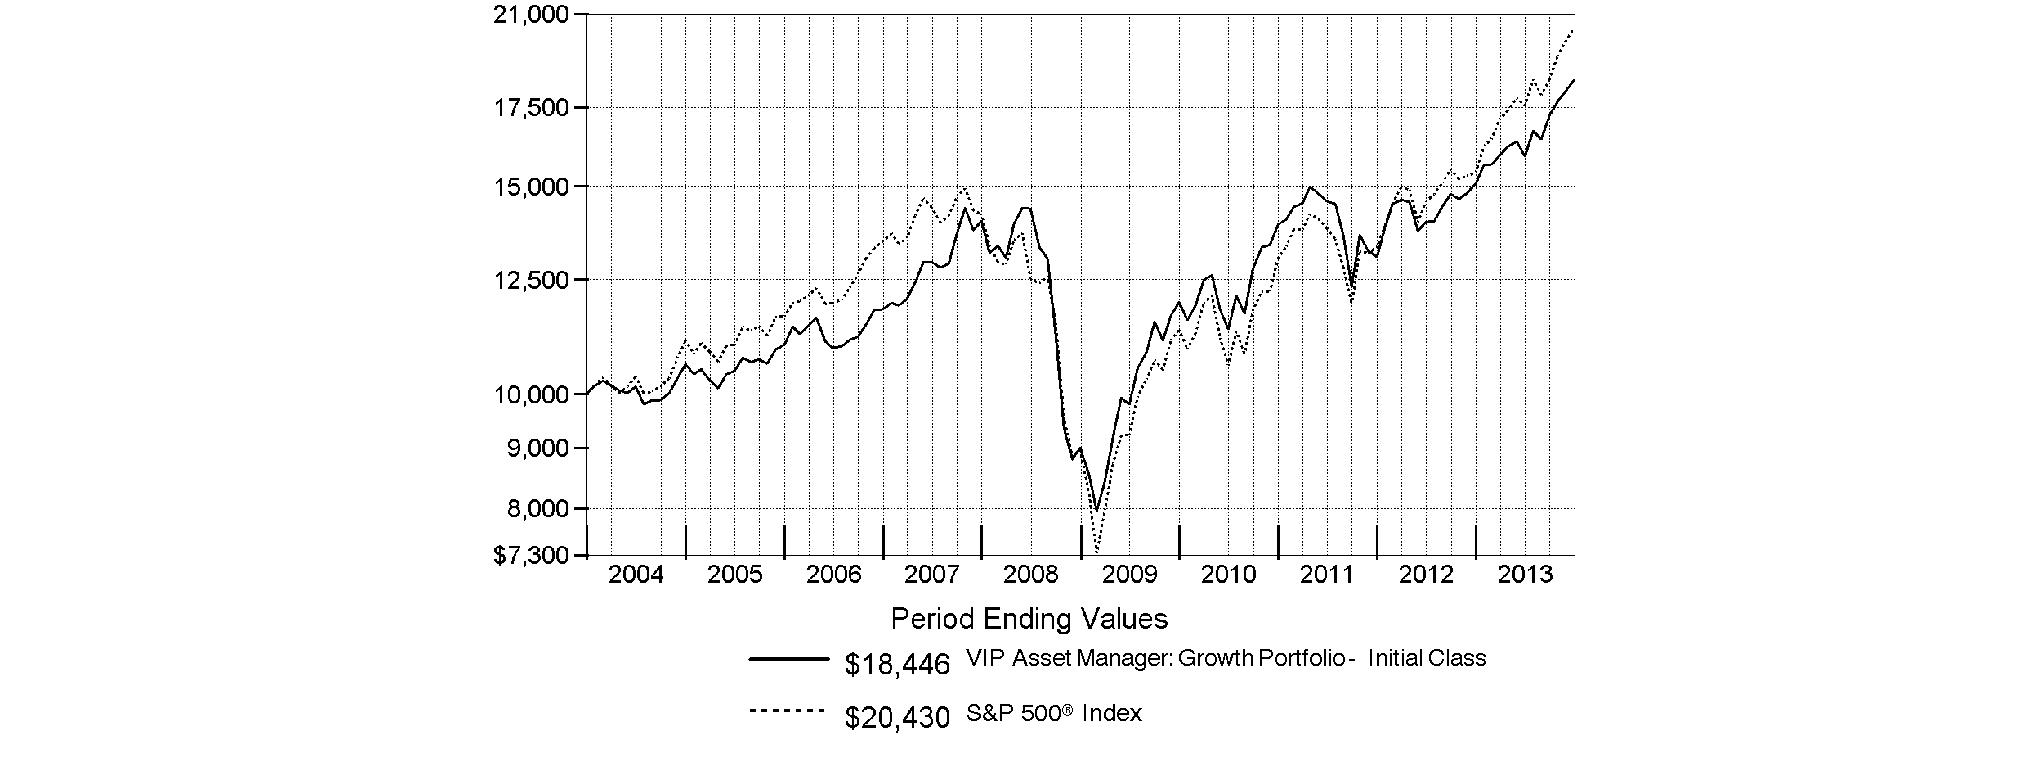
Annual Report
Market Recap: Global equity markets remained upbeat for the 12 months ending December 31, 2013, propelling the MSCI® ACWI® (All Country World Index) Index to a 23.24% return. Midyear turbulence gave way by autumn when policymakers in the U.S. and China had made clear their intentions to maintain accommodative monetary policies. That stance, combined with modest cyclical improvement around the globe and generally low valuations, underpinned the broad rally in equities, although the relative strength of the U.S. dollar generally tempered gains for U.S. investors holding foreign securities based in local currencies. During the period, the broad-market S&P 500® Index set a series of new highs, finishing the year up 32.39%. For the first time since 1995, the S&P® scored a "perfect 10," with all 10 economic sectors gaining at least 10% for the year. A resurgence in growth-oriented stocks lifted the Nasdaq Composite Index® to a 40.12% result for 2013, while the blue-chip Dow Jones Industrial AverageSM notched a relatively more modest 29.65% gain. International developed-markets equities rose in concert with their U.S. counterparts, with the MSCI® EAFE® Index gaining 22.92% for the period. Meanwhile, foreign exchange and commodity weakness curbed results in resource-heavy emerging markets (EM), especially in the year's waning months. More generally, concern over EM's slowing growth, its declining share of global trade and uncertainty surrounding U.S. central bank intentions were all factors hampering performance. The MSCI Emerging Markets Index returned -2.27% for the period. On the bond side, U.S. high-yield securities rallied with equities for much of the period, with The BofA Merrill LynchSM US High Yield Constrained Index returning 7.41% for 2013. The more rate-sensitive U.S. investment-grade bond category faced headwinds though, as reflected in the -2.02% return of the Barclays® U.S. Aggregate Bond Index. Within the Barclays index, investment-grade corporate credit returned -2.01%, while ultra-safe U.S. Treasuries saw a -2.75% result. Major non-U.S. developed markets performed only slightly better, with the Citigroup Non-USD Group-of-Seven (G7) Equal Weighted Index logging a -1.59% result. After several years of strong advances, EM debt reversed course in 2013, with the J.P. Morgan Emerging Markets Bond Index Global returning -6.58%.
Comments from Geoff Stein, Lead Portfolio Manager of VIP Asset Manager: Growth Portfolio: For the year, the fund's share classes outpaced the 19.91% return of the Fidelity Asset Manager 70% Composite IndexSM. (For specific portfolio results, please see the performance section of this report.) Strong domestic stock picks fueled the fund's performance versus the index, complemented by favorable investment-grade bond selections. The domestic equity subportfolio, which is run by Bob Bertelson, outpaced the S&P 500® Index by a healthy margin. A strong, upwardly trending market rewarded Bob's emphasis on companies with the potential for rapid earnings growth. Moreover, he did a great job selecting stocks across multiple sectors, most notably in financials, industrials and health care. From an asset-allocation perspective, underweighting both investment-grade bonds and cash provided the biggest boost, followed by an overweighting in U.S. stocks. The fund's developed-markets equities positioning - overweighting domestic and underweighting foreign - helped, but having a meaningful allocation to poor-performing emerging-markets (EM) stocks during the period's first half overwhelmed the benefit of this positioning. As for our fixed-income allocation strategy, underweighting investment-grade bonds and cash worked particularly well, but was partially offset by a poor result in Treasury Inflation-Protected Securities (TIPS). In May and June, as interest rates rose and inflation expectations fell, TIPS sold off relative to Treasuries of comparable maturity, leading me to reduce the fund's TIPS position. Other allocation shifts included decreasing the fund's EM equities stake to about 2% of the portfolio and redeploying those proceeds to increase our foreign developed-markets equities allocation. Additionally, following the May-to-June bond market sell-off, I increased our investment-grade bond allocation to roughly 23% of the portfolio, which is slightly below neutral versus the index.
The views expressed above reflect those of the portfolio manager(s) only through the end of the period as stated on the cover of this report and do not necessarily represent the views of Fidelity or any other person in the Fidelity organization. Any such views are subject to change at any time based upon market or other conditions and Fidelity disclaims any responsibility to update such views. These views may not be relied on as investment advice and, because investment decisions for a Fidelity fund are based on numerous factors, may not be relied on as an indication of trading intent on behalf of any Fidelity fund.
Annual Report
As a shareholder of the Fund, you incur two types of costs: (1) transaction costs, and (2) ongoing costs, including management fees, distribution and/or service (12b-1) fees and other Fund expenses. This Example is intended to help you understand your ongoing costs (in dollars) of investing in the Fund and to compare these costs with the ongoing costs of investing in other mutual funds.
The Example is based on an investment of $1,000 invested at the beginning of the period and held for the entire period (July 1, 2013 to December 31, 2013).
Actual Expenses
The first line of the accompanying table for each class of the Fund provides information about actual account values and actual expenses. You may use the information in this line, together with the amount you invested, to estimate the expenses that you paid over the period. Simply divide your account value by $1,000.00 (for example, an $8,600 account value divided by $1,000.00 = 8.6), then multiply the result by the number in the first line for a class of the Fund under the heading entitled "Expenses Paid During Period" to estimate the expenses you paid on your account during this period. The estimate of expenses does not include any fees or other expenses of any variable annuity or variable life insurance product. If they were, the estimate of expenses you paid during the period would be higher, and your ending account value would be lower. In addition, the Fund, as a shareholder in the underlying Fidelity Central Funds, will indirectly bear its pro-rata share of the fees and expenses incurred by the underlying Fidelity Central Funds. These fees and expenses are not included in the Fund's annualized expense ratio used to calculate the expense estimate in the table below.
Hypothetical Example for Comparison Purposes
The second line of the accompanying table for each class of the Fund provides information about hypothetical account values and hypothetical expenses based on a Class' actual expense ratio and an assumed rate of return of 5% per year before expenses, which is not the Class' actual return. The hypothetical account values and expenses may not be used to estimate the actual ending account balance or expenses you paid for the period. You may use this information to compare the ongoing costs of investing in the Fund and other funds. To do so, compare this 5% hypothetical example with the 5% hypothetical examples that appear in the shareholder reports of the other funds. The estimate of expenses does not include any fees or other expenses of any variable annuity or variable life insurance product. If they were, the estimate of expenses you paid during the period would be higher, and your ending account value would be lower. In addition, the Fund, as a shareholder in the underlying Fidelity Central Funds, will indirectly bear its pro-rata share of the fees and expenses incurred by the underlying Fidelity Central Funds. These fees and expenses are not included in the Fund's annualized expense ratio used to calculate the expense estimate in the table below.
Please note that the expenses shown in the table are meant to highlight your ongoing costs only and do not reflect any transaction costs. Therefore, the second line of the table is useful in comparing ongoing costs only, and will not help you determine the relative total costs of owning different funds.
| Annualized
Expense RatioB | Beginning
Account Value
July 1, 2013 | Ending
Account Value
December 31, 2013 | Expenses Paid
During Period*
July 1, 2013
to December 31, 2013 |
Initial Class | .71% | | | |
Actual | | $ 1,000.00 | $ 1,160.10 | $ 3.87 |
HypotheticalA | | $ 1,000.00 | $ 1,021.63 | $ 3.62 |
Service Class | .81% | | | |
Actual | | $ 1,000.00 | $ 1,159.80 | $ 4.41 |
HypotheticalA | | $ 1,000.00 | $ 1,021.12 | $ 4.13 |
Service Class 2 | 1.02% | | | |
Actual | | $ 1,000.00 | $ 1,158.60 | $ 5.55 |
HypotheticalA | | $ 1,000.00 | $ 1,020.06 | $ 5.19 |
Investor Class | .79% | | | |
Actual | | $ 1,000.00 | $ 1,159.60 | $ 4.30 |
HypotheticalA | | $ 1,000.00 | $ 1,021.22 | $ 4.02 |
A 5% return per year before expenses
B Annualized expense ratio reflects expenses net of applicable fee waivers.
* Expenses are equal to each Class' annualized expense ratio, multiplied by the average account value over the period, multiplied by 184/365 (to reflect the one-half year period). The fees and expenses of the underlying Fidelity Central Funds in which the Fund invests are not included in each Class' annualized expense ratio.
In addition to the expenses noted above, the Fund also indirectly bears its proportional share of the expenses of the underlying Fidelity Central Funds. Annualized expenses of the underlying non-money market Fidelity Central Funds as of their most recent fiscal half year ranged from less than .01% to .16%.
Annual Report
Investment Changes (Unaudited)
The information in the following tables is based on the combined investments of the Fund and its pro-rata share of the investments of Fidelity's Central Funds, other than the Money Market Central Funds.
Top Ten Stocks as of December 31, 2013 |
| % of fund's
net assets | % of fund's net assets
6 months ago |
Apple, Inc. | 2.4 | 2.5 |
Bank of America Corp. | 1.2 | 1.2 |
Gilead Sciences, Inc. | 1.2 | 1.1 |
Google, Inc. Class A | 0.9 | 1.3 |
Comcast Corp. Class A | 0.9 | 1.0 |
American Airlines Group, Inc. | 0.8 | 0.8 |
Biogen Idec, Inc. | 0.8 | 0.9 |
Monster Beverage Corp. | 0.8 | 0.8 |
Pioneer Natural Resources Co. | 0.7 | 0.9 |
Ocwen Financial Corp. | 0.7 | 0.4 |
| 10.4 | |
Market Sectors as of December 31, 2013 |
(stocks only) | % of fund's
net assets | % of fund's net assets
6 months ago |
Consumer Discretionary | 16.8 | 18.1 |
Financials | 12.6 | 11.2 |
Health Care | 11.1 | 12.1 |
Information Technology | 8.7 | 8.0 |
Energy | 6.9 | 7.8 |
Industrials | 6.6 | 5.4 |
Consumer Staples | 3.8 | 4.2 |
Materials | 2.8 | 3.7 |
Telecommunication Services | 1.6 | 1.3 |
Utilities | 0.7 | 0.8 |
Asset Allocation (% of fund's net assets) |
As of December 31, 2013 * | As of June 30, 2013 ** |
 | Stock Class andEquity Futures 74.5% | | | Stock Class andEquity Futures 72.9% | |
 | Bond Class 22.5% | | | Bond Class 25.1% | |
 | Short-Term Class 3.0% | | | Short-Term Class 2.0% | |
* Foreign investments | 30.7% | | ** Foreign investments | 26.2% | |

Asset allocations in the pie charts reflect the categorization of assets as defined in the Fund's prospectus in effect as of the time periods indicated above. Financial Statement categorizations conform to accounting standards and will differ from the pie chart. Percentages are adjusted for the effect of futures contracts and swap contracts, if applicable. |
Percentages in the above tables are adjusted for the effect of TBA Sale Commitments. |
An unaudited holdings listing for the Fund, which presents direct holdings as well as the pro-rata share of any securities and other investments held indirectly through its investment in underlying non-money market Fidelity Central Funds, is available at advisor.fidelity.com. |
Annual Report
Investments December 31, 2013
Showing Percentage of Net Assets
Common Stocks - 50.2% |
| Shares | | Value |
CONSUMER DISCRETIONARY - 14.4% |
Auto Components - 0.7% |
BorgWarner, Inc. | 7,000 | | $ 391,370 |
Delphi Automotive PLC | 16,800 | | 1,010,184 |
| | 1,401,554 |
Automobiles - 0.4% |
General Motors Co. (a) | 18,300 | | 747,921 |
Diversified Consumer Services - 0.2% |
Estacio Participacoes SA | 47,700 | | 416,369 |
Hotels, Restaurants & Leisure - 1.0% |
Alsea S.A.B. de CV | 72,800 | | 229,255 |
Chipotle Mexican Grill, Inc. (a) | 1,900 | | 1,012,282 |
Fiesta Restaurant Group, Inc. (a) | 5,600 | | 292,544 |
Las Vegas Sands Corp. | 5,600 | | 441,672 |
| | 1,975,753 |
Household Durables - 2.0% |
Barratt Developments PLC | 32,100 | | 185,514 |
Bellway PLC | 11,500 | | 298,982 |
D.R. Horton, Inc. | 39,900 | | 890,568 |
KB Home (d) | 43,200 | | 789,696 |
PulteGroup, Inc. | 48,500 | | 987,945 |
Taylor Morrison Home Corp. | 10,300 | | 231,235 |
Toll Brothers, Inc. (a) | 13,000 | | 481,000 |
| | 3,864,940 |
Internet & Catalog Retail - 0.7% |
priceline.com, Inc. (a) | 1,100 | | 1,278,640 |
Media - 4.7% |
AMC Networks, Inc. Class A (a) | 2,200 | | 149,842 |
CBS Corp. Class B | 21,000 | | 1,338,540 |
Comcast Corp. Class A | 32,800 | | 1,704,452 |
Interpublic Group of Companies, Inc. | 21,800 | | 385,860 |
ITV PLC | 153,200 | | 492,162 |
Naspers Ltd. Class N | 5,300 | | 553,751 |
Sirius XM Holdings, Inc. | 154,500 | | 539,205 |
The Walt Disney Co. | 14,300 | | 1,092,520 |
Time Warner, Inc. | 16,900 | | 1,178,268 |
Twenty-First Century Fox, Inc. Class A | 37,900 | | 1,333,322 |
Viacom, Inc. Class A | 4,300 | | 377,411 |
| | 9,145,333 |
Multiline Retail - 0.5% |
Macy's, Inc. | 17,800 | | 950,520 |
Specialty Retail - 2.3% |
Cabela's, Inc. Class A (a) | 7,800 | | 519,948 |
Conn's, Inc. (a)(d) | 9,500 | | 748,505 |
GNC Holdings, Inc. | 15,900 | | 929,355 |
Home Depot, Inc. | 6,900 | | 568,146 |
Lowe's Companies, Inc. | 6,700 | | 331,985 |
TJX Companies, Inc. | 21,300 | | 1,357,449 |
| | 4,455,388 |
|
| Shares | | Value |
Textiles, Apparel & Luxury Goods - 1.9% |
adidas AG | 3,200 | | $ 407,824 |
Coach, Inc. | 1,900 | | 106,647 |
Deckers Outdoor Corp. (a) | 9,400 | | 793,924 |
Michael Kors Holdings Ltd. (a) | 12,559 | | 1,019,665 |
Prada SpA | 28,200 | | 250,932 |
PVH Corp. | 3,000 | | 408,060 |
VF Corp. | 10,000 | | 623,400 |
| | 3,610,452 |
TOTAL CONSUMER DISCRETIONARY | | 27,846,870 |
CONSUMER STAPLES - 1.4% |
Beverages - 0.8% |
Fomento Economico Mexicano S.A.B. de CV unit | 14,400 | | 140,522 |
Monster Beverage Corp. (a) | 19,200 | | 1,301,184 |
| | 1,441,706 |
Food Products - 0.6% |
Green Mountain Coffee Roasters, Inc. | 15,700 | | 1,186,606 |
TOTAL CONSUMER STAPLES | | 2,628,312 |
ENERGY - 5.4% |
Energy Equipment & Services - 0.6% |
Halliburton Co. | 13,700 | | 695,275 |
Helmerich & Payne, Inc. | 4,800 | | 403,584 |
| | 1,098,859 |
Oil, Gas & Consumable Fuels - 4.8% |
Anadarko Petroleum Corp. | 14,900 | | 1,181,868 |
Cabot Oil & Gas Corp. | 16,300 | | 631,788 |
Cimarex Energy Co. | 5,600 | | 587,496 |
Cobalt International Energy, Inc. (a) | 12,500 | | 205,625 |
Concho Resources, Inc. (a) | 12,400 | | 1,339,200 |
Continental Resources, Inc. (a) | 9,800 | | 1,102,696 |
EOG Resources, Inc. | 7,800 | | 1,309,152 |
Genel Energy PLC (a) | 18,400 | | 327,547 |
Hess Corp. | 11,100 | | 921,300 |
Pioneer Natural Resources Co. | 7,800 | | 1,435,746 |
Sanchez Energy Corp. (a) | 7,700 | | 188,727 |
| | 9,231,145 |
TOTAL ENERGY | | 10,330,004 |
FINANCIALS - 7.0% |
Capital Markets - 2.6% |
Apollo Global Management LLC Class A | 36,000 | | 1,137,960 |
BlackRock, Inc. Class A | 2,800 | | 886,116 |
Charles Schwab Corp. | 7,700 | | 200,200 |
KKR & Co. LP | 29,900 | | 727,766 |
Morgan Stanley | 31,500 | | 987,840 |
The Blackstone Group LP | 30,300 | | 954,450 |
| | 4,894,332 |
Common Stocks - continued |
| Shares | | Value |
FINANCIALS - continued |
Commercial Banks - 0.4% |
Societe Generale Series A | 7,600 | | $ 441,424 |
UniCredit SpA | 32,900 | | 243,502 |
| | 684,926 |
Consumer Finance - 0.2% |
Springleaf Holdings, Inc. | 12,100 | | 305,888 |
Diversified Financial Services - 2.1% |
Bank of America Corp. | 150,200 | | 2,338,614 |
CBOE Holdings, Inc. | 9,800 | | 509,208 |
Citigroup, Inc. | 24,200 | | 1,261,062 |
| | 4,108,884 |
Real Estate Investment Trusts - 0.3% |
American Tower Corp. | 7,900 | | 630,578 |
Real Estate Management & Development - 0.7% |
Altisource Asset Management Corp. (a) | 450 | | 418,500 |
Altisource Portfolio Solutions SA | 3,900 | | 618,657 |
Altisource Residential Corp. Class B | 12,900 | | 388,419 |
| | 1,425,576 |
Thrifts & Mortgage Finance - 0.7% |
Ocwen Financial Corp. (a) | 25,800 | | 1,430,610 |
TOTAL FINANCIALS | | 13,480,794 |
HEALTH CARE - 9.1% |
Biotechnology - 6.4% |
Acorda Therapeutics, Inc. (a) | 9,900 | | 289,080 |
Actelion Ltd. | 3,381 | | 285,588 |
Aegerion Pharmaceuticals, Inc. (a) | 7,700 | | 546,392 |
Alexion Pharmaceuticals, Inc. (a) | 7,600 | | 1,011,256 |
Alnylam Pharmaceuticals, Inc. (a) | 100 | | 6,433 |
Amgen, Inc. | 11,000 | | 1,255,760 |
ARIAD Pharmaceuticals, Inc. (a) | 40,700 | | 277,574 |
Biogen Idec, Inc. (a) | 5,600 | | 1,566,600 |
BioMarin Pharmaceutical, Inc. (a) | 6,800 | | 477,836 |
Celldex Therapeutics, Inc. (a) | 7,000 | | 169,470 |
Clovis Oncology, Inc. (a) | 2,100 | | 126,567 |
Genmab A/S (a) | 4,700 | | 183,744 |
Gilead Sciences, Inc. (a) | 30,300 | | 2,277,045 |
Infinity Pharmaceuticals, Inc. (a) | 3,100 | | 42,811 |
Intercept Pharmaceuticals, Inc. (a) | 3,730 | | 254,684 |
InterMune, Inc. (a) | 20,900 | | 307,857 |
KYTHERA Biopharmaceuticals, Inc. (a) | 5,600 | | 208,600 |
Medivation, Inc. (a) | 20,200 | | 1,289,164 |
Pharmacyclics, Inc. (a) | 3,500 | | 370,230 |
Regeneron Pharmaceuticals, Inc. (a) | 1,600 | | 440,384 |
Synageva BioPharma Corp. (a) | 7,800 | | 504,816 |
United Therapeutics Corp. (a) | 3,400 | | 384,472 |
| | 12,276,363 |
Health Care Equipment & Supplies - 0.1% |
Edwards Lifesciences Corp. (a) | 2,900 | | 190,704 |
|
| Shares | | Value |
Health Care Providers & Services - 0.2% |
Community Health Systems, Inc. | 11,800 | | $ 463,386 |
Health Care Technology - 0.2% |
athenahealth, Inc. (a) | 1,200 | | 161,400 |
Medidata Solutions, Inc. (a) | 2,200 | | 133,254 |
| | 294,654 |
Life Sciences Tools & Services - 0.4% |
Illumina, Inc. (a) | 7,200 | | 796,464 |
Pharmaceuticals - 1.8% |
Actavis PLC (a) | 2,700 | | 453,600 |
Jazz Pharmaceuticals PLC (a) | 5,500 | | 696,080 |
Pacira Pharmaceuticals, Inc. (a) | 9,700 | | 557,653 |
Salix Pharmaceuticals Ltd. (a) | 4,500 | | 404,730 |
Shire PLC sponsored ADR | 2,800 | | 395,612 |
Valeant Pharmaceuticals International (Canada) (a) | 8,106 | | 950,972 |
| | 3,458,647 |
TOTAL HEALTH CARE | | 17,480,218 |
INDUSTRIALS - 3.9% |
Aerospace & Defense - 1.0% |
European Aeronautic Defence and Space Co. (EADS) NV | 6,600 | | 506,734 |
The Boeing Co. | 10,400 | | 1,419,496 |
| | 1,926,230 |
Airlines - 2.3% |
American Airlines Group, Inc. (a)(d) | 65,300 | | 1,648,825 |
Copa Holdings SA Class A | 2,000 | | 320,220 |
Delta Air Lines, Inc. | 35,000 | | 961,450 |
Southwest Airlines Co. | 32,300 | | 608,532 |
United Continental Holdings, Inc. (a) | 24,785 | | 937,617 |
| | 4,476,644 |
Electrical Equipment - 0.4% |
Eaton Corp. PLC | 9,400 | | 715,528 |
Professional Services - 0.2% |
Bureau Veritas SA | 12,600 | | 368,257 |
TOTAL INDUSTRIALS | | 7,486,659 |
INFORMATION TECHNOLOGY - 7.5% |
Communications Equipment - 0.2% |
Alcatel-Lucent SA sponsored ADR | 90,800 | | 399,520 |
Computers & Peripherals - 2.8% |
3D Systems Corp. (a)(d) | 2,150 | | 199,800 |
Apple, Inc. | 8,000 | | 4,488,878 |
Nimble Storage, Inc. | 4,700 | | 212,910 |
SanDisk Corp. | 6,100 | | 430,294 |
| | 5,331,882 |
Internet Software & Services - 2.6% |
Bankrate, Inc. (a) | 29,500 | | 529,230 |
Cornerstone OnDemand, Inc. (a) | 9,500 | | 506,730 |
Common Stocks - continued |
| Shares | | Value |
INFORMATION TECHNOLOGY - continued |
Internet Software & Services - continued |
Facebook, Inc. Class A (a) | 22,880 | | $ 1,250,621 |
Google, Inc. Class A (a) | 1,600 | | 1,793,136 |
Kakaku.com, Inc. | 6,000 | | 105,398 |
Naver Corp. | 650 | | 445,760 |
Tencent Holdings Ltd. | 4,800 | | 306,163 |
Twitter, Inc. (d) | 1,400 | | 89,110 |
| | 5,026,148 |
IT Services - 1.4% |
Cognizant Technology Solutions Corp. Class A (a) | 5,500 | | 555,390 |
FleetCor Technologies, Inc. (a) | 6,600 | | 773,322 |
QIWI PLC Class B sponsored ADR | 4,100 | | 229,600 |
Visa, Inc. Class A | 5,000 | | 1,113,400 |
| | 2,671,712 |
Semiconductors & Semiconductor Equipment - 0.4% |
Freescale Semiconductor Holdings I Ltd. (a) | 20,700 | | 332,235 |
NXP Semiconductors NV (a) | 9,700 | | 445,521 |
| | 777,756 |
Software - 0.1% |
CommVault Systems, Inc. (a) | 2,200 | | 164,736 |
TOTAL INFORMATION TECHNOLOGY | | 14,371,754 |
MATERIALS - 1.1% |
Chemicals - 1.1% |
Eastman Chemical Co. | 9,700 | | 782,790 |
Huntsman Corp. | 13,900 | | 341,940 |
LyondellBasell Industries NV Class A | 13,400 | | 1,075,752 |
| | 2,200,482 |
TELECOMMUNICATION SERVICES - 0.4% |
Wireless Telecommunication Services - 0.4% |
SBA Communications Corp. Class A (a) | 5,600 | | 503,104 |
SoftBank Corp. | 3,200 | | 280,802 |
| | 783,906 |
TOTAL COMMON STOCKS (Cost $62,303,616) |
96,608,999
|
Fixed-Income Funds - 23.8% |
| | | |
Fidelity Floating Rate Central Fund (f) | 16,092 | | 1,729,435 |
Fidelity High Income Central Fund 1 (f) | 34,926 | | 3,610,651 |
Fidelity Inflation-Protected Bond Index Central Fund (f) | 17,828 | | 1,732,704 |
Fidelity VIP Investment Grade Central Fund (f) | 375,337 | | 38,764,800 |
TOTAL FIXED-INCOME FUNDS (Cost $44,972,193) |
45,837,590
|
Equity Funds - 22.5% |
| Shares | | Value |
International Equity Funds - 22.5% |
Fidelity Emerging Markets Equity Central Fund (f) | 18,444 | | $ 3,876,174 |
Fidelity International Equity Central Fund (f) | 475,948 | | 39,332,329 |
TOTAL EQUITY FUNDS (Cost $44,078,634) |
43,208,503
|
U.S. Treasury Obligations - 0.1% |
| Principal Amount | | |
U.S. Treasury Bills, yield at date of purchase 0.02% to 0.04% 1/2/14 to 2/27/14 (e)
(Cost $249,995) | | $ 250,000 | |
249,997
|
Money Market Funds - 5.1% |
| Shares | | |
Fidelity Cash Central Fund, 0.11% (b) | 6,402,783 | | 6,402,783 |
Fidelity Securities Lending Cash Central Fund, 0.11% (b)(c) | 3,486,775 | | 3,486,775 |
TOTAL MONEY MARKET FUNDS (Cost $9,889,558) |
9,889,558
|
TOTAL INVESTMENT PORTFOLIO - 101.7% (Cost $161,493,996) | | 195,794,647 |
NET OTHER ASSETS (LIABILITIES) - (1.7)% | | (3,260,599) |
NET ASSETS - 100% | $ 192,534,048 |
Futures Contracts |
| Expiration Date | | Underlying Face Amount at Value | | Unrealized Appreciation/
(Depreciation) |
Purchased |
Equity Index Contracts |
30 CME E-mini S&P 500 Index Contracts (United States) | March 2014 | | $ 2,761,650 | | $ 108,955 |
19 NYSE E-mini MSCI EAFE Index Contracts (United States) | March 2014 | | 1,821,910 | | 78,814 |
TOTAL EQUITY INDEX CONTRACTS | | $ 4,583,560 | | $ 187,769 |
|
The face value of futures purchased as a percentage of net assets is 2.3% |
Legend |
(a) Non-income producing |
(b) Affiliated fund that is generally available only to investment companies and other accounts managed by Fidelity Investments. The rate quoted is the annualized seven-day yield of the fund at period end. A complete unaudited listing of the fund's holdings as of its most recent quarter end is available upon request. In addition, each Fidelity Central Fund's financial statements, which are not covered by the Fund's Report of Independent Registered Public Accounting Firm, are available on the SEC's website or upon request. |
(c) Investment made with cash collateral received from securities on loan. |
(d) Security or a portion of the security is on loan at period end. |
(e) Security or a portion of the security was pledged to cover margin requirements for futures contracts. At period end, the value of securities pledged amounted to $249,997. |
(f) Affiliated fund that is generally available only to investment companies and other accounts managed by Fidelity Investments. A complete unaudited schedule of portfolio holdings for each Fidelity Central Fund is filed with the SEC for the first and third quarters of each fiscal year on Form N-Q and is available upon request or at the SEC's website at www.sec.gov. An unaudited holdings listing for the Fund, which presents direct holdings as well as the pro-rata share of securities and other investments held indirectly through its investment in underlying non-money market Fidelity Central Funds, is available at advisor.fidelity.com. In addition, each Fidelity Central Fund's financial statements, which are not covered by the Fund's Report of Independent Registered Public Accounting Firm, are available on the SEC's website or upon request. |
Affiliated Central Funds |
Information regarding fiscal year to date income earned by the Fund from investments in Fidelity Central Funds is as follows: |
Fund | Income earned |
Fidelity Cash Central Fund | $ 6,627 |
Fidelity Emerging Markets Debt Central Fund | 25,595 |
Fidelity Emerging Markets Equity Central Fund | 127,050 |
Fidelity Floating Rate Central Fund | 98,916 |
Fidelity High Income Central Fund 1 | 221,520 |
Fidelity Inflation-Protected Bond Index Central Fund | 1 |
Fidelity International Equity Central Fund | 676,358 |
Fidelity Securities Lending Cash Central Fund | 35,765 |
Fidelity VIP Investment Grade Central Fund | 906,824 |
Total | $ 2,098,656 |
Additional information regarding the Fund's fiscal year to date purchases and sales, including the ownership percentage, of the non Money Market Central Funds is as follows: |
Fund | Value, beginning of period | Purchases | Sales
Proceeds | Value,
end of
period | % ownership, end of
period |
Fidelity Commodity Strategy Central Fund | $ 1,583,138 | $ - | $ 1,515,017 | $ - | 0.0% |
Fidelity Emerging Markets Debt Central Fund | 808,859 | 28,170 | 764,289 | - | 0.0% |
Fidelity Emerging Markets Equity Central Fund | 9,027,490 | 279,890 | 4,963,568 | 3,876,174 | 1.7% |
Fidelity Floating Rate Central Fund | 4,048,579 | 98,885 | 2,480,941 | 1,729,435 | 0.1% |
Fidelity High Income Central Fund 1 | 4,042,127 | 221,520 | 680,823 | 3,610,651 | 0.8% |
Fidelity Inflation-Protected Bond Index Central Fund | 4,799,420 | 1,893,693 | 4,717,771 | 1,732,704 | 0.9% |
Fidelity International Equity Central Fund | 21,589,033 | 12,376,812 | 424,720 | 39,332,329 | 1.3% |
Fidelity VIP Investment Grade Central Fund | 28,673,911 | 12,296,480 | 499,456 | 38,764,800 | 1.0% |
Total | $ 74,572,557 | $ 27,195,450 | $ 16,046,585 | $ 89,046,093 | |
Other Information |
The following is a summary of the inputs used, as of December 31, 2013, involving the Fund's assets and liabilities carried at fair value. The inputs or methodology used for valuing securities may not be an indication of the risk associated with investing in those securities. For more information on valuation inputs, and their aggregation into the levels used in the table below, please refer to the Investment Valuation section in the accompanying Notes to Financial Statements. |
Valuation Inputs at Reporting Date: |
Description | Total | Level 1 | Level 2 | Level 3 |
Investments in Securities: | | | | |
Equities: | | | | |
Consumer Discretionary | $ 27,846,870 | $ 27,201,246 | $ 645,624 | $ - |
Consumer Staples | 2,628,312 | 2,487,790 | 140,522 | - |
Energy | 10,330,004 | 10,330,004 | - | - |
Financials | 13,480,794 | 13,480,794 | - | - |
Health Care | 17,480,218 | 17,480,218 | - | - |
Industrials | 7,486,659 | 7,486,659 | - | - |
Information Technology | 14,371,754 | 14,266,356 | 105,398 | - |
Materials | 2,200,482 | 2,200,482 | - | - |
Telecommunication Services | 783,906 | 503,104 | 280,802 | - |
U.S. Government and Government Agency Obligations | 249,997 | - | 249,997 | - |
Fixed-Income Funds | 45,837,590 | 45,837,590 | - | - |
Money Market Funds | 9,889,558 | 9,889,558 | - | - |
Equity Funds | 43,208,503 | 43,208,503 | - | - |
Total Investments in Securities: | $ 195,794,647 | $ 194,372,304 | $ 1,422,343 | $ - |
Derivative Instruments: | | | | |
Assets | | | | |
Futures Contracts | $ 187,769 | $ 187,769 | $ - | $ - |
Value of Derivative Instruments |
The following table is a summary of the Fund's value of derivative instruments by primary risk exposure as of December 31, 2013. For additional information on derivative instruments, please refer to the Derivative Instruments section in the accompanying Notes to Financial Statements. |
Primary Risk Exposure /
Derivative Type | Value |
| Asset | Liability |
Equity Risk | | |
Futures Contracts (a) | $ 187,769 | $ - |
Total Value of Derivatives | $ 187,769 | $ - |
(a) Reflects gross cumulative appreciation (depreciation) on futures contracts as presented in the Schedule of Investments. Only the period end receivable or payable for daily variation margin and net unrealized appreciation (depreciation) are presented in the Statement of Assets and Liabilities. |
Other Information |
The information in the following tables is based on the combined investments of the Fund and its pro-rata share of the investments of Fidelity's Central Funds, other than the Money Market Central Funds. Percentages in the below tables are adjusted for the effect of TBA Sale Commitments. |
The composition of credit quality ratings as a percentage of net assets is as follows (Unaudited): |
U.S. Government and U.S. Government Agency Obligations | 11.4% |
AAA,AA,A | 3.0% |
BBB | 5.2% |
BB | 0.9% |
B | 1.4% |
CCC,CC,C | 0.6% |
D | 0.0%* |
Not Rated | 0.2% |
Equities | 71.6% |
Short-Term Investments and Net Other Assets | 5.7% |
| 100.0% |
* Amount represents less than 0.1% |
We have used ratings from Moody's Investors Service, Inc. Where Moody's® ratings are not available, we have used S&P® ratings. All ratings are as of the date indicated and do not reflect subsequent changes. Percentages are adjusted for the effect of futures contracts, if applicable. |
Distribution of investments by country or territory of incorporation, as a percentage of total net assets, is as follows (Unaudited): |
United States of America | 69.3% |
United Kingdom | 4.8% |
Japan | 3.3% |
France | 2.3% |
Germany | 2.3% |
Netherlands | 1.9% |
Switzerland | 1.3% |
Australia | 1.3% |
Ireland | 1.3% |
Bailiwick of Jersey | 1.1% |
Italy | 1.1% |
Others (Individually Less Than 1%) | 10.0% |
| 100.0% |
See accompanying notes which are an integral part of the financial statements.
Annual Report
Statement of Assets and Liabilities
| December 31, 2013 |
| | |
Assets | | |
Investment in securities, at value (including securities loaned of $3,458,227) - See accompanying schedule: Unaffiliated issuers (cost $62,553,611) | $ 96,858,996 | |
Fidelity Central Funds (cost $98,940,385) | 98,935,651 | |
Total Investments (cost $161,493,996) | | $ 195,794,647 |
Cash | | 122,142 |
Receivable for investments sold | | 101,617 |
Receivable for fund shares sold | | 92,701 |
Dividends receivable | | 43,676 |
Distributions receivable from Fidelity Central Funds | | 8,587 |
Receivable for daily variation margin for derivative instruments | | 14,825 |
Prepaid expenses | | 382 |
Other receivables | | 1,458 |
Total assets | | 196,180,035 |
| | |
Liabilities | | |
Payable for investments purchased | $ 6,441 | |
Payable for fund shares redeemed | 7,220 | |
Accrued management fee | 86,162 | |
Distribution and service plan fees payable | 1,001 | |
Other affiliated payables | 21,912 | |
Other payables and accrued expenses | 36,476 | |
Collateral on securities loaned, at value | 3,486,775 | |
Total liabilities | | 3,645,987 |
| | |
Net Assets | | $ 192,534,048 |
Net Assets consist of: | | |
Paid in capital | | $ 169,343,891 |
Undistributed net investment income | | 5,163 |
Accumulated undistributed net realized gain (loss) on investments and foreign currency transactions | | (11,303,402) |
Net unrealized appreciation (depreciation) on investments and assets and liabilities in foreign currencies | | 34,488,396 |
Net Assets | | $ 192,534,048 |
Statement of Assets and Liabilities - continued
| December 31, 2013 |
| | |
Initial Class:
Net Asset Value, offering price and redemption price per share ($127,422,919 ÷ 6,964,445 shares) | | $ 18.30 |
| | |
Service Class:
Net Asset Value, offering price and redemption price per share ($3,190,666 ÷ 175,446 shares) | | $ 18.19 |
| | |
Service Class 2:
Net Asset Value, offering price and redemption price per share ($3,625,884 ÷ 200,369 shares) | | $ 18.10 |
| | |
Investor Class:
Net Asset Value, offering price and redemption price per share ($58,294,579 ÷ 3,199,602 shares) | | $ 18.22 |
See accompanying notes which are an integral part of the financial statements.
Annual Report
Statement of Operations
| Year ended December 31, 2013 |
| | |
Investment Income | | |
Dividends | | $ 962,367 |
Interest | | 64 |
Income from Fidelity Central Funds | | 2,098,656 |
Total income | | 3,061,087 |
| | |
Expenses | | |
Management fee | $ 962,985 | |
Transfer agent fees | 167,048 | |
Distribution and service plan fees | 12,396 | |
Accounting and security lending fees | 85,741 | |
Custodian fees and expenses | 22,704 | |
Independent trustees' compensation | 682 | |
Audit | 49,241 | |
Legal | 1,016 | |
Miscellaneous | 1,151 | |
Total expenses before reductions | 1,302,964 | |
Expense reductions | (16,640) | 1,286,324 |
Net investment income (loss) | | 1,774,763 |
Realized and Unrealized Gain (Loss) Net realized gain (loss) on: | | |
Investment securities: | | |
Unaffiliated issuers | 11,619,764 | |
Fidelity Central Funds | 1,170,405 | |
Foreign currency transactions | (4,131) | |
Futures contracts | 241,336 | |
Capital gain distributions from Fidelity Central Funds | 333,481 | |
Total net realized gain (loss) | | 13,360,855 |
Change in net unrealized appreciation (depreciation) on: Investment securities | 19,969,526 | |
Assets and liabilities in foreign currencies | 67 | |
Futures contracts | 186,455 | |
Total change in net unrealized appreciation (depreciation) | | 20,156,048 |
Net gain (loss) | | 33,516,903 |
Net increase (decrease) in net assets resulting from operations | | $ 35,291,666 |
Statement of Changes in Net Assets
| Year ended
December 31, 2013 | Year ended
December 31, 2012 |
Increase (Decrease) in Net Assets | | |
Operations | | |
Net investment income (loss) | $ 1,774,763 | $ 2,047,482 |
Net realized gain (loss) | 13,360,855 | 5,765,525 |
Change in net unrealized appreciation (depreciation) | 20,156,048 | 15,662,987 |
Net increase (decrease) in net assets resulting from operations | 35,291,666 | 23,475,994 |
Distributions to shareholders from net investment income | (1,787,949) | (2,210,245) |
Distributions to shareholders from net realized gain | (498,676) | (580,372) |
Total distributions | (2,286,625) | (2,790,617) |
Share transactions - net increase (decrease) | (1,458,791) | (18,745,600) |
Total increase (decrease) in net assets | 31,546,250 | 1,939,777 |
| | |
Net Assets | | |
Beginning of period | 160,987,798 | 159,048,021 |
End of period (including undistributed net investment income of $5,163 and distributions in excess of net investment income of $7, respectively) | $ 192,534,048 | $ 160,987,798 |
See accompanying notes which are an integral part of the financial statements.
Annual Report
Financial Highlights - Initial Class
Years ended December 31, | 2013 | 2012 | 2011 | 2010 | 2009 |
Selected Per-Share Data | | | | | |
Net asset value, beginning of period | $ 15.14 | $ 13.35 | $ 14.52 | $ 12.66 | $ 9.68 |
Income from Investment Operations | | | | | |
Net investment income (loss) C | .17 | .19 | .22 | .16 | .17 |
Net realized and unrealized gain (loss) | 3.22 | 1.87 | (1.12) | 1.91 | 3.01 |
Total from investment operations | 3.39 | 2.06 | (.90) | 2.07 | 3.18 |
Distributions from net investment income | (.18) | (.21) | (.24) | (.16) | (.18) |
Distributions from net realized gain | (.05) | (.06) | (.03) | (.05) | (.02) |
Total distributions | (.23) | (.27) | (.27) | (.21) | (.20) |
Net asset value, end of period | $ 18.30 | $ 15.14 | $ 13.35 | $ 14.52 | $ 12.66 |
Total Return A, B | 22.41% | 15.45% | (6.17)% | 16.34% | 32.91% |
Ratios to Average Net Assets D, F | | | | | |
Expenses before reductions | .72% | .72% | .73% | .74% | .78% |
Expenses net of fee waivers, if any | .71% | .72% | .72% | .73% | .78% |
Expenses net of all reductions | .71% | .71% | .71% | .72% | .77% |
Net investment income (loss) | 1.05% | 1.29% | 1.49% | 1.20% | 1.57% |
Supplemental Data | | | | | |
Net assets, end of period (000 omitted) | $ 127,423 | $ 116,252 | $ 113,899 | $ 138,051 | $ 136,479 |
Portfolio turnover rate E | 52% | 59% | 71% | 68% | 126% |
A Total returns do not reflect charges attributable to your insurance company's separate account. Inclusion of these charges would reduce the total returns shown.
B Total returns would have been lower if certain expenses had not been reduced during the applicable periods shown.
C Calculated based on average shares outstanding during the period.
D Fees and expenses of any underlying Fidelity Central Funds are not included in the Fund's expense ratio. The Fund indirectly bears its proportionate share of the expenses of any underlying Fidelity Central Funds. Based on their most recent shareholder report date, the expenses of any underlying non-money market Fidelity Central Funds ranged from less than .01% to .13%.
E Amount does not include the portfolio activity of any underlying Fidelity Central Funds.
F Expense ratios reflect operating expenses of the class. Expenses before reductions do not reflect amounts reimbursed by the investment adviser or reductions from brokerage service arrangements or reductions from other expense offset arrangements and do not represent the amount paid by the class during periods when reimbursements or reductions occur. Expenses net of fee waivers reflect expenses after reimbursement by the investment adviser but prior to reductions from brokerage service arrangements or other expense offset arrangements. Expenses net of all reductions represent the net expenses paid by the class.
Financial Highlights - Service Class
Years ended December 31, | 2013 | 2012 | 2011 | 2010 | 2009 |
Selected Per-Share Data | | | | | |
Net asset value, beginning of period | $ 15.04 | $ 13.26 | $ 14.42 | $ 12.58 | $ 9.62 |
Income from Investment Operations | | | | | |
Net investment income (loss) C | .16 | .17 | .20 | .14 | .16 |
Net realized and unrealized gain (loss) | 3.19 | 1.86 | (1.11) | 1.89 | 2.99 |
Total from investment operations | 3.35 | 2.03 | (.91) | 2.03 | 3.15 |
Distributions from net investment income | (.15) | (.20) | (.22) | (.15) | (.17) |
Distributions from net realized gain | (.05) | (.06) | (.03) | (.05) | (.02) |
Total distributions | (.20) | (.25) G | (.25) | (.19) H | (.19) |
Net asset value, end of period | $ 18.19 | $ 15.04 | $ 13.26 | $ 14.42 | $ 12.58 |
Total Return A, B | 22.34% | 15.34% | (6.26)% | 16.18% | 32.79% |
Ratios to Average Net Assets D, F | | | | | |
Expenses before reductions | .82% | .82% | .83% | .84% | .88% |
Expenses net of fee waivers, if any | .82% | .82% | .82% | .84% | .88% |
Expenses net of all reductions | .81% | .81% | .81% | .82% | .87% |
Net investment income (loss) | .95% | 1.19% | 1.39% | 1.09% | 1.47% |
Supplemental Data | | | | | |
Net assets, end of period (000 omitted) | $ 3,191 | $ 3,541 | $ 5,654 | $ 3,999 | $ 3,838 |
Portfolio turnover rate E | 52% | 59% | 71% | 68% | 126% |
A Total returns do not reflect charges attributable to your insurance company's separate account. Inclusion of these charges would reduce the total returns shown.
B Total returns would have been lower if certain expenses had not been reduced during the applicable periods shown.
C Calculated based on average shares outstanding during the period.
D Fees and expenses of any underlying Fidelity Central Funds are not included in the Fund's expense ratio. The Fund indirectly bears its proportionate share of the expenses of any underlying Fidelity Central Funds. Based on their most recent shareholder report date, the expenses of any underlying non-money market Fidelity Central Funds ranged from less than .01% to .13%.
E Amount does not include the portfolio activity of any underlying Fidelity Central Funds.
F Expense ratios reflect operating expenses of the class. Expenses before reductions do not reflect amounts reimbursed by the investment adviser or reductions from brokerage service arrangements or reductions from other expense offset arrangements and do not represent the amount paid by the class during periods when reimbursements or reductions occur. Expenses net of fee waivers reflect expenses after reimbursement by the investment adviser but prior to reductions from brokerage service arrangements or other expense offset arrangements. Expenses net of all reductions represent the net expenses paid by the class.
G Total distributions of $.25 per share is comprised of distributions from net investment income of $.195 and distributions from net realized gain of $.055 per share.
H Total distributions of $.19 per share is comprised of distributions from net investment income of $.148 and distributions from net realized gain of $.045 per share.
See accompanying notes which are an integral part of the financial statements.
Annual Report
Financial Highlights - Service Class 2
Years ended December 31, | 2013 | 2012 | 2011 | 2010 | 2009 |
Selected Per-Share Data | | | | | |
Net asset value, beginning of period | $ 14.97 | $ 13.21 | $ 14.36 | $ 12.51 | $ 9.57 |
Income from Investment Operations | | | | | |
Net investment income (loss) C | .12 | .14 | .17 | .12 | .14 |
Net realized and unrealized gain (loss) | 3.18 | 1.84 | (1.09) | 1.88 | 2.97 |
Total from investment operations | 3.30 | 1.98 | (.92) | 2.00 | 3.11 |
Distributions from net investment income | (.12) | (.17) | (.20) | (.11) | (.15) |
Distributions from net realized gain | (.05) | (.06) | (.03) | (.05) | (.02) |
Total distributions | (.17) | (.22) G | (.23) | (.15) H | (.17) |
Net asset value, end of period | $ 18.10 | $ 14.97 | $ 13.21 | $ 14.36 | $ 12.51 |
Total Return A, B | 22.09% | 15.03% | (6.39)% | 16.02% | 32.55% |
Ratios to Average Net Assets D, F | | | | | |
Expenses before reductions | 1.03% | 1.04% | 1.01% | 1.02% | 1.06% |
Expenses net of fee waivers, if any | 1.02% | 1.04% | 1.01% | 1.02% | 1.06% |
Expenses net of all reductions | 1.02% | 1.03% | 1.00% | 1.00% | 1.05% |
Net investment income (loss) | .74% | .97% | 1.20% | .91% | 1.29% |
Supplemental Data | | | | | |
Net assets, end of period (000 omitted) | $ 3,626 | $ 3,621 | $ 3,260 | $ 6,046 | $ 8,139 |
Portfolio turnover rate E | 52% | 59% | 71% | 68% | 126% |
A Total returns do not reflect charges attributable to your insurance company's separate account. Inclusion of these charges would reduce the total returns shown.
B Total returns would have been lower if certain expenses had not been reduced during the applicable periods shown.
C Calculated based on average shares outstanding during the period.
D Fees and expenses of any underlying Fidelity Central Funds are not included in the Fund's expense ratio. The Fund indirectly bears its proportionate share of the expenses of any underlying Fidelity Central Funds. Based on their most recent shareholder report date, the expenses of any underlying non-money market Fidelity Central Funds ranged from less than .01% to .13%.
E Amount does not include the portfolio activity of any underlying Fidelity Central Funds.
F Expense ratios reflect operating expenses of the class. Expenses before reductions do not reflect amounts reimbursed by the investment adviser or reductions from brokerage service arrangements or reductions from other expense offset arrangements and do not represent the amount paid by the class during periods when reimbursements or reductions occur. Expenses net of fee waivers reflect expenses after reimbursement by the investment adviser but prior to reductions from brokerage service arrangements or other expense offset arrangements. Expenses net of all reductions represent the net expenses paid by the class.
G Total distributions of $.22 per share is comprised of distributions from net investment income of $.167 and distributions from net realized gain of $.055 per share.
H Total distributions of $.15 per share is comprised of distributions from net investment income of $.108 and distributions from net realized gain of $.045 per share.
Financial Highlights - Investor Class
Years ended December 31, | 2013 | 2012 | 2011 | 2010 | 2009 |
Selected Per-Share Data | | | | | |
Net asset value, beginning of period | $ 15.08 | $ 13.30 | $ 14.46 | $ 12.61 | $ 9.65 |
Income from Investment Operations | | | | | |
Net investment income (loss) C | .16 | .18 | .20 | .15 | .16 |
Net realized and unrealized gain (loss) | 3.20 | 1.86 | (1.10) | 1.90 | 2.99 |
Total from investment operations | 3.36 | 2.04 | (.90) | 2.05 | 3.15 |
Distributions from net investment income | (.17) | (.20) | (.23) | (.15) | (.17) |
Distributions from net realized gain | (.05) | (.06) | (.03) | (.05) | (.02) |
Total distributions | (.22) | (.26) | (.26) | (.20) | (.19) |
Net asset value, end of period | $ 18.22 | $ 15.08 | $ 13.30 | $ 14.46 | $ 12.61 |
Total Return A, B | 22.30% | 15.34% | (6.20)% | 16.25% | 32.68% |
Ratios to Average Net Assets D, F | | | | | |
Expenses before reductions | .80% | .81% | .81% | .83% | .89% |
Expenses net of fee waivers, if any | .80% | .81% | .81% | .82% | .89% |
Expenses net of all reductions | .79% | .79% | .80% | .81% | .87% |
Net investment income (loss) | .97% | 1.21% | 1.41% | 1.11% | 1.47% |
Supplemental Data | | | | | |
Net assets, end of period (000 omitted) | $ 58,295 | $ 37,574 | $ 36,235 | $ 33,627 | $ 26,307 |
Portfolio turnover rate E | 52% | 59% | 71% | 68% | 126% |
A Total returns do not reflect charges attributable to your insurance company's separate account. Inclusion of these charges would reduce the total returns shown.
B Total returns would have been lower if certain expenses had not been reduced during the applicable periods shown.
C Calculated based on average shares outstanding during the period.
D Fees and expenses of any underlying Fidelity Central Funds are not included in the Fund's expense ratio. The Fund indirectly bears its proportionate share of the expenses of any underlying Fidelity Central Funds. Based on their most recent shareholder report date, the expenses of any underlying non-money market Fidelity Central Funds ranged from less than .01% to .13%.
E Amount does not include the portfolio activity of any underlying Fidelity Central Funds.
F Expense ratios reflect operating expenses of the class. Expenses before reductions do not reflect amounts reimbursed by the investment adviser or reductions from brokerage service arrangements or reductions from other expense offset arrangements and do not represent the amount paid by the class during periods when reimbursements or reductions occur. Expenses net of fee waivers reflect expenses after reimbursement by the investment adviser but prior to reductions from brokerage service arrangements or other expense offset arrangements. Expenses net of all reductions represent the net expenses paid by the class.
See accompanying notes which are an integral part of the financial statements.
Annual Report
Notes to Financial Statements
For the period ended December 31, 2013
1. Organization.
VIP Asset Manager: Growth Portfolio (the Fund) is a fund of Variable Insurance Products Fund V (the Trust) and is authorized to issue an unlimited number of shares. The Trust is registered under the Investment Company Act of 1940, as amended (the 1940 Act), as an open-end management investment company organized as a Massachusetts business trust. Shares of the Fund may only be purchased by insurance companies for the purpose of funding variable annuity or variable life insurance contracts. The Fund offers the following classes of shares: Initial Class shares, Service Class shares, Service Class 2 shares and Investor Class shares. All classes have equal rights and voting privileges, except for matters affecting a single class.
2. Investments in Fidelity Central Funds.
The Fund invests in Fidelity Central Funds, which are open-end investment companies generally available only to other investment companies and accounts managed by the investment adviser and its affiliates. The Fund's Schedule of Investments lists each of the Fidelity Central Funds held as of period end, as an investment of the Fund, but does not include the underlying holdings of each Fidelity Central Fund. As an Investing Fund, the Fund indirectly bears its proportionate share of the expenses of the underlying Fidelity Central Funds.
Based on its investment objective, each Fidelity Central Fund may invest or participate in various investment vehicles or strategies that are similar to those of the Fund. These strategies are consistent with the investment objectives of the Fund and may involve certain economic risks which may cause a decline in value of each of the Fidelity Central Funds and thus a decline in the value of the Fund. The following summarizes the Fund's investment in each Fidelity Central Fund.
Fidelity Central
Fund | Investment Manager | Investment
Objective | Investment
Practices | Expense
Ratio* |
Fidelity Emerging Markets Debt Central Fund | FMR Co., Inc. (FMRC) | Seeks high total return by normally investing in debt securities of issuers in emerging markets and other debt investments that are tied economically to emerging markets. | Foreign Securities Loans & Direct Debt Instruments Restricted Securities | .01% |
Fidelity Emerging Markets Equity Central Fund | FMRC | Seeks capital appreciation by investing primarily in equity securities of issuers in emerging markets. | Foreign Securities Futures Repurchase Agreements Restricted Securities | .13% |
Fidelity International Equity Central Fund | FMRC | Seeks capital appreciation by investing primarily in non-U.S. based common stocks, including securities of issuers located in emerging markets. | Foreign Securities Futures Repurchase Agreements | .01% |
Fidelity Floating Rate Central Fund | FMRC | Seeks a high level of income by normally investing in floating rate loans and other floating rate securities. | Loans & Direct Debt Instruments Repurchase Agreements Restricted Securities | .00%** |
Fidelity High Income Central Fund 1 | FMRC | Seeks a high level of income and may also seek capital appreciation by investing primarily in debt securities, preferred stocks, and convertible securities, with an emphasis on lower-quality debt securities. | Delayed Delivery & When Issued Securities Loans & Direct Debt Instruments Repurchase Agreements Restricted Securities | .00%** |
Fidelity Inflation-Protected Bond Index Central Fund | Fidelity Investment Money Management, Inc. (FIMM) | Seeks to provide investment results that correspond to the performance of the inflation-protected United States Treasury market, and may invest in derivatives. | Repurchase Agreements | .00%** |
Annual Report
2. Investments in Fidelity Central Funds - continued
Fidelity Central
Fund | Investment Manager | Investment
Objective | Investment
Practices | Expense
Ratio* |
Fidelity VIP Investment Grade Central Fund | FIMM | Seeks a high level of current income by normally investing in investment-grade debt securities and repurchase agreements. | Delayed Delivery & When Issued Securities Repurchase Agreements Restricted Securities Swaps | .00%** |
Fidelity Money Market Central Funds | FIMM | Seeks to obtain a high level of current income consistent with the preservation of capital and liquidity. | Short-term Investments | .00%** |
* Expenses expressed as a percentage of average net assets and are as of each underlying Central Fund's most recent annual or semi-annual shareholder report.
** Amount represents less than .01%.
An unaudited holdings listing for the Fund, which presents direct holdings as well as the pro-rata share of any securities and other investments held indirectly through its investment in underlying non-money market Fidelity Central Funds, is available at advisor.fidelity.com. A complete unaudited list of holdings for each Fidelity Central Fund is available upon request or at the Securities and Exchange Commission (the SEC) website at www.sec.gov. In addition, the financial statements of the Fidelity Central Funds which contain the significant accounting policies (including investment valuation policies) of those funds, which are not covered by the Fund's Report of Independent Registered Public Accounting Firm, are available on the SEC website or upon request.
3. Significant Accounting Policies.
The financial statements have been prepared in conformity with accounting principles generally accepted in the United States of America (GAAP), which require management to make certain estimates and assumptions at the date of the financial statements. Actual results could differ from those estimates. Subsequent events, if any, through the date that the financial statements were issued have been evaluated in the preparation of the financial statements. The following summarizes the significant accounting policies of the Fund:
Investment Valuation. Investments are valued as of 4:00 p.m. Eastern time on the last calendar day of the period. In accordance with valuation policies and procedures approved by the Board of Trustees (the Board), the Fund attempts to obtain prices from one or more third party pricing vendors or brokers to value its investments. When current market prices, quotations or currency exchange rates are not readily available or reliable, investments will be fair valued in good faith by the Fidelity Management & Research Company (FMR) Fair Value Committee (the Committee), in accordance with procedures adopted by the Board. Factors used in determining fair value vary by investment type and may include market or investment specific events, changes in interest rates and credit quality. The frequency with which these procedures are used cannot be predicted and they may be utilized to a significant extent. The Committee oversees the Fund's valuation policies and procedures and is responsible for approving and reporting to the Board all fair value determinations.
The Fund categorizes the inputs to valuation techniques used to value its investments into a disclosure hierarchy consisting of three levels as shown below:
Level 1 - quoted prices in active markets for identical investments
Level 2 - other significant observable inputs (including quoted prices for similar investments, interest rates, prepayment speeds, etc.)
Level 3 - unobservable inputs (including the Fund's own assumptions based on the best information available)
Valuation techniques used to value the Fund's investments by major category are as follows:
Equity securities, including restricted securities, for which market quotations are readily available, are valued at the last reported sale price or official closing price as reported by a third party pricing vendor on the primary market or exchange on which they are traded and are categorized as Level 1 in the hierarchy. In the event there were no sales during the day or closing prices are not available, securities are valued at the last quoted bid price or may be valued using the last available price and are generally categorized as Level 2 in the hierarchy. For foreign equity securities, when market or security specific events arise, comparisons to the valuation of American Depositary Receipts (ADRs), futures contracts, Exchange-Traded Funds (ETFs) and certain indexes as well as quoted prices for similar securities may be used and would be categorized as Level 2 in the hierarchy. Utilizing these techniques may result in transfers between Level 1 and Level 2. For equity securities, including restricted securities, where observable inputs are limited, assumptions about market activity and risk are used and these securities may be categorized as Level 3 in the hierarchy.
Annual Report
Notes to Financial Statements - continued
3. Significant Accounting Policies - continued
Investment Valuation - continued
Debt securities, including restricted securities, are valued based on evaluated prices received from third party pricing vendors or from brokers who make markets in such securities. U.S. government and government agency obligations are valued by pricing vendors who utilize matrix pricing which considers yield or price of bonds of comparable quality, coupon, maturity and type or by broker-supplied prices. When independent prices are unavailable or unreliable, debt securities may be valued utilizing pricing methodologies which consider similar factors that would be used by third party pricing vendors. Debt securities are generally categorized as Level 2 in the hierarchy but may be Level 3 depending on the circumstances.
Futures contracts are valued at the settlement price established each day by the board of trade or exchange on which they are traded and are categorized as Level 1 in the hierarchy. Investments in open-end mutual funds, including the Fidelity Central Funds, are valued at their closing net asset value (NAV) each business day and are categorized as Level 1 in the hierarchy.
Changes in valuation techniques may result in transfers in or out of an assigned level within the disclosure hierarchy. The aggregate value of investments by input level, as of December 31, 2013, is included at the end of the Fund's Schedule of Investments.
Foreign Currency. The Fund may use foreign currency contracts to facilitate transactions in foreign-denominated securities. Gains and losses from these transactions may arise from changes in the value of the foreign currency or if the counterparties do not perform under the contracts' terms.
Foreign-denominated assets, including investment securities, and liabilities are translated into U.S. dollars at the exchange rates at period end. Purchases and sales of investment securities, income and dividends received and expenses denominated in foreign currencies are translated into U.S. dollars at the exchange rate in effect on the transaction date.
The effects of exchange rate fluctuations on investments are included with the net realized and unrealized gain (loss) on investment securities. Other foreign currency transactions resulting in realized and unrealized gain (loss) are disclosed separately.
Investment Transactions and Income. For financial reporting purposes, the Fund's investment holdings and NAV include trades executed through the end of the last business day of the period. The NAV per share for processing shareholder transactions is calculated as of the close of business of the New York Stock Exchange (NYSE), normally 4:00 p.m. Eastern time and includes trades executed through the end of the prior business day. Gains and losses on securities sold are determined on the basis of identified cost and may include proceeds received from litigation. Dividend income is recorded on the ex-dividend date, except for certain dividends from foreign securities where the ex-dividend date may have passed, which are recorded as soon as the Fund is informed of the ex-dividend date. Non-cash dividends included in dividend income, if any, are recorded at the fair market value of the securities received. Distributions received on securities that represent a return of capital or capital gain are recorded as a reduction of cost of investments and/or as a realized gain. Subsequent to ex-dividend date the Fund determines the components of these distributions, based upon receipt of tax filings or other correspondence relating to the underlying investment. Interest income and distributions from the Fidelity Central Funds are accrued as earned. Interest income includes coupon interest and amortization of premium and accretion of discount on debt securities. Investment income is recorded net of foreign taxes withheld where recovery of such taxes is uncertain.
Class Allocations and Expenses. Investment income, realized and unrealized capital gains and losses, common expenses of the Fund, and certain fund-level expense reductions, if any, are allocated daily on a pro-rata basis to each class based on the relative net assets of each class to the total net assets of the Fund. Each class differs with respect to transfer agent and distribution and service plan fees incurred. Certain expense reductions may also differ by class. For the reporting period, the allocated portion of income and expenses to each class as a percent of its average net assets may vary due to the timing of recording these transactions in relation to fluctuating net assets of the classes. Expenses directly attributable to a fund are charged to that fund. Expenses attributable to more than one fund are allocated among the respective funds on the basis of relative net assets or other appropriate methods. Expense estimates are accrued in the period to which they relate and adjustments are made when actual amounts are known. Expenses included in the accompanying financial statements reflect the expenses of the Fund and do not include any expenses of the Fidelity Central Funds. Although not included in the Fund's expenses, the Fund indirectly bears its proportionate share of the Fidelity Central Funds' expenses through the impact of these expenses on each Fidelity Central Fund's NAV.
Income Tax Information and Distributions to Shareholders. Each year, the Fund intends to qualify as a regulated investment company under Subchapter M of the Internal Revenue Code, including distributing substantially all of its taxable income and realized gains. As a result, no provision for U.S. Federal income taxes is required. As of December 31, 2013, the Fund did not have any unrecognized tax benefits in the financial statements; nor is the Fund aware of any tax positions for which it is reasonably possible that the total amounts of unrecognized tax benefits will significantly change in the next twelve months. The Fund files a U.S. federal tax return, in addition to state and local tax returns as required. The Fund's federal income tax returns are subject to examination by the Internal Revenue Service (IRS) for a period of three fiscal years after they are filed. State and local tax returns may be subject to examination for an additional fiscal year depending on the jurisdiction. Foreign taxes are provided for based on the Fund's understanding of the tax rules and rates that exist in the foreign markets in which it invests.
Annual Report
3. Significant Accounting Policies - continued
Income Tax Information and Distributions to Shareholders - continued
Distributions are declared and recorded on the ex-dividend date. Income dividends and capital gain distributions are declared separately for each class. Income and capital gain distributions are determined in accordance with income tax regulations, which may differ from GAAP.
Capital accounts within the financial statements are adjusted for permanent book-tax differences. These adjustments have no impact on net assets or the results of operations. Capital accounts are not adjusted for temporary book-tax differences which will reverse in a subsequent period.
Book-tax differences are primarily due to the short-term gain distributions from the Fidelity Central Funds, futures contracts, foreign currency transactions, partnerships (including allocations from Fidelity Central Funds), deferred trustees compensation, capital loss carryforwards and losses deferred due to wash sales.
The federal tax cost of investment securities and unrealized appreciation (depreciation) as of period end were as follows:
Gross unrealized appreciation | $ 46,781,981 |
Gross unrealized depreciation | (4,294,725) |
Net unrealized appreciation (depreciation) on securities and other investments | $ 42,487,256 |
| |
Tax Cost | $ 153,307,391 |
The tax-based components of distributable earnings as of period end were as follows:
Undistributed ordinary income | $ 10,841 |
Capital loss carryforward | $ (18,888,513) |
Net unrealized appreciation (depreciation) | $ 42,487,232 |
Capital loss carryforwards are only available to offset future capital gains of the Fund to the extent provided by regulations and may be limited. Under the Regulated Investment Company Modernization Act of 2010 (the Act), the Fund is permitted to carry forward capital losses incurred in taxable years beginning after December 22, 2010 for an unlimited period and such capital losses are required to be used prior to any losses that expire. The capital loss carryforward information presented below, including any applicable limitation, is estimated as of fiscal period end and is subject to adjustment.
Fiscal year of expiration | |
2017 | $ (18,888,513) |
The tax character of distributions paid was as follows:
| December 31, 2013 | December 31, 2012 |
Ordinary Income | $ 2,286,625 | $ 2,790,617 |
4. Derivative Instruments.
Risk Exposures and the Use of Derivative Instruments. The Fund's investment objective allows the Fund to enter into various types of derivative contracts, including futures contracts. Derivatives are investments whose value is primarily derived from underlying assets, indices or reference rates and may be transacted on an exchange or over-the-counter (OTC). Derivatives may involve a future commitment to buy or sell a specified asset based on specified terms, to exchange future cash flows at periodic intervals based on a notional principal amount, or for one party to make one or more payments upon the occurrence of specified events in exchange for periodic payments from the other party.
The Fund used derivatives to increase returns and to manage exposure to certain risks as defined below. The success of any strategy involving derivatives depends on analysis of numerous economic factors, and if the strategies for investment do not work as intended, the Fund may not achieve its objectives.
The Fund's use of derivatives increased or decreased its exposure to the following risk:
Equity Risk | Equity risk relates to the fluctuations in the value of financial instruments as a result of changes in market prices (other than those arising from interest rate risk or foreign exchange risk), whether caused by factors specific to an individual investment, its issuer, or all factors affecting all instruments traded in a market or market segment. |
Annual Report
Notes to Financial Statements - continued
4. Derivative Instruments - continued
Risk Exposures and the Use of Derivative Instruments - continued
The Fund is also exposed to additional risks from investing in derivatives, such as liquidity risk and counterparty credit risk. Liquidity risk is the risk that the Fund will be unable to close out the derivative in the open market in a timely manner. Counterparty credit risk is the risk that the counterparty will not be able to fulfill its obligation to the Fund. Counterparty credit risk related to exchange-traded futures contracts may be mitigated by the protection provided by the exchange on which they trade.
Investing in derivatives may involve greater risks than investing in the underlying assets directly and, to varying degrees, may involve risk of loss in excess of any initial investment and collateral received and amounts recognized in the Statement of Assets and Liabilities. In addition, there may be the risk that the change in value of the derivative contract does not correspond to the change in value of the underlying instrument.
Futures Contracts. A futures contract is an agreement between two parties to buy or sell a specified underlying instrument for a fixed price at a specified future date. The Fund used futures contracts to manage its exposure to the stock market.
Upon entering into a futures contract, a fund is required to deposit either cash or securities (initial margin) with a clearing broker in an amount equal to a certain percentage of the face value of the contract. Futures contracts are marked-to-market daily and subsequent daily payments (variation margin) are made or received by a fund depending on the daily fluctuations in the value of the futures contracts and are recorded as unrealized appreciation or (depreciation). This receivable and/or payable, if any, is included in daily variation margin for derivative instruments in the Statement of Assets and Liabilities. Realized gain or (loss) is recorded upon the expiration or closing of a futures contract.
Any open futures contracts at period end are presented in the Schedule of Investments under the caption "Futures Contracts." The underlying face amount at value reflects each contract's exposure to the underlying instrument or index at period end and is representative of volume of activity during the period. Securities deposited to meet initial margin requirements are identified in the Schedule of Investments.
During the period the Fund recognized net realized gain (loss) of $241,336 and a change in net unrealized appreciation (depreciation) of $186,455 related to its investment in futures contracts. These amounts are included in the Statement of Operations.
5. Purchases and Sales of Investments.
Purchases and sales of securities (including the Equity and Fixed-Income Central Funds), other than short-term securities, aggregated $87,777,150 and $91,516,803, respectively.
6. Fees and Other Transactions with Affiliates.
Management Fee. Fidelity Management & Research Company (the investment adviser) and its affiliates provide the Fund with investment management related services for which the Fund pays a monthly management fee. The management fee is the sum of an individual fund fee rate that is based on an annual rate of .30% of the Fund's average net assets and an annualized group fee rate that averaged .25% during the period. The group fee rate is based upon the average net assets of all the mutual funds advised by the investment adviser, including any mutual funds previously advised by the investment adviser that are currently advised by Fidelity SelectCo, LLC, an affiliate of the investment adviser. The group fee rate decreases as assets under management increase and increases as assets under management decrease. For the reporting period, the total annual management fee rate was .55% of the Fund's average net assets.
The investment adviser pays a portion of the management fees received from the Fund to the Fidelity Central Funds' investment advisers, who are also affiliates, for managing the assets of the Fidelity Central Funds.
Distribution and Service Plan Fees. In accordance with Rule 12b-1 of the 1940 Act, the Fund has adopted separate 12b-1 Plans for each Service Class of shares. Each Service Class pays Fidelity Distributors Corporation (FDC), an affiliate of the investment adviser, a service fee. For the period, the service fee is based on an annual rate of .10% of Service Class' average net assets and .25% of Service Class 2's average net assets.
For the period, total fees, all of which were re-allowed to insurance companies for the distribution of shares and providing shareholder support services were as follows:
Service Class | $ 3,524 |
Service Class 2 | 8,872 |
| $ 12,396 |
Annual Report
6. Fees and Other Transactions with Affiliates - continued
Transfer Agent Fees. Fidelity Investments Institutional Operations Company, Inc. (FIIOC), an affiliate of the investment adviser, is the Fund's transfer, dividend disbursing, and shareholder servicing agent. FIIOC receives an asset-based fee with respect to each class. Each class (with the exception of Investor Class) pays a transfer agent fee, excluding out of pocket expenses, equal to an annual rate of .07% of average net assets. Investor Class pays a monthly asset-based transfer agent fee of .15% of average net assets. In addition, FIIOC receives an asset-based fee of .0035% of average net assets for typesetting, printing and mailing of shareholder reports, except proxy statements. FIIOC voluntarily agreed to reimburse or waive this fee for the period January 1, 2013 through December 31, 2013 (see Expense Reductions note). For the period, transfer agent fees for each class, including printing and out of pocket expenses, were as follows:
Initial Class | $ 88,445 |
Service Class | 2,645 |
Service Class 2 | 4,698 |
Investor Class | 71,260 |
| $ 167,048 |
Effective February 1, 2014, the Board of Trustees approved an amendment to the transfer agent fee agreement whereby each class (with the exception of Investor Class) pays a single fee of .07% of average net assets for transfer agent services, typesetting, printing and mailing of shareholder reports, excluding mailing of proxy statements and out of pocket expenses. Investor Class pays a single fee of .15% of average net assets.
Accounting and Security Lending Fees. Fidelity Service Company, Inc. (FSC), an affiliate of the investment adviser, maintains the Fund's accounting records. The accounting fee is based on the level of average net assets for each month. Under a separate contract, FSC administers the security lending program. The security lending fee is based on the number and duration of lending transactions.
Brokerage Commissions. The Fund placed a portion of its portfolio transactions with brokerage firms which are affiliates of the investment adviser. Brokerage commissions are included in net realized gain (loss) and change in net unrealized appreciation (depreciation) in the Statement of Operations. The commissions paid to these affiliated firms were $2,400 for the period.
7. Committed Line of Credit.
The Fund participates with other funds managed by the investment adviser or an affiliate in a $4.25 billion credit facility (the "line of credit") to be utilized for temporary or emergency purposes to fund shareholder redemptions or for other short-term liquidity purposes. The Fund has agreed to pay commitment fees on its pro-rata portion of the line of credit, which amounted to $366 and is reflected in Miscellaneous expenses on the Statement of Operations. During the period, there were no borrowings on this line of credit.
8. Security Lending.
The Fund lends portfolio securities through a lending agent from time to time in order to earn additional income. For equity securities, a lending agent is used and may loan securities to certain qualified borrowers, including Fidelity Capital Markets (FCM), a broker-dealer affiliated with the Fund. On the settlement date of the loan, the Fund receives collateral (in the form of U.S. Treasury obligations, letters of credit and/or cash) against the loaned securities and maintains collateral in an amount not less than 100% of the market value of the loaned securities during the period of the loan. The market value of the loaned securities is determined at the close of business of the Fund and any additional required collateral is delivered to the Fund on the next business day. If the borrower defaults on its obligation to return the securities loaned because of insolvency or other reasons, the Fund may apply collateral received from the borrower against the obligation. The Fund may experience delays and costs in recovering the securities loaned. Any cash collateral received is invested in the Fidelity Securities Lending Cash Central Fund. The value of loaned securities and cash collateral at period end are disclosed on the Fund's Statement of Assets and Liabilities. At period end, there were no security loans outstanding with FCM. Security lending income represents the income earned on investing cash collateral, less rebates paid to borrowers and any lending agent fees associated with the loan, plus any premium payments received for lending certain types of securities. Security lending income is presented in the Statement of Operations as a component of income from Fidelity Central Funds. Total security lending income during the period amounted to $35,765, including $871 from securities loaned to FCM.
9. Expense Reductions.
The investment adviser or its affiliates agreed to reimburse or waive certain fees during the period as noted in the table below.
Initial Class | $ 4,741 |
Service Class | 138 |
Service Class 2 | 139 |
Investor Class | 1,799 |
| $ 6,817 |
Commissions paid to certain brokers with whom the investment adviser, or its affiliates, places trades on behalf of the Fund include an amount in addition to trade execution, which may be rebated back to the Fund to offset certain expenses. This amount totaled $9,823 for the period.
Annual Report
Notes to Financial Statements - continued
10. Distributions to Shareholders.
Distributions to shareholders of each class were as follows:
Years ended December 31, | 2013 | 2012 |
From net investment income | | |
Initial Class | $ 1,223,555 | $ 1,629,244 |
Service Class | 26,731 | 45,299 |
Service Class 2 | 24,103 | 40,910 |
Investor Class | 513,560 | 494,792 |
Total | $ 1,787,949 | $ 2,210,245 |
From net realized gain | | |
Initial Class | $ 335,311 | $ 418,731 |
Service Class | 8,656 | 12,776 |
Service Class 2 | 9,703 | 13,474 |
Investor Class | 145,006 | 135,391 |
Total | $ 498,676 | $ 580,372 |
11. Share Transactions.
Transactions for each class of shares were as follows:
| Shares | Dollars |
Years ended December 31, | 2013 | 2012 | 2013 | 2012 |
Initial Class | | | | |
Shares sold | 254,258 | 209,683 | $ 4,235,828 | $ 3,101,220 |
Reinvestment of distributions | 88,376 | 137,264 | 1,558,866 | 2,047,975 |
Shares redeemed | (1,057,265) | (1,201,677) | (17,597,555) | (17,554,476) |
Net increase (decrease) | (714,631) | (854,730) | $ (11,802,861) | $ (12,405,281) |
Service Class | | | | |
Shares sold | 7,813 | 67,757 | $ 123,295 | $ 988,975 |
Reinvestment of distributions | 2,020 | 3,916 | 35,387 | 58,075 |
Shares redeemed | (69,763) | (262,622) | (1,172,829) | (3,862,828) |
Net increase (decrease) | (59,930) | (190,949) | $ (1,014,147) | $ (2,815,778) |
Service Class 2 | | | | |
Shares sold | 38,367 | 48,258 | $ 623,037 | $ 685,875 |
Reinvestment of distributions | 1,940 | 3,682 | 33,806 | 54,384 |
Shares redeemed | (81,713) | (57,062) | (1,327,456) | (826,629) |
Net increase (decrease) | (41,406) | (5,122) | $ (670,613) | $ (86,370) |
Investor Class | | | | |
Shares sold | 876,640 | 326,655 | $ 14,728,602 | $ 4,754,809 |
Reinvestment of distributions | 37,462 | 42,379 | 658,566 | 630,183 |
Shares redeemed | (206,156) | (602,703) | (3,358,338) | (8,823,163) |
Net increase (decrease) | 707,946 | (233,669) | $ 12,028,830 | $ (3,438,171) |
12. Other.
The Fund's organizational documents provide former and current trustees and officers with a limited indemnification against liabilities arising in connection with the performance of their duties to the Fund. In the normal course of business, the Fund may also enter into contracts that provide general indemnifications. The Fund's maximum exposure under these arrangements is unknown as this would be dependent on future claims that may be made against the Fund. The risk of material loss from such claims is considered remote.
At the end of the period, the investment adviser or its affiliates were the owners of record of 81% of the total outstanding shares of the Fund.
Annual Report
Report of Independent Registered Public Accounting Firm
To the Trustees of Variable Insurance Products Fund V and Shareholders of VIP Asset Manager: Growth Portfolio:
We have audited the accompanying statement of assets and liabilities of VIP Asset Manager: Growth Portfolio (the Fund), a fund of Variable Insurance Products Fund V, including the schedule of investments, as of December 31, 2013, and the related statement of operations for the year then ended, the statement of changes in net assets for each of the two years in the period then ended, and the financial highlights for each of the five years in the period then ended. These financial statements and financial highlights are the responsibility of the Fund's management. Our responsibility is to express an opinion on these financial statements and financial highlights based on our audits.
We conducted our audits in accordance with the standards of the Public Company Accounting Oversight Board (United States). Those standards require that we plan and perform the audit to obtain reasonable assurance about whether the financial statements and financial highlights are free of material misstatement. The Fund is not required to have, nor were we engaged to perform, an audit of its internal control over financial reporting. Our audits included consideration of internal control over financial reporting as a basis for designing audit procedures that are appropriate in the circumstances, but not for the purpose of expressing an opinion on the effectiveness of the Fund's internal control over financial reporting. Accordingly, we express no such opinion. An audit also includes examining, on a test basis, evidence support the amounts and disclosures in the financial statements, assessing the accounting principles used and significant estimates made by management, as well as evaluating the overall financial statement presentation. Our procedures included confirmation of securities owned as of December 31, 2013, by correspondence with the custodians and brokers; where replies were not received from brokers, we performed other auditing procedures. We believe that our audits provide a reasonable basis for our opinion.
In our opinion, the financial statements and financial highlights referred to above present fairly, in all material respects, the financial position of VIP Asset Manager: Growth Portfolio as of December 31, 2013, the results of its operations for the year then ended, the changes in its net assets for each of the two years in the period then ended, and the financial highlights for each of the five years in the period then ended, in conformity with accounting principles generally accepted in the United States of America.
DELOITTE & TOUCHE LLP
Boston, Massachusetts
February 18, 2014
Annual Report
The Trustees and officers of the trust and fund, as applicable, are listed below. The Board of Trustees governs the fund and is responsible for protecting the interests of shareholders. The Trustees are experienced executives who meet periodically throughout the year to oversee the fund's activities, review contractual arrangements with companies that provide services to the fund, oversee management of the risks associated with such activities and contractual arrangements, and review the fund's performance. Except for Elizabeth S. Acton and James C. Curvey each of the Trustees oversees 223 funds. Elizabeth S. Acton oversees 205 funds. James C. Curvey oversees 396 funds.
The Trustees hold office without limit in time except that (a) any Trustee may resign; (b) any Trustee may be removed by written instrument, signed by at least two-thirds of the number of Trustees prior to such removal; (c) any Trustee who requests to be retired or who has become incapacitated by illness or injury may be retired by written instrument signed by a majority of the other Trustees; and (d) any Trustee may be removed at any special meeting of shareholders by a two-thirds vote of the outstanding voting securities of the trust. Each Trustee who is not an interested person (as defined in the 1940 Act) of the trust and the fund (Independent Trustee), shall retire not later than the last day of the month in which his or her 75th birthday occurs. The Independent Trustees may waive this mandatory retirement age policy with respect to individual Trustees. The officers hold office without limit in time, except that any officer may resign or may be removed by a vote of a majority of the Trustees at any regular meeting or any special meeting of the Trustees. Except as indicated, each individual has held the office shown or other offices in the same company for the past five years.
Experience, Skills, Attributes, and Qualifications of the Fund's Trustees. The Governance and Nominating Committee has adopted a statement of policy that describes the experience, qualifications, attributes, and skills that are necessary and desirable for potential Independent Trustee candidates (Statement of Policy). The Board believes that each Trustee satisfied at the time he or she was initially elected or appointed a Trustee, and continues to satisfy, the standards contemplated by the Statement of Policy. The Governance and Nominating Committee also engages professional search firms to help identify potential Independent Trustee candidates who have the experience, qualifications, attributes, and skills consistent with the Statement of Policy. From time to time, additional criteria based on the composition and skills of the current Independent Trustees, as well as experience or skills that may be appropriate in light of future changes to board composition, business conditions, and regulatory or other developments, have also been considered by the professional search firms and the Governance and Nominating Committee. In addition, the Board takes into account the Trustees' commitment and participation in Board and committee meetings, as well as their leadership of standing and ad hoc committees throughout their tenure.
In determining that a particular Trustee was and continues to be qualified to serve as a Trustee, the Board has considered a variety of criteria, none of which, in isolation, was controlling. The Board believes that, collectively, the Trustees have balanced and diverse experience, qualifications, attributes, and skills, which allow the Board to operate effectively in governing the fund and protecting the interests of shareholders. Information about the specific experience, skills, attributes, and qualifications of each Trustee, which in each case led to the Board's conclusion that the Trustee should serve (or continue to serve) as a trustee of the fund, is provided below.
Board Structure and Oversight Function. Abigail P. Johnson is an interested person (as defined in the 1940 Act) and currently serves as Chairman. The Trustees have determined that an interested Chairman is appropriate and benefits shareholders because an interested Chairman has a personal and professional stake in the quality and continuity of services provided to the fund. Independent Trustees exercise their informed business judgment to appoint an individual of their choosing to serve as Chairman, regardless of whether the Trustee happens to be independent or a member of management. The Independent Trustees have determined that they can act independently and effectively without having an Independent Trustee serve as Chairman and that a key structural component for assuring that they are in a position to do so is for the Independent Trustees to constitute a substantial majority for the Board. The Independent Trustees also regularly meet in executive session. Albert R. Gamper, Jr. serves as Chairman of the Independent Trustees and as such (i) acts as a liaison between the Independent Trustees and management with respect to matters important to the Independent Trustees and (ii) with management prepares agendas for Board meetings.
Fidelity funds are overseen by different Boards of Trustees. The fund's Board oversees Fidelity's investment-grade bond, money market, and asset allocation funds and another Board oversees Fidelity's equity and high income funds. The asset allocation funds may invest in Fidelity funds that are overseen by such other Board. The use of separate Boards, each with its own committee structure, allows the Trustees of each group of Fidelity funds to focus on the unique issues of the funds they oversee, including common research, investment, and operational issues. On occasion, the separate Boards establish joint committees to address issues of overlapping consequences for the Fidelity funds overseen by each Board.
The Trustees operate using a system of committees to facilitate the timely and efficient consideration of all matters of importance to the Trustees, the fund, and fund shareholders and to facilitate compliance with legal and regulatory requirements and oversight of the fund's activities and associated risks. The Board, acting through its committees, has charged FMR and its affiliates with (i) identifying events or circumstances the occurrence of which could have demonstrably adverse effects on the fund's business and/or reputation; (ii) implementing processes and controls to lessen the possibility that such events or circumstances occur or to mitigate the effects of such events or circumstances if they do occur; and (iii) creating and maintaining a system designed to evaluate continuously business and market conditions in order to facilitate the identification and implementation processes described in (i) and (ii) above. Because the day-to-day operations and activities of the fund are carried out by or through FMR its affiliates, and other service providers, the fund's exposure to risks is mitigated but not eliminated by the processes overseen by the Trustees. While each of the Board's committees has responsibility for overseeing different aspects of the fund's activities, oversight is exercised primarily through the Operations and Audit Committees. In addition, an ad hoc Board committee of Independent Trustees has worked with FMR to enhance the Board's oversight of investment and financial risks, legal and regulatory risks, technology risks, and operational risks, including the development of additional risk reporting to the Board. Appropriate personnel, including but not limited to the fund's Chief Compliance Officer (CCO), FMR's internal auditor, the independent accountants, the fund's Treasurer and portfolio management personnel, make periodic reports to the Board's committees, as appropriate, including an annual review of FMR's risk management program for the Fidelity funds. The responsibilities of each standing committee, including their oversight responsibilities, are described further under "Standing Committees of the Fund's Trustees."
Annual Report
The fund's Statement of Additional Information (SAI) includes more information about the Trustees. To request a free copy, call Fidelity at 1-877-208-0098.
Interested Trustees*:
Correspondence intended for each Trustee who is an interested person may be sent to Fidelity Investments, 245 Summer Street, Boston, Massachusetts 02210.
Name, Year of Birth; Principal Occupations and Other Relevant Experience+ |
James C. Curvey (1935) |
Year of Election or Appointment: 2007 Trustee |
| Mr. Curvey also serves as Trustee of other Fidelity funds. Mr. Curvey is a Director of Fidelity Investments Money Management, Inc. (2009-present), Director of Fidelity Research & Analysis Co. (2009-present) and Director of FMR and FMR Co., Inc. (2007-present). Mr. Curvey is also Vice Chairman (2007-present) and Director of FMR LLC. In addition, Mr. Curvey serves as an Overseer for the Boston Symphony Orchestra and a member of the Trustees of Villanova University. Previously, Mr. Curvey was the Vice Chairman (2006-2007) and Director (2000-2007) of FMR Corp. |
Abigail P. Johnson (1961) |
Year of Election or Appointment: 2009 Trustee Chairman of the Board of Trustees |
| Ms. Johnson also serves as Trustee of other Fidelity funds. Ms. Johnson serves as President of FMR LLC (2013-present), President of Fidelity Financial Services (2012-present) and President of Personal, Workplace and Institutional Services (2005-present). Ms. Johnson is Chairman and Director of FMR Co., Inc. (2011-present), Chairman and Director of FMR (2011-present), and the Vice Chairman and Director (2007-present) of FMR LLC. Previously, Ms. Johnson served as President and a Director of FMR (2001-2005), a Trustee of other investment companies advised by FMR, Fidelity Investments Money Management, Inc., and FMR Co., Inc. (2001-2005), Senior Vice President of the Fidelity funds (2001-2005), and managed a number of Fidelity funds. Ms. Abigail P. Johnson and Mr. Arthur E. Johnson are not related. |
* Trustees have been determined to be "Interested Trustees" by virtue of, among other things, their affiliation with the trust or various entities under common control with FMR.
+ The information above includes each Trustee's principal occupation during the last five years and other information relating to the experience, attributes, and skills relevant to each Trustee's qualifications to serve as a Trustee, which led to the conclusion that each Trustee should serve as a Trustee for the fund.
Independent Trustees:
Correspondence intended for each Independent Trustee (that is, the Trustees other than the Interested Trustees) may be sent to Fidelity Investments, P.O. Box 55235, Boston, Massachusetts 02205-5235.
Name, Year of Birth; Principal Occupations and Other Relevant Experience+ |
Elizabeth S. Acton (1951) |
Year of Election or Appointment: 2013 Trustee |
| Ms. Acton also serves as Trustee or Member of the Advisory Board of other Fidelity funds. Prior to her retirement in April 2012, Ms. Acton was Executive Vice President, Finance (2011-2012), Executive Vice President, Chief Financial Officer (2002-2011), and Treasurer (2004-2005) of Comerica Incorporated (financial services). Prior to joining Comerica, Ms. Acton held a variety of positions at Ford Motor Company (1983-2002), including Vice President and Treasurer (2000-2002) and Executive Vice President and Chief Financial Officer of Ford Motor Credit Company (1998-2000). Ms. Acton currently serves as a member of the Board of Directors and Audit and Finance Committees of Beazer Homes USA, Inc. (homebuilding, 2012-present). |
Albert R. Gamper, Jr. (1942) |
Year of Election or Appointment: 2006 Trustee Chairman of the Independent Trustees |
| Mr. Gamper also serves as Trustee of other Fidelity funds. Prior to his retirement in December 2004, Mr. Gamper served as Chairman of the Board of CIT Group Inc. (commercial finance). During his tenure with CIT Group Inc. Mr. Gamper served in numerous senior management positions, including Chairman (1987-1989; 1999-2001; 2002-2004), Chief Executive Officer (1987-2004), and President (2002-2003). Mr. Gamper currently serves as a member of the Board of Directors of Public Service Enterprise Group (utilities, 2000-present), a member of the Board of Trustees, Rutgers University (2004-present), and Chairman of the Board of Barnabas Health Care System. Previously, Mr. Gamper served as Vice Chairman of the Independent Trustees of certain Fidelity funds (2011-2012) and as Chairman of the Board of Governors, Rutgers University (2004-2007). |
Robert F. Gartland (1951) |
Year of Election or Appointment: 2010 Trustee |
| Mr. Gartland also serves as Trustee of other Fidelity funds. Mr. Gartland is Chairman and an investor in Gartland and Mellina Group Corp. (consulting, 2009-present). Previously, Mr. Gartland served as a partner and investor of Vietnam Partners LLC (investments and consulting, 2008-2011). Prior to his retirement, Mr. Gartland held a variety of positions at Morgan Stanley (financial services, 1979-2007) including Managing Director (1987-2007). |
Arthur E. Johnson (1947) |
Year of Election or Appointment: 2008 Trustee |
| Mr. Johnson also serves as Trustee of other Fidelity funds. Mr. Johnson serves as a member of the Board of Directors of Eaton Corporation (diversified power management, 2009-present), AGL Resources, Inc. (holding company, 2002-present) and Booz Allen Hamilton (management consulting, 2011-present). Prior to his retirement, Mr. Johnson served as Senior Vice President of Corporate Strategic Development of Lockheed Martin Corporation (defense contractor, 1999-2009). He previously served on the Board of Directors of IKON Office Solutions, Inc. (1999-2008) and Delta Airlines (2005-2007). Mr. Arthur E. Johnson is not related to Ms. Abigail P. Johnson. |
Michael E. Kenneally (1954) |
Year of Election or Appointment: 2009 Trustee |
| Mr. Kenneally also serves as Trustee of other Fidelity funds. Mr. Kenneally served as a Member of the Advisory Board for certain Fidelity funds before joining the Board of Trustees (2008-2009). Prior to his retirement, Mr. Kenneally served as Chairman and Global Chief Executive Officer of Credit Suisse Asset Management. Before joining Credit Suisse, he was an Executive Vice President and Chief Investment Officer for Bank of America Corporation. Earlier roles at Bank of America included Director of Research, Senior Portfolio Manager and Research Analyst, and Mr. Kenneally was awarded the Chartered Financial Analyst (CFA) designation in 1991. |
James H. Keyes (1940) |
Year of Election or Appointment: 2007 Trustee |
| Mr. Keyes also serves as Trustee of other Fidelity funds. Mr. Keyes serves as a member of the Board and Non-Executive Chairman of Navistar International Corporation (manufacture and sale of trucks, buses, and diesel engines, since 2002). Previously, Mr. Keyes served as a member of the Board of Pitney Bowes, Inc. (integrated mail, messaging, and document management solutions, 1998-2013). Prior to his retirement, Mr. Keyes served as Chairman (1993-2002) and Chief Executive Officer (1988-2002) of Johnson Controls (automotive, building, and energy) and as a member of the Board of LSI Logic Corporation (semiconductor technologies, 1984-2008). |
Marie L. Knowles (1946) |
Year of Election or Appointment: 2001 Trustee Vice Chairman of the Independent Trustees |
| Ms. Knowles also serves as Trustee of other Fidelity funds. Prior to Ms. Knowles' retirement in June 2000, she served as Executive Vice President and Chief Financial Officer of Atlantic Richfield Company (ARCO) (diversified energy, 1996-2000). From 1993 to 1996, she was a Senior Vice President of ARCO and President of ARCO Transportation Company. She served as a Director of ARCO from 1996 to 1998. Ms. Knowles currently serves as a Director and Chairman of the Audit Committee of McKesson Corporation (healthcare service, since 2002). Ms. Knowles is a member of the Board of the Catalina Island Conservancy and of the Santa Catalina Island Company (2009-present). She also serves as a member of the Advisory Board for the School of Engineering of the University of Southern California. Previously, Ms. Knowles served as a Director of Phelps Dodge Corporation (copper mining and manufacturing, 1994-2007), URS Corporation (engineering and construction, 2000-2003) and America West (airline, 1999-2002). |
Kenneth L. Wolfe (1939) |
Year of Election or Appointment: 2005 Trustee |
| Mr. Wolfe also serves as Trustee of other Fidelity funds. Prior to his retirement, Mr. Wolfe served as Chairman and a Director (2007-2009) and Chairman and Chief Executive Officer (1994-2001) of Hershey Foods Corporation. He also served as a member of the Boards of Adelphia Communications Corporation (telecommunications, 2003-2006), Bausch & Lomb, Inc. (medical/pharmaceutical, 1993-2007), and Revlon, Inc. (personal care products, 2004-2009). Mr. Wolfe previously served as Chairman of the Independent Trustees of other Fidelity funds (2008-2012). |
+ The information above includes each Trustee's principal occupation during the last five years and other information relating to the experience, attributes, and skills relevant to each Trustee's qualifications to serve as a Trustee, which led to the conclusion that each Trustee should serve as a Trustee for the fund.
Officers:
Correspondence intended for each officer may be sent to Fidelity Investments, 245 Summer Street, Boston, Massachusetts 02210.
Officers appear below in alphabetical order.
Name, Year of Birth; Principal Occupation |
Elizabeth Paige Baumann (1968) |
Year of Election or Appointment: 2012 Anti-Money Laundering (AML) Officer |
| Ms. Baumann also serves as AML Officer of other funds. She is Chief AML Officer of FMR LLC (2012-present) and is an employee of Fidelity Investments. Previously, Ms. Baumann served as Vice President and Deputy Anti-Money Laundering Officer (2007-2012). |
Robert P. Brown (1963) |
Year of Election or Appointment: 2012 Vice President of Fidelity's Bond Funds |
| Mr. Brown also serves as Vice President of other funds. Mr. Brown serves as Executive Vice President of Fidelity Investments Money Management, Inc. (FIMM) (2010-present), President, Bond Group of FMR (2011-present), Director and Managing Director, Research of Fidelity Management & Research (U.K.) Inc. (2008-present), and is an employee of Fidelity Investments. Previously, Mr. Brown served as President, Money Market Group of FMR (2010-2011) and Vice President of Fidelity's Money Market Funds (2010-2012). |
Marc Bryant (1966) |
Year of Election or Appointment: 2013 Assistant Secretary |
| Mr. Bryant also serves as an officer of other funds. He is Senior Vice President and Deputy General Counsel of FMR LLC. Prior to joining Fidelity Investments, Mr. Bryant served as a Senior Vice President and the Head of Global Retail Legal for AllianceBernstein L.P. (2006-2010), and as the General Counsel for ProFund Advisors LLC (2001-2006). |
Jonathan Davis (1968) |
Year of Election or Appointment: 2010 Assistant Treasurer |
| Mr. Davis also serves as Assistant Treasurer of other funds. Mr. Davis is an employee of Fidelity Investments. Previously, Mr. Davis served as Vice President and Associate General Counsel of FMR LLC (2003-2010). |
Adrien E. Deberghes (1967) |
Year of Election or Appointment: 2010 Assistant Treasurer |
| Mr. Deberghes also serves as an officer of other funds. He is an employee of Fidelity Investments (2008-present). Prior to joining Fidelity Investments, Mr. Deberghes was Senior Vice President of Mutual Fund Administration at State Street Corporation (2007-2008), Senior Director of Mutual Fund Administration at Investors Bank & Trust (2005-2007), and Director of Finance for Dunkin' Brands (2000-2005). |
Stephanie J. Dorsey (1969) |
Year of Election or Appointment: 2013 President and Treasurer |
| Ms. Dorsey also serves as an officer of other funds. She is an employee of Fidelity Investments (2008-present) and has served in other fund officer roles. Prior to joining Fidelity Investments, Ms. Dorsey served as Treasurer (2004-2008) of the JPMorgan Mutual Funds and Vice President (2004-2008) of JPMorgan Chase Bank. |
Scott C. Goebel (1968) |
Year of Election or Appointment: 2008 Secretary and Chief Legal Officer (CLO) |
| Mr. Goebel serves as Secretary and CLO of other funds. Mr. Goebel also serves as Secretary of Fidelity Investments Money Management, Inc. (FIMM) (2010-present) and Fidelity Research and Analysis Company (FRAC) (2010-present); General Counsel,Secretary, and Senior Vice President of FMR (2008-present) and FMR Co., Inc. (2008-present); Chief Legal Officer of Fidelity Management & Research (Hong Kong) Limited (2008-present) and Assistant Secretary of Fidelity Management & Research (Japan) Inc. (2008-present), and Fidelity Management & Research (U.K.) Inc. (2008-present). Previously, Mr. Goebel served as Secretary and CLO of other Fidelity funds (2008-2013), Assistant Secretary of FIMM (2008-2010), FRAC (2008-2010), and certain funds (2007-2008); and as Vice President and Secretary of Fidelity Distributors Corporation (FDC) (2005-2007). Mr. Goebel has been employed by FMR LLC or an affiliate since 2001. |
Bruce T. Herring (1965) |
Year of Election or Appointment: 2013 Vice President of Fidelity's Asset Allocation Funds |
| Mr. Herring also serves as Vice President of other funds. He serves as Chief Investment Officer of Fidelity Global Asset Allocation (GAA) (2013-present), Group Chief Investment Officer of FMR, and President of Fidelity Research & Analysis Company (2010-present). Previously, Mr. Herring served as Chief Investment Officer and Director of Fidelity Management & Research (U.K.) Inc. (2010-2013), Vice President (2005-2006) and Senior Vice President (2006-2007) of Fidelity Management & Research Company, Vice President of FMR Co., Inc. (2001-2007), and as a portfolio manager for Fidelity U.S. Equity Funds. |
Chris Maher (1972) |
Year of Election or Appointment: 2013 Assistant Treasurer |
| Mr. Maher serves as Assistant Treasurer of other funds. Mr. Maher is Vice President of Valuation Oversight and is an employee of Fidelity Investments. Previously, Mr. Maher served as Vice President of Asset Management Compliance (2013), Vice President of FMR's Program Management Group (2010-2013), and Vice President of Valuation Oversight (2008-2010). |
Charles S. Morrison (1960) |
Year of Election or Appointment: 2012 Vice President |
| Mr. Morrison also serves as Vice President of other funds. He serves as President, Fixed Income and is an employee of Fidelity Investments. Previously, Mr. Morrison served as Vice President of Fidelity's Money Market Funds (2005-2009), President, Money Market Group Leader of FMR (2009), and Senior Vice President, Money Market Group of FMR (2004-2009). Mr. Morrison also served as Vice President of Fidelity's Bond Funds (2002-2005), certain Balanced Funds (2002-2005), and certain Asset Allocation Funds (2002-2007), and as Senior Vice President (2002-2005) of Fidelity's Fixed Income Division. |
Nancy D. Prior (1967) |
Year of Election or Appointment: 2012 Vice President of Fidelity's Money Market Funds |
| Ms. Prior also serves as Vice President of other funds. Ms. Prior serves as President, Money Market Group of FMR (2011-present) and is an employee of Fidelity Investments (2002-present). Previously, Ms. Prior served as Managing Director of Research (2009-2011), Senior Vice President and Deputy General Counsel (2007-2009), and Assistant Secretary of other Fidelity funds (2008-2009). |
Christine Reynolds (1958) |
Year of Election or Appointment: 2008 Chief Financial Officer |
| Ms. Reynolds also serves as Chief Financial Officer of other funds. Ms. Reynolds became President of Fidelity Pricing and Cash Management Services (FPCMS) in August 2008. Ms. Reynolds served as Chief Operating Officer of FPCMS (2007-2008). Previously, Ms. Reynolds served as President, Treasurer, and Anti-Money Laundering officer of the Fidelity funds (2004-2007). |
Kenneth B. Robins (1969) |
Year of Election or Appointment: 2009 Assistant Treasurer |
| Mr. Robins also serves as an officer of other funds. Mr. Robins serves as Executive Vice President of Fidelity Investments Money Management, Inc. (FIMM) (2013-present) and is an employee of Fidelity Investments (2004-present). Previously, Mr. Robins served in other fund officer roles. |
Gary W. Ryan (1958) |
Year of Election or Appointment: 2005 Assistant Treasurer |
| Mr. Ryan also serves as Assistant Treasurer of other funds. Mr. Ryan is an employee of Fidelity Investments and has served in other fund officer roles. Previously, Mr. Ryan served as Vice President of Fund Reporting in Fidelity Pricing and Cash Management Services (FPCMS) (1999-2005). |
Stephen Sadoski (1971) |
Year of Election or Appointment: 2013 Deputy Treasurer |
| Mr. Sadoski also serves as Deputy Treasurer of other funds. He is an employee of Fidelity Investments (2012-present) and has served in another fund officer role. Prior to joining Fidelity Investments, Mr. Sadoski served as an assistant chief accountant in the Division of Investment Management of the Securities and Exchange Commission (SEC) (2009-2012) and as a senior manager at Deloitte & Touche LLP (1997-2009). |
Stacie M. Smith (1974) |
Year of Election or Appointment: 2013 Assistant Treasurer |
| Ms. Smith also serves as an officer of other funds. She is an employee of Fidelity Investments (2009-present) and has served in other fund officer roles. Prior to joining Fidelity Investments, Ms. Smith served as Senior Audit Manager of Ernst & Young LLP (1996-2009). |
Renee Stagnone (1975) |
Year of Election or Appointment: 2013 Deputy Treasurer |
| Ms. Stagnone also serves as Deputy Treasurer of other funds. Ms. Stagnone is an employee of Fidelity Investments. |
Michael H. Whitaker (1967) |
Year of Election or Appointment: 2008 Chief Compliance Officer |
| Mr. Whitaker also serves as Chief Compliance Officer of other funds. Mr. Whitaker is an employee of Fidelity Investments (2007-present). Prior to joining Fidelity Investments, Mr. Whitaker worked at MFS Investment Management where he served as Senior Vice President and Chief Compliance Officer (2004-2006), and Assistant General Counsel. |
Derek L. Young (1964) |
Year of Election or Appointment: 2009 Vice President of Fidelity's Asset Allocation Funds |
| Mr. Young also serves as Trustee or an officer of other funds. He is President and a Director of Strategic Advisers, Inc. (2011-present), President of Fidelity Global Asset Allocation (GAA) (2011-present), and Vice Chairman of Pyramis Global Advisors, LLC (2011-present). Previously, Mr. Young served as Chief Investment Officer of GAA (2009-2011) and as a portfolio manager. |
Joseph F. Zambello (1957) |
Year of Election or Appointment: 2011 Deputy Treasurer |
| Mr. Zambello also serves as Deputy Treasurer of other funds. Mr. Zambello is an employee of Fidelity Investments. Previously, Mr. Zambello served as Vice President of FMR's Program Management Group (2009-2011) and Vice President of the Transfer Agent Oversight Group (2005-2009). |
Annual Report
The Board of Trustees of VIP Asset Manager: Growth Portfolio voted to pay to shareholders of record at the opening of business on record date, the following distributions per share derived from capital gains realized from sales of portfolio securities:
| Pay Date | Record Date | Capital Gains |
Initial Class | 02/14/2014 | 02/14/2014 | $0.003 |
Service Class | 02/14/2014 | 02/14/2014 | $0.003 |
Service Class 2 | 02/14/2014 | 02/14/2014 | $0.003 |
Investor Class | 02/14/2014 | 02/14/2014 | $0.003 |
Initial Class designates 25%, Service Class designates 28%, Service Class 2 designates 33%, and Investor Class designates 26%, of the dividends distributed in December 2013 as qualifying for the dividends-received deduction for corporate shareholders.
A total of 4.92% of the dividends distributed during the fiscal year was derived from interest on U.S. Government securities which is generally exempt from state income tax.
Annual Report
Board Approval of Investment Advisory Contracts and Management Fees
VIP Asset Manager: Growth Portfolio
Each year, the Board of Trustees, including the Independent Trustees (together, the Board), votes on the renewal of the management contract with Fidelity Management & Research Company (FMR) and the sub-advisory agreements (together, the Advisory Contracts) for the fund. The Board, assisted by the advice of fund counsel and Independent Trustees' counsel, requests and considers a broad range of information relevant to the renewal of the Advisory Contracts throughout the year.
The Board meets regularly and, at each of its meetings, covers an extensive agenda of topics and materials and considers factors that are relevant to its annual consideration of the renewal of the fund's Advisory Contracts, including the services and support provided to the fund and its shareholders. The Board has established four standing committees, Operations, Audit, Fair Valuation, and Governance and Nominating, each composed of and chaired by Independent Trustees with varying backgrounds, to which the Board has assigned specific subject matter responsibilities in order to enhance effective decision-making by the Board. The Operations Committee, of which all of the Independent Trustees are members, meets regularly throughout the year and, among other matters, considers matters specifically related to the annual consideration of the renewal of the fund's Advisory Contracts. The Board, acting directly and through its Committees, requests and receives information concerning the annual consideration of the renewal of the fund's Advisory Contracts. The Board also meets as needed to consider matters specifically related to the Board's annual consideration of the renewal of Advisory Contracts. Members of the Board may also meet with trustees of other Fidelity funds through ad hoc joint committees to discuss certain matters relevant to the Fidelity funds.
At its September 2013 meeting, the Board, including the Independent Trustees, unanimously determined to renew the fund's Advisory Contracts. In reaching its determination, the Board considered all factors it believed relevant, including (i) the nature, extent, and quality of the services to be provided to the fund and its shareholders (including the investment performance of the fund); (ii) the competitiveness of the fund's management fee and total expense ratio relative to peer funds; (iii) the total costs of the services to be provided by and the profits to be realized by Fidelity from its relationship with the fund; (iv) the extent to which economies of scale exist and would be realized as the fund grows; and (v) whether fee levels reflect these economies of scale, if any, for the benefit of fund shareholders.
In considering whether to renew the Advisory Contracts for the fund, the Board reached a determination, with the assistance of fund counsel and Independent Trustees' counsel and through the exercise of its business judgment, that the renewal of the Advisory Contracts was in the best interests of the fund and its shareholders and that the compensation payable under the Advisory Contracts was fair and reasonable. The Board's decision to renew the Advisory Contracts was not based on any single factor, but rather was based on a comprehensive consideration of all the information provided to the Board at its meetings throughout the year. The Board, in reaching its determination to renew the Advisory Contracts, was aware that shareholders in the fund have a broad range of investment choices available to them, including a wide choice among mutual funds offered by Fidelity's competitors, and that the fund's shareholders, who have the opportunity to review and weigh the disclosure provided by the fund in its prospectus and other public disclosures, have chosen to invest in this fund, which is part of the Fidelity family of funds.
Nature, Extent, and Quality of Services Provided. The Board considered Fidelity's staffing as it relates to the fund, including the backgrounds of investment personnel of FMR and the sub-advisers (together, the Investment Advisers), and also considered the fund's investment objective, strategies, and related investment philosophy. The Independent Trustees also had discussions with senior management of Fidelity's investment operations and investment groups. The Board considered the structure of the portfolio manager compensation program and whether this structure provides appropriate incentives to act in the best interests of the fund.
Resources Dedicated to Investment Management and Support Services. The Board reviewed the general qualifications and capabilities of Fidelity's investment staff, including its size, education, experience, and resources, as well as Fidelity's approach to recruiting, managing, and compensating investment personnel. The Board noted that Fidelity has continued to increase the resources devoted to non-U.S. offices, including expansion of Fidelity's global investment organization. The Board also noted that Fidelity's analysts have extensive resources, tools and capabilities that allow them to conduct sophisticated quantitative and fundamental analysis, as well as credit analysis of issuers, counterparties and guarantors. Further, the Board believes that Fidelity's investment professionals have sufficient access to global information and data so as to provide competitive investment results over time, and that those professionals also have access to sophisticated tools that permit them to assess portfolio construction and risk and performance attribution characteristics continuously, as well as to transmit new information and research conclusions rapidly around the world. Additionally, in its deliberations, the Board considered Fidelity's trading and risk management capabilities and resources, which are an integral part of the investment management process.
Shareholder and Administrative Services. The Board considered (i) the nature, extent, quality, and cost of advisory, administrative, and shareholder services performed by the Investment Advisers and their affiliates under the Advisory Contracts and under separate agreements covering transfer agency, pricing and bookkeeping, and securities lending services for the fund; (ii) the nature and extent of the supervision of third party service providers, principally custodians and subcustodians; and (iii) the resources devoted to, and the record of compliance with, the fund's compliance policies and procedures. The Board also reviewed the allocation of fund brokerage, including allocations to brokers affiliated with the Investment Advisers, the use of brokerage commissions to pay fund expenses, and the use of "soft" commission dollars to pay for research services.
Annual Report
The Board noted that the growth of fund assets over time across the complex allows Fidelity to reinvest in the development of services designed to enhance the value or convenience of the Fidelity funds as investment vehicles. These services include 24-hour access to account information and market information through telephone representatives and over the Internet, investor education materials and asset allocation tools, and the expanded availability of Fidelity Investor Centers.
Investment in a Large Fund Family. The Board considered the benefits to shareholders of investing in a Fidelity fund, including the benefits of investing in a fund that is part of a large family of funds offering a variety of investment disciplines and providing a large variety of mutual fund investor services. The Board noted that Fidelity had taken, or had made recommendations that resulted in the Fidelity funds taking, a number of actions over the previous year that benefited particular funds, including (i) continuing to dedicate additional resources to investment research and to the support of the senior management team that oversees asset management; (ii) persisting in efforts to enhance Fidelity's global research capabilities; (iii) launching new funds and making other enhancements to meet client needs for global and income-oriented solutions; (iv) continuing to launch dedicated lower cost underlying funds to meet portfolio construction needs related to expanding underlying fund options for Fidelity funds of funds, specifically for the Freedom Fund product lines; (v) rationalizing product lines and gaining increased efficiencies through the combination of several funds with other funds; (vi) strengthening Fidelity's index fund offerings by reducing investment minimums and adopting or lowering existing expense caps for certain funds and classes; (vii) enhancing Global Asset Allocation product offerings by launching new funds and strategies, including "open architecture" target date funds that utilize affiliated and unaffiliated sub-advisers; (viii) modifying the eligibility criteria for Institutional Class shares of Advisor funds to increase their marketability to a portion of the defined contribution plan market; (ix) creating a new low-cost retirement share class for certain Advisor funds to appeal to large retirement plans; (x) transitioning the management of certain Fidelity commodity funds to Geode Capital Management LLC, a registered commodity pool operator, while retaining administrative responsibilities for the funds; and (xi) taking steps toward establishing a new Fidelity adviser to manage sector-based funds and products.
Investment Performance. The Board considered whether the fund has operated in accordance with its investment objective, as well as its record of compliance with its investment restrictions and its performance history.
The Board took into account discussions with the Investment Advisers about fund investment performance that occur at Board meetings throughout the year. In this regard the Board noted that as part of regularly scheduled fund reviews and other reports to the Board on fund performance, the Board periodically considers annualized return information for the fund for different time periods, measured against one or more securities market indices, including a customized blended index representative of the fund's asset classes (each a "benchmark index") and a peer group of mutual funds with similar objectives ("peer group"). In its evaluation of fund investment performance at meetings throughout the year, the Board gave particular attention to information indicating underperformance of certain Fidelity funds for specific time periods and the Investment Advisers' explanations for such underperformance.
In addition to reviewing absolute and relative fund performance, the Independent Trustees periodically consider the appropriateness of fund performance metrics in evaluating the results achieved. In general, the Independent Trustees believe that fund performance should be evaluated based on gross performance (before fees and expenses but after transaction costs) compared to appropriate benchmark indices, over appropriate time periods that may include full market cycles, and on net performance (after fees and expenses) compared to peer groups, as applicable, over the same periods, taking into account relevant factors including the following: general market conditions; expectations for interest rate levels and credit conditions; issuer-specific information including credit quality; tactical opportunities for investment; and fund cash flows and other factors. Depending on the circumstances, the Independent Trustees may be satisfied with a fund's performance notwithstanding that it lags its benchmark index or peer group for certain periods.
The Independent Trustees recognize that shareholders evaluate performance on a net basis over their own holding periods, for which one-, three-, and five-year periods are often used as a proxy. For this reason, the performance information reviewed by the Board also included net cumulative calendar year total return information for the fund and an appropriate benchmark index and peer group for the most recent one-, three-, and five-year periods.
Based on its review, the Board concluded that the nature, extent, and quality of services provided to the fund under the Advisory Contracts should benefit the fund's shareholders.
Competitiveness of Management Fee and Total Expense Ratio. The Board considered the fund's management fee and total expense ratio compared to "mapped groups" of competitive funds and classes. Fidelity creates "mapped groups" by combining similar Lipper investment objective categories that have comparable investment mandates. Combining Lipper investment objective categories aids the Board's management fee and total expense ratio comparisons by broadening the competitive group used for comparison and by reducing the number of universes to which various Fidelity funds are compared.
Management Fee. The Board considered two proprietary management fee comparisons for the 12-month periods shown in the chart below. The group of Lipper funds used by the Board for management fee comparisons is referred to below as the "Total Mapped Group." The Total Mapped Group comparison focuses on a fund's standing in terms of gross management fees before expense reimbursements or caps relative to the total universe of funds with comparable investment mandates, regardless of whether their management fee structures also are comparable. "TMG %" represents the percentage of funds in the Total Mapped Group that had management fees that were lower than the fund's. For example, a hypothetical TMG % of 50% would mean that half of the funds in the Total Mapped Group had higher, and half had lower, management fees than the fund. The fund's actual TMG %s are in the chart below. The "Asset-Size Peer Group" (ASPG) comparison focuses on a fund's standing relative to a subset of non-Fidelity funds within the Total Mapped Group that are similar in size and management fee structure. For example, if a fund is in the first quartile of the ASPG, the fund's management fee ranks in the least expensive or lowest 25% of funds in the ASPG. The ASPG represents at least 15% of the funds in the Total Mapped Group with comparable asset size and management fee structures, subject to a minimum of 50 funds (or all funds in the Total Mapped Group if fewer than 50). Additional information, such as the ASPG quartile in which the fund's management fee rate ranked, is also included in the chart and considered by the Board.
Annual Report
Board Approval of Investment Advisory Contracts and Management Fees - continued
VIP Asset Manager: Growth Portfolio
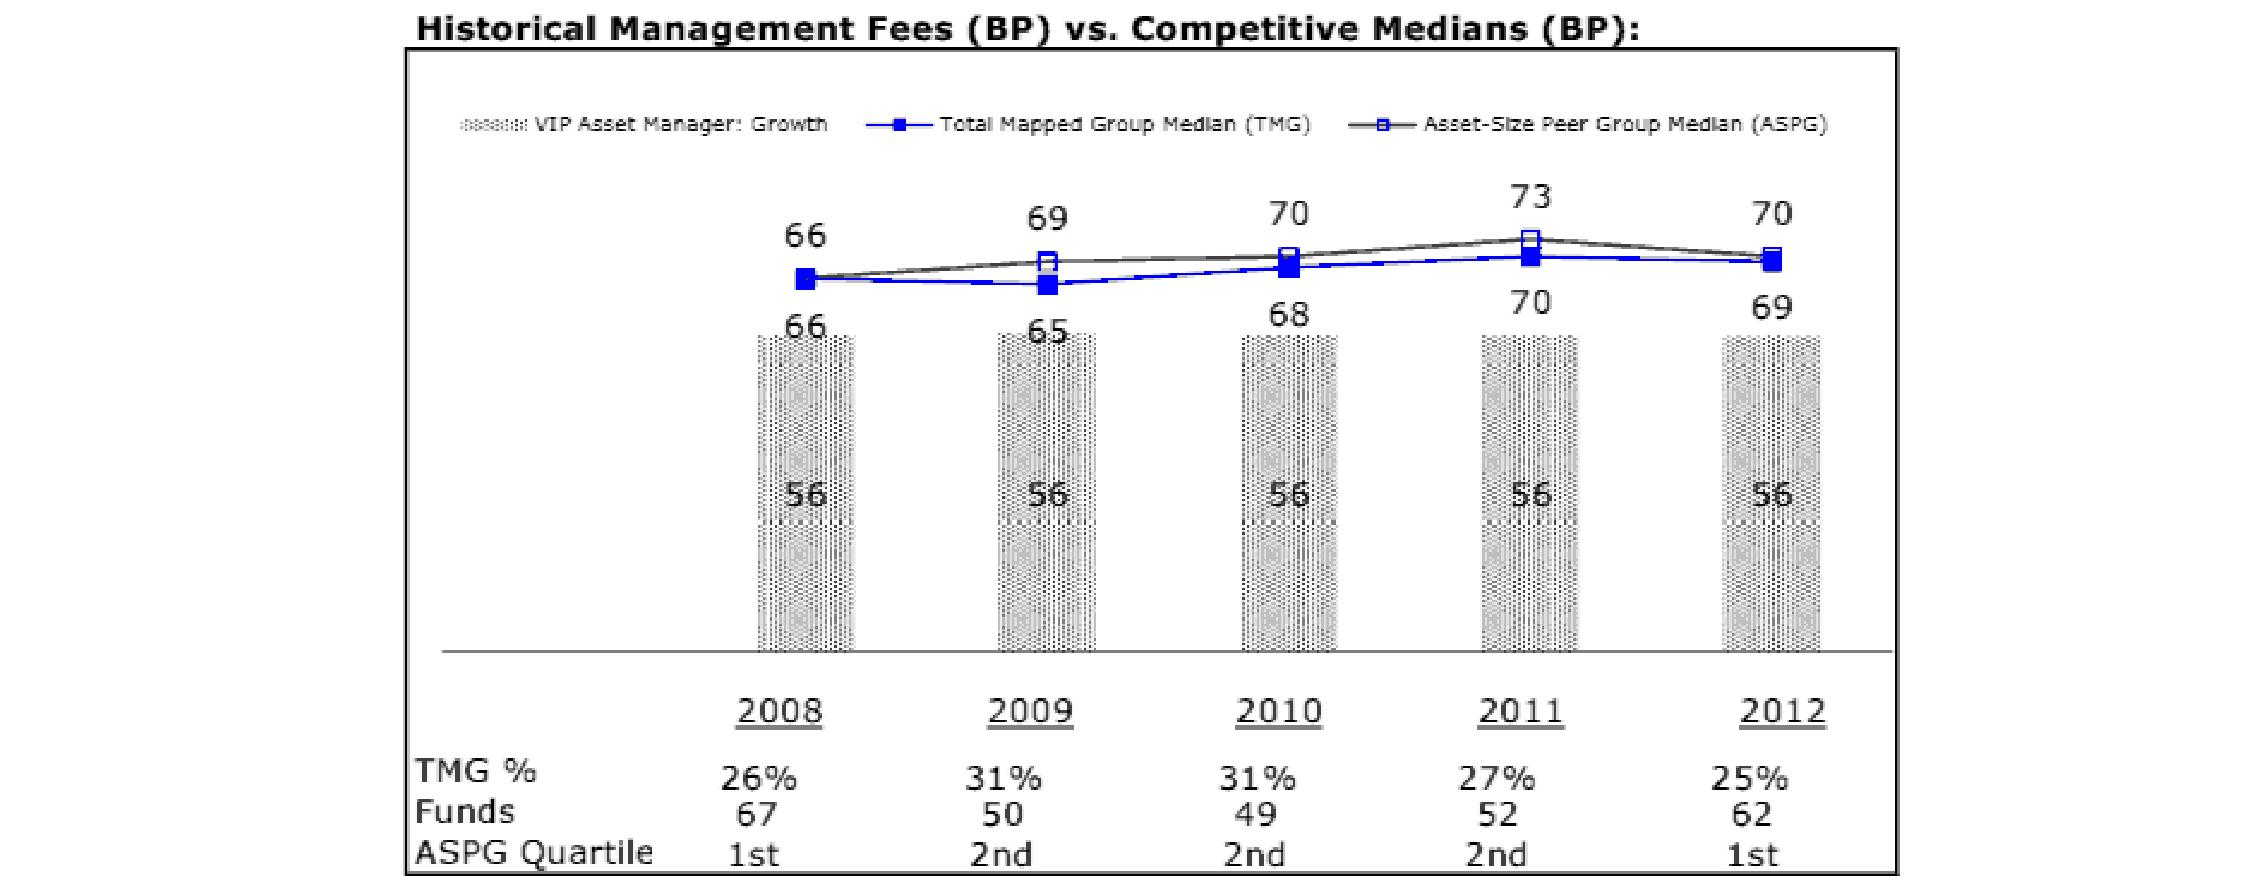
The Board noted that the fund's management fee rate ranked below the median of its Total Mapped Group and below the median of its ASPG for 2012.
Based on its review, the Board concluded that the fund's management fee is fair and reasonable in light of the services that the fund receives and the other factors considered.
Total Expense Ratio. In its review of each class's total expense ratio, the Board considered the fund's management fee as well as other fund or class expenses, as applicable, such as transfer agent fees, pricing and bookkeeping fees, fund-paid 12b-1 fees, and custodial, legal, and audit fees. The Board also noted the effects of any waivers and reimbursements on fees and expenses. As part of its review, the Board also considered the current and historical total expense ratios of each class of the fund compared to competitive fund median expenses. Each class of the fund is compared to those funds and classes in the Total Mapped Group (used by the Board for management fee comparisons) that have a similar sales load structure.
The Board noted that the total expense ratio of each of Initial Class, Investor Class, and Service Class ranked below its competitive median for 2012 and the total expense ratio of Service Class 2 ranked above its competitive median for 2012. The Board considered that, in general, various factors can affect total expense ratios. The Board noted that the total expense ratio of Service Class 2 was above the competitive median primarily because of higher 12b-1 fees for Service Class 2 as compared to most competitor funds. The Board noted that the fund offers multiple classes, each of which has a different 12b-1 fee structure, and that the multiple structures are intended to offer a range of pricing options for the intermediary market. The Board also noted that the total expense ratios of the classes vary primarily by the level of their 12b-1 fees, although differences in transfer agent fees may also cause expenses to vary from class to class.
Fees Charged to Other Fidelity Clients. The Board also considered Fidelity fee structures and other information with respect to clients of Fidelity, such as other mutual funds advised or subadvised by Fidelity, pension plan clients, and other institutional clients. The Board noted the findings of the 2013 ad hoc joint committee (created with the board of other Fidelity funds), which reviewed and compared Fidelity's institutional investment advisory business with its business of providing services to the Fidelity funds, including the differences in services provided, fees charged, and costs incurred, as well as competition in their respective marketplaces.
Based on its review of total expense ratios and fees charged to other Fidelity clients, the Board concluded that the total expense ratio of each class of the fund was reasonable, although Service Class 2 was above the median of the universe presented for comparison, in light of the services that the fund and its shareholders receive and the other factors considered.
Annual Report
Costs of the Services and Profitability. The Board considered the revenues earned and the expenses incurred by Fidelity in conducting the business of developing, marketing, distributing, managing, administering and servicing the fund and servicing the fund's shareholders. The Board also considered the level of Fidelity's profits in respect of all the Fidelity funds.
On an annual basis, Fidelity presents to the Board Fidelity's profitability for the fund. Fidelity calculates the profitability for each fund, as well as aggregate profitability for groups of Fidelity funds and all Fidelity funds, using a series of detailed revenue and cost allocation methodologies which originate with the books and records of Fidelity on which Fidelity's audited financial statements are based. The Audit Committee of the Board reviews any significant changes from the prior year's methodologies.
PricewaterhouseCoopers LLP (PwC), independent registered public accounting firm and auditor to Fidelity and certain Fidelity funds, has been engaged annually by the Board as part of the Board's assessment of Fidelity's profitability analysis. PwC's engagement includes the review and assessment of the methodologies used by Fidelity in determining the revenues and expenses attributable to Fidelity's mutual fund business, and completion of agreed-upon procedures surrounding the mathematical accuracy of fund profitability and its conformity to allocation methodologies. After considering PwC's reports issued under the engagement and information provided by Fidelity, the Board concluded that while other allocation methods may also be reasonable, Fidelity's profitability methodologies are reasonable in all material respects.
The Board also reviewed Fidelity's non-fund businesses and fall-out benefits related to the mutual fund business as well as cases where Fidelity's affiliates may benefit from or be related to the fund's business.
The Board considered the costs of the services provided by and the profits realized by Fidelity in connection with the operation of the fund and was satisfied that the profitability was not excessive in the circumstances.
Economies of Scale. The Board considered whether there have been economies of scale in respect of the management of the Fidelity funds, whether the Fidelity funds (including the fund) have appropriately benefited from any such economies of scale, and whether there is potential for realization of any further economies of scale. The Board considered the extent to which the fund will benefit from economies of scale through increased services to the fund, through waivers or reimbursements, or through fee or expense reductions. The Board also noted that in 2009, it and the board of other Fidelity funds created an ad hoc committee (the Economies of Scale Committee) to analyze whether Fidelity attains economies of scale in respect of the management and servicing of the Fidelity funds, whether the Fidelity funds have appropriately benefited from such economies of scale, and whether there is potential for realization of any further economies of scale.
The Board recognized that the fund's management contract incorporates a "group fee" structure, which provides for lower group fee rates as total fund assets under FMR's management increase, and for higher group fee rates as total fund assets under FMR's management decrease. FMR calculates the group fee rates based on a tiered asset "breakpoint" schedule that varies based on asset class. The Board considered that the group fee is designed to deliver the benefits of economies of scale to fund shareholders when total Fidelity fund assets increase, even if assets of any particular fund are unchanged or have declined, because some portion of Fidelity's costs are attributable to services provided to all Fidelity funds, and all funds benefit if those costs can be allocated among more assets. The Board concluded that, given the group fee structure, fund shareholders will benefit from lower management fees as assets under FMR's management increase at the fund complex level, regardless of whether Fidelity achieves any such economies of scale.
The Board concluded, taking into account the analysis of the Economies of Scale Committee, that economies of scale, if any, are being appropriately shared between fund shareholders and Fidelity.
Amendment to Description of Group Fee Rate. At its September 2013 meeting, the Board voted to approve an amendment to the fund's management contract to modify the description of the "group fee rate." The Board noted that under the prior description in the contract, the group fee rate was based on the average net assets of all registered investment companies with which FMR has management contracts. Under the contract's tiered asset breakpoint schedule, the group fee rate is lower as total fund assets under FMR's management increase, and higher as total fund assets under FMR's management decrease. The Board considered that the prior description would have excluded the assets of 64 Fidelity sector funds from the group fee rate calculation once Fidelity SelectCo, LLC, an affiliate of FMR, assumed management responsibilities for those funds. The Board noted that modifying the description of the group fee rate to continue to include the assets of those 64 funds for purposes of determining group fee rate breakpoints would avoid an immediate adverse impact on the group fee rate for any fund.
Additional Information Requested by the Board. In order to develop fully the factual basis for consideration of the Fidelity funds' Advisory Contracts, the Board requested and received additional information on certain topics, including: (i) Fidelity's fund profitability methodology, profitability trends for certain funds, and the impact of certain factors on fund profitability results; (ii) portfolio manager changes that have occurred during the past year and the amount of the investment that each portfolio manager has made in the Fidelity fund(s) that he or she manages; (iii) Fidelity's compensation structure for portfolio managers, research analysts, and other key personnel, including its effects on fund profitability, the rationale for the compensation structure, and the extent to which current market conditions have affected retention and recruitment; (iv) the arrangements with and compensation paid to certain fund sub-advisers on behalf of the Fidelity funds; (v) Fidelity's fee structures, including the group fee structure and definition of group assets, and the rationale for recommending different fees among different categories of funds and classes; (vi) Fidelity's voluntary waiver of its fees to maintain minimum yields for certain money market funds and classes as well as contractual waivers in place for certain funds; (vii) the methodology with respect to competitive fund data and peer group classifications; (viii) Fidelity's transfer agent fee, expense, and service structures for different funds and classes, and the impact of the increased use of omnibus accounts; and (ix) explanations regarding the relative total expense ratios of certain funds and classes, total expense competitive trends and methodologies for total expense competitive comparisons, and actions that might be taken by Fidelity to reduce total expense ratios for certain funds and classes or to achieve further economies of scale.
Annual Report
Board Approval of Investment Advisory Contracts and Management Fees - continued
Based on its evaluation of all of the conclusions noted above, and after considering all factors it believed relevant, the Board ultimately concluded that the advisory fee structures are fair and reasonable, and that the fund's Advisory Contracts should be renewed.
Annual Report
Investment Adviser
Fidelity Management & Research Company
Boston, MA
Investment Sub-Advisers
FMR Co., Inc.
Fidelity Management & Research (U.K.) Inc.
Fidelity Management & Research (Hong Kong) Limited
Fidelity Management & Research (Japan) Inc.
Fidelity Investments Money Management, Inc.
General Distributor
Fidelity Distributors Corporation
Smithfield, RI
Transfer and Service Agents
Fidelity Investments Institutional Operations Company, Inc.
Boston, MA
Fidelity Service Company, Inc.
Boston, MA
Custodian
JPMorgan Chase Bank
New York, NY
VIPAMG-ANN-0214
1.540207.116
Fidelity® Variable Insurance Products:
Freedom Funds -
Income, 2005, 2010, 2015, 2020, 2025, 2030, 2035, 2040, 2045, 2050
Annual Report
December 31, 2013
(Fidelity Cover Art)
Contents
Annual Report
To view a fund's proxy voting guidelines and proxy voting record for the 12-month period ended June 30, visit http://www.fidelity.com/proxyvotingresults or visit the Securities and Exchange Commission's (SEC) web site at http://www.sec.gov. You may also call 1-877-208-0098 to request a free copy of the proxy voting guidelines.
Fidelity Variable Insurance Products are separate account options which are purchased through a variable insurance contract.
Standard & Poor's, S&P and S&P 500 are registered service marks of The McGraw-Hill Companies, Inc. and have been licensed for use by Fidelity Distributors Corporation.
Other third-party marks appearing herein are the property of their respective owners.
All other marks appearing herein are registered or unregistered trademarks or service marks of FMR LLC or an affiliated company. © 2014 FMR LLC. All rights reserved.
This report and the financial statements contained herein are submitted for the general information of the shareholders of the funds. This report is not authorized for distribution to prospective investors in the funds unless preceded or accompanied by an effective prospectus.
A fund files its complete schedule of portfolio holdings with the SEC for the first and third quarters of each fiscal year on Form N-Q. Forms N-Q are available on the SEC's web site at http://www.sec.gov. A fund's Forms N-Q may be reviewed and copied at the SEC's Public Reference Room in Washington, DC. Information regarding the operation of the SEC's Public Reference Room may be obtained by calling 1-800-SEC-0330. For a complete list of a fund's portfolio holdings, view the most recent holdings listing, semiannual report, or annual report on Fidelity's web site at http://www.fidelity.com, http://www.advisor.fidelity.com, or http://www.401k.com, as applicable.
NOT FDIC INSURED • MAY LOSE VALUE • NO BANK GUARANTEE
Neither the funds nor Fidelity Distributors Corporation is a bank.
Annual Report
VIP Freedom Income PortfolioSM
Average annual total return reflects the change in the value of an investment, assuming reinvestment of the class' distributions from dividend income and capital gains (the profits earned upon the sale of securities that have grown in value, if any) and assuming a constant rate of performance each year. During periods of reimbursement by Fidelity, a fund's total return will be greater than it would be had the reimbursement not occurred. Performance numbers are net of all underlying fund operating expenses, but do not include any insurance charges imposed by your insurance company's separate account. If performance information included the effect of these additional charges, the total returns would have been lower. How a fund did yesterday is no guarantee of how it will do tomorrow.
Average Annual Total Returns
Periods ended December 31, 2013 | Past 1
year | Past 5
years | Life of
FundA |
VIP Freedom Income PortfolioSM - Initial Class | 5.55% | 7.14% | 4.78% |
VIP Freedom Income Portfolio - Service Class | 5.38% | 7.04% | 4.67% |
VIP Freedom Income Portfolio - Service Class 2 | 5.21% | 6.86% | 4.51% |
A From April 26, 2005.
$10,000 Over Life of Fund
Let's say hypothetically that $10,000 was invested in VIP Freedom Income Portfolio - Initial Class on April 26, 2005, when the fund started. The chart shows how the value of your investment would have changed, and also shows how the Barclays® U.S. Aggregate Bond Index performed over the same period.
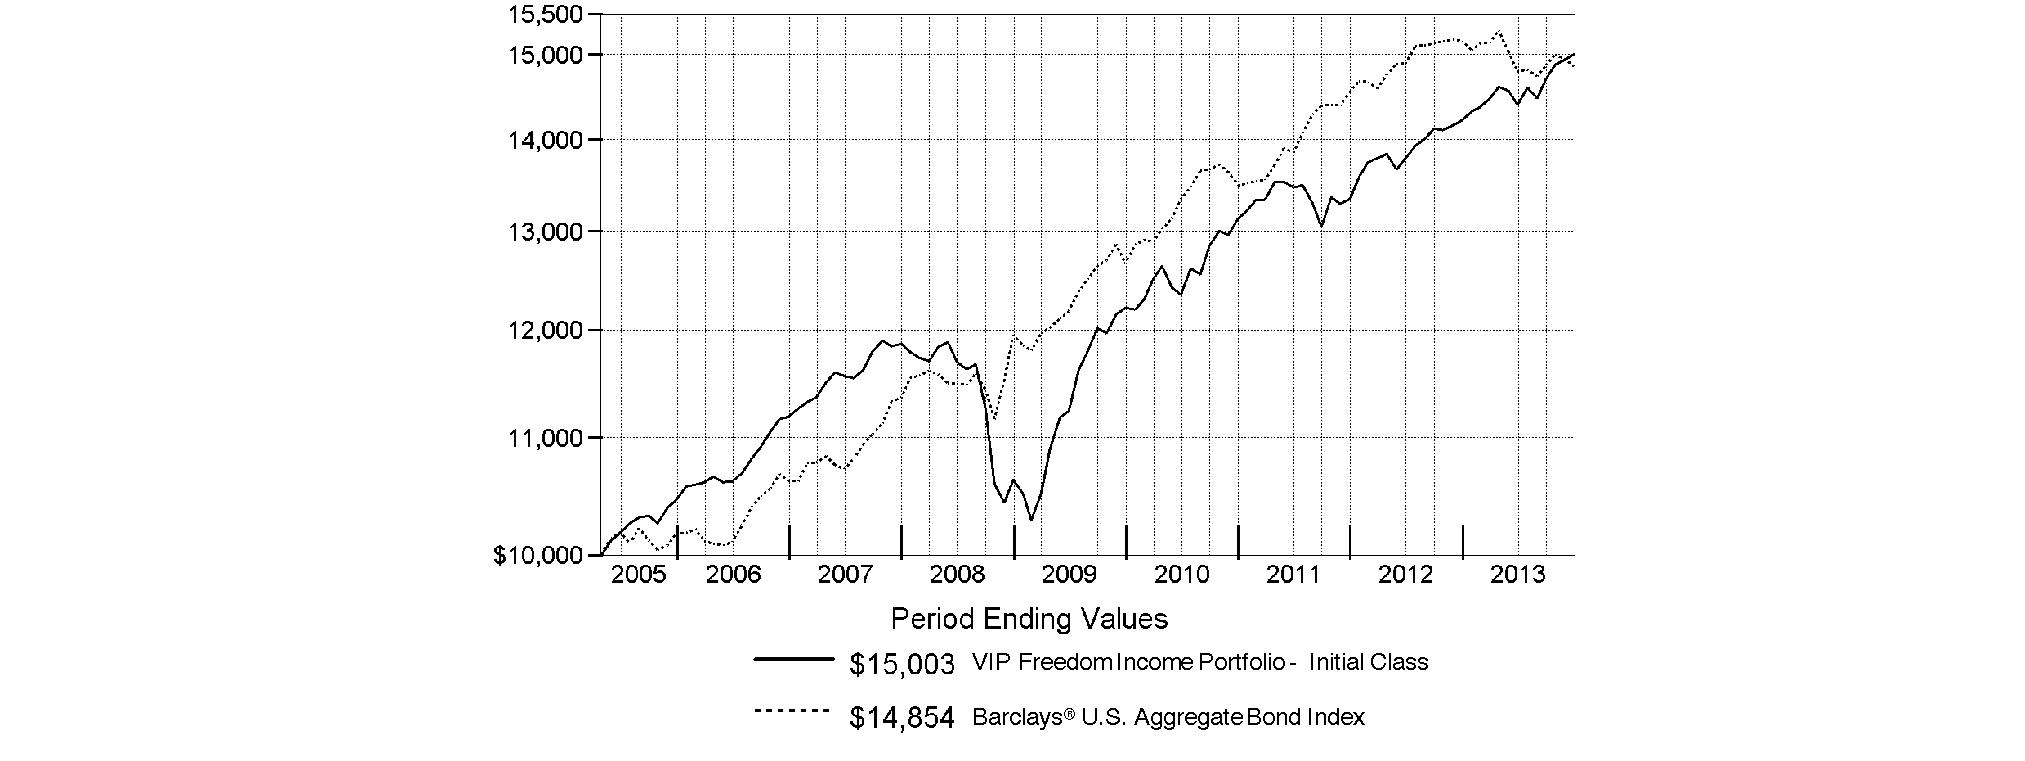
Annual Report
VIP Freedom 2005 PortfolioSM
Performance: The Bottom Line
Average annual total return reflects the change in the value of an investment, assuming reinvestment of the class' distributions from dividend income and capital gains (the profits earned upon the sale of securities that have grown in value, if any) and assuming a constant rate of performance each year. During periods of reimbursement by Fidelity, a fund's total return will be greater than it would be had the reimbursement not occurred. Performance numbers are net of all underlying fund operating expenses, but do not include any insurance charges imposed by your insurance company's separate account. If performance information included the effect of these additional charges, the total returns would have been lower. How a fund did yesterday is no guarantee of how it will do tomorrow.
Average Annual Total Returns
Periods ended December 31, 2013 | Past 1
year | Past 5
years | Life of
FundA |
VIP Freedom 2005 PortfolioSM - Initial Class | 9.74% | 10.53% | 5.68% |
VIP Freedom 2005 Portfolio - Service Class | 9.60% | 10.44% | 5.57% |
VIP Freedom 2005 Portfolio - Service Class 2 | 9.46% | 10.27% | 5.41% |
A From April 26, 2005.
$10,000 Over Life of Fund
Let's say hypothetically that $10,000 was invested in VIP Freedom 2005 Portfolio - Initial Class on April 26, 2005, when the fund started. The chart shows how the value of your investment would have changed, and also shows how the Barclays U.S. Aggregate Bond Index performed over the same period.
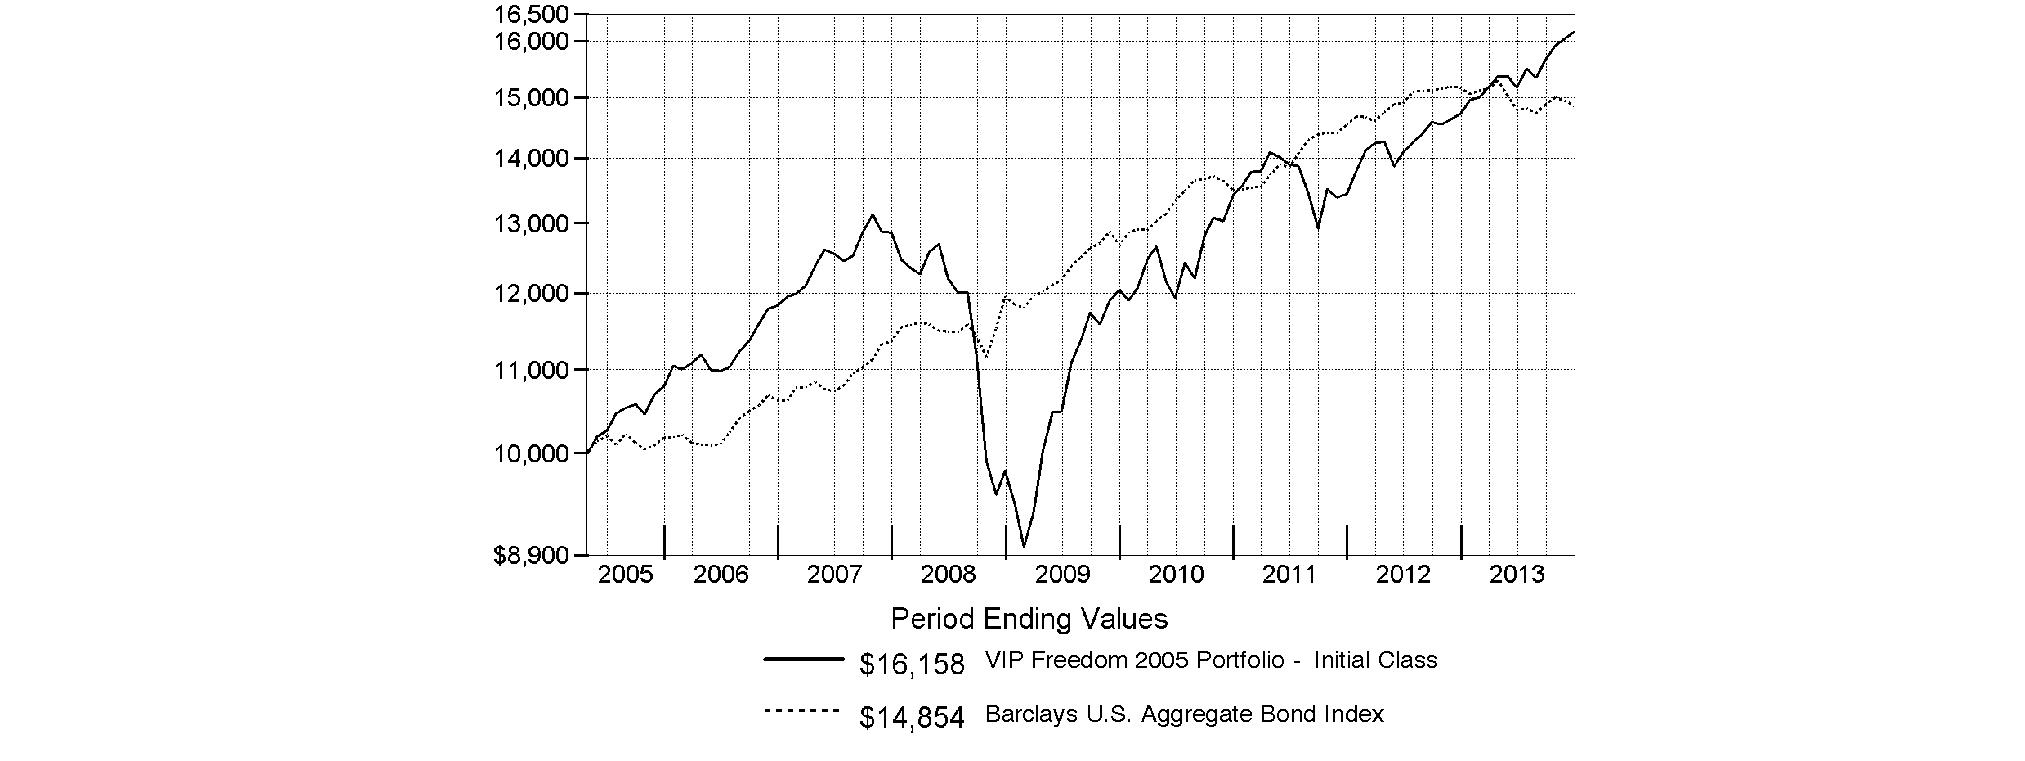
Annual Report
VIP Freedom 2010 PortfolioSM
Performance: The Bottom Line
Average annual total return reflects the change in the value of an investment, assuming reinvestment of the class' distributions from dividend income and capital gains (the profits earned upon the sale of securities that have grown in value, if any) and assuming a constant rate of performance each year. During periods of reimbursement by Fidelity, a fund's total return will be greater than it would be had the reimbursement not occurred. Performance numbers are net of all underlying fund operating expenses, but do not include any insurance charges imposed by your insurance company's separate account. If performance information included the effect of these additional charges, the total returns would have been lower. How a fund did yesterday is no guarantee of how it will do tomorrow.
Average Annual Total Returns
Periods ended December 31, 2013 | Past 1
year | Past 5
years | Life of
FundA |
VIP Freedom 2010 PortfolioSM - Initial Class | 13.49% | 12.19% | 6.46% |
VIP Freedom 2010 Portfolio - Service Class | 13.39% | 12.07% | 6.36% |
VIP Freedom 2010 Portfolio - Service Class 2 | 13.20% | 11.90% | 6.20% |
A From April 26, 2005.
$10,000 Over Life of Fund
Let's say hypothetically that $10,000 was invested in VIP Freedom 2010 Portfolio - Initial Class on April 26, 2005, when the fund started. The chart shows how the value of your investment would have changed, and also shows how the Barclays U.S. Aggregate Bond Index performed over the same period.
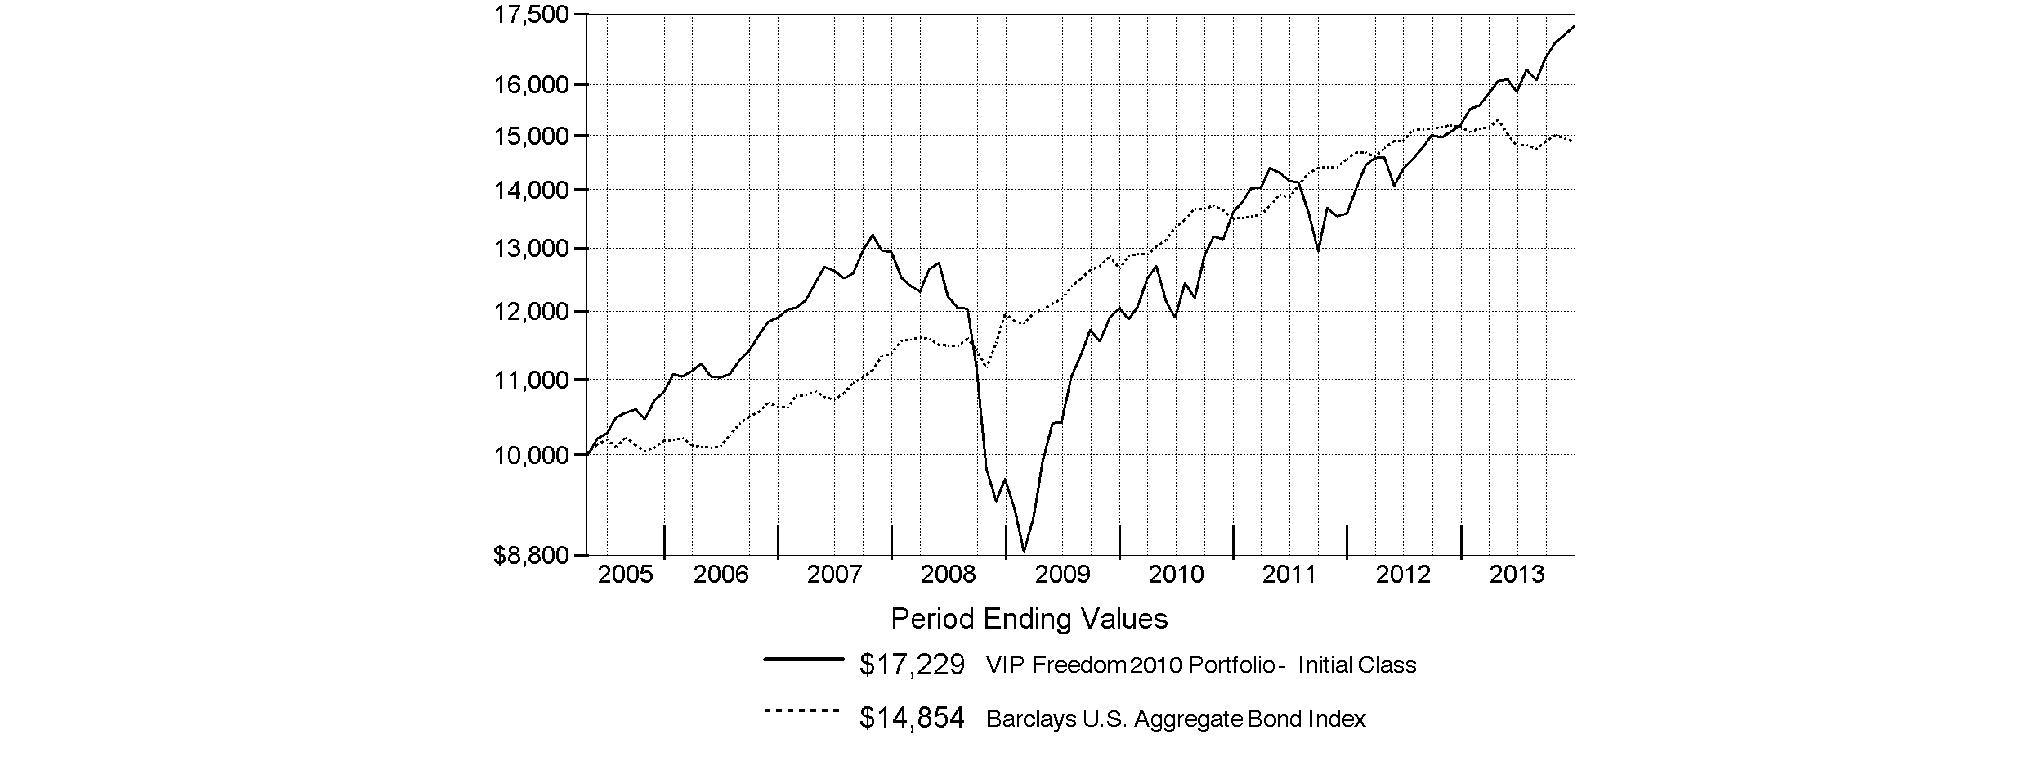
Annual Report
VIP Freedom 2015 PortfolioSM
Performance: The Bottom Line
Average annual total return reflects the change in the value of an investment, assuming reinvestment of the class' distributions from dividend income and capital gains (the profits earned upon the sale of securities that have grown in value, if any) and assuming a constant rate of performance each year. During periods of reimbursement by Fidelity, a fund's total return will be greater than it would be had the reimbursement not occurred. Performance numbers are net of all underlying fund operating expenses, but do not include any insurance charges imposed by your insurance company's separate account. If performance information included the effect of these additional charges, the total returns would have been lower. How a fund did yesterday is no guarantee of how it will do tomorrow.
Average Annual Total Returns
Periods ended December 31, 2013 | Past 1
year | Past 5
years | Life of
FundA |
VIP Freedom 2015 PortfolioSM - Initial Class | 14.41% | 12.63% | 6.78% |
VIP Freedom 2015 Portfolio - Service Class | 14.24% | 12.51% | 6.67% |
VIP Freedom 2015 Portfolio - Service Class 2 | 14.10% | 12.36% | 6.51% |
A From April 26, 2005.
$10,000 Over Life of Fund
Let's say hypothetically that $10,000 was invested in VIP Freedom 2015 Portfolio - Initial Class on April 26, 2005, when the fund started. The chart shows how the value of your investment would have changed, and also shows how the S&P 500® Index performed over the same period.
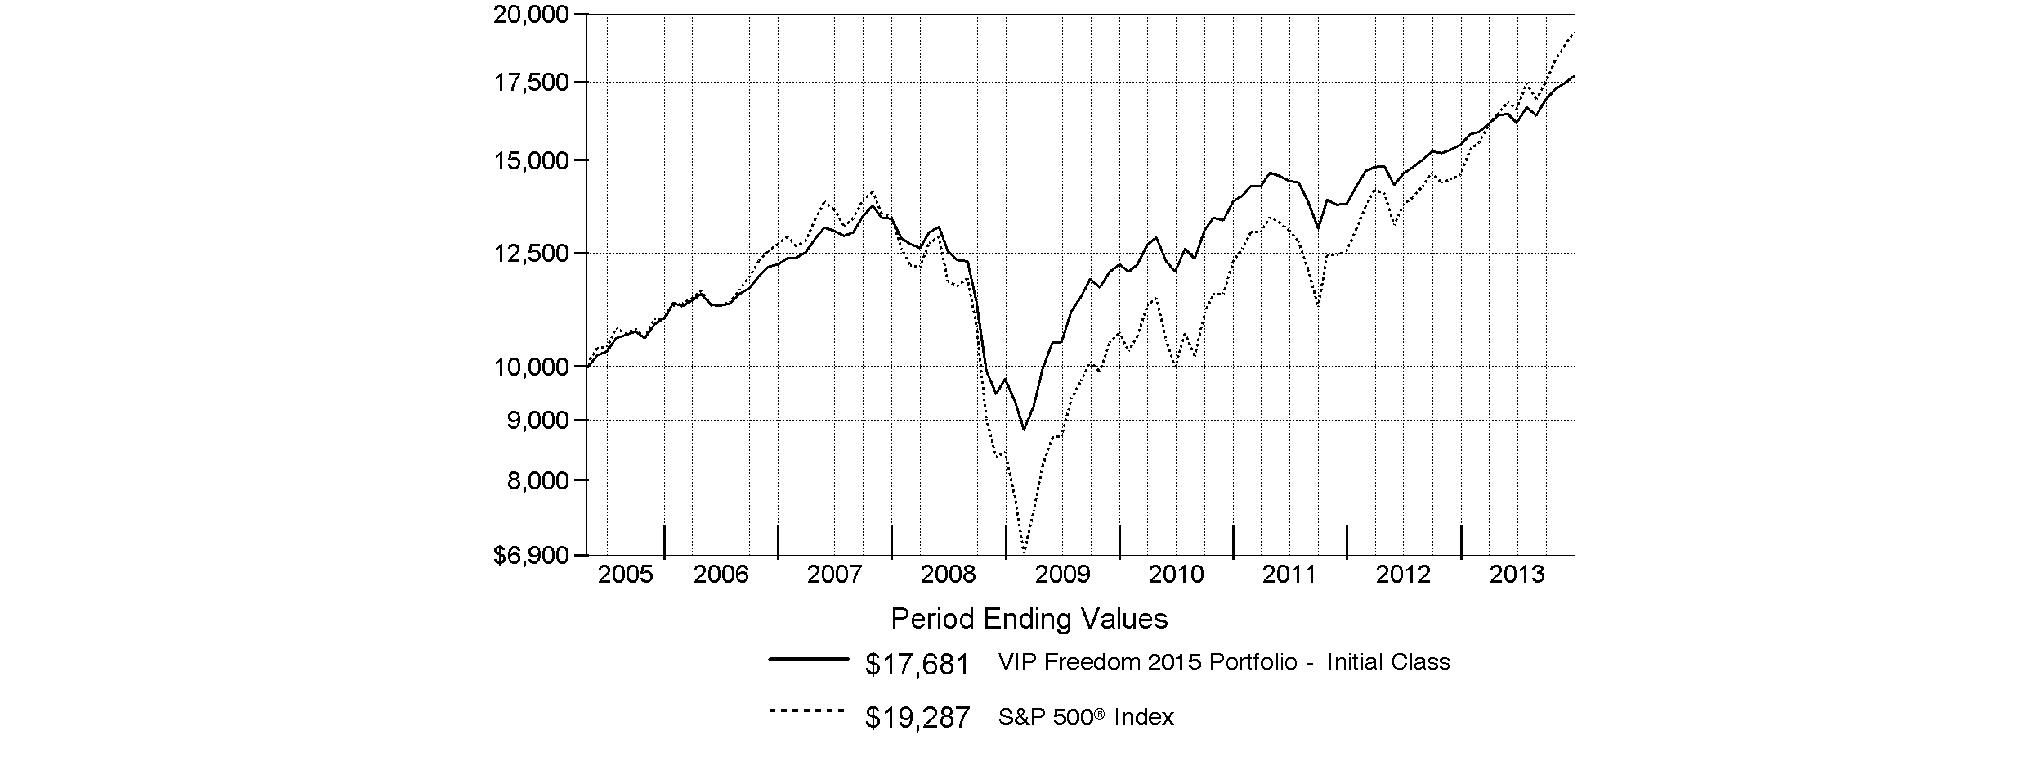
Annual Report
VIP Freedom 2020 PortfolioSM
Performance: The Bottom Line
Average annual total return reflects the change in the value of an investment, assuming reinvestment of the class' distributions from dividend income and capital gains (the profits earned upon the sale of securities that have grown in value, if any) and assuming a constant rate of performance each year. During periods of reimbursement by Fidelity, a fund's total return will be greater than it would be had the reimbursement not occurred. Performance numbers are net of all underlying fund operating expenses, but do not include any insurance charges imposed by your insurance company's separate account. If performance information included the effect of these additional charges, the total returns would have been lower. How a fund did yesterday is no guarantee of how it will do tomorrow.
Average Annual Total Returns
Periods ended December 31, 2013 | Past 1
year | Past 5
years | Life of
FundA |
VIP Freedom 2020 PortfolioSM - Initial Class | 16.01% | 13.96% | 6.86% |
VIP Freedom 2020 Portfolio - Service Class | 15.95% | 13.86% | 6.76% |
VIP Freedom 2020 Portfolio - Service Class 2 | 15.63% | 13.67% | 6.59% |
A From April 26, 2005.
$10,000 Over Life of Fund
Let's say hypothetically that $10,000 was invested in VIP Freedom 2020 Portfolio - Initial Class on April 26, 2005, when the fund started. The chart shows how the value of your investment would have changed, and also shows how the S&P 500 Index performed over the same period.
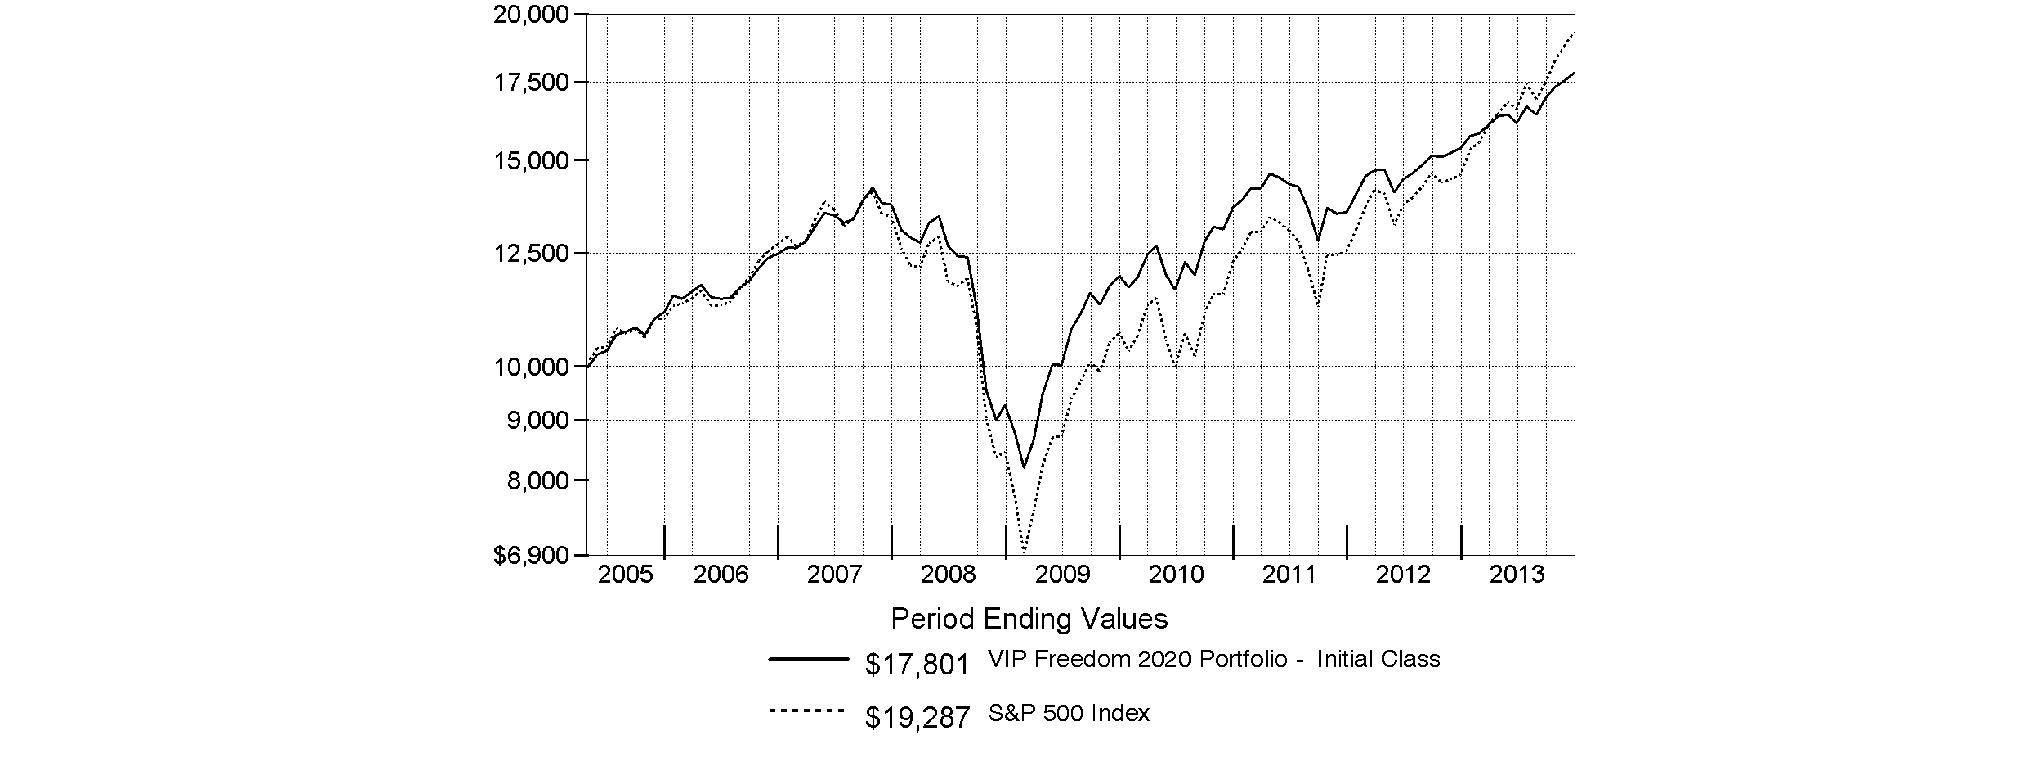
Annual Report
VIP Freedom 2025 PortfolioSM
Performance: The Bottom Line
Average annual total return reflects the change in the value of an investment, assuming reinvestment of the class' distributions from dividend income and capital gains (the profits earned upon the sale of securities that have grown in value, if any) and assuming a constant rate of performance each year. During periods of reimbursement by Fidelity, a fund's total return will be greater than it would be had the reimbursement not occurred. Performance numbers are net of all underlying fund operating expenses, but do not include any insurance charges imposed by your insurance company's separate account. If performance information included the effect of these additional charges, the total returns would have been lower. How a fund did yesterday is no guarantee of how it will do tomorrow.
Average Annual Total Returns
Periods ended December 31, 2013 | Past 1
year | Past 5
years | Life of
FundA |
VIP Freedom 2025 PortfolioSM - Initial Class | 19.95% | 15.27% | 7.47% |
VIP Freedom 2025 Portfolio - Service Class | 19.89% | 15.16% | 7.36% |
VIP Freedom 2025 Portfolio - Service Class 2 | 19.71% | 15.00% | 7.20% |
A From April 26, 2005.
$10,000 Over Life of Fund
Let's say hypothetically that $10,000 was invested in VIP Freedom 2025 Portfolio - Initial Class on April 26, 2005, when the fund started. The chart shows how the value of your investment would have changed, and also shows how the S&P 500 Index performed over the same period.

Annual Report
VIP Freedom 2030 PortfolioSM
Performance: The Bottom Line
Average annual total return reflects the change in the value of an investment, assuming reinvestment of the class' distributions from dividend income and capital gains (the profits earned upon the sale of securities that have grown in value, if any) and assuming a constant rate of performance each year. During periods of reimbursement by Fidelity, a fund's total return will be greater than it would be had the reimbursement not occurred. Performance numbers are net of all underlying fund operating expenses, but do not include any insurance charges imposed by your insurance company's separate account. If performance information included the effect of these additional charges, the total returns would have been lower. How a fund did yesterday is no guarantee of how it will do tomorrow.
Average Annual Total Returns
Periods ended December 31, 2013 | Past 1
year | Past 5
years | Life of
FundA |
VIP Freedom 2030 PortfolioSM - Initial Class | 21.66% | 15.92% | 7.36% |
VIP Freedom 2030 Portfolio - Service Class | 21.50% | 15.79% | 7.25% |
VIP Freedom 2030 Portfolio - Service Class 2 | 21.41% | 15.62% | 7.09% |
A From April 26, 2005.
$10,000 Over Life of Fund
Let's say hypothetically that $10,000 was invested in VIP Freedom 2030 Portfolio - Initial Class on April 26, 2005, when the fund started. The chart shows how the value of your investment would have changed, and also shows how the S&P 500 Index performed over the same period.
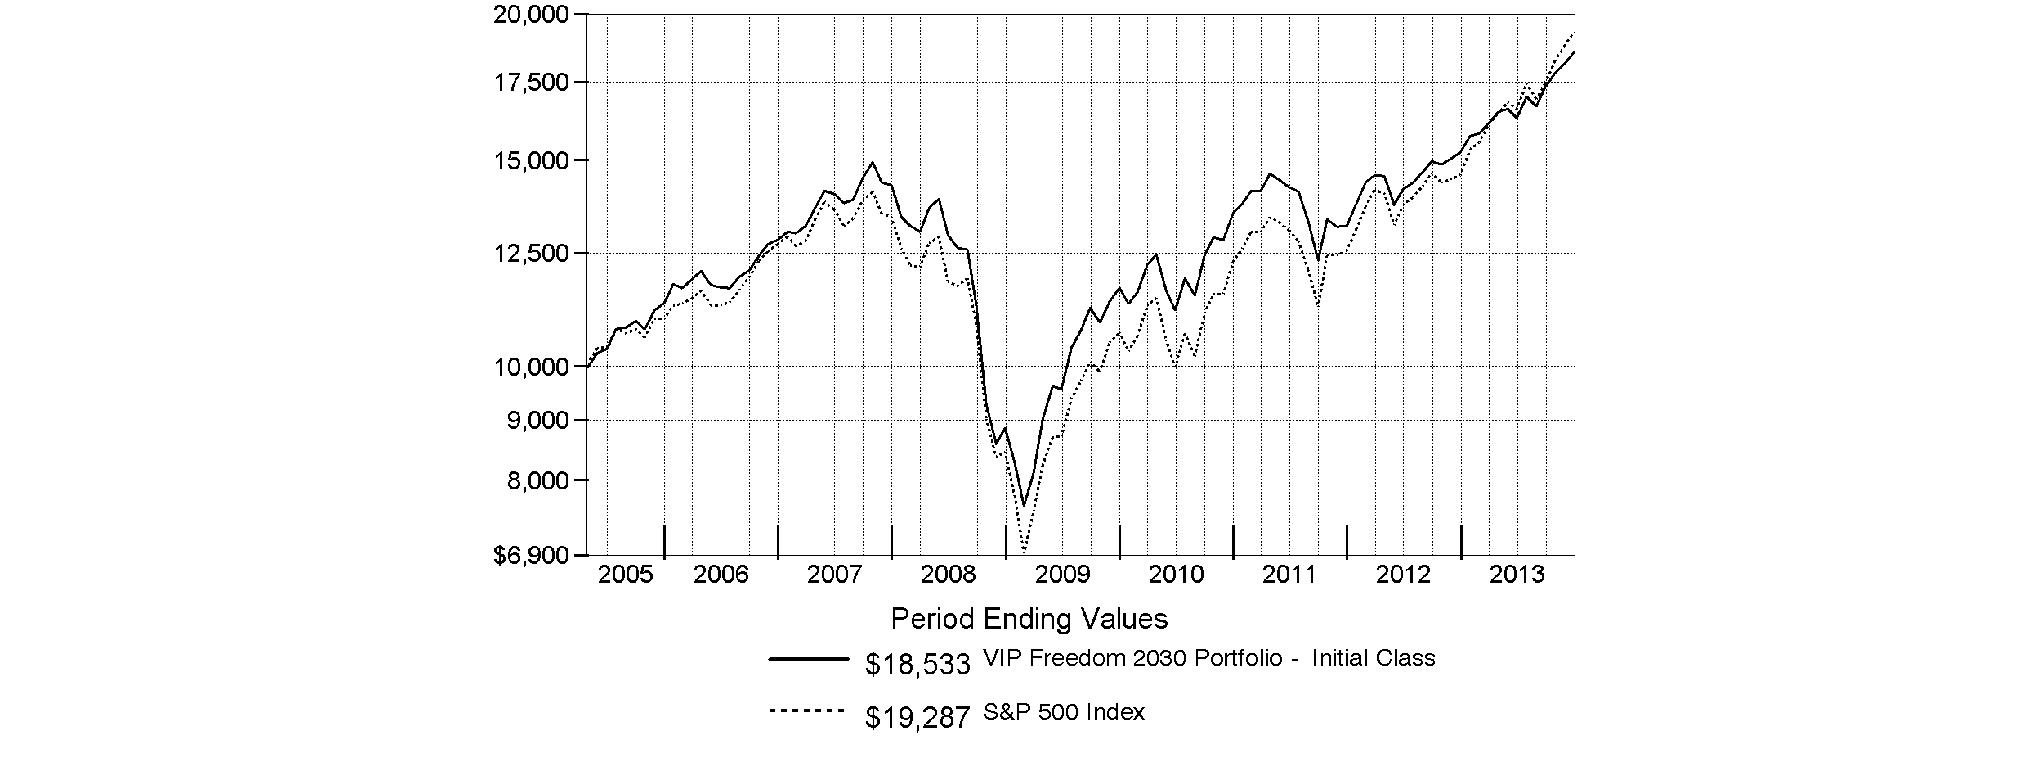
Annual Report
VIP Freedom 2035 PortfolioSM
Performance: The Bottom Line
Average annual total return reflects the change in the value of an investment, assuming reinvestment of the class' distributions from dividend income and capital gains (the profits earned upon the sale of securities that have grown in value, if any) and assuming a constant rate of performance each year. During periods of reimbursement by Fidelity, a fund's total return will be greater than it would be had the reimbursement not occurred. Performance numbers are net of all underlying fund operating expenses, but do not include any insurance charges imposed by your insurance company's separate account. If performance information included the effect of these additional charges, the total returns would have been lower. How a fund did yesterday is no guarantee of how it will do tomorrow.
Average Annual Total Returns
Periods ended December 31, 2013 | Past 1
year | Life of
FundA |
VIP Freedom 2035 PortfolioSM - Initial Class | 24.84% | 19.18% |
VIP Freedom 2035 Portfolio - Service Class | 24.72% | 19.06% |
VIP Freedom 2035 Portfolio - Service Class 2 | 24.50% | 18.88% |
A From April 8, 2009.
$10,000 Over Life of Fund
Let's say hypothetically that $10,000 was invested in VIP Freedom 2035 Portfolio - Initial Class on April 8, 2009, when the fund started. The chart shows how the value of your investment would have changed, and also shows how the S&P 500 Index performed over the same period.
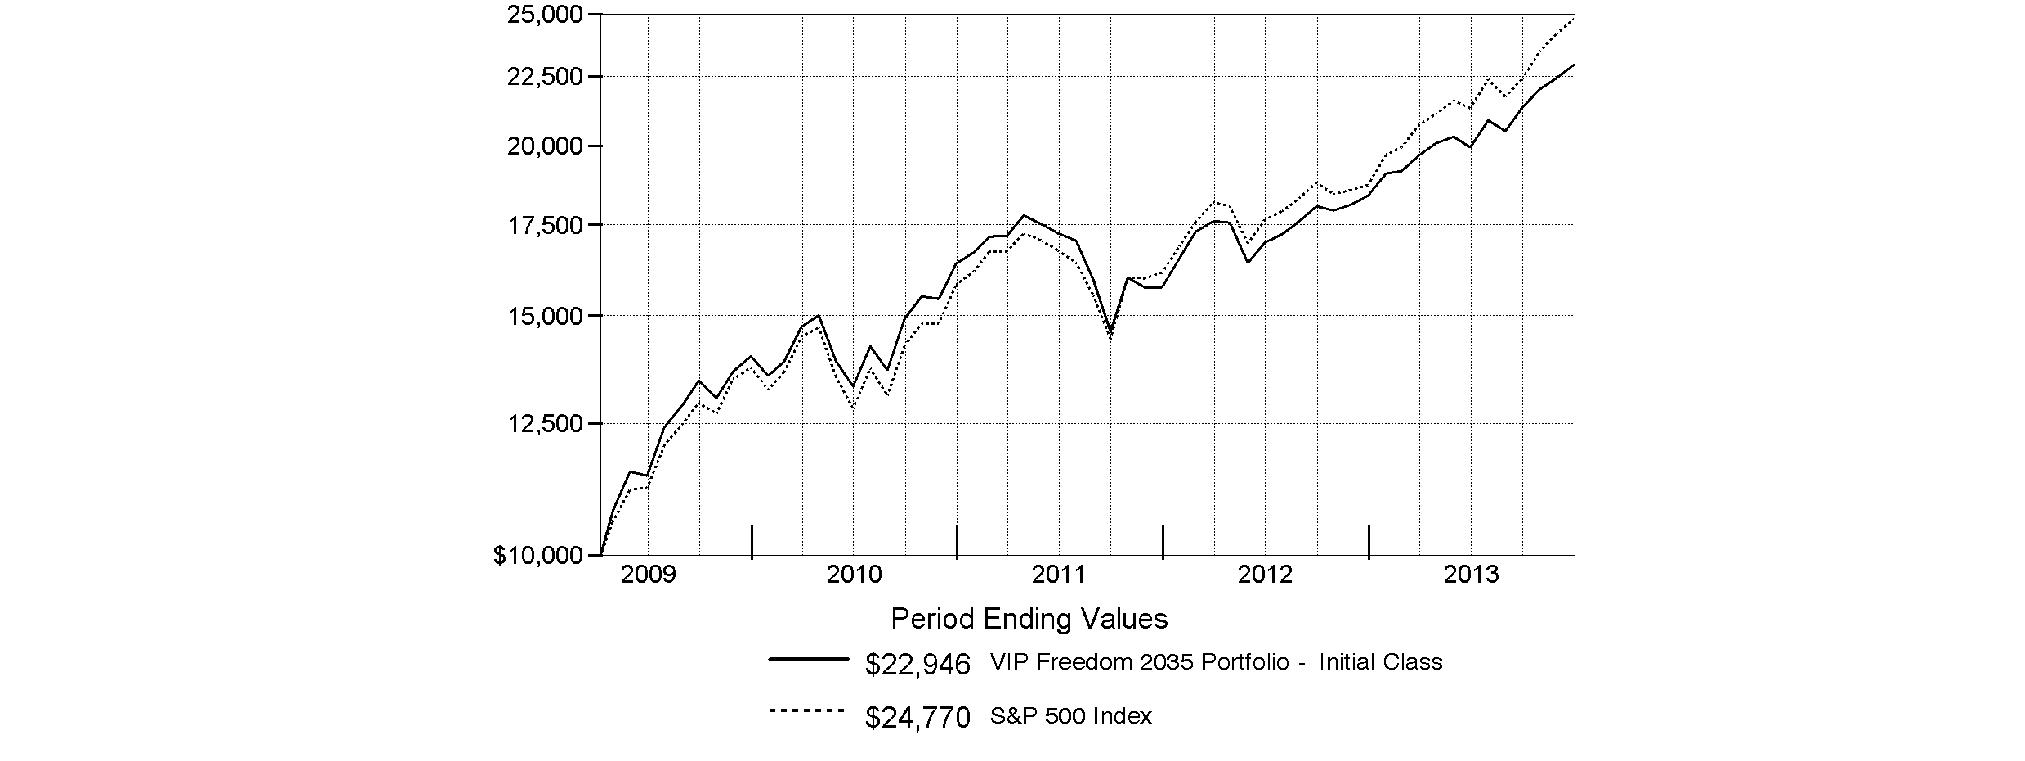
Annual Report
VIP Freedom 2040 PortfolioSM
Performance: The Bottom Line
Average annual total return reflects the change in the value of an investment, assuming reinvestment of the class' distributions from dividend income and capital gains (the profits earned upon the sale of securities that have grown in value, if any) and assuming a constant rate of performance each year. During periods of reimbursement by Fidelity, a fund's total return will be greater than it would be had the reimbursement not occurred. Performance numbers are net of all underlying fund operating expenses, but do not include any insurance charges imposed by your insurance company's separate account. If performance information included the effect of these additional charges, the total returns would have been lower. How a fund did yesterday is no guarantee of how it will do tomorrow.
Average Annual Total Returns
Periods ended December 31, 2013 | Past 1
year | Life of
FundA |
VIP Freedom 2040 PortfolioSM - Initial Class | 25.29% | 19.48% |
VIP Freedom 2040 Portfolio - Service Class | 25.16% | 19.35% |
VIP Freedom 2040 Portfolio - Service Class 2 | 24.99% | 19.17% |
A From April 8, 2009.
$10,000 Over Life of Fund
Let's say hypothetically that $10,000 was invested in VIP Freedom 2040 Portfolio - Initial Class on April 8, 2009, when the fund started. The chart shows how the value of your investment would have changed, and also shows how the S&P 500 Index performed over the same period.
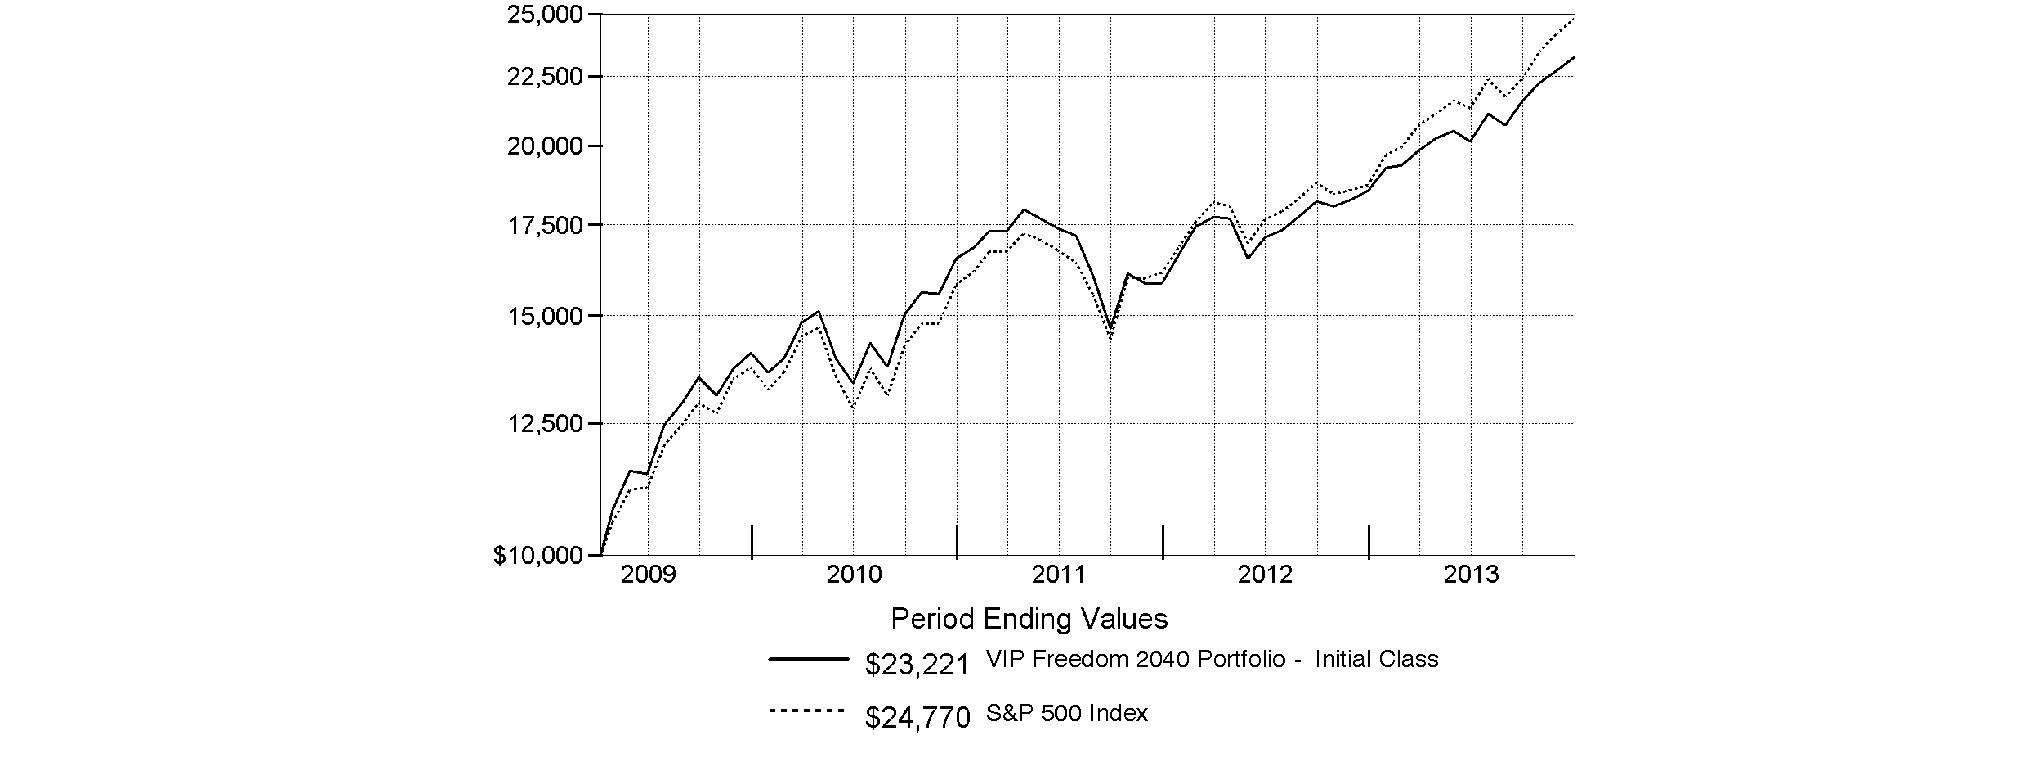
Annual Report
VIP Freedom 2045 PortfolioSM
Performance: The Bottom Line
Average annual total return reflects the change in the value of an investment, assuming reinvestment of the class' distributions from dividend income and capital gains (the profits earned upon the sale of securities that have grown in value, if any) and assuming a constant rate of performance each year. During periods of reimbursement by Fidelity, a fund's total return will be greater than it would be had the reimbursement not occurred. Performance numbers are net of all underlying fund operating expenses, but do not include any insurance charges imposed by your insurance company's separate account. If performance information included the effect of these additional charges, the total returns would have been lower. How a fund did yesterday is no guarantee of how it will do tomorrow.
Average Annual Total Returns
Periods ended December 31, 2013 | Past 1
year | Life of
FundA |
VIP Freedom 2045 PortfolioSM - Initial Class | 26.07% | 19.72% |
VIP Freedom 2045 Portfolio - Service Class | 25.96% | 19.61% |
VIP Freedom 2045 Portfolio - Service Class 2 | 25.76% | 19.43% |
A From April 8, 2009.
$10,000 Over Life of Fund
Let's say hypothetically that $10,000 was invested in VIP Freedom 2045 Portfolio - Initial Class on April 8, 2009, when the fund started. The chart shows how the value of your investment would have changed, and also shows how the S&P 500 Index performed over the same period.

Annual Report
VIP Freedom 2050 PortfolioSM
Performance: The Bottom Line
Average annual total return reflects the change in the value of an investment, assuming reinvestment of the class' distributions from dividend income and capital gains (the profits earned upon the sale of securities that have grown in value, if any) and assuming a constant rate of performance each year. During periods of reimbursement by Fidelity, a fund's total return will be greater than it would be had the reimbursement not occurred. Performance numbers are net of all underlying fund operating expenses, but do not include any insurance charges imposed by your insurance company's separate account. If performance information included the effect of these additional charges, the total returns would have been lower. How a fund did yesterday is no guarantee of how it will do tomorrow.
Average Annual Total Returns
Periods ended December 31, 2013 | Past 1
year | Life of
FundA |
VIP Freedom 2050 PortfolioSM - Initial Class | 26.44% | 20.02% |
VIP Freedom 2050 Portfolio - Service Class | 26.32% | 19.91% |
VIP Freedom 2050 Portfolio - Service Class 2 | 26.13% | 19.73% |
A From April 8, 2009.
$10,000 Over Life of Fund
Let's say hypothetically that $10,000 was invested in VIP Freedom 2050 Portfolio - Initial Class on April 8, 2009, when the fund started. The chart shows how the value of your investment would have changed, and also shows how the S&P 500 Index performed over the same period.
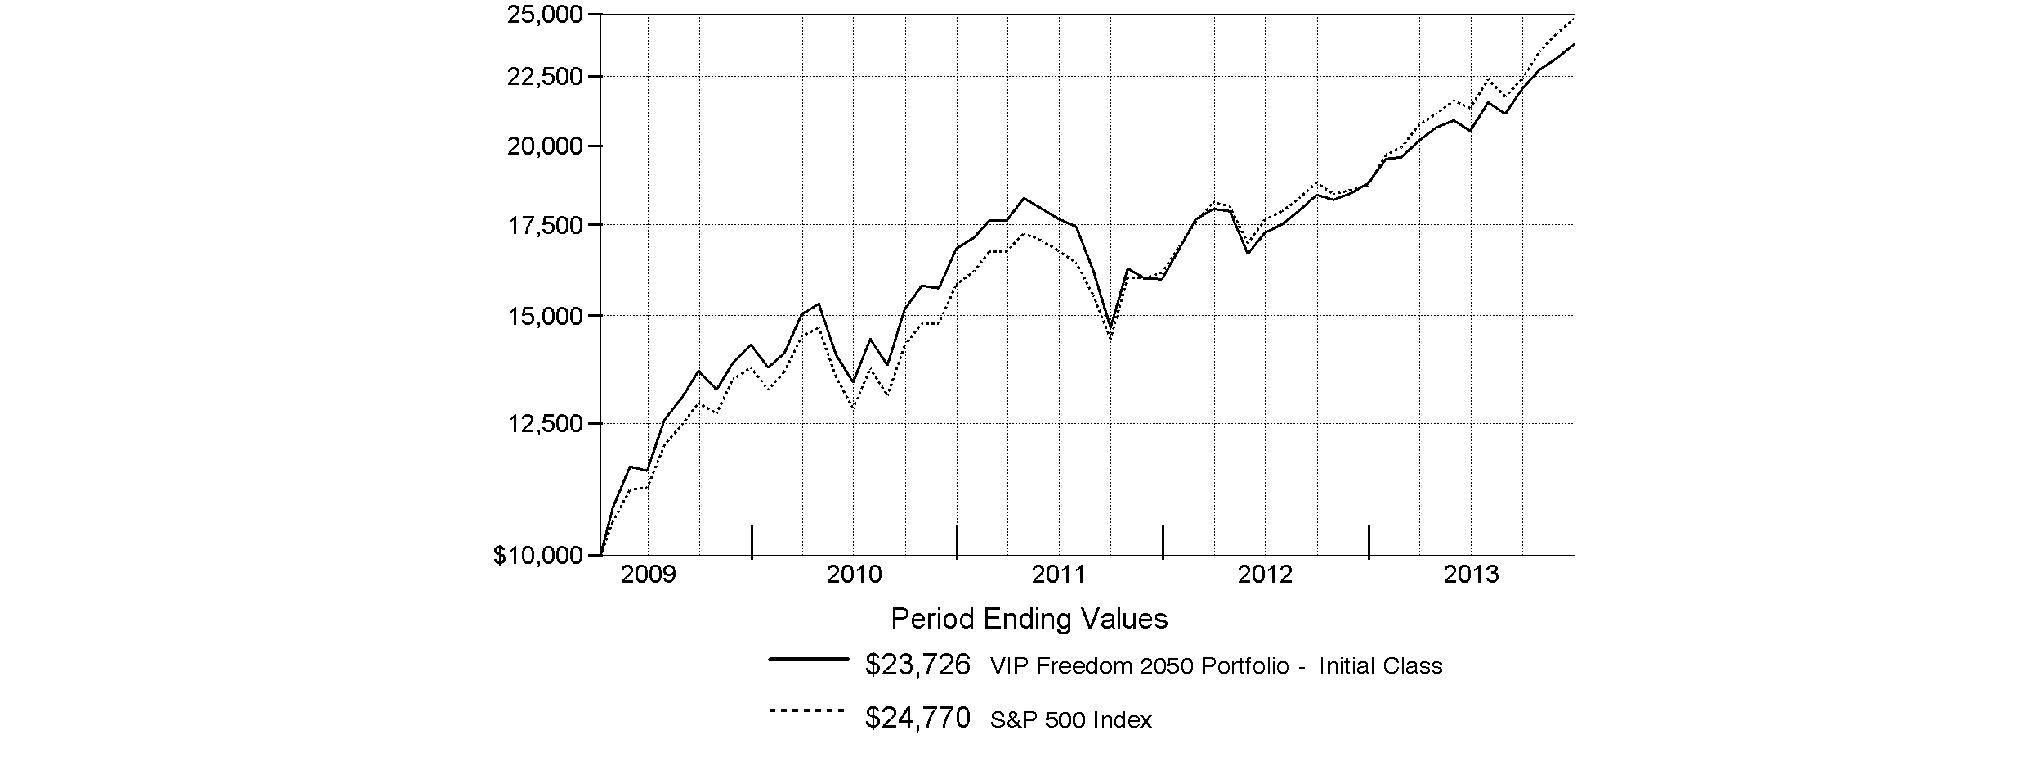
Annual Report
Market Recap: Global equity markets remained upbeat for the 12 months ending December 31, 2013, propelling the MSCI® ACWI® (All Country World Index) Index to a 23.24% return. Midyear turbulence gave way by autumn when policymakers in the U.S. and China had made clear their intentions to maintain accommodative monetary policies. That stance, combined with modest cyclical improvement around the globe and generally low valuations, underpinned the broad rally in equities, although the relative strength of the U.S. dollar generally tempered gains for U.S. investors holding foreign securities based in local currencies. During the period, the broad-market S&P 500® Index set a series of new highs, finishing the year up 32.39%. For the first time since 1995, the S&P® scored a "perfect 10," with all 10 economic sectors gaining at least 10% for the year. A resurgence in growth-oriented stocks lifted the Nasdaq Composite Index® to a 40.12% result for 2013, while the blue-chip Dow Jones Industrial AverageSM notched a relatively more modest 29.65% gain. International developed-markets equities rose in concert with their U.S. counterparts, with the MSCI® EAFE® Index gaining 22.92% for the period. Meanwhile, foreign exchange and commodity weakness curbed results in resource-heavy emerging markets (EM), especially in the year's waning months. More generally, concern over EM's slowing growth, its declining share of global trade and uncertainty surrounding U.S. central bank intentions were all factors hampering performance. The MSCI Emerging Markets Index returned -2.27% for the period. On the bond side, U.S. high-yield securities rallied with equities for much of the period, with The BofA Merrill LynchSM US High Yield Constrained Index returning 7.41% for 2013. The more rate-sensitive U.S. investment-grade bond category faced headwinds though, as reflected in the -2.02% return of the Barclays® U.S. Aggregate Bond Index. Within the Barclays index, investment-grade corporate credit returned -2.01%, while ultra-safe U.S. Treasuries saw a -2.75% result. Major non-U.S. developed markets performed only slightly better, with the Citigroup® Non-USD Group-of-Seven (G7) Equal Weighted Index logging a -1.59% result. After several years of strong advances, EM debt reversed course in 2013, with the J.P. Morgan Emerging Markets Bond Index Global returning -6.58%.
Comments from Andrew Dierdorf and Christopher Sharpe, Co-Managers of VIP Freedom Funds: Each VIP Freedom Fund posted a positive return for the 12 months ending December 31, 2013. (For specific portfolio performance, please refer to the performance section of this report.) The longer-dated Funds, designed for investors who have the longest time horizon until retirement, delivered the highest absolute returns. This is consistent with what we would anticipate, given that these Funds have greater exposure to underlying equity funds, which performed very well in 2013. On a relative basis - meaning how the Funds performed versus their respective Composite indexes - each Fund outperformed, thanks in part to the Funds' allocation to non-U.S. equities and bonds. Looking at the Funds' equity asset allocation, non-U.S. stocks provided the greatest boost on a relative basis. The MSCI® EAFE® Index, which is the benchmark for the Funds' non-U.S. equity holdings, rose 22.92%. The Funds' core holding in this investment area - VIP Overseas Portfolio - outpaced the MSCI index, mainly due to strong security selection within developed countries that fared better as they recovered from the region's financial and economic crises. In the U.S., despite strong absolute results, the Funds did not match the 33.47% result for The Dow Jones U.S. Total Stock Market IndexSM, a yardstick for the Funds' U.S.-equity exposure. Even though the Funds received a boost from the strong relative performance of their largest U.S. equity holding, VIP Growth & Income Portfolio, that positive performance could not overcome relative weakness from some other holdings, in particular two of the Funds' larger investments - VIP Contrafund Portfolio and VIP Equity-Income Portfolio - which lagged the Dow Jones index. Turning to the fixed-income arena, investment-grade bonds declined during the 12-month period, as concern about downside risk amid the prospect of higher interest rates weighed on sentiment. Investors sought higher yields and leaned more toward equity securities and higher-yielding bonds. In terms of the Funds' underlying investments, in aggregate they bettered the -2.02% return of the Barclays® U.S. Aggregate Bond Index, the benchmark for the Funds' fixed-income sleeve. Here, our allocation to VIP Investment Grade Bond Portfolio outpaced the Barclays index, helping the Funds' relative showing. VIP High Income Portfolio, with its nearly 6% return, also added to relative performance.
Note to shareholders: In recent months, Fidelity has made several changes to the target-date funds, including the VIP Freedom Funds. The enhancements are primarily focused on enhancing the glide path, or the strategic asset allocation of equities, bonds and cash over time. Across most of the Funds, Fidelity is modifying the glide path to increase equity allocations, with a proportional decrease in other asset classes, most notably short-term debt. The changes are based on Fidelity's dedicated research, analysis of investor behavior and the ongoing evaluation of the Funds' investment structure that aims to improve outcomes for investors. Additionally, on or about January 1, 2014, in line with the changes to the Funds' lineup of underlying funds over the past several years, the non-U.S. equity component of the Funds' Composite indexes changed from the MSCI® EAFE® index to the MSCI® ACWI® (All Country World Index) ex USA Index, which extends exposure to emerging markets. We believe the broader representation of the non-U.S. equity stocks available through the MSCI® ACWI® serves as a more accurate comparison for the Funds' performance. Lastly, on January 21, 2014, Brett Sumsion will become a Co-Manager of the Funds. Brett will replace Chris Sharpe following a transition period that will be completed on or around March 31, 2014.
The views expressed above reflect those of the portfolio manager(s) only through the end of the period as stated on the cover of this report and do not necessarily represent the views of Fidelity or any other person in the Fidelity organization. Any such views are subject to change at any time based upon market or other conditions and Fidelity disclaims any responsibility to update such views. These views may not be relied on as investment advice and, because investment decisions for a Fidelity fund are based on numerous factors, may not be relied on as an indication of trading intent on behalf of any Fidelity fund.
Annual Report
As a shareholder of a Fund, you incur two types of costs: (1) transaction costs, and (2) ongoing costs, including distribution and/or service (12b-1) fees and other Fund expenses. This Example is intended to help you understand your ongoing costs (in dollars) of investing in the Funds and to compare these costs with the ongoing costs of investing in other mutual funds.
The Example is based on an investment of $1,000 invested at the beginning of the period and held for the entire period (July 1, 2013 to December 31, 2013).
Actual Expenses
The first line of the accompanying table for each class of each fund provides information about actual account values and actual expenses. You may use the information in this line, together with the amount you invested, to estimate the expenses that you paid over the period. Simply divide your account value by $1,000.00 (for example, an $8,600 account value divided by $1,000.00 = 8.6), then multiply the result by the number in the first line for a class of the fund under the heading entitled "Expenses Paid During Period" to estimate the expenses you paid on your account during this period. The estimate of expenses does not include any fees or other expenses of any variable annuity or variable life insurance product. If they were, the estimate of expenses you paid during the period would be higher, and your ending account value would be lower. In addition, each Fund, as a shareholder in underlying Fidelity Funds, will indirectly bear its pro-rata share of the fees and expenses incurred by the underlying Fidelity Funds. These fees and expenses are not included in each Fund's annualized expense ratio used to calculate the expense estimates in the table below.
Hypothetical Example for Comparison Purposes
The second line of the accompanying table for each class of each fund provides information about hypothetical account values and hypothetical expenses based on a Class' actual expense ratio and an assumed rate of return of 5% per year before expenses, which is not the Class' actual return. The hypothetical account values and expenses may not be used to estimate the actual ending account balance or expenses you paid for the period. You may use this information to compare the ongoing costs of investing in the Fund and other funds. To do so, compare this 5% hypothetical example with the 5% hypothetical examples that appear in the shareholder reports of the other funds. The estimate of expenses does not include any fees or other expenses of any variable annuity or variable life insurance product. If they were, the estimate of expenses you paid during the period would be higher, and your ending account value would be lower. In addition, each Fund, as a shareholder in underlying Fidelity Funds, will indirectly bear its pro-rata share of the fees and expenses incurred by the underlying Fidelity Funds. These fees and expenses are not included in each Fund's annualized expense ratio used to calculate the expense estimates in the table below.
Please note that the expenses shown in the table are meant to highlight your ongoing costs only and do not reflect any transaction costs. Therefore, the second line of the table is useful in comparing ongoing costs only, and will not help you determine the relative total costs of owning different funds.
| Annualized
Expense Ratio B | Beginning
Account Value
July 1, 2013 | Ending
Account Value
December 31, 2013 | Expenses Paid
During Period*
July 1, 2013
to December 31, 2013 |
VIP Freedom Income | | | | |
Initial Class | .00% | | | |
Actual | | $ 1,000.00 | $ 1,042.20 | $ .00 |
HypotheticalA | | $ 1,000.00 | $ 1,025.21 | $ .00 |
Service Class | .10% | | | |
Actual | | $ 1,000.00 | $ 1,041.60 | $ .51 |
HypotheticalA | | $ 1,000.00 | $ 1,024.70 | $ .51 |
Service Class 2 | .25% | | | |
Actual | | $ 1,000.00 | $ 1,039.80 | $ 1.29 |
HypotheticalA | | $ 1,000.00 | $ 1,023.95 | $ 1.28 |
VIP Freedom 2005 | | | | |
Initial Class | .00% | | | |
Actual | | $ 1,000.00 | $ 1,065.10 | $ .00 |
HypotheticalA | | $ 1,000.00 | $ 1,025.21 | $ .00 |
Service Class | .10% | | | |
Actual | | $ 1,000.00 | $ 1,064.70 | $ .52 |
HypotheticalA | | $ 1,000.00 | $ 1,024.70 | $ .51 |
Service Class 2 | .25% | | | |
Actual | | $ 1,000.00 | $ 1,063.40 | $ 1.30 |
HypotheticalA | | $ 1,000.00 | $ 1,023.95 | $ 1.28 |
| Annualized
Expense Ratio B | Beginning
Account Value
July 1, 2013 | Ending
Account Value
December 31, 2013 | Expenses Paid
During Period*
July 1, 2013
to December 31, 2013 |
VIP Freedom 2010 | | | | |
Initial Class | .00% | | | |
Actual | | $ 1,000.00 | $ 1,087.20 | $ .00 |
HypotheticalA | | $ 1,000.00 | $ 1,025.21 | $ .00 |
Service Class | .10% | | | |
Actual | | $ 1,000.00 | $ 1,087.20 | $ .53 |
HypotheticalA | | $ 1,000.00 | $ 1,024.70 | $ .51 |
Service Class 2 | .25% | | | |
Actual | | $ 1,000.00 | $ 1,086.10 | $ 1.31 |
HypotheticalA | | $ 1,000.00 | $ 1,023.95 | $ 1.28 |
VIP Freedom 2015 | | | | |
Initial Class | .00% | | | |
Actual | | $ 1,000.00 | $ 1,094.80 | $ .00 |
HypotheticalA | | $ 1,000.00 | $ 1,025.21 | $ .00 |
Service Class | .10% | | | |
Actual | | $ 1,000.00 | $ 1,094.10 | $ .53 |
HypotheticalA | | $ 1,000.00 | $ 1,024.70 | $ .51 |
Service Class 2 | .25% | | | |
Actual | | $ 1,000.00 | $ 1,093.60 | $ 1.32 |
HypotheticalA | | $ 1,000.00 | $ 1,023.95 | $ 1.28 |
VIP Freedom 2020 | | | | |
Initial Class | .00% | | | |
Actual | | $ 1,000.00 | $ 1,103.10 | $ .00 |
HypotheticalA | | $ 1,000.00 | $ 1,025.21 | $ .00 |
Service Class | .10% | | | |
Actual | | $ 1,000.00 | $ 1,103.40 | $ .53 |
HypotheticalA | | $ 1,000.00 | $ 1,024.70 | $ .51 |
Service Class 2 | .25% | | | |
Actual | | $ 1,000.00 | $ 1,102.10 | $ 1.32 |
HypotheticalA | | $ 1,000.00 | $ 1,023.95 | $ 1.28 |
VIP Freedom 2025 | | | | |
Initial Class | .00% | | | |
Actual | | $ 1,000.00 | $ 1,125.40 | $ .00 |
HypotheticalA | | $ 1,000.00 | $ 1,025.21 | $ .00 |
Service Class | .10% | | | |
Actual | | $ 1,000.00 | $ 1,124.70 | $ .54 |
HypotheticalA | | $ 1,000.00 | $ 1,024.70 | $ .51 |
Service Class 2 | .25% | | | |
Actual | | $ 1,000.00 | $ 1,123.70 | $ 1.34 |
HypotheticalA | | $ 1,000.00 | $ 1,023.95 | $ 1.28 |
| Annualized
Expense Ratio B | Beginning
Account Value
July 1, 2013 | Ending
Account Value
December 31, 2013 | Expenses Paid
During Period*
July 1, 2013
to December 31, 2013 |
VIP Freedom 2030 | | | | |
Initial Class | .00% | | | |
Actual | | $ 1,000.00 | $ 1,136.80 | $ .00 |
HypotheticalA | | $ 1,000.00 | $ 1,025.21 | $ .00 |
Service Class | .10% | | | |
Actual | | $ 1,000.00 | $ 1,136.20 | $ .54 |
HypotheticalA | | $ 1,000.00 | $ 1,024.70 | $ .51 |
Service Class 2 | .25% | | | |
Actual | | $ 1,000.00 | $ 1,135.10 | $ 1.35 |
HypotheticalA | | $ 1,000.00 | $ 1,023.95 | $ 1.28 |
VIP Freedom 2035 | | | | |
Initial Class | .00% | | | |
Actual | | $ 1,000.00 | $ 1,150.40 | $ .00 |
HypotheticalA | | $ 1,000.00 | $ 1,025.21 | $ .00 |
Service Class | .10% | | | |
Actual | | $ 1,000.00 | $ 1,150.00 | $ .54 |
HypotheticalA | | $ 1,000.00 | $ 1,024.70 | $ .51 |
Service Class 2 | .25% | | | |
Actual | | $ 1,000.00 | $ 1,149.10 | $ 1.35 |
HypotheticalA | | $ 1,000.00 | $ 1,023.95 | $ 1.28 |
VIP Freedom 2040 | | | | |
Initial Class | .00% | | | |
Actual | | $ 1,000.00 | $ 1,153.30 | $ .00 |
HypotheticalA | | $ 1,000.00 | $ 1,025.21 | $ .00 |
Service Class | .10% | | | |
Actual | | $ 1,000.00 | $ 1,152.10 | $ .54 |
HypotheticalA | | $ 1,000.00 | $ 1,024.70 | $ .51 |
Service Class 2 | .25% | | | |
Actual | | $ 1,000.00 | $ 1,151.10 | $ 1.36 |
HypotheticalA | | $ 1,000.00 | $ 1,023.95 | $ 1.28 |
VIP Freedom 2045 | | | | |
Initial Class | .00% | | | |
Actual | | $ 1,000.00 | $ 1,155.70 | $ .00 |
HypotheticalA | | $ 1,000.00 | $ 1,025.21 | $ .00 |
Service Class | .10% | | | |
Actual | | $ 1,000.00 | $ 1,155.50 | $ .54 |
HypotheticalA | | $ 1,000.00 | $ 1,024.70 | $ .51 |
Service Class 2 | .25% | | | |
Actual | | $ 1,000.00 | $ 1,155.00 | $ 1.36 |
HypotheticalA | | $ 1,000.00 | $ 1,023.95 | $ 1.28 |
| Annualized
Expense Ratio B | Beginning
Account Value
July 1, 2013 | Ending
Account Value
December 31, 2013 | Expenses Paid
During Period*
July 1, 2013
to December 31, 2013 |
VIP Freedom 2050 | | | | |
Initial Class | .00% | | | |
Actual | | $ 1,000.00 | $ 1,157.10 | $ .00 |
HypotheticalA | | $ 1,000.00 | $ 1,025.21 | $ .00 |
Service Class | .10% | | | |
Actual | | $ 1,000.00 | $ 1,156.80 | $ .54 |
HypotheticalA | | $ 1,000.00 | $ 1,024.70 | $ .51 |
Service Class 2 | .25% | | | |
Actual | | $ 1,000.00 | $ 1,155.70 | $ 1.36 |
HypotheticalA | | $ 1,000.00 | $ 1,023.95 | $ 1.28 |
A 5% return per year before expenses
B Annualized expense ratio reflects expenses net of applicable fee waivers.
* Expenses are equal to each Class' annualized expense ratio, multiplied by the average account value over the period, multiplied by 184/ 365 (to reflect the one-half year period). The fees and expenses of the underlying Fidelity Funds in which each Fund invests are not included in each Class' annualized expense ratio.
Annual Report
VIP Freedom Income Portfolio
Investment Changes (Unaudited)
The information in the following tables is based on the direct investments of the Fund.
Fund Holdings as of December 31, 2013 |
| % of fund's
net assets | % of fund's net assets
6 months ago |
Domestic Equity Funds | | |
VIP Contrafund Portfolio Initial Class | 3.0 | 2.6 |
VIP Equity-Income Portfolio Initial Class | 3.1 | 2.8 |
VIP Growth & Income Portfolio Initial Class | 3.6 | 3.3 |
VIP Growth Portfolio Initial Class | 3.2 | 2.7 |
VIP Mid Cap Portfolio Initial Class | 0.9 | 0.8 |
VIP Value Portfolio Initial Class | 2.3 | 2.1 |
VIP Value Strategies Portfolio Initial Class | 1.1 | 1.0 |
| 17.2 | 15.3 |
Developed International Equity Funds | | |
VIP Overseas Portfolio Initial Class | 5.9 | 4.4 |
Emerging Markets Equity Funds | | |
VIP Emerging Markets Portfolio Initial Class | 1.5 | 1.2 |
High Yield Bond Funds | | |
VIP High Income Portfolio Initial Class | 5.9 | 5.0 |
Investment Grade Bond Funds | | |
VIP Investment Grade Bond Portfolio Initial Class | 39.7 | 34.2 |
Short-Term Funds | | |
VIP Money Market Portfolio Initial Class | 29.8 | 39.9 |
Net Other Assets (Liabilities)* | 0.0 | 0.0 |
| 100.0 | 100.0 |
* Amount represents less than 0.1% |
Asset Allocation (% of fund's net assets) |
Period end |
 | Domestic Equity Funds | 17.2% | |
 | Developed International Equity Funds | 5.9% | |
 | Emerging Markets Equity Funds | 1.5% | |
 | High Yield Bond Funds | 5.9% | |
 | Investment Grade Bond Funds | 39.7% | |
 | Short-Term Funds | 29.8% | |

Six months ago |
| Domestic Equity Funds | 15.3% | |
| Developed International Equity Funds | 4.4% | |
| Emerging Markets Equity Funds | 1.2% | |
| High Yield Bond Funds | 5.0% | |
| Investment Grade Bond Funds | 34.2% | |
| Short-Term Funds | 39.9% | |

Annual Report
VIP Freedom Income Portfolio
Investments December 31, 2013
Showing Percentage of Net Assets
Domestic Equity Funds - 17.2% |
| Shares | | Value |
Domestic Equity Funds - 17.2% |
VIP Contrafund Portfolio Initial Class (b) | 25,663 | | $ 881,526 |
VIP Equity-Income Portfolio Initial Class (b) | 38,265 | | 891,202 |
VIP Growth & Income Portfolio Initial Class (b) | 54,116 | | 1,035,773 |
VIP Growth Portfolio Initial Class (b) | 16,100 | | 919,975 |
VIP Mid Cap Portfolio Initial Class (b) | 7,255 | | 264,014 |
VIP Value Portfolio Initial Class (b) | 44,324 | | 672,840 |
VIP Value Strategies Portfolio Initial Class (b) | 22,971 | | 330,099 |
TOTAL DOMESTIC EQUITY FUNDS (Cost $4,070,392) |
4,995,429
|
International Equity Funds - 7.4% |
| | | |
Developed International Equity Funds - 5.9% |
VIP Overseas Portfolio Initial Class (b) | 82,780 | | 1,708,577 |
Emerging Markets Equity Funds - 1.5% |
VIP Emerging Markets Portfolio Initial Class (b) | 49,121 | | 442,582 |
TOTAL INTERNATIONAL EQUITY FUNDS (Cost $1,725,499) |
2,151,159
|
Bond Funds - 45.6% |
| Shares | | Value |
High Yield Bond Funds - 5.9% |
VIP High Income Portfolio Initial Class (b) | 297,937 | | $ 1,728,037 |
Investment Grade Bond Funds - 39.7% |
VIP Investment Grade Bond Portfolio Initial Class (b) | 931,142 | | 11,508,917 |
TOTAL BOND FUNDS (Cost $13,543,278) |
13,236,954
|
Short-Term Funds - 29.8% |
| | | |
VIP Money Market Portfolio Initial
Class 0.01% (a)(b)
(Cost $8,627,262) | 8,627,262 | |
8,627,262
|
TOTAL INVESTMENT PORTFOLIO - 100.0% (Cost $27,966,431) | | 29,010,804 |
NET OTHER ASSETS (LIABILITIES) - 0.0% | | (1,862) |
NET ASSETS - 100% | $ 29,008,942 |
Legend |
(a) The rate quoted is the annualized seven-day yield of the fund at period end. |
(b) Affiliated company |
Affiliated Underlying Funds |
Information regarding the Fund's fiscal year to date purchases and sales of the affiliated Underlying Funds and income earned by the Fund from investments in affiliated Underlying Funds is as follows: |
Affiliate | Value,
beginning of period | Purchases | Sales
Proceeds | Dividend
Income | Value,
end of
period |
VIP Contrafund Portfolio Initial Class | $ 577,117 | $ 389,831 | $ 268,450 | $ 7,981 | $ 881,526 |
VIP Emerging Markets Portfolio Initial Class | 304,060 | 236,708 | 109,063 | 2,700 | 442,582 |
VIP Equity-Income Portfolio Initial Class | 618,155 | 471,284 | 308,282 | 19,294 | 891,202 |
VIP Growth & Income Portfolio Initial Class | 698,650 | 474,155 | 362,857 | 16,432 | 1,035,773 |
VIP Growth Portfolio Initial Class | 571,010 | 392,321 | 264,080 | 2,198 | 919,975 |
VIP High Income Portfolio Initial Class | 1,175,228 | 995,552 | 428,886 | 90,139 | 1,728,037 |
VIP Investment Grade Bond Portfolio Initial Class | 8,139,868 | 6,914,796 | 2,975,037 | 265,358 | 11,508,917 |
VIP Mid Cap Portfolio Initial Class | 171,938 | 139,968 | 83,485 | 1,123 | 264,014 |
VIP Money Market Portfolio Initial Class | 9,214,263 | 5,119,573 | 5,706,575 | 2,849 | 8,627,262 |
VIP Overseas Portfolio Initial Class | 989,990 | 847,677 | 438,802 | 17,486 | 1,708,577 |
VIP Value Portfolio Initial Class | 460,052 | 348,427 | 234,832 | 6,442 | 672,840 |
VIP Value Strategies Portfolio Initial Class | 228,012 | 146,088 | 112,899 | 2,604 | 330,099 |
Total | $ 23,148,343 | $ 16,476,380 | $ 11,293,248 | $ 434,606 | $ 29,010,804 |
Other Information |
All investments are categorized as Level 1 under the Fair Value Hierarchy. The inputs or methodology used for valuing securities may not be an indication of the risk associated with investing in those securities. For more information on valuation inputs, please refer to the Investment Valuation section in the accompanying Notes to Financial Statements. |
See accompanying notes which are an integral part of the financial statements.
Annual Report
VIP Freedom Income Portfolio
Statement of Assets and Liabilities
| December 31, 2013 |
| | |
Assets | | |
Investment in securities, at value (cost $27,966,431) - See accompanying schedule | | $ 29,010,804 |
Cash | | 1 |
Receivable for investments sold | | 27,051 |
Receivable for fund shares sold | | 95,776 |
Total assets | | 29,133,632 |
| | |
Liabilities | | |
Payable for investments purchased | $ 75,933 | |
Payable for fund shares redeemed | 46,900 | |
Distribution and service plan fees payable | 1,857 | |
Total liabilities | | 124,690 |
| | |
Net Assets | | $ 29,008,942 |
Net Assets consist of: | | |
Paid in capital | | $ 27,849,229 |
Accumulated undistributed net realized gain (loss) on investments | | 115,340 |
Net unrealized appreciation (depreciation) on investments | | 1,044,373 |
Net Assets | | $ 29,008,942 |
Statement of Assets and Liabilities - continued
| December 31, 2013 |
| | |
Initial Class:
Net Asset Value, offering price and redemption price per share ($16,980,235 ÷ 1,559,725 shares) | | $ 10.89 |
| | |
Service Class:
Net Asset Value, offering price and redemption price per share ($4,528,783 ÷ 415,855 shares) | | $ 10.89 |
| | |
Service Class 2:
Net Asset Value, offering price and redemption price per share ($7,499,924 ÷ 691,158 shares) | | $ 10.85 |
See accompanying notes which are an integral part of the financial statements.
Annual Report
Statement of Operations
| Year ended December 31, 2013 |
| | |
Investment Income | | |
Income distributions from underlying funds | | $ 434,606 |
| | |
Expenses | | |
Distribution and service plan fees | $ 21,209 | |
Independent trustees' compensation | 97 | |
Total expenses before reductions | 21,306 | |
Expense reductions | (97) | 21,209 |
Net investment income (loss) | | 413,397 |
Realized and Unrealized Gain (Loss) Realized gain (loss) on sale of underlying fund shares | 41,711 | |
Capital gain distributions from underlying funds | 268,657 | |
Total net realized gain (loss) | | 310,368 |
Change in net unrealized appreciation (depreciation) on underlying funds | | 637,601 |
Net gain (loss) | | 947,969 |
Net increase (decrease) in net assets resulting from operations | | $ 1,361,366 |
Statement of Changes in Net Assets
| Year ended
December 31, 2013 | Year ended
December 31, 2012 |
Increase (Decrease) in Net Assets | | |
Operations | | |
Net investment income (loss) | $ 413,397 | $ 323,590 |
Net realized gain (loss) | 310,368 | 324,012 |
Change in net unrealized appreciation (depreciation) | 637,601 | 712,493 |
Net increase (decrease) in net assets resulting from operations | 1,361,366 | 1,360,095 |
Distributions to shareholders from net investment income | (415,198) | (322,416) |
Distributions to shareholders from net realized gain | (227,373) | (296,101) |
Total distributions | (642,571) | (618,517) |
Share transactions - net increase (decrease) | 5,143,347 | 1,231,616 |
Total increase (decrease) in net assets | 5,862,142 | 1,973,194 |
| | |
Net Assets | | |
Beginning of period | 23,146,800 | 21,173,606 |
End of period (including undistributed net investment income of $0 and $1,711, respectively) | $ 29,008,942 | $ 23,146,800 |
See accompanying notes which are an integral part of the financial statements.
Annual Report
Financial Highlights - Initial Class
Years ended December 31, | 2013 | 2012 | 2011 | 2010 | 2009 |
Selected Per-Share Data | | | | | |
Net asset value, beginning of period | $ 10.57 | $ 10.21 | $ 10.27 | $ 10.00 | $ 9.14 |
Income from Investment Operations | | | | | |
Net investment income (loss) C | .18 | .16 | .19 | .19 | .39 |
Net realized and unrealized gain (loss) | .40 | .50 | (.02) | .56 | .96 |
Total from investment operations | .58 | .66 | .17 | .75 | 1.35 |
Distributions from net investment income | (.17) | (.16) | (.19) | (.20) | (.35) |
Distributions from net realized gain | (.10) | (.14) | (.04) | (.28) | (.15) |
Total distributions | (.26) G | (.30) | (.23) | (.48) | (.49) H |
Net asset value, end of period | $ 10.89 | $ 10.57 | $ 10.21 | $ 10.27 | $ 10.00 |
Total Return A,B | 5.55% | 6.52% | 1.63% | 7.49% | 14.95% |
Ratios to Average Net Assets D,F | | | | | |
Expenses before reductions E | .00% | .00% | .00% | .00% | .00% |
Expenses net of fee waivers, if any | .00% | .00% | .00% | .00% | .00% |
Expenses net of all reductions | .00% | .00% | .00% | .00% | .00% |
Net investment income (loss) | 1.67% | 1.55% | 1.85% | 1.88% | 4.00% |
Supplemental Data | | | | | |
Net assets, end of period (000 omitted) | $ 16,980 | $ 14,184 | $ 10,938 | $ 11,165 | $ 12,679 |
Portfolio turnover rate D | 43% | 43% | 49% | 41% | 32% |
A Total returns do not reflect charges attributable to your insurance company's separate account. Inclusion of these charges would reduce the total returns shown.
B Total returns would have been lower if certain expenses had not been reduced during the applicable periods shown.
C Calculated based on average shares outstanding during the period.
D Amounts do not include the activity of the Underlying Funds.
E Amount represents less than .01%.
F Expense ratios reflect operating expenses of the class. Expenses before reductions do not reflect amounts reimbursed by the investment adviser or reductions from expense offset arrangements and do not represent the amount paid by the class during periods when reimbursements or reductions occur. Expenses net of fee waivers reflect expenses after reimbursement by the investment adviser but prior to reductions from expense offset arrangements. Expenses net of all reductions represent the net expenses paid by the class but do not include expenses of the investment companies in which the Fund invests.
G Total distributions of $.26 per share is comprised of distributions from net investment income of $.166 and distributions from net realized gain of $.097 per share.
H Total distributions of $.49 per share is comprised of distributions from net investment income of $.347 and distributions from net realized gain of $.146 per share.
Financial Highlights - Service Class
Years ended December 31, | 2013 | 2012 | 2011 | 2010 | 2009 |
Selected Per-Share Data | | | | | |
Net asset value, beginning of period | $ 10.58 | $ 10.22 | $ 10.28 | $ 10.00 | $ 9.14 |
Income from Investment Operations | | | | | |
Net investment income (loss) C | .17 | .15 | .18 | .18 | .37 |
Net realized and unrealized gain (loss) | .40 | .50 | (.02) | .56 | .97 |
Total from investment operations | .57 | .65 | .16 | .74 | 1.34 |
Distributions from net investment income | (.16) | (.15) | (.18) | (.19) | (.33) |
Distributions from net realized gain | (.10) | (.14) | (.04) | (.28) | (.15) |
Total distributions | (.26) | (.29) | (.22) | (.46) F | (.48) G |
Net asset value, end of period | $ 10.89 | $ 10.58 | $ 10.22 | $ 10.28 | $ 10.00 |
Total Return A,B | 5.38% | 6.42% | 1.56% | 7.46% | 14.81% |
Ratios to Average Net Assets D,E | | | | | |
Expenses before reductions | .10% | .10% | .10% | .10% | .10% |
Expenses net of fee waivers, if any | .10% | .10% | .10% | .10% | .10% |
Expenses net of all reductions | .10% | .10% | .10% | .10% | .10% |
Net investment income (loss) | 1.57% | 1.45% | 1.75% | 1.78% | 3.90% |
Supplemental Data | | | | | |
Net assets, end of period (000 omitted) | $ 4,529 | $ 2,467 | $ 2,505 | $ 172 | $ 163 |
Portfolio turnover rate D | 43% | 43% | 49% | 41% | 32% |
A Total returns do not reflect charges attributable to your insurance company's separate account. Inclusion of these charges would reduce the total returns shown.
B Total returns would have been lower if certain expenses had not been reduced during the applicable periods shown.
C Calculated based on average shares outstanding during the period.
D Amounts do not include the activity of the Underlying Funds.
E Expense ratios reflect operating expenses of the class. Expenses before reductions do not reflect amounts reimbursed by the investment adviser or reductions from expense offset arrangements and do not represent the amount paid by the class during periods when reimbursements or reductions occur. Expenses net of fee waivers reflect expenses after reimbursement by the investment adviser but prior to reductions from expense offset arrangements. Expenses net of all reductions represent the net expenses paid by the class but do not include expenses of the investment companies in which the Fund invests.
F Total distributions of $.46 per share is comprised of distributions from net investment income of $.189 and distributions from net realized gain of $.275 per share.
G Total distributions of $.48 per share is comprised of distributions from net investment income of $.334 and distributions from net realized gain of $.146 per share.
See accompanying notes which are an integral part of the financial statements.
Annual Report
Financial Highlights - Service Class 2
Years ended December 31, | 2013 | 2012 | 2011 | 2010 | 2009 |
Selected Per-Share Data | | | | | |
Net asset value, beginning of period | $ 10.54 | $ 10.18 | $ 10.24 | $ 9.97 | $ 9.12 |
Income from Investment Operations | | | | | |
Net investment income (loss) C | .15 | .14 | .17 | .17 | .36 |
Net realized and unrealized gain (loss) | .40 | .49 | (.03) | .55 | .96 |
Total from investment operations | .55 | .63 | .14 | .72 | 1.32 |
Distributions from net investment income | (.14) | (.13) | (.16) | (.18) | (.33) |
Distributions from net realized gain | (.10) | (.14) | (.04) | (.28) | (.15) |
Total distributions | (.24) | (.27) | (.20) | (.45) F | (.47) G |
Net asset value, end of period | $ 10.85 | $ 10.54 | $ 10.18 | $ 10.24 | $ 9.97 |
Total Return A,B | 5.21% | 6.26% | 1.39% | 7.25% | 14.64% |
Ratios to Average Net Assets D,E | | | | | |
Expenses before reductions | .25% | .25% | .25% | .25% | .25% |
Expenses net of fee waivers, if any | .25% | .25% | .25% | .25% | .25% |
Expenses net of all reductions | .25% | .25% | .25% | .25% | .25% |
Net investment income (loss) | 1.42% | 1.30% | 1.60% | 1.63% | 3.76% |
Supplemental Data | | | | | |
Net assets, end of period (000 omitted) | $ 7,500 | $ 6,495 | $ 7,731 | $ 7,313 | $ 6,753 |
Portfolio turnover rate D | 43% | 43% | 49% | 41% | 32% |
A Total returns do not reflect charges attributable to your insurance company's separate account. Inclusion of these charges would reduce the total returns shown.
B Total returns would have been lower if certain expenses had not been reduced during the applicable periods shown.
C Calculated based on average shares outstanding during the period.
D Amounts do not include the activity of the Underlying Funds.
E Expense ratios reflect operating expenses of the class. Expenses before reductions do not reflect amounts reimbursed by the investment adviser or reductions from expense offset arrangements and do not represent the amount paid by the class during periods when reimbursements or reductions occur. Expenses net of fee waivers reflect expenses after reimbursement by the investment adviser but prior to reductions from expense offset arrangements. Expenses net of all reductions represent the net expenses paid by the class but do not include expenses of the investment companies in which the Fund invests.
F Total distributions of $.45 per share is comprised of distributions from net investment income of $.176 and distributions from net realized gain of $.275 per share.
G Total distributions of $.47 per share is comprised of distributions from net investment income of $.326 and distributions from net realized gain of $.146 per share.
See accompanying notes which are an integral part of the financial statements.
Annual Report
VIP Freedom 2005 Portfolio
Investment Changes (Unaudited)
The information in the following tables is based on the direct investments of the Fund.
Fund Holdings as of December 31, 2013 |
| % of fund's
net assets | % of fund's net assets
6 months ago |
Domestic Equity Funds | | |
VIP Contrafund Portfolio Initial Class | 4.8 | 4.4 |
VIP Equity-Income Portfolio Initial Class | 4.8 | 4.7 |
VIP Growth & Income Portfolio Initial Class | 5.6 | 5.4 |
VIP Growth Portfolio Initial Class | 5.1 | 4.5 |
VIP Mid Cap Portfolio Initial Class | 1.5 | 1.3 |
VIP Value Portfolio Initial Class | 3.7 | 3.5 |
VIP Value Strategies Portfolio Initial Class | 1.8 | 1.7 |
| 27.3 | 25.5 |
Developed International Equity Funds | | |
VIP Overseas Portfolio Initial Class | 9.4 | 7.1 |
Emerging Markets Equity Funds | | |
VIP Emerging Markets Portfolio Initial Class | 2.4 | 2.0 |
High Yield Bond Funds | | |
VIP High Income Portfolio Initial Class | 6.2 | 4.9 |
Investment Grade Bond Funds | | |
VIP Investment Grade Bond Portfolio Initial Class | 34.1 | 28.8 |
Short-Term Funds | | |
VIP Money Market Portfolio Initial Class | 20.6 | 31.7 |
Net Other Assets (Liabilities)* | 0.0 | 0.0 |
| 100.0 | 100.0 |
* Amount represents less than 0.1% |
Asset Allocation (% of fund's net assets) |
Period end |
| Domestic Equity Funds | 27.3% | |
| Developed International Equity Funds | 9.4% | |
| Emerging Markets Equity Funds | 2.4% | |
| High Yield Bond Funds | 6.2% | |
| Investment Grade Bond Funds | 34.1% | |
| Short-Term Funds | 20.6% | |

Six months ago |
| Domestic Equity Funds | 25.5% | |
| Developed International Equity Funds | 7.1% | |
| Emerging Markets Equity Funds | 2.0% | |
| High Yield Bond Funds | 4.9% | |
| Investment Grade Bond Funds | 28.8% | |
| Short-Term Funds | 31.7% | |

Annual Report
VIP Freedom 2005 Portfolio
Investments December 31, 2013
Showing Percentage of Net Assets
Domestic Equity Funds - 27.3% |
| Shares | | Value |
Domestic Equity Funds - 27.3% |
VIP Contrafund Portfolio Initial Class (b) | 10,335 | | $ 355,021 |
VIP Equity-Income Portfolio Initial Class (b) | 15,334 | | 357,123 |
VIP Growth & Income Portfolio Initial Class (b) | 21,783 | | 416,920 |
VIP Growth Portfolio Initial Class (b) | 6,534 | | 373,359 |
VIP Mid Cap Portfolio Initial Class (b) | 2,996 | | 109,010 |
VIP Value Portfolio Initial Class (b) | 17,766 | | 269,695 |
VIP Value Strategies Portfolio Initial Class (b) | 9,421 | | 135,381 |
TOTAL DOMESTIC EQUITY FUNDS (Cost $1,666,825) |
2,016,509
|
International Equity Funds - 11.8% |
| | | |
Developed International Equity Funds - 9.4% |
VIP Overseas Portfolio Initial Class (b) | 33,612 | | 693,747 |
Emerging Markets Equity Funds - 2.4% |
VIP Emerging Markets Portfolio Initial Class (b) | 19,457 | | 175,304 |
TOTAL INTERNATIONAL EQUITY FUNDS (Cost $828,271) |
869,051
|
Bond Funds - 40.3% |
| Shares | | Value |
High Yield Bond Funds - 6.2% |
VIP High Income Portfolio Initial Class (b) | 78,317 | | $ 454,241 |
Investment Grade Bond Funds - 34.1% |
VIP Investment Grade Bond Portfolio Initial Class (b) | 203,655 | | 2,517,174 |
TOTAL BOND FUNDS (Cost $3,065,199) |
2,971,415
|
Short-Term Funds - 20.6% |
| | | |
VIP Money Market Portfolio Initial Class 0.01% (a)(b)
(Cost $1,515,699) | 1,515,699 | |
1,515,699
|
TOTAL INVESTMENT PORTFOLIO - 100.0% (Cost $7,075,994) | | 7,372,674 |
NET OTHER ASSETS (LIABILITIES) - 0.0% | | (36) |
NET ASSETS - 100% | $ 7,372,638 |
Legend |
(a) The rate quoted is the annualized seven-day yield of the fund at period end. |
(b) Affiliated company |
Affiliated Underlying Funds |
Information regarding the Fund's fiscal year to date purchases and sales of the affiliated Underlying Funds and income earned by the Fund from investments in affiliated Underlying Funds is as follows: |
Affiliate | Value,
beginning of
period | Purchases | Sales
Proceeds | Dividend
Income | Value,
end of
period |
VIP Contrafund Portfolio Initial Class | $ 290,601 | $ 149,210 | $ 172,021 | $ 3,408 | $ 355,021 |
VIP Emerging Markets Portfolio Initial Class | 150,498 | 91,117 | 71,368 | 1,153 | 175,304 |
VIP Equity-Income Portfolio Initial Class | 310,988 | 183,146 | 192,359 | 8,215 | 357,123 |
VIP Growth & Income Portfolio Initial Class | 351,652 | 181,831 | 224,606 | 7,025 | 416,920 |
VIP Growth Portfolio Initial Class | 287,822 | 150,157 | 172,031 | 944 | 373,359 |
VIP High Income Portfolio Initial Class | 324,816 | 275,308 | 143,213 | 23,638 | 454,241 |
VIP Investment Grade Bond Portfolio Initial Class | 1,900,518 | 1,591,204 | 845,294 | 59,306 | 2,517,174 |
VIP Mid Cap Portfolio Initial Class | 86,527 | 55,499 | 51,072 | 491 | 109,010 |
VIP Money Market Portfolio Initial Class | 1,858,464 | 1,272,376 | 1,615,133 | 617 | 1,515,699 |
VIP Overseas Portfolio Initial Class | 490,698 | 322,734 | 266,144 | 7,666 | 693,747 |
VIP Value Portfolio Initial Class | 231,406 | 135,444 | 146,691 | 2,740 | 269,695 |
VIP Value Strategies Portfolio Initial Class | 114,721 | 56,349 | 68,458 | 1,133 | 135,381 |
Total | $ 6,398,711 | $ 4,464,375 | $ 3,968,390 | $ 116,336 | $ 7,372,674 |
Other Information |
All investments are categorized as Level 1 under the Fair Value Hierarchy. The inputs or methodology used for valuing securities may not be an indication of the risk associated with investing in those securities. For more information on valuation inputs, please refer to the Investment Valuation section in the accompanying Notes to Financial Statements. |
See accompanying notes which are an integral part of the financial statements.
Annual Report
VIP Freedom 2005 Portfolio
Statement of Assets and Liabilities
| December 31, 2013 |
| | |
Assets | | |
Investment in securities, at value (cost $7,075,994) - See accompanying schedule | | $ 7,372,674 |
Receivable for investments sold | | 1,965 |
Receivable for fund shares sold | | 308 |
Total assets | | 7,374,947 |
| | |
Liabilities | | |
Payable to custodian bank | $ 1 | |
Payable for fund shares redeemed | 2,273 | |
Distribution and service plan fees payable | 35 | |
Total liabilities | | 2,309 |
| | |
Net Assets | | $ 7,372,638 |
Net Assets consist of: | | |
Paid in capital | | $ 7,108,133 |
Accumulated undistributed net realized gain (loss) on investments | | (32,175) |
Net unrealized appreciation (depreciation) on investments | | 296,680 |
Net Assets | | $ 7,372,638 |
Statement of Assets and Liabilities - continued
| December 31, 2013 |
| | |
Initial Class:
Net Asset Value, offering price and redemption price per share ($7,145,390 ÷ 628,247 shares) | | $ 11.37 |
| | |
Service Class:
Net Asset Value, offering price and redemption price per share ($125,432 ÷ 10,964 shares) | | $ 11.44 |
| | |
Service Class 2:
Net Asset Value, offering price and redemption price per share ($101,816 ÷ 8,960 shares) | | $ 11.36 |
See accompanying notes which are an integral part of the financial statements.
Annual Report
Statement of Operations
| Year ended December 31, 2013 |
| | |
Investment Income | | |
Income distributions from underlying funds | | $ 116,336 |
| | |
Expenses | | |
Distribution and service plan fees | $ 1,080 | |
Independent trustees' compensation | 28 | |
Total expenses before reductions | 1,108 | |
Expense reductions | (28) | 1,080 |
Net investment income (loss) | | 115,256 |
Realized and Unrealized Gain (Loss) Realized gain (loss) on sale of underlying fund shares | 91,201 | |
Capital gain distributions from underlying funds | 87,298 | |
Total net realized gain (loss) | | 178,499 |
Change in net unrealized appreciation (depreciation) on underlying funds | | 386,770 |
Net gain (loss) | | 565,269 |
Net increase (decrease) in net assets resulting from operations | | $ 680,525 |
Statement of Changes in Net Assets
| Year ended
December 31, 2013 | Year ended
December 31, 2012 |
Increase (Decrease) in Net Assets | | |
Operations | | |
Net investment income (loss) | $ 115,256 | $ 102,489 |
Net realized gain (loss) | 178,499 | 125,579 |
Change in net unrealized appreciation (depreciation) | 386,770 | 304,249 |
Net increase (decrease) in net assets resulting from operations | 680,525 | 532,317 |
Distributions to shareholders from net investment income | (115,267) | (101,614) |
Distributions to shareholders from net realized gain | (23,784) | (41,617) |
Total distributions | (139,051) | (143,231) |
Share transactions - net increase (decrease) | 432,519 | 465,022 |
Total increase (decrease) in net assets | 973,993 | 854,108 |
| | |
Net Assets | | |
Beginning of period | 6,398,645 | 5,544,537 |
End of period | $ 7,372,638 | $ 6,398,645 |
See accompanying notes which are an integral part of the financial statements.
Annual Report
Financial Highlights - Initial Class
Years ended December 31, | 2013 | 2012 | 2011 | 2010 | 2009 |
Selected Per-Share Data | | | | | |
Net asset value, beginning of period | $ 10.56 | $ 9.86 | $ 10.07 | $ 9.34 | $ 8.14 |
Income from Investment Operations | | | | | |
Net investment income (loss) C | .17 | .18 | .22 | .18 | .34 |
Net realized and unrealized gain (loss) | .86 | .76 | (.20) | .87 | 1.48 |
Total from investment operations | 1.03 | .94 | .02 | 1.05 | 1.82 |
Distributions from net investment income | (.18) | (.17) | (.19) | (.20) | (.35) |
Distributions from net realized gain | (.04) | (.07) | (.04) | (.12) | (.26) |
Total distributions | (.22) | (.24) | (.23) | (.32) | (.62) G |
Net asset value, end of period | $ 11.37 | $ 10.56 | $ 9.86 | $ 10.07 | $ 9.34 |
Total Return A,B | 9.74% | 9.57% | .18% | 11.34% | 23.02% |
Ratios to Average Net Assets D,F | | | | | |
Expenses before reductions E | .00% | .00% | .00% | .00% | .00% |
Expenses net of fee waivers, if any | .00% | .00% | .00% | .00% | .00% |
Expenses net of all reductions | .00% | .00% | .00% | .00% | .00% |
Net investment income (loss) | 1.57% | 1.72% | 2.17% | 1.90% | 3.95% |
Supplemental Data | | | | | |
Net assets, end of period (000 omitted) | $ 7,145 | $ 5,971 | $ 5,224 | $ 5,733 | $ 6,833 |
Portfolio turnover rate D | 54% | 30% | 54% | 42% | 50% |
A Total returns do not reflect charges attributable to your insurance company's separate account. Inclusion of these charges would reduce the total returns shown.
B Total returns would have been lower if certain expenses had not been reduced during the applicable periods shown.
C Calculated based on average shares outstanding during the period.
D Amounts do not include the activity of the Underlying Funds.
E Amount represents less than .01%.
F Expense ratios reflect operating expenses of the class. Expenses before reductions do not reflect amounts reimbursed by the investment adviser or reductions from expense offset arrangements and do not represent the amount paid by the class during periods when reimbursements or reductions occur. Expenses net of fee waivers reflect expenses after reimbursement by the investment adviser but prior to reductions from expense offset arrangements. Expenses net of all reductions represent the net expenses paid by the class but do not include expenses of the investment companies in which the Fund invests.
G Total distributions of $.62 per share is comprised of distributions from net investment income of $.353 and distributions from net realized gain of $.262 per share.
Financial Highlights - Service Class
Years ended December 31, | 2013 | 2012 | 2011 | 2010 | 2009 |
Selected Per-Share Data | | | | | |
Net asset value, beginning of period | $ 10.57 | $ 9.86 | $ 10.08 | $ 9.35 | $ 8.14 |
Income from Investment Operations | | | | | |
Net investment income (loss) C | .16 | .17 | .21 | .17 | .33 |
Net realized and unrealized gain (loss) | .85 | .77 | (.21) | .87 | 1.48 |
Total from investment operations | 1.01 | .94 | - H | 1.04 | 1.81 |
Distributions from net investment income | (.11) | (.16) | (.18) | (.19) | (.34) |
Distributions from net realized gain | (.04) | (.07) | (.04) | (.12) | (.26) |
Total distributions | (.14) F | (.23) | (.22) | (.31) | (.60) G |
Net asset value, end of period | $ 11.44 | $ 10.57 | $ 9.86 | $ 10.08 | $ 9.35 |
Total Return A,B | 9.60% | 9.59% | (.04)% | 11.24% | 23.00% |
Ratios to Average Net Assets D,E | | | | | |
Expenses before reductions | .10% | .10% | .10% | .10% | .10% |
Expenses net of fee waivers, if any | .10% | .10% | .10% | .10% | .10% |
Expenses net of all reductions | .10% | .10% | .10% | .10% | .10% |
Net investment income (loss) | 1.47% | 1.62% | 2.07% | 1.80% | 3.85% |
Supplemental Data | | | | | |
Net assets, end of period (000 omitted) | $ 125 | $ 177 | $ 95 | $ 179 | $ 172 |
Portfolio turnover rate D | 54% | 30% | 54% | 42% | 50% |
A Total returns do not reflect charges attributable to your insurance company's separate account. Inclusion of these charges would reduce the total returns shown.
B Total returns would have been lower if certain expenses had not been reduced during the applicable periods shown.
C Calculated based on average shares outstanding during the period.
D Amounts do not include the activity of the Underlying Funds.
E Expense ratios reflect operating expenses of the class. Expenses before reductions do not reflect amounts reimbursed by the investment adviser or reductions from expense offset arrangements and do not represent the amount paid by the class during periods when reimbursements or reductions occur. Expenses net of fee waivers reflect expenses after reimbursement by the investment adviser but prior to reductions from expense offset arrangements. Expenses net of all reductions represent the net expenses paid by the class but do not include expenses of the investment companies in which the Fund invests.
F Total distributions of $.14 per share is comprised of distributions from net investment income of $.107 and distributions from net realized gain of $.037 per share.
G Total distributions of $.60 per share is comprised of distributions from net investment income of $.341 and distributions from net realized gain of $.262 per share.
H Amount represents less than $.01 per share.
See accompanying notes which are an integral part of the financial statements.
Annual Report
Financial Highlights - Service Class 2
Years ended December 31, | 2013 | 2012 | 2011 | 2010 | 2009 |
Selected Per-Share Data | | | | | |
Net asset value, beginning of period | $ 10.55 | $ 9.85 | $ 10.08 | $ 9.35 | $ 8.14 |
Income from Investment Operations | | | | | |
Net investment income (loss) C | .15 | .15 | .19 | .16 | .32 |
Net realized and unrealized gain (loss) | .85 | .77 | (.20) | .86 | 1.48 |
Total from investment operations | 1.00 | .92 | (.01) | 1.02 | 1.80 |
Distributions from net investment income | (.15) | (.15) | (.18) | (.18) | (.32) |
Distributions from net realized gain | (.04) | (.07) | (.04) | (.12) | (.26) |
Total distributions | (.19) | (.22) | (.22) | (.29) F | (.59) G |
Net asset value, end of period | $ 11.36 | $ 10.55 | $ 9.85 | $ 10.08 | $ 9.35 |
Total Return A,B | 9.46% | 9.35% | (.09)% | 11.06% | 22.78% |
Ratios to Average Net Assets D,E | | | | | |
Expenses before reductions | .25% | .25% | .25% | .25% | .25% |
Expenses net of fee waivers, if any | .25% | .25% | .25% | .25% | .25% |
Expenses net of all reductions | .25% | .25% | .25% | .25% | .25% |
Net investment income (loss) | 1.31% | 1.48% | 1.92% | 1.65% | 3.70% |
Supplemental Data | | | | | |
Net assets, end of period (000 omitted) | $ 102 | $ 251 | $ 226 | $ 157 | $ 183 |
Portfolio turnover rate D | 54% | 30% | 54% | 42% | 50% |
A Total returns do not reflect charges attributable to your insurance company's separate account. Inclusion of these charges would reduce the total returns shown.
B Total returns would have been lower if certain expenses had not been reduced during the applicable periods shown.
C Calculated based on average shares outstanding during the period.
D Amounts do not include the activity of the Underlying Funds.
E Expense ratios reflect operating expenses of the class. Expenses before reductions do not reflect amounts reimbursed by the investment adviser or reductions from expense offset arrangements and do not represent the amount paid by the class during periods when reimbursements or reductions occur. Expenses net of fee waivers reflect expenses after reimbursement by the investment adviser but prior to reductions from expense offset arrangements. Expenses net of all reductions represent the net expenses paid by the class but do not include expenses of the investment companies in which the Fund invests.
F Total distributions of $.29 per share is comprised of distributions from net investment income of $.177 and distributions from net realized gain of $.117 per share.
G Total distributions of $.59 per share is comprised of distributions from net investment income of $.324 and distributions from net realized gain of $.262 per share.
See accompanying notes which are an integral part of the financial statements.
Annual Report
VIP Freedom 2010 Portfolio
Investment Changes (Unaudited)
The information in the following tables is based on the direct investments of the Fund.
Fund Holdings as of December 31, 2013 |
| % of fund's
net assets | % of fund's net assets
6 months ago |
Domestic Equity Funds | | |
VIP Contrafund Portfolio Initial Class | 5.9 | 6.2 |
VIP Equity-Income Portfolio Initial Class | 6.0 | 6.6 |
VIP Growth & Income Portfolio Initial Class | 7.0 | 7.6 |
VIP Growth Portfolio Initial Class | 6.2 | 6.3 |
VIP Mid Cap Portfolio Initial Class | 1.8 | 1.8 |
VIP Value Portfolio Initial Class | 4.5 | 4.9 |
VIP Value Strategies Portfolio Initial Class | 2.2 | 2.4 |
| 33.6 | 35.8 |
Developed International Equity Funds | | |
VIP Overseas Portfolio Initial Class | 11.6 | 9.9 |
Emerging Markets Equity Funds | | |
VIP Emerging Markets Portfolio Initial Class | 2.9 | 2.8 |
High Yield Bond Funds | | |
VIP High Income Portfolio Initial Class | 6.3 | 4.9 |
Investment Grade Bond Funds | | |
VIP Investment Grade Bond Portfolio Initial Class | 30.4 | 33.3 |
Short-Term Funds | | |
VIP Money Market Portfolio Initial Class | 15.2 | 13.3 |
Net Other Assets (Liabilities)* | 0.0 | 0.0 |
| 100.0 | 100.0 |
* Amount represents less than 0.1% |
Asset Allocation (% of fund's net assets) |
Period end |
| Domestic Equity Funds | 33.6% | |
| Developed International Equity Funds | 11.6% | |
| Emerging Markets Equity Funds | 2.9% | |
| High Yield Bond Funds | 6.3% | |
| Investment Grade Bond Funds | 30.4% | |
| Short-Term Funds | 15.2% | |

Six months ago |
| Domestic Equity Funds | 35.8% | |
| Developed International Equity Funds | 9.9% | |
| Emerging Markets Equity Funds | 2.8% | |
| High Yield Bond Funds | 4.9% | |
| Investment Grade Bond Funds | 33.3% | |
| Short-Term Funds | 13.3% | |

Annual Report
VIP Freedom 2010 Portfolio
Investments December 31, 2013
Showing Percentage of Net Assets
Domestic Equity Funds - 33.6% |
| Shares | | Value |
Domestic Equity Funds - 33.6% |
VIP Contrafund Portfolio Initial Class (b) | 484,645 | | $ 16,647,567 |
VIP Equity-Income Portfolio Initial Class (b) | 719,069 | | 16,747,109 |
VIP Growth & Income Portfolio Initial Class (b) | 1,023,178 | | 19,583,629 |
VIP Growth Portfolio Initial Class (b) | 305,482 | | 17,455,242 |
VIP Mid Cap Portfolio Initial Class (b) | 139,301 | | 5,069,177 |
VIP Value Portfolio Initial Class (b) | 830,721 | | 12,610,351 |
VIP Value Strategies Portfolio Initial Class (b) | 438,786 | | 6,305,361 |
TOTAL DOMESTIC EQUITY FUNDS (Cost $71,478,814) |
94,418,436
|
International Equity Funds - 14.5% |
| | | |
Developed International Equity Funds - 11.6% |
VIP Overseas Portfolio Initial Class (b) | 1,573,821 | | 32,483,675 |
Emerging Markets Equity Funds - 2.9% |
VIP Emerging Markets Portfolio Initial Class (b) | 908,620 | | 8,186,669 |
TOTAL INTERNATIONAL EQUITY FUNDS (Cost $35,549,936) |
40,670,344
|
Bond Funds - 36.7% |
| Shares | | Value |
High Yield Bond Funds - 6.3% |
VIP High Income Portfolio Initial Class (b) | 3,036,675 | | $ 17,612,716 |
Investment Grade Bond Funds - 30.4% |
VIP Investment Grade Bond Portfolio Initial Class (b) | 6,917,829 | | 85,504,368 |
TOTAL BOND FUNDS (Cost $106,297,059) |
103,117,084
|
Short-Term Funds - 15.2% |
| | | |
VIP Money Market Portfolio Initial Class 0.01% (a)(b)
(Cost $42,788,632) | 42,788,632 | |
42,788,632
|
TOTAL INVESTMENT PORTFOLIO - 100.0% (Cost $256,114,441) | | 280,994,496 |
NET OTHER ASSETS (LIABILITIES) - 0.0% | | (45,017) |
NET ASSETS - 100% | $ 280,949,479 |
Legend |
(a) The rate quoted is the annualized seven-day yield of the fund at period end. |
(b) Affiliated company |
Affiliated Underlying Funds |
Information regarding the Fund's fiscal year to date purchases and sales of the affiliated Underlying Funds and income earned by the Fund from investments in affiliated Underlying Funds is as follows: |
Affiliate | Value,
beginning of
period | Purchases | Sales
Proceeds | Dividend
Income | Value,
end of
period |
VIP Contrafund Portfolio Initial Class | $ 13,293,989 | $ 3,543,411 | $ 4,236,897 | $ 167,582 | $ 16,647,567 |
VIP Emerging Markets Portfolio Initial Class | 6,874,133 | 2,038,569 | 964,887 | 57,613 | 8,186,669 |
VIP Equity-Income Portfolio Initial Class | 14,217,462 | 5,021,377 | 4,984,377 | 404,772 | 16,747,109 |
VIP Growth & Income Portfolio Initial Class | 16,082,359 | 4,392,999 | 5,888,390 | 346,345 | 19,583,629 |
VIP Growth Portfolio Initial Class | 13,181,909 | 3,552,791 | 4,179,584 | 46,221 | 17,455,242 |
VIP High Income Portfolio Initial Class | 11,095,058 | 7,976,976 | 1,306,127 | 892,120 | 17,612,716 |
VIP Investment Grade Bond Portfolio Initial Class | 75,215,095 | 27,058,514 | 12,154,860 | 2,091,645 | 85,504,368 |
VIP Mid Cap Portfolio Initial Class | 3,957,804 | 1,606,203 | 1,304,000 | 23,891 | 5,069,177 |
VIP Money Market Portfolio Initial Class | 26,685,102 | 19,621,647 | 3,518,117 | 8,730 | 42,788,632 |
VIP Overseas Portfolio Initial Class | 22,425,345 | 7,187,195 | 3,857,956 | 383,272 | 32,483,675 |
VIP Value Portfolio Initial Class | 10,578,208 | 3,730,816 | 3,931,588 | 134,434 | 12,610,351 |
VIP Value Strategies Portfolio Initial Class | 5,243,866 | 1,326,925 | 1,784,390 | 55,277 | 6,305,361 |
Total | $ 218,850,330 | $ 87,057,423 | $ 48,111,173 | $ 4,611,902 | $ 280,994,496 |
Other Information |
All investments are categorized as Level 1 under the Fair Value Hierarchy. The inputs or methodology used for valuing securities may not be an indication of the risk associated with investing in those securities. For more information on valuation inputs, please refer to the Investment Valuation section in the accompanying Notes to Financial Statements. |
See accompanying notes which are an integral part of the financial statements.
Annual Report
VIP Freedom 2010 Portfolio
Statement of Assets and Liabilities
| December 31, 2013 |
| | |
Assets | | |
Investment in securities, at value (cost $256,114,441) - See accompanying schedule | | $ 280,994,496 |
Cash | | 3 |
Receivable for investments sold | | 123,254 |
Receivable for fund shares sold | | 90,167 |
Total assets | | 281,207,920 |
| | |
Liabilities | | |
Payable for fund shares redeemed | $ 213,433 | |
Distribution and service plan fees payable | 45,008 | |
Total liabilities | | 258,441 |
| | |
Net Assets | | $ 280,949,479 |
Net Assets consist of: | | |
Paid in capital | | $ 253,587,049 |
Undistributed net investment income | | 5,291 |
Accumulated undistributed net realized gain (loss) on investments | | 2,477,084 |
Net unrealized appreciation (depreciation) on investments | | 24,880,055 |
Net Assets | | $ 280,949,479 |
Statement of Assets and Liabilities - continued
| December 31, 2013 |
| | |
Initial Class:
Net Asset Value, offering price and redemption price per share ($44,429,614 ÷ 3,612,298 shares) | | $ 12.30 |
| | |
Service Class:
Net Asset Value, offering price and redemption price per share ($27,142,785 ÷ 2,209,036 shares) | | $ 12.29 |
| | |
Service Class 2:
Net Asset Value, offering price and redemption price per share ($209,377,080 ÷ 17,111,918 shares) | | $ 12.24 |
See accompanying notes which are an integral part of the financial statements.
Annual Report
Statement of Operations
| Year ended December 31, 2013 |
| | |
Investment Income | | |
Income distributions from underlying funds | | $ 4,611,902 |
| | |
Expenses | | |
Distribution and service plan fees | $ 498,683 | |
Independent trustees' compensation | 933 | |
Total expenses before reductions | 499,616 | |
Expense reductions | (933) | 498,683 |
Net investment income (loss) | | 4,113,219 |
Realized and Unrealized Gain (Loss) Realized gain (loss) on sale of underlying fund shares | 773,305 | |
Capital gain distributions from underlying funds | 3,867,882 | |
Total net realized gain (loss) | | 4,641,187 |
Change in net unrealized appreciation (depreciation) on underlying funds | | 22,424,595 |
Net gain (loss) | | 27,065,782 |
Net increase (decrease) in net assets resulting from operations | | $ 31,179,001 |
Statement of Changes in Net Assets
| Year ended
December 31, 2013 | Year ended
December 31, 2012 |
Increase (Decrease) in Net Assets | | |
Operations | | |
Net investment income (loss) | $ 4,113,219 | $ 3,713,684 |
Net realized gain (loss) | 4,641,187 | 3,661,695 |
Change in net unrealized appreciation (depreciation) | 22,424,595 | 14,134,634 |
Net increase (decrease) in net assets resulting from operations | 31,179,001 | 21,510,013 |
Distributions to shareholders from net investment income | (4,107,928) | (3,667,794) |
Distributions to shareholders from net realized gain | (2,907,571) | (2,915,717) |
Total distributions | (7,015,499) | (6,583,511) |
Share transactions - net increase (decrease) | 37,971,934 | 24,270,479 |
Total increase (decrease) in net assets | 62,135,436 | 39,196,981 |
| | |
Net Assets | | |
Beginning of period | 218,814,043 | 179,617,062 |
End of period (including undistributed net investment income of $5,291 and $0, respectively) | $ 280,949,479 | $ 218,814,043 |
See accompanying notes which are an integral part of the financial statements.
Annual Report
Financial Highlights - Initial Class
Years ended December 31, | 2013 | 2012 | 2011 | 2010 | 2009 |
Selected Per-Share Data | | | | | |
Net asset value, beginning of period | $ 11.15 | $ 10.31 | $ 10.61 | $ 9.77 | $ 8.23 |
Income from Investment Operations | | | | | |
Net investment income (loss) C | .22 | .23 | .24 | .24 | .38 |
Net realized and unrealized gain (loss) | 1.27 | .98 | (.26) | 1.02 | 1.60 |
Total from investment operations | 1.49 | 1.21 | (.02) | 1.26 | 1.98 |
Distributions from net investment income | (.21) | (.21) | (.23) | (.23) | (.37) |
Distributions from net realized gain | (.14) | (.16) | (.06) | (.19) | (.07) |
Total distributions | (.34) G | (.37) | (.28) H | (.42) | (.44) |
Net asset value, end of period | $ 12.30 | $ 11.15 | $ 10.31 | $ 10.61 | $ 9.77 |
Total Return A,B | 13.49% | 11.78% | (.19)% | 12.95% | 24.27% |
Ratios to Average Net Assets D,F | | | | | |
Expenses before reductions E | .00% | .00% | .00% | .00% | .00% |
Expenses net of fee waivers, if any | .00% | .00% | .00% | .00% | .00% |
Expenses net of all reductions | .00% | .00% | .00% | .00% | .00% |
Net investment income (loss) | 1.83% | 2.07% | 2.27% | 2.38% | 4.22% |
Supplemental Data | | | | | |
Net assets, end of period (000 omitted) | $ 44,430 | $ 27,416 | $ 22,338 | $ 22,573 | $ 21,197 |
Portfolio turnover rate D | 19% | 18% | 17% | 29% | 28% |
A Total returns do not reflect charges attributable to your insurance company's separate account. Inclusion of these charges would reduce the total returns shown.
B Total returns would have been lower if certain expenses had not been reduced during the applicable periods shown.
C Calculated based on average shares outstanding during the period.
D Amounts do not include the activity of the Underlying Funds.
E Amount represents less than .01%.
F Expense ratios reflect operating expenses of the class. Expenses before reductions do not reflect amounts reimbursed by the investment adviser or reductions from expense offset arrangements and do not represent the amount paid by the class during periods when reimbursements or reductions occur. Expenses net of fee waivers reflect expenses after reimbursement by the investment adviser but prior to reductions from expense offset arrangements. Expenses net of all reductions represent the net expenses paid by the class but do not include expenses of the investment companies in which the Fund invests.
G Total distributions of $.34 per share is comprised of distributions from net investment income of $.205 and distributions from net realized gain of $.139 per share.
H Total distributions of $.28 per share is comprised of distributions from net investment income of $.225 and distributions from net realized gain of $.055 per share.
Financial Highlights - Service Class
Years ended December 31, | 2013 | 2012 | 2011 | 2010 | 2009 |
Selected Per-Share Data | | | | | |
Net asset value, beginning of period | $ 11.14 | $ 10.30 | $ 10.60 | $ 9.77 | $ 8.23 |
Income from Investment Operations | | | | | |
Net investment income (loss) C | .20 | .22 | .23 | .23 | .37 |
Net realized and unrealized gain (loss) | 1.28 | .98 | (.26) | 1.01 | 1.60 |
Total from investment operations | 1.48 | 1.20 | (.03) | 1.24 | 1.97 |
Distributions from net investment income | (.19) | (.20) | (.22) | (.21) | (.36) |
Distributions from net realized gain | (.14) | (.16) | (.06) | (.19) | (.07) |
Total distributions | (.33) | (.36) | (.27) F | (.41) G | (.43) |
Net asset value, end of period | $ 12.29 | $ 11.14 | $ 10.30 | $ 10.60 | $ 9.77 |
Total Return A,B | 13.39% | 11.69% | (.28)% | 12.74% | 24.15% |
Ratios to Average Net Assets D,E | | | | | |
Expenses before reductions | .10% | .10% | .10% | .10% | .10% |
Expenses net of fee waivers, if any | .10% | .10% | .10% | .10% | .10% |
Expenses net of all reductions | .10% | .10% | .10% | .10% | .10% |
Net investment income (loss) | 1.73% | 1.97% | 2.17% | 2.28% | 4.12% |
Supplemental Data | | | | | |
Net assets, end of period (000 omitted) | $ 27,143 | $ 23,896 | $ 20,927 | $ 19,259 | $ 19,238 |
Portfolio turnover rate D | 19% | 18% | 17% | 29% | 28% |
A Total returns do not reflect charges attributable to your insurance company's separate account. Inclusion of these charges would reduce the total returns shown.
B Total returns would have been lower if certain expenses had not been reduced during the applicable periods shown.
C Calculated based on average shares outstanding during the period.
D Amounts do not include the activity of the Underlying Funds.
E Expense ratios reflect operating expenses of the class. Expenses before reductions do not reflect amounts reimbursed by the investment adviser or reductions from expense offset arrangements and do not represent the amount paid by the class during periods when reimbursements or reductions occur. Expenses net of fee waivers reflect expenses after reimbursement by the investment adviser but prior to reductions from expense offset arrangements. Expenses net of all reductions represent the net expenses paid by the class but do not include expenses of the investment companies in which the Fund invests.
F Total distributions of $.27 per share is comprised of distributions from net investment income of $.215 and distributions from net realized gain of $.055 per share.
G Total distributions of $.41 per share is comprised of distributions from net investment income of $.214 and distributions from net realized gain of $.191 per share.
See accompanying notes which are an integral part of the financial statements.
Annual Report
Financial Highlights - Service Class 2
Years ended December 31, | 2013 | 2012 | 2011 | 2010 | 2009 |
Selected Per-Share Data | | | | | |
Net asset value, beginning of period | $ 11.10 | $ 10.26 | $ 10.56 | $ 9.74 | $ 8.21 |
Income from Investment Operations | | | | | |
Net investment income (loss) C | .19 | .20 | .22 | .22 | .35 |
Net realized and unrealized gain (loss) | 1.27 | .98 | (.26) | .99 | 1.60 |
Total from investment operations | 1.46 | 1.18 | (.04) | 1.21 | 1.95 |
Distributions from net investment income | (.18) | (.19) | (.20) | (.20) | (.35) |
Distributions from net realized gain | (.14) | (.16) | (.06) | (.19) | (.07) |
Total distributions | (.32) | (.34) F | (.26) | (.39) | (.42) |
Net asset value, end of period | $ 12.24 | $ 11.10 | $ 10.26 | $ 10.56 | $ 9.74 |
Total Return A,B | 13.20% | 11.58% | (.43)% | 12.55% | 23.95% |
Ratios to Average Net Assets D,E | | | | | |
Expenses before reductions | .25% | .25% | .25% | .25% | .25% |
Expenses net of fee waivers, if any | .25% | .25% | .25% | .25% | .25% |
Expenses net of all reductions | .25% | .25% | .25% | .25% | .25% |
Net investment income (loss) | 1.58% | 1.82% | 2.02% | 2.13% | 3.97% |
Supplemental Data | | | | | |
Net assets, end of period (000 omitted) | $ 209,377 | $ 167,502 | $ 136,353 | $ 117,966 | $ 87,791 |
Portfolio turnover rate D | 19% | 18% | 17% | 29% | 28% |
A Total returns do not reflect charges attributable to your insurance company's separate account. Inclusion of these charges would reduce the total returns shown.
B Total returns would have been lower if certain expenses had not been reduced during the applicable periods shown.
C Calculated based on average shares outstanding during the period.
D Amounts do not include the activity of the Underlying Funds.
E Expense ratios reflect operating expenses of the class. Expenses before reductions do not reflect amounts reimbursed by the investment adviser or reductions from expense offset arrangements and do not represent the amount paid by the class during periods when reimbursements or reductions occur. Expenses net of fee waivers reflect expenses after reimbursement by the investment adviser but prior to reductions from expense offset arrangements. Expenses net of all reductions represent the net expenses paid by the class but do not include expenses of the investment companies in which the Fund invests.
F Total distributions of $.34 per share is comprised of distributions from net investment income of $.186 and distributions from net realized gain of $.157 per share.
See accompanying notes which are an integral part of the financial statements.
Annual Report
VIP Freedom 2015 Portfolio
Investment Changes (Unaudited)
The information in the following tables is based on the direct investments of the Fund.
Fund Holdings as of December 31, 2013 |
| % of fund's
net assets | % of fund's net assets
6 months ago |
Domestic Equity Funds | | |
VIP Contrafund Portfolio Initial Class | 7.0 | 6.5 |
VIP Equity-Income Portfolio Initial Class | 7.1 | 6.9 |
VIP Growth & Income Portfolio Initial Class | 8.2 | 7.9 |
VIP Growth Portfolio Initial Class | 7.3 | 6.6 |
VIP Mid Cap Portfolio Initial Class | 2.1 | 1.9 |
VIP Value Portfolio Initial Class | 5.3 | 5.1 |
VIP Value Strategies Portfolio Initial Class | 2.6 | 2.4 |
| 39.6 | 37.3 |
Developed International Equity Funds | | |
VIP Overseas Portfolio Initial Class | 13.6 | 10.4 |
Emerging Markets Equity Funds | | |
VIP Emerging Markets Portfolio Initial Class | 3.5 | 3.0 |
High Yield Bond Funds | | |
VIP High Income Portfolio Initial Class | 6.4 | 4.9 |
Investment Grade Bond Funds | | |
VIP Investment Grade Bond Portfolio Initial Class | 26.8 | 34.4 |
Short-Term Funds | | |
VIP Money Market Portfolio Initial Class | 10.1 | 10.0 |
Net Other Assets (Liabilities)* | 0.0 | 0.0 |
| 100.0 | 100.0 |
* Amount represents less than 0.1% |
Asset Allocation (% of fund's net assets) |
Period end |
| Domestic Equity Funds | 39.6% | |
| Developed International Equity Funds | 13.6% | |
| Emerging Markets Equity Funds | 3.5% | |
| High Yield Bond Funds | 6.4% | |
| Investment Grade Bond Funds | 26.8% | |
| Short-Term Funds | 10.1% | |

Six months ago |
 | Domestic Equity Funds | 37.3% | |
| Developed International Equity Funds | 10.4% | |
| Emerging Markets Equity Funds | 3.0% | |
| High Yield Bond Funds | 4.9% | |
| Investment Grade Bond Funds | 34.4% | |
| Short-Term Funds | 10.0% | |

Annual Report
VIP Freedom 2015 Portfolio
Investments December 31, 2013
Showing Percentage of Net Assets
Domestic Equity Funds - 39.6% |
| Shares | | Value |
Domestic Equity Funds - 39.6% |
VIP Contrafund Portfolio Initial Class (b) | 232,934 | | $ 8,001,284 |
VIP Equity-Income Portfolio Initial Class (b) | 346,726 | | 8,075,257 |
VIP Growth & Income Portfolio Initial Class (b) | 492,441 | | 9,425,320 |
VIP Growth Portfolio Initial Class (b) | 146,451 | | 8,368,225 |
VIP Mid Cap Portfolio Initial Class (b) | 66,510 | | 2,420,315 |
VIP Value Portfolio Initial Class (b) | 399,651 | | 6,066,706 |
VIP Value Strategies Portfolio Initial Class (b) | 210,058 | | 3,018,527 |
TOTAL DOMESTIC EQUITY FUNDS (Cost $32,344,916) |
45,375,634
|
International Equity Funds - 17.1% |
| | | |
Developed International Equity Funds - 13.6% |
VIP Overseas Portfolio Initial Class (b) | 755,057 | | 15,584,370 |
Emerging Markets Equity Funds - 3.5% |
VIP Emerging Markets Portfolio Initial Class (b) | 439,939 | | 3,963,850 |
TOTAL INTERNATIONAL EQUITY FUNDS (Cost $17,130,007) |
19,548,220
|
Bond Funds - 33.2% |
| Shares | | Value |
High Yield Bond Funds - 6.4% |
VIP High Income Portfolio Initial Class (b) | 1,262,712 | | $ 7,323,728 |
Investment Grade Bond Funds - 26.8% |
VIP Investment Grade Bond Portfolio Initial Class (b) | 2,478,957 | | 30,639,904 |
TOTAL BOND FUNDS (Cost $38,774,797) |
37,963,632
|
Short-Term Funds - 10.1% |
| | | |
VIP Money Market Portfolio Initial Class 0.01% (a)(b)
(Cost $11,611,098) | 11,611,098 | |
11,611,098
|
TOTAL INVESTMENT PORTFOLIO - 100.0% (Cost $99,860,818) | | 114,498,584 |
NET OTHER ASSETS (LIABILITIES) - 0.0% | | (13,762) |
NET ASSETS - 100% | $ 114,484,822 |
Legend |
(a) The rate quoted is the annualized seven-day yield of the fund at period end. |
(b) Affiliated company |
Affiliated Underlying Funds |
Information regarding the Fund's fiscal year to date purchases and sales of the affiliated Underlying Funds and income earned by the Fund from investments in affiliated Underlying Funds is as follows: |
Affiliate | Value,
beginning
of period | Purchases | Sales
Proceeds | Dividend
Income | Value,
end of
period |
VIP Contrafund Portfolio Initial Class | $ 6,511,189 | $ 1,397,567 | $ 1,786,159 | $ 76,790 | $ 8,001,284 |
VIP Emerging Markets Portfolio Initial Class | 3,376,954 | 1,199,372 | 716,824 | 26,938 | 3,963,850 |
VIP Equity-Income Portfolio Initial Class | 6,970,691 | 2,060,991 | 2,152,430 | 185,738 | 8,075,257 |
VIP Growth & Income Portfolio Initial Class | 7,880,187 | 1,738,273 | 2,538,412 | 158,864 | 9,425,320 |
VIP Growth Portfolio Initial Class | 6,443,947 | 1,377,612 | 1,695,909 | 21,157 | 8,368,225 |
VIP High Income Portfolio Initial Class | 5,269,193 | 3,200,795 | 1,095,708 | 370,557 | 7,323,728 |
VIP Investment Grade Bond Portfolio Initial Class | 36,296,613 | 10,302,469 | 14,054,403 | 832,850 | 30,639,904 |
VIP Mid Cap Portfolio Initial Class | 1,939,810 | 670,779 | 567,894 | 10,897 | 2,420,315 |
VIP Money Market Portfolio Initial Class | 10,200,518 | 3,592,935 | 2,182,355 | 3,047 | 11,611,098 |
VIP Overseas Portfolio Initial Class | 11,005,057 | 4,210,248 | 2,702,298 | 177,611 | 15,584,370 |
VIP Value Portfolio Initial Class | 5,188,872 | 1,529,599 | 1,714,386 | 61,608 | 6,066,706 |
VIP Value Strategies Portfolio Initial Class | 2,573,085 | 521,269 | 787,090 | 25,244 | 3,018,527 |
Total | $ 103,656,116 | $ 31,801,909 | $ 31,993,868 | $ 1,951,301 | $ 114,498,584 |
Other Information |
All investments are categorized as Level 1 under the Fair Value Hierarchy. The inputs or methodology used for valuing securities may not be an indication of the risk associated with investing in those securities. For more information on valuation inputs, please refer to the Investment Valuation section in the accompanying Notes to Financial Statements. |
See accompanying notes which are an integral part of the financial statements.
Annual Report
VIP Freedom 2015 Portfolio
Statement of Assets and Liabilities
| December 31, 2013 |
| | |
Assets | | |
Investment in securities, at value (cost $99,860,818) - See accompanying schedule | | $ 114,498,584 |
Cash | | 9 |
Receivable for investments sold | | 183,939 |
Receivable for fund shares sold | | 42,701 |
Total assets | | 114,725,233 |
| | |
Liabilities | | |
Payable for fund shares redeemed | $ 226,676 | |
Distribution and service plan fees payable | 13,735 | |
Total liabilities | | 240,411 |
| | |
Net Assets | | $ 114,484,822 |
Net Assets consist of: | | |
Paid in capital | | $ 98,818,662 |
Undistributed net investment income | | 5,232 |
Accumulated undistributed net realized gain (loss) on investments | | 1,023,162 |
Net unrealized appreciation (depreciation) on investments | | 14,637,766 |
Net Assets | | $ 114,484,822 |
Statement of Assets and Liabilities - continued
| December 31, 2013 |
| | |
Initial Class:
Net Asset Value, offering price and redemption price per share ($41,070,079 ÷ 3,304,647 shares) | | $ 12.43 |
| | |
Service Class:
Net Asset Value, offering price and redemption price per share ($10,762,352 ÷ 867,107 shares) | | $ 12.41 |
| | |
Service Class 2:
Net Asset Value, offering price and redemption price per share ($62,652,391 ÷ 5,064,137 shares) | | $ 12.37 |
See accompanying notes which are an integral part of the financial statements.
Annual Report
Statement of Operations
| Year ended December 31, 2013 |
| | |
Investment Income | | |
Income distributions from underlying funds | | $ 1,951,301 |
| | |
Expenses | | |
Distribution and service plan fees | $ 163,743 | |
Independent trustees' compensation | 411 | |
Total expenses before reductions | 164,154 | |
Expense reductions | (411) | 163,743 |
Net investment income (loss) | | 1,787,558 |
Realized and Unrealized Gain (Loss) Realized gain (loss) on sale of underlying fund shares | 305,459 | |
Capital gain distributions from underlying funds | 1,711,245 | |
Total net realized gain (loss) | | 2,016,704 |
Change in net unrealized appreciation (depreciation) on underlying funds | | 10,728,968 |
Net gain (loss) | | 12,745,672 |
Net increase (decrease) in net assets resulting from operations | | $ 14,533,230 |
Statement of Changes in Net Assets
| Year ended
December 31, 2013 | Year ended
December 31, 2012 |
Increase (Decrease) in Net Assets | | |
Operations | | |
Net investment income (loss) | $ 1,787,558 | $ 1,911,708 |
Net realized gain (loss) | 2,016,704 | 2,326,374 |
Change in net unrealized appreciation (depreciation) | 10,728,968 | 7,433,132 |
Net increase (decrease) in net assets resulting from operations | 14,533,230 | 11,671,214 |
Distributions to shareholders from net investment income | (1,804,111) | (1,889,922) |
Distributions to shareholders from net realized gain | (1,618,311) | (1,799,507) |
Total distributions | (3,422,422) | (3,689,429) |
Share transactions - net increase (decrease) | (269,133) | (6,207,000) |
Total increase (decrease) in net assets | 10,841,675 | 1,774,785 |
| | |
Net Assets | | |
Beginning of period | 103,643,147 | 101,868,362 |
End of period (including undistributed net investment income of $5,232 and $21,786, respectively) | $ 114,484,822 | $ 103,643,147 |
See accompanying notes which are an integral part of the financial statements.
Annual Report
Financial Highlights - Initial Class
Years ended December 31, | 2013 | 2012 | 2011 | 2010 | 2009 |
Selected Per-Share Data | | | | | |
Net asset value, beginning of period | $ 11.22 | $ 10.38 | $ 10.70 | $ 9.78 | $ 8.19 |
Income from Investment Operations | | | | | |
Net investment income (loss) C | .21 | .22 | .23 | .23 | .38 |
Net realized and unrealized gain (loss) | 1.39 | 1.04 | (.27) | 1.04 | 1.67 |
Total from investment operations | 1.60 | 1.26 | (.04) | 1.27 | 2.05 |
Distributions from net investment income | (.22) | (.23) | (.23) | (.23) | (.34) |
Distributions from net realized gain | (.18) | (.20) | (.06) | (.13) | (.12) |
Total distributions | (.39) G | (.42) H | (.28) I | (.35) J | (.46) |
Net asset value, end of period | $ 12.43 | $ 11.22 | $ 10.38 | $ 10.70 | $ 9.78 |
Total Return A,B | 14.41% | 12.23% | (.36)% | 13.09% | 25.28% |
Ratios to Average Net Assets D,F | | | | | |
Expenses before reductions E | .00% | .00% | .00% | .00% | .00% |
Expenses net of fee waivers, if any | .00% | .00% | .00% | .00% | .00% |
Expenses net of all reductions | .00% | .00% | .00% | .00% | .00% |
Net investment income (loss) | 1.79% | 2.01% | 2.16% | 2.30% | 4.21% |
Supplemental Data | | | | | |
Net assets, end of period (000 omitted) | $ 41,070 | $ 36,449 | $ 38,879 | $ 39,535 | $ 37,291 |
Portfolio turnover rate D | 29% | 28% | 26% | 30% | 23% |
A Total returns do not reflect charges attributable to your insurance company's separate account. Inclusion of these charges would reduce the total returns shown.
B Total returns would have been lower if certain expenses had not been reduced during the applicable periods shown.
C Calculated based on average shares outstanding during the period.
D Amounts do not include the activity of the Underlying Funds.
E Amount represents less than .01%.
F Expense ratios reflect operating expenses of the class. Expenses before reductions do not reflect amounts reimbursed by the investment adviser or reductions from expense offset arrangements and do not represent the amount paid by the class during periods when reimbursements or reductions occur. Expenses net of fee waivers reflect expenses after reimbursement by the investment adviser but prior to reductions from expense offset arrangements. Expenses net of all reductions represent the net expenses paid by the class but do not include expenses of the investment companies in which the Fund invests.
G Total distributions of $.39 per share is comprised of distributions from net investment income of $.217 and distributions from net realized gain of $.175 per share.
H Total distributions of $.42 per share is comprised of distributions from net investment income of $.227 and distributions from net realized gain of $.195 per share.
I Total distributions of $.28 per share is comprised of distributions from net investment income of $.227 and distributions from net realized gain of $.055 per share.
J Total distributions of $.35 per share is comprised of distributions from net investment income of $.227 and distributions from net realized gain of $.127 per share.
Financial Highlights - Service Class
Years ended December 31, | 2013 | 2012 | 2011 | 2010 | 2009 |
Selected Per-Share Data | | | | | |
Net asset value, beginning of period | $ 11.21 | $ 10.37 | $ 10.69 | $ 9.77 | $ 8.19 |
Income from Investment Operations | | | | | |
Net investment income (loss) C | .20 | .21 | .22 | .22 | .37 |
Net realized and unrealized gain (loss) | 1.38 | 1.04 | (.26) | 1.05 | 1.66 |
Total from investment operations | 1.58 | 1.25 | (.04) | 1.27 | 2.03 |
Distributions from net investment income | (.21) | (.22) | (.22) | (.22) | (.33) |
Distributions from net realized gain | (.18) | (.20) | (.06) | (.13) | (.12) |
Total distributions | (.38) F | (.41) G | (.28) | (.35) | (.45) |
Net asset value, end of period | $ 12.41 | $ 11.21 | $ 10.37 | $ 10.69 | $ 9.77 |
Total Return A,B | 14.24% | 12.13% | (.41)% | 13.00% | 25.06% |
Ratios to Average Net Assets D,E | | | | | |
Expenses before reductions | .10% | .10% | .10% | .10% | .10% |
Expenses net of fee waivers, if any | .10% | .10% | .10% | .10% | .10% |
Expenses net of all reductions | .10% | .10% | .10% | .10% | .10% |
Net investment income (loss) | 1.69% | 1.91% | 2.06% | 2.20% | 4.12% |
Supplemental Data | | | | | |
Net assets, end of period (000 omitted) | $ 10,762 | $ 6,600 | $ 7,743 | $ 2,723 | $ 1,524 |
Portfolio turnover rate D | 29% | 28% | 26% | 30% | 23% |
A Total returns do not reflect charges attributable to your insurance company's separate account. Inclusion of these charges would reduce the total returns shown.
B Total returns would have been lower if certain expenses had not been reduced during the applicable periods shown.
C Calculated based on average shares outstanding during the period.
D Amounts do not include the activity of the Underlying Funds.
E Expense ratios reflect operating expenses of the class. Expenses before reductions do not reflect amounts reimbursed by the investment adviser or reductions from expense offset arrangements and do not represent the amount paid by the class during periods when reimbursements or reductions occur. Expenses net of fee waivers reflect expenses after reimbursement by the investment adviser but prior to reductions from expense offset arrangements. Expenses net of all reductions represent the net expenses paid by the class but do not include expenses of the investment companies in which the Fund invests.
F Total distributions of $.38 per share is comprised of distributions from net investment income of $.207 and distributions from net realized gain of $.175 per share.
G Total distributions of $.41 per share is comprised of distributions from net investment income of $.216 and distributions from net realized gain of $.195 per share.
See accompanying notes which are an integral part of the financial statements.
Annual Report
Financial Highlights - Service Class 2
Years ended December 31, | 2013 | 2012 | 2011 | 2010 | 2009 |
Selected Per-Share Data | | | | | |
Net asset value, beginning of period | $ 11.17 | $ 10.34 | $ 10.65 | $ 9.74 | $ 8.16 |
Income from Investment Operations | | | | | |
Net investment income (loss) C | .18 | .19 | .21 | .21 | .35 |
Net realized and unrealized gain (loss) | 1.38 | 1.03 | (.26) | 1.03 | 1.67 |
Total from investment operations | 1.56 | 1.22 | (.05) | 1.24 | 2.02 |
Distributions from net investment income | (.19) | (.20) | (.20) | (.20) | (.32) |
Distributions from net realized gain | (.18) | (.20) | (.06) | (.13) | (.12) |
Total distributions | (.36) F | (.39) G | (.26) | (.33) | (.44) |
Net asset value, end of period | $ 12.37 | $ 11.17 | $ 10.34 | $ 10.65 | $ 9.74 |
Total Return A,B | 14.10% | 11.90% | (.52)% | 12.79% | 25.02% |
Ratios to Average Net Assets D,E | | | | | |
Expenses before reductions | .25% | .25% | .25% | .25% | .25% |
Expenses net of fee waivers, if any | .25% | .25% | .25% | .25% | .25% |
Expenses net of all reductions | .25% | .25% | .25% | .25% | .25% |
Net investment income (loss) | 1.54% | 1.76% | 1.91% | 2.05% | 3.97% |
Supplemental Data | | | | | |
Net assets, end of period (000 omitted) | $ 62,652 | $ 60,594 | $ 55,246 | $ 56,112 | $ 42,534 |
Portfolio turnover rate D | 29% | 28% | 26% | 30% | 23% |
A Total returns do not reflect charges attributable to your insurance company's separate account. Inclusion of these charges would reduce the total returns shown.
B Total returns would have been lower if certain expenses had not been reduced during the applicable periods shown.
C Calculated based on average shares outstanding during the period.
D Amounts do not include the activity of the Underlying Funds.
E Expense ratios reflect operating expenses of the class. Expenses before reductions do not reflect amounts reimbursed by the investment adviser or reductions from expense offset arrangements and do not represent the amount paid by the class during periods when reimbursements or reductions occur. Expenses net of fee waivers reflect expenses after reimbursement by the investment adviser but prior to reductions from expense offset arrangements. Expenses net of all reductions represent the net expenses paid by the class but do not include expenses of the investment companies in which the Fund invests.
F Total distributions of $.36 per share is comprised of distributions from net investment income of $.186 and distributions from net realized gain of $.175 per share.
G Total distributions of $.39 per share is comprised of distributions from net investment income of $.199 and distributions from net realized gain of $.195 per share.
See accompanying notes which are an integral part of the financial statements.
Annual Report
VIP Freedom 2020 Portfolio
Investment Changes (Unaudited)
The information in the following tables is based on the direct investments of the Fund.
Fund Holdings as of December 31, 2013 |
| % of fund's
net assets | % of fund's net assets
6 months ago |
Domestic Equity Funds | | |
VIP Contrafund Portfolio Initial Class | 7.8 | 7.1 |
VIP Equity-Income Portfolio Initial Class | 7.9 | 7.5 |
VIP Growth & Income Portfolio Initial Class | 9.2 | 8.6 |
VIP Growth Portfolio Initial Class | 8.1 | 7.2 |
VIP Mid Cap Portfolio Initial Class | 2.3 | 2.0 |
VIP Value Portfolio Initial Class | 5.9 | 5.5 |
VIP Value Strategies Portfolio Initial Class | 2.9 | 2.7 |
| 44.1 | 40.6 |
Developed International Equity Funds | | |
VIP Overseas Portfolio Initial Class | 15.2 | 11.2 |
Emerging Markets Equity Funds | | |
VIP Emerging Markets Portfolio Initial Class | 3.8 | 3.2 |
High Yield Bond Funds | | |
VIP High Income Portfolio Initial Class | 6.5 | 5.7 |
Investment Grade Bond Funds | | |
VIP Investment Grade Bond Portfolio Initial Class | 24.0 | 32.2 |
Short-Term Funds | | |
VIP Money Market Portfolio Initial Class | 6.4 | 7.1 |
Net Other Assets (Liabilities)* | 0.0 | 0.0 |
| 100.0 | 100.0 |
* Amount represents less than 0.1% |
Asset Allocation (% of fund's net assets) |
Period end |
| Domestic Equity Funds | 44.1% | |
| Developed International Equity Funds | 15.2% | |
| Emerging Markets Equity Funds | 3.8% | |
| High Yield Bond Funds | 6.5% | |
| Investment Grade Bond Funds | 24.0% | |
| Short-Term Funds | 6.4% | |

Six months ago |
| Domestic Equity Funds | 40.6% | |
| Developed International Equity Funds | 11.2% | |
| Emerging Markets Equity Funds | 3.2% | |
| High Yield Bond Funds | 5.7% | |
| Investment Grade Bond Funds | 32.2% | |
| Short-Term Funds | 7.1% | |

Annual Report
VIP Freedom 2020 Portfolio
Investments December 31, 2013
Showing Percentage of Net Assets
Domestic Equity Funds - 44.1% |
| Shares | | Value |
Domestic Equity Funds - 44.1% |
VIP Contrafund Portfolio Initial Class (b) | 1,673,533 | | $ 57,485,863 |
VIP Equity-Income Portfolio Initial Class (b) | 2,493,638 | | 58,076,823 |
VIP Growth & Income Portfolio Initial Class (b) | 3,540,197 | | 67,759,370 |
VIP Growth Portfolio Initial Class (b) | 1,051,348 | | 60,074,001 |
VIP Mid Cap Portfolio Initial Class (b) | 477,597 | | 17,379,772 |
VIP Value Portfolio Initial Class (b) | 2,871,323 | | 43,586,683 |
VIP Value Strategies Portfolio Initial Class (b) | 1,509,962 | | 21,698,160 |
TOTAL DOMESTIC EQUITY FUNDS (Cost $233,407,637) |
326,060,672
|
International Equity Funds - 19.0% |
| | | |
Developed International Equity Funds - 15.2% |
VIP Overseas Portfolio Initial Class (b) | 5,428,717 | | 112,048,720 |
Emerging Markets Equity Funds - 3.8% |
VIP Emerging Markets Portfolio Initial Class (b) | 3,151,266 | | 28,392,902 |
TOTAL INTERNATIONAL EQUITY FUNDS (Cost $119,850,336) |
140,441,622
|
Bond Funds - 30.5% |
| Shares | | Value |
High Yield Bond Funds - 6.5% |
VIP High Income Portfolio Initial Class (b) | 8,325,506 | | $ 48,287,935 |
Investment Grade Bond Funds - 24.0% |
VIP Investment Grade Bond Portfolio Initial Class (b) | 14,375,653 | | 177,683,069 |
TOTAL BOND FUNDS (Cost $234,685,543) |
225,971,004
|
Short-Term Funds - 6.4% |
| | | |
VIP Money Market Portfolio Initial Class 0.01% (a)(b)
(Cost $47,569,070) | 47,569,070 | |
47,569,070
|
TOTAL INVESTMENT PORTFOLIO - 100.0% (Cost $635,512,586) | | 740,042,368 |
NET OTHER ASSETS (LIABILITIES) - 0.0% | | (124,703) |
NET ASSETS - 100% | $ 739,917,665 |
Legend |
(a) The rate quoted is the annualized seven-day yield of the fund at period end. |
(b) Affiliated company |
Affiliated Underlying Funds |
Information regarding the Fund's fiscal year to date purchases and sales of the affiliated Underlying Funds and income earned by the Fund from investments in affiliated Underlying Funds is as follows: |
Affiliate | Value,
beginning of
period | Purchases | Sales
Proceeds | Dividend
Income | Value,
end of
period |
VIP Contrafund Portfolio Initial Class | $ 43,609,513 | $ 8,455,064 | $ 7,487,691 | $ 538,074 | $ 57,485,863 |
VIP Emerging Markets Portfolio Initial Class | 22,586,206 | 7,671,463 | 2,602,642 | 187,380 | 28,392,902 |
VIP Equity-Income Portfolio Initial Class | 46,667,440 | 13,058,977 | 9,643,530 | 1,301,574 | 58,076,823 |
VIP Growth & Income Portfolio Initial Class | 52,771,327 | 10,598,152 | 11,573,801 | 1,112,961 | 67,759,370 |
VIP Growth Portfolio Initial Class | 43,202,017 | 8,312,154 | 6,931,701 | 148,245 | 60,074,001 |
VIP High Income Portfolio Initial Class | 37,083,988 | 15,092,906 | 3,634,296 | 2,517,870 | 48,287,935 |
VIP Investment Grade Bond Portfolio Initial Class | 200,343,135 | 54,187,060 | 65,742,423 | 4,881,087 | 177,683,069 |
VIP Mid Cap Portfolio Initial Class | 12,987,056 | 4,306,454 | 2,466,610 | 76,379 | 17,379,772 |
VIP Money Market Portfolio Initial Class | 39,192,728 | 14,126,283 | 5,749,941 | 12,554 | 47,569,070 |
VIP Overseas Portfolio Initial Class | 73,628,388 | 27,998,506 | 10,803,743 | 1,241,661 | 112,048,720 |
VIP Value Portfolio Initial Class | 34,726,330 | 9,725,213 | 7,980,746 | 431,485 | 43,586,683 |
VIP Value Strategies Portfolio Initial Class | 17,215,044 | 3,162,939 | 3,519,872 | 177,024 | 21,698,160 |
Total | $ 624,013,172 | $ 176,695,171 | $ 138,136,996 | $ 12,626,294 | $ 740,042,368 |
Other Information |
All investments are categorized as Level 1 under the Fair Value Hierarchy. The inputs or methodology used for valuing securities may not be an indication of the risk associated with investing in those securities. For more information on valuation inputs, please refer to the Investment Valuation section in the accompanying Notes to Financial Statements. |
See accompanying notes which are an integral part of the financial statements.
Annual Report
VIP Freedom 2020 Portfolio
Statement of Assets and Liabilities
| December 31, 2013 |
| | |
Assets | | |
Investment in securities, at value (cost $635,512,586) - See accompanying schedule | | $ 740,042,368 |
Receivable for investments sold | | 46,668 |
Receivable for fund shares sold | | 415,636 |
Total assets | | 740,504,672 |
| | |
Liabilities | | |
Payable to custodian bank | $ 26 | |
Payable for fund shares redeemed | 462,346 | |
Distribution and service plan fees payable | 124,635 | |
Total liabilities | | 587,007 |
| | |
Net Assets | | $ 739,917,665 |
Net Assets consist of: | | |
Paid in capital | | $ 627,786,005 |
Undistributed net investment income | | 10,693 |
Accumulated undistributed net realized gain (loss) on investments | | 7,591,185 |
Net unrealized appreciation (depreciation) on investments | | 104,529,782 |
Net Assets | | $ 739,917,665 |
Statement of Assets and Liabilities - continued
| December 31, 2013 |
| | |
Initial Class:
Net Asset Value, offering price and redemption price per share ($91,328,349 ÷ 7,242,005 shares) | | $ 12.61 |
| | |
Service Class:
Net Asset Value, offering price and redemption price per share ($65,867,112 ÷ 5,233,282 shares) | | $ 12.59 |
| | |
Service Class 2:
Net Asset Value, offering price and redemption price per share ($582,722,204 ÷ 46,451,030 shares) | | $ 12.54 |
See accompanying notes which are an integral part of the financial statements.
Annual Report
Statement of Operations
| Year ended December 31, 2013 |
| | |
Investment Income | | |
Income distributions from underlying funds | | $ 12,626,294 |
| | |
Expenses | | |
Distribution and service plan fees | $ 1,438,964 | |
Independent trustees' compensation | 2,564 | |
Total expenses before reductions | 1,441,528 | |
Expense reductions | (2,564) | 1,438,964 |
Net investment income (loss) | | 11,187,330 |
Realized and Unrealized Gain (Loss) Realized gain (loss) on sale of underlying fund shares | 2,162,792 | |
Capital gain distributions from underlying funds | 11,480,758 | |
Total net realized gain (loss) | | 13,643,550 |
Change in net unrealized appreciation (depreciation) on underlying funds | | 75,308,233 |
Net gain (loss) | | 88,951,783 |
Net increase (decrease) in net assets resulting from operations | | $ 100,139,113 |
Statement of Changes in Net Assets
| Year ended
December 31, 2013 | Year ended
December 31, 2012 |
Increase (Decrease) in Net Assets | | |
Operations | | |
Net investment income (loss) | $ 11,187,330 | $ 11,356,013 |
Net realized gain (loss) | 13,643,550 | 10,411,086 |
Change in net unrealized appreciation (depreciation) | 75,308,233 | 48,277,108 |
Net increase (decrease) in net assets resulting from operations | 100,139,113 | 70,044,207 |
Distributions to shareholders from net investment income | (11,274,396) | (11,215,369) |
Distributions to shareholders from net realized gain | (9,210,708) | (7,056,034) |
Total distributions | (20,485,104) | (18,271,403) |
Share transactions - net increase (decrease) | 36,361,165 | 61,104,235 |
Total increase (decrease) in net assets | 116,015,174 | 112,877,039 |
| | |
Net Assets | | |
Beginning of period | 623,902,491 | 511,025,452 |
End of period (including undistributed net investment income of $10,693 and $97,759, respectively) | $ 739,917,665 | $ 623,902,491 |
See accompanying notes which are an integral part of the financial statements.
Annual Report
Financial Highlights - Initial Class
Years ended December 31, | 2013 | 2012 | 2011 | 2010 | 2009 |
Selected Per-Share Data | | | | | |
Net asset value, beginning of period | $ 11.21 | $ 10.21 | $ 10.59 | $ 9.52 | $ 7.71 |
Income from Investment Operations | | | | | |
Net investment income (loss) C | .22 | .24 | .26 | .26 | .33 |
Net realized and unrealized gain (loss) | 1.56 | 1.12 | (.37) | 1.11 | 1.88 |
Total from investment operations | 1.78 | 1.36 | (.11) | 1.37 | 2.21 |
Distributions from net investment income | (.22) | (.23) | (.23) | (.22) | (.29) |
Distributions from net realized gain | (.16) | (.13) | (.04) | (.08) | (.11) |
Total distributions | (.38) | (.36) | (.27) | (.30) | (.40) G |
Net asset value, end of period | $ 12.61 | $ 11.21 | $ 10.21 | $ 10.59 | $ 9.52 |
Total Return A,B | 16.01% | 13.38% | (1.03)% | 14.49% | 28.97% |
Ratios to Average Net Assets D,F | | | | | |
Expenses before reductions E | .00% | .00% | .00% | .00% | .00% |
Expenses net of fee waivers, if any | .00% | .00% | .00% | .00% | .00% |
Expenses net of all reductions | .00% | .00% | .00% | .00% | .00% |
Net investment income (loss) | 1.84% | 2.16% | 2.47% | 2.61% | 3.93% |
Supplemental Data | | | | | |
Net assets, end of period (000 omitted) | $ 91,328 | $ 58,113 | $ 47,731 | $ 45,225 | $ 38,330 |
Portfolio turnover rate D | 20% | 15% | 10% | 21% | 18% |
A Total returns do not reflect charges attributable to your insurance company's separate account. Inclusion of these charges would reduce the total returns shown.
B Total returns would have been lower if certain expenses had not been reduced during the applicable periods shown.
C Calculated based on average shares outstanding during the period.
D Amounts do not include the activity of the Underlying Funds.
E Amount represents less than .01%.
F Expense ratios reflect operating expenses of the class. Expenses before reductions do not reflect amounts reimbursed by the investment adviser or reductions from expense offset arrangements and do not represent the amount paid by the class during periods when reimbursements or reductions occur. Expenses net of fee waivers reflect expenses after reimbursement by the investment adviser but prior to reductions from expense offset arrangements. Expenses net of all reductions represent the net expenses paid by the class but do not include expenses of the investment companies in which the Fund invests.
G Total distributions of $.40 per share is comprised of distributions from net investment income of $.293 and distributions from net realized gain of $.107 per share.
Financial Highlights - Service Class
Years ended December 31, | 2013 | 2012 | 2011 | 2010 | 2009 |
Selected Per-Share Data | | | | | |
Net asset value, beginning of period | $ 11.19 | $ 10.20 | $ 10.58 | $ 9.50 | $ 7.70 |
Income from Investment Operations | | | | | |
Net investment income (loss) C | .21 | .23 | .25 | .25 | .32 |
Net realized and unrealized gain (loss) | 1.56 | 1.11 | (.37) | 1.12 | 1.87 |
Total from investment operations | 1.77 | 1.34 | (.12) | 1.37 | 2.19 |
Distributions from net investment income | (.21) | (.22) | (.22) | (.21) | (.29) |
Distributions from net realized gain | (.16) | (.13) | (.04) | (.08) | (.11) |
Total distributions | (.37) | (.35) | (.26) | (.29) | (.39) F |
Net asset value, end of period | $ 12.59 | $ 11.19 | $ 10.20 | $ 10.58 | $ 9.50 |
Total Return A,B | 15.95% | 13.19% | (1.12)% | 14.52% | 28.78% |
Ratios to Average Net Assets D,E | | | | | |
Expenses before reductions | .10% | .10% | .10% | .10% | .10% |
Expenses net of fee waivers, if any | .10% | .10% | .10% | .10% | .10% |
Expenses net of all reductions | .10% | .10% | .10% | .10% | .10% |
Net investment income (loss) | 1.74% | 2.06% | 2.37% | 2.51% | 3.83% |
Supplemental Data | | | | | |
Net assets, end of period (000 omitted) | $ 65,867 | $ 45,779 | $ 36,818 | $ 33,244 | $ 25,941 |
Portfolio turnover rate D | 20% | 15% | 10% | 21% | 18% |
A Total returns do not reflect charges attributable to your insurance company's separate account. Inclusion of these charges would reduce the total returns shown.
B Total returns would have been lower if certain expenses had not been reduced during the applicable periods shown.
C Calculated based on average shares outstanding during the period.
D Amounts do not include the activity of the Underlying Funds.
E Expense ratios reflect operating expenses of the class. Expenses before reductions do not reflect amounts reimbursed by the investment adviser or reductions from expense offset arrangements and do not represent the amount paid by the class during periods when reimbursements or reductions occur. Expenses net of fee waivers reflect expenses after reimbursement by the investment adviser but prior to reductions from expense offset arrangements. Expenses net of all reductions represent the net expenses paid by the class but do not include expenses of the investment companies in which the Fund invests.
F Total distributions of $.39 per share is comprised of distributions from net investment income of $.285 and distributions from net realized gain of $.107 per share.
See accompanying notes which are an integral part of the financial statements.
Annual Report
Financial Highlights - Service Class 2
Years ended December 31, | 2013 | 2012 | 2011 | 2010 | 2009 |
Selected Per-Share Data | | | | | |
Net asset value, beginning of period | $ 11.16 | $ 10.17 | $ 10.55 | $ 9.48 | $ 7.69 |
Income from Investment Operations | | | | | |
Net investment income (loss) C | .19 | .21 | .24 | .23 | .31 |
Net realized and unrealized gain (loss) | 1.54 | 1.11 | (.37) | 1.12 | 1.86 |
Total from investment operations | 1.73 | 1.32 | (.13) | 1.35 | 2.17 |
Distributions from net investment income | (.19) | (.20) | (.21) | (.20) | (.28) |
Distributions from net realized gain | (.16) | (.13) | (.04) | (.08) | (.11) |
Total distributions | (.35) | (.33) | (.25) | (.28) | (.38) F |
Net asset value, end of period | $ 12.54 | $ 11.16 | $ 10.17 | $ 10.55 | $ 9.48 |
Total Return A,B | 15.63% | 13.07% | (1.24)% | 14.33% | 28.55% |
Ratios to Average Net Assets D,E | | | | | |
Expenses before reductions | .25% | .25% | .25% | .25% | .25% |
Expenses net of fee waivers, if any | .25% | .25% | .25% | .25% | .25% |
Expenses net of all reductions | .25% | .25% | .25% | .25% | .25% |
Net investment income (loss) | 1.59% | 1.91% | 2.22% | 2.36% | 3.68% |
Supplemental Data | | | | | |
Net assets, end of period (000 omitted) | $ 582,722 | $ 520,011 | $ 426,477 | $ 310,255 | $ 189,686 |
Portfolio turnover rate D | 20% | 15% | 10% | 21% | 18% |
A Total returns do not reflect charges attributable to your insurance company's separate account. Inclusion of these charges would reduce the total returns shown.
B Total returns would have been lower if certain expenses had not been reduced during the applicable periods shown.
C Calculated based on average shares outstanding during the period.
D Amounts do not include the activity of the Underlying Funds.
E Expense ratios reflect operating expenses of the class. Expenses before reductions do not reflect amounts reimbursed by the investment adviser or reductions from expense offset arrangements and do not represent the amount paid by the class during periods when reimbursements or reductions occur. Expenses net of fee waivers reflect expenses after reimbursement by the investment adviser but prior to reductions from expense offset arrangements. Expenses net of all reductions represent the net expenses paid by the class but do not include expenses of the investment companies in which the Fund invests.
F Total distributions of $.38 per share is comprised of distributions from net investment income of $.275 and distributions from net realized gain of $.107 per share.
See accompanying notes which are an integral part of the financial statements.
Annual Report
VIP Freedom 2025 Portfolio
Investment Changes (Unaudited)
The information in the following tables is based on the direct investments of the Fund.
Fund Holdings as of December 31, 2013 |
| % of fund's
net assets | % of fund's net assets
6 months ago |
Domestic Equity Funds | | |
VIP Contrafund Portfolio Initial Class | 9.2 | 8.7 |
VIP Equity-Income Portfolio Initial Class | 9.3 | 9.2 |
VIP Growth & Income Portfolio Initial Class | 10.8 | 10.5 |
VIP Growth Portfolio Initial Class | 9.6 | 8.8 |
VIP Mid Cap Portfolio Initial Class | 2.8 | 2.5 |
VIP Value Portfolio Initial Class | 7.0 | 6.8 |
VIP Value Strategies Portfolio Initial Class | 3.4 | 3.3 |
| 52.1 | 49.8 |
Developed International Equity Funds | | |
VIP Overseas Portfolio Initial Class | 17.9 | 13.8 |
Emerging Markets Equity Funds | | |
VIP Emerging Markets Portfolio Initial Class | 4.6 | 3.9 |
High Yield Bond Funds | | |
VIP High Income Portfolio Initial Class | 6.6 | 7.2 |
Investment Grade Bond Funds | | |
VIP Investment Grade Bond Portfolio Initial Class | 18.8 | 24.5 |
Short-Term Funds | | |
VIP Money Market Portfolio Initial Class | 0.0 | 0.8 |
Net Other Assets (Liabilities)* | 0.0 | 0.0 |
| 100.0 | 100.0 |
* Amount represents less than 0.1% |
Asset Allocation (% of fund's net assets) |
Period end |
| Domestic Equity Funds | 52.1% | |
 | Developed International Equity Funds | 17.9% | |
 | Emerging Markets Equity Funds | 4.6% | |
 | High Yield Bond Funds | 6.6% | |
| Investment Grade Bond Funds | 18.8% | |

Six months ago |
| Domestic Equity Funds | 49.8% | |
| Developed International Equity Funds | 13.8% | |
| Emerging Markets Equity Funds | 3.9% | |
| High Yield Bond Funds | 7.2% | |
| Investment Grade Bond Funds | 24.5% | |
| Short-Term Funds | 0.8% | |

Annual Report
VIP Freedom 2025 Portfolio
Investments December 31, 2013
Showing Percentage of Net Assets
Domestic Equity Funds - 52.1% |
| Shares | | Value |
Domestic Equity Funds - 52.1% |
VIP Contrafund Portfolio Initial Class (a) | 248,221 | | $ 8,526,388 |
VIP Equity-Income Portfolio Initial Class (a) | 370,041 | | 8,618,255 |
VIP Growth & Income Portfolio Initial Class (a) | 525,307 | | 10,054,377 |
VIP Growth Portfolio Initial Class (a) | 155,906 | | 8,908,461 |
VIP Mid Cap Portfolio Initial Class (a) | 70,419 | | 2,562,544 |
VIP Value Portfolio Initial Class (a) | 425,671 | | 6,461,681 |
VIP Value Strategies Portfolio Initial Class (a) | 222,761 | | 3,201,074 |
TOTAL DOMESTIC EQUITY FUNDS (Cost $36,561,223) |
48,332,780
|
International Equity Funds - 22.5% |
| | | |
Developed International Equity Funds - 17.9% |
VIP Overseas Portfolio Initial Class (a) | 803,981 | | 16,594,173 |
Emerging Markets Equity Funds - 4.6% |
VIP Emerging Markets Portfolio Initial Class (a) | 469,072 | | 4,226,339 |
TOTAL INTERNATIONAL EQUITY FUNDS (Cost $17,891,683) |
20,820,512
|
Bond Funds - 25.4% |
| Shares | | Value |
High Yield Bond Funds - 6.6% |
VIP High Income Portfolio Initial Class (a) | 1,062,108 | | $ 6,160,224 |
Investment Grade Bond Funds - 18.8% |
VIP Investment Grade Bond Portfolio Initial Class (a) | 1,408,204 | | 17,405,403 |
TOTAL BOND FUNDS (Cost $24,460,546) |
23,565,627
|
TOTAL INVESTMENT PORTFOLIO - 100.0% (Cost $78,913,452) | | 92,718,919 |
NET OTHER ASSETS (LIABILITIES) - 0.0% | | (11,289) |
NET ASSETS - 100% | $ 92,707,630 |
Legend |
(a) Affiliated company |
Affiliated Underlying Funds |
Information regarding the Fund's fiscal year to date purchases and sales of the affiliated Underlying Funds and income earned by the Fund from investments in affiliated Underlying Funds is as follows: |
Affiliate | Value,
beginning of period | Purchases | Sales
Proceeds | Dividend
Income | Value,
end of
period |
VIP Contrafund Portfolio Initial Class | $ 5,717,968 | $ 2,681,112 | $ 1,688,422 | $ 80,186 | $ 8,526,388 |
VIP Emerging Markets Portfolio Initial Class | 2,943,853 | 1,867,887 | 699,577 | 27,289 | 4,226,339 |
VIP Equity-Income Portfolio Initial Class | 6,106,193 | 3,434,033 | 1,991,985 | 194,103 | 8,618,255 |
VIP Growth & Income Portfolio Initial Class | 6,910,811 | 3,279,007 | 2,364,862 | 165,827 | 10,054,377 |
VIP Growth Portfolio Initial Class | 5,684,708 | 2,700,005 | 1,666,658 | 22,086 | 8,908,461 |
VIP High Income Portfolio Initial Class | 5,073,085 | 2,530,585 | 1,416,043 | 358,568 | 6,160,224 |
VIP Investment Grade Bond Portfolio Initial Class | 16,499,573 | 9,703,854 | 7,739,068 | 492,456 | 17,405,403 |
VIP Mid Cap Portfolio Initial Class | 1,698,369 | 1,050,769 | 533,926 | 11,310 | 2,562,544 |
VIP Money Market Portfolio Initial Class | 384,791 | 500,355 | 885,146 | 139 | - |
VIP Overseas Portfolio Initial Class | 9,602,877 | 6,546,769 | 2,574,962 | 179,874 | 16,594,173 |
VIP Value Portfolio Initial Class | 4,537,818 | 2,541,712 | 1,583,073 | 64,275 | 6,461,681 |
VIP Value Strategies Portfolio Initial Class | 2,246,395 | 1,005,203 | 729,091 | 26,235 | 3,201,074 |
Total | $ 67,406,441 | $ 37,841,291 | $ 23,872,813 | $ 1,622,348 | $ 92,718,919 |
Other Information |
All investments are categorized as Level 1 under the Fair Value Hierarchy. The inputs or methodology used for valuing securities may not be an indication of the risk associated with investing in those securities. For more information on valuation inputs, please refer to the Investment Valuation section in the accompanying Notes to Financial Statements. |
See accompanying notes which are an integral part of the financial statements.
Annual Report
VIP Freedom 2025 Portfolio
Statement of Assets and Liabilities
| December 31, 2013 |
| | |
Assets | | |
Investment in securities, at value (cost $78,913,452) - See accompanying schedule | | $ 92,718,919 |
Cash | | 1 |
Receivable for investments sold | | 666,157 |
Receivable for fund shares sold | | 160,857 |
Total assets | | 93,545,934 |
| | |
Liabilities | | |
Payable for fund shares redeemed | $ 827,050 | |
Distribution and service plan fees payable | 11,254 | |
Total liabilities | | 838,304 |
| | |
Net Assets | | $ 92,707,630 |
Net Assets consist of: | | |
Paid in capital | | $ 78,067,038 |
Accumulated undistributed net realized gain (loss) on investments | | 835,125 |
Net unrealized appreciation (depreciation) on investments | | 13,805,467 |
Net Assets | | $ 92,707,630 |
Statement of Assets and Liabilities - continued
| December 31, 2013 |
| | |
Initial Class:
Net Asset Value, offering price and redemption price per share ($24,548,388 ÷ 1,889,306 shares) | | $ 12.99 |
| | |
Service Class:
Net Asset Value, offering price and redemption price per share ($21,780,011 ÷ 1,679,111 shares) | | $ 12.97 |
| | |
Service Class 2:
Net Asset Value, offering price and redemption price per share ($46,379,231 ÷ 3,589,354 shares) | | $ 12.92 |
See accompanying notes which are an integral part of the financial statements.
Annual Report
Statement of Operations
| Year ended December 31, 2013 |
| | |
Investment Income | | |
Income distributions from underlying funds | | $ 1,622,348 |
| | |
Expenses | | |
Distribution and service plan fees | $ 119,274 | |
Independent trustees' compensation | 293 | |
Total expenses before reductions | 119,567 | |
Expense reductions | (293) | 119,274 |
Net investment income (loss) | | 1,503,074 |
Realized and Unrealized Gain (Loss) Realized gain (loss) on sale of underlying fund shares | 182,906 | |
Capital gain distributions from underlying funds | 1,582,966 | |
Total net realized gain (loss) | | 1,765,872 |
Change in net unrealized appreciation (depreciation) on underlying funds | | 11,161,093 |
Net gain (loss) | | 12,926,965 |
Net increase (decrease) in net assets resulting from operations | | $ 14,430,039 |
Statement of Changes in Net Assets
| Year ended
December 31, 2013 | Year ended
December 31, 2012 |
Increase (Decrease) in Net Assets | | |
Operations | | |
Net investment income (loss) | $ 1,503,074 | $ 1,155,079 |
Net realized gain (loss) | 1,765,872 | 1,145,671 |
Change in net unrealized appreciation (depreciation) | 11,161,093 | 5,420,555 |
Net increase (decrease) in net assets resulting from operations | 14,430,039 | 7,721,305 |
Distributions to shareholders from net investment income | (1,503,790) | (1,137,450) |
Distributions to shareholders from net realized gain | (1,289,396) | (679,640) |
Total distributions | (2,793,186) | (1,817,090) |
Share transactions - net increase (decrease) | 13,669,826 | 12,942,487 |
Total increase (decrease) in net assets | 25,306,679 | 18,846,702 |
| | |
Net Assets | | |
Beginning of period | 67,400,951 | 48,554,249 |
End of period | $ 92,707,630 | $ 67,400,951 |
See accompanying notes which are an integral part of the financial statements.
Annual Report
Financial Highlights - Initial Class
Years ended December 31, | 2013 | 2012 | 2011 | 2010 | 2009 |
Selected Per-Share Data | | | | | |
Net asset value, beginning of period | $ 11.20 | $ 10.02 | $ 10.49 | $ 9.30 | $ 7.49 |
Income from Investment Operations | | | | | |
Net investment income (loss) C | .25 | .24 | .24 | .28 | .32 |
Net realized and unrealized gain (loss) | 1.97 | 1.27 | (.46) | 1.19 | 1.89 |
Total from investment operations | 2.22 | 1.51 | (.22) | 1.47 | 2.21 |
Distributions from net investment income | (.23) | (.21) | (.22) | (.21) | (.29) |
Distributions from net realized gain | (.20) | (.12) | (.03) | (.06) | (.12) |
Total distributions | (.43) | (.33) | (.25) | (.28) H | (.40) G |
Net asset value, end of period | $ 12.99 | $ 11.20 | $ 10.02 | $ 10.49 | $ 9.30 |
Total Return A,B | 19.95% | 15.11% | (2.11)% | 15.79% | 30.05% |
Ratios to Average Net Assets D,F | | | | | |
Expenses before reductions E | .00% | .00% | .00% | .00% | .00% |
Expenses net of fee waivers, if any | .00% | .00% | .00% | .00% | .00% |
Expenses net of all reductions | .00% | .00% | .00% | .00% | .00% |
Net investment income (loss) | 2.03% | 2.17% | 2.25% | 2.91% | 3.84% |
Supplemental Data | | | | | |
Net assets, end of period (000 omitted) | $ 24,548 | $ 17,792 | $ 15,537 | $ 17,388 | $ 14,888 |
Portfolio turnover rate D | 30% | 34% | 21% | 25% | 30% |
A Total returns do not reflect charges attributable to your insurance company's separate account. Inclusion of these charges would reduce the total returns shown.
B Total returns would have been lower if certain expenses had not been reduced during the applicable periods shown.
C Calculated based on average shares outstanding during the period.
D Amounts do not include the activity of the Underlying Funds.
E Amount represents less than .01%.
F Expense ratios reflect operating expenses of the class. Expenses before reductions do not reflect amounts reimbursed by the investment adviser or reductions from expense offset arrangements and do not represent the amount paid by the class during periods when reimbursements or reductions occur. Expenses net of fee waivers reflect expenses after reimbursement by the investment adviser but prior to reductions from expense offset arrangements. Expenses net of all reductions represent the net expenses paid by the class but do not include expenses of the investment companies in which the Fund invests.
G Total distributions of $.40 per share is comprised of distributions from net investment income of $.285 and distributions from net realized gain of $.117 per share.
H Total distributions of $.28 per share is comprised of distributions from net investment income of $.214 and distributions from net realized gain of $.061 per share.
Financial Highlights - Service Class
Years ended December 31, | 2013 | 2012 | 2011 | 2010 | 2009 |
Selected Per-Share Data | | | | | |
Net asset value, beginning of period | $ 11.18 | $ 10.01 | $ 10.49 | $ 9.30 | $ 7.49 |
Income from Investment Operations | | | | | |
Net investment income (loss) C | .23 | .22 | .23 | .27 | .31 |
Net realized and unrealized gain (loss) | 1.98 | 1.27 | (.47) | 1.19 | 1.90 |
Total from investment operations | 2.21 | 1.49 | (.24) | 1.46 | 2.21 |
Distributions from net investment income | (.22) | (.20) | (.21) | (.21) | (.28) |
Distributions from net realized gain | (.20) | (.12) | (.03) | (.06) | (.12) |
Total distributions | (.42) | (.32) | (.24) | (.27) | (.40) F |
Net asset value, end of period | $ 12.97 | $ 11.18 | $ 10.01 | $ 10.49 | $ 9.30 |
Total Return A,B | 19.89% | 14.97% | (2.26)% | 15.70% | 29.96% |
Ratios to Average Net Assets D,E | | | | | |
Expenses before reductions | .10% | .10% | .10% | .10% | .10% |
Expenses net of fee waivers, if any | .10% | .10% | .10% | .10% | .10% |
Expenses net of all reductions | .10% | .10% | .10% | .10% | .10% |
Net investment income (loss) | 1.93% | 2.07% | 2.16% | 2.81% | 3.74% |
Supplemental Data | | | | | |
Net assets, end of period (000 omitted) | $ 21,780 | $ 16,558 | $ 7,149 | $ 1,429 | $ 679 |
Portfolio turnover rate D | 30% | 34% | 21% | 25% | 30% |
A Total returns do not reflect charges attributable to your insurance company's separate account. Inclusion of these charges would reduce the total returns shown.
B Total returns would have been lower if certain expenses had not been reduced during the applicable periods shown.
C Calculated based on average shares outstanding during the period.
D Amounts do not include the activity of the Underlying Funds.
E Expense ratios reflect operating expenses of the class. Expenses before reductions do not reflect amounts reimbursed by the investment adviser or reductions from expense offset arrangements and do not represent the amount paid by the class during periods when reimbursements or reductions occur. Expenses net of fee waivers reflect expenses after reimbursement by the investment adviser but prior to reductions from expense offset arrangements. Expenses net of all reductions represent the net expenses paid by the class but do not include expenses of the investment companies in which the Fund invests.
F Total distributions of $.40 per share is comprised of distributions from net investment income of $.278 and distributions from net realized gain of $.117 per share.
See accompanying notes which are an integral part of the financial statements.
Annual Report
Financial Highlights - Service Class 2
Years ended December 31, | 2013 | 2012 | 2011 | 2010 | 2009 |
Selected Per-Share Data | | | | | |
Net asset value, beginning of period | $ 11.14 | $ 9.97 | $ 10.44 | $ 9.27 | $ 7.47 |
Income from Investment Operations | | | | | |
Net investment income (loss) C | .22 | .21 | .21 | .26 | .30 |
Net realized and unrealized gain (loss) | 1.96 | 1.26 | (.45) | 1.17 | 1.89 |
Total from investment operations | 2.18 | 1.47 | (.24) | 1.43 | 2.19 |
Distributions from net investment income | (.20) | (.18) | (.19) | (.20) | (.27) |
Distributions from net realized gain | (.20) | (.12) | (.03) | (.06) | (.12) |
Total distributions | (.40) | (.30) | (.23) G | (.26) | (.39) F |
Net asset value, end of period | $ 12.92 | $ 11.14 | $ 9.97 | $ 10.44 | $ 9.27 |
Total Return A,B | 19.71% | 14.80% | (2.35)% | 15.47% | 29.79% |
Ratios to Average Net Assets D,E | | | | | |
Expenses before reductions | .25% | .25% | .25% | .25% | .25% |
Expenses net of fee waivers, if any | .25% | .25% | .25% | .25% | .25% |
Expenses net of all reductions | .25% | .25% | .25% | .25% | .25% |
Net investment income (loss) | 1.78% | 1.92% | 2.00% | 2.67% | 3.59% |
Supplemental Data | | | | | |
Net assets, end of period (000 omitted) | $ 46,379 | $ 33,051 | $ 25,869 | $ 22,782 | $ 8,262 |
Portfolio turnover rate D | 30% | 34% | 21% | 25% | 30% |
A Total returns do not reflect charges attributable to your insurance company's separate account. Inclusion of these charges would reduce the total returns shown.
B Total returns would have been lower if certain expenses had not been reduced during the applicable periods shown.
C Calculated based on average shares outstanding during the period.
D Amounts do not include the activity of the Underlying Funds.
E Expense ratios reflect operating expenses of the class. Expenses before reductions do not reflect amounts reimbursed by the investment adviser or reductions from expense offset arrangements and do not represent the amount paid by the class during periods when reimbursements or reductions occur. Expenses net of fee waivers reflect expenses after reimbursement by the investment adviser but prior to reductions from expense offset arrangements. Expenses net of all reductions represent the net expenses paid by the class but do not include expenses of the investment companies in which the Fund invests.
F Total distributions of $.39 per share is comprised of distributions from net investment income of $.270 and distributions from net realized gain of $.117 per share.
G Total distributions of $.23 per share is comprised of distributions from net investment income of $.192 and distributions from net realized gain of $.033 per share.
See accompanying notes which are an integral part of the financial statements.
Annual Report
VIP Freedom 2030 Portfolio
Investment Changes (Unaudited)
The information in the following tables is based on the direct investments of the Fund.
Fund Holdings as of December 31, 2013 |
| % of fund's
net assets | % of fund's net assets
6 months ago |
Domestic Equity Funds | | |
VIP Contrafund Portfolio Initial Class | 10.8 | 9.1 |
VIP Equity-Income Portfolio Initial Class | 11.0 | 9.7 |
VIP Growth & Income Portfolio Initial Class | 12.8 | 11.1 |
VIP Growth Portfolio Initial Class | 11.3 | 9.2 |
VIP Mid Cap Portfolio Initial Class | 3.2 | 2.7 |
VIP Value Portfolio Initial Class | 8.2 | 7.2 |
VIP Value Strategies Portfolio Initial Class | 4.0 | 3.5 |
| 61.3 | 52.5 |
Developed International Equity Funds | | |
VIP Overseas Portfolio Initial Class | 21.1 | 14.5 |
Emerging Markets Equity Funds | | |
VIP Emerging Markets Portfolio Initial Class | 5.3 | 4.2 |
High Yield Bond Funds | | |
VIP High Income Portfolio Initial Class | 6.8 | 7.3 |
Investment Grade Bond Funds | | |
VIP Investment Grade Bond Portfolio Initial Class | 5.5 | 21.5 |
Net Other Assets (Liabilities)* | 0.0 | 0.0 |
| 100.0 | 100.0 |
* Amount represents less than 0.1% |
Asset Allocation (% of fund's net assets) |
Period end |
| Domestic Equity Funds | 61.3% | |
| Developed International Equity Funds | 21.1% | |
| Emerging Markets Equity Funds | 5.3% | |
| High Yield Bond Funds | 6.8% | |
| Investment Grade Bond Funds | 5.5% | |

Six months ago |
| Domestic Equity Funds | 52.5% | |
| Developed International Equity Funds | 14.5% | |
| Emerging Markets Equity Funds | 4.2% | |
| High Yield Bond Funds | 7.3% | |
| Investment Grade Bond Funds | 21.5% | |

Annual Report
VIP Freedom 2030 Portfolio
Investments December 31, 2013
Showing Percentage of Net Assets
Domestic Equity Funds - 61.3% |
| Shares | | Value |
Domestic Equity Funds - 61.3% |
VIP Contrafund Portfolio Initial Class (a) | 765,378 | | $ 26,290,743 |
VIP Equity-Income Portfolio Initial Class (a) | 1,143,482 | | 26,631,689 |
VIP Growth & Income Portfolio Initial Class (a) | 1,620,974 | | 31,025,447 |
VIP Growth Portfolio Initial Class (a) | 480,068 | | 27,431,063 |
VIP Mid Cap Portfolio Initial Class (a) | 215,997 | | 7,860,120 |
VIP Value Portfolio Initial Class (a) | 1,313,099 | | 19,932,844 |
VIP Value Strategies Portfolio Initial Class (a) | 684,913 | | 9,842,202 |
TOTAL DOMESTIC EQUITY FUNDS (Cost $118,812,438) |
149,014,108
|
International Equity Funds - 26.4% |
| | | |
Developed International Equity Funds - 21.1% |
VIP Overseas Portfolio Initial Class (a) | 2,479,408 | | 51,174,972 |
Emerging Markets Equity Funds - 5.3% |
VIP Emerging Markets Portfolio Initial Class (a) | 1,442,746 | | 12,999,146 |
TOTAL INTERNATIONAL EQUITY FUNDS (Cost $56,494,688) |
64,174,118
|
Bond Funds - 12.3% |
| Shares | | Value |
High Yield Bond Funds - 6.8% |
VIP High Income Portfolio Initial Class (a) | 2,830,510 | | $ 16,416,959 |
Investment Grade Bond Funds - 5.5% |
VIP Investment Grade Bond Portfolio Initial Class (a) | 1,083,798 | | 13,395,744 |
TOTAL BOND FUNDS (Cost $30,892,731) |
29,812,703
|
TOTAL INVESTMENT PORTFOLIO - 100.0% (Cost $206,199,857) | | 243,000,929 |
NET OTHER ASSETS (LIABILITIES) - 0.0% | | (30,446) |
NET ASSETS - 100% | $ 242,970,483 |
Legend |
(a) Affiliated company |
Affiliated Underlying Funds |
Information regarding the Fund's fiscal year to date purchases and sales of the affiliated Underlying Funds and income earned by the Fund from investments in affiliated Underlying Funds is as follows: |
Affiliate | Value,
beginning of period | Purchases | Sales
Proceeds | Dividend
Income | Value,
end of
period |
VIP Contrafund Portfolio Initial Class | $ 14,706,853 | $ 8,949,600 | $ 2,379,512 | $ 244,019 | $ 26,290,743 |
VIP Emerging Markets Portfolio Initial Class | 7,608,177 | 6,055,555 | 960,889 | 88,446 | 12,999,146 |
VIP Equity-Income Portfolio Initial Class | 15,730,299 | 11,274,637 | 3,079,306 | 591,707 | 26,631,689 |
VIP Growth & Income Portfolio Initial Class | 17,792,158 | 10,904,610 | 3,716,102 | 504,483 | 31,025,447 |
VIP Growth Portfolio Initial Class | 14,582,533 | 9,007,523 | 2,246,084 | 67,133 | 27,431,063 |
VIP High Income Portfolio Initial Class | 12,609,248 | 5,950,671 | 2,061,032 | 944,569 | 16,416,959 |
VIP Investment Grade Bond Portfolio Initial Class | 36,105,462 | 17,680,277 | 38,979,378 | 512,522 | 13,395,744 |
VIP Mid Cap Portfolio Initial Class | 4,378,516 | 3,421,061 | 840,460 | 34,246 | 7,860,120 |
VIP Overseas Portfolio Initial Class | 24,815,733 | 21,583,118 | 3,573,345 | 584,190 | 51,174,972 |
VIP Value Portfolio Initial Class | 11,703,020 | 8,331,479 | 2,583,661 | 195,635 | 19,932,844 |
VIP Value Strategies Portfolio Initial Class | 5,801,138 | 3,364,667 | 1,193,025 | 79,594 | 9,842,202 |
Total | $ 165,833,137 | $ 106,523,198 | $ 61,612,794 | $ 3,846,544 | $ 243,000,929 |
Other Information |
All investments are categorized as Level 1 under the Fair Value Hierarchy. The inputs or methodology used for valuing securities may not be an indication of the risk associated with investing in those securities. For more information on valuation inputs, please refer to the Investment Valuation section in the accompanying Notes to Financial Statements. |
See accompanying notes which are an integral part of the financial statements.
Annual Report
VIP Freedom 2030 Portfolio
Statement of Assets and Liabilities
| December 31, 2013 |
| | |
Assets | | |
Investment in securities, at value (cost $206,199,857) - See accompanying schedule | | $ 243,000,929 |
Cash | | 1,656 |
Receivable for fund shares sold | | 546,778 |
Total assets | | 243,549,363 |
| | |
Liabilities | | |
Payable for investments purchased | $ 489,940 | |
Payable for fund shares redeemed | 58,518 | |
Distribution and service plan fees payable | 30,422 | |
Total liabilities | | 578,880 |
| | |
Net Assets | | $ 242,970,483 |
Net Assets consist of: | | |
Paid in capital | | $ 204,411,410 |
Accumulated undistributed net realized gain (loss) on investments | | 1,758,001 |
Net unrealized appreciation (depreciation) on investments | | 36,801,072 |
Net Assets | | $ 242,970,483 |
Statement of Assets and Liabilities - continued
| December 31, 2013 |
| | |
Initial Class:
Net Asset Value, offering price and redemption price per share ($64,172,573 ÷ 4,997,672 shares) | | $ 12.84 |
| | |
Service Class:
Net Asset Value, offering price and redemption price per share ($46,867,977 ÷ 3,654,840 shares) | | $ 12.82 |
| | |
Service Class 2:
Net Asset Value, offering price and redemption price per share ($131,929,933 ÷ 10,320,268 shares) | | $ 12.78 |
See accompanying notes which are an integral part of the financial statements.
Annual Report
Statement of Operations
| Year ended December 31, 2013 |
| | |
Investment Income | | |
Income distributions from underlying funds | | $ 3,846,544 |
| | |
Expenses | | |
Distribution and service plan fees | $ 323,826 | |
Independent trustees' compensation | 752 | |
Total expenses before reductions | 324,578 | |
Expense reductions | (752) | 323,826 |
Net investment income (loss) | | 3,522,718 |
Realized and Unrealized Gain (Loss) Realized gain (loss) on sale of underlying fund shares | 169,674 | |
Capital gain distributions from underlying funds | 4,304,795 | |
Total net realized gain (loss) | | 4,474,469 |
Change in net unrealized appreciation (depreciation) on underlying funds | | 32,087,717 |
Net gain (loss) | | 36,562,186 |
Net increase (decrease) in net assets resulting from operations | | $ 40,084,904 |
Statement of Changes in Net Assets
| Year ended
December 31, 2013 | Year ended
December 31, 2012 |
Increase (Decrease) in Net Assets | | |
Operations | | |
Net investment income (loss) | $ 3,522,718 | $ 3,251,140 |
Net realized gain (loss) | 4,474,469 | 2,379,329 |
Change in net unrealized appreciation (depreciation) | 32,087,717 | 14,353,736 |
Net increase (decrease) in net assets resulting from operations | 40,084,904 | 19,984,205 |
Distributions to shareholders from net investment income | (3,560,740) | (3,199,536) |
Distributions to shareholders from net realized gain | (2,890,634) | (1,366,281) |
Total distributions | (6,451,374) | (4,565,817) |
Share transactions - net increase (decrease) | 43,511,429 | 31,469,851 |
Total increase (decrease) in net assets | 77,144,959 | 46,888,239 |
| | |
Net Assets | | |
Beginning of period | 165,825,524 | 118,937,285 |
End of period (including undistributed net investment income of $0 and $33,352, respectively) | $ 242,970,483 | $ 165,825,524 |
See accompanying notes which are an integral part of the financial statements.
Annual Report
Financial Highlights - Initial Class
Years ended December 31, | 2013 | 2012 | 2011 | 2010 | 2009 |
Selected Per-Share Data | | | | | |
Net asset value, beginning of period | $ 10.88 | $ 9.70 | $ 10.21 | $ 9.03 | $ 7.12 |
Income from Investment Operations | | | | | |
Net investment income (loss) C | .22 | .25 | .23 | .21 | .24 |
Net realized and unrealized gain (loss) | 2.12 | 1.26 | (.49) | 1.24 | 1.96 |
Total from investment operations | 2.34 | 1.51 | (.26) | 1.45 | 2.20 |
Distributions from net investment income | (.21) | (.23) | (.22) | (.20) | (.18) |
Distributions from net realized gain | (.17) | (.10) | (.03) | (.07) | (.11) |
Total distributions | (.38) | (.33) | (.25) | (.27) | (.29) |
Net asset value, end of period | $ 12.84 | $ 10.88 | $ 9.70 | $ 10.21 | $ 9.03 |
Total Return A,B | 21.66% | 15.58% | (2.60)% | 16.08% | 31.66% |
Ratios to Average Net Assets D,F | | | | | |
Expenses before reductions E | .00% | .00% | .00% | .00% | .00% |
Expenses net of fee waivers, if any | .00% | .00% | .00% | .00% | .00% |
Expenses net of all reductions | .00% | .00% | .00% | .00% | .00% |
Net investment income (loss) | 1.88% | 2.39% | 2.27% | 2.25% | 3.13% |
Supplemental Data | | | | | |
Net assets, end of period (000 omitted) | $ 64,173 | $ 39,111 | $ 30,601 | $ 28,917 | $ 23,836 |
Portfolio turnover rate D | 30% | 17% | 16% | 25% | 24% |
A Total returns do not reflect charges attributable to your insurance company's separate account. Inclusion of these charges would reduce the total returns shown.
B Total returns would have been lower if certain expenses had not been reduced during the applicable periods shown.
C Calculated based on average shares outstanding during the period.
D Amounts do not include the activity of the Underlying Funds.
E Amount represents less than .01%.
F Expense ratios reflect operating expenses of the class. Expenses before reductions do not reflect amounts reimbursed by the investment adviser or reductions from expense offset arrangements and do not represent the amount paid by the class during periods when reimbursements or reductions occur. Expenses net of fee waivers reflect expenses after reimbursement by the investment adviser but prior to reductions from expense offset arrangements. Expenses net of all reductions represent the net expenses paid by the class but do not include expenses of the investment companies in which the Fund invests.
Financial Highlights - Service Class
Years ended December 31, | 2013 | 2012 | 2011 | 2010 | 2009 |
Selected Per-Share Data | | | | | |
Net asset value, beginning of period | $ 10.87 | $ 9.69 | $ 10.20 | $ 9.02 | $ 7.12 |
Income from Investment Operations | | | | | |
Net investment income (loss) C | .21 | .24 | .22 | .20 | .24 |
Net realized and unrealized gain (loss) | 2.11 | 1.26 | (.49) | 1.24 | 1.94 |
Total from investment operations | 2.32 | 1.50 | (.27) | 1.44 | 2.18 |
Distributions from net investment income | (.20) | (.22) | (.21) | (.19) | (.17) |
Distributions from net realized gain | (.17) | (.10) | (.03) | (.07) | (.11) |
Total distributions | (.37) | (.32) | (.24) | (.26) | (.28) |
Net asset value, end of period | $ 12.82 | $ 10.87 | $ 9.69 | $ 10.20 | $ 9.02 |
Total Return A,B | 21.50% | 15.48% | (2.70)% | 16.00% | 31.40% |
Ratios to Average Net Assets D,E | | | | | |
Expenses before reductions | .10% | .10% | .10% | .10% | .10% |
Expenses net of fee waivers, if any | .10% | .10% | .10% | .10% | .10% |
Expenses net of all reductions | .10% | .10% | .10% | .10% | .10% |
Net investment income (loss) | 1.78% | 2.29% | 2.17% | 2.15% | 3.03% |
Supplemental Data | | | | | |
Net assets, end of period (000 omitted) | $ 46,868 | $ 32,295 | $ 28,666 | $ 23,137 | $ 16,162 |
Portfolio turnover rate D | 30% | 17% | 16% | 25% | 24% |
A Total returns do not reflect charges attributable to your insurance company's separate account. Inclusion of these charges would reduce the total returns shown.
B Total returns would have been lower if certain expenses had not been reduced during the applicable periods shown.
C Calculated based on average shares outstanding during the period.
D Amounts do not include the activity of the Underlying Funds.
E Expense ratios reflect operating expenses of the class. Expenses before reductions do not reflect amounts reimbursed by the investment adviser or reductions from expense offset arrangements and do not represent the amount paid by the class during periods when reimbursements or reductions occur. Expenses net of fee waivers reflect expenses after reimbursement by the investment adviser but prior to reductions from expense offset arrangements. Expenses net of all reductions represent the net expenses paid by the class but do not include expenses of the investment companies in which the Fund invests.
See accompanying notes which are an integral part of the financial statements.
Annual Report
Financial Highlights - Service Class 2
Years ended December 31, | 2013 | 2012 | 2011 | 2010 | 2009 |
Selected Per-Share Data | | | | | |
Net asset value, beginning of period | $ 10.83 | $ 9.67 | $ 10.18 | $ 9.00 | $ 7.11 |
Income from Investment Operations | | | | | |
Net investment income (loss) C | .19 | .23 | .21 | .19 | .23 |
Net realized and unrealized gain (loss) | 2.11 | 1.23 | (.50) | 1.24 | 1.93 |
Total from investment operations | 2.30 | 1.46 | (.29) | 1.43 | 2.16 |
Distributions from net investment income | (.18) | (.21) | (.19) | (.17) | (.16) |
Distributions from net realized gain | (.17) | (.10) | (.03) | (.07) | (.11) |
Total distributions | (.35) | (.30) G | (.22) | (.25) F | (.27) |
Net asset value, end of period | $ 12.78 | $ 10.83 | $ 9.67 | $ 10.18 | $ 9.00 |
Total Return A,B | 21.41% | 15.18% | (2.83)% | 15.89% | 31.18% |
Ratios to Average Net Assets D,E | | | | | |
Expenses before reductions | .25% | .25% | .25% | .25% | .25% |
Expenses net of fee waivers, if any | .25% | .25% | .25% | .25% | .25% |
Expenses net of all reductions | .25% | .25% | .25% | .25% | .25% |
Net investment income (loss) | 1.63% | 2.14% | 2.02% | 2.01% | 2.88% |
Supplemental Data | | | | | |
Net assets, end of period (000 omitted) | $ 131,930 | $ 94,419 | $ 59,671 | $ 49,574 | $ 34,809 |
Portfolio turnover rate D | 30% | 17% | 16% | 25% | 24% |
A Total returns do not reflect charges attributable to your insurance company's separate account. Inclusion of these charges would reduce the total returns shown.
B Total returns would have been lower if certain expenses had not been reduced during the applicable periods shown.
C Calculated based on average shares outstanding during the period.
D Amounts do not include the activity of the Underlying Funds.
E Expense ratios reflect operating expenses of the class. Expenses before reductions do not reflect amounts reimbursed by the investment adviser or reductions from expense offset arrangements and do not represent the amount paid by the class during periods when reimbursements or reductions occur. Expenses net of fee waivers reflect expenses after reimbursement by the investment adviser but prior to reductions from expense offset arrangements. Expenses net of all reductions represent the net expenses paid by the class but do not include expenses of the investment companies in which the Fund invests.
F Total distributions of $.25 per share is comprised of distributions from net investment income of $.173 and distributions from net realized gain of $.072 per share.
G Total distributions of $.30 per share is comprised of distributions from net investment income of $.207 and distributions from net realized gain of $.096 per share.
See accompanying notes which are an integral part of the financial statements.
Annual Report
VIP Freedom 2035 Portfolio
Investment Changes (Unaudited)
The information in the following tables is based on the direct investments of the Fund.
Fund Holdings as of December 31, 2013 |
| % of fund's
net assets | % of fund's net assets
6 months ago |
Domestic Equity Funds | | |
VIP Contrafund Portfolio Initial Class | 11.1 | 10.4 |
VIP Equity-Income Portfolio Initial Class | 11.4 | 11.1 |
VIP Growth & Income Portfolio Initial Class | 13.2 | 12.7 |
VIP Growth Portfolio Initial Class | 11.5 | 10.6 |
VIP Mid Cap Portfolio Initial Class | 3.3 | 3.1 |
VIP Value Portfolio Initial Class | 8.4 | 8.2 |
VIP Value Strategies Portfolio Initial Class | 4.2 | 4.0 |
| 63.1 | 60.1 |
Developed International Equity Funds | | |
VIP Overseas Portfolio Initial Class | 21.5 | 16.7 |
Emerging Markets Equity Funds | | |
VIP Emerging Markets Portfolio Initial Class | 5.6 | 4.8 |
High Yield Bond Funds | | |
VIP High Income Portfolio Initial Class | 6.8 | 7.3 |
Investment Grade Bond Funds | | |
VIP Investment Grade Bond Portfolio Initial Class | 3.0 | 11.1 |
Net Other Assets (Liabilities)* | 0.0 | 0.0 |
| 100.0 | 100.0 |
* Amount represents less than 0.1% |
Asset Allocation (% of fund's net assets) |
Period end |
| Domestic Equity Funds | 63.1% | |
| Developed International Equity Funds | 21.5% | |
| Emerging Markets Equity Funds | 5.6% | |
| High Yield Bond Funds | 6.8% | |
| Investment Grade Bond Funds | 3.0% | |

Six months ago |
| Domestic Equity Funds | 60.1% | |
| Developed International Equity Funds | 16.7% | |
| Emerging Markets Equity Funds | 4.8% | |
| High Yield Bond Funds | 7.3% | |
| Investment Grade Bond Funds | 11.1% | |

Annual Report
VIP Freedom 2035 Portfolio
Investments December 31, 2013
Showing Percentage of Net Assets
Domestic Equity Funds - 63.1% |
| Shares | | Value |
Domestic Equity Funds - 63.1% |
VIP Contrafund Portfolio Initial Class (a) | 18,641 | | $ 640,327 |
VIP Equity-Income Portfolio Initial Class (a) | 28,131 | | 655,181 |
VIP Growth & Income Portfolio Initial Class (a) | 39,673 | | 759,347 |
VIP Growth Portfolio Initial Class (a) | 11,644 | | 665,321 |
VIP Mid Cap Portfolio Initial Class (a) | 5,201 | | 189,279 |
VIP Value Portfolio Initial Class (a) | 32,124 | | 487,649 |
VIP Value Strategies Portfolio Initial Class (a) | 16,706 | | 240,059 |
TOTAL DOMESTIC EQUITY FUNDS (Cost $3,251,852) |
3,637,163
|
International Equity Funds - 27.1% |
| | | |
Developed International Equity Funds - 21.5% |
VIP Overseas Portfolio Initial Class (a) | 60,028 | | 1,238,968 |
Emerging Markets Equity Funds - 5.6% |
VIP Emerging Markets Portfolio Initial Class (a) | 36,089 | | 325,159 |
TOTAL INTERNATIONAL EQUITY FUNDS (Cost $1,413,940) |
1,564,127
|
Bond Funds - 9.8% |
| Shares | | Value |
High Yield Bond Funds - 6.8% |
VIP High Income Portfolio Initial Class (a) | 67,512 | | $ 391,568 |
Investment Grade Bond Funds - 3.0% |
VIP Investment Grade Bond Portfolio Initial Class (a) | 14,153 | | 174,929 |
TOTAL BOND FUNDS (Cost $570,253) |
566,497
|
TOTAL INVESTMENT PORTFOLIO - 100.0% (Cost $5,236,045) | | 5,767,787 |
NET OTHER ASSETS (LIABILITIES) - 0.0% | | (877) |
NET ASSETS - 100% | $ 5,766,910 |
Legend |
(a) Affiliated company |
Affiliated Underlying Funds |
Information regarding the Fund's fiscal year to date purchases and sales of the affiliated Underlying Funds and income earned by the Fund from investments in affiliated Underlying Funds is as follows: |
Affiliate | Value,
beginning of period | Purchases | Sales
Proceeds | Dividend
Income | Value,
end of
period |
VIP Contrafund Portfolio Initial Class | $ 106,906 | $ 509,275 | $ 38,985 | $ 5,768 | $ 640,327 |
VIP Emerging Markets Portfolio Initial Class | 54,693 | 281,861 | 17,315 | 2,112 | 325,159 |
VIP Equity-Income Portfolio Initial Class | 113,769 | 578,604 | 44,052 | 14,125 | 655,181 |
VIP Growth & Income Portfolio Initial Class | 129,054 | 614,436 | 51,847 | 11,944 | 759,347 |
VIP Growth Portfolio Initial Class | 106,757 | 517,262 | 37,868 | 1,581 | 665,321 |
VIP High Income Portfolio Initial Class | 78,645 | 354,681 | 31,977 | 21,205 | 391,568 |
VIP Investment Grade Bond Portfolio Initial Class | 112,245 | 460,642 | 385,675 | 7,645 | 174,929 |
VIP Mid Cap Portfolio Initial Class | 31,778 | 166,349 | 12,323 | 801 | 189,279 |
VIP Overseas Portfolio Initial Class | 179,734 | 1,006,571 | 60,115 | 13,473 | 1,238,968 |
VIP Value Portfolio Initial Class | 84,603 | 426,456 | 34,048 | 4,645 | 487,649 |
VIP Value Strategies Portfolio Initial Class | 41,992 | 191,371 | 16,390 | 1,884 | 240,059 |
Total | $ 1,040,176 | $ 5,107,509 | $ 730,595 | $ 85,183 | $ 5,767,787 |
Other Information |
All investments are categorized as Level 1 under the Fair Value Hierarchy. The inputs or methodology used for valuing securities may not be an indication of the risk associated with investing in those securities. For more information on valuation inputs, please refer to the Investment Valuation section in the accompanying Notes to Financial Statements. |
See accompanying notes which are an integral part of the financial statements.
Annual Report
VIP Freedom 2035 Portfolio
Statement of Assets and Liabilities
| December 31, 2013 |
| | |
Assets | | |
Investment in securities, at value (cost $5,236,045) - See accompanying schedule | | $ 5,767,787 |
Cash | | 1 |
Receivable for investments sold | | 18,637 |
Receivable for fund shares sold | | 6,260 |
Total assets | | 5,792,685 |
| | |
Liabilities | | |
Payable for fund shares redeemed | $ 24,894 | |
Distribution and service plan fees payable | 881 | |
Total liabilities | | 25,775 |
| | |
Net Assets | | $ 5,766,910 |
Net Assets consist of: | | |
Paid in capital | | $ 5,185,299 |
Accumulated undistributed net realized gain (loss) on investments | | 49,869 |
Net unrealized appreciation (depreciation) on investments | | 531,742 |
Net Assets | | $ 5,766,910 |
Statement of Assets and Liabilities - continued
| December 31, 2013 |
| | |
Initial Class:
Net Asset Value, offering price and redemption price per share ($1,054,306 ÷ 55,024 shares) | | $ 19.16 |
| | |
Service Class:
Net Asset Value, offering price and redemption price per share ($289,150 ÷ 15,096 shares) | | $ 19.15 |
| | |
Service Class 2:
Net Asset Value, offering price and redemption price per share ($4,423,454 ÷ 231,715 shares) | | $ 19.09 |
See accompanying notes which are an integral part of the financial statements.
Annual Report
Statement of Operations
| Year ended December 31, 2013 |
| | |
Investment Income | | |
Income distributions from underlying funds | | $ 85,183 |
| | |
Expenses | | |
Distribution and service plan fees | $ 4,894 | |
Independent trustees' compensation | 7 | |
Total expenses before reductions | 4,901 | |
Expense reductions | (7) | 4,894 |
Net investment income (loss) | | 80,289 |
Realized and Unrealized Gain (Loss) Realized gain (loss) on sale of underlying fund shares | (9,219) | |
Capital gain distributions from underlying funds | 98,137 | |
Total net realized gain (loss) | | 88,918 |
Change in net unrealized appreciation (depreciation) on underlying funds | | 359,936 |
Net gain (loss) | | 448,854 |
Net increase (decrease) in net assets resulting from operations | | $ 529,143 |
Statement of Changes in Net Assets
| Year ended
December 31, 2013 | Year ended
December 31, 2012 |
Increase (Decrease) in Net Assets | | |
Operations | | |
Net investment income (loss) | $ 80,289 | $ 19,429 |
Net realized gain (loss) | 88,918 | 11,177 |
Change in net unrealized appreciation (depreciation) | 359,936 | 64,172 |
Net increase (decrease) in net assets resulting from operations | 529,143 | 94,778 |
Distributions to shareholders from net investment income | (80,620) | (19,084) |
Distributions to shareholders from net realized gain | (41,889) | (4,264) |
Total distributions | (122,509) | (23,348) |
Share transactions - net increase (decrease) | 4,318,971 | 506,925 |
Total increase (decrease) in net assets | 4,725,605 | 578,355 |
| | |
Net Assets | | |
Beginning of period | 1,041,305 | 462,950 |
End of period (including undistributed net investment income of $0 and $340, respectively) | $ 5,766,910 | $ 1,041,305 |
See accompanying notes which are an integral part of the financial statements.
Annual Report
Financial Highlights - Initial Class
Years ended December 31, | 2013 | 2012 | 2011 | 2010 | 2009 F |
Selected Per-Share Data | | | | | |
Net asset value, beginning of period | $ 15.76 | $ 13.82 | $ 14.74 | $ 13.74 | $ 10.00 |
Income from Investment Operations | | | | | |
Net investment income (loss) D | .66 | .49 | .27 | .27 | .25 |
Net realized and unrealized gain (loss) | 3.24 | 1.83 | (.85) | 2.04 | 3.76 |
Total from investment operations | 3.90 | 2.32 | (.58) | 2.31 | 4.01 |
Distributions from net investment income | (.29) | (.31) | (.28) | (.28) | (.25) |
Distributions from net realized gain | (.20) | (.07) | (.06) | (1.03) | (.01) |
Total distributions | (.50) H | (.38) | (.34) | (1.31) | (.27) I |
Net asset value, end of period | $ 19.16 | $ 15.76 | $ 13.82 | $ 14.74 | $ 13.74 |
Total Return B,C, J | 24.84% | 16.82% | (3.99)% | 17.01% | 40.04% |
Ratios to Average Net Assets E,G | | | | | |
Expenses before reductions | .00% | .00% | .00% | .00% | .00% A |
Expenses net of fee waivers, if any | .00% | .00% | .00% | .00% | .00% A |
Expenses net of all reductions | .00% | .00% | .00% | .00% | .00% A |
Net investment income (loss) | 3.72% | 3.20% | 1.82% | 1.92% | 2.78% A |
Supplemental Data | | | | | |
Net assets, end of period (000 omitted) | $ 1,054 | $ 128 | $ 97 | $ 121 | $ 144 |
Portfolio turnover rate E | 31% | 19% | 38% | 38% | 5% A |
A Annualized
B Total returns for periods of less than one year are not annualized.
C Total returns do not reflect charges attributable to your insurance company's separate account. Inclusion of these charges would reduce the total returns shown.
D Calculated based on average shares outstanding during the period.
E Amounts do not include the activity of the Underlying Funds.
F For the period April 8, 2009 (commencement of operations) to December 31, 2009.
G Expense ratios reflect operating expenses of the class. Expenses before reductions do not reflect amounts reimbursed by the investment adviser or reductions from expense offset arrangements and do not represent the amount paid by the class during periods when reimbursements or reductions occur. Expenses net of fee waivers reflect expenses after reimbursement by the investment adviser but prior to reductions from expense offset arrangements. Expenses net of all reductions represent the net expenses paid by the class but do not include expenses of the investment companies in which the Fund invests.
H Total distributions of $.50 per share is comprised of distributions from net investment income of $.292 and distributions from net realized gain of $.204 per share.
I Total distributions of $.27 per share is comprised of distributions from net investment income of $.252 and distributions from net realized gain of $.014 per share.
J Total returns would have been lower if certain expenses had not been reduced during the applicable periods shown.
Financial Highlights - Service Class
Years ended December 31, | 2013 | 2012 | 2011 | 2010 | 2009 F |
Selected Per-Share Data | | | | | |
Net asset value, beginning of period | $ 15.76 | $ 13.82 | $ 14.74 | $ 13.73 | $ 10.00 |
Income from Investment Operations | | | | | |
Net investment income (loss) D | .64 | .47 | .25 | .26 | .24 |
Net realized and unrealized gain (loss) | 3.24 | 1.84 | (.85) | 2.04 | 3.75 |
Total from investment operations | 3.88 | 2.31 | (.60) | 2.30 | 3.99 |
Distributions from net investment income | (.28) | (.30) | (.26) | (.26) | (.24) |
Distributions from net realized gain | (.20) | (.07) | (.06) | (1.03) | (.01) |
Total distributions | (.49) I | (.37) | (.32) | (1.29) | (.26) H |
Net asset value, end of period | $ 19.15 | $ 15.76 | $ 13.82 | $ 14.74 | $ 13.73 |
Total Return B,C | 24.72% | 16.71% | (4.10)% | 16.97% | 39.85% |
Ratios to Average Net Assets E,G | | | | | |
Expenses before reductions | .10% | .10% | .10% | .10% | .10% A |
Expenses net of fee waivers, if any | .10% | .10% | .10% | .10% | .10% A |
Expenses net of all reductions | .10% | .10% | .10% | .10% | .10% A |
Net investment income (loss) | 3.62% | 3.10% | 1.72% | 1.82% | 2.68% A |
Supplemental Data | | | | | |
Net assets, end of period (000 omitted) | $ 289 | $ 105 | $ 90 | $ 116 | $ 140 |
Portfolio turnover rate E | 31% | 19% | 38% | 38% | 5% A |
A Annualized
B Total returns for periods of less than one year are not annualized.
C Total returns do not reflect charges attributable to your insurance company's separate account. Inclusion of these charges would reduce the total returns shown.
D Calculated based on average shares outstanding during the period.
E Amounts do not include the activity of the Underlying Funds.
F For the period April 8, 2009 (commencement of operations) to December 31, 2009.
G Expense ratios reflect operating expenses of the class. Expenses before reductions do not reflect amounts reimbursed by the investment adviser or reductions from expense offset arrangements and do not represent the amount paid by the class during periods when reimbursements or reductions occur. Expenses net of fee waivers reflect expenses after reimbursement by the investment adviser but prior to reductions from expense offset arrangements. Expenses net of all reductions represent the net expenses paid by the class but do not include expenses of the investment companies in which the Fund invests.
H Total distributions of $.26 per share is comprised of distributions from net investment income of $.243 and distributions from net realized gain of $.014 per share.
I Total distributions of $.49 per share is comprised of distributions from net investment income of $.283 and distributions from net realized gain of $.204 per share.
See accompanying notes which are an integral part of the financial statements.
Annual Report
Financial Highlights - Service Class 2
Years ended December 31, | 2013 | 2012 | 2011 | 2010 | 2009 F |
Selected Per-Share Data | | | | | |
Net asset value, beginning of period | $ 15.73 | $ 13.80 | $ 14.72 | $ 13.73 | $ 10.00 |
Income from Investment Operations | | | | | |
Net investment income (loss) D | .62 | .45 | .23 | .24 | .23 |
Net realized and unrealized gain (loss) | 3.22 | 1.84 | (.85) | 2.03 | 3.74 |
Total from investment operations | 3.84 | 2.29 | (.62) | 2.27 | 3.97 |
Distributions from net investment income | (.27) | (.29) | (.24) | (.26) | (.23) |
Distributions from net realized gain | (.20) | (.07) | (.06) | (1.03) | (.01) |
Total distributions | (.48) H | (.36) | (.30) | (1.28) J | (.24) I |
Net asset value, end of period | $ 19.09 | $ 15.73 | $ 13.80 | $ 14.72 | $ 13.73 |
Total Return B,C, K | 24.50% | 16.61% | (4.25)% | 16.76% | 39.72% |
Ratios to Average Net Assets E,G | | | | | |
Expenses before reductions | .25% | .25% | .25% | .25% | .25% A |
Expenses net of fee waivers, if any | .25% | .25% | .25% | .25% | .25% A |
Expenses net of all reductions | .25% | .25% | .25% | .25% | .25% A |
Net investment income (loss) | 3.48% | 2.95% | 1.57% | 1.67% | 2.53% A |
Supplemental Data | | | | | |
Net assets, end of period (000 omitted) | $ 4,423 | $ 808 | $ 276 | $ 211 | $ 143 |
Portfolio turnover rate E | 31% | 19% | 38% | 38% | 5% A |
A Annualized
B Total returns for periods of less than one year are not annualized.
C Total returns do not reflect charges attributable to your insurance company's separate account. Inclusion of these charges would reduce the total returns shown.
D Calculated based on average shares outstanding during the period.
E Amounts do not include the activity of the Underlying Funds.
F For the period April 8, 2009 (commencement of operations) to December 31, 2009.
G Expense ratios reflect operating expenses of the class. Expenses before reductions do not reflect amounts reimbursed by the investment adviser or reductions from expense offset arrangements and do not represent the amount paid by the class during periods when reimbursements or reductions occur. Expenses net of fee waivers reflect expenses after reimbursement by the investment adviser but prior to reductions from expense offset arrangements. Expenses net of all reductions represent the net expenses paid by the class but do not include expenses of the investment companies in which the Fund invests.
H Total distributions of $.48 per share is comprised of distributions from net investment income of $.271 and distributions from net realized gain of $.204 per share.
I Total distributions of $.24 per share is comprised of distributions from net investment income of $.230 and distributions from net realized gain of $.014 per share.
J Total distributions of $1.28 per share is comprised of distributions from net investment income of $.255 and distributions from net realized gain of $1.029 per share.
K Total returns would have been lower if certain expenses had not been reduced during the applicable periods shown.
See accompanying notes which are an integral part of the financial statements.
Annual Report
VIP Freedom 2040 Portfolio
Investment Changes (Unaudited)
The information in the following tables is based on the direct investments of the Fund.
Fund Holdings as of December 31, 2013 |
| % of fund's
net assets | % of fund's net assets
6 months ago |
Domestic Equity Funds | | |
VIP Contrafund Portfolio Initial Class | 11.1 | 10.6 |
VIP Equity-Income Portfolio Initial Class | 11.3 | 11.4 |
VIP Growth & Income Portfolio Initial Class | 13.1 | 13.0 |
VIP Growth Portfolio Initial Class | 11.6 | 10.7 |
VIP Mid Cap Portfolio Initial Class | 3.3 | 3.1 |
VIP Value Portfolio Initial Class | 8.5 | 8.4 |
VIP Value Strategies Portfolio Initial Class | 4.1 | 4.1 |
| 63.0 | 61.3 |
Developed International Equity Funds | | |
VIP Overseas Portfolio Initial Class | 21.5 | 17.0 |
Emerging Markets Equity Funds | | |
VIP Emerging Markets Portfolio Initial Class | 5.6 | 4.9 |
High Yield Bond Funds | | |
VIP High Income Portfolio Initial Class | 6.8 | 7.4 |
Investment Grade Bond Funds | | |
VIP Investment Grade Bond Portfolio Initial Class | 3.1 | 9.4 |
Net Other Assets (Liabilities)* | 0.0 | 0.0 |
| 100.0 | 100.0 |
* Amount represents less than 0.1% |
Asset Allocation (% of fund's net assets) |
Period end |
| Domestic Equity Funds | 63.0% | |
| Developed International Equity Funds | 21.5% | |
| Emerging Markets Equity Funds | 5.6% | |
| High Yield Bond Funds | 6.8% | |
| Investment Grade Bond Funds | 3.1% | |

Six months ago |
| Domestic Equity Funds | 61.3% | |
| Developed International Equity Funds | 17.0% | |
| Emerging Markets Equity Funds | 4.9% | |
| High Yield Bond Funds | 7.4% | |
| Investment Grade Bond Funds | 9.4% | |

Annual Report
VIP Freedom 2040 Portfolio
Investments December 31, 2013
Showing Percentage of Net Assets
Domestic Equity Funds - 63.0% |
| Shares | | Value |
Domestic Equity Funds - 63.0% |
VIP Contrafund Portfolio Initial Class (a) | 71,638 | | $ 2,460,749 |
VIP Equity-Income Portfolio Initial Class (a) | 107,144 | | 2,495,378 |
VIP Growth & Income Portfolio Initial Class (a) | 152,257 | | 2,914,207 |
VIP Growth Portfolio Initial Class (a) | 44,954 | | 2,568,656 |
VIP Mid Cap Portfolio Initial Class (a) | 20,160 | | 733,608 |
VIP Value Portfolio Initial Class (a) | 123,479 | | 1,874,418 |
VIP Value Strategies Portfolio Initial Class (a) | 64,065 | | 920,617 |
TOTAL DOMESTIC EQUITY FUNDS (Cost $11,795,209) |
13,967,633
|
International Equity Funds - 27.1% |
| | | |
Developed International Equity Funds - 21.5% |
VIP Overseas Portfolio Initial Class (a) | 230,798 | | 4,763,663 |
Emerging Markets Equity Funds - 5.6% |
VIP Emerging Markets Portfolio Initial Class (a) | 137,431 | | 1,238,252 |
TOTAL INTERNATIONAL EQUITY FUNDS (Cost $5,233,161) |
6,001,915
|
Bond Funds - 9.9% |
| Shares | | Value |
High Yield Bond Funds - 6.8% |
VIP High Income Portfolio Initial Class (a) | 259,392 | | $ 1,504,471 |
Investment Grade Bond Funds - 3.1% |
VIP Investment Grade Bond Portfolio Initial Class (a) | 54,985 | | 679,618 |
TOTAL BOND FUNDS (Cost $2,207,254) |
2,184,089
|
TOTAL INVESTMENT PORTFOLIO - 100.0% (Cost $19,235,624) | | 22,153,637 |
NET OTHER ASSETS (LIABILITIES) - 0.0% | | (1,190) |
NET ASSETS - 100% | $ 22,152,447 |
Legend |
(a) Affiliated company |
Affiliated Underlying Funds |
Information regarding the Fund's fiscal year to date purchases and sales of the affiliated Underlying Funds and income earned by the Fund from investments in affiliated Underlying Funds is as follows: |
Affiliate | Value,
beginning of period | Purchases | Sales
Proceeds | Dividend
Income | Value,
end of
period |
VIP Contrafund Portfolio Initial Class | $ 888,327 | $ 1,585,557 | $ 408,090 | $ 21,707 | $ 2,460,749 |
VIP Emerging Markets Portfolio Initial Class | 456,764 | 939,528 | 188,872 | 7,606 | 1,238,252 |
VIP Equity-Income Portfolio Initial Class | 947,579 | 1,818,241 | 447,428 | 52,589 | 2,495,378 |
VIP Growth & Income Portfolio Initial Class | 1,073,266 | 1,902,348 | 521,315 | 44,939 | 2,914,207 |
VIP Growth Portfolio Initial Class | 884,224 | 1,611,466 | 414,166 | 5,983 | 2,568,656 |
VIP High Income Portfolio Initial Class | 665,770 | 1,168,071 | 311,917 | 80,343 | 1,504,471 |
VIP Investment Grade Bond Portfolio Initial Class | 822,791 | 1,438,615 | 1,520,844 | 31,185 | 679,618 |
VIP Mid Cap Portfolio Initial Class | 264,162 | 531,588 | 126,668 | 3,041 | 733,608 |
VIP Overseas Portfolio Initial Class | 1,493,939 | 3,251,421 | 667,083 | 49,100 | 4,763,663 |
VIP Value Portfolio Initial Class | 704,677 | 1,338,736 | 340,204 | 17,474 | 1,874,418 |
VIP Value Strategies Portfolio Initial Class | 349,388 | 591,430 | 165,509 | 7,073 | 920,617 |
Total | $ 8,550,887 | $ 16,177,001 | $ 5,112,096 | $ 321,040 | $ 22,153,637 |
Other Information |
All investments are categorized as Level 1 under the Fair Value Hierarchy. The inputs or methodology used for valuing securities may not be an indication of the risk associated with investing in those securities. For more information on valuation inputs, please refer to the Investment Valuation section in the accompanying Notes to Financial Statements. |
See accompanying notes which are an integral part of the financial statements.
Annual Report
VIP Freedom 2040 Portfolio
Statement of Assets and Liabilities
| December 31, 2013 |
| | |
Assets | | |
Investment in securities, at value (cost $19,235,624) - See accompanying schedule | | $ 22,153,637 |
Cash | | 11,557 |
Receivable for investments sold | | 186,450 |
Receivable for fund shares sold | | 25,344 |
Total assets | | 22,376,988 |
| | |
Liabilities | | |
Payable for investments purchased | $ 3,693 | |
Payable for fund shares redeemed | 219,658 | |
Distribution and service plan fees payable | 1,190 | |
Total liabilities | | 224,541 |
| | |
Net Assets | | $ 22,152,447 |
Net Assets consist of: | | |
Paid in capital | | $ 19,110,096 |
Accumulated undistributed net realized gain (loss) on investments | | 124,338 |
Net unrealized appreciation (depreciation) on investments | | 2,918,013 |
Net Assets | | $ 22,152,447 |
Statement of Assets and Liabilities - continued
| December 31, 2013 |
| | |
Initial Class:
Net Asset Value, offering price and redemption price per share ($10,261,772 ÷ 559,344 shares) | | $ 18.35 |
| | |
Service Class:
Net Asset Value, offering price and redemption price per share ($9,075,945 ÷ 495,116 shares) | | $ 18.33 |
| | |
Service Class 2:
Net Asset Value, offering price and redemption price per share ($2,814,730 ÷ 153,874 shares) | | $ 18.29 |
See accompanying notes which are an integral part of the financial statements.
Annual Report
Statement of Operations
| Year ended December 31, 2013 |
| | |
Investment Income | | |
Income distributions from underlying funds | | $ 321,040 |
| | |
Expenses | | |
Distribution and service plan fees | $ 9,606 | |
Independent trustees' compensation | 50 | |
Total expenses before reductions | 9,656 | |
Expense reductions | (50) | 9,606 |
Net investment income (loss) | | 311,434 |
Realized and Unrealized Gain (Loss) Realized gain (loss) on sale of underlying fund shares | (23,300) | |
Capital gain distributions from underlying funds | 372,331 | |
Total net realized gain (loss) | | 349,031 |
Change in net unrealized appreciation (depreciation) on underlying funds | | 2,561,148 |
Net gain (loss) | | 2,910,179 |
Net increase (decrease) in net assets resulting from operations | | $ 3,221,613 |
Statement of Changes in Net Assets
| Year ended
December 31, 2013 | Year ended
December 31, 2012 |
Increase (Decrease) in Net Assets | | |
Operations | | |
Net investment income (loss) | $ 311,434 | $ 161,806 |
Net realized gain (loss) | 349,031 | 17,370 |
Change in net unrealized appreciation (depreciation) | 2,561,148 | 474,270 |
Net increase (decrease) in net assets resulting from operations | 3,221,613 | 653,446 |
Distributions to shareholders from net investment income | (313,021) | (159,049) |
Distributions to shareholders from net realized gain | (186,661) | (35,708) |
Total distributions | (499,682) | (194,757) |
Share transactions - net increase (decrease) | 10,880,097 | 5,337,147 |
Total increase (decrease) in net assets | 13,602,028 | 5,795,836 |
| | |
Net Assets | | |
Beginning of period | 8,550,419 | 2,754,583 |
End of period (including undistributed net investment income of $0 and $1,590, respectively) | $ 22,152,447 | $ 8,550,419 |
See accompanying notes which are an integral part of the financial statements.
Annual Report
Financial Highlights - Initial Class
Years ended December 31, | 2013 | 2012 | 2011 | 2010 | 2009 H |
Selected Per-Share Data | | | | | |
Net asset value, beginning of period | $ 15.03 | $ 13.16 | $ 14.02 | $ 13.82 | $ 10.00 |
Income from Investment Operations | | | | | |
Net investment income (loss) E | .38 | .42 | .35 | .20 | .26 |
Net realized and unrealized gain (loss) | 3.41 | 1.81 | (.91) | 2.15 | 3.83 |
Total from investment operations | 3.79 | 2.23 | (.56) | 2.35 | 4.09 |
Distributions from net investment income | (.27) | (.29) | (.27) | (.28) | (.26) |
Distributions from net realized gain | (.19) | (.07) | (.02) | (1.87) | (.01) |
Total distributions | (.47) J | (.36) | (.30) L | (2.15) | (.27) K |
Net asset value, end of period | $ 18.35 | $ 15.03 | $ 13.16 | $ 14.02 | $ 13.82 |
Total Return B,C,D | 25.29% | 16.95% | (4.02)% | 17.19% | 40.89% |
Ratios to Average Net Assets F,I | | | | | |
Expenses before reductions | .00% G | .00% G | .00% G | .00% | .00% A |
Expenses net of fee waivers, if any | .00% | .00% | .00% | .00% | .00% A |
Expenses net of all reductions | .00% | .00% | .00% | .00% | .00% A |
Net investment income (loss) | 2.26% | 2.91% | 2.50% | 1.46% | 2.81% A |
Supplemental Data | | | | | |
Net assets, end of period (000 omitted) | $ 10,262 | $ 3,369 | $ 1,559 | $ 278 | $ 145 |
Portfolio turnover rate F | 36% | 39% | 42% | 194% | 5% A |
A Annualized
B Total returns for periods of less than one year are not annualized.
C Total returns do not reflect charges attributable to your insurance company's separate account. Inclusion of these charges would reduce the total returns shown.
D Total returns would have been lower if certain expenses had not been reduced during the applicable periods shown.
E Calculated based on average shares outstanding during the period.
F Amounts do not include the activity of the Underlying Funds.
G Amount represents less than .01%.
H For the period April 8, 2009 (commencement of operations) to December 31, 2009.
I Expense ratios reflect operating expenses of the class. Expenses before reductions do not reflect amounts reimbursed by the investment adviser or reductions from expense offset arrangements and do not represent the amount paid by the class during periods when reimbursements or reductions occur. Expenses net of fee waivers reflect expenses after reimbursement by the investment adviser but prior to reductions from expense offset arrangements. Expenses net of all reductions represent the net expenses paid by the class but do not include expenses of the investment companies in which the Fund invests.
J Total distributions of $.47 per share is comprised of distributions from net investment income of $.272 and distributions from net realized gain of $.193 per share.
K Total distributions of $.27 per share is comprised of distributions from net investment income of $.257 and distributions from net realized gain of $.014 per share.
L Total distributions of $.30 per share is comprised of distributions from net investment income of $.274 and distributions from net realized gain of $.022 per share.
Financial Highlights - Service Class
Years ended December 31, | 2013 | 2012 | 2011 | 2010 | 2009 G |
Selected Per-Share Data | | | | | |
Net asset value, beginning of period | $ 15.02 | $ 13.15 | $ 14.02 | $ 13.82 | $ 10.00 |
Income from Investment Operations | | | | | |
Net investment income (loss) E | .36 | .41 | .33 | .19 | .25 |
Net realized and unrealized gain (loss) | 3.40 | 1.81 | (.91) | 2.14 | 3.83 |
Total from investment operations | 3.76 | 2.22 | (.58) | 2.33 | 4.08 |
Distributions from net investment income | (.26) | (.28) | (.26) | (.26) | (.25) |
Distributions from net realized gain | (.19) | (.07) | (.02) | (1.87) | (.01) |
Total distributions | (.45) | (.35) | (.29) J | (2.13) | (.26) I |
Net asset value, end of period | $ 18.33 | $ 15.02 | $ 13.15 | $ 14.02 | $ 13.82 |
Total Return B,C,D | 25.16% | 16.88% | (4.17)% | 17.05% | 40.80% |
Ratios to Average Net Assets F,H | | | | | |
Expenses before reductions | .10% | .10% | .10% | .10% | .10% A |
Expenses net of fee waivers, if any | .10% | .10% | .10% | .10% | .10% A |
Expenses net of all reductions | .10% | .10% | .10% | .10% | .10% A |
Net investment income (loss) | 2.16% | 2.81% | 2.41% | 1.36% | 2.71% A |
Supplemental Data | | | | | |
Net assets, end of period (000 omitted) | $ 9,076 | $ 4,600 | $ 1,058 | $ 116 | $ 141 |
Portfolio turnover rate F | 36% | 39% | 42% | 194% | 5% A |
A Annualized
B Total returns for periods of less than one year are not annualized.
C Total returns do not reflect charges attributable to your insurance company's separate account. Inclusion of these charges would reduce the total returns shown.
D Total returns would have been lower if certain expenses had not been reduced during the applicable periods shown.
E Calculated based on average shares outstanding during the period.
F Amounts do not include the activity of the Underlying Funds.
G For the period April 8, 2009 (commencement of operations) to December 31, 2009.
H Expense ratios reflect operating expenses of the class. Expenses before reductions do not reflect amounts reimbursed by the investment adviser or reductions from expense offset arrangements and do not represent the amount paid by the class during periods when reimbursements or reductions occur. Expenses net of fee waivers reflect expenses after reimbursement by the investment adviser but prior to reductions from expense offset arrangements. Expenses net of all reductions represent the net expenses paid by the class but do not include expenses of the investment companies in which the Fund invests.
I Total distributions of $.26 per share is comprised of distributions from net investment income of $.248 and distributions from net realized gain of $.014 per share.
J Total distributions of $.29 per share is comprised of distributions from net investment income of $.264 and distributions from net realized gain of $.022 per share.
See accompanying notes which are an integral part of the financial statements.
Annual Report
Financial Highlights - Service Class 2
Years ended December 31, | 2013 | 2012 | 2011 | 2010 | 2009 G |
Selected Per-Share Data | | | | | |
Net asset value, beginning of period | $ 15.00 | $ 13.15 | $ 14.02 | $ 13.82 | $ 10.00 |
Income from Investment Operations | | | | | |
Net investment income (loss) E | .34 | .39 | .32 | .17 | .23 |
Net realized and unrealized gain (loss) | 3.39 | 1.79 | (.92) | 2.14 | 3.84 |
Total from investment operations | 3.73 | 2.18 | (.60) | 2.31 | 4.07 |
Distributions from net investment income | (.25) | (.27) | (.24) | (.24) | (.23) |
Distributions from net realized gain | (.19) | (.07) | (.02) | (1.87) | (.01) |
Total distributions | (.44) | (.33) K | (.27) J | (2.11) | (.25) I |
Net asset value, end of period | $ 18.29 | $ 15.00 | $ 13.15 | $ 14.02 | $ 13.82 |
Total Return B,C,D | 24.99% | 16.64% | (4.32)% | 16.92% | 40.66% |
Ratios to Average Net Assets F,H | | | | | |
Expenses before reductions | .25% | .25% | .25% | .25% | .25% A |
Expenses net of fee waivers, if any | .25% | .25% | .25% | .25% | .25% A |
Expenses net of all reductions | .25% | .25% | .25% | .25% | .25% A |
Net investment income (loss) | 2.01% | 2.66% | 2.25% | 1.21% | 2.56% A |
Supplemental Data | | | | | |
Net assets, end of period (000 omitted) | $ 2,815 | $ 581 | $ 137 | $ 144 | $ 141 |
Portfolio turnover rate F | 36% | 39% | 42% | 194% | 5% A |
A Annualized
B Total returns for periods of less than one year are not annualized.
C Total returns do not reflect charges attributable to your insurance company's separate account. Inclusion of these charges would reduce the total returns shown.
D Total returns would have been lower if certain expenses had not been reduced during the applicable periods shown.
E Calculated based on average shares outstanding during the period.
F Amounts do not include the activity of the Underlying Funds.
G For the period April 8, 2009 (commencement of operations) to December 31, 2009.
H Expense ratios reflect operating expenses of the class. Expenses before reductions do not reflect amounts reimbursed by the investment adviser or reductions from expense offset arrangements and do not represent the amount paid by the class during periods when reimbursements or reductions occur. Expenses net of fee waivers reflect expenses after reimbursement by the investment adviser but prior to reductions from expense offset arrangements. Expenses net of all reductions represent the net expenses paid by the class but do not include expenses of the investment companies in which the Fund invests.
I Total distributions of $.25 per share is comprised of distributions from net investment income of $.234 and distributions from net realized gain of $.014 per share.
J Total distributions of $.27 per share is comprised of distributions from net investment income of $.243 and distributions from net realized gain of $.022 per share.
K Total distributions of $.33 per share is comprised of distributions from net investment income of $.265 and distributions from net realized gain of $.069 per share.
See accompanying notes which are an integral part of the financial statements.
Annual Report
VIP Freedom 2045 Portfolio
Investment Changes (Unaudited)
The information in the following tables is based on the direct investments of the Fund.
Fund Holdings as of December 31, 2013 |
| % of fund's
net assets | % of fund's net assets
6 months ago |
Domestic Equity Funds | | |
VIP Contrafund Portfolio Initial Class | 11.1 | 10.9 |
VIP Equity-Income Portfolio Initial Class | 11.3 | 11.7 |
VIP Growth & Income Portfolio Initial Class | 13.2 | 13.3 |
VIP Growth Portfolio Initial Class | 11.5 | 11.0 |
VIP Mid Cap Portfolio Initial Class | 3.3 | 3.2 |
VIP Value Portfolio Initial Class | 8.5 | 8.6 |
VIP Value Strategies Portfolio Initial Class | 4.2 | 4.2 |
| 63.1 | 62.9 |
Developed International Equity Funds | | |
VIP Overseas Portfolio Initial Class | 21.5 | 17.4 |
Emerging Markets Equity Funds | | |
VIP Emerging Markets Portfolio Initial Class | 5.7 | 5.0 |
High Yield Bond Funds | | |
VIP High Income Portfolio Initial Class | 6.8 | 9.5 |
Investment Grade Bond Funds | | |
VIP Investment Grade Bond Portfolio Initial Class | 2.9 | 5.2 |
Net Other Assets (Liabilities)* | 0.0 | 0.0 |
| 100.0 | 100.0 |
* Amount represents less than 0.1% |
Asset Allocation (% of fund's net assets) |
Period end |
| Domestic Equity Funds | 63.1% | |
| Developed International Equity Funds | 21.5% | |
| Emerging Markets Equity Funds | 5.7% | |
| High Yield Bond Funds | 6.8% | |
| Investment Grade Bond Funds | 2.9% | |

Six months ago |
| Domestic Equity Funds | 62.9% | |
| Developed International Equity Funds | 17.4% | |
| Emerging Markets Equity Funds | 5.0% | |
| High Yield Bond Funds | 9.5% | |
| Investment Grade Bond Funds | 5.2% | |

Annual Report
VIP Freedom 2045 Portfolio
Investments December 31, 2013
Showing Percentage of Net Assets
Domestic Equity Funds - 63.1% |
| Shares | | Value |
Domestic Equity Funds - 63.1% |
VIP Contrafund Portfolio Initial Class (a) | 9,508 | | $ 326,601 |
VIP Equity-Income Portfolio Initial Class (a) | 14,313 | | 333,339 |
VIP Growth & Income Portfolio Initial Class (a) | 20,272 | | 388,011 |
VIP Growth Portfolio Initial Class (a) | 5,893 | | 336,722 |
VIP Mid Cap Portfolio Initial Class (a) | 2,657 | | 96,671 |
VIP Value Portfolio Initial Class (a) | 16,376 | | 248,594 |
VIP Value Strategies Portfolio Initial Class (a) | 8,522 | | 122,454 |
TOTAL DOMESTIC EQUITY FUNDS (Cost $1,559,253) |
1,852,392
|
International Equity Funds - 27.2% |
| | | |
Developed International Equity Funds - 21.5% |
VIP Overseas Portfolio Initial Class (a) | 30,584 | | 631,251 |
Emerging Markets Equity Funds - 5.7% |
VIP Emerging Markets Portfolio Initial Class (a) | 18,459 | | 166,319 |
TOTAL INTERNATIONAL EQUITY FUNDS (Cost $694,843) |
797,570
|
Bond Funds - 9.7% |
| Shares | | Value |
High Yield Bond Funds - 6.8% |
VIP High Income Portfolio Initial Class (a) | 34,383 | | $ 199,421 |
Investment Grade Bond Funds - 2.9% |
VIP Investment Grade Bond Portfolio Initial Class (a) | 6,909 | | 85,400 |
TOTAL BOND FUNDS (Cost $279,927) |
284,821
|
TOTAL INVESTMENT PORTFOLIO - 100.0% (Cost $2,534,023) | | 2,934,783 |
NET OTHER ASSETS (LIABILITIES) - 0.0% | | (512) |
NET ASSETS - 100% | $ 2,934,271 |
Legend |
(a) Affiliated company |
Affiliated Underlying Funds |
Information regarding the Fund's fiscal year to date purchases and sales of the affiliated Underlying Funds and income earned by the Fund from investments in affiliated Underlying Funds is as follows: |
Affiliate | Value,
beginning of period | Purchases | Sales
Proceeds | Dividend
Income | Value,
end of
period |
VIP Contrafund Portfolio Initial Class | $ 80,500 | $ 256,391 | $ 52,871 | $ 3,118 | $ 326,601 |
VIP Emerging Markets Portfolio Initial Class | 41,434 | 146,288 | 24,607 | 1,113 | 166,319 |
VIP Equity-Income Portfolio Initial Class | 85,820 | 293,464 | 58,795 | 7,626 | 333,339 |
VIP Growth & Income Portfolio Initial Class | 97,208 | 310,259 | 68,325 | 6,477 | 388,011 |
VIP Growth Portfolio Initial Class | 80,144 | 260,137 | 53,623 | 846 | 336,722 |
VIP High Income Portfolio Initial Class | 75,278 | 223,390 | 96,689 | 11,713 | 199,421 |
VIP Investment Grade Bond Portfolio Initial Class | 40,139 | 138,327 | 87,392 | 3,479 | 85,400 |
VIP Mid Cap Portfolio Initial Class | 23,944 | 84,589 | 16,214 | 432 | 96,671 |
VIP Overseas Portfolio Initial Class | 135,619 | 509,331 | 84,790 | 7,063 | 631,251 |
VIP Value Portfolio Initial Class | 63,843 | 216,358 | 44,511 | 2,511 | 248,594 |
VIP Value Strategies Portfolio Initial Class | 31,672 | 96,452 | 21,485 | 1,018 | 122,454 |
Total | $ 755,601 | $ 2,534,986 | $ 609,302 | $ 45,396 | $ 2,934,783 |
Other Information |
All investments are categorized as Level 1 under the Fair Value Hierarchy. The inputs or methodology used for valuing securities may not be an indication of the risk associated with investing in those securities. For more information on valuation inputs, please refer to the Investment Valuation section in the accompanying Notes to Financial Statements. |
See accompanying notes which are an integral part of the financial statements.
Annual Report
VIP Freedom 2045 Portfolio
Statement of Assets and Liabilities
| December 31, 2013 |
| | |
Assets | | |
Investment in securities, at value (cost $2,534,023) - See accompanying schedule | | $ 2,934,783 |
Receivable for investments sold | | 4 |
Receivable for fund shares sold | | 9,652 |
Total assets | | 2,944,439 |
| | |
Liabilities | | |
Payable to custodian bank | $ 1 | |
Payable for investments purchased | 6,867 | |
Payable for fund shares redeemed | 2,788 | |
Distribution and service plan fees payable | 512 | |
Total liabilities | | 10,168 |
| | |
Net Assets | | $ 2,934,271 |
Net Assets consist of: | | |
Paid in capital | | $ 2,503,537 |
Accumulated undistributed net realized gain (loss) on investments | | 29,974 |
Net unrealized appreciation (depreciation) on investments | | 400,760 |
Net Assets | | $ 2,934,271 |
Statement of Assets and Liabilities - continued
| December 31, 2013 |
| | |
Initial Class:
Net Asset Value, offering price and redemption price per share ($271,524 ÷ 14,932 shares) | | $ 18.18 |
| | |
Service Class:
Net Asset Value, offering price and redemption price per share ($169,399 ÷ 9,316 shares) | | $ 18.18 |
| | |
Service Class 2:
Net Asset Value, offering price and redemption price per share ($2,493,348 ÷ 137,509 shares) | | $ 18.13 |
See accompanying notes which are an integral part of the financial statements.
Annual Report
Financial Statements - continued
Statement of Operations
| Year ended December 31, 2013 |
| | |
Investment Income | | |
Income distributions from underlying funds | | $ 45,396 |
| | |
Expenses | | |
Distribution and service plan fees | $ 2,951 | |
Independent trustees' compensation | 5 | |
Total expenses before reductions | 2,956 | |
Expense reductions | (5) | 2,951 |
Net investment income (loss) | | 42,445 |
Realized and Unrealized Gain (Loss) Realized gain (loss) on sale of underlying fund shares | 1,525 | |
Capital gain distributions from underlying funds | 52,841 | |
Total net realized gain (loss) | | 54,366 |
Change in net unrealized appreciation (depreciation) on underlying funds | | 251,989 |
Net gain (loss) | | 306,355 |
Net increase (decrease) in net assets resulting from operations | | $ 348,800 |
Statement of Changes in Net Assets
| Year ended
December 31, 2013 | Year ended
December 31, 2012 |
Increase (Decrease) in Net Assets | | |
Operations | | |
Net investment income (loss) | $ 42,445 | $ 14,172 |
Net realized gain (loss) | 54,366 | 8,432 |
Change in net unrealized appreciation (depreciation) | 251,989 | 53,952 |
Net increase (decrease) in net assets resulting from operations | 348,800 | 76,556 |
Distributions to shareholders from net investment income | (42,511) | (14,184) |
Distributions to shareholders from net realized gain | (27,647) | (15,172) |
Total distributions | (70,158) | (29,356) |
Share transactions - net increase (decrease) | 1,900,136 | 380,344 |
Total increase (decrease) in net assets | 2,178,778 | 427,544 |
| | |
Net Assets | | |
Beginning of period | 755,493 | 327,949 |
End of period | $ 2,934,271 | $ 755,493 |
See accompanying notes which are an integral part of the financial statements.
Annual Report
Financial Highlights - Initial Class
Years ended December 31, | 2013 | 2012 | 2011 | 2010 | 2009 F |
Selected Per-Share Data | | | | | |
Net asset value, beginning of period | $ 14.83 | $ 13.38 | $ 14.61 | $ 13.86 | $ 10.00 |
Income from Investment Operations | | | | | |
Net investment income (loss) D | .52 | .44 | .27 | .24 | .26 |
Net realized and unrealized gain (loss) | 3.33 | 1.84 | (.89) | 2.14 | 3.87 |
Total from investment operations | 3.85 | 2.28 | (.62) | 2.38 | 4.13 |
Distributions from net investment income | (.29) | (.30) | (.28) | (.29) | (.26) |
Distributions from net realized gain | (.21) | (.53) | (.34) | (1.34) | (.01) |
Total distributions | (.50) | (.83) | (.61) H | (1.63) | (.27) |
Net asset value, end of period | $ 18.18 | $ 14.83 | $ 13.38 | $ 14.61 | $ 13.86 |
Total Return B,C, I | 26.07% | 17.33% | (4.41)% | 17.37% | 41.28% |
Ratios to Average Net Assets E,G | | | | | |
Expenses before reductions | .00% | .00% | .00% | .00% | .00% A |
Expenses net of fee waivers, if any | .00% | .00% | .00% | .00% | .00% A |
Expenses net of all reductions | .00% | .00% | .00% | .00% | .00% A |
Net investment income (loss) | 3.13% | 3.07% | 1.88% | 1.65% | 2.83% A |
Supplemental Data | | | | | |
Net assets, end of period (000 omitted) | $ 272 | $ 136 | $ 95 | $ 121 | $ 145 |
Portfolio turnover rate E | 42% | 16% | 29% | 17% | 5% A |
A Annualized
B Total returns for periods of less than one year are not annualized.
C Total returns do not reflect charges attributable to your insurance company's separate account. Inclusion of these charges would reduce the total returns shown.
D Calculated based on average shares outstanding during the period.
E Amounts do not include the activity of the Underlying Funds.
F For the period April 8, 2009 (commencement of operations) to December 31, 2009.
G Expense ratios reflect operating expenses of the class. Expenses before reductions do not reflect amounts reimbursed by the investment adviser or reductions from expense offset arrangements and do not represent the amount paid by the class during periods when reimbursements or reductions occur. Expenses net of fee waivers reflect expenses after reimbursement by the investment adviser but prior to reductions from expense offset arrangements. Expenses net of all reductions represent the net expenses paid by the class but do not include expenses of the investment companies in which the Fund invests.
H Total distributions of $.61 per share is comprised of distributions from net investment income of $.279 and distributions from net realized gain of $.335 per share.
I Total returns would have been lower if certain expenses had not been reduced during the applicable periods shown.
Financial Highlights - Service Class
Years ended December 31, | 2013 | 2012 | 2011 | 2010 | 2009 F |
Selected Per-Share Data | | | | | |
Net asset value, beginning of period | $ 14.83 | $ 13.38 | $ 14.61 | $ 13.86 | $ 10.00 |
Income from Investment Operations | | | | | |
Net investment income (loss) D | .51 | .43 | .26 | .22 | .25 |
Net realized and unrealized gain (loss) | 3.33 | 1.83 | (.89) | 2.14 | 3.87 |
Total from investment operations | 3.84 | 2.26 | (.63) | 2.36 | 4.12 |
Distributions from net investment income | (.27) | (.29) | (.26) | (.28) | (.25) |
Distributions from net realized gain | (.21) | (.53) | (.34) | (1.34) | (.01) |
Total distributions | (.49) J | (.81) I | (.60) | (1.61) H | (.26) |
Net asset value, end of period | $ 18.18 | $ 14.83 | $ 13.38 | $ 14.61 | $ 13.86 |
Total Return B,C, K | 25.96% | 17.24% | (4.52)% | 17.23% | 41.19% |
Ratios to Average Net Assets E,G | | | | | |
Expenses before reductions | .10% | .10% | .10% | .10% | .10% A |
Expenses net of fee waivers, if any | .10% | .10% | .10% | .10% | .10% A |
Expenses net of all reductions | .10% | .10% | .10% | .10% | .10% A |
Net investment income (loss) | 3.03% | 2.97% | 1.78% | 1.55% | 2.73% A |
Supplemental Data | | | | | |
Net assets, end of period (000 omitted) | $ 169 | $ 134 | $ 90 | $ 117 | $ 141 |
Portfolio turnover rate E | 42% | 16% | 29% | 17% | 5% A |
A Annualized
B Total returns for periods of less than one year are not annualized.
C Total returns do not reflect charges attributable to your insurance company's separate account. Inclusion of these charges would reduce the total returns shown.
D Calculated based on average shares outstanding during the period.
E Amounts do not include the activity of the Underlying Funds.
F For the period April 8, 2009 (commencement of operations) to December 31, 2009.
G Expense ratios reflect operating expenses of the class. Expenses before reductions do not reflect amounts reimbursed by the investment adviser or reductions from expense offset arrangements and do not represent the amount paid by the class during periods when reimbursements or reductions occur. Expenses net of fee waivers reflect expenses after reimbursement by the investment adviser but prior to reductions from expense offset arrangements. Expenses net of all reductions represent the net expenses paid by the class but do not include expenses of the investment companies in which the Fund invests.
H Total distributions of $1.61 per share is comprised of distributions from net investment income of $.276 and distributions from net realized gain of $1.335 per share.
I Total distributions of $.81 per share is comprised of distributions from net investment income of $.289 and distributions from net realized gain of $.525 per share.
J Total distributions of $.49 per share is comprised of distributions from net investment income of $.271 and distributions from net realized gain of $.214 per share.
K Total returns would have been lower if certain expenses had not been reduced during the applicable periods shown.
See accompanying notes which are an integral part of the financial statements.
Annual Report
Financial Highlights - Service Class 2
Years ended December 31, | 2013 | 2012 | 2011 | 2010 | 2009 F |
Selected Per-Share Data | | | | | |
Net asset value, beginning of period | $ 14.81 | $ 13.38 | $ 14.61 | $ 13.85 | $ 10.00 |
Income from Investment Operations | | | | | |
Net investment income (loss) D | .49 | .41 | .23 | .20 | .24 |
Net realized and unrealized gain (loss) | 3.31 | 1.83 | (.88) | 2.15 | 3.86 |
Total from investment operations | 3.80 | 2.24 | (.65) | 2.35 | 4.10 |
Distributions from net investment income | (.27) | (.28) | (.25) | (.25) | (.24) |
Distributions from net realized gain | (.21) | (.53) | (.34) | (1.34) | (.01) |
Total distributions | (.48) | (.81) | (.58) H | (1.59) | (.25) |
Net asset value, end of period | $ 18.13 | $ 14.81 | $ 13.38 | $ 14.61 | $ 13.85 |
Total Return B,C, I | 25.76% | 17.02% | (4.64)% | 17.15% | 40.96% |
Ratios to Average Net Assets E,G | | | | | |
Expenses before reductions | .25% | .25% | .25% | .25% | .25% A |
Expenses net of fee waivers, if any | .25% | .25% | .25% | .25% | .25% A |
Expenses net of all reductions | .25% | .25% | .25% | .25% | .25% A |
Net investment income (loss) | 2.88% | 2.82% | 1.63% | 1.40% | 2.58% A |
Supplemental Data | | | | | |
Net assets, end of period (000 omitted) | $ 2,493 | $ 486 | $ 143 | $ 126 | $ 141 |
Portfolio turnover rate E | 42% | 16% | 29% | 17% | 5% A |
A Annualized
B Total returns for periods of less than one year are not annualized.
C Total returns do not reflect charges attributable to your insurance company's separate account. Inclusion of these charges would reduce the total returns shown.
D Calculated based on average shares outstanding during the period.
E Amounts do not include the activity of the Underlying Funds.
F For the period April 8, 2009 (commencement of operations) to December 31, 2009.
G Expense ratios reflect operating expenses of the class. Expenses before reductions do not reflect amounts reimbursed by the investment adviser or reductions from expense offset arrangements and do not represent the amount paid by the class during periods when reimbursements or reductions occur. Expenses net of fee waivers reflect expenses after reimbursement by the investment adviser but prior to reductions from expense offset arrangements. Expenses net of all reductions represent the net expenses paid by the class but do not include expenses of the investment companies in which the Fund invests.
H Total distributions of $.58 per share is comprised of distributions from net investment income of $.245 and distributions from net realized gain of $.335 per share.
I Total returns would have been lower if certain expenses had not been reduced during the applicable periods shown.
See accompanying notes which are an integral part of the financial statements.
Annual Report
VIP Freedom 2050 Portfolio
Investment Changes (Unaudited)
The information in the following tables is based on the direct investments of the Fund.
Fund Holdings as of December 31, 2013 |
| % of fund's
net assets | % of fund's net assets
6 months ago |
Domestic Equity Funds | | |
VIP Contrafund Portfolio Initial Class | 11.1 | 11.0 |
VIP Equity-Income Portfolio Initial Class | 11.3 | 11.7 |
VIP Growth & Income Portfolio Initial Class | 13.2 | 13.4 |
VIP Growth Portfolio Initial Class | 11.5 | 11.2 |
VIP Mid Cap Portfolio Initial Class | 3.3 | 3.3 |
VIP Value Portfolio Initial Class | 8.5 | 8.6 |
VIP Value Strategies Portfolio Initial Class | 4.2 | 4.2 |
| 63.1 | 63.4 |
Developed International Equity Funds | | |
VIP Overseas Portfolio Initial Class | 21.4 | 17.6 |
Emerging Markets Equity Funds | | |
VIP Emerging Markets Portfolio Initial Class | 5.6 | 5.1 |
High Yield Bond Funds | | |
VIP High Income Portfolio Initial Class | 6.9 | 9.7 |
Investment Grade Bond Funds | | |
VIP Investment Grade Bond Portfolio Initial Class | 3.0 | 4.2 |
Net Other Assets (Liabilities)* | 0.0 | 0.0 |
| 100.0 | 100.0 |
* Amount represents less than 0.1% |
Asset Allocation (% of fund's net assets) |
Period end |
| Domestic Equity Funds | 63.1% | |
| Developed International Equity Funds | 21.4% | |
| Emerging Markets Equity Funds | 5.6% | |
| High Yield Bond Funds | 6.9% | |
| Investment Grade Bond Funds | 3.0% | |

Six months ago |
| Domestic Equity Funds | 63.4% | |
| Developed International Equity Funds | 17.6% | |
| Emerging Markets Equity Funds | 5.1% | |
| High Yield Bond Funds | 9.7% | |
| Investment Grade Bond Funds | 4.2% | |

Annual Report
VIP Freedom 2050 Portfolio
Investments December 31, 2013
Showing Percentage of Net Assets
Domestic Equity Funds - 63.1% |
| Shares | | Value |
Domestic Equity Funds - 63.1% |
VIP Contrafund Portfolio Initial Class (a) | 14,353 | | $ 493,030 |
VIP Equity-Income Portfolio Initial Class (a) | 21,604 | | 503,165 |
VIP Growth & Income Portfolio Initial Class (a) | 30,564 | | 585,000 |
VIP Growth Portfolio Initial Class (a) | 8,962 | | 512,072 |
VIP Mid Cap Portfolio Initial Class (a) | 4,009 | | 145,877 |
VIP Value Portfolio Initial Class (a) | 24,733 | | 375,450 |
VIP Value Strategies Portfolio Initial Class (a) | 12,850 | | 184,653 |
TOTAL DOMESTIC EQUITY FUNDS (Cost $2,376,969) |
2,799,247
|
International Equity Funds - 27.0% |
| | | |
Developed International Equity Funds - 21.4% |
VIP Overseas Portfolio Initial Class (a) | 45,972 | | 948,854 |
Emerging Markets Equity Funds - 5.6% |
VIP Emerging Markets Portfolio Initial Class (a) | 27,692 | | 249,508 |
TOTAL INTERNATIONAL EQUITY FUNDS (Cost $1,047,545) |
1,198,362
|
Bond Funds - 9.9% |
| Shares | | Value |
High Yield Bond Funds - 6.9% |
VIP High Income Portfolio Initial Class (a) | 53,056 | | $ 307,724 |
Investment Grade Bond Funds - 3.0% |
VIP Investment Grade Bond Portfolio Initial Class (a) | 10,823 | | 133,777 |
TOTAL BOND FUNDS (Cost $438,044) |
441,501
|
TOTAL INVESTMENT PORTFOLIO - 100.0% (Cost $3,862,558) | | 4,439,110 |
NET OTHER ASSETS (LIABILITIES) - 0.0% | | (434) |
NET ASSETS - 100% | $ 4,438,676 |
Legend |
(a) Affiliated company |
Affiliated Underlying Funds |
Information regarding the Fund's fiscal year to date purchases and sales of the affiliated Underlying Funds and income earned by the Fund from investments in affiliated Underlying Funds is as follows: |
Affiliate | Value,
beginning of period | Purchases | Sales
Proceeds | Dividend
Income | Value,
end of
period |
VIP Contrafund Portfolio Initial Class | $ 143,777 | $ 420,652 | $ 137,774 | $ 3,947 | $ 493,030 |
VIP Emerging Markets Portfolio Initial Class | 73,519 | 234,220 | 62,286 | 1,421 | 249,508 |
VIP Equity-Income Portfolio Initial Class | 152,655 | 471,865 | 149,500 | 9,594 | 503,165 |
VIP Growth & Income Portfolio Initial Class | 173,157 | 506,754 | 173,212 | 8,178 | 585,000 |
VIP Growth Portfolio Initial Class | 143,573 | 427,501 | 138,245 | 1,084 | 512,072 |
VIP High Income Portfolio Initial Class | 133,149 | 379,996 | 204,329 | 14,458 | 307,724 |
VIP Investment Grade Bond Portfolio Initial Class | 46,400 | 195,000 | 101,375 | 3,621 | 133,777 |
VIP Mid Cap Portfolio Initial Class | 42,713 | 135,265 | 41,540 | 549 | 145,877 |
VIP Overseas Portfolio Initial Class | 242,170 | 817,268 | 220,954 | 9,076 | 948,854 |
VIP Value Portfolio Initial Class | 113,736 | 347,118 | 112,195 | 3,171 | 375,450 |
VIP Value Strategies Portfolio Initial Class | 56,505 | 158,124 | 54,522 | 1,287 | 184,653 |
Total | $ 1,321,354 | $ 4,093,763 | $ 1,395,932 | $ 56,386 | $ 4,439,110 |
Other Information |
All investments are categorized as Level 1 under the Fair Value Hierarchy. The inputs or methodology used for valuing securities may not be an indication of the risk associated with investing in those securities. For more information on valuation inputs, please refer to the Investment Valuation section in the accompanying Notes to Financial Statements. |
See accompanying notes which are an integral part of the financial statements.
Annual Report
VIP Freedom 2050 Portfolio
Statement of Assets and Liabilities
| December 31, 2013 |
| | |
Assets | | |
Investment in securities, at value (cost $3,862,558) - See accompanying schedule | | $ 4,439,110 |
Cash | | 1 |
Receivable for fund shares sold | | 14,258 |
Total assets | | 4,453,369 |
| | |
Liabilities | | |
Payable for investments purchased | $ 14,000 | |
Payable for fund shares redeemed | 258 | |
Distribution and service plan fees payable | 435 | |
Total liabilities | | 14,693 |
| | |
Net Assets | | $ 4,438,676 |
Net Assets consist of: | | |
Paid in capital | | $ 3,820,642 |
Accumulated undistributed net realized gain (loss) on investments | | 41,482 |
Net unrealized appreciation (depreciation) on investments | | 576,552 |
Net Assets | | $ 4,438,676 |
Statement of Assets and Liabilities - continued
| December 31, 2013 |
| | |
Initial Class:
Net Asset Value, offering price and redemption price per share ($879,957 ÷ 53,158 shares) | | $ 16.55 |
| | |
Service Class:
Net Asset Value, offering price and redemption price per share ($1,892,221 ÷ 114,419 shares) | | $ 16.54 |
| | |
Service Class 2:
Net Asset Value, offering price and redemption price per share ($1,666,498 ÷ 100,938 shares) | | $ 16.51 |
See accompanying notes which are an integral part of the financial statements.
Annual Report
Statement of Operations
| Year ended December 31, 2013 |
| | |
Investment Income | | |
Income distributions from underlying funds | | $ 56,386 |
| | |
Expenses | | |
Distribution and service plan fees | $ 3,186 | |
Independent trustees' compensation | 8 | |
Total expenses before reductions | 3,194 | |
Expense reductions | (8) | 3,186 |
Net investment income (loss) | | 53,200 |
Realized and Unrealized Gain (Loss) Realized gain (loss) on sale of underlying fund shares | 11,428 | |
Capital gain distributions from underlying funds | 66,694 | |
Total net realized gain (loss) | | 78,122 |
Change in net unrealized appreciation (depreciation) on underlying funds | | 408,501 |
Net gain (loss) | | 486,623 |
Net increase (decrease) in net assets resulting from operations | | $ 539,823 |
Statement of Changes in Net Assets
| Year ended
December 31, 2013 | Year ended
December 31, 2012 |
Increase (Decrease) in Net Assets | | |
Operations | | |
Net investment income (loss) | $ 53,200 | $ 26,288 |
Net realized gain (loss) | 78,122 | 13,852 |
Change in net unrealized appreciation (depreciation) | 408,501 | 76,485 |
Net increase (decrease) in net assets resulting from operations | 539,823 | 116,625 |
Distributions to shareholders from net investment income | (53,488) | (25,863) |
Distributions to shareholders from net realized gain | (39,156) | (74,006) |
Total distributions | (92,644) | (99,869) |
Share transactions - net increase (decrease) | 2,670,262 | 797,658 |
Total increase (decrease) in net assets | 3,117,441 | 814,414 |
| | |
Net Assets | | |
Beginning of period | 1,321,235 | 506,821 |
End of period (including undistributed net investment income of $0 and $335, respectively) | $ 4,438,676 | $ 1,321,235 |
See accompanying notes which are an integral part of the financial statements.
Annual Report
Financial Highlights - Initial Class
Years ended December 31, | 2013 | 2012 | 2011 | 2010 | 2009 F |
Selected Per-Share Data | | | | | |
Net asset value, beginning of period | $ 13.41 | $ 13.34 | $ 15.82 | $ 14.01 | $ 10.00 |
Income from Investment Operations | | | | | |
Net investment income (loss) D | .37 | .47 | .26 | .39 | .26 |
Net realized and unrealized gain (loss) | 3.16 | 1.72 | (1.03) | 2.06 | 4.01 |
Total from investment operations | 3.53 | 2.19 | (.77) | 2.45 | 4.27 |
Distributions from net investment income | (.22) | (.28) | (.28) | (.28) | (.25) |
Distributions from net realized gain | (.18) | (1.84) | (1.43) | (.36) | (.01) |
Total distributions | (.39) H | (2.12) | (1.71) | (.64) | (.26) |
Net asset value, end of period | $ 16.55 | $ 13.41 | $ 13.34 | $ 15.82 | $ 14.01 |
Total Return B,C, I | 26.44% | 17.64% | (4.93)% | 17.58% | 42.70% |
Ratios to Average Net Assets E,G | | | | | |
Expenses before reductions | .00% | .00% | .00% | .00% | .00% A |
Expenses net of fee waivers, if any | .00% | .00% | .00% | .00% | .00% A |
Expenses net of all reductions | .00% | .00% | .00% | .00% | .00% A |
Net investment income (loss) | 2.42% | 3.57% | 1.67% | 2.64% | 2.76% A |
Supplemental Data | | | | | |
Net assets, end of period (000 omitted) | $ 880 | $ 441 | $ 253 | $ 666 | $ 159 |
Portfolio turnover rate E | 59% | 24% | 92% | 50% | 4% A |
A Annualized
B Total returns for periods of less than one year are not annualized.
C Total returns do not reflect charges attributable to your insurance company's separate account. Inclusion of these charges would reduce the total returns shown.
D Calculated based on average shares outstanding during the period.
E Amounts do not include the activity of the Underlying Funds.
F For the period April 8, 2009 (commencement of operations) to December 31, 2009.
G Expense ratios reflect operating expenses of the class. Expenses before reductions do not reflect amounts reimbursed by the investment adviser or reductions from expense offset arrangements and do not represent the amount paid by the class during periods when reimbursements or reductions occur. Expenses net of fee waivers reflect expenses after reimbursement by the investment adviser but prior to reductions from expense offset arrangements. Expenses net of all reductions represent the net expenses paid by the class but do not include expenses of the investment companies in which the Fund invests.
H Total distributions of $.39 per share is comprised of distributions from net investment income of $.218 and distributions from net realized gain of $.175 per share.
I Total returns would have been lower if certain expenses had not been reduced during the applicable periods shown.
Financial Highlights - Service Class
Years ended December 31, | 2013 | 2012 | 2011 | 2010 | 2009 F |
Selected Per-Share Data | | | | | |
Net asset value, beginning of period | $ 13.41 | $ 13.34 | $ 15.82 | $ 14.00 | $ 10.00 |
Income from Investment Operations | | | | | |
Net investment income (loss) D | .35 | .46 | .25 | .37 | .25 |
Net realized and unrealized gain (loss) | 3.17 | 1.73 | (1.04) | 2.07 | 4.00 |
Total from investment operations | 3.52 | 2.19 | (.79) | 2.44 | 4.25 |
Distributions from net investment income | (.21) | (.27) | (.26) | (.26) | (.24) |
Distributions from net realized gain | (.18) | (1.84) | (1.43) | (.36) | (.01) |
Total distributions | (.39) | (2.12) H | (1.69) | (.62) | (.25) |
Net asset value, end of period | $ 16.54 | $ 13.41 | $ 13.34 | $ 15.82 | $ 14.00 |
Total Return B,C, I | 26.32% | 17.59% | (5.06)% | 17.53% | 42.51% |
Ratios to Average Net Assets E,G | | | | | |
Expenses before reductions | .10% | .10% | .10% | .10% | .10% A |
Expenses net of fee waivers, if any | .10% | .10% | .10% | .10% | .10% A |
Expenses net of all reductions | .10% | .10% | .10% | .10% | .10% A |
Net investment income (loss) | 2.32% | 3.47% | 1.57% | 2.54% | 2.66% A |
Supplemental Data | | | | | |
Net assets, end of period (000 omitted) | $ 1,892 | $ 490 | $ 91 | $ 118 | $ 143 |
Portfolio turnover rate E | 59% | 24% | 92% | 50% | 4% A |
A Annualized
B Total returns for periods of less than one year are not annualized.
C Total returns do not reflect charges attributable to your insurance company's separate account. Inclusion of these charges would reduce the total returns shown.
D Calculated based on average shares outstanding during the period.
E Amounts do not include the activity of the Underlying Funds.
F For the period April 8, 2009 (commencement of operations) to December 31, 2009.
G Expense ratios reflect operating expenses of the class. Expenses before reductions do not reflect amounts reimbursed by the investment adviser or reductions from expense offset arrangements and do not represent the amount paid by the class during periods when reimbursements or reductions occur. Expenses net of fee waivers reflect expenses after reimbursement by the investment adviser but prior to reductions from expense offset arrangements. Expenses net of all reductions represent the net expenses paid by the class but do not include expenses of the investment companies in which the Fund invests.
H Total distributions of $2.12 per share is comprised of distributions from net investment income of $.272 and distributions from net realized gain of $1.843 per share.
I Total returns would have been lower if certain expenses had not been reduced during the applicable periods shown.
See accompanying notes which are an integral part of the financial statements.
Annual Report
Financial Highlights - Service Class 2
Years ended December 31, | 2013 | 2012 | 2011 | 2010 | 2009 F |
Selected Per-Share Data | | | | | |
Net asset value, beginning of period | $ 13.39 | $ 13.33 | $ 15.81 | $ 14.00 | $ 10.00 |
Income from Investment Operations | | | | | |
Net investment income (loss) D | .33 | .43 | .22 | .35 | .23 |
Net realized and unrealized gain (loss) | 3.16 | 1.73 | (1.02) | 2.06 | 4.01 |
Total from investment operations | 3.49 | 2.16 | (.80) | 2.41 | 4.24 |
Distributions from net investment income | (.19) | (.26) | (.25) | (.24) | (.23) |
Distributions from net realized gain | (.18) | (1.84) | (1.43) | (.36) | (.01) |
Total distributions | (.37) | (2.10) | (1.68) | (.60) | (.24) |
Net asset value, end of period | $ 16.51 | $ 13.39 | $ 13.33 | $ 15.81 | $ 14.00 |
Total Return B,C, H | 26.13% | 17.38% | (5.16)% | 17.30% | 42.37% |
Ratios to Average Net Assets E,G | | | | | |
Expenses before reductions | .25% | .25% | .25% | .25% | .25% A |
Expenses net of fee waivers, if any | .25% | .25% | .25% | .25% | .25% A |
Expenses net of all reductions | .25% | .25% | .25% | .25% | .25% A |
Net investment income (loss) | 2.17% | 3.32% | 1.42% | 2.39% | 2.51% A |
Supplemental Data | | | | | |
Net assets, end of period (000 omitted) | $ 1,666 | $ 390 | $ 163 | $ 142 | $ 147 |
Portfolio turnover rate E | 59% | 24% | 92% | 50% | 4% A |
A Annualized
B Total returns for periods of less than one year are not annualized.
C Total returns do not reflect charges attributable to your insurance company's separate account. Inclusion of these charges would reduce the total returns shown.
D Calculated based on average shares outstanding during the period.
E Amounts do not include the activity of the Underlying Funds.
F For the period April 8, 2009 (commencement of operations) to December 31, 2009.
G Expense ratios reflect operating expenses of the class. Expenses before reductions do not reflect amounts reimbursed by the investment adviser or reductions from expense offset arrangements and do not represent the amount paid by the class during periods when reimbursements or reductions occur. Expenses net of fee waivers reflect expenses after reimbursement by the investment adviser but prior to reductions from expense offset arrangements. Expenses net of all reductions represent the net expenses paid by the class but do not include expenses of the investment companies in which the Fund invests.
H Total returns would have been lower if certain expenses had not been reduced during the applicable periods shown.
See accompanying notes which are an integral part of the financial statements.
Annual Report
Notes to Financial Statements
For the period ended December 31, 2013
1. Organization.
VIP Freedom Income Portfolio, VIP Freedom 2005 Portfolio, VIP Freedom 2010 Portfolio, VIP Freedom 2015 Portfolio, VIP Freedom 2020 Portfolio, VIP Freedom 2025 Portfolio, VIP Freedom 2030 Portfolio, VIP Freedom 2035 Portfolio, VIP Freedom 2040 Portfolio, VIP Freedom 2045 Portfolio and VIP Freedom 2050 Portfolio (the Funds) are funds of Variable Insurance Products Fund V. Variable Insurance Products Fund V (the Trust) is registered under the Investment Company Act of 1940, as amended (the 1940 Act), as an open-end management investment company organized as a Massachusetts business trust. Each Fund is authorized to issue an unlimited number of shares. The Funds invest primarily in a combination of other VIP equity, bond, and short-term funds (the Underlying Funds) managed by Fidelity Management & Research Company (FMR). Shares of each Fund may only be purchased by insurance companies for the purpose of funding variable annuity or variable life insurance contracts. Each Fund offers three classes of shares: Initial Class shares, Service Class shares and Service Class 2 shares. All classes have equal rights and voting privileges, except for matters affecting a single class.
2. Significant Accounting Policies.
The financial statements have been prepared in conformity with accounting principles generally accepted in the United States of America (GAAP), which require management to make certain estimates and assumptions at the date of the financial statements. Actual results could differ from those estimates. Subsequent events, if any, through the date that the financial statements were issued have been evaluated in the preparation of the financial statements. The following summarizes the significant accounting policies of the Funds:
Investment Valuation. Investments are valued as of 4:00 p.m. Eastern time on the last calendar day of the period. Each Fund categorizes the inputs to valuation techniques used to value its investments into a disclosure hierarchy consisting of three levels as shown below:
Level 1 - quoted prices in active markets for identical investments
Level 2 - other significant observable inputs (including quoted prices for similar investments, interest rates, prepayment speeds, etc.)
Level 3 - unobservable inputs (including the Fund's own assumptions based on the best information available)
Valuation techniques used to value each Fund's investments by major category are as follows. Investments in the Underlying Funds are valued at their closing net asset value (NAV) each business day and are categorized as Level 1 in the hierarchy.
Investment Transactions and Income. For financial reporting purposes, the Funds' investment holdings and NAV include trades executed through the end of the last business day of the period. The NAV per share for processing shareholder transactions is calculated as of the close of business of the New York Stock Exchange (NYSE), normally 4:00 p.m. Eastern time and includes trades executed through the end of the prior business day. Gains and losses on securities sold are determined on the basis of identified cost. Income and capital gain distributions from the Underlying Funds, if any, are recorded on the ex-dividend date.
Class Allocations and Expenses. Investment income, realized and unrealized capital gains and losses, common expenses of each Fund, and certain fund-level expense reductions, if any, are allocated daily on a pro-rata basis to each class based on the relative net assets of each class to the total net assets of the Fund. Each class differs with respect to distribution and service plan fees incurred. Certain expense reductions may also differ by class. For the reporting period, the allocated portion of income and expenses to each class as a percent of its average net assets may vary due to the timing of recording these transactions in relation to fluctuating net assets of the classes. Expenses directly attributable to a fund are charged to that fund. Expenses attributable to more than one fund are allocated among the respective funds on the basis of relative net assets or other appropriate methods. Expenses included in the accompanying financial statements reflect the expenses of each Fund and do not include any expenses associated with the Underlying Funds. Although not included in each Fund's expenses, each Fund indirectly bears its proportionate share of the Underlying Funds' expenses through the impact of these expenses on each Underlying Fund's NAV. Expense estimates are accrued in the period to which they relate and adjustments are made when actual amounts are known.
Income Tax Information and Distributions to Shareholders. Each year, each Fund intends to qualify as a regulated investment company under Subchapter M of the Internal Revenue Code, including distributing substantially all of its taxable income and realized gains. As a result, no provision for U.S. Federal income taxes is required. As of December 31, 2013, each Fund did not have any unrecognized tax benefits in the financial statements; nor is each Fund aware of any tax positions for which it is reasonably possible that the total amounts of unrecognized tax benefits will significantly change in the next twelve months. Each Fund files a U.S. federal tax return, in addition to state and local tax returns as required. Each Fund's federal income tax returns are subject to examination by the Internal Revenue Service (IRS) for a period of three fiscal years after they are filed. State and local tax returns may be subject to examination for an additional fiscal year depending on the jurisdiction.
Distributions are declared and recorded on the ex-dividend date. Income dividends and capital gain distributions are declared separately for each class. Income and capital gain distributions are determined in accordance with income tax regulations, which may differ from GAAP.
Annual Report
2. Significant Accounting Policies - continued
Income Tax Information and Distributions to Shareholders - continued
Capital accounts within the financial statements are adjusted for permanent book-tax differences. These adjustments have no impact on net assets or the results of operations. Capital accounts are not adjusted for temporary book-tax differences which will reverse in a subsequent period.
Book-tax differences are primarily due to the short-term gain distributions from the Underlying Funds, capital loss carryforwards and losses deferred due to wash sales and excise tax regulations.
The federal tax cost of investment securities and unrealized appreciation (depreciation) as of period end were as follows for each Fund:
| Tax cost | Gross unrealized
appreciation | Gross unrealized
depreciation | Net unrealized
appreciation
(depreciation) on
securities and other
investments |
VIP Freedom Income | $ 28,059,763 | $ 1,438,516 | $ (487,475) | $ 951,041 |
VIP Freedom 2005 | 7,157,232 | 415,943 | (200,501) | 215,442 |
VIP Freedom 2010 | 257,058,234 | 29,683,599 | (5,747,337) | 23,936,262 |
VIP Freedom 2015 | 100,276,275 | 16,684,923 | (2,462,614) | 14,222,309 |
VIP Freedom 2020 | 637,315,880 | 118,065,879 | (15,339,391) | 102,726,488 |
VIP Freedom 2025 | 79,179,301 | 15,254,829 | (1,715,211) | 13,539,618 |
VIP Freedom 2030 | 207,361,464 | 39,432,170 | (3,792,705) | 35,639,465 |
VIP Freedom 2035 | 5,244,597 | 575,912 | (52,722) | 523,190 |
VIP Freedom 2040 | 19,317,821 | 2,930,419 | (94,603) | 2,835,816 |
VIP Freedom 2045 | 2,536,603 | 416,855 | (18,675) | 398,180 |
VIP Freedom 2050 | 3,870,400 | 590,096 | (21,386) | 568,710 |
The tax-based components of distributable earnings as of period end were as follows for each Fund:
| Undistributed
ordinary income | Undistributed
long-term capital gain | Net unrealized
appreciation
(depreciation) |
VIP Freedom Income | $ - | $ 208,672 | $ 951,041 |
VIP Freedom 2005 | - | 49,063 | 215,442 |
VIP Freedom 2010 | 411,796 | 3,014,373 | 23,936,262 |
VIP Freedom 2015 | 32,622 | 1,411,231 | 14,222,309 |
VIP Freedom 2020 | 100,035 | 9,305,137 | 102,726,488 |
VIP Freedom 2025 | 15,469 | 1,085,505 | 13,539,618 |
VIP Freedom 2030 | - | 2,984,622 | 35,639,465 |
VIP Freedom 2035 | - | 59,792 | 523,190 |
VIP Freedom 2040 | - | 222,965 | 2,835,816 |
VIP Freedom 2045 | - | 32,766 | 398,180 |
VIP Freedom 2050 | 6,091 | 43,233 | 568,710 |
The tax character of distributions paid was as follows:
December 31, 2013 | | | |
| Ordinary
Income | Long-term
Capital Gains | Total |
VIP Freedom Income | $ 492,822 | $ 149,749 | $ 642,571 |
VIP Freedom 2005 | 139,051 | - | 139,051 |
VIP Freedom 2010 | 5,280,196 | 1,735,303 | 7,015,499 |
VIP Freedom 2015 | 2,311,732 | 1,110,690 | 3,422,422 |
VIP Freedom 2020 | 15,082,779 | 5,402,325 | 20,485,104 |
VIP Freedom 2025 | 2,060,637 | 732,549 | 2,793,186 |
VIP Freedom 2030 | 5,078,567 | 1,372,807 | 6,451,374 |
VIP Freedom 2035 | 115,339 | 7,170 | 122,509 |
VIP Freedom 2040 | 453,677 | 46,005 | 499,682 |
VIP Freedom 2045 | 65,734 | 4,424 | 70,158 |
VIP Freedom 2050 | 84,151 | 8,493 | 92,644 |
Annual Report
Notes to Financial Statements - continued
2. Significant Accounting Policies - continued
Income Tax Information and Distributions to Shareholders - continued
December 31, 2012 | | | |
| Ordinary
Income | Long-term
Capital Gains | Total |
VIP Freedom Income | $ 500,644 | $ 117,873 | $ 618,517 |
VIP Freedom 2005 | 143,231 | - | 143,231 |
VIP Freedom 2010 | 5,608,538 | 974,973 | 6,583,511 |
VIP Freedom 2015 | 3,062,355 | 627,074 | 3,689,429 |
VIP Freedom 2020 | 16,177,717 | 2,093,686 | 18,271,403 |
VIP Freedom 2025 | 1,626,511 | 190,579 | 1,817,090 |
VIP Freedom 2030 | 4,212,575 | 353,242 | 4,565,817 |
VIP Freedom 2035 | 23,348 | - | 23,348 |
VIP Freedom 2040 | 192,615 | 2,142 | 194,757 |
VIP Freedom 2045 | 17,315 | 12,041 | 29,356 |
VIP Freedom 2050 | 29,906 | 69,963 | 99,869 |
3. Purchases and Sales of Investments.
Purchases and redemptions of the Underlying Fund shares are noted in the table below.
| Purchases ($) | Redemptions ($) |
VIP Freedom Income | 16,476,380 | 11,293,248 |
VIP Freedom 2005 | 4,464,375 | 3,968,390 |
VIP Freedom 2010 | 87,057,423 | 48,111,173 |
VIP Freedom 2015 | 31,801,909 | 31,993,868 |
VIP Freedom 2020 | 176,695,171 | 138,136,996 |
VIP Freedom 2025 | 37,841,291 | 23,872,813 |
VIP Freedom 2030 | 106,523,198 | 61,612,794 |
VIP Freedom 2035 | 5,107,509 | 730,595 |
VIP Freedom 2040 | 16,177,001 | 5,112,096 |
VIP Freedom 2045 | 2,534,986 | 609,302 |
VIP Freedom 2050 | 4,093,763 | 1,395,932 |
4. Fees and Other Transactions with Affiliates.
Management Fee. Strategic Advisers, Inc. (the investment adviser), an affiliate of FMR, provides the Funds with investment management related services. The Funds do not pay any fees for these services.
Other Transactions. The investment adviser has entered into an administration agreement with FMR under which FMR provides management and administrative services (other than investment advisory services) necessary for the operation of each Fund. Pursuant to this agreement, FMR pays all expenses of each Fund, excluding the distribution and service fees, the compensation of the independent Trustees and certain other expenses such as interest expense. FMR also contracts with other Fidelity companies to perform the services necessary for the operation of each Fund. The Funds do not pay any fees for these services.
Distribution and Service Plan Fees. In accordance with Rule 12b-1 of the 1940 Act, the Funds have adopted separate 12b-1 Plans for each Service Class of shares. Each Service Class pays Fidelity Distributors Corporation (FDC), an affiliate of the investment adviser, a service fee. For the period, the service fee is based on an annual rate of .10% of Service Class' average net assets and .25% of Service Class 2's average net assets.
For the period, total fees, all of which were reallowed to insurance companies for the distribution of shares and providing shareholder support services were as follows:
| Service
Class | Service
Class 2 | Total |
VIP Freedom Income | $ 3,025 | $ 18,184 | $ 21,209 |
VIP Freedom 2005 | 817 | 263 | 1,080 |
VIP Freedom 2010 | 24,833 | 473,850 | 498,683 |
VIP Freedom 2015 | 8,778 | 154,965 | 163,743 |
VIP Freedom 2020 | 52,392 | 1,386,572 | 1,438,964 |
VIP Freedom 2025 | 19,232 | 100,042 | 119,274 |
VIP Freedom 2030 | 37,812 | 286,014 | 323,826 |
Annual Report
4. Fees and Other Transactions with Affiliates - continued
Distribution and Service Plan Fees - continued
| Service
Class | Service
Class 2 | Total |
VIP Freedom 2035 | $ 137 | $ 4,757 | $ 4,894 |
VIP Freedom 2040 | 6,197 | 3,409 | 9,606 |
VIP Freedom 2045 | 152 | 2,799 | 2,951 |
VIP Freedom 2050 | 654 | 2,532 | 3,186 |
5. Expense Reductions.
FMR voluntarily agreed to reimburse funds to the extent annual operating expenses exceeded certain levels of average net assets as noted in the table below. Some expenses, for example interest expense, are excluded from this reimbursement.
The following classes of each applicable Fund were in reimbursement during the period:
| Expense
Limitations | Reimbursement |
VIP Freedom Income | | |
Initial Class | -% | $ 59 |
Service Class | .10% | 11 |
Service Class 2 | .25% | 27 |
VIP Freedom 2005 | | |
Initial Class | -% | 25 |
Service Class | .10% | 3 |
Service Class 2 | .25% | - |
VIP Freedom 2010 | | |
Initial Class | -% | 137 |
Service Class | .10% | 92 |
Service Class 2 | .25% | 704 |
VIP Freedom 2015 | | |
Initial Class | -% | 145 |
Service Class | .10% | 33 |
Service Class 2 | .25% | 233 |
VIP Freedom 2020 | | |
Initial Class | -% | 293 |
Service Class | .10% | 196 |
Service Class 2 | .25% | 2,075 |
VIP Freedom 2025 | | |
Initial Class | -% | 76 |
Service Class | .10% | 70 |
Service Class 2 | .25% | 147 |
VIP Freedom 2030 | | |
Initial Class | -% | 192 |
Service Class | .10% | 139 |
Service Class 2 | .25% | 421 |
VIP Freedom 2035 | | |
Initial Class | -% | 1 |
Service Class | .10% | - |
Service Class 2 | .25% | 6 |
VIP Freedom 2040 | | |
Initial Class | -% | 23 |
Service Class | .10% | 22 |
Service Class 2 | .25% | 5 |
Annual Report
Notes to Financial Statements - continued
5. Expense Reductions - continued
| Expense
Limitations | Reimbursement |
VIP Freedom 2045 | | |
Initial Class | -% | $ 1 |
Service Class | .10% | 1 |
Service Class 2 | .25% | 3 |
VIP Freedom 2050 | | |
Initial Class | -% | 2 |
Service Class | .10% | 2 |
Service Class 2 | .25% | 4 |
6. Distributions to Shareholders.
Distributions to shareholders of each class were as follows:
Years ended December 31, | 2013 | 2012 |
VIP Freedom Income | | |
From net investment income | | |
Initial Class | $ 255,596 | $ 208,805 |
Service Class | 65,076 | 35,216 |
Service Class 2 | 94,526 | 78,395 |
Total | $ 415,198 | $ 322,416 |
From net realized gain | | |
Initial Class | $ 131,752 | $ 175,382 |
Service Class | 28,487 | 31,602 |
Service Class 2 | 67,134 | 89,117 |
Total | $ 227,373 | $ 296,101 |
VIP Freedom 2005 | | |
From net investment income | | |
Initial Class | $ 112,762 | $ 95,401 |
Service Class | 1,176 | 2,725 |
Service Class 2 | 1,329 | 3,488 |
Total | $ 115,267 | $ 101,614 |
From net realized gain | | |
Initial Class | $ 23,051 | $ 38,826 |
Service Class | 407 | 1,163 |
Service Class 2 | 326 | 1,628 |
Total | $ 23,784 | $ 41,617 |
VIP Freedom 2010 | | |
From net investment income | | |
Initial Class | $ 728,350 | $ 513,310 |
Service Class | 422,544 | 412,676 |
Service Class 2 | 2,957,034 | 2,741,808 |
Total | $ 4,107,928 | $ 3,667,794 |
From net realized gain | | |
Initial Class | $ 394,542 | $ 357,937 |
Service Class | 302,244 | 320,340 |
Service Class 2 | 2,210,785 | 2,237,440 |
Total | $ 2,907,571 | $ 2,915,717 |
Annual Report
6. Distributions to Shareholders - continued
Years ended December 31, | 2013 | 2012 |
VIP Freedom 2015 | | |
From net investment income | | |
Initial Class | $ 700,891 | $ 717,161 |
Service Class | 177,530 | 123,156 |
Service Class 2 | 925,690 | 1,049,605 |
Total | $ 1,804,111 | $ 1,889,922 |
From net realized gain | | |
Initial Class | $ 570,080 | $ 643,418 |
Service Class | 129,859 | 117,879 |
Service Class 2 | 918,372 | 1,038,210 |
Total | $ 1,618,311 | $ 1,799,507 |
VIP Freedom 2020 | | |
From net investment income | | |
Initial Class | $ 1,550,848 | $ 1,157,821 |
Service Class | 1,066,976 | 865,656 |
Service Class 2 | 8,656,572 | 9,191,892 |
Total | $ 11,274,396 | $ 11,215,369 |
From net realized gain | | |
Initial Class | $ 984,904 | $ 657,453 |
Service Class | 735,382 | 509,270 |
Service Class 2 | 7,490,422 | 5,889,311 |
Total | $ 9,210,708 | $ 7,056,034 |
VIP Freedom 2025 | | |
From net investment income | | |
Initial Class | $ 419,762 | $ 322,574 |
Service Class | 371,669 | 294,901 |
Service Class 2 | 712,359 | 519,975 |
Total | $ 1,503,790 | $ 1,137,450 |
From net realized gain | | |
Initial Class | $ 339,026 | $ 186,098 |
Service Class | 305,689 | 147,320 |
Service Class 2 | 644,681 | 346,222 |
Total | $ 1,289,396 | $ 679,640 |
VIP Freedom 2030 | | |
From net investment income | | |
Initial Class | $ 1,021,484 | $ 810,230 |
Service Class | 708,478 | 633,316 |
Service Class 2 | 1,830,778 | 1,755,990 |
Total | $ 3,560,740 | $ 3,199,536 |
From net realized gain | | |
Initial Class | $ 716,739 | $ 330,540 |
Service Class | 552,081 | 280,641 |
Service Class 2 | 1,621,814 | 755,100 |
Total | $ 2,890,634 | $ 1,366,281 |
VIP Freedom 2035 | | |
From net investment income | | |
Initial Class | $ 15,527 | $ 2,496 |
Service Class | 4,181 | 1,942 |
Service Class 2 | 60,912 | 14,646 |
Total | $ 80,620 | $ 19,084 |
From net realized gain | | |
Initial Class | $ 7,160 | $ 525 |
Service Class | 2,358 | 429 |
Service Class 2 | 32,371 | 3,310 |
Total | $ 41,889 | $ 4,264 |
Annual Report
Notes to Financial Statements - continued
6. Distributions to Shareholders - continued
Years ended December 31, | 2013 | 2012 |
VIP Freedom 2040 | | |
From net investment income | | |
Initial Class | $ 147,607 | $ 63,792 |
Service Class | 128,484 | 85,249 |
Service Class 2 | 36,930 | 10,008 |
Total | $ 313,021 | $ 159,049 |
From net realized gain | | |
Initial Class | $ 83,140 | $ 14,342 |
Service Class | 82,004 | 19,029 |
Service Class 2 | 21,517 | 2,337 |
Total | $ 186,661 | $ 35,708 |
VIP Freedom 2045 | | |
From net investment income | | |
Initial Class | $ 4,212 | $ 2,686 |
Service Class | 2,508 | 2,545 |
Service Class 2 | 35,791 | 8,953 |
Total | $ 42,511 | $ 14,184 |
From net realized gain | | |
Initial Class | $ 2,788 | $ 3,882 |
Service Class | 1,959 | 3,727 |
Service Class 2 | 22,900 | 7,563 |
Total | $ 27,647 | $ 15,172 |
VIP Freedom 2050 | | |
From net investment income | | |
Initial Class | $ 11,234 | $ 8,896 |
Service Class | 23,546 | 9,703 |
Service Class 2 | 18,708 | 7,264 |
Total | $ 53,488 | $ 25,863 |
From net realized gain | | |
Initial Class | $ 8,296 | $ 36,328 |
Service Class | 15,999 | 13,771 |
Service Class 2 | 14,861 | 23,907 |
Total | $ 39,156 | $ 74,006 |
7. Share Transactions.
Transactions for each class of shares were as follows:
| Shares | Dollars |
Years ended December 31, | 2013 | 2012 | 2013 | 2012 |
VIP Freedom Income | | | | |
Initial Class | | | | |
Shares sold | 697,498 | 506,250 | $ 7,508,739 | $ 5,321,423 |
Reinvestment of distributions | 35,816 | 36,517 | 387,348 | 384,187 |
Shares redeemed | (515,273) | (272,479) | (5,550,243) | (2,874,050) |
Net increase (decrease) | 218,041 | 270,288 | $ 2,345,844 | $ 2,831,560 |
Service Class | | | | |
Shares sold | 251,595 | 82,410 | $ 2,738,723 | $ 870,420 |
Reinvestment of distributions | 8,639 | 6,352 | 93,563 | 66,818 |
Shares redeemed | (77,622) | (100,761) | (837,256) | (1,053,819) |
Net increase (decrease) | 182,612 | (11,999) | $ 1,995,030 | $ (116,581) |
Service Class 2 | | | | |
Shares sold | 385,422 | 322,518 | $ 4,123,984 | $ 3,394,259 |
Reinvestment of distributions | 15,025 | 15,998 | 161,660 | 167,513 |
Shares redeemed | (325,641) | (481,884) | (3,483,171) | (5,045,135) |
Net increase (decrease) | 74,806 | (143,368) | $ 802,473 | $ (1,483,363) |
Annual Report
7. Share Transactions - continued
| Shares | Dollars |
Years ended December 31, | 2013 | 2012 | 2013 | 2012 |
VIP Freedom 2005 | | | | |
Initial Class | | | | |
Shares sold | 165,892 | 132,470 | $ 1,831,685 | $ 1,382,914 |
Reinvestment of distributions | 11,966 | 12,771 | 135,813 | 134,226 |
Shares redeemed | (114,913) | (109,991) | (1,264,764) | (1,139,278) |
Net increase (decrease) | 62,945 | 35,250 | $ 702,734 | $ 377,862 |
Service Class | | | | |
Shares sold | 117,100 | 9,826 | $ 1,267,819 | $ 102,541 |
Reinvestment of distributions | 139 | 370 | 1,583 | 3,888 |
Shares redeemed | (123,064) | (3,024) | (1,382,013) | (31,330) |
Net increase (decrease) | (5,825) | 7,172 | $ (112,611) | $ 75,099 |
Service Class 2 | | | | |
Shares sold | 6,220 | 8,838 | $ 67,155 | $ 92,263 |
Reinvestment of distributions | 146 | 487 | 1,655 | 5,116 |
Shares redeemed | (21,164) | (8,497) | (226,414) | (85,318) |
Net increase (decrease) | (14,798) | 828 | $ (157,604) | $ 12,061 |
VIP Freedom 2010 | | | | |
Initial Class | | | | |
Shares sold | 1,986,285 | 810,762 | $ 23,305,406 | $ 8,897,928 |
Reinvestment of distributions | 92,885 | 78,947 | 1,122,892 | 871,247 |
Shares redeemed | (924,715) | (599,458) | (10,962,841) | (6,576,629) |
Net increase (decrease) | 1,154,455 | 290,251 | $ 13,465,457 | $ 3,192,546 |
Service Class | | | | |
Shares sold | 699,448 | 600,572 | $ 8,320,948 | $ 6,665,476 |
Reinvestment of distributions | 60,386 | 66,530 | 724,788 | 733,016 |
Shares redeemed | (695,038) | (555,332) | (8,178,280) | (6,060,774) |
Net increase (decrease) | 64,796 | 111,770 | $ 867,456 | $ 1,337,718 |
Service Class 2 | | | | |
Shares sold | 2,966,063 | 2,733,936 | $ 34,666,277 | $ 29,882,425 |
Reinvestment of distributions | 432,321 | 453,521 | 5,167,819 | 4,979,248 |
Shares redeemed | (1,376,502) | (1,388,708) | (16,195,075) | (15,121,458) |
Net increase (decrease) | 2,021,882 | 1,798,749 | $ 23,639,021 | $ 19,740,215 |
VIP Freedom 2015 | | | | |
Initial Class | | | | |
Shares sold | 568,689 | 672,186 | $ 6,775,424 | $ 7,512,932 |
Reinvestment of distributions | 105,400 | 122,757 | 1,270,971 | 1,360,579 |
Shares redeemed | (618,401) | (1,290,134) | (7,345,257) | (14,331,975) |
Net increase (decrease) | 55,688 | (495,191) | $ 701,138 | $ (5,458,464) |
Service Class | | | | |
Shares sold | 452,049 | 381,833 | $ 5,363,465 | $ 4,217,950 |
Reinvestment of distributions | 25,438 | 21,773 | 307,389 | 241,035 |
Shares redeemed | (199,353) | (561,029) | (2,365,023) | (6,154,990) |
Net increase (decrease) | 278,134 | (157,423) | $ 3,305,831 | $ (1,696,005) |
Service Class 2 | | | | |
Shares sold | 970,192 | 973,937 | $ 11,406,266 | $ 10,760,312 |
Reinvestment of distributions | 154,189 | 189,185 | 1,844,062 | 2,087,815 |
Shares redeemed | (1,485,035) | (1,080,658) | (17,526,430) | (11,900,658) |
Net increase (decrease) | (360,654) | 82,464 | $ (4,276,102) | $ 947,469 |
Annual Report
Notes to Financial Statements - continued
7. Share Transactions - continued
| Shares | Dollars |
Years ended December 31, | 2013 | 2012 | 2013 | 2012 |
VIP Freedom 2020 | | | | |
Initial Class | | | | |
Shares sold | 3,463,224 | 1,647,927 | $ 40,977,645 | $ 18,136,371 |
Reinvestment of distributions | 205,810 | 163,724 | 2,535,752 | 1,815,274 |
Shares redeemed | (1,609,325) | (1,302,769) | (19,417,224) | (14,476,639) |
Net increase (decrease) | 2,059,709 | 508,882 | $ 24,096,173 | $ 5,475,006 |
Service Class | | | | |
Shares sold | 1,831,801 | 922,752 | $ 22,308,623 | $ 10,165,437 |
Reinvestment of distributions | 146,856 | 124,227 | 1,802,358 | 1,374,926 |
Shares redeemed | (834,633) | (568,382) | (10,018,305) | (6,216,861) |
Net increase (decrease) | 1,144,024 | 478,597 | $ 14,092,676 | $ 5,323,502 |
Service Class 2 | | | | |
Shares sold | 2,691,292 | 6,045,967 | $ 31,848,028 | $ 65,633,205 |
Reinvestment of distributions | 1,327,096 | 1,367,811 | 16,146,994 | 15,081,203 |
Shares redeemed | (4,169,480) | (2,763,924) | (49,822,706) | (30,408,681) |
Net increase (decrease) | (151,092) | 4,649,854 | $ (1,827,684) | $ 50,305,727 |
VIP Freedom 2025 | | | | |
Initial Class | | | | |
Shares sold | 533,264 | 233,426 | $ 6,515,651 | $ 2,546,455 |
Reinvestment of distributions | 60,269 | 46,086 | 758,788 | 508,672 |
Shares redeemed | (292,668) | (242,195) | (3,548,920) | (2,657,164) |
Net increase (decrease) | 300,865 | 37,317 | $ 3,725,519 | $ 397,963 |
Service Class | | | | |
Shares sold | 690,373 | 1,168,675 | $ 8,333,071 | $ 13,125,656 |
Reinvestment of distributions | 53,856 | 40,016 | 677,358 | 442,221 |
Shares redeemed | (545,603) | (442,575) | (6,597,340) | (4,814,177) |
Net increase (decrease) | 198,626 | 766,116 | $ 2,413,089 | $ 8,753,700 |
Service Class 2 | | | | |
Shares sold | 1,520,235 | 1,282,953 | $ 18,315,316 | $ 13,795,302 |
Reinvestment of distributions | 108,504 | 78,879 | 1,357,040 | 866,197 |
Shares redeemed | (1,004,998) | (991,383) | (12,141,138) | (10,870,675) |
Net increase (decrease) | 623,741 | 370,449 | $ 7,531,218 | $ 3,790,824 |
VIP Freedom 2030 | | | | |
Initial Class | | | | |
Shares sold | 2,155,912 | 898,656 | $ 25,300,188 | $ 9,463,981 |
Reinvestment of distributions | 139,570 | 106,281 | 1,738,223 | 1,140,770 |
Shares redeemed | (893,298) | (564,704) | (10,673,085) | (6,095,956) |
Net increase (decrease) | 1,402,184 | 440,233 | $ 16,365,326 | $ 4,508,795 |
Service Class | | | | |
Shares sold | 1,172,540 | 664,672 | $ 14,126,268 | $ 7,022,022 |
Reinvestment of distributions | 101,713 | 85,273 | 1,260,559 | 913,957 |
Shares redeemed | (591,435) | (736,616) | (6,983,113) | (7,785,898) |
Net increase (decrease) | 682,818 | 13,329 | $ 8,403,714 | $ 150,081 |
Service Class 2 | | | | |
Shares sold | 2,956,366 | 3,362,116 | $ 34,718,018 | $ 35,481,817 |
Reinvestment of distributions | 280,405 | 234,938 | 3,452,592 | 2,511,089 |
Shares redeemed | (1,630,902) | (1,056,441) | (19,428,221) | (11,181,931) |
Net increase (decrease) | 1,605,869 | 2,540,613 | $ 18,742,389 | $ 26,810,975 |
Annual Report
7. Share Transactions - continued
| Shares | Dollars |
Years ended December 31, | 2013 | 2012 | 2013 | 2012 |
VIP Freedom 2035 | | | | |
Initial Class | | | | |
Shares sold | 47,066 | 1,405 | $ 891,578 | $ 20,852 |
Reinvestment of distributions | 1,196 | 194 | 22,687 | 3,021 |
Shares redeemed | (1,381) | (489) | (25,376) | (7,420) |
Net increase (decrease) | 46,881 | 1,110 | $ 888,889 | $ 16,453 |
Service Class | | | | |
Shares sold | 8,593 | - | $ 160,540 | $ - |
Reinvestment of distributions | 348 | 152 | 6,539 | 2,370 |
Shares redeemed | (491) | - | (9,338) | - |
Net increase (decrease) | 8,450 | 152 | $ 157,741 | $ 2,370 |
Service Class 2 | | | | |
Shares sold | 199,956 | 36,092 | $ 3,604,089 | $ 555,796 |
Reinvestment of distributions | 4,955 | 1,155 | 93,283 | 17,956 |
Shares redeemed | (24,585) | (5,852) | (425,031) | (85,650) |
Net increase (decrease) | 180,326 | 31,395 | $ 3,272,341 | $ 488,102 |
VIP Freedom 2040 | | | | |
Initial Class | | | | |
Shares sold | 435,007 | 190,414 | $ 7,354,319 | $ 2,787,250 |
Reinvestment of distributions | 12,798 | 5,266 | 230,747 | 78,134 |
Shares redeemed | (112,620) | (90,035) | (1,962,464) | (1,291,491) |
Net increase (decrease) | 335,185 | 105,645 | $ 5,622,602 | $ 1,573,893 |
Service Class | | | | |
Shares sold | 294,776 | 269,625 | $ 5,055,998 | $ 3,978,915 |
Reinvestment of distributions | 11,747 | 7,029 | 210,488 | 104,277 |
Shares redeemed | (117,657) | (50,822) | (1,988,868) | (731,927) |
Net increase (decrease) | 188,866 | 225,832 | $ 3,277,618 | $ 3,351,265 |
Service Class 2 | | | | |
Shares sold | 136,223 | 29,964 | $ 2,328,951 | $ 436,786 |
Reinvestment of distributions | 3,242 | 833 | 58,447 | 12,345 |
Shares redeemed | (24,335) | (2,501) | (407,521) | (37,142) |
Net increase (decrease) | 115,130 | 28,296 | $ 1,979,877 | $ 411,989 |
VIP Freedom 2045 | | | | |
Initial Class | | | | |
Shares sold | 6,906 | 1,911 | $ 122,766 | $ 27,316 |
Reinvestment of distributions | 392 | 458 | 7,000 | 6,568 |
Shares redeemed | (1,526) | (288) | (26,776) | (4,149) |
Net increase (decrease) | 5,772 | 2,081 | $ 102,990 | $ 29,735 |
Service Class | | | | |
Shares sold | 3,786 | 1,905 | $ 63,342 | $ 28,391 |
Reinvestment of distributions | 252 | 437 | 4,467 | 6,272 |
Shares redeemed | (3,755) | (64) | (64,325) | (965) |
Net increase (decrease) | 283 | 2,278 | $ 3,484 | $ 33,698 |
Service Class 2 | | | | |
Shares sold | 128,955 | 25,555 | $ 2,192,890 | $ 366,613 |
Reinvestment of distributions | 3,277 | 1,144 | 58,691 | 16,516 |
Shares redeemed | (27,505) | (4,594) | (457,919) | (66,218) |
Net increase (decrease) | 104,727 | 22,105 | $ 1,793,662 | $ 316,911 |
Annual Report
Notes to Financial Statements - continued
7. Share Transactions - continued
| Shares | Dollars |
Years ended December 31, | 2013 | 2012 | 2013 | 2012 |
VIP Freedom 2050 | | | | |
Initial Class | | | | |
Shares sold | 31,847 | 19,347 | $ 481,158 | $ 252,461 |
Reinvestment of distributions | 1,205 | 3,546 | 19,530 | 45,224 |
Shares redeemed | (12,779) | (8,948) | (195,189) | (117,392) |
Net increase (decrease) | 20,273 | 13,945 | $ 305,499 | $ 180,293 |
Service Class | | | | |
Shares sold | 130,257 | 28,158 | $ 2,105,119 | $ 377,910 |
Reinvestment of distributions | 2,422 | 1,818 | 39,545 | 23,474 |
Shares redeemed | (54,776) | (274) | (856,642) | (3,695) |
Net increase (decrease) | 77,903 | 29,702 | $ 1,288,022 | $ 397,689 |
Service Class 2 | | | | |
Shares sold | 85,642 | 17,914 | $ 1,291,392 | $ 233,914 |
Reinvestment of distributions | 2,070 | 2,441 | 33,569 | 31,171 |
Shares redeemed | (15,920) | (3,452) | (248,220) | (45,409) |
Net increase (decrease) | 71,792 | 16,903 | $ 1,076,741 | $ 219,676 |
8. Other.
The Funds' organizational documents provide former and current trustees and officers with a limited indemnification against liabilities arising in connection with the performance of their duties to the Funds. In the normal course of business, the Funds may also enter into contracts that provide general indemnifications. The Funds' maximum exposure under these arrangements is unknown as this would be dependent on future claims that may be made against the Funds. The risk of material loss from such claims is considered remote.
The Funds do not invest in the Underlying Funds for the purpose of exercising management or control; however, investments by the Funds within their principal investment strategies may represent a significant portion of the Underlying Fund's net assets. At the end of the period, the following VIP Freedom Portfolios were the owners of record of 10% or more of the total outstanding shares of the Underlying Funds.
Fund | VIP Freedom 2020 |
VIP Emerging Markets Portfolio | 21% |
VIP Value Portfolio | 19% |
The Funds, in aggregate, were the owners of record of more than 20% of the total outstanding shares of the following Underlying Funds.
Fund | % of shares held |
VIP Emerging Markets Portfolio | 46% |
VIP Value Portfolio | 40% |
In addition, at the end of the period, the investment adviser or its affiliates and certain otherwise unaffiliated shareholders were owners of record of more than 10% of the outstanding shares of the following funds:
| Affiliated % | Number of
Unaffiliated
Shareholders | Unaffiliated
Shareholders % |
VIP Freedom Income | 54 | 1 | 14 |
VIP Freedom 2005 | 96 | - | - |
VIP Freedom 2010 | - | 1 | 76 |
VIP Freedom 2015 | 30 | 1 | 24 |
VIP Freedom 2020 | - | 1 | 73 |
VIP Freedom 2025 | 19 | 3 | 61 |
Annual Report
8. Other - continued
| Affiliated % | Number of
Unaffiliated
Shareholders | Unaffiliated
Shareholders % |
VIP Freedom 2030 | - | 3 | 69 |
VIP Freedom 2035 | - | 3 | 78 |
VIP Freedom 2040 | - | 3 | 86 |
VIP Freedom 2045 | - | 2 | 80 |
VIP Freedom 2050 | - | 4 | 91 |
Annual Report
Report of Independent Registered Public Accounting Firm
To the Trustees of Variable Insurance Products V and the Shareholders of VIP Freedom Income Portfolio, VIP Freedom 2005 Portfolio, VIP Freedom 2010 Portfolio, VIP Freedom 2015 Portfolio, VIP Freedom 2020 Portfolio, VIP Freedom 2025 Portfolio, VIP Freedom 2030 Portfolio, VIP Freedom 2035 Portfolio, VIP Freedom 2040 Portfolio, VIP Freedom 2045 Portfolio and VIP Freedom 2050 Portfolio:
We have audited the accompanying statements of assets and liabilities of VIP Freedom Income Portfolio, VIP Freedom 2005 Portfolio, VIP Freedom 2010 Portfolio, VIP Freedom 2015 Portfolio, VIP Freedom 2020 Portfolio, VIP Freedom 2025 Portfolio, VIP Freedom 2030 Portfolio, VIP Freedom 2035 Portfolio, VIP Freedom 2040 Portfolio, VIP Freedom 2045 Portfolio and VIP Freedom 2050 Portfolio (the Funds), each a fund of the Variable Insurance Products V, including the schedules of investments, as of December 31, 2013, and the related statements of operations for the year then ended, the statements of changes in net assets for each of the two years in the period then ended, and the financial highlights for each of the five years in the period then ended. These financial statements and financial highlights are the responsibility of the Funds' management. Our responsibility is to express an opinion on these financial statements and financial highlights based on our audits.
We conducted our audits in accordance with the standards of the Public Company Accounting Oversight Board (United States). Those standards require that we plan and perform the audit to obtain reasonable assurance about whether the financial statements and financial highlights are free of material misstatement. The Funds are not required to have, nor were we engaged to perform, an audit of their internal control over financial reporting. Our audits included consideration of internal control over financial reporting as a basis for designing audit procedures that are appropriate in the circumstances, but not for the purpose of expressing an opinion on the effectiveness of the Funds' internal control over financial reporting. Accordingly, we express no such opinion. An audit also includes examining, on a test basis, evidence supporting the amounts and disclosures in the financial statements, assessing the accounting principles used and significant estimates made by management, as well as evaluating the overall financial statement presentation. Our procedures included confirmation of securities owned as of December 31, 2013, by correspondence with the custodians. We believe that our audits provide a reasonable basis for our opinion.
In our opinion, the financial statements and financial highlights referred to above present fairly, in all material respects, the financial position of VIP Freedom Income Portfolio, VIP Freedom 2005 Portfolio, VIP Freedom 2010 Portfolio, VIP Freedom 2015 Portfolio, VIP Freedom 2020 Portfolio, VIP Freedom 2025 Portfolio, VIP Freedom 2030 Portfolio, VIP Freedom 2035 Portfolio, VIP Freedom 2040 Portfolio, VIP Freedom 2045 Portfolio and VIP Freedom 2050 Portfolio as of December 31, 2013, the results of their operations for the year then ended, the changes in their net assets for each of the two years in the period then ended, and the financial highlights for each of the five years in the period then ended, in conformity with accounting principles generally accepted in the United States of America.
DELOITTE & TOUCHE LLP
Boston, Massachusetts
February 20, 2014
Annual Report
The Trustees and officers of the trust and funds, as applicable, are listed below. The Board of Trustees governs each VIP Freedom Portfolio and is responsible for protecting the interests of shareholders. The Trustees are experienced executives who meet periodically throughout the year to oversee each VIP Freedom Portfolio's activities, review contractual arrangements with companies that provide services to each VIP Freedom Portfolio, oversee management of the risks associated with such activities and contractual arrangements, and review each VIP Freedom Portfolio's performance. If the interests of a VIP Freedom Portfolio and an underlying Fidelity fund were to diverge, a conflict of interest could arise and affect how the Trustees fulfill their fiduciary duties to the affected funds. Strategic Advisers has structured the VIP Freedom Portfolio to avoid these potential conflicts, although there may be situations where a conflict of interest is unavoidable. In such instances, Strategic Advisers and the Trustees would take reasonable steps to minimize and, if possible, eliminate the conflict. Except for Elizabeth A. Acton and James C. Curvey, each of the Trustees oversees 223 funds. Ms. Acton oversees 205 funds. Mr. Curvey oversees 396 funds.
The Trustees hold office without limit in time except that (a) any Trustee may resign; (b) any Trustee may be removed by written instrument, signed by at least two-thirds of the number of Trustees prior to such removal; (c) any Trustee who requests to be retired or who has become incapacitated by illness or injury may be retired by written instrument signed by a majority of the other Trustees; and (d) any Trustee may be removed at any special meeting of shareholders by a two-thirds vote of the outstanding voting securities of the trust. Each Trustee who is not an interested person (as defined in the 1940 Act) of the trust and the funds (Independent Trustee), shall retire not later than the last day of the month in which his or her 75th birthday occurs. The Independent Trustees may waive this mandatory retirement age policy with respect to individual Trustees. The officers hold office without limit in time, except that any officer may resign or may be removed by a vote of a majority of the Trustees at any regular meeting or any special meeting of the Trustees. Except as indicated, each individual has held the office shown or other offices in the same company for the past five years.
Experience, Skills, Attributes, and Qualifications of the Funds' Trustees. The Governance and Nominating Committee has adopted a statement of policy that describes the experience, qualifications, attributes, and skills that are necessary and desirable for potential Independent Trustee candidates (Statement of Policy). The Board believes that each Trustee satisfied at the time he or she was initially elected or appointed a Trustee, and continues to satisfy, the standards contemplated by the Statement of Policy. The Governance and Nominating Committee also engages professional search firms to help identify potential Independent Trustee candidates who have the experience, qualifications, attributes, and skills consistent with the Statement of Policy. From time to time, additional criteria based on the composition and skills of the current Independent Trustees, as well as experience or skills that may be appropriate in light of future changes to board composition, business conditions, and regulatory or other developments, have also been considered by the professional search firms and the Governance and Nominating Committee. In addition, the Board takes into account the Trustees' commitment and participation in Board and committee meetings, as well as their leadership of standing and ad hoc committees throughout their tenure.
In determining that a particular Trustee was and continues to be qualified to serve as a Trustee, the Board has considered a variety of criteria, none of which, in isolation, was controlling. The Board believes that, collectively, the Trustees have balanced and diverse experience, qualifications, attributes, and skills, which allow the Board to operate effectively in governing each fund and protecting the interests of shareholders. Information about the specific experience, skills, attributes, and qualifications of each Trustee, which in each case led to the Board's conclusion that the Trustee should serve (or continue to serve) as a trustee of the funds, is provided below.
Board Structure and Oversight Function. Abigail P. Johnson is an interested person (as defined in the 1940 Act) and currently serves as Chairman. The Trustees have determined that an interested Chairman is appropriate and benefits shareholders because an interested Chairman has a personal and professional stake in the quality and continuity of services provided to the funds. Independent Trustees exercise their informed business judgment to appoint an individual of their choosing to serve as Chairman, regardless of whether the Trustee happens to be independent or a member of management. The Independent Trustees have determined that they can act independently and effectively without having an Independent Trustee serve as Chairman and that a key structural component for assuring that they are in a position to do so is for the Independent Trustees to constitute a substantial majority for the Board. The Independent Trustees also regularly meet in executive session. Albert R. Gamper, Jr. serves as Chairman of the Independent Trustees and as such (i) acts as a liaison between the Independent Trustees and management with respect to matters important to the Independent Trustees and (ii) with management prepares agendas for Board meetings.
Fidelity funds are overseen by different Boards of Trustees. The funds' Board oversees Fidelity's investment-grade bond, money market, and asset allocation funds and another Board oversees Fidelity's equity and high income funds. The asset allocation funds may invest in Fidelity funds that are overseen by such other Board. The use of separate Boards, each with its own committee structure, allows the Trustees of each group of Fidelity funds to focus on the unique issues of the funds they oversee, including common research, investment, and operational issues. On occasion, the separate Boards establish joint committees to address issues of overlapping consequences for the Fidelity funds overseen by each Board.
The Trustees operate using a system of committees to facilitate the timely and efficient consideration of all matters of importance to the Trustees, each fund, and fund shareholders and to facilitate compliance with legal and regulatory requirements and oversight of the funds' activities and associated risks. The Board, acting through its committees, has charged FMR and its affiliates with (i) identifying events or circumstances the occurrence of which could have demonstrably adverse effects on the funds' business and/or reputation; (ii) implementing processes and controls to lessen the possibility that such events or circumstances occur or to mitigate the effects of such events or circumstances if they do occur; and (iii) creating and maintaining a system designed to evaluate continuously business and market conditions in order to facilitate the identification and implementation processes described in (i) and (ii) above. Because the day-to-day operations and activities of the funds are carried out by or through FMR, its affiliates, and other service providers, the funds' exposure to risks is mitigated but not eliminated by the processes overseen by the Trustees. While each of the Board's committees has responsibility for overseeing different aspects of the funds' activities, oversight is exercised primarily through the Operations and Audit Committees. In addition, an ad hoc Board committee of Independent Trustees has worked with FMR to enhance the Board's oversight of investment and financial risks, legal and regulatory risks, technology risks, and operational risks, including the development of additional risk reporting to the Board. Appropriate personnel, including but not limited to the funds' Chief Compliance Officer (CCO), FMR's internal auditor, the independent accountants, the funds' Treasurer and portfolio management personnel, make periodic reports to the Board's committees, as appropriate, including an annual review of FMR's risk management program for the Fidelity funds. The responsibilities of each standing committee, including their oversight responsibilities, are described further under "Standing Committees of the Funds' Trustees."
Annual Report
The funds' Statement of Additional Information (SAI) includes more information about the Trustees. To request a free copy, call Fidelity at 1-877-208-0098.
Interested Trustees*:
Correspondence intended for each Trustee who is an interested person may be sent to Fidelity Investments, 245 Summer Street, Boston, Massachusetts 02210.
Name, Year of Birth; Principal Occupations and Other Relevant Experience+ |
James C. Curvey (1935) |
Year of Election or Appointment: 2007 Trustee |
| Mr. Curvey also serves as Trustee of other Fidelity funds. Mr. Curvey is a Director of Fidelity Investments Money Management, Inc. (2009-present), Director of Fidelity Research & Analysis Co. (2009-present) and Director of FMR and FMR Co., Inc. (2007-present). Mr. Curvey is also Vice Chairman (2007-present) and Director of FMR LLC. In addition, Mr. Curvey serves as an Overseer for the Boston Symphony Orchestra and a member of the Trustees of Villanova University. Previously, Mr. Curvey was the Vice Chairman (2006-2007) and Director (2000-2007) of FMR Corp. |
Abigail P. Johnson (1961) |
Year of Election or Appointment: 2009 Trustee Chairman of the Board of Trustees |
| Ms. Johnson also serves as Trustee of other Fidelity funds. Ms. Johnson serves as President of FMR LLC (2013-present), President of Fidelity Financial Services (2012-present) and President of Personal, Workplace and Institutional Services (2005-present). Ms. Johnson is Chairman and Director of FMR Co., Inc. (2011-present), Chairman and Director of FMR (2011-present), and the Vice Chairman and Director (2007-present) of FMR LLC. Previously, Ms. Johnson served as President and a Director of FMR (2001-2005), a Trustee of other investment companies advised by FMR, Fidelity Investments Money Management, Inc., and FMR Co., Inc. (2001-2005), Senior Vice President of the Fidelity funds (2001-2005), and managed a number of Fidelity funds. Ms. Abigail P. Johnson and Mr. Arthur E. Johnson are not related. |
* Trustees have been determined to be "Interested Trustees" by virtue of, among other things, their affiliation with the trust or various entities under common control with FMR.
+ The information above includes each Trustee's principal occupation during the last five years and other information relating to the experience, attributes, and skills relevant to each Trustee's qualifications to serve as a Trustee, which led to the conclusion that each Trustee should serve as a Trustee for each fund.
Independent Trustees:
Correspondence intended for each Independent Trustee (that is, the Trustees other than the Interested Trustees) may be sent to Fidelity Investments, P.O. Box 55235, Boston, Massachusetts 02205-5235.
Name, Year of Birth; Principal Occupations and Other Relevant Experience+ |
Elizabeth S. Acton (1951) |
Year of Election or Appointment: 2013 Trustee |
| Ms. Acton also serves as Trustee or Member of the Advisory Board of other Fidelity funds. Prior to her retirement in April 2012, Ms. Acton was Executive Vice President, Finance (2011-2012), Executive Vice President, Chief Financial Officer (2002-2011), and Treasurer (2004-2005) of Comerica Incorporated (financial services). Prior to joining Comerica, Ms. Acton held a variety of positions at Ford Motor Company (1983-2002), including Vice President and Treasurer (2000-2002) and Executive Vice President and Chief Financial Officer of Ford Motor Credit Company (1998-2000). Ms. Acton currently serves as a member of the Board of Directors and Audit and Finance Committees of Beazer Homes USA, Inc. (homebuilding, 2012-present). |
Albert R. Gamper, Jr. (1942) |
Year of Election or Appointment: 2006 Trustee Chairman of the Independent Trustees |
| Mr. Gamper also serves as Trustee of other Fidelity funds. Prior to his retirement in December 2004, Mr. Gamper served as Chairman of the Board of CIT Group Inc. (commercial finance). During his tenure with CIT Group Inc. Mr. Gamper served in numerous senior management positions, including Chairman (1987-1989; 1999-2001; 2002-2004), Chief Executive Officer (1987-2004), and President (2002-2003). Mr. Gamper currently serves as a member of the Board of Directors of Public Service Enterprise Group (utilities, 2000-present), a member of the Board of Trustees, Rutgers University (2004-present), and Chairman of the Board of Barnabas Health Care System. Previously, Mr. Gamper served as Vice Chairman of the Independent Trustees of certain Fidelity funds (2011-2012) and as Chairman of the Board of Governors, Rutgers University (2004-2007). |
Robert F. Gartland (1951) |
Year of Election or Appointment: 2010 Trustee |
| Mr. Gartland also serves as Trustee of other Fidelity funds. Mr. Gartland is Chairman and an investor in Gartland and Mellina Group Corp. (consulting, 2009-present). Previously, Mr. Gartland served as a partner and investor of Vietnam Partners LLC (investments and consulting, 2008-2011). Prior to his retirement, Mr. Gartland held a variety of positions at Morgan Stanley (financial services, 1979-2007) including Managing Director (1987-2007). |
Arthur E. Johnson (1947) |
Year of Election or Appointment: 2008 Trustee |
| Mr. Johnson also serves as Trustee of other Fidelity funds. Mr. Johnson serves as a member of the Board of Directors of Eaton Corporation (diversified power management, 2009-present), AGL Resources, Inc. (holding company, 2002-present) and Booz Allen Hamilton (management consulting, 2011-present). Prior to his retirement, Mr. Johnson served as Senior Vice President of Corporate Strategic Development of Lockheed Martin Corporation (defense contractor, 1999-2009). He previously served on the Board of Directors of IKON Office Solutions, Inc. (1999-2008) and Delta Airlines (2005-2007). Mr. Arthur E. Johnson is not related to Ms. Abigail P. Johnson. |
Michael E. Kenneally (1954) |
Year of Election or Appointment: 2009 Trustee |
| Mr. Kenneally also serves as Trustee of other Fidelity funds. Mr. Kenneally served as a Member of the Advisory Board for certain Fidelity funds before joining the Board of Trustees (2008-2009). Prior to his retirement, Mr. Kenneally served as Chairman and Global Chief Executive Officer of Credit Suisse Asset Management. Before joining Credit Suisse, he was an Executive Vice President and Chief Investment Officer for Bank of America Corporation. Earlier roles at Bank of America included Director of Research, Senior Portfolio Manager and Research Analyst, and Mr. Kenneally was awarded the Chartered Financial Analyst (CFA) designation in 1991. |
James H. Keyes (1940) |
Year of Election or Appointment: 2007 Trustee |
| Mr. Keyes also serves as Trustee of other Fidelity funds. Mr. Keyes serves as a member of the Board and Non-Executive Chairman of Navistar International Corporation (manufacture and sale of trucks, buses, and diesel engines, since 2002). Previously, Mr. Keyes served as a member of the Board of Pitney Bowes, Inc. (integrated mail, messaging, and document management solutions, 1998-2013). Prior to his retirement, Mr. Keyes served as Chairman (1993-2002) and Chief Executive Officer (1988-2002) of Johnson Controls (automotive, building, and energy) and as a member of the Board of LSI Logic Corporation (semiconductor technologies, 1984-2008). |
Marie L. Knowles (1946) |
Year of Election or Appointment: 2001 Trustee Vice Chairman of the Independent Trustees |
| Ms. Knowles also serves as Trustee of other Fidelity funds. Prior to Ms. Knowles' retirement in June 2000, she served as Executive Vice President and Chief Financial Officer of Atlantic Richfield Company (ARCO) (diversified energy, 1996-2000). From 1993 to 1996, she was a Senior Vice President of ARCO and President of ARCO Transportation Company. She served as a Director of ARCO from 1996 to 1998. Ms. Knowles currently serves as a Director and Chairman of the Audit Committee of McKesson Corporation (healthcare service, since 2002). Ms. Knowles is a member of the Board of the Catalina Island Conservancy and of the Santa Catalina Island Company (2009-present). She also serves as a member of the Advisory Board for the School of Engineering of the University of Southern California. Previously, Ms. Knowles served as a Director of Phelps Dodge Corporation (copper mining and manufacturing, 1994-2007), URS Corporation (engineering and construction, 2000-2003) and America West (airline, 1999-2002). |
Kenneth L. Wolfe (1939) |
Year of Election or Appointment: 2005 Trustee |
| Mr. Wolfe also serves as Trustee of other Fidelity funds. Prior to his retirement, Mr. Wolfe served as Chairman and a Director (2007-2009) and Chairman and Chief Executive Officer (1994-2001) of Hershey Foods Corporation. He also served as a member of the Boards of Adelphia Communications Corporation (telecommunications, 2003-2006), Bausch & Lomb, Inc. (medical/pharmaceutical, 1993-2007), and Revlon, Inc. (personal care products, 2004-2009). Mr. Wolfe previously served as Chairman of the Independent Trustees of other Fidelity funds (2008-2012). |
+ The information above includes each Trustee's principal occupation during the last five years and other information relating to the experience, attributes, and skills relevant to each Trustee's qualifications to serve as a Trustee, which led to the conclusion that each Trustee should serve as a Trustee for each fund.
Officers:
Correspondence intended for each officer may be sent to Fidelity Investments, 245 Summer Street, Boston, Massachusetts 02210. Officers appear below in alphabetical order.
Name, Year of Birth; Principal Occupation |
Elizabeth Paige Baumann (1968) |
Year of Election or Appointment: 2012 Anti-Money Laundering (AML) Officer |
| Ms. Baumann also serves as AML Officer of other funds. She is Chief AML Officer of FMR LLC (2012-present) and is an employee of Fidelity Investments. Previously, Ms. Baumann served as Vice President and Deputy Anti-Money Laundering Officer (2007-2012). |
Marc Bryant (1966) |
Year of Election or Appointment: 2013 Assistant Secretary |
| Mr. Bryant also serves as an officer of other funds. He is Senior Vice President and Deputy General Counsel of FMR LLC. Prior to joining Fidelity Investments, Mr. Bryant served as a Senior Vice President and the Head of Global Retail Legal for AllianceBernstein L.P. (2006-2010), and as the General Counsel for ProFund Advisors LLC (2001-2006). |
Jonathan Davis (1968) |
Year of Election or Appointment: 2010 Assistant Treasurer |
| Mr. Davis also serves as Assistant Treasurer of other funds. Mr. Davis is an employee of Fidelity Investments. Previously, Mr. Davis served as Vice President and Associate General Counsel of FMR LLC (2003-2010). |
Adrien E. Deberghes (1967) |
Year of Election or Appointment: 2010 Assistant Treasurer |
| Mr. Deberghes also serves as an officer of other funds. He is an employee of Fidelity Investments (2008-present). Prior to joining Fidelity Investments, Mr. Deberghes was Senior Vice President of Mutual Fund Administration at State Street Corporation (2007-2008), Senior Director of Mutual Fund Administration at Investors Bank & Trust (2005-2007), and Director of Finance for Dunkin' Brands (2000-2005). |
Stephanie J. Dorsey (1969) |
Year of Election or Appointment: 2013 President and Treasurer |
| Ms. Dorsey also serves as an officer of other funds. She is an employee of Fidelity Investments (2008-present) and has served in other fund officer roles. Prior to joining Fidelity Investments, Ms. Dorsey served as Treasurer (2004-2008) of the JPMorgan Mutual Funds and Vice President (2004-2008) of JPMorgan Chase Bank. |
Scott C. Goebel (1968) |
Year of Election or Appointment: 2008 Secretary and Chief Legal Officer (CLO) |
| Mr. Goebel serves as Secretary and CLO of other funds. Mr. Goebel also serves as Secretary of Fidelity Investments Money Management, Inc. (FIMM) (2010-present) and Fidelity Research and Analysis Company (FRAC) (2010-present); General Counsel, Secretary, and Senior Vice President of FMR (2008-present) and FMR Co., Inc. (2008-present); Chief Legal Officer of Fidelity Management & Research (Hong Kong) Limited (2008-present) and Assistant Secretary of Fidelity Management & Research (Japan) Inc. (2008-present), and Fidelity Management & Research (U.K.) Inc. (2008-present). Previously, Mr. Goebel served as Secretary and CLO of other Fidelity funds (2008-2013), Assistant Secretary of FIMM (2008-2010), FRAC (2008-2010), and certain funds (2007-2008); and as Vice President and Secretary of Fidelity Distributors Corporation (FDC) (2005-2007). Mr. Goebel has been employed by FMR LLC or an affiliate since 2001. |
Bruce T. Herring (1965) |
Year of Election or Appointment: 2013 Vice President of Fidelity's Asset Allocation Funds |
| Mr. Herring also serves as Vice President of other funds. He serves as Chief Investment Officer of Fidelity Global Asset Allocation (GAA) (2013-present), Group Chief Investment Officer of FMR, and President of Fidelity Research & Analysis Company (2010-present). Previously, Mr. Herring served as Chief Investment Officer and Director of Fidelity Management & Research (U.K.) Inc. (2010-2013), Vice President (2005-2006) and Senior Vice President (2006-2007) of Fidelity Management & Research Company, Vice President of FMR Co., Inc. (2001-2007), and as a portfolio manager for Fidelity U.S. Equity Funds. |
Chris Maher (1972) |
Year of Election or Appointment: 2013 Assistant Treasurer |
| Mr. Maher serves as Assistant Treasurer of other funds. Mr. Maher is Vice President of Valuation Oversight and is an employee of Fidelity Investments. Previously, Mr. Maher served as Vice President of Asset Management Compliance (2013), Vice President of FMR's Program Management Group (2010-2013), and Vice President of Valuation Oversight (2008-2010). |
Charles S. Morrison (1960) |
Year of Election or Appointment: 2012 Vice President |
| Mr. Morrison also serves as Vice President of other funds. He serves as President, Fixed Income and is an employee of Fidelity Investments. Previously, Mr. Morrison served as Vice President of Fidelity's Money Market Funds (2005-2009), President, Money Market Group Leader of FMR (2009), and Senior Vice President, Money Market Group of FMR (2004-2009). Mr. Morrison also served as Vice President of Fidelity's Bond Funds (2002-2005), certain Balanced Funds (2002-2005), and certain Asset Allocation Funds (2002-2007), and as Senior Vice President (2002-2005) of Fidelity's Fixed Income Division. |
Christine Reynolds (1958) |
Year of Election or Appointment: 2008 Chief Financial Officer |
| Ms. Reynolds also serves as Chief Financial Officer of other funds. Ms. Reynolds became President of Fidelity Pricing and Cash Management Services (FPCMS) in August 2008. Ms. Reynolds served as Chief Operating Officer of FPCMS (2007-2008). Previously, Ms. Reynolds served as President, Treasurer, and Anti-Money Laundering officer of the Fidelity funds (2004-2007). |
Kenneth B. Robins (1969) |
Year of Election or Appointment: 2009 Assistant Treasurer |
| Mr. Robins also serves as an officer of other funds. Mr. Robins serves as Executive Vice President of Fidelity Investments Money Management, Inc. (FIMM) (2013-present) and is an employee of Fidelity Investments (2004-present). Previously, Mr. Robins served in other fund officer roles. |
Gary W. Ryan (1958) |
Year of Election or Appointment: 2005 Assistant Treasurer |
| Mr. Ryan also serves as Assistant Treasurer of other funds. Mr. Ryan is an employee of Fidelity Investments and has served in other fund officer roles. Previously, Mr. Ryan served as Vice President of Fund Reporting in Fidelity Pricing and Cash Management Services (FPCMS) (1999-2005). |
Stephen Sadoski (1971) |
Year of Election or Appointment: 2013 Deputy Treasurer |
| Mr. Sadoski also serves as Deputy Treasurer of other funds. He is an employee of Fidelity Investments (2012-present) and has served in another fund officer role. Prior to joining Fidelity Investments, Mr. Sadoski served as an assistant chief accountant in the Division of Investment Management of the Securities and Exchange Commission (SEC) (2009-2012) and as a senior manager at Deloitte & Touche LLP (1997-2009). |
Stacie M. Smith (1974) |
Year of Election or Appointment: 2013 Assistant Treasurer |
| Ms. Smith also serves as an officer of other funds. She is an employee of Fidelity Investments (2009-present) and has served in other fund officer roles. Prior to joining Fidelity Investments, Ms. Smith served as Senior Audit Manager of Ernst & Young LLP (1996-2009). |
Renee Stagnone (1975) |
Year of Election or Appointment: 2013 Deputy Treasurer |
| Ms. Stagnone also serves as Deputy Treasurer of other funds. Ms. Stagnone is an employee of Fidelity Investments. |
Michael H. Whitaker (1967) |
Year of Election or Appointment: 2008 Chief Compliance Officer |
| Mr. Whitaker also serves as Chief Compliance Officer of other funds. Mr. Whitaker is an employee of Fidelity Investments (2007-present). Prior to joining Fidelity Investments, Mr. Whitaker worked at MFS Investment Management where he served as Senior Vice President and Chief Compliance Officer (2004-2006), and Assistant General Counsel. |
Derek L. Young (1964) |
Year of Election or Appointment: 2009 Vice President of Fidelity's Asset Allocation Funds |
| Mr. Young also serves as Trustee or an officer of other funds. He is President and a Director of Strategic Advisers, Inc. (2011-present), President of Fidelity Global Asset Allocation (GAA) (2011-present), and Vice Chairman of Pyramis Global Advisors, LLC (2011-present). Previously, Mr. Young served as Chief Investment Officer of GAA (2009-2011) and as a portfolio manager. |
Joseph F. Zambello (1957) |
Year of Election or Appointment: 2011 Deputy Treasurer |
| Mr. Zambello also serves as Deputy Treasurer of other funds. Mr. Zambello is an employee of Fidelity Investments. Previously, Mr. Zambello served as Vice President of FMR's Program Management Group (2009-2011) and Vice President of the Transfer Agent Oversight Group (2005-2009). |
Annual Report
The Board of Trustees of each portfolio voted to pay to shareholders of record at the opening of business on record date, the following distributions per share derived from capital gains realized from sales of portfolio securities:
| Pay Date | Record Date | Capital Gains |
VIP Freedom Income Portfolio | | | |
Initial Class | 02/14/2014 | 02/14/2014 | $0.081 |
Service Class | 02/14/2014 | 02/14/2014 | $0.081 |
Service Class 2 | 02/14/2014 | 02/14/2014 | $0.081 |
VIP Freedom 2005 Portfolio | | | |
Initial Class | 02/14/2014 | 02/14/2014 | $0.074 |
Service Class | 02/14/2014 | 02/14/2014 | $0.074 |
Service Class 2 | 02/14/2014 | 02/14/2014 | $0.074 |
VIP Freedom 2010 Portfolio | | | |
Initial Class | 02/14/2014 | 02/14/2014 | $0.150 |
Service Class | 02/14/2014 | 02/14/2014 | $0.150 |
Service Class 2 | 02/14/2014 | 02/14/2014 | $0.150 |
VIP Freedom 2015 Portfolio | | | |
Initial Class | 02/14/2014 | 02/14/2014 | $0.159 |
Service Class | 02/14/2014 | 02/14/2014 | $0.159 |
Service Class 2 | 02/14/2014 | 02/14/2014 | $0.159 |
VIP Freedom 2020 Portfolio | | | |
Initial Class | 02/14/2014 | 02/14/2014 | $0.162 |
Service Class | 02/14/2014 | 02/14/2014 | $0.162 |
Service Class 2 | 02/14/2014 | 02/14/2014 | $0.162 |
VIP Freedom 2025 Portfolio | | | |
Initial Class | 02/14/2014 | 02/14/2014 | $0.154 |
Service Class | 02/14/2014 | 02/14/2014 | $0.154 |
Service Class 2 | 02/14/2014 | 02/14/2014 | $0.154 |
VIP Freedom 2030 Portfolio | | | |
Initial Class | 02/14/2014 | 02/14/2014 | $0.161 |
Service Class | 02/14/2014 | 02/14/2014 | $0.161 |
Service Class 2 | 02/14/2014 | 02/14/2014 | $0.161 |
VIP Freedom 2035 Portfolio | | | |
Initial Class | 02/14/2014 | 02/14/2014 | $0.161 |
Service Class | 02/14/2014 | 02/14/2014 | $0.161 |
Service Class 2 | 02/14/2014 | 02/14/2014 | $0.161 |
VIP Freedom 2040 Portfolio | | | |
Initial Class | 02/14/2014 | 02/14/2014 | $0.180 |
Service Class | 02/14/2014 | 02/14/2014 | $0.180 |
Service Class 2 | 02/14/2014 | 02/14/2014 | $0.180 |
VIP Freedom 2045 Portfolio | | | |
Initial Class | 02/14/2014 | 02/14/2014 | $0.179 |
Service Class | 02/14/2014 | 02/14/2014 | $0.179 |
Service Class 2 | 02/14/2014 | 02/14/2014 | $0.179 |
VIP Freedom 2050 Portfolio | | | |
Initial Class | 02/14/2014 | 02/14/2014 | $0.157 |
Service Class | 02/14/2014 | 02/14/2014 | $0.157 |
Service Class 2 | 02/14/2014 | 02/14/2014 | $0.157 |
Annual Report
The funds hereby designate as capital gain dividend the amounts noted below for the taxable year ended December 31, 2013, or, if subsequently determined to be different, the net capital gain of such year.
VIP Freedom Income Portfolio | $229,972 |
VIP Freedom 2005 Portfolio | $50,620 |
VIP Freedom 2010 Portfolio | $3,036,789 |
VIP Freedom 2015 Portfolio | $1,412,333 |
VIP Freedom 2020 Portfolio | $9,354,613 |
VIP Freedom 2025 Portfolio | $1,183,637 |
VIP Freedom 2030 Portfolio | $3,016,508 |
VIP Freedom 2035 Portfolio | $60,877 |
VIP Freedom 2040 Portfolio | $228,576 |
VIP Freedom 2045 Portfolio | $33,472 |
VIP Freedom 2050 Portfolio | $45,950 |
A percentage of the dividends distributed during the fiscal year for the following funds were derived from interest on U.S. Government securities which is generally exempt from state income tax:
VIP Freedom Income Portfolio | |
Initial Class | 8.17% |
Service Class | 8.17% |
Service Class 2 | 8.17% |
VIP Freedom 2005 Portfolio | |
Initial Class | 6.27% |
Service Class | 6.27% |
Service Class 2 | 6.27% |
VIP Freedom 2010 Portfolio | |
Initial Class | 5.20% |
Service Class | 5.20% |
Service Class 2 | 5.20% |
VIP Freedom 2015 Portfolio | |
Initial Class | 4.80% |
Service Class | 4.80% |
Service Class 2 | 4.80% |
VIP Freedom 2020 Portfolio | |
Initial Class | 4.20% |
Service Class | 4.20% |
Service Class 2 | 4.20% |
VIP Freedom 2025 Portfolio | |
Initial Class | 3.14% |
Service Class | 3.14% |
Service Class 2 | 3.14% |
VIP Freedom 2030 Portfolio | |
Initial Class | 1.27% |
Service Class | 1.27% |
Service Class 2 | 1.27% |
Annual Report
Distributions (Unaudited) - continued
A percentage of the dividends distributed during the fiscal year for the following funds qualify for the dividends-received deduction for corporate shareholders:
| February 2013 | December 2013 |
VIP Freedom Income Portfolio | | |
Initial Class | 1% | 11% |
Service Class | 1% | 11% |
Service Class 2 | 1% | 13% |
VIP Freedom 2005 Portfolio | | |
Initial Class | 0% | 17% |
Service Class | 0% | 25% |
Service Class 2 | 0% | 19% |
VIP Freedom 2010 Portfolio | | |
Initial Class | 0% | 20% |
Service Class | 0% | 21% |
Service Class 2 | 0% | 23% |
VIP Freedom 2015 Portfolio | | |
Initial Class | 8% | 22% |
Service Class | 8% | 22% |
Service Class 2 | 8% | 24% |
VIP Freedom 2020 Portfolio | | |
Initial Class | 3% | 23% |
Service Class | 3% | 24% |
Service Class 2 | 3% | 26% |
VIP Freedom 2025 Portfolio | | |
Initial Class | 0% | 26% |
Service Class | 0% | 26% |
Service Class 2 | 0% | 28% |
VIP Freedom 2030 Portfolio | | |
Initial Class | 10% | 32% |
Service Class | 10% | 33% |
Service Class 2 | 10% | 35% |
VIP Freedom 2035 Portfolio | | |
Initial Class | 3% | 33% |
Service Class | 3% | 34% |
Service Class 2 | 3% | 35% |
VIP Freedom 2040 Portfolio | | |
Initial Class | 3% | 32% |
Service Class | 3% | 33% |
Service Class 2 | 3% | 34% |
VIP Freedom 2045 Portfolio | | |
Initial Class | 0% | 32% |
Service Class | 0% | 33% |
Service Class 2 | 0% | 33% |
VIP Freedom 2050 Portfolio | | |
Initial Class | 3% | 31% |
Service Class | 3% | 32% |
Service Class 2 | 3% | 34% |
Annual Report
The amounts per share which represent income derived from sources within, and taxes paid to, foreign countries or possessions of the United States are as follows:
Fund | Pay Date | Income | Taxes |
VIP Freedom Income Portfolio | | | |
Initial Class | 02/15/2013 | $0.0002 | $0.0000 |
| 12/27/2013 | $0.0107 | $0.0006 |
Service Class | 02/15/2013 | $0.0002 | $0.0000 |
| 12/27/2013 | $0.0103 | $0.0006 |
Service Class 2 | 02/15/2013 | $0.0002 | $0.0000 |
| 12/27/2013 | $0.0092 | $0.0006 |
VIP Freedom 2005 Portfolio | | | |
Initial Class | 12/27/2013 | $0.0184 | $0.0011 |
Service Class | 12/27/2013 | $0.0122 | $0.0011 |
Service Class 2 | 12/27/2013 | $0.0159 | $0.0011 |
VIP Freedom 2010 Portfolio | | | |
Initial Class | 12/27/2013 | $0.0286 | $0.0015 |
Service Class | 12/27/2013 | $0.0272 | $0.0015 |
Service Class 2 | 12/27/2013 | $0.0254 | $0.0015 |
VIP Freedom 2015 Portfolio | | | |
Initial Class | 02/15/2013 | $0.0004 | $0.0000 |
| 12/27/2013 | $0.0322 | $0.0018 |
Service Class | 02/15/2013 | $0.0004 | $0.0000 |
| 12/27/2013 | $0.0310 | $0.0018 |
Service Class 2 | 02/15/2013 | $0.0004 | $0.0000 |
| 12/27/2013 | $0.0285 | $0.0018 |
VIP Freedom 2020 Portfolio | | | |
Initial Class | 02/15/2013 | $0.0002 | $0.0000 |
| 12/27/2013 | $0.0361 | $0.0019 |
Service Class | 02/15/2013 | $0.0002 | $0.0000 |
| 12/27/2013 | $0.0348 | $0.0019 |
Service Class 2 | 02/15/2013 | $0.0002 | $0.0000 |
| 12/27/2013 | $0.0323 | $0.0019 |
VIP Freedom 2025 Portfolio | | | |
Initial Class | 02/15/2013 | $0.0000 | $0.0000 |
| 12/27/2013 | $0.0414 | $0.0023 |
Service Class | 02/15/2013 | $0.0000 | $0.0000 |
| 12/27/2013 | $0.0399 | $0.0023 |
Service Class 2 | 02/15/2013 | $0.0000 | $0.0000 |
| 12/27/2013 | $0.0376 | $0.0023 |
VIP Freedom 2030 Portfolio | | | |
Initial Class | 02/15/2013 | $0.0005 | $0.0000 |
| 12/27/2013 | $0.0514 | $0.0028 |
Service Class | 02/15/2013 | $0.0005 | $0.0000 |
| 12/27/2013 | $0.0497 | $0.0028 |
Service Class 2 | 02/15/2013 | $0.0005 | $0.0000 |
| 12/27/2013 | $0.0465 | $0.0028 |
VIP Freedom 2035 Portfolio | | | |
Initial Class | 02/15/2013 | $0.0010 | $0.0000 |
| 12/27/2013 | $0.0729 | $0.0041 |
Service Class | 02/15/2013 | $0.0010 | $0.0000 |
| 12/27/2013 | $0.0713 | $0.0041 |
Service Class 2 | 02/15/2013 | $0.0010 | $0.0000 |
| 12/27/2013 | $0.0691 | $0.0041 |
VIP Freedom 2040 Portfolio | | | |
Initial Class | 02/15/2013 | $0.0006 | $0.0000 |
| 12/27/2013 | $0.0647 | $0.0037 |
Service Class | 02/15/2013 | $0.0006 | $0.0000 |
| 12/27/2013 | $0.0627 | $0.0037 |
Service Class 2 | 02/15/2013 | $0.0006 | $0.0000 |
| 12/27/2013 | $0.0608 | $0.0037 |
Fund | Pay Date | Income | Taxes |
VIP Freedom 2045 Portfolio | | | |
Initial Class | 12/27/2013 | $0.0719 | $0.0041 |
Service Class | 12/27/2013 | $0.0692 | $0.0041 |
Service Class 2 | 12/27/2013 | $0.0686 | $0.0041 |
VIP Freedom 2050 Portfolio | | | |
Initial Class | 02/15/2013 | $0.0006 | $0.0000 |
| 12/27/2013 | $0.0554 | $0.0031 |
Service Class | 02/15/2013 | $0.0006 | $0.0000 |
| 12/27/2013 | $0.0544 | $0.0031 |
Service Class 2 | 02/15/2013 | $0.0006 | $0.0000 |
| 12/27/2013 | $0.0511 | $0.0031 |
Annual Report
Board Approval of Investment Advisory Contracts and Management Fees
VIP Freedom Funds
Each year, the Board of Trustees, including the Independent Trustees (together, the Board), votes on the renewal of the management contract (the Advisory Contract) with Strategic Advisers, Inc. (Strategic Advisers) and the administration agreement for each fund. The Board, assisted by the advice of fund counsel and Independent Trustees' counsel, requests and considers a broad range of information relevant to the renewal of the Advisory Contracts throughout the year.
The Board meets regularly and, at each of its meetings, covers an extensive agenda of topics and materials and considers factors that are relevant to its annual consideration of the renewal of each fund's Advisory Contract, including the services and support provided to each fund and its shareholders. The Board has established four standing committees, Operations, Audit, Fair Valuation, and Governance and Nominating, each composed of and chaired by Independent Trustees with varying backgrounds, to which the Board has assigned specific subject matter responsibilities in order to enhance effective decision-making by the Board. The Operations Committee, of which all of the Independent Trustees are members, meets regularly throughout the year and, among other matters, considers matters specifically related to the annual consideration of the renewal of each fund's Advisory Contract. The Board, acting directly and through its Committees, requests and receives information concerning the annual consideration of the renewal of each fund's Advisory Contract. The Board also meets as needed to consider matters specifically related to the Board's annual consideration of the renewal of Advisory Contracts. Members of the Board may also meet with trustees of other Fidelity funds through ad hoc joint committees to discuss certain matters relevant to the Fidelity funds.
At its September 2013 meeting, the Board, including the Independent Trustees, unanimously determined to renew each fund's Advisory Contract. In reaching its determination, the Board considered all factors it believed relevant and reached a determination, with the assistance of fund counsel and Independent Trustees' counsel and through the exercise of its business judgment, that the renewal of the Advisory Contract was in the best interests of each fund and its shareholders and the fact that no fees are payable under the Advisory Contracts was fair and reasonable. The Board's decision to renew the Advisory Contracts was not based on any single factor, but rather was based on a comprehensive consideration of all the information provided to the Board at its meetings throughout the year. In reaching its determination, the Board was aware that shareholders in each fund have a broad range of investment choices available to them, including a wide choice among mutual funds offered by Fidelity's competitors, and that each fund's shareholders, who have the opportunity to review and weigh the disclosure provided by the fund in its prospectus and other public disclosures, have chosen to invest in that fund, which is part of the Fidelity family of funds.
Nature, Extent, and Quality of Services Provided. The Board considered Fidelity's staffing as it relates to the funds, including the backgrounds of investment personnel of Strategic Advisers, and also considered the funds' investment objectives, strategies, and related investment philosophies. The Independent Trustees also had discussions with senior management of Fidelity's investment operations and investment groups with responsibility for the underlying Fidelity funds in which each fund invests. The Board considered the structure of the portfolio manager compensation program and whether this structure provides appropriate incentives to act in the best interests of each fund.
Resources Dedicated to Investment Management and Support Services. The Board reviewed the general qualifications and capabilities of Fidelity's investment staff, including its size, education, experience, and resources, as well as Fidelity's approach to recruiting, managing, and compensating investment personnel. The Board noted that Fidelity has continued to increase the resources devoted to non-U.S. offices, including expansion of Fidelity's global investment organization. The Board also noted that Fidelity's analysts have extensive resources, tools and capabilities that allow them to conduct sophisticated quantitative and fundamental analysis, as well as credit analysis of issuers, counterparties and guarantors. Further, the Board believes that Fidelity's investment professionals have sufficient access to global information and data so as to provide competitive investment results over time, and that those professionals also have access to sophisticated tools that permit them to assess portfolio construction and risk and performance attribution characteristics continuously, as well as to transmit new information and research conclusions rapidly around the world. Additionally, in its deliberations, the Board considered Fidelity's risk management capabilities and resources, which are an integral part of the investment management process.
Shareholder and Administrative Services. The Board considered (i) the nature, extent, quality, and cost of advisory, administrative, and shareholder services performed by Fidelity affiliates under the Advisory Contract and the administration agreement and under separate agreements covering transfer agency and pricing and bookkeeping services for each fund; (ii) the nature and extent of the supervision of third party service providers, principally custodians and subcustodians; and (iii) the resources devoted to, and the record of compliance with, each fund's compliance policies and procedures.
The Board noted that the growth of fund assets over time across the complex allows Fidelity to reinvest in the development of services designed to enhance the value or convenience of the Fidelity funds as investment vehicles. These services include 24-hour access to account information and market information through telephone representatives and over the Internet, investor education materials and asset allocation tools, and the expanded availability of Fidelity Investor Centers.
Investment in a Large Fund Family. The Board considered the benefits to shareholders of investing in a Fidelity fund, including the benefits of investing in a fund that is part of a large family of funds offering a variety of investment disciplines and providing a large variety of mutual fund investor services. The Board noted that Fidelity had taken, or had made recommendations that resulted in the Fidelity funds taking, a number of actions over the previous year that benefited particular funds, including (i) continuing to dedicate additional resources to investment research and to the support of the senior management team that oversees asset management; (ii) persisting in efforts to enhance Fidelity's global research capabilities; (iii) launching new funds and making other enhancements to meet client needs for global and income-oriented solutions; (iv) continuing to launch dedicated lower cost underlying funds to meet portfolio construction needs related to expanding underlying fund options for Fidelity funds of funds, specifically for the Freedom Fund product lines; (v) rationalizing product lines and gaining increased efficiencies through the combination of several funds with other funds; (vi) strengthening Fidelity's index fund offerings by reducing investment minimums and adopting or lowering existing expense caps for certain funds and classes; (vii) enhancing Global Asset Allocation product offerings by launching new funds and strategies, including "open architecture" target date funds that utilize affiliated and unaffiliated sub-advisers; (viii) modifying the eligibility criteria for Institutional Class shares of Advisor funds to increase their marketability to a portion of the defined contribution plan market; (ix) creating a new low-cost retirement share class for certain Advisor funds to appeal to large retirement plans; (x) transitioning the management of certain Fidelity commodity funds to Geode Capital Management LLC, a registered commodity pool operator, while retaining administrative responsibilities for the funds; and (xi) taking steps toward establishing a new Fidelity adviser to manage sector-based funds and products.
Annual Report
Board Approval of Investment Advisory Contracts and Management Fees - continued
Investment Performance. The Board considered whether each fund has operated in accordance with its investment objective, as well as its record of compliance with its investment restrictions and its performance history.
The Board took into account discussions with the investment adviser about fund investment performance that occur at Board meetings throughout the year. In this regard the Board noted that as part of regularly scheduled fund reviews and other reports to the Board on fund performance, the Board periodically considers annualized return information for each fund for different time periods, measured against one or more securities market indices, including a customized blended index representative of the fund's asset classes (each a "benchmark index") and a peer group of mutual funds with similar objectives ("peer group"). In its evaluation of fund investment performance at meetings throughout the year, the Board gave particular attention to information indicating underperformance of certain Fidelity funds for specific time periods and the investment adviser's explanations for such underperformance.
In addition to reviewing absolute and relative fund performance, the Independent Trustees periodically consider the appropriateness of fund performance metrics in evaluating the results achieved. In general, the Independent Trustees believe that fund performance should be evaluated based on gross performance (before fees and expenses, including acquired fund fees and expenses, but after transaction costs, if any) compared to appropriate benchmark indices, over appropriate time periods that may include full market cycles, and on net performance (after fees and expenses) compared to peer groups, as applicable, over the same periods, taking into account relevant factors including the following: general market conditions; the extent to which particular underlying funds affected performance; and fund cash flows and other factors. Depending on the circumstances, the Independent Trustees may be satisfied with a fund's performance notwithstanding that it lags its benchmark index or peer group for certain periods.
The Independent Trustees recognize that shareholders evaluate performance on a net basis over their own holding periods, for which one-, three-, and five-year periods are often used as a proxy. For this reason, the performance information reviewed by the Board also included net cumulative calendar year total return information for each fund and an appropriate benchmark index for the most recent one-, three-, and five-year periods (for the most recent one-year and three-year periods for each of Fidelity VIP Freedom 2035 Fund, Fidelity VIP Freedom 2040 Fund, Fidelity VIP Freedom 2045 Fund, and Fidelity VIP Freedom 2050 Fund).
Based on its review, the Board concluded that the nature, extent, and quality of services provided to each fund under the Advisory Contract should benefit each fund's shareholders.
Competitiveness of Management Fee and Total Expense Ratio. The Board noted that the funds do not pay Strategic Advisers a management fee for investment advisory services. The Board considered each fund's management fee and total expense ratio compared to "mapped groups" of competitive funds and classes, and also considered that each fund bears indirectly the expenses of the underlying Fidelity funds in which it invests. Fidelity creates "mapped groups" by combining similar Lipper investment objective categories that have comparable investment mandates. Combining Lipper investment objective categories aids the Board's management fee and total expense ratio comparisons by broadening the competitive group used for comparison and by reducing the number of universes to which various Fidelity funds are compared.
Management Fee. The Board considered two proprietary management fee comparisons for the 12-month (or shorter) periods shown in the charts below. The group of Lipper funds used by the Board for management fee comparisons is referred to below as the "Total Mapped Group." The Total Mapped Group comparison focuses on a fund's standing in terms of gross management fees before expense reimbursements or caps relative to the total universe of funds with comparable investment mandates, regardless of whether their management fee structures also are comparable. "TMG %" represents the percentage of funds in the Total Mapped Group that had management fees that were lower than a fund's. For example, a hypothetical TMG % of 50% would mean that half of the funds in the Total Mapped Group had higher, and half had lower, management fees than a fund. The funds' actual TMG %s are in the charts below. The "Asset-Size Peer Group" (ASPG) comparison focuses on a fund's standing relative to a subset of non-Fidelity funds within the Total Mapped Group that are similar in size and management fee structure. For example, if a fund is in the first quartile of the ASPG, the fund's management fee ranks in the least expensive or lowest 25% of funds in the ASPG. The ASPG represents at least 15% of the funds in the Total Mapped Group with comparable asset size and management fee structures, subject to a minimum of 50 funds (or all funds in the Total Mapped Group if fewer than 50). Additional information, such as the ASPG quartile in which a fund's management fee rate ranked, is also included in the charts and considered by the Board.
Annual Report
VIP Freedom 2005 Portfolio
VIP Freedom 2010 Portfolio
Annual Report
Board Approval of Investment Advisory Contracts and Management Fees - continued
VIP Freedom 2015 Portfolio
VIP Freedom 2020 Portfolio
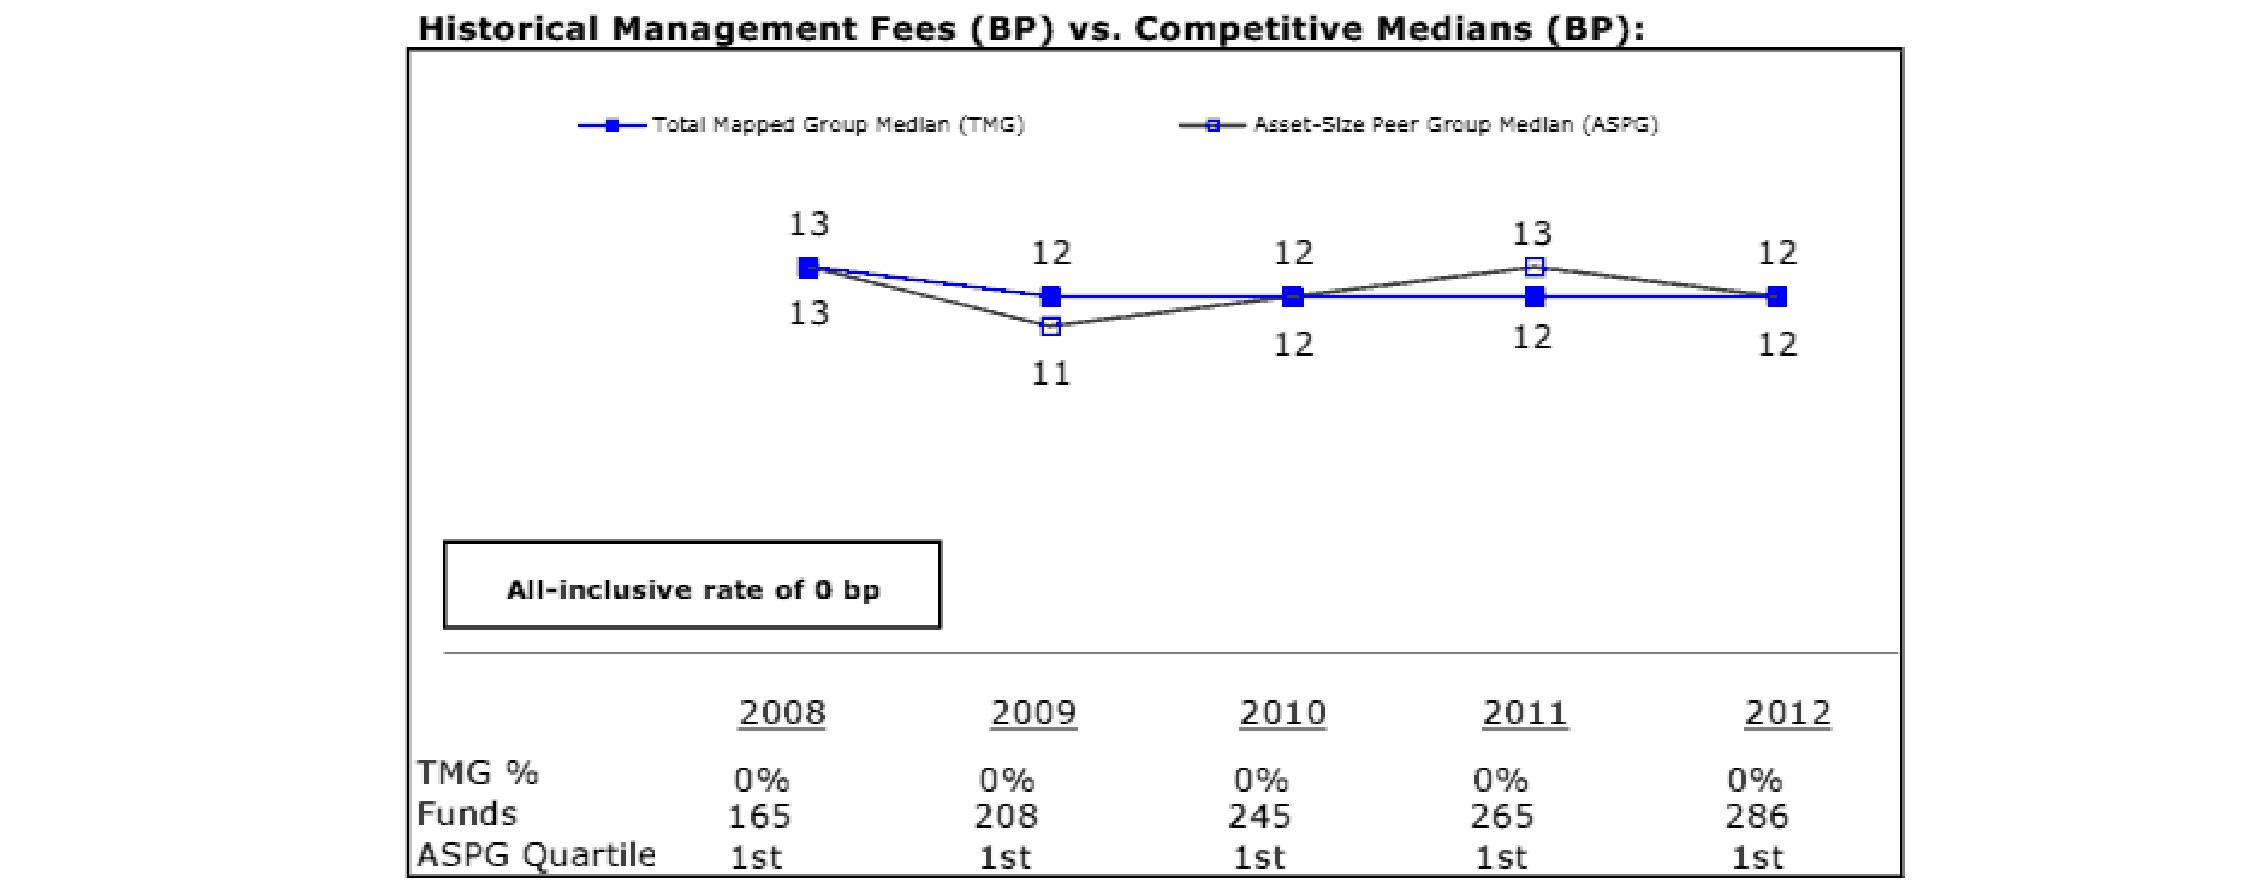
Annual Report
VIP Freedom 2025 Portfolio
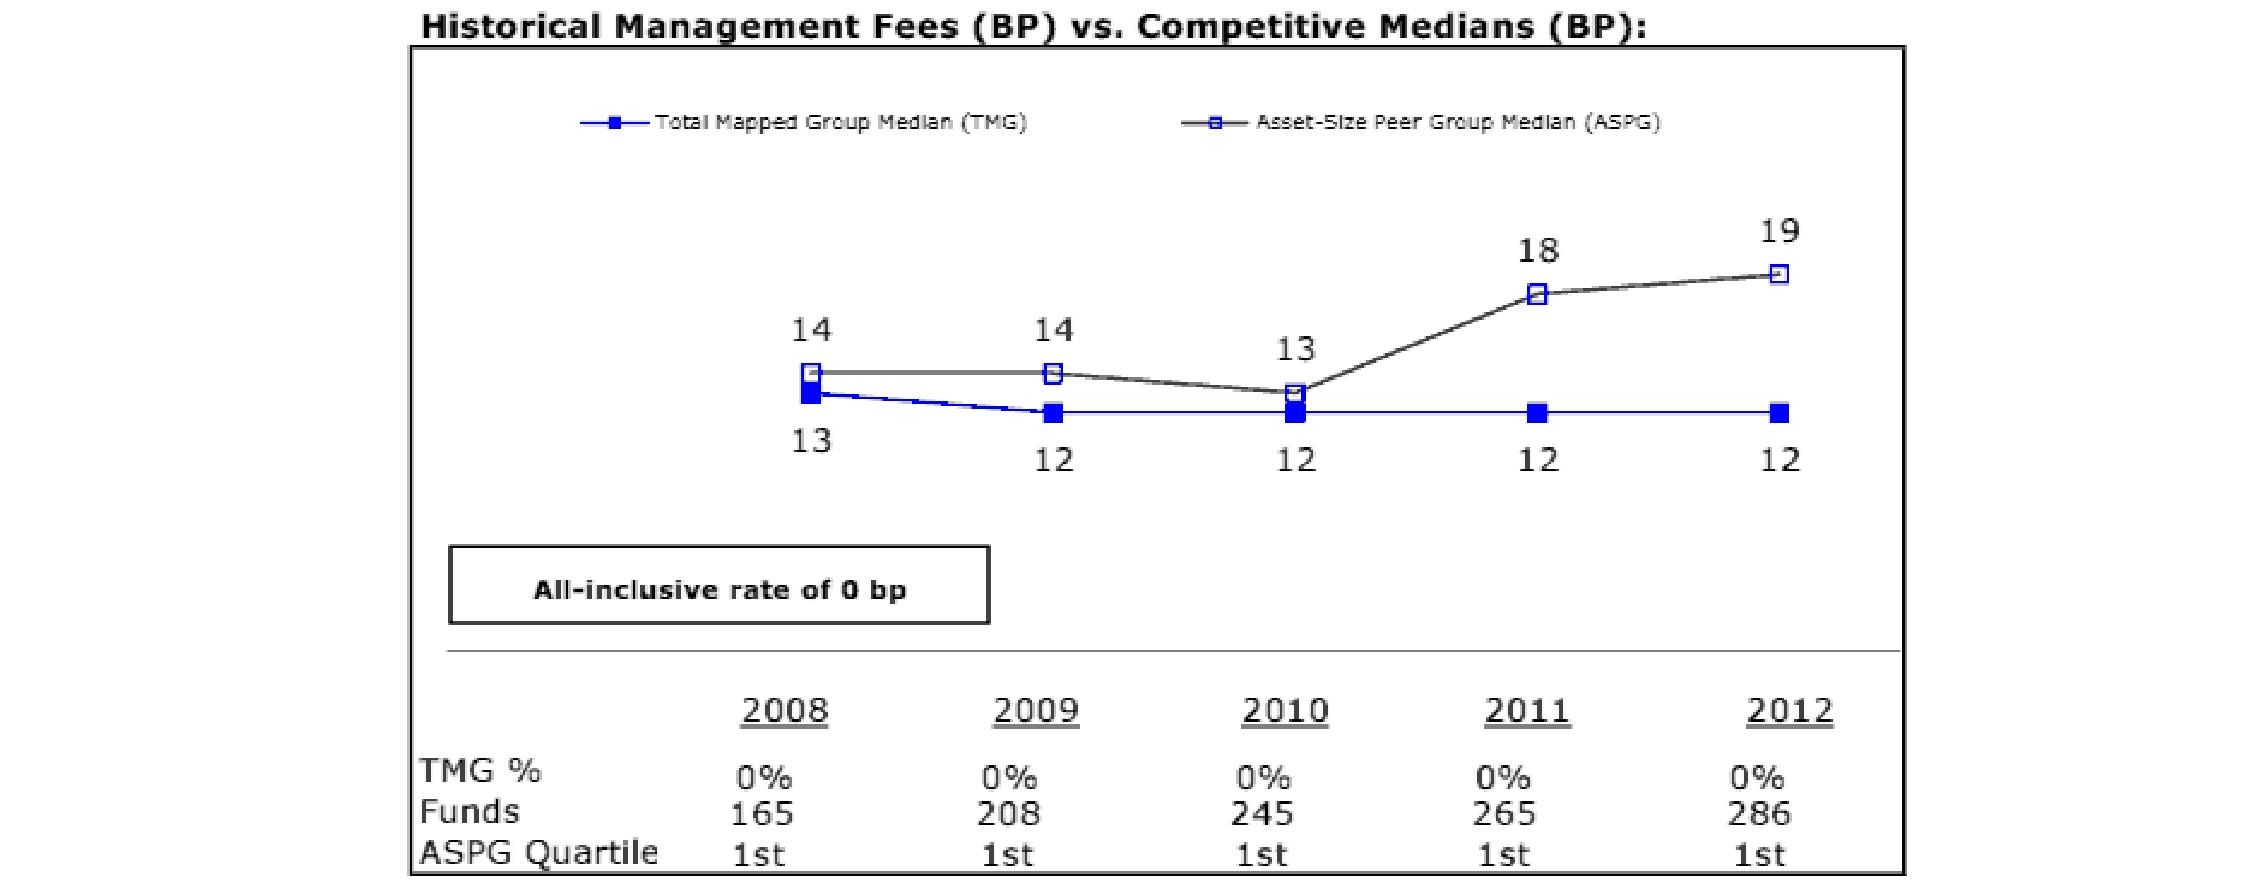
VIP Freedom 2030 Portfolio
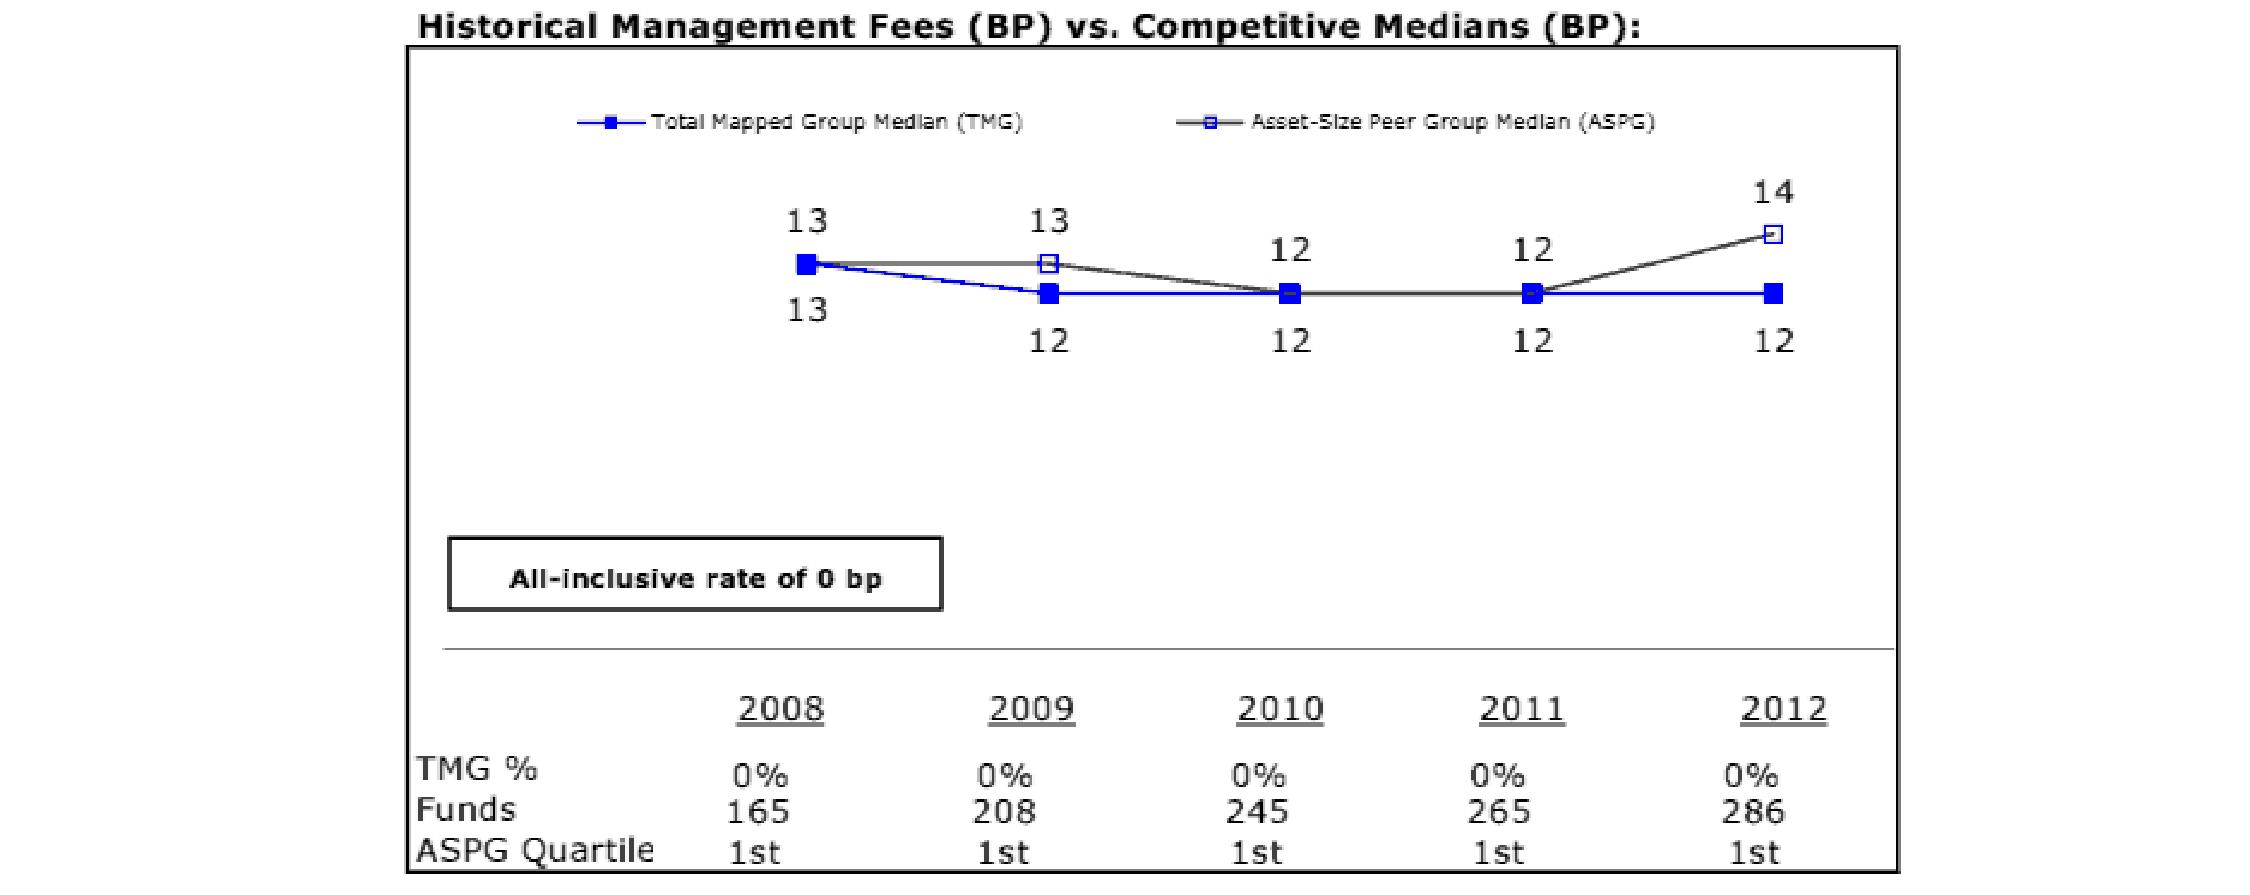
Annual Report
Board Approval of Investment Advisory Contracts and Management Fees - continued
VIP Freedom 2035 Portfolio
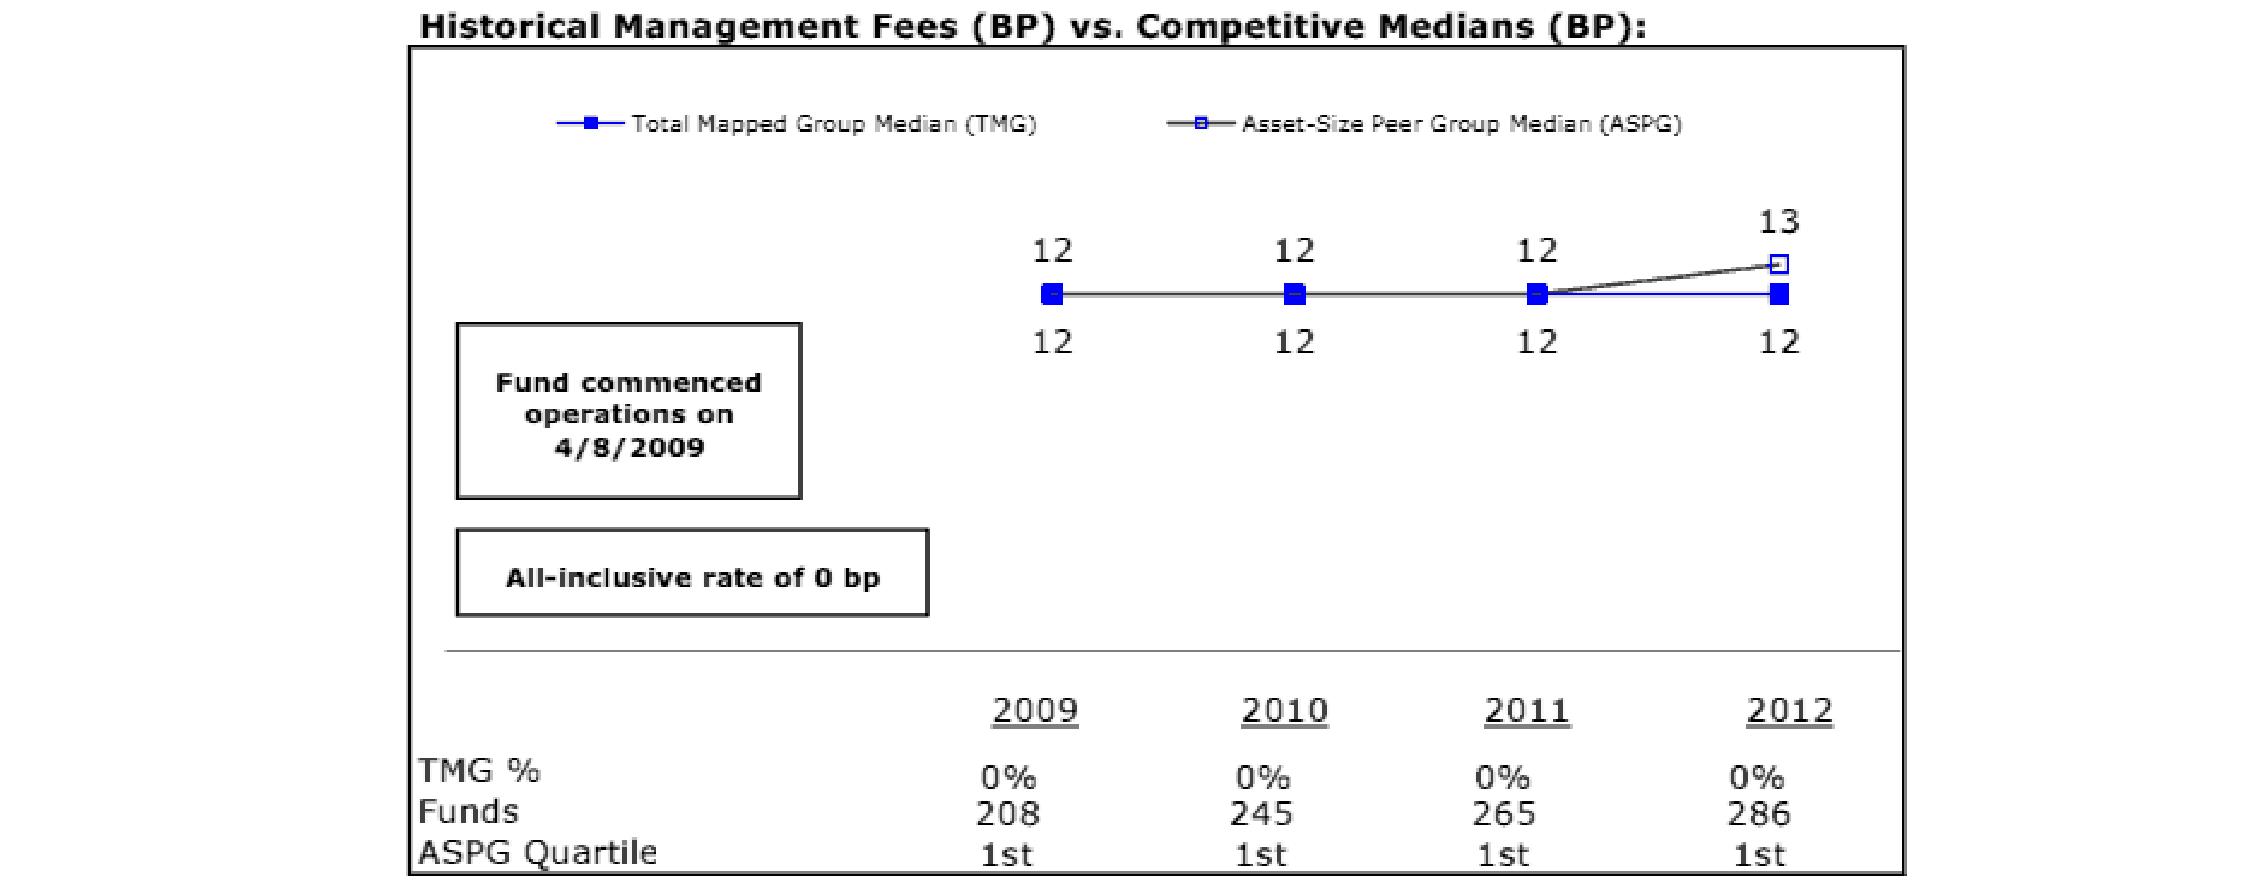
VIP Freedom 2040 Portfolio
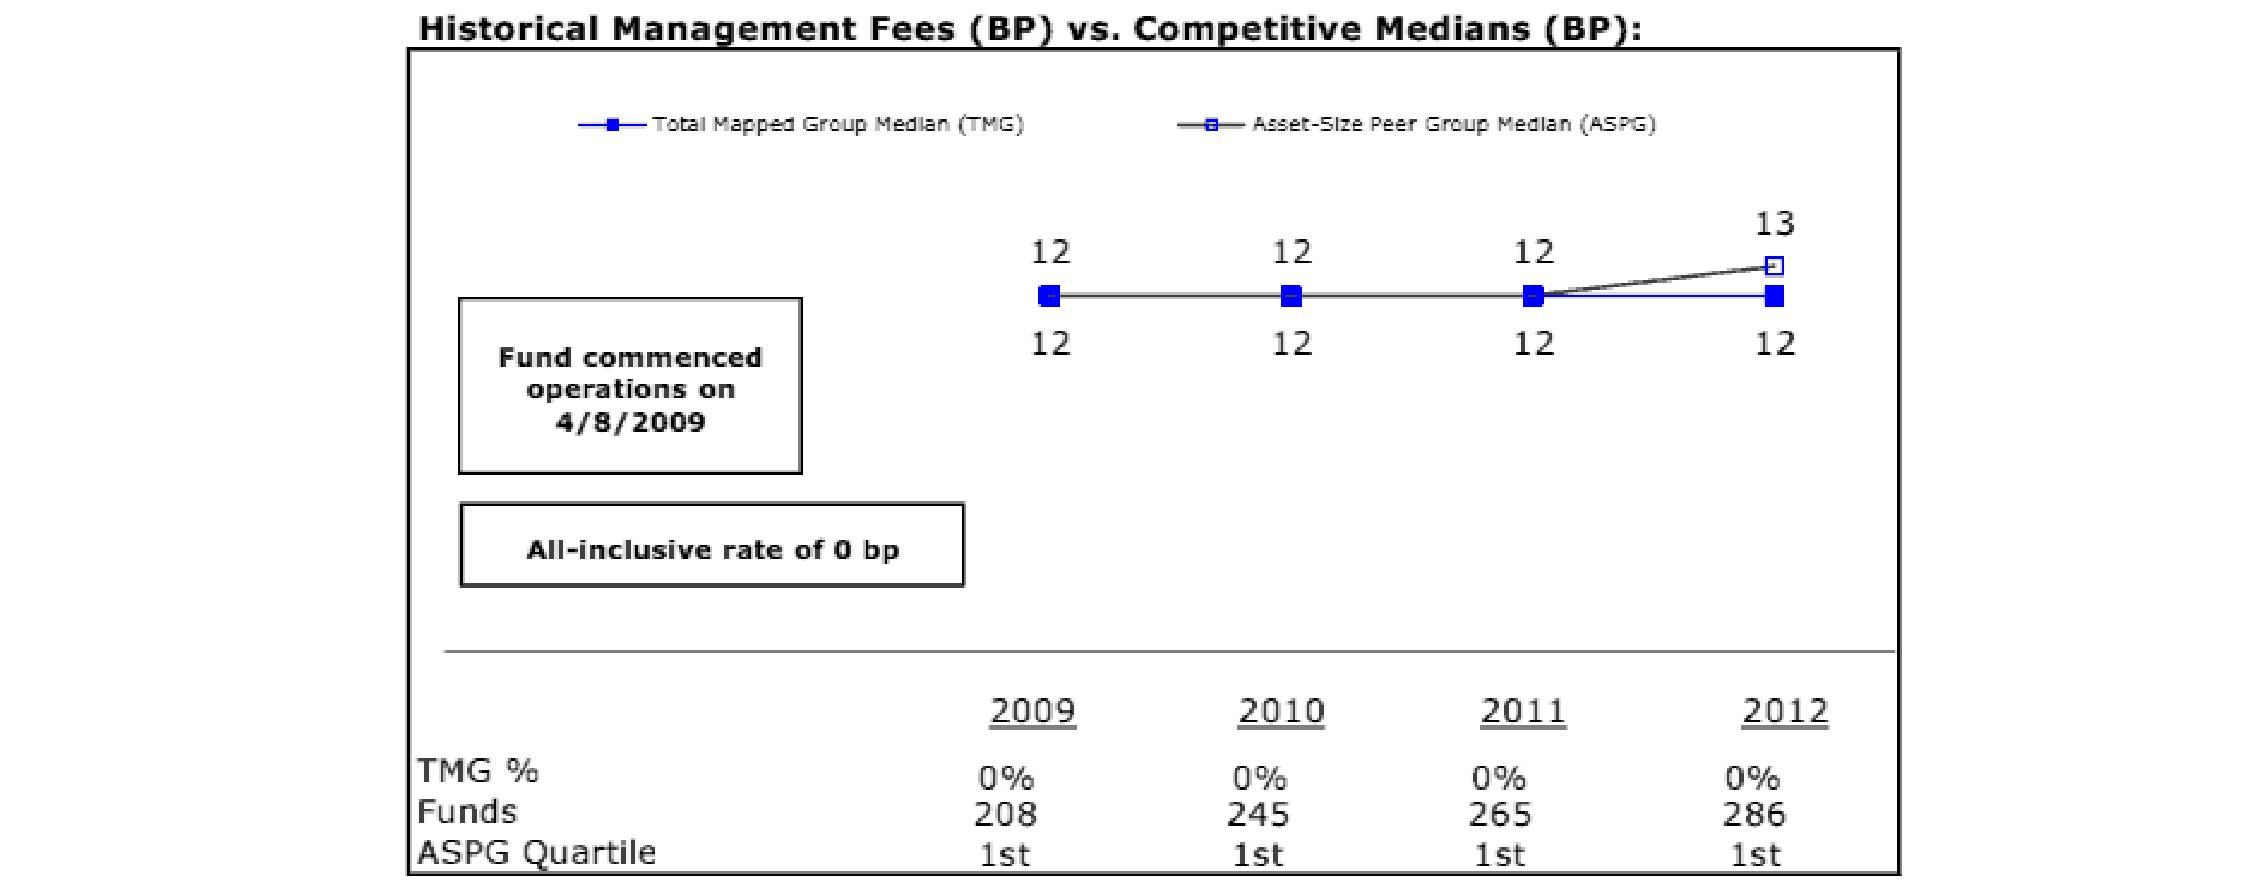
Annual Report
VIP Freedom 2045 Portfolio
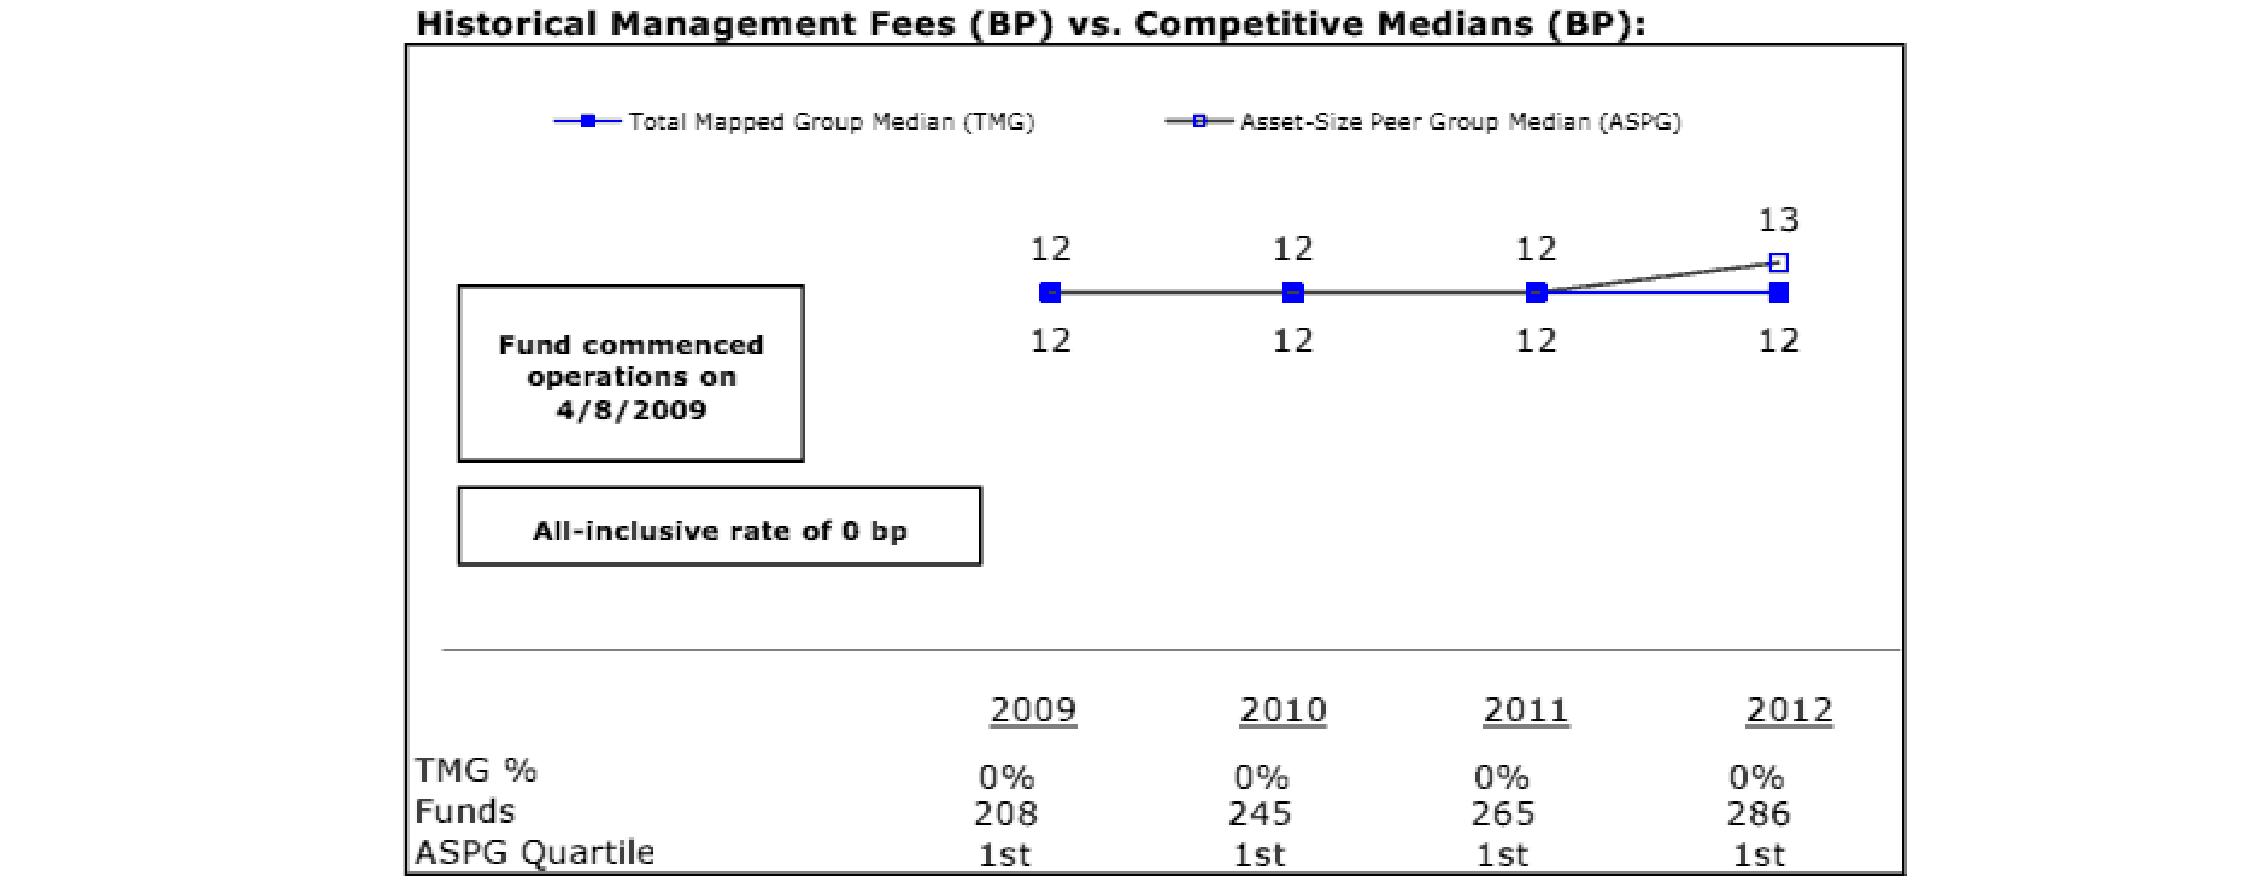
VIP Freedom 2050 Portfolio
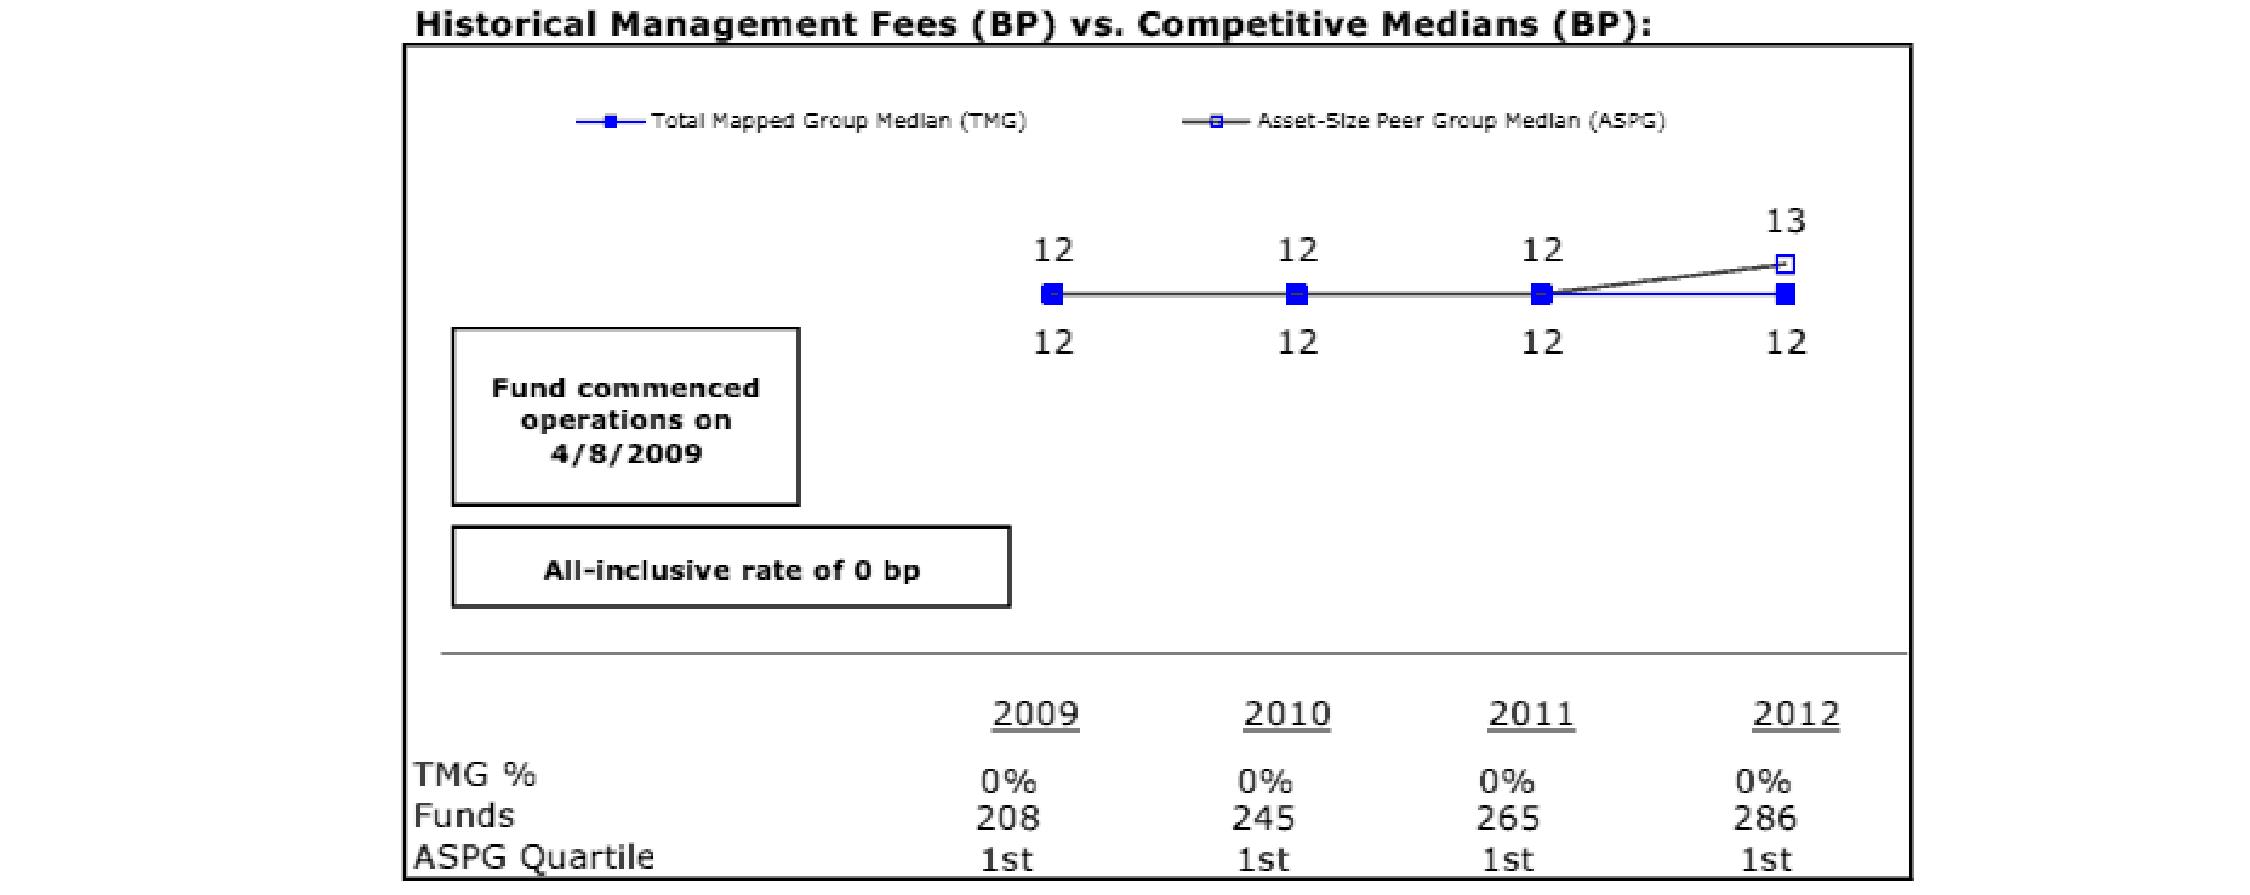
Annual Report
Board Approval of Investment Advisory Contracts and Management Fees - continued
VIP Freedom Income Portfolio
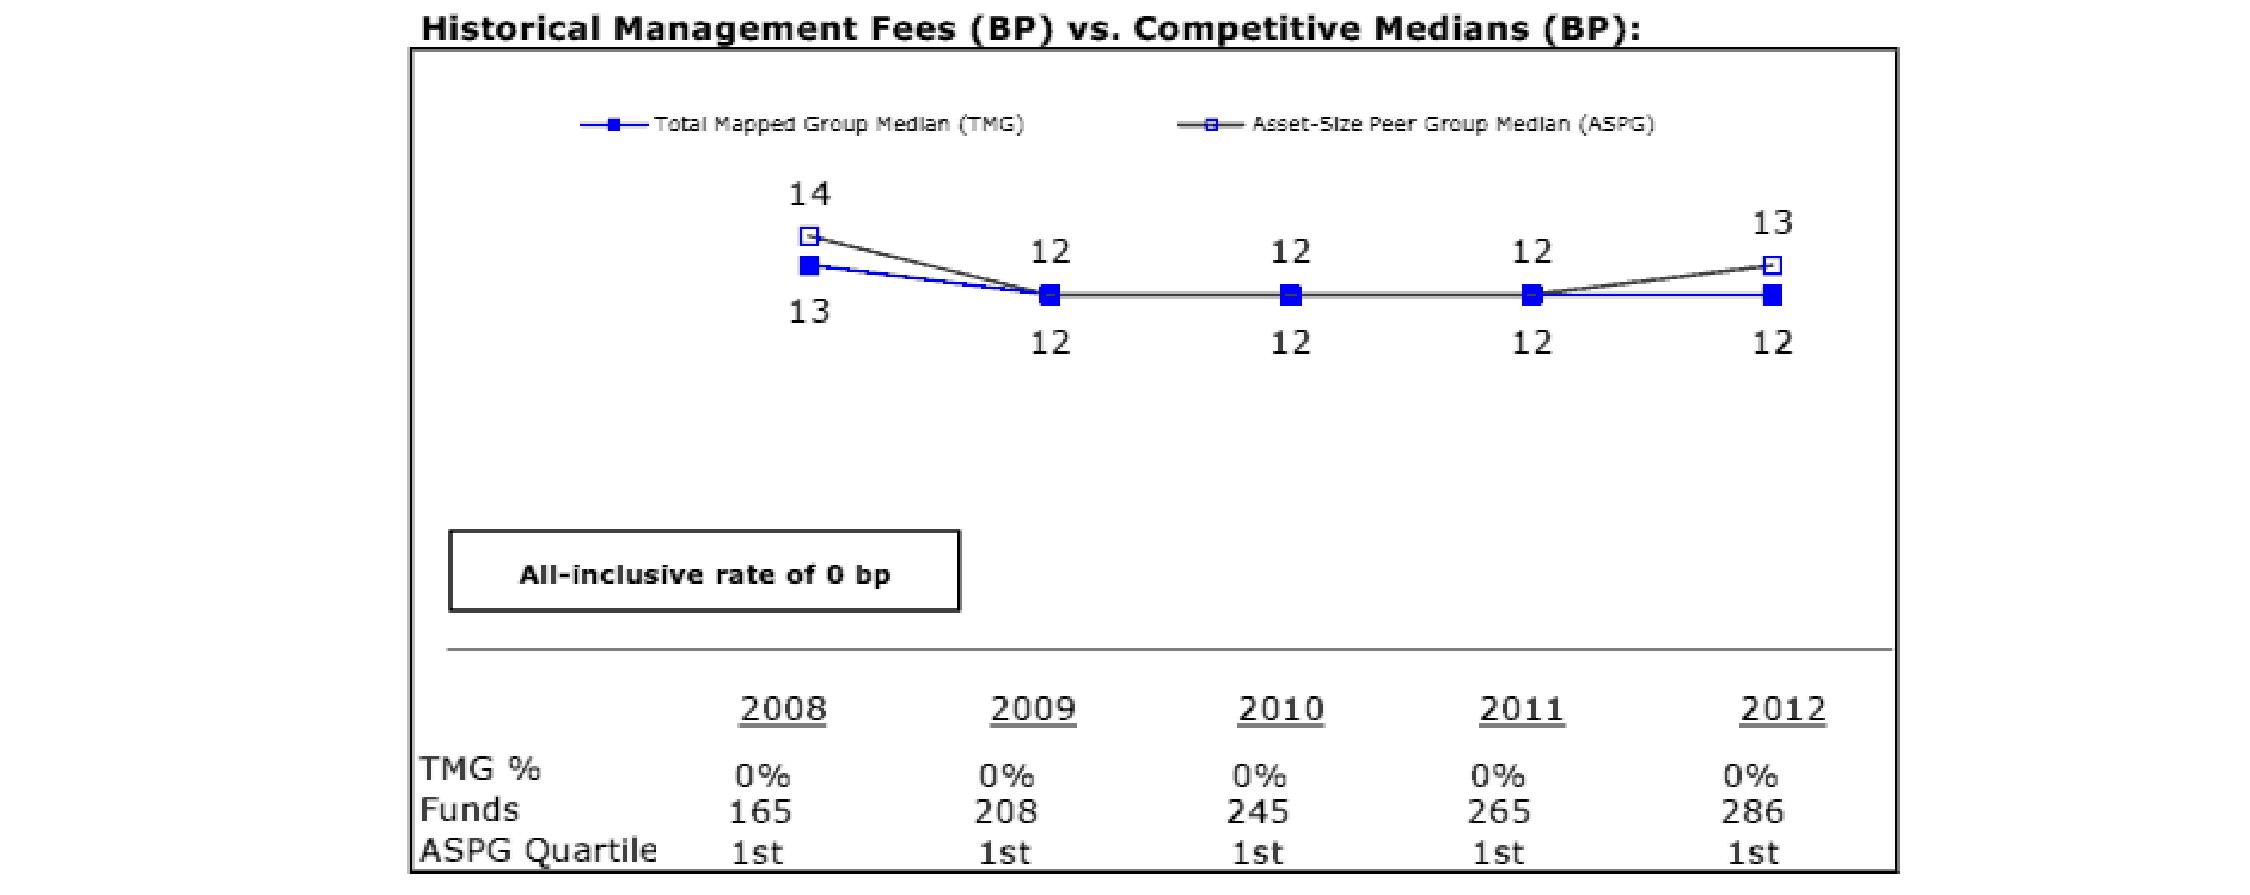
The Board noted that each fund's management fee rate of 0.00% ranked below the median of its Total Mapped Group and below the median of its ASPG for 2012. The Board further noted that many peer funds pay fund-level expenses, including management fees, to which the funds are not subject.
Based on its review, the Board concluded that each fund's management fee is fair and reasonable in light of the services that the fund receives and the other factors considered.
Total Expense Ratio. In its review of the total expense ratio of each class of each fund, the Board noted that each fund invests in Initial Class of the underlying Fidelity fund to avoid charging fund-paid 12b-1 fees at both fund levels. The Board considered that the funds do not pay transfer agent fees. Instead, Initial Class of each underlying Fidelity fund bears its pro rata portion of each fund's transfer agent fee according to the percentage of each fund's assets invested in that underlying fund. The Board further noted that Fidelity Management & Research Company (FMR) pays all other expenses of each fund, with limited exceptions.
The Board noted that the total expense ratio of each of Initial Class and Service Class of each fund ranked below its competitive median for 2012 and the total expense ratio of Service Class 2 of each fund ranked equal to its competitive median for 2012.
Fees Charged to Other Fidelity Clients. The Board also considered Fidelity fee structures and other information with respect to clients of Fidelity, such as other mutual funds advised or subadvised by Fidelity, pension plan clients, and other institutional clients. The Board noted the findings of the 2013 ad hoc joint committee (created with the board of other Fidelity funds), which reviewed and compared Fidelity's institutional investment advisory business with its business of providing services to the Fidelity funds, including the differences in services provided, fees charged, and costs incurred, as well as competition in their respective marketplaces.
Based on its review of total expense ratios and fees charged to other Fidelity clients, the Board concluded that the total expense ratio of each class of each fund was reasonable in light of the services that the fund and its shareholders receive and the other factors considered.
Costs of the Services and Profitability. The Board considered the level of Fidelity's profits in respect of all the Fidelity funds, including the Fidelity funds in which the funds invest.
PricewaterhouseCoopers LLP (PwC), independent registered public accounting firm and auditor to Fidelity and certain Fidelity funds, has been engaged annually by the Board as part of the Board's assessment of Fidelity's profitability analysis. PwC's engagement includes the review and assessment of the methodologies used by Fidelity in determining the revenues and expenses attributable to Fidelity's mutual fund business, and completion of agreed-upon procedures surrounding the mathematical accuracy of fund profitability and its conformity to allocation methodologies. After considering PwC's reports issued under the engagement and information provided by Fidelity, the Board concluded that while other allocation methods may also be reasonable, Fidelity's profitability methodologies are reasonable in all material respects.
The Board also reviewed Fidelity's non-fund businesses and fall-out benefits related to the mutual fund business as well as cases where Fidelity's affiliates may benefit from or be related to the funds' business.
Annual Report
The Board concluded that the costs of the services provided by and the profits realized by Fidelity in connection with the operation of each fund were not relevant to the renewal of each fund's Advisory Contract because the funds do not pay management fees and FMR pays all other expenses of each fund, with limited exceptions.
Economies of Scale. The Board concluded that because the funds do not pay management fees and FMR pays all other expenses of each fund, with limited exceptions, economies of scale cannot be realized by the funds, but may be realized by the other Fidelity funds in which each fund invests, many of which may benefit from breakpoints in the group fee arrangement.
Additional Information Requested by the Board. In order to develop fully the factual basis for consideration of the Fidelity funds' Advisory Contracts, the Board requested and received additional information on certain topics, including: (i) Fidelity's fund profitability methodology, profitability trends for certain funds, and the impact of certain factors on fund profitability results; (ii) portfolio manager changes that have occurred during the past year and the amount of the investment that each portfolio manager has made in the Fidelity fund(s) that he or she manages; (iii) Fidelity's compensation structure for portfolio managers, research analysts, and other key personnel, including its effects on fund profitability, the rationale for the compensation structure, and the extent to which current market conditions have affected retention and recruitment; (iv) the arrangements with and compensation paid to certain fund sub-advisers on behalf of the Fidelity funds; (v) Fidelity's fee structures, including the group fee structure and definition of group assets, and the rationale for recommending different fees among different categories of funds and classes; (vi) Fidelity's voluntary waiver of its fees to maintain minimum yields for certain money market funds and classes as well as contractual waivers in place for certain funds; (vii) the methodology with respect to competitive fund data and peer group classifications; (viii) Fidelity's transfer agent fee, expense, and service structures for different funds and classes, and the impact of the increased use of omnibus accounts; and (ix) explanations regarding the relative total expense ratios of certain funds and classes, total expense competitive trends and methodologies for total expense competitive comparisons, and actions that might be taken by Fidelity to reduce total expense ratios for certain funds and classes or to achieve further economies of scale.
Based on its evaluation of all of the conclusions noted above, and after considering all factors it believed relevant, the Board ultimately concluded that the advisory fee structures are fair and reasonable, and that each fund's Advisory Contract should be renewed.
Annual Report
Investment Adviser
Strategic Advisers, Inc.
Boston, MA
General Distributor
Fidelity Distributors Corporation
Smithfield, RI
Transfer and Service Agents
Fidelity Investments Institutional Operations Company, Inc.
Boston, MA
Fidelity Service Company, Inc.
Boston, MA
Custodian
The Bank of New York Mellon
New York, NY
VIPFF2K-ANN-0214
1.826371.109
Fidelity® Variable Insurance Products:
Freedom Lifetime Income Funds -
Portfolios I, II, & III
Annual Report
December 31, 2013
(Fidelity Cover Art)
Contents
To view a fund's proxy voting guidelines and proxy voting record for the 12-month period ended June 30, visit http://www.fidelity.com/proxyvotingresults or visit the Securities and Exchange Commission's (SEC) web site at http://www.sec.gov. You may also call 1-877-208-0098 to request a free copy of the proxy voting guidelines.
Fidelity Variable Insurance Products are separate account options which are purchased through a variable insurance contract.
Standard & Poor's, S&P and S&P 500 are registered service marks of The McGraw-Hill Companies, Inc. and have been licensed for use by Fidelity Distributors Corporation.
Other third-party marks appearing herein are the property of their respective owners.
All other marks appearing herein are registered or unregistered trademarks or service marks of FMR LLC or an affiliated company. © 2014 FMR LLC. All rights reserved.
This report and the financial statements contained herein are submitted for the general information of the shareholders of the funds. This report is not authorized for distribution to prospective investors in the funds unless preceded or accompanied by an effective prospectus.
A fund files its complete schedule of portfolio holdings with the SEC for the first and third quarters of each fiscal year on Form N-Q. Forms N-Q are available on the SEC's web site at http://www.sec.gov. A fund's Forms N-Q may be reviewed and copied at the SEC's Public Reference Room in Washington, DC. Information regarding the operation of the SEC's Public Reference Room may be obtained by calling 1-800-SEC-0330. For a complete list of a fund's portfolio holdings, view the most recent holdings listing, semiannual report, or annual report on Fidelity's web site at http://www.fidelity.com, http://www.advisor.fidelity.com, or http://www.401k.com, as applicable.
NOT FDIC INSURED • MAY LOSE VALUE • NO BANK GUARANTEE
Neither the funds nor Fidelity Distributors Corporation is a bank.
Annual Report
VIP Freedom Lifetime Income® I Portfolio
Performance: The Bottom Line
Average annual total return reflects the change in the value of an investment, assuming reinvestment of the fund's distributions from dividend income and capital gains (the profits earned upon the sale of securities that have grown in value, if any) and assuming a constant rate of performance each year. During periods of reimbursement by Fidelity, a fund's total return will be greater than it would be had the reimbursement not occurred. Performance numbers are net of all underlying fund operating expenses, but do not include any insurance charges imposed by your insurance company's separate account. If performance information included the effect of these additional charges, the total returns would have been lower. How a fund did yesterday is no guarantee of how it will do tomorrow.
Average Annual Total Returns
Periods ended December 31, 2013 | Past 1
year | Past 5
years | Life of
fund A |
VIP Freedom Lifetime Income I Portfolio | 9.96% | 10.87% | 5.60% |
A From July 26, 2005.
$10,000 Over Life of Fund
Let's say hypothetically that $10,000 was invested in VIP Freedom Lifetime Income I Portfolio on July 26, 2005, when the fund started. The chart shows how the value of your investment would have changed, and also shows how the Barclays® U.S. Aggregate Bond Index performed over the same period.
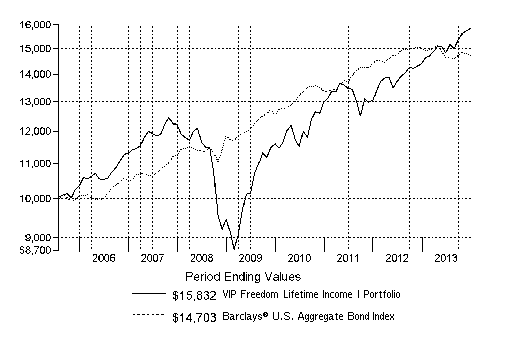
Annual Report
VIP Freedom Lifetime Income II Portfolio
Performance: The Bottom Line
Average annual total return reflects the change in the value of an investment, assuming reinvestment of the fund's distributions from dividend income and capital gains (the profits earned upon the sale of securities that have grown in value, if any) and assuming a constant rate of performance each year. During periods of reimbursement by Fidelity, a fund's total return will be greater than it would be had the reimbursement not occurred. Performance numbers are net of all underlying fund operating expenses, but do not include any insurance charges imposed by your insurance company's separate account. If performance information included the effect of these additional charges, the total returns would have been lower. How a fund did yesterday is no guarantee of how it will do tomorrow.
Average Annual Total Returns
Periods ended December 31, 2013 | Past 1
year | Past 5
years | Life of
fund A |
VIP Freedom Lifetime Income II Portfolio | 12.76% | 12.50% | 6.14% |
A From July 26, 2005.
$10,000 Over Life of Fund
Let's say hypothetically that $10,000 was invested in VIP Freedom Lifetime Income II Portfolio on July 26, 2005, when the fund started. The chart shows how the value of your investment would have changed, and also shows how the Barclays U.S. Aggregate Bond Index performed over the same period.
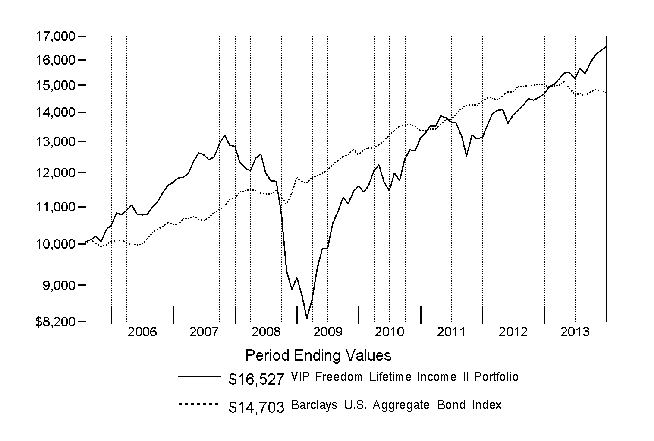
Annual Report
VIP Freedom Lifetime Income III Portfolio
Performance: The Bottom Line
Average annual total return reflects the change in the value of an investment, assuming reinvestment of the fund's distributions from dividend income and capital gains (the profits earned upon the sale of securities that have grown in value, if any) and assuming a constant rate of performance each year. During periods of reimbursement by Fidelity, a fund's total return will be greater than it would be had the reimbursement not occurred. Performance numbers are net of all underlying fund operating expenses, but do not include any insurance charges imposed by your insurance company's separate account. If performance information included the effect of these additional charges, the total returns would have been lower. How a fund did yesterday is no guarantee of how it will do tomorrow.
Average Annual Total Returns
Periods ended December 31, 2013 | Past 1
year | Past 5
years | Life of
fund A |
VIP Freedom Lifetime Income III Portfolio | 20.43% | 15.41% | 6.92% |
A From July 26, 2005.
$10,000 Over Life of Fund
Let's say hypothetically that $10,000 was invested in VIP Freedom Lifetime Income III Portfolio on July 26, 2005, when the fund started. The chart shows how the value of your investment would have changed, and also shows how the S&P 500® Index performed over the same period.
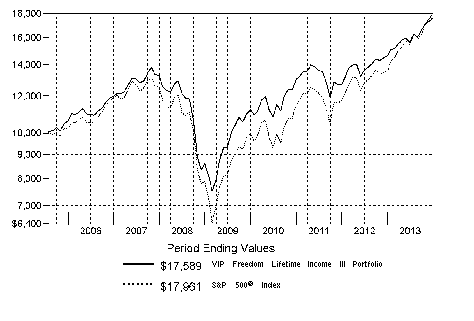
Annual Report
Market Recap: Global equity markets remained upbeat for the 12 months ending December 31, 2013, propelling the MSCI® ACWI® (All Country World Index) Index to a 23.24% return. Midyear turbulence gave way by autumn when policymakers in the U.S. and China had made clear their intentions to maintain accommodative monetary policies. That stance, combined with modest cyclical improvement around the globe and generally low valuations, underpinned the broad rally in equities, although the relative strength of the U.S. dollar generally tempered gains for U.S. investors holding foreign securities based in local currencies. During the period, the broad-market S&P 500® Index set a series of new highs, finishing the year up 32.39%. For the first time since 1995, the S&P® scored a "perfect 10," with all 10 economic sectors gaining at least 10% for the year. A resurgence in growth-oriented stocks lifted the Nasdaq Composite Index® to a 40.12% result for 2013, while the blue-chip Dow Jones Industrial AverageSM notched a relatively more modest 29.65% gain. International developed-markets equities rose in concert with their U.S. counterparts, with the MSCI® EAFE® Index gaining 22.92% for the period. Meanwhile, foreign exchange and commodity weakness curbed results in resource-heavy emerging markets (EM), especially in the year's waning months. More generally, concern over EM's slowing growth, its declining share of global trade and uncertainty surrounding U.S. central bank intentions were all factors hampering performance. The MSCI Emerging Markets Index returned -2.27% for the period. On the bond side, U.S. high-yield securities rallied with equities for much of the period, with The BofA Merrill LynchSM US High Yield Constrained Index returning 7.41% for 2013. The more rate-sensitive U.S. investment-grade bond category faced headwinds though, as reflected in the -2.02% return of the Barclays® U.S. Aggregate Bond Index. Within the Barclays index, investment-grade corporate credit returned -2.01%, while ultra-safe U.S. Treasuries saw a -2.75% result. Major non-U.S. developed markets performed only slightly better, with the Citigroup® Non-USD Group-of-Seven (G7) Equal Weighted Index logging a -1.59% result. After several years of strong advances, EM debt reversed course in 2013, with the J.P. Morgan Emerging Markets Bond Index Global returning -6.58%.
Comments from Andrew Dierdorf and Christopher Sharpe, Co-Managers of VIP Freedom Lifetime Income® Funds: Each VIP Freedom Lifetime Income Fund posted a positive return for the 12 months ending December 31, 2013. (For specific portfolio results, please refer to the performance section of this report.) VIP Freedom Lifetime Income III Fund delivered the highest absolute return, followed by VIP Freedom Lifetime Income II Fund and VIP Freedom Lifetime Income I Fund. This is consistent with what we would anticipate, given that VIP Freedom Lifetime Income III Fund has a greater exposure to underlying equity funds, which performed very well in 2013. On a relative basis - meaning how the Funds performed versus their respective Composite indexes - each Fund outperformed, thanks in part to the Funds' allocation to non-U.S. equities and bonds. Looking at the Funds' equity asset allocation, non-U.S. stocks provided the greatest boost on a relative basis. The MSCI® EAFE® Index, benchmark for the Funds' non-U.S. equity holdings, rose 22.92%. The Funds' core holding in this investment area - VIP Overseas Portfolio - handily outpaced the MSCI index, mainly on security selection within developed countries that fared better as they recovered from the region's financial and economic crises. In the U.S., despite strong absolute results, the Funds did not match the 33.47% result for The Dow Jones U.S. Total Stock Market IndexSM, a yardstick for the Funds' U.S.-equity exposure. Even though the Funds received a boost from the strong relative performance of their largest equity holding, VIP Growth & Income Portfolio, that positive performance could not overcome relative weakness from some other holdings, in particular two of the Funds' larger investments - VIP Contrafund Portfolio and VIP Equity-Income Portfolio - which lagged the Dow Jones index. Turning to the fixed-income arena, investment-grade bonds declined during the 12-month period, as concern about downside risk amid the prospect of higher interest rates weighed on sentiment. Investors sought higher yields and leaned more toward equity securities and higher-yielding bonds. In terms of the Funds' underlying investments, in aggregate they bettered the -2.02% return of the Barclays® U.S. Aggregate Bond Index, the benchmark for the Funds' fixed-income sleeve. Here, the allocation to VIP Investment Grade Bond Portfolio outpaced the Barclays index, helping the Funds' relative showing. VIP High Income Portfolio, with its nearly 6% return, also added to relative performance.
Note to shareholders: On January 21, 2014, Brett Sumsion will become a Co-Manager of the Funds. Brett will replace Chris Sharpe following a transition period that will be completed on or around March 31, 2014.
The views expressed above reflect those of the portfolio manager(s) only through the end of the period as stated on the cover of this report and do not necessarily represent the views of Fidelity or any other person in the Fidelity organization. Any such views are subject to change at any time based upon market or other conditions and Fidelity disclaims any responsibility to update such views. These views may not be relied on as investment advice and, because investment decisions for a Fidelity fund are based on numerous factors, may not be relied on as an indication of trading intent on behalf of any Fidelity fund.
Annual Report
As a shareholder of a Fund, you incur two types of costs: (1) transaction costs, and (2) ongoing costs, including other Fund expenses. This Example is intended to help you understand your ongoing costs (in dollars) of investing in the Funds and to compare these costs with the ongoing costs of investing in other mutual funds.
The Example is based on an investment of $1,000 invested at the beginning of the period and held for the entire period (July 1, 2013 to December 31, 2013).
Actual Expenses
The first line of the accompanying table for each fund provides information about actual account values and actual expenses. You may use the information in this line, together with the amount you invested, to estimate the expenses that you paid over the period. Simply divide your account value by $1,000.00 (for example, an $8,600 account value divided by $1,000.00 = 8.6), then multiply the result by the number in the first line for a fund under the heading entitled "Expenses Paid During Period" to estimate the expenses you paid on your account during this period. The estimate of expenses does not include any fees or other expenses of any variable annuity or variable life insurance product. If they were, the estimate of expenses you paid during the period would be higher, and your ending account value would be lower. In addition, each Fund, as a shareholder in underlying Fidelity Funds, will indirectly bear its pro-rata share of the fees and expenses incurred by the underlying Fidelity Funds. These fees and expenses are not included in each Fund's annualized expense ratio used to calculate the expense estimates in the table below.
Hypothetical Example for Comparison Purposes
The second line of the accompanying table for each fund provides information about hypothetical account values and hypothetical expenses based on a fund's actual expense ratio and an assumed rate of return of 5% per year before expenses, which is not the Fund's actual return. The hypothetical account values and expenses may not be used to estimate the actual ending account balance or expenses you paid for the period. You may use this information to compare the ongoing costs of investing in the Fund and other funds. To do so, compare this 5% hypothetical example with the 5% hypothetical examples that appear in the shareholder reports of the other funds. The estimate of expenses does not include any fees or other expenses of any variable annuity or variable life insurance product. If they were, the estimate of expenses you paid during the period would be higher, and your ending account value would be lower. In addition, each Fund, as a shareholder in underlying Fidelity Funds, will indirectly bear its pro-rata share of the fees and expenses incurred by the underlying Fidelity Funds. These fees and expenses are not included in each Fund's annualized expense ratio used to calculate the expense estimates in the table below.
Please note that the expenses shown in the table are meant to highlight your ongoing costs only and do not reflect any transaction costs. Therefore, the second line of the table is useful in comparing ongoing costs only, and will not help you determine the relative total costs of owning different funds.
| Annualized
Expense Ratio B | Beginning
Account Value
July 1, 2013 | Ending
Account Value
December 31, 2013 | Expenses Paid
During Period*
July 1, 2013
to December 31, 2013 |
VIP Freedom Lifetime Income I | .00% | | | |
Actual | | $ 1,000.00 | $ 1,067.60 | $ .00 |
HypotheticalA | | $ 1,000.00 | $ 1,025.21 | $ .00 |
VIP Freedom Lifetime Income II | .00% | | | |
Actual | | $ 1,000.00 | $ 1,084.50 | $ .00 |
HypotheticalA | | $ 1,000.00 | $ 1,025.21 | $ .00 |
VIP Freedom Lifetime Income III | .00% | | | |
Actual | | $ 1,000.00 | $ 1,126.30 | $ .00 |
HypotheticalA | | $ 1,000.00 | $ 1,025.21 | $ .00 |
A 5% return per year before expenses
B Annualized expense ratio reflects expenses net of applicable fee waivers.
* Expenses are equal to each Fund's annualized expense ratio, multiplied by the average account value over the period, multiplied by 184/365 (to reflect the one-half year period). The fees and expenses of the underlying Fidelity Funds in which each Fund invests are not included in each Fund's annualized expense ratio.
Annual Report
VIP Freedom Lifetime Income I Portfolio
Investment Changes (Unaudited)
The information in the following tables is based on the direct investments of the Fund. |
Fund Holdings as of December 31, 2013 |
| % of fund's
net assets | % of fund's net assets
6 months ago |
Domestic Equity Funds | | |
VIP Contrafund Portfolio Investor Class | 4.7 | 4.8 |
VIP Equity-Income Portfolio Investor Class | 4.7 | 5.0 |
VIP Growth & Income Portfolio Investor Class | 5.5 | 5.7 |
VIP Growth Portfolio Investor Class | 4.8 | 4.9 |
VIP Mid Cap Portfolio Investor Class | 1.4 | 1.4 |
VIP Value Portfolio Investor Class | 3.5 | 3.7 |
VIP Value Strategies Portfolio Investor Class | 1.8 | 1.8 |
| 26.4 | 27.3 |
Developed International Equity Funds | | |
VIP Overseas Portfolio Investor Class R | 7.5 | 7.6 |
Emerging Markets Equity Funds | | |
VIP Emerging Markets Portfolio Investor Class R | 1.9 | 2.2 |
High Yield Bond Funds | | |
VIP High Income Portfolio Investor Class | 5.0 | 5.0 |
Investment Grade Bond Funds | | |
VIP Investment Grade Bond Portfolio Investor Class | 44.4 | 42.8 |
Short-Term Funds | | |
VIP Money Market Portfolio Investor Class | 14.8 | 15.1 |
Net Other Assets (Liabilities)* | 0.0 | 0.0 |
| 100.0 | 100.0 |
* Amount represents less than 0.1% |
Asset Allocation (% of fund's net assets) |
Period end |
 | Domestic Equity Funds | 26.4% | |
 | Developed International Equity Funds | 7.5% | |
 | Emerging Markets Equity Funds | 1.9% | |
 | High Yield Bond Funds | 5.0% | |
 | Investment Grade Bond Funds | 44.4% | |
 | Short-Term Funds | 14.8% | |

Six months ago |
| Domestic Equity Funds | 27.3% | |
| Developed International Equity Funds | 7.6% | |
| Emerging Markets Equity Funds | 2.2% | |
| High Yield Bond Funds | 5.0% | |
| Investment Grade Bond Funds | 42.8% | |
| Short-Term Funds | 15.1% | |

Expected |
| Domestic Equity Funds | 23.0% | |
| Developed International Equity Funds | 6.6% | |
| Emerging Markets Equity Funds | 1.8% | |
| High Yield Bond Funds | 5.0% | |
| Investment Grade Bond Funds | 48.6% | |
| Short-Term Funds | 15.0% | |

The fund invests according to an asset allocation strategy that becomes increasingly conservative over time. The six months ago allocation is based on the fund's holdings as of June 30, 2013. The period end allocation is based on the fund's holdings as of December 31, 2013. The expected allocation represents the fund's anticipated allocation at June 30, 2014. |
Annual Report
VIP Freedom Lifetime Income I Portfolio
Investments December 31, 2013
Showing Percentage of Net Assets
Domestic Equity Funds - 26.4% |
| Shares | | Value |
Domestic Equity Funds - 26.4% |
VIP Contrafund Portfolio Investor Class (b) | 17,649 | | $ 603,956 |
VIP Equity-Income Portfolio Investor Class (b) | 26,342 | | 611,387 |
VIP Growth & Income Portfolio Investor Class (b) | 37,197 | | 710,091 |
VIP Growth Portfolio Investor Class (b) | 10,982 | | 625,868 |
VIP Mid Cap Portfolio Investor Class (b) | 5,093 | | 184,619 |
VIP Value Portfolio Investor Class (b) | 30,243 | | 458,793 |
VIP Value Strategies Portfolio Investor Class (b) | 16,061 | | 229,838 |
TOTAL DOMESTIC EQUITY FUNDS (Cost $2,883,175) |
3,424,552
|
International Equity Funds - 9.4% |
| | | |
Developed International Equity Funds - 7.5% |
VIP Overseas Portfolio Investor Class R (b) | 47,202 | | 971,422 |
Emerging Markets Equity Funds - 1.9% |
VIP Emerging Markets Portfolio Investor Class R (b) | 28,058 | | 251,964 |
TOTAL INTERNATIONAL EQUITY FUNDS (Cost $1,218,448) |
1,223,386
|
Bond Funds - 49.4% |
| Shares | | Value |
High Yield Bond Funds - 5.0% |
VIP High Income Portfolio Investor Class (b) | 111,750 | | $ 645,915 |
Investment Grade Bond Funds - 44.4% |
VIP Investment Grade Bond Portfolio Investor Class (b) | 468,762 | | 5,775,152 |
TOTAL BOND FUNDS (Cost $6,662,111) |
6,421,067
|
Short-Term Funds - 14.8% |
| | | |
VIP Money Market Portfolio Investor Class 0.01% (a)(b)
(Cost $1,922,420) | 1,922,420 | |
1,922,420
|
TOTAL INVESTMENT PORTFOLIO - 100.0% (Cost $12,686,154) | | 12,991,425 |
NET OTHER ASSETS (LIABILITIES) - 0.0% | | 1 |
NET ASSETS - 100% | $ 12,991,426 |
Legend |
(a) The rate quoted is the annualized seven-day yield of the fund at period end. |
(b) Affiliated company |
Affiliated Underlying Funds |
Information regarding the Fund's fiscal year to date purchases and sales of the affiliated Underlying Funds and income earned by the Fund from investments in affiliated Underlying Funds is as follows: |
Affiliate | Value,
beginning of
period | Purchases | Sales
Proceeds | Dividend
Income | Value,
end of
period |
VIP Contrafund Portfolio Investor Class | $ 585,265 | $ 71,012 | $ 210,433 | $ 5,537 | $ 603,956 |
VIP Emerging Markets Portfolio Investor Class R | 302,619 | 32,787 | 92,046 | 1,676 | 251,964 |
VIP Equity-Income Portfolio Investor Class | 626,411 | 121,024 | 241,435 | 14,007 | 611,387 |
VIP Growth & Income Portfolio Investor Class | 707,888 | 90,224 | 287,006 | 11,863 | 710,091 |
VIP Growth Portfolio Investor Class | 580,212 | 68,431 | 210,857 | 1,230 | 625,868 |
VIP High Income Portfolio Investor Class | 610,462 | 119,429 | 82,996 | 37,317 | 645,915 |
VIP Investment Grade Bond Portfolio Investor Class | 4,970,558 | 1,832,287 | 723,645 | 138,193 | 5,775,152 |
VIP Mid Cap Portfolio Investor Class | 174,266 | 41,424 | 64,092 | 730 | 184,619 |
VIP Money Market Portfolio Investor Class | 1,795,982 | 372,364 | 245,927 | 350 | 1,922,420 |
VIP Overseas Portfolio Investor Class R | 986,701 | 119,866 | 385,539 | 11,550 | 971,422 |
VIP Value Portfolio Investor Class | 465,504 | 90,031 | 189,733 | 4,498 | 458,793 |
VIP Value Strategies Portfolio Investor Class | 230,756 | 26,449 | 87,072 | 1,805 | 229,838 |
Total | $ 12,036,624 | $ 2,985,328 | $ 2,820,781 | $ 228,756 | $ 12,991,425 |
Other Information |
All investments are categorized as Level 1 under the Fair Value Hierarchy. The inputs or methodology used for valuing securities may not be an indication of the risk associated with investing in those securities. For more information on valuation inputs, please refer to the Investment Valuation section in the accompanying Notes to Financial Statements. |
See accompanying notes which are an integral part of the financial statements.
Annual Report
VIP Freedom Lifetime Income I Portfolio
Statement of Assets and Liabilities
| December 31, 2013 |
| | |
Assets | | |
Investment in securities, at value (cost $12,686,154) - See accompanying schedule | | $ 12,991,425 |
Cash | | 1 |
Receivable for investments sold | | 214 |
Total assets | | 12,991,640 |
| | |
Liabilities | | |
Payable for fund shares redeemed | | 214 |
| | |
Net Assets | | $ 12,991,426 |
Net Assets consist of: | | |
Paid in capital | | $ 12,476,740 |
Accumulated undistributed net realized gain (loss) on investments | | 209,415 |
Net unrealized appreciation (depreciation) on investments | | 305,271 |
Net Assets, for 1,186,125 shares outstanding | | $ 12,991,426 |
Net Asset Value, offering price and redemption price per share ($12,991,426 ÷ 1,186,125 shares) | | $ 10.95 |
Statement of Operations
| Year ended December 31, 2013 |
| | |
Investment Income | | |
Income distributions from underlying funds | | $ 228,756 |
| | |
Expenses | | |
Independent trustees' compensation | $ 48 | |
Total expenses before reductions | 48 | |
Expenses reductions | (48) | 0 |
Net investment income (loss) | | 228,756 |
Realized and Unrealized Gain (Loss) Realized gain (loss) on sale of underlying fund shares | 153,582 | |
Capital gain distributions from underlying funds | 171,264 | |
Total net realized gain (loss) | | 324,846 |
Change in net unrealized appreciation (depreciation) on underlying funds | | 636,670 |
Net gain (loss) | | 961,516 |
Net increase (decrease) in net assets resulting from operations | | $ 1,190,272 |
See accompanying notes which are an integral part of the financial statements.
Annual Report
Statement of Changes in Net Assets
| Year ended
December 31,
2013 | Year ended
December 31,
2012 |
Increase (Decrease) in Net Assets | | |
Operations | | |
Net investment income (loss) | $ 228,756 | $ 225,817 |
Net realized gain (loss) | 324,846 | 243,848 |
Change in net unrealized appreciation (depreciation) | 636,670 | 657,851 |
Net increase (decrease) in net assets resulting from operations | 1,190,272 | 1,127,516 |
Distributions to shareholders from net investment income | (230,800) | (224,866) |
Distributions to shareholders from net realized gain | (149,260) | (219,217) |
Total distributions | (380,060) | (444,083) |
Share transactions
Proceeds from sales of shares | 1,418,782 | 1,367,992 |
Reinvestment of distributions | 380,060 | 444,083 |
Cost of shares redeemed | (1,654,250) | (1,205,660) |
Net increase (decrease) in net assets resulting from share transactions | 144,592 | 606,415 |
Total increase (decrease) in net assets | 954,804 | 1,289,848 |
| | |
Net Assets | | |
Beginning of period | 12,036,622 | 10,746,774 |
End of period (including undistributed net investment income of $0 and $952, respectively) | $ 12,991,426 | $ 12,036,622 |
Other Information Shares | | |
Sold | 132,500 | 131,981 |
Issued in reinvestment of distributions | 35,198 | 43,598 |
Redeemed | (154,296) | (117,015) |
Net increase (decrease) | 13,402 | 58,564 |
Financial Highlights
Years ended December 31, | 2013 | 2012 | 2011 | 2010 | 2009 |
Selected Per-Share Data | | | | | |
Net asset value, beginning of period | $ 10.26 | $ 9.65 | $ 9.88 | $ 9.13 | $ 7.81 |
Income from Investment Operations | | | | | |
Net investment income (loss) C | .19 | .20 | .22 | .21 | .36 |
Net realized and unrealized gain (loss) | .83 | .80 | (.17) | .87 | 1.40 |
Total from investment operations | 1.02 | 1.00 | .05 | 1.08 | 1.76 |
Distributions from net investment income | (.20) | (.20) | (.21) | (.22) | (.36) |
Distributions from net realized gain | (.13) | (.19) | (.06) | (.11) | (.08) |
Total distributions | (.33) | (.39) | (.28) G | (.33) | (.44) |
Net asset value, end of period | $ 10.95 | $ 10.26 | $ 9.65 | $ 9.88 | $ 9.13 |
Total Return A, B | 9.96% | 10.42% | .48% | 11.84% | 22.76% |
Ratios to Average Net Assets D, F | | | | | |
Expenses before reductions E | .00% | .00% | .00% | .00% | .00% |
Expenses net of fee waivers, if any | .00% | .00% | .00% | .00% | .00% |
Expenses net of all reductions | .00% | .00% | .00% | .00% | .00% |
Net investment income (loss) | 1.81% | 1.97% | 2.25% | 2.26% | 4.28% |
Supplemental Data | | | | | |
Net assets, end of period (000 omitted) | $ 12,991 | $ 12,037 | $ 10,747 | $ 10,345 | $ 8,773 |
Portfolio turnover rate D | 22% | 19% | 17% | 26% | 20% |
A Total returns do not reflect charges attributable to your insurance company's separate account. Inclusion of these charges would reduce the total returns shown.
B Total returns would have been lower if certain expenses had not been reduced during the applicable periods shown.
C Calculated based on average shares outstanding during the period.
D Amounts do not include the activity of the Underlying Funds.
E Amount represents less than .01%.
F Expense ratios reflect operating expenses of the Fund. Expenses before reductions do not reflect amounts reimbursed by the investment adviser or reductions from expense offset arrangements and do not represent the amount paid by the Fund during periods when reimbursements or reductions occur. Expenses net of fee waivers reflect expenses after reimbursement by the investment adviser but prior to reductions from expense offset arrangements. Expenses net of all reductions represent the net expenses paid by the Fund but do not include expenses of the investment companies in which the Fund invests.
G Total distributions of $.28 per share is comprised of distributions from net investment income of $.214 and distributions from net realized gain of $.064 per share.
See accompanying notes which are an integral part of the financial statements.
Annual Report
VIP Freedom Lifetime Income II Portfolio
Investment Changes (Unaudited)
The information in the following tables is based on the direct investments of the Fund. |
Fund Holdings as of December 31, 2013 |
| % of fund's
net assets | % of fund's net assets
6 months ago |
Domestic Equity Funds | | |
VIP Contrafund Portfolio Investor Class | 6.1 | 6.0 |
VIP Equity-Income Portfolio Investor Class | 6.1 | 6.4 |
VIP Growth & Income Portfolio Investor Class | 7.2 | 7.3 |
VIP Growth Portfolio Investor Class | 6.4 | 6.1 |
VIP Mid Cap Portfolio Investor Class | 1.8 | 1.7 |
VIP Value Portfolio Investor Class | 4.6 | 4.7 |
VIP Value Strategies Portfolio Investor Class | 2.3 | 2.3 |
| 34.5 | 34.5 |
Developed International Equity Funds | | |
VIP Overseas Portfolio Investor Class R | 9.9 | 9.5 |
Emerging Markets Equity Funds | | |
VIP Emerging Markets Portfolio Investor Class R | 2.5 | 2.7 |
High Yield Bond Funds | | |
VIP High Income Portfolio Investor Class | 5.0 | 5.0 |
Investment Grade Bond Funds | | |
VIP Investment Grade Bond Portfolio Investor Class | 38.5 | 38.7 |
Short-Term Funds | | |
VIP Money Market Portfolio Investor Class | 9.6 | 9.6 |
Net Other Assets (Liabilities)* | 0.0 | 0.0 |
| 100.0 | 100.0 |
* Amount represents less than 0.1%. |
Asset Allocation (% of fund's net assets) |
Period end |
| Domestic Equity Funds | 34.5% | |
| Developed International Equity Funds | 9.9% | |
| Emerging Markets Equity Funds | 2.5% | |
| High Yield Bond Funds | 5.0% | |
| Investment Grade Bond Funds | 38.5% | |
| Short-Term Funds | 9.6% | |

Six months ago |
| Domestic Equity Funds | 34.5% | |
| Developed International Equity Funds | 9.5% | |
| Emerging Markets Equity Funds | 2.7% | |
| High Yield Bond Funds | 5.0% | |
| Investment Grade Bond Funds | 38.7% | |
| Short-Term Funds | 9.6% | |

Expected |
| Domestic Equity Funds | 33.2% | |
| Developed International Equity Funds | 9.5% | |
| Emerging Markets Equity Funds | 2.6% | |
| High Yield Bond Funds | 5.0% | |
| Investment Grade Bond Funds | 39.8% | |
| Short-Term Funds | 9.9% | |

The fund invests according to an asset allocation strategy that becomes increasingly conservative over time. The six months ago allocation is based on the fund's holdings as of June 30, 2013. The period end allocation is based on the fund's holdings as of December 31, 2013. The expected allocation represents the fund's anticipated allocation at June 30, 2014. |
Annual Report
VIP Freedom Lifetime Income II Portfolio
Investments December 31, 2013
Showing Percentage of Net Assets
Domestic Equity Funds - 34.5% |
| Shares | | Value |
Domestic Equity Funds - 34.5% |
VIP Contrafund Portfolio Investor Class (b) | 41,024 | | $ 1,403,825 |
VIP Equity-Income Portfolio Investor Class (b) | 60,963 | | 1,414,953 |
VIP Growth & Income Portfolio Investor Class (b) | 86,644 | | 1,654,034 |
VIP Growth Portfolio Investor Class (b) | 25,792 | | 1,469,901 |
VIP Mid Cap Portfolio Investor Class (b) | 11,756 | | 426,151 |
VIP Value Portfolio Investor Class (b) | 70,178 | | 1,064,594 |
VIP Value Strategies Portfolio Investor Class (b) | 37,086 | | 530,701 |
TOTAL DOMESTIC EQUITY FUNDS (Cost $6,806,192) |
7,964,159
|
International Equity Funds - 12.4% |
| | | |
Developed International Equity Funds - 9.9% |
VIP Overseas Portfolio Investor Class R (b) | 111,284 | | 2,290,233 |
Emerging Markets Equity Funds - 2.5% |
VIP Emerging Markets Portfolio Investor Class R (b) | 63,700 | | 572,025 |
TOTAL INTERNATIONAL EQUITY FUNDS (Cost $2,861,213) |
2,862,258
|
Bond Funds - 43.5% |
| Shares | | Value |
High Yield Bond Funds - 5.0% |
VIP High Income Portfolio Investor Class (b) | 198,590 | | $ 1,147,848 |
Investment Grade Bond Funds - 38.5% |
VIP Investment Grade Bond Portfolio Investor Class (b) | 722,042 | | 8,895,556 |
TOTAL BOND FUNDS (Cost $10,397,945) |
10,043,404
|
Short-Term Funds - 9.6% |
| | | |
VIP Money Market Portfolio Investor Class 0.01% (a)(b)
(Cost $2,201,020) | 2,201,020 | |
2,201,020
|
TOTAL INVESTMENT PORTFOLIO - 100.0% (Cost $22,266,370) | | 23,070,841 |
NET OTHER ASSETS (LIABILITIES) - 0.0% | | 1 |
NET ASSETS - 100% | $ 23,070,842 |
Legend |
(a) The rate quoted is the annualized seven-day yield of the fund at period end. |
(b) Affiliated company |
Affiliated Underlying Funds |
Information regarding the Fund's fiscal year to date purchases and sales of the affiliated Underlying Funds and income earned by the Fund from investments in affiliated Underlying Funds is as follows: |
Affiliate | Value,
beginning of
period | Purchases | Sales
Proceeds | Dividend
Income | Value,
end of
period |
VIP Contrafund Portfolio Investor Class | $ 1,142,986 | $ 143,590 | $ 221,339 | $ 12,848 | $ 1,403,825 |
VIP Emerging Markets Portfolio Investor Class R | 591,486 | 65,770 | 104,331 | 3,797 | 572,025 |
VIP Equity-Income Portfolio Investor Class | 1,223,396 | 257,558 | 280,763 | 32,358 | 1,414,953 |
VIP Growth & Income Portfolio Investor Class | 1,382,275 | 183,995 | 335,541 | 27,559 | 1,654,034 |
VIP Growth Portfolio Investor Class | 1,132,857 | 137,121 | 206,126 | 2,884 | 1,469,901 |
VIP High Income Portfolio Investor Class | 1,018,151 | 207,064 | 74,165 | 66,157 | 1,147,848 |
VIP Investment Grade Bond Portfolio Investor Class | 7,767,877 | 2,177,305 | 582,256 | 212,441 | 8,895,556 |
VIP Mid Cap Portfolio Investor Class | 340,295 | 89,174 | 71,342 | 1,684 | 426,151 |
VIP Money Market Portfolio Investor Class | 1,834,279 | 508,701 | 141,960 | 374 | 2,201,020 |
VIP Overseas Portfolio Investor Class R | 1,928,234 | 245,061 | 423,486 | 27,183 | 2,290,233 |
VIP Value Portfolio Investor Class | 909,230 | 192,397 | 228,970 | 10,419 | 1,064,594 |
VIP Value Strategies Portfolio Investor Class | 450,710 | 53,354 | 101,300 | 4,160 | 530,701 |
Total | $ 19,721,776 | $ 4,261,090 | $ 2,771,579 | $ 401,864 | $ 23,070,841 |
Other Information |
All investments are categorized as Level 1 under the Fair Value Hierarchy. The inputs or methodology used for valuing securities may not be an indication of the risk associated with investing in those securities. For more information on valuation inputs, please refer to the Investment Valuation section in the accompanying Notes to Financial Statements. |
See accompanying notes which are an integral part of the financial statements.
Annual Report
VIP Freedom Lifetime Income II Portfolio
Statement of Assets and Liabilities
| December 31, 2013 |
| | |
Assets | | |
Investment in securities, at value (cost $22,266,370) - See accompanying schedule | | $ 23,070,841 |
Cash | | 2 |
Receivable for investments sold | | 380 |
Total assets | | 23,071,223 |
| | |
Liabilities | | |
Payable for fund shares redeemed | | 381 |
| | |
Net Assets | | $ 23,070,842 |
Net Assets consist of: | | |
Paid in capital | | $ 22,510,728 |
Accumulated undistributed net realized gain (loss) on investments | | (244,357) |
Net unrealized appreciation (depreciation) on investments | | 804,471 |
Net Assets, for 2,018,042 shares outstanding | | $ 23,070,842 |
Net Asset Value, offering price and redemption price per share ($23,070,842 ÷ 2,018,042 shares) | | $ 11.43 |
Statement of Operations
| Year ended December 31, 2013 |
| | |
Investment Income | | |
Income distributions from underlying funds | | $ 401,864 |
| | |
Expenses | | |
Independent trustees' compensation | $ 81 | |
Total expenses before reductions | 81 | |
Expense reductions | (81) | 0 |
Net investment income (loss) | | 401,864 |
Realized and Unrealized Gain (Loss) Realized gain (loss) on sale of underlying fund shares | 158,944 | |
Capital gain distributions from underlying funds | 339,406 | |
Total net realized gain (loss) | | 498,350 |
Change in net unrealized appreciation (depreciation) on underlying funds | | 1,700,609 |
Net gain (loss) | | 2,198,959 |
Net increase (decrease) in net assets resulting from operations | | $ 2,600,823 |
See accompanying notes which are an integral part of the financial statements.
Annual Report
Statement of Changes in Net Assets
| Year ended
December 31,
2013 | Year ended
December 31,
2012 |
Increase (Decrease) in Net Assets | | |
Operations | | |
Net investment income (loss) | $ 401,864 | $ 383,936 |
Net realized gain (loss) | 498,350 | 368,989 |
Change in net unrealized appreciation (depreciation) | 1,700,609 | 1,204,692 |
Net increase (decrease) in net assets resulting from operations | 2,600,823 | 1,957,617 |
Distributions to shareholders from net investment income | (405,910) | (381,234) |
Distributions to shareholders from net realized gain | (88,661) | (166,559) |
Total distributions | (494,571) | (547,793) |
Share transactions
Proceeds from sales of shares | 2,232,231 | 4,336,852 |
Reinvestment of distributions | 494,571 | 547,793 |
Cost of shares redeemed | (1,483,988) | (3,166,240) |
Net increase (decrease) in net assets resulting from share transactions | 1,242,814 | 1,718,405 |
Total increase (decrease) in net assets | 3,349,066 | 3,128,229 |
| | |
Net Assets | | |
Beginning of period | 19,721,776 | 16,593,547 |
End of period (including undistributed net investment income of $0 and $710, respectively) | $ 23,070,842 | $ 19,721,776 |
Other Information Shares | | |
Sold | 205,615 | 420,942 |
Issued in reinvestment of distributions | 43,409 | 53,184 |
Redeemed | (134,692) | (308,787) |
Net increase (decrease) | 114,332 | 165,339 |
Financial Highlights
Years ended December 31, | 2013 | 2012 | 2011 | 2010 | 2009 |
Selected Per-Share Data | | | | | |
Net asset value, beginning of period | $ 10.36 | $ 9.55 | $ 9.79 | $ 8.90 | $ 7.42 |
Income from Investment Operations | | | | | |
Net investment income (loss) C | .20 | .21 | .23 | .21 | .34 |
Net realized and unrealized gain (loss) | 1.12 | .90 | (.21) | .95 | 1.59 |
Total from investment operations | 1.32 | 1.11 | .02 | 1.16 | 1.93 |
Distributions from net investment income | (.21) | (.21) | (.22) | (.22) | (.36) |
Distributions from net realized gain | (.05) | (.09) | (.04) | (.05) | (.09) |
Total distributions | (.25) G | (.30) | (.26) | (.27) | (.45) |
Net asset value, end of period | $ 11.43 | $ 10.36 | $ 9.55 | $ 9.79 | $ 8.90 |
Total Return A, B | 12.76% | 11.60% | .25% | 12.99% | 26.44% |
Ratios to Average Net Assets D, F | | | | | |
Expenses before reductions E | .00% | .00% | .00% | .00% | .00% |
Expenses net of fee waivers, if any | .00% | .00% | .00% | .00% | .00% |
Expenses net of all reductions | .00% | .00% | .00% | .00% | .00% |
Net investment income (loss) | 1.86% | 2.06% | 2.33% | 2.22% | 4.25% |
Supplemental Data | | | | | |
Net assets, end of period (000 omitted) | $ 23,071 | $ 19,722 | $ 16,594 | $ 14,637 | $ 14,172 |
Portfolio turnover rate D | 13% | 25% | 12% | 23% | 21% |
A Total returns do not reflect charges attributable to your insurance company's separate account. Inclusion of these charges would reduce the total returns shown.
B Total returns would have been lower if certain expenses had not been reduced during the applicable periods shown.
C Calculated based on average shares outstanding during the period.
D Amounts do not include the activity of the Underlying Funds.
E Amount represents less than .01%.
F Expense ratios reflect operating expenses of the Fund. Expenses before reductions do not reflect amounts reimbursed by the investment adviser or reductions from expense offset arrangements and do not represent the amount paid by the Fund during periods when reimbursements or reductions occur. Expenses net of fee waivers reflect expenses after reimbursement by the investment adviser but prior to reductions from expense offset arrangements. Expenses net of all reductions represent the net expenses paid by the Fund but do not include expenses of the investment companies in which the Fund invests.
G Total distributions of $.25 per share is comprised of distributions from net investment income of $.206 and distributions from net realized gain of $.045 per share.
See accompanying notes which are an integral part of the financial statements.
Annual Report
VIP Freedom Lifetime Income III Portfolio
Investment Changes (Unaudited)
The information in the following tables is based on the direct investments of the Fund. |
Fund Holdings as of December 31, 2013 |
| % of fund's
net assets | % of fund's net assets
6 months ago |
Domestic Equity Funds | | |
VIP Contrafund Portfolio Investor Class | 9.0 | 9.0 |
VIP Equity-Income Portfolio Investor Class | 9.1 | 9.5 |
VIP Growth & Income Portfolio Investor Class | 10.7 | 10.9 |
VIP Growth Portfolio Investor Class | 9.4 | 9.1 |
VIP Mid Cap Portfolio Investor Class | 2.7 | 2.6 |
VIP Value Portfolio Investor Class | 6.9 | 7.0 |
VIP Value Strategies Portfolio Investor Class | 3.4 | 3.4 |
| 51.2 | 51.5 |
Developed International Equity Funds | | |
VIP Overseas Portfolio Investor Class R | 14.7 | 14.3 |
Emerging Markets Equity Funds | | |
VIP Emerging Markets Portfolio Investor Class R | 3.8 | 4.1 |
High Yield Bond Funds | | |
VIP High Income Portfolio Investor Class | 7.3 | 7.4 |
Investment Grade Bond Funds | | |
VIP Investment Grade Bond Portfolio Investor Class | 22.7 | 22.6 |
Short-Term Funds | | |
VIP Money Market Portfolio Investor Class | 0.3 | 0.1 |
Net Other Assets (Liabilities) | 0.0 | 0.0 |
| 100.0 | 100.0 |
Asset Allocation (% of fund's net assets) |
Period end |
| Domestic Equity Funds | 51.2% | |
| Developed International Equity Funds | 14.7% | |
| Emerging Markets Equity Funds | 3.8% | |
| High Yield Bond Funds | 7.3% | |
| Investment Grade Bond Funds | 22.7% | |
| Short-Term Funds | 0.3% | |

Six months ago |
| Domestic Equity Funds | 51.5% | |
| Developed International Equity Funds | 14.3% | |
| Emerging Markets Equity Funds | 4.1% | |
| High Yield Bond Funds | 7.4% | |
| Investment Grade Bond Funds | 22.6% | |
| Short-Term Funds | 0.1% | |

Expected |
| Domestic Equity Funds | 49.8% | |
| Developed International Equity Funds | 14.3% | |
| Emerging Markets Equity Funds | 3.8% | |
| High Yield Bond Funds | 7.5% | |
| Investment Grade Bond Funds | 24.1% | |
| Short-Term Funds | 0.5% | |

The fund invests according to an asset allocation strategy that becomes increasingly conservative over time. The six months ago allocation is based on the fund's holdings as of June 30, 2013. The period end allocation is based on the fund's holdings as of December 31, 2013. The expected allocation represents the fund's anticipated allocation at June 30, 2014. |
Annual Report
VIP Freedom Lifetime Income III Portfolio
Investments December 31, 2013
Showing Percentage of Net Assets
Domestic Equity Funds - 51.2% |
| Shares | | Value |
Domestic Equity Funds - 51.2% |
VIP Contrafund Portfolio Investor Class (b) | 33,442 | | $ 1,144,394 |
VIP Equity-Income Portfolio Investor Class (b) | 49,939 | | 1,159,079 |
VIP Growth & Income Portfolio Investor Class (b) | 70,798 | | 1,351,539 |
VIP Growth Portfolio Investor Class (b) | 20,972 | | 1,195,187 |
VIP Mid Cap Portfolio Investor Class (b) | 9,466 | | 343,155 |
VIP Value Portfolio Investor Class (b) | 57,229 | | 868,158 |
VIP Value Strategies Portfolio Investor Class (b) | 30,012 | | 429,477 |
TOTAL DOMESTIC EQUITY FUNDS (Cost $5,585,390) |
6,490,989
|
International Equity Funds - 18.5% |
| | | |
Developed International Equity Funds - 14.7% |
VIP Overseas Portfolio Investor Class R (b) | 90,684 | | 1,866,281 |
Emerging Markets Equity Funds - 3.8% |
VIP Emerging Markets Portfolio Investor Class R (b) | 52,975 | | 475,711 |
TOTAL INTERNATIONAL EQUITY FUNDS (Cost $2,224,298) |
2,341,992
|
Bond Funds - 30.0% |
| Shares | | Value |
High Yield Bond Funds - 7.3% |
VIP High Income Portfolio Investor Class (b) | 159,983 | | $ 924,700 |
Investment Grade Bond Funds - 22.7% |
VIP Investment Grade Bond Portfolio Investor Class (b) | 232,920 | | 2,869,576 |
TOTAL BOND FUNDS (Cost $3,936,313) |
3,794,276
|
Short-Term Funds - 0.3% |
| | | |
VIP Money Market Portfolio Investor Class 0.01% (a)(b)
(Cost $34,017) | 34,017 | |
34,017
|
TOTAL INVESTMENT PORTFOLIO - 100.0% (Cost $11,780,018) | | 12,661,274 |
NET OTHER ASSETS (LIABILITIES) - 0.0% | | 0 |
NET ASSETS - 100% | $ 12,661,274 |
Legend |
(a) The rate quoted is the annualized seven-day yield of the fund at period end. |
(b) Affiliated company |
Affiliated Underlying Funds |
Information regarding the Fund's fiscal year to date purchases and sales of the affiliated Underlying Funds and income earned by the Fund from investments in affiliated Underlying Funds is as follows: |
Affiliate | Value,
beginning of
period | Purchases | Sales
Proceeds | Dividend
Income | Value,
end of
period |
VIP Contrafund Portfolio Investor Class | $ 726,941 | $ 351,046 | $ 163,353 | $ 9,685 | $ 1,144,394 |
VIP Emerging Markets Portfolio Investor Class R | 376,379 | 168,943 | 83,302 | 2,901 | 475,711 |
VIP Equity-Income Portfolio Investor Class | 778,208 | 449,187 | 201,557 | 24,433 | 1,159,079 |
VIP Growth & Income Portfolio Investor Class | 879,282 | 430,108 | 239,871 | 20,764 | 1,351,539 |
VIP Growth Portfolio Investor Class | 720,215 | 351,752 | 154,958 | 2,173 | 1,195,187 |
VIP High Income Portfolio Investor Class | 632,852 | 400,289 | 100,873 | 48,919 | 924,700 |
VIP Investment Grade Bond Portfolio Investor Class | 1,891,681 | 1,428,402 | 314,520 | 63,011 | 2,869,576 |
VIP Mid Cap Portfolio Investor Class | 216,541 | 136,974 | 54,211 | 1,258 | 343,155 |
VIP Money Market Portfolio Investor Class | 4,188 | 32,639 | 2,811 | 2 | 34,017 |
VIP Overseas Portfolio Investor Class R | 1,227,043 | 579,042 | 312,222 | 20,460 | 1,866,281 |
VIP Value Portfolio Investor Class | 578,668 | 332,259 | 164,699 | 7,844 | 868,158 |
VIP Value Strategies Portfolio Investor Class | 287,004 | 131,795 | 75,859 | 3,112 | 429,477 |
Total | $ 8,319,002 | $ 4,792,436 | $ 1,868,236 | $ 204,562 | $ 12,661,274 |
Other Information |
All investments are categorized as Level 1 under the Fair Value Hierarchy. The inputs or methodology used for valuing securities may not be an indication of the risk associated with investing in those securities. For more information on valuation inputs, please refer to the Investment Valuation section in the accompanying Notes to Financial Statements. |
See accompanying notes which are an integral part of the financial statements.
Annual Report
VIP Freedom Lifetime Income III Portfolio
Statement of Assets and Liabilities
| December 31, 2013 |
| | |
Assets | | |
Investment in securities, at value (cost $11,780,018) - See accompanying schedule | | $ 12,661,274 |
Receivable for investments sold | | 208 |
Total assets | | 12,661,482 |
| | |
Liabilities | | |
Payable to custodian bank | $ 1 | |
Payable for fund shares redeemed | 207 | |
Total liabilities | | 208 |
| | |
Net Assets | | $ 12,661,274 |
Net Assets consist of: | | |
Paid in capital | | $ 11,665,096 |
Accumulated undistributed net realized gain (loss) on investments | | 114,922 |
Net unrealized appreciation (depreciation) on investments | | 881,256 |
Net Assets, for 1,078,669 shares outstanding | | $ 12,661,274 |
Net Asset Value, offering price and redemption price per share ($12,661,274 ÷ 1,078,669 shares) | | $ 11.74 |
Statement of Operations
| Year ended December 31, 2013 |
| | |
Investment Income | | |
Income distributions from underlying funds | | $ 204,562 |
| | |
Expenses | | |
Independent trustees' compensation | $ 36 | |
Total expenses before reductions | 36 | |
Expense reductions | (36) | 0 |
Net investment income (loss) | | 204,562 |
Realized and Unrealized Gain (Loss) Realized gain (loss) on sale of underlying fund shares | 47,598 | |
Capital gain distributions from underlying funds | 203,718 | |
Total net realized gain (loss) | | 251,316 |
Change in net unrealized appreciation (depreciation) on underlying funds | | 1,370,475 |
Net gain (loss) | | 1,621,791 |
Net increase (decrease) in net assets resulting from operations | | $ 1,826,353 |
See accompanying notes which are an integral part of the financial statements.
Annual Report
Statement of Changes in Net Assets
| Year ended
December 31,
2013 | Year ended
December 31,
2012 |
Increase (Decrease) in Net Assets | | |
Operations | | |
Net investment income (loss) | $ 204,562 | $ 178,493 |
Net realized gain (loss) | 251,316 | 158,158 |
Change in net unrealized appreciation (depreciation) | 1,370,475 | 735,684 |
Net increase (decrease) in net assets resulting from operations | 1,826,353 | 1,072,335 |
Distributions to shareholders from net investment income | (206,323) | (176,434) |
Distributions to shareholders from net realized gain | (90,884) | (52,606) |
Total distributions | (297,207) | (229,040) |
Share transactions
Proceeds from sales of shares | 3,863,570 | 1,393,113 |
Reinvestment of distributions | 297,207 | 229,040 |
Cost of shares redeemed | (1,347,649) | (970,490) |
Net increase (decrease) in net assets resulting from share transactions | 2,813,128 | 651,663 |
Total increase (decrease) in net assets | 4,342,274 | 1,494,958 |
| | |
Net Assets | | |
Beginning of period | 8,319,000 | 6,824,042 |
End of period (including undistributed net investment income of $0 and $1,513, respectively) | $ 12,661,274 | $ 8,319,000 |
Other Information Shares | | |
Sold | 344,361 | 142,165 |
Issued in reinvestment of distributions | 25,618 | 23,135 |
Redeemed | (123,719) | (97,600) |
Net increase (decrease) | 246,260 | 67,700 |
Financial Highlights
Years ended December 31, | 2013 | 2012 | 2011 | 2010 | 2009 |
Selected Per-Share Data | | | | | |
Net asset value, beginning of period | $ 9.99 | $ 8.92 | $ 9.37 | $ 8.28 | $ 6.72 |
Income from Investment Operations | | | | | |
Net investment income (loss) C | .23 | .23 | .20 | .18 | .24 |
Net realized and unrealized gain (loss) | 1.81 | 1.12 | (.42) | 1.14 | 1.76 |
Total from investment operations | 2.04 | 1.35 | (.22) | 1.32 | 2.00 |
Distributions from net investment income | (.20) | (.22) | (.20) | (.19) | (.26) |
Distributions from net realized gain | (.09) | (.07) | (.03) | (.04) | (.18) |
Total distributions | (.29) | (.28) G | (.23) | (.23) | (.44) |
Net asset value, end of period | $ 11.74 | $ 9.99 | $ 8.92 | $ 9.37 | $ 8.28 |
Total Return A, B | 20.43% | 15.20% | (2.36)% | 15.98% | 30.34% |
Ratios to Average Net Assets D, F | | | | | |
Expenses before reductions E | .00% | .00% | .00% | .00% | .00% |
Expenses net of fee waivers, if any | .00% | .00% | .00% | .00% | .00% |
Expenses net of all reductions | .00% | .00% | .00% | .00% | .00% |
Net investment income (loss) | 2.07% | 2.34% | 2.13% | 2.03% | 3.33% |
Supplemental Data | | | | | |
Net assets, end of period (000 omitted) | $ 12,661 | $ 8,319 | $ 6,824 | $ 6,741 | $ 6,630 |
Portfolio turnover rate D | 19% | 20% | 16% | 20% | 10% |
A Total returns do not reflect charges attributable to your insurance company's separate account. Inclusion of these charges would reduce the total returns shown.
B Total returns would have been lower if certain expenses had not been reduced during the applicable periods shown.
C Calculated based on average shares outstanding during the period.
D Amounts do not include the activity of the Underlying Funds.
E Amount represents less than .01%.
F Expense ratios reflect operating expenses of the Fund. Expenses before reductions do not reflect amounts reimbursed by the investment adviser or reductions from expense offset arrangements and do not represent the amount paid by the Fund during periods when reimbursements or reductions occur. Expenses net of fee waivers reflect expenses after reimbursement by the investment adviser but prior to reductions from expense offset arrangements. Expenses net of all reductions represent the net expenses paid by the Fund but do not include expenses of the investment companies in which the Fund invests.
G Total distributions of $.28 per share is comprised of distributions from net investment income of $.218 and distributions from net realized gain of $.065 per share.
See accompanying notes which are an integral part of the financial statements.
Annual Report
Notes to Financial Statements
For the period ended December 31, 2013
1. Organization.
VIP Freedom Lifetime Income I Portfolio, VIP Freedom Lifetime Income II Portfolio, and VIP Freedom Lifetime Income III Portfolio (the Funds) are funds of Variable Insurance Products Fund V. The Variable Insurance Products Fund V (the Trust) is registered under the Investment Company Act of 1940, as amended (the 1940 Act), as an open-end management investment company organized as a Massachusetts business trust. Each Fund is authorized to issue an unlimited number of shares. The Funds invest primarily in a combination of other VIP equity, bond, and short-term funds (the Underlying Funds) managed by Fidelity Management & Research Company (FMR). Shares of each Fund may only be purchased by insurance companies for the purpose of funding variable annuity or variable life insurance contracts.
2. Significant Accounting Policies.
The financial statements have been prepared in conformity with accounting principles generally accepted in the United States of America (GAAP), which require management to make certain estimates and assumptions at the date of the financial statements. Actual results could differ from those estimates. Subsequent events, if any, through the date that the financial statements were issued have been evaluated in the preparation of the financial statements. The following summarizes the significant accounting policies of the Funds:
Investment Valuation. Investments are valued as of 4:00 p.m. Eastern time on the last calendar day of the period. Each Fund categorizes the inputs to valuation techniques used to value its investments into a disclosure hierarchy consisting of three levels as shown below:
Level 1 - quoted prices in active markets for identical investments
Level 2 - other significant observable inputs (including quoted prices for similar investments, interest rates, prepayment speeds, etc.)
Level 3 - unobservable inputs (including the Fund's own assumptions based on the best information available)
Valuation techniques used to value each Fund's investments by major category are as follows. Investments in the Underlying Funds are valued at their closing net asset value (NAV) each business day and are categorized as Level 1 in the hierarchy.
Investment Transactions and Income. For financial reporting purposes, the Funds' investment holdings and NAV include trades executed through the end of the last business day of the period. The NAV per share for processing shareholder transactions is calculated as of the close of business of the New York Stock Exchange (NYSE), normally 4:00 p.m. Eastern time and includes trades executed through the end of the prior business day. Gains and losses on securities sold are determined on the basis of identified cost. Income and capital gain distributions from the Underlying Funds, if any, are recorded on the ex-dividend date.
Expenses. Expenses directly attributable to a fund are charged to that fund. Expenses attributable to more than one fund are allocated among the respective funds on the basis of relative net assets or other appropriate methods. Expenses included in the accompanying financial statements reflect the expenses of each Fund and do not include any expenses associated with the Underlying Funds. Although not included in each Fund's expenses, each Fund indirectly bears its proportionate share of the Underlying Funds' expenses through the impact of these expenses on each Underlying Fund's NAV. Expense estimates are accrued in the period to which they relate and adjustments are made when actual amounts are known.
Income Tax Information and Distributions to Shareholders. Each year, each Fund intends to qualify as a regulated investment company under Subchapter M of the Internal Revenue Code, including distributing substantially all of its taxable income and realized gains. As a result, no provision for U.S. Federal income taxes is required. As of December 31, 2013, each Fund did not have any unrecognized tax benefits in the financial statements; nor is each Fund aware of any tax positions for which it is reasonably possible that the total amounts of unrecognized tax benefits will significantly change in the next twelve months. Each Fund files a U.S. federal tax return, in addition to state and local tax returns as required. Each Fund's federal income tax returns are subject to examination by the Internal Revenue Service (IRS) for a period of three fiscal years after they are filed. State and local tax returns may be subject to examination for an additional fiscal year depending on the jurisdiction.
Distributions are declared and recorded on the ex-dividend date. Income and capital gain distributions are determined in accordance with income tax regulations, which may differ from GAAP.
Capital accounts within the financial statements are adjusted for permanent book-tax differences. These adjustments have no impact on net assets or the results of operations. Capital accounts are not adjusted for temporary book-tax differences which will reverse in a subsequent period.
Book-tax differences are primarily due to the short-term gain distributions from the Underlying Funds, capital loss carryforwards and losses deferred due to wash sales.
Annual Report
2. Significant Accounting Policies - continued
Income Tax Information and Distributions to Shareholders - continued
The federal tax cost of investment securities and unrealized appreciation (depreciation) as of period end were as follows for each Fund:
| Tax cost | Gross unrealized
appreciation | Gross unrealized
depreciation | Net unrealized
appreciation
(depreciation) on
securities and
other investments |
VIP Freedom Lifetime Income I | $ 12,727,968 | $ 661,027 | $ (397,570) | $ 263,457 |
VIP Freedom Lifetime Income II | 22,381,577 | 1,420,560 | (731,296) | 689,264 |
VIP Freedom Lifetime Income III | 11,832,734 | 1,154,765 | (326,225) | 828,540 |
The tax-based components of distributable earnings as of period end were as follows for each Fund:
| Undistributed
ordinary
income | Undistributed
long-term
capital gain | Capital loss
carryforward | Net
unrealized
appreciation
(depreciation) |
VIP Freedom Lifetime Income I | $ 8,257 | $ 242,971 | $ - | $ 263,457 |
VIP Freedom Lifetime Income II | - | - | (129,150) | 689,264 |
VIP Freedom Lifetime Income III | 10,712 | 156,927 | - | 828,540 |
Capital loss carryforwards are only available to offset future capital gains of the Funds to the extent provided by regulations and may be limited. Under the Regulated Investment Company Modernization Act of 2010 (the Act), the Funds are permitted to carry forward capital losses incurred in taxable years beginning after December 22, 2010 for an unlimited period and such capital losses are required to be used prior to any losses that expire. The capital loss carryforward information presented below, including any applicable limitation, is estimated as of fiscal period end and is subject to adjustment.
| Fiscal year of expiration
2018 |
VIP Freedom Lifetime Income II | $ (129,150) |
The tax character of distributions paid was as follows:
December 31, 2013 | | | |
| Ordinary Income | Long-term
Capital Gains | Total |
VIP Freedom Lifetime Income I | $ 291,161 | $ 88,899 | $ 380,060 |
VIP Freedom Lifetime Income II | 494,571 | - | 494,571 |
VIP Freedom Lifetime Income III | 281,217 | 15,990 | 297,207 |
December 31, 2012 | | | |
| Ordinary Income | Long-term
Capital Gains | Total |
VIP Freedom Lifetime Income I | $ 381,592 | $ 62,491 | $ 444,083 |
VIP Freedom Lifetime Income II | 547,793 | - | 547,793 |
VIP Freedom Lifetime Income III | 229,040 | - | 229,040 |
3. Purchases and Sales of Investments.
Purchases and redemptions of the Underlying Fund shares are noted in the table below.
| Purchases ($) | Redemptions ($) |
VIP Freedom Lifetime Income I | 2,985,328 | 2,820,781 |
VIP Freedom Lifetime Income II | 4,261,090 | 2,771,579 |
VIP Freedom Lifetime Income III | 4,792,436 | 1,868,236 |
Annual Report
Notes to Financial Statements - continued
4. Fees and Other Transactions with Affiliates.
Management Fee. Strategic Advisers, Inc. (the investment adviser), an affiliate of FMR, provides the Funds with investment management related services. The Funds do not pay any fees for these services.
Other Transactions. The investment adviser has entered into an administration agreement with FMR under which FMR provides management and administrative services (other than investment advisory services) necessary for the operation of each Fund. Pursuant to this agreement, FMR pays all expenses of each Fund, excluding the compensation of the independent Trustees and certain other expenses such as interest expense. FMR also contracts with other Fidelity companies to perform the services necessary for the operation of each Fund. The Funds do not pay any fees for these services.
5. Expense Reductions.
FMR voluntarily agreed to reimburse each Fund to the extent annual operating expenses exceeded certain levels of average net assets as noted in the table below. Some expenses, for example interest expense, are excluded from this reimbursement.
The following Funds were in reimbursement during the period:
| Expense Limitations | Reimbursement |
VIP Freedom Lifetime Income I | .00% | $ 48 |
VIP Freedom Lifetime Income II | .00% | $ 81 |
VIP Freedom Lifetime Income III | .00% | $ 36 |
6. Other.
The Funds' organizational documents provide former and current trustees and officers with a limited indemnification against liabilities arising in connection with the performance of their duties to the Funds. In the normal course of business, the Funds may also enter into contracts that provide general indemnifications. The Funds' maximum exposure under these arrangements is unknown as this would be dependent on future claims that may be made against the Funds. The risk of material loss from such claims is considered remote.
At the end of the period, the investment adviser or its affiliates were owners of record of all of the outstanding shares of the Funds.
Annual Report
Report of Independent Registered Public Accounting Firm
To the Trustees of Variable Insurance Products V and the Shareholders of VIP Freedom Lifetime Income I Portfolio, VIP Freedom Lifetime Income II Portfolio, and VIP Freedom Lifetime Income III Portfolio:
We have audited the accompanying statements of assets and liabilities of VIP Freedom Lifetime Income I Portfolio, VIP Freedom Lifetime Income II Portfolio, and VIP Freedom Lifetime Income III Portfolio (the Funds), each a fund of Variable Insurance Products V, including the schedules of investments, as of December 31, 2013, and the related statements of operations for the year then ended, the statements of changes in net assets for each of the two years in the period then ended, and the financial highlights for each of the five years in the period then ended. These financial statements and financial highlights are the responsibility of the Funds' management. Our responsibility is to express an opinion on these financial statements and financial highlights based on our audits.
We conducted our audits in accordance with the standards of the Public Company Accounting Oversight Board (United States). Those standards require that we plan and perform the audit to obtain reasonable assurance about whether the financial statements and financial highlights are free of material misstatement. The Funds are not required to have, nor were we engaged to perform, an audit of their internal control over financial reporting. Our audits included consideration of internal control over financial reporting as a basis for designing audit procedures that are appropriate in the circumstances, but not for the purpose of expressing an opinion on the effectiveness of the Funds' internal control over financial reporting. Accordingly, we express no such opinion. An audit also includes examining, on a test basis, evidence supporting the amounts and disclosures in the financial statements, assessing the accounting principles used and significant estimates made by management, as well as evaluating the overall financial statement presentation. Our procedures included confirmation of securities owned as of December 31, 2013, by correspondence with the custodians. We believe that our audits provide a reasonable basis for our opinion.
In our opinion, the financial statements and financial highlights referred to above present fairly, in all material respects, the financial position of VIP Freedom Lifetime Income I Portfolio, VIP Freedom Lifetime Income II Portfolio, and VIP Freedom Lifetime Income III Portfolio as of December 31, 2013, the results of their operations for the year then ended, the changes in their net assets for each of the two years in the period then ended, and the financial highlights for each of the five years in the period then ended, in conformity with accounting principles generally accepted in the United States of America.
DELOITTE & TOUCHE LLP
Boston, Massachusetts
February 19, 2014
Annual Report
The Trustees and officers of the trust and funds, as applicable, are listed below. The Board of Trustees governs each VIP Freedom Lifetime Income Portfolio and is responsible for protecting the interests of shareholders. The Trustees are experienced executives who meet periodically throughout the year to oversee each VIP Freedom Lifetime Income Portfolio's activities, review contractual arrangements with companies that provide services to each VIP Freedom Lifetime Income Portfolio, oversee management of the risks associated with such activities and contractual arrangements, and review each VIP Freedom Lifetime Income Portfolio's performance. If the interests of a VIP Freedom Lifetime Income Portfolio and an underlying Fidelity fund were to diverge, a conflict of interest could arise and affect how the Trustees fulfill their fiduciary duties to the affected funds. Strategic Advisers has structured the VIP Freedom Lifetime Income Portfolio to avoid these potential conflicts, although there may be situations where a conflict of interest is unavoidable. In such instances, Strategic Advisers and the Trustees would take reasonable steps to minimize and, if possible, eliminate the conflict. Except for Elizabeth A. Acton and James C. Curvey, each of the Trustees oversees 223 funds. Ms. Acton oversees 205 funds. Mr. Curvey oversees 396 funds.
The Trustees hold office without limit in time except that (a) any Trustee may resign; (b) any Trustee may be removed by written instrument, signed by at least two-thirds of the number of Trustees prior to such removal; (c) any Trustee who requests to be retired or who has become incapacitated by illness or injury may be retired by written instrument signed by a majority of the other Trustees; and (d) any Trustee may be removed at any special meeting of shareholders by a two-thirds vote of the outstanding voting securities of the trust. Each Trustee who is not an interested person (as defined in the 1940 Act) of the trust and the funds (Independent Trustee), shall retire not later than the last day of the month in which his or her 75th birthday occurs. The Independent Trustees may waive this mandatory retirement age policy with respect to individual Trustees. The officers hold office without limit in time, except that any officer may resign or may be removed by a vote of a majority of the Trustees at any regular meeting or any special meeting of the Trustees. Except as indicated, each individual has held the office shown or other offices in the same company for the past five years.
Experience, Skills, Attributes, and Qualifications of the Funds' Trustees. The Governance and Nominating Committee has adopted a statement of policy that describes the experience, qualifications, attributes, and skills that are necessary and desirable for potential Independent Trustee candidates (Statement of Policy). The Board believes that each Trustee satisfied at the time he or she was initially elected or appointed a Trustee, and continues to satisfy, the standards contemplated by the Statement of Policy. The Governance and Nominating Committee also engages professional search firms to help identify potential Independent Trustee candidates who have the experience, qualifications, attributes, and skills consistent with the Statement of Policy. From time to time, additional criteria based on the composition and skills of the current Independent Trustees, as well as experience or skills that may be appropriate in light of future changes to board composition, business conditions, and regulatory or other developments, have also been considered by the professional search firms and the Governance and Nominating Committee. In addition, the Board takes into account the Trustees' commitment and participation in Board and committee meetings, as well as their leadership of standing and ad hoc committees throughout their tenure.
In determining that a particular Trustee was and continues to be qualified to serve as a Trustee, the Board has considered a variety of criteria, none of which, in isolation, was controlling. The Board believes that, collectively, the Trustees have balanced and diverse experience, qualifications, attributes, and skills, which allow the Board to operate effectively in governing each fund and protecting the interests of shareholders. Information about the specific experience, skills, attributes, and qualifications of each Trustee, which in each case led to the Board's conclusion that the Trustee should serve (or continue to serve) as a trustee of the funds, is provided below.
Board Structure and Oversight Function. Abigail P. Johnson is an interested person (as defined in the 1940 Act) and currently serves as Chairman. The Trustees have determined that an interested Chairman is appropriate and benefits shareholders because an interested Chairman has a personal and professional stake in the quality and continuity of services provided to the funds. Independent Trustees exercise their informed business judgment to appoint an individual of their choosing to serve as Chairman, regardless of whether the Trustee happens to be independent or a member of management. The Independent Trustees have determined that they can act independently and effectively without having an Independent Trustee serve as Chairman and that a key structural component for assuring that they are in a position to do so is for the Independent Trustees to constitute a substantial majority for the Board. The Independent Trustees also regularly meet in executive session. Albert R. Gamper, Jr. serves as Chairman of the Independent Trustees and as such (i) acts as a liaison between the Independent Trustees and management with respect to matters important to the Independent Trustees and (ii) with management prepares agendas for Board meetings.
Fidelity funds are overseen by different Boards of Trustees. The funds' Board oversees Fidelity's investment-grade bond, money market, and asset allocation funds and another Board oversees Fidelity's equity and high income funds. The asset allocation funds may invest in Fidelity funds that are overseen by such other Board. The use of separate Boards, each with its own committee structure, allows the Trustees of each group of Fidelity funds to focus on the unique issues of the funds they oversee, including common research, investment, and operational issues. On occasion, the separate Boards establish joint committees to address issues of overlapping consequences for the Fidelity funds overseen by each Board.
The Trustees operate using a system of committees to facilitate the timely and efficient consideration of all matters of importance to the Trustees, each fund, and fund shareholders and to facilitate compliance with legal and regulatory requirements and oversight of the funds' activities and associated risks. The Board, acting through its committees, has charged FMR and its affiliates with (i) identifying events or circumstances the occurrence of which could have demonstrably adverse effects on the funds' business and/or reputation; (ii) implementing processes and controls to lessen the possibility that such events or circumstances occur or to mitigate the effects of such events or circumstances if they do occur; and (iii) creating and maintaining a system designed to evaluate continuously business and market conditions in order to facilitate the identification and implementation processes described in (i) and (ii) above. Because the day-to-day operations and activities of the funds are carried out by or through FMR, its affiliates, and other service providers, the funds' exposure to risks is mitigated but not eliminated by the processes overseen by the Trustees. While each of the Board's committees has responsibility for overseeing different aspects of the funds' activities, oversight is exercised primarily through the Operations and Audit Committees. In addition, an ad hoc Board committee of Independent Trustees has worked with FMR to enhance the Board's oversight of investment and financial risks, legal and regulatory risks, technology risks, and operational risks, including the development of additional risk reporting to the Board. Appropriate personnel, including but not limited to the funds' Chief Compliance Officer (CCO), FMR's internal auditor, the independent accountants, the funds' Treasurer and portfolio management personnel, make periodic reports to the Board's committees, as appropriate, including an annual review of FMR's risk management program for the Fidelity funds. The responsibilities of each standing committee, including their oversight responsibilities, are described further under "Standing Committees of the Funds' Trustees."
Annual Report
The funds' Statement of Additional Information (SAI) includes more information about the Trustees. To request a free copy, call Fidelity at 1-877-208-0098.
Interested Trustees*:
Correspondence intended for each Trustee who is an interested person may be sent to Fidelity Investments, 245 Summer Street, Boston, Massachusetts 02210.
Name, Year of Birth; Principal Occupations and Other Relevant Experience+ |
James C. Curvey (1935) |
Year of Election or Appointment: 2007 Trustee |
| Mr. Curvey also serves as Trustee of other Fidelity funds. Mr. Curvey is a Director of Fidelity Investments Money Management, Inc. (2009-present), Director of Fidelity Research & Analysis Co. (2009-present) and Director of FMR and FMR Co., Inc. (2007-present). Mr. Curvey is also Vice Chairman (2007-present) and Director of FMR LLC. In addition, Mr. Curvey serves as an Overseer for the Boston Symphony Orchestra and a member of the Trustees of Villanova University. Previously, Mr. Curvey was the Vice Chairman (2006-2007) and Director (2000-2007) of FMR Corp. |
Abigail P. Johnson (1961) |
Year of Election or Appointment: 2009 Trustee Chairman of the Board of Trustees |
| Ms. Johnson also serves as Trustee of other Fidelity funds. Ms. Johnson serves as President of FMR LLC (2013-present), President of Fidelity Financial Services (2012-present) and President of Personal, Workplace and Institutional Services (2005-present). Ms. Johnson is Chairman and Director of FMR Co., Inc. (2011-present), Chairman and Director of FMR (2011-present), and the Vice Chairman and Director (2007-present) of FMR LLC. Previously, Ms. Johnson served as President and a Director of FMR (2001-2005), a Trustee of other investment companies advised by FMR, Fidelity Investments Money Management, Inc., and FMR Co., Inc. (2001-2005), Senior Vice President of the Fidelity funds (2001-2005), and managed a number of Fidelity funds. Ms. Abigail P. Johnson and Mr. Arthur E. Johnson are not related. |
* Trustees have been determined to be "Interested Trustees" by virtue of, among other things, their affiliation with the trust or various entities under common control with FMR.
+ The information above includes each Trustee's principal occupation during the last five years and other information relating to the experience, attributes, and skills relevant to each Trustee's qualifications to serve as a Trustee, which led to the conclusion that each Trustee should serve as a Trustee for each fund.
Annual Report
Trustees and Officers - continued
Independent Trustees:
Correspondence intended for each Independent Trustee (that is, the Trustees other than the Interested Trustees) may be sent to Fidelity Investments, P.O. Box 55235, Boston, Massachusetts 02205-5235.
Name, Year of Birth; Principal Occupations and Other Relevant Experience+ |
Elizabeth S. Acton (1951) |
Year of Election or Appointment: 2013 Trustee |
| Ms. Acton also serves as Trustee or Member of the Advisory Board of other Fidelity funds. Prior to her retirement in April 2012, Ms. Acton was Executive Vice President, Finance (2011-2012), Executive Vice President, Chief Financial Officer (2002-2011), and Treasurer (2004-2005) of Comerica Incorporated (financial services). Prior to joining Comerica, Ms. Acton held a variety of positions at Ford Motor Company (1983-2002), including Vice President and Treasurer (2000-2002) and Executive Vice President and Chief Financial Officer of Ford Motor Credit Company (1998-2000). Ms. Acton currently serves as a member of the Board of Directors and Audit and Finance Committees of Beazer Homes USA, Inc. (homebuilding, 2012-present). |
Albert R. Gamper, Jr. (1942) |
Year of Election or Appointment: 2006 Trustee Chairman of the Independent Trustees |
| Mr. Gamper also serves as Trustee of other Fidelity funds. Prior to his retirement in December 2004, Mr. Gamper served as Chairman of the Board of CIT Group Inc. (commercial finance). During his tenure with CIT Group Inc. Mr. Gamper served in numerous senior management positions, including Chairman (1987-1989; 1999-2001; 2002-2004), Chief Executive Officer (1987-2004), and President (2002-2003). Mr. Gamper currently serves as a member of the Board of Directors of Public Service Enterprise Group (utilities, 2000-present), a member of the Board of Trustees, Rutgers University (2004-present), and Chairman of the Board of Barnabas Health Care System. Previously, Mr. Gamper served as Vice Chairman of the Independent Trustees of certain Fidelity funds (2011-2012) and as Chairman of the Board of Governors, Rutgers University (2004-2007). |
Robert F. Gartland (1951) |
Year of Election or Appointment: 2010 Trustee |
| Mr. Gartland also serves as Trustee of other Fidelity funds. Mr. Gartland is Chairman and an investor in Gartland and Mellina Group Corp. (consulting, 2009-present). Previously, Mr. Gartland served as a partner and investor of Vietnam Partners LLC (investments and consulting, 2008-2011). Prior to his retirement, Mr. Gartland held a variety of positions at Morgan Stanley (financial services, 1979-2007) including Managing Director (1987-2007). |
Arthur E. Johnson (1947) |
Year of Election or Appointment: 2008 Trustee |
| Mr. Johnson also serves as Trustee of other Fidelity funds. Mr. Johnson serves as a member of the Board of Directors of Eaton Corporation (diversified power management, 2009-present), AGL Resources, Inc. (holding company, 2002-present) and Booz Allen Hamilton (management consulting, 2011-present). Prior to his retirement, Mr. Johnson served as Senior Vice President of Corporate Strategic Development of Lockheed Martin Corporation (defense contractor, 1999-2009). He previously served on the Board of Directors of IKON Office Solutions, Inc. (1999-2008) and Delta Airlines (2005-2007). Mr. Arthur E. Johnson is not related to Ms. Abigail P. Johnson. |
Michael E. Kenneally (1954) |
Year of Election or Appointment: 2009 Trustee |
| Mr. Kenneally also serves as Trustee of other Fidelity funds. Mr. Kenneally served as a Member of the Advisory Board for certain Fidelity funds before joining the Board of Trustees (2008-2009). Prior to his retirement, Mr. Kenneally served as Chairman and Global Chief Executive Officer of Credit Suisse Asset Management. Before joining Credit Suisse, he was an Executive Vice President and Chief Investment Officer for Bank of America Corporation. Earlier roles at Bank of America included Director of Research, Senior Portfolio Manager and Research Analyst, and Mr. Kenneally was awarded the Chartered Financial Analyst (CFA) designation in 1991. |
James H. Keyes (1940) |
Year of Election or Appointment: 2007 Trustee |
| Mr. Keyes also serves as Trustee of other Fidelity funds. Mr. Keyes serves as a member of the Board and Non-Executive Chairman of Navistar International Corporation (manufacture and sale of trucks, buses, and diesel engines, since 2002). Previously, Mr. Keyes served as a member of the Board of Pitney Bowes, Inc. (integrated mail, messaging, and document management solutions, 1998-2013). Prior to his retirement, Mr. Keyes served as Chairman (1993-2002) and Chief Executive Officer (1988-2002) of Johnson Controls (automotive, building, and energy) and as a member of the Board of LSI Logic Corporation (semiconductor technologies, 1984-2008). |
Marie L. Knowles (1946) |
Year of Election or Appointment: 2001 Trustee Vice Chairman of the Independent Trustees |
| Ms. Knowles also serves as Trustee of other Fidelity funds. Prior to Ms. Knowles' retirement in June 2000, she served as Executive Vice President and Chief Financial Officer of Atlantic Richfield Company (ARCO) (diversified energy, 1996-2000). From 1993 to 1996, she was a Senior Vice President of ARCO and President of ARCO Transportation Company. She served as a Director of ARCO from 1996 to 1998. Ms. Knowles currently serves as a Director and Chairman of the Audit Committee of McKesson Corporation (healthcare service, since 2002). Ms. Knowles is a member of the Board of the Catalina Island Conservancy and of the Santa Catalina Island Company (2009-present). She also serves as a member of the Advisory Board for the School of Engineering of the University of Southern California. Previously, Ms. Knowles served as a Director of Phelps Dodge Corporation (copper mining and manufacturing, 1994-2007), URS Corporation (engineering and construction, 2000-2003) and America West (airline, 1999-2002). |
Kenneth L. Wolfe (1939) |
Year of Election or Appointment: 2005 Trustee |
| Mr. Wolfe also serves as Trustee of other Fidelity funds. Prior to his retirement, Mr. Wolfe served as Chairman and a Director (2007-2009) and Chairman and Chief Executive Officer (1994-2001) of Hershey Foods Corporation. He also served as a member of the Boards of Adelphia Communications Corporation (telecommunications, 2003-2006), Bausch & Lomb, Inc. (medical/pharmaceutical, 1993-2007), and Revlon, Inc. (personal care products, 2004-2009). Mr. Wolfe previously served as Chairman of the Independent Trustees of other Fidelity funds (2008-2012). |
+ The information above includes each Trustee's principal occupation during the last five years and other information relating to the experience, attributes, and skills relevant to each Trustee's qualifications to serve as a Trustee, which led to the conclusion that each Trustee should serve as a Trustee for each fund.
Officers:
Correspondence intended for each officer may be sent to Fidelity Investments, 245 Summer Street, Boston, Massachusetts 02210. Officers appear below in alphabetical order.
Name, Year of Birth; Principal Occupation |
Elizabeth Paige Baumann (1968) |
Year of Election or Appointment: 2012 Anti-Money Laundering (AML) Officer |
| Ms. Baumann also serves as AML Officer of other funds. She is Chief AML Officer of FMR LLC (2012-present) and is an employee of Fidelity Investments. Previously, Ms. Baumann served as Vice President and Deputy Anti-Money Laundering Officer (2007-2012). |
Marc Bryant (1966) |
Year of Election or Appointment: 2013 Assistant Secretary |
| Mr. Bryant also serves as an officer of other funds. He is Senior Vice President and Deputy General Counsel of FMR LLC. Prior to joining Fidelity Investments, Mr. Bryant served as a Senior Vice President and the Head of Global Retail Legal for AllianceBernstein L.P. (2006-2010), and as the General Counsel for ProFund Advisors LLC (2001-2006). |
Jonathan Davis (1968) |
Year of Election or Appointment: 2010 Assistant Treasurer |
| Mr. Davis also serves as Assistant Treasurer of other funds. Mr. Davis is an employee of Fidelity Investments. Previously, Mr. Davis served as Vice President and Associate General Counsel of FMR LLC (2003-2010). |
Adrien E. Deberghes (1967) |
Year of Election or Appointment: 2010 Assistant Treasurer |
| Mr. Deberghes also serves as an officer of other funds. He is an employee of Fidelity Investments (2008-present). Prior to joining Fidelity Investments, Mr. Deberghes was Senior Vice President of Mutual Fund Administration at State Street Corporation (2007-2008), Senior Director of Mutual Fund Administration at Investors Bank & Trust (2005-2007), and Director of Finance for Dunkin' Brands (2000-2005). |
Stephanie J. Dorsey (1969) |
Year of Election or Appointment: 2013 President and Treasurer |
| Ms. Dorsey also serves as an officer of other funds. She is an employee of Fidelity Investments (2008-present) and has served in other fund officer roles. Prior to joining Fidelity Investments, Ms. Dorsey served as Treasurer (2004-2008) of the JPMorgan Mutual Funds and Vice President (2004-2008) of JPMorgan Chase Bank. |
Scott C. Goebel (1968) |
Year of Election or Appointment: 2008 Secretary and Chief Legal Officer (CLO) |
| Mr. Goebel serves as Secretary and CLO of other funds. Mr. Goebel also serves as Secretary of Fidelity Investments Money Management, Inc. (FIMM) (2010-present) and Fidelity Research and Analysis Company (FRAC) (2010-present); General Counsel, Secretary, and Senior Vice President of FMR (2008-present) and FMR Co., Inc. (2008-present); Chief Legal Officer of Fidelity Management & Research (Hong Kong) Limited (2008-present) and Assistant Secretary of Fidelity Management & Research (Japan) Inc. (2008-present), and Fidelity Management & Research (U.K.) Inc. (2008-present). Previously, Mr. Goebel served as Secretary and CLO of other Fidelity funds (2008-2013), Assistant Secretary of FIMM (2008-2010), FRAC (2008-2010), and certain funds (2007-2008); and as Vice President and Secretary of Fidelity Distributors Corporation (FDC) (2005-2007). Mr. Goebel has been employed by FMR LLC or an affiliate since 2001. |
Bruce T. Herring (1965) |
Year of Election or Appointment: 2013 Vice President of Fidelity's Asset Allocation Funds |
| Mr. Herring also serves as Vice President of other funds. He serves as Chief Investment Officer of Fidelity Global Asset Allocation (GAA) (2013-present), Group Chief Investment Officer of FMR, and President of Fidelity Research & Analysis Company (2010-present). Previously, Mr. Herring served as Chief Investment Officer and Director of Fidelity Management & Research (U.K.) Inc. (2010-2013), Vice President (2005-2006) and Senior Vice President (2006-2007) of Fidelity Management & Research Company, Vice President of FMR Co., Inc. (2001-2007), and as a portfolio manager for Fidelity U.S. Equity Funds. |
Chris Maher (1972) |
Year of Election or Appointment: 2013 Assistant Treasurer |
| Mr. Maher serves as Assistant Treasurer of other funds. Mr. Maher is Vice President of Valuation Oversight and is an employee of Fidelity Investments. Previously, Mr. Maher served as Vice President of Asset Management Compliance (2013), Vice President of FMR's Program Management Group (2010-2013), and Vice President of Valuation Oversight (2008-2010). |
Charles S. Morrison (1960) |
Year of Election or Appointment: 2012 Vice President |
| Mr. Morrison also serves as Vice President of other funds. He serves as President, Fixed Income and is an employee of Fidelity Investments. Previously, Mr. Morrison served as Vice President of Fidelity's Money Market Funds (2005-2009), President, Money Market Group Leader of FMR (2009), and Senior Vice President, Money Market Group of FMR (2004-2009). Mr. Morrison also served as Vice President of Fidelity's Bond Funds (2002-2005), certain Balanced Funds (2002-2005), and certain Asset Allocation Funds (2002-2007), and as Senior Vice President (2002-2005) of Fidelity's Fixed Income Division. |
Christine Reynolds (1958) |
Year of Election or Appointment: 2008 Chief Financial Officer |
| Ms. Reynolds also serves as Chief Financial Officer of other funds. Ms. Reynolds became President of Fidelity Pricing and Cash Management Services (FPCMS) in August 2008. Ms. Reynolds served as Chief Operating Officer of FPCMS (2007-2008). Previously, Ms. Reynolds served as President, Treasurer, and Anti-Money Laundering officer of the Fidelity funds (2004-2007). |
Kenneth B. Robins (1969) |
Year of Election or Appointment: 2009 Assistant Treasurer |
| Mr. Robins also serves as an officer of other funds. Mr. Robins serves as Executive Vice President of Fidelity Investments Money Management, Inc. (FIMM) (2013-present) and is an employee of Fidelity Investments (2004-present). Previously, Mr. Robins served in other fund officer roles. |
Gary W. Ryan (1958) |
Year of Election or Appointment: 2005 Assistant Treasurer |
| Mr. Ryan also serves as Assistant Treasurer of other funds. Mr. Ryan is an employee of Fidelity Investments and has served in other fund officer roles. Previously, Mr. Ryan served as Vice President of Fund Reporting in Fidelity Pricing and Cash Management Services (FPCMS) (1999-2005). |
Stephen Sadoski (1971) |
Year of Election or Appointment: 2013 Deputy Treasurer |
| Mr. Sadoski also serves as Deputy Treasurer of other funds. He is an employee of Fidelity Investments (2012-present) and has served in another fund officer role. Prior to joining Fidelity Investments, Mr. Sadoski served as an assistant chief accountant in the Division of Investment Management of the Securities and Exchange Commission (SEC) (2009-2012) and as a senior manager at Deloitte & Touche LLP (1997-2009). |
Stacie M. Smith (1974) |
Year of Election or Appointment: 2013 Assistant Treasurer |
| Ms. Smith also serves as an officer of other funds. She is an employee of Fidelity Investments (2009-present) and has served in other fund officer roles. Prior to joining Fidelity Investments, Ms. Smith served as Senior Audit Manager of Ernst & Young LLP (1996-2009). |
Renee Stagnone (1975) |
Year of Election or Appointment: 2013 Deputy Treasurer |
| Ms. Stagnone also serves as Deputy Treasurer of other funds. Ms. Stagnone is an employee of Fidelity Investments. |
Michael H. Whitaker (1967) |
Year of Election or Appointment: 2008 Chief Compliance Officer |
| Mr. Whitaker also serves as Chief Compliance Officer of other funds. Mr. Whitaker is an employee of Fidelity Investments (2007-present). Prior to joining Fidelity Investments, Mr. Whitaker worked at MFS Investment Management where he served as Senior Vice President and Chief Compliance Officer (2004-2006), and Assistant General Counsel. |
Derek L. Young (1964) |
Year of Election or Appointment: 2009 Vice President of Fidelity's Asset Allocation Funds |
| Mr. Young also serves as Trustee or an officer of other funds. He is President and a Director of Strategic Advisers, Inc. (2011-present), President of Fidelity Global Asset Allocation (GAA) (2011-present), and Vice Chairman of Pyramis Global Advisors, LLC (2011-present). Previously, Mr. Young served as Chief Investment Officer of GAA (2009-2011) and as a portfolio manager. |
Joseph F. Zambello (1957) |
Year of Election or Appointment: 2011 Deputy Treasurer |
| Mr. Zambello also serves as Deputy Treasurer of other funds. Mr. Zambello is an employee of Fidelity Investments. Previously, Mr. Zambello served as Vice President of FMR's Program Management Group (2009-2011) and Vice President of the Transfer Agent Oversight Group (2005-2009). |
Annual Report
The Board of Trustees of each fund voted to pay to shareholders of record at the opening of business on record date, the following distributions per share derived from capital gains realized from sales of portfolio securities:
Fund | Pay Date | Record Date | Capital Gains |
VIP Freedom Lifetime Income I | 02/14/14 | 02/14/14 | $0.219 |
VIP Freedom Lifetime Income III | 02/14/14 | 02/14/14 | $0.153 |
The funds hereby designate as capital gain dividends the amounts noted below for the taxable year ended December 31, 2013, or, if subsequently determined to be different, the net capital gain of such year.
Fund | |
VIP Freedom Lifetime Income I | $245,039 |
VIP Freedom Lifetime Income III | $158,276 |
A percentage of the dividends distributed during the fiscal year for the following funds qualifies for the dividends-received deduction for corporate shareholders:
Fund | February 2013 | December 2013 |
VIP Freedom Lifetime Income I | 1% | 14% |
VIP Freedom Lifetime Income II | 15% | 19% |
VIP Freedom Lifetime Income III | 3% | 25% |
A percentage of the dividends distributed during the fiscal year for the following funds were derived from interest on U.S. Government securities which is generally exempt from state income tax:
VIP Freedom Lifetime Income I | 7.24% |
VIP Freedom Lifetime Income II | 6.18% |
VIP Freedom Lifetime Income III | 3.15% |
The amounts per share which represent income derived from sources within, and taxes paid to, foreign countries or possessions of the United States are as follows:
| Pay Date | Income | Taxes |
VIP Freedom Lifetime Income I | 02/15/2013 | 0.0001 | 0.0000 |
| 12/27/2013 | 0.0154 | 0.0009 |
VIP Freedom Lifetime Income II | 02/15/2013 | 0.0002 | 0.0000 |
| 12/27/2013 | 0.0212 | 0.0013 |
VIP Freedom Lifetime Income III | 02/15/2013 | 0.0003 | 0.0000 |
| 12/27/2013 | 0.0299 | 0.0018 |
Annual Report
Board Approval of Investment Advisory Contracts and Management Fees
VIP Freedom Lifetime Income Funds
Each year, the Board of Trustees, including the Independent Trustees (together, the Board), votes on the renewal of the management contract (the Advisory Contract) with Strategic Advisers, Inc. (Strategic Advisers) and the administration agreement for each fund. The Board, assisted by the advice of fund counsel and Independent Trustees' counsel, requests and considers a broad range of information relevant to the renewal of the Advisory Contracts throughout the year.
The Board meets regularly and, at each of its meetings, covers an extensive agenda of topics and materials and considers factors that are relevant to its annual consideration of the renewal of each fund's Advisory Contract, including the services and support provided to each fund and its shareholders. The Board has established four standing committees, Operations, Audit, Fair Valuation, and Governance and Nominating, each composed of and chaired by Independent Trustees with varying backgrounds, to which the Board has assigned specific subject matter responsibilities in order to enhance effective decision-making by the Board. The Operations Committee, of which all of the Independent Trustees are members, meets regularly throughout the year and, among other matters, considers matters specifically related to the annual consideration of the renewal of each fund's Advisory Contract. The Board, acting directly and through its Committees, requests and receives information concerning the annual consideration of the renewal of each fund's Advisory Contract. The Board also meets as needed to consider matters specifically related to the Board's annual consideration of the renewal of Advisory Contracts. Members of the Board may also meet with trustees of other Fidelity funds through ad hoc joint committees to discuss certain matters relevant to the Fidelity funds.
At its September 2013 meeting, the Board, including the Independent Trustees, unanimously determined to renew each fund's Advisory Contract. In reaching its determination, the Board considered all factors it believed relevant and reached a determination, with the assistance of fund counsel and Independent Trustees' counsel and through the exercise of its business judgment, that the renewal of the Advisory Contract was in the best interests of each fund and its shareholders and the fact that no fees are payable under the Advisory Contracts was fair and reasonable. The Board's decision to renew the Advisory Contracts was not based on any single factor, but rather was based on a comprehensive consideration of all the information provided to the Board at its meetings throughout the year. In reaching its determination, the Board was aware that shareholders in each fund have a broad range of investment choices available to them, including a wide choice among mutual funds offered by Fidelity's competitors, and that each fund's shareholders, who have the opportunity to review and weigh the disclosure provided by the fund in its prospectus and other public disclosures, have chosen to invest in that fund, which is part of the Fidelity family of funds.
Nature, Extent, and Quality of Services Provided. The Board considered Fidelity's staffing as it relates to the funds, including the backgrounds of investment personnel of Strategic Advisers, and also considered the funds' investment objectives, strategies, and related investment philosophies. The Independent Trustees also had discussions with senior management of Fidelity's investment operations and investment groups with responsibility for the underlying Fidelity funds in which each fund invests. The Board considered the structure of the portfolio manager compensation program and whether this structure provides appropriate incentives to act in the best interests of each fund.
Resources Dedicated to Investment Management and Support Services. The Board reviewed the general qualifications and capabilities of Fidelity's investment staff, including its size, education, experience, and resources, as well as Fidelity's approach to recruiting, managing, and compensating investment personnel. The Board noted that Fidelity has continued to increase the resources devoted to non-U.S. offices, including expansion of Fidelity's global investment organization. The Board also noted that Fidelity's analysts have extensive resources, tools and capabilities that allow them to conduct sophisticated quantitative and fundamental analysis, as well as credit analysis of issuers, counterparties and guarantors. Further, the Board believes that Fidelity's investment professionals have sufficient access to global information and data so as to provide competitive investment results over time, and that those professionals also have access to sophisticated tools that permit them to assess portfolio construction and risk and performance attribution characteristics continuously, as well as to transmit new information and research conclusions rapidly around the world. Additionally, in its deliberations, the Board considered Fidelity's risk management capabilities and resources, which are an integral part of the investment management process.
Shareholder and Administrative Services. The Board considered (i) the nature, extent, quality, and cost of advisory, administrative, and shareholder services performed by Fidelity affiliates under the Advisory Contract and the administration agreement and under separate agreements covering transfer agency and pricing and bookkeeping services for each fund; (ii) the nature and extent of the supervision of third party service providers, principally custodians and subcustodians; and (iii) the resources devoted to, and the record of compliance with, each fund's compliance policies and procedures.
The Board noted that the growth of fund assets over time across the complex allows Fidelity to reinvest in the development of services designed to enhance the value or convenience of the Fidelity funds as investment vehicles. These services include 24-hour access to account information and market information through telephone representatives and over the Internet, investor education materials and asset allocation tools, and the expanded availability of Fidelity Investor Centers.
Investment in a Large Fund Family. The Board considered the benefits to shareholders of investing in a Fidelity fund, including the benefits of investing in a fund that is part of a large family of funds offering a variety of investment disciplines and providing a large variety of mutual fund investor services. The Board noted that Fidelity had taken, or had made recommendations that resulted in the Fidelity funds taking, a number of actions over the previous year that benefited particular funds, including (i) continuing to dedicate additional resources to investment research and to the support of the senior management team that oversees asset management; (ii) persisting in efforts to enhance Fidelity's global research capabilities; (iii) launching new funds and making other enhancements to meet client needs for global and income-oriented solutions; (iv) continuing to launch dedicated lower cost underlying funds to meet portfolio construction needs related to expanding underlying fund options for Fidelity funds of funds, specifically for the Freedom Fund product lines; (v) rationalizing product lines and gaining increased efficiencies through the combination of several funds with other funds; (vi) strengthening Fidelity's index fund offerings by reducing investment minimums and adopting or lowering existing expense caps for certain funds and classes; (vii) enhancing Global Asset Allocation product offerings by launching new funds and strategies, including "open architecture" target date funds that utilize affiliated and unaffiliated sub-advisers; (viii) modifying the eligibility criteria for Institutional Class shares of Advisor funds to increase their marketability to a portion of the defined contribution plan market; (ix) creating a new low-cost retirement share class for certain Advisor funds to appeal to large retirement plans; (x) transitioning the management of certain Fidelity commodity funds to Geode Capital Management LLC, a registered commodity pool operator, while retaining administrative responsibilities for the funds; and (xi) taking steps toward establishing a new Fidelity adviser to manage sector-based funds and products.
Annual Report
Investment Performance. The Board considered whether each fund has operated in accordance with its investment objective, as well as its record of compliance with its investment restrictions and its performance history.
The Board took into account discussions with the investment adviser about fund investment performance that occur at Board meetings throughout the year. In this regard the Board noted that as part of regularly scheduled fund reviews and other reports to the Board on fund performance, the Board periodically considers annualized return information for each fund for different time periods, measured against one or more securities market indices, including a customized blended index representative of the fund's asset classes (each a "benchmark index") and a peer group of mutual funds with similar objectives ("peer group"). In its evaluation of fund investment performance at meetings throughout the year, the Board gave particular attention to information indicating underperformance of certain Fidelity funds for specific time periods and the investment adviser's explanations for such underperformance.
In addition to reviewing absolute and relative fund performance, the Independent Trustees periodically consider the appropriateness of fund performance metrics in evaluating the results achieved. In general, the Independent Trustees believe that fund performance should be evaluated based on gross performance (before fees and expenses, including acquired fund fees and expenses, but after transaction costs, if any) compared to appropriate benchmark indices, over appropriate time periods that may include full market cycles, and on net performance (after fees and expenses) compared to peer groups, as applicable, over the same periods, taking into account relevant factors including the following: general market conditions; the extent to which particular underlying funds affected performance; and fund cash flows and other factors. Depending on the circumstances, the Independent Trustees may be satisfied with a fund's performance notwithstanding that it lags its benchmark index or peer group for certain periods.
The Independent Trustees recognize that shareholders evaluate performance on a net basis over their own holding periods, for which one-, three-, and five-year periods are often used as a proxy. For this reason, the performance information reviewed by the Board also included net cumulative calendar year total return information for each fund and an appropriate benchmark index for the most recent one-, three-, and five-year periods.
Based on its review, the Board concluded that the nature, extent, and quality of services provided to each fund under the Advisory Contract should benefit each fund's shareholders.
Competitiveness of Management Fee and Total Expense Ratio. The Board noted that the funds do not pay Strategic Advisers a management fee for investment advisory services. The Board considered each fund's management fee and total expense ratio compared to "mapped groups" of competitive funds and classes, and also considered that each fund bears indirectly the expenses of the underlying Fidelity funds in which it invests. Fidelity creates "mapped groups" by combining similar Lipper investment objective categories that have comparable investment mandates. Combining Lipper investment objective categories aids the Board's management fee and total expense ratio comparisons by broadening the competitive group used for comparison and by reducing the number of universes to which various Fidelity funds are compared.
Management Fee. The Board considered two proprietary management fee comparisons for the 12-month periods shown in the charts below. The group of Lipper funds used by the Board for management fee comparisons is referred to below as the "Total Mapped Group." The Total Mapped Group comparison focuses on a fund's standing in terms of gross management fees before expense reimbursements or caps relative to the total universe of funds with comparable investment mandates, regardless of whether their management fee structures also are comparable. "TMG %" represents the percentage of funds in the Total Mapped Group that had management fees that were lower than a fund's. For example, a hypothetical TMG % of 50% would mean that half of the funds in the Total Mapped Group had higher, and half had lower, management fees than a fund. The funds' actual TMG %s are in the charts below. The "Asset-Size Peer Group" (ASPG) comparison focuses on a fund's standing relative to a subset of non-Fidelity funds within the Total Mapped Group that are similar in size and management fee structure. For example, if a fund is in the first quartile of the ASPG, the fund's management fee ranks in the least expensive or lowest 25% of funds in the ASPG. The ASPG represents at least 15% of the funds in the Total Mapped Group with comparable asset size and management fee structures, subject to a minimum of 50 funds (or all funds in the Total Mapped Group if fewer than 50). Additional information, such as the ASPG quartile in which a fund's management fee rate ranked, is also included in the charts and considered by the Board.
Annual Report
Board Approval of Investment Advisory Contracts and Management Fees - continued
VIP Freedom Lifetime Income I Portfolio
VIP Freedom Lifetime Income II Portfolio
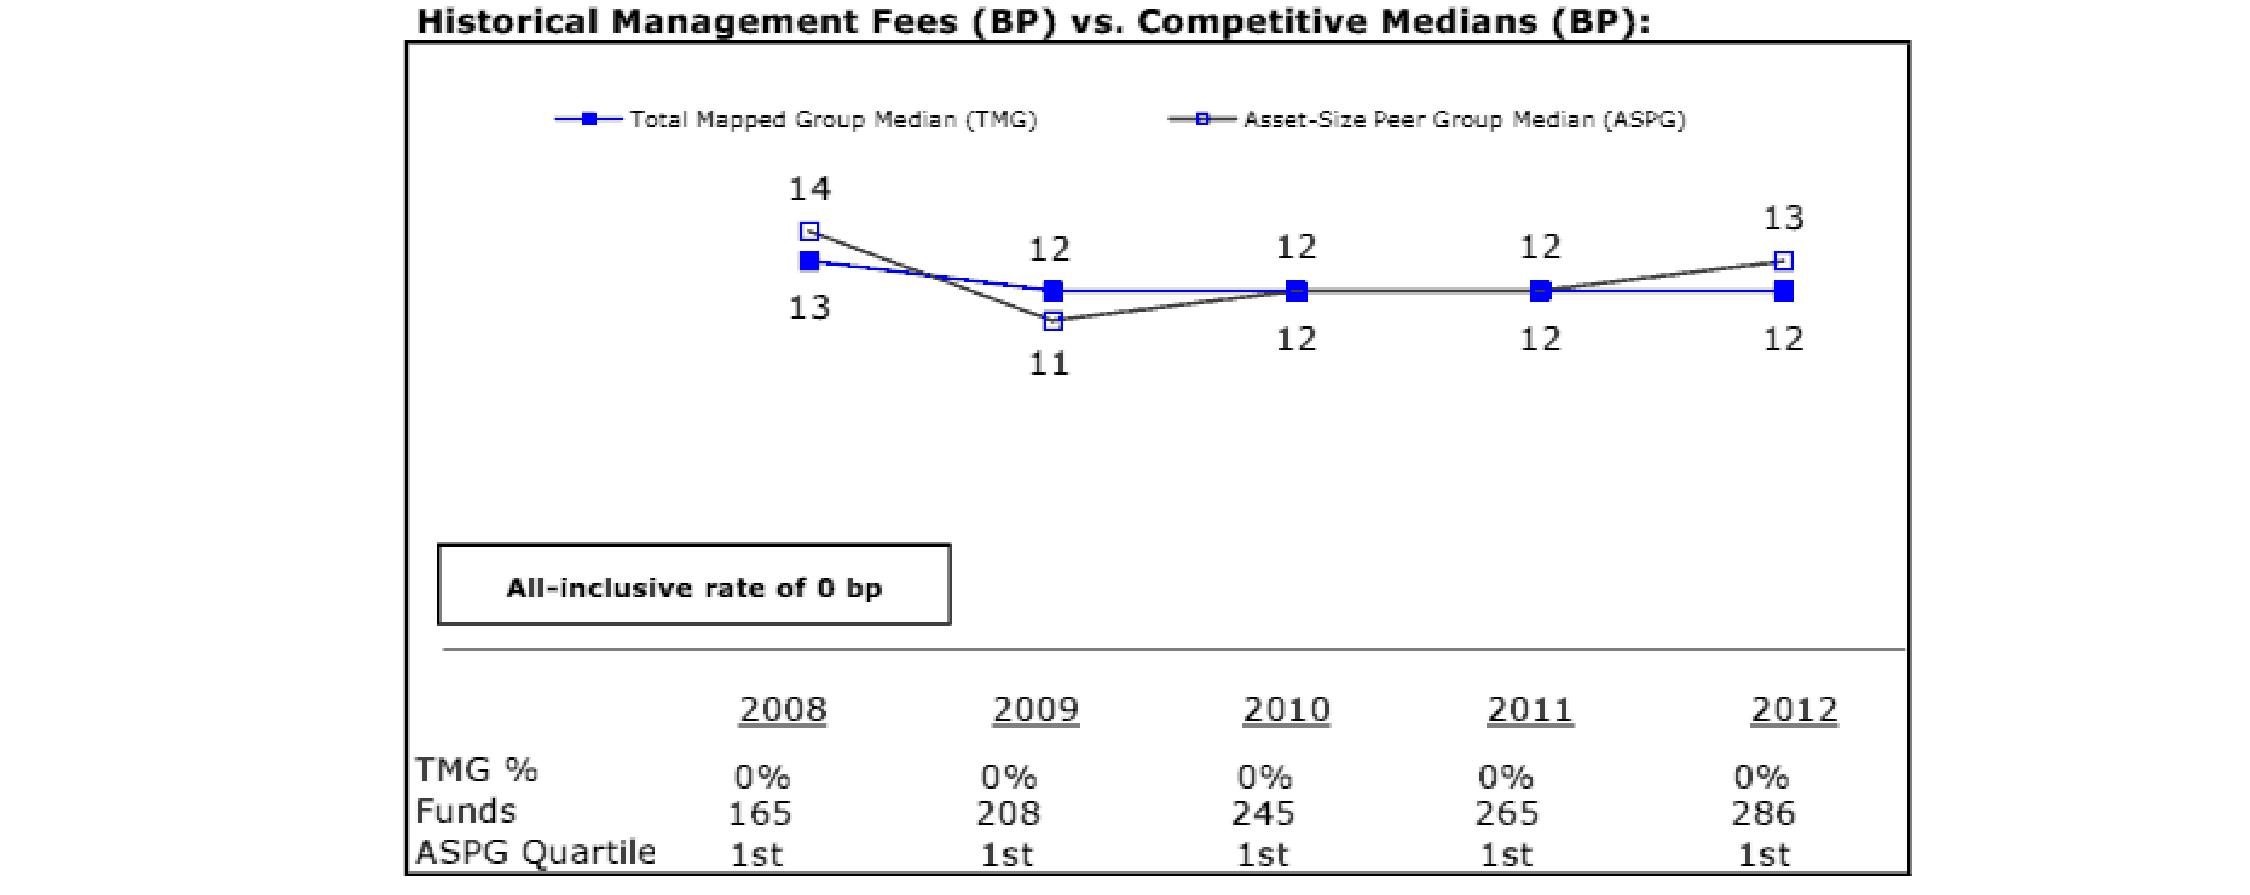
Annual Report
VIP Freedom Lifetime Income III Portfolio
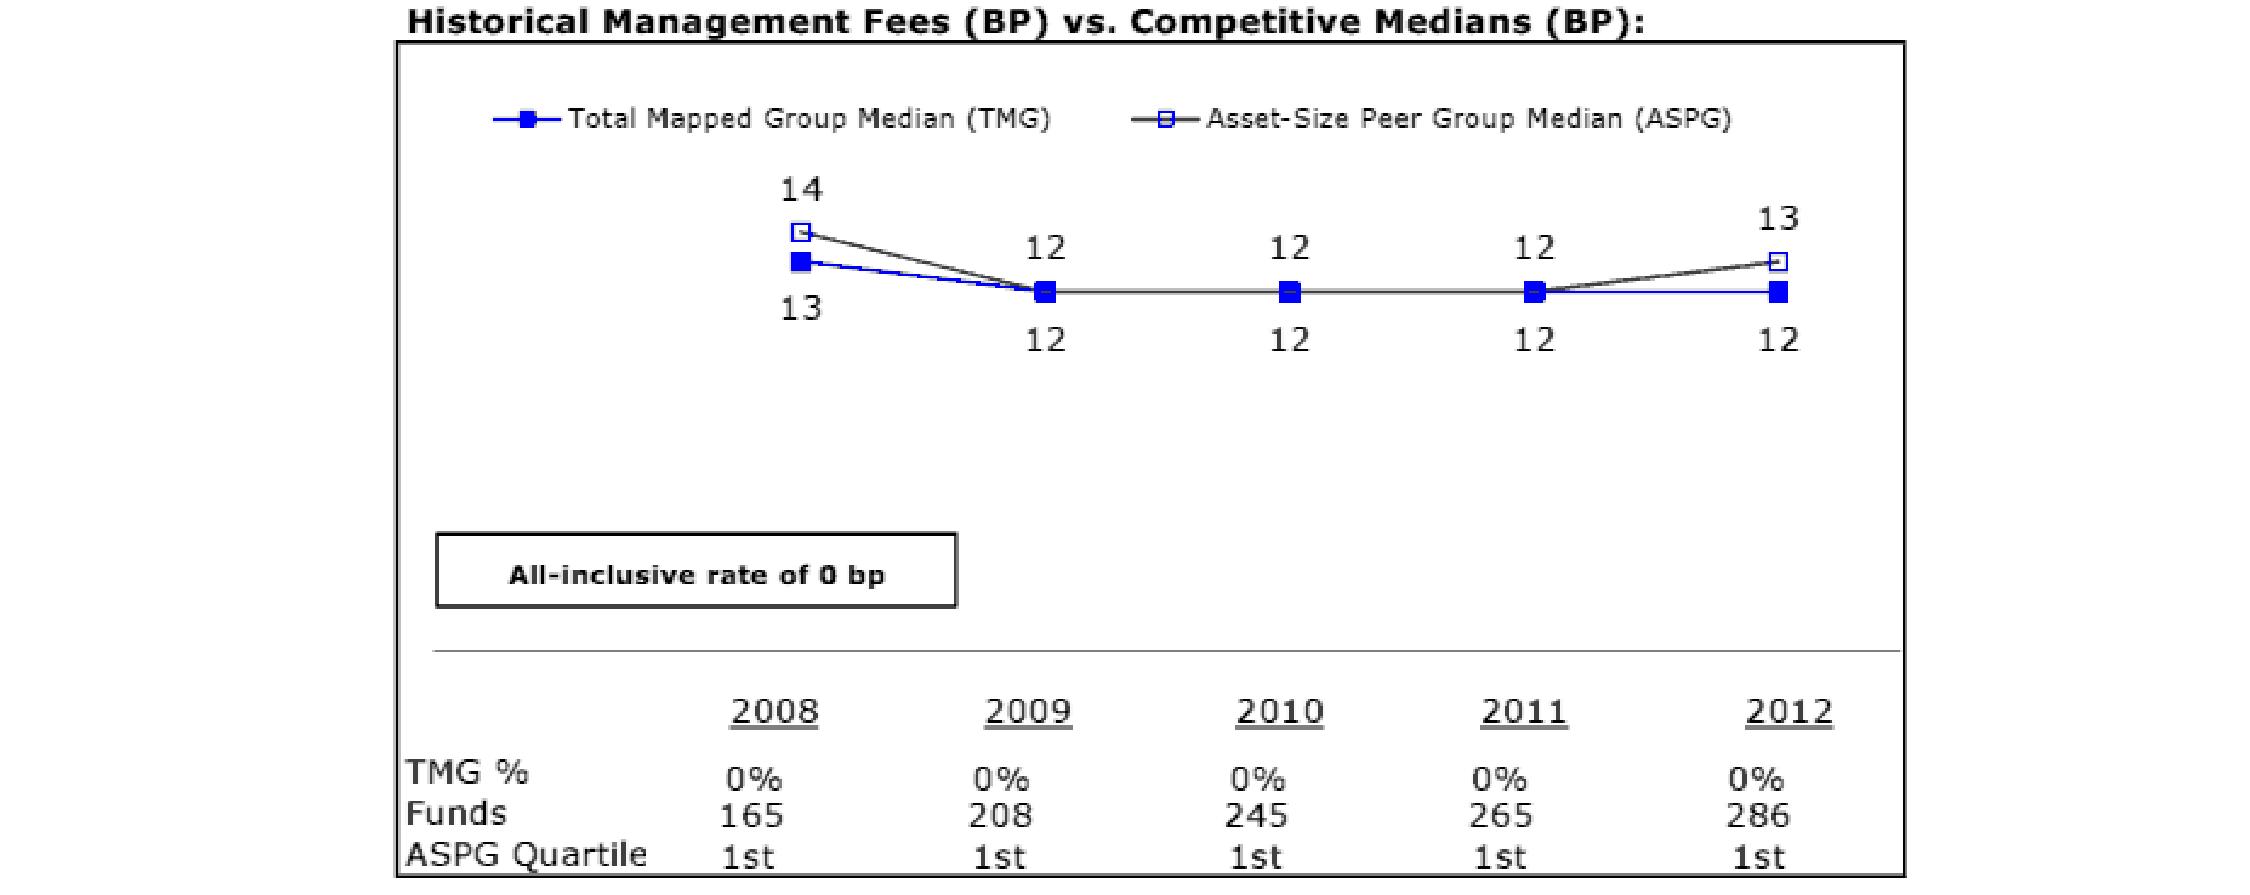
The Board noted that each fund's management fee rate of 0.00% ranked below the median of its Total Mapped Group and below the median of its ASPG for 2012. The Board further noted that many peer funds pay fund-level expenses, including management fees, to which the funds are not subject.
Based on its review, the Board concluded that each fund's management fee is fair and reasonable in light of the services that the fund receives and the other factors considered.
Total Expense Ratio. In its review of each fund's total expense ratio, the Board noted that each fund invests in Investor Class of the underlying Fidelity fund to avoid charging fund-paid 12b-1 fees at both fund levels. The Board considered that the funds do not pay transfer agent fees. Instead, Investor Class of each underlying Fidelity fund bears its pro rata portion of each fund's transfer agent fee according to the percentage of each fund's assets invested in that underlying fund. The Board further noted that Fidelity Management & Research Company (FMR) pays all other expenses of each fund, with limited exceptions.
The Board noted that each fund's total expense ratio ranked below its competitive median for 2012.
Fees Charged to Other Fidelity Clients. The Board also considered Fidelity fee structures and other information with respect to clients of Fidelity, such as other mutual funds advised or subadvised by Fidelity, pension plan clients, and other institutional clients. The Board noted the findings of the 2013 ad hoc joint committee (created with the board of other Fidelity funds), which reviewed and compared Fidelity's institutional investment advisory business with its business of providing services to the Fidelity funds, including the differences in services provided, fees charged, and costs incurred, as well as competition in their respective marketplaces.
Based on its review of total expense ratios and fees charged to other Fidelity clients, the Board concluded that each fund's total expense ratio was reasonable in light of the services that the fund and its shareholders receive and the other factors considered.
Costs of the Services and Profitability. The Board considered the level of Fidelity's profits in respect of all the Fidelity funds, including the Fidelity funds in which the funds invest.
PricewaterhouseCoopers LLP (PwC), independent registered public accounting firm and auditor to Fidelity and certain Fidelity funds, has been engaged annually by the Board as part of the Board's assessment of Fidelity's profitability analysis. PwC's engagement includes the review and assessment of the methodologies used by Fidelity in determining the revenues and expenses attributable to Fidelity's mutual fund business, and completion of agreed-upon procedures surrounding the mathematical accuracy of fund profitability and its conformity to allocation methodologies. After considering PwC's reports issued under the engagement and information provided by Fidelity, the Board concluded that while other allocation methods may also be reasonable, Fidelity's profitability methodologies are reasonable in all material respects.
The Board also reviewed Fidelity's non-fund businesses and fall-out benefits related to the mutual fund business as well as cases where Fidelity's affiliates may benefit from or be related to the funds' business.
The Board concluded that the costs of the services provided by and the profits realized by Fidelity in connection with the operation of each fund were not relevant to the renewal of each fund's Advisory Contract because the funds do not pay management fees and FMR pays all other expenses of each fund, with limited exceptions.
Annual Report
Board Approval of Investment Advisory Contracts and Management Fees - continued
Economies of Scale. The Board concluded that because the funds do not pay management fees and FMR pays all other expenses of each fund, with limited exceptions, economies of scale cannot be realized by the funds, but may be realized by the other Fidelity funds in which each fund invests, many of which may benefit from breakpoints in the group fee arrangement.
Additional Information Requested by the Board. In order to develop fully the factual basis for consideration of the Fidelity funds' Advisory Contracts, the Board requested and received additional information on certain topics, including: (i) Fidelity's fund profitability methodology, profitability trends for certain funds, and the impact of certain factors on fund profitability results; (ii) portfolio manager changes that have occurred during the past year and the amount of the investment that each portfolio manager has made in the Fidelity fund(s) that he or she manages; (iii) Fidelity's compensation structure for portfolio managers, research analysts, and other key personnel, including its effects on fund profitability, the rationale for the compensation structure, and the extent to which current market conditions have affected retention and recruitment; (iv) the arrangements with and compensation paid to certain fund sub-advisers on behalf of the Fidelity funds; (v) Fidelity's fee structures, including the group fee structure and definition of group assets, and the rationale for recommending different fees among different categories of funds and classes; (vi) Fidelity's voluntary waiver of its fees to maintain minimum yields for certain money market funds and classes as well as contractual waivers in place for certain funds; (vii) the methodology with respect to competitive fund data and peer group classifications; (viii) Fidelity's transfer agent fee, expense, and service structures for different funds and classes, and the impact of the increased use of omnibus accounts; and (ix) explanations regarding the relative total expense ratios of certain funds and classes, total expense competitive trends and methodologies for total expense competitive comparisons, and actions that might be taken by Fidelity to reduce total expense ratios for certain funds and classes or to achieve further economies of scale.
Based on its evaluation of all of the conclusions noted above, and after considering all factors it believed relevant, the Board ultimately concluded that the advisory fee structures are fair and reasonable, and that each fund's Advisory Contract should be renewed.
Annual Report
Investment Adviser
Strategic Advisers, Inc.
Boston, MA
Administrator
Fidelity Management & Research Company
Boston, MA
General Distributor
Fidelity Distributors Corporation
Smithfield, RI
Transfer and Service Agents
Fidelity Investments Institutional Operations Company, Inc.
Boston, MA
Fidelity Service Company, Inc.
Boston, MA
Custodian
The Bank of New York Mellon
New York, NY
VIPFLI-ANN-0214
1.816199.108
Fidelity® Variable Insurance Products:
FundsManager - 20%, 50%, 60%, 70%, 85% Portfolio
Annual Report
December 31, 2013
(Fidelity Cover Art)
Contents
To view a fund's proxy voting guidelines and proxy voting record for the 12-month period ended June 30, visit http://www.fidelity.com/proxyvotingresults or visit the Securities and Exchange Commission's (SEC) web site at http://www.sec.gov. You may also call 1-877-208-0098 to request a free copy of the proxy voting guidelines.
Fidelity Variable Insurance Products are separate account options which are purchased through a variable insurance contract.
Standard & Poor's, S&P and S&P 500 are registered service marks of The McGraw-Hill Companies, Inc. and have been licensed for use by Fidelity Distributors Corporation.
Other third-party marks appearing herein are the property of their respective owners.
All other marks appearing herein are registered or unregistered trademarks or service marks of FMR LLC or an affiliated company. © 2014 FMR LLC. All rights reserved.
This report and the financial statements contained herein are submitted for the general information of the shareholders of the funds. This report is not authorized for distribution to prospective investors in the funds unless preceded or accompanied by an effective prospectus.
A fund files its complete schedule of portfolio holdings with the SEC for the first and third quarters of each fiscal year on Form N-Q. Forms N-Q are available on the SEC's web site at http://www.sec.gov. A fund's Forms N-Q may be reviewed and copied at the SEC's Public Reference Room in Washington, DC. Information regarding the operation of the SEC's Public Reference Room may be obtained by calling 1-800-SEC-0330. For a complete list of a fund's portfolio holdings, view the most recent holdings listing, semiannual report, or annual report on Fidelity's web site at http://www.fidelity.com, http://www.advisor.fidelity.com, or http://www.401k.com, as applicable.
NOT FDIC INSURED • MAY LOSE VALUE • NO BANK GUARANTEE
Neither the funds nor Fidelity Distributors Corporation is a bank.
Annual Report
VIP FundsManager® 20% Portfolio
Performance: The Bottom Line
Average annual total return reflects the change in the value of an investment, assuming reinvestment of the class' distributions from dividend income and capital gains (the profits earned upon the sale of securities that have grown in value, if any) and assuming a constant rate of performance each year. During periods of reimbursement by Fidelity, a fund's total return will be greater than it would be had the reimbursement not occurred. Performance numbers are net of all underlying fund operating expenses, but do not include any insurance charges imposed by your insurance company's separate account. If performance information included the effect of these additional charges, the total returns would have been lower. How a fund did yesterday is no guarantee of how it will do tomorrow.
Average Annual Total Returns
Periods ended December 31, 2013 | Past 1
year | Past 5
years | Life of fund A |
VIP FundsManager 20% Portfolio - Investor Class | 5.62% | 6.23% | 4.32% |
VIP FundsManager 20% Portfolio - Service Class | 5.53% | 6.23% | 4.32% |
VIP FundsManager 20% Portfolio - Service Class 2 | 5.46% | 6.06% | 4.17% |
A From April 13, 2006.
$10,000 Over Life of Fund
Let's say hypothetically that $10,000 was invested in VIP FundsManager 20% Portfolio - Investor Class on April 13, 2006, when the fund started. The chart shows how the value of your investment would have changed, and also shows how the Barclays® U.S. Aggregate Bond Index performed over the same period.
Annual Report
VIP FundsManager 50% Portfolio
Performance: The Bottom Line
Average annual total return reflects the change in the value of an investment, assuming reinvestment of the class' distributions from dividend income and capital gains (the profits earned upon the sale of securities that have grown in value, if any) and assuming a constant rate of performance each year. During periods of reimbursement by Fidelity, a fund's total return will be greater than it would be had the reimbursement not occurred. Performance numbers are net of all underlying fund operating expenses, but do not include any insurance charges imposed by your insurance company's separate account. If performance information included the effect of these additional charges, the total returns would have been lower. How a fund did yesterday is no guarantee of how it will do tomorrow.
Average Annual Total Returns
Periods ended December 31, 2013 | Past 1
year | Past 5
years | Life of fund A |
VIP FundsManager 50% Portfolio - Investor Class | 14.90% | 10.90% | 5.31% |
VIP FundsManager 50% Portfolio - Service Class | 14.79% | 10.87% | 5.31% |
VIP FundsManager 50% Portfolio - Service Class 2 | 14.66% | 10.73% | 5.16% |
A From April 13, 2006.
$10,000 Over Life of Fund
Let's say hypothetically that $10,000 was invested in VIP FundsManager 50% Portfolio - Investor Class on April 13, 2006, when the fund started. The chart shows how the value of your investment would have changed, and also shows how the S&P 500® Index performed over the same period.
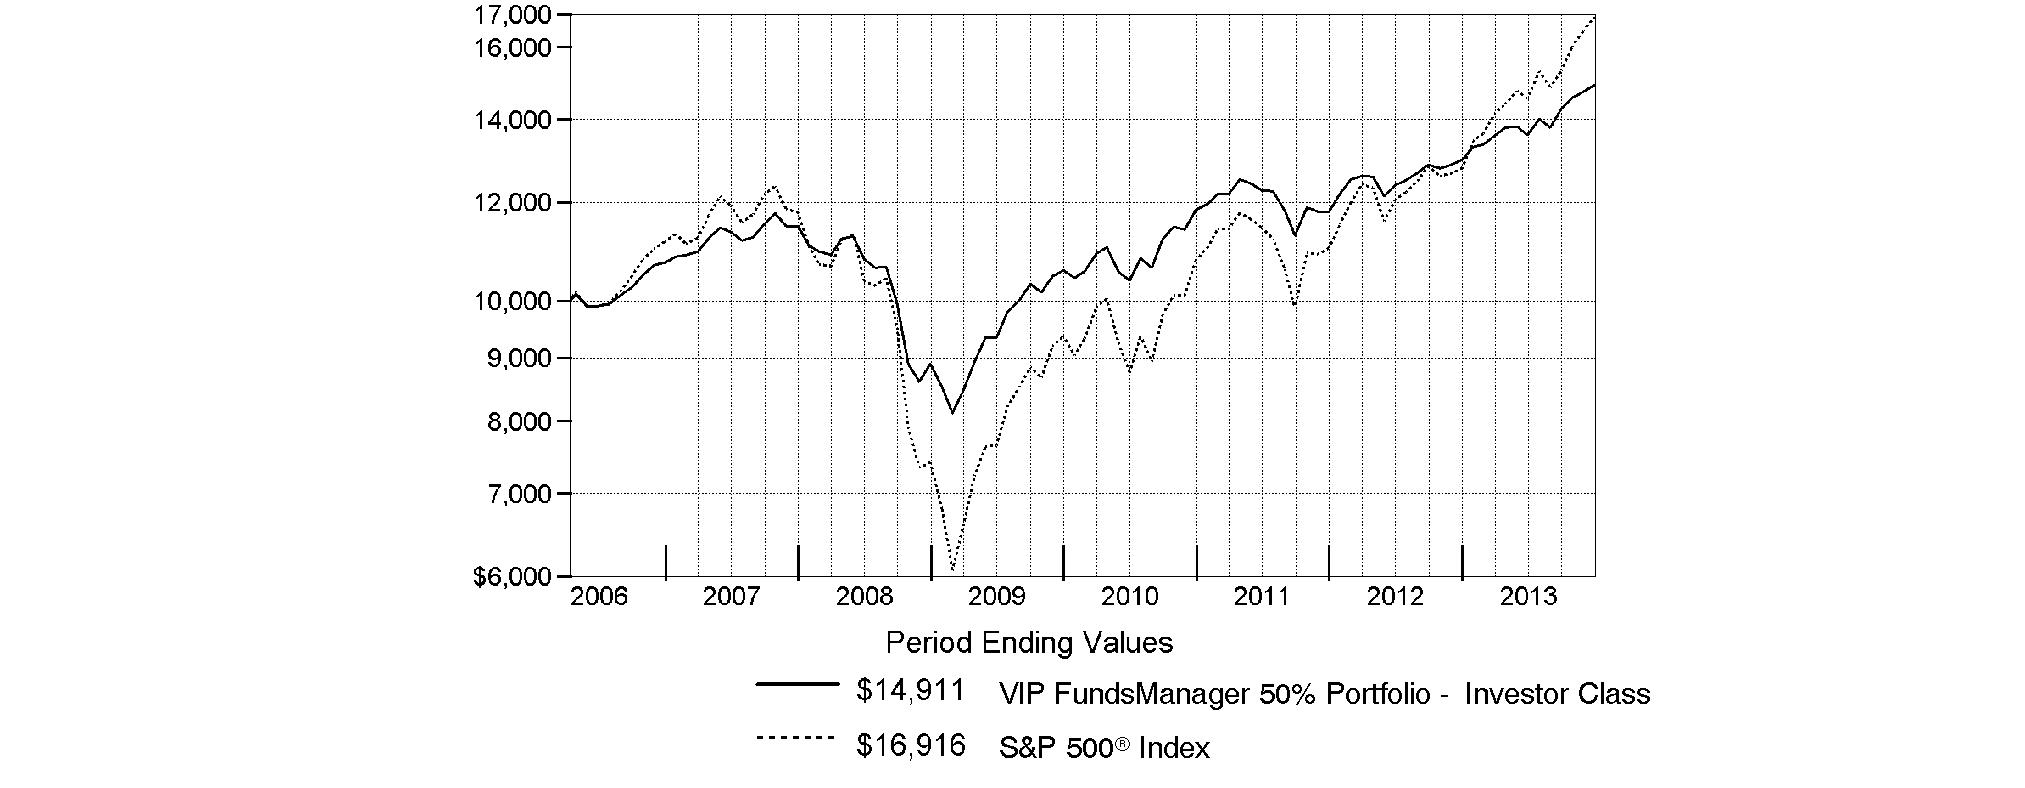
Annual Report
VIP FundsManager 60% Portfolio
Performance: The Bottom Line
Average annual total return reflects the change in the value of an investment, assuming reinvestment of the class' distributions from dividend income and capital gains (the profits earned upon the sale of securities that have grown in value, if any) and assuming a constant rate of performance each year. During periods of reimbursement by Fidelity, a fund's total return will be greater than it would be had the reimbursement not occurred. Performance numbers are net of all underlying fund operating expenses, but do not include any insurance charges imposed by your insurance company's separate account. If performance information included the effect of these additional charges, the total returns would have been lower. How a fund did yesterday is no guarantee of how it will do tomorrow.
Average Annual Total Returns
Periods ended December 31, 2013 | Past 1
year | Past 5
years | Life of
fund A |
VIP FundsManager 60% Portfolio - Investor Class | 18.62% | 12.53% | 5.10% |
VIP FundsManager 60% Portfolio - Service Class | 18.62% | 12.53% | 5.10% |
VIP FundsManager 60% Portfolio - Service Class 2 | 18.39% | 12.35% | 4.94% |
A From August 22, 2007.
$10,000 Over Life of Fund
Let's say hypothetically that $10,000 was invested in VIP FundsManager 60% Portfolio - Investor Class on August 22, 2007, when the fund started. The chart shows how the value of your investment would have changed, and also shows how the S&P 500 Index performed over the same period.
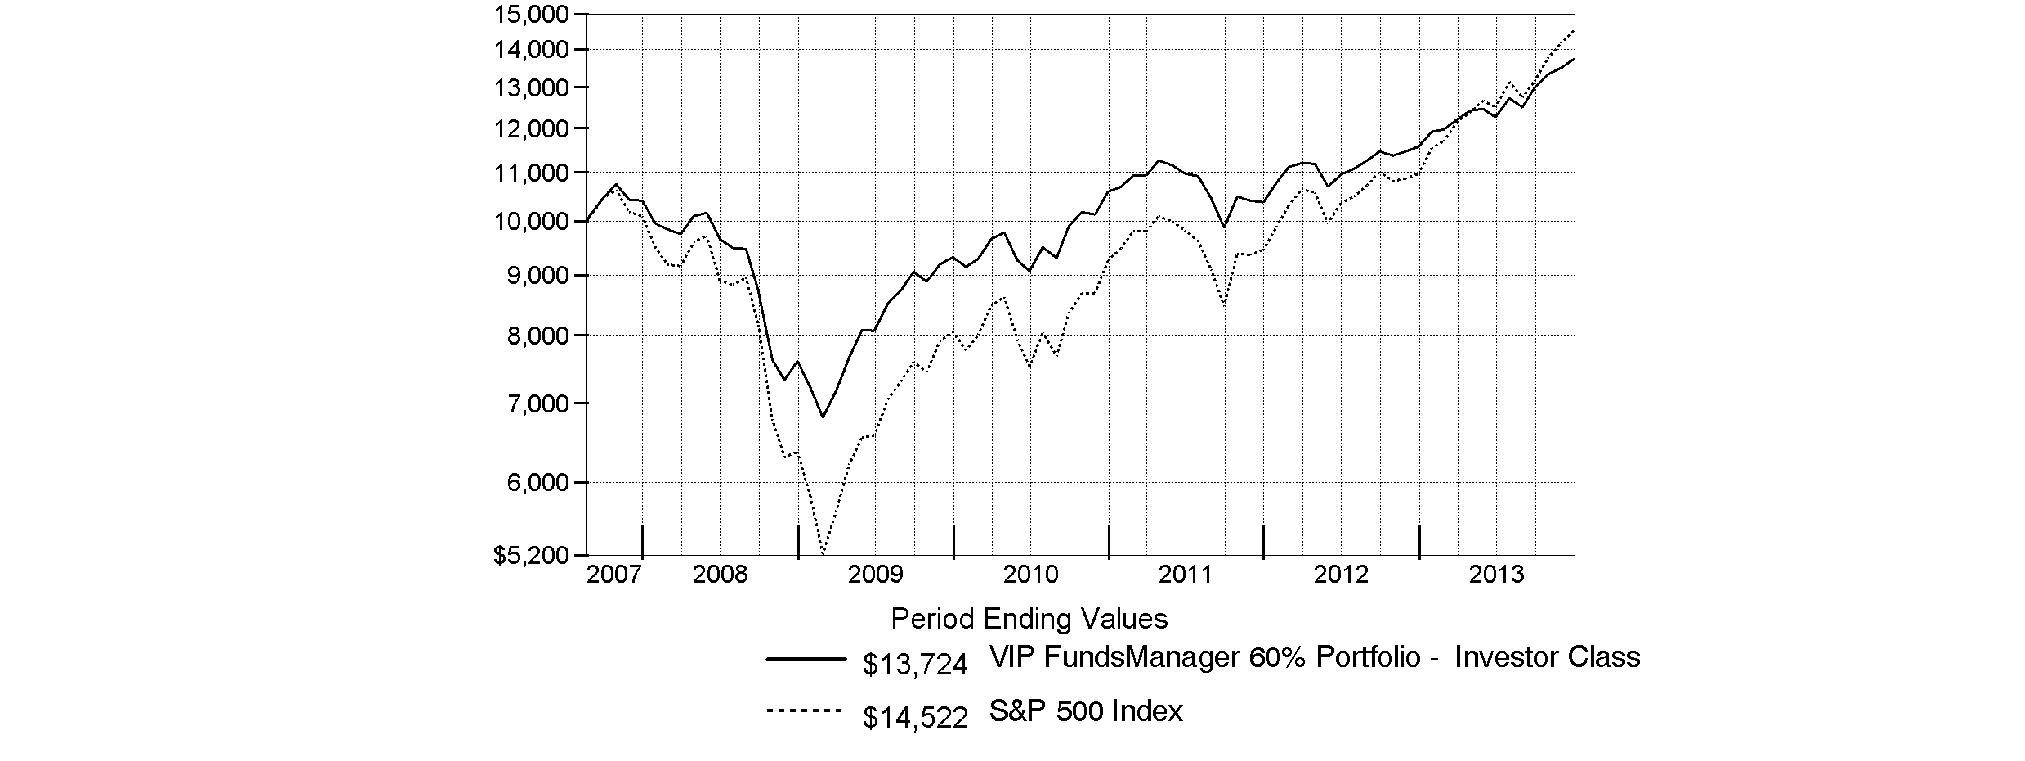
Annual Report
VIP FundsManager 70% Portfolio
Performance: The Bottom Line
Average annual total return reflects the change in the value of an investment, assuming reinvestment of the class' distributions from dividend income and capital gains (the profits earned upon the sale of securities that have grown in value, if any) and assuming a constant rate of performance each year. During periods of reimbursement by Fidelity, a fund's total return will be greater than it would be had the reimbursement not occurred. Performance numbers are net of all underlying fund operating expenses, but do not include any insurance charges imposed by your insurance company's separate account. If performance information included the effect of these additional charges, the total returns would have been lower. How a fund did yesterday is no guarantee of how it will do tomorrow.
Average Annual Total Returns
Periods ended December 31, 2013 | Past 1
year | Past 5
years | Life of fund A |
VIP FundsManager 70% Portfolio - Investor Class | 21.75% | 13.75% | 5.52% |
VIP FundsManager 70% Portfolio - Service Class | 21.75% | 13.75% | 5.52% |
VIP FundsManager 70% Portfolio - Service Class 2 | 21.54% | 13.59% | 5.36% |
A From April 13, 2006.
$10,000 Over Life of Fund
Let's say hypothetically that $10,000 was invested in VIP FundsManager 70% Portfolio - Investor Class on April 13, 2006, when the fund started. The chart shows how the value of your investment would have changed, and also shows how the S&P 500 Index performed over the same period.
Annual Report
VIP FundsManager 85% Portfolio
Performance: The Bottom Line
Average annual total return reflects the change in the value of an investment, assuming reinvestment of the class' distributions from dividend income and capital gains (the profits earned upon the sale of securities that have grown in value, if any) and assuming a constant rate of performance each year. During periods of reimbursement by Fidelity, a fund's total return will be greater than it would be had the reimbursement not occurred. Performance numbers are net of all underlying fund operating expenses, but do not include any insurance charges imposed by your insurance company's separate account. If performance information included the effect of these additional charges, the total returns would have been lower. How a fund did yesterday is no guarantee of how it will do tomorrow.
Average Annual Total Returns
Periods ended December 31, 2013 | Past 1
year | Past 5
years | Life of fund A |
VIP FundsManager 85% Portfolio - Investor Class | 27.73% | 15.57% | 5.48% |
VIP FundsManager 85% Portfolio - Service Class | 27.86% | 15.58% | 5.48% |
VIP FundsManager 85% Portfolio - Service Class 2 | 27.54% | 15.37% | 5.32% |
A From April 13, 2006.
$10,000 Over Life of Fund
Let's say hypothetically that $10,000 was invested in VIP FundsManager 85% Portfolio - Investor Class on April 13, 2006, when the fund started. The chart shows how the value of your investment would have changed, and also shows how the S&P 500 Index performed over the same period.
Annual Report
Market Recap: Global equity markets remained upbeat for the 12 months ending December 31, 2013, propelling the MSCI® ACWI® (All Country World Index) Index to a 23.24% return. Midyear turbulence gave way by autumn when policymakers in the U.S. and China had made clear their intentions to maintain accommodative monetary policies. That stance, combined with modest cyclical improvement around the globe and generally low valuations, underpinned the broad rally in equities, although the relative strength of the U.S. dollar generally tempered gains for U.S. investors holding foreign securities based in local currencies. During the period, the broad-market S&P 500® Index set a series of new highs, finishing the year up 32.39%. For the first time since 1995, the S&P® scored a "perfect 10," with all 10 economic sectors gaining at least 10% for the year. A resurgence in growth-oriented stocks lifted the Nasdaq Composite Index® to a 40.12% result for 2013, while the blue-chip Dow Jones Industrial AverageSM notched a relatively more modest 29.65% gain. International developed-markets equities rose in concert with their U.S. counterparts, with the MSCI® EAFE® Index gaining 22.92% for the period. Meanwhile, foreign exchange and commodity weakness curbed results in resource-heavy emerging markets (EM), especially in the year's waning months. More generally, concern over EM's slowing growth, its declining share of global trade and uncertainty surrounding U.S. central bank intentions were all factors hampering performance. The MSCI Emerging Markets Index returned -2.27% for the period. On the bond side, U.S. high-yield securities rallied with equities for much of the period, with The BofA Merrill LynchSM US High Yield Constrained Index returning 7.41% for 2013. The more rate-sensitive U.S. investment-grade bond category faced headwinds though, as reflected in the -2.02% return of the Barclays® U.S. Aggregate Bond Index. Within the Barclays index, investment-grade corporate credit returned -2.01%, while ultra-safe U.S. Treasuries saw a -2.75% result. Major non-U.S. developed markets performed only slightly better, with the Citigroup® Non-USD Group-of-Seven (G7) Equal Weighted Index logging a -1.59% result. After several years of strong advances, EM debt reversed course in 2013, with the J.P. Morgan Emerging Markets Bond Index Global returning -6.58%.
Comments from Xuehai En, Portfolio Manager of VIP FundsManager® Portfolios: For the year, the various classes of the VIP Funds-Manager® Portfolios outpaced their respective Composite benchmarks. (For specific portfolio results, please see the performance section of this report.) Asset allocation and security selection were positive across all of the Portfolios. U.S. equities added the most value by far, due to an overweighting in the asset class and strong underlying security selection. My overall fixed-income strategy - underweighting investment-grade bonds and cash while maintaining small positions in high-yield and floating-rate bonds and emerging-markets (EM) debt - also contributed. Elsewhere, favorable stock selection in foreign developed-markets equities modestly aided most of the Portfolios. Conversely, our allocation to EM equities and a small position in gold via Fidelity® Select Gold Portfolio were the biggest detractors, mainly because of poor performance in those asset classes during the period's first half. Favorable EM stock picks partially offset the negative result in that category. I sold most of Select Gold Portfolio near the middle of the year. I adjusted the Portfolios' asset-class positioning in several ways during the year. After boosting their exposure to domestic equities during the period's first half, I trimmed the allocations here in the second half, in order to keep the U.S. stock overweighting from becoming too large. I redeployed these proceeds, along with new inflows, into foreign developed-markets equities, bringing these allocations to roughly neutral by period-end. Additionally, after a long bull run, I reduced the Portfolios' investment-grade bond exposure early in the year. These allocations shrank further during the balance of 2013 because of the category's negative return. Most of the top-contributing underlying funds were Fidelity sector and industry funds - Fidelity® Select Portfolios® - including Health Care Portfolio, Software and Computer Services Portfolio, Biotechnology Portfolio, Industrials Portfolio and Insurance Portfolio, among others. On the downside, additional detractors included the defensively oriented Consumer Staples Portfolio, which lagged amid a strong, upwardly trending stock market. Also, reflecting the poor performance of EM equities during the period, Fidelity® Emerging Asia Fund hampered relative performance. Lastly, Energy Portfolio notably detracted in most of the Portfolios.
The views expressed above reflect those of the portfolio manager(s) only through the end of the period as stated on the cover of this report and do not necessarily represent the views of Fidelity or any other person in the Fidelity organization. Any such views are subject to change at any time based upon market or other conditions and Fidelity disclaims any responsibility to update such views. These views may not be relied on as investment advice and, because investment decisions for a Fidelity fund are based on numerous factors, may not be relied on as an indication of trading intent on behalf of any Fidelity fund.
Annual Report
As a shareholder of a Fund, you incur two types of costs: (1) transaction costs, and (2) ongoing costs, including distribution and/or service (12b-1) fees and other Fund expenses. This Example is intended to help you understand your ongoing costs (in dollars) of investing in the Funds and to compare these costs with the ongoing costs of investing in other mutual funds.
The Example is based on an investment of $1,000 invested at the beginning of the period and held for the entire period (July 1, 2013 to December 31, 2013).
Actual Expenses
The first line of the accompanying table for each class of each fund provides information about actual account values and actual expenses. You may use the information in this line, together with the amount you invested, to estimate the expenses that you paid over the period. Simply divide your account value by $1,000.00 (for example, an $8,600 account value divided by $1,000.00 = 8.6), then multiply the result by the number in the first line for a class of the fund under the heading entitled "Expenses Paid During Period" to estimate the expenses you paid on your account during this period. The estimate of expenses does not include any fees or other expenses of any variable annuity or variable life insurance product. If they were, the estimate of expenses you paid during the period would be higher, and your ending account value would be lower. In addition, each Fund, as a shareholder in underlying Fidelity Funds, will indirectly bear its pro-rata share of the fees and expenses incurred by the underlying Fidelity Funds. These fees and expenses are not included in each Fund's annualized expense ratio used to calculate the expense estimates in the table below.
Hypothetical Example for Comparison Purposes
The second line of the accompanying table for each class of each fund provides information about hypothetical account values and hypothetical expenses based on a Class' actual expense ratio and an assumed rate of return of 5% per year before expenses, which is not the Class' actual return. The hypothetical account values and expenses may not be used to estimate the actual ending account balance or expenses you paid for the period. You may use this information to compare the ongoing costs of investing in the Fund and other funds. To do so, compare this 5% hypothetical example with the 5% hypothetical examples that appear in the shareholder reports of the other funds. The estimate of expenses does not include any fees or other expenses of any variable annuity or variable life insurance product. If they were, the estimate of expenses you paid during the period would be higher, and your ending account value would be lower. In addition, each Fund, as a shareholder in underlying Fidelity Funds, will indirectly bear its pro-rata share of the fees and expenses incurred by the underlying Fidelity Funds. These fees and expenses are not included in each Fund's annualized expense ratio used to calculate the expense estimates in the table below.
Please note that the expenses shown in the table are meant to highlight your ongoing costs only and do not reflect any transaction costs. Therefore, the second line of the table is useful in comparing ongoing costs only, and will not help you determine the relative total costs of owning different funds.
| Annualized
Expense RatioB | Beginning
Account Value
July 1, 2013 | Ending
Account Value
December 31, 2013 | Expenses Paid
During Period*
July 1, 2013 to
December 31, 2013 |
VIP FundsManager 20% Portfolio | | | | |
Service Class | .20% | | | |
Actual | | $ 1,000.00 | $ 1,043.80 | $ 1.03 |
HypotheticalA | | $ 1,000.00 | $ 1,024.20 | $ 1.02 |
Service Class 2 | .35% | | | |
Actual | | $ 1,000.00 | $ 1,044.00 | $ 1.80 |
HypotheticalA | | $ 1,000.00 | $ 1,023.44 | $ 1.79 |
Investor Class | .20% | | | |
Actual | | $ 1,000.00 | $ 1,044.70 | $ 1.03 |
HypotheticalA | | $ 1,000.00 | $ 1,024.20 | $ 1.02 |
VIP FundsManager 50% Portfolio | | | | |
Service Class | .20% | | | |
Actual | | $ 1,000.00 | $ 1,098.30 | $ 1.06 |
HypotheticalA | | $ 1,000.00 | $ 1,024.20 | $ 1.02 |
Service Class 2 | .35% | | | |
Actual | | $ 1,000.00 | $ 1,097.90 | $ 1.85 |
HypotheticalA | | $ 1,000.00 | $ 1,023.44 | $ 1.79 |
Investor Class | .20% | | | |
Actual | | $ 1,000.00 | $ 1,098.30 | $ 1.06 |
HypotheticalA | | $ 1,000.00 | $ 1,024.20 | $ 1.02 |
VIP FundsManager 60% Portfolio | | | | |
Service Class | .20% | | | |
Actual | | $ 1,000.00 | $ 1,119.60 | $ 1.07 |
HypotheticalA | | $ 1,000.00 | $ 1,024.20 | $ 1.02 |
| Annualized
Expense RatioB | Beginning
Account Value
July 1, 2013 | Ending
Account Value
December 31, 2013 | Expenses Paid
During Period*
July 1, 2013 to
December 31, 2013 |
VIP FundsManager 60% Portfolio | | | | |
Service Class 2 | .35% | | | |
Actual | | $ 1,000.00 | $ 1,118.40 | $ 1.87 |
HypotheticalA | | $ 1,000.00 | $ 1,023.44 | $ 1.79 |
Investor Class | .20% | | | |
Actual | | $ 1,000.00 | $ 1,119.60 | $ 1.07 |
HypotheticalA | | $ 1,000.00 | $ 1,024.20 | $ 1.02 |
VIP FundsManager 70% Portfolio | | | | |
Service Class | .20% | | | |
Actual | | $ 1,000.00 | $ 1,135.00 | $ 1.08 |
HypotheticalA | | $ 1,000.00 | $ 1,024.20 | $ 1.02 |
Service Class 2 | .35% | | | |
Actual | | $ 1,000.00 | $ 1,134.90 | $ 1.88 |
HypotheticalA | | $ 1,000.00 | $ 1,023.44 | $ 1.79 |
Investor Class | .20% | | | |
Actual | | $ 1,000.00 | $ 1,136.00 | $ 1.08 |
HypotheticalA | | $ 1,000.00 | $ 1,024.20 | $ 1.02 |
VIP FundsManager 85% Portfolio | | | | |
Service Class | .20% | | | |
Actual | | $ 1,000.00 | $ 1,165.90 | $ 1.09 |
HypotheticalA | | $ 1,000.00 | $ 1,024.20 | $ 1.02 |
Service Class 2 | .35% | | | |
Actual | | $ 1,000.00 | $ 1,165.00 | $ 1.91 |
HypotheticalA | | $ 1,000.00 | $ 1,023.44 | $ 1.79 |
Investor Class | .20% | | | |
Actual | | $ 1,000.00 | $ 1,165.90 | $ 1.09 |
HypotheticalA | | $ 1,000.00 | $ 1,024.20 | $ 1.02 |
A 5% return per year before expenses
B Annualized expense ratio reflects expenses net of applicable fee waivers.
* Expenses are equal to each Class' annualized expense ratio, multiplied by the average account value over the period, multiplied by 184/ 365 (to reflect the one-half year period). The fees and expenses of the underlying Fidelity Funds in which each Fund invests are not included in each Class' annualized expense ratio.
Annual Report
VIP FundsManager 20% Portfolio
Investment Changes (Unaudited)
The information in the following tables is based on the direct investments of the Fund. |
Fund Holdings as of December 31, 2013 |
| % of fund's
net assets | % of fund's net assets
6 months ago |
Domestic Equity Funds | | |
Fidelity Air Transportation Portfolio | 0.1 | 0.1 |
Fidelity Automotive Portfolio | 0.2 | 0.1 |
Fidelity Banking Portfolio | 0.4 | 0.8 |
Fidelity Biotechnology Portfolio | 0.0* | 0.5 |
Fidelity Blue Chip Growth Fund | 0.1 | 0.0* |
Fidelity Brokerage & Investment Management Portfolio | 1.1 | 0.7 |
Fidelity Capital Appreciation Fund | 0.3 | 0.6 |
Fidelity Chemicals Portfolio | 0.2 | 0.1 |
Fidelity Communications Equipment Portfolio | 0.3 | 0.3 |
Fidelity Computers Portfolio | 0.2 | 0.4 |
Fidelity Construction & Housing Portfolio | 0.0* | 0.5 |
Fidelity Consumer Discretionary Portfolio | 0.9 | 0.8 |
Fidelity Consumer Finance Portfolio | 0.3 | 0.3 |
Fidelity Consumer Staples Portfolio | 0.9 | 1.4 |
Fidelity Contrafund | 0.1 | 0.0* |
Fidelity Defense & Aerospace Portfolio | 0.0* | 0.0* |
Fidelity Disciplined Equity Fund | 0.1 | 0.0* |
Fidelity Dividend Growth Fund | 0.0* | 0.0* |
Fidelity Electronics Portfolio | 0.1 | 0.3 |
Fidelity Energy Portfolio | 0.8 | 0.7 |
Fidelity Energy Service Portfolio | 0.3 | 0.8 |
Fidelity Environmental & Alternative Energy Portfolio | 0.0* | 0.0* |
Fidelity Equity Dividend Income Fund | 0.0* | 0.0* |
Fidelity Equity-Income Fund | 0.2 | 0.7 |
Fidelity Financial Services Portfolio | 0.8 | 0.6 |
Fidelity Fund | 0.0* | 0.0* |
Fidelity Global Commodity Stock Fund | 0.0* | 0.0* |
Fidelity Gold Portfolio | 0.0* | 0.1 |
Fidelity Growth & Income Portfolio | 0.0* | 0.0* |
Fidelity Growth Company Fund | 0.0* | 0.0* |
Fidelity Growth Discovery Fund | 0.0* | 0.0 |
Fidelity Health Care Portfolio | 2.3 | 1.3 |
Fidelity Independence Fund | 0.1 | 0.1 |
Fidelity Industrial Equipment Portfolio | 0.5 | 0.5 |
Fidelity Industrials Portfolio | 1.5 | 1.1 |
|
| % of fund's
net assets | % of fund's net assets
6 months ago |
Fidelity Insurance Portfolio | 0.7 | 0.6 |
Fidelity IT Services Portfolio | 0.4 | 0.3 |
Fidelity Large Cap Stock Fund | 0.3 | 0.2 |
Fidelity Large Cap Value Fund | 0.0* | 0.0* |
Fidelity Leisure Portfolio | 0.1 | 0.1 |
Fidelity Leveraged Company Stock Fund | 0.0* | 0.0* |
Fidelity Low-Priced Stock Fund | 0.0* | 0.0 |
Fidelity Magellan Fund | 0.0* | 0.0* |
Fidelity Materials Portfolio | 0.1 | 0.0* |
Fidelity Medical Delivery Portfolio | 0.0* | 0.0* |
Fidelity Medical Equipment & Systems Portfolio | 0.0* | 0.0* |
Fidelity Mega Cap Stock Fund | 0.2 | 0.3 |
Fidelity Mid-Cap Stock Fund | 0.0* | 0.0* |
Fidelity Multimedia Portfolio | 0.4 | 0.5 |
Fidelity Natural Gas Portfolio | 0.0* | 0.0* |
Fidelity Natural Resources Portfolio | 0.0* | 0.0* |
Fidelity New Millennium Fund | 0.3 | 0.1 |
Fidelity OTC Portfolio | 0.5 | 0.4 |
Fidelity Pharmaceuticals Portfolio | 0.0* | 0.3 |
Fidelity Real Estate Investment Portfolio | 0.1 | 0.1 |
Fidelity Retailing Portfolio | 0.1 | 0.1 |
Fidelity Series Commodity Strategy Fund | 0.0* | 0.0* |
Fidelity Small Cap Discovery Fund | 0.3 | 0.1 |
Fidelity Small Cap Growth Fund | 0.0* | 0.0* |
Fidelity Small Cap Stock Fund | 0.0* | 0.0* |
Fidelity Small Cap Value Fund | 0.3 | 0.0* |
Fidelity Software & Computer Services Portfolio | 1.8 | 1.7 |
Fidelity Technology Portfolio | 0.0 | 0.3 |
Fidelity Telecom and Utilities Fund | 0.0* | 0.1 |
Fidelity Telecommunications Portfolio | 0.2 | 0.2 |
Fidelity Transportation Portfolio | 0.2 | 0.1 |
Fidelity Utilities Portfolio | 0.0* | 0.0* |
Fidelity Value Fund | 0.0* | 0.0* |
Spartan Extended Market Index Fund Investor Class | 0.0* | 0.0* |
Spartan Total Market Index Fund Investor Class | 0.0* | 0.0* |
VIP Energy Portfolio Investor Class | 0.4 | 0.3 |
VIP Mid Cap Portfolio Investor Class | 0.0* | 0.0* |
| 18.2 | 18.6 |
Fund Holdings as of December 31, 2013 - continued |
| % of fund's
net assets | % of fund's net assets
6 months ago |
International Equity Funds | | |
Fidelity Canada Fund | 0.0* | 0.0* |
Fidelity China Region Fund | 0.1 | 0.1 |
Fidelity Diversified International Fund | 1.4 | 0.6 |
Fidelity Emerging Asia Fund | 0.3 | 0.4 |
Fidelity Emerging Markets Fund | 0.3 | 0.1 |
Fidelity Europe Capital Appreciation Fund | 0.1 | 0.0 |
Fidelity Europe Fund | 0.4 | 0.1 |
Fidelity International Capital Appreciation Fund | 0.2 | 0.2 |
Fidelity International Discovery Fund | 2.5 | 0.5 |
Fidelity International Real Estate Fund | 0.0* | 0.0* |
Fidelity International Small Cap Fund | 0.1 | 0.1 |
Fidelity International Small Cap Opportunities Fund | 0.3 | 0.3 |
Fidelity International Value Fund | 0.2 | 0.1 |
Fidelity Japan Fund | 0.0* | 0.0* |
Fidelity Japan Smaller Companies Fund | 0.2 | 0.1 |
Fidelity Nordic Fund | 0.2 | 0.2 |
Fidelity Overseas Fund | 0.0* | 0.0* |
Fidelity Pacific Basin Fund | 0.2 | 0.2 |
Spartan International Index Fund Investor Class | 1.3 | 1.0 |
| 7.8 | 4.0 |
Fixed-Income Funds | | |
Fidelity Floating Rate High Income Fund | 1.6 | 2.3 |
Fidelity Focused High Income Fund | 0.1 | 0.2 |
Fidelity High Income Fund | 1.6 | 0.7 |
Fidelity New Markets Income Fund | 0.1 | 0.3 |
Fidelity Real Estate Income Fund | 0.1 | 0.1 |
Spartan U.S. Bond Index Fund Investor Class | 46.0 | 46.3 |
| 49.5 | 49.9 |
Money Market Funds | | |
Fidelity Institutional Money Market Portfolio Class I | 1.9 | 1.9 |
Fidelity Institutional Prime Money Market Portfolio Class I | 17.9 | 20.9 |
Fidelity Select Money Market Portfolio | 4.7 | 4.7 |
| 24.5 | 27.5 |
Net Other Assets (Liabilities)* | 0.0 | 0.0 |
| 100.0 | 100.0 |
* Amount represents less than 0.1%
Asset Allocation (% of fund's net assets) |
As of December 31, 2013 |
 | Domestic Equity Funds | 18.2% | |
 | International Equity Funds | 7.8% | |
 | Fixed-Income Funds | 49.5% | |
 | Money Market Funds | 24.5% | |

As of June 30, 2013 |
| Domestic Equity Funds | 18.6% | |
| International Equity Funds | 4.0% | |
| Fixed-Income Funds | 49.9% | |
| Money Market Funds | 27.5% | |

Annual Report
VIP FundsManager 20% Portfolio
Investments December 31, 2013
Showing Percentage of Net Assets
Equity Funds - 26.0% |
| Shares | | Value |
Domestic Equity Funds - 18.2% |
Fidelity Air Transportation Portfolio (c) | 9,509 | | $ 563,881 |
Fidelity Automotive Portfolio (c) | 24,104 | | 1,357,761 |
Fidelity Banking Portfolio (c) | 98,045 | | 2,565,839 |
Fidelity Biotechnology Portfolio (c) | 1,036 | | 188,247 |
Fidelity Blue Chip Growth Fund (c) | 12,174 | | 771,438 |
Fidelity Brokerage & Investment Management Portfolio (c) | 100,522 | | 7,463,745 |
Fidelity Capital Appreciation Fund (c) | 58,032 | | 2,099,582 |
Fidelity Chemicals Portfolio (c) | 7,166 | | 1,045,303 |
Fidelity Communications Equipment Portfolio (c) | 77,607 | | 2,289,418 |
Fidelity Computers Portfolio (c) | 20,832 | | 1,544,074 |
Fidelity Construction & Housing Portfolio (c) | 1,002 | | 54,655 |
Fidelity Consumer Discretionary Portfolio (c) | 194,917 | | 6,455,657 |
Fidelity Consumer Finance Portfolio (c) | 139,390 | | 2,280,416 |
Fidelity Consumer Staples Portfolio (c) | 68,864 | | 6,212,247 |
Fidelity Contrafund (c) | 4,988 | | 479,558 |
Fidelity Defense & Aerospace Portfolio (c) | 1,735 | | 212,338 |
Fidelity Disciplined Equity Fund (c) | 11,861 | | 383,340 |
Fidelity Dividend Growth Fund (c) | 544 | | 19,256 |
Fidelity Electronics Portfolio (c) | 5,547 | | 350,161 |
Fidelity Energy Portfolio (c) | 103,314 | | 5,796,947 |
Fidelity Energy Service Portfolio (c) | 21,681 | | 1,839,664 |
Fidelity Environmental & Alternative Energy Portfolio (c) | 11,086 | | 253,092 |
Fidelity Equity Dividend Income Fund (c) | 725 | | 17,854 |
Fidelity Equity-Income Fund (c) | 22,116 | | 1,298,201 |
Fidelity Financial Services Portfolio (c) | 69,141 | | 5,654,338 |
Fidelity Fund (c) | 709 | | 30,236 |
Fidelity Global Commodity Stock Fund (c) | 3,802 | | 53,718 |
Fidelity Gold Portfolio (a)(c) | 6,965 | | 125,169 |
Fidelity Growth & Income Portfolio (c) | 112 | | 3,113 |
Fidelity Growth Company Fund (c) | 1,253 | | 150,203 |
Fidelity Growth Discovery Fund (c) | 5,571 | | 118,269 |
Fidelity Health Care Portfolio (c) | 85,782 | | 16,170,782 |
Fidelity Independence Fund (c) | 23,763 | | 860,940 |
Fidelity Industrial Equipment Portfolio (c) | 69,279 | | 3,174,351 |
Fidelity Industrials Portfolio (c) | 317,103 | | 10,676,857 |
Fidelity Insurance Portfolio (c) | 73,153 | | 5,016,864 |
Fidelity IT Services Portfolio (c) | 81,290 | | 3,042,691 |
Fidelity Large Cap Stock Fund (c) | 71,426 | | 1,944,931 |
Fidelity Large Cap Value Fund (c) | 10,350 | | 157,841 |
Fidelity Leisure Portfolio (c) | 4,529 | | 603,162 |
Fidelity Leveraged Company Stock Fund (c) | 197 | | 8,519 |
Fidelity Low-Priced Stock Fund (c) | 1,417 | | 70,108 |
Fidelity Magellan Fund (c) | 411 | | 37,919 |
Fidelity Materials Portfolio (c) | 3,311 | | 281,082 |
Fidelity Medical Delivery Portfolio (c) | 171 | | 12,500 |
|
| Shares | | Value |
Fidelity Medical Equipment & Systems Portfolio (c) | 445 | | $ 15,916 |
Fidelity Mega Cap Stock Fund (c) | 84,918 | | 1,309,441 |
Fidelity Mid-Cap Stock Fund (c) | 2,206 | | 87,173 |
Fidelity Multimedia Portfolio (c) | 34,917 | | 2,827,249 |
Fidelity Natural Gas Portfolio (c) | 150 | | 5,666 |
Fidelity Natural Resources Portfolio (c) | 896 | | 33,076 |
Fidelity New Millennium Fund (c) | 42,535 | | 1,678,855 |
Fidelity OTC Portfolio (c) | 46,493 | | 3,598,123 |
Fidelity Pharmaceuticals Portfolio (c) | 6,937 | | 133,265 |
Fidelity Real Estate Investment Portfolio (c) | 14,155 | | 451,969 |
Fidelity Retailing Portfolio (c) | 8,725 | | 763,312 |
Fidelity Series Commodity Strategy Fund (a)(c) | 1,089 | | 8,628 |
Fidelity Small Cap Discovery Fund (c) | 55,854 | | 1,745,982 |
Fidelity Small Cap Growth Fund (c) | 10,287 | | 198,238 |
Fidelity Small Cap Stock Fund (c) | 571 | | 11,961 |
Fidelity Small Cap Value Fund (c) | 92,048 | | 1,844,650 |
Fidelity Software & Computer Services Portfolio (c) | 101,886 | | 12,089,760 |
Fidelity Telecom and Utilities Fund (c) | 5,562 | | 122,424 |
Fidelity Telecommunications Portfolio (c) | 20,694 | | 1,251,781 |
Fidelity Transportation Portfolio (c) | 15,264 | | 1,127,230 |
Fidelity Utilities Portfolio (c) | 3,442 | | 229,274 |
Fidelity Value Fund (c) | 1,534 | | 158,870 |
Spartan Extended Market Index Fund Investor Class (c) | 293 | | 15,662 |
Spartan Total Market Index Fund Investor Class (c) | 3,504 | | 189,613 |
VIP Energy Portfolio Investor Class (c) | 107,633 | | 2,572,440 |
VIP Mid Cap Portfolio Investor Class (c) | 99 | | 3,595 |
TOTAL DOMESTIC EQUITY FUNDS | | 126,210,420 |
International Equity Funds - 7.8% |
Fidelity Canada Fund (c) | 2,514 | | 146,592 |
Fidelity China Region Fund (c) | 15,197 | | 513,044 |
Fidelity Diversified International Fund (c) | 259,961 | | 9,595,158 |
Fidelity Emerging Asia Fund (c) | 75,746 | | 2,320,860 |
Fidelity Emerging Markets Fund (c) | 94,264 | | 2,270,820 |
Fidelity Europe Capital Appreciation Fund (c) | 38,822 | | 914,247 |
Fidelity Europe Fund (c) | 77,810 | | 3,026,041 |
Fidelity International Capital Appreciation Fund (c) | 79,461 | | 1,330,972 |
Fidelity International Discovery Fund (c) | 428,673 | | 17,361,242 |
Fidelity International Real Estate Fund (c) | 1,097 | | 11,160 |
Fidelity International Small Cap Fund (c) | 20,756 | | 556,055 |
Fidelity International Small Cap Opportunities Fund (c) | 168,734 | | 2,355,520 |
Fidelity International Value Fund (c) | 130,552 | | 1,181,497 |
Fidelity Japan Fund (c) | 3,353 | | 40,369 |
Fidelity Japan Smaller Companies Fund (c) | 78,252 | | 1,051,705 |
Equity Funds - continued |
| Shares | | Value |
International Equity Funds - continued |
Fidelity Nordic Fund (c) | 37,015 | | $ 1,657,534 |
Fidelity Overseas Fund (c) | 455 | | 18,319 |
Fidelity Pacific Basin Fund (c) | 47,541 | | 1,314,981 |
Spartan International Index Fund Investor Class (c) | 214,578 | | 8,726,882 |
TOTAL INTERNATIONAL EQUITY FUNDS | | 54,392,998 |
TOTAL EQUITY FUNDS (Cost $139,351,141) |
180,603,418
|
Fixed-Income Funds - 49.5% |
| | | |
Fidelity Floating Rate High Income Fund (c) | 1,108,922 | | 11,044,861 |
Fidelity Focused High Income Fund (c) | 61,508 | | 553,576 |
Fidelity High Income Fund (c) | 1,188,608 | | 11,137,255 |
Fidelity New Markets Income Fund (c) | 72,534 | | 1,130,813 |
Fidelity Real Estate Income Fund (c) | 50,997 | | 565,052 |
Spartan U.S. Bond Index Fund Investor Class (c) | 28,190,178 | | 320,240,419 |
TOTAL FIXED-INCOME FUNDS (Cost $341,710,342) |
344,671,976
|
Money Market Funds - 24.5% |
| Shares | | Value |
Fidelity Institutional Money Market Portfolio Class I 0.01% (b)(c) | 13,203,190 | | $ 13,203,190 |
Fidelity Institutional Prime Money Market Portfolio Class I 0.01% (b)(c) | 124,480,048 | | 124,480,048 |
Fidelity Select Money Market Portfolio 0.01% (b)(c) | 32,970,809 | | 32,970,809 |
TOTAL MONEY MARKET FUNDS (Cost $170,654,047) |
170,654,047
|
TOTAL INVESTMENT PORTFOLIO - 100.0% (Cost $651,715,530) | | 695,929,441 |
NET OTHER ASSETS (LIABILITIES) - 0.0% | | (115,265) |
NET ASSETS - 100% | $ 695,814,176 |
Legend |
(a) Non-income producing |
(b) The rate quoted is the annualized seven-day yield of the fund at period end. |
(c) Affiliated company |
Affiliated Underlying Funds |
Information regarding the Fund's fiscal year to date purchases and sales of the affiliated Underlying Funds and income earned by the Fund from investments in affiliated Underlying Funds is as follows: |
Affiliate | Value,
beginning of period | Purchases | Sales
Proceeds | Dividend
Income | Value,
end of
period |
Fidelity Air Transportation Portfolio | $ 127,877 | $ 303,541 | $ - | $ 507 | $ 563,881 |
Fidelity Automotive Portfolio | 308,146 | 864,634 | - | 3,511 | 1,357,761 |
Fidelity Banking Portfolio | 4,462,144 | 275,630 | 3,488,528 | 23,941 | 2,565,839 |
Fidelity Biotechnology Portfolio | 2,120,052 | 426,694 | 3,505,223 | - | 188,247 |
Fidelity Blue Chip Growth Fund | 25,018 | 707,945 | - | 1,326 | 771,438 |
Fidelity Brokerage & Investment Management Portfolio | 3,087,543 | 2,462,600 | 36,412 | 38,719 | 7,463,745 |
Fidelity Canada Fund | 133,212 | 1,392 | - | 595 | 146,592 |
Fidelity Capital Appreciation Fund | 3,420,328 | 191,384 | 2,300,000 | 7,570 | 2,099,582 |
Fidelity Chemicals Portfolio | 252,832 | 640,916 | - | 7,665 | 1,045,303 |
Fidelity China Region Fund | 942,464 | 353,645 | 800,000 | 5,193 | 513,044 |
Fidelity Commodity Strategy Fund | 9,582 | - | 9,059 | - | - |
Fidelity Communications Equipment Portfolio | 989,105 | 845,410 | - | 15,413 | 2,289,418 |
Fidelity Computers Portfolio | 2,630,862 | 222,686 | 1,676,924 | 11,749 | 1,544,074 |
Fidelity Construction & Housing Portfolio | 2,850,792 | 363,304 | 3,541,322 | 849 | 54,655 |
Fidelity Consumer Discretionary Portfolio | 5,416,693 | 1,095,202 | 1,642,522 | 6,336 | 6,455,657 |
Fidelity Consumer Finance Portfolio | 1,894,138 | 348,763 | 221,661 | 50,214 | 2,280,416 |
Fidelity Consumer Staples Portfolio | 9,561,239 | 864,089 | 5,442,569 | 119,063 | 6,212,247 |
Fidelity Contrafund | 22,323 | 457,225 | - | 519 | 479,558 |
Fidelity Defense & Aerospace Portfolio | 106,144 | 62,555 | - | 968 | 212,338 |
Fidelity Disciplined Equity Fund | 12,078 | 361,017 | - | 6,975 | 383,340 |
Fidelity Diversified International Fund | 4,048,158 | 5,413,656 | 1,157,066 | 80,306 | 9,595,158 |
Fidelity Dividend Growth Fund | 64,954 | 1,798 | 60,000 | 189 | 19,256 |
Fidelity Electronics Portfolio | 1,954,310 | 2,204 | 2,200,000 | 1,850 | 350,161 |
Fidelity Emerging Asia Fund | 4,509,583 | 563,164 | 2,622,109 | 28,890 | 2,320,860 |
Fidelity Emerging Markets Fund | 1,846,153 | 1,752,740 | 1,223,681 | 1,790 | 2,270,820 |
Affiliate | Value,
beginning of period | Purchases | Sales
Proceeds | Dividend
Income | Value,
end of
period |
Fidelity Energy Portfolio | $ 5,612,750 | $ 2,188,847 | $ 2,591,741 | $ 44,820 | $ 5,796,947 |
Fidelity Energy Service Portfolio | 3,996,959 | 2,467,101 | 5,758,494 | 9,352 | 1,839,664 |
Fidelity Environmental & Alternative Energy Portfolio | 187,492 | 1,905 | - | 1,905 | 253,092 |
Fidelity Equity Dividend Income Fund | 13,834 | 333 | - | 333 | 17,854 |
Fidelity Equity-Income Fund | 3,979,748 | 534,239 | 3,951,384 | 58,989 | 1,298,201 |
Fidelity Europe Capital Appreciation Fund | - | 838,982 | - | 13,982 | 914,247 |
Fidelity Europe Fund | - | 2,727,424 | - | 39,878 | 3,026,041 |
Fidelity Financial Services Portfolio | 2,293,070 | 4,117,129 | 1,700,000 | 49,447 | 5,654,338 |
Fidelity Floating Rate High Income Fund | 17,639,788 | 1,651,977 | 8,318,105 | 500,696 | 11,044,861 |
Fidelity Focused High Income Fund | 2,159,339 | 269,113 | 1,820,424 | 69,474 | 553,576 |
Fidelity Fund | 23,438 | 2,206 | - | 218 | 30,236 |
Fidelity Global Commodity Stock Fund | 55,490 | 753 | - | 704 | 53,718 |
Fidelity Gold Portfolio | 2,479,897 | - | 1,330,021 | - | 125,169 |
Fidelity Growth & Income Portfolio | - | 304,358 | 310,719 | 1,243 | 3,113 |
Fidelity Growth Company Fund | 109,155 | 9,751 | - | 243 | 150,203 |
Fidelity Growth Discovery Fund | - | 106,591 | - | - | 118,269 |
Fidelity Health Care Portfolio | 8,092,667 | 5,988,753 | 836,715 | 1,940 | 16,170,782 |
Fidelity High Income Fund | 11,416,150 | 6,358,016 | 6,589,543 | 493,930 | 11,137,255 |
Fidelity Independence Fund | 1,527,957 | 2,606 | 1,000,000 | 2,606 | 860,940 |
Fidelity Industrial Equipment Portfolio | 2,639,807 | 758,484 | 900,000 | 22,027 | 3,174,351 |
Fidelity Industrials Portfolio | 5,773,570 | 3,389,319 | 525,188 | 60,007 | 10,676,857 |
Fidelity Institutional Money Market Portfolio Class I | 13,192,892 | 10,299 | - | 10,299 | 13,203,190 |
Fidelity Institutional Prime Money Market Portfolio Class I | 104,987,825 | 50,561,315 | 31,069,092 | 28,369 | 124,480,048 |
Fidelity Insurance Portfolio | 3,280,588 | 658,817 | 63,180 | 41,853 | 5,016,864 |
Fidelity International Capital Appreciation Fund | 1,496,924 | 179,702 | 595,109 | 9,387 | 1,330,972 |
Fidelity International Discovery Fund | 2,970,874 | 13,331,405 | 598,685 | 197,925 | 17,361,242 |
Fidelity International Real Estate Fund | 311,876 | 561 | 320,000 | 194 | 11,160 |
Fidelity International Small Cap Fund | 133,841 | 348,074 | - | 1,861 | 556,055 |
Fidelity International Small Cap Opportunities Fund | 1,935,616 | 47,239 | 80,207 | 15,313 | 2,355,520 |
Fidelity International Value Fund | 842,435 | 159,164 | - | 25,110 | 1,181,497 |
Fidelity IT Services Portfolio | 1,987,075 | 84,131 | - | - | 3,042,691 |
Fidelity Japan Fund | 32,647 | 379 | - | 349 | 40,369 |
Fidelity Japan Smaller Companies Fund | 53,435 | 924,620 | 71,039 | 1,388 | 1,051,705 |
Fidelity Large Cap Stock Fund | 277,248 | 1,647,034 | 188,380 | 12,339 | 1,944,931 |
Fidelity Large Cap Value Fund | 119,361 | 2,416 | - | 1,937 | 157,841 |
Fidelity Leisure Portfolio | 372,167 | 101,813 | - | 4,231 | 603,162 |
Fidelity Leveraged Company Stock Fund | 6,305 | 53 | - | 53 | 8,519 |
Fidelity Low-Priced Stock Fund | - | 68,439 | - | 264 | 70,108 |
Fidelity Magellan Fund | 28,027 | 2,504 | - | 259 | 37,919 |
Fidelity Materials Portfolio | 58,169 | 201,953 | - | 1,402 | 281,082 |
Fidelity Medical Delivery Portfolio | 82,470 | 2,195 | 90,000 | - | 12,500 |
Fidelity Medical Equipment & Systems Portfolio | 61,828 | 33,487 | 100,000 | - | 15,916 |
Fidelity Mega Cap Stock Fund | 1,854,905 | 558,052 | 1,551,364 | 21,997 | 1,309,441 |
Fidelity Mid-Cap Stock Fund | 62,726 | 2,620 | - | 184 | 87,173 |
Fidelity Multimedia Portfolio | 2,249,300 | 463,641 | 825,453 | 6,329 | 2,827,249 |
Fidelity Natural Gas Portfolio | 4,545 | 97 | - | 49 | 5,666 |
Fidelity Natural Resources Portfolio | 102,164 | 849 | 80,000 | 83 | 33,076 |
Fidelity New Markets Income Fund | 7,243,299 | 551,192 | 6,033,270 | 170,561 | 1,130,813 |
Fidelity New Millennium Fund | - | 1,574,337 | - | 7,754 | 1,678,855 |
Fidelity Nordic Fund | 1,140,763 | 91,519 | 29,722 | 28,892 | 1,657,534 |
Fidelity OTC Portfolio | - | 3,840,940 | 668,803 | 2,318 | 3,598,123 |
Fidelity Overseas Fund | 14,449 | 308 | - | 229 | 18,319 |
Fidelity Pacific Basin Fund | 1,031,902 | 170,087 | - | 7,488 | 1,314,981 |
Fidelity Pharmaceuticals Portfolio | 2,789,811 | 125,257 | 3,462,934 | 8,749 | 133,265 |
Fidelity Real Estate Income Fund | 1,776,838 | 527,406 | 1,750,000 | 59,547 | 565,052 |
Fidelity Real Estate Investment Portfolio | 1,834,819 | 540,388 | 2,030,068 | 15,288 | 451,969 |
Fidelity Retailing Portfolio | 1,755,298 | 17,824 | 1,400,000 | 1,590 | 763,312 |
Affiliate | Value,
beginning of period | Purchases | Sales
Proceeds | Dividend
Income | Value,
end of
period |
Fidelity Select Money Market Portfolio | $ 32,966,488 | $ 4,321 | $ - | $ 4,320 | $ 32,970,809 |
Fidelity Series Commodity Strategy Fund | - | 9,075 | - | - | 8,628 |
Fidelity Small Cap Discovery Fund | - | 1,563,129 | - | 1,548 | 1,745,982 |
Fidelity Small Cap Growth Fund | 137,163 | 29,540 | - | - | 198,238 |
Fidelity Small Cap Stock Fund | 57,982 | 4,325 | 57,000 | 82 | 11,961 |
Fidelity Small Cap Value Fund | 231,470 | 1,569,348 | - | 5,239 | 1,844,650 |
Fidelity Software & Computer Services Portfolio | 7,655,739 | 3,119,064 | 2,351,739 | - | 12,089,760 |
Fidelity Technology Portfolio | 1,231,264 | 1,681,621 | 3,132,088 | - | - |
Fidelity Telecom and Utilities Fund | 3,147,009 | 19,513 | 3,495,117 | 19,513 | 122,424 |
Fidelity Telecommunications Portfolio | 1,230,795 | 145,523 | 329,136 | 26,527 | 1,251,781 |
Fidelity Transportation Portfolio | 522,151 | 340,458 | - | 3,724 | 1,127,230 |
Fidelity Utilities Portfolio | 223,500 | 5,674 | 34,866 | 3,583 | 229,274 |
Fidelity Value Fund | - | 146,586 | - | 1,312 | 158,870 |
Spartan Extended Market Index Fund Investor Class | 11,334 | 457 | - | 155 | 15,662 |
Spartan International Index Fund Investor Class | 6,524,768 | 1,010,853 | 82,879 | 199,805 | 8,726,882 |
Spartan Total Market Index Fund Investor Class | 142,169 | 2,776 | - | 2,776 | 189,613 |
Spartan U.S. Bond Index Fund Investor Class | 322,704,210 | 57,230,588 | 44,479,874 | 7,086,548 | 320,240,419 |
VIP Energy Portfolio Investor Class | 2,737,608 | 36,276 | 750,000 | 21,108 | 2,572,440 |
VIP Mid Cap Portfolio Investor Class | 2,642 | 428 | - | 14 | 3,595 |
Total | $ 652,415,555 | $ 194,049,753 | $ 171,279,415 | $ 9,845,777 | $ 695,929,441 |
Other Information |
All investments are categorized as Level 1 under the Fair Value Hierarchy. The inputs or methodology used for valuing securities may not be an indication of the risk associated with investing in those securities. For more information on valuation inputs, please refer to the Investment Valuation section in the accompanying Notes to Financial Statements. |
See accompanying notes which are an integral part of the financial statements.
Annual Report
VIP FundsManager 20% Portfolio
Statement of Assets and Liabilities
| December 31, 2013 |
| | |
Assets | | |
Investment in securities, at value (cost $651,715,530) - See accompanying schedule | | $ 695,929,441 |
Receivable for fund shares sold | | 111,778 |
Total assets | | 696,041,219 |
| | |
Liabilities | | |
Payable for investments purchased | $ 111,241 | |
Payable for fund shares redeemed | 537 | |
Accrued management fee | 115,117 | |
Distribution and service plan fees payable | 148 | |
Total liabilities | | 227,043 |
| | |
Net Assets | | $ 695,814,176 |
Net Assets consist of: | | |
Paid in capital | | $ 646,455,709 |
Undistributed net investment income | | 14,691 |
Accumulated undistributed net realized gain (loss) on investments | | 5,129,865 |
Net unrealized appreciation (depreciation) on investments | | 44,213,911 |
Net Assets | | $ 695,814,176 |
Statement of Assets and Liabilities - continued
| December 31, 2013 |
| | |
Service Class:
Net Asset Value, offering price and redemption price per share ($71,797 ÷ 6,335 shares) | | $ 11.33 |
| | |
Service Class 2:
Net Asset Value, offering price and redemption price per share ($1,196,761 ÷ 105,738 shares) | | $ 11.32 |
| | |
Investor Class:
Net Asset Value, offering price and redemption price per share ($694,545,618 ÷ 61,311,897 shares) | | $ 11.33 |
See accompanying notes which are an integral part of the financial statements.
Annual Report
Statement of Operations
| Year ended December 31, 2013 |
| | |
Investment Income | | |
Income distributions from underlying funds | | $ 9,845,777 |
| | |
Expenses | | |
Management fee | $ 1,714,041 | |
Distribution and service plan fees | 3,368 | |
Independent trustees' compensation | 2,587 | |
Total expenses before reductions | 1,719,996 | |
Expense reductions | (344,789) | 1,375,207 |
Net investment income (loss) | | 8,470,570 |
Realized and Unrealized Gain (Loss) Realized gain (loss) on sale of underlying fund shares | 11,160,501 | |
Capital gain distributions from underlying funds | 7,438,036 | |
Total net realized gain (loss) | | 18,598,537 |
Change in net unrealized appreciation (depreciation) on underlying funds | | 9,581,168 |
Net gain (loss) | | 28,179,705 |
Net increase (decrease) in net assets resulting from operations | | $ 36,650,275 |
Statement of Changes in Net Assets
| Year ended
December 31,
2013 | Year ended
December 31,
2012 |
Increase (Decrease) in Net Assets | | |
Operations | | |
Net investment income (loss) | $ 8,470,570 | $ 8,962,223 |
Net realized gain (loss) | 18,598,537 | 8,190,372 |
Change in net unrealized appreciation (depreciation) | 9,581,168 | 14,648,998 |
Net increase (decrease) in net assets resulting
from operations | 36,650,275 | 31,801,593 |
Distributions to shareholders from net investment income | (8,453,986) | (8,950,931) |
Distributions to shareholders from net realized gain | (14,302,675) | (1,790,569) |
Total distributions | (22,756,661) | (10,741,500) |
Share transactions - net increase (decrease) | 29,613,069 | 96,242,937 |
Total increase (decrease) in net assets | 43,506,683 | 117,303,030 |
| | |
Net Assets | | |
Beginning of period | 652,307,493 | 535,004,463 |
End of period (including undistributed net investment income of $14,691 and undistributed net investment income of $0, respectively) | $ 695,814,176 | $ 652,307,493 |
See accompanying notes which are an integral part of the financial statements.
Annual Report
Financial Highlights - Service Class
Years ended December 31, | 2013 | 2012 | 2011 | 2010 | 2009 |
Selected Per-Share Data | | | | | |
Net asset value, beginning of period | $ 11.10 | $ 10.68 | $ 10.63 | $ 10.07 | $ 9.27 |
Income from Investment Operations | | | | | |
Net investment income (loss) C | .14 | .17 | .20 | .19 | .21 |
Net realized and unrealized gain (loss) | .47 | .44 | .05 | .55 | .76 |
Total from investment operations | .61 | .61 | .25 | .74 | .97 |
Distributions from net investment income | (.14) | (.16) | (.18) | (.17) | (.16) |
Distributions from net realized gain | (.24) | (.03) | (.02) | (.01) | (.01) |
Total distributions | (.38) | (.19) | (.20) | (.18) | (.17) F |
Net asset value, end of period | $ 11.33 | $ 11.10 | $ 10.68 | $ 10.63 | $ 10.07 |
Total Return A, B | 5.53% | 5.68% | 2.30% | 7.36% | 10.43% |
Ratios to Average Net Assets D, E | | | | | |
Expenses before reductions | .35% | .35% | .35% | .35% | .35% |
Expenses net of fee waivers, if any | .20% | .20% | .20% | .20% | .20% |
Expenses net of all reductions | .20% | .20% | .20% | .20% | .20% |
Net investment income (loss) | 1.23% | 1.51% | 1.84% | 1.84% | 2.19% |
Supplemental Data | | | | | |
Net assets, end of period (000 omitted) | $ 72 | $ 71 | $ 64 | $ 67 | $ 61 |
Portfolio turnover rate D | 25% | 17% | 12% | 14% | 31% |
A Total returns do not reflect charges attributable to your insurance company's separate account. Inclusion of these charges would reduce the total returns shown.
B Total returns would have been lower if certain expenses had not been reduced during the applicable periods shown.
C Calculated based on average shares outstanding during the period.
D Amounts do not include the activity of the Underlying Funds.
E Expense ratios reflect operating expenses of the class. Expenses before reductions do not reflect amounts reimbursed by the investment adviser or reductions from expense offset arrangements and do not represent the amount paid by the class during periods when reimbursements or reductions occur. Expenses net of fee waivers reflect expenses after reimbursement by the investment adviser but prior to reductions from expense offset arrangements. Expenses net of all reductions represent the net expenses paid by the class but do not include expenses of the investment companies in which the Fund invests.
F Total distributions of $.17 per share is comprised of distributions from net investment income of $.161 and distributions from net realized gain of $.006 per share.
Financial Highlights - Service Class 2
Years ended December 31, | 2013 | 2012 | 2011 | 2010 | 2009 |
Selected Per-Share Data | | | | | |
Net asset value, beginning of period | $ 11.08 | $ 10.67 | $ 10.62 | $ 10.06 | $ 9.28 |
Income from Investment Operations | | | | | |
Net investment income (loss) C | .12 | .15 | .18 | .18 | .20 |
Net realized and unrealized gain (loss) | .48 | .43 | .05 | .55 | .74 |
Total from investment operations | .60 | .58 | .23 | .73 | .94 |
Distributions from net investment income | (.12) | (.14) | (.16) | (.16) | (.16) |
Distributions from net realized gain | (.24) | (.03) | (.02) | (.01) | (.01) |
Total distributions | (.36) | (.17) | (.18) | (.17) | (.16) F |
Net asset value, end of period | $ 11.32 | $ 11.08 | $ 10.67 | $ 10.62 | $ 10.06 |
Total Return A, B | 5.46% | 5.43% | 2.20% | 7.24% | 10.14% |
Ratios to Average Net Assets D, E | | | | | |
Expenses before reductions | .50% | .50% | .50% | .50% | .50% |
Expenses net of fee waivers, if any | .35% | .35% | .35% | .35% | .35% |
Expenses net of all reductions | .35% | .35% | .35% | .35% | .35% |
Net investment income (loss) | 1.08% | 1.36% | 1.69% | 1.69% | 2.04% |
Supplemental Data | | | | | |
Net assets, end of period (000 omitted) | $ 1,197 | $ 1,274 | $ 1,373 | $ 569 | $ 425 |
Portfolio turnover rate D | 25% | 17% | 12% | 14% | 31% |
A Total returns do not reflect charges attributable to your insurance company's separate account. Inclusion of these charges would reduce the total returns shown.
B Total returns would have been lower if certain expenses had not been reduced during the applicable periods shown.
C Calculated based on average shares outstanding during the period.
D Amounts do not include the activity of the Underlying Funds.
E Expense ratios reflect operating expenses of the class. Expenses before reductions do not reflect amounts reimbursed by the investment adviser or reductions from expense offset arrangements and do not represent the amount paid by the class during periods when reimbursements or reductions occur. Expenses net of fee waivers reflect expenses after reimbursement by the investment adviser but prior to reductions from expense offset arrangements. Expenses net of all reductions represent the net expenses paid by the class but do not include expenses of the investment companies in which the Fund invests.
F Total distributions of $.16 per share is comprised of distributions from net investment income of $.155 and distributions from net realized gain of $.006 per share.
See accompanying notes which are an integral part of the financial statements.
Annual Report
Financial Highlights - Investor Class
Years ended December 31, | 2013 | 2012 | 2011 | 2010 | 2009 |
Selected Per-Share Data | | | | | |
Net asset value, beginning of period | $ 11.09 | $ 10.68 | $ 10.63 | $ 10.06 | $ 9.27 |
Income from Investment Operations | | | | | |
Net investment income (loss) C | .14 | .17 | .20 | .19 | .21 |
Net realized and unrealized gain (loss) | .48 | .43 | .05 | .56 | .75 |
Total from investment operations | .62 | .60 | .25 | .75 | .96 |
Distributions from net investment income | (.14) | (.16) | (.18) | (.17) | (.16) |
Distributions from net realized gain | (.24) | (.03) | (.02) | (.01) | (.01) |
Total distributions | (.38) | (.19) | (.20) | (.18) | (.17) F |
Net asset value, end of period | $ 11.33 | $ 11.09 | $ 10.68 | $ 10.63 | $ 10.06 |
Total Return A, B | 5.62% | 5.58% | 2.31% | 7.47% | 10.32% |
Ratios to Average Net Assets D, E | | | | | |
Expenses before reductions | .25% | .25% | .25% | .25% | .25% |
Expenses net of fee waivers, if any | .20% | .20% | .20% | .20% | .20% |
Expenses net of all reductions | .20% | .20% | .20% | .20% | .20% |
Net investment income (loss) | 1.23% | 1.51% | 1.84% | 1.84% | 2.19% |
Supplemental Data | | | | | |
Net assets, end of period (000 omitted) | $ 694,546 | $ 650,963 | $ 533,568 | $ 391,226 | $ 270,852 |
Portfolio turnover rate D | 25% | 17% | 12% | 14% | 31% |
A Total returns do not reflect charges attributable to your insurance company's separate account. Inclusion of these charges would reduce the total returns shown.
B Total returns would have been lower if certain expenses had not been reduced during the applicable periods shown.
C Calculated based on average shares outstanding during the period.
D Amounts do not include the activity of the Underlying Funds.
E Expense ratios reflect operating expenses of the class. Expenses before reductions do not reflect amounts reimbursed by the investment adviser or reductions from expense offset arrangements and do not represent the amount paid by the class during periods when reimbursements or reductions occur. Expenses net of fee waivers reflect expenses after reimbursement by the investment adviser but prior to reductions from expense offset arrangements. Expenses net of all reductions represent the net expenses paid by the class but do not include expenses of the investment companies in which the Fund invests.
F Total distributions of $.17 per share is comprised of distributions from net investment income of $.161 and distributions from net realized gain of $.006 per share.
See accompanying notes which are an integral part of the financial statements.
Annual Report
VIP FundsManager 50% Portfolio
Investment Changes (Unaudited)
The information in the following tables is based on the direct investments of the Fund. |
Fund Holdings as of December 31, 2013 |
| % of fund's
net assets | % of fund's net assets
6 months ago |
Domestic Equity Funds | | |
Fidelity Air Transportation Portfolio | 0.3 | 0.3 |
Fidelity Automotive Portfolio | 0.6 | 0.2 |
Fidelity Banking Portfolio | 1.3 | 1.2 |
Fidelity Biotechnology Portfolio | 0.7 | 1.1 |
Fidelity Blue Chip Growth Fund | 0.9 | 0.2 |
Fidelity Brokerage & Investment Management Portfolio | 1.9 | 1.9 |
Fidelity Capital Appreciation Fund | 0.1 | 0.6 |
Fidelity Chemicals Portfolio | 0.7 | 0.6 |
Fidelity Communications Equipment Portfolio | 0.4 | 0.4 |
Fidelity Computers Portfolio | 0.8 | 0.9 |
Fidelity Construction & Housing Portfolio | 0.7 | 1.3 |
Fidelity Consumer Discretionary Portfolio | 1.5 | 1.4 |
Fidelity Consumer Finance Portfolio | 0.2 | 0.3 |
Fidelity Consumer Staples Portfolio | 2.4 | 2.9 |
Fidelity Contrafund | 0.2 | 0.0* |
Fidelity Defense & Aerospace Portfolio | 0.0* | 0.1 |
Fidelity Disciplined Equity Fund | 0.4 | 0.0* |
Fidelity Dividend Growth Fund | 0.0* | 0.0* |
Fidelity Electronics Portfolio | 0.3 | 0.3 |
Fidelity Energy Portfolio | 1.4 | 1.9 |
Fidelity Energy Service Portfolio | 0.9 | 1.5 |
Fidelity Environmental & Alternative Energy Portfolio | 0.0* | 0.0* |
Fidelity Equity Dividend Income Fund | 0.0* | 0.0* |
Fidelity Equity-Income Fund | 0.8 | 0.3 |
Fidelity Financial Services Portfolio | 1.6 | 1.7 |
Fidelity Fund | 0.0* | 0.0* |
Fidelity Global Commodity Stock Fund | 0.0* | 0.0* |
Fidelity Gold Portfolio | 0.0* | 0.1 |
Fidelity Growth & Income Portfolio | 0.7 | 0.5 |
Fidelity Growth Company Fund | 0.1 | 0.2 |
Fidelity Growth Discovery Fund | 0.2 | 0.0 |
Fidelity Health Care Portfolio | 2.4 | 1.9 |
Fidelity Independence Fund | 0.1 | 0.1 |
Fidelity Industrial Equipment Portfolio | 1.1 | 1.2 |
Fidelity Industrials Portfolio | 2.3 | 1.7 |
Fidelity Insurance Portfolio | 1.0 | 1.1 |
|
| % of fund's
net assets | % of fund's net assets
6 months ago |
Fidelity IT Services Portfolio | 0.5 | 0.5 |
Fidelity Large Cap Stock Fund | 1.6 | 1.0 |
Fidelity Large Cap Value Fund | 0.0* | 0.0* |
Fidelity Leisure Portfolio | 0.1 | 0.1 |
Fidelity Leveraged Company Stock Fund | 0.0* | 0.0* |
Fidelity Low-Priced Stock Fund | 0.1 | 0.0 |
Fidelity Magellan Fund | 0.0* | 0.0* |
Fidelity Materials Portfolio | 0.2 | 0.0* |
Fidelity Medical Delivery Portfolio | 0.2 | 0.3 |
Fidelity Medical Equipment & Systems Portfolio | 0.0* | 0.0* |
Fidelity Mega Cap Stock Fund | 1.6 | 1.2 |
Fidelity Mid Cap Value Fund | 0.0* | 0.0* |
Fidelity Mid-Cap Stock Fund | 0.0* | 0.0* |
Fidelity Multimedia Portfolio | 0.9 | 1.2 |
Fidelity Nasdaq Composite Index Fund | 0.0* | 0.0* |
Fidelity Natural Gas Portfolio | 0.0* | 0.0* |
Fidelity Natural Resources Portfolio | 0.0* | 0.0* |
Fidelity New Millennium Fund | 0.7 | 0.4 |
Fidelity OTC Portfolio | 0.7 | 0.8 |
Fidelity Pharmaceuticals Portfolio | 0.7 | 0.9 |
Fidelity Real Estate Investment Portfolio | 0.0* | 0.2 |
Fidelity Retailing Portfolio | 0.3 | 0.4 |
Fidelity Series Commodity Strategy Fund | 0.0* | 0.0* |
Fidelity Small Cap Discovery Fund | 0.8 | 0.5 |
Fidelity Small Cap Growth Fund | 0.0* | 0.0* |
Fidelity Small Cap Stock Fund | 0.0* | 0.0* |
Fidelity Small Cap Value Fund | 0.0* | 0.0* |
Fidelity Software & Computer Services Portfolio | 2.3 | 2.2 |
Fidelity Technology Portfolio | 1.2 | 1.6 |
Fidelity Telecom and Utilities Fund | 0.0* | 0.0* |
Fidelity Telecommunications Portfolio | 0.4 | 0.7 |
Fidelity Transportation Portfolio | 0.5 | 0.3 |
Fidelity Utilities Portfolio | 0.2 | 0.4 |
Fidelity Value Fund | 0.5 | 0.1 |
Fidelity Value Strategies Fund | 0.0* | 0.0* |
Spartan 500 Index Fund Investor Class | 0.0* | 0.0* |
Spartan Extended Market Index Fund Investor Class | 0.3 | 0.4 |
Spartan Total Market Index Fund Investor Class | 0.3 | 0.5 |
VIP Mid Cap Portfolio Investor Class | 0.0* | 0.0* |
| 40.1 | 39.6 |
Fund Holdings as of December 31, 2013 - continued |
| % of fund's
net assets | % of fund's net assets
6 months ago |
International Equity Funds | | |
Fidelity Canada Fund | 0.0* | 0.0* |
Fidelity China Region Fund | 0.0* | 0.0* |
Fidelity Diversified International Fund | 2.5 | 0.2 |
Fidelity Emerging Asia Fund | 0.5 | 0.8 |
Fidelity Emerging Markets Fund | 0.9 | 0.5 |
Fidelity Europe Capital Appreciation Fund | 0.1 | 0.0 |
Fidelity Europe Fund | 2.1 | 1.2 |
Fidelity International Capital Appreciation Fund | 0.4 | 0.5 |
Fidelity International Discovery Fund | 4.5 | 4.1 |
Fidelity International Growth Fund | 0.2 | 0.2 |
Fidelity International Real Estate Fund | 0.0* | 0.0* |
Fidelity International Small Cap Fund | 0.8 | 0.4 |
Fidelity International Small Cap Opportunities Fund | 0.5 | 0.3 |
Fidelity International Value Fund | 0.3 | 0.4 |
Fidelity Japan Fund | 0.1 | 0.1 |
Fidelity Japan Smaller Companies Fund | 0.9 | 0.9 |
Fidelity Latin America Fund | 0.0* | 0.0* |
Fidelity Nordic Fund | 0.2 | 0.1 |
Fidelity Overseas Fund | 0.1 | 0.1 |
Fidelity Pacific Basin Fund | 0.3 | 0.3 |
Spartan International Index Fund Investor Class | 2.6 | 2.8 |
| 17.0 | 12.9 |
Fixed-Income Funds | | |
Fidelity Floating Rate High Income Fund | 1.7 | 2.0 |
Fidelity Focused High Income Fund | 0.2 | 0.3 |
Fidelity High Income Fund | 1.0 | 0.7 |
Fidelity New Markets Income Fund | 0.2 | 0.4 |
Fidelity Real Estate Income Fund | 0.0* | 0.0* |
Spartan U.S. Bond Index Fund Investor Class | 33.8 | 34.6 |
| 36.9 | 38.0 |
Money Market Funds | | |
Fidelity Institutional Prime Money Market Portfolio Class I | 5.7 | 9.1 |
Fidelity Select Money Market Portfolio | 0.3 | 0.4 |
| 6.0 | 9.5 |
Net Other Assets (Liabilities)* | 0.0 | 0.0 |
| 100.0 | 100.0 |
* Amount represents less than 0.1%
Asset Allocation (% of fund's net assets) |
As of December 31, 2013 |
| Domestic Equity Funds | 40.1% | |
| International Equity Funds | 17.0% | |
| Fixed-Income Funds | 36.9% | |
| Money Market Funds | 6.0% | |

As of June 30, 2013 |
| Domestic Equity Funds | 39.6% | |
| International Equity Funds | 12.9% | |
| Fixed-Income Funds | 38.0% | |
| Money Market Funds | 9.5% | |

Annual Report
VIP FundsManager 50% Portfolio
Investments December 31, 2013
Showing Percentage of Net Assets
Equity Funds - 57.1% |
| Shares | | Value |
Domestic Equity Funds - 40.1% |
Fidelity Air Transportation Portfolio (c) | 183,314 | | $ 10,870,505 |
Fidelity Automotive Portfolio (c) | 380,852 | | 21,453,398 |
Fidelity Banking Portfolio (c) | 1,668,222 | | 43,657,362 |
Fidelity Biotechnology Portfolio (c) | 126,212 | | 22,936,543 |
Fidelity Blue Chip Growth Fund (c) | 492,434 | | 31,205,529 |
Fidelity Brokerage & Investment Management Portfolio (c) | 858,757 | | 63,762,714 |
Fidelity Capital Appreciation Fund (c) | 60,914 | | 2,203,863 |
Fidelity Chemicals Portfolio (c) | 157,566 | | 22,984,107 |
Fidelity Communications Equipment Portfolio (c) | 403,562 | | 11,905,092 |
Fidelity Computers Portfolio (c) | 385,597 | | 28,580,421 |
Fidelity Construction & Housing Portfolio (c) | 410,410 | | 22,375,540 |
Fidelity Consumer Discretionary Portfolio (c) | 1,502,453 | | 49,761,238 |
Fidelity Consumer Finance Portfolio (c) | 451,377 | | 7,384,535 |
Fidelity Consumer Staples Portfolio (c) | 911,897 | | 82,262,236 |
Fidelity Contrafund (c) | 71,554 | | 6,879,234 |
Fidelity Defense & Aerospace Portfolio (c) | 13,291 | | 1,626,260 |
Fidelity Disciplined Equity Fund (c) | 400,493 | | 12,943,925 |
Fidelity Dividend Growth Fund (c) | 4,379 | | 154,957 |
Fidelity Electronics Portfolio (c) | 134,523 | | 8,492,416 |
Fidelity Energy Portfolio (c) | 854,881 | | 47,967,394 |
Fidelity Energy Service Portfolio (c) | 376,747 | | 31,966,985 |
Fidelity Environmental & Alternative Energy Portfolio (c) | 16,955 | | 387,084 |
Fidelity Equity Dividend Income Fund (c) | 545 | | 13,416 |
Fidelity Equity-Income Fund (c) | 449,421 | | 26,381,003 |
Fidelity Financial Services Portfolio (c) | 656,836 | | 53,716,017 |
Fidelity Fund (c) | 753 | | 32,123 |
Fidelity Global Commodity Stock Fund (c) | 4,619 | | 65,261 |
Fidelity Gold Portfolio (a)(c) | 5,877 | | 105,612 |
Fidelity Growth & Income Portfolio (c) | 807,902 | | 22,508,160 |
Fidelity Growth Company Fund (c) | 37,410 | | 4,484,663 |
Fidelity Growth Discovery Fund (c) | 354,926 | | 7,535,082 |
Fidelity Health Care Portfolio (c) | 424,788 | | 80,076,772 |
Fidelity Independence Fund (c) | 59,806 | | 2,166,780 |
Fidelity Industrial Equipment Portfolio (c) | 795,611 | | 36,454,898 |
Fidelity Industrials Portfolio (c) | 2,350,410 | | 79,138,311 |
Fidelity Insurance Portfolio (c) | 499,796 | | 34,275,979 |
Fidelity IT Services Portfolio (c) | 475,100 | | 17,782,991 |
Fidelity Large Cap Stock Fund (c) | 1,977,616 | | 53,850,480 |
Fidelity Large Cap Value Fund (c) | 33,099 | | 504,762 |
Fidelity Leisure Portfolio (c) | 26,115 | | 3,477,945 |
Fidelity Leveraged Company Stock Fund (c) | 774 | | 33,485 |
Fidelity Low-Priced Stock Fund (c) | 65,340 | | 3,231,719 |
Fidelity Magellan Fund (c) | 122 | | 11,241 |
Fidelity Materials Portfolio (c) | 70,195 | | 5,958,829 |
Fidelity Medical Delivery Portfolio (c) | 102,174 | | 7,453,627 |
|
| Shares | | Value |
Fidelity Medical Equipment & Systems Portfolio (c) | 15,313 | | $ 547,281 |
Fidelity Mega Cap Stock Fund (c) | 3,519,384 | | 54,268,895 |
Fidelity Mid Cap Value Fund (c) | 20,972 | | 473,960 |
Fidelity Mid-Cap Stock Fund (c) | 23,480 | | 927,714 |
Fidelity Multimedia Portfolio (c) | 379,486 | | 30,727,011 |
Fidelity Nasdaq Composite Index Fund (c) | 10,551 | | 581,474 |
Fidelity Natural Gas Portfolio (c) | 5,944 | | 224,625 |
Fidelity Natural Resources Portfolio (c) | 3,561 | | 131,404 |
Fidelity New Millennium Fund (c) | 626,053 | | 24,710,327 |
Fidelity OTC Portfolio (c) | 320,603 | | 24,811,439 |
Fidelity Pharmaceuticals Portfolio (c) | 1,328,231 | | 25,515,323 |
Fidelity Real Estate Investment Portfolio (c) | 5,010 | | 159,956 |
Fidelity Retailing Portfolio (c) | 129,600 | | 11,338,726 |
Fidelity Series Commodity Strategy Fund (a)(c) | 1,089 | | 8,628 |
Fidelity Small Cap Discovery Fund (c) | 894,609 | | 27,965,478 |
Fidelity Small Cap Growth Fund (c) | 4,989 | | 96,130 |
Fidelity Small Cap Stock Fund (c) | 8,849 | | 185,291 |
Fidelity Small Cap Value Fund (c) | 9,762 | | 195,636 |
Fidelity Software & Computer Services Portfolio (c) | 660,483 | | 78,372,926 |
Fidelity Technology Portfolio (c) | 345,034 | | 42,452,935 |
Fidelity Telecom and Utilities Fund (c) | 9,838 | | 216,526 |
Fidelity Telecommunications Portfolio (c) | 222,354 | | 13,450,208 |
Fidelity Transportation Portfolio (c) | 225,951 | | 16,686,513 |
Fidelity Utilities Portfolio (c) | 95,884 | | 6,386,832 |
Fidelity Value Fund (c) | 175,788 | | 18,208,133 |
Fidelity Value Strategies Fund (c) | 293 | | 11,986 |
Spartan 500 Index Fund Investor Class (c) | 2,960 | | 193,825 |
Spartan Extended Market Index Fund Investor Class (c) | 159,286 | | 8,509,059 |
Spartan Total Market Index Fund Investor Class (c) | 162,414 | | 8,789,820 |
VIP Mid Cap Portfolio Investor Class (c) | 9,892 | | 358,602 |
TOTAL DOMESTIC EQUITY FUNDS | | 1,367,527,157 |
International Equity Funds - 17.0% |
Fidelity Canada Fund (c) | 2,644 | | 154,154 |
Fidelity China Region Fund (c) | 44,327 | | 1,496,463 |
Fidelity Diversified International Fund (c) | 2,304,189 | | 85,047,614 |
Fidelity Emerging Asia Fund (c) | 590,729 | | 18,099,927 |
Fidelity Emerging Markets Fund (c) | 1,270,569 | | 30,608,006 |
Fidelity Europe Capital Appreciation Fund (c) | 75,554 | | 1,779,295 |
Fidelity Europe Fund (c) | 1,843,270 | | 71,684,771 |
Fidelity International Capital Appreciation Fund (c) | 809,450 | | 13,558,285 |
Fidelity International Discovery Fund (c) | 3,830,243 | | 155,124,844 |
Fidelity International Growth Fund (c) | 487,707 | | 5,481,822 |
Fidelity International Real Estate Fund (c) | 14,690 | | 149,401 |
Fidelity International Small Cap Fund (c) | 1,074,013 | | 28,772,812 |
Equity Funds - continued |
| Shares | | Value |
International Equity Funds - continued |
Fidelity International Small Cap Opportunities Fund (c) | 1,203,104 | | $ 16,795,337 |
Fidelity International Value Fund (c) | 1,175,369 | | 10,637,089 |
Fidelity Japan Fund (c) | 181,051 | | 2,179,850 |
Fidelity Japan Smaller Companies Fund (c) | 2,324,643 | | 31,243,206 |
Fidelity Latin America Fund (c) | 645 | | 20,172 |
Fidelity Nordic Fund (c) | 166,951 | | 7,476,087 |
Fidelity Overseas Fund (c) | 52,544 | | 2,115,407 |
Fidelity Pacific Basin Fund (c) | 340,365 | | 9,414,498 |
Spartan International Index Fund Investor Class (c) | 2,151,845 | | 87,515,519 |
TOTAL INTERNATIONAL EQUITY FUNDS | | 579,354,559 |
TOTAL EQUITY FUNDS (Cost $1,598,181,909) |
1,946,881,716
|
Fixed-Income Funds - 36.9% |
| | | |
Fidelity Floating Rate High Income Fund (c) | 5,630,837 | | 56,083,137 |
Fidelity Focused High Income Fund (c) | 805,673 | | 7,251,058 |
Fidelity High Income Fund (c) | 3,709,046 | | 34,753,759 |
Fidelity New Markets Income Fund (c) | 468,373 | | 7,301,936 |
|
| Shares | | Value |
Fidelity Real Estate Income Fund (c) | 9,692 | | $ 107,384 |
Spartan U.S. Bond Index Fund Investor Class (c) | 101,530,486 | | 1,153,386,318 |
TOTAL FIXED-INCOME FUNDS (Cost $1,273,232,256) |
1,258,883,592
|
Money Market Funds - 6.0% |
| | | |
Fidelity Institutional Prime Money Market Portfolio Class I 0.01% (b)(c) | 193,114,698 | | 193,114,698 |
Fidelity Select Money Market Portfolio 0.01% (b)(c) | 10,214,841 | | 10,214,841 |
TOTAL MONEY MARKET FUNDS (Cost $203,329,539) |
203,329,539
|
TOTAL INVESTMENT PORTFOLIO - 100.0% (Cost $3,074,743,704) | | 3,409,094,847 |
NET OTHER ASSETS (LIABILITIES) - 0.0% | | (559,706) |
NET ASSETS - 100% | $ 3,408,535,141 |
Legend |
(a) Non-income producing |
(b) The rate quoted is the annualized seven-day yield of the fund at period end. |
(c) Affiliated company |
Affiliated Underlying Funds |
Information regarding the Fund's fiscal year to date purchases and sales of the affiliated Underlying Funds and income earned by the Fund from investments in affiliated Underlying Funds is as follows: |
Affiliate | Value,
beginning of period | Purchases | Sales
Proceeds | Dividend
Income | Value,
end of
period |
Fidelity Air Transportation Portfolio | $ 1,234,173 | $ 7,434,735 | $ - | $ 9,341 | $ 10,870,505 |
Fidelity Automotive Portfolio | 1,978,745 | 17,837,771 | 712,762 | 55,486 | 21,453,398 |
Fidelity Banking Portfolio | 20,914,954 | 16,594,358 | 1,950,019 | 297,421 | 43,657,362 |
Fidelity Biotechnology Portfolio | 9,327,057 | 13,566,308 | 10,209,641 | - | 22,936,543 |
Fidelity Blue Chip Growth Fund | 187,959 | 29,732,006 | - | 56,470 | 31,205,529 |
Fidelity Brokerage & Investment Management Portfolio | 10,373,195 | 39,335,404 | 13,676 | 326,800 | 63,762,714 |
Fidelity Canada Fund | 140,084 | 1,463 | - | 625 | 154,154 |
Fidelity Capital Appreciation Fund | 11,839,589 | 200,889 | 12,300,000 | 7,945 | 2,203,863 |
Fidelity Chemicals Portfolio | 5,007,055 | 19,927,198 | 4,729,231 | 162,270 | 22,984,107 |
Fidelity China Region Fund | 7,515,285 | 8,229,196 | 14,400,000 | 15,146 | 1,496,463 |
Fidelity Commodity Strategy Fund | 9,582 | - | 9,059 | - | - |
Fidelity Communications Equipment Portfolio | 201,370 | 11,494,959 | 1,840,000 | 93,158 | 11,905,092 |
Fidelity Computers Portfolio | 17,726,566 | 6,709,011 | 380,517 | 198,302 | 28,580,421 |
Fidelity Construction & Housing Portfolio | 18,315,136 | 12,007,892 | 10,525,313 | 115,518 | 22,375,540 |
Fidelity Consumer Discretionary Portfolio | 16,173,030 | 28,349,833 | 2,340,151 | 43,874 | 49,761,238 |
Fidelity Consumer Finance Portfolio | 5,639,757 | 1,093,286 | 89,113 | 162,376 | 7,384,535 |
Fidelity Consumer Staples Portfolio | 41,063,902 | 36,436,679 | 395,689 | 1,381,794 | 82,262,236 |
Fidelity Contrafund | 980,514 | 13,043,321 | 7,335,000 | 6,610 | 6,879,234 |
Fidelity Defense & Aerospace Portfolio | 1,097,765 | 79,889 | - | 8,130 | 1,626,260 |
Fidelity Disciplined Equity Fund | 318,429 | 12,324,916 | - | 221,297 | 12,943,925 |
Fidelity Diversified International Fund | 14,111,784 | 76,865,912 | 13,446,376 | 613,236 | 85,047,614 |
Affiliate | Value,
beginning of period | Purchases | Sales
Proceeds | Dividend
Income | Value,
end of
period |
Fidelity Dividend Growth Fund | $ 1,011,343 | $ 14,468 | $ 1,000,000 | $ 1,523 | $ 154,957 |
Fidelity Electronics Portfolio | 6,101,953 | 51,643 | - | 43,043 | 8,492,416 |
Fidelity Emerging Asia Fund | 27,381,168 | 9,557,809 | 18,188,478 | 215,200 | 18,099,927 |
Fidelity Emerging Markets Fund | 3,321,076 | 31,938,904 | 4,500,000 | 23,985 | 30,608,006 |
Fidelity Energy Portfolio | 31,455,529 | 30,332,724 | 17,145,125 | 348,890 | 47,967,394 |
Fidelity Energy Service Portfolio | 15,701,457 | 28,268,525 | 18,657,699 | 76,665 | 31,966,985 |
Fidelity Environmental & Alternative Energy Portfolio | 439,463 | 3,182 | 170,000 | 3,182 | 387,084 |
Fidelity Equity Dividend Income Fund | 10,395 | 250 | - | 250 | 13,416 |
Fidelity Equity-Income Fund | 4,513,195 | 22,925,367 | 3,030,577 | 323,360 | 26,381,003 |
Fidelity Europe Capital Appreciation Fund | - | 1,642,211 | - | 27,211 | 1,779,295 |
Fidelity Europe Fund | - | 63,428,939 | - | 944,693 | 71,684,771 |
Fidelity Financial Services Portfolio | 25,011,062 | 18,032,253 | - | 470,851 | 53,716,017 |
Fidelity Floating Rate High Income Fund | 35,258,327 | 21,120,341 | 439,370 | 1,477,403 | 56,083,137 |
Fidelity Focused High Income Fund | 7,094,068 | 612,527 | 154,024 | 352,350 | 7,251,058 |
Fidelity Fund | 589,817 | 36,182 | 660,000 | 2,567 | 32,123 |
Fidelity Global Commodity Stock Fund | 67,413 | 915 | - | 856 | 65,261 |
Fidelity Gold Portfolio | 7,732,711 | - | 4,364,470 | - | 105,612 |
Fidelity Growth & Income Portfolio | - | 20,220,935 | 113,097 | 249,175 | 22,508,160 |
Fidelity Growth Company Fund | 6,788,403 | 297,096 | 4,000,000 | 7,236 | 4,484,663 |
Fidelity Growth Discovery Fund | - | 6,993,610 | - | - | 7,535,082 |
Fidelity Health Care Portfolio | 25,381,808 | 53,266,593 | 12,272,403 | 9,016 | 80,076,772 |
Fidelity High Income Fund | 19,654,829 | 19,215,142 | 4,089,888 | 1,193,894 | 34,753,759 |
Fidelity Independence Fund | 1,545,277 | 6,558 | - | 6,558 | 2,166,780 |
Fidelity Industrial Equipment Portfolio | 17,060,928 | 15,458,337 | 1,840,719 | 238,287 | 36,454,898 |
Fidelity Industrials Portfolio | 20,641,910 | 48,644,103 | 1,614,135 | 408,395 | 79,138,311 |
Fidelity Institutional Prime Money Market Portfolio Class I | 58,653,226 | 192,262,198 | 57,800,725 | 23,504 | 193,114,698 |
Fidelity Insurance Portfolio | 13,730,869 | 14,421,564 | 54,789 | 267,024 | 34,275,979 |
Fidelity International Capital Appreciation Fund | 8,733,811 | 4,781,995 | 2,182,034 | 95,620 | 13,558,285 |
Fidelity International Discovery Fund | 60,151,481 | 74,883,264 | 665,101 | 1,719,949 | 155,124,844 |
Fidelity International Growth Fund | 4,486,842 | 28,619 | - | 24,253 | 5,481,822 |
Fidelity International Real Estate Fund | 1,368,313 | 7,506 | 1,300,000 | 2,595 | 149,401 |
Fidelity International Small Cap Fund | 1,010,313 | 26,976,178 | 2,187,941 | 96,401 | 28,772,812 |
Fidelity International Small Cap Opportunities Fund | 5,774,587 | 8,908,467 | 66,855 | 108,316 | 16,795,337 |
Fidelity International Value Fund | 726,829 | 10,094,425 | 1,020,000 | 226,064 | 10,637,089 |
Fidelity IT Services Portfolio | 9,127,437 | 4,070,296 | - | - | 17,782,991 |
Fidelity Japan Fund | 1,762,854 | 20,444 | - | 18,830 | 2,179,850 |
Fidelity Japan Smaller Companies Fund | 1,376,579 | 29,675,045 | 3,212,586 | 42,667 | 31,243,206 |
Fidelity Large Cap Stock Fund | 2,347,385 | 45,772,839 | 107,033 | 322,534 | 53,850,480 |
Fidelity Large Cap Value Fund | 381,705 | 7,726 | - | 6,194 | 504,762 |
Fidelity Latin America Fund | 188,553 | 3,669 | 150,000 | 380 | 20,172 |
Fidelity Leisure Portfolio | 2,454,019 | 239,956 | - | 25,001 | 3,477,945 |
Fidelity Leveraged Company Stock Fund | 24,783 | 210 | - | 210 | 33,485 |
Fidelity Low-Priced Stock Fund | - | 3,165,223 | - | 12,151 | 3,231,719 |
Fidelity Magellan Fund | 211,257 | 1,795 | 245,000 | 235 | 11,241 |
Fidelity Materials Portfolio | 200,201 | 5,637,668 | 150,000 | 28,821 | 5,958,829 |
Fidelity Medical Delivery Portfolio | 5,602,132 | 424,481 | 97,654 | - | 7,453,627 |
Fidelity Medical Equipment & Systems Portfolio | 128,024 | 394,947 | - | - | 547,281 |
Fidelity Mega Cap Stock Fund | 20,065,778 | 32,706,291 | 6,008,163 | 533,404 | 54,268,895 |
Fidelity Mid Cap Value Fund | 341,068 | 39,108 | - | 4,753 | 473,960 |
Fidelity Mid-Cap Stock Fund | 169,523 | 622,597 | - | 1,904 | 927,714 |
Fidelity Multimedia Portfolio | 15,107,634 | 13,019,107 | 6,177,596 | 68,787 | 30,727,011 |
Fidelity Nasdaq Composite Index Fund | 416,093 | 9,225 | - | 4,130 | 581,474 |
Fidelity Natural Gas Portfolio | 1,181,589 | 4,401 | 1,100,000 | 2,492 | 224,625 |
Fidelity Natural Resources Portfolio | 111,847 | 3,371 | - | 329 | 131,404 |
Fidelity New Markets Income Fund | 17,116,448 | 2,878,981 | 10,823,949 | 556,127 | 7,301,936 |
Fidelity New Millennium Fund | - | 26,468,714 | 4,000,000 | 101,839 | 24,710,327 |
Fidelity Nordic Fund | 2,452,002 | 4,052,665 | 97,468 | 130,311 | 7,476,087 |
Affiliate | Value,
beginning of period | Purchases | Sales
Proceeds | Dividend
Income | Value,
end of
period |
Fidelity OTC Portfolio | $ - | $ 39,786,797 | $ 17,298,924 | $ 20,604 | $ 24,811,439 |
Fidelity Overseas Fund | 1,668,437 | 35,568 | - | 26,431 | 2,115,407 |
Fidelity Pacific Basin Fund | 7,387,817 | 1,217,726 | - | 53,612 | 9,414,498 |
Fidelity Pharmaceuticals Portfolio | 14,731,454 | 7,634,274 | 1,184,865 | 209,120 | 25,515,323 |
Fidelity Real Estate Income Fund | 7,390,414 | 1,507,571 | 9,068,356 | 117,011 | 107,384 |
Fidelity Real Estate Investment Portfolio | 3,820,172 | 10,793,434 | 14,448,312 | 30,831 | 159,956 |
Fidelity Retailing Portfolio | 8,536,702 | 252,081 | 750,000 | 16,002 | 11,338,726 |
Fidelity Select Money Market Portfolio | 10,213,502 | 1,338 | - | 1,339 | 10,214,841 |
Fidelity Series Commodity Strategy Fund | - | 9,075 | - | - | 8,628 |
Fidelity Small Cap Discovery Fund | - | 25,254,121 | - | 24,428 | 27,965,478 |
Fidelity Small Cap Growth Fund | 66,513 | 14,325 | - | - | 96,130 |
Fidelity Small Cap Stock Fund | 142,761 | 18,768 | - | 519 | 185,291 |
Fidelity Small Cap Value Fund | 142,720 | 17,960 | - | 555 | 195,636 |
Fidelity Software & Computer Services Portfolio | 14,470,573 | 47,311,139 | 63,729 | - | 78,372,926 |
Fidelity Technology Portfolio | 29,876,166 | 10,591,726 | 5,505,699 | 46,075 | 42,452,935 |
Fidelity Telecom and Utilities Fund | 6,617,183 | 38,616 | 7,000,000 | 38,616 | 216,526 |
Fidelity Telecommunications Portfolio | 13,773,209 | 3,984,465 | 6,634,094 | 289,679 | 13,450,208 |
Fidelity Transportation Portfolio | 2,747,932 | 11,756,711 | 31,864 | 49,261 | 16,686,513 |
Fidelity Utilities Portfolio | 9,566,925 | 158,114 | 4,953,414 | 99,861 | 6,386,832 |
Fidelity Value Fund | - | 16,540,616 | 18,413 | 150,341 | 18,208,133 |
Fidelity Value Strategies Fund | 913,502 | 95 | 1,035,000 | 96 | 11,986 |
Spartan 500 Index Fund Investor Class | 146,558 | 3,387 | - | 3,387 | 193,825 |
Spartan Extended Market Index Fund Investor Class | 10,028,271 | 314,535 | 4,935,000 | 103,389 | 8,509,059 |
Spartan International Index Fund Investor Class | 58,012,558 | 20,653,614 | 2,947,192 | 1,992,365 | 87,515,519 |
Spartan Total Market Index Fund Investor Class | 11,857,704 | 163,738 | 6,405,000 | 163,738 | 8,789,820 |
Spartan U.S. Bond Index Fund Investor Class | 540,697,956 | 653,935,150 | 4,386,246 | 18,564,380 | 1,153,386,318 |
VIP Mid Cap Portfolio Investor Class | 263,522 | 42,663 | - | 1,416 | 358,602 |
Total | $ 1,429,393,796 | $ 2,096,954,222 | $ 357,029,534 | $ 36,628,270 | $ 3,409,094,847 |
Other Information |
All investments are categorized as Level 1 under the Fair Value Hierarchy. The inputs or methodology used for valuing securities may not be an indication of the risk associated with investing in those securities. For more information on valuation inputs, please refer to the Investment Valuation section in the accompanying Notes to Financial Statements. |
See accompanying notes which are an integral part of the financial statements.
Annual Report
VIP FundsManager 50% Portfolio
Statement of Assets and Liabilities
| December 31, 2013 |
| | |
Assets | | |
Investment in securities, at value (cost $3,074,743,704) - See accompanying schedule | | $ 3,409,094,847 |
Receivable for investments sold | | 8,435 |
Receivable for fund shares sold | | 5,561,608 |
Total assets | | 3,414,664,890 |
| | |
Liabilities | | |
Payable for investments purchased | $ 5,496,489 | |
Payable for fund shares redeemed | 73,554 | |
Accrued management fee | 548,737 | |
Distribution and service plan fees payable | 10,969 | |
Total liabilities | | 6,129,749 |
| | |
Net Assets | | $ 3,408,535,141 |
Net Assets consist of: | | |
Paid in capital | | $ 3,073,329,644 |
Accumulated undistributed net realized gain (loss) on investments | | 854,354 |
Net unrealized appreciation (depreciation) on investments | | 334,351,143 |
Net Assets | | $ 3,408,535,141 |
Statement of Assets and Liabilities - continued
| December 31, 2013 |
| | |
Service Class:
Net Asset Value, offering price and redemption price per share ($79,889 ÷ 6,652 shares) | | $ 12.01 |
| | |
Service Class 2:
Net Asset Value, offering price and redemption price per share ($89,164,314 ÷ 7,445,269 shares) | | $ 11.98 |
| | |
Investor Class:
Net Asset Value, offering price and redemption price per share ($3,319,290,938 ÷ 276,408,533 shares) | | $ 12.01 |
See accompanying notes which are an integral part of the financial statements.
Annual Report
Statement of Operations
| Year ended December 31, 2013 |
| | |
Investment Income | | |
Income distributions from underlying funds | | $ 36,628,270 |
| | |
Expenses | | |
Management fee | $ 5,969,266 | |
Distribution and service plan fees | 210,773 | |
Independent trustees' compensation | 8,458 | |
Total expenses before reductions | 6,188,497 | |
Expense reductions | (1,283,118) | 4,905,379 |
Net investment income (loss) | | 31,722,891 |
Realized and Unrealized Gain (Loss) Realized gain (loss) on sale of underlying fund shares | 16,867,324 | |
Capital gain distributions from underlying funds | 61,052,998 | |
Total net realized gain (loss) | | 77,920,322 |
Change in net unrealized appreciation (depreciation) on underlying funds | | 222,867,946 |
Net gain (loss) | | 300,788,268 |
Net increase (decrease) in net assets resulting from operations | | $ 332,511,159 |
Statement of Changes in Net Assets
| Year ended
December 31,
2013 | Year ended
December 31,
2012 |
Increase (Decrease) in Net Assets | | |
Operations | | |
Net investment income (loss) | $ 31,722,891 | $ 17,315,688 |
Net realized gain (loss) | 77,920,322 | 19,794,433 |
Change in net unrealized appreciation (depreciation) | 222,867,946 | 51,810,378 |
Net increase (decrease) in net assets resulting
from operations | 332,511,159 | 88,920,499 |
Distributions to shareholders from net investment income | (31,865,189) | (17,293,629) |
Distributions to shareholders from net realized gain | (18,085,537) | (3,690,979) |
Total distributions | (49,950,726) | (20,984,608) |
Share transactions - net increase (decrease) | 1,696,818,975 | 595,783,166 |
Total increase (decrease) in net assets | 1,979,379,408 | 663,719,057 |
| | |
Net Assets | | |
Beginning of period | 1,429,155,733 | 765,436,676 |
End of period | $ 3,408,535,141 | $ 1,429,155,733 |
See accompanying notes which are an integral part of the financial statements.
Annual Report
Financial Highlights - Service Class
Years ended December 31, | 2013 | 2012 | 2011 | 2010 | 2009 |
Selected Per-Share Data | | | | | |
Net asset value, beginning of period | $ 10.62 | $ 9.78 | $ 10.02 | $ 9.11 | $ 7.80 |
Income from Investment Operations | | | | | |
Net investment income (loss) C | .15 | .18 | .19 | .17 | .17 |
Net realized and unrealized gain (loss) | 1.42 | .82 | (.23) | .91 | 1.30 |
Total from investment operations | 1.57 | 1.00 | (.04) | 1.08 | 1.47 |
Distributions from net investment income | (.12) | (.13) | (.18) | (.16) | (.15) |
Distributions from net realized gain | (.07) | (.03) | (.02) | (.02) | (.01) |
Total distributions | (.18) G | (.16) | (.20) | (.17) F | (.16) |
Net asset value, end of period | $ 12.01 | $ 10.62 | $ 9.78 | $ 10.02 | $ 9.11 |
Total Return A, B | 14.79% | 10.24% | (.42)% | 11.89% | 18.82% |
Ratios to Average Net Assets D, E | | | | | |
Expenses before reductions | .35% | .35% | .35% | .35% | .35% |
Expenses net of fee waivers, if any | .20% | .20% | .20% | .20% | .20% |
Expenses net of all reductions | .20% | .20% | .20% | .20% | .20% |
Net investment income (loss) | 1.33% | 1.77% | 1.84% | 1.78% | 2.07% |
Supplemental Data | | | | | |
Net assets, end of period (000 omitted) | $ 80 | $ 72 | $ 59 | $ 62 | $ 58 |
Portfolio turnover rate D | 15% | 15% | 14% | 16% | 44% |
A Total returns do not reflect charges attributable to your insurance company's separate account. Inclusion of these charges would reduce the total returns shown.
B Total returns would have been lower if certain expenses had not been reduced during the applicable periods shown.
C Calculated based on average shares outstanding during the period.
D Amounts do not include the activity of the Underlying Funds.
E Expense ratios reflect operating expenses of the class. Expenses before reductions do not reflect amounts reimbursed by the investment adviser or reductions from expense offset arrangements and do not represent the amount paid by the class during periods when reimbursements or reductions occur. Expenses net of fee waivers reflect expenses after reimbursement by the investment adviser but prior to reductions from expense offset arrangements. Expenses net of all reductions represent the net expenses paid by the class but do not include expenses of the investment companies in which the Fund invests.
F Total distributions of $.17 per share is comprised of distributions from net investment income of $.155 and distributions from net realized gain of $.018 per share.
G Total distributions of $.18 per share is comprised of distributions from net investment income of $.115 and distributions from net realized gain of $.065 per share.
Financial Highlights - Service Class 2
Years ended December 31, | 2013 | 2012 | 2011 | 2010 | 2009 |
Selected Per-Share Data | | | | | |
Net asset value, beginning of period | $ 10.59 | $ 9.75 | $ 10.01 | $ 9.10 | $ 7.79 |
Income from Investment Operations | | | | | |
Net investment income (loss) C | .13 | .17 | .17 | .15 | .16 |
Net realized and unrealized gain (loss) | 1.42 | .82 | (.24) | .92 | 1.30 |
Total from investment operations | 1.55 | .99 | (.07) | 1.07 | 1.46 |
Distributions from net investment income | (.10) | (.12) | (.17) | (.14) | (.14) |
Distributions from net realized gain | (.07) | (.03) | (.02) | (.02) | (.01) |
Total distributions | (.16) F | (.15) | (.19) | (.16) | (.15) |
Net asset value, end of period | $ 11.98 | $ 10.59 | $ 9.75 | $ 10.01 | $ 9.10 |
Total Return A, B | 14.66% | 10.12% | (.68)% | 11.75% | 18.76% |
Ratios to Average Net Assets D, E | | | | | |
Expenses before reductions | .50% | .50% | .50% | .50% | .50% |
Expenses net of fee waivers, if any | .35% | .35% | .35% | .35% | .35% |
Expenses net of all reductions | .35% | .35% | .35% | .35% | .35% |
Net investment income (loss) | 1.18% | 1.62% | 1.69% | 1.63% | 1.92% |
Supplemental Data | | | | | |
Net assets, end of period (000 omitted) | $ 89,164 | $ 81,647 | $ 17,800 | $ 1,030 | $ 550 |
Portfolio turnover rate D | 15% | 15% | 14% | 16% | 44% |
A Total returns do not reflect charges attributable to your insurance company's separate account. Inclusion of these charges would reduce the total returns shown.
B Total returns would have been lower if certain expenses had not been reduced during the applicable periods shown.
C Calculated based on average shares outstanding during the period.
D Amounts do not include the activity of the Underlying Funds.
E Expense ratios reflect operating expenses of the class. Expenses before reductions do not reflect amounts reimbursed by the investment adviser or reductions from expense offset arrangements and do not represent the amount paid by the class during periods when reimbursements or reductions occur. Expenses net of fee waivers reflect expenses after reimbursement by the investment adviser but prior to reductions from expense offset arrangements. Expenses net of all reductions represent the net expenses paid by the class but do not include expenses of the investment companies in which the Fund invests.
F Total distributions of $.16 per share is comprised of distributions from net investment income of $.097 and distributions from net realized gain of $.065 per share.
See accompanying notes which are an integral part of the financial statements.
Annual Report
Financial Highlights - Investor Class
Years ended December 31, | 2013 | 2012 | 2011 | 2010 | 2009 |
Selected Per-Share Data | | | | | |
Net asset value, beginning of period | $ 10.61 | $ 9.78 | $ 10.02 | $ 9.11 | $ 7.79 |
Income from Investment Operations | | | | | |
Net investment income (loss) C | .15 | .18 | .19 | .17 | .17 |
Net realized and unrealized gain (loss) | 1.43 | .81 | (.23) | .91 | 1.31 |
Total from investment operations | 1.58 | .99 | (.04) | 1.08 | 1.48 |
Distributions from net investment income | (.12) | (.13) | (.18) | (.16) | (.15) |
Distributions from net realized gain | (.07) | (.03) | (.02) | (.02) | (.01) |
Total distributions | (.18) G | (.16) | (.20) | (.17) F | (.16) |
Net asset value, end of period | $ 12.01 | $ 10.61 | $ 9.78 | $ 10.02 | $ 9.11 |
Total Return A, B | 14.90% | 10.13% | (.42)% | 11.89% | 18.98% |
Ratios to Average Net Assets D, E | | | | | |
Expenses before reductions | .25% | .25% | .25% | .25% | .25% |
Expenses net of fee waivers, if any | .20% | .20% | .20% | .20% | .20% |
Expenses net of all reductions | .20% | .20% | .20% | .20% | .20% |
Net investment income (loss) | 1.33% | 1.77% | 1.84% | 1.78% | 2.07% |
Supplemental Data | | | | | |
Net assets, end of period (000 omitted) | $ 3,319,291 | $ 1,347,437 | $ 747,577 | $ 671,632 | $ 520,243 |
Portfolio turnover rate D | 15% | 15% | 14% | 16% | 44% |
A Total returns do not reflect charges attributable to your insurance company's separate account. Inclusion of these charges would reduce the total returns shown.
B Total returns would have been lower if certain expenses had not been reduced during the applicable periods shown.
C Calculated based on average shares outstanding during the period.
D Amounts do not include the activity of the Underlying Funds.
E Expense ratios reflect operating expenses of the class. Expenses before reductions do not reflect amounts reimbursed by the investment adviser or reductions from expense offset arrangements and do not represent the amount paid by the class during periods when reimbursements or reductions occur. Expenses net of fee waivers reflect expenses after reimbursement by the investment adviser but prior to reductions from expense offset arrangements. Expenses net of all reductions represent the net expenses paid by the class but do not include expenses of the investment companies in which the Fund invests.
F Total distributions of $.17 per share is comprised of distributions from net investment income of $.155 and distributions from net realized gain of $.018 per share.
G Total distributions of $.18 per share is comprised of distributions from net investment income of $.115 and distributions from net realized gain of $.065 per share.
See accompanying notes which are an integral part of the financial statements.
Annual Report
VIP FundsManager 60% Portfolio
Investment Changes (Unaudited)
The information in the following tables is based on the direct investments of the Fund. |
Fund Holdings as of December 31, 2013 |
| % of fund's
net assets | % of fund's net assets
6 months ago |
Domestic Equity Funds | | |
Fidelity Air Transportation Portfolio | 0.2 | 0.1 |
Fidelity Automotive Portfolio | 0.3 | 0.2 |
Fidelity Banking Portfolio | 2.3 | 2.2 |
Fidelity Biotechnology Portfolio | 0.4 | 0.8 |
Fidelity Blue Chip Growth Fund | 0.1 | 0.0* |
Fidelity Brokerage & Investment Management Portfolio | 1.2 | 0.9 |
Fidelity Capital Appreciation Fund | 0.2 | 0.6 |
Fidelity Chemicals Portfolio | 0.6 | 0.5 |
Fidelity Communications Equipment Portfolio | 0.3 | 0.2 |
Fidelity Computers Portfolio | 1.5 | 1.7 |
Fidelity Construction & Housing Portfolio | 0.7 | 1.0 |
Fidelity Consumer Discretionary Portfolio | 2.7 | 2.5 |
Fidelity Consumer Finance Portfolio | 0.8 | 0.9 |
Fidelity Consumer Staples Portfolio | 3.1 | 3.8 |
Fidelity Contrafund | 0.0* | 0.0* |
Fidelity Defense & Aerospace Portfolio | 0.0* | 0.0* |
Fidelity Disciplined Equity Fund | 0.0* | 0.0* |
Fidelity Dividend Growth Fund | 0.0* | 0.0* |
Fidelity Electronics Portfolio | 0.4 | 0.4 |
Fidelity Energy Portfolio | 2.2 | 2.5 |
Fidelity Energy Service Portfolio | 1.1 | 1.2 |
Fidelity Environmental & Alternative Energy Portfolio | 0.0* | 0.0* |
Fidelity Equity Dividend Income Fund | 0.0* | 0.0* |
Fidelity Equity-Income Fund | 0.1 | 0.1 |
Fidelity Financial Services Portfolio | 2.5 | 2.4 |
Fidelity Fund | 0.0* | 0.0* |
Fidelity Global Commodity Stock Fund | 0.0* | 0.0* |
Fidelity Gold Portfolio | 0.0* | 0.0* |
Fidelity Growth & Income Portfolio | 0.0* | 0.1 |
Fidelity Growth Company Fund | 0.4 | 0.4 |
Fidelity Growth Discovery Fund | 0.2 | 0.0 |
Fidelity Health Care Portfolio | 4.6 | 3.9 |
Fidelity Independence Fund | 0.2 | 0.2 |
Fidelity Industrial Equipment Portfolio | 2.0 | 1.7 |
Fidelity Industrials Portfolio | 3.3 | 2.5 |
Fidelity Insurance Portfolio | 1.9 | 1.8 |
|
| % of fund's
net assets | % of fund's net assets
6 months ago |
Fidelity IT Services Portfolio | 1.3 | 1.1 |
Fidelity Large Cap Stock Fund | 1.1 | 1.0 |
Fidelity Large Cap Value Fund | 0.0* | 0.0* |
Fidelity Leisure Portfolio | 0.3 | 0.3 |
Fidelity Leveraged Company Stock Fund | 0.0* | 0.0* |
Fidelity Low-Priced Stock Fund | 0.0* | 0.0 |
Fidelity Magellan Fund | 0.0* | 0.0* |
Fidelity Materials Portfolio | 0.1 | 0.0* |
Fidelity Medical Delivery Portfolio | 0.0* | 0.1 |
Fidelity Medical Equipment & Systems Portfolio | 0.0* | 0.0* |
Fidelity Mega Cap Stock Fund | 0.5 | 1.0 |
Fidelity Mid Cap Value Fund | 0.0* | 0.0* |
Fidelity Mid-Cap Stock Fund | 0.1 | 0.0 |
Fidelity Multimedia Portfolio | 0.8 | 0.7 |
Fidelity Natural Gas Portfolio | 0.0* | 0.1 |
Fidelity Natural Resources Portfolio | 0.1 | 0.3 |
Fidelity New Millennium Fund | 0.2 | 0.0* |
Fidelity OTC Portfolio | 0.8 | 0.4 |
Fidelity Pharmaceuticals Portfolio | 1.4 | 1.3 |
Fidelity Real Estate Investment Portfolio | 0.0* | 0.0* |
Fidelity Retailing Portfolio | 0.8 | 0.7 |
Fidelity Series Commodity Strategy Fund | 0.0* | 0.0* |
Fidelity Small Cap Discovery Fund | 0.1 | 0.0* |
Fidelity Small Cap Growth Fund | 0.0* | 0.0* |
Fidelity Small Cap Value Fund | 0.1 | 0.0* |
Fidelity Software & Computer Services Portfolio | 3.0 | 2.7 |
Fidelity Stock Selector All Cap Fund | 0.0* | 0.0* |
Fidelity Technology Portfolio | 1.3 | 2.0 |
Fidelity Telecom and Utilities Fund | 0.0* | 0.0* |
Fidelity Telecommunications Portfolio | 0.9 | 1.3 |
Fidelity Transportation Portfolio | 0.3 | 0.1 |
Fidelity Utilities Portfolio | 0.4 | 0.8 |
Fidelity Value Fund | 0.0* | 0.0* |
Fidelity Value Strategies Fund | 0.0* | 0.0* |
Spartan 500 Index Fund Investor Class | 0.0* | 0.0* |
Spartan Total Market Index Fund Investor Class | 0.3 | 0.5 |
VIP Industrials Portfolio Investor Class | 0.0* | 0.0* |
VIP Mid Cap Portfolio Investor Class | 0.0* | 0.0* |
| 47.2 | 47.0 |
Fund Holdings as of December 31, 2013 - continued |
| % of fund's
net assets | % of fund's net assets
6 months ago |
International Equity Funds | | |
Fidelity Canada Fund | 0.0* | 0.0* |
Fidelity China Region Fund | 0.2 | 0.3 |
Fidelity Diversified International Fund | 3.5 | 3.8 |
Fidelity Emerging Asia Fund | 0.9 | 0.9 |
Fidelity Emerging Europe, Middle East, Africa (EMEA) Fund | 0.0* | 0.0* |
Fidelity Emerging Markets Discovery Fund | 0.0* | 0.0* |
Fidelity Emerging Markets Fund | 0.4 | 0.1 |
Fidelity Europe Capital Appreciation Fund | 0.1 | 0.0* |
Fidelity Europe Fund | 0.2 | 0.1 |
Fidelity International Capital Appreciation Fund | 1.3 | 1.2 |
Fidelity International Discovery Fund | 6.1 | 3.5 |
Fidelity International Growth Fund | 0.4 | 0.4 |
Fidelity International Real Estate Fund | 0.0* | 0.0* |
Fidelity International Small Cap Fund | 0.5 | 0.1 |
Fidelity International Small Cap Opportunities Fund | 0.7 | 0.7 |
Fidelity International Value Fund | 0.4 | 0.4 |
Fidelity Japan Fund | 0.0* | 0.0* |
Fidelity Japan Smaller Companies Fund | 0.7 | 0.2 |
Fidelity Latin America Fund | 0.0* | 0.0* |
Fidelity Nordic Fund | 0.6 | 0.5 |
Fidelity Overseas Fund | 0.1 | 0.1 |
Fidelity Pacific Basin Fund | 0.6 | 0.6 |
Spartan International Index Fund Investor Class | 3.0 | 2.9 |
| 19.7 | 15.8 |
Fixed-Income Funds | | |
Fidelity Floating Rate High Income Fund | 1.6 | 2.0 |
Fidelity Focused High Income Fund | 0.4 | 0.5 |
Fidelity High Income Fund | 0.8 | 0.5 |
Fidelity New Markets Income Fund | 0.3 | 0.4 |
Fidelity Real Estate Income Fund | 0.0* | 0.1 |
Spartan U.S. Bond Index Fund Investor Class | 28.5 | 29.2 |
| 31.6 | 32.7 |
Money Market Funds | | |
Fidelity Institutional Prime Money Market Portfolio Class I | 1.5 | 4.5 |
Net Other Assets (Liabilities)* | 0.0 | 0.0 |
| 100.0 | 100.0 |
* Amount represents less than 0.1%
Asset Allocation (% of fund's net assets) |
As of December 31, 2013 |
| Domestic Equity Funds | 47.2% | |
| International Equity Funds | 19.7% | |
| Fixed-Income Funds | 31.6% | |
| Money Market Funds | 1.5% | |

As of June 30, 2013 |
| Domestic Equity Funds | 47.0% | |
| International Equity Funds | 15.8% | |
| Fixed-Income Funds | 32.7% | |
| Money Market Funds | 4.5% | |

Annual Report
VIP FundsManager 60% Portfolio
Investments December 31, 2013
Showing Percentage of Net Assets
Equity Funds - 66.9% |
| Shares | | Value |
Domestic Equity Funds - 47.2% |
Fidelity Air Transportation Portfolio (c) | 181,526 | | $ 10,764,473 |
Fidelity Automotive Portfolio (c) | 322,727 | | 18,179,192 |
Fidelity Banking Portfolio (c) | 5,629,344 | | 147,319,936 |
Fidelity Biotechnology Portfolio (c) | 156,307 | | 28,405,668 |
Fidelity Blue Chip Growth Fund (c) | 74,306 | | 4,708,772 |
Fidelity Brokerage & Investment Management Portfolio (c) | 995,135 | | 73,888,782 |
Fidelity Capital Appreciation Fund (c) | 329,396 | | 11,917,558 |
Fidelity Chemicals Portfolio (c) | 279,586 | | 40,783,175 |
Fidelity Communications Equipment Portfolio (c) | 553,161 | | 16,318,255 |
Fidelity Computers Portfolio (c) | 1,330,479 | | 98,615,097 |
Fidelity Construction & Housing Portfolio (c) | 813,078 | | 44,329,023 |
Fidelity Consumer Discretionary Portfolio (c) | 5,214,043 | | 172,689,100 |
Fidelity Consumer Finance Portfolio (c) | 3,267,139 | | 53,450,391 |
Fidelity Consumer Staples Portfolio (c) | 2,179,072 | | 196,574,068 |
Fidelity Contrafund (c) | 16,355 | | 1,572,407 |
Fidelity Defense & Aerospace Portfolio (c) | 16,711 | | 2,044,728 |
Fidelity Disciplined Equity Fund (c) | 76,532 | | 2,473,524 |
Fidelity Dividend Growth Fund (c) | 2,056 | | 72,753 |
Fidelity Electronics Portfolio (c) | 391,503 | | 24,715,566 |
Fidelity Energy Portfolio (c) | 2,509,999 | | 140,836,028 |
Fidelity Energy Service Portfolio (c) | 820,009 | | 69,577,784 |
Fidelity Environmental & Alternative Energy Portfolio (c) | 4,663 | | 106,450 |
Fidelity Equity Dividend Income Fund (c) | 5,185 | | 127,712 |
Fidelity Equity-Income Fund (c) | 86,466 | | 5,075,546 |
Fidelity Financial Services Portfolio (c) | 1,976,798 | | 161,662,533 |
Fidelity Fund (c) | 2,027 | | 86,455 |
Fidelity Global Commodity Stock Fund (c) | 13,776 | | 194,659 |
Fidelity Gold Portfolio (a)(c) | 28,629 | | 514,463 |
Fidelity Growth & Income Portfolio (c) | 33,783 | | 941,193 |
Fidelity Growth Company Fund (c) | 228,310 | | 27,369,829 |
Fidelity Growth Discovery Fund (c) | 691,566 | | 14,681,938 |
Fidelity Health Care Portfolio (c) | 1,547,561 | | 291,730,709 |
Fidelity Independence Fund (c) | 400,104 | | 14,495,781 |
Fidelity Industrial Equipment Portfolio (c) | 2,736,840 | | 125,402,020 |
Fidelity Industrials Portfolio (c) | 6,363,557 | | 214,260,968 |
Fidelity Insurance Portfolio (c) | 1,782,653 | | 122,254,346 |
Fidelity IT Services Portfolio (c) | 2,169,826 | | 81,216,571 |
Fidelity Large Cap Stock Fund (c) | 2,626,242 | | 71,512,561 |
Fidelity Large Cap Value Fund (c) | 29,151 | | 444,559 |
Fidelity Leisure Portfolio (c) | 150,676 | | 20,067,012 |
Fidelity Leveraged Company Stock Fund (c) | 4,378 | | 189,299 |
Fidelity Low-Priced Stock Fund (c) | 10,808 | | 534,560 |
Fidelity Magellan Fund (c) | 608 | | 56,164 |
Fidelity Materials Portfolio (c) | 55,262 | | 4,691,227 |
Fidelity Medical Delivery Portfolio (c) | 1,052 | | 76,727 |
Fidelity Medical Equipment & Systems Portfolio (c) | 5,967 | | 213,255 |
|
| Shares | | Value |
Fidelity Mega Cap Stock Fund (c) | 2,259,074 | | $ 34,834,919 |
Fidelity Mid Cap Value Fund (c) | 6,207 | | 140,273 |
Fidelity Mid-Cap Stock Fund (c) | 81,749 | | 3,229,902 |
Fidelity Multimedia Portfolio (c) | 592,975 | | 48,013,216 |
Fidelity Natural Gas Portfolio (c) | 1,558 | | 58,865 |
Fidelity Natural Resources Portfolio (c) | 172,664 | | 6,371,293 |
Fidelity New Millennium Fund (c) | 280,885 | | 11,086,536 |
Fidelity OTC Portfolio (c) | 657,525 | | 50,885,898 |
Fidelity Pharmaceuticals Portfolio (c) | 4,655,377 | | 89,429,800 |
Fidelity Real Estate Investment Portfolio (c) | 4,577 | | 146,129 |
Fidelity Retailing Portfolio (c) | 593,060 | | 51,886,791 |
Fidelity Series Commodity Strategy Fund (a)(c) | 1,149 | | 9,103 |
Fidelity Small Cap Discovery Fund (c) | 165,765 | | 5,181,827 |
Fidelity Small Cap Growth Fund (c) | 11,672 | | 224,917 |
Fidelity Small Cap Value Fund (c) | 464,346 | | 9,305,485 |
Fidelity Software & Computer Services Portfolio (c) | 1,639,228 | | 194,510,796 |
Fidelity Stock Selector All Cap Fund (c) | 4,761 | | 169,456 |
Fidelity Technology Portfolio (c) | 667,591 | | 82,140,436 |
Fidelity Telecom and Utilities Fund (c) | 4,365 | | 96,081 |
Fidelity Telecommunications Portfolio (c) | 948,895 | | 57,398,659 |
Fidelity Transportation Portfolio (c) | 224,620 | | 16,588,194 |
Fidelity Utilities Portfolio (c) | 339,615 | | 22,621,725 |
Fidelity Value Fund (c) | 19,210 | | 1,989,757 |
Fidelity Value Strategies Fund (c) | 19,678 | | 805,811 |
Spartan 500 Index Fund Investor Class (c) | 2,337 | | 153,021 |
Spartan Total Market Index Fund Investor Class (c) | 315,016 | | 17,048,656 |
VIP Industrials Portfolio Investor Class (c) | 82,408 | | 1,818,755 |
VIP Mid Cap Portfolio Investor Class (c) | 6,244 | | 226,362 |
TOTAL DOMESTIC EQUITY FUNDS | | 3,023,515,480 |
International Equity Funds - 19.7% |
Fidelity Canada Fund (c) | 2,342 | | 136,581 |
Fidelity China Region Fund (c) | 460,633 | | 15,550,971 |
Fidelity Diversified International Fund (c) | 6,083,817 | | 224,553,670 |
Fidelity Emerging Asia Fund (c) | 1,878,577 | | 57,559,606 |
Fidelity Emerging Europe, Middle East, Africa (EMEA) Fund (c) | 150,414 | | 1,382,302 |
Fidelity Emerging Markets Discovery Fund (c) | 29,625 | | 359,944 |
Fidelity Emerging Markets Fund (c) | 994,737 | | 23,963,217 |
Fidelity Europe Capital Appreciation Fund (c) | 293,978 | | 6,923,174 |
Fidelity Europe Fund (c) | 309,003 | | 12,017,140 |
Fidelity International Capital Appreciation Fund (c) | 4,837,395 | | 81,026,362 |
Fidelity International Discovery Fund (c) | 9,634,324 | | 390,190,103 |
Fidelity International Growth Fund (c) | 2,291,361 | | 25,754,892 |
Fidelity International Real Estate Fund (c) | 18,781 | | 191,001 |
Fidelity International Small Cap Fund (c) | 1,139,776 | | 30,534,602 |
Equity Funds - continued |
| Shares | | Value |
International Equity Funds - continued |
Fidelity International Small Cap Opportunities Fund (c) | 3,161,460 | | $ 44,133,986 |
Fidelity International Value Fund (c) | 3,207,925 | | 29,031,726 |
Fidelity Japan Fund (c) | 32,165 | | 387,270 |
Fidelity Japan Smaller Companies Fund (c) | 3,502,081 | | 47,067,969 |
Fidelity Latin America Fund (c) | 3,591 | | 112,217 |
Fidelity Nordic Fund (c) | 843,777 | | 37,784,319 |
Fidelity Overseas Fund (c) | 109,055 | | 4,390,551 |
Fidelity Pacific Basin Fund (c) | 1,516,635 | | 41,950,114 |
Spartan International Index Fund Investor Class (c) | 4,679,732 | | 190,324,702 |
TOTAL INTERNATIONAL EQUITY FUNDS | | 1,265,326,419 |
TOTAL EQUITY FUNDS (Cost $3,105,681,758) |
4,288,841,899
|
Fixed-Income Funds - 31.6% |
| | | |
Fidelity Floating Rate High Income Fund (c) | 10,524,689 | | 104,825,906 |
Fidelity Focused High Income Fund (c) | 3,013,671 | | 27,123,038 |
Fidelity High Income Fund (c) | 5,247,612 | | 49,170,122 |
Fidelity New Markets Income Fund (c) | 1,109,881 | | 17,303,042 |
Fidelity Real Estate Income Fund (c) | 22,598 | | 250,381 |
Spartan U.S. Bond Index Fund Investor Class (c) | 160,971,045 | | 1,828,631,075 |
TOTAL FIXED-INCOME FUNDS (Cost $2,030,549,750) |
2,027,303,564
|
Money Market Funds - 1.5% |
| Shares | | Value |
Fidelity Institutional Prime Money Market Portfolio Class I 0.01% (b)(c)
(Cost $94,885,114) | 94,885,114 | | $ 94,885,114 |
TOTAL INVESTMENT PORTFOLIO - 100.0% (Cost $5,231,116,622) | 6,411,030,577 |
NET OTHER ASSETS (LIABILITIES) - 0.0% | | (1,092,591) |
NET ASSETS - 100% | $ 6,409,937,986 |
Legend |
(a) Non-income producing |
(b) The rate quoted is the annualized seven-day yield of the fund at period end. |
(c) Affiliated company |
Affiliated Underlying Funds |
Information regarding the Fund's fiscal year to date purchases and sales of the affiliated Underlying Funds and income earned by the Fund from investments in affiliated Underlying Funds is as follows: |
Affiliate | Value,
beginning of period | Purchases | Sales
Proceeds | Dividend
Income | Value,
end of
period |
Fidelity Air Transportation Portfolio | $ 4,703,042 | $ 3,565,263 | $ - | $ 8,938 | $ 10,764,473 |
Fidelity Automotive Portfolio | 10,885,570 | 3,434,027 | 1,065,450 | 47,151 | 18,179,192 |
Fidelity Banking Portfolio | 103,312,021 | 15,526,672 | 8,105,920 | 1,085,237 | 147,319,936 |
Fidelity Biotechnology Portfolio | 34,259,357 | 2,208,659 | 27,217,712 | - | 28,405,668 |
Fidelity Blue Chip Growth Fund | 818,389 | 3,404,572 | - | 13,081 | 4,708,772 |
Fidelity Brokerage & Investment Management Portfolio | 25,839,484 | 29,764,920 | - | 383,683 | 73,888,782 |
Fidelity Canada Fund | 124,115 | 1,297 | - | 555 | 136,581 |
Fidelity Capital Appreciation Fund | 27,936,958 | 1,086,323 | 22,900,000 | 42,964 | 11,917,558 |
Fidelity Chemicals Portfolio | 33,028,599 | 6,784,429 | 6,029,078 | 318,696 | 40,783,175 |
Fidelity China Region Fund | 32,021,553 | 2,314,442 | 20,100,000 | 157,400 | 15,550,971 |
Fidelity Commodity Strategy Fund | 10,110 | - | 9,558 | - | - |
Fidelity Communications Equipment Portfolio | 7,814,835 | 5,811,180 | 379,903 | 109,861 | 16,318,255 |
Fidelity Computers Portfolio | 92,124,628 | 9,066,028 | 21,151,009 | 704,823 | 98,615,097 |
Fidelity Construction & Housing Portfolio | 47,499,877 | 8,997,075 | 18,276,571 | 229,605 | 44,329,023 |
Fidelity Consumer Discretionary Portfolio | 121,508,423 | 17,152,566 | 2,648,734 | 163,918 | 172,689,100 |
Fidelity Consumer Finance Portfolio | 40,025,584 | 11,405,135 | 3,579,192 | 1,179,582 | 53,450,391 |
Fidelity Consumer Staples Portfolio | 226,102,502 | 18,258,281 | 75,520,104 | 3,541,355 | 196,574,068 |
Fidelity Contrafund | 704,858 | 4,203,465 | 3,470,000 | 1,789 | 1,572,407 |
Affiliate | Value,
beginning of period | Purchases | Sales
Proceeds | Dividend
Income | Value,
end of
period |
Fidelity Defense & Aerospace Portfolio | $ 1,380,240 | $ 100,454 | $ - | $ 10,223 | $ 2,044,728 |
Fidelity Disciplined Equity Fund | 112,886 | 2,285,829 | - | 44,943 | 2,473,524 |
Fidelity Diversified International Fund | 211,963,951 | 71,547,558 | 107,370,631 | 1,878,343 | 224,553,670 |
Fidelity Dividend Growth Fund | 5,688,496 | 6,793 | 6,200,000 | 715 | 72,753 |
Fidelity Electronics Portfolio | 16,379,243 | 2,050,299 | 383,512 | 125,268 | 24,715,566 |
Fidelity Emerging Asia Fund | 76,066,527 | 1,405,769 | 19,799,617 | 719,799 | 57,559,606 |
Fidelity Emerging Europe, Middle East, Africa (EMEA) Fund | 691,663 | 699,713 | - | 19,713 | 1,382,302 |
Fidelity Emerging Markets Discovery Fund | 121,518 | 251,056 | - | 2,441 | 359,944 |
Fidelity Emerging Markets Fund | 34,012,943 | 19,684,369 | 28,400,000 | 18,887 | 23,963,217 |
Fidelity Energy Portfolio | 153,779,499 | 19,211,907 | 49,947,084 | 1,084,091 | 140,836,028 |
Fidelity Energy Service Portfolio | 52,262,379 | 14,232,808 | 12,159,326 | 151,430 | 69,577,784 |
Fidelity Environmental & Alternative Energy Portfolio | 78,859 | 801 | - | 801 | 106,450 |
Fidelity Equity Dividend Income Fund | 98,956 | 2,381 | - | 2,381 | 127,712 |
Fidelity Equity-Income Fund | 5,355,204 | 4,940,837 | 6,433,357 | 173,131 | 5,075,546 |
Fidelity Europe Capital Appreciation Fund | - | 6,295,876 | - | 105,876 | 6,923,174 |
Fidelity Europe Fund | - | 10,904,898 | - | 158,367 | 12,017,140 |
Fidelity Financial Services Portfolio | 107,867,884 | 19,060,065 | 3,400,000 | 1,463,435 | 161,662,533 |
Fidelity Floating Rate High Income Fund | 113,877,586 | 6,142,321 | 15,648,800 | 3,487,161 | 104,825,906 |
Fidelity Focused High Income Fund | 39,350,349 | 2,663,755 | 13,547,484 | 1,588,192 | 27,123,038 |
Fidelity Fund | 67,017 | 6,307 | - | 624 | 86,455 |
Fidelity Global Commodity Stock Fund | 1,293,262 | 2,729 | 1,000,000 | 2,552 | 194,659 |
Fidelity Gold Portfolio | 31,090,570 | - | 19,417,445 | - | 514,463 |
Fidelity Growth & Income Portfolio | - | 6,917,943 | 6,351,871 | 35,694 | 941,193 |
Fidelity Growth Company Fund | 18,733,043 | 3,274,772 | - | 44,163 | 27,369,829 |
Fidelity Growth Discovery Fund | - | 13,576,538 | - | - | 14,681,938 |
Fidelity Health Care Portfolio | 189,896,076 | 34,203,462 | 9,335,361 | 63,526 | 291,730,709 |
Fidelity High Income Fund | 82,815,850 | 18,985,423 | 52,560,537 | 3,100,563 | 49,170,122 |
Fidelity Independence Fund | 13,079,805 | 43,872 | 3,000,000 | 43,872 | 14,495,781 |
Fidelity Industrial Equipment Portfolio | 81,207,585 | 27,335,153 | 4,250,750 | 812,991 | 125,402,020 |
Fidelity Industrials Portfolio | 109,556,036 | 64,371,788 | 1,175,483 | 1,198,853 | 214,260,968 |
Fidelity Institutional Prime Money Market Portfolio Class I | 89,050,318 | 204,263,253 | 198,428,457 | 21,361 | 94,885,114 |
Fidelity Insurance Portfolio | 86,775,215 | 9,543,896 | 3,003,603 | 1,026,741 | 122,254,346 |
Fidelity International Capital Appreciation Fund | 79,885,324 | 1,102,145 | 14,834,233 | 571,442 | 81,026,362 |
Fidelity International Discovery Fund | 188,746,582 | 156,921,062 | 7,525,324 | 4,462,799 | 390,190,103 |
Fidelity International Growth Fund | 21,080,243 | 134,458 | - | 113,947 | 25,754,892 |
Fidelity International Real Estate Fund | 1,627,374 | 35,046 | 1,600,000 | 12,177 | 191,001 |
Fidelity International Small Cap Fund | 3,407,256 | 26,193,458 | 1,956,399 | 103,922 | 30,534,602 |
Fidelity International Small Cap Opportunities Fund | 37,898,716 | 1,126,294 | 3,759,802 | 286,936 | 44,133,986 |
Fidelity International Value Fund | 23,385,769 | 1,013,300 | - | 616,997 | 29,031,726 |
Fidelity IT Services Portfolio | 51,551,140 | 4,420,209 | - | - | 81,216,571 |
Fidelity Japan Fund | 313,187 | 3,632 | - | 3,345 | 387,270 |
Fidelity Japan Smaller Companies Fund | 5,909,521 | 40,272,201 | 1,402,154 | 58,554 | 47,067,969 |
Fidelity Large Cap Stock Fund | 42,045,322 | 15,814,609 | 1,658,289 | 525,409 | 71,512,561 |
Fidelity Large Cap Value Fund | 336,179 | 6,804 | - | 5,455 | 444,559 |
Fidelity Latin America Fund | 1,722,668 | 20,413 | 1,450,000 | 2,115 | 112,217 |
Fidelity Leisure Portfolio | 13,810,287 | 2,339,693 | 399,344 | 142,037 | 20,067,012 |
Fidelity Leveraged Company Stock Fund | 140,106 | 1,185 | - | 1,185 | 189,299 |
Fidelity Low-Priced Stock Fund | - | 524,093 | - | 2,010 | 534,560 |
Fidelity Magellan Fund | 214,064 | 4,605 | 200,000 | 518 | 56,164 |
Fidelity Materials Portfolio | 140,395 | 4,312,463 | - | 22,676 | 4,691,227 |
Fidelity Medical Delivery Portfolio | 4,695,601 | 98,328 | 5,700,000 | - | 76,727 |
Fidelity Medical Equipment & Systems Portfolio | 150,928 | 19,255 | - | - | 213,255 |
Fidelity Mega Cap Stock Fund | 48,891,802 | 3,410,444 | 29,937,827 | 591,143 | 34,834,919 |
Fidelity Mid Cap Value Fund | 100,942 | 11,574 | - | 1,406 | 140,273 |
Fidelity Mid-Cap Stock Fund | - | 2,872,405 | - | 6,626 | 3,229,902 |
Fidelity Multimedia Portfolio | 33,644,103 | 5,216,286 | 4,945,514 | 107,484 | 48,013,216 |
Fidelity Natural Gas Portfolio | 6,256,836 | 4,431 | 7,100,000 | 3,931 | 58,865 |
Fidelity Natural Resources Portfolio | 20,143,496 | 163,448 | 16,400,000 | 15,975 | 6,371,293 |
Affiliate | Value,
beginning of period | Purchases | Sales
Proceeds | Dividend
Income | Value,
end of
period |
Fidelity New Markets Income Fund | $ 38,675,666 | $ 1,917,922 | $ 19,210,933 | $ 1,198,577 | $ 17,303,042 |
Fidelity New Millennium Fund | - | 10,721,760 | - | 40,018 | 11,086,536 |
Fidelity Nordic Fund | 26,765,900 | 2,386,572 | 1,678,374 | 658,595 | 37,784,319 |
Fidelity OTC Portfolio | - | 57,316,332 | 9,009,486 | 33,411 | 50,885,898 |
Fidelity Overseas Fund | 3,462,860 | 73,822 | - | 54,857 | 4,390,551 |
Fidelity Pacific Basin Fund | 34,161,206 | 5,426,072 | 1,400,000 | 238,890 | 41,950,114 |
Fidelity Pharmaceuticals Portfolio | 64,797,645 | 9,353,983 | 2,678,960 | 778,040 | 89,429,800 |
Fidelity Real Estate Income Fund | 10,142,122 | 379,651 | 10,355,000 | 289,313 | 250,381 |
Fidelity Real Estate Investment Portfolio | 19,886,929 | 2,771,206 | 23,641,940 | 91,405 | 146,129 |
Fidelity Retailing Portfolio | 36,504,114 | 3,851,686 | 2,800,000 | 72,112 | 51,886,791 |
Fidelity Series Commodity Strategy Fund | - | 9,575 | - | - | 9,103 |
Fidelity Small Cap Discovery Fund | - | 4,740,926 | - | 4,108 | 5,181,827 |
Fidelity Small Cap Growth Fund | 1,665,630 | 247,346 | 2,000,000 | - | 224,917 |
Fidelity Small Cap Value Fund | 421,464 | 8,854,291 | - | 26,426 | 9,305,485 |
Fidelity Software & Computer Services Portfolio | 110,613,370 | 42,689,315 | 14,221,402 | - | 194,510,796 |
Fidelity Stock Selector All Cap Fund | 126,401 | 10,091 | - | 1,219 | 169,456 |
Fidelity Technology Portfolio | 134,687,480 | 11,963,039 | 87,004,020 | 89,782 | 82,140,436 |
Fidelity Telecom and Utilities Fund | 11,455,420 | 6,687 | 11,900,000 | 6,687 | 96,081 |
Fidelity Telecommunications Portfolio | 80,713,047 | 1,597,282 | 37,815,198 | 1,317,765 | 57,398,659 |
Fidelity Transportation Portfolio | 6,153,308 | 7,801,644 | 399,344 | 50,688 | 16,588,194 |
Fidelity Utilities Portfolio | 74,243,313 | 771,353 | 62,201,992 | 486,513 | 22,621,725 |
Fidelity Value Fund | 315,218 | 1,429,462 | - | 16,430 | 1,989,757 |
Fidelity Value Strategies Fund | 4,101,214 | 6,420 | 4,000,000 | 6,420 | 805,811 |
Spartan 500 Index Fund Investor Class | 115,705 | 2,674 | - | 2,674 | 153,021 |
Spartan International Index Fund Investor Class | 165,722,701 | 6,713,385 | 12,104,309 | 4,366,493 | 190,324,702 |
Spartan Total Market Index Fund Investor Class | 28,429,123 | 297,038 | 18,710,000 | 297,038 | 17,048,656 |
Spartan U.S. Bond Index Fund Investor Class | 1,758,895,784 | 223,172,488 | 73,834,284 | 38,738,646 | 1,828,631,075 |
VIP Industrials Portfolio Investor Class | 1,301,691 | 104,383 | - | 12,544 | 1,818,755 |
VIP Mid Cap Portfolio Investor Class | 166,345 | 26,930 | - | 894 | 226,362 |
Total | $ 5,530,994,362 | $ 1,377,682,135 | $ 1,266,100,677 | $ 81,912,409 | $ 6,411,030,577 |
Other Information |
All investments are categorized as Level 1 under the Fair Value Hierarchy. The inputs or methodology used for valuing securities may not be an indication of the risk associated with investing in those securities. For more information on valuation inputs, please refer to the Investment Valuation section in the accompanying Notes to Financial Statements. |
See accompanying notes which are an integral part of the financial statements.
Annual Report
VIP FundsManager 60% Portfolio
Statement of Assets and Liabilities
| December 31, 2013 |
| | |
Assets | | |
Investment in securities, at value (cost $5,231,116,622) - See accompanying schedule | | $ 6,411,030,577 |
Receivable for investments sold | | 778,158 |
Receivable for fund shares sold | | 264,097 |
Total assets | | 6,412,072,832 |
| | |
Liabilities | | |
Payable for investments purchased | $ 31,257 | |
Payable for fund shares redeemed | 1,010,997 | |
Accrued management fee | 1,047,497 | |
Distribution and service plan fees payable | 45,095 | |
Total liabilities | | 2,134,846 |
| | |
Net Assets | | $ 6,409,937,986 |
Net Assets consist of: | | |
Paid in capital | | $ 5,122,796,225 |
Accumulated undistributed net realized gain (loss) on investments | | 107,227,806 |
Net unrealized appreciation (depreciation) on investments | | 1,179,913,955 |
Net Assets | | $ 6,409,937,986 |
Statement of Assets and Liabilities - continued
| December 31, 2013 |
| | |
Service Class:
Net Asset Value, offering price and redemption price per share ($75,426 ÷ 6,385 shares) | | $ 11.81 |
| | |
Service Class 2:
Net Asset Value, offering price and redemption price per share ($372,190,966 ÷ 31,564,337 shares) | | $ 11.79 |
| | |
Investor Class:
Net Asset Value, offering price and redemption price per share ($6,037,671,594 ÷ 511,274,480 shares) | | $ 11.81 |
See accompanying notes which are an integral part of the financial statements.
Annual Report
Statement of Operations
| Year ended December 31, 2013 |
| | |
Investment Income | | |
Income distributions from underlying funds | | $ 81,912,409 |
| | |
Expenses | | |
Management fee | $ 14,834,310 | |
Distribution and service plan fees | 769,608 | |
Independent trustees' compensation | 22,265 | |
Total expenses before reductions | 15,626,183 | |
Expense reductions | (3,281,115) | 12,345,068 |
Net investment income (loss) | | 69,567,341 |
Realized and Unrealized Gain (Loss) Realized gain (loss) on sale of underlying fund shares | 109,648,578 | |
Capital gain distributions from underlying funds | 176,552,372 | |
Total net realized gain (loss) | | 286,200,950 |
Change in net unrealized appreciation (depreciation) on underlying funds | | 658,777,682 |
Net gain (loss) | | 944,978,632 |
Net increase (decrease) in net assets resulting from operations | | $ 1,014,545,973 |
Statement of Changes in Net Assets
| Year ended
December 31,
2013 | Year ended
December 31,
2012 |
Increase (Decrease) in Net Assets | | |
Operations | | |
Net investment income (loss) | $ 69,567,341 | $ 77,428,023 |
Net realized gain (loss) | 286,200,950 | 100,321,779 |
Change in net unrealized appreciation (depreciation) | 658,777,682 | 354,606,172 |
Net increase (decrease) in net assets resulting
from operations | 1,014,545,973 | 532,355,974 |
Distributions to shareholders from net investment income | (69,509,916) | (77,244,951) |
Distributions to shareholders from net realized gain | (222,348,021) | (17,703,186) |
Total distributions | (291,857,937) | (94,948,137) |
Share transactions - net increase (decrease) | 157,204,419 | 952,857,500 |
Total increase (decrease) in net assets | 879,892,455 | 1,390,265,337 |
| | |
Net Assets | | |
Beginning of period | 5,530,045,531 | 4,139,780,194 |
End of period (including undistributed net investment income of $0 and undistributed net investment income of $183,073, respectively) | $ 6,409,937,986 | $ 5,530,045,531 |
See accompanying notes which are an integral part of the financial statements.
Annual Report
Financial Highlights - Service Class
Years ended December 31, | 2013 | 2012 | 2011 | 2010 | 2009 |
Selected Per-Share Data | | | | | |
Net asset value, beginning of period | $ 10.44 | $ 9.53 | $ 9.88 | $ 8.83 | $ 7.32 |
Income from Investment Operations | | | | | |
Net investment income (loss) C | .13 | .15 | .18 | .16 | .15 |
Net realized and unrealized gain (loss) | 1.80 | .94 | (.37) | 1.03 | 1.51 |
Total from investment operations | 1.93 | 1.09 | (.19) | 1.19 | 1.66 |
Distributions from net investment income | (.13) | (.15) | (.14) | (.12) | (.13) |
Distributions from net realized gain | (.43) | (.03) | (.02) | (.02) | (.01) |
Total distributions | (.56) | (.18) | (.16) | (.14) | (.15) F |
Net asset value, end of period | $ 11.81 | $ 10.44 | $ 9.53 | $ 9.88 | $ 8.83 |
Total Return A, B | 18.62% | 11.48% | (1.92)% | 13.49% | 22.61% |
Ratios to Average Net Assets D, E | | | | | |
Expenses before reductions | .35% | .35% | .35% | .35% | .35% |
Expenses net of fee waivers, if any | .20% | .20% | .20% | .20% | .20% |
Expenses net of all reductions | .20% | .20% | .20% | .20% | .20% |
Net investment income (loss) | 1.18% | 1.51% | 1.77% | 1.77% | 1.89% |
Supplemental Data | | | | | |
Net assets, end of period (000 omitted) | $ 75 | $ 66 | $ 58 | $ 60 | $ 52 |
Portfolio turnover rate D | 21% | 19% | 9% | 10% | 38% |
A Total returns do not reflect charges attributable to your insurance company's separate account. Inclusion of these charges would reduce the total returns shown.
B Total returns would have been lower if certain expenses had not been reduced during the applicable periods shown.
C Calculated based on average shares outstanding during the period.
D Amounts do not include the activity of the Underlying Funds.
E Expense ratios reflect operating expenses of the class. Expenses before reductions do not reflect amounts reimbursed by the investment adviser or reductions from expense offset arrangements and do not represent the amount paid by the class during periods when reimbursements or reductions occur. Expenses net of fee waivers reflect expenses after reimbursement by the investment adviser but prior to reductions from expense offset arrangements. Expenses net of all reductions represent the net expenses paid by the class but do not include expenses of the investment companies in which the Fund invests.
F Total distributions of $.15 per share is comprised of distributions from net investment income of $.134 and distributions from net realized gain of $.012 per share.
Financial Highlights - Service Class 2
Years ended December 31, | 2013 | 2012 | 2011 | 2010 | 2009 |
Selected Per-Share Data | | | | | |
Net asset value, beginning of period | $ 10.43 | $ 9.52 | $ 9.88 | $ 8.83 | $ 7.33 |
Income from Investment Operations | | | | | |
Net investment income (loss) C | .12 | .14 | .16 | .15 | .14 |
Net realized and unrealized gain (loss) | 1.78 | .94 | (.37) | 1.03 | 1.50 |
Total from investment operations | 1.90 | 1.08 | (.21) | 1.18 | 1.64 |
Distributions from net investment income | (.12) | (.14) | (.13) | (.11) | (.12) |
Distributions from net realized gain | (.43) | (.03) | (.02) | (.02) | (.01) |
Total distributions | (.54) G | (.17) | (.15) | (.13) | (.14) F |
Net asset value, end of period | $ 11.79 | $ 10.43 | $ 9.52 | $ 9.88 | $ 8.83 |
Total Return A, B | 18.39% | 11.35% | (2.08)% | 13.35% | 22.31% |
Ratios to Average Net Assets D, E | | | | | |
Expenses before reductions | .50% | .50% | .50% | .50% | .50% |
Expenses net of fee waivers, if any | .35% | .35% | .35% | .35% | .35% |
Expenses net of all reductions | .35% | .35% | .35% | .35% | .35% |
Net investment income (loss) | 1.03% | 1.36% | 1.62% | 1.62% | 1.74% |
Supplemental Data | | | | | |
Net assets, end of period (000 omitted) | $ 372,191 | $ 254,505 | $ 45,494 | $ 125 | $ 83 |
Portfolio turnover rate D | 21% | 19% | 9% | 10% | 38% |
A Total returns do not reflect charges attributable to your insurance company's separate account. Inclusion of these charges would reduce the total returns shown.
B Total returns would have been lower if certain expenses had not been reduced during the applicable periods shown.
C Calculated based on average shares outstanding during the period.
D Amounts do not include the activity of the Underlying Funds.
E Expense ratios reflect operating expenses of the class. Expenses before reductions do not reflect amounts reimbursed by the investment adviser or reductions from expense offset arrangements and do not represent the amount paid by the class during periods when reimbursements or reductions occur. Expenses net of fee waivers reflect expenses after reimbursement by the investment adviser but prior to reductions from expense offset arrangements. Expenses net of all reductions represent the net expenses paid by the class but do not include expenses of the investment companies in which the Fund invests.
F Total distributions of $.14 per share is comprised of distributions from net investment income of $.124 and distributions from net realized gain of $.012 per share.
G Total distributions of $.54 per share is comprised of distributions from net investment income of $.119 and distributions from net realized gain of $.425 per share.
See accompanying notes which are an integral part of the financial statements.
Annual Report
Financial Highlights - Investor Class
Years ended December 31, | 2013 | 2012 | 2011 | 2010 | 2009 |
Selected Per-Share Data | | | | | |
Net asset value, beginning of period | $ 10.44 | $ 9.52 | $ 9.88 | $ 8.82 | $ 7.32 |
Income from Investment Operations | | | | | |
Net investment income (loss) C | .13 | .15 | .17 | .16 | .15 |
Net realized and unrealized gain (loss) | 1.80 | .95 | (.37) | 1.04 | 1.50 |
Total from investment operations | 1.93 | 1.10 | (.20) | 1.20 | 1.65 |
Distributions from net investment income | (.13) | (.15) | (.14) | (.12) | (.13) |
Distributions from net realized gain | (.43) | (.03) | (.02) | (.02) | (.01) |
Total distributions | (.56) | (.18) | (.16) | (.14) | (.15) F |
Net asset value, end of period | $ 11.81 | $ 10.44 | $ 9.52 | $ 9.88 | $ 8.82 |
Total Return A, B | 18.62% | 11.60% | (2.02)% | 13.62% | 22.48% |
Ratios to Average Net Assets D, E | | | | | |
Expenses before reductions | .25% | .25% | .25% | .25% | .25% |
Expenses net of fee waivers, if any | .20% | .20% | .20% | .20% | .20% |
Expenses net of all reductions | .20% | .20% | .20% | .20% | .20% |
Net investment income (loss) | 1.18% | 1.51% | 1.77% | 1.77% | 1.89% |
Supplemental Data | | | | | |
Net assets, end of period (000 omitted) | $ 6,037,672 | $ 5,275,474 | $ 4,094,228 | $ 2,584,021 | $ 1,159,764 |
Portfolio turnover rate D | 21% | 19% | 9% | 10% | 38% |
A Total returns do not reflect charges attributable to your insurance company's separate account. Inclusion of these charges would reduce the total returns shown.
B Total returns would have been lower if certain expenses had not been reduced during the applicable periods shown.
C Calculated based on average shares outstanding during the period.
D Amounts do not include the activity of the Underlying Funds.
E Expense ratios reflect operating expenses of the class. Expenses before reductions do not reflect amounts reimbursed by the investment adviser or reductions from expense offset arrangements and do not represent the amount paid by the class during periods when reimbursements or reductions occur. Expenses net of fee waivers reflect expenses after reimbursement by the investment adviser but prior to reductions from expense offset arrangements. Expenses net of all reductions represent the net expenses paid by the class but do not include expenses of the investment companies in which the Fund invests.
F Total distributions of $.15 per share is comprised of distributions from net investment income of $.134 and distributions from net realized gain of $.012 per share.
See accompanying notes which are an integral part of the financial statements.
Annual Report
VIP FundsManager 70% Portfolio
Investment Changes (Unaudited)
The information in the following tables is based on the direct investments of the Fund. |
Fund Holdings as of December 31, 2013 |
| % of fund's
net assets | % of fund's net assets
6 months ago |
Domestic Equity Funds | | |
Fidelity Air Transportation Portfolio | 0.2 | 0.1 |
Fidelity Automotive Portfolio | 0.6 | 0.2 |
Fidelity Banking Portfolio | 2.7 | 2.4 |
Fidelity Biotechnology Portfolio | 0.2 | 1.4 |
Fidelity Blue Chip Growth Fund | 0.8 | 0.6 |
Fidelity Blue Chip Value Fund | 0.1 | 0.1 |
Fidelity Brokerage & Investment Management Portfolio | 1.7 | 1.3 |
Fidelity Capital Appreciation Fund | 0.1 | 0.3 |
Fidelity Chemicals Portfolio | 1.1 | 0.8 |
Fidelity Communications Equipment Portfolio | 0.1 | 0.1 |
Fidelity Computers Portfolio | 1.2 | 1.5 |
Fidelity Construction & Housing Portfolio | 0.5 | 1.2 |
Fidelity Consumer Discretionary Portfolio | 2.3 | 2.1 |
Fidelity Consumer Finance Portfolio | 0.2 | 0.3 |
Fidelity Consumer Staples Portfolio | 2.7 | 4.2 |
Fidelity Contrafund | 0.3 | 0.0* |
Fidelity Defense & Aerospace Portfolio | 0.5 | 0.1 |
Fidelity Disciplined Equity Fund | 0.7 | 0.0 |
Fidelity Dividend Growth Fund | 0.0* | 0.0* |
Fidelity Electronics Portfolio | 0.1 | 0.2 |
Fidelity Energy Portfolio | 1.6 | 3.2 |
Fidelity Energy Service Portfolio | 0.8 | 1.6 |
Fidelity Environmental & Alternative Energy Portfolio | 0.1 | 0.1 |
Fidelity Equity Dividend Income Fund | 0.0* | 0.0* |
Fidelity Equity-Income Fund | 1.7 | 0.0* |
Fidelity Financial Services Portfolio | 2.4 | 2.9 |
Fidelity Fund | 0.0* | 0.0* |
Fidelity Gold Portfolio | 0.0* | 0.1 |
Fidelity Growth & Income Portfolio | 0.7 | 0.7 |
Fidelity Growth Company Fund | 0.4 | 0.4 |
Fidelity Growth Discovery Fund | 0.0* | 0.0 |
Fidelity Health Care Portfolio | 3.3 | 1.7 |
Fidelity Independence Fund | 0.5 | 0.5 |
Fidelity Industrial Equipment Portfolio | 1.4 | 1.3 |
Fidelity Industrials Portfolio | 3.3 | 2.8 |
Fidelity Insurance Portfolio | 1.6 | 1.5 |
Fidelity IT Services Portfolio | 0.6 | 0.5 |
|
| % of fund's
net assets | % of fund's net assets
6 months ago |
Fidelity Large Cap Stock Fund | 0.9 | 0.5 |
Fidelity Large Cap Value Fund | 0.0* | 0.0* |
Fidelity Leisure Portfolio | 0.0* | 0.0* |
Fidelity Leveraged Company Stock Fund | 0.0* | 0.0* |
Fidelity Low-Priced Stock Fund | 0.5 | 0.0 |
Fidelity Magellan Fund | 0.0* | 0.0* |
Fidelity Materials Portfolio | 0.5 | 0.0* |
Fidelity Medical Delivery Portfolio | 0.0* | 0.2 |
Fidelity Medical Equipment & Systems Portfolio | 0.0* | 0.0* |
Fidelity Mega Cap Stock Fund | 2.1 | 1.1 |
Fidelity Mid Cap Value Fund | 0.2 | 0.2 |
Fidelity Mid-Cap Stock Fund | 0.1 | 0.0* |
Fidelity Multimedia Portfolio | 0.7 | 1.5 |
Fidelity Nasdaq Composite Index Fund | 0.3 | 0.3 |
Fidelity Natural Gas Portfolio | 0.0* | 0.0* |
Fidelity Natural Resources Portfolio | 0.0* | 0.0* |
Fidelity New Millennium Fund | 0.3 | 0.2 |
Fidelity OTC Portfolio | 0.6 | 1.7 |
Fidelity Pharmaceuticals Portfolio | 2.4 | 2.3 |
Fidelity Real Estate Investment Portfolio | 0.0* | 0.1 |
Fidelity Retailing Portfolio | 1.0 | 1.0 |
Fidelity Series Commodity Strategy Fund | 0.0* | 0.0* |
Fidelity Small Cap Discovery Fund | 0.4 | 0.1 |
Fidelity Small Cap Growth Fund | 0.0* | 0.0* |
Fidelity Small Cap Stock Fund | 0.0* | 0.0* |
Fidelity Small Cap Value Fund | 0.0* | 0.0* |
Fidelity Software & Computer Services Portfolio | 4.0 | 2.9 |
Fidelity Technology Portfolio | 1.3 | 2.7 |
Fidelity Telecom and Utilities Fund | 0.1 | 0.2 |
Fidelity Telecommunications Portfolio | 0.4 | 0.5 |
Fidelity Transportation Portfolio | 0.5 | 0.3 |
Fidelity Utilities Portfolio | 0.0* | 0.0* |
Fidelity Value Discovery Fund | 0.0* | 0.0* |
Fidelity Value Fund | 0.5 | 0.3 |
Spartan 500 Index Fund Investor Class | 0.0* | 0.0* |
Spartan Extended Market Index Fund Investor Class | 1.5 | 2.1 |
Spartan Total Market Index Fund Investor Class | 0.5 | 1.5 |
VIP Mid Cap Portfolio Investor Class | 0.0* | 0.1 |
| 53.3 | 54.0 |
Fund Holdings as of December 31, 2013 - continued |
| % of fund's
net assets | % of fund's net assets
6 months ago |
International Equity Funds | | |
Fidelity Canada Fund | 0.0* | 0.0* |
Fidelity China Region Fund | 0.0* | 0.0* |
Fidelity Diversified International Fund | 2.5 | 1.7 |
Fidelity Emerging Asia Fund | 0.4 | 0.7 |
Fidelity Emerging Markets Fund | 1.1 | 0.7 |
Fidelity Europe Capital Appreciation Fund | 0.1 | 0.1 |
Fidelity Europe Fund | 0.7 | 0.4 |
Fidelity International Capital Appreciation Fund | 0.7 | 0.7 |
Fidelity International Discovery Fund | 4.8 | 2.7 |
Fidelity International Growth Fund | 0.0* | 0.1 |
Fidelity International Real Estate Fund | 0.0* | 0.0* |
Fidelity International Small Cap Fund | 0.8 | 0.1 |
Fidelity International Small Cap Opportunities Fund | 0.3 | 0.4 |
Fidelity International Value Fund | 0.1 | 0.1 |
Fidelity Japan Fund | 0.0* | 0.0* |
Fidelity Japan Smaller Companies Fund | 0.8 | 0.4 |
Fidelity Nordic Fund | 0.9 | 0.8 |
Fidelity Overseas Fund | 0.3 | 0.3 |
Fidelity Pacific Basin Fund | 0.7 | 0.7 |
Spartan International Index Fund Investor Class | 8.5 | 8.8 |
| 22.7 | 18.7 |
Fixed-Income Funds | | |
Fidelity Floating Rate High Income Fund | 1.5 | 1.9 |
Fidelity Focused High Income Fund | 0.5 | 0.6 |
Fidelity High Income Fund | 1.0 | 0.4 |
Fidelity New Markets Income Fund | 0.2 | 0.4 |
Fidelity Real Estate Income Fund | 0.0* | 0.1 |
Spartan U.S. Bond Index Fund Investor Class | 19.2 | 19.7 |
| 22.4 | 23.1 |
Money Market Funds | | |
Fidelity Institutional Prime Money Market Portfolio Class I | 1.6 | 4.2 |
Net Other Assets (Liabilities)* | 0.0 | 0.0 |
| 100.0 | 100.0 |
* Amount represents less than 0.1%
Asset Allocation (% of fund's net assets) |
As of December 31, 2013 |
| Domestic Equity Funds | 53.3% | |
| International Equity Funds | 22.7% | |
| Fixed-Income Funds | 22.4% | |
| Money Market Funds | 1.6% | |

As of June 30, 2013 |
| Domestic Equity Funds | 54.0% | |
| International Equity Funds | 18.7% | |
| Fixed-Income Funds | 23.1% | |
| Money Market Funds | 4.2% | |

Annual Report
VIP FundsManager 70% Portfolio
Investments December 31, 2013
Showing Percentage of Net Assets
Equity Funds - 76.0% |
| Shares | | Value |
Domestic Equity Funds - 53.3% |
Fidelity Air Transportation Portfolio (c) | 25,695 | | $ 1,523,733 |
Fidelity Automotive Portfolio (c) | 89,261 | | 5,028,073 |
Fidelity Banking Portfolio (c) | 910,351 | | 23,823,886 |
Fidelity Biotechnology Portfolio (c) | 11,805 | | 2,145,330 |
Fidelity Blue Chip Growth Fund (c) | 113,430 | | 7,188,043 |
Fidelity Blue Chip Value Fund (c) | 38,706 | | 565,500 |
Fidelity Brokerage & Investment Management Portfolio (c) | 198,672 | | 14,751,425 |
Fidelity Capital Appreciation Fund (c) | 15,633 | | 565,609 |
Fidelity Chemicals Portfolio (c) | 68,764 | | 10,030,573 |
Fidelity Communications Equipment Portfolio (c) | 17,177 | | 506,736 |
Fidelity Computers Portfolio (c) | 144,025 | | 10,675,100 |
Fidelity Construction & Housing Portfolio (c) | 88,740 | | 4,838,113 |
Fidelity Consumer Discretionary Portfolio (c) | 604,189 | | 20,010,753 |
Fidelity Consumer Finance Portfolio (c) | 112,478 | | 1,840,136 |
Fidelity Consumer Staples Portfolio (c) | 262,734 | | 23,701,263 |
Fidelity Contrafund (c) | 23,487 | | 2,258,050 |
Fidelity Defense & Aerospace Portfolio (c) | 36,201 | | 4,429,512 |
Fidelity Disciplined Equity Fund (c) | 195,647 | | 6,323,302 |
Fidelity Dividend Growth Fund (c) | 424 | | 15,005 |
Fidelity Electronics Portfolio (c) | 21,268 | | 1,342,678 |
Fidelity Energy Portfolio (c) | 244,286 | | 13,706,915 |
Fidelity Energy Service Portfolio (c) | 81,350 | | 6,902,549 |
Fidelity Environmental & Alternative Energy Portfolio (c) | 23,715 | | 541,416 |
Fidelity Equity Dividend Income Fund (c) | 537 | | 13,231 |
Fidelity Equity-Income Fund (c) | 250,651 | | 14,713,236 |
Fidelity Financial Services Portfolio (c) | 252,707 | | 20,666,390 |
Fidelity Fund (c) | 539 | | 22,991 |
Fidelity Gold Portfolio (a)(c) | 4,361 | | 78,375 |
Fidelity Growth & Income Portfolio (c) | 228,225 | | 6,358,338 |
Fidelity Growth Company Fund (c) | 27,729 | | 3,324,123 |
Fidelity Growth Discovery Fund (c) | 14,038 | | 298,029 |
Fidelity Health Care Portfolio (c) | 152,586 | | 28,763,962 |
Fidelity Independence Fund (c) | 114,004 | | 4,130,364 |
Fidelity Industrial Equipment Portfolio (c) | 268,493 | | 12,302,351 |
Fidelity Industrials Portfolio (c) | 861,177 | | 28,995,845 |
Fidelity Insurance Portfolio (c) | 206,640 | | 14,171,347 |
Fidelity IT Services Portfolio (c) | 135,171 | | 5,059,451 |
Fidelity Large Cap Stock Fund (c) | 278,747 | | 7,590,283 |
Fidelity Large Cap Value Fund (c) | 6,646 | | 101,356 |
Fidelity Leisure Portfolio (c) | 2,179 | | 290,242 |
Fidelity Leveraged Company Stock Fund (c) | 974 | | 42,129 |
Fidelity Low-Priced Stock Fund (c) | 81,717 | | 4,041,728 |
Fidelity Magellan Fund (c) | 191 | | 17,616 |
Fidelity Materials Portfolio (c) | 57,078 | | 4,845,338 |
Fidelity Medical Delivery Portfolio (c) | 1,898 | | 138,469 |
Fidelity Medical Equipment & Systems Portfolio (c) | 9,373 | | 334,995 |
|
| Shares | | Value |
Fidelity Mega Cap Stock Fund (c) | 1,197,626 | | $ 18,467,388 |
Fidelity Mid Cap Value Fund (c) | 73,837 | | 1,668,712 |
Fidelity Mid-Cap Stock Fund (c) | 21,700 | | 857,362 |
Fidelity Multimedia Portfolio (c) | 74,215 | | 6,009,194 |
Fidelity Nasdaq Composite Index Fund (c) | 45,662 | | 2,516,407 |
Fidelity Natural Gas Portfolio (c) | 309 | | 11,686 |
Fidelity Natural Resources Portfolio (c) | 1,839 | | 67,875 |
Fidelity New Millennium Fund (c) | 71,700 | | 2,830,011 |
Fidelity OTC Portfolio (c) | 66,711 | | 5,162,774 |
Fidelity Pharmaceuticals Portfolio (c) | 1,084,369 | | 20,830,732 |
Fidelity Real Estate Investment Portfolio (c) | 818 | | 26,108 |
Fidelity Retailing Portfolio (c) | 96,521 | | 8,444,586 |
Fidelity Series Commodity Strategy Fund (a)(c) | 1,089 | | 8,628 |
Fidelity Small Cap Discovery Fund (c) | 99,875 | | 3,122,078 |
Fidelity Small Cap Growth Fund (c) | 13,706 | | 264,120 |
Fidelity Small Cap Stock Fund (c) | 548 | | 11,469 |
Fidelity Small Cap Value Fund (c) | 13,024 | | 260,995 |
Fidelity Software & Computer Services Portfolio (c) | 294,075 | | 34,894,923 |
Fidelity Technology Portfolio (c) | 93,535 | | 11,508,486 |
Fidelity Telecom and Utilities Fund (c) | 57,454 | | 1,264,558 |
Fidelity Telecommunications Portfolio (c) | 56,991 | | 3,447,415 |
Fidelity Transportation Portfolio (c) | 60,186 | | 4,444,738 |
Fidelity Utilities Portfolio (c) | 4,086 | | 272,154 |
Fidelity Value Discovery Fund (c) | 1,672 | | 36,416 |
Fidelity Value Fund (c) | 41,810 | | 4,330,632 |
Spartan 500 Index Fund Investor Class (c) | 332 | | 21,737 |
Spartan Extended Market Index Fund Investor Class (c) | 243,117 | | 12,987,300 |
Spartan Total Market Index Fund Investor Class (c) | 79,777 | | 4,317,514 |
VIP Mid Cap Portfolio Investor Class (c) | 664 | | 24,078 |
TOTAL DOMESTIC EQUITY FUNDS | | 467,123,965 |
International Equity Funds - 22.7% |
Fidelity Canada Fund (c) | 1,741 | | 101,542 |
Fidelity China Region Fund (c) | 6,306 | | 212,904 |
Fidelity Diversified International Fund (c) | 599,817 | | 22,139,254 |
Fidelity Emerging Asia Fund (c) | 125,464 | | 3,844,227 |
Fidelity Emerging Markets Fund (c) | 384,179 | | 9,254,861 |
Fidelity Europe Capital Appreciation Fund (c) | 37,107 | | 873,877 |
Fidelity Europe Fund (c) | 160,369 | | 6,236,767 |
Fidelity International Capital Appreciation Fund (c) | 347,827 | | 5,826,109 |
Fidelity International Discovery Fund (c) | 1,046,917 | | 42,400,130 |
Fidelity International Growth Fund (c) | 34,234 | | 384,792 |
Fidelity International Real Estate Fund (c) | 1,527 | | 15,530 |
Fidelity International Small Cap Fund (c) | 260,856 | | 6,988,341 |
Fidelity International Small Cap Opportunities Fund (c) | 215,605 | | 3,009,843 |
Equity Funds - continued |
| Shares | | Value |
International Equity Funds - continued |
Fidelity International Value Fund (c) | 67,591 | | $ 611,699 |
Fidelity Japan Fund (c) | 11,889 | | 143,142 |
Fidelity Japan Smaller Companies Fund (c) | 491,106 | | 6,600,466 |
Fidelity Nordic Fund (c) | 173,736 | | 7,779,901 |
Fidelity Overseas Fund (c) | 67,067 | | 2,700,100 |
Fidelity Pacific Basin Fund (c) | 205,882 | | 5,694,704 |
Spartan International Index Fund Investor Class (c) | 1,825,688 | | 74,250,749 |
TOTAL INTERNATIONAL EQUITY FUNDS | | 199,068,938 |
TOTAL EQUITY FUNDS (Cost $492,525,601) |
666,192,903
|
Fixed-Income Funds - 22.4% |
| | | |
Fidelity Floating Rate High Income Fund (c) | 1,308,276 | | 13,030,432 |
Fidelity Focused High Income Fund (c) | 472,364 | | 4,251,279 |
Fidelity High Income Fund (c) | 908,958 | | 8,516,936 |
Fidelity New Markets Income Fund (c) | 135,601 | | 2,114,017 |
|
| Shares | | Value |
Fidelity Real Estate Income Fund (c) | 3,891 | | $ 43,112 |
Spartan U.S. Bond Index Fund Investor Class (c) | 14,811,747 | | 168,261,451 |
TOTAL FIXED-INCOME FUNDS (Cost $191,744,308) |
196,217,227
|
Money Market Funds - 1.6% |
| | | |
Fidelity Institutional Prime Money Market Portfolio Class I 0.01% (b)(c)
(Cost $14,356,626) | 14,356,626 | |
14,356,626
|
TOTAL INVESTMENT PORTFOLIO - 100.0% (Cost $698,626,535) | 876,766,756 |
NET OTHER ASSETS (LIABILITIES) - 0.0% | | (143,146) |
NET ASSETS - 100% | $ 876,623,610 |
Legend |
(a) Non-income producing |
(b) The rate quoted is the annualized seven-day yield of the fund at period end. |
(c) Affiliated company |
Affiliated Underlying Funds |
Information regarding the Fund's fiscal year to date purchases and sales of the affiliated Underlying Funds and income earned by the Fund from investments in affiliated Underlying Funds is as follows: |
Affiliate | Value,
beginning of period | Purchases | Sales
Proceeds | Dividend
Income | Value,
end of
period |
Fidelity Air Transportation Portfolio | $ 675,958 | $ 859,723 | $ 340,000 | $ 1,328 | $ 1,523,733 |
Fidelity Automotive Portfolio | 907,720 | 3,408,364 | 68,249 | 13,060 | 5,028,073 |
Fidelity Banking Portfolio | 13,440,688 | 5,597,695 | 400,402 | 168,713 | 23,823,886 |
Fidelity Biotechnology Portfolio | 5,557,118 | 2,292,217 | 9,363,405 | - | 2,145,330 |
Fidelity Blue Chip Growth Fund | 304,660 | 10,425,718 | 4,000,000 | 20,667 | 7,188,043 |
Fidelity Blue Chip Value Fund | - | 493,389 | - | 3,389 | 565,500 |
Fidelity Brokerage & Investment Management Portfolio | 4,144,529 | 7,233,178 | - | 76,174 | 14,751,425 |
Fidelity Canada Fund | 92,274 | 964 | - | 412 | 101,542 |
Fidelity Capital Appreciation Fund | 1,968,524 | 51,557 | 1,900,000 | 2,039 | 565,609 |
Fidelity Chemicals Portfolio | 4,422,423 | 7,578,624 | 2,889,332 | 70,050 | 10,030,573 |
Fidelity China Region Fund | 1,555,776 | 2,064,023 | 3,400,000 | 2,155 | 212,904 |
Fidelity Commodity Strategy Fund | 9,582 | - | 9,059 | - | - |
Fidelity Communications Equipment Portfolio | 138,977 | 807,759 | 600,000 | 7,621 | 506,736 |
Fidelity Computers Portfolio | 10,678,340 | 1,059,492 | 3,170,835 | 76,306 | 10,675,100 |
Fidelity Construction & Housing Portfolio | 6,791,676 | 1,401,971 | 4,194,211 | 25,536 | 4,838,113 |
Fidelity Consumer Discretionary Portfolio | 10,901,594 | 5,940,232 | 521,242 | 18,130 | 20,010,753 |
Fidelity Consumer Finance Portfolio | 1,596,065 | 859,797 | 882,826 | 42,742 | 1,840,136 |
Fidelity Consumer Staples Portfolio | 28,892,441 | 4,250,912 | 13,031,747 | 432,136 | 23,701,263 |
Fidelity Contrafund | 80,441 | 2,283,989 | 80,000 | 2,349 | 2,258,050 |
Fidelity Defense & Aerospace Portfolio | 349,684 | 3,951,673 | - | 17,061 | 4,429,512 |
Fidelity Disciplined Equity Fund | - | 6,185,586 | - | 119,965 | 6,323,302 |
Fidelity Diversified International Fund | 11,559,191 | 18,570,335 | 11,328,116 | 168,708 | 22,139,254 |
Fidelity Dividend Growth Fund | 2,678,667 | 1,401 | 2,930,000 | 148 | 15,005 |
Fidelity Electronics Portfolio | 964,738 | 8,165 | - | 6,805 | 1,342,678 |
Fidelity Emerging Asia Fund | 8,930,847 | 877,471 | 5,679,325 | 47,507 | 3,844,227 |
Affiliate | Value,
beginning of period | Purchases | Sales
Proceeds | Dividend
Income | Value,
end of
period |
Fidelity Emerging Markets Fund | $ 4,234,010 | $ 4,900,980 | $ 43,269 | $ 7,307 | $ 9,254,861 |
Fidelity Energy Portfolio | 18,237,286 | 6,610,998 | 13,964,571 | 113,944 | 13,706,915 |
Fidelity Energy Service Portfolio | 7,707,235 | 9,790,714 | 12,833,653 | 28,667 | 6,902,549 |
Fidelity Environmental & Alternative Energy Portfolio | 401,083 | 4,075 | - | 4,075 | 541,416 |
Fidelity Equity Dividend Income Fund | 10,252 | 247 | - | 247 | 13,231 |
Fidelity Equity-Income Fund | 125,952 | 14,070,330 | 33,887 | 118,528 | 14,713,236 |
Fidelity Europe Capital Appreciation Fund | - | 763,364 | - | 13,364 | 873,877 |
Fidelity Europe Fund | - | 5,462,023 | - | 82,191 | 6,236,767 |
Fidelity Financial Services Portfolio | 14,782,747 | 3,866,660 | 3,400,000 | 189,222 | 20,666,390 |
Fidelity Floating Rate High Income Fund | 12,552,219 | 1,965,365 | 1,539,495 | 414,840 | 13,030,432 |
Fidelity Focused High Income Fund | 6,009,148 | 427,228 | 1,961,991 | 248,444 | 4,251,279 |
Fidelity Fund | 195,804 | 1,677 | 200,000 | 166 | 22,991 |
Fidelity Gold Portfolio | 2,742,004 | - | 1,510,999 | - | 78,375 |
Fidelity Growth & Income Portfolio | - | 5,882,286 | 167,780 | 77,191 | 6,358,338 |
Fidelity Growth Company Fund | 2,415,693 | 215,788 | - | 5,365 | 3,324,123 |
Fidelity Growth Discovery Fund | - | 276,537 | - | - | 298,029 |
Fidelity Health Care Portfolio | 7,383,173 | 18,476,945 | 567,199 | 3,316 | 28,763,962 |
Fidelity High Income Fund | 7,068,011 | 5,426,255 | 3,946,516 | 321,695 | 8,516,936 |
Fidelity Independence Fund | 2,560,651 | 1,552,501 | 1,000,000 | 12,501 | 4,130,364 |
Fidelity Industrial Equipment Portfolio | 7,059,265 | 3,609,073 | 393,039 | 79,806 | 12,302,351 |
Fidelity Industrials Portfolio | 14,545,894 | 9,151,336 | 361,706 | 161,802 | 28,995,845 |
Fidelity Institutional Prime Money Market Portfolio Class I | 8,889,231 | 23,031,390 | 17,563,995 | 2,818 | 14,356,626 |
Fidelity Insurance Portfolio | 8,566,839 | 2,732,945 | 25,706 | 114,715 | 14,171,347 |
Fidelity International Capital Appreciation Fund | 6,679,663 | 478,525 | 2,433,545 | 41,089 | 5,826,109 |
Fidelity International Discovery Fund | 14,062,707 | 24,529,963 | 1,098,161 | 475,510 | 42,400,130 |
Fidelity International Growth Fund | 314,950 | 2,009 | - | 1,703 | 384,792 |
Fidelity International Real Estate Fund | 215,567 | 780 | 220,000 | 270 | 15,530 |
Fidelity International Small Cap Fund | 175,188 | 6,362,436 | 148,723 | 23,821 | 6,988,341 |
Fidelity International Small Cap Opportunities Fund | 2,743,152 | 730,172 | 1,163,544 | 19,727 | 3,009,843 |
Fidelity International Value Fund | - | 563,252 | - | 13,000 | 611,699 |
Fidelity IT Services Portfolio | 3,217,286 | 260,486 | - | - | 5,059,451 |
Fidelity Japan Fund | 115,760 | 1,342 | - | 1,236 | 143,142 |
Fidelity Japan Smaller Companies Fund | 1,080,553 | 4,822,801 | 129,807 | 8,310 | 6,600,466 |
Fidelity Large Cap Stock Fund | 792,079 | 6,026,605 | 240,634 | 44,807 | 7,590,283 |
Fidelity Large Cap Value Fund | 76,646 | 1,551 | - | 1,243 | 101,356 |
Fidelity Leisure Portfolio | 204,793 | 20,025 | - | 2,087 | 290,242 |
Fidelity Leveraged Company Stock Fund | 31,181 | 264 | - | 264 | 42,129 |
Fidelity Low-Priced Stock Fund | - | 3,981,838 | - | 15,196 | 4,041,728 |
Fidelity Magellan Fund | 66,864 | 1,443 | 65,000 | 162 | 17,616 |
Fidelity Materials Portfolio | 64,881 | 4,637,425 | - | 23,350 | 4,845,338 |
Fidelity Medical Delivery Portfolio | 4,432,791 | 32,658 | 4,786,268 | - | 138,469 |
Fidelity Medical Equipment & Systems Portfolio | 147,294 | 149,920 | - | - | 334,995 |
Fidelity Mega Cap Stock Fund | 6,619,577 | 9,698,513 | 198,253 | 168,079 | 18,467,388 |
Fidelity Mid Cap Value Fund | 79,704 | 1,437,691 | - | 16,729 | 1,668,712 |
Fidelity Mid-Cap Stock Fund | 193,603 | 531,275 | - | 1,758 | 857,362 |
Fidelity Multimedia Portfolio | 8,515,421 | 998,439 | 6,806,377 | 13,502 | 6,009,194 |
Fidelity Nasdaq Composite Index Fund | 1,800,698 | 39,921 | - | 17,873 | 2,516,407 |
Fidelity Natural Gas Portfolio | 9,374 | 200 | - | 101 | 11,686 |
Fidelity Natural Resources Portfolio | 57,773 | 1,741 | - | 170 | 67,875 |
Fidelity New Markets Income Fund | 5,029,438 | 515,759 | 2,924,250 | 155,397 | 2,114,017 |
Fidelity New Millennium Fund | - | 2,525,832 | - | 12,417 | 2,830,011 |
Fidelity Nordic Fund | 5,109,539 | 761,785 | 141,004 | 135,606 | 7,779,901 |
Fidelity OTC Portfolio | - | 16,965,759 | 13,539,723 | 10,736 | 5,162,774 |
Fidelity Overseas Fund | 2,129,588 | 45,399 | - | 33,736 | 2,700,100 |
Fidelity Pacific Basin Fund | 4,468,791 | 736,586 | - | 32,429 | 5,694,704 |
Fidelity Pharmaceuticals Portfolio | 13,972,565 | 3,121,592 | 187,066 | 177,419 | 20,830,732 |
Fidelity Real Estate Income Fund | 1,076,273 | 44,370 | 1,080,000 | 32,993 | 43,112 |
Fidelity Real Estate Investment Portfolio | 2,484,489 | 878,162 | 3,469,910 | 16,252 | 26,108 |
Fidelity Retailing Portfolio | 5,465,149 | 611,086 | - | 11,704 | 8,444,586 |
Affiliate | Value,
beginning of period | Purchases | Sales
Proceeds | Dividend
Income | Value,
end of
period |
Fidelity Series Commodity Strategy Fund | $ - | $ 9,075 | $ - | $ - | $ 8,628 |
Fidelity Small Cap Discovery Fund | - | 2,829,184 | - | 2,606 | 3,122,078 |
Fidelity Small Cap Growth Fund | 182,748 | 39,358 | - | - | 264,120 |
Fidelity Small Cap Stock Fund | 150,004 | 10,175 | 165,000 | 173 | 11,469 |
Fidelity Small Cap Value Fund | 190,399 | 23,961 | - | 742 | 260,995 |
Fidelity Software & Computer Services Portfolio | 12,318,800 | 15,356,829 | 72,363 | - | 34,894,923 |
Fidelity Technology Portfolio | 20,685,786 | 1,873,675 | 14,726,005 | 11,132 | 11,508,486 |
Fidelity Telecom and Utilities Fund | 13,392,554 | 298,335 | 13,711,920 | 77,469 | 1,264,558 |
Fidelity Telecommunications Portfolio | 5,462,877 | 698,851 | 3,613,789 | 84,944 | 3,447,415 |
Fidelity Transportation Portfolio | 1,724,425 | 1,940,589 | 20,239 | 13,854 | 4,444,738 |
Fidelity Utilities Portfolio | 1,596,783 | 25,966 | 1,423,289 | 4,254 | 272,154 |
Fidelity Value Discovery Fund | 26,873 | 432 | - | 432 | 36,416 |
Fidelity Value Fund | 89,531 | 3,632,973 | - | 35,757 | 4,330,632 |
Spartan 500 Index Fund Investor Class | 8,889,236 | 37,471 | 10,000,000 | 37,471 | 21,737 |
Spartan Extended Market Index Fund Investor Class | 13,732,988 | 448,247 | 5,414,000 | 148,030 | 12,987,300 |
Spartan International Index Fund Investor Class | 62,082,508 | 5,234,370 | 4,549,807 | 1,721,997 | 74,250,749 |
Spartan Total Market Index Fund Investor Class | 13,554,256 | 113,249 | 12,275,000 | 113,249 | 4,317,514 |
Spartan U.S. Bond Index Fund Investor Class | 139,799,366 | 40,202,290 | 4,997,444 | 3,314,407 | 168,261,451 |
VIP Mid Cap Portfolio Investor Class | 617,037 | 9,653 | 730,000 | 95 | 24,078 |
Total | $ 628,057,918 | $ 368,725,240 | $ 234,633,676 | $ 10,398,493 | $ 876,766,756 |
Other Information |
All investments are categorized as Level 1 under the Fair Value Hierarchy. The inputs or methodology used for valuing securities may not be an indication of the risk associated with investing in those securities. For more information on valuation inputs, please refer to the Investment Valuation section in the accompanying Notes to Financial Statements. |
See accompanying notes which are an integral part of the financial statements.
Annual Report
VIP FundsManager 70% Portfolio
Statement of Assets and Liabilities
| December 31, 2013 |
| | |
Assets | | |
Investment in securities, at value (cost $698,626,535) - See accompanying schedule | | $ 876,766,756 |
Receivable for fund shares sold | | 405,491 |
Total assets | | 877,172,247 |
| | |
Liabilities | | |
Payable to custodian bank | $ 3 | |
Payable for investments purchased | 404,740 | |
Payable for fund shares redeemed | 750 | |
Accrued management fee | 142,320 | |
Distribution and service plan fees payable | 824 | |
Total liabilities | | 548,637 |
| | |
Net Assets | | $ 876,623,610 |
Net Assets consist of: | | |
Paid in capital | | $ 757,060,026 |
Accumulated undistributed net realized gain (loss) on investments | | (58,576,637) |
Net unrealized appreciation (depreciation) on investments | | 178,140,221 |
Net Assets | | $ 876,623,610 |
Statement of Assets and Liabilities - continued
| December 31, 2013 |
| | |
Service Class:
Net Asset Value, offering price and redemption price per share ($90,882 ÷ 7,567 shares) | | $ 12.01 |
| | |
Service Class 2:
Net Asset Value, offering price and redemption price per share ($6,751,593 ÷ 563,528 shares) | | $ 11.98 |
| | |
Investor Class:
Net Asset Value, offering price and redemption price per share ($869,781,135 ÷ 72,440,429 shares) | | $ 12.01 |
See accompanying notes which are an integral part of the financial statements.
Annual Report
Statement of Operations
| Year ended December 31, 2013 |
| | |
Investment Income | | |
Income distributions from underlying funds | | $ 10,398,493 |
| | |
Expenses | | |
Management fee | $ 1,864,160 | |
Distribution and service plan fees | 15,152 | |
Independent trustees' compensation | 2,756 | |
Total expenses before reductions | 1,882,068 | |
Expense reductions | (379,853) | 1,502,215 |
Net investment income (loss) | | 8,896,278 |
Realized and Unrealized Gain (Loss) Realized gain (loss) on sale of underlying fund shares | 35,305,742 | |
Capital gain distributions from underlying funds | 23,314,446 | |
Total net realized gain (loss) | | 58,620,188 |
Change in net unrealized appreciation (depreciation) on underlying funds | | 79,310,616 |
Net gain (loss) | | 137,930,804 |
Net increase (decrease) in net assets resulting from operations | | $ 146,827,082 |
Statement of Changes in Net Assets
| Year ended
December 31,
2013 | Year ended
December 31,
2012 |
Increase (Decrease) in Net Assets | | |
Operations | | |
Net investment income (loss) | $ 8,896,278 | $ 9,429,376 |
Net realized gain (loss) | 58,620,188 | 16,968,418 |
Change in net unrealized appreciation (depreciation) | 79,310,616 | 46,266,297 |
Net increase (decrease) in net assets resulting
from operations | 146,827,082 | 72,664,091 |
Distributions to shareholders from net investment income | (8,894,045) | (9,395,457) |
Distributions to shareholders from net realized gain | (6,389,993) | (1,782,056) |
Total distributions | (15,284,038) | (11,177,513) |
Share transactions - net increase (decrease) | 117,126,900 | 8,640,522 |
Total increase (decrease) in net assets | 248,669,944 | 70,127,100 |
| | |
Net Assets | | |
Beginning of period | 627,953,666 | 557,826,566 |
End of period | $ 876,623,610 | $ 627,953,666 |
See accompanying notes which are an integral part of the financial statements.
Annual Report
Financial Highlights - Service Class
Years ended December 31, | 2013 | 2012 | 2011 | 2010 | 2009 |
Selected Per-Share Data | | | | | |
Net asset value, beginning of period | $ 10.04 | $ 9.04 | $ 9.48 | $ 8.42 | $ 6.87 |
Income from Investment Operations | | | | | |
Net investment income (loss) C | .13 | .15 | .15 | .13 | .13 |
Net realized and unrealized gain (loss) | 2.05 | 1.03 | (.41) | 1.08 | 1.55 |
Total from investment operations | 2.18 | 1.18 | (.26) | 1.21 | 1.68 |
Distributions from net investment income | (.12) | (.15) | (.15) | (.13) | (.12) |
Distributions from net realized gain | (.09) | (.03) | (.02) | (.02) | (.01) |
Total distributions | (.21) | (.18) | (.18) F | (.15) | (.13) |
Net asset value, end of period | $ 12.01 | $ 10.04 | $ 9.04 | $ 9.48 | $ 8.42 |
Total Return A, B | 21.75% | 13.10% | (2.79)% | 14.32% | 24.44% |
Ratios to Average Net Assets D, E | | | | | |
Expenses before reductions | .35% | .35% | .35% | .35% | .35% |
Expenses net of fee waivers, if any | .20% | .20% | .20% | .20% | .20% |
Expenses net of all reductions | .20% | .20% | .20% | .20% | .20% |
Net investment income (loss) | 1.19% | 1.57% | 1.60% | 1.49% | 1.73% |
Supplemental Data | | | | | |
Net assets, end of period (000 omitted) | $ 91 | $ 77 | $ 63 | $ 67 | $ 68 |
Portfolio turnover rate D | 31% | 24% | 16% | 22% | 55% |
A Total returns do not reflect charges attributable to your insurance company's separate account. Inclusion of these charges would reduce the total returns shown.
B Total returns would have been lower if certain expenses had not been reduced during the applicable periods shown.
C Calculated based on average shares outstanding during the period.
D Amounts do not include the activity of the Underlying Funds.
E Expense ratios reflect operating expenses of the class. Expenses before reductions do not reflect amounts reimbursed by the investment adviser or reductions from expense offset arrangements and do not represent the amount paid by the class during periods when reimbursements or reductions occur. Expenses net of fee waivers reflect expenses after reimbursement by the investment adviser but prior to reductions from expense offset arrangements. Expenses net of all reductions represent the net expenses paid by the class but do not include expenses of the investment companies in which the Fund invests.
F Total distributions of $.18 per share is comprised of distributions from net investment income of $.151 and distributions from net realized gain of $.024 per share.
Financial Highlights - Service Class 2
Years ended December 31, | 2013 | 2012 | 2011 | 2010 | 2009 |
Selected Per-Share Data | | | | | |
Net asset value, beginning of period | $ 10.02 | $ 9.02 | $ 9.46 | $ 8.41 | $ 6.86 |
Income from Investment Operations | | | | | |
Net investment income (loss) C | .12 | .14 | .14 | .12 | .12 |
Net realized and unrealized gain (loss) | 2.04 | 1.03 | (.42) | 1.07 | 1.55 |
Total from investment operations | 2.16 | 1.17 | (.28) | 1.19 | 1.67 |
Distributions from net investment income | (.11) | (.14) | (.14) | (.12) | (.11) |
Distributions from net realized gain | (.09) | (.03) | (.02) | (.02) | (.01) |
Total distributions | (.20) | (.17) | (.16) | (.14) | (.12) |
Net asset value, end of period | $ 11.98 | $ 10.02 | $ 9.02 | $ 9.46 | $ 8.41 |
Total Return A, B | 21.54% | 12.98% | (2.94)% | 14.09% | 24.38% |
Ratios to Average Net Assets D, E | | | | | |
Expenses before reductions | .50% | .50% | .50% | .50% | .50% |
Expenses net of fee waivers, if any | .35% | .35% | .35% | .35% | .35% |
Expenses net of all reductions | .35% | .35% | .35% | .35% | .35% |
Net investment income (loss) | 1.04% | 1.42% | 1.45% | 1.34% | 1.58% |
Supplemental Data | | | | | |
Net assets, end of period (000 omitted) | $ 6,752 | $ 5,035 | $ 3,675 | $ 2,586 | $ 1,464 |
Portfolio turnover rate D | 31% | 24% | 16% | 22% | 55% |
A Total returns do not reflect charges attributable to your insurance company's separate account. Inclusion of these charges would reduce the total returns shown.
B Total returns would have been lower if certain expenses had not been reduced during the applicable periods shown.
C Calculated based on average shares outstanding during the period.
D Amounts do not include the activity of the Underlying Funds.
E Expense ratios reflect operating expenses of the class. Expenses before reductions do not reflect amounts reimbursed by the investment adviser or reductions from expense offset arrangements and do not represent the amount paid by the class during periods when reimbursements or reductions occur. Expenses net of fee waivers reflect expenses after reimbursement by the investment adviser but prior to reductions from expense offset arrangements. Expenses net of all reductions represent the net expenses paid by the class but do not include expenses of the investment companies in which the Fund invests.
See accompanying notes which are an integral part of the financial statements.
Annual Report
Financial Highlights - Investor Class
Years ended December 31, | 2013 | 2012 | 2011 | 2010 | 2009 |
Selected Per-Share Data | | | | | |
Net asset value, beginning of period | $ 10.04 | $ 9.03 | $ 9.48 | $ 8.42 | $ 6.87 |
Income from Investment Operations | | | | | |
Net investment income (loss) C | .13 | .15 | .15 | .13 | .13 |
Net realized and unrealized gain (loss) | 2.05 | 1.04 | (.42) | 1.08 | 1.55 |
Total from investment operations | 2.18 | 1.19 | (.27) | 1.21 | 1.68 |
Distributions from net investment income | (.12) | (.15) | (.15) | (.13) | (.12) |
Distributions from net realized gain | (.09) | (.03) | (.02) | (.02) | (.01) |
Total distributions | (.21) | (.18) | (.18) F | (.15) | (.13) |
Net asset value, end of period | $ 12.01 | $ 10.04 | $ 9.03 | $ 9.48 | $ 8.42 |
Total Return A, B | 21.75% | 13.22% | (2.90)% | 14.32% | 24.44% |
Ratios to Average Net Assets D, E | | | | | |
Expenses before reductions | .25% | .25% | .25% | .25% | .25% |
Expenses net of fee waivers, if any | .20% | .20% | .20% | .20% | .20% |
Expenses net of all reductions | .20% | .20% | .20% | .20% | .20% |
Net investment income (loss) | 1.19% | 1.57% | 1.60% | 1.49% | 1.73% |
Supplemental Data | | | | | |
Net assets, end of period (000 omitted) | $ 869,781 | $ 622,842 | $ 554,088 | $ 536,918 | $ 445,681 |
Portfolio turnover rate D | 31% | 24% | 16% | 22% | 55% |
A Total returns do not reflect charges attributable to your insurance company's separate account. Inclusion of these charges would reduce the total returns shown.
B Total returns would have been lower if certain expenses had not been reduced during the applicable periods shown.
C Calculated based on average shares outstanding during the period.
D Amounts do not include the activity of the Underlying Funds.
E Expense ratios reflect operating expenses of the class. Expenses before reductions do not reflect amounts reimbursed by the investment adviser or reductions from expense offset arrangements and do not represent the amount paid by the class during periods when reimbursements or reductions occur. Expenses net of fee waivers reflect expenses after reimbursement by the investment adviser but prior to reductions from expense offset arrangements. Expenses net of all reductions represent the net expenses paid by the class but do not include expenses of the investment companies in which the Fund invests.
F Total distributions of $.18 per share is comprised of distributions from net investment income of $.151 and distributions from net realized gain of $.024 per share.
See accompanying notes which are an integral part of the financial statements.
Annual Report
VIP FundsManager 85% Portfolio
Investment Changes (Unaudited)
The information in the following tables is based on the direct investments of the Fund. |
Fund Holdings as of December 31, 2013 |
| % of fund's
net assets | % of fund's net assets
6 months ago |
Domestic Equity Funds | | |
Fidelity Air Transportation Portfolio | 0.5 | 0.2 |
Fidelity Automotive Portfolio | 0.4 | 0.5 |
Fidelity Banking Portfolio | 2.3 | 2.3 |
Fidelity Biotechnology Portfolio | 0.5 | 2.1 |
Fidelity Blue Chip Growth Fund | 0.4 | 0.2 |
Fidelity Brokerage & Investment Management Portfolio | 2.8 | 3.5 |
Fidelity Capital Appreciation Fund | 0.2 | 0.2 |
Fidelity Chemicals Portfolio | 0.9 | 1.2 |
Fidelity Communications Equipment Portfolio | 0.0* | 0.4 |
Fidelity Computers Portfolio | 1.7 | 2.3 |
Fidelity Construction & Housing Portfolio | 0.3 | 1.7 |
Fidelity Consumer Discretionary Portfolio | 4.1 | 2.8 |
Fidelity Consumer Finance Portfolio | 0.7 | 0.8 |
Fidelity Consumer Staples Portfolio | 4.1 | 4.6 |
Fidelity Contrafund | 0.2 | 0.0* |
Fidelity Defense & Aerospace Portfolio | 0.8 | 0.2 |
Fidelity Disciplined Equity Fund | 1.3 | 0.0 |
Fidelity Dividend Growth Fund | 0.0* | 0.0* |
Fidelity Electronics Portfolio | 0.7 | 0.7 |
Fidelity Energy Portfolio | 2.5 | 3.6 |
Fidelity Energy Service Portfolio | 1.4 | 2.4 |
Fidelity Environmental & Alternative Energy Portfolio | 0.0* | 0.0* |
Fidelity Equity Dividend Income Fund | 0.0* | 0.0* |
Fidelity Equity-Income Fund | 0.4 | 0.0* |
Fidelity Financial Services Portfolio | 1.0 | 1.7 |
Fidelity Global Commodity Stock Fund | 0.0* | 0.0* |
Fidelity Gold Portfolio | 0.0* | 0.0* |
Fidelity Growth & Income Portfolio | 0.2 | 0.5 |
Fidelity Growth Company Fund | 0.1 | 0.1 |
Fidelity Growth Discovery Fund | 0.1 | 0.0 |
Fidelity Health Care Portfolio | 6.0 | 4.9 |
Fidelity Independence Fund | 0.1 | 0.1 |
Fidelity Industrial Equipment Portfolio | 1.4 | 1.3 |
Fidelity Industrials Portfolio | 6.8 | 5.4 |
Fidelity Insurance Portfolio | 3.2 | 3.5 |
Fidelity IT Services Portfolio | 1.8 | 1.8 |
Fidelity Large Cap Stock Fund | 1.6 | 0.3 |
|
| % of fund's
net assets | % of fund's net assets
6 months ago |
Fidelity Large Cap Value Fund | 0.1 | 0.1 |
Fidelity Leisure Portfolio | 0.0* | 0.0* |
Fidelity Leveraged Company Stock Fund | 0.0* | 0.1 |
Fidelity Low-Priced Stock Fund | 0.5 | 0.0 |
Fidelity Magellan Fund | 0.0* | 0.0* |
Fidelity Materials Portfolio | 0.1 | 0.0* |
Fidelity Medical Delivery Portfolio | 0.1 | 0.1 |
Fidelity Medical Equipment & Systems Portfolio | 0.1 | 0.0* |
Fidelity Mega Cap Stock Fund | 1.1 | 0.8 |
Fidelity Mid Cap Value Fund | 0.0* | 0.0* |
Fidelity Mid-Cap Stock Fund | 0.2 | 0.0* |
Fidelity Multimedia Portfolio | 0.7 | 2.3 |
Fidelity Nasdaq Composite Index Fund | 0.0* | 0.0* |
Fidelity Natural Gas Portfolio | 0.0* | 0.1 |
Fidelity Natural Resources Portfolio | 0.0* | 0.2 |
Fidelity New Millennium Fund | 0.9 | 0.1 |
Fidelity OTC Portfolio | 0.6 | 1.3 |
Fidelity Pharmaceuticals Portfolio | 0.7 | 0.8 |
Fidelity Real Estate Investment Portfolio | 0.0* | 0.0* |
Fidelity Retailing Portfolio | 1.0 | 1.1 |
Fidelity Series Commodity Strategy Fund | 0.0* | 0.0* |
Fidelity Small Cap Discovery Fund | 0.4 | 0.2 |
Fidelity Small Cap Growth Fund | 0.0* | 0.0* |
Fidelity Small Cap Stock Fund | 0.0* | 0.0* |
Fidelity Small Cap Value Fund | 0.7 | 0.1 |
Fidelity Software & Computer Services Portfolio | 4.5 | 4.3 |
Fidelity Technology Portfolio | 1.1 | 2.4 |
Fidelity Telecom and Utilities Fund | 0.0* | 0.5 |
Fidelity Telecommunications Portfolio | 0.3 | 0.7 |
Fidelity Transportation Portfolio | 0.7 | 0.1 |
Fidelity Utilities Portfolio | 0.0* | 0.0* |
Fidelity Value Discovery Fund | 0.0* | 0.0* |
Fidelity Value Fund | 0.1 | 0.1 |
Fidelity Value Strategies Fund | 0.0* | 0.5 |
Spartan 500 Index Fund Investor Class | 0.0* | 0.1 |
Spartan Extended Market Index Fund Investor Class | 0.0* | 0.0* |
Spartan Total Market Index Fund Investor Class | 0.0* | 0.0* |
VIP Energy Portfolio Investor Class | 0.1 | 0.1 |
VIP Mid Cap Portfolio Investor Class | 0.0* | 0.0* |
| 62.5 | 65.4 |
Fund Holdings as of December 31, 2013 - continued |
| % of fund's
net assets | % of fund's net assets
6 months ago |
International Equity Funds | | |
Fidelity Canada Fund | 0.0* | 0.0* |
Fidelity China Region Fund | 0.1 | 0.1 |
Fidelity Diversified International Fund | 5.3 | 3.5 |
Fidelity Emerging Asia Fund | 0.5 | 0.8 |
Fidelity Emerging Europe, Middle East, Africa (EMEA) Fund | 0.1 | 0.1 |
Fidelity Emerging Markets Fund | 0.9 | 0.4 |
Fidelity Europe Capital Appreciation Fund | 0.0* | 0.0 |
Fidelity Europe Fund | 3.3 | 0.4 |
Fidelity International Capital Appreciation Fund | 0.2 | 0.3 |
Fidelity International Discovery Fund | 5.8 | 4.3 |
Fidelity International Real Estate Fund | 0.0* | 0.1 |
Fidelity International Small Cap Fund | 1.0 | 0.1 |
Fidelity International Small Cap Opportunities Fund | 0.4 | 0.6 |
Fidelity International Value Fund | 0.1 | 0.0* |
Fidelity Japan Fund | 0.0* | 0.0* |
Fidelity Japan Smaller Companies Fund | 1.0 | 0.6 |
Fidelity Nordic Fund | 0.9 | 0.0 |
Fidelity Overseas Fund | 0.0* | 0.0* |
Fidelity Pacific Basin Fund | 0.2 | 0.7 |
Spartan International Index Fund Investor Class | 7.3 | 9.2 |
| 27.1 | 21.2 |
Fixed-Income Funds | | |
Fidelity Floating Rate High Income Fund | 0.0* | 0.0* |
Fidelity Focused High Income Fund | 0.2 | 0.3 |
Fidelity High Income Fund | 1.3 | 0.8 |
Fidelity New Markets Income Fund | 0.2 | 0.2 |
Fidelity Real Estate Income Fund | 0.0* | 0.0* |
Spartan U.S. Bond Index Fund Investor Class | 8.7 | 10.9 |
| 10.4 | 12.2 |
Money Market Funds | | |
Fidelity Institutional Prime Money Market Portfolio Class I | 0.0* | 1.2 |
Net Other Assets (Liabilities)* | 0.0 | 0.0 |
| 100.0 | 100.0 |
* Amount represents less than 0.1%
Asset Allocation (% of fund's net assets) |
As of December 31, 2013 |
| Domestic Equity Funds | 62.5% | |
| International Equity Funds | 27.1% | |
| Fixed-Income Funds | 10.4% | |
| Money Market Funds | 0.0%* | |

As of June 30, 2013 |
| Domestic Equity Funds | 65.4% | |
| International Equity Funds | 21.2% | |
| Fixed-Income Funds | 12.2% | |
| Money Market Funds | 1.2% | |

Annual Report
VIP FundsManager 85% Portfolio
Investments December 31, 2013
Showing Percentage of Net Assets
Equity Funds - 89.6% |
| Shares | | Value |
Domestic Equity Funds - 62.5% |
Fidelity Air Transportation Portfolio (c) | 29,074 | | $ 1,724,077 |
Fidelity Automotive Portfolio (c) | 25,865 | | 1,456,984 |
Fidelity Banking Portfolio (c) | 294,297 | | 7,701,740 |
Fidelity Biotechnology Portfolio (c) | 8,128 | | 1,477,080 |
Fidelity Blue Chip Growth Fund (c) | 18,874 | | 1,196,064 |
Fidelity Brokerage & Investment Management Portfolio (c) | 127,182 | | 9,443,261 |
Fidelity Capital Appreciation Fund (c) | 13,651 | | 493,910 |
Fidelity Chemicals Portfolio (c) | 21,188 | | 3,090,753 |
Fidelity Communications Equipment Portfolio (c) | 2,480 | | 73,151 |
Fidelity Computers Portfolio (c) | 73,986 | | 5,483,866 |
Fidelity Construction & Housing Portfolio (c) | 15,891 | | 866,394 |
Fidelity Consumer Discretionary Portfolio (c) | 411,004 | | 13,612,436 |
Fidelity Consumer Finance Portfolio (c) | 133,999 | | 2,192,220 |
Fidelity Consumer Staples Portfolio (c) | 149,979 | | 13,529,608 |
Fidelity Contrafund (c) | 5,207 | | 500,621 |
Fidelity Defense & Aerospace Portfolio (c) | 20,246 | | 2,477,250 |
Fidelity Disciplined Equity Fund (c) | 134,787 | | 4,356,302 |
Fidelity Dividend Growth Fund (c) | 223 | | 7,876 |
Fidelity Electronics Portfolio (c) | 34,863 | | 2,200,902 |
Fidelity Energy Portfolio (c) | 145,163 | | 8,145,068 |
Fidelity Energy Service Portfolio (c) | 55,081 | | 4,673,665 |
Fidelity Environmental & Alternative Energy Portfolio (c) | 4,215 | | 96,235 |
Fidelity Equity Dividend Income Fund (c) | 1,282 | | 31,584 |
Fidelity Equity-Income Fund (c) | 22,237 | | 1,305,301 |
Fidelity Financial Services Portfolio (c) | 38,873 | | 3,179,016 |
Fidelity Global Commodity Stock Fund (c) | 1,829 | | 25,848 |
Fidelity Gold Portfolio (a)(c) | 357 | | 6,413 |
Fidelity Growth & Income Portfolio (c) | 22,660 | | 631,295 |
Fidelity Growth Company Fund (c) | 2,798 | | 335,476 |
Fidelity Growth Discovery Fund (c) | 20,702 | | 439,496 |
Fidelity Health Care Portfolio (c) | 106,475 | | 20,071,686 |
Fidelity Independence Fund (c) | 8,140 | | 294,914 |
Fidelity Industrial Equipment Portfolio (c) | 101,078 | | 4,631,391 |
Fidelity Industrials Portfolio (c) | 670,001 | | 22,558,946 |
Fidelity Insurance Portfolio (c) | 155,877 | | 10,690,013 |
Fidelity IT Services Portfolio (c) | 163,732 | | 6,128,504 |
Fidelity Large Cap Stock Fund (c) | 191,038 | | 5,201,963 |
Fidelity Large Cap Value Fund (c) | 9,603 | | 146,444 |
Fidelity Leisure Portfolio (c) | 923 | | 122,863 |
Fidelity Leveraged Company Stock Fund (c) | 3,137 | | 135,656 |
Fidelity Low-Priced Stock Fund (c) | 32,040 | | 1,584,712 |
Fidelity Magellan Fund (c) | 132 | | 12,151 |
Fidelity Materials Portfolio (c) | 5,541 | | 470,363 |
Fidelity Medical Delivery Portfolio (c) | 2,660 | | 194,028 |
Fidelity Medical Equipment & Systems Portfolio (c) | 4,529 | | 161,851 |
Fidelity Mega Cap Stock Fund (c) | 232,927 | | 3,591,727 |
|
| Shares | | Value |
Fidelity Mid Cap Value Fund (c) | 5,029 | | $ 113,645 |
Fidelity Mid-Cap Stock Fund (c) | 18,820 | | 743,597 |
Fidelity Multimedia Portfolio (c) | 29,346 | | 2,376,137 |
Fidelity Nasdaq Composite Index Fund (c) | 918 | | 50,601 |
Fidelity Natural Gas Portfolio (c) | 941 | | 35,547 |
Fidelity Natural Resources Portfolio (c) | 2,403 | | 88,688 |
Fidelity New Millennium Fund (c) | 75,690 | | 2,987,493 |
Fidelity OTC Portfolio (c) | 26,126 | | 2,021,928 |
Fidelity Pharmaceuticals Portfolio (c) | 123,928 | | 2,380,658 |
Fidelity Real Estate Investment Portfolio (c) | 892 | | 28,478 |
Fidelity Retailing Portfolio (c) | 39,182 | | 3,428,010 |
Fidelity Series Commodity Strategy Fund (a)(c) | 1,089 | | 8,628 |
Fidelity Small Cap Discovery Fund (c) | 47,210 | | 1,475,771 |
Fidelity Small Cap Growth Fund (c) | 2,762 | | 53,219 |
Fidelity Small Cap Stock Fund (c) | 3,907 | | 81,818 |
Fidelity Small Cap Value Fund (c) | 121,271 | | 2,430,280 |
Fidelity Software & Computer Services Portfolio (c) | 125,337 | | 14,872,498 |
Fidelity Technology Portfolio (c) | 28,974 | | 3,564,904 |
Fidelity Telecom and Utilities Fund (c) | 4,735 | | 104,218 |
Fidelity Telecommunications Portfolio (c) | 17,135 | | 1,036,511 |
Fidelity Transportation Portfolio (c) | 29,255 | | 2,160,489 |
Fidelity Utilities Portfolio (c) | 995 | | 66,267 |
Fidelity Value Discovery Fund (c) | 606 | | 13,203 |
Fidelity Value Fund (c) | 2,083 | | 215,727 |
Fidelity Value Strategies Fund (c) | 275 | | 11,253 |
Spartan 500 Index Fund Investor Class (c) | 214 | | 13,984 |
Spartan Extended Market Index Fund Investor Class (c) | 205 | | 10,973 |
Spartan Total Market Index Fund Investor Class (c) | 1,286 | | 69,598 |
VIP Energy Portfolio Investor Class (c) | 17,103 | | 408,751 |
VIP Mid Cap Portfolio Investor Class (c) | 382 | | 13,852 |
TOTAL DOMESTIC EQUITY FUNDS | | 207,617,830 |
International Equity Funds - 27.1% |
Fidelity Canada Fund (c) | 583 | | 34,007 |
Fidelity China Region Fund (c) | 11,181 | | 377,484 |
Fidelity Diversified International Fund (c) | 480,575 | | 17,738,041 |
Fidelity Emerging Asia Fund (c) | 50,314 | | 1,541,612 |
Fidelity Emerging Europe, Middle East, Africa (EMEA) Fund (c) | 38,811 | | 356,673 |
Fidelity Emerging Markets Fund (c) | 129,014 | | 3,107,945 |
Fidelity Europe Capital Appreciation Fund (c) | 242 | | 5,696 |
Fidelity Europe Fund (c) | 284,981 | | 11,082,898 |
Fidelity International Capital Appreciation Fund (c) | 43,205 | | 723,688 |
Fidelity International Discovery Fund (c) | 476,744 | | 19,308,143 |
Fidelity International Real Estate Fund (c) | 1,392 | | 14,153 |
Fidelity International Small Cap Fund (c) | 124,673 | | 3,339,998 |
Equity Funds - continued |
| Shares | | Value |
International Equity Funds - continued |
Fidelity International Small Cap Opportunities Fund (c) | 87,235 | | $ 1,217,801 |
Fidelity International Value Fund (c) | 15,668 | | 141,796 |
Fidelity Japan Fund (c) | 8,892 | | 107,065 |
Fidelity Japan Smaller Companies Fund (c) | 255,079 | | 3,428,255 |
Fidelity Nordic Fund (c) | 65,864 | | 2,949,407 |
Fidelity Overseas Fund (c) | 351 | | 14,120 |
Fidelity Pacific Basin Fund (c) | 19,618 | | 542,636 |
Spartan International Index Fund Investor Class (c) | 595,491 | | 24,218,616 |
TOTAL INTERNATIONAL EQUITY FUNDS | | 90,250,034 |
TOTAL EQUITY FUNDS (Cost $228,563,939) |
297,867,864
|
Fixed-Income Funds - 10.4% |
| | | |
Fidelity Floating Rate High Income Fund (c) | 791 | | 7,874 |
Fidelity Focused High Income Fund (c) | 69,531 | | 625,783 |
Fidelity High Income Fund (c) | 473,981 | | 4,441,205 |
Fidelity New Markets Income Fund (c) | 36,912 | | 575,464 |
|
| Shares | | Value |
Fidelity Real Estate Income Fund (c) | 1,148 | | $ 12,724 |
Spartan U.S. Bond Index Fund Investor Class (c) | 2,542,413 | | 28,881,813 |
TOTAL FIXED-INCOME FUNDS (Cost $33,811,984) |
34,544,863
|
Money Market Funds - 0.0% |
| | | |
Fidelity Institutional Prime Money Market Portfolio Class I 0.01% (b)(c)
(Cost $772) | 772 | |
772
|
TOTAL INVESTMENT PORTFOLIO - 100.0% (Cost $262,376,695) | | 332,413,499 |
NET OTHER ASSETS (LIABILITIES) - 0.0% | | (53,978) |
NET ASSETS - 100% | $ 332,359,521 |
Legend |
(a) Non-income producing |
(b) The rate quoted is the annualized seven-day yield of the fund at period end. |
(c) Affiliated company |
Affiliated Underlying Funds |
Information regarding the Fund's fiscal year to date purchases and sales of the affiliated Underlying Funds and income earned by the Fund from investments in affiliated Underlying Funds is as follows: |
Affiliate | Value,
beginning of period | Purchases | Sales
Proceeds | Dividend
Income | Value,
end of
period |
Fidelity Air Transportation Portfolio | $ 292,060 | $ 1,239,272 | $ - | $ 1,189 | $ 1,724,077 |
Fidelity Automotive Portfolio | 515,555 | 1,312,469 | 729,309 | 3,768 | 1,456,984 |
Fidelity Banking Portfolio | 10,655,387 | 1,382,707 | 6,552,900 | 61,039 | 7,701,740 |
Fidelity Biotechnology Portfolio | 3,540,020 | 575,170 | 4,751,978 | - | 1,477,080 |
Fidelity Blue Chip Growth Fund | 102,879 | 1,720,857 | 700,000 | 2,406 | 1,196,064 |
Fidelity Brokerage & Investment Management Portfolio | 2,809,716 | 5,834,325 | 1,600,000 | 49,075 | 9,443,261 |
Fidelity Canada Fund | 30,903 | 323 | - | 138 | 34,007 |
Fidelity Capital Appreciation Fund | 363,288 | 45,021 | - | 1,780 | 493,910 |
Fidelity Chemicals Portfolio | 3,090,624 | 3,136,649 | 3,510,147 | 25,385 | 3,090,753 |
Fidelity China Region Fund | 478,205 | 1,422,428 | 1,500,000 | 3,821 | 377,484 |
Fidelity Commodity Strategy Fund | 9,582 | - | 9,059 | - | - |
Fidelity Communications Equipment Portfolio | 141,426 | 972,238 | 1,172,750 | 7,654 | 73,151 |
Fidelity Computers Portfolio | 6,600,925 | 570,087 | 2,751,328 | 39,356 | 5,483,866 |
Fidelity Construction & Housing Portfolio | 3,388,836 | 564,346 | 3,610,106 | 4,989 | 866,394 |
Fidelity Consumer Discretionary Portfolio | 6,905,044 | 6,588,176 | 1,572,520 | 11,918 | 13,612,436 |
Fidelity Consumer Finance Portfolio | 2,564,061 | 390,120 | 1,043,963 | 48,738 | 2,192,220 |
Fidelity Consumer Staples Portfolio | 10,754,350 | 7,542,183 | 5,945,985 | 233,826 | 13,529,608 |
Fidelity Contrafund | 69,905 | 1,168,987 | 771,959 | 181 | 500,621 |
Fidelity Defense & Aerospace Portfolio | 386,439 | 1,909,758 | - | 10,024 | 2,477,250 |
Fidelity Disciplined Equity Fund | - | 4,260,845 | - | 81,601 | 4,356,302 |
Fidelity Diversified International Fund | 9,785,618 | 13,001,219 | 7,442,451 | 113,015 | 17,738,041 |
Fidelity Dividend Growth Fund | 86,298 | 735 | 92,000 | 77 | 7,876 |
Fidelity Electronics Portfolio | 1,609,842 | 13,384 | 29,451 | 11,155 | 2,200,902 |
Fidelity Emerging Asia Fund | 4,549,723 | 347,413 | 3,278,067 | 19,228 | 1,541,612 |
Fidelity Emerging Europe, Middle East, Africa (EMEA) Fund | 351,856 | 5,087 | - | 5,087 | 356,673 |
Affiliate | Value,
beginning of period | Purchases | Sales
Proceeds | Dividend
Income | Value,
end of
period |
Fidelity Emerging Markets Fund | $ 776,271 | $ 2,305,905 | $ 396 | $ 2,445 | $ 3,107,945 |
Fidelity Energy Portfolio | 8,570,903 | 4,705,737 | 6,107,313 | 62,267 | 8,145,068 |
Fidelity Energy Service Portfolio | 5,287,385 | 2,080,445 | 4,331,885 | 11,701 | 4,673,665 |
Fidelity Environmental & Alternative Energy Portfolio | 71,291 | 724 | - | 724 | 96,235 |
Fidelity Equity Dividend Income Fund | 24,472 | 589 | - | 589 | 31,584 |
Fidelity Equity-Income Fund | 48,340 | 3,467,434 | 2,290,153 | 14,427 | 1,305,301 |
Fidelity Europe Capital Appreciation Fund | - | 5,087 | - | 87 | 5,696 |
Fidelity Europe Fund | - | 10,060,551 | - | 146,055 | 11,082,898 |
Fidelity Financial Services Portfolio | 1,497,772 | 3,121,954 | 2,204,261 | 28,181 | 3,179,016 |
Fidelity Floating Rate High Income Fund | 37,851 | 54,650 | 85,008 | 1,835 | 7,874 |
Fidelity Focused High Income Fund | 1,096,310 | 59,588 | 505,275 | 36,497 | 625,783 |
Fidelity Global Commodity Stock Fund | 26,701 | 362 | - | 339 | 25,848 |
Fidelity Gold Portfolio | 1,102,571 | - | 824,871 | - | 6,413 |
Fidelity Growth & Income Portfolio | - | 2,671,889 | 2,179,232 | 12,367 | 631,295 |
Fidelity Growth Company Fund | 102,783 | 200,672 | - | 541 | 335,476 |
Fidelity Growth Discovery Fund | - | 406,085 | - | - | 439,496 |
Fidelity Health Care Portfolio | 10,469,289 | 6,413,982 | 940,810 | 2,543 | 20,071,686 |
Fidelity High Income Fund | 3,809,372 | 2,583,304 | 1,944,074 | 175,514 | 4,441,205 |
Fidelity Independence Fund | 210,323 | 893 | - | 893 | 294,914 |
Fidelity Industrial Equipment Portfolio | 2,714,424 | 1,569,723 | 327,843 | 29,566 | 4,631,391 |
Fidelity Industrials Portfolio | 11,040,463 | 9,172,103 | 1,579,615 | 123,499 | 22,558,946 |
Fidelity Institutional Prime Money Market Portfolio Class I | 17,073 | 5,442,935 | 5,459,236 | 48 | 772 |
Fidelity Insurance Portfolio | 8,440,434 | 1,271,545 | 1,669,865 | 92,083 | 10,690,013 |
Fidelity International Capital Appreciation Fund | 2,756,300 | 302,915 | 2,625,071 | 5,104 | 723,688 |
Fidelity International Discovery Fund | 8,236,684 | 12,728,916 | 4,056,066 | 200,872 | 19,308,143 |
Fidelity International Real Estate Fund | 145,558 | 711 | 145,000 | 246 | 14,153 |
Fidelity International Small Cap Fund | 184,180 | 4,811,011 | 2,172,949 | 11,275 | 3,339,998 |
Fidelity International Small Cap Opportunities Fund | 1,343,378 | 669,003 | 1,150,000 | 7,840 | 1,217,801 |
Fidelity International Value Fund | - | 128,593 | - | 3,014 | 141,796 |
Fidelity IT Services Portfolio | 3,915,671 | 296,332 | - | - | 6,128,504 |
Fidelity Japan Fund | 86,584 | 1,004 | - | 925 | 107,065 |
Fidelity Japan Smaller Companies Fund | 111,626 | 3,187,029 | 1,582 | 4,234 | 3,428,255 |
Fidelity Large Cap Stock Fund | 204,024 | 4,745,143 | 85,665 | 26,169 | 5,201,963 |
Fidelity Large Cap Value Fund | 110,742 | 2,241 | - | 1,796 | 146,444 |
Fidelity Leisure Portfolio | 86,691 | 8,477 | - | 884 | 122,863 |
Fidelity Leveraged Company Stock Fund | 100,403 | 849 | - | 849 | 135,656 |
Fidelity Low-Priced Stock Fund | - | 1,559,957 | - | 5,958 | 1,584,712 |
Fidelity Magellan Fund | 63,653 | 1,086 | 66,000 | 125 | 12,151 |
Fidelity Materials Portfolio | 23,717 | 423,848 | - | 2,282 | 470,363 |
Fidelity Medical Delivery Portfolio | 143,394 | 11,050 | - | - | 194,028 |
Fidelity Medical Equipment & Systems Portfolio | 56,436 | 92,038 | - | - | 161,851 |
Fidelity Mega Cap Stock Fund | 1,538,431 | 3,908,062 | 2,347,043 | 38,331 | 3,591,727 |
Fidelity Mid Cap Value Fund | 81,781 | 9,377 | - | 1,139 | 113,645 |
Fidelity Mid-Cap Stock Fund | 78,476 | 567,503 | - | 1,526 | 743,597 |
Fidelity Multimedia Portfolio | 4,951,063 | 390,131 | 4,774,082 | 5,320 | 2,376,137 |
Fidelity Nasdaq Composite Index Fund | 36,209 | 803 | - | 360 | 50,601 |
Fidelity Natural Gas Portfolio | 1,066,081 | 1,181 | 1,180,000 | 879 | 35,547 |
Fidelity Natural Resources Portfolio | 516,786 | 2,275 | 500,000 | 222 | 88,688 |
Fidelity New Markets Income Fund | 1,172,212 | 119,749 | 619,640 | 33,172 | 575,464 |
Fidelity New Millennium Fund | - | 2,860,494 | - | 12,392 | 2,987,493 |
Fidelity Nordic Fund | - | 2,752,232 | - | 51,409 | 2,949,407 |
Fidelity OTC Portfolio | - | 6,354,009 | 4,681,370 | 3,692 | 2,021,928 |
Fidelity Overseas Fund | 11,137 | 237 | - | 176 | 14,120 |
Fidelity Pacific Basin Fund | 1,628,604 | 267,278 | 1,500,000 | 10,655 | 542,636 |
Fidelity Pharmaceuticals Portfolio | 2,589,783 | 310,776 | 1,000,000 | 20,496 | 2,380,658 |
Fidelity Real Estate Income Fund | 326,173 | 102,282 | 420,000 | 10,800 | 12,724 |
Fidelity Real Estate Investment Portfolio | 11,516 | 703,317 | 641,699 | 1,972 | 28,478 |
Fidelity Retailing Portfolio | 3,497,501 | 514,798 | 1,690,270 | 5,084 | 3,428,010 |
Affiliate | Value,
beginning of period | Purchases | Sales
Proceeds | Dividend
Income | Value,
end of
period |
Fidelity Series Commodity Strategy Fund | $ - | $ 9,075 | $ - | $ - | $ 8,628 |
Fidelity Small Cap Discovery Fund | - | 1,351,999 | - | 1,199 | 1,475,771 |
Fidelity Small Cap Growth Fund | 36,823 | 7,930 | - | - | 53,219 |
Fidelity Small Cap Stock Fund | 63,038 | 8,287 | - | 228 | 81,818 |
Fidelity Small Cap Value Fund | 181,169 | 2,223,112 | - | 6,901 | 2,430,280 |
Fidelity Software & Computer Services Portfolio | 6,846,157 | 4,538,528 | 338,501 | - | 14,872,498 |
Fidelity Technology Portfolio | 5,343,932 | 2,128,446 | 4,920,094 | 3,462 | 3,564,904 |
Fidelity Telecom and Utilities Fund | 5,227,203 | 40,196 | 5,859,450 | 40,074 | 104,218 |
Fidelity Telecommunications Portfolio | 1,739,150 | 637,951 | 1,603,563 | 24,525 | 1,036,511 |
Fidelity Transportation Portfolio | 6,327 | 2,077,893 | 6,570 | 5,482 | 2,160,489 |
Fidelity Utilities Portfolio | 39,449 | 19,760 | - | 1,036 | 66,267 |
Fidelity Value Discovery Fund | 9,743 | 157 | - | 157 | 13,203 |
Fidelity Value Fund | - | 2,117,797 | 2,000,000 | 18,762 | 215,727 |
Fidelity Value Strategies Fund | 1,126,652 | 90 | 1,334,000 | 90 | 11,253 |
Spartan 500 Index Fund Investor Class | 135,088 | 1,547 | 150,000 | 1,547 | 13,984 |
Spartan Extended Market Index Fund Investor Class | 7,941 | 320 | - | 108 | 10,973 |
Spartan International Index Fund Investor Class | 23,077,208 | 2,563,646 | 5,425,989 | 554,017 | 24,218,616 |
Spartan Total Market Index Fund Investor Class | 691,850 | 2,959 | 740,000 | 2,959 | 69,598 |
Spartan U.S. Bond Index Fund Investor Class | 27,102,426 | 12,069,099 | 9,047,330 | 629,335 | 28,881,813 |
VIP Energy Portfolio Investor Class | 328,621 | 5,731 | - | 3,337 | 408,751 |
VIP Mid Cap Portfolio Investor Class | 84,071 | 2,485 | 90,000 | 55 | 13,852 |
Total | $ 231,548,212 | $ 187,241,671 | $ 138,685,744 | $ 3,240,123 | $ 332,413,499 |
Other Information |
All investments are categorized as Level 1 under the Fair Value Hierarchy. The inputs or methodology used for valuing securities may not be an indication of the risk associated with investing in those securities. For more information on valuation inputs, please refer to the Investment Valuation section in the accompanying Notes to Financial Statements. |
See accompanying notes which are an integral part of the financial statements.
Annual Report
VIP FundsManager 85% Portfolio
Statement of Assets and Liabilities
| December 31, 2013 |
| | |
Assets | | |
Investment in securities, at value (cost $262,376,695) - See accompanying schedule | | $ 332,413,499 |
Cash | | 7 |
Receivable for fund shares sold | | 272,811 |
Total assets | | 332,686,317 |
| | |
Liabilities | | |
Payable for investments purchased | $ 222,567 | |
Payable for fund shares redeemed | 50,244 | |
Accrued management fee | 53,159 | |
Distribution and service plan fees payable | 826 | |
Total liabilities | | 326,796 |
| | |
Net Assets | | $ 332,359,521 |
Net Assets consist of: | | |
Paid in capital | | $ 282,268,808 |
Accumulated undistributed net realized gain (loss) on investments | | (19,946,091) |
Net unrealized appreciation (depreciation) on investments | | 70,036,804 |
Net Assets | | $ 332,359,521 |
Statement of Assets and Liabilities - continued
| December 31, 2013 |
| | |
Service Class:
Net Asset Value, offering price and redemption price per share ($241,525 ÷ 20,018 shares) | | $ 12.07 |
| | |
Service Class 2:
Net Asset Value, offering price and redemption price per share ($6,862,470 ÷ 570,475 shares) | | $ 12.03 |
| | |
Investor Class:
Net Asset Value, offering price and redemption price per share ($325,255,526 ÷ 26,942,679 shares) | | $ 12.07 |
See accompanying notes which are an integral part of the financial statements.
Annual Report
VIP FundsManager 85% Portfolio
Financial Statements - continued
Statement of Operations
| Year ended December 31, 2013 |
| | |
Investment Income | | |
Income distributions from underlying funds | | $ 3,240,123 |
| | |
Expenses | | |
Management fee | $ 673,322 | |
Distribution and service plan fees | 14,717 | |
Independent trustees' compensation | 994 | |
Total expenses before reductions | 689,033 | |
Expense reductions | (141,006) | 548,027 |
Net investment income (loss) | | 2,692,096 |
Realized and Unrealized Gain (Loss) Realized gain (loss) on sale of underlying fund shares | 19,028,019 | |
Capital gain distributions from underlying funds | 11,406,005 | |
Total net realized gain (loss) | | 30,434,024 |
Change in net unrealized appreciation (depreciation) on underlying funds | | 33,277,740 |
Net gain (loss) | | 63,711,764 |
Net increase (decrease) in net assets resulting from operations | | $ 66,403,860 |
Statement of Changes in Net Assets
| Year ended
December 31,
2013 | Year ended
December 31,
2012 |
Increase (Decrease) in Net Assets | | |
Operations | | |
Net investment income (loss) | $ 2,692,096 | $ 2,980,240 |
Net realized gain (loss) | 30,434,024 | 11,251,825 |
Change in net unrealized appreciation (depreciation) | 33,277,740 | 17,070,579 |
Net increase (decrease) in net assets resulting
from operations | 66,403,860 | 31,302,644 |
Distributions to shareholders from net investment income | (2,700,538) | (2,967,962) |
Distributions to shareholders from net realized gain | (3,433,717) | (779,007) |
Total distributions | (6,134,255) | (3,746,969) |
Share transactions - net increase (decrease) | 40,580,804 | (31,698,471) |
Total increase (decrease) in net assets | 100,850,409 | (4,142,796) |
| | |
Net Assets | | |
Beginning of period | 231,509,112 | 235,651,908 |
End of period | $ 332,359,521 | $ 231,509,112 |
See accompanying notes which are an integral part of the financial statements.
Annual Report
Financial Highlights - Service Class
Years ended December 31, | 2013 | 2012 | 2011 | 2010 | 2009 |
Selected Per-Share Data | | | | | |
Net asset value, beginning of period | $ 9.62 | $ 8.57 | $ 9.19 | $ 8.02 | $ 6.32 |
Income from Investment Operations | | | | | |
Net investment income (loss) C | .11 | .12 | .11 | .10 | .11 |
Net realized and unrealized gain (loss) | 2.57 | 1.09 | (.60) | 1.19 | 1.70 |
Total from investment operations | 2.68 | 1.21 | (.49) | 1.29 | 1.81 |
Distributions from net investment income | (.10) | (.13) | (.11) | (.10) | (.10) |
Distributions from net realized gain | (.13) | (.03) | (.02) | (.02) | (.01) |
Total distributions | (.23) | (.16) | (.13) | (.12) | (.11) |
Net asset value, end of period | $ 12.07 | $ 9.62 | $ 8.57 | $ 9.19 | $ 8.02 |
Total Return A, B | 27.86% | 14.13% | (5.30)% | 16.07% | 28.56% |
Ratios to Average Net Assets D, E | | | | | |
Expenses before reductions | .35% | .35% | .35% | .35% | .35% |
Expenses net of fee waivers, if any | .20% | .20% | .20% | .20% | .20% |
Expenses net of all reductions | .20% | .20% | .20% | .20% | .20% |
Net investment income (loss) | 1.00% | 1.25% | 1.23% | 1.20% | 1.53% |
Supplemental Data | | | | | |
Net assets, end of period (000 omitted) | $ 242 | $ 149 | $ 183 | $ 108 | $ 112 |
Portfolio turnover rate D | 51% | 50% | 26% | 38% | 66% |
A Total returns do not reflect charges attributable to your insurance company's separate account. Inclusion of these charges would reduce the total returns shown.
B Total returns would have been lower if certain expenses had not been reduced during the applicable periods shown.
C Calculated based on average shares outstanding during the period.
D Amounts do not include the activity of the Underlying Funds.
E Expense ratios reflect operating expenses of the class. Expenses before reductions do not reflect amounts reimbursed by the investment adviser or reductions from expense offset arrangements and do not represent the amount paid by the class during periods when reimbursements or reductions occur. Expenses net of fee waivers reflect expenses after reimbursement by the investment adviser but prior to reductions from expense offset arrangements. Expenses net of all reductions represent the net expenses paid by the class but do not include expenses of the investment companies in which the Fund invests.
Financial Highlights - Service Class 2
Years ended December 31, | 2013 | 2012 | 2011 | 2010 | 2009 |
Selected Per-Share Data | | | | | |
Net asset value, beginning of period | $ 9.60 | $ 8.55 | $ 9.17 | $ 8.00 | $ 6.32 |
Income from Investment Operations | | | | | |
Net investment income (loss) C | .09 | .10 | .10 | .09 | .10 |
Net realized and unrealized gain (loss) | 2.55 | 1.10 | (.60) | 1.19 | 1.68 |
Total from investment operations | 2.64 | 1.20 | (.50) | 1.28 | 1.78 |
Distributions from net investment income | (.09) | (.11) | (.10) | (.09) | (.09) |
Distributions from net realized gain | (.13) | (.03) | (.02) | (.02) | (.01) |
Total distributions | (.21) G | (.15) F | (.12) | (.11) | (.10) |
Net asset value, end of period | $ 12.03 | $ 9.60 | $ 8.55 | $ 9.17 | $ 8.00 |
Total Return A, B | 27.54% | 14.01% | (5.44)% | 16.00% | 28.17% |
Ratios to Average Net Assets D, E | | | | | |
Expenses before reductions | .50% | .50% | .50% | .50% | .50% |
Expenses net of fee waivers, if any | .35% | .35% | .35% | .35% | .35% |
Expenses net of all reductions | .35% | .35% | .35% | .35% | .35% |
Net investment income (loss) | .85% | 1.10% | 1.08% | 1.05% | 1.38% |
Supplemental Data | | | | | |
Net assets, end of period (000 omitted) | $ 6,862 | $ 4,812 | $ 3,574 | $ 2,384 | $ 886 |
Portfolio turnover rate D | 51% | 50% | 26% | 38% | 66% |
A Total returns do not reflect charges attributable to your insurance company's separate account. Inclusion of these charges would reduce the total returns shown.
B Total returns would have been lower if certain expenses had not been reduced during the applicable periods shown.
C Calculated based on average shares outstanding during the period.
D Amounts do not include the activity of the Underlying Funds.
E Expense ratios reflect operating expenses of the class. Expenses before reductions do not reflect amounts reimbursed by the investment adviser or reductions from expense offset arrangements and do not represent the amount paid by the class during periods when reimbursements or reductions occur. Expenses net of fee waivers reflect expenses after reimbursement by the investment adviser but prior to reductions from expense offset arrangements. Expenses net of all reductions represent the net expenses paid by the class but do not include expenses of the investment companies in which the Fund invests.
F Total distributions of $.15 per share is comprised of distributions from net investment income of $.113 and distributions from net realized gain of $.033 per share.
G Total distributions of $.21 per share is comprised of distributions from net investment income of $.085 and distributions from net realized gain of $.128 per share.
See accompanying notes which are an integral part of the financial statements.
Annual Report
Financial Highlights - Investor Class
Years ended December 31, | 2013 | 2012 | 2011 | 2010 | 2009 |
Selected Per-Share Data | | | | | |
Net asset value, beginning of period | $ 9.63 | $ 8.58 | $ 9.20 | $ 8.02 | $ 6.32 |
Income from Investment Operations | | | | | |
Net investment income (loss) C | .11 | .12 | .11 | .10 | .11 |
Net realized and unrealized gain (loss) | 2.56 | 1.09 | (.60) | 1.20 | 1.70 |
Total from investment operations | 2.67 | 1.21 | (.49) | 1.30 | 1.81 |
Distributions from net investment income | (.10) | (.13) | (.11) | (.10) | (.10) |
Distributions from net realized gain | (.13) | (.03) | (.02) | (.02) | (.01) |
Total distributions | (.23) | (.16) | (.13) | (.12) | (.11) |
Net asset value, end of period | $ 12.07 | $ 9.63 | $ 8.58 | $ 9.20 | $ 8.02 |
Total Return A, B | 27.73% | 14.11% | (5.29)% | 16.20% | 28.56% |
Ratios to Average Net Assets D, E | | | | | |
Expenses before reductions | .25% | .25% | .25% | .25% | .25% |
Expenses net of fee waivers, if any | .20% | .20% | .20% | .20% | .20% |
Expenses net of all reductions | .20% | .20% | .20% | .20% | .20% |
Net investment income (loss) | 1.00% | 1.25% | 1.23% | 1.20% | 1.53% |
Supplemental Data | | | | | |
Net assets, end of period (000 omitted) | $ 325,256 | $ 226,548 | $ 231,895 | $ 225,225 | $ 180,463 |
Portfolio turnover rate D | 51% | 50% | 26% | 38% | 66% |
A Total returns do not reflect charges attributable to your insurance company's separate account. Inclusion of these charges would reduce the total returns shown.
B Total returns would have been lower if certain expenses had not been reduced during the applicable periods shown.
C Calculated based on average shares outstanding during the period.
D Amounts do not include the activity of the Underlying Funds.
E Expense ratios reflect operating expenses of the class. Expenses before reductions do not reflect amounts reimbursed by the investment adviser or reductions from expense offset arrangements and do not represent the amount paid by the class during periods when reimbursements or reductions occur. Expenses net of fee waivers reflect expenses after reimbursement by the investment adviser but prior to reductions from expense offset arrangements. Expenses net of all reductions represent the net expenses paid by the class but do not include expenses of the investment companies in which the Fund invests.
See accompanying notes which are an integral part of the financial statements.
Annual Report
Notes to Financial Statements
For the period ended December 31, 2013
1. Organization.
VIP FundsManager 20% Portfolio, VIP FundsManager 50% Portfolio, VIP FundsManager 60% Portfolio, VIP FundsManager 70% Portfolio, and VIP FundsManager 85% Portfolio (the Funds) are funds of Variable Insurance Products Fund V. Variable Insurance Products Fund V (the Trust) is registered under the Investment Company Act of 1940, as amended (the 1940 Act), as an open-end management investment company organized as a Massachusetts business trust. Each Fund is authorized to issue an unlimited number of shares. The Funds invest primarily in a combination of other Fidelity equity, fixed income, and short-term funds (the Underlying Funds) managed by Fidelity Management & Research Company (FMR). Shares of each Fund may only be purchased by insurance companies for the purpose of funding variable annuity or variable life insurance contracts. Each Fund offers three classes of shares: Service Class shares, Service Class 2 shares, and Investor Class shares. All classes have equal rights and voting privileges, except for matters affecting a single class.
2. Significant Accounting Policies.
The financial statements have been prepared in conformity with accounting principles generally accepted in the United States of America (GAAP), which require management to make certain estimates and assumptions at the date of the financial statements. Actual results could differ from those estimates. Subsequent events, if any, through the date that the financial statements were issued have been evaluated in the preparation of the financial statements. The following summarizes the significant accounting policies of the Funds:
Investment Valuation. Investments are valued as of 4:00 p.m. Eastern time on the last calendar day of the period. Each Fund categorizes the inputs to valuation techniques used to value its investments into a disclosure hierarchy consisting of three levels as shown below:
Level 1 - quoted prices in active markets for identical investments
Level 2 - other significant observable inputs (including quoted prices for similar investments, interest rates, prepayment speeds, etc.)
Level 3 - unobservable inputs (including the Fund's own assumptions based on the best information available)
Valuation techniques used to value each Fund's investments by major category are as follows. Investments in the Underlying Funds are valued at their closing net asset value (NAV) each business day and are categorized as Level 1 in the hierarchy.
Investment Transactions and Income. For financial reporting purposes, the Funds' investment holdings and NAV include trades executed through the end of the last business day of the period. The NAV per share for processing shareholder transactions is calculated as of the close of business of the New York Stock Exchange (NYSE), normally 4:00 p.m. Eastern time and includes trades executed through the end of the prior business day. Gains and losses on securities sold are determined on the basis of identified cost. Income and capital gain distributions from the Underlying Funds, if any, are recorded on the ex-dividend date. Distributions received on securities that represent a return of capital or capital gain are recorded as a reduction of cost of investments and/or as a realized gain. Subsequent to ex-dividend date the Funds determine the components of these distributions, based upon receipt of tax filings or other correspondence relating to the underlying investment.
Class Allocations and Expenses. Investment income, realized and unrealized capital gains and losses, common expenses of each Fund, and certain fund-level expense reductions, if any, are allocated daily on a pro-rata basis to each class based on the relative net assets of each class to the total net assets of each Fund. Each class differs with respect to distribution and service plan fees incurred. Certain expense reductions may also differ by class. For the reporting period, the allocated portion of income and expenses to each class as a percent of its average net assets may vary due to the timing of recording these transactions in relation to fluctuating net assets of the classes. Expenses directly attributable to a fund are charged to that fund. Expenses attributable to more than one fund are allocated among the respective funds on the basis of relative net assets or other appropriate methods. Expenses included in the accompanying financial statements reflect the expenses of each Fund and do not include any expenses associated with the Underlying Funds. Although not included in each Fund's expenses, each Fund indirectly bears its proportionate share of the Underlying Funds' expenses through the impact of these expenses on each Underlying Fund's NAV. Expense estimates are accrued in the period to which they relate and adjustments are made when actual amounts are known.
Income Tax Information and Distributions to Shareholders. Each year, each Fund intends to qualify as a regulated investment company under Subchapter M of the Internal Revenue Code, including distributing substantially all of its taxable income and realized gains. As a result, no provision for U.S. Federal income taxes is required. As of December 31, 2013, each Fund did not have any unrecognized tax benefits in the financial statements; nor is each Fund aware of any tax positions for which it is reasonably possible that the total amounts of unrecognized tax benefits will significantly change in the next twelve months. Each Fund files a U.S. federal tax return, in addition to state and local tax returns as required. The Fund's federal income tax returns are subject to examination by the Internal Revenue Service (IRS) for a period of three fiscal years after they are filed. State and local tax returns may be subject to examination for an additional fiscal year depending on the jurisdiction.
Distributions are declared and recorded on the ex-dividend date. Income dividends and capital gain distributions are declared separately for each class. Income and capital gain distributions are determined in accordance with income tax regulations, which may differ from GAAP.
Annual Report
Notes to Financial Statements - continued
2. Significant Accounting Policies - continued
Income Tax Information and Distributions to Shareholders - continued
Capital accounts within the financial statements are adjusted for permanent book-tax differences. These adjustments have no impact on net assets or the results of operations. Capital accounts are not adjusted for temporary book-tax differences which will reverse in a subsequent period.
Book-tax differences are primarily due to short-term gain distributions from the Underlying Funds, capital loss carryforwards and losses deferred due to wash sales.
The federal tax cost of investment securities and unrealized appreciation (depreciation) as of period end were as follows for each Fund:
| Tax cost | Gross unrealized
appreciation | Gross unrealized
depreciation | Net unrealized
appreciation
(depreciation) on
securities and
other investments |
VIP FundsManager 20% Portfolio | $ 652,192,349 | $ 49,565,618 | $ (5,828,526) | $ 43,737,092 |
VIP FundsManager 50% Portfolio | 3,076,049,347 | 363,207,478 | (30,161,978) | 333,045,500 |
VIP FundsManager 60% Portfolio | 5,233,604,726 | 1,215,959,826 | (38,533,975) | 1,177,425,851 |
VIP FundsManager 70% Portfolio | 698,980,722 | 180,625,901 | (2,839,867) | 177,786,034 |
VIP FundsManager 85% Portfolio | 262,581,681 | 71,001,470 | (1,169,652) | 69,831,818 |
The tax-based components of distributable earnings as of period end were as follows for each Fund:
| Undistributed
ordinary income | Undistributed
long-term
capital gain | Capital loss
carryforward | Net unrealized
appreciation
(depreciation) |
VIP FundsManager 20% Portfolio | $ 243,030 | $ 5,378,345 | $ - | $ 43,737,092 |
VIP FundsManager 50% Portfolio | - | 2,159,998 | - | 333,045,500 |
VIP FundsManager 60% Portfolio | 704,051 | 109,011,858 | - | 1,177,425,851 |
VIP FundsManager 70% Portfolio | - | - | (58,222,450) | 177,786,034 |
VIP FundsManager 85% Portfolio | - | - | (19,741,105) | 69,831,818 |
Capital loss carryforwards are only available to offset future capital gains of the Funds to the extent provided by regulations and may be limited. Under the Regulated Investment Company Modernization Act of 2010 (the Act), the Funds are permitted to carry forward capital losses incurred in taxable years beginning after December 22, 2010 for an unlimited period and such capital losses are required to be used prior to any losses that expire. The capital loss carryforward information presented below, including any applicable limitation, is estimated as of fiscal period end and is subject to adjustment.
| Fiscal year
of expiration |
| 2017 |
VIP FundsManager 70% Portfolio | $ (58,222,450) |
VIP FundsManager 85% Portfolio | (19,741,105) |
The tax character of distributions paid was as follows:
December 31, 2013 | Ordinary Income | Long-term
Capital Gains | Total |
VIP FundsManager 20% Portfolio | $ 12,503,307 | $ 10,253,353 | $ 22,756,660 |
VIP FundsManager 50% Portfolio | 49,950,725 | - | 49,950,725 |
VIP FundsManager 60% Portfolio | 133,204,554 | 158,653,383 | 291,857,937 |
VIP FundsManager 70% Portfolio | 15,284,038 | - | 15,284,038 |
VIP FundsManager 85% Portfolio | 6,134,255 | - | 6,134,255 |
December 31, 2012 | Ordinary Income |
VIP FundsManager 20% Portfolio | $ 10,741,500 |
VIP FundsManager 50% Portfolio | 20,984,608 |
VIP FundsManager 60% Portfolio | 94,948,137 |
VIP FundsManager 70% Portfolio | 11,177,513 |
VIP FundsManager 85% Portfolio | 3,746,969 |
Annual Report
3. Purchases and Sales of Investments.
Purchases and redemptions of the Underlying Fund shares are noted in the table below.
| Purchases ($) | Redemptions ($) |
VIP FundsManager 20% Portfolio | 194,049,753 | 171,279,415 |
VIP FundsManager 50% Portfolio | 2,096,954,222 | 357,029,534 |
VIP FundsManager 60% Portfolio | 1,377,682,135 | 1,266,100,677 |
VIP FundsManager 70% Portfolio | 368,725,240 | 234,633,676 |
VIP FundsManager 85% Portfolio | 187,241,671 | 138,685,744 |
4. Fees and Other Transactions with Affiliates.
Management Fee. Strategic Advisers, Inc. (the investment adviser), an affiliate of FMR, provides the funds with investment management related services. For these services each fund pays a monthly management fee to the investment adviser. The management fee is based on an annual rate of .25% of each fund's average net assets. The management fee is reduced by an amount equal to the fees and expenses paid by the fund to the independent Trustees.
The investment adviser has contractually agreed to waive 0.05% of its management fee, thereby limiting each fund's management fee to an annual rate of 0.20% of average net assets, until April 30, 2014.
Other Transactions. The investment adviser has entered into an administration agreement with FMR under which FMR provides management and administrative services (other than investment advisory services) necessary for the operation of each Fund. Pursuant to this agreement, FMR pays all expenses of each Fund, excluding the distribution and service fees, the compensation of the independent Trustees and certain other expenses such as interest expense. FMR also contracts with other Fidelity companies to perform the services necessary for the operation of each Fund.
Distribution and Service Plan Fees. In accordance with Rule 12b-1 of the 1940 Act, the Funds have adopted separate 12b-1 Plans for each Service Class of shares. Each Service Class pays Fidelity Distributors Corporation (FDC), an affiliate of the investment adviser, a service fee. For the period, the service fee is based on an annual rate of .10% of Service Class' average net assets and .25% of Service Class 2's average net assets.
For the period, total fees, all of which were reallowed to insurance companies for the distribution of shares and providing shareholder support services were as follows:
| Service
Class | Service
Class 2 | Total |
VIP FundsManager 20% Portfolio | $ 77 | $ 3,291 | $ 3,368 |
VIP FundsManager 50% Portfolio | 76 | 210,697 | 210,773 |
VIP FundsManager 60% Portfolio | 72 | 769,536 | 769,608 |
VIP FundsManager 70% Portfolio | 85 | 15,067 | 15,152 |
VIP FundsManager 85% Portfolio | 194 | 14,523 | 14,717 |
5. Expense Reductions.
The investment adviser contractually agreed to limit each funds' management fee to an annual rate of 0.20% of each funds' average net assets until April 30, 2014. For the period, each fund's management fees were reduced by the following amounts:
| Management Fee
Waiver |
| |
VIP FundsManager 20% Portfolio | $ 343,395 |
VIP FundsManager 50% Portfolio | 1,198,700 |
VIP FundsManager 60% Portfolio | 2,972,623 |
VIP FundsManager 70% Portfolio | 373,720 |
VIP FundsManager 85% Portfolio | 134,987 |
In addition, FMR has contractually agreed to reimburse 0.10% of class-level expenses for each fund's Service class and Service Class 2. During the period, this reimbursement reduced each fund's Service class and Service class 2's expenses by the following amounts:
| Reimbursement |
VIP FundsManager 20% Portfolio | |
Service Class | $ 77 |
Service Class 2 | 1,316 |
Annual Report
Notes to Financial Statements - continued
5. Expense Reductions - continued
| Reimbursement |
VIP FundsManager 50% Portfolio | |
Service Class | $ 76 |
Service Class 2 | 84,333 |
VIP FundsManager 60% Portfolio | |
Service Class | 72 |
Service Class 2 | 308,394 |
VIP FundsManager 70% Portfolio | |
Service Class | 85 |
Service Class 2 | 6,039 |
VIP FundsManager 85% Portfolio | |
Service Class | 194 |
Service Class 2 | 5,825 |
In addition, through arrangements with each applicable Fund's custodian, credits realized as a result of uninvested cash balances were used to reduce each applicable Fund's management fee. During the period, these credits reduced management fee by the following amounts:
VIP FundsManager 20% Portfolio | $ 1 |
VIP FundsManager 50% Portfolio | 9 |
VIP FundsManager 60% Portfolio | 26 |
VIP FundsManager 70% Portfolio | 9 |
6. Distributions to Shareholders.
Distributions to shareholders of each class were as follows:
Years ended December 31, | 2013 | 2012 |
VIP FundsManager 20% Portfolio | | |
From net investment income | | |
Service Class | $ 894 | $ 969 |
Service Class 2 | 12,626 | 15,515 |
Investor Class | 8,440,466 | 8,934,447 |
Total | $ 8,453,986 | $ 8,950,931 |
From net realized gain | | |
Service Class | 1,512 | 194 |
Service Class 2 | 25,038 | 3,485 |
Investor Class | 14,276,125 | 1,786,890 |
Total | $ 14,302,675 | $ 1,790,569 |
VIP FundsManager 50% Portfolio | | |
From net investment income | | |
Service Class | 755 | 882 |
Service Class 2 | 712,942 | 899,332 |
Investor Class | 31,151,492 | 16,393,415 |
Total | $ 31,865,189 | $ 17,293,629 |
From net realized gain | | |
Service Class | 427 | 187 |
Service Class 2 | 477,745 | 213,401 |
Investor Class | 17,607,365 | 3,477,391 |
Total | $ 18,085,537 | $ 3,690,979 |
VIP FundsManager 60% Portfolio | | |
From net investment income | | |
Service Class | 847 | 926 |
Service Class 2 | 3,604,593 | 3,246,365 |
Investor Class | 65,904,476 | 73,997,660 |
Total | $ 69,509,916 | $ 77,244,951 |
Annual Report
6. Distributions to Shareholders - continued
Years ended December 31, | 2013 | 2012 |
VIP FundsManager 60% Portfolio | | |
From net realized gain | | |
Service Class | $ 2,688 | $ 211 |
Service Class 2 | 12,440,936 | 817,603 |
Investor Class | 209,904,397 | 16,885,372 |
Total | $ 222,348,021 | $ 17,703,186 |
VIP FundsManager 70% Portfolio | | |
From net investment income | | |
Service Class | 932 | 1,152 |
Service Class 2 | 59,847 | 69,192 |
Investor Class | 8,833,266 | 9,325,113 |
Total | $ 8,894,045 | $ 9,395,457 |
From net realized gain | | |
Service Class | 669 | 218 |
Service Class 2 | 49,318 | 14,333 |
Investor Class | 6,340,006 | 1,767,505 |
Total | $ 6,389,993 | $ 1,782,056 |
VIP FundsManager 85% Portfolio | | |
From net investment income | | |
Service Class | 1,972 | 1,924 |
Service Class 2 | 47,174 | 55,902 |
Investor Class | 2,651,392 | 2,910,136 |
Total | $ 2,700,538 | $ 2,967,962 |
From net realized gain | | |
Service Class | 2,499 | 504 |
Service Class 2 | 71,038 | 16,325 |
Investor Class | 3,360,180 | 762,178 |
Total | $ 3,433,717 | $ 779,007 |
7. Share Transactions.
Transactions for each class of shares were as follows:
| Shares | Dollars |
Years ended December 31, | 2013 | 2012 | 2013 | 2012 |
VIP FundsManager 20% Portfolio | | | | |
Service Class | | | | |
Shares sold | 4,335 | 3,854 | $ 49,173 | $ 43,262 |
Reinvestment of distributions | 213 | 105 | 2,406 | 1,163 |
Shares redeemed | (4,569) | (3,617) | (52,347) | (40,752) |
Net increase (decrease) | (21) | 342 | $ (768) | $ 3,673 |
Service Class 2 | | | | |
Shares sold | 35,304 | 93,342 | $ 399,373 | $ 1,023,285 |
Reinvestment of distributions | 3,336 | 1,718 | 37,664 | 19,000 |
Shares redeemed | (47,827) | (108,824) | (543,206) | (1,194,286) |
Net increase (decrease) | (9,187) | (13,764) | $ (106,169) | $ (152,001) |
Investor Class | | | | |
Shares sold | 8,431,513 | 10,490,900 | $ 95,563,353 | $ 116,157,366 |
Reinvestment of distributions | 2,009,790 | 968,504 | 22,716,591 | 10,721,337 |
Shares redeemed | (7,802,750) | (2,757,599) | (88,559,938) | (30,487,438) |
Net increase (decrease) | 2,638,553 | 8,701,805 | $ 29,720,006 | $ 96,391,265 |
Annual Report
Notes to Financial Statements - continued
7. Share Transactions - continued
| Shares | Dollars |
Years ended December 31, | 2013 | 2012 | 2013 | 2012 |
VIP FundsManager 50% Portfolio | | | | |
Service Class | | | | |
Shares sold | 473 | 726 | $ 5,428 | $ 7,690 |
Reinvestment of distributions | 99 | 101 | 1,182 | 1,069 |
Shares redeemed | (707) | (116) | (8,141) | (1,201) |
Net increase (decrease) | (135) | 711 | $ (1,531) | $ 7,558 |
Service Class 2 | | | | |
Shares sold | 1,076,347 | 6,865,482 | $ 12,153,363 | $ 69,749,572 |
Reinvestment of distributions | 99,723 | 105,874 | 1,190,687 | 1,112,733 |
Shares redeemed | (1,443,409) | (1,083,591) | (16,222,057) | (11,181,369) |
Net increase (decrease) | (267,339) | 5,887,765 | $ (2,878,007) | $ 59,680,936 |
Investor Class | | | | |
Shares sold | 148,703,643 | 53,988,034 | $ 1,688,464,574 | $ 571,976,949 |
Reinvestment of distributions | 4,073,422 | 1,885,276 | 48,758,856 | 19,870,806 |
Shares redeemed | (3,312,150) | (5,384,061) | (37,524,917) | (55,753,083) |
Net increase (decrease) | 149,464,915 | 50,489,249 | $ 1,699,698,513 | $ 536,094,672 |
VIP FundsManager 60% Portfolio | | | | |
Service Class | | | | |
Shares sold | 453 | 507 | $ 5,145 | $ 5,153 |
Reinvestment of distributions | 305 | 110 | 3,535 | 1,137 |
Shares redeemed | (698) | (341) | (8,130) | (3,457) |
Net increase (decrease) | 60 | 276 | $ 550 | $ 2,833 |
Service Class 2 | | | | |
Shares sold | 8,672,414 | 21,908,418 | $ 98,156,461 | $ 218,407,711 |
Reinvestment of distributions | 1,384,119 | 393,034 | 16,045,529 | 4,063,968 |
Shares redeemed | (2,896,140) | (2,678,671) | (32,768,682) | (27,313,360) |
Net increase (decrease) | 7,160,393 | 19,622,781 | $ 81,433,308 | $ 195,158,319 |
Investor Class | | | | |
Shares sold | 8,809,786 | 83,271,705 | $ 99,670,330 | $ 838,466,166 |
Reinvestment of distributions | 23,801,207 | 8,780,969 | 275,808,873 | 90,883,035 |
Shares redeemed | (26,609,299) | (16,640,221) | (299,708,642) | (171,652,853) |
Net increase (decrease) | 6,001,694 | 75,412,453 | $ 75,770,561 | $ 757,696,348 |
VIP FundsManager 70% Portfolio | | | | |
Service Class | | | | |
Shares sold | 462 | 1,414 | $ 5,187 | $ 13,427 |
Reinvestment of distributions | 134 | 138 | 1,601 | 1,370 |
Shares redeemed | (696) | (852) | (7,956) | (8,251) |
Net increase (decrease) | (100) | 700 | $ (1,168) | $ 6,546 |
Service Class 2 | | | | |
Shares sold | 104,492 | 125,442 | $ 1,136,389 | $ 1,218,053 |
Reinvestment of distributions | 9,150 | 8,420 | 109,165 | 83,525 |
Shares redeemed | (52,752) | (38,738) | (591,226) | (380,430) |
Net increase (decrease) | 60,890 | 95,124 | $ 654,328 | $ 921,148 |
Investor Class | | | | |
Shares sold | 11,344,976 | 4,855,406 | $ 126,241,051 | $ 47,547,638 |
Reinvestment of distributions | 1,268,668 | 1,115,958 | 15,173,272 | 11,092,618 |
Shares redeemed | (2,230,299) | (5,248,480) | (24,940,583) | (50,927,428) |
Net increase (decrease) | 10,383,345 | 722,884 | $ 116,473,740 | $ 7,712,828 |
VIP FundsManager 85% Portfolio | | | | |
Service Class | | | | |
Shares sold | 5,300 | 3,756 | $ 58,028 | $ 34,929 |
Reinvestment of distributions | 372 | 255 | 4,471 | 2,428 |
Shares redeemed | (1,178) | (9,838) | (12,542) | (94,514) |
Net increase (decrease) | 4,494 | (5,827) | $ 49,957 | $ (57,157) |
Annual Report
7. Share Transactions - continued
| Shares | Dollars |
Years ended December 31, | 2013 | 2012 | 2013 | 2012 |
VIP FundsManager 85% Portfolio | | | | |
Service Class 2 | | | | |
Shares sold | 146,877 | 132,837 | $ 1,596,213 | $ 1,228,746 |
Reinvestment of distributions | 9,876 | 7,619 | 118,212 | 72,227 |
Shares redeemed | (87,603) | (57,167) | (959,046) | (531,015) |
Net increase (decrease) | 69,150 | 83,289 | $ 755,379 | $ 769,958 |
Investor Class | | | | |
Shares sold | 5,435,173 | 1,851,531 | $ 60,347,651 | $ 17,304,322 |
Reinvestment of distributions | 500,131 | 386,153 | 6,011,572 | 3,672,314 |
Shares redeemed | (2,519,325) | (5,749,016) | (26,583,755) | (53,387,908) |
Net increase (decrease) | 3,415,979 | (3,511,332) | $ 39,775,468 | $ (32,411,272) |
8. Other.
The Funds' organizational documents provide former and current trustees and officers with a limited indemnification against liabilities arising in connection with the performance of their duties to the Funds. In the normal course of business, the Funds may also enter into contracts that provide general indemnifications. The Funds' maximum exposure under these arrangements is unknown as this would be dependent on future claims that may be made against the Funds. The risk of material loss from such claims is considered remote.
The Funds do not invest in the Underlying Funds for the purpose of exercising management or control; however, investments by the Funds within their principal investment strategies may represent a significant portion of the Underlying Fund's net assets.
At the end of the period, the following Funds were each the owners of record of 10% or more of the total outstanding shares of the Underlying Funds.
Fund | VIP FundsManager
60% Portfolio |
| |
Fidelity Industrial Equipment Portfolio | 29% |
Fidelity Consumer Discretionary Portfolio | 28% |
Fidelity Financial Services Portfolio | 22% |
Fidelity Consumer Finance Portfolio | 21% |
Fidelity Insurance Portfolio | 19% |
Fidelity Banking Portfolio | 18% |
Fidelity Industrials Portfolio | 16% |
Fidelity International Value Fund | 15% |
Fidelity Telecommunications Portfolio | 14% |
Fidelity Computers Portfolio | 14% |
Spartan U.S. Bond Index Fund | 11% |
Fidelity Construction & Housing Portfolio | 11% |
The Funds, in aggregate, were the owners of record of more than 20% of the total outstanding shares of the following Underlying Funds.
Fund | % of shares held |
| |
Fidelity Industrial Equipment Portfolio | 43% |
Fidelity Consumer Discretionary Portfolio | 42% |
Fidelity Financial Services Portfolio | 33% |
Fidelity Insurance Portfolio | 29% |
Fidelity Banking Portfolio | 28% |
Fidelity Consumer Finance Portfolio | 27% |
Fidelity Industrials Portfolio | 27% |
Spartan U.S. Bond Index Fund | 22% |
Fidelity International Value Fund | 21% |
Fidelity Computers Portfolio | 21% |
Annual Report
Notes to Financial Statements - continued
8. Other - continued
In addition, at the end of the period, the investment adviser or its affiliates and certain otherwise unaffiliated shareholders were the owners of record of more than 10% of the outstanding shares of the following funds:
| Affiliated % | Number of
Unaffiliated
Shareholders | Unaffiliated
Shareholders % |
VIP FundsManager 20% Portfolio | 100% | - | - |
VIP FundsManager 50% Portfolio | 34% | 1 | 60% |
VIP FundsManager 60% Portfolio | 27% | 1 | 63% |
VIP FundsManager 70% Portfolio | 99% | - | - |
VIP FundsManager 85% Portfolio | 98% | - | - |
Annual Report
Report of Independent Registered Public Accounting Firm
To the Trustees of Variable Insurance Products Fund V and the Shareholders of VIP FundsManager 20% Portfolio, VIP FundsManager 50% Portfolio, VIP FundsManager 60% Portfolio, VIP FundsManager 70% Portfolio and VIP FundsManager 85% Portfolio:
In our opinion, the accompanying statements of assets and liabilities, including the schedules of investments, and the related statements of operations and of changes in net assets and the financial highlights present fairly, in all material respects, the financial position of VIP FundsManager 20% Portfolio, VIP FundsManager 50% Portfolio, VIP FundsManager 60% Portfolio, VIP FundsManager 70% Portfolio and VIP FundsManager 85% Portfolio (funds of Variable Insurance Products Fund V) at December 31, 2013, the results of each of their operations for the year then ended, the changes in each of their net assets for each of the two years in the period then ended and the financial highlights for each of the five years in the period then ended, in conformity with accounting principles generally accepted in the United States of America. These financial statements and financial highlights (hereafter referred to as "financial statements") are the responsibility of the Funds' management. Our responsibility is to express an opinion on these financial statements based on our audits. We conducted our audits of these financial statements in accordance with the standards of the Public Company Accounting Oversight Board (United States). Those standards require that we plan and perform the audit to obtain reasonable assurance about whether the financial statements are free of material misstatement. An audit includes examining, on a test basis, evidence supporting the amounts and disclosures in the financial statements, assessing the accounting principles used and significant estimates made by management, and evaluating the overall financial statement presentation. We believe that our audits, which included confirmation of securities at December 31, 2013 by correspondence with the custodian and brokers, provide a reasonable basis for our opinion.
PricewaterhouseCoopers LLP
Boston, Massachusetts
February 20, 2014
Annual Report
The Trustees and officers of the trust and funds, as applicable, are listed below. The Board of Trustees governs each VIP FundsManager Portfolio and is responsible for protecting the interests of shareholders. The Trustees are experienced executives who meet periodically throughout the year to oversee each VIP FundsManager Portfolio's activities, review contractual arrangements with companies that provide services to each VIP FundsManager Portfolio, oversee management of the risks associated with such activities and contractual arrangements, and review each VIP FundsManager Portfolio's performance. If the interests of a VIP FundsManager Portfolio and an underlying Fidelity fund were to diverge, a conflict of interest could arise and affect how the Trustees fulfill their fiduciary duties to the affected funds. Strategic Advisers has structured the VIP FundsManager Portfolios to avoid these potential conflicts, although there may be situations where a conflict of interest is unavoidable. In such instances, Strategic Advisers and the Trustees would take reasonable steps to minimize and, if possible, eliminate the conflict. Except for Elizabeth S. Acton and James C. Curvey, each of the Trustees oversees 223 funds. Ms. Acton oversees 205 funds. Mr. Curvey oversees 396 funds.
The Trustees hold office without limit in time except that (a) any Trustee may resign; (b) any Trustee may be removed by written instrument, signed by at least two-thirds of the number of Trustees prior to such removal; (c) any Trustee who requests to be retired or who has become incapacitated by illness or injury may be retired by written instrument signed by a majority of the other Trustees; and (d) any Trustee may be removed at any special meeting of shareholders by a two-thirds vote of the outstanding voting securities of the trust. Each Trustee who is not an interested person (as defined in the 1940 Act) of the trust and the funds (Independent Trustee), shall retire not later than the last day of the month in which his or her 75th birthday occurs. The Independent Trustees may waive this mandatory retirement age policy with respect to individual Trustees. The officers hold office without limit in time, except that any officer may resign or may be removed by a vote of a majority of the Trustees at any regular meeting or any special meeting of the Trustees. Except as indicated, each individual has held the office shown or other offices in the same company for the past five years.
Experience, Skills, Attributes, and Qualifications of the Funds' Trustees. The Governance and Nominating Committee has adopted a statement of policy that describes the experience, qualifications, attributes, and skills that are necessary and desirable for potential Independent Trustee candidates (Statement of Policy). The Board believes that each Trustee satisfied at the time he or she was initially elected or appointed a Trustee, and continues to satisfy, the standards contemplated by the Statement of Policy. The Governance and Nominating Committee also engages professional search firms to help identify potential Independent Trustee candidates who have the experience, qualifications, attributes, and skills consistent with the Statement of Policy. From time to time, additional criteria based on the composition and skills of the current Independent Trustees, as well as experience or skills that may be appropriate in light of future changes to board composition, business conditions, and regulatory or other developments, have also been considered by the professional search firms and the Governance and Nominating Committee. In addition, the Board takes into account the Trustees' commitment and participation in Board and committee meetings, as well as their leadership of standing and ad hoc committees throughout their tenure.
In determining that a particular Trustee was and continues to be qualified to serve as a Trustee, the Board has considered a variety of criteria, none of which, in isolation, was controlling. The Board believes that, collectively, the Trustees have balanced and diverse experience, qualifications, attributes, and skills, which allow the Board to operate effectively in governing each fund and protecting the interests of shareholders. Information about the specific experience, skills, attributes, and qualifications of each Trustee, which in each case led to the Board's conclusion that the Trustee should serve (or continue to serve) as a trustee of the funds, is provided below.
Board Structure and Oversight Function. Abigail P. Johnson is an interested person (as defined in the 1940 Act) and currently serves as Chairman. The Trustees have determined that an interested Chairman is appropriate and benefits shareholders because an interested Chairman has a personal and professional stake in the quality and continuity of services provided to the funds. Independent Trustees exercise their informed business judgment to appoint an individual of their choosing to serve as Chairman, regardless of whether the Trustee happens to be independent or a member of management. The Independent Trustees have determined that they can act independently and effectively without having an Independent Trustee serve as Chairman and that a key structural component for assuring that they are in a position to do so is for the Independent Trustees to constitute a substantial majority for the Board. The Independent Trustees also regularly meet in executive session. Albert R. Gamper, Jr. serves as Chairman of the Independent Trustees and as such (i) acts as a liaison between the Independent Trustees and management with respect to matters important to the Independent Trustees and (ii) with management prepares agendas for Board meetings.
Fidelity funds are overseen by different Boards of Trustees. The funds' Board oversees Fidelity's investment-grade bond, money market, and asset allocation funds and another Board oversees Fidelity's equity and high income funds. The asset allocation funds may invest in Fidelity funds that are overseen by such other Board. The use of separate Boards, each with its own committee structure, allows the Trustees of each group of Fidelity funds to focus on the unique issues of the funds they oversee, including common research, investment, and operational issues. On occasion, the separate Boards establish joint committees to address issues of overlapping consequences for the Fidelity funds overseen by each Board.
The Trustees operate using a system of committees to facilitate the timely and efficient consideration of all matters of importance to the Trustees, each fund, and fund shareholders and to facilitate compliance with legal and regulatory requirements and oversight of the funds' activities and associated risks. The Board, acting through its committees, has charged FMR and its affiliates with (i) identifying events or circumstances the occurrence of which could have demonstrably adverse effects on the funds' business and/or reputation; (ii) implementing processes and controls to lessen the possibility that such events or circumstances occur or to mitigate the effects of such events or circumstances if they do occur; and (iii) creating and maintaining a system designed to evaluate continuously business and market conditions in order to facilitate the identification and implementation processes described in (i) and (ii) above. Because the day-to-day operations and activities of the funds are carried out by or through FMR , its affiliates, and other service providers, the funds' exposure to risks is mitigated but not eliminated by the processes overseen by the Trustees. While each of the Board's committees has responsibility for overseeing different aspects of the funds' activities, oversight is exercised primarily through the Operations and Audit Committees. In addition, an ad hoc Board committee of Independent Trustees has worked with FMR to enhance the Board's oversight of investment and financial risks, legal and regulatory risks, technology risks, and operational risks, including the development of additional risk reporting to the Board. Appropriate personnel, including but not limited to the funds' Chief Compliance Officer (CCO), FMR's internal auditor, the independent accountants, the funds' Treasurer and portfolio management personnel, make periodic reports to the Board's committees, as appropriate, including an annual review of FMR's risk management program for the Fidelity funds. The responsibilities of each standing committee, including their oversight responsibilities, are described further under "Standing Committees of the Funds' Trustees."
Annual Report
Trustees and Officers - continued
The fund's Statement of Additional Information (SAI) includes more information about the Trustees. To request a free copy, call Fidelity at 1-877-208-0098.
Interested Trustees*:
Correspondence intended for each Trustee who is an interested person may be sent to Fidelity Investments, 245 Summer Street, Boston, Massachusetts 02210.
Name, Year of Birth; Principal Occupations and Other Relevant Experience+ |
James C. Curvey (1935) |
Year of Election or Appointment: 2007 Trustee |
| Mr. Curvey also serves as Trustee of other Fidelity funds. Mr. Curvey is a Director of Fidelity Investments Money Management, Inc. (2009-present), Director of Fidelity Research & Analysis Co. (2009-present) and Director of FMR and FMR Co., Inc. (2007-present). Mr. Curvey is also Vice Chairman (2007-present) and Director of FMR LLC. In addition, Mr. Curvey serves as an Overseer for the Boston Symphony Orchestra and a member of the Trustees of Villanova University. Previously, Mr. Curvey was the Vice Chairman (2006-2007) and Director (2000-2007) of FMR Corp. |
Abigail P. Johnson (1961) |
Year of Election or Appointment: 2009 Trustee Chairman of the Board of Trustees |
| Ms. Johnson also serves as Trustee of other Fidelity funds. Ms. Johnson serves as President of FMR LLC (2013-present), President of Fidelity Financial Services (2012-present) and President of Personal, Workplace and Institutional Services (2005-present). Ms. Johnson is Chairman and Director of FMR Co., Inc. (2011-present), Chairman and Director of FMR (2011-present), and the Vice Chairman and Director (2007-present) of FMR LLC. Previously, Ms. Johnson served as President and a Director of FMR (2001-2005), a Trustee of other investment companies advised by FMR, Fidelity Investments Money Management, Inc., and FMR Co., Inc. (2001-2005), Senior Vice President of the Fidelity funds (2001-2005), and managed a number of Fidelity funds. Ms. Abigail P. Johnson and Mr. Arthur E. Johnson are not related. |
* Trustees have been determined to be "Interested Trustees" by virtue of, among other things, their affiliation with the or various entities under common control withFMR.
+ The information above includes each Trustee's principal occupation during the last five years and other information relating to the experience, attributes, and skills relevant to each Trustee's qualifications to serve as a Trustee, which led to the conclusion that each Trustee should serve as a Trustee for each fund.
Independent Trustees:
Correspondence intended for each Independent Trustee (that is, the Trustees other than the Interested Trustees) may be sent to Fidelity Investments, P.O. Box 55235, Boston, Massachusetts 02205-5235.
Name, Year of Birth; Principal Occupations and Other Relevant Experience+ |
Elizabeth S. Acton (1951) |
Year of Election or Appointment: 2013 Trustee |
| Ms. Acton also serves as Trustee or Member of the Advisory Board of other Fidelity funds. Prior to her retirement in April 2012, Ms. Acton was Executive Vice President, Finance (2011-2012), Executive Vice President, Chief Financial Officer (2002-2011), and Treasurer (2004-2005) of Comerica Incorporated (financial services). Prior to joining Comerica, Ms. Acton held a variety of positions at Ford Motor Company (1983-2002), including Vice President and Treasurer (2000-2002) and Executive Vice President and Chief Financial Officer of Ford Motor Credit Company (1998-2000). Ms. Acton currently serves as a member of the Board of Directors and Audit and Finance Committees of Beazer Homes USA, Inc. (homebuilding, 2012-present). |
Albert R. Gamper, Jr. (1942) |
Year of Election or Appointment: 2006 Trustee Chairman of the Independent Trustees |
| Mr. Gamper also serves as Trustee of other Fidelity funds. Prior to his retirement in December 2004, Mr. Gamper served as Chairman of the Board of CIT Group Inc. (commercial finance). During his tenure with CIT Group Inc. Mr. Gamper served in numerous senior management positions, including Chairman (1987-1989; 1999-2001; 2002-2004), Chief Executive Officer (1987-2004), and President (2002-2003). Mr. Gamper currently serves as a member of the Board of Directors of Public Service Enterprise Group (utilities, 2000-present), a member of the Board of Trustees, Rutgers University (2004-present), and Chairman of the Board of Barnabas Health Care System. Previously, Mr. Gamper served as Vice Chairman of the Independent Trustees of certain Fidelity funds (2011-2012) and as Chairman of the Board of Governors, Rutgers University (2004-2007). |
Robert F. Gartland (1951) |
Year of Election or Appointment: 2010 Trustee |
| Mr. Gartland also serves as Trustee of other Fidelity funds. Mr. Gartland is Chairman and an investor in Gartland and Mellina Group Corp. (consulting, 2009-present). Previously, Mr. Gartland served as a partner and investor of Vietnam Partners LLC (investments and consulting, 2008-2011). Prior to his retirement, Mr. Gartland held a variety of positions at Morgan Stanley (financial services, 1979-2007) including Managing Director (1987-2007). |
Arthur E. Johnson (1947) |
Year of Election or Appointment: 2008 Trustee |
| Mr. Johnson also serves as Trustee of other Fidelity funds. Mr. Johnson serves as a member of the Board of Directors of Eaton Corporation (diversified power management, 2009-present), AGL Resources, Inc. (holding company, 2002-present) and Booz Allen Hamilton (management consulting, 2011-present). Prior to his retirement, Mr. Johnson served as Senior Vice President of Corporate Strategic Development of Lockheed Martin Corporation (defense contractor, 1999-2009). He previously served on the Board of Directors of IKON Office Solutions, Inc. (1999-2008) and Delta Airlines (2005-2007). Mr. Arthur E. Johnson is not related to Ms. Abigail P. Johnson. |
Michael E. Kenneally (1954) |
Year of Election or Appointment: 2009 Trustee |
| Mr. Kenneally also serves as Trustee of other Fidelity funds. Mr. Kenneally served as a Member of the Advisory Board for certain Fidelity funds before joining the Board of Trustees (2008-2009). Prior to his retirement, Mr. Kenneally served as Chairman and Global Chief Executive Officer of Credit Suisse Asset Management. Before joining Credit Suisse, he was an Executive Vice President and Chief Investment Officer for Bank of America Corporation. Earlier roles at Bank of America included Director of Research, Senior Portfolio Manager and Research Analyst, and Mr. Kenneally was awarded the Chartered Financial Analyst (CFA) designation in 1991. |
James H. Keyes (1940) |
Year of Election or Appointment: 2007 Trustee |
| Mr. Keyes also serves as Trustee of other Fidelity funds. Mr. Keyes serves as a member of the Board and Non-Executive Chairman of Navistar International Corporation (manufacture and sale of trucks, buses, and diesel engines, since 2002). Previously, Mr. Keyes served as a member of the Board of Pitney Bowes, Inc. (integrated mail, messaging, and document management solutions, 1998-2013). Prior to his retirement, Mr. Keyes served as Chairman (1993-2002) and Chief Executive Officer (1988-2002) of Johnson Controls (automotive, building, and energy) and as a member of the Board of LSI Logic Corporation (semiconductor technologies, 1984-2008). |
Marie L. Knowles (1946) |
Year of Election or Appointment: 2001 Trustee Vice Chairman of the Independent Trustees |
| Ms. Knowles also serves as Trustee of other Fidelity funds. Prior to Ms. Knowles' retirement in June 2000, she served as Executive Vice President and Chief Financial Officer of Atlantic Richfield Company (ARCO) (diversified energy, 1996-2000). From 1993 to 1996, she was a Senior Vice President of ARCO and President of ARCO Transportation Company. She served as a Director of ARCO from 1996 to 1998. Ms. Knowles currently serves as a Director and Chairman of the Audit Committee of McKesson Corporation (healthcare service, since 2002). Ms. Knowles is a member of the Board of the Catalina Island Conservancy and of the Santa Catalina Island Company (2009-present). She also serves as a member of the Advisory Board for the School of Engineering of the University of Southern California. Previously, Ms. Knowles served as a Director of Phelps Dodge Corporation (copper mining and manufacturing, 1994-2007), URS Corporation (engineering and construction, 2000-2003) and America West (airline, 1999-2002). |
Kenneth L. Wolfe (1939) |
Year of Election or Appointment: 2005 Trustee |
| Mr. Wolfe also serves as Trustee of other Fidelity funds. Prior to his retirement, Mr. Wolfe served as Chairman and a Director (2007-2009) and Chairman and Chief Executive Officer (1994-2001) of Hershey Foods Corporation. He also served as a member of the Boards of Adelphia Communications Corporation (telecommunications, 2003-2006), Bausch & Lomb, Inc. (medical/pharmaceutical, 1993-2007), and Revlon, Inc. (personal care products, 2004-2009). Mr. Wolfe previously served as Chairman of the Independent Trustees of other Fidelity funds (2008-2012). |
+ The information above includes each Trustee's principal occupation during the last five years and other information relating to the experience, attributes, and skills relevant to each Trustee's qualifications to serve as a Trustee, which led to the conclusion that each Trustee should serve as a Trustee for each fund.
Officers:
Correspondence intended for each officer may be sent to Fidelity Investments, 245 Summer Street, Boston, Massachusetts 02210. Officers appear below in alphabetical order.
Name, Year of Birth; Principal Occupation |
Elizabeth Paige Baumann (1968) |
Year of Election or Appointment: 2012 Anti-Money Laundering (AML) Officer |
| Ms. Baumann also serves as AML Officer of other funds. She is Chief AML Officer of FMR LLC (2012-present) and is an employee of Fidelity Investments. Previously, Ms. Baumann served as Vice President and Deputy Anti-Money Laundering Officer (2007-2012). |
Marc Bryant (1966) |
Year of Election or Appointment: 2013 Assistant Secretary |
| Mr. Bryant also serves as an officer of other funds. He is Senior Vice President and Deputy General Counsel of FMR LLC. Prior to joining Fidelity Investments, Mr. Bryant served as a Senior Vice President and the Head of Global Retail Legal for AllianceBernstein L.P. (2006-2010), and as the General Counsel for ProFund Advisors LLC (2001-2006). |
Jonathan Davis (1968) |
Year of Election or Appointment: 2010 Assistant Treasurer |
| Mr. Davis also serves as Assistant Treasurer of other funds. Mr. Davis is an employee of Fidelity Investments. Previously, Mr. Davis served as Vice President and Associate General Counsel of FMR LLC (2003-2010). |
Adrien E. Deberghes (1967) |
Year of Election or Appointment: 2010 Assistant Treasurer |
| Mr. Deberghes also serves as an officer of other funds. He is an employee of Fidelity Investments (2008-present). Prior to joining Fidelity Investments, Mr. Deberghes was Senior Vice President of Mutual Fund Administration at State Street Corporation (2007-2008), Senior Director of Mutual Fund Administration at Investors Bank & Trust (2005-2007), and Director of Finance for Dunkin' Brands (2000-2005). |
Stephanie J. Dorsey (1969) |
Year of Election or Appointment: 2013 President and Treasurer |
| Ms. Dorsey also serves as an officer of other funds. She is an employee of Fidelity Investments (2008-present) and has served in other fund officer roles. Prior to joining Fidelity Investments, Ms. Dorsey served as Treasurer (2004-2008) of the JPMorgan Mutual Funds and Vice President (2004-2008) of JPMorgan Chase Bank. |
Scott C. Goebel (1968) |
Year of Election or Appointment: 2008 Secretary and Chief Legal Officer (CLO) |
| Mr. Goebel serves as Secretary and CLO of other funds. Mr. Goebel also serves as Secretary of Fidelity Investments Money Management, Inc. (FIMM) (2010-present) and Fidelity Research and Analysis Company (FRAC) (2010-present); General Counsel, Secretary, and Senior Vice President of FMR (2008-present) and FMR Co., Inc. (2008-present); Chief Legal Officer of Fidelity Management & Research (Hong Kong) Limited (2008-present) and Assistant Secretary of Fidelity Management & Research (Japan) Inc. (2008-present), and Fidelity Management & Research (U.K.) Inc. (2008-present). Previously, Mr. Goebel served as Secretary and CLO of other Fidelity funds (2008-2013), Assistant Secretary of FIMM (2008-2010), FRAC (2008-2010), and certain funds (2007-2008); and as Vice President and Secretary of Fidelity Distributors Corporation (FDC) (2005-2007). Mr. Goebel has been employed by FMR LLC or an affiliate since 2001. |
Bruce T. Herring (1965) |
Year of Election or Appointment: 2013 Vice President of Fidelity's Asset Allocation Funds |
| Mr. Herring also serves as Vice President of other funds. He serves as Chief Investment Officer of Fidelity Global Asset Allocation (GAA) (2013-present), Group Chief Investment Officer of FMR, and President of Fidelity Research & Analysis Company (2010-present). Previously, Mr. Herring served as Chief Investment Officer and Director of Fidelity Management & Research (U.K.) Inc. (2010-2013), Vice President (2005-2006) and Senior Vice President (2006-2007) of Fidelity Management & Research Company, Vice President of FMR Co., Inc. (2001-2007), and as a portfolio manager for Fidelity U.S. Equity Funds. |
Chris Maher (1972) |
Year of Election or Appointment: 2013 Assistant Treasurer |
| Mr. Maher serves as Assistant Treasurer of other funds. Mr. Maher is Vice President of Valuation Oversight and is an employee of Fidelity Investments. Previously, Mr. Maher served as Vice President of Asset Management Compliance (2013), Vice President of FMR's Program Management Group (2010-2013), and Vice President of Valuation Oversight (2008-2010). |
Charles S. Morrison (1960) |
Year of Election or Appointment: 2012 Vice President |
| Mr. Morrison also serves as Vice President of other funds. He serves as President, Fixed Income and is an employee of Fidelity Investments. Previously, Mr. Morrison served as Vice President of Fidelity's Money Market Funds (2005-2009), President, Money Market Group Leader of FMR (2009), and Senior Vice President, Money Market Group of FMR (2004-2009). Mr. Morrison also served as Vice President of Fidelity's Bond Funds (2002-2005), certain Balanced Funds (2002-2005), and certain Asset Allocation Funds (2002-2007), and as Senior Vice President (2002-2005) of Fidelity's Fixed Income Division. |
Christine Reynolds (1958) |
Year of Election or Appointment: 2008 Chief Financial Officer |
| Ms. Reynolds also serves as Chief Financial Officer of other funds. Ms. Reynolds became President of Fidelity Pricing and Cash Management Services (FPCMS) in August 2008. Ms. Reynolds served as Chief Operating Officer of FPCMS (2007-2008). Previously, Ms. Reynolds served as President, Treasurer, and Anti-Money Laundering officer of the Fidelity funds (2004-2007). |
Kenneth B. Robins (1969) |
Year of Election or Appointment: 2009 Assistant Treasurer |
| Mr. Robins also serves as an officer of other funds. Mr. Robins serves as Executive Vice President of Fidelity Investments Money Management, Inc. (FIMM) (2013-present) and is an employee of Fidelity Investments (2004-present). Previously, Mr. Robins served in other fund officer roles. |
Gary W. Ryan (1958) |
Year of Election or Appointment: 2005 Assistant Treasurer |
| Mr. Ryan also serves as Assistant Treasurer of other funds. Mr. Ryan is an employee of Fidelity Investments and has served in other fund officer roles. Previously, Mr. Ryan served as Vice President of Fund Reporting in Fidelity Pricing and Cash Management Services (FPCMS) (1999-2005). |
Stephen Sadoski (1971) |
Year of Election or Appointment: 2013 Deputy Treasurer |
| Mr. Sadoski also serves as Deputy Treasurer of other funds. He is an employee of Fidelity Investments (2012-present) and has served in another fund officer role. Prior to joining Fidelity Investments, Mr. Sadoski served as an assistant chief accountant in the Division of Investment Management of the Securities and Exchange Commission (SEC) (2009-2012) and as a senior manager at Deloitte & Touche LLP (1997-2009). |
Stacie M. Smith (1974) |
Year of Election or Appointment: 2013 Assistant Treasurer |
| Ms. Smith also serves as an officer of other funds. She is an employee of Fidelity Investments (2009-present) and has served in other fund officer roles. Prior to joining Fidelity Investments, Ms. Smith served as Senior Audit Manager of Ernst & Young LLP (1996-2009). |
Renee Stagnone (1975) |
Year of Election or Appointment: 2013 Deputy Treasurer |
| Ms. Stagnone also serves as Deputy Treasurer of other funds. Ms. Stagnone is an employee of Fidelity Investments. |
Michael H. Whitaker (1967) |
Year of Election or Appointment: 2008 Chief Compliance Officer |
| Mr. Whitaker also serves as Chief Compliance Officer of other funds. Mr. Whitaker is an employee of Fidelity Investments (2007-present). Prior to joining Fidelity Investments, Mr. Whitaker worked at MFS Investment Management where he served as Senior Vice President and Chief Compliance Officer (2004-2006), and Assistant General Counsel. |
Derek L. Young (1964) |
Year of Election or Appointment: 2009 Vice President of Fidelity's Asset Allocation Funds |
| Mr. Young also serves as Trustee or an officer of other funds. He is President and a Director of Strategic Advisers, Inc. (2011-present), President of Fidelity Global Asset Allocation (GAA) (2011-present), and Vice Chairman of Pyramis Global Advisors, LLC (2011-present). Previously, Mr. Young served as Chief Investment Officer of GAA (2009-2011) and as a portfolio manager. |
Joseph F. Zambello (1957) |
Year of Election or Appointment: 2011 Deputy Treasurer |
| Mr. Zambello also serves as Deputy Treasurer of other funds. Mr. Zambello is an employee of Fidelity Investments. Previously, Mr. Zambello served as Vice President of FMR's Program Management Group (2009-2011) and Vice President of the Transfer Agent Oversight Group (2005-2009). |
Annual Report
The Board of Trustees of each voted to pay to shareholders of record at the opening of business on record date, the following distributions per share derived from capital gains realized from sales of portfolio securities, and dividends derived from net investment income:
VIP Funds Manager 20% | Pay Date | Record Date | Capital Gains |
Service Class | 02/14/14 | 02/14/14 | $0.092 |
Service Class 2 | 02/14/14 | 02/14/14 | $0.092 |
Investor Class | 02/14/14 | 02/14/14 | $0.092 |
VIP Funds Manager 50% | Pay Date | Record Date | Capital Gains |
Service Class | 02/14/14 | 02/14/14 | $0.009 |
Service Class 2 | 02/14/14 | 02/14/14 | $0.009 |
Investor Class | 02/14/14 | 02/14/14 | $0.009 |
VIP Funds Manager 60% | Pay Date | Record Date | Capital Gains |
Service Class | 02/14/14 | 02/14/14 | $0.204 |
Service Class 2 | 02/14/14 | 02/14/14 | $0.204 |
Investor Class | 02/14/14 | 02/14/14 | $0.204 |
The funds hereby designate as capital gain dividend the amounts noted below for the taxable year ended December 31, 2013, or, if subsequently determined to be different, the net capital gain of such year.
Fund |
|
VIP Funds Manager 20% | $14,389,873 |
VIP Funds Manager 50% | $2,775,889 |
VIP Funds Manager 60% | $221,871,388 |
Annual Report
Distributions (Unaudited) - continued
A percentage of the dividends distributed during the fiscal year for the following funds qualifies for the dividends-received deduction for corporate shareholders:
Fund | February, 2013 | December, 2013 |
VIP Funds Manager 20% | | |
Service Class | | 9% |
Service Class 2 | | 9% |
Investor Class | | 9% |
VIP Funds Manager 50% | | |
Service Class | | 21% |
Service Class 2 | | 24% |
Investor Class | | 21% |
VIP Funds Manager 60% | | |
Service Class | 12% | 19% |
Service Class 2 | 12% | 21% |
Investor Class | 12% | 19% |
VIP Funds Manager 70% | | |
Service Class | | 26% |
Service Class 2 | | 28% |
Investor Class | | 26% |
VIP Funds Manager 85% | | |
Service Class | | 28% |
Service Class 2 | | 30% |
Investor Class | | 28% |
A percentage of the dividends distributed during the fiscal year for the following funds was derived from interest on U.S. Government securities which is generally exempt from state income tax:
VIP Funds Manager 20% | |
Service Class | 8.03% |
Service Class 2 | 8.03% |
Investor Class | 8.03% |
VIP Funds Manager 50% | |
Service Class | 3.87% |
Service Class 2 | 3.87% |
Investor Class | 3.87% |
VIP Funds Manager 60% | |
Service Class | 2.90% |
Service Class 2 | 2.90% |
Investor Class | 2.90% |
VIP Funds Manager 70% | |
Service Class | 2.00% |
Service Class 2 | 2.00% |
Investor Class | 2.00% |
VIP Funds Manager 85% | |
Service Class | 0.84% |
Service Class 2 | 0.84% |
Investor Class | 0.84% |
Annual Report
The amounts per share which represent income derived from sources within, and taxes paid to, foreign countries or possessions of the United States are as follows:
Fund | Pay Date | Income | Taxes |
VIP Funds Manager 20% | | | |
Service Class | 12/27/13 | $0.0185 | $0.0010 |
Service Class 2 | 12/27/13 | $0.0168 | $0.0010 |
Investor Class | 12/27/13 | $0.0185 | $0.0010 |
VIP Funds Manager 50% | | | |
Service Class | 12/27/13 | $0.0345 | $0.0021 |
Service Class 2 | 12/27/13 | $0.0311 | $0.0021 |
Investor Class | 12/27/13 | $0.0345 | $0.0021 |
VIP Funds Manager 60% | | | |
Service Class | 02/15/13 | $0.0002 | $0.0000 |
Service Class | 12/27/13 | $0.0429 | $0.0026 |
Service Class 2 | 02/15/13 | $0.0002 | $0.0000 |
Service Class 2 | 12/27/13 | $0.0404 | $0.0026 |
Investor Class | 02/15/13 | $0.0002 | $0.0000 |
Investor Class | 12/27/13 | $0.0429 | $0.0026 |
VIP Funds Manager 70% | | | |
Service Class | 12/27/13 | $0.0523 | $0.0032 |
Service Class 2 | 12/27/13 | $0.0484 | $0.0032 |
Investor Class | 12/27/13 | $0.0523 | $0.0032 |
VIP Funds Manager 85% | | | |
Service Class | 12/27/13 | $0.0574 | $0.0036 |
Service Class 2 | 12/27/13 | $0.0534 | $0.0036 |
Investor Class | 12/27/13 | $0.0574 | $0.0036 |
Annual Report
Board Approval of Investment Advisory Contracts and Management Fees
VIP FundsManager Funds
Each year, the Board of Trustees, including the Independent Trustees (together, the Board), votes on the renewal of the management contract (the Advisory Contract) with Strategic Advisers, Inc. (Strategic Advisers) and the administration agreement for each fund. The Board, assisted by the advice of fund counsel and Independent Trustees' counsel, requests and considers a broad range of information relevant to the renewal of the Advisory Contracts throughout the year.
The Board meets regularly and, at each of its meetings, covers an extensive agenda of topics and materials and considers factors that are relevant to its annual consideration of the renewal of each fund's Advisory Contract, including the services and support provided to each fund and its shareholders. The Board has established four standing committees, Operations, Audit, Fair Valuation, and Governance and Nominating, each composed of and chaired by Independent Trustees with varying backgrounds, to which the Board has assigned specific subject matter responsibilities in order to enhance effective decision-making by the Board. The Operations Committee, of which all of the Independent Trustees are members, meets regularly throughout the year and, among other matters, considers matters specifically related to the annual consideration of the renewal of each fund's Advisory Contract. The Board, acting directly and through its Committees, requests and receives information concerning the annual consideration of the renewal of each fund's Advisory Contract. The Board also meets as needed to consider matters specifically related to the Board's annual consideration of the renewal of Advisory Contracts. Members of the Board may also meet with trustees of other Fidelity funds through ad hoc joint committees to discuss certain matters relevant to the Fidelity funds.
At its September 2013 meeting, the Board, including the Independent Trustees, unanimously determined to renew each fund's Advisory Contract. In reaching its determination, the Board considered all factors it believed relevant, including (i) the nature, extent, and quality of the services to be provided to each fund and its shareholders (including the investment performance of each fund); (ii) the competitiveness of each fund's management fee and total expense ratio relative to peer funds; (iii) the total costs of the services to be provided by and the profits to be realized by Fidelity from its relationship with each fund; (iv) the extent to which economies of scale exist and would be realized as each fund grows; and (v) whether fee levels reflect these economies of scale, if any, for the benefit of fund shareholders.
In considering whether to renew the Advisory Contract for each fund, the Board reached a determination, with the assistance of fund counsel and Independent Trustees' counsel and through the exercise of its business judgment, that the renewal of the Advisory Contract was in the best interests of each fund and its shareholders and that the compensation payable under the Advisory Contracts was fair and reasonable. The Board's decision to renew the Advisory Contracts was not based on any single factor, but rather was based on a comprehensive consideration of all the information provided to the Board at its meetings throughout the year. The Board, in reaching its determination to renew the Advisory Contracts, was aware that shareholders in each fund have a broad range of investment choices available to them, including a wide choice among mutual funds offered by Fidelity's competitors, and that each fund's shareholders, who have the opportunity to review and weigh the disclosure provided by the fund in its prospectus and other public disclosures, have chosen to invest in that fund, which is part of the Fidelity family of funds.
Nature, Extent, and Quality of Services Provided. The Board considered Fidelity's staffing as it relates to the funds, including the backgrounds of investment personnel of Strategic Advisers, and also considered the funds' investment objectives, strategies, and related investment philosophies. The Independent Trustees also had discussions with senior management of Fidelity's investment operations and investment groups with responsibility for the underlying Fidelity funds in which each fund invests. The Board considered the structure of the portfolio manager compensation program and whether this structure provides appropriate incentives to act in the best interests of each fund.
Resources Dedicated to Investment Management and Support Services. The Board reviewed the general qualifications and capabilities of Fidelity's investment staff, including its size, education, experience, and resources, as well as Fidelity's approach to recruiting, managing, and compensating investment personnel. The Board noted that Fidelity has continued to increase the resources devoted to non-U.S. offices, including expansion of Fidelity's global investment organization. The Board also noted that Fidelity's analysts have extensive resources, tools and capabilities that allow them to conduct sophisticated quantitative and fundamental analysis, as well as credit analysis of issuers, counterparties and guarantors. Further, the Board believes that Fidelity's investment professionals have sufficient access to global information and data so as to provide competitive investment results over time, and that those professionals also have access to sophisticated tools that permit them to assess portfolio construction and risk and performance attribution characteristics continuously, as well as to transmit new information and research conclusions rapidly around the world. Additionally, in its deliberations, the Board considered Fidelity's risk management capabilities and resources, which are an integral part of the investment management process.
Shareholder and Administrative Services. The Board considered (i) the nature, extent, quality, and cost of advisory, administrative, and shareholder services performed by Fidelity affiliates under the Advisory Contract and the administration agreement and under separate agreements covering transfer agency and pricing and bookkeeping services for each fund; (ii) the nature and extent of the supervision of third party service providers, principally custodians and subcustodians; and (iii) the resources devoted to, and the record of compliance with, each fund's compliance policies and procedures.
Annual Report
Board Approval of Investment Advisory Contracts and Management Fees - continued
The Board noted that the growth of fund assets over time across the complex allows Fidelity to reinvest in the development of services designed to enhance the value or convenience of the Fidelity funds as investment vehicles. These services include 24-hour access to account information and market information through telephone representatives and over the Internet, investor education materials and asset allocation tools, and the expanded availability of Fidelity Investor Centers.
Investment in a Large Fund Family. The Board considered the benefits to shareholders of investing in a Fidelity fund, including the benefits of investing in a fund that is part of a large family of funds offering a variety of investment disciplines and providing a large variety of mutual fund investor services. The Board noted that Fidelity had taken, or had made recommendations that resulted in the Fidelity funds taking, a number of actions over the previous year that benefited particular funds, including (i) continuing to dedicate additional resources to investment research and to the support of the senior management team that oversees asset management; (ii) persisting in efforts to enhance Fidelity's global research capabilities; (iii) launching new funds and making other enhancements to meet client needs for global and income-oriented solutions; (iv) continuing to launch dedicated lower cost underlying funds to meet portfolio construction needs related to expanding underlying fund options for Fidelity funds of funds, specifically for the Freedom Fund product lines; (v) rationalizing product lines and gaining increased efficiencies through the combination of several funds with other funds; (vi) strengthening Fidelity's index fund offerings by reducing investment minimums and adopting or lowering existing expense caps for certain funds and classes; (vii) enhancing Global Asset Allocation product offerings by launching new funds and strategies, including "open architecture" target date funds that utilize affiliated and unaffiliated sub-advisers; (viii) modifying the eligibility criteria for Institutional Class shares of Advisor funds to increase their marketability to a portion of the defined contribution plan market; (ix) creating a new low-cost retirement share class for certain Advisor funds to appeal to large retirement plans; (x) transitioning the management of certain Fidelity commodity funds to Geode Capital Management LLC, a registered commodity pool operator, while retaining administrative responsibilities for the funds; and (xi) taking steps toward establishing a new Fidelity adviser to manage sector-based funds and products.
Investment Performance. The Board considered whether each fund has operated in accordance with its investment objective, as well as its record of compliance with its investment restrictions and its performance history.
The Board took into account discussions with the investment adviser about fund investment performance that occur at Board meetings throughout the year. In this regard the Board noted that as part of regularly scheduled fund reviews and other reports to the Board on fund performance, the Board periodically considers annualized return information for each fund for different time periods, measured against one or more securities market indices, including a customized blended index representative of the fund's asset classes (each a "benchmark index") and a peer group of mutual funds with similar objectives ("peer group"). In its evaluation of fund investment performance at meetings throughout the year, the Board gave particular attention to information indicating underperformance of certain Fidelity funds for specific time periods and the investment adviser's explanations for such underperformance.
In addition to reviewing absolute and relative fund performance, the Independent Trustees periodically consider the appropriateness of fund performance metrics in evaluating the results achieved. In general, the Independent Trustees believe that fund performance should be evaluated based on gross performance (before fees and expenses, including acquired fund fees and expenses, but after transaction costs, if any) compared to appropriate benchmark indices, over appropriate time periods that may include full market cycles, and on net performance (after fees and expenses) compared to peer groups, as applicable, over the same periods, taking into account relevant factors including the following: general market conditions; the extent to which particular underlying funds affected performance; and fund cash flows and other factors. Depending on the circumstances, the Independent Trustees may be satisfied with a fund's performance notwithstanding that it lags its benchmark index or peer group for certain periods.
The Independent Trustees recognize that shareholders evaluate performance on a net basis over their own holding periods, for which one-, three-, and five-year periods are often used as a proxy. For this reason, the performance information reviewed by the Board also included net cumulative calendar year total return information for each fund and an appropriate benchmark index for the most recent one-, three-, and five-year periods.
Based on its review, the Board concluded that the nature, extent, and quality of services provided to each fund under the Advisory Contract should benefit each fund's shareholders.
Competitiveness of Management Fee and Total Expense Ratio. The Board considered each fund's management fee and total expense ratio compared to "mapped groups" of competitive funds and classes, and also considered that each fund bears indirectly the expenses of the underlying Fidelity funds in which it invests. Fidelity creates "mapped groups" by combining similar Lipper investment objective categories that have comparable investment mandates. Combining Lipper investment objective categories aids the Board's management fee and total expense ratio comparisons by broadening the competitive group used for comparison and by reducing the number of universes to which various Fidelity funds are compared.
Management Fee. The Board considered two proprietary management fee comparisons for the 12-month periods shown in the charts below. The group of Lipper funds used by the Board for management fee comparisons is referred to below as the "Total Mapped Group." The Total Mapped Group comparison focuses on a fund's standing in terms of gross management fees before expense reimbursements or caps relative to the total universe of funds with comparable investment mandates, regardless of whether their management fee structures also are comparable. "TMG %" represents the percentage of funds in the Total Mapped Group that had management fees that were lower than a fund's. For example, a hypothetical TMG % of 50% would mean that half of the funds in the Total Mapped Group had higher, and half had lower, management fees than a fund. The funds' actual TMG %s are in the charts below. The "Asset-Size Peer Group" (ASPG) comparison focuses on a fund's standing relative to a subset of non-Fidelity funds within the Total Mapped Group that are similar in size and management fee structure. For example, if a fund is in the first quartile of the ASPG, the fund's management fee ranks in the least expensive or lowest 25% of funds in the ASPG. The ASPG represents at least 15% of the funds in the Total Mapped Group with comparable asset size and management fee structures, subject to a minimum of 50 funds (or all funds in the Total Mapped Group if fewer than 50). Additional information, such as the ASPG quartile in which a fund's management fee rate ranked, is also included in the charts and considered by the Board. Because the vast majority of competitor funds' management fees do not cover non-management expenses, for a more meaningful comparison of management fees, each fund is compared on the basis of a hypothetical "net management fee," which is derived by subtracting payments made by FMR (under the administration agreement) for non-management expenses (including pricing and bookkeeping fees and fees paid to non-affiliated custodians) from the fund's all-inclusive fee. In this regard, the Board considered that net management fees can vary from year to year because of differences in non-management expenses.
Annual Report
VIP FundsManager 20%
VIP FundsManager 50%
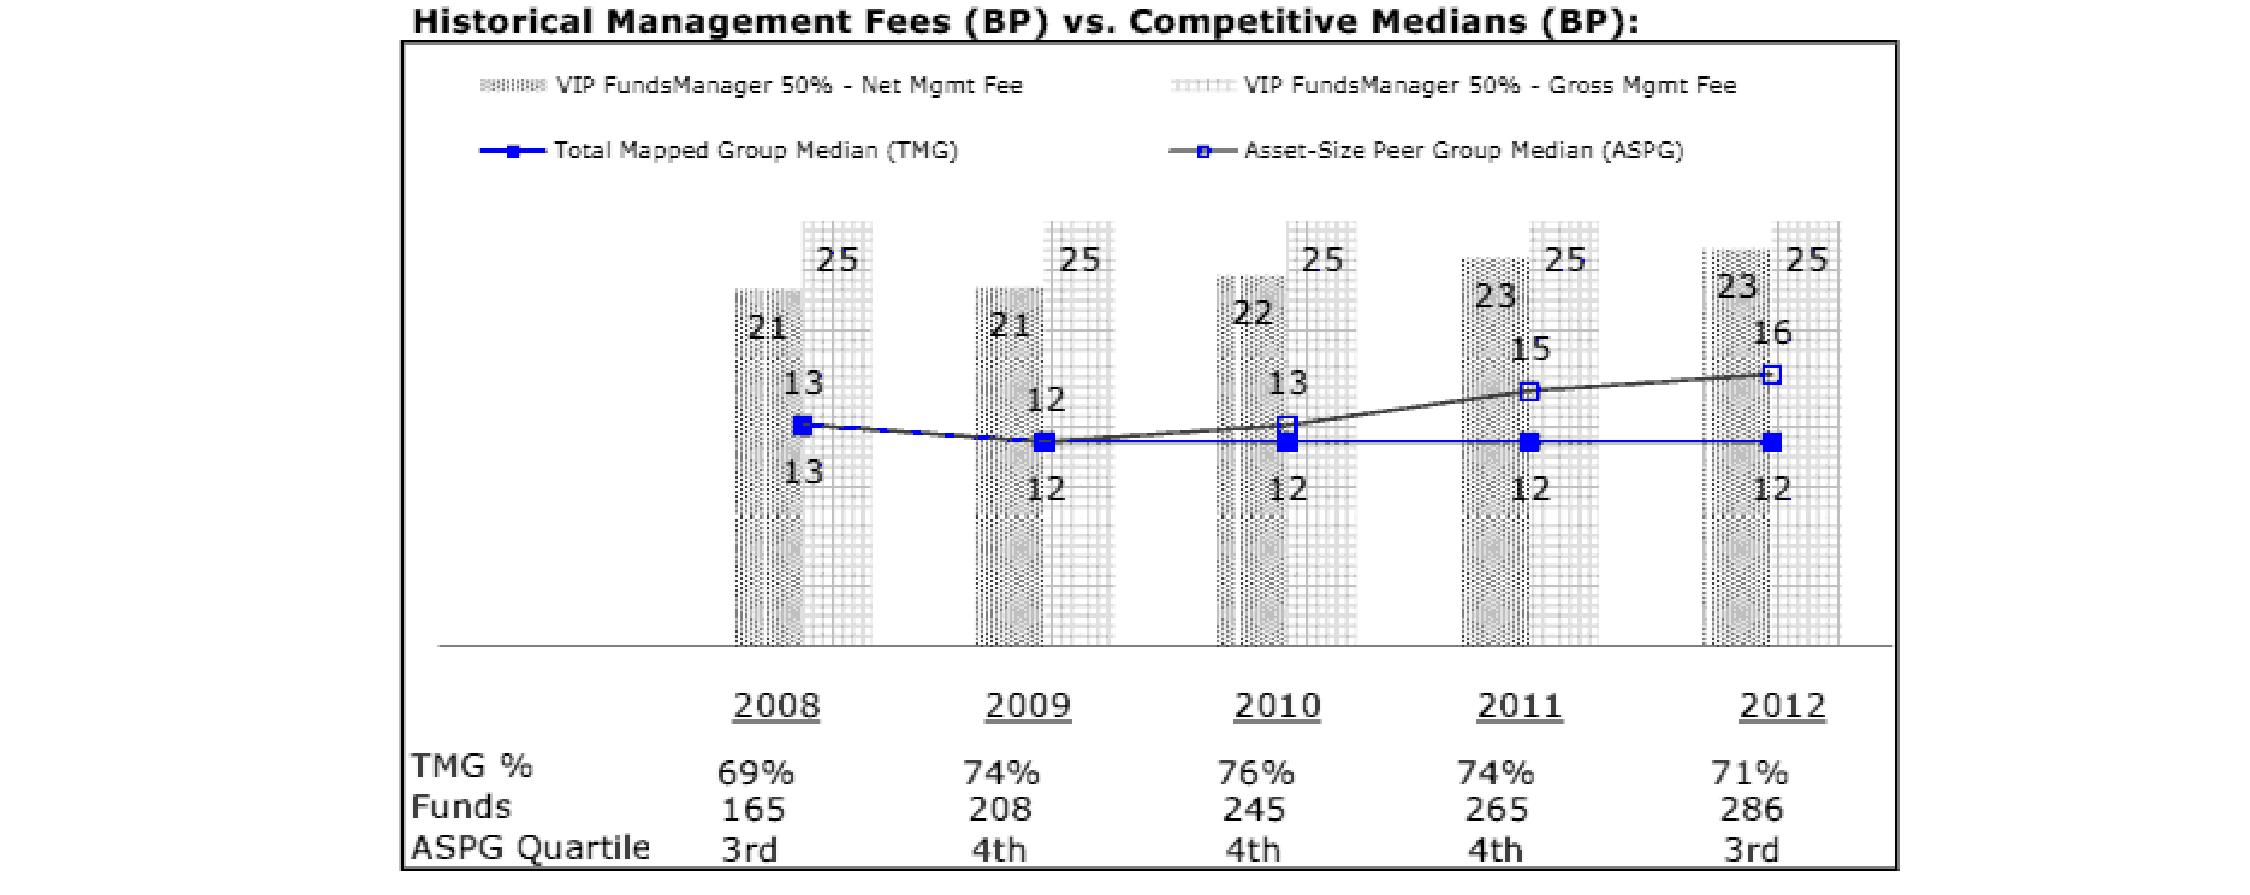
Annual Report
Board Approval of Investment Advisory Contracts and Management Fees - continued
VIP FundsManager 60%
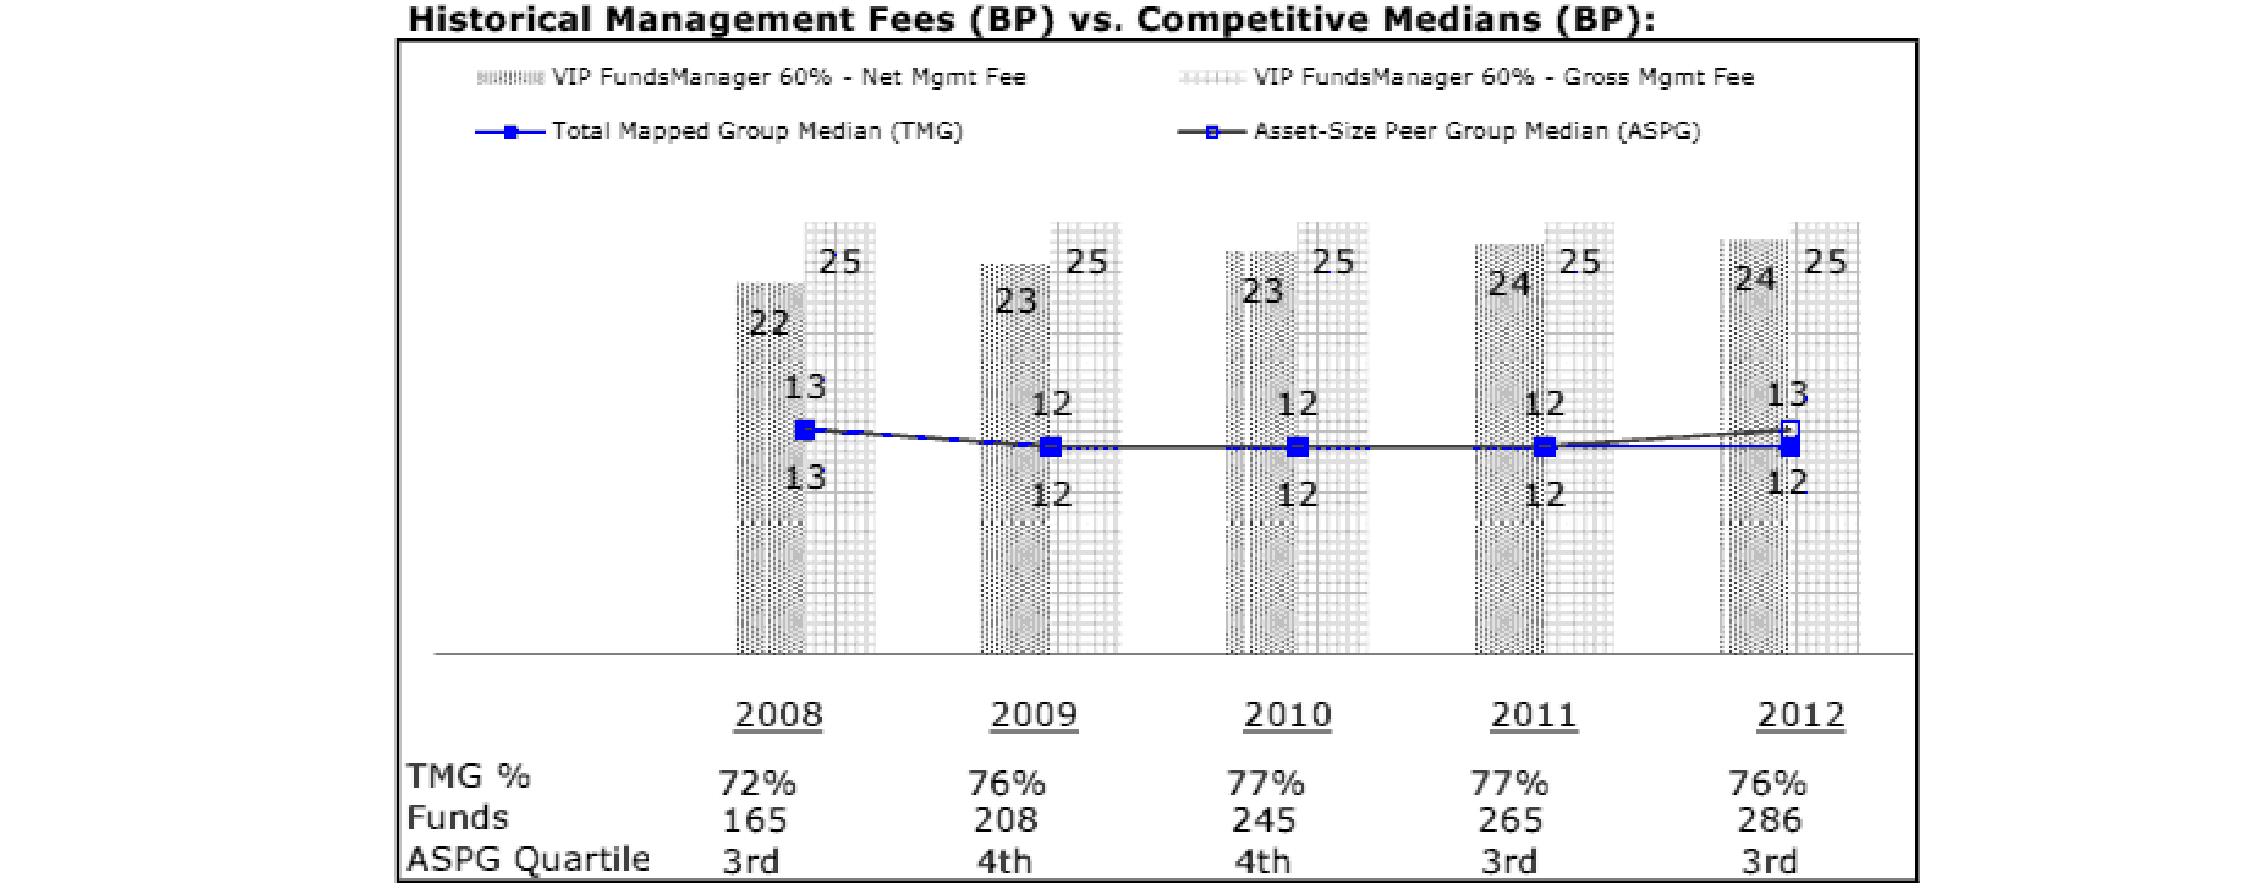
VIP FundsManager 70%
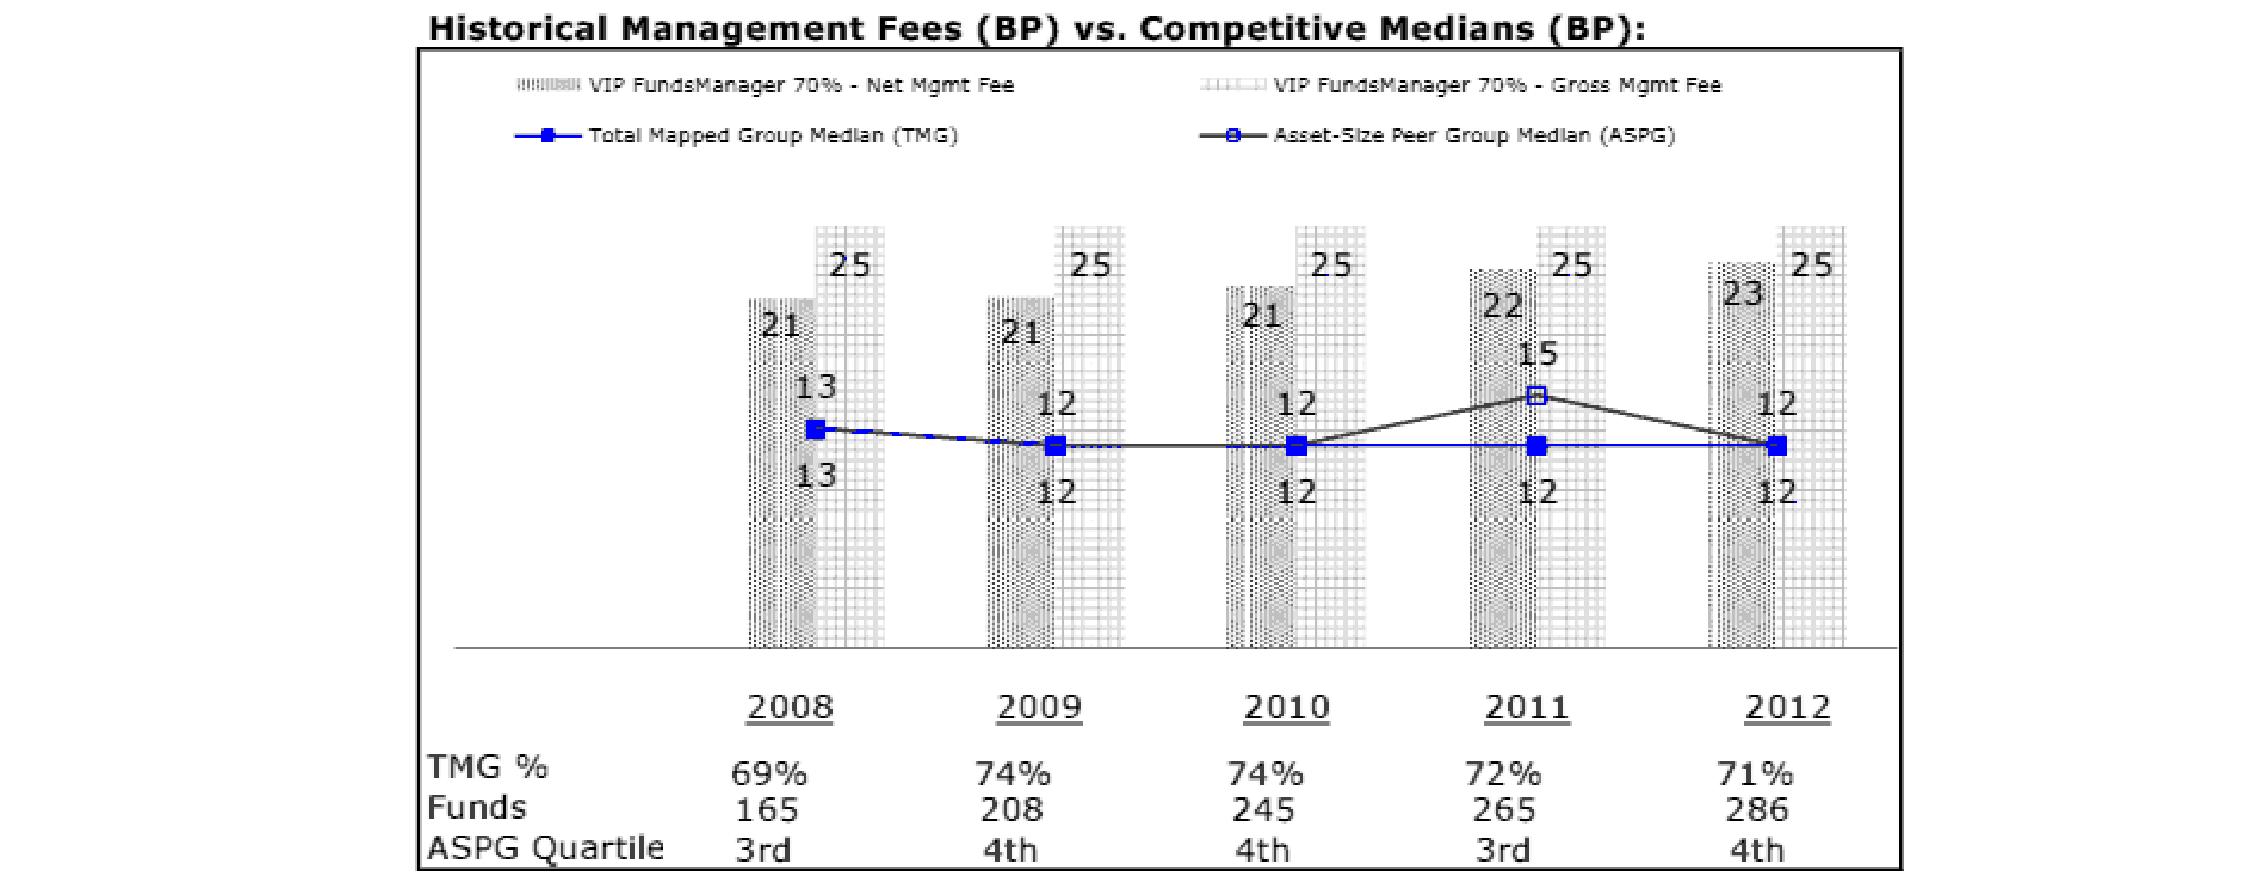
Annual Report
VIP FundsManager 85%
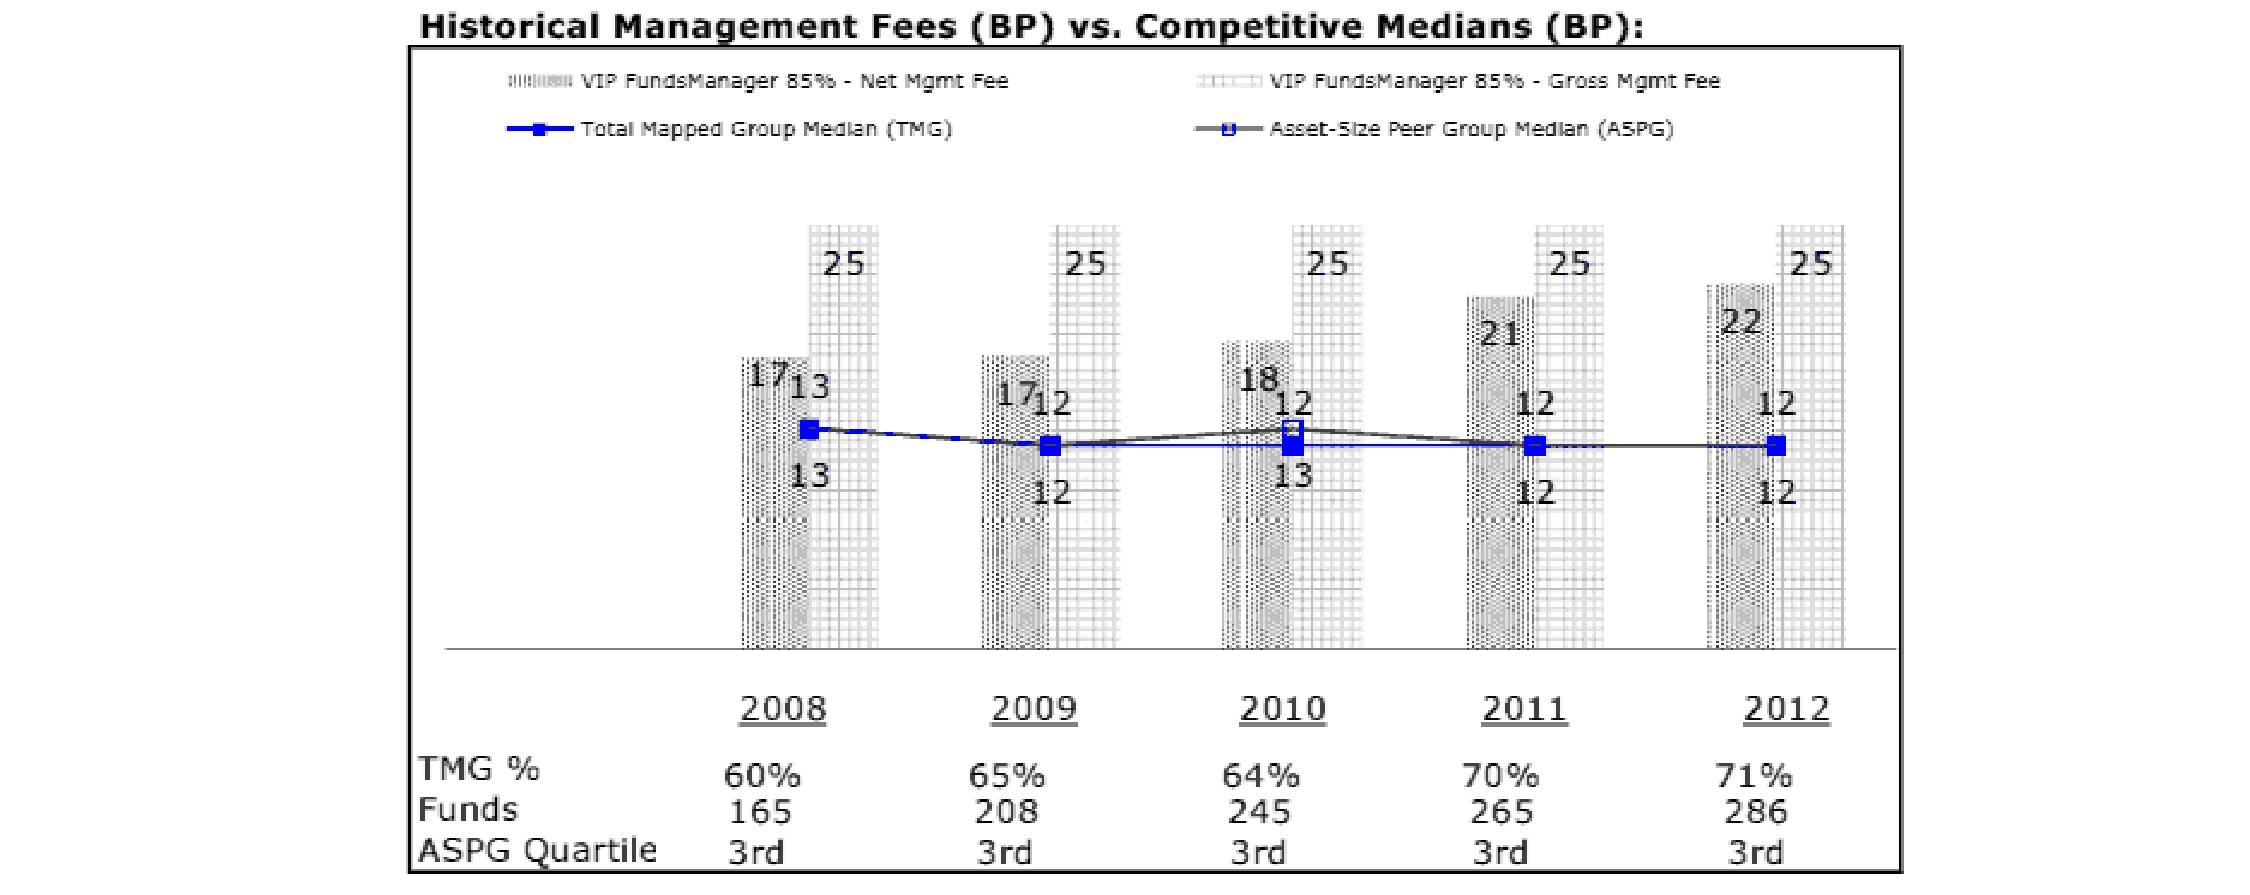
The Board noted that each fund's hypothetical net management fee rate ranked above the median of its Total Mapped Group and above the median of its ASPG for 2012. The Board considered that the funds are more actively managed than most funds in their TMG and ASPG, many of which are target date funds.
Furthermore, the Board considered that Strategic Advisers contractually agreed to waive 0.05% of each fund's management fee through April 30, 2014.
Based on its review, the Board concluded that each fund's management fee is fair and reasonable in light of the services that the fund receives and the other factors considered.
Total Expense Ratio. In its review of the total expense ratio of each class of each fund, the Board considered the fund's hypothetical net management fee as well as the fund's all-inclusive fee. The Board also considered other expenses, such as pricing and bookkeeping fees and custodial, legal, and audit fees, paid by Fidelity Management & Research Company (FMR) under the administration agreement. The Board also noted the effects of any waivers and reimbursements on fees and expenses. As part of its review, the Board also considered the current and historical total expense ratios of each fund compared to competitive fund median expenses. Each fund is compared to those funds and classes in the Total Mapped Group (used by the Board for management fee comparisons) that have a similar sales load structure.
The Board noted that the total expense ratio of each of Investor Class and Service Class of each fund ranked below its competitive median for 2012 and the total expense ratio of Service Class 2 of each fund ranked above its competitive median for 2012. The Board considered that, in general, various factors can affect total expense ratios. The Board noted that the total expense ratio of Service Class 2 was above the competitive median primarily because of higher 12b-1 fees for Service Class 2 as compared to most competitor funds. The Board noted that each fund offers multiple classes, each of which has a different 12b-1 fee structure, and that the multiple structures are intended to offer a range of pricing options for the intermediary market. The Board also noted that the total expense ratios of the classes of each fund vary primarily by the level of their 12b-1 fees.
The Board further considered that FMR contractually agreed to reimburse 0.10% of "class-level" expenses for Service Class and Service Class 2 as long as these classes continue to be sold to unaffiliated insurance companies.
Fees Charged to Other Fidelity Clients. The Board also considered Fidelity fee structures and other information with respect to clients of Fidelity, such as other mutual funds advised or subadvised by Fidelity, pension plan clients, and other institutional clients. The Board noted the findings of the 2013 ad hoc joint committee (created with the board of other Fidelity funds), which reviewed and compared Fidelity's institutional investment advisory business with its business of providing services to the Fidelity funds, including the differences in services provided, fees charged, and costs incurred, as well as competition in their respective marketplaces.
Based on its review of total expense ratios and fees charged to other Fidelity clients, the Board concluded that the total expense ratio of each class of each fund was reasonable, although Service Class 2 was above the median of the universe presented for comparison, in light of the services that the fund and its shareholders receive and the other factors considered.
Costs of the Services and Profitability. The Board considered the revenues earned and the expenses incurred by Fidelity in conducting the business of developing, marketing, distributing, managing, administering and servicing each fund and servicing each fund's shareholders. The Board also considered the level of Fidelity's profits in respect of all the Fidelity funds, including the Fidelity funds in which the funds invest.
Annual Report
Board Approval of Investment Advisory Contracts and Management Fees - continued
On an annual basis, Fidelity presents to the Board Fidelity's profitability for each fund. Fidelity calculates the profitability for each fund, as well as aggregate profitability for groups of Fidelity funds and all Fidelity funds, using a series of detailed revenue and cost allocation methodologies which originate with the books and records of Fidelity on which Fidelity's audited financial statements are based. The Audit Committee of the Board reviews any significant changes from the prior year's methodologies.
PricewaterhouseCoopers LLP (PwC), independent registered public accounting firm and auditor to Fidelity and certain Fidelity funds, has been engaged annually by the Board as part of the Board's assessment of Fidelity's profitability analysis. PwC's engagement includes the review and assessment of the methodologies used by Fidelity in determining the revenues and expenses attributable to Fidelity's mutual fund business, and completion of agreed-upon procedures surrounding the mathematical accuracy of fund profitability and its conformity to allocation methodologies. After considering PwC's reports issued under the engagement and information provided by Fidelity, the Board concluded that while other allocation methods may also be reasonable, Fidelity's profitability methodologies are reasonable in all material respects.
The Board also reviewed Fidelity's non-fund businesses and fall-out benefits related to the mutual fund business as well as cases where Fidelity's affiliates may benefit from or be related to the funds' business.
The Board considered the costs of the services provided by and the profits realized by Fidelity in connection with the operation of each fund and was satisfied that the profitability was not excessive in the circumstances.
Economies of Scale. The Board considered whether there have been economies of scale in respect of the management of the Fidelity funds, whether the Fidelity funds (including each fund) have appropriately benefited from any such economies of scale, and whether there is potential for realization of any further economies of scale. The Board considered the extent to which each fund will benefit from economies of scale through increased services to the fund, through waivers or reimbursements, or through fee or expense reductions. The Board also noted that in 2009, it and the board of other Fidelity funds created an ad hoc committee (the Economies of Scale Committee) to analyze whether Fidelity attains economies of scale in respect of the management and servicing of the Fidelity funds, whether the Fidelity funds have appropriately benefited from such economies of scale, and whether there is potential for realization of any further economies of scale.
The Board concluded, taking into account the analysis of the Economies of Scale Committee, that economies of scale, if any, are being appropriately shared between fund shareholders and Fidelity.
Additional Information Requested by the Board. In order to develop fully the factual basis for consideration of the Fidelity funds' Advisory Contracts, the Board requested and received additional information on certain topics, including: (i) Fidelity's fund profitability methodology, profitability trends for certain funds, and the impact of certain factors on fund profitability results; (ii) portfolio manager changes that have occurred during the past year and the amount of the investment that each portfolio manager has made in the Fidelity fund(s) that he or she manages; (iii) Fidelity's compensation structure for portfolio managers, research analysts, and other key personnel, including its effects on fund profitability, the rationale for the compensation structure, and the extent to which current market conditions have affected retention and recruitment; (iv) the arrangements with and compensation paid to certain fund sub-advisers on behalf of the Fidelity funds; (v) Fidelity's fee structures, including the group fee structure and definition of group assets, and the rationale for recommending different fees among different categories of funds and classes; (vi) Fidelity's voluntary waiver of its fees to maintain minimum yields for certain money market funds and classes as well as contractual waivers in place for certain funds; (vii) the methodology with respect to competitive fund data and peer group classifications; (viii) Fidelity's transfer agent fee, expense, and service structures for different funds and classes, and the impact of the increased use of omnibus accounts; and (ix) explanations regarding the relative total expense ratios of certain funds and classes, total expense competitive trends and methodologies for total expense competitive comparisons, and actions that might be taken by Fidelity to reduce total expense ratios for certain funds and classes or to achieve further economies of scale.
Based on its evaluation of all of the conclusions noted above, and after considering all factors it believed relevant, the Board ultimately concluded that the advisory fee structures are fair and reasonable, and that each fund's Advisory Contract should be renewed.
Annual Report
Investment Adviser
Strategic Advisers, Inc.
Boston, MA
General Distributor
Fidelity Distributors Corporation
Smithfield, RI
Transfer and Service Agents
Fidelity Investments Institutional Operations Company, Inc.
Boston, MA
Fidelity Service Company, Inc.
Boston, MA
Custodian
The Bank of New York Mellon
New York, NY
VIPFM-ANN-0214
1.843208.107
Fidelity® Variable Insurance Products:
Investment Grade Bond Portfolio
Annual Report
December 31, 2013
(Fidelity Cover Art)
Contents
Performance | (Click Here) | How the fund has done over time. |
Management's Discussion of Fund Performance | (Click Here) | The Portfolio Manager's review of fund performance and strategy. |
Shareholder Expense Example | (Click Here) | An example of shareholder expenses. |
Investment Changes | (Click Here) | A summary of major shifts in the fund's investments over the past six months. |
Investments | (Click Here) | A complete list of the fund's investments with their market values. |
Financial Statements | (Click Here) | Statements of assets and liabilities, operations, and changes in net assets, as well as financial highlights. |
Notes | (Click Here) | Notes to the financial statements. |
Report of Independent Registered Public Accounting Firm | (Click Here) | |
Trustees and Officers | (Click Here) | |
Distributions | (Click Here) | |
Board Approval of Investment Advisory Contracts and Management Fees | (Click Here) | |
Fidelity® VIP Investment Grade Central Fund Financial Statements | 30 | Complete list of investments and financial statements for Fidelity® VIP Investment Grade Central Fund. |
To view a fund's proxy voting guidelines and proxy voting record for the 12-month period ended June 30, visit http://www.fidelity.com/proxyvotingresults or visit the Securities and Exchange Commission's (SEC) web site at http://www.sec.gov. You may also call 1-877-208-0098 to request a free copy of the proxy voting guidelines.
Fidelity Variable Insurance Products are separate account options which are purchased through a variable insurance contract.
Standard & Poor's, S&P and S&P 500 are registered service marks of The McGraw-Hill Companies, Inc. and have been licensed for use by Fidelity Distributors Corporation.
Other third-party marks appearing herein are the property of their respective owners.
All other marks appearing herein are registered or unregistered trademarks or service marks of FMR LLC or an affiliated company. © 2014 FMR LLC. All rights reserved.
This report and the financial statements contained herein are submitted for the general information of the shareholders of the fund. This report is not authorized for distribution to prospective investors in the fund unless preceded or accompanied by an effective prospectus.
A fund files its complete schedule of portfolio holdings with the SEC for the first and third quarters of each fiscal year on Form N-Q. Forms N-Q are available on the SEC's web site at http://www.sec.gov. A fund's Forms N-Q may be reviewed and copied at the SEC's Public Reference Room in Washington, DC. Information regarding the operation of the SEC's Public Reference Room may be obtained by calling 1-800-SEC-0330. For a complete list of a fund's portfolio holdings, view the most recent holdings listing, semiannual report, or annual report on Fidelity's web site at http://www.fidelity.com, http://www.advisor.fidelity.com, or http://www.401k.com, as applicable.
NOT FDIC INSURED • MAY LOSE VALUE • NO BANK GUARANTEE
Neither the fund nor Fidelity Distributors Corporation is a bank.
Annual Report
Average annual total return reflects the change in the value of an investment, assuming reinvestment of the class' distributions from dividend income and capital gains (the profits earned upon the sale of securities that have grown in value, if any) and assuming a constant rate of performance each year. During periods of reimbursement by Fidelity, a fund's total return will be greater than it would be had the reimbursement not occurred. Performance numbers are net of all underlying fund operating expenses, but do not include any insurance charges imposed by your insurance company's separate account. If performance information included the effect of these additional charges, the total returns would have been lower. How a fund did yesterday is no guarantee of how it will do tomorrow.
Average Annual Total Returns
Periods ended December 31, 2013 | Past 1
year | Past 5
years | Past 10
years |
VIP Investment Grade Bond Portfolio - Initial Class | -1.78% | 6.85% | 4.59% |
VIP Investment Grade Bond Portfolio - Service Class | -1.89% | 6.74% | 4.48% |
VIP Investment Grade Bond Portfolio - Service Class 2 | -1.99% | 6.59% | 4.33% |
VIP Investment Grade Bond Portfolio - Investor Class A | -1.82% | 6.82% | 4.56% |
A The initial offering of Investor Class shares took place on July 21, 2005. Returns prior to July 21, 2005 are those of Initial Class. Had Investor Class's transfer agent fee been reflected, returns prior to July 21, 2005, would have been lower.
$10,000 Over 10 Years
Let's say hypothetically that $10,000 was invested in VIP Investment Grade Bond Portfolio - Initial Class on December 31, 2003. The chart shows how the value of your investment would have changed, and also shows how the Barclays® U.S. Aggregate Bond Index performed over the same period.
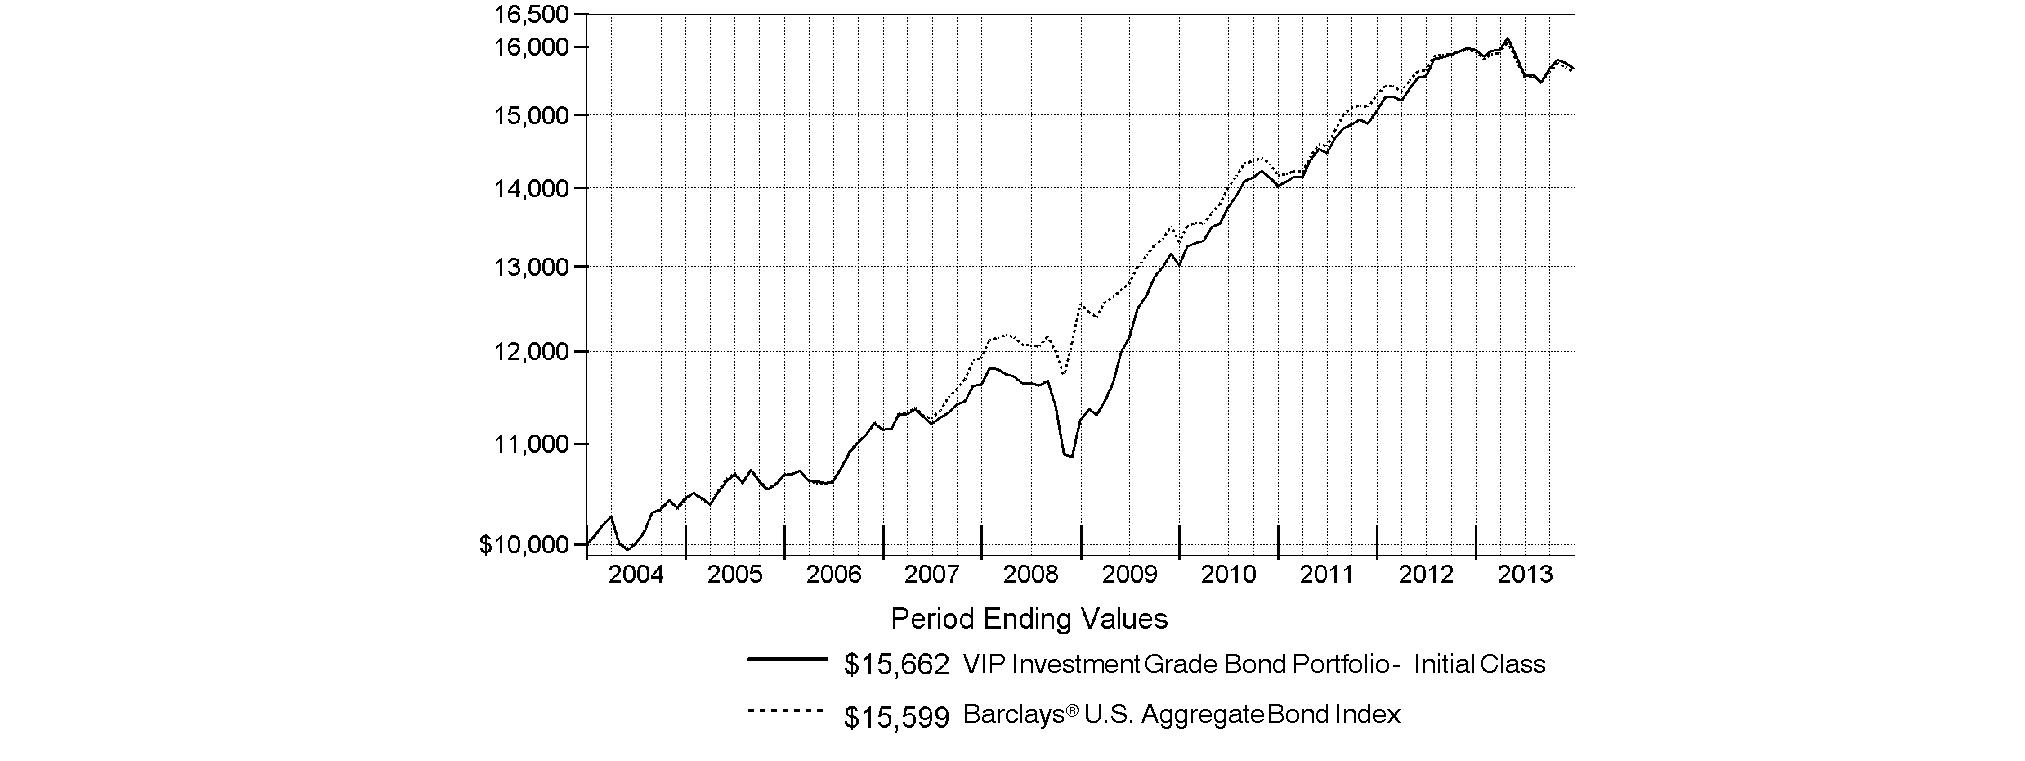
Annual Report
Market Recap: The prospect of tighter monetary policy weighed on U.S. taxable investment-grade bonds during the 12-month period ending December 31, 2013, resulting in a -2.02% return for the Barclays® U.S. Aggregate Bond Index. Much of the damage occurred from May through August, as interest rates spiked higher amid signals from the U.S. Federal Reserve that it could begin tapering its stimulative bond-buying programs prior to year-end, prompting waves of investor outflows. Surprisingly strong global economic data also tempered demand for higher-quality, rate-sensitive bonds. The market staged a bit of rebound in September and October because the Fed refrained from tapering. But the period ended on a weak note, when better-than-expected economic news revived the specter of tapering and the Fed announced it would begin to dial back its bond purchases in January 2014. U.S. Treasuries and mortgage-backed securities returned -2.75% and -1.41%, respectively, while government-agency securities returned -1.38%. Investment-grade credit also lost ground, returning -2.01%, due to rising interest rates and investors' intermittent aversion to riskier assets. Thanks largely to their higher yields, commercial mortgage-backed securities fared best, advancing 0.23%.
Comments from Ford O'Neil, Portfolio Manager of VIP Investment Grade Bond Portfolio: For the year, the performance of the fund's share classes, net of expenses, outpaced the Barclays® U.S. Aggregate Bond Index. Nearly all of the fund's assets were invested in VIP Investment Grade Central Fund - an investment-grade pool I manage for several VIP funds, including Investment Grade Bond - with the remainder spread among individual securities, cash equivalents and Fidelity® Specialized High Income Central Fund. Management of the fund's exposure to the latter was a small plus for the period. Among investment-grade securities, favorable positioning among corporate bonds was beneficial, most notably our heavier-than-benchmark exposure to financials and security selection within industrials. An overweighting in commercial mortgage-backed securities (CMBS) delivered a meaningful boost, while timely purchases of taxable municipal bonds issued in California and Illinois also helped. An underweighting in sovereign bonds, particularly our lack of exposure to those issued by Turkey, aided performance. In contrast, yield-curve positioning detracted. The fund was overweighted in intermediate-maturity U.S. Treasuries and shorter-term bonds, which proved detrimental as the intermediate-maturity securities were among the market's worst performers.
The views expressed above reflect those of the portfolio manager(s) only through the end of the period as stated on the cover of this report and do not necessarily represent the views of Fidelity or any other person in the Fidelity organization. Any such views are subject to change at any time based upon market or other conditions and Fidelity disclaims any responsibility to update such views. These views may not be relied on as investment advice and, because investment decisions for a Fidelity fund are based on numerous factors, may not be relied on as an indication of trading intent on behalf of any Fidelity fund.
Annual Report
As a shareholder of the Fund, you incur two types of costs: (1) transaction costs, and (2) ongoing costs, including management fees, distribution and/or service (12b-1) fees and other Fund expenses. This Example is intended to help you understand your ongoing costs (in dollars) of investing in the Fund and to compare these costs with the ongoing costs of investing in other mutual funds.
The Example is based on an investment of $1,000 invested at the beginning of the period and held for the entire period (July 1, 2013 to December 31, 2013).
Actual Expenses
The first line of the accompanying table for each class of the Fund provides information about actual account values and actual expenses. You may use the information in this line, together with the amount you invested, to estimate the expenses that you paid over the period. Simply divide your account value by $1,000.00 (for example, an $8,600 account value divided by $1,000.00 = 8.6), then multiply the result by the number in the first line for a class of the Fund under the heading entitled "Expenses Paid During Period" to estimate the expenses you paid on your account during this period. The estimate of expenses does not include any fees or other expenses of any variable annuity or variable life insurance product. If they were, the estimate of expenses you paid during the period would be higher, and your ending account value would be lower. In addition, the Fund, as a shareholder in the underlying Fidelity Central Funds, will indirectly bear its pro-rata share of the fees and expenses incurred by the underlying Fidelity Central Funds. These fees and expenses are not included in the Fund's annualized expense ratio used to calculate the expense estimate in the table below.
Hypothetical Example for Comparison Purposes
The second line of the accompanying table for each class of the Fund provides information about hypothetical account values and hypothetical expenses based on a Class' actual expense ratio and an assumed rate of return of 5% per year before expenses, which is not the Class' actual return. The hypothetical account values and expenses may not be used to estimate the actual ending account balance or expenses you paid for the period. You may use this information to compare the ongoing costs of investing in the Fund and other funds. To do so, compare this 5% hypothetical example with the 5% hypothetical examples that appear in the shareholder reports of the other funds. The estimate of expenses does not include any fees or other expenses of any variable annuity or variable life insurance product. If they were, the estimate of expenses you paid during the period would be higher, and your ending account value would be lower. In addition, the Fund, as a shareholder in the underlying Fidelity Central Funds, will indirectly bear its pro-rata share of the fees and expenses incurred by the underlying Fidelity Central Funds. These fees and expenses are not included in the Fund's annualized expense ratio used to calculate the expense estimate in the table below.
Please note that the expenses shown in the table are meant to highlight your ongoing costs only and do not reflect any transaction costs. Therefore, the second line of the table is useful in comparing ongoing costs only, and will not help you determine the relative total costs of owning different funds.
| Annualized Expense RatioB | Beginning
Account Value
July 1, 2013 | Ending
Account Value
December 31, 2013 | Expenses Paid
During Period*
July 1, 2013 to
December 31, 2013 |
Initial Class | .41% | | | |
Actual | | $ 1,000.00 | $ 1,006.90 | $ 2.07 |
HypotheticalA | | $ 1,000.00 | $ 1,023.14 | $ 2.09 |
Service Class | .51% | | | |
Actual | | $ 1,000.00 | $ 1,006.00 | $ 2.58 |
HypotheticalA | | $ 1,000.00 | $ 1,022.63 | $ 2.60 |
Service Class 2 | .66% | | | |
Actual | | $ 1,000.00 | $ 1,006.10 | $ 3.34 |
HypotheticalA | | $ 1,000.00 | $ 1,021.88 | $ 3.36 |
Investor Class | .44% | | | |
Actual | | $ 1,000.00 | $ 1,007.30 | $ 2.23 |
HypotheticalA | | $ 1,000.00 | $ 1,022.99 | $ 2.24 |
A 5% return per year before expenses
B Annualized expense ratio reflects expenses net of applicable fee waivers.
* Expenses are equal to each Class' annualized expense ratio, multiplied by the average account value over the period, multiplied by 184/365 (to reflect the one-half year period). The fees and expenses of the underlying Fidelity Central Funds in which the Fund invests are not included in each Class' annualized expense ratio.
In addition to the expenses noted above, the Fund also indirectly bears its proportional share of the expenses of the underlying Fidelity Central Funds. Annualized expenses of the underlying non-money market Fidelity Central Funds as of their most recent fiscal half year were less than .01%.
Annual Report
Investment Changes (Unaudited)
Quality Diversification (% of fund's net assets) |
As of December 31, 2013 | As of June 30, 2013 |
 | U.S. Government
and U.S. Government
Agency Obligations 51.5% | | | U.S. Government
and U.S. Government
Agency Obligations 61.9% | |
 | AAA 4.5% | | | AAA 2.5% | |
 | AA 2.8% | | | AA 2.4% | |
 | A 9.0% | | | A 9.1% | |
 | BBB 23.7% | | | BBB 18.0% | |
 | BB and Below 3.6% | | | BB and Below 3.3% | |
 | Not Rated 0.1% | | | Not Rated 0.1% | |
 | Short-Term Investments
and Net Other Assets 4.8% | | | Short-Term Investments
and Net Other Assets 2.7% | |

We have used ratings from Moody's Investors Service, Inc. Where Moody's® ratings are not available, we have used S&P® ratings. All ratings are as of the date indicated and do not reflect subsequent changes. Securities rated BB or below were rated investment grade at the time of acquisition. The information in the above table is based on the combined investments of the Fund and its pro-rata share of the investments of Fidelity's fixed-income central funds. |
Weighted Average Maturity as of December 31, 2013 |
| | 6 months ago |
Years | 6.7 | 6.4 |
This is a weighted average of all the maturities of the securities held in a fund. Weighted Average Maturity (WAM) can be used as a measure of sensitivity to interest rate changes and market changes. Generally, the longer the maturity, the greater the sensitivity to such changes. WAM is based on the dollar-weighted average length of time until principal payments must be paid. Depending on the types of securities held in a fund, certain maturity shortening devices (e.g., demand features, interest rate resets, and call options) may be taken into account when calculating the WAM. |
Duration as of December 31, 2013 |
| | 6 months ago |
Years | 5.4 | 5.5 |
Duration is a measure of a security's price sensitivity to changes in interest rates. Duration differs from maturity in that it considers a security's interest payments in addition to the amount of time until the security reaches maturity, and also takes into account certain maturity shortening features (e.g., demand features, interest rate resets, and call options) when applicable. Securities with longer durations generally tend to be more sensitive to interest rate changes than securities with shorter durations. A fund with a longer average duration generally can be expected to be more sensitive to interest rate changes than a fund with a shorter average duration. |
Asset Allocation (% of fund's net assets) |
As of December 31, 2013* | As of June 30, 2013** |
| Corporate Bonds 31.4% | | | Corporate Bonds 27.3% | |
| U.S. Government
and U.S. Government
Agency Obligations 51.5% | | | U.S. Government
and U.S. Government
Agency Obligations 61.9% | |
| Asset-Backed Securities 1.0% | | | Asset-Backed Securities 0.7% | |
| CMOs and Other
Mortgage Related Securities 8.3% | | | CMOs and Other
Mortgage Related Securities 5.2% | |
| Municipal Bonds 2.3% | | | Municipal Bonds 2.1% | |
| Other Investments 0.7% | | | Other Investments 0.1% | |
| Short-Term Investments
and Net Other Assets
(Liabilities) 4.8% | | | Short-Term Investments
and Net Other Assets
(Liabilities) 2.7% | |

* Foreign investments | 5.1% | | ** Foreign investments | 3.9% | |
* Futures and Swaps | 0.0%† | | ** Futures and Swaps | 0.0%† | |
† Amount represents less than 0.1%
Percentages in the above tables are adjusted for the effect of TBA Sale Commitments. |
The information in the above table is based on the combined investments of the Fund and its pro-rata share of the investments of Fidelity's fixed-income central funds. An unaudited holdings listing for the Fund, which presents direct holdings as well as the pro-rata share of any securities and other investments held indirectly through its investment in underlying non-money market Fidelity Central Funds, is available at advisor.fidelity.com. Fidelity VIP Investment Grade Central Fund's holdings and financial statements are included at the end of this report.
Annual Report
Investments December 31, 2013
Showing Percentage of Net Assets
Fixed-Income Funds - 99.8% |
| Shares | | Value |
Fidelity Specialized High Income Central Fund (c) | 361,420 | | $ 38,285,173 |
Fidelity VIP Investment Grade Central Fund (d) | 28,098,984 | | 2,902,063,071 |
TOTAL FIXED-INCOME FUNDS (Cost $2,947,840,387) |
2,940,348,244
|
Nonconvertible Bonds - 0.1% |
| Principal Amount | | |
CONSUMER DISCRETIONARY - 0.1% |
Auto Components - 0.1% |
Delphi Corp. 5% 2/15/23 (Cost $3,234,999) | | $ 3,235,000 | |
3,328,006
|
Asset-Backed Securities - 0.0% |
|
Ally Master Owner Trust Series 2012-3 Class A2, 1.21% 6/15/17
(Cost $439,951) | | 440,000 | |
442,427
|
Collateralized Mortgage Obligations - 0.1% |
|
Private Sponsor - 0.1% |
MASTR Adjustable Rate Mortgages Trust Series 2007-3 Class 22A2, 0.3746% 5/25/47 (b) | | 380,554 | | 292,075 |
Merrill Lynch Alternative Note Asset Trust floater Series 2007-OAR1 Class A1, 0.3346% 2/25/37 (b) | | 1,079,672 | | 956,006 |
Wells Fargo Mortgage Backed Securities Trust Series 2005-AR2 Class 1A2, 2.6718% 3/25/35 (b) | | 726,506 | | 514,438 |
TOTAL COLLATERALIZED MORTGAGE OBLIGATIONS (Cost $772,595) |
1,762,519
|
Money Market Funds - 0.1% |
| Shares | | Value |
Fidelity Cash Central Fund, 0.11% (a)
(Cost $3,016,583) | 3,016,583 | | $ 3,016,583 |
TOTAL INVESTMENT PORTFOLIO - 100.1% (Cost $2,955,304,515) | 2,948,897,779 |
NET OTHER ASSETS (LIABILITIES) - (0.1)% | (4,067,672) |
NET ASSETS - 100% | $ 2,944,830,107 |
Legend |
(a) Affiliated fund that is generally available only to investment companies and other accounts managed by Fidelity Investments. The rate quoted is the annualized seven-day yield of the fund at period end. A complete unaudited listing of the fund's holdings as of its most recent quarter end is available upon request. In addition, each Fidelity Central Fund's financial statements, which are not covered by the Fund's Report of Independent Registered Public Accounting Firm, are available on the SEC's website or upon request. |
(b) Coupon rates for floating and adjustable rate securities reflect the rates in effect at period end. |
(c) Affiliated fund that is generally available only to investment companies and other accounts managed by Fidelity Investments. A complete unaudited schedule of portfolio holdings for each Fidelity Central Fund is filed with the SEC for the first and third quarters of each fiscal year on Form N-Q and is available upon request or at the SEC's website at www.sec.gov. An unaudited holdings listing for the Fund, which presents direct holdings as well as the pro-rata share of securities and other investments held indirectly through its investment in underlying non-money market Fidelity Central Funds, is available at advisor.fidelity.com. In addition, each Fidelity Central Fund's financial statements, which are not covered by the Fund's Report of Independent Registered Public Accounting Firm, are available on the SEC's website or upon request. |
(d) Affiliated central fund that is available only to investment companies and other accounts managed by Fidelity Investments. Fidelity VIP Investment Grade Central Fund's investments and financial statements are included at the end of this report as an attachment. |
Affiliated Central Funds |
Information regarding fiscal year to date income earned by the Fund from investments in Fidelity Central Funds is as follows: |
Fund | Income earned |
Fidelity Cash Central Fund | $ 16,049 |
Fidelity Specialized High Income Central Fund | 2,080,179 |
Fidelity VIP Investment Grade Central Fund | 84,473,953 |
Total | $ 86,570,181 |
Additional information regarding the Fund's fiscal year to date purchases and sales, including the ownership percentage, of the non Money Market Central Funds is as follows: |
Fund | Value,
beginning of
period | Purchases | Sales
Proceeds | Value,
end of
period | % ownership,
end of
period |
Fidelity Specialized High Income Central Fund | $ 36,383,523 | $ 2,080,179 | $ - | $ 38,285,173 | 9.2% |
Fidelity VIP Investment Grade Central Fund | 3,315,314,712 | 120,951,921 | 364,808,987 | 2,902,063,071 | 73.5% |
Total | $ 3,351,698,235 | $ 123,032,100 | $ 364,808,987 | $ 2,940,348,244 | |
Other Information |
The following is a summary of the inputs used, as of December 31, 2013, involving the Fund's assets and liabilities carried at fair value. The inputs or methodology used for valuing securities may not be an indication of the risk associated with investing in those securities. For more information on valuation inputs, and their aggregation into the levels used in the table below, please refer to the Investment Valuation section in the accompanying Notes to Financial Statements. |
Valuation Inputs at Reporting Date: |
Description | Total | Level 1 | Level 2 | Level 3 |
Investments in Securities: | | | | |
Corporate Bonds | $ 3,328,006 | $ - | $ 3,328,006 | $ - |
Asset-Backed Securities | 442,427 | - | 442,427 | - |
Collateralized Mortgage Obligations | 1,762,519 | - | 1,762,519 | - |
Fixed-Income Funds | 2,940,348,244 | 2,940,348,244 | - | - |
Money Market Funds | 3,016,583 | 3,016,583 | - | - |
Total Investments in Securities: | $ 2,948,897,779 | $ 2,943,364,827 | $ 5,532,952 | $ - |
See accompanying notes which are an integral part of the financial statements.
Annual Report
Statement of Assets and Liabilities
| December 31, 2013 |
| | |
Assets | | |
Investment in securities, at value - See accompanying schedule: Unaffiliated issuers (cost $4,447,545) | $ 5,532,952 | |
Fidelity Central Funds (cost $2,950,856,970) | 2,943,364,827 | |
Total Investments (cost $2,955,304,515) | | $ 2,948,897,779 |
Receivable for investments sold | | 1,389 |
Receivable for fund shares sold | | 2,968,414 |
Interest receivable | | 63,042 |
Distributions receivable from Fidelity Central Funds | | 861 |
Prepaid expenses | | 6,555 |
Total assets | | 2,951,938,040 |
| | |
Liabilities | | |
Payable for investments purchased | $ 1,316 | |
Payable for fund shares redeemed | 5,776,230 | |
Accrued management fee | 777,820 | |
Distribution and service plan fees payable | 255,533 | |
Other affiliated payables | 261,478 | |
Other payables and accrued expenses | 35,556 | |
Total liabilities | | 7,107,933 |
| | |
Net Assets | | $ 2,944,830,107 |
Net Assets consist of: | | |
Paid in capital | | $ 2,951,492,999 |
Distributions in excess of net investment income | | (148) |
Accumulated undistributed net realized gain (loss) on investments | | (256,008) |
Net unrealized appreciation (depreciation) on investments | | (6,406,736) |
Net Assets | | $ 2,944,830,107 |
Statement of Assets and Liabilities - continued
| December 31, 2013 |
| | |
Initial Class:
Net Asset Value, offering price and redemption price per share ($981,378,237 ÷ 79,409,771 shares) | | $ 12.36 |
| | |
Service Class:
Net Asset Value, offering price and redemption price per share ($265,505,292 ÷ 21,684,580 shares) | | $ 12.24 |
| | |
Service Class 2:
Net Asset Value, offering price and redemption price per share ($1,115,492,874 ÷ 92,225,657 shares) | | $ 12.10 |
| | |
Investor Class:
Net Asset Value, offering price and redemption price per share ($582,453,704 ÷ 47,280,240 shares) | | $ 12.32 |
See accompanying notes which are an integral part of the financial statements.
Annual Report
Financial Statements - continued
Statement of Operations
| Year ended December 31, 2013 |
| | |
Investment Income | | |
Interest | | $ 423,828 |
Income from Fidelity Central Funds | | 86,570,181 |
Total income | | 86,994,009 |
| | |
Expenses | | |
Management fee | $ 10,071,744 | |
Transfer agent fees | 2,524,698 | |
Distribution and service plan fees | 3,174,936 | |
Accounting fees and expenses | 1,025,150 | |
Custodian fees and expenses | 4,381 | |
Independent trustees' compensation | 12,467 | |
Registration fees | 16,018 | |
Audit | 52,214 | |
Legal | 12,276 | |
Miscellaneous | 28,781 | |
Total expenses before reductions | 16,922,665 | |
Expense reductions | (126,872) | 16,795,793 |
Net investment income (loss) | | 70,198,216 |
Realized and Unrealized Gain (Loss) Net realized gain (loss) on: | | |
Investment securities: | | |
Unaffiliated issuers | 608,652 | |
Fidelity Central Funds | 940,342 | |
Capital gain distributions from Fidelity Central Funds | 36,485,121 | |
Total net realized gain (loss) | | 38,034,115 |
Change in net unrealized appreciation (depreciation) on investment securities | | (170,719,353) |
Net gain (loss) | | (132,685,238) |
Net increase (decrease) in net assets resulting from operations | | $ (62,487,022) |
Statement of Changes in Net Assets
| Year ended
December 31, 2013 | Year ended
December 31, 2012 |
Increase (Decrease) in Net Assets | | |
Operations | | |
Net investment income (loss) | $ 70,198,216 | $ 75,320,602 |
Net realized gain (loss) | 38,034,115 | 66,920,225 |
Change in net unrealized appreciation (depreciation) | (170,719,353) | 40,458,832 |
Net increase (decrease) in net assets resulting from operations | (62,487,022) | 182,699,659 |
Distributions to shareholders from net investment income | (70,294,727) | (75,924,448) |
Distributions to shareholders from net realized gain | (37,771,525) | (89,277,491) |
Total distributions | (108,066,252) | (165,201,939) |
Share transactions - net increase (decrease) | (265,727,285) | 383,840,633 |
Total increase (decrease) in net assets | (436,280,559) | 401,338,353 |
| | |
Net Assets | | |
Beginning of period | 3,381,110,666 | 2,979,772,313 |
End of period (including distributions in excess of net investment income of $148 and distributions in excess of net investment income of $149, respectively) | $ 2,944,830,107 | $ 3,381,110,666 |
See accompanying notes which are an integral part of the financial statements.
Annual Report
Financial Highlights - Initial Class
Years ended December 31, | 2013 | 2012 | 2011 | 2010 | 2009 |
Selected Per-Share Data | | | | | |
Net asset value, beginning of period | $ 13.06 | $ 12.97 | $ 12.83 | $ 12.48 | $ 11.84 |
Income from Investment Operations | | | | | |
Net investment income (loss) C | .295 | .318 | .431 | .443 | .510 |
Net realized and unrealized gain (loss) | (.526) | .443 | .492 | .528 | 1.266 |
Total from investment operations | (.231) | .761 | .923 | .971 | 1.776 |
Distributions from net investment income | (.310) | (.315) | (.436) | (.476) | (1.087) |
Distributions from net realized gain | (.159) | (.356) | (.347) | (.145) | (.049) |
Total distributions | (.469) | (.671) | (.783) | (.621) | (1.136) |
Net asset value, end of period | $ 12.36 | $ 13.06 | $ 12.97 | $ 12.83 | $ 12.48 |
Total Return A,B | (1.78)% | 5.90% | 7.33% | 7.80% | 15.72% |
Ratios to Average Net Assets D,F | | | | | |
Expenses before reductions | .42% | .42% | .43% | .43% | .45% |
Expenses net of fee waivers, if any | .42% | .42% | .42% | .42% | .45% |
Expenses net of all reductions | .42% | .42% | .42% | .42% | .45% |
Net investment income (loss) | 2.29% | 2.39% | 3.30% | 3.38% | 4.19% |
Supplemental Data | | | | | |
Net assets, end of period (000 omitted) | $ 981,378 | $ 1,149,849 | $ 1,116,778 | $ 1,110,373 | $ 1,083,773 |
Portfolio turnover rate E | 4% | 2% | 5% | 8% | 3% |
A Total returns do not reflect charges attributable to your insurance company's separate account. Inclusion of these charges would reduce the total returns shown.
B Total returns would have been lower if certain expenses had not been reduced during the applicable periods shown.
C Calculated based on average shares outstanding during the period.
D Fees and expenses of any underlying Fidelity Central Funds are not included in the Fund's expense ratio. The Fund indirectly bears its proportionate share of the expenses of any underlying Fidelity Central Funds. Based on their most recent shareholder report date, the expenses of any underlying non-money market Fidelity Central Funds were .00%.
E Amount does not include the portfolio activity of any underlying Fidelity Central Funds.
F Expense ratios reflect operating expenses of the class. Expenses before reductions do not reflect amounts reimbursed by the investment adviser or reductions from expense offset arrangements and do not represent the amount paid by the class during periods when reimbursements or reductions occur. Expenses net of fee waivers reflect expenses after reimbursement by the investment adviser but prior to reductions from expense offset arrangements. Expenses net of all reductions represent the net expenses paid by the class.
Financial Highlights - Service Class
Years ended December 31, | 2013 | 2012 | 2011 | 2010 | 2009 |
Selected Per-Share Data | | | | | |
Net asset value, beginning of period | $ 12.94 | $ 12.86 | $ 12.73 | $ 12.39 | $ 11.75 |
Income from Investment Operations | | | | | |
Net investment income (loss) C | .280 | .302 | .415 | .427 | .495 |
Net realized and unrealized gain (loss) | (.523) | .436 | .485 | .521 | 1.262 |
Total from investment operations | (.243) | .738 | .900 | .948 | 1.757 |
Distributions from net investment income | (.298) | (.302) | (.423) | (.463) | (1.068) |
Distributions from net realized gain | (.159) | (.356) | (.347) | (.145) | (.049) |
Total distributions | (.457) | (.658) | (.770) | (.608) | (1.117) |
Net asset value, end of period | $ 12.24 | $ 12.94 | $ 12.86 | $ 12.73 | $ 12.39 |
Total Return A,B | (1.89)% | 5.77% | 7.21% | 7.68% | 15.67% |
Ratios to Average Net Assets D,F | | | | | |
Expenses before reductions | .52% | .52% | .52% | .53% | .54% |
Expenses net of fee waivers, if any | .52% | .52% | .52% | .52% | .54% |
Expenses net of all reductions | .52% | .52% | .52% | .52% | .54% |
Net investment income (loss) | 2.19% | 2.29% | 3.20% | 3.28% | 4.09% |
Supplemental Data | | | | | |
Net assets, end of period (000 omitted) | $ 265,505 | $ 288,708 | $ 277,732 | $ 283,962 | $ 259,246 |
Portfolio turnover rate E | 4% | 2% | 5% | 8% | 3% |
A Total returns do not reflect charges attributable to your insurance company's separate account. Inclusion of these charges would reduce the total returns shown.
B Total returns would have been lower if certain expenses had not been reduced during the applicable periods shown.
C Calculated based on average shares outstanding during the period.
D Fees and expenses of any underlying Fidelity Central Funds are not included in the Fund's expense ratio. The Fund indirectly bears its proportionate share of the expenses of any underlying Fidelity Central Funds. Based on their most recent shareholder report date, the expenses of any underlying non-money market Fidelity Central Funds were .00%.
E Amount does not include the portfolio activity of any underlying Fidelity Central Funds.
F Expense ratios reflect operating expenses of the class. Expenses before reductions do not reflect amounts reimbursed by the investment adviser or reductions from expense offset arrangements and do not represent the amount paid by the class during periods when reimbursements or reductions occur. Expenses net of fee waivers reflect expenses after reimbursement by the investment adviser but prior to reductions from expense offset arrangements. Expenses net of all reductions represent the net expenses paid by the class.
See accompanying notes which are an integral part of the financial statements.
Annual Report
Financial Highlights - Service Class 2
Years ended December 31, | 2013 | 2012 | 2011 | 2010 | 2009 |
Selected Per-Share Data | | | | | |
Net asset value, beginning of period | $ 12.79 | $ 12.72 | $ 12.60 | $ 12.26 | $ 11.62 |
Income from Investment Operations | | | | | |
Net investment income (loss) C | .257 | .279 | .391 | .402 | .473 |
Net realized and unrealized gain (loss) | (.510) | .430 | .478 | .520 | 1.244 |
Total from investment operations | (.253) | .709 | .869 | .922 | 1.717 |
Distributions from net investment income | (.278) | (.283) | (.402) | (.437) | (1.028) |
Distributions from net realized gain | (.159) | (.356) | (.347) | (.145) | (.049) |
Total distributions | (.437) | (.639) | (.749) | (.582) | (1.077) |
Net asset value, end of period | $ 12.10 | $ 12.79 | $ 12.72 | $ 12.60 | $ 12.26 |
Total Return A,B | (1.99)% | 5.60% | 7.03% | 7.55% | 15.47% |
Ratios to Average Net Assets D,F | | | | | |
Expenses before reductions | .67% | .67% | .67% | .68% | .69% |
Expenses net of fee waivers, if any | .67% | .67% | .67% | .67% | .69% |
Expenses net of all reductions | .67% | .67% | .67% | .67% | .69% |
Net investment income (loss) | 2.04% | 2.14% | 3.05% | 3.13% | 3.94% |
Supplemental Data | | | | | |
Net assets, end of period (000 omitted) | $ 1,115,493 | $ 1,198,326 | $ 972,651 | $ 1,011,652 | $ 1,240,935 |
Portfolio turnover rate E | 4% | 2% | 5% | 8% | 3% |
A Total returns do not reflect charges attributable to your insurance company's separate account. Inclusion of these charges would reduce the total returns shown.
B Total returns would have been lower if certain expenses had not been reduced during the applicable periods shown.
C Calculated based on average shares outstanding during the period.
D Fees and expenses of any underlying Fidelity Central Funds are not included in the Fund's expense ratio. The Fund indirectly bears its proportionate share of the expenses of any underlying Fidelity Central Funds. Based on their most recent shareholder report date, the expenses of any underlying non-money market Fidelity Central Funds were .00%.
E Amount does not include the portfolio activity of any underlying Fidelity Central Funds.
F Expense ratios reflect operating expenses of the class. Expenses before reductions do not reflect amounts reimbursed by the investment adviser or reductions from expense offset arrangements and do not represent the amount paid by the class during periods when reimbursements or reductions occur. Expenses net of fee waivers reflect expenses after reimbursement by the investment adviser but prior to reductions from expense offset arrangements. Expenses net of all reductions represent the net expenses paid by the class.
Financial Highlights - Investor Class
Years ended December 31, | 2013 | 2012 | 2011 | 2010 | 2009 |
Selected Per-Share Data | | | | | |
Net asset value, beginning of period | $ 13.02 | $ 12.93 | $ 12.80 | $ 12.45 | $ 11.81 |
Income from Investment Operations | | | | | |
Net investment income (loss) C | .290 | .313 | .426 | .438 | .511 |
Net realized and unrealized gain (loss) | (.526) | .444 | .484 | .529 | 1.263 |
Total from investment operations | (.236) | .757 | .910 | .967 | 1.774 |
Distributions from net investment income | (.305) | (.311) | (.433) | (.472) | (1.085) |
Distributions from net realized gain | (.159) | (.356) | (.347) | (.145) | (.049) |
Total distributions | (.464) | (.667) | (.780) | (.617) | (1.134) |
Net asset value, end of period | $ 12.32 | $ 13.02 | $ 12.93 | $ 12.80 | $ 12.45 |
Total Return A,B | (1.82)% | 5.89% | 7.25% | 7.79% | 15.75% |
Ratios to Average Net Assets D,F | | | | | |
Expenses before reductions | .45% | .46% | .46% | .46% | .48% |
Expenses net of fee waivers, if any | .45% | .46% | .45% | .45% | .45% |
Expenses net of all reductions | .45% | .46% | .45% | .45% | .45% |
Net investment income (loss) | 2.26% | 2.36% | 3.27% | 3.35% | 4.18% |
Supplemental Data | | | | | |
Net assets, end of period (000 omitted) | $ 582,454 | $ 744,227 | $ 612,611 | $ 537,936 | $ 523,032 |
Portfolio turnover rate E | 4% | 2% | 5% | 8% | 3% |
A Total returns do not reflect charges attributable to your insurance company's separate account. Inclusion of these charges would reduce the total returns shown.
B Total returns would have been lower if certain expenses had not been reduced during the applicable periods shown.
C Calculated based on average shares outstanding during the period.
D Fees and expenses of any underlying Fidelity Central Funds are not included in the Fund's expense ratio. The Fund indirectly bears its proportionate share of the expenses of any underlying Fidelity Central Funds. Based on their most recent shareholder report date, the expenses of any underlying non-money market Fidelity Central Funds were .00%.
E Amount does not include the portfolio activity of any underlying Fidelity Central Funds.
F Expense ratios reflect operating expenses of the class. Expenses before reductions do not reflect amounts reimbursed by the investment adviser or reductions from expense offset arrangements and do not represent the amount paid by the class during periods when reimbursements or reductions occur. Expenses net of fee waivers reflect expenses after reimbursement by the investment adviser but prior to reductions from expense offset arrangements. Expenses net of all reductions represent the net expenses paid by the class.
See accompanying notes which are an integral part of the financial statements.
Annual Report
Notes to Financial Statements
For the period ended December 31, 2013
1. Organization.
VIP Investment Grade Bond Portfolio (the Fund) is a fund of Variable Insurance Products Fund V (the Trust) and is authorized to issue an unlimited number of shares. The Trust is registered under the Investment Company Act of 1940, as amended (the 1940 Act), as an open-end management investment company organized as a Massachusetts business trust. Shares of the Fund may only be purchased by insurance companies for the purpose of funding variable annuity or variable life insurance contracts. The Fund offers the following classes of shares: Initial Class shares, Service Class shares, Service Class 2 shares, and Investor Class shares. All classes have equal rights and voting privileges, except for matters affecting a single class.
2. Investments in Fidelity Central Funds.
The Fund invests in Fidelity Central Funds, which are open-end investment companies generally available only to other investment companies and accounts managed by the investment adviser and its affiliates. The Fund's Schedule of Investments lists each of the Fidelity Central Funds held as of period end, if any, as an investment of the Fund, but does not include the underlying holdings of each Fidelity Central Fund. As an Investing Fund, the Fund indirectly bears its proportionate share of the expenses of the underlying Fidelity Central Funds.
Based on its investment objective, each Fidelity Central Fund may invest or participate in various investment vehicles or strategies that are similar to those of the Fund. These strategies are consistent with the investment objectives of the Fund and may involve certain economic risks which may cause a decline in value of each of the Fidelity Central Funds and thus a decline in the value of the Fund. The Money Market Central Funds seek preservation of capital and current income and are managed by Fidelity Investments Money Management, Inc. (FIMM), an affiliate of the investment adviser. Annualized expenses of the Money Market Central Funds as of their most recent shareholder report date are less than .01%. The following summarizes the Fund's investment in each non-money market Fidelity Central Fund.
Fidelity Central Fund | Investment Manager | Investment Objective | | Investment Practices | Expense Ratio* |
Fidelity Specialized High Income Central Fund | FMR Co., Inc. (FMRC) | Seeks a high level of current income by normally investing in income-producing debt securities, with an emphasis on lower-quality debt securities. | | Delayed Delivery & When Issued Securities Loans & Direct Debt Instruments Repurchase Agreements Restricted Securities | .00% |
VIP Investment Grade Central Fund | Fidelity Investments Money Management, Inc. (FIMM) | Seeks a high level of current income by normally investing in investment-grade debt securities and repurchase agreements. | | Delayed Delivery & When Issued Securities Repurchase Agreements Restricted Securities Swaps | .00% |
* Expenses expressed as a percentage of average net assets and are as of each underlying Central Fund's most recent annual or semi-annual shareholder report.
An unaudited holdings listing for the Fund, which presents direct holdings as well as the pro-rata share of any securities and other investments held indirectly through its investment in underlying non-money market Fidelity Central Funds, is available at advisor.fidelity.com. A complete unaudited list of holdings for each Fidelity Central Fund is available upon request or at the Securities and Exchange Commission (the SEC) website at www.sec.gov. In addition, the financial statements of the Fidelity Central Funds which contain the significant accounting policies (including investment valuation policies) of those funds, which are not covered by the Fund's Report of Independent Registered Public Accounting Firm, are available on the SEC website or upon request.
3. Significant Accounting Policies.
The financial statements have been prepared in conformity with accounting principles generally accepted in the United States of America (GAAP), which require management to make certain estimates and assumptions at the date of the financial statements. Actual results could differ from those estimates. Subsequent events, if any, through the date that the financial statements were issued have been evaluated in the preparation of the financial statements. The following summarizes the significant accounting policies of the Fund:
Investment Valuation. Investments are valued as of 4:00 p.m. Eastern time on the last calendar day of the period. In accordance with valuation policies and procedures approved by the Board of Trustees (the Board), the Fund attempts to obtain prices from one or more third party pricing vendors or brokers to value its investments. When current market prices, quotations or currency exchange rates are not readily available or reliable, investments will be fair valued in good faith by the Fidelity Management & Research Company (FMR) Fair Value Committee (the Committee), in accordance with procedures adopted by the Board. Factors used in determining fair value vary by investment type and may include market or investment specific events, changes in interest rates and credit quality. The frequency with which these procedures are used cannot be predicted and they may be utilized to a significant extent. The Committee oversees the Fund's valuation policies and procedures and is responsible for approving and reporting to the Board all fair value determinations.
Annual Report
Notes to Financial Statements - continued
3. Significant Accounting Policies - continued
Investment Valuation - continued
The Fund categorizes the inputs to valuation techniques used to value its investments into a disclosure hierarchy consisting of three levels as shown below:
Level 1 - quoted prices in active markets for identical investments
Level 2 - other significant observable inputs (including quoted prices for similar investments, interest rates, prepayment speeds, etc.)
Level 3 - unobservable inputs (including the Fund's own assumptions based on the best information available)
Valuation techniques used to value the Fund's investments by major category are as follows:
Debt securities, including restricted securities, are valued based on evaluated prices received from third party pricing vendors or from brokers who make markets in such securities. Corporate bonds are valued by pricing vendors who utilize matrix pricing which considers yield or price of bonds of comparable quality, coupon, maturity and type or by broker-supplied prices. Asset backed securities and collateralized mortgage obligations, are valued by pricing vendors who utilize matrix pricing which considers prepayment speed assumptions, attributes of the collateral, yield or price of bonds of comparable quality, coupon, maturity and type or by broker-supplied prices. When independent prices are unavailable or unreliable, debt securities may be valued utilizing pricing methodologies which consider similar factors that would be used by third party pricing vendors. Debt securities are generally categorized as Level 2 in the hierarchy but may be Level 3 depending on the circumstances.
Investments in open-end mutual funds, including the Fidelity Central Funds, are valued at their closing net asset value (NAV) each business day and are categorized as Level 1 in the hierarchy.
Changes in valuation techniques may result in transfers in or out of an assigned level within the disclosure hierarchy. The aggregate value of investments by input level, as of December 31, 2013, is included at the end of the Fund's Schedule of Investments.
Investment Transactions and Income. For financial reporting purposes, the Fund's investment holdings and NAV include trades executed through the end of the last business day of the period. The NAV per share for processing shareholder transactions is calculated as of the close of business of the New York Stock Exchange (NYSE), normally 4:00 p.m. Eastern time and includes trades executed through the end of the prior business day. Gains and losses on securities sold are determined on the basis of identified cost and may include proceeds received from litigation. Interest income and distributions from the Fidelity Central Funds are accrued as earned. Interest income includes coupon interest and amortization of premium and accretion of discount on debt securities.
Class Allocations and Expenses. Investment income, realized and unrealized capital gains and losses, common expenses of the Fund, and certain fund-level expense reductions, if any, are allocated daily on a pro-rata basis to each class based on the relative net assets of each class to the total net assets of the Fund. Each class differs with respect to transfer agent and distribution and service plan fees incurred. Certain expense reductions may also differ by class. For the reporting period, the allocated portion of income and expenses to each class as a percent of its average net assets may vary due to the timing of recording these transactions in relation to fluctuating net assets of the classes. Expenses directly attributable to a fund are charged to that fund. Expenses attributable to more than one fund are allocated among the respective funds on the basis of relative net assets or other appropriate methods. Expense estimates are accrued in the period to which they relate and adjustments are made when actual amounts are known.
Income Tax Information and Distributions to Shareholders. Each year, the Fund intends to qualify as a regulated investment company under Subchapter M of the Internal Revenue Code, including distributing substantially all of its taxable income and realized gains. As a result, no provision for U.S. Federal income taxes is required. As of December 31, 2013, the Fund did not have any unrecognized tax benefits in the financial statements; nor is the Fund aware of any tax positions for which it is reasonably possible that the total amounts of unrecognized tax benefits will significantly change in the next twelve months. The Fund files a U.S. federal tax return, in addition to state and local tax returns as required. The Fund's federal income tax returns are subject to examination by the Internal Revenue Service (IRS) for a period of three fiscal years after they are filed. State and local tax returns may be subject to examination for an additional fiscal year depending on the jurisdiction.
Distributions are declared and recorded on the ex-dividend date. Income dividends and capital gain distributions are declared separately for each class. Income and capital gain distributions are determined in accordance with income tax regulations, which may differ from GAAP.
Capital accounts within the financial statements are adjusted for permanent book-tax differences. These adjustments have no impact on net assets or the results of operations. Capital accounts are not adjusted for temporary book-tax differences which will reverse in a subsequent period.
Book-tax differences are primarily due to the short-term gain distributions from the Underlying Funds, deferred trustees compensation, Partnerships (including allocations from Fidelity Central Funds), in-kind transactions and losses deferred due to wash sales and excise tax regulations.
Annual Report
3. Significant Accounting Policies - continued
Income Tax Information and Distributions to Shareholders - continued
The federal tax cost of investment securities and unrealized appreciation (depreciation) as of period end were as follows:
Gross unrealized appreciation | $ 71,421,370 |
Gross unrealized depreciation | (23,959,296) |
Net unrealized appreciation (depreciation) on securities and other investments | $ 47,462,074 |
| |
Tax Cost | $ 2,901,435,705 |
The tax-based components of distributable earnings as of period end were as follows:
Undistributed long-term capital gain | $ 627,054 |
Net unrealized appreciation (depreciation) | $ 47,462,074 |
The tax character of distributions paid was as follows:
| December 31, 2013 | December 31, 2012 |
Ordinary Income | $ 72,907,852 | $ 136,853,209 |
Long-term Capital Gains | 35,158,400 | 28,348,730 |
Total | $ 108,066,252 | $ 165,201,939 |
4. Purchases and Sales of Investments.
Purchases and sales of securities (including the Fixed-Income Central Funds), other than short-term securities and U.S. government securities, aggregated $126,267,100 and $370,352,914, respectively.
5. Fees and Other Transactions with Affiliates.
Management Fee. Fidelity Management & Research Company (the investment adviser) and its affiliates provide the Fund with investment management related services for which the Fund pays a monthly management fee. The management fee is the sum of an individual fund fee rate that is based on an annual rate of .20% of the Fund's average net assets and an annualized group fee rate that averaged .11% during the period. The group fee rate is based upon the average net assets of all the mutual funds advised by the investment adviser, including any mutual funds previously advised by the investment adviser that are currently advised by Fidelity SelectCo, LLC, an affiliate of the investment adviser. The group fee rate decreases as assets under management increase and increases as assets under management decrease. For the reporting period, the total annual management fee rate was .31% of the Fund's average net assets.
Distribution and Service Plan Fees. In accordance with Rule 12b-1 of the 1940 Act, the Fund has adopted separate 12b-1 Plans for each Service Class of shares. Each Service Class pays Fidelity Distributors Corporation (FDC), an affiliate of the investment adviser, a service fee. For the period, the service fee is based on an annual rate of .10% of Service Class' average net assets and .25% of Service Class 2's average net assets.
For the period, total fees, all of which were re-allowed to insurance companies for the distribution of shares and providing shareholder support services were as follows:
Service Class | $ 272,503 |
Service Class 2 | 2,902,433 |
| $ 3,174,936 |
Annual Report
Notes to Financial Statements - continued
5. Fees and Other Transactions with Affiliates - continued
Transfer Agent Fees. Fidelity Investments Institutional Operations Company, Inc. (FIIOC), an affiliate of the investment adviser, is the Fund's transfer, dividend disbursing, and shareholder servicing agent. FIIOC receives an asset-based fee with respect to each class. Each class pays a transfer agent fee, excluding out of pocket expenses, equal to an annual rate of .07% of average net assets. Investor Class pays a monthly asset-based transfer agent fee of .10% of average net assets. In addition, FIIOC receives an asset-based fee of .0035% of average net assets for typesetting, printing and mailing of shareholder reports, except proxy statements. FIIOC voluntarily agreed to reimburse or waive this fee for the period January 1, 2013 through December 31, 2013 (see Expense Reductions note). For the period, transfer agent fees for each class, including printing and out of pocket expenses, were as follows:
Initial Class | $ 809,178 |
Service Class | 191,983 |
Service Class 2 | 813,556 |
Investor Class | 709,981 |
| $ 2,524,698 |
Effective February 1, 2014, the Board of Trustees approved an amendment to the transfer agent fee agreement whereby each class (with the exception of Investor Class) pays a single fee of .07% of average net assets for transfer agent services, typesetting, printing and mailing of shareholder reports, excluding mailing of proxy statements and out of pocket expenses. Investor Class pays a single fee of .10% of average net assets.
Accounting Fees. Fidelity Service Company, Inc. (FSC), an affiliate of the investment adviser, maintains the Fund's accounting records. The fee is based on the level of average net assets for each month.
6. Committed Line of Credit.
The Fund participates with other funds managed by the investment adviser or an affiliate in a $4.25 billion credit facility (the "line of credit") to be utilized for temporary or emergency purposes to fund shareholder redemptions or for other short-term liquidity purposes. The Fund has agreed to pay commitment fees on its pro-rata portion of the line of credit, which amounted to $7,242 and is reflected in Miscellaneous expenses on the Statement of Operations. During the period, there were no borrowings on this line of credit.
7. Expense Reductions.
The investment adviser or its affiliates agreed to reimburse or waive certain fees during the period as noted in the table below.
Initial Class | $ 43,616 |
Service Class | 10,752 |
Service Class 2 | 45,800 |
Investor Class | 26,704 |
| $ 126,872 |
8. Distributions to Shareholders.
Distributions to shareholders of each class were as follows:
Years ended December 31, | 2013 | 2012 |
From net investment income | | |
Initial Class | $ 24,788,498 | $ 26,865,370 |
Service Class | 6,230,965 | 6,451,673 |
Service Class 2 | 24,850,468 | 25,525,008 |
Investor Class | 14,424,796 | 17,082,397 |
Total | $ 70,294,727 | $ 75,924,448 |
From net realized gain | | |
Initial Class | $ 12,714,101 | $ 30,332,583 |
Service Class | 3,324,575 | 7,632,369 |
Service Class 2 | 14,213,037 | 32,277,305 |
Investor Class | 7,519,812 | 19,035,234 |
Total | $ 37,771,525 | $ 89,277,491 |
Annual Report
9. Share Transactions.
Transactions for each class of shares were as follows:
| Shares | Dollars |
Years ended December 31, | 2013 | 2012 | 2013 | 2012 |
Initial Class | | | | |
Shares sold | 12,397,143 | 12,752,671 | $ 159,779,398 | $ 169,322,445 |
Reinvestment of distributions | 3,026,844 | 4,373,004 | 37,502,598 | 57,197,953 |
Shares redeemed | (24,071,551) | (15,155,151) | (308,354,985) | (201,050,751) |
Net increase (decrease) | (8,647,564) | 1,970,524 | $ (111,072,989) | $ 25,469,647 |
Service Class | | | | |
Shares sold | 2,416,244 | 3,030,909 | $ 30,836,373 | $ 39,844,986 |
Reinvestment of distributions | 778,138 | 1,086,659 | 9,555,540 | 14,084,042 |
Shares redeemed | (3,817,953) | (3,400,787) | (48,792,908) | (44,838,867) |
Net increase (decrease) | (623,571) | 716,781 | $ (8,400,995) | $ 9,090,161 |
Service Class 2 | | | | |
Shares sold | 12,430,324 | 29,052,546 | $ 156,751,818 | $ 375,349,850 |
Reinvestment of distributions | 3,220,404 | 4,512,088 | 39,063,505 | 57,802,313 |
Shares redeemed | (17,124,623) | (16,334,581) | (215,459,350) | (213,179,031) |
Net increase (decrease) | (1,473,895) | 17,230,053 | $ (19,644,027) | $ 219,973,132 |
Investor Class | | | | |
Shares sold | 6,898,022 | 11,000,632 | $ 88,686,246 | $ 145,663,306 |
Reinvestment of distributions | 1,776,891 | 2,769,636 | 21,944,608 | 36,117,631 |
Shares redeemed | (18,567,930) | (3,960,352) | (237,240,128) | (52,473,244) |
Net increase (decrease) | (9,893,017) | 9,809,916 | $ (126,609,274) | $ 129,307,693 |
10. Other.
The Fund's organizational documents provide former and current trustees and officers with a limited indemnification against liabilities arising in connection with the performance of their duties to the Fund. In the normal course of business, the Fund may also enter into contracts that provide general indemnifications. The Fund's maximum exposure under these arrangements is unknown as this would be dependent on future claims that may be made against the Fund. The risk of material loss from such claims is considered remote.
At the end of the period, the investment adviser or its affiliates were the owners of record of 24% of the total outstanding shares of the Fund and one otherwise unaffiliated shareholder was the owner of record of 19% of the total outstanding shares of the Fund.
Annual Report
Report of Independent Registered Public Accounting Firm
To the Trustees of Variable Insurance Products Fund V and Shareholders of VIP Investment Grade Bond Portfolio:
We have audited the accompanying statement of assets and liabilities of VIP Investment Grade Bond Portfolio (the Fund), a fund of Variable Insurance Products Fund V, including the schedule of investments, as of December 31, 2013, and the related statement of operations for the year then ended, the statement of changes in net assets for each of the two years in the period then ended, and the financial highlights for each of the five years in the period then ended. These financial statements and financial highlights are the responsibility of the Fund's management. Our responsibility is to express an opinion on these financial statements and financial highlights based on our audits.
We conducted our audits in accordance with the standards of the Public Company Accounting Oversight Board (United States). Those standards require that we plan and perform the audit to obtain reasonable assurance about whether the financial statements and financial highlights are free of material misstatement. The Fund is not required to have, nor were we engaged to perform, an audit of its internal control over financial reporting. Our audits included consideration of internal control over financial reporting as a basis for designing audit procedures that are appropriate in the circumstances, but not for the purpose of expressing an opinion on the effectiveness of the Fund's internal control over financial reporting. Accordingly, we express no such opinion. An audit also includes examining, on a test basis, evidence supporting the amounts and disclosures in the financial statements, assessing the accounting principles used and significant estimates made by management, as well as evaluating the overall financial statement presentation. Our procedures included confirmation of securities owned as of December 31, 2013, by correspondence with the custodians and brokers. We believe that our audits provide a reasonable basis for our opinion.
In our opinion, the financial statements and financial highlights referred to above present fairly, in all material respects, the financial position of VIP Investment Grade Bond Portfolio as of December 31, 2013, the results of its operations for the year then ended, the changes in its net assets for each of the two years in the period then ended, and the financial highlights for each of the five years in the period then ended, in conformity with accounting principles generally accepted in the United States of America.
DELOITTE & TOUCHE LLP
Boston, Massachusetts
February 19, 2014
Annual Report
The Trustees and officers of the trust and fund, as applicable, are listed below. The Board of Trustees governs the fund and is responsible for protecting the interests of shareholders. The Trustees are experienced executives who meet periodically throughout the year to oversee the fund's activities, review contractual arrangements with companies that provide services to the fund, oversee management of the risks associated with such activities and contractual arrangements, and review the fund's performance. Except for James C. Curvey and Elizabeth S. Acton, each of the Trustees oversees 223 funds. Ms. Acton oversees 205 funds. Mr. Curvey oversees 396 funds.
The Trustees hold office without limit in time except that (a) any Trustee may resign; (b) any Trustee may be removed by written instrument, signed by at least two-thirds of the number of Trustees prior to such removal; (c) any Trustee who requests to be retired or who has become incapacitated by illness or injury may be retired by written instrument signed by a majority of the other Trustees; and (d) any Trustee may be removed at any special meeting of shareholders by a two-thirds vote of the outstanding voting securities of the trust. Each Trustee who is not an interested person (as defined in the 1940 Act) of the trust and the fund (Independent Trustee), shall retire not later than the last day of the month in which his or her 75th birthday occurs. The Independent Trustees may waive this mandatory retirement age policy with respect to individual Trustees. The officers hold office without limit in time, except that any officer may resign or may be removed by a vote of a majority of the Trustees at any regular meeting or any special meeting of the Trustees. Except as indicated, each individual has held the office shown or other offices in the same company for the past five years.
Experience, Skills, Attributes, and Qualifications of the Fund's Trustees. The Governance and Nominating Committee has adopted a statement of policy that describes the experience, qualifications, attributes, and skills that are necessary and desirable for potential Independent Trustee candidates (Statement of Policy). The Board believes that each Trustee satisfied at the time he or she was initially elected or appointed a Trustee, and continues to satisfy, the standards contemplated by the Statement of Policy. The Governance and Nominating Committee also engages professional search firms to help identify potential Independent Trustee candidates who have the experience, qualifications, attributes, and skills consistent with the Statement of Policy. From time to time, additional criteria based on the composition and skills of the current Independent Trustees, as well as experience or skills that may be appropriate in light of future changes to board composition, business conditions, and regulatory or other developments, have also been considered by the professional search firms and the Governance and Nominating Committee. In addition, the Board takes into account the Trustees' commitment and participation in Board and committee meetings, as well as their leadership of standing and ad hoc committees throughout their tenure.
In determining that a particular Trustee was and continues to be qualified to serve as a Trustee, the Board has considered a variety of criteria, none of which, in isolation, was controlling. The Board believes that, collectively, the Trustees have balanced and diverse experience, qualifications, attributes, and skills, which allow the Board to operate effectively in governing the fund and protecting the interests of shareholders. Information about the specific experience, skills, attributes, and qualifications of each Trustee, which in each case led to the Board's conclusion that the Trustee should serve (or continue to serve) as a trustee of the fund, is provided below.
Board Structure and Oversight Function. Abigail P. Johnson is an interested person (as defined in the 1940 Act) and currently serves as Chairman. The Trustees have determined that an interested Chairman is appropriate and benefits shareholders because an interested Chairman has a personal and professional stake in the quality and continuity of services provided to the fund. Independent Trustees exercise their informed business judgment to appoint an individual of their choosing to serve as Chairman, regardless of whether the Trustee happens to be independent or a member of management. The Independent Trustees have determined that they can act independently and effectively without having an Independent Trustee serve as Chairman and that a key structural component for assuring that they are in a position to do so is for the Independent Trustees to constitute a substantial majority for the Board. The Independent Trustees also regularly meet in executive session. Albert R. Gamper, Jr. serves as Chairman of the Independent Trustees and as such (i) acts as a liaison between the Independent Trustees and management with respect to matters important to the Independent Trustees and (ii) with management prepares agendas for Board meetings.
Fidelity funds are overseen by different Boards of Trustees. The fund's Board oversees Fidelity's investment-grade bond, money market, and asset allocation funds and another Board oversees Fidelity's equity and high income funds. The asset allocation funds may invest in Fidelity funds that are overseen by such other Board. The use of separate Boards, each with its own committee structure, allows the Trustees of each group of Fidelity funds to focus on the unique issues of the funds they oversee, including common research, investment, and operational issues. On occasion, the separate Boards establish joint committees to address issues of overlapping consequences for the Fidelity funds overseen by each Board.
The Trustees operate using a system of committees to facilitate the timely and efficient consideration of all matters of importance to the Trustees, the fund, and fund shareholders and to facilitate compliance with legal and regulatory requirements and oversight of the fund's activities and associated risks. The Board, acting through its committees, has charged FMR and its affiliates with (i) identifying events or circumstances the occurrence of which could have demonstrably adverse effects on the fund's business and/or reputation; (ii) implementing processes and controls to lessen the possibility that such events or circumstances occur or to mitigate the effects of such events or circumstances if they do occur; and (iii) creating and maintaining a system designed to evaluate continuously business and market conditions in order to facilitate the identification and implementation processes described in (i) and (ii) above. Because the day-to-day operations and activities of the fund are carried out by or through FMR, its affiliates, and other service providers, the fund's exposure to risks is mitigated but not eliminated by the processes overseen by the Trustees. While each of the Board's committees has responsibility for overseeing different aspects of the fund's activities, oversight is exercised primarily through the Operations and Audit Committees. In addition, an ad hoc Board committee of Independent Trustees has worked with FMR to enhance the Board's oversight of investment and financial risks, legal and regulatory risks, technology risks, and operational risks, including the development of additional risk reporting to the Board. Appropriate personnel, including but not limited to the fund's Chief Compliance Officer (CCO), FMR's internal auditor, the independent accountants, the fund's Treasurer and portfolio management personnel, make periodic reports to the Board's committees, as appropriate, including an annual review of FMR's risk management program for the Fidelity funds. The responsibilities of each standing committee, including their oversight responsibilities, are described further under "Standing Committees of the Fund's Trustees."
Annual Report
The fund's Statements of Additional Information (SAIs) include more information about the Trustees. To request a free copy, call Fidelity at 1-877-208-0098.
Interested Trustees*:
Correspondence intended for each Trustee who is an interested person may be sent to Fidelity Investments, 245 Summer Street, Boston, Massachusetts 02210.
Name, Year of Birth; Principal Occupations and Other Relevant Experience+ |
James C. Curvey (1935) |
Year of Election or Appointment: 2007 Trustee |
| Mr. Curvey also serves as Trustee of other Fidelity funds. Mr. Curvey is a Director of Fidelity Investments Money Management, Inc. (2009-present), Director of Fidelity Research & Analysis Co. (2009-present) and Director of FMR and FMR Co., Inc. (2007-present). Mr. Curvey is also Vice Chairman (2007-present) and Director of FMR LLC. In addition, Mr. Curvey serves as an Overseer for the Boston Symphony Orchestra and a member of the Trustees of Villanova University. Previously, Mr. Curvey was the Vice Chairman (2006-2007) and Director (2000-2007) of FMR Corp. |
Abigail P. Johnson (1961) |
Year of Election or Appointment: 2009 Trustee Chairman of the Board of Trustees |
| Ms. Johnson also serves as Trustee of other Fidelity funds. Ms. Johnson serves as President of FMR LLC (2013-present), President of Fidelity Financial Services (2012-present) and President of Personal, Workplace and Institutional Services (2005-present). Ms. Johnson is Chairman and Director of FMR Co., Inc. (2011-present), Chairman and Director of FMR (2011-present), and the Vice Chairman and Director (2007-present) of FMR LLC. Previously, Ms. Johnson served as President and a Director of FMR (2001-2005), a Trustee of other investment companies advised by FMR, Fidelity Investments Money Management, Inc., and FMR Co., Inc. (2001-2005), Senior Vice President of the Fidelity funds (2001-2005), and managed a number of Fidelity funds. Ms. Abigail P. Johnson and Mr. Arthur E. Johnson are not related. |
* Trustees have been determined to be "Interested Trustees" by virtue of, among other things, their affiliation with the trust or various entities under common control with FMR.
+ The information above includes each Trustee's principal occupation during the last five years and other information relating to the experience, attributes, and skills relevant to each Trustee's qualifications to serve as a Trustee, which led to the conclusion that each Trustee should serve as a Trustee for the fund.
Independent Trustees:
Correspondence intended for each Independent Trustee (that is, the Trustees other than the Interested Trustees) may be sent to Fidelity Investments, P.O. Box 55235, Boston, Massachusetts 02205-5235.
Name, Year of Birth; Principal Occupations and Other Relevant Experience+ |
Elizabeth S. Acton (1951) |
Year of Election or Appointment: 2013 Trustee |
| Ms. Acton also serves as Trustee or Member of the Advisory Board of other Fidelity funds. Prior to her retirement in April 2012, Ms. Acton was Executive Vice President, Finance (2011-2012), Executive Vice President, Chief Financial Officer (2002-2011), and Treasurer (2004-2005) of Comerica Incorporated (financial services). Prior to joining Comerica, Ms. Acton held a variety of positions at Ford Motor Company (1983-2002), including Vice President and Treasurer (2000-2002) and Executive Vice President and Chief Financial Officer of Ford Motor Credit Company (1998-2000). Ms. Acton currently serves as a member of the Board of Directors and Audit and Finance Committees of Beazer Homes USA, Inc. (homebuilding, 2012-present). |
Albert R. Gamper, Jr. (1942) |
Year of Election or Appointment: 2007 Trustee Chairman of the Independent Trustees |
| Mr. Gamper also serves as Trustee of other Fidelity funds. Prior to his retirement in December 2004, Mr. Gamper served as Chairman of the Board of CIT Group Inc. (commercial finance). During his tenure with CIT Group Inc. Mr. Gamper served in numerous senior management positions, including Chairman (1987-1989; 1999-2001; 2002-2004), Chief Executive Officer (1987-2004), and President (2002-2003). Mr. Gamper currently serves as a member of the Board of Directors of Public Service Enterprise Group (utilities, 2000-present), a member of the Board of Trustees, Rutgers University (2004-present), and Chairman of the Board of Barnabas Health Care System. Previously, Mr. Gamper served as Vice Chairman of the Independent Trustees of certain Fidelity funds (2011-2012) and as Chairman of the Board of Governors, Rutgers University (2004-2007). |
Robert F. Gartland (1951) |
Year of Election or Appointment: 2010 Trustee |
| Mr. Gartland also serves as Trustee of other Fidelity funds. Mr. Gartland is Chairman and an investor in Gartland and Mellina Group Corp. (consulting, 2009-present). Previously, Mr. Gartland served as a partner and investor of Vietnam Partners LLC (investments and consulting, 2008-2011). Prior to his retirement, Mr. Gartland held a variety of positions at Morgan Stanley (financial services, 1979-2007) including Managing Director (1987-2007). |
Arthur E. Johnson (1947) |
Year of Election or Appointment: 2008 Trustee |
| Mr. Johnson also serves as Trustee of other Fidelity funds. Mr. Johnson serves as a member of the Board of Directors of Eaton Corporation (diversified power management, 2009-present), AGL Resources, Inc. (holding company, 2002-present) and Booz Allen Hamilton (management consulting, 2011-present). Prior to his retirement, Mr. Johnson served as Senior Vice President of Corporate Strategic Development of Lockheed Martin Corporation (defense contractor, 1999-2009). He previously served on the Board of Directors of IKON Office Solutions, Inc. (1999-2008) and Delta Airlines (2005-2007). Mr. Arthur E. Johnson is not related to Ms. Abigail P. Johnson. |
Michael E. Kenneally (1954) |
Year of Election or Appointment: 2009 Trustee |
| Mr. Kenneally also serves as Trustee of other Fidelity funds. Mr. Kenneally served as a Member of the Advisory Board for certain Fidelity funds before joining the Board of Trustees (2008-2009). Prior to his retirement, Mr. Kenneally served as Chairman and Global Chief Executive Officer of Credit Suisse Asset Management. Before joining Credit Suisse, he was an Executive Vice President and Chief Investment Officer for Bank of America Corporation. Earlier roles at Bank of America included Director of Research, Senior Portfolio Manager and Research Analyst, and Mr. Kenneally was awarded the Chartered Financial Analyst (CFA) designation in 1991. |
James H. Keyes (1940) |
Year of Election or Appointment: 2007 Trustee |
| Mr. Keyes also serves as Trustee of other Fidelity funds. Mr. Keyes serves as a member of the Board and Non-Executive Chairman of Navistar International Corporation (manufacture and sale of trucks, buses, and diesel engines, since 2002). Previously, Mr. Keyes served as a member of the Board of Pitney Bowes, Inc. (integrated mail, messaging, and document management solutions, 1998-2013). Prior to his retirement, Mr. Keyes served as Chairman (1993-2002) and Chief Executive Officer (1988-2002) of Johnson Controls (automotive, building, and energy) and as a member of the Board of LSI Logic Corporation (semiconductor technologies, 1984-2008). |
Marie L. Knowles (1946) |
Year of Election or Appointment: 2001 Trustee Vice Chairman of the Independent Trustees |
| Ms. Knowles also serves as Trustee of other Fidelity funds. Prior to Ms. Knowles' retirement in June 2000, she served as Executive Vice President and Chief Financial Officer of Atlantic Richfield Company (ARCO) (diversified energy, 1996-2000). From 1993 to 1996, she was a Senior Vice President of ARCO and President of ARCO Transportation Company. She served as a Director of ARCO from 1996 to 1998. Ms. Knowles currently serves as a Director and Chairman of the Audit Committee of McKesson Corporation (healthcare service, since 2002). Ms. Knowles is a member of the Board of the Catalina Island Conservancy and of the Santa Catalina Island Company (2009-present). She also serves as a member of the Advisory Board for the School of Engineering of the University of Southern California. Previously, Ms. Knowles served as a Director of Phelps Dodge Corporation (copper mining and manufacturing, 1994-2007), URS Corporation (engineering and construction, 2000-2003) and America West (airline, 1999-2002). |
Kenneth L. Wolfe (1939) |
Year of Election or Appointment: 2007 Trustee |
| Mr. Wolfe also serves as Trustee of other Fidelity funds. Prior to his retirement, Mr. Wolfe served as Chairman and a Director (2007-2009) and Chairman and Chief Executive Officer (1994-2001) of Hershey Foods Corporation. He also served as a member of the Boards of Adelphia Communications Corporation (telecommunications, 2003-2006), Bausch & Lomb, Inc. (medical/pharmaceutical, 1993-2007), and Revlon, Inc. (personal care products, 2004-2009). Mr. Wolfe previously served as Chairman of the Independent Trustees of other Fidelity funds (2008-2012). |
+ The information above includes each Trustee's principal occupation during the last five years and other information relating to the experience, attributes, and skills relevant to each Trustee's qualifications to serve as a Trustee, which led to the conclusion that each Trustee should serve as a Trustee for the fund.
Officers:
Correspondence intended for each officer may be sent to Fidelity Investments, 245 Summer Street, Boston, Massachusetts 02210. Officers appear below in alphabetical order.
Name, Year of Birth; Principal Occupation |
Elizabeth Paige Baumann (1968) |
Year of Election or Appointment: 2012 Anti-Money Laundering (AML) Officer |
| Ms. Baumann also serves as AML Officer of other funds. She is Chief AML Officer of FMR LLC (2012-present) and is an employee of Fidelity Investments. Previously, Ms. Baumann served as Vice President and Deputy Anti-Money Laundering Officer (2007-2012). |
Robert P. Brown (1963) |
Year of Election or Appointment: 2012 Vice President of Fidelity's Bond Funds |
| Mr. Brown also serves as Vice President of other funds. Mr. Brown serves as Executive Vice President of Fidelity Investments Money Management, Inc. (FIMM) (2010-present), President, Bond Group of FMR (2011-present), Director and Managing Director, Research of Fidelity Management & Research (U.K.) Inc. (2008-present), and is an employee of Fidelity Investments. Previously, Mr. Brown served as President, Money Market Group of FMR (2010-2011) and Vice President of Fidelity's Money Market Funds (2010-2012). |
Marc Bryant (1966) |
Year of Election or Appointment: 2013 Assistant Secretary |
| Mr. Bryant also serves as an officer of other funds. He is Senior Vice President and Deputy General Counsel of FMR LLC. Prior to joining Fidelity Investments, Mr. Bryant served as a Senior Vice President and the Head of Global Retail Legal for AllianceBernstein L.P. (2006-2010), and as the General Counsel for ProFund Advisors LLC (2001-2006). |
Jonathan Davis (1968) |
Year of Election or Appointment: 2010 Assistant Treasurer |
| Mr. Davis also serves as Assistant Treasurer of other funds. Mr. Davis is an employee of Fidelity Investments. Previously, Mr. Davis served as Vice President and Associate General Counsel of FMR LLC (2003-2010). |
Adrien E. Deberghes (1967) |
Year of Election or Appointment: 2010 Assistant Treasurer |
| Mr. Deberghes also serves as an officer of other funds. He is an employee of Fidelity Investments (2008-present). Prior to joining Fidelity Investments, Mr. Deberghes was Senior Vice President of Mutual Fund Administration at State Street Corporation (2007-2008), Senior Director of Mutual Fund Administration at Investors Bank & Trust (2005-2007), and Director of Finance for Dunkin' Brands (2000-2005). |
Stephanie J. Dorsey (1969) |
Year of Election or Appointment: 2013 President and Treasurer |
| Ms. Dorsey also serves as an officer of other funds. She is an employee of Fidelity Investments (2008-present) and has served in other fund officer roles. Prior to joining Fidelity Investments, Ms. Dorsey served as Treasurer (2004-2008) of the JPMorgan Mutual Funds and Vice President (2004-2008) of JPMorgan Chase Bank. |
Scott C. Goebel (1968) |
Year of Election or Appointment: 2008 Secretary and Chief Legal Officer (CLO) |
| Mr. Goebel serves as Secretary and CLO of other funds. Mr. Goebel also serves as Secretary of Fidelity Investments Money Management, Inc. (FIMM) (2010-present) and Fidelity Research and Analysis Company (FRAC) (2010-present); General Counsel, Secretary, and Senior Vice President of FMR (2008-present) and FMR Co., Inc. (2008-present); Chief Legal Officer of Fidelity Management & Research (Hong Kong) Limited (2008-present) and Assistant Secretary of Fidelity Management & Research (Japan) Inc. (2008-present), and Fidelity Management & Research (U.K.) Inc. (2008-present). Previously, Mr. Goebel served as Secretary and CLO of other Fidelity funds (2008-2013), Assistant Secretary of FIMM (2008-2010), FRAC (2008-2010), and certain funds (2007-2008); and as Vice President and Secretary of Fidelity Distributors Corporation (FDC) (2005-2007). Mr. Goebel has been employed by FMR LLC or an affiliate since 2001. |
Chris Maher (1972) |
Year of Election or Appointment: 2013 Assistant Treasurer |
| Mr. Maher serves as Assistant Treasurer of other funds. Mr. Maher is Vice President of Valuation Oversight and is an employee of Fidelity Investments. Previously, Mr. Maher served as Vice President of Asset Management Compliance (2013), Vice President of FMR's Program Management Group (2010-2013), and Vice President of Valuation Oversight (2008-2010). |
Charles S. Morrison (1960) |
Year of Election or Appointment: 2012 Vice President |
| Mr. Morrison also serves as Vice President of other funds. He serves as President, Fixed Income and is an employee of Fidelity Investments. Previously, Mr. Morrison served as Vice President of Fidelity's Money Market Funds (2005-2009), President, Money Market Group Leader of FMR (2009), and Senior Vice President, Money Market Group of FMR (2004-2009). Mr. Morrison also served as Vice President of Fidelity's Bond Funds (2002-2005), certain Balanced Funds (2002-2005), and certain Asset Allocation Funds (2002-2007), and as Senior Vice President (2002-2005) of Fidelity's Fixed Income Division. |
Christine Reynolds (1958) |
Year of Election or Appointment: 2008 Chief Financial Officer |
| Ms. Reynolds also serves as Chief Financial Officer of other funds. Ms. Reynolds became President of Fidelity Pricing and Cash Management Services (FPCMS) in August 2008. Ms. Reynolds served as Chief Operating Officer of FPCMS (2007-2008). Previously, Ms. Reynolds served as President, Treasurer, and Anti-Money Laundering officer of the Fidelity funds (2004-2007). |
Kenneth B. Robins (1969) |
Year of Election or Appointment: 2009 Assistant Treasurer |
| Mr. Robins also serves as an officer of other funds. Mr. Robins serves as Executive Vice President of Fidelity Investments Money Management, Inc. (FIMM) (2013-present) and is an employee of Fidelity Investments (2004-present). Previously, Mr. Robins served in other fund officer roles. |
Gary W. Ryan (1958) |
Year of Election or Appointment: 2005 Assistant Treasurer |
| Mr. Ryan also serves as Assistant Treasurer of other funds. Mr. Ryan is an employee of Fidelity Investments and has served in other fund officer roles. Previously, Mr. Ryan served as Vice President of Fund Reporting in Fidelity Pricing and Cash Management Services (FPCMS) (1999-2005). |
Stephen Sadoski (1971) |
Year of Election or Appointment: 2013 Deputy Treasurer |
| Mr. Sadoski also serves as Deputy Treasurer of other funds. He is an employee of Fidelity Investments (2012-present) and has served in another fund officer role. Prior to joining Fidelity Investments, Mr. Sadoski served as an assistant chief accountant in the Division of Investment Management of the Securities and Exchange Commission (SEC) (2009-2012) and as a senior manager at Deloitte & Touche LLP (1997-2009). |
Stacie M. Smith (1974) |
Year of Election or Appointment: 2013 Assistant Treasurer |
| Ms. Smith also serves as an officer of other funds. She is an employee of Fidelity Investments (2009-present) and has served in other fund officer roles. Prior to joining Fidelity Investments, Ms. Smith served as Senior Audit Manager of Ernst & Young LLP (1996-2009). |
Renee Stagnone (1975) |
Year of Election or Appointment: 2013 Deputy Treasurer |
| Ms. Stagnone also serves as Deputy Treasurer of other funds. Ms. Stagnone is an employee of Fidelity Investments. |
Michael H. Whitaker (1967) |
Year of Election or Appointment: 2008 Chief Compliance Officer |
| Mr. Whitaker also serves as Chief Compliance Officer of other funds. Mr. Whitaker is an employee of Fidelity Investments (2007-present). Prior to joining Fidelity Investments, Mr. Whitaker worked at MFS Investment Management where he served as Senior Vice President and Chief Compliance Officer (2004-2006), and Assistant General Counsel. |
Joseph F. Zambello (1957) |
Year of Election or Appointment: 2011 Deputy Treasurer |
| Mr. Zambello also serves as Deputy Treasurer of other funds. Mr. Zambello is an employee of Fidelity Investments. Previously, Mr. Zambello served as Vice President of FMR's Program Management Group (2009-2011) and Vice President of the Transfer Agent Oversight Group (2005-2009). |
Annual Report
The Board of Trustees of VIP Investment Grade Bond Portfolio voted to pay to shareholders of record at the opening of business on record date, the following distributions per share derived from capital gains realized from sales of portfolio securities:
Fund | Pay Date | Record Date | Capital Gains |
Initial Class | 02/14/2014 | 02/14/2014 | $0.004 |
Service Class | 02/14/2014 | 02/14/2014 | $0.004 |
Service Class 2 | 02/14/2014 | 02/14/2014 | $0.004 |
Investor Class | 02/14/2014 | 02/14/2014 | $0.004 |
The fund hereby designates as a capital gain dividend with respect to the taxable year ended December 31, 2013 $35,760,678, or, if subsequently determined to be different, the net capital gain of such year.
A total of 15.85% of the dividends distributed during the fiscal year was derived from interest on U.S. government securities which is generally exempt from state income tax.
Annual Report
Board Approval of Investment Advisory Contracts and Management Fees
VIP Investment Grade Bond Portfolio
Each year, the Board of Trustees, including the Independent Trustees (together, the Board), votes on the renewal of the management contract with Fidelity Management & Research Company (FMR) and the sub-advisory agreements (together, the Advisory Contracts) for the fund. The Board, assisted by the advice of fund counsel and Independent Trustees' counsel, requests and considers a broad range of information relevant to the renewal of the Advisory Contracts throughout the year.
The Board meets regularly and, at each of its meetings, covers an extensive agenda of topics and materials and considers factors that are relevant to its annual consideration of the renewal of the fund's Advisory Contracts, including the services and support provided to the fund and its shareholders. The Board has established four standing committees, Operations, Audit, Fair Valuation, and Governance and Nominating, each composed of and chaired by Independent Trustees with varying backgrounds, to which the Board has assigned specific subject matter responsibilities in order to enhance effective decision-making by the Board. The Operations Committee, of which all of the Independent Trustees are members, meets regularly throughout the year and, among other matters, considers matters specifically related to the annual consideration of the renewal of the fund's Advisory Contracts. The Board, acting directly and through its Committees, requests and receives information concerning the annual consideration of the renewal of the fund's Advisory Contracts. The Board also meets as needed to consider matters specifically related to the Board's annual consideration of the renewal of Advisory Contracts. Members of the Board may also meet with trustees of other Fidelity funds through ad hoc joint committees to discuss certain matters relevant to the Fidelity funds.
At its September 2013 meeting, the Board, including the Independent Trustees, unanimously determined to renew the fund's Advisory Contracts. In reaching its determination, the Board considered all factors it believed relevant, including (i) the nature, extent, and quality of the services to be provided to the fund and its shareholders (including the investment performance of the fund); (ii) the competitiveness of the fund's management fee and total expense ratio relative to peer funds; (iii) the total costs of the services to be provided by and the profits to be realized by Fidelity from its relationship with the fund; (iv) the extent to which economies of scale exist and would be realized as the fund grows; and (v) whether fee levels reflect these economies of scale, if any, for the benefit of fund shareholders.
In considering whether to renew the Advisory Contracts for the fund, the Board reached a determination, with the assistance of fund counsel and Independent Trustees' counsel and through the exercise of its business judgment, that the renewal of the Advisory Contracts was in the best interests of the fund and its shareholders and that the compensation payable under the Advisory Contracts was fair and reasonable. The Board's decision to renew the Advisory Contracts was not based on any single factor, but rather was based on a comprehensive consideration of all the information provided to the Board at its meetings throughout the year. The Board, in reaching its determination to renew the Advisory Contracts, was aware that shareholders in the fund have a broad range of investment choices available to them, including a wide choice among mutual funds offered by Fidelity's competitors, and that the fund's shareholders, who have the opportunity to review and weigh the disclosure provided by the fund in its prospectus and other public disclosures, have chosen to invest in this fund, which is part of the Fidelity family of funds.
Nature, Extent, and Quality of Services Provided. The Board considered Fidelity's staffing as it relates to the fund, including the backgrounds of investment personnel of FMR and the sub-advisers (together, the Investment Advisers), and also considered the fund's investment objective, strategies, and related investment philosophy. The Independent Trustees also had discussions with senior management of Fidelity's investment operations and investment groups. The Board considered the structure of the portfolio manager compensation program and whether this structure provides appropriate incentives to act in the best interests of the fund.
Resources Dedicated to Investment Management and Support Services. The Board reviewed the general qualifications and capabilities of Fidelity's investment staff, including its size, education, experience, and resources, as well Fidelity's approach to recruiting, managing, and compensating investment personnel. The Board noted that Fidelity has continued to increase the resources devoted to non-U.S. offices, including expansion of Fidelity's global investment organization. The Board also noted that Fidelity's analysts have extensive resources, tools and capabilities that allow them to conduct sophisticated quantitative and fundamental analysis, as well as credit analysis of issuers, counterparties and guarantors. Further, the Board believes that Fidelity's investment professionals have sufficient access to global information and data so as to provide competitive investment results over time, and that those professionals also have access to sophisticated tools that permit them to assess portfolio construction and risk and performance attribution characteristics continuously, as well as to transmit new information and research conclusions rapidly around the world. Additionally, in its deliberations, the Board considered the Fidelity's trading and risk management capabilities and resources, which are an integral part of the investment management process.
Shareholder and Administrative Services. The Board considered (i) the nature, extent, quality, and cost of advisory, administrative, and shareholder services performed by the Investment Advisers and their affiliates under the Advisory Contracts and under separate agreements covering transfer agency, pricing and bookkeeping, and securities lending services for the fund; (ii) the nature and extent of the supervision of third party service providers, principally custodians and subcustodians; and (iii) the resources devoted to, and the record of compliance with, the fund's compliance policies and procedures.
Annual Report
Board Approval of Investment Advisory Contracts and Management Fees - continued
The Board noted that the growth of fund assets over time across the complex allows Fidelity to reinvest in the development of services designed to enhance the value or convenience of the Fidelity funds as investment vehicles. These services include 24-hour access to account information and market information through telephone representatives and over the Internet, investor education materials and asset allocation tools, and the expanded availability of Fidelity Investor Centers.
Investment in a Large Fund Family. The Board considered the benefits to shareholders of investing in a Fidelity fund, including the benefits of investing in a fund that is part of a large family of funds offering a variety of investment disciplines and providing a large variety of mutual fund investor services. The Board noted that Fidelity had taken, or had made recommendations that resulted in the Fidelity funds taking, a number of actions over the previous year that benefited particular funds, including (i) continuing to dedicate additional resources to investment research and to the support of the senior management team that oversees asset management; (ii) persisting in efforts to enhance Fidelity's global research capabilities; (iii) launching new funds and making other enhancements to meet client needs for global and income-oriented solutions; (iv) continuing to launch dedicated lower cost underlying funds to meet portfolio construction needs related to expanding underlying fund options for Fidelity funds of funds, specifically for the Freedom Fund product lines; (v) rationalizing product lines and gaining increased efficiencies through the combination of several funds with other funds; (vi) strengthening Fidelity's index fund offerings by reducing investment minimums and adopting or lowering existing expense caps for certain funds and classes; (vii) enhancing Global Asset Allocation product offerings by launching new funds and strategies, including "open architecture" target date funds that utilize affiliated and unaffiliated sub-advisers; (viii) modifying the eligibility criteria for Institutional Class shares of Advisor funds to increase their marketability to a portion of the defined contribution plan market; (ix) creating a new low-cost retirement share class for certain Advisor funds to appeal to large retirement plans; (x) transitioning the management of certain Fidelity commodity funds to Geode Capital Management LLC, a registered commodity pool operator, while retaining administrative responsibilities for the funds; and (xi) taking steps toward establishing a new Fidelity adviser to manage sector-based funds and products.
Investment Performance. The Board considered whether the fund has operated in accordance with its investment objective, as well as its record of compliance with its investment restrictions and its performance history.
The Board took into account discussions with the Investment Advisers about fund investment performance that occur at Board meetings throughout the year. In this regard the Board noted that as part of regularly scheduled fund reviews and other reports to the Board on fund performance, the Board periodically considers annualized return information for the fund for different time periods, measured against a securities market index ("benchmark index") and a peer group of mutual funds with similar objectives ("peer group"). In its evaluation of fund investment performance at meetings throughout the year, the Board gave particular attention to information indicating underperformance of certain Fidelity funds for specific time periods and the Investment Advisers' explanations for such underperformance.
In addition to reviewing absolute and relative fund performance, the Independent Trustees periodically consider the appropriateness of fund performance metrics in evaluating the results achieved. In general, the Independent Trustees believe that fund performance should be evaluated based on gross performance (before fees and expenses but after transaction costs) compared to appropriate benchmark indices, over appropriate time periods that may include full market cycles, and on net performance (after fees and expenses) compared to peer groups, as applicable, over the same periods, taking into account relevant factors including the following: general market conditions; expectations for interest rate levels and credit conditions; issuer-specific information including credit quality; tactical opportunities for investment; the potential for incremental return versus the fund's benchmark index weighed against the risks involved in obtaining that incremental return, including the risk of diminished or negative total returns; and fund cash flows and other factors. Depending on the circumstances, the Independent Trustees may be satisfied with a fund's performance notwithstanding that it lags its benchmark index or peer group for certain periods.
The Independent Trustees recognize that shareholders evaluate performance on a net basis over their own holding periods, for which one-, three-, and five-year periods are often used as a proxy. For this reason, the performance information reviewed by the Board also included net cumulative calendar year total return information for the fund and an appropriate benchmark index and peer group for the most recent one-, three-, and five-year periods.
Based on its review, the Board concluded that the nature, extent, and quality of services provided to the fund under the Advisory Contracts should benefit the fund's shareholders.
Competitiveness of Management Fee and Total Expense Ratio. The Board considered the fund's management fee and total expense ratio compared to "mapped groups" of competitive funds and classes. Fidelity creates "mapped groups" by combining similar Lipper investment objective categories that have comparable investment mandates. Combining Lipper investment objective categories aids the Board's management fee and total expense ratio comparisons by broadening the competitive group used for comparison and by reducing the number of universes to which various Fidelity funds are compared.
Management Fee. The Board considered two proprietary management fee comparisons for the 12-month periods shown in the chart below. The group of Lipper funds used by the Board for management fee comparisons is referred to below as the "Total Mapped Group" and, for the reasons explained above, is broader than the Lipper peer group used by the Board for performance comparisons. The Total Mapped Group comparison focuses on a fund's standing in terms of gross management fees before expense reimbursements or caps relative to the total universe of funds with comparable investment mandates, regardless of whether their management fee structures also are comparable. "TMG %" represents the percentage of funds in the Total Mapped Group that had management fees that were lower than the fund's. For example, a hypothetical TMG % of 50% would mean that half of the funds in the Total Mapped Group had higher, and half had lower, management fees than the fund. The fund's actual TMG %s are in the chart below. The "Asset-Size Peer Group" (ASPG) comparison focuses on a fund's standing relative to a subset of non-Fidelity funds within the Total Mapped Group that are similar in size and management fee structure. For example, if a fund is in the first quartile of the ASPG, the fund's management fee ranks in the least expensive or lowest 25% of funds in the ASPG. The ASPG represents at least 15% of the funds in the Total Mapped Group with comparable asset size and management fee structures, subject to a minimum of 50 funds (or all funds in the Total Mapped Group if fewer than 50). Additional information, such as the ASPG quartile in which the fund's management fee rate ranked, is also included in the chart and considered by the Board.
Annual Report
VIP Investment Grade Bond Portfolio
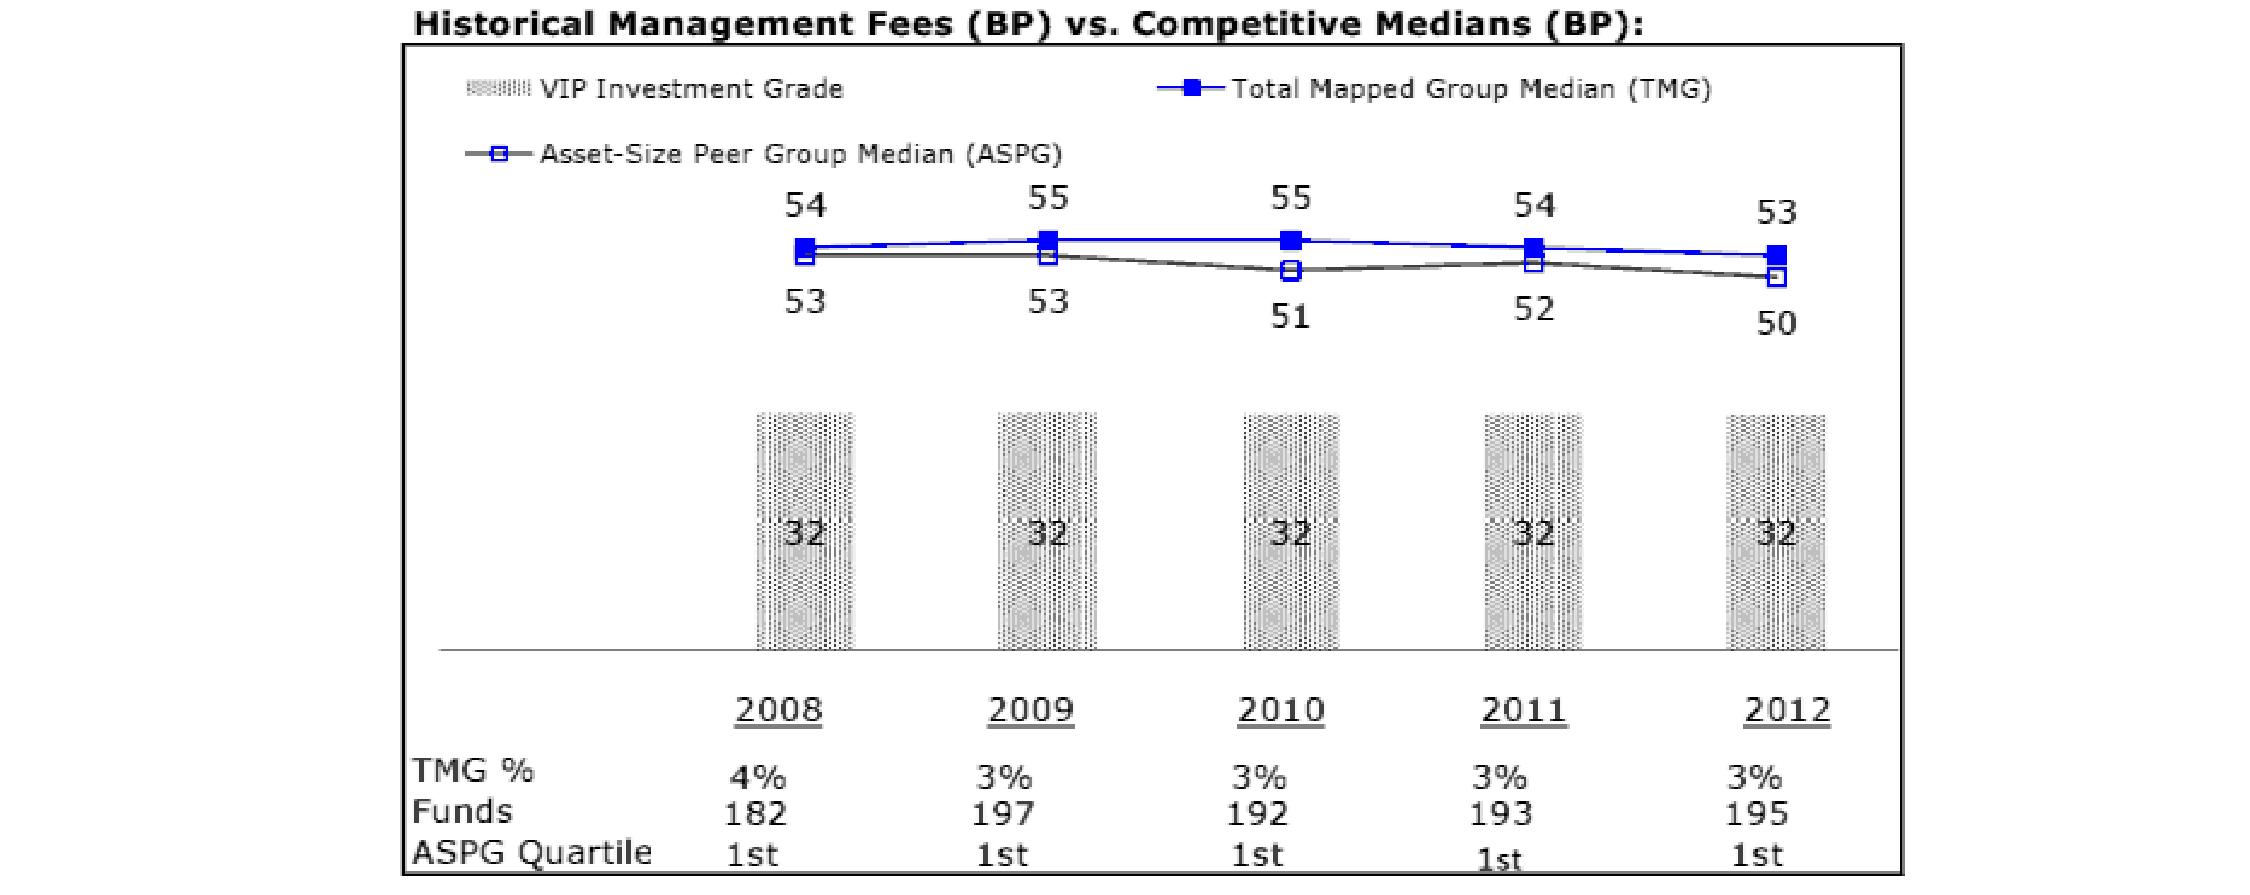
The Board noted that the fund's management fee rate ranked below the median of its Total Mapped Group and below the median of its ASPG for 2012.
Based on its review, the Board concluded that the fund's management fee is fair and reasonable in light of the services that the fund receives and the other factors considered.
Total Expense Ratio. In its review of each class's total expense ratio, the Board considered the fund's management fee as well as other fund or class expenses, as applicable, such as transfer agent fees, pricing and bookkeeping fees, fund-paid 12b-1 fees, and custodial, legal, and audit fees. The Board also noted the effects of any waivers and reimbursements on fees and expenses. As part of its review, the Board also considered the current and historical total expense ratios of each class of the fund compared to competitive fund median expenses. Each class of the fund is compared to those funds and classes in the Total Mapped Group (used by the Board for management fee comparisons) that have a similar sales load structure.
The Board noted that the total expense ratio of each class ranked below its competitive median for 2012.
Fees Charged to Other Fidelity Clients. The Board also considered Fidelity fee structures and other information with respect to clients of Fidelity, such as other mutual funds advised or subadvised by Fidelity, pension plan clients, and other institutional clients. The Board noted the findings of the 2013 ad hoc joint committee (created with the board of other Fidelity funds), which reviewed and compared Fidelity's institutional investment advisory business with its business of providing services to the Fidelity funds, including the differences in services provided, fees charged, and costs incurred, as well as competition in their respective marketplaces.
Based on its review of total expense ratios and fees charged to other Fidelity clients, the Board concluded that the total expense ratio of each class of the fund was reasonable in light of the services that the fund and its shareholders receive and the other factors considered.
Costs of the Services and Profitability. The Board considered the revenues earned and the expenses incurred by Fidelity in conducting the business of developing, marketing, distributing, managing, administering and servicing the fund and servicing the fund's shareholders. The Board also considered the level of Fidelity's profits in respect of all the Fidelity funds.
On an annual basis, Fidelity presents to the Board Fidelity's profitability for the fund. Fidelity calculates the profitability for each fund, as well as aggregate profitability for groups of Fidelity funds and all Fidelity funds, using a series of detailed revenue and cost allocation methodologies which originate with the books and records of Fidelity on which Fidelity's audited financial statements are based. The Audit Committee of the Board reviews any significant changes from the prior year's methodologies.
Annual Report
Board Approval of Investment Advisory Contracts and Management Fees - continued
PricewaterhouseCoopers LLP (PwC), independent registered public accounting firm and auditor to Fidelity and certain Fidelity funds, has been engaged annually by the Board as part of the Board's assessment of Fidelity's profitability analysis. PwC's engagement includes the review and assessment of the methodologies used by Fidelity in determining the revenues and expenses attributable to Fidelity's mutual fund business, and completion of agreed-upon procedures surrounding the mathematical accuracy of fund profitability and its conformity to allocation methodologies. After considering PwC's reports issued under the engagement and information provided by Fidelity, the Board concluded that while other allocation methods may also be reasonable, Fidelity's profitability methodologies are reasonable in all material respects.
The Board also reviewed Fidelity's non-fund businesses and fall-out benefits related to the mutual fund business as well as cases where Fidelity's affiliates may benefit from or be related to the fund's business.
The Board considered the costs of the services provided by and the profits realized by Fidelity in connection with the operation of the fund and was satisfied that the profitability was not excessive in the circumstances.
Economies of Scale. The Board considered whether there have been economies of scale in respect of the management of the Fidelity funds, whether the Fidelity funds (including the fund) have appropriately benefited from any such economies of scale, and whether there is potential for realization of any further economies of scale. The Board considered the extent to which the fund will benefit from economies of scale through increased services to the fund, through waivers or reimbursements, or through fee or expense reductions. The Board also noted that in 2009, it and the board of other Fidelity funds created an ad hoc committee (the Economies of Scale Committee) to analyze whether Fidelity attains economies of scale in respect of the management and servicing of the Fidelity funds, whether the Fidelity funds have appropriately benefited from such economies of scale, and whether there is potential for realization of any further economies of scale.
The Board recognized that the fund's management contract incorporates a "group fee" structure, which provides for lower group fee rates as total fund assets under FMR's management increase, and for higher group fee rates as total fund assets under FMR's management decrease. FMR calculates the group fee rates based on a tiered asset "breakpoint" schedule that varies based on asset class. The Board considered that the group fee is designed to deliver the benefits of economies of scale to fund shareholders when total Fidelity fund assets increase, even if assets of any particular fund are unchanged or have declined, because some portion of Fidelity's costs are attributable to services provided to all Fidelity funds, and all funds benefit if those costs can be allocated among more assets. The Board concluded that, given the group fee structure, fund shareholders will benefit from lower management fees as assets under FMR's management increase at the fund complex level, regardless of whether Fidelity achieves any such economies of scale.
The Board concluded, taking into account the analysis of the Economies of Scale Committee, that economies of scale, if any, are being appropriately shared between fund shareholders and Fidelity.
Amendment to Description of Group Fee Rate. At its September 2013 meeting, the Board voted to approve an amendment to the fund's management contract to modify the description of the "group fee rate." The Board noted that under the prior description in the contract, the group fee rate was based on the average net assets of all registered investment companies with which FMR has management contracts. Under the contract's tiered asset breakpoint schedule, the group fee rate is lower as total fund assets under FMR's management increase, and higher as total fund assets under FMR's management decrease. The Board considered that the prior description would have excluded the assets of 64 Fidelity sector funds from the group fee rate calculation once Fidelity SelectCo, LLC, an affiliate of FMR, assumed management responsibilities for those funds. The Board noted that modifying the description of the group fee rate to continue to include the assets of those 64 funds for purposes of determining group fee rate breakpoints would avoid an immediate adverse impact on the group fee rate for any fund.
Additional Information Requested by the Board. In order to develop fully the factual basis for consideration of the Fidelity funds' Advisory Contracts, the Board requested and received additional information on certain topics, including: (i) Fidelity's fund profitability methodology, profitability trends for certain funds, and the impact of certain factors on fund profitability results; (ii) portfolio manager changes that have occurred during the past year and the amount of the investment that each portfolio manager has made in the Fidelity fund(s) that he or she manages; (iii) Fidelity's compensation structure for portfolio managers, research analysts, and other key personnel, including its effects on fund profitability, the rationale for the compensation structure, and the extent to which current market conditions have affected retention and recruitment; (iv) the arrangements with and compensation paid to certain fund sub-advisers on behalf of the Fidelity funds; (v) Fidelity's fee structures, including the group fee structure and definition of group assets, and the rationale for recommending different fees among different categories of funds and classes; (vi) Fidelity's voluntary waiver of its fees to maintain minimum yields for certain money market funds and classes as well as contractual waivers in place for certain funds; (vii) the methodology with respect to competitive fund data and peer group classifications; (viii) Fidelity's transfer agent fee, expense, and service structures for different funds and classes, and the impact of the increased use of omnibus accounts; and (ix) explanations regarding the relative total expense ratios of certain funds and classes, total expense competitive trends and methodologies for total expense competitive comparisons, and actions that might be taken by Fidelity to reduce total expense ratios for certain funds and classes or to achieve further economies of scale.
Based on its evaluation of all of the conclusions noted above, and after considering all factors it believed relevant, the Board ultimately concluded that the advisory fee structures are fair and reasonable, and that the fund's Advisory Contracts should be renewed.
Annual Report
The following are the financial statements for the Fidelity VIP Investment
Grade Central Fund as of December 31, 2013 which is a direct investment of
VIP Investment Grade Bond Portfolio.
Not Part of Financial Report
Performance: The Bottom Line
Average annual total return reflects the change in the value of an investment, assuming reinvestment of the fund's distributions from dividend income and capital gains (the profits earned upon the sale of securities that have grown in value, if any) and assuming a constant rate of performance each year. The $10,000 table and the fund's returns do not reflect the deduction of taxes that a shareholder would pay on fund distributions or the redemption of fund shares. During periods of reimbursement by Fidelity, a fund's total return will be greater than it would be had the reimbursement not occurred. How a fund did yesterday is no guarantee of how it will do tomorrow.
Average Annual Total Returns
Periods ended December 31, 2013 | Past 1
year | Past 5
years | Life of
fund A |
Fidelity® VIP Investment Grade Central Fund | -1.46% | 7.16% | 5.86% |
A From June 23, 2006.
$10,000 Over Life of Fund
Let's say hypothetically that $10,000 was invested in Fidelity® VIP Investment Grade Central Fund on June 23, 2006, when the fund started. The chart shows how the value of your investment would have changed, and also shows how the Barclays® U.S. Aggregate Bond Index performed over the same period.
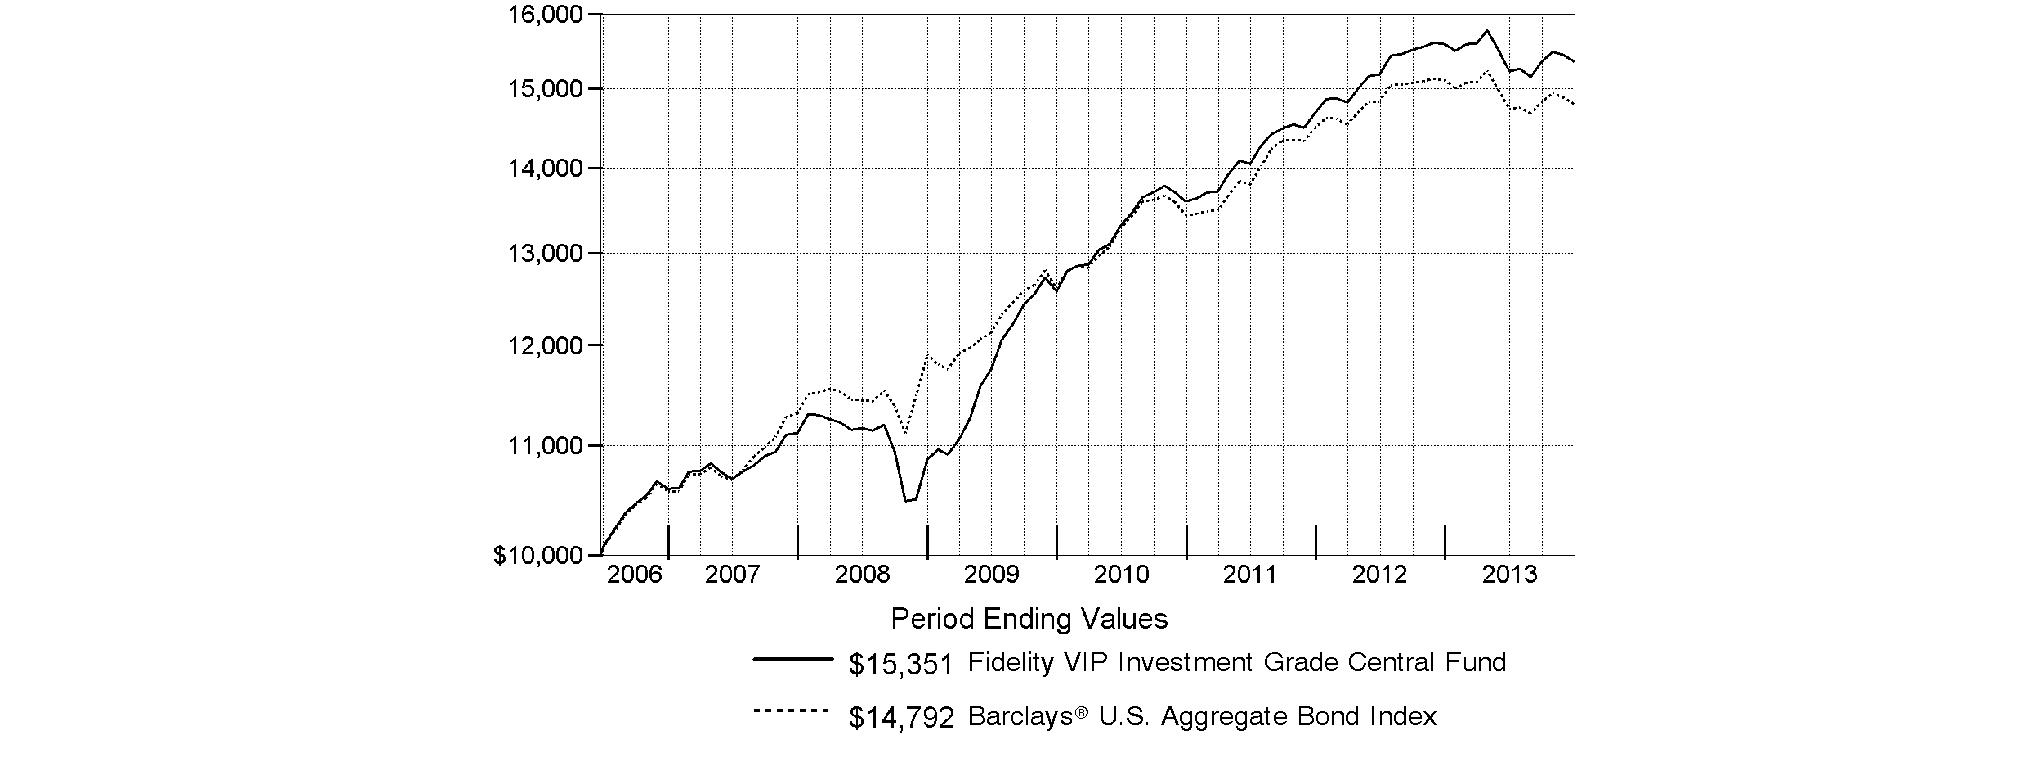
Not Part of Financial Report
Management's Discussion of Fund Performance
Market Recap: The prospect of tighter monetary policy weighed on U.S. taxable investment-grade bonds during the 12-month period ending December 31, 2013, resulting in a -2.02% return for the Barclays® U.S. Aggregate Bond Index. Much of the damage occurred from May through August, as interest rates spiked higher amid signals from the U.S. Federal Reserve that it could begin tapering its stimulative bond-buying programs prior to year-end, prompting waves of investor outflows. Surprisingly strong global economic data also tempered demand for higher-quality, rate-sensitive bonds. The market staged a bit of rebound in September and October because the Fed refrained from tapering. But the period ended on a weak note, when better-than-expected economic news revived the specter of tapering and the Fed announced it would begin to dial back its bond purchases in January 2014. U.S. Treasuries and mortgage-backed securities returned -2.75% and -1.41%, respectively, while government-agency securities returned -1.38%. Investment-grade credit also lost ground, returning -2.01%, due to rising interest rates and investors' intermittent aversion to riskier assets. Thanks largely to their higher yields, commercial mortgage-backed securities fared best, advancing 0.23%.
Comments from Ford O'Neil, Lead Portfolio Manager of Fidelity® VIP Investment Grade Central Fund: For the year, the fund returned -1.46%, outpacing the Barclays U.S. Aggregate Bond Index. Favorable positioning among investment-grade corporate bonds was beneficial, most notably our larger-than-benchmark exposure to financials, which solidly outpaced the broader credit market. Security selection within industrials, specifically communications, was another plus, with our large overweighting to Verizon providing a significant boost. An overweighting in commercial mortgage-backed securities (CMBS) delivered a meaningful boost to relative performance, as this comparatively high-quality, high-yielding, short-duration segment substantially outperformed the benchmark. Timely purchases of out-of-index municipal bonds issued in California and Illinois were helpful, as the credit outlook for both states meaningfully improved. An underweighting in sovereign bonds, particularly our lack of exposure to bonds issued in Turkey, aided performance. In contrast, yield-curve positioning detracted. As part of our approach to managing the fund's yield-curve exposure, the fund was overweighted in 30-year U.S. Treasuries and shorter-term bonds. This positioning proved detrimental, as the highly interest-rate-sensitive 30-year securities were among the market's worst performers.
The views expressed above reflect those of the portfolio manager(s) only through the end of the period as stated on the cover of this report and do not necessarily represent the views of Fidelity or any other person in the Fidelity organization. Any such views are subject to change at any time based upon market or other conditions and Fidelity disclaims any responsibility to update such views. These views may not be relied on as investment advice and, because investment decisions for a Fidelity fund are based on numerous factors, may not be relied on as an indication of trading intent on behalf of any Fidelity fund.
Not Part of Financial Report
Shareholder Expense Example
As a shareholder of the Fund, you incur two types of costs: (1) transaction costs, and (2) ongoing costs, including other Fund expenses. This Example is intended to help you understand your ongoing costs (in dollars) of investing in the Fund and to compare these costs with the ongoing costs of investing in other mutual funds.
The Example is based on an investment of $1,000 invested at the beginning of the period and held for the entire period (July 1, 2013 to December 31, 2013).
Actual Expenses
The first line of the accompanying table provides information about actual account values and actual expenses. You may use the information in this line, together with the amount you invested, to estimate the expenses that you paid over the period. Simply divide your account value by $1,000.00 (for example, an $8,600 account value divided by $1,000.00 = 8.6), then multiply the result by the number in the first line under the heading entitled "Expenses Paid During Period" to estimate the expenses you paid on your account during this period. In addition, the Fund, as a shareholder in the underlying Fidelity Central Funds, will indirectly bear its pro-rata share of the fees and expenses incurred by the underlying Fidelity Central Funds. These fees and expenses are not included in the Fund's annualized expense ratio used to calculate the expense estimate in the table below.
Hypothetical Example for Comparison Purposes
The second line of the accompanying table provides information about hypothetical account values and hypothetical expenses based on the Fund's actual expense ratio and an assumed rate of return of 5% per year before expenses, which is not the Fund's actual return. The hypothetical account values and expenses may not be used to estimate the actual ending account balance or expenses you paid for the period. You may use this information to compare the ongoing costs of investing in the Fund and other funds. To do so, compare this 5% hypothetical example with the 5% hypothetical examples that appear in the shareholder reports of the other funds. In addition, the Fund, as a shareholder in the underlying Fidelity Central Funds, will indirectly bear its pro-rata share of the fees and expenses incurred by the underlying Fidelity Central Funds. These fees and expenses are not included in the Fund's annualized expense ratio used to calculate the expense estimate in the table below.
Please note that the expenses shown in the table are meant to highlight your ongoing costs only and do not reflect any transaction costs. Therefore, the second line of the table is useful in comparing ongoing costs only, and will not help you determine the relative total costs of owning different funds.
| Annualized
Expense Ratio B | Beginning
Account Value
July 1, 2013 | Ending
Account Value
December 31, 2013 | Expenses Paid
During Period*
July 1, 2013
to December 31, 2013 |
Actual | .0022% | $ 1,000.00 | $ 1,008.80 | $ .01 |
HypotheticalA | | $ 1,000.00 | $ 1,025.19 | $ .01 |
A 5% return per year before expenses
B Annualized expense ratio reflects expenses net of applicable fee waivers.
* Expenses are equal to the Fund's annualized expense ratio, multiplied by the average account value over the period, multiplied by 184/365 (to reflect the one-half year period).
Not Part of Financial Report
Investment Changes (Unaudited)
Quality Diversification (% of fund's net assets) |
As of December 31, 2013 | As of June 30, 2013 |
| U.S. Government and
U.S. Government
Agency Obligations 52.2% | | | U.S. Government and
U.S. Government
Agency Obligations 62.8% | |
| AAA 4.5% | | | AAA 2.6% | |
| AA 2.9% | | | AA 2.4% | |
| A 9.4% | | | A 9.1% | |
 | BBB 23.8% | |  | BBB 18.4% | |
 | BB and Below 2.3% | | | BB and Below 2.1% | |
| Not Rated 0.1% | | | Not Rated 0.1% | |
| Short-Term
Investments and
Net Other Assets 4.8% | | | Short-Term
Investments and
Net Other Assets 2.5% | |

We have used ratings from Moody's Investors Service, Inc. Where Moody's® ratings are not available, we have used S&P® ratings. All ratings are as of the date indicated and do not reflect subsequent changes. Securities rated BB or below were rated investment grade at the time of acquisition. |
Weighted Average Maturity as of December 31, 2013 |
| | 6 months ago |
Years | 6.8 | 6.4 |
This is a weighted average of all the maturities of the securities held in a fund. Weighted Average Maturity (WAM) can be used as a measure of sensitivity to interest rate changes and market changes. Generally, the longer the maturity, the greater the sensitivity to such changes. WAM is based on the dollar-weighted average length of time until principal payments must be paid. Depending on the types of securities held in a fund, certain maturity shortening devices (e.g., demand features, interest rate resets, and call options) may be taken into account when calculating the WAM. |
Duration as of December 31, 2013 |
| | 6 months ago |
Years | 5.3 | 5.3 |
Duration is a measure of a security's price sensitivity to changes in interest rates. Duration differs from maturity in that it considers a security's interest payments in addition to the amount of time until the security reaches maturity, and also takes into account certain maturity shortening features (e.g., demand features, interest rate resets, and call options) when applicable. Securities with longer durations generally tend to be more sensitive to interest rate changes than securities with shorter durations. A fund with a longer average duration generally can be expected to be more sensitive to interest rate changes than a fund with a shorter average duration. |
Asset Allocation (% of fund's net assets) |
As of December 31, 2013* | As of June 30, 2013** |
| Corporate Bonds 30.5% | | | Corporate Bonds 26.5% | |
| U.S. Government and
U.S. Government
Agency Obligations 52.2% | | | U.S. Government and
U.S. Government
Agency Obligations 62.8% | |
 | Asset-Backed
Securities 1.0% | | | Asset-Backed
Securities 0.7% | |
| CMOs and Other
Mortgage Related
Securities 8.4% | | | CMOs and Other
Mortgage Related
Securities 5.3% | |
| Municipal Bonds 2.4% | | | Municipal Bonds 2.1% | |
| Other Investments 0.7% | | | Other Investments 0.1% | |
| Short-Term
Investments and
Net Other Assets
(Liabilities) 4.8% | | | Short-Term
Investments and
Net Other Assets
(Liabilities) 2.5% | |
* Foreign investments 5.1% | | ** Foreign investments 4.0% | |
* Futures and Swaps 0.0%† | | ** Futures and Swaps 0.0%† | |

† Amount represents less than 0.1% |
Percentages in the above tables are adjusted for the effect of TBA Sale Commitments. |
Not Part of Financial Report
Investments December 31, 2013
Showing Percentage of Net Assets
Nonconvertible Bonds - 30.5% |
| Principal Amount | | Value |
CONSUMER DISCRETIONARY - 2.2% |
Automobiles - 0.1% |
Daimler Finance North America LLC 1.45% 8/1/16 (e) | | $ 2,724,000 | | $ 2,740,039 |
Diversified Consumer Services - 0.2% |
Ingersoll-Rand Global Holding Co. Ltd.: | | | | |
2.875% 1/15/19 (e) | | 416,000 | | 409,801 |
4.25% 6/15/23 (e) | | 2,932,000 | | 2,859,204 |
5.75% 6/15/43 (e) | | 2,110,000 | | 2,134,468 |
| | 5,403,473 |
Media - 1.9% |
AOL Time Warner, Inc. 7.625% 4/15/31 | | 1,625,000 | | 2,051,514 |
Comcast Corp.: | | | | |
4.65% 7/15/42 | | 5,434,000 | | 5,038,905 |
4.95% 6/15/16 | | 2,975,000 | | 3,248,286 |
6.4% 3/1/40 | | 2,058,000 | | 2,367,151 |
6.45% 3/15/37 | | 1,410,000 | | 1,631,474 |
COX Communications, Inc. 3.25% 12/15/22 (e) | | 1,609,000 | | 1,453,691 |
DIRECTV Holdings LLC/DIRECTV Financing, Inc. 5.875% 10/1/19 | | 4,711,000 | | 5,333,502 |
Discovery Communications LLC: | | | | |
3.25% 4/1/23 | | 604,000 | | 560,112 |
4.875% 4/1/43 | | 1,416,000 | | 1,301,688 |
6.35% 6/1/40 | | 2,421,000 | | 2,670,288 |
NBCUniversal, Inc.: | | | | |
5.15% 4/30/20 | | 3,234,000 | | 3,610,748 |
6.4% 4/30/40 | | 3,340,000 | | 3,827,587 |
News America Holdings, Inc. 7.75% 12/1/45 | | 3,169,000 | | 3,991,581 |
News America, Inc.: | | | | |
6.15% 3/1/37 | | 2,331,000 | | 2,554,314 |
6.15% 2/15/41 | | 1,822,000 | | 2,024,091 |
Thomson Reuters Corp. 1.3% 2/23/17 | | 1,374,000 | | 1,367,827 |
Time Warner Cable, Inc.: | | | | |
4% 9/1/21 | | 5,937,000 | | 5,506,692 |
4.5% 9/15/42 | | 8,550,000 | | 6,455,857 |
5.5% 9/1/41 | | 1,944,000 | | 1,605,995 |
5.85% 5/1/17 | | 1,239,000 | | 1,350,899 |
5.875% 11/15/40 | | 1,806,000 | | 1,557,726 |
6.75% 7/1/18 | | 4,425,000 | | 4,960,120 |
Time Warner, Inc.: | | | | |
5.875% 11/15/16 | | 5,514,000 | | 6,220,299 |
6.5% 11/15/36 | | 2,337,000 | | 2,632,801 |
Viacom, Inc.: | | | | |
2.5% 9/1/18 | | 546,000 | | 550,123 |
|
| Principal Amount | | Value |
3.5% 4/1/17 | | $ 1,312,000 | | $ 1,386,314 |
4.375% 3/15/43 | | 1,321,000 | | 1,111,447 |
| | 76,371,032 |
TOTAL CONSUMER DISCRETIONARY | | 84,514,544 |
CONSUMER STAPLES - 1.5% |
Beverages - 0.3% |
Beam, Inc. 1.75% 6/15/18 | | 2,229,000 | | 2,171,162 |
Heineken NV: | | | | |
1.4% 10/1/17 (e) | | 2,178,000 | | 2,135,882 |
2.75% 4/1/23 (e) | | 2,276,000 | | 2,035,561 |
SABMiller Holdings, Inc. 3.75% 1/15/22 (e) | | 3,034,000 | | 3,041,015 |
| | 9,383,620 |
Food & Staples Retailing - 0.2% |
CVS Caremark Corp.: | | | | |
1.2% 12/5/16 | | 1,469,000 | | 1,470,378 |
2.25% 12/5/18 | | 3,097,000 | | 3,094,439 |
4% 12/5/23 | | 3,097,000 | | 3,085,300 |
| | 7,650,117 |
Food Products - 0.2% |
ConAgra Foods, Inc.: | | | | |
1.9% 1/25/18 | | 1,554,000 | | 1,524,824 |
3.2% 1/25/23 | | 1,807,000 | | 1,675,011 |
4.65% 1/25/43 | | 978,000 | | 895,293 |
General Mills, Inc. 5.2% 3/17/15 | | 3,528,000 | | 3,719,810 |
| | 7,814,938 |
Tobacco - 0.8% |
Altria Group, Inc.: | | | | |
2.85% 8/9/22 | | 2,952,000 | | 2,713,791 |
4% 1/31/24 | | 2,394,000 | | 2,335,993 |
4.25% 8/9/42 | | 2,952,000 | | 2,510,227 |
4.75% 5/5/21 | | 4,000,000 | | 4,287,172 |
5.375% 1/31/44 | | 4,099,000 | | 4,101,660 |
9.7% 11/10/18 | | 2,242,000 | | 2,945,486 |
Philip Morris International, Inc. 5.65% 5/16/18 | | 2,751,000 | | 3,158,148 |
Reynolds American, Inc.: | | | | |
3.25% 11/1/22 | | 2,224,000 | | 2,046,732 |
4.75% 11/1/42 | | 3,437,000 | | 3,044,312 |
6.15% 9/15/43 | | 1,680,000 | | 1,808,152 |
7.25% 6/15/37 | | 2,962,000 | | 3,458,594 |
| | 32,410,267 |
TOTAL CONSUMER STAPLES | | 57,258,942 |
ENERGY - 3.9% |
Energy Equipment & Services - 0.4% |
DCP Midstream LLC: | | | | |
4.75% 9/30/21 (e) | | 3,739,000 | | 3,732,438 |
5.35% 3/15/20 (e) | | 3,724,000 | | 3,887,957 |
Nonconvertible Bonds - continued |
| Principal Amount | | Value |
ENERGY - continued |
Energy Equipment & Services - continued |
El Paso Pipeline Partners Operating Co. LLC: | | | | |
4.1% 11/15/15 | | $ 3,902,000 | | $ 4,103,995 |
5% 10/1/21 | | 1,517,000 | | 1,586,740 |
Transocean, Inc. 5.05% 12/15/16 | | 2,488,000 | | 2,748,215 |
| | 16,059,345 |
Oil, Gas & Consumable Fuels - 3.5% |
Anadarko Petroleum Corp. 6.375% 9/15/17 | | 6,869,000 | | 7,883,036 |
Apache Corp. 4.75% 4/15/43 | | 2,750,000 | | 2,657,674 |
Chevron Corp. 2.427% 6/24/20 | | 2,041,000 | | 1,983,705 |
ConocoPhillips Co. 5.75% 2/1/19 | | 3,900,000 | | 4,501,290 |
DCP Midstream Operating LP: | | | | |
2.5% 12/1/17 | | 1,990,000 | | 1,980,591 |
3.875% 3/15/23 | | 1,228,000 | | 1,129,066 |
Devon Energy Corp. 1.2% 12/15/16 | | 4,495,000 | | 4,492,766 |
Duke Energy Field Services 6.45% 11/3/36 (e) | | 2,477,000 | | 2,515,874 |
El Paso Natural Gas Co. 5.95% 4/15/17 | | 3,330,000 | | 3,701,218 |
Enbridge Energy Partners LP 4.2% 9/15/21 | | 4,399,000 | | 4,419,979 |
Encana Holdings Finance Corp. 5.8% 5/1/14 | | 320,000 | | 325,525 |
Marathon Petroleum Corp. 5.125% 3/1/21 | | 2,187,000 | | 2,366,179 |
Motiva Enterprises LLC 5.75% 1/15/20 (e) | | 1,496,000 | | 1,697,083 |
Nakilat, Inc. 6.067% 12/31/33 (e) | | 1,808,000 | | 1,889,360 |
Petro-Canada 6.05% 5/15/18 | | 1,480,000 | | 1,704,775 |
Petrobras Global Finance BV: | | | | |
3% 1/15/19 | | 714,000 | | 668,184 |
4.375% 5/20/23 | | 7,020,000 | | 6,223,230 |
5.625% 5/20/43 | | 6,681,000 | | 5,453,780 |
Petrobras International Finance Co. Ltd.: | | | | |
3.875% 1/27/16 | | 3,612,000 | | 3,718,417 |
5.375% 1/27/21 | | 9,195,000 | | 9,125,008 |
5.75% 1/20/20 | | 6,461,000 | | 6,647,975 |
7.875% 3/15/19 | | 4,277,000 | | 4,844,738 |
Petroleos Mexicanos: | | | | |
3.5% 7/18/18 | | 5,440,000 | | 5,582,800 |
3.5% 1/30/23 | | 3,410,000 | | 3,124,413 |
4.875% 1/24/22 | | 3,398,000 | | 3,488,047 |
5.5% 1/21/21 | | 3,601,000 | | 3,874,676 |
5.5% 6/27/44 | | 7,799,000 | | 7,116,588 |
6.5% 6/2/41 | | 7,675,000 | | 8,020,375 |
Phillips 66 Co.: | | | | |
4.3% 4/1/22 | | 3,770,000 | | 3,825,709 |
5.875% 5/1/42 | | 1,819,000 | | 1,966,195 |
|
| Principal Amount | | Value |
Plains All American Pipeline LP/PAA Finance Corp.: | | | | |
3.65% 6/1/22 | | $ 1,784,000 | | $ 1,750,188 |
6.125% 1/15/17 | | 1,250,000 | | 1,405,035 |
Spectra Energy Capital, LLC 3.3% 3/15/23 | | 5,000,000 | | 4,421,060 |
Spectra Energy Partners, LP: | | | | |
2.95% 6/15/16 | | 668,000 | | 693,387 |
2.95% 9/25/18 | | 733,000 | | 742,615 |
4.6% 6/15/21 | | 873,000 | | 903,806 |
Suncor Energy, Inc. 6.1% 6/1/18 | | 4,665,000 | | 5,390,100 |
Transcontinental Gas Pipe Line Corp. 6.4% 4/15/16 | | 615,000 | | 685,957 |
Western Gas Partners LP 5.375% 6/1/21 | | 3,820,000 | | 4,087,362 |
| | 137,007,766 |
TOTAL ENERGY | | 153,067,111 |
FINANCIALS - 15.0% |
Capital Markets - 1.4% |
Goldman Sachs Group, Inc.: | | | | |
2.9% 7/19/18 | | 6,251,000 | | 6,358,361 |
5.25% 7/27/21 | | 1,125,000 | | 1,230,109 |
5.625% 1/15/17 | | 3,000,000 | | 3,304,740 |
5.95% 1/18/18 | | 755,000 | | 858,027 |
6.15% 4/1/18 | | 5,954,000 | | 6,824,326 |
Lazard Group LLC: | | | | |
4.25% 11/14/20 | | 2,080,000 | | 2,073,088 |
6.85% 6/15/17 | | 3,241,000 | | 3,652,931 |
Morgan Stanley: | | | | |
2.125% 4/25/18 | | 4,257,000 | | 4,218,287 |
3.75% 2/25/23 | | 6,489,000 | | 6,304,310 |
4.875% 11/1/22 | | 4,345,000 | | 4,441,294 |
5% 11/24/25 | | 1,047,000 | | 1,048,216 |
5.75% 1/25/21 | | 1,751,000 | | 1,978,455 |
6.625% 4/1/18 | | 10,165,000 | | 11,888,832 |
| | 54,180,976 |
Commercial Banks - 2.6% |
Bank of America NA 5.3% 3/15/17 | | 3,403,000 | | 3,749,575 |
Credit Suisse AG 6% 2/15/18 | | 6,486,000 | | 7,506,832 |
Discover Bank: | | | | |
4.2% 8/8/23 | | 2,849,000 | | 2,805,493 |
7% 4/15/20 | | 2,309,000 | | 2,682,483 |
8.7% 11/18/19 | | 1,503,000 | | 1,878,637 |
Fifth Third Bancorp: | | | | |
4.5% 6/1/18 | | 1,179,000 | | 1,256,671 |
8.25% 3/1/38 | | 4,319,000 | | 5,733,974 |
HBOS PLC 6.75% 5/21/18 (e) | | 2,600,000 | | 2,939,625 |
Huntington Bancshares, Inc. 7% 12/15/20 | | 1,004,000 | | 1,162,997 |
Nonconvertible Bonds - continued |
| Principal Amount | | Value |
FINANCIALS - continued |
Commercial Banks - continued |
KeyBank NA: | | | | |
5.45% 3/3/16 | | $ 1,618,000 | | $ 1,760,711 |
5.8% 7/1/14 | | 2,049,000 | | 2,101,895 |
6.95% 2/1/28 | | 800,000 | | 947,659 |
Marshall & Ilsley Bank: | | | | |
4.85% 6/16/15 | | 1,796,000 | | 1,891,389 |
5% 1/17/17 | | 4,952,000 | | 5,352,256 |
Regions Bank: | | | | |
6.45% 6/26/37 | | 7,720,000 | | 8,156,180 |
7.5% 5/15/18 | | 6,153,000 | | 7,280,759 |
Regions Financial Corp.: | | | | |
2% 5/15/18 | | 4,497,000 | | 4,352,412 |
5.75% 6/15/15 | | 814,000 | | 867,337 |
7.75% 11/10/14 | | 2,367,000 | | 2,497,308 |
Royal Bank of Scotland Group PLC: | | | | |
6% 12/19/23 | | 5,383,000 | | 5,421,327 |
6.1% 6/10/23 | | 5,485,000 | | 5,521,344 |
6.125% 12/15/22 | | 8,239,000 | | 8,408,443 |
Wells Fargo & Co.: | | | | |
1.25% 7/20/16 | | 14,500,000 | | 14,606,575 |
3.676% 6/15/16 | | 1,714,000 | | 1,824,856 |
| | 100,706,738 |
Consumer Finance - 1.2% |
American Express Credit Corp. 1.3% 7/29/16 | | 4,207,000 | | 4,239,263 |
Discover Financial Services 3.85% 11/21/22 | | 5,040,000 | | 4,771,524 |
Ford Motor Credit Co. LLC: | | | | |
1.5% 1/17/17 | | 2,686,000 | | 2,684,582 |
1.7% 5/9/16 | | 6,586,000 | | 6,660,942 |
2.875% 10/1/18 | | 4,500,000 | | 4,603,824 |
General Electric Capital Corp.: | | | | |
1% 12/11/15 | | 3,432,000 | | 3,459,494 |
2.95% 5/9/16 | | 774,000 | | 810,306 |
3.5% 6/29/15 | | 799,000 | | 833,856 |
5.625% 5/1/18 | | 9,700,000 | | 11,134,155 |
HSBC U.S.A., Inc. 1.625% 1/16/18 | | 3,721,000 | | 3,667,473 |
Hyundai Capital America: | | | | |
1.625% 10/2/15 (e) | | 1,373,000 | | 1,379,872 |
1.875% 8/9/16 (e) | | 1,083,000 | | 1,086,849 |
2.125% 10/2/17 (e) | | 1,518,000 | | 1,506,998 |
2.875% 8/9/18 (e) | | 1,921,000 | | 1,927,339 |
| | 48,766,477 |
Diversified Financial Services - 3.0% |
Bank of America Corp.: | | | | |
2.6% 1/15/19 | | 5,065,000 | | 5,084,602 |
3.3% 1/11/23 | | 12,978,000 | | 12,261,303 |
3.875% 3/22/17 | | 3,077,000 | | 3,282,984 |
|
| Principal Amount | | Value |
4.1% 7/24/23 | | $ 4,166,000 | | $ 4,176,940 |
5.75% 12/1/17 | | 12,290,000 | | 13,981,669 |
6.5% 8/1/16 | | 3,000,000 | | 3,387,045 |
BP Capital Markets PLC 4.742% 3/11/21 | | 3,000,000 | | 3,277,467 |
Citigroup, Inc.: | | | | |
1.3% 11/15/16 | | 6,383,000 | | 6,360,251 |
3.375% 3/1/23 | | 2,800,000 | | 2,657,203 |
3.953% 6/15/16 | | 3,838,000 | | 4,082,999 |
4.05% 7/30/22 | | 1,800,000 | | 1,777,324 |
4.75% 5/19/15 | | 4,790,000 | | 5,040,287 |
5.5% 9/13/25 | | 1,663,000 | | 1,748,428 |
6.125% 5/15/18 | | 1,159,000 | | 1,340,694 |
Five Corners Funding Trust 4.419% 11/15/23 (e) | | 4,110,000 | | 4,044,746 |
JPMorgan Chase & Co.: | | | | |
1.625% 5/15/18 | | 8,510,000 | | 8,328,958 |
2% 8/15/17 | | 5,000,000 | | 5,069,730 |
3.15% 7/5/16 | | 4,200,000 | | 4,402,919 |
3.25% 9/23/22 | | 5,719,000 | | 5,472,214 |
4.35% 8/15/21 | | 4,371,000 | | 4,600,556 |
4.5% 1/24/22 | | 6,648,000 | | 7,022,043 |
6.3% 4/23/19 | | 3,920,000 | | 4,624,138 |
RBS Citizens Financial Group, Inc. 4.15% 9/28/22 (e) | | 4,259,000 | | 4,114,322 |
TECO Finance, Inc.: | | | | |
4% 3/15/16 | | 1,075,000 | | 1,139,730 |
5.15% 3/15/20 | | 1,545,000 | | 1,692,543 |
| | 118,971,095 |
Insurance - 2.3% |
Allstate Corp. 6.2% 5/16/14 | | 2,709,000 | | 2,766,152 |
American International Group, Inc.: | | | | |
4.875% 9/15/16 | | 2,638,000 | | 2,897,186 |
4.875% 6/1/22 | | 1,252,000 | | 1,343,765 |
5.6% 10/18/16 | | 3,756,000 | | 4,184,451 |
Aon Corp.: | | | | |
3.125% 5/27/16 | | 3,681,000 | | 3,838,565 |
3.5% 9/30/15 | | 1,538,000 | | 1,605,192 |
5% 9/30/20 | | 1,402,000 | | 1,538,162 |
Axis Capital Holdings Ltd. 5.75% 12/1/14 | | 420,000 | | 438,824 |
Hartford Financial Services Group, Inc. 5.125% 4/15/22 | | 4,644,000 | | 5,051,246 |
Liberty Mutual Group, Inc. 5% 6/1/21 (e) | | 4,093,000 | | 4,287,241 |
Marsh & McLennan Companies, Inc. 4.8% 7/15/21 | | 2,278,000 | | 2,425,355 |
Massachusetts Mutual Life Insurance Co. 5.375% 12/1/41 (e) | | 2,110,000 | | 2,173,963 |
MetLife, Inc.: | | | | |
3.048% 12/15/22 | | 3,731,000 | | 3,473,915 |
4.368% 9/15/23 (h) | | 3,574,000 | | 3,642,735 |
4.75% 2/8/21 | | 1,477,000 | | 1,594,377 |
Nonconvertible Bonds - continued |
| Principal Amount | | Value |
FINANCIALS - continued |
Insurance - continued |
MetLife, Inc.: - continued | | | | |
6.75% 6/1/16 | | $ 3,234,000 | | $ 3,676,935 |
Metropolitan Life Global Funding I: | | | | |
3% 1/10/23 (e) | | 2,636,000 | | 2,452,031 |
5.125% 6/10/14 (e) | | 2,884,000 | | 2,943,756 |
Northwestern Mutual Life Insurance Co. 6.063% 3/30/40 (e) | | 2,214,000 | | 2,479,423 |
Pacific Life Insurance Co. 9.25% 6/15/39 (e) | | 2,297,000 | | 3,181,044 |
Pacific LifeCorp: | | | | |
5.125% 1/30/43 (e) | | 5,252,000 | | 4,812,607 |
6% 2/10/20 (e) | | 4,627,000 | | 5,156,278 |
Prudential Financial, Inc.: | | | | |
2.3% 8/15/18 | | 599,000 | | 595,153 |
4.5% 11/16/21 | | 2,157,000 | | 2,292,533 |
5.8% 11/16/41 | | 2,824,000 | | 3,116,917 |
6.2% 11/15/40 | | 1,297,000 | | 1,483,869 |
7.375% 6/15/19 | | 1,250,000 | | 1,533,789 |
Symetra Financial Corp. 6.125% 4/1/16 (e) | | 6,355,000 | | 6,764,472 |
Unum Group: | | | | |
5.625% 9/15/20 | | 2,889,000 | | 3,163,114 |
5.75% 8/15/42 | | 5,234,000 | | 5,331,174 |
| | 90,244,224 |
Real Estate Investment Trusts - 1.7% |
Alexandria Real Estate Equities, Inc. 4.6% 4/1/22 | | 1,200,000 | | 1,205,855 |
American Campus Communities Operating Partnership LP 3.75% 4/15/23 | | 1,184,000 | | 1,097,036 |
AvalonBay Communities, Inc.: | | | | |
3.625% 10/1/20 | | 1,872,000 | | 1,890,267 |
4.2% 12/15/23 | | 4,000,000 | | 3,965,816 |
Boston Properties, Inc. 3.85% 2/1/23 | | 4,708,000 | | 4,592,800 |
BRE Properties, Inc. 5.5% 3/15/17 | | 670,000 | | 734,719 |
Camden Property Trust: | | | | |
2.95% 12/15/22 | | 1,607,000 | | 1,449,856 |
4.25% 1/15/24 | | 3,408,000 | | 3,364,439 |
DDR Corp. 4.625% 7/15/22 | | 2,855,000 | | 2,907,949 |
Developers Diversified Realty Corp.: | | | | |
4.75% 4/15/18 | | 3,691,000 | | 3,979,832 |
7.5% 4/1/17 | | 1,944,000 | | 2,264,986 |
9.625% 3/15/16 | | 1,253,000 | | 1,468,948 |
Duke Realty LP: | | | | |
3.625% 4/15/23 | | 2,123,000 | | 1,956,361 |
3.875% 10/15/22 | | 3,512,000 | | 3,332,870 |
4.375% 6/15/22 | | 2,340,000 | | 2,316,020 |
5.5% 3/1/16 | | 1,270,000 | | 1,374,284 |
5.95% 2/15/17 | | 928,000 | | 1,032,314 |
6.5% 1/15/18 | | 2,445,000 | | 2,792,980 |
|
| Principal Amount | | Value |
Equity One, Inc.: | | | | |
3.75% 11/15/22 | | $ 5,500,000 | | $ 5,152,466 |
5.375% 10/15/15 | | 455,000 | | 488,544 |
6% 9/15/17 | | 2,405,000 | | 2,691,777 |
Federal Realty Investment Trust 5.9% 4/1/20 | | 1,046,000 | | 1,199,784 |
HCP, Inc. 3.75% 2/1/16 | | 2,272,000 | | 2,387,299 |
Health Care REIT, Inc.: | | | | |
2.25% 3/15/18 | | 1,731,000 | | 1,710,569 |
4.7% 9/15/17 | | 568,000 | | 617,171 |
HRPT Properties Trust: | | | | |
5.75% 11/1/15 | | 1,155,000 | | 1,204,701 |
6.25% 6/15/17 | | 3,000,000 | | 3,217,377 |
Retail Opportunity Investments Partnership LP 5% 12/15/23 | | 737,000 | | 732,616 |
UDR, Inc. 5.5% 4/1/14 | | 3,685,000 | | 3,725,852 |
United Dominion Realty Trust, Inc. 5.25% 1/15/15 | | 904,000 | | 941,637 |
Weingarten Realty Investors 3.375% 10/15/22 | | 812,000 | | 744,841 |
| | 66,541,966 |
Real Estate Management & Development - 2.8% |
BioMed Realty LP: | | | | |
3.85% 4/15/16 | | 3,700,000 | | 3,863,170 |
4.25% 7/15/22 | | 1,842,000 | | 1,765,948 |
6.125% 4/15/20 | | 1,392,000 | | 1,524,354 |
Brandywine Operating Partnership LP: | | | | |
3.95% 2/15/23 | | 4,271,000 | | 3,997,400 |
4.95% 4/15/18 | | 2,312,000 | | 2,485,331 |
5.7% 5/1/17 | | 5,000,000 | | 5,499,645 |
6% 4/1/16 | | 1,005,000 | | 1,095,847 |
7.5% 5/15/15 | | 523,000 | | 568,015 |
Digital Realty Trust LP: | | | | |
4.5% 7/15/15 | | 1,829,000 | | 1,902,467 |
5.25% 3/15/21 | | 1,953,000 | | 1,990,785 |
ERP Operating LP: | | | | |
4.625% 12/15/21 | | 5,595,000 | | 5,890,735 |
4.75% 7/15/20 | | 2,827,000 | | 3,044,410 |
5.375% 8/1/16 | | 1,066,000 | | 1,175,268 |
5.75% 6/15/17 | | 5,343,000 | | 5,996,834 |
Liberty Property LP: | | | | |
3.375% 6/15/23 | | 2,202,000 | | 2,000,854 |
4.125% 6/15/22 | | 2,007,000 | | 1,972,602 |
4.4% 2/15/24 | | 4,876,000 | | 4,779,850 |
4.75% 10/1/20 | | 4,185,000 | | 4,393,116 |
5.5% 12/15/16 | | 2,290,000 | | 2,527,675 |
6.625% 10/1/17 | | 2,673,000 | | 3,059,751 |
Mack-Cali Realty LP: | | | | |
2.5% 12/15/17 | | 2,995,000 | | 2,961,854 |
3.15% 5/15/23 | | 4,988,000 | | 4,322,576 |
4.5% 4/18/22 | | 1,218,000 | | 1,195,119 |
Nonconvertible Bonds - continued |
| Principal Amount | | Value |
FINANCIALS - continued |
Real Estate Management & Development - continued |
Mid-America Apartments LP: | | | | |
4.3% 10/15/23 | | $ 831,000 | | $ 806,624 |
5.5% 10/1/15 (e) | | 6,290,000 | | 6,768,612 |
Post Apartment Homes LP 3.375% 12/1/22 | | 790,000 | | 726,621 |
Prime Property Funding, Inc. 5.125% 6/1/15 (e) | | 3,844,000 | | 4,027,636 |
Reckson Operating Partnership LP 6% 3/31/16 | | 4,360,000 | | 4,724,160 |
Regency Centers LP: | | | | |
5.25% 8/1/15 | | 1,468,000 | | 1,558,636 |
5.875% 6/15/17 | | 2,430,000 | | 2,708,155 |
Simon Property Group LP: | | | | |
2.75% 2/1/23 | | 2,705,000 | | 2,467,828 |
2.8% 1/30/17 | | 857,000 | | 886,123 |
4.125% 12/1/21 | | 2,399,000 | | 2,478,424 |
5.1% 6/15/15 | | 2,220,000 | | 2,364,211 |
Tanger Properties LP: | | | | |
3.875% 12/1/23 | | 1,792,000 | | 1,724,501 |
6.125% 6/1/20 | | 4,876,000 | | 5,582,206 |
Ventas Realty LP 1.55% 9/26/16 | | 2,853,000 | | 2,873,037 |
Ventas Realty LP/Ventas Capital Corp.: | | | | |
2% 2/15/18 | | 2,696,000 | | 2,648,979 |
4% 4/30/19 | | 1,357,000 | | 1,425,159 |
| | 111,784,518 |
TOTAL FINANCIALS | | 591,195,994 |
HEALTH CARE - 1.1% |
Biotechnology - 0.1% |
Amgen, Inc. 5.15% 11/15/41 | | 4,000,000 | | 3,971,456 |
Health Care Providers & Services - 0.5% |
Aetna, Inc. 2.75% 11/15/22 | | 2,118,000 | | 1,947,901 |
Express Scripts Holding Co. 4.75% 11/15/21 | | 3,953,000 | | 4,171,364 |
Express Scripts, Inc. 3.125% 5/15/16 | | 3,450,000 | | 3,600,589 |
Medco Health Solutions, Inc. 4.125% 9/15/20 | | 2,723,000 | | 2,816,127 |
UnitedHealth Group, Inc.: | | | | |
2.75% 2/15/23 | | 708,000 | | 647,232 |
2.875% 3/15/23 | | 5,473,000 | | 5,084,357 |
WellPoint, Inc. 3.3% 1/15/23 | | 1,974,000 | | 1,839,265 |
| | 20,106,835 |
Life Sciences Tools & Services - 0.1% |
Thermo Fisher Scientific, Inc.: | | | | |
1.3% 2/1/17 | | 1,129,000 | | 1,124,003 |
2.4% 2/1/19 | | 712,000 | | 704,985 |
|
| Principal Amount | | Value |
4.15% 2/1/24 | | $ 1,093,000 | | $ 1,080,803 |
5.3% 2/1/44 | | 455,000 | | 458,466 |
| | 3,368,257 |
Pharmaceuticals - 0.4% |
AbbVie, Inc.: | | | | |
1.75% 11/6/17 | | 4,266,000 | | 4,256,871 |
2.9% 11/6/22 | | 4,376,000 | | 4,083,613 |
Mylan, Inc. 1.35% 11/29/16 | | 1,345,000 | | 1,342,432 |
Perrigo Co. Ltd.: | | | | |
1.3% 11/8/16 (e) | | 1,103,000 | | 1,099,094 |
2.3% 11/8/18 (e) | | 1,180,000 | | 1,164,079 |
Watson Pharmaceuticals, Inc. 1.875% 10/1/17 | | 1,428,000 | | 1,412,520 |
Zoetis, Inc.: | | | | |
1.875% 2/1/18 | | 676,000 | | 670,142 |
3.25% 2/1/23 | | 1,649,000 | | 1,540,476 |
4.7% 2/1/43 | | 1,654,000 | | 1,540,398 |
| | 17,109,625 |
TOTAL HEALTH CARE | | 44,556,173 |
INDUSTRIALS - 0.4% |
Airlines - 0.2% |
Continental Airlines, Inc.: | | | | |
6.648% 3/15/19 | | 878,194 | | 923,202 |
6.795% 2/2/20 | | 1,084,707 | | 1,152,501 |
Northwest Airlines, Inc. pass-thru trust certificates 7.027% 11/1/19 | | 2,509,981 | | 2,786,079 |
U.S. Airways pass-thru trust certificates: | | | | |
6.85% 1/30/18 | | 774,291 | | 809,135 |
8.36% 1/20/19 | | 3,284,794 | | 3,621,485 |
| | 9,292,402 |
Industrial Conglomerates - 0.2% |
General Electric Co. 5.25% 12/6/17 | | 7,130,000 | | 8,067,395 |
TOTAL INDUSTRIALS | | 17,359,797 |
INFORMATION TECHNOLOGY - 0.1% |
Computers & Peripherals - 0.1% |
Apple, Inc. 3.85% 5/4/43 | | 5,454,000 | | 4,539,070 |
Electronic Equipment & Components - 0.0% |
Tyco Electronics Group SA 2.375% 12/17/18 | | 832,000 | | 819,985 |
TOTAL INFORMATION TECHNOLOGY | | 5,359,055 |
MATERIALS - 0.8% |
Chemicals - 0.2% |
The Dow Chemical Co.: | | | | |
4.125% 11/15/21 | | 3,587,000 | | 3,700,299 |
Nonconvertible Bonds - continued |
| Principal Amount | | Value |
MATERIALS - continued |
Chemicals - continued |
The Dow Chemical Co.: - continued | | | | |
4.25% 11/15/20 | | $ 1,931,000 | | $ 2,054,271 |
4.375% 11/15/42 | | 1,579,000 | | 1,381,415 |
| | 7,135,985 |
Metals & Mining - 0.6% |
Anglo American Capital PLC 9.375% 4/8/14 (e) | | 2,675,000 | | 2,734,294 |
Corporacion Nacional del Cobre de Chile (Codelco): | | | | |
3.875% 11/3/21 (e) | | 3,750,000 | | 3,667,781 |
4.5% 8/13/23 (e) | | 5,000,000 | | 4,968,500 |
5.625% 10/18/43 (e) | | 2,882,000 | | 2,832,709 |
Rio Tinto Finance (U.S.A.) PLC 2.25% 12/14/18 | | 4,174,000 | | 4,151,168 |
Vale Overseas Ltd.: | | | | |
4.375% 1/11/22 | | 3,818,000 | | 3,704,464 |
6.25% 1/23/17 | | 3,115,000 | | 3,453,840 |
| | 25,512,756 |
TOTAL MATERIALS | | 32,648,741 |
TELECOMMUNICATION SERVICES - 2.0% |
Diversified Telecommunication Services - 1.8% |
AT&T, Inc.: | | | | |
4.35% 6/15/45 | | 11,574,000 | | 9,762,333 |
5.55% 8/15/41 | | 8,621,000 | | 8,720,167 |
6.3% 1/15/38 | | 364,000 | | 401,099 |
CenturyLink, Inc.: | | | | |
5.15% 6/15/17 | | 330,000 | | 353,925 |
6% 4/1/17 | | 825,000 | | 909,563 |
6.15% 9/15/19 | | 2,305,000 | | 2,431,775 |
Embarq Corp.: | | | | |
7.082% 6/1/16 | | 2,793,000 | | 3,120,708 |
7.995% 6/1/36 | | 1,808,000 | | 1,826,028 |
Verizon Communications, Inc.: | | | | |
3.85% 11/1/42 | | 1,284,000 | | 1,044,858 |
6.1% 4/15/18 | | 2,190,000 | | 2,542,314 |
6.25% 4/1/37 | | 1,380,000 | | 1,524,705 |
6.4% 9/15/33 | | 4,059,000 | | 4,655,515 |
6.55% 9/15/43 | | 29,145,000 | | 33,985,343 |
| | 71,278,333 |
Wireless Telecommunication Services - 0.2% |
America Movil S.A.B. de CV: | | | | |
2.375% 9/8/16 | | 5,411,000 | | 5,568,449 |
3.125% 7/16/22 | | 2,875,000 | | 2,650,046 |
| | 8,218,495 |
TOTAL TELECOMMUNICATION SERVICES | | 79,496,828 |
|
| Principal Amount | | Value |
UTILITIES - 3.5% |
Electric Utilities - 1.9% |
AmerenUE 6.4% 6/15/17 | | $ 3,819,000 | | $ 4,376,753 |
American Electric Power Co., Inc.: | | | | |
1.65% 12/15/17 | | 1,748,000 | | 1,711,961 |
2.95% 12/15/22 | | 1,655,000 | | 1,528,116 |
Dayton Power & Light Co. 1.875% 9/15/16 (e) | | 1,393,000 | | 1,404,282 |
Duke Energy Corp. 3.95% 10/15/23 | | 620,000 | | 619,155 |
Duquesne Light Holdings, Inc.: | | | | |
5.9% 12/1/21 (e) | | 2,664,000 | | 2,923,522 |
6.4% 9/15/20 (e) | | 6,054,000 | | 6,916,828 |
Edison International 3.75% 9/15/17 | | 2,401,000 | | 2,515,242 |
FirstEnergy Corp.: | | | | |
2.75% 3/15/18 | | 3,523,000 | | 3,460,019 |
4.25% 3/15/23 | | 6,228,000 | | 5,796,574 |
7.375% 11/15/31 | | 5,538,000 | | 6,003,148 |
FirstEnergy Solutions Corp. 6.05% 8/15/21 | | 7,286,000 | | 7,776,457 |
LG&E and KU Energy LLC: | | | | |
2.125% 11/15/15 | | 2,670,000 | | 2,716,738 |
3.75% 11/15/20 | | 525,000 | | 530,492 |
Monongahela Power Co.: | | | | |
4.1% 4/15/24 (e) | | 1,477,000 | | 1,473,779 |
5.4% 12/15/43 (e) | | 2,245,000 | | 2,323,600 |
Nevada Power Co. 6.5% 5/15/18 | | 3,165,000 | | 3,728,905 |
Northeast Utilities: | | | | |
1.45% 5/1/18 | | 1,125,000 | | 1,089,084 |
2.8% 5/1/23 | | 5,110,000 | | 4,663,938 |
Pennsylvania Electric Co. 6.05% 9/1/17 | | 2,905,000 | | 3,236,838 |
Pepco Holdings, Inc. 2.7% 10/1/15 | | 2,535,000 | | 2,599,366 |
PPL Capital Funding, Inc. 3.4% 6/1/23 | | 2,425,000 | | 2,252,786 |
Progress Energy, Inc.: | | | | |
4.4% 1/15/21 | | 4,274,000 | | 4,504,766 |
5.625% 1/15/16 | | 2,000,000 | | 2,176,934 |
| | 76,329,283 |
Gas Utilities - 0.0% |
Southern Natural Gas Co./Southern Natural Issuing Corp. 4.4% 6/15/21 | | 1,182,000 | | 1,209,398 |
Independent Power Producers & Energy Traders - 0.1% |
PPL Energy Supply LLC: | | | | |
6.2% 5/15/16 | | 1,229,000 | | 1,351,687 |
6.5% 5/1/18 | | 1,554,000 | | 1,727,902 |
PSEG Power LLC 2.75% 9/15/16 | | 919,000 | | 951,571 |
| | 4,031,160 |
Nonconvertible Bonds - continued |
| Principal Amount | | Value |
UTILITIES - continued |
Multi-Utilities - 1.5% |
Ameren Illinois Co. 6.125% 11/15/17 | | $ 1,465,000 | | $ 1,678,288 |
Dominion Resources, Inc. 2.5469% 9/30/66 (h) | | 13,401,000 | | 12,486,663 |
MidAmerican Energy Holdings, Co.: | | | | |
1.1% 5/15/17 (e) | | 5,903,000 | | 5,870,551 |
2% 11/15/18 (e) | | 4,545,000 | | 4,472,662 |
6.5% 9/15/37 | | 1,334,000 | | 1,544,832 |
National Grid PLC 6.3% 8/1/16 | | 4,181,000 | | 4,701,580 |
NiSource Finance Corp.: | | | | |
4.45% 12/1/21 | | 1,622,000 | | 1,641,313 |
5.25% 2/15/43 | | 4,094,000 | | 3,965,195 |
5.4% 7/15/14 | | 3,885,000 | | 3,980,524 |
5.45% 9/15/20 | | 613,000 | | 680,858 |
5.8% 2/1/42 | | 2,085,000 | | 2,161,567 |
5.95% 6/15/41 | | 3,834,000 | | 3,982,142 |
6.4% 3/15/18 | | 2,760,000 | | 3,174,889 |
Sempra Energy: | | | | |
2.3% 4/1/17 | | 4,185,000 | | 4,237,681 |
2.875% 10/1/22 | | 1,723,000 | | 1,583,938 |
Wisconsin Energy Corp. 6.25% 5/15/67 (h) | | 1,426,000 | | 1,470,563 |
| | 57,633,246 |
TOTAL UTILITIES | | 139,203,087 |
TOTAL NONCONVERTIBLE BONDS (Cost $1,167,293,539) |
1,204,660,272
|
U.S. Treasury Obligations - 30.6% |
|
U.S. Treasury Bonds: | | | | |
3.125% 2/15/43 (l) | | 11,922,000 | | 10,163,505 |
3.625% 8/15/43 | | 57,435,000 | | 54,015,837 |
3.75% 11/15/43 | | 428,000 | | 412,017 |
U.S. Treasury Notes: | | | | |
0.25% 8/15/15 | | 20,500,000 | | 20,491,985 |
0.5% 7/31/17 | | 5,745,000 | | 5,622,471 |
0.625% 12/15/16 (d) | | 132,726,000 | | 132,176,382 |
0.875% 11/30/16 | | 28,809,000 | | 28,899,028 |
0.875% 1/31/17 | | 2,343,000 | | 2,345,198 |
0.875% 4/30/17 | | 695,000 | | 692,828 |
0.875% 1/31/18 | | 63,538,000 | | 62,301,995 |
1% 3/31/17 | | 27,344,000 | | 27,403,829 |
1% 5/31/18 | | 69,810,000 | | 68,261,056 |
|
| Principal
Amount | | Value |
1.25% 10/31/18 | | $ 231,238,000 | | $ 226,559,131 |
1.375% 7/31/18 | | 115,163,000 | | 114,074,364 |
1.5% 12/31/18 | | 140,324,000 | | 138,668,598 |
1.75% 5/15/23 | | 28,620,000 | | 25,749,071 |
1.875% 10/31/17 | | 20,552,000 | | 21,060,991 |
2.375% 2/28/15 | | 41,576,000 | | 42,617,021 |
2.375% 12/31/20 | | 197,573,000 | | 196,554,314 |
2.625% 12/31/14 (g) | | 30,935,000 | | 31,686,628 |
TOTAL U.S. TREASURY OBLIGATIONS (Cost $1,225,516,194) |
1,209,756,249
|
U.S. Government Agency - Mortgage Securities - 21.0% |
|
Fannie Mae - 10.3% |
1.749% 9/1/33 (h) | | 471,423 | | 486,356 |
1.79% 5/1/34 (h) | | 1,045,522 | | 1,078,034 |
1.929% 10/1/33 (h) | | 38,368 | | 39,891 |
1.949% 7/1/35 (h) | | 27,122 | | 28,309 |
2.05% 3/1/35 (h) | | 11,795 | | 12,156 |
2.056% 10/1/33 (h) | | 619,753 | | 646,874 |
2.23% 7/1/34 (h) | | 42,558 | | 44,741 |
2.303% 6/1/36 (h) | | 84,646 | | 89,064 |
2.332% 3/1/35 (h) | | 45,362 | | 48,108 |
2.421% 10/1/33 (h) | | 63,385 | | 66,429 |
2.442% 8/1/36 (h) | | 1,551,937 | | 1,649,417 |
2.5% 1/1/28 to 1/1/43 | | 29,051,707 | | 28,120,623 |
2.526% 11/1/36 (h) | | 1,035,048 | | 1,100,062 |
2.536% 6/1/42 (h) | | 704,849 | | 721,241 |
2.597% 5/1/35 (h) | | 176,202 | | 187,269 |
2.601% 7/1/35 (h) | | 75,974 | | 80,741 |
2.643% 7/1/37 (h) | | 129,910 | | 138,070 |
2.658% 2/1/36 (h) | | 779,247 | | 828,193 |
2.685% 5/1/36 (h) | | 309,231 | | 328,655 |
2.7% 9/1/36 (h) | | 886,203 | | 941,867 |
2.82% 12/1/35 (h) | | 383,055 | | 407,115 |
2.949% 11/1/40 (h) | | 477,959 | | 500,932 |
2.959% 9/1/41 (h) | | 534,569 | | 557,040 |
3% 10/1/42 to 8/1/43 | | 84,224,928 | | 80,055,482 |
3.093% 10/1/41 (h) | | 262,098 | | 273,361 |
3.223% 7/1/41 (h) | | 833,281 | | 876,397 |
3.349% 10/1/41 (h) | | 474,058 | | 498,292 |
3.5% 2/1/42 to 11/1/43 | | 139,331,031 | | 136,921,301 |
3.551% 7/1/41 (h) | | 863,600 | | 911,754 |
4% 9/1/26 to 6/1/43 | | 45,257,720 | | 46,834,788 |
4.5% 5/1/25 to 11/1/41 | | 30,531,626 | | 32,424,320 |
5% 9/1/20 to 9/1/25 | | 2,215,620 | | 2,367,640 |
5.5% 11/1/17 to 3/1/39 | | 36,766,851 | | 40,434,738 |
U.S. Government Agency - Mortgage Securities - continued |
| Principal Amount | | Value |
Fannie Mae - continued |
5.5% 1/1/44 (f) | | $ 3,400,000 | | $ 3,742,922 |
6% 1/1/23 to 1/1/42 | | 14,643,575 | | 16,279,583 |
6.5% 12/1/14 to 8/1/36 | | 5,992,320 | | 6,612,187 |
7% 3/1/15 to 8/1/32 | | 1,121,614 | | 1,278,410 |
7.5% 7/1/16 to 11/1/31 | | 972,269 | | 1,133,408 |
8% 1/1/30 to 5/1/30 | | 42,784 | | 51,296 |
8.5% 3/1/25 to 6/1/25 | | 614 | | 737 |
TOTAL FANNIE MAE | | 408,797,803 |
Freddie Mac - 5.0% |
2.032% 4/1/35 (h) | | 736,444 | | 771,032 |
2.114% 3/1/36 (h) | | 162,164 | | 169,765 |
2.463% 1/1/35 (h) | | 117,389 | | 122,870 |
2.5% 8/1/28 | | 8,387,972 | | 8,312,284 |
3% 8/1/42 to 3/1/43 | | 22,770,237 | | 21,592,246 |
3.01% 10/1/35 (h) | | 116,750 | | 124,083 |
3.035% 3/1/33 (h) | | 7,771 | | 8,233 |
3.136% 11/1/35 (h) | | 279,370 | | 296,918 |
3.227% 4/1/41 (h) | | 520,580 | | 546,696 |
3.242% 9/1/41 (h) | | 477,919 | | 500,754 |
3.281% 6/1/41 (h) | | 636,014 | | 667,699 |
3.46% 5/1/41 (h) | | 560,038 | | 590,813 |
3.5% 1/1/26 to 10/1/43 | | 79,521,584 | | 78,372,355 |
3.624% 6/1/41 (h) | | 828,721 | | 876,407 |
3.715% 5/1/41 (h) | | 807,887 | | 854,525 |
4% 6/1/24 to 4/1/42 | | 30,049,368 | | 30,994,091 |
4.5% 7/1/25 to 10/1/41 | | 28,584,467 | | 30,313,950 |
4.5% 1/1/44 (f) | | 600,000 | | 634,913 |
5% 1/1/35 to 9/1/40 | | 16,284,468 | | 17,625,958 |
5.5% 1/1/38 | | 338,625 | | 371,205 |
6% 4/1/32 to 8/1/37 | | 2,434,955 | | 2,685,141 |
7.5% 5/1/17 to 11/1/31 | | 93,510 | | 108,938 |
8% 7/1/17 to 5/1/27 | | 5,865 | | 6,815 |
8.5% 3/1/20 to 1/1/28 | | 85,178 | | 100,938 |
TOTAL FREDDIE MAC | | 196,648,629 |
Ginnie Mae - 5.7% |
3% 8/20/42 to 2/20/43 | | 17,419,843 | | 16,871,390 |
3.5% 1/15/41 to 7/15/43 | | 23,546,920 | | 23,775,429 |
3.5% 1/1/44 (f) | | 5,700,000 | | 5,747,649 |
3.5% 1/1/44 (f) | | 11,400,000 | | 11,495,297 |
3.5% 1/1/44 (f) | | 2,500,000 | | 2,520,899 |
3.5% 1/1/44 (f) | | 5,500,000 | | 5,539,531 |
4% 1/15/25 to 12/15/41 | | 26,118,850 | | 27,424,285 |
4% 1/1/44 (f) | | 18,300,000 | | 19,027,657 |
4.5% 5/15/39 to 4/15/41 | | 41,664,432 | | 44,569,445 |
5% 3/15/39 to 6/20/41 | | 42,412,335 | | 46,234,628 |
|
| Principal Amount | | Value |
5.5% 6/15/35 | | $ 1,751,570 | | $ 1,936,168 |
6% 3/15/29 to 9/20/38 | | 14,368,859 | | 16,208,080 |
6.5% 10/15/34 to 11/15/35 | | 289,183 | | 330,673 |
7% 1/15/28 to 7/15/32 | | 2,090,507 | | 2,445,750 |
7.5% 4/15/22 to 10/15/28 | | 502,446 | | 587,443 |
8% 2/15/17 to 9/15/30 | | 36,303 | | 42,622 |
8.5% 12/15/16 to 3/15/30 | | 7,238 | | 8,171 |
TOTAL GINNIE MAE | | 224,765,117 |
TOTAL U.S. GOVERNMENT AGENCY - MORTGAGE SECURITIES (Cost $842,970,332) |
830,211,549
|
Asset-Backed Securities - 1.0% |
|
Accredited Mortgage Loan Trust Series 2005-1 Class M1, 0.6346% 4/25/35 (h) | | 234,160 | | 212,321 |
ACE Securities Corp. Home Equity Loan Trust Series 2005-HE2 Class M2, 0.8396% 4/25/35 (h) | | 703 | | 702 |
Airspeed Ltd. Series 2007-1A Class C1, 2.6666% 6/15/32 (e)(h) | | 2,376,961 | | 1,307,328 |
Ally Master Owner Trust: | | | | |
Series 2011-1 Class A2, 2.15% 1/15/16 | | 3,150,000 | | 3,151,859 |
Series 2011-3 Class A2, 1.81% 5/15/16 | | 2,760,000 | | 2,772,561 |
Series 2012-3 Class A2, 1.21% 6/15/17 | | 4,120,000 | | 4,142,722 |
Ameriquest Mortgage Securities, Inc. pass-thru certificates: | | | | |
Series 2003-10 Class M1, 1.2146% 12/25/33 (h) | | 21,168 | | 19,099 |
Series 2004-R2 Class M3, 0.9896% 4/25/34 (h) | | 31,593 | | 19,173 |
Series 2005-R2 Class M1, 0.6146% 4/25/35 (h) | | 418,405 | | 412,959 |
Argent Securities, Inc. pass-thru certificates: | | | | |
Series 2003-W7 Class A2, 0.9446% 3/25/34 (h) | | 16,878 | | 15,933 |
Series 2004-W11 Class M2, 1.2146% 11/25/34 (h) | | 198,000 | | 180,573 |
Series 2004-W7 Class M1, 0.9896% 5/25/34 (h) | | 209,000 | | 193,954 |
Series 2006-W4 Class A2C, 0.3246% 5/25/36 (h) | | 433,669 | | 138,160 |
Asset Backed Securities Corp. Home Equity Loan Trust Series 2004-HE2 Class M1, 0.9896% 4/25/34 (h) | | 719,916 | | 682,681 |
Capital Auto Receivables Trust Series 2013-3 Class A3, 1.39% 12/20/17 | | 4,260,000 | | 4,271,432 |
Asset-Backed Securities - continued |
| Principal Amount | | Value |
Carrington Mortgage Loan Trust Series 2007-RFC1 Class A3, 0.3046% 12/25/36 (h) | | $ 635,000 | | $ 369,864 |
CFC LLC: | | | | |
Series 2013-1A Class A, 1.65% 7/17/17 (e) | | 789,077 | | 788,581 |
Series 2013-2A Class A, 1.75% 11/15/17 (e) | | 3,849,247 | | 3,848,609 |
Countrywide Home Loans, Inc.: | | | | |
Series 2003-BC1 Class B1, 5.4202% 3/25/32 (MGIC Investment Corp. Insured) (h) | | 11,075 | | 5,628 |
Series 2004-3 Class M4, 1.6196% 4/25/34 (h) | | 32,448 | | 24,484 |
Series 2004-4 Class M2, 0.9596% 6/25/34 (h) | | 158,747 | | 137,599 |
Series 2004-7 Class AF5, 5.37% 1/25/35 | | 1,551,172 | | 1,636,310 |
Fannie Mae Series 2004-T5 Class AB3, 0.9942% 5/28/35 (h) | | 13,702 | | 12,315 |
Fieldstone Mortgage Investment Corp. Series 2004-3 Class M5, 2.3396% 8/25/34 (h) | | 102,000 | | 80,583 |
First Franklin Mortgage Loan Trust Series 2004-FF2 Class M3, 0.9896% 3/25/34 (h) | | 4,138 | | 3,480 |
Ford Credit Floorplan Master Owner Trust Series 2013-3 Class A1, 0.79% 6/15/17 | | 8,230,000 | | 8,248,772 |
Fremont Home Loan Trust Series 2005-A: | | | | |
Class M3, 0.8996% 1/25/35 (h) | | 334,000 | | 271,061 |
Class M4, 1.1846% 1/25/35 (h) | | 126,312 | | 50,536 |
GCO Education Loan Funding Master Trust II Series 2007-1A Class C1L, 0.6176% 2/25/47 (e)(h) | | 829,000 | | 701,740 |
GE Business Loan Trust Series 2003-1 Class A, 0.5966% 4/15/31 (e)(h) | | 23,526 | | 21,985 |
GSAMP Trust Series 2004-AR1 Class B4, 5.5% 6/25/34 (c)(e) | | 138,597 | | 9,652 |
Guggenheim Structured Real Estate Funding Ltd. Series 2006-3 Class C, 0.7146% 9/25/46 (e)(h) | | 282,583 | | 282,300 |
Home Equity Asset Trust: | | | | |
Series 2003-3 Class M1, 1.4546% 8/25/33 (h) | | 196,156 | | 183,110 |
Series 2003-5 Class A2, 0.8646% 12/25/33 (h) | | 11,595 | | 10,707 |
HSI Asset Securitization Corp. Trust Series 2007-HE1 Class 2A3, 0.3546% 1/25/37 (h) | | 436,000 | | 220,820 |
JPMorgan Mortgage Acquisition Trust Series 2007-CH1 Class AV4, 0.2946% 11/25/36 (h) | | 434,779 | | 427,570 |
KeyCorp Student Loan Trust Series 1999-A Class A2, 0.5759% 12/27/29 (h) | | 111,095 | | 108,959 |
|
| Principal Amount | | Value |
MASTR Asset Backed Securities Trust Series 2007-HE1 Class M1, 0.4646% 5/25/37 (h) | | $ 157,049 | | $ 3,246 |
Merrill Lynch Mortgage Investors Trust: | | | | |
Series 2003-OPT1 Class M1, 1.1396% 7/25/34 (h) | | 26,234 | | 22,908 |
Series 2006-FM1 Class A2B, 0.2746% 4/25/37 (h) | | 217,328 | | 211,537 |
Series 2006-OPT1 Class A1A, 0.6846% 6/25/35 (h) | | 396,391 | | 374,510 |
Morgan Stanley ABS Capital I Trust: | | | | |
Series 2004-HE6 Class A2, 0.8446% 8/25/34 (h) | | 20,187 | | 20,104 |
Series 2004-NC8 Class M6, 2.0396% 9/25/34 (h) | | 79,728 | | 52,460 |
Series 2005-NC1 Class M1, 0.6046% 1/25/35 (h) | | 141,000 | | 132,461 |
New Century Home Equity Loan Trust Series 2005-4 Class M2, 0.6746% 9/25/35 (h) | | 503,000 | | 426,109 |
Ocala Funding LLC Series 2006-1A Class A, 1.5668% 3/20/11 (b)(e)(h) | | 414,000 | | 0 |
Park Place Securities, Inc.: | | | | |
Series 2004-WCW1: | | | | |
Class M3, 1.4146% 9/25/34 (h) | | 188,000 | | 156,176 |
Class M4, 1.6146% 9/25/34 (h) | | 241,000 | | 74,376 |
Series 2005-WCH1 Class M4, 0.9946% 1/25/36 (h) | | 520,000 | | 429,249 |
Salomon Brothers Mortgage Securities VII, Inc. Series 2003-HE1 Class A, 0.9646% 4/25/33 (h) | | 1,796 | | 1,701 |
Saxon Asset Securities Trust Series 2004-1 Class M1, 0.9596% 3/25/35 (h) | | 364,727 | | 299,567 |
SLM Private Credit Student Loan Trust Series 2004-A Class C, 1.1929% 6/15/33 (h) | | 364,321 | | 310,161 |
Structured Asset Investment Loan Trust Series 2004-8 Class M5, 1.8896% 9/25/34 (h) | | 18,221 | | 12,937 |
Terwin Mortgage Trust Series 2003-4HE Class A1, 1.0246% 9/25/34 (h) | | 10,148 | | 9,575 |
Whinstone Capital Management Ltd. Series 1A Class B3, 2.0384% 10/25/44 (e)(h) | | 630,180 | | 595,520 |
TOTAL ASSET-BACKED SECURITIES (Cost $38,951,520) |
38,098,719
|
Collateralized Mortgage Obligations - 1.2% |
| Principal Amount | | Value |
Private Sponsor - 0.5% |
Bear Stearns ALT-A Trust floater Series 2005-1 Class A1, 0.7246% 1/25/35 (h) | | $ 508,427 | | $ 496,822 |
Granite Master Issuer PLC floater: | | | | |
Series 2006-1A: | | | | |
Class A1, 0.2368% 12/20/54 (e)(h) | | 4,074,861 | | 4,020,258 |
Class C2, 1.3668% 12/20/54 (e)(h) | | 2,117,000 | | 1,980,877 |
Series 2006-2: | | | | |
Class A4, 0.2468% 12/20/54 (h) | | 1,215,882 | | 1,199,832 |
Class C1, 1.1068% 12/20/54 (h) | | 1,885,000 | | 1,740,609 |
Series 2006-3: | | | | |
Class A3, 0.2468% 12/20/54 (h) | | 585,457 | | 577,729 |
Class A7, 0.3668% 12/20/54 (h) | | 636,417 | | 629,225 |
Class C2, 1.1668% 12/20/54 (h) | | 396,000 | | 365,587 |
Series 2006-4: | | | | |
Class A4, 0.2668% 12/20/54 (h) | | 1,866,479 | | 1,842,029 |
Class B1, 0.3468% 12/20/54 (h) | | 1,059,000 | | 1,009,757 |
Class C1, 0.9268% 12/20/54 (h) | | 647,000 | | 596,663 |
Class M1, 0.5068% 12/20/54 (h) | | 279,000 | | 261,060 |
Series 2007-1: | | | | |
Class 1C1, 0.7668% 12/20/54 (h) | | 654,000 | | 600,176 |
Class 1M1, 0.4668% 12/20/54 (h) | | 425,000 | | 399,585 |
Class 2A1, 0.3068% 12/20/54 (h) | | 1,464,532 | | 1,446,372 |
Class 2C1, 1.0268% 12/20/54 (h) | | 298,000 | | 274,816 |
Class 2M1, 0.6668% 12/20/54 (h) | | 546,000 | | 512,530 |
Series 2007-2: | | | | |
Class 2C1, 1.024% 12/17/54 (h) | | 757,000 | | 698,105 |
Class 3A1, 0.344% 12/17/54 (h) | | 261,266 | | 258,340 |
Granite Mortgages PLC floater Series 2003-3 Class 1C, 2.6921% 1/20/44 (h) | | 151,584 | | 150,225 |
|
| Principal Amount | | Value |
MASTR Adjustable Rate Mortgages Trust Series 2007-3 Class 22A2, 0.3746% 5/25/47 (h) | | $ 198,998 | | $ 152,731 |
Merrill Lynch Alternative Note Asset Trust floater Series 2007-OAR1 Class A1, 0.3346% 2/25/37 (h) | | 304,342 | | 269,483 |
Opteum Mortgage Acceptance Corp. floater Series 2005-3 Class APT, 0.4546% 7/25/35 (h) | | 528,225 | | 516,691 |
RESI Finance LP/RESI Finance DE Corp. floater Series 2003-B Class B5, 2.5195% 7/10/35 (e)(h) | | 113,480 | | 104,721 |
Sequoia Mortgage Trust floater Series 2004-6 Class A3B, 1.2893% 7/20/34 (h) | | 9,889 | | 9,461 |
TOTAL PRIVATE SPONSOR | | 20,113,684 |
U.S. Government Agency - 0.7% |
Fannie Mae: | | | | |
floater: | | | | |
Series 2005-38 Class F, 0.4646% 5/25/35 (h) | | 636,238 | | 634,974 |
Series 2006-50 Class BF, 0.5646% 6/25/36 (h) | | 818,569 | | 821,067 |
Series 2006-82 Class F, 0.7346% 9/25/36 (h) | | 1,142,920 | | 1,141,232 |
Series 2007-36 Class F, 0.3946% 4/25/37 (h) | | 988,783 | | 983,939 |
Series 2011-37 Class FA, 0.6146% 5/25/41 (h) | | 2,980,401 | | 2,988,995 |
Series 2011-40 Class DF, 0.6146% 5/25/41 (h) | | 2,293,249 | | 2,302,923 |
Series 2013-62 Class FA, 0.4646% 6/25/43 (h) | | 4,089,867 | | 4,044,940 |
floater sequential payer: | | | | |
Series 2010-74 Class WF, 0.7646% 7/25/34 (h) | | 887,513 | | 895,940 |
Series 2012-120 Class FE 0.4646% 2/25/39 (h) | | 1,803,765 | | 1,793,766 |
planned amortization class: | | | | |
Series 1999-54 Class PH, 6.5% 11/18/29 | | 714,529 | | 776,426 |
Series 1999-57 Class PH, 6.5% 12/25/29 | | 626,819 | | 700,565 |
Series 2002-9 Class PC, 6% 3/25/17 | | 55,366 | | 58,299 |
sequential payer Series 2004-86 Class KC, 4.5% 5/25/19 | | 49,065 | | 49,883 |
Freddie Mac: | | | | |
floater: | | | | |
Series 2011-3845 Class FA, 0.5866% 4/15/41 (h) | | 1,494,820 | | 1,496,859 |
Series 3830 Class FD, 0.5266% 3/15/41 (h) | | 4,246,720 | | 4,253,744 |
floater sequential payer Series 2011-3969 Class AF, 0.6166% 10/15/33 (h) | | 1,847,990 | | 1,854,000 |
Collateralized Mortgage Obligations - continued |
| Principal Amount | | Value |
U.S. Government Agency - continued |
Freddie Mac: - continued | | | | |
planned amortization class Series 2500 Class TE, 5.5% 9/15/17 | | $ 1,377,669 | | $ 1,455,593 |
Ginnie Mae guaranteed REMIC pass-thru certificates Series 2007-35 Class SC, 0.2471% 6/16/37 (h)(j) | | 73,060 | | 132,793 |
TOTAL U.S. GOVERNMENT AGENCY | | 26,385,938 |
TOTAL COLLATERALIZED MORTGAGE OBLIGATIONS (Cost $44,212,911) |
46,499,622
|
Commercial Mortgage Securities - 7.9% |
|
Banc of America Commercial Mortgage Trust: | | | | |
sequential payer: | | | | |
Series 2006-2 Class AAB, 5.9053% 5/10/45 (h) | | 867,261 | | 891,441 |
Series 2006-3 Class A4, 5.889% 7/10/44 | | 3,692,296 | | 4,016,612 |
Series 2006-5 Class A2, 5.317% 9/10/47 | | 5,492,157 | | 5,522,216 |
Series 2006-4 Class A1A, 5.617% 7/10/46 (h) | | 10,061,869 | | 11,064,132 |
Series 2007-3 Class A3, 5.7965% 6/10/49 (h) | | 6,100,000 | | 6,117,885 |
Banc of America Commercial Mortgage, Inc. sequential payer Series 2001-1 Class A4, 5.451% 1/15/49 | | 8,305,000 | | 8,988,477 |
Bayview Commercial Asset Trust floater: | | | | |
Series 2005-4A: | | | | |
Class A2, 0.5546% 1/25/36 (e)(h) | | 557,023 | | 470,463 |
Class M1, 0.6146% 1/25/36 (e)(h) | | 116,548 | | 64,896 |
Class M2, 0.6346% 1/25/36 (e)(h) | | 35,160 | | 18,452 |
Class M3, 0.6646% 1/25/36 (e)(h) | | 51,112 | | 26,284 |
Series 2007-1 Class A2, 0.4346% 3/25/37 (e)(h) | | 161,994 | | 110,065 |
Series 2007-2A: | | | | |
Class A1, 0.4346% 7/25/37 (e)(h) | | 161,541 | | 131,236 |
Class A2, 0.4846% 7/25/37 (e)(h) | | 151,202 | | 83,429 |
Class M2, 0.5746% 7/25/37 (e)(h) | | 84,001 | | 14,333 |
Class M3, 0.6546% 7/25/37 (e)(h) | | 84,001 | | 8,450 |
|
| Principal Amount | | Value |
Class M4, 0.8146% 7/25/37 (e)(h) | | $ 177,695 | | $ 6,419 |
Class M5, 0.9146% 7/25/37 (e)(h) | | 2,025 | | 12 |
Series 2007-3: | | | | |
Class A2, 0.4546% 7/25/37 (e)(h) | | 219,618 | | 145,425 |
Class M1, 0.4746% 7/25/37 (e)(h) | | 89,969 | | 42,553 |
Class M2, 0.5046% 7/25/37 (e)(h) | | 94,583 | | 27,530 |
Class M3, 0.5346% 7/25/37 (e)(h) | | 206,699 | | 47,646 |
Class M4, 0.6646% 7/25/37 (e)(h) | | 326,658 | | 66,208 |
Class M5, 0.7646% 7/25/37 (e)(h) | | 122,266 | | 17,592 |
Class M6, 0.9646% 7/25/37 (e)(h) | | 32,716 | | 2,792 |
Bear Stearns Commercial Mortgage Securities Trust floater Series 2007-BBA8: | | | | |
Class D, 0.4166% 3/15/22 (e)(h) | | 147,000 | | 139,690 |
Class E, 0.4666% 3/15/22 (e)(h) | | 763,000 | | 710,200 |
Class F, 0.5166% 3/15/22 (e)(h) | | 468,000 | | 426,107 |
Class G, 0.5666% 3/15/22 (e)(h) | | 120,000 | | 106,883 |
Class H, 0.7166% 3/15/22 (e)(h) | | 147,000 | | 127,610 |
Class J, 0.8666% 3/15/22 (e)(h) | | 147,000 | | 124,245 |
C-BASS Trust floater Series 2006-SC1 Class A, 0.4346% 5/25/36 (e)(h) | | 184,188 | | 176,719 |
Citigroup Commercial Mortgage Trust Series 2007-FL3A Class A2, 0.3066% 4/15/22 (e)(h) | | 69,176 | | 69,040 |
Citigroup/Deutsche Bank Commercial Mortgage Trust sequential payer Series 2007-CD4: | | | | |
Class A3, 5.293% 12/11/49 | | 6,065,000 | | 6,176,584 |
Class A4, 5.322% 12/11/49 | | 16,150,000 | | 17,684,751 |
COMM Mortgage Trust pass-thru certificates: | | | | |
floater Series 2005-F10A Class J, 1.0166% 4/15/17 (e)(h) | | 44,103 | | 44,049 |
sequential payer Series 2006-C7 Class A1A, 5.9334% 6/10/46 (h) | | 8,726,504 | | 9,506,391 |
Series 2004-LB4A Class A5, 4.84% 10/15/37 | | 7,122,000 | | 7,218,083 |
Credit Suisse Commercial Mortgage Trust: | | | | |
sequential payer: | | | | |
Series 2007-C2 Class A2, 5.448% 1/15/49 (h) | | 139,391 | | 139,112 |
Commercial Mortgage Securities - continued |
| Principal Amount | | Value |
Credit Suisse Commercial Mortgage Trust: - continued | | | | |
sequential payer: | | | | |
Series 2007-C3 Class A4, 5.8708% 6/15/39 (h) | | $ 2,440,199 | | $ 2,678,037 |
Series 2007-C5 Class A4, 5.695% 9/15/40 (h) | | 2,750,000 | | 3,036,600 |
Credit Suisse First Boston Mortgage Securities Corp. Series 2001-CKN5 Class AX, 0.6567% 9/15/34 (e)(h)(i) | | 855,865 | | 466 |
Credit Suisse Mortgage Capital Certificates floater Series 2007-TFL1: | | | | |
Class B, 0.3166% 2/15/22 (e)(h) | | 3,470,000 | | 3,427,218 |
Class C: | | | | |
0.3366% 2/15/22 (e)(h) | | 657,000 | | 637,726 |
0.4366% 2/15/22 (e)(h) | | 234,000 | | 223,826 |
Class F, 0.4866% 2/15/22 (e)(h) | | 469,000 | | 447,205 |
GE Capital Commercial Mortgage Corp. sequential payer Series 2007-C1 Class A4, 5.543% 12/10/49 | | 5,341,000 | | 5,784,677 |
Greenwich Capital Commercial Funding Corp.: | | | | |
floater Series 2006-FL4 Class B, 0.3575% 11/5/21 (e)(h) | | 3,490,000 | | 3,455,878 |
sequential payer Series 2007-GG9 Class A4, 5.444% 3/10/39 | | 2,090,000 | | 2,295,591 |
Series 2006-GG7 Class A4, 6.0184% 7/10/38 (h) | | 2,091,405 | | 2,284,530 |
GS Mortgage Securities Corp. II Series 2006-GG6 Class A2, 5.506% 4/10/38 | | 220,520 | | 220,477 |
GS Mortgage Securities Trust sequential payer Series 2006-GG8 Class A4, 5.56% 11/10/39 (h) | | 920,000 | | 1,008,732 |
Hilton U.S.A. Trust Series 2013-HLT: | | | | |
Class CFX, 3.7141% 11/5/30 (e) | | 890,000 | | 891,865 |
Class DFX, 4.4065% 11/5/30 (e) | | 3,995,000 | | 4,000,174 |
JPMorgan Chase Commercial Mortgage Securities Trust: | | | | |
floater Series 2006-FL2A: | | | | |
Class E, 0.4466% 11/15/18 (e)(h) | | 58,901 | | 56,112 |
Class F, 0.4966% 11/15/18 (e)(h) | | 88,352 | | 83,947 |
Class G, 0.5266% 11/15/18 (e)(h) | | 76,973 | | 72,944 |
Class H, 0.6666% 11/15/18 (e)(h) | | 58,914 | | 55,241 |
sequential payer: | | | | |
Series 2006-CB14 Class A3B, 5.6707% 12/12/44 (h) | | 147,897 | | 148,492 |
|
| Principal Amount | | Value |
Series 2006-CB16 Class A1A, 5.546% 5/12/45 | | $ 5,819,253 | | $ 6,378,454 |
Series 2006-CB17 Class A4, 5.429% 12/12/43 | | 2,810,000 | | 3,041,080 |
Series 2006-LDP8 Class A1A, 5.397% 5/15/45 | | 9,756,173 | | 10,648,990 |
Series 2007-CB18 Class A4, 5.44% 6/12/47 | | 870,000 | | 956,043 |
Series 2007-CB19 Class A4, 5.8949% 2/12/49 (h) | | 4,967,639 | | 5,520,924 |
Series 2007-LD11 Class A4, 6.0023% 6/15/49 (h) | | 6,664,597 | | 7,412,265 |
Series 2007-LDPX Class A3, 5.42% 1/15/49 | | 5,416,000 | | 5,940,648 |
Series 2006-LDP7 Class A4, 6.0562% 4/15/45 (h) | | 8,035,000 | | 8,771,247 |
Series 2007-CB19: | | | | |
Class B, 5.8949% 2/12/49 (h) | | 755,000 | | 232,435 |
Class C, 5.8949% 2/12/49 (h) | | 1,971,000 | | 401,903 |
Class D, 5.8949% 2/12/49 (h) | | 2,075,000 | | 335,646 |
Series 2007-CB20 Class A1A, 5.746% 2/12/51 | | 15,321,324 | | 17,158,688 |
Series 2007-LDP10: | | | | |
Class CS, 5.466% 1/15/49 (h) | | 745,000 | | 114,283 |
Class ES, 5.8951% 1/15/49 (e)(h) | | 4,663,000 | | 219,008 |
LB Commercial Conduit Mortgage Trust sequential payer Series 2007-C3 Class A4, 6.0517% 7/15/44 (h) | | 3,733,000 | | 4,180,202 |
LB-UBS Commercial Mortgage Trust: | | | | |
sequential payer: | | | | |
Series 2007-C1 Class A4, 5.424% 2/15/40 | | 12,560,000 | | 13,840,869 |
Series 2007-C2 Class A3, 5.43% 2/15/40 | | 965,705 | | 1,063,745 |
Series 2007-C7 Class A3, 5.866% 9/15/45 | | 4,514,047 | | 5,005,424 |
Lehman Brothers Floating Rate Commercial Mortgage Trust floater Series 2006-LLFA: | | | | |
Class G, 0.5266% 9/15/21 (e)(h) | | 53,583 | | 53,549 |
Class H, 0.5666% 9/15/21 (e)(h) | | 204,773 | | 194,042 |
Merrill Lynch Mortgage Trust Series 2007-C1 Class A4, 6.0474% 6/12/50 (h) | | 10,916,000 | | 12,092,810 |
Merrill Lynch-CFC Commercial Mortgage Trust: | | | | |
sequential payer: | | | | |
Series 2006-4 Class A3, 5.172% 12/12/49 (h) | | 490,000 | | 531,218 |
Series 2007-5 Class A4, 5.378% 8/12/48 | | 2,520,000 | | 2,744,091 |
Series 2007-6 Class A4, 5.485% 3/12/51 (h) | | 3,875,000 | | 4,261,996 |
Commercial Mortgage Securities - continued |
| Principal Amount | | Value |
Merrill Lynch-CFC Commercial Mortgage Trust: - continued | | | | |
sequential payer: | | | | |
Series 2007-9 Class A4, 5.7% 9/12/49 | | $ 5,500,000 | | $ 6,110,286 |
Series 2007-7 Class B, 5.9278% 6/12/50 (h) | | 770,000 | | 31,177 |
Morgan Stanley Capital I Trust: | | | | |
floater: | | | | |
Series 2006-XLF Class C, 1.367% 7/15/19 (e)(h) | | 113,478 | | 85,392 |
Series 2007-XLFA: | | | | |
Class D, 0.3566% 10/15/20 (e)(h) | | 235,000 | | 226,815 |
Class E, 0.4166% 10/15/20 (e)(h) | | 294,000 | | 282,290 |
Class F, 0.4666% 10/15/20 (e)(h) | | 176,000 | | 167,230 |
Class G, 0.5066% 10/15/20 (e)(h) | | 218,000 | | 204,957 |
Class H, 0.5966% 10/15/20 (e)(h) | | 137,000 | | 124,008 |
Class J, 0.7466% 10/15/20 (e)(h) | | 79,407 | | 32,967 |
sequential payer Series 2007-HQ11 Class A31, 5.439% 2/12/44 (h) | | 2,523,907 | | 2,550,209 |
Series 2007-HQ12 Class A2, 5.7784% 4/12/49 (h) | | 2,818,799 | | 2,858,535 |
Series 2007-IQ14 Class B, 5.9114% 4/15/49 (h) | | 2,175,000 | | 439,850 |
Providence Place Group Ltd. Partnership Series 2000-C1 Class A2, 7.75% 7/20/28 (e) | | 3,767,430 | | 4,817,790 |
Wachovia Bank Commercial Mortgage Trust: | | | | |
floater: | | | | |
Series 2006-WL7A: | | | | |
Class F, 0.504% 9/15/21 (e)(h) | | 506,395 | | 504,812 |
Class G, 0.524% 9/15/21 (e)(h) | | 626,000 | | 594,700 |
Class J, 0.764% 9/15/21 (e)(h) | | 139,000 | | 118,150 |
Series 2007-WHL8 Class F, 0.6466% 6/15/20 (e)(h) | | 1,046,000 | | 951,974 |
sequential payer: | | | | |
Series 2006-C28 Class A4, 5.572% 10/15/48 | | 3,990,000 | | 4,366,453 |
Series 2006-C29 Class A1A, 5.297% 11/15/48 | | 3,365,799 | | 3,689,625 |
Series 2007-C30 Class A5, 5.342% 12/15/43 | | 13,901,000 | | 15,295,857 |
Series 2007-C31 Class A4, 5.509% 4/15/47 | | 6,652,000 | | 7,259,461 |
Series 2007-C32 Class A3, 5.9201% 6/15/49 (h) | | 10,240,000 | | 11,340,066 |
|
| Principal Amount | | Value |
Series 2007-C33 Class A4, 6.1226% 2/15/51 (h) | | $ 5,735,000 | | $ 6,254,155 |
Series 2006-C23 Class A5, 5.416% 1/15/45 (h) | | 3,010,000 | | 3,242,471 |
Series 2006-C26 Class A1A, 6.009% 6/15/45 (h) | | 4,667,998 | | 5,110,240 |
Series 2006-C27 Class A1A, 5.749% 7/15/45 (h) | | 8,240,487 | | 9,035,241 |
Series 2007-C31 Class C, 5.8594% 4/15/47 (h) | | 2,455,000 | | 2,023,271 |
TOTAL COMMERCIAL MORTGAGE SECURITIES (Cost $311,817,729) |
310,161,292
|
Municipal Securities - 2.4% |
|
Beaver County Indl. Dev. Auth. Poll. Cont. Rev. Bonds (FirstEnergy Nuclear Generation Corp. Proj.) Series 2005 A, 3.375%, tender 7/1/15 (h) | | 1,200,000 | | 1,220,328 |
California Gen. Oblig.: | | | | |
Series 2009, 7.35% 11/1/39 | | 805,000 | | 1,016,578 |
6.65% 3/1/22 | | 4,360,000 | | 5,108,132 |
7.3% 10/1/39 | | 6,270,000 | | 7,882,017 |
7.5% 4/1/34 | | 5,055,000 | | 6,449,523 |
7.6% 11/1/40 | | 10,310,000 | | 13,582,703 |
7.625% 3/1/40 | | 1,675,000 | | 2,190,682 |
Chicago Gen. Oblig. (Taxable Proj.): | | | | |
Series 2008 B, 5.63% 1/1/22 | | 880,000 | | 900,319 |
Series 2010 C1, 7.781% 1/1/35 | | 4,720,000 | | 5,206,302 |
Series 2012 B, 5.432% 1/1/42 | | 1,205,000 | | 1,002,150 |
Illinois Gen. Oblig.: | | | | |
Series 2003, 5.1% 6/1/33 | | 20,780,000 | | 19,303,373 |
Series 2010, 4.421% 1/1/15 | | 2,850,000 | | 2,935,586 |
Series 2010-1, 6.63% 2/1/35 | | 3,720,000 | | 3,874,975 |
Series 2010-3: | | | | |
6.725% 4/1/35 | | 5,545,000 | | 5,828,738 |
7.35% 7/1/35 | | 2,580,000 | | 2,840,399 |
Series 2011: | | | | |
5.665% 3/1/18 | | 2,610,000 | | 2,842,238 |
5.877% 3/1/19 | | 7,810,000 | | 8,528,676 |
Series 2013: | | | | |
2.69% 12/1/17 | | 1,225,000 | | 1,219,573 |
3.14% 12/1/18 | | 1,270,000 | | 1,260,856 |
TOTAL MUNICIPAL SECURITIES (Cost $95,662,983) |
93,193,148
|
Foreign Government and Government Agency Obligations - 0.7% |
|
Banco Nacional de Desenvolvimento Economico e Social: | | | | |
3.375% 9/26/16 (e) | | 4,235,000 | | 4,277,350 |
Foreign Government and Government Agency Obligations - continued |
| Principal Amount | | Value |
Banco Nacional de Desenvolvimento Economico e Social: - continued | | | | |
5.75% 9/26/23 (e) | | $ 3,877,000 | | $ 3,833,384 |
Brazilian Federative Republic: | | | | |
4.25% 1/7/25 | | 4,015,000 | | 3,824,288 |
5.625% 1/7/41 | | 4,104,000 | | 3,950,100 |
United Mexican States: | | | | |
4% 10/2/23 | | 9,396,000 | | 9,302,040 |
4.75% 3/8/44 | | 4,170,000 | | 3,778,020 |
TOTAL FOREIGN GOVERNMENT AND GOVERNMENT AGENCY OBLIGATIONS (Cost $29,952,429) |
28,965,182
|
Bank Notes - 0.0% |
|
Fifth Third Bank 4.75% 2/1/15
(Cost $494,715) | | 487,000 | |
507,256
|
Money Market Funds - 5.4% |
| Shares | | |
Fidelity Cash Central Fund, 0.11% (a)
(Cost $211,534,304) | 211,534,304 | |
211,534,304
|
Cash Equivalents - 3.1% |
| Maturity
Amount | | Value |
Investments in repurchase agreements in a joint trading account at 0.03%, dated 12/31/13 due 1/2/14 (Collateralized by U.S. Government Obligations) # (k)
(Cost $121,980,000) | $ 121,980,203 | | $ 121,980,000 |
TOTAL INVESTMENT PORTFOLIO - 103.8% (Cost $4,090,386,656) | | 4,095,567,593 |
NET OTHER ASSETS (LIABILITIES) - (3.8)% | | (149,818,667) |
NET ASSETS - 100% | $ 3,945,748,926 |
TBA Sale Commitments |
| Principal
Amount | | |
Fannie Mae |
5.5% 1/1/44 (Proceeds $3,734,687) | $ (3,400,000) | |
(3,742,922)
|
Swaps |
Credit Default Swaps |
Underlying Reference | Rating (1) | Expiration Date | Clearinghouse/
Counterparty | Fixed
Payment
Received/
(Paid) | Notional
Amount (2) | Value (1) | Upfront Premium Received/(Paid) | Unrealized
Appreciation/
(Depreciation) |
Sell Protection |
Ameriquest Mortgage Securities Inc Series 2004-R11 Class M9 | C | Dec. 2034 | Bank of America | 2.5% | $ 137,714 | $ (128,537) | $ 0 | $ (128,537) |
Ameriquest Mortgage Securities Inc Series 2004-R11 Class M9 | C | Dec. 2034 | Credit Suisse | 2.5% | 239,234 | (223,292) | 0 | (223,292) |
Morgan Stanley ABS Capital I Inc Series 2004-HE7 Class B3 | C | Sep. 2034 | Morgan Stanley, Inc. | 5.10% | 78,601 | (34,191) | 0 | (34,191) |
Morgan Stanley ABS Capital I Inc Series 2004-NC6 Class M3 | Ca | Aug. 2034 | UBS | 1.545% | 67,245 | (22,541) | 0 | (22,541) |
TOTAL CREDIT DEFAULT SWAPS | $ (408,561) | $ 0 | $ (408,561) |
|
(1) Ratings are presented for credit default swaps in which the Fund has sold protection on the underlying referenced debt. Ratings for an underlying index represent a weighted average of the ratings of all securities included in the index. The credit rating or value can be measures of the current payment/performance risk. Ratings are from Moody's Investors Service, Inc. Where Moody's® ratings are not available, S&P® ratings are disclosed and are indicated as such. All ratings are as of the report date and do not reflect subsequent changes. |
|
(2) The notional amount of each credit default swap where the Fund has sold protection approximates the maximum potential amount of future payments that the Fund could be required to make if a credit event were to occur. |
Legend |
(a) Affiliated fund that is generally available only to investment companies and other accounts managed by Fidelity Investments. The rate quoted is the annualized seven-day yield of the fund at period end. A complete unaudited listing of the fund's holdings as of its most recent quarter end is available upon request. In addition, each Fidelity Central Fund's financial statements, which are not covered by the Fund's Report of Independent Registered Public Accounting Firm, are available on the SEC's website or upon request. |
(b) Non-income producing - Security is in default. |
(c) Security initially issued at one coupon which converts to a higher coupon at a specified date. The rate shown is the rate at period end. |
(d) Security or a portion of the security is on loan at period end. |
(e) Security exempt from registration under Rule 144A of the Securities Act of 1933. These securities may be resold in transactions exempt from registration, normally to qualified institutional buyers. At the end of the period, the value of these securities amounted to $181,341,787 or 4.6% of net assets. |
(f) Security or a portion of the security purchased on a delayed delivery or when-issued basis. |
(g) Security or a portion of the security has been segregated as collateral for open bi-lateral over-the-counter (OTC) swaps. At period end, the value of securities pledged amounted to $1,687,017. |
(h) Coupon rates for floating and adjustable rate securities reflect the rates in effect at period end. |
(i) Security represents right to receive monthly interest payments on an underlying pool of mortgages or assets. Principal shown is the outstanding par amount of the pool as of the end of the period. |
(j) Coupon is inversely indexed to a floating interest rate multiplied by a specified factor. The price may be considerably more volatile than the price of a comparable fixed rate security. |
(k) Includes investment made with cash collateral received from securities on loan. |
(l) Security or a portion of the security has been segregated as collateral for mortgage-backed or asset-backed securities purchased on a delayed delivery or when-issued basis. At period end, the value of securities pledged amounted to $75,020. |
# Additional information on each counterparty to the repurchase agreement is as follows: |
Repurchase Agreement / Counterparty | Value |
$121,980,000 due 1/02/14 at 0.03% |
Commerz Markets LLC | $ 120,000,118 |
Mizuho Securities USA, Inc. | 1,979,882 |
| $ 121,980,000 |
Affiliated Central Funds |
Information regarding fiscal year to date income earned by the Fund from investments in Fidelity Central Funds is as follows: |
Fund | Income earned |
Fidelity Cash Central Fund | $ 413,901 |
Other Information |
The following is a summary of the inputs used, as of December 31, 2013, involving the Fund's assets and liabilities carried at fair value. The inputs or methodology used for valuing securities may not be an indication of the risk associated with investing in those securities. For more information on valuation inputs, and their aggregation into the levels used in the table below, please refer to the Investment Valuation section in the accompanying Notes to Financial Statements. |
Valuation Inputs at Reporting Date: |
Description | Total | Level 1 | Level 2 | Level 3 |
Investments in Securities: | | | | |
Corporate Bonds | $ 1,204,660,272 | $ - | $ 1,204,660,272 | $ - |
U.S. Government and Government Agency Obligations | 1,209,756,249 | - | 1,209,756,249 | - |
U.S. Government Agency - Mortgage Securities | 830,211,549 | - | 830,211,549 | - |
Asset-Backed Securities | 38,098,719 | - | 35,895,628 | 2,203,091 |
Collateralized Mortgage Obligations | 46,499,622 | - | 46,394,901 | 104,721 |
Commercial Mortgage Securities | 310,161,292 | - | 310,075,900 | 85,392 |
Municipal Securities | 93,193,148 | - | 93,193,148 | - |
Foreign Government and Government Agency Obligations | 28,965,182 | - | 28,965,182 | - |
Bank Notes | 507,256 | - | 507,256 | - |
Money Market Funds | 211,534,304 | 211,534,304 | - | - |
Cash Equivalents | 121,980,000 | - | 121,980,000 | - |
Total Investments in Securities: | $ 4,095,567,593 | $ 211,534,304 | $ 3,881,640,085 | $ 2,393,204 |
Derivative Instruments: | | | | |
Liabilities | | | | |
Swaps | $ (408,561) | $ - | $ (408,561) | $ - |
Other Financial Instruments: | | | | |
TBA Sale Commitments | $ (3,742,922) | $ - | $ (3,742,922) | $ - |
Primary Risk Exposure /
Derivative Type | Value |
| Asset | Liability |
Credit Risk | | |
Swaps (a) | $ - | $ (408,561) |
Total Value of Derivatives | $ - | $ (408,561) |
(a) For bi-lateral OTC swaps, reflects gross value which is presented in the Statement of Assets and Liabilities in the bi-lateral OTC swaps, at value line-items. |
See accompanying notes which are an integral part of the financial statements.
Not Part of Financial Report
Financial Statements
Statement of Assets and Liabilities
| December 31, 2013 |
| | |
Assets | | |
Investment in securities, at value (including securities loaned of $119,503,080 and repurchase agreements of $121,980,000) - See accompanying schedule: Unaffiliated issuers (cost $3,878,852,352) | $ 3,884,033,289 | |
Fidelity Central Funds (cost $211,534,304) | 211,534,304 | |
Total Investments (cost $4,090,386,656) | | $ 4,095,567,593 |
Cash | | 483 |
Receivable for investments sold, regular delivery | | 68,928 |
Receivable for TBA sale commitments | | 3,734,687 |
Receivable for swaps | | 1,198 |
Interest receivable | | 21,567,434 |
Distributions receivable from Fidelity Central Funds | | 19,058 |
Other receivables | | 371,897 |
Total assets | | 4,121,331,278 |
| | |
Liabilities | | |
TBA sale commitments, at value | $ 3,742,922 | |
Payable for investments purchased on a delayed delivery basis | 49,054,418 | |
Payable for swaps | 9,303 | |
Bi-lateral OTC swaps, at value | 408,561 | |
Other payables and accrued expenses | 387,148 | |
Collateral on securities loaned, at value | 121,980,000 | |
Total liabilities | | 175,582,352 |
| | |
Net Assets | | $ 3,945,748,926 |
Net Assets consist of: | | |
Paid in capital | | $ 3,966,171,699 |
Undistributed net investment income | | 2,806,305 |
Accumulated undistributed net realized gain (loss) on investments | | (27,993,228) |
Net unrealized appreciation (depreciation) on investments | | 4,764,150 |
Net Assets, for 38,202,418 shares outstanding | | $ 3,945,748,926 |
Net Asset Value, offering price and redemption price per share ($3,945,748,926 ÷ 38,202,418 shares) | | $ 103.29 |
Statement of Operations
| Year ended December 31, 2013 |
| | |
Investment Income | | |
Interest | | $ 111,295,034 |
Income from Fidelity Central Funds | | 413,901 |
Total income | | 111,708,935 |
| | |
Expenses | | |
Custodian fees and expenses | $ 86,039 | |
Independent trustees' compensation | 15,844 | |
Total expenses before reductions | 101,883 | |
Expense reductions | (16,430) | 85,453 |
Net investment income (loss) | | 111,623,482 |
Realized and Unrealized Gain (Loss) Net realized gain (loss) on: | | |
Investment securities: | | |
Unaffiliated issuers | (29,537,209) | |
Swaps | (178,495) | |
Total net realized gain (loss) | | (29,715,704) |
Change in net unrealized appreciation (depreciation) on: Investment securities | (144,034,881) | |
Swaps | 207,751 | |
Delayed delivery commitments | 31,105 | |
Total change in net unrealized appreciation (depreciation) | | (143,796,025) |
Net gain (loss) | | (173,511,729) |
Net increase (decrease) in net assets resulting from operations | | $ (61,888,247) |
See accompanying notes which are an integral part of the financial statements.
Not Part of Financial Report
Financial Statements - continued
Statement of Changes in Net Assets
| Year ended
December 31,
2013 | Year ended
December 31,
2012 |
Increase (Decrease) in Net Assets | | |
Operations | | |
Net investment income (loss) | $ 111,623,482 | $ 117,614,823 |
Net realized gain (loss) | (29,715,704) | 120,265,599 |
Change in net unrealized appreciation (depreciation) | (143,796,025) | 8,093,329 |
Net increase (decrease) in net assets resulting from operations | (61,888,247) | 245,973,751 |
Distributions to shareholders from net investment income | (111,480,985) | (114,968,209) |
Distributions to shareholders from net realized gain | (47,197,834) | (85,937,583) |
Total distributions | (158,678,819) | (200,905,792) |
Share transactions
Proceeds from sales of shares | 138,326,373 | 291,928,653 |
Reinvestment of distributions | 158,678,818 | 201,241,629 |
Cost of shares redeemed | (383,113,369) | (76,195,187) |
Net increase (decrease) in net assets resulting from share transactions | (86,108,178) | 416,975,095 |
Total increase (decrease) in net assets | (306,675,244) | 462,043,054 |
| | |
Net Assets | | |
Beginning of period | 4,252,424,170 | 3,790,381,116 |
End of period (including undistributed net investment income of $2,806,305 and undistributed net investment income of $4,906,141, respectively) | $ 3,945,748,926 | $ 4,252,424,170 |
Other Information Shares | | |
Sold | 1,312,355 | 2,692,517 |
Issued in reinvestment of distributions | 1,501,757 | 1,838,710 |
Redeemed | (3,663,162) | (694,031) |
Net increase (decrease) | (849,050) | 3,837,196 |
Financial Highlights
Years ended December 31, | 2013 | 2012 | 2011 | 2010 | 2009 |
Selected Per-Share Data | | | | | |
Net asset value, beginning of period | $ 108.89 | $ 107.64 | $ 105.18 | $ 104.52 | $ 94.78 |
Income from Investment Operations | | | | | |
Net investment income (loss) B | 2.829 | 3.111 | 3.817 | 3.943 | 4.762 |
Net realized and unrealized gain (loss) | (4.398) | 3.442 | 4.385 | 4.424 | 9.818 |
Total from investment operations | (1.569) | 6.553 | 8.202 | 8.367 | 14.580 |
Distributions from net investment income | (2.826) | (3.056) | (3.851) | (3.947) | (4.580) |
Distributions from net realized gain | (1.205) | (2.247) | (1.891) | (3.760) | (.260) |
Total distributions | (4.031) | (5.303) | (5.742) | (7.707) | (4.840) |
Net asset value, end of period | $ 103.29 | $ 108.89 | $ 107.64 | $ 105.18 | $ 104.52 |
Total Return A | (1.46)% | 6.16% | 7.96% | 8.12% | 15.71% |
Ratios to Average Net Assets C, F | | | | | |
Expenses before reductions E | -% | -% | -% | -% | -% |
Expenses net of fee waivers, if any E | -% | -% | -% | -% | -% |
Expenses net of all reductions E | -% | -% | -% | -% | -% |
Net investment income (loss) | 2.68% | 2.84% | 3.57% | 3.65% | 4.75% |
Supplemental Data | | | | | |
Net assets, end of period (000 omitted) | $ 3,945,749 | $ 4,252,424 | $ 3,790,381 | $ 3,758,091 | $ 3,957,226 |
Portfolio turnover rate D | 333% | 291% | 302% | 230% | 141% |
A Total returns would have been lower if certain expenses had not been reduced during the applicable periods shown.
B Calculated based on average shares outstanding during the period.
C Fees and expenses of any underlying Fidelity Central Funds are not included in the Fund's expense ratio. The Fund indirectly bears its proportionate share of the expenses of any underlying Fidelity Central Funds.
D Amount does not include the portfolio activity of any underlying Fidelity Central Funds.
E Amount represents less than .01%.
F Expense ratios reflect operating expenses of the Fund. Expenses before reductions do not reflect amounts reimbursed by the investment adviser or reductions from expense offset arrangements and do not represent the amount paid by the Fund during periods when reimbursements or reductions occur. Expenses net of fee waivers reflect expenses after reimbursement by the investment adviser but prior to reductions from expense offset arrangements. Expenses net of all reductions represent the net expenses paid by the Fund.
See accompanying notes which are an integral part of the financial statements.
Not Part of Financial Report
Notes to Financial Statements
For the period ended December 31, 2013
1. Organization.
Fidelity VIP Investment Grade Central Fund (the Fund) is a fund of Fidelity Garrison Street Trust (the Trust) and is authorized to issue an unlimited number of shares. The Trust is registered under the Investment Company Act of 1940, as amended (the 1940 Act), as an open-end management investment company organized as a Massachusetts business trust. Shares of the Fund are only offered to other investment companies and accounts managed by Fidelity Management & Research Company (FMR), or its affiliates (the Investing Funds).
2. Investments in Fidelity Central Funds.
The Fund invests in Fidelity Central Funds, which are open-end investment companies generally available only to other investment companies and accounts managed by the investment adviser and its affiliates. The Fund's Schedule of Investments lists each of the Fidelity Central Funds held as of period end, if any, as an investment of the Fund, but does not include the underlying holdings of each Fidelity Central Fund. As an Investing Fund, the Fund indirectly bears its proportionate share of the expenses of the underlying Fidelity Central Funds.
The Money Market Central Funds seek preservation of capital and current income and are managed by Fidelity Investments Money Management, Inc. (FIMM), an affiliate of the investment adviser. Annualized expenses of the Money Market Central Funds as of their most recent shareholder report date are less than .01%.
A complete unaudited list of holdings for each Fidelity Central Fund is available upon request or at the Securities and Exchange Commission (the SEC) website at www.sec.gov. In addition, the financial statements of the Fidelity Central Funds, which are not covered by the Fund's Report of Independent Registered Public Accounting Firm, are available on the SEC website or upon request.
3. Significant Accounting Policies.
The financial statements have been prepared in conformity with accounting principles generally accepted in the United States of America (GAAP), which require management to make certain estimates and assumptions at the date of the financial statements. Actual results could differ from those estimates. Subsequent events, if any, through the date that the financial statements were issued have been evaluated in the preparation of the financial statements. The following summarizes the significant accounting policies of the Fund:
Investment Valuation. Investments are valued as of 4:00 p.m. Eastern time on the last calendar day of the period. In accordance with valuation policies and procedures approved by the Board of Trustees (the Board), the Fund attempts to obtain prices from one or more third party pricing vendors or brokers to value its investments. When current market prices, quotations or currency exchange rates are not readily available or reliable, investments will be fair valued in good faith by the FMR Fair Value Committee (the Committee), in accordance with procedures adopted by the Board. Factors used in determining fair value vary by investment type and may include market or investment specific events, changes in interest rates and credit quality. The frequency with which these procedures are used cannot be predicted and they may be utilized to a significant extent. The Committee oversees the Fund's valuation policies and procedures and is responsible for approving and reporting to the Board all fair value determinations.
The Fund categorizes the inputs to valuation techniques used to value its investments into a disclosure hierarchy consisting of three levels as shown below:
Level 1 - quoted prices in active markets for identical investments
Level 2 - other significant observable inputs (including quoted prices for similar investments, interest rates, prepayment speeds, etc.)
Level 3 - unobservable inputs (including the Fund's own assumptions based on the best information available)
Valuation techniques used to value the Fund's investments by major category are as follows:
Debt securities, including restricted securities, are valued based on evaluated prices received from third party pricing vendors or from brokers who make markets in such securities. Corporate bonds, bank notes, foreign government and government agency obligations, municipal securities and U.S. government and government agency obligations, are valued by pricing vendors who utilize matrix pricing which considers yield or price of bonds of comparable quality, coupon, maturity and type or by broker-supplied prices. Asset backed securities, collateralized mortgage obligations, commercial mortgage securities and U.S. government agency mortgage securities, are valued by pricing vendors who utilize matrix pricing which considers prepayment speed assumptions, attributes of the collateral, yield or price of bonds of comparable quality, coupon, maturity and type or by broker-supplied prices. Brokers which make markets in asset backed securities, collateralized mortgage obligations and commercial mortgage securities may also consider such factors as the structure of the issue, cash flow assumptions, the value of underlying assets as well as any guarantees. Swaps are marked-to-market daily based on valuations from third party pricing vendors, registered derivatives clearing organizations (clearinghouses) or broker-supplied valuations. These pricing sources may utilize inputs such as interest rate curves, credit spread curves, default possibilities and recovery rates. When independent prices are unavailable or unreliable, debt securities and swaps may be valued utilizing pricing methodologies which consider similar
Not Part of Financial Report
3. Significant Accounting Policies - continued
Investment Valuation - continued
factors that would be used by third party pricing vendors. Debt securities and swaps are generally categorized as Level 2 in the hierarchy but may be Level 3 depending on the circumstances.
Investments in open-end mutual funds , including the Fidelity Central Funds, are valued at their closing net asset value (NAV) each business day and are categorized as Level 1 in the hierarchy. Short-term securities with remaining maturities of sixty days or less may be valued at amortized cost, which approximates fair value, and are categorized as Level 2 in the hierarchy.
Changes in valuation techniques may result in transfers in or out of an assigned level within the disclosure hierarchy. The aggregate value of investments by input level, as of December 31, 2013, is included at the end of the Fund's Schedule of Investments.
Investment Transactions and Income. For financial reporting purposes, the Fund's investment holdings and NAV include trades executed through the end of the last business day of the period. The NAV per share for processing shareholder transactions is calculated as of the close of business of the New York Stock Exchange (NYSE), normally 4:00 p.m. Eastern time and includes trades executed through the end of the prior business day. Gains and losses on securities sold are determined on the basis of identified cost and may include proceeds received from litigation. Interest income and distributions from other Fidelity Central Funds are accrued as earned. Interest income includes coupon interest and amortization of premium and accretion of discount on debt securities. The principal amount on inflation-indexed securities is periodically adjusted to the rate of inflation and interest is accrued based on the principal amount. The adjustments to principal due to inflation are reflected as increases or decreases to Interest in the accompanying Statement of Operations. Debt obligations may be placed on non-accrual status and related interest income may be reduced by ceasing current accruals and writing off interest receivables when the collection of all or a portion of interest has become doubtful based on consistently applied procedures. A debt obligation is removed from non-accrual status when the issuer resumes interest payments or when collectability of interest is reasonably assured.
Expenses. Expenses directly attributable to a fund are charged to that fund. Expenses attributable to more than one fund are allocated among the respective funds on the basis of relative net assets or other appropriate methods. Expense estimates are accrued in the period to which they relate and adjustments are made when actual amounts are known.
Income Tax Information and Distributions to Shareholders. Each year, the Fund intends to qualify as a regulated investment company under Subchapter M of the Internal Revenue Code, including distributing substantially all of its taxable income and realized gains. As a result, no provision for U.S. Federal income taxes is required. As of December 31, 2013, the Fund did not have any unrecognized tax benefits in the financial statements; nor is the Fund aware of any tax positions for which it is reasonably possible that the total amounts of unrecognized tax benefits will significantly change in the next twelve months. The Fund files a U.S. federal tax return, in addition to state and local tax returns as required. The Fund's federal income tax returns are subject to examination by the Internal Revenue Service (IRS) for a period of three fiscal years after they are filed. State and local tax returns may be subject to examination for an additional fiscal year depending on the jurisdiction.
Dividends are declared and recorded daily and paid monthly from net investment income. Distributions from realized gains, if any, are declared and recorded on the ex-dividend date. Income and capital gain distributions are determined in accordance with income tax regulations, which may differ from GAAP.
Capital accounts within the financial statements are adjusted for permanent book-tax differences. These adjustments have no impact on net assets or the results of operations. Capital accounts are not adjusted for temporary book-tax differences which will reverse in a subsequent period.
Book-tax differences are primarily due to swap agreements, market discount, capital loss carryforwards and losses deferred due to wash sales.
The federal tax cost of investment securities and unrealized appreciation (depreciation) as of period end were as follows:
Gross unrealized appreciation | $ 86,949,210 |
Gross unrealized depreciation | (78,613,643) |
Net unrealized appreciation (depreciation) on securities and other investments | $ 8,335,567 |
| |
Tax Cost | $ 4,087,232,026 |
The tax-based components of distributable earnings as of period end were as follows:
Capital loss carryforward | $ (27,535,971) |
Net unrealized appreciation (depreciation) | $ 7,918,605 |
Not Part of Financial Report
Notes to Financial Statements - continued
3. Significant Accounting Policies - continued
Income Tax Information and Distributions to Shareholders - continued
Capital loss carryforwards are only available to offset future capital gains of the Fund to the extent provided by regulations and may be limited. Under the Regulated Investment Company Modernization Act of 2010 (the Act), the Fund is permitted to carry forward capital losses incurred in taxable years beginning after December 22, 2010 for an unlimited period and such capital losses are required to be used prior to any losses that expire. The capital loss carryforward information presented below, including any applicable limitation, is estimated as of fiscal period end and is subject to adjustment.
No expiration | |
Short-term | $ (27,535,971) |
The tax character of distributions paid was as follows:
| December 31, 2013 | December 31, 2012 |
Ordinary Income | $ 114,536,115 | $ 191,972,771 |
Long-term Capital Gains | 44,142,704 | 8,933,021 |
Total | $ 158,678,819 | $ 200,905,792 |
Repurchase Agreements. Pursuant to an Exemptive Order issued by the SEC, the Fund along with other registered investment companies having management contracts with FMR, or other affiliated entities of FMR, are permitted to transfer uninvested cash balances into joint trading accounts which are then invested in repurchase agreements. The Fund may also invest directly with institutions in repurchase agreements. Repurchase agreements may be collateralized by government or non-government securities. Upon settlement date, collateral is held in segregated accounts with custodian banks and may be obtained in the event of a default of the counterparty. The Fund monitors, on a daily basis, the value of the collateral to ensure it is at least equal to the principal amount of the repurchase agreement (including accrued interest). In the event of a default by the counterparty, realization of the collateral proceeds could be delayed, during which time the value of the collateral may decline.
Delayed Delivery Transactions and When-Issued Securities. During the period, the Fund transacted in securities on a delayed delivery or when-issued basis. Payment and delivery may take place after the customary settlement period for that security. The price of the underlying securities and the date when the securities will be delivered and paid for are fixed at the time the transaction is negotiated. The securities purchased on a delayed delivery or when-issued basis are identified as such in the Fund's Schedule of Investments. The Fund may receive compensation for interest forgone in the purchase of a delayed delivery or when-issued security. With respect to purchase commitments, the Fund identifies securities as segregated in its records with a value at least equal to the amount of the commitment. Losses may arise due to changes in the value of the underlying securities or if the counterparty does not perform under the contract's terms, or if the issuer does not issue the securities due to political, economic, or other factors.
To-Be-Announced (TBA) Securities and Mortgage Dollar Rolls. During the period, the Fund transacted in TBA securities that involved buying or selling mortgage-backed securities (MBS) on a forward commitment basis. A TBA transaction typically does not designate the actual security to be delivered and only includes an approximate principal amount; however delivered securities must meet specified terms defined by industry guidelines, including issuer, rate and current principal amount outstanding on underlying mortgage pools. The Fund may enter into a TBA transaction with the intent to take possession of or deliver the underlying MBS, or the Fund may elect to extend the settlement by entering into either a mortgage or reverse mortgage dollar roll. Mortgage dollar rolls are transactions where a fund sells TBA securities and simultaneously agrees to repurchase MBS on a later date at a lower price and with the same counterparty. Reverse mortgage dollar rolls involve the purchase and simultaneous agreement to sell TBA securities on a later date at a lower price. Transactions in mortgage dollar rolls and reverse mortgage dollar rolls are accounted for as purchases and sales and may result in an increase to the Fund's portfolio turnover rate.
Purchases and sales of TBA securities involve risks similar to those discussed above for delayed delivery and when-issued securities. Also, if the counterparty in a mortgage dollar roll or a reverse mortgage dollar roll transaction files for bankruptcy or becomes insolvent, the Fund's right to repurchase or sell securities may be limited. Additionally, when a fund sells TBA securities without already owning or having the right to obtain the deliverable securities (an uncovered forward commitment to sell), it incurs a risk of loss because it could have to purchase the securities at a price that is higher than the price at which it sold them. A fund may be unable to purchase the deliverable securities if the corresponding market is illiquid.
TBA securities subject to a forward commitment to sell at period end are included at the end of the Fund's Schedule of Investments under the caption "TBA Sale Commitments." The proceeds and value of these commitments are reflected in the Fund's Statement of Assets and Liabilities as Receivable for TBA sale commitments and TBA sale commitments, at value, respectively.
Restricted Securities. The Fund may invest in securities that are subject to legal or contractual restrictions on resale. These securities generally may be resold in transactions exempt from registration or to the public if the securities are registered. Disposal of these securities may involve time-consuming negotiations and expense, and prompt sale at an acceptable price may be difficult. Information regarding restricted securities is included at the end of the Fund's Schedule of Investments.
Not Part of Financial Report
4. Derivative Instruments.
Risk Exposures and the Use of Derivative Instruments. The Fund's investment objective allows the Fund to enter into various types of derivative contracts, including swaps. Derivatives are investments whose value is primarily derived from underlying assets, indices or reference rates and may be transacted on an exchange or over-the-counter (OTC). Derivatives may involve a future commitment to buy or sell a specified asset based on specified terms, to exchange future cash flows at periodic intervals based on a notional principal amount, or for one party to make one or more payments upon the occurrence of specified events in exchange for periodic payments from the other party.
The Fund used derivatives to increase returns, to gain exposure to certain types of assets and to manage exposure to certain risks as defined below. The success of any strategy involving derivatives depends on analysis of numerous economic factors, and if the strategies for investment do not work as intended, the Fund may not achieve its objectives.
The Fund's use of derivatives increased or decreased its exposure to the following risk:
Credit Risk | Credit risk relates to the ability of the issuer of a financial instrument to make further principal or interest payments on an obligation or commitment that it has to the Fund. |
The Fund is also exposed to additional risks from investing in derivatives, such as liquidity risk and counterparty credit risk. Liquidity risk is the risk that the Fund will be unable to close out the derivative in the open market in a timely manner. Counterparty credit risk is the risk that the counterparty will not be able to fulfill its obligation to the Fund. Derivative counterparty credit risk is managed through formal evaluation of the creditworthiness of all potential counterparties. On certain OTC derivatives such as bi-lateral swaps, the Fund attempts to reduce its exposure to counterparty credit risk by entering into an International Swaps and Derivatives Association, Inc. (ISDA) Master Agreement with each of its counterparties. The ISDA Master Agreement gives the Fund the right to terminate all transactions traded under such agreement upon the deterioration in the credit quality of the counterparty beyond specified levels. The ISDA Master Agreement gives each party the right, upon an event of default by the other party or a termination of the agreement, to close out all transactions traded under such agreement and to net amounts owed under each transaction to one net payable by one party to the other. To mitigate counterparty credit risk on bi-lateral OTC derivatives, the Fund receives collateral in the form of cash or securities once the net unrealized appreciation on outstanding derivative contracts under an ISDA Master Agreement exceeds certain applicable thresholds, subject to certain minimum transfer provisions. The collateral received is held in segregated accounts with the Fund's custodian bank in accordance with the collateral agreements entered into between the Fund, the counterparty and the Fund's custodian bank. The Fund could experience delays and costs in gaining access to the collateral even though it is held by the Fund's custodian bank. The Fund's maximum risk of loss from counterparty credit risk related to bi-lateral OTC derivatives is generally the aggregate unrealized appreciation and unpaid counterparty payments in excess of any collateral pledged by the counterparty to the Fund. The Fund may be required to pledge collateral for the benefit of the counterparties on bi-lateral OTC derivatives in an amount not less than each counterparty's unrealized appreciation on outstanding derivative contracts, subject to certain minimum transfer provisions, and any such pledged collateral is identified in the Schedule of Investments.
Investing in derivatives may involve greater risks than investing in the underlying assets directly and, to varying degrees, may involve risk of loss in excess of any initial investment and collateral received and amounts recognized in the Statement of Assets and Liabilities. In addition, there may be the risk that the change in value of the derivative contract does not correspond to the change in value of the underlying instrument.
Net Realized Gain (Loss) and Change in Net Unrealized Appreciation (Depreciation) on Derivatives. The table below, which reflects the impacts of derivatives on the financial performance of the Fund, summarizes the net realized gain (loss) and change in net unrealized appreciation (depreciation) for derivatives during the period as presented in the Statement of Operations.
Primary Risk Exposure / Derivative Type | Net Realized
Gain (Loss) | Change in Net
Unrealized Appreciation
(Depreciation) |
Credit Risk | | |
Swaps (a) | $ (178,495) | $ 207,751 |
(a) A summary of the value of derivatives by primary risk exposure as of period end is included at the end of the Schedule of Investments.
Swaps. A swap is a contract between two parties to exchange future cash flows at periodic intervals based on a notional principal amount. A bi-lateral OTC swap is a transaction between a fund and a dealer counterparty where cash flows are exchanged between the two parties for the life of the swap.
Bi-lateral OTC swaps are marked-to-market daily and changes in value are reflected in the Statement of Assets and Liabilities in the bi-lateral OTC swaps at value line items. Any upfront premiums paid or received upon entering a bi-lateral OTC swap to compensate for differences between stated terms of the swap and prevailing market conditions (e.g. credit spreads, interest rates or other factors) are recorded in net unrealized appreciation (depreciation) in the Statement of Assets and Liabilities and amortized to realized gain or (loss) ratably over the term of the swap. Any unamortized upfront premiums are presented in the Schedule of Investments.
Not Part of Financial Report
Notes to Financial Statements - continued
4. Derivative Instruments - continued
Swaps - continued
Payments are exchanged at specified intervals, accrued daily commencing with the effective date of the contract and recorded as realized gain or (loss). Realized gain or (loss) is also recorded in the event of an early termination of a swap. The net realized gain (loss) and change in net unrealized appreciation (depreciation) on swaps during the period is included in the Statement of Operations.
Any open swaps at period end are included in the Schedule of Investments under the caption "Swaps" and are representative of volume of activity during the period.
Credit Default Swaps. Credit default swaps enable the Fund to buy or sell protection against specified credit events on a single-name issuer or a traded credit index. Under the terms of a credit default swap the buyer of protection (buyer) receives credit protection in exchange for making periodic payments to the seller of protection (seller) based on a fixed percentage applied to a notional principal amount. In return for these payments, the seller will be required to make a payment upon the occurrence of one or more specified credit events. The Fund enters into credit default swaps as a seller to gain credit exposure to an issuer and/or as a buyer to obtain a measure of protection against defaults of an issuer. Periodic payments are made over the life of the contract by the buyer provided that no credit event occurs.
For credit default swaps on most corporate and sovereign issuers, credit events include bankruptcy, failure to pay or repudiation/moratorium. For credit default swaps on corporate or sovereign issuers, the obligation that may be put to the seller is not limited to the specific reference obligation described in the Schedule of Investments. For credit default swaps on asset-backed securities, a credit event may be triggered by events such as failure to pay principal, maturity extension, rating downgrade or write-down. For credit default swaps on asset-backed securities, the reference obligation described represents the security that may be put to the seller. For credit default swaps on a traded credit index, a specified credit event may affect all or individual underlying securities included in the index.
As a seller, if an underlying credit event occurs, the Fund will pay a net settlement amount of cash equal to the notional amount of the swap less the recovery value of the reference obligation or underlying securities comprising an index. Only in the event of the industry's inability to value the underlying asset will the Fund be required to take delivery of the reference obligation or underlying securities comprising an index and pay an amount equal to the notional amount of the swap.
As a buyer, if an underlying credit event occurs, the Fund will receive a net settlement amount of cash equal to the notional amount of the swap less the recovery value of the reference obligation or underlying securities comprising an index. Only in the event of the industry's inability to value the underlying asset will the Fund be required to deliver the reference obligation or underlying securities comprising an index in exchange for payment of an amount equal to the notional amount of the swap.
Typically, the value of each credit default swap and credit rating disclosed for each reference obligation in the Schedule of Investments, where the Fund is the seller, can be used as measures of the current payment/performance risk of the swap. As the value of the swap changes as a positive or negative percentage of the total notional amount, the payment/performance risk may decrease or increase, respectively. In addition to these measures, the investment adviser monitors a variety of factors including cash flow assumptions, market activity and market sentiment as part of its ongoing process of assessing payment/performance risk.
5. Purchases and Sales of Investments.
Purchases and sales of securities, other than short-term securities and U.S. government securities, aggregated $753,123,801 and $324,043,148, respectively.
6. Fees and Other Transactions with Affiliates.
Management Fee and Expense Contract. Fidelity Investments Money Management, Inc. (the investment adviser), an affiliate of FMR, provides the Fund with investment management services. The Fund does not pay any fees for these services. Pursuant to the Fund's management contract with the investment adviser, FMR pays the investment adviser a portion of the management fees it receives from the Investing Funds. In addition, under an expense contract, FMR also pays all other expenses of the Fund, excluding custody fees, the compensation of the independent Trustees, and certain exceptions such as interest expense.
7. Security Lending.
The Fund lends portfolio securities from time to time in order to earn additional income. On the settlement date of the loan, the Fund receives collateral (in the form of U.S. Treasury obligations, letters of credit and/or cash) against the loaned securities and maintains collateral in an amount not less than 100% of the market value of the loaned securities during the period of the loan. The market value of the loaned securities is determined at the close of business of the Fund and any additional required collateral is delivered to the Fund on the next business day. If the borrower defaults on its
Not Part of Financial Report
7. Security Lending - continued
obligation to return the securities loaned because of insolvency or other reasons, the Fund may apply collateral received from the borrower against the obligation. The Fund may experience delays and costs in recovering the securities loaned. Any cash collateral received is maintained at the Fund's custodian and/or invested in cash equivalents. The value of loaned securities and cash collateral at period end are disclosed on the Fund's Statement of Assets and Liabilities. Security lending income represents the income earned on investing cash collateral, less rebates paid to borrowers, plus any premium payments received for lending certain types of securities. Security lending income is presented in the Statement of Operations as a component of interest income. Total security lending income during the period amounted to $9,224.
8. Expense Reductions.
The investment adviser has voluntarily agreed to reimburse a portion of the Fund's operating expenses. For the period, the reimbursement reduced the expenses by $15,844. In addition, through arrangements with the Fund's custodian, credits realized as a result of uninvested cash balances were used to reduce the Fund's expenses. During the period, these credits reduced the Fund's custody expenses by $586.
9. Other.
The Fund's organizational documents provide former and current trustees and officers with a limited indemnification against liabilities arising in connection with the performance of their duties to the Fund. In the normal course of business, the Fund may also enter into contracts that provide general indemnifications. The Fund's maximum exposure under these arrangements is unknown as this would be dependent on future claims that may be made against the Fund. The risk of material loss from such claims is considered remote.
At the end of the period, mutual funds managed by the investment adviser or its affiliates were the owners of record of all of the outstanding shares of the Fund according to the following schedule.
Fund | Ownership % |
VIP Asset Manager Portfolio | 12.76% |
VIP Asset Manager: Growth Portfolio | .98% |
VIP Balanced Portfolio | 12.70% |
VIP Investment Grade Bond Portfolio | 73.56% |
10. Credit Risk.
The Fund invests a portion of its assets in structured securities of issuers backed by residential mortgage loans, credit card receivables and automotive loans. The value and related income of these securities is sensitive to changes in economic conditions, including delinquencies and/or defaults.
Not Part of Financial Report
Report of Independent Registered Public Accounting Firm
To the Trustees of Fidelity Garrison Street Trust and Shareholders of Fidelity VIP Investment Grade Central Fund:
We have audited the accompanying statement of assets and liabilities of Fidelity VIP Investment Grade Central Fund (the Fund), a fund of Fidelity Garrison Street Trust, including the schedule of investments, as of December 31, 2013, and the related statement of operations for the year then ended, the statement of changes in net assets for each of the two years in the period then ended and the financial highlights for each of the five years in the period then ended. These financial statements and financial highlights are the responsibility of the Fund's management. Our responsibility is to express an opinion on these financial statements and financial highlights based on our audits.
We conducted our audits in accordance with the standards of the Public Company Accounting Oversight Board (United States). Those standards require that we plan and perform the audit to obtain reasonable assurance about whether the financial statements and financial highlights are free of material misstatement. The Fund is not required to have, nor were we engaged to perform, an audit of its internal control over financial reporting. Our audits included consideration of internal control over financial reporting as a basis for designing audit procedures that are appropriate in the circumstances, but not for the purpose of expressing an opinion on the effectiveness of the Fund's internal control over financial reporting. Accordingly, we express no such opinion. An audit also includes examining, on a test basis, evidence supporting the amounts and disclosures in the financial statements, assessing the accounting principles used and significant estimates made by management, as well as evaluating the overall financial statement presentation. Our procedures included confirmation of securities owned as of December 31, 2013, by correspondence with the custodians and brokers; where replies were not received from brokers, we performed other auditing procedures. We believe that our audits provide a reasonable basis for our opinion.
In our opinion, the financial statements and financial highlights referred to above present fairly, in all material respects, the financial position of Fidelity VIP Investment Grade Central Fund as of December 31, 2013, the results of its operations for the year then ended, the changes in net assets for each of the two years in the period then ended, and the financial highlights for each of the five years in the period then ended in conformity with accounting principles generally accepted in the United States of America.
DELOITTE & TOUCHE LLP
Boston, Massachusetts
February 19, 2014
Not Part of Financial Report
Trustees and Officers
The Trustees and officers of the trust and fund, as applicable, are listed below. The Board of Trustees governs the fund and is responsible for protecting the interests of shareholders. The Trustees are experienced executives who meet periodically throughout the year to oversee the fund's activities, review contractual arrangements with companies that provide services to the fund, oversee management of the risks associated with such activities and contractual arrangements, and review the fund's performance. Except for Elizabeth S. Acton and James C. Curvey, each of the Trustees oversees 223 funds. Ms. Acton oversees 205 funds. Mr. Curvey oversees 396 funds.
The Trustees hold office without limit in time except that (a) any Trustee may resign; (b) any Trustee may be removed by written instrument, signed by at least two-thirds of the number of Trustees prior to such removal; (c) any Trustee who requests to be retired or who has become incapacitated by illness or injury may be retired by written instrument signed by a majority of the other Trustees; and (d) any Trustee may be removed at any special meeting of shareholders by a two-thirds vote of the outstanding voting securities of the trust. Each Trustee who is not an interested person (as defined in the 1940 Act) of the trust and the fund (Independent Trustee), shall retire not later than the last day of the month in which his or her 75th birthday occurs. The Independent Trustees may waive this mandatory retirement age policy with respect to individual Trustees. The officers hold office without limit in time, except that any officer may resign or may be removed by a vote of a majority of the Trustees at any regular meeting or any special meeting of the Trustees. Except as indicated, each individual has held the office shown or other offices in the same company for the past five years.
Experience, Skills, Attributes, and Qualifications of the Fund's Trustees. The Governance and Nominating Committee has adopted a statement of policy that describes the experience, qualifications, attributes, and skills that are necessary and desirable for potential Independent Trustee candidates (Statement of Policy). The Board believes that each Trustee satisfied at the time he or she was initially elected or appointed a Trustee, and continues to satisfy, the standards contemplated by the Statement of Policy. The Governance and Nominating Committee also engages professional search firms to help identify potential Independent Trustee candidates who have the experience, qualifications, attributes, and skills consistent with the Statement of Policy. From time to time, additional criteria based on the composition and skills of the current Independent Trustees, as well as experience or skills that may be appropriate in light of future changes to board composition, business conditions, and regulatory or other developments, have also been considered by the professional search firms and the Governance and Nominating Committee. In addition, the Board takes into account the Trustees' commitment and participation in Board and committee meetings, as well as their leadership of standing and ad hoc committees throughout their tenure.
In determining that a particular Trustee was and continues to be qualified to serve as a Trustee, the Board has considered a variety of criteria, none of which, in isolation, was controlling. The Board believes that, collectively, the Trustees have balanced and diverse experience, qualifications, attributes, and skills, which allow the Board to operate effectively in governing the fund and protecting the interests of shareholders. Information about the specific experience, skills, attributes, and qualifications of each Trustee, which in each case led to the Board's conclusion that the Trustee should serve (or continue to serve) as a trustee of the fund, is provided below.
Board Structure and Oversight Function. Abigail P. Johnson is an interested person (as defined in the 1940 Act) and currently serves as Chairman. The Trustees have determined that an interested Chairman is appropriate and benefits shareholders because an interested Chairman has a personal and professional stake in the quality and continuity of services provided to the fund. Independent Trustees exercise their informed business judgment to appoint an individual of their choosing to serve as Chairman, regardless of whether the Trustee happens to be independent or a member of management. The Independent Trustees have determined that they can act independently and effectively without having an Independent Trustee serve as Chairman and that a key structural component for assuring that they are in a position to do so is for the Independent Trustees to constitute a substantial majority for the Board. The Independent Trustees also regularly meet in executive session. Albert R. Gamper, Jr. serves as Chairman of the Independent Trustees and as such (i) acts as a liaison between the Independent Trustees and management with respect to matters important to the Independent Trustees and (ii) with management prepares agendas for Board meetings.
Fidelity funds are overseen by different Boards of Trustees. The fund's Board oversees Fidelity's investment-grade bond, money market, and asset allocation funds and another Board oversees Fidelity's equity and high income funds. The asset allocation funds may invest in Fidelity funds that are overseen by such other Board. The use of separate Boards, each with its own committee structure, allows the Trustees of each group of Fidelity funds to focus on the unique issues of the funds they oversee, including common research, investment, and operational issues. On occasion, the separate Boards establish joint committees to address issues of overlapping consequences for the Fidelity funds overseen by each Board.
The Trustees operate using a system of committees to facilitate the timely and efficient consideration of all matters of importance to the Trustees, the fund, and fund shareholders and to facilitate compliance with legal and regulatory requirements and oversight of the fund's activities and associated risks. The Board, acting through its committees, has charged FMR and its affiliates with (i) identifying events or circumstances the occurrence of which could have demonstrably adverse effects on the fund's business and/or reputation; (ii) implementing processes and controls to lessen the possibility that such events or circumstances occur or to mitigate the effects of such events or circumstances if they do occur; and (iii) creating and maintaining a system designed to evaluate continuously business and market conditions in order to facilitate the identification and implementation processes described in (i) and (ii) above. Because the day-to-day operations and activities of the fund are carried out by or through FMR, its affiliates, and other service providers, the fund's exposure to risks is mitigated but not eliminated by the processes overseen by the Trustees. While each of the Board's committees has responsibility for overseeing different aspects of the fund's activities, oversight is exercised primarily through the Operations and Audit Committees. In addition, an ad hoc Board committee of Independent Trustees has worked with FMR to enhance the Board's oversight of investment and financial risks, legal and regulatory risks, technology risks, and operational risks, including the development of additional risk reporting to the Board. Appropriate personnel, including but not limited to the fund's Chief Compliance Officer (CCO), FMR's internal auditor, the independent accountants, the fund's Treasurer and portfolio management personnel, make periodic reports to the Board's committees, as appropriate, including an annual review of FMR's risk management program for the Fidelity funds. The responsibilities of each standing committee, including their oversight responsibilities, are described further under "Standing Committees of the Fund's Trustees."
Not Part of Financial Report
The fund's Statement of Additional Information (SAI) includes more information about the Trustees. To request a free copy, call Fidelity at 1-800-544-8544.
Interested Trustees*:
Correspondence intended for each Trustee who is an interested person may be sent to Fidelity Investments, 245 Summer Street, Boston, Massachusetts 02210.
Name, Year of Birth; Principal Occupations and Other Relevant Experience+ |
James C. Curvey (1935) |
Year of Election or Appointment: 2007 Trustee |
| Mr. Curvey also serves as Trustee of other Fidelity funds. Mr. Curvey is a Director of Fidelity Investments Money Management, Inc. (2009-present), Director of Fidelity Research & Analysis Co. (2009-present) and Director of FMR and FMR Co., Inc. (2007-present). Mr. Curvey is also Vice Chairman (2007-present) and Director of FMR LLC. In addition, Mr. Curvey serves as an Overseer for the Boston Symphony Orchestra and a member of the Trustees of Villanova University. Previously, Mr. Curvey was the Vice Chairman (2006-2007) and Director (2000-2007) of FMR Corp. |
Abigail P. Johnson (1961) |
Year of Election or Appointment: 2009 Trustee Chairman of the Board of Trustees |
| Ms. Johnson also serves as Trustee of other Fidelity funds. Ms. Johnson serves as President of FMR LLC (2013-present), President of Fidelity Financial Services (2012-present) and President of Personal, Workplace and Institutional Services (2005-present). Ms. Johnson is Chairman and Director of FMR Co., Inc. (2011-present), Chairman and Director of FMR (2011-present), and the Vice Chairman and Director (2007-present) of FMR LLC. Previously, Ms. Johnson served as President and a Director of FMR (2001-2005), a Trustee of other investment companies advised by FMR, Fidelity Investments Money Management, Inc., and FMR Co., Inc. (2001-2005), Senior Vice President of the Fidelity funds (2001-2005), and managed a number of Fidelity funds. Ms. Abigail P. Johnson and Mr. Arthur E. Johnson are not related. |
* Trustees have been determined to be "Interested Trustees" by virtue of, among other things, their affiliation with the trust or various entities under common control with FMR.
+ The information above includes each Trustee's principal occupation during the last five years and other information relating to the experience, attributes, and skills relevant to each Trustee's qualifications to serve as a Trustee, which led to the conclusion that each Trustee should serve as a Trustee for the fund.
Independent Trustees:
Correspondence intended for each Independent Trustee (that is, the Trustees other than the Interested Trustees) may be sent to Fidelity Investments, P.O. Box 55235, Boston, Massachusetts 02205-5235.
Name, Year of Birth; Principal Occupations and Other Relevant Experience+ |
Elizabeth S. Acton (1951) |
Year of Election or Appointment: 2013 Trustee |
| Ms. Acton also serves as Trustee or Member of the Advisory Board of other Fidelity funds. Prior to her retirement in April 2012, Ms. Acton was Executive Vice President, Finance (2011-2012), Executive Vice President, Chief Financial Officer (2002-2011), and Treasurer (2004-2005) of Comerica Incorporated (financial services). Prior to joining Comerica, Ms. Acton held a variety of positions at Ford Motor Company (1983-2002), including Vice President and Treasurer (2000-2002) and Executive Vice President and Chief Financial Officer of Ford Motor Credit Company (1998-2000). Ms. Acton currently serves as a member of the Board of Directors and Audit and Finance Committees of Beazer Homes USA, Inc. (homebuilding, 2012-present). |
Albert R. Gamper, Jr. (1942) |
Year of Election or Appointment: 2006 Trustee Chairman of the Independent Trustees |
| Mr. Gamper also serves as Trustee of other Fidelity funds. Prior to his retirement in December 2004, Mr. Gamper served as Chairman of the Board of CIT Group Inc. (commercial finance). During his tenure with CIT Group Inc. Mr. Gamper served in numerous senior management positions, including Chairman (1987-1989; 1999-2001; 2002-2004), Chief Executive Officer (1987-2004), and President (2002-2003). Mr. Gamper currently serves as a member of the Board of Directors of Public Service Enterprise Group (utilities, 2000-present), a member of the Board of Trustees, Rutgers University (2004-present), and Chairman of the Board of Barnabas Health Care System. Previously, Mr. Gamper served as Vice Chairman of the Independent Trustees of certain Fidelity funds (2011-2012) and as Chairman of the Board of Governors, Rutgers University (2004-2007). |
Robert F. Gartland (1951) |
Year of Election or Appointment: 2010 Trustee |
| Mr. Gartland also serves as Trustee of other Fidelity funds. Mr. Gartland is Chairman and an investor in Gartland and Mellina Group Corp. (consulting, 2009-present). Previously, Mr. Gartland served as a partner and investor of Vietnam Partners LLC (investments and consulting, 2008-2011). Prior to his retirement, Mr. Gartland held a variety of positions at Morgan Stanley (financial services, 1979-2007) including Managing Director (1987-2007). |
Arthur E. Johnson (1947) |
Year of Election or Appointment: 2008 Trustee |
| Mr. Johnson also serves as Trustee of other Fidelity funds. Mr. Johnson serves as a member of the Board of Directors of Eaton Corporation (diversified power management, 2009-present), AGL Resources, Inc. (holding company, 2002-present) and Booz Allen Hamilton (management consulting, 2011-present). Prior to his retirement, Mr. Johnson served as Senior Vice President of Corporate Strategic Development of Lockheed Martin Corporation (defense contractor, 1999-2009). He previously served on the Board of Directors of IKON Office Solutions, Inc. (1999-2008) and Delta Airlines (2005-2007). Mr. Arthur E. Johnson is not related to Ms. Abigail P. Johnson. |
Michael E. Kenneally (1954) |
Year of Election or Appointment: 2009 Trustee |
| Mr. Kenneally also serves as Trustee of other Fidelity funds. Mr. Kenneally served as a Member of the Advisory Board for certain Fidelity funds before joining the Board of Trustees (2008-2009). Prior to his retirement, Mr. Kenneally served as Chairman and Global Chief Executive Officer of Credit Suisse Asset Management. Before joining Credit Suisse, he was an Executive Vice President and Chief Investment Officer for Bank of America Corporation. Earlier roles at Bank of America included Director of Research, Senior Portfolio Manager and Research Analyst, and Mr. Kenneally was awarded the Chartered Financial Analyst (CFA) designation in 1991. |
James H. Keyes (1940) |
Year of Election or Appointment: 2007 Trustee |
| Mr. Keyes also serves as Trustee of other Fidelity funds. Mr. Keyes serves as a member of the Board and Non-Executive Chairman of Navistar International Corporation (manufacture and sale of trucks, buses, and diesel engines, since 2002). Previously, Mr. Keyes served as a member of the Board of Pitney Bowes, Inc. (integrated mail, messaging, and document management solutions, 1998-2013). Prior to his retirement, Mr. Keyes served as Chairman (1993-2002) and Chief Executive Officer (1988-2002) of Johnson Controls (automotive, building, and energy) and as a member of the Board of LSI Logic Corporation (semiconductor technologies, 1984-2008). |
Marie L. Knowles (1946) |
Year of Election or Appointment: 2001 Trustee Vice Chairman of the Independent Trustees |
| Ms. Knowles also serves as Trustee of other Fidelity funds. Prior to Ms. Knowles' retirement in June 2000, she served as Executive Vice President and Chief Financial Officer of Atlantic Richfield Company (ARCO) (diversified energy, 1996-2000). From 1993 to 1996, she was a Senior Vice President of ARCO and President of ARCO Transportation Company. She served as a Director of ARCO from 1996 to 1998. Ms. Knowles currently serves as a Director and Chairman of the Audit Committee of McKesson Corporation (healthcare service, since 2002). Ms. Knowles is a member of the Board of the Catalina Island Conservancy and of the Santa Catalina Island Company (2009-present). She also serves as a member of the Advisory Board for the School of Engineering of the University of Southern California. Previously, Ms. Knowles served as a Director of Phelps Dodge Corporation (copper mining and manufacturing, 1994-2007), URS Corporation (engineering and construction, 2000-2003) and America West (airline, 1999-2002). |
Kenneth L. Wolfe (1939) |
Year of Election or Appointment: 2005 Trustee |
| Mr. Wolfe also serves as Trustee of other Fidelity funds. Prior to his retirement, Mr. Wolfe served as Chairman and a Director (2007-2009) and Chairman and Chief Executive Officer (1994-2001) of Hershey Foods Corporation. He also served as a member of the Boards of Adelphia Communications Corporation (telecommunications, 2003-2006), Bausch & Lomb, Inc. (medical/pharmaceutical, 1993-2007), and Revlon, Inc. (personal care products, 2004-2009). Mr. Wolfe previously served as Chairman of the Independent Trustees of other Fidelity funds (2008-2012). |
+ The information above includes each Trustee's principal occupation during the last five years and other information relating to the experience, attributes, and skills relevant to each Trustee's qualifications to serve as a Trustee, which led to the conclusion that each Trustee should serve as a Trustee for the fund.
Officers:
Correspondence intended for each officer may be sent to Fidelity Investments, 245 Summer Street, Boston, Massachusetts 02210. Officers appear below in alphabetical order.
Name, Year of Birth; Principal Occupation |
Elizabeth Paige Baumann (1968) |
Year of Election or Appointment: 2012 Anti-Money Laundering (AML) Officer |
| Ms. Baumann also serves as AML Officer of other funds. She is Chief AML Officer of FMR LLC (2012-present) and is an employee of Fidelity Investments. Previously, Ms. Baumann served as Vice President and Deputy Anti-Money Laundering Officer (2007-2012). |
Robert P. Brown (1963) |
Year of Election or Appointment: 2012 Vice President of Fidelity's Bond Funds |
| Mr. Brown also serves as Vice President of other funds. Mr. Brown serves as Executive Vice President of Fidelity Investments Money Management, Inc. (FIMM) (2010-present), President, Bond Group of FMR (2011-present), Director and Managing Director, Research of Fidelity Management & Research (U.K.) Inc. (2008-present), and is an employee of Fidelity Investments. Previously, Mr. Brown served as President, Money Market Group of FMR (2010-2011) and Vice President of Fidelity's Money Market Funds (2010-2012). |
Marc Bryant (1966) |
Year of Election or Appointment: 2013 Assistant Secretary |
| Mr. Bryant also serves as an officer of other funds. He is Senior Vice President and Deputy General Counsel of FMR LLC. Prior to joining Fidelity Investments, Mr. Bryant served as a Senior Vice President and the Head of Global Retail Legal for AllianceBernstein L.P. (2006-2010), and as the General Counsel for ProFund Advisors LLC (2001-2006). |
Jonathan Davis (1968) |
Year of Election or Appointment: 2010 Assistant Treasurer |
| Mr. Davis also serves as Assistant Treasurer of other funds. Mr. Davis is an employee of Fidelity Investments. Previously, Mr. Davis served as Vice President and Associate General Counsel of FMR LLC (2003-2010). |
Adrien E. Deberghes (1967) |
Year of Election or Appointment: 2010 Assistant Treasurer |
| Mr. Deberghes also serves as an officer of other funds. He is an employee of Fidelity Investments (2008-present). Prior to joining Fidelity Investments, Mr. Deberghes was Senior Vice President of Mutual Fund Administration at State Street Corporation (2007-2008), Senior Director of Mutual Fund Administration at Investors Bank & Trust (2005-2007), and Director of Finance for Dunkin' Brands (2000-2005). |
Stephanie J. Dorsey (1969) |
Year of Election or Appointment: 2013 President and Treasurer |
| Ms. Dorsey also serves as an officer of other funds. She is an employee of Fidelity Investments (2008-present) and has served in other fund officer roles. Prior to joining Fidelity Investments, Ms. Dorsey served as Treasurer (2004-2008) of the JPMorgan Mutual Funds and Vice President (2004-2008) of JPMorgan Chase Bank. |
Scott C. Goebel (1968) |
Year of Election or Appointment: 2008 Secretary and Chief Legal Officer (CLO) |
| Mr. Goebel serves as Secretary and CLO of other funds. Mr. Goebel also serves as Secretary of Fidelity Investments Money Management, Inc. (FIMM) (2010-present) and Fidelity Research and Analysis Company (FRAC) (2010-present); General Counsel, Secretary, and Senior Vice President of FMR (2008-present) and FMR Co., Inc. (2008-present); Chief Legal Officer of Fidelity Management & Research (Hong Kong) Limited (2008-present) and Assistant Secretary of Fidelity Management & Research (Japan) Inc. (2008-present), and Fidelity Management & Research (U.K.) Inc. (2008-present). Previously, Mr. Goebel served as Secretary and CLO of other Fidelity funds (2008-2013), Assistant Secretary of FIMM (2008-2010), FRAC (2008-2010), and certain funds (2007-2008); and as Vice President and Secretary of Fidelity Distributors Corporation (FDC) (2005-2007). Mr. Goebel has been employed by FMR LLC or an affiliate since 2001. |
Chris Maher (1972) |
Year of Election or Appointment: 2013 Assistant Treasurer |
| Mr. Maher serves as Assistant Treasurer of other funds. Mr. Maher is Vice President of Valuation Oversight and is an employee of Fidelity Investments. Previously, Mr. Maher served as Vice President of Asset Management Compliance (2013), Vice President of FMR's Program Management Group (2010-2013), and Vice President of Valuation Oversight (2008-2010). |
Charles S. Morrison (1960) |
Year of Election or Appointment: 2012 Vice President |
| Mr. Morrison also serves as Vice President of other funds. He serves as President, Fixed Income and is an employee of Fidelity Investments. Previously, Mr. Morrison served as Vice President of Fidelity's Money Market Funds (2005-2009), President, Money Market Group Leader of FMR (2009), and Senior Vice President, Money Market Group of FMR (2004-2009). Mr. Morrison also served as Vice President of Fidelity's Bond Funds (2002-2005), certain Balanced Funds (2002-2005), and certain Asset Allocation Funds (2002-2007), and as Senior Vice President (2002-2005) of Fidelity's Fixed Income Division. |
Christine Reynolds (1958) |
Year of Election or Appointment: 2008 Chief Financial Officer |
| Ms. Reynolds also serves as Chief Financial Officer of other funds. Ms. Reynolds became President of Fidelity Pricing and Cash Management Services (FPCMS) in August 2008. Ms. Reynolds served as Chief Operating Officer of FPCMS (2007-2008). Previously, Ms. Reynolds served as President, Treasurer, and Anti-Money Laundering officer of the Fidelity funds (2004-2007). |
Kenneth B. Robins (1969) |
Year of Election or Appointment: 2009 Assistant Treasurer |
| Mr. Robins also serves as an officer of other funds. Mr. Robins serves as Executive Vice President of Fidelity Investments Money Management, Inc. (FIMM) (2013-present) and is an employee of Fidelity Investments (2004-present). Previously, Mr. Robins served in other fund officer roles. |
Gary W. Ryan (1958) |
Year of Election or Appointment: 2005 Assistant Treasurer |
| Mr. Ryan also serves as Assistant Treasurer of other funds. Mr. Ryan is an employee of Fidelity Investments and has served in other fund officer roles. Previously, Mr. Ryan served as Vice President of Fund Reporting in Fidelity Pricing and Cash Management Services (FPCMS) (1999-2005). |
Stephen Sadoski (1971) |
Year of Election or Appointment: 2013 Deputy Treasurer |
| Mr. Sadoski also serves as Deputy Treasurer of other funds. He is an employee of Fidelity Investments (2012-present) and has served in another fund officer role. Prior to joining Fidelity Investments, Mr. Sadoski served as an assistant chief accountant in the Division of Investment Management of the Securities and Exchange Commission (SEC) (2009-2012) and as a senior manager at Deloitte & Touche LLP (1997-2009). |
Stacie M. Smith (1974) |
Year of Election or Appointment: 2013 Assistant Treasurer |
| Ms. Smith also serves as an officer of other funds. She is an employee of Fidelity Investments (2009-present) and has served in other fund officer roles. Prior to joining Fidelity Investments, Ms. Smith served as Senior Audit Manager of Ernst & Young LLP (1996-2009). |
Renee Stagnone (1975) |
Year of Election or Appointment: 2013 Deputy Treasurer |
| Ms. Stagnone also serves as Deputy Treasurer of other funds. Ms. Stagnone is an employee of Fidelity Investments. |
Michael H. Whitaker (1967) |
Year of Election or Appointment: 2008 Chief Compliance Officer |
| Mr. Whitaker also serves as Chief Compliance Officer of other funds. Mr. Whitaker is an employee of Fidelity Investments (2007-present). Prior to joining Fidelity Investments, Mr. Whitaker worked at MFS Investment Management where he served as Senior Vice President and Chief Compliance Officer (2004-2006), and Assistant General Counsel. |
Joseph F. Zambello (1957) |
Year of Election or Appointment: 2011 Deputy Treasurer |
| Mr. Zambello also serves as Deputy Treasurer of other funds. Mr. Zambello is an employee of Fidelity Investments. Previously, Mr. Zambello served as Vice President of FMR's Program Management Group (2009-2011) and Vice President of the Transfer Agent Oversight Group (2005-2009). |
Not Part of Financial Report
Board Approval of Investment Advisory Contracts and Management Fees
VIP Investment Grade Central Fund
Each year, the Board of Trustees, including the Independent Trustees (together, the Board), votes on the renewal of the management contract with Fidelity Investments Money Management, Inc. (FIMM) and the sub-advisory agreements (together, the Advisory Contracts) for the fund. The Board, assisted by the advice of fund counsel and Independent Trustees' counsel, requests and considers a broad range of information relevant to the renewal of the Advisory Contracts throughout the year.
The Board meets regularly and, at each of its meetings, covers an extensive agenda of topics and materials and considers factors that are relevant to its annual consideration of the renewal of the fund's Advisory Contracts, including the services and support provided to the fund and its shareholders. The Board has established four standing committees, Operations, Audit, Fair Valuation, and Governance and Nominating, each composed of and chaired by Independent Trustees with varying backgrounds, to which the Board has assigned specific subject matter responsibilities in order to enhance effective decision-making by the Board. The Operations Committee, of which all of the Independent Trustees are members, meets regularly throughout the year and, among other matters, considers matters specifically related to the annual consideration of the renewal of the fund's Advisory Contracts. The Board, acting directly and through its Committees, requests and receives information concerning the annual consideration of the renewal of the fund's Advisory Contracts. The Board also meets as needed to consider matters specifically related to the Board's annual consideration of the renewal of Advisory Contracts. Members of the Board may also meet with trustees of other Fidelity funds through ad hoc joint committees to discuss certain matters relevant to the Fidelity funds.
At its September 2013 meeting, the Board, including the Independent Trustees, unanimously determined to renew the fund's Advisory Contracts. In reaching its determination, the Board considered all factors it believed relevant and reached a determination, with the assistance of fund counsel and Independent Trustees' counsel and through the exercise of its business judgment, that the renewal of the Advisory Contracts was in the best interests of the fund and its shareholders and the fact that no fee is payable under the management contract was fair and reasonable.
Nature, Extent, and Quality of Services Provided. The Board considered Fidelity's staffing as it relates to the fund, including the backgrounds of investment personnel of FIMM and the sub-advisers (together, the Investment Advisers), and also considered the fund's investment objective, strategies, and related investment philosophy. The Independent Trustees also had discussions with senior management of Fidelity's investment operations and investment groups. The Board considered the structure of the portfolio manager compensation program and whether this structure provides appropriate incentives to act in the best interests of the fund.
Resources Dedicated to Investment Management and Support Services. The Board reviewed the general qualifications and capabilities of Fidelity's investment staff, including its size, education, experience, and resources, as well as Fidelity's approach to recruiting, managing, and compensating investment personnel. The Board noted that Fidelity has continued to increase the resources devoted to non-U.S. offices, including expansion of Fidelity's global investment organization. The Board also noted that Fidelity's analysts have extensive resources, tools and capabilities that allow them to conduct sophisticated quantitative and fundamental analysis, as well as credit analysis of issuers, counterparties and guarantors. Further, the Board believes that Fidelity's investment professionals have sufficient access to global information and data so as to provide competitive investment results over time, and that those professionals also have access to sophisticated tools that permit them to assess portfolio construction and risk and performance attribution characteristics continuously, as well as to transmit new information and research conclusions rapidly around the world. Additionally, in its deliberations, the Board considered Fidelity's trading and risk management capabilities and resources, which are an integral part of the investment management process.
Administrative Services. The Board considered (i) the nature, extent, quality, and cost of advisory and administrative services performed by the Investment Advisers and their affiliates under the Advisory Contracts and under separate agreements covering transfer agency, pricing and bookkeeping, and securities lending services for the fund; (ii) the nature and extent of the supervision of third party service providers, principally custodians and subcustodians; and (iii) the resources devoted to, and the record of compliance with, the fund's compliance policies and procedures.
Investment Performance. The Board considered whether the fund has operated in accordance with its investment objective, as well as its record of compliance with its investment restrictions. The Board reviewed the fund's absolute investment performance, as well as the fund's relative investment performance, but did not consider performance to be a material factor in its decision to renew the fund's Advisory Contracts, as the fund is not publicly offered as a stand-alone investment product. In this regard, the Board noted that the fund is designed to offer a liquid investment option for other Fidelity funds and accounts and ultimately to enhance the performance of those funds and accounts.
Based on its review, the Board concluded that the nature, extent, and quality of services provided to the fund under the Advisory Contracts should benefit the fund's shareholders.
Competitiveness of Management Fee and Total Expense Ratio. The Board considered that while the fund does not pay a management fee, Fidelity Management & Research Company (FMR) pays a management fee on behalf of the fund and receives fees for providing services to funds that invest in the fund. The Board also noted that FMR bears all expenses of the fund, except expenses related to the fund's investment activities (primarily custody expenses). Based on its review, the Board concluded that the management fee paid on behalf of the fund and the fund's total expense ratio were reasonable in light of the services that the fund and its shareholders receive and the other factors considered.
Not Part of Financial Report
Costs of the Services and Profitability. The Board considered the level of Fidelity's profits in respect of all the Fidelity funds, as well as the profitability of each fund that invests in this fund.
PricewaterhouseCoopers LLP (PwC), independent registered public accounting firm and auditor to Fidelity and certain Fidelity funds, has been engaged annually by the Board as part of the Board's assessment of Fidelity's profitability analysis. PwC's engagement includes the review and assessment of the methodologies used by Fidelity in determining the revenues and expenses attributable to Fidelity's mutual fund business, and completion of agreed-upon procedures surrounding the mathematical accuracy of fund profitability and its conformity to allocation methodologies. After considering PwC's reports issued under the engagement and information provided by Fidelity, the Board concluded that while other allocation methods may also be reasonable, Fidelity's profitability methodologies are reasonable in all material respects.
The Board also reviewed Fidelity's non-fund businesses and fall-out benefits related to the mutual fund business as well as cases where Fidelity's affiliates may benefit from or be related to the fund's business.
The Board concluded that the costs of the services provided by and the profits realized by Fidelity in connection with the operation of the fund were not relevant to the renewal of the Advisory Contracts because the fund pays no advisory fees and FMR bears all expenses of the fund, except expenses related to the fund's investment activities.
Economies of Scale. The Board concluded that because the fund pays no advisory fees and FMR bears all expenses of the fund, except expenses related to the fund's investment activities, economies of scale cannot be realized by the fund.
Additional Information Requested by the Board. In order to develop fully the factual basis for consideration of the Fidelity funds' Advisory Contracts, the Board requested and received additional information on certain topics, including: (i) Fidelity's fund profitability methodology, profitability trends for certain funds, and the impact of certain factors on fund profitability results; (ii) portfolio manager changes that have occurred during the past year and the amount of the investment that each portfolio manager has made in the Fidelity fund(s) that he or she manages; (iii) Fidelity's compensation structure for portfolio managers, research analysts, and other key personnel, including its effects on fund profitability, the rationale for the compensation structure, and the extent to which current market conditions have affected retention and recruitment; (iv) the arrangements with and compensation paid to certain fund sub-advisers on behalf of the Fidelity funds; (v) Fidelity's fee structures, including the group fee structure and definition of group assets, and the rationale for recommending different fees among different categories of funds and classes; (vi) Fidelity's voluntary waiver of its fees to maintain minimum yields for certain money market funds and classes as well as contractual waivers in place for certain funds; (vii) the methodology with respect to competitive fund data and peer group classifications; (viii) Fidelity's transfer agent fee, expense, and service structures for different funds and classes, and the impact of the increased use of omnibus accounts; and (ix) explanations regarding the relative total expense ratios of certain funds and classes, total expense competitive trends and methodologies for total expense competitive comparisons, and actions that might be taken by Fidelity to reduce total expense ratios for certain funds and classes or to achieve further economies of scale.
Based on its evaluation of all of the conclusions noted above, and after considering all factors it believed relevant, the Board ultimately concluded that the advisory fee structures are fair and reasonable, and that the fund's Advisory Contracts should be renewed.
Not Part of Financial Report
Annual Report
Investment Adviser
Fidelity Management & Research Company
Boston, MA
Investment Sub-Adviser
Fidelity Investments Money Management, Inc.
Fidelity Management & Research (U.K.) Inc.
Fidelity Management & Research (Hong Kong) Limited
Fidelity Management & Research (Japan) Inc.
General Distributor
Fidelity Distributors Corporation
Smithfield, RI
Transfer and Service Agents
Fidelity Investments Institutional Operations Co., Inc.
Boston, MA
Fidelity Service Company, Inc.
Boston, MA
Custodian
The Bank of New York Mellon
New York, NY
VIPIGB-ANN-0214
1.540025.116
Fidelity® Variable Insurance Products:
Investor Freedom® Funds -
Income, 2005, 2010, 2015, 2020, 2025, 2030
Annual Report
December 31, 2013
(Fidelity Cover Art)
Contents
To view a fund's proxy voting guidelines and proxy voting record for the 12-month period ended June 30, visit http://www.fidelity.com/proxyvotingresults or visit the Securities and Exchange Commission's (SEC) web site at http://www.sec.gov. You may also call 1-877-208-0098 to request a free copy of the proxy voting guidelines.
Fidelity Variable Insurance Products are separate account options which are purchased through a variable insurance contract.
Standard & Poor's, S&P and S&P 500 are registered service marks of The McGraw-Hill Companies, Inc. and have been licensed for use by Fidelity Distributors Corporation.
Other third-party marks appearing herein are the property of their respective owners.
All other marks appearing herein are registered or unregistered trademarks or service marks of FMR LLC or an affiliated company. © 2014 FMR LLC. All rights reserved.
Annual Report
This report and the financial statements contained herein are submitted for the general information of the shareholders of the funds. This report is not authorized for distribution to prospective investors in the funds unless preceded or accompanied by an effective prospectus.
A fund files its complete schedule of portfolio holdings with the SEC for the first and third quarters of each fiscal year on Form N-Q. Forms N-Q are available on the SEC's web site at http://www.sec.gov. A fund's Forms N-Q may be reviewed and copied at the SEC's Public Reference Room in Washington, DC. Information regarding the operation of the SEC's Public Reference Room may be obtained by calling 1-800-SEC-0330. For a complete list of a fund's portfolio holdings, view the most recent holdings listing, semiannual report, or annual report on Fidelity's web site at http://www.fidelity.com, http://www.advisor.fidelity.com, or http://401k.com, as applicable.
NOT FDIC INSURED • MAY LOSE VALUE • NO BANK GUARANTEE
Neither the funds nor Fidelity Distributors Corporation is a bank.
Annual Report
VIP Investor Freedom Income PortfolioSM
Average annual total return reflects the change in the value of an investment, assuming reinvestment of the fund's distributions from dividend income and capital gains (the profits earned upon the sale of securities that have grown in value, if any) and assuming a constant rate of performance each year. During periods of reimbursement by Fidelity, a fund's total return will be greater than it would be had the reimbursement not occurred. Performance numbers are net of all underlying fund operating expenses, but do not include any insurance charges imposed by your insurance company's separate account. If performance information included the effect of these additional charges, the total returns would have been lower. How a fund did yesterday is no guarantee of how it will do tomorrow.
Average Annual Total Returns
Periods ended December 31, 2013 | Past 1
year | Past 5
years | Life of
fund A |
VIP Investor Freedom Income PortfolioSM | 5.43% | 7.09% | 4.49% |
A From August 3, 2005.
$10,000 Over Life of Fund
Let's say hypothetically that $10,000 was invested in VIP Investor Freedom Income Portfolio on August 3, 2005, when the fund started. The chart shows how the value of your investment would have changed, and also shows how the Barclays® U.S. Aggregate Bond Index performed over the same period.
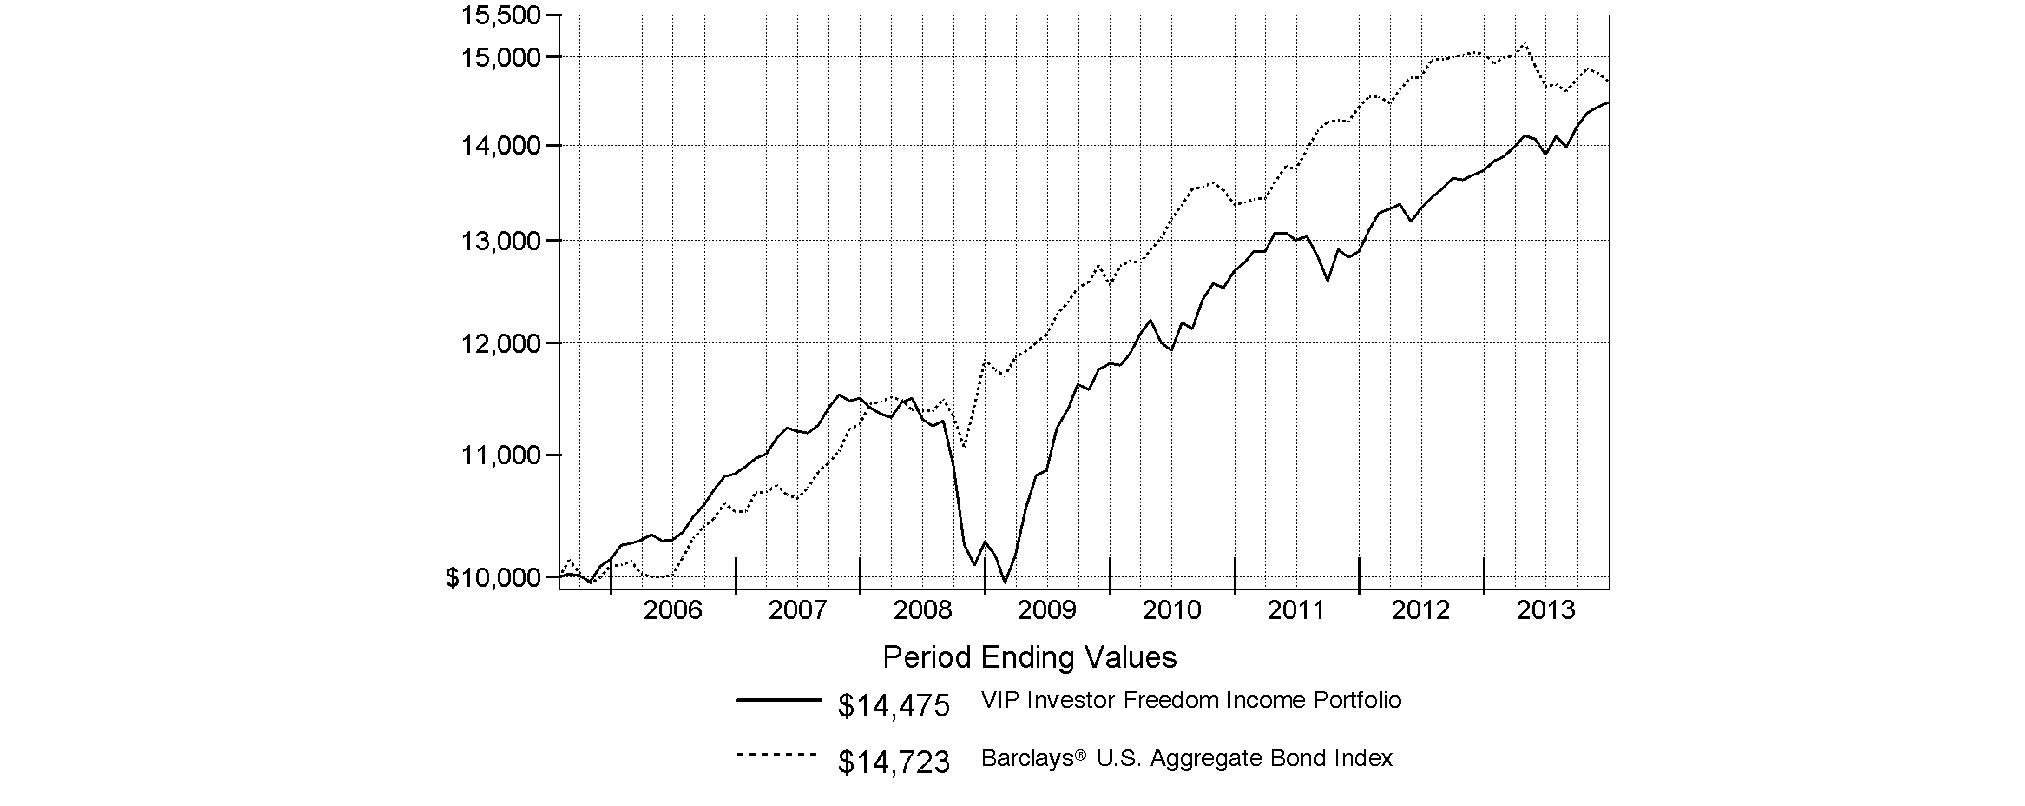
Annual Report
VIP Investor Freedom 2005 PortfolioSM
Performance: The Bottom Line
Average annual total return reflects the change in the value of an investment, assuming reinvestment of the fund's distributions from dividend income and capital gains (the profits earned upon the sale of securities that have grown in value, if any) and assuming a constant rate of performance each year. During periods of reimbursement by Fidelity, a fund's total return will be greater than it would be had the reimbursement not occurred. Performance numbers are net of all underlying fund operating expenses, but do not include any insurance charges imposed by your insurance company's separate account. If performance information included the effect of these additional charges, the total returns would have been lower. How a fund did yesterday is no guarantee of how it will do tomorrow.
Average Annual Total Returns
Periods ended December 31, 2013 | Past 1
year | Past 5
years | Life of
fund A |
VIP Investor Freedom 2005 PortfolioSM | 9.73% | 10.46% | 5.15% |
A From August 3, 2005.
$10,000 Over Life of Fund
Let's say hypothetically that $10,000 was invested in VIP Investor Freedom 2005 Portfolio on August 3, 2005, when the fund started. The chart shows how the value of your investment would have changed, and also shows how the Barclays U.S. Aggregate Bond Index performed over the same period.
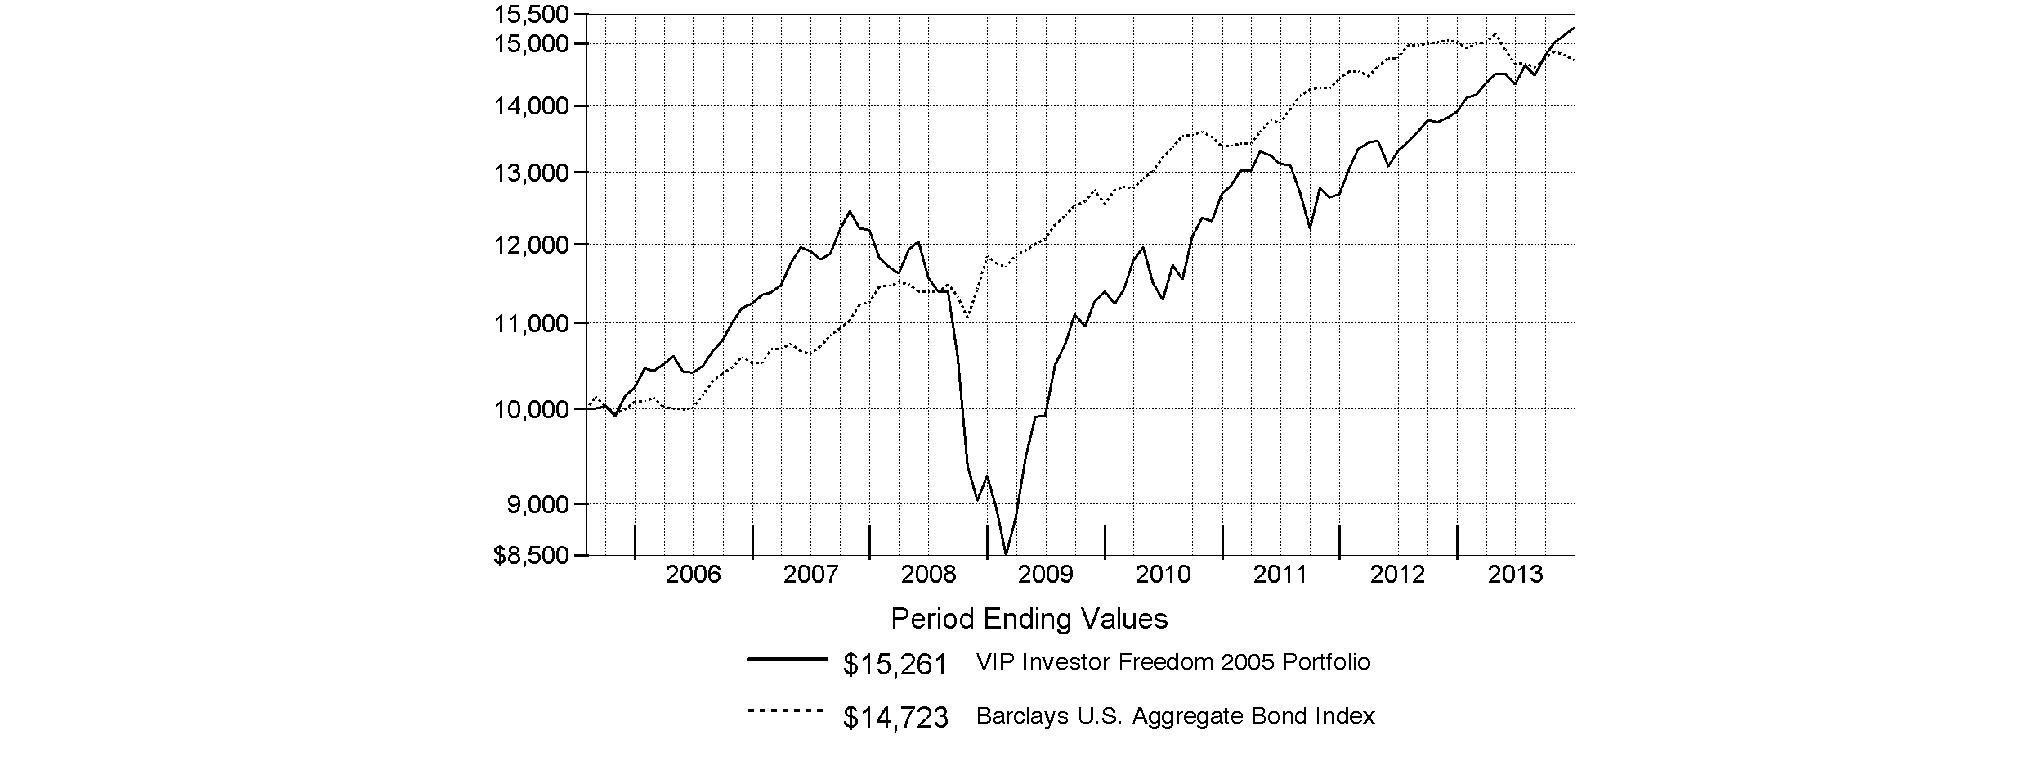
Annual Report
VIP Investor Freedom 2010 PortfolioSM
Performance: The Bottom Line
Average annual total return reflects the change in the value of an investment, assuming reinvestment of the fund's distributions from dividend income and capital gains (the profits earned upon the sale of securities that have grown in value, if any) and assuming a constant rate of performance each year. During periods of reimbursement by Fidelity, a fund's total return will be greater than it would be had the reimbursement not occurred. Performance numbers are net of all underlying fund operating expenses, but do not include any insurance charges imposed by your insurance company's separate account. If performance information included the effect of these additional charges, the total returns would have been lower. How a fund did yesterday is no guarantee of how it will do tomorrow.
Average Annual Total Returns
Periods ended December 31, 2013 | Past 1
year | Past 5
years | Life of
fund A |
VIP Investor Freedom 2010 PortfolioSM | 13.41% | 12.10% | 5.90% |
A From August 3, 2005.
$10,000 Over Life of Fund
Let's say hypothetically that $10,000 was invested in VIP Investor Freedom 2010 Portfolio on August 3, 2005, when the fund started. The chart shows how the value of your investment would have changed, and also shows how the Barclays U.S. Aggregate Bond Index performed over the same period.
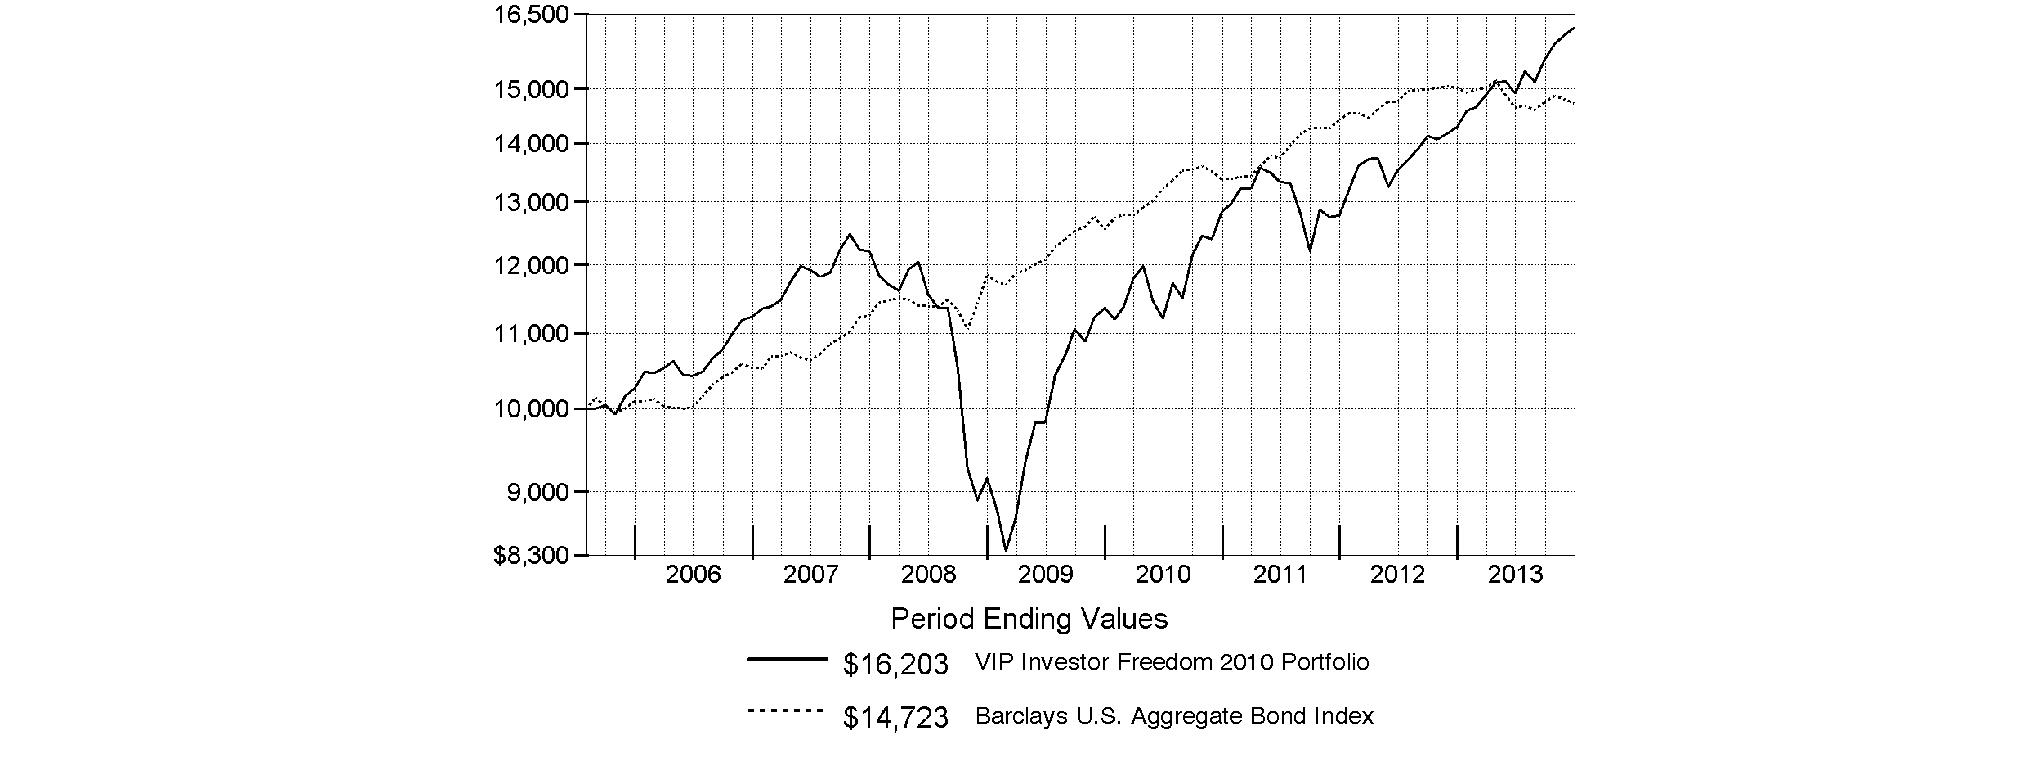
Annual Report
VIP Investor Freedom 2015 PortfolioSM
Performance: The Bottom Line
Average annual total return reflects the change in the value of an investment, assuming reinvestment of the fund's distributions from dividend income and capital gains (the profits earned upon the sale of securities that have grown in value, if any) and assuming a constant rate of performance each year. During periods of reimbursement by Fidelity, a fund's total return will be greater than it would be had the reimbursement not occurred. Performance numbers are net of all underlying fund operating expenses, but do not include any insurance charges imposed by your insurance company's separate account. If performance information included the effect of these additional charges, the total returns would have been lower. How a fund did yesterday is no guarantee of how it will do tomorrow.
Average Annual Total Returns
Periods ended December 31, 2013 | Past 1
year | Past 5
years | Life of
fund A |
VIP Investor Freedom 2015 PortfolioSM | 14.35% | 12.59% | 6.12% |
A From August 3, 2005.
$10,000 Over Life of Fund
Let's say hypothetically that $10,000 was invested in VIP Investor Freedom 2015 Portfolio on August 3, 2005, when the fund started. The chart shows how the value of your investment would have changed, and also shows how the S&P 500® Index performed over the same period.
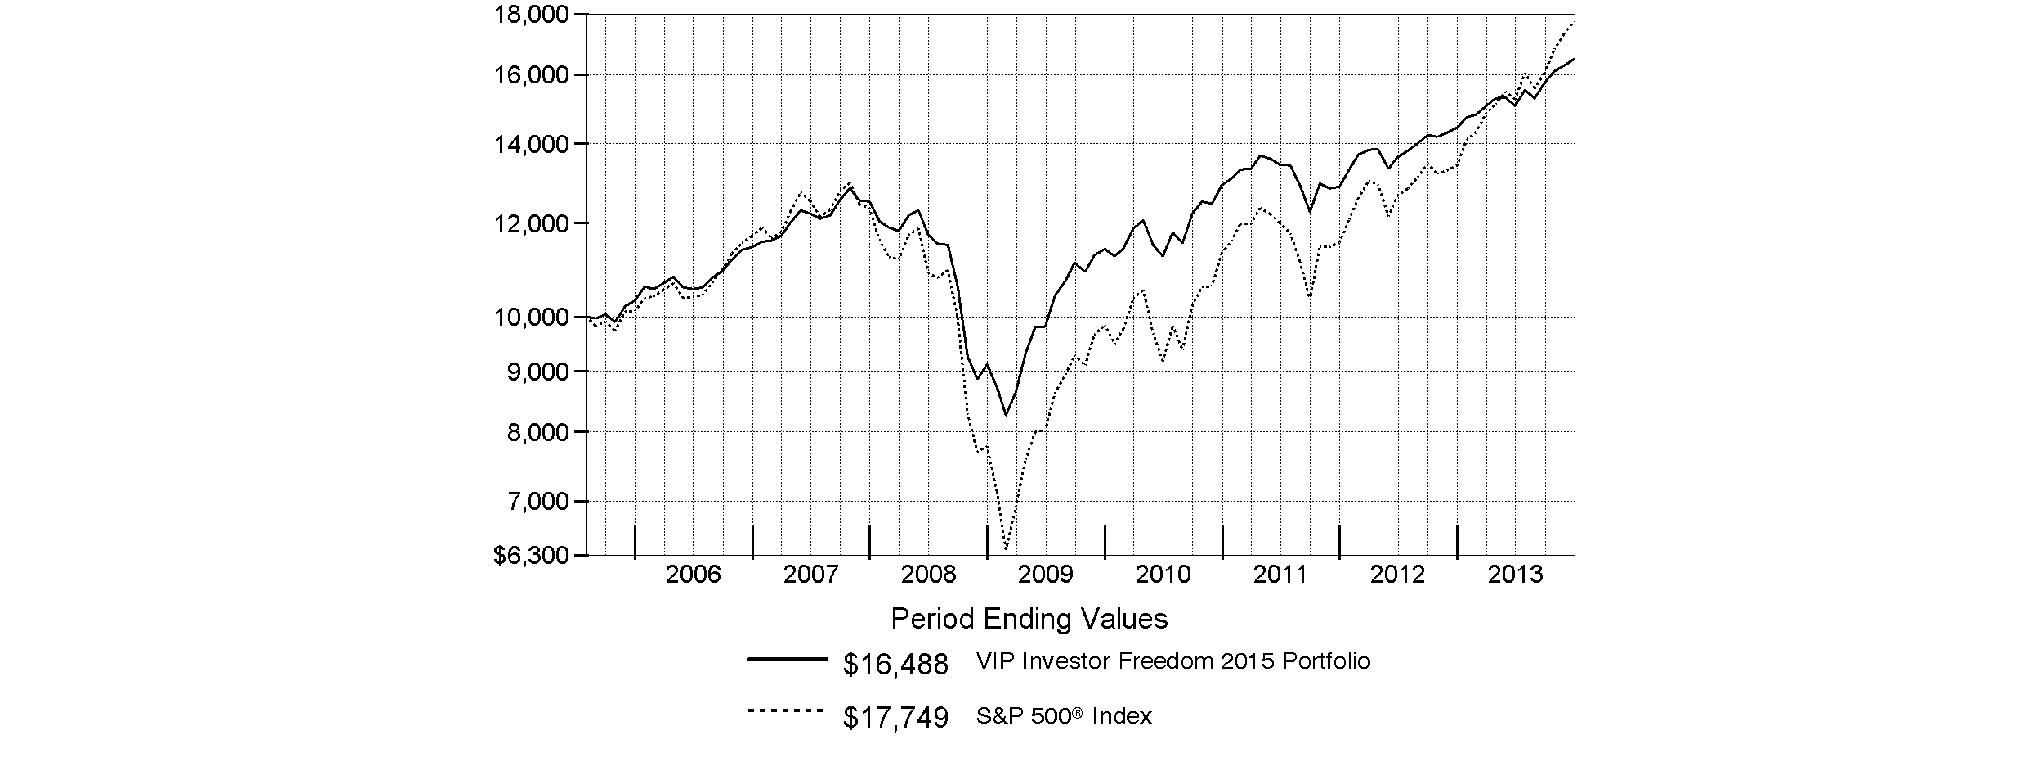
Annual Report
VIP Investor Freedom 2020 PortfolioSM
Performance: The Bottom Line
Average annual total return reflects the change in the value of an investment, assuming reinvestment of the fund's distributions from dividend income and capital gains (the profits earned upon the sale of securities that have grown in value, if any) and assuming a constant rate of performance each year. During periods of reimbursement by Fidelity, a fund's total return will be greater than it would be had the reimbursement not occurred. Performance numbers are net of all underlying fund operating expenses, but do not include any insurance charges imposed by your insurance company's separate account. If performance information included the effect of these additional charges, the total returns would have been lower. How a fund did yesterday is no guarantee of how it will do tomorrow.
Average Annual Total Returns
Periods ended December 31, 2013 | Past 1
year | Past 5
years | Life of
fund A |
VIP Investor Freedom 2020 PortfolioSM | 15.96% | 13.87% | 6.11% |
A From August 3, 2005.
$10,000 Over Life of Fund
Let's say hypothetically that $10,000 was invested in VIP Investor Freedom 2020 Portfolio on August 3, 2005, when the fund started. The chart shows how the value of your investment would have changed, and also shows how the S&P 500 Index performed over the same period.
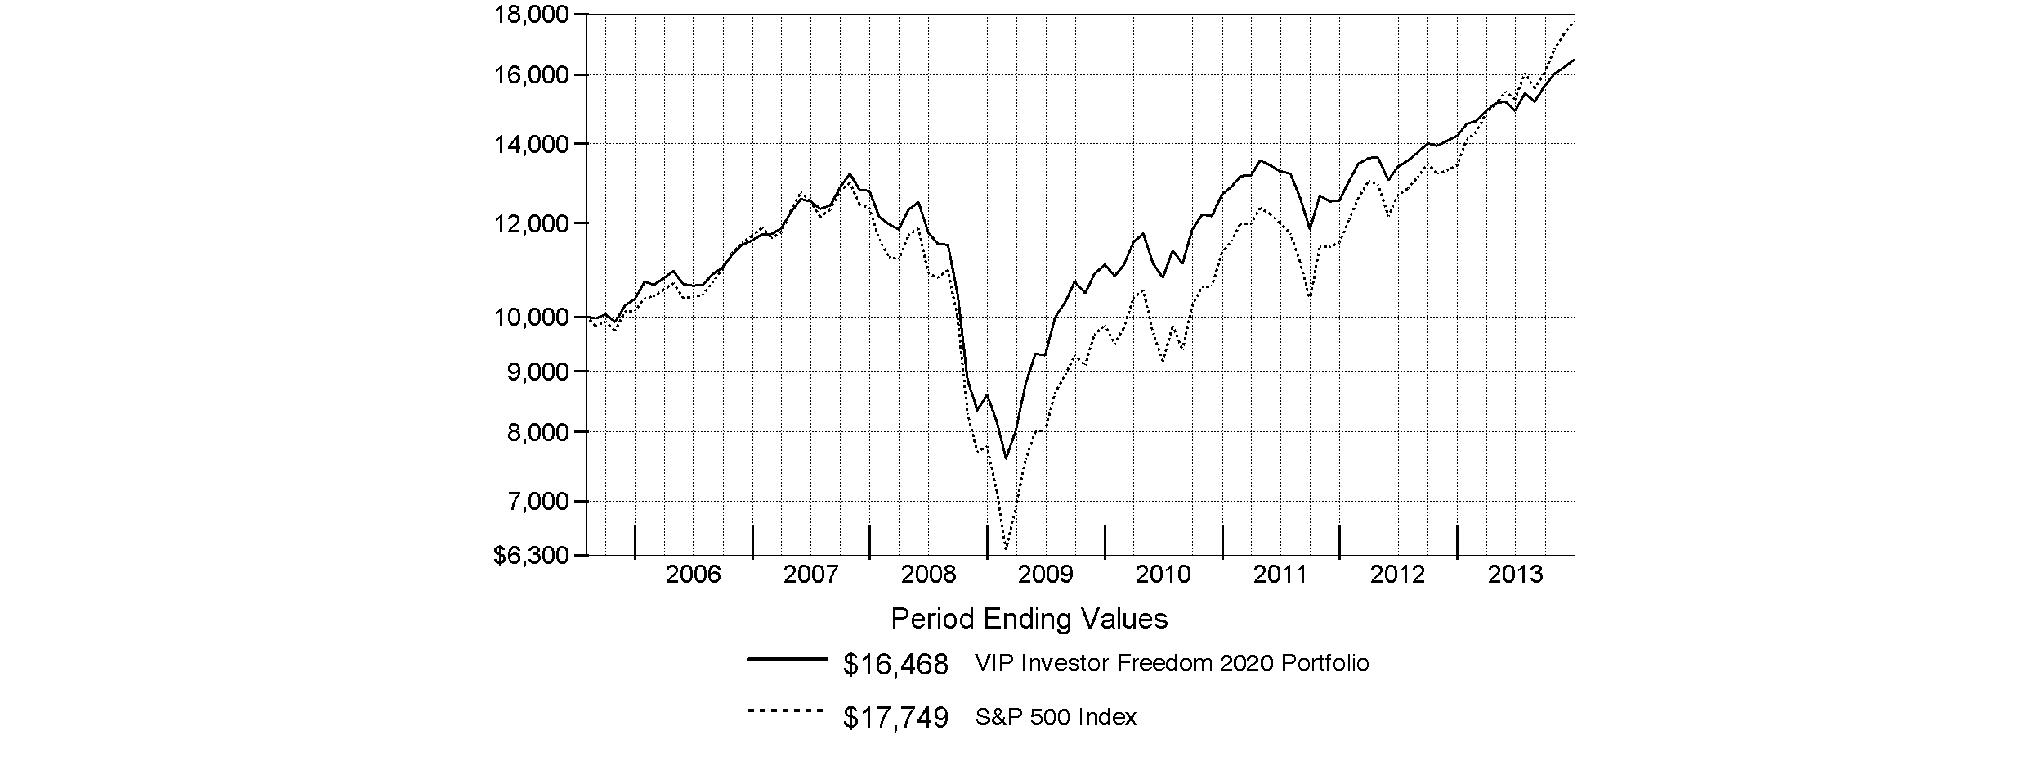
Annual Report
VIP Investor Freedom 2025 PortfolioSM
Performance: The Bottom Line
Average annual total return reflects the change in the value of an investment, assuming reinvestment of the fund's distributions from dividend income and capital gains (the profits earned upon the sale of securities that have grown in value, if any) and assuming a constant rate of performance each year. During periods of reimbursement by Fidelity, a fund's total return will be greater than it would be had the reimbursement not occurred. Performance numbers are net of all underlying fund operating expenses, but do not include any insurance charges imposed by your insurance company's separate account. If performance information included the effect of these additional charges, the total returns would have been lower. How a fund did yesterday is no guarantee of how it will do tomorrow.
Average Annual Total Returns
Periods ended December 31, 2013 | Past 1
year | Past 5
years | Life of
fund A |
VIP Investor Freedom 2025 PortfolioSM | 19.95% | 15.21% | 6.65% |
A From August 3, 2005.
$10,000 Over Life of Fund
Let's say hypothetically that $10,000 was invested in VIP Investor Freedom 2025 Portfolio on August 3, 2005, when the fund started. The chart shows how the value of your investment would have changed, and also shows how the S&P 500 Index performed over the same period.
Annual Report
VIP Investor Freedom 2030 PortfolioSM
Performance: The Bottom Line
Average annual total return reflects the change in the value of an investment, assuming reinvestment of the fund's distributions from dividend income and capital gains (the profits earned upon the sale of securities that have grown in value, if any) and assuming a constant rate of performance each year. During periods of reimbursement by Fidelity, a fund's total return will be greater than it would be had the reimbursement not occurred. Performance numbers are net of all underlying fund operating expenses, but do not include any insurance charges imposed by your insurance company's separate account. If performance information included the effect of these additional charges, the total returns would have been lower. How a fund did yesterday is no guarantee of how it will do tomorrow.
Average Annual Total Returns
Periods ended December 31, 2013 | Past 1
year | Past 5
years | Life of
fund A |
VIP Investor Freedom 2030 PortfolioSM | 21.72% | 15.87% | 6.47% |
A From August 3, 2005.
$10,000 Over Life of Fund
Let's say hypothetically that $10,000 was invested in VIP Investor Freedom 2030 Portfolio on August 3, 2005, when the fund started. The chart shows how the value of your investment would have changed, and also shows how the S&P 500 Index performed over the same period.
Annual Report
Market Recap: Global equity markets remained upbeat for the 12 months ending December 31, 2013, propelling the MSCI® ACWI® (All Country World Index) Index to a 23.24% return. Midyear turbulence gave way by autumn when policymakers in the U.S. and China had made clear their intentions to maintain accommodative monetary policies. That stance, combined with modest cyclical improvement around the globe and generally low valuations, underpinned the broad rally in equities, although the relative strength of the U.S. dollar generally tempered gains for U.S. investors holding foreign securities based in local currencies. During the period, the broad-market S&P 500® Index set a series of new highs, finishing the year up 32.39%. For the first time since 1995, the S&P® scored a "perfect 10," with all 10 economic sectors gaining at least 10% for the year. A resurgence in growth-oriented stocks lifted the Nasdaq Composite Index® to a 40.12% result for 2013, while the blue-chip Dow Jones Industrial AverageSM notched a relatively more modest 29.65% gain. International developed-markets equities rose in concert with their U.S. counterparts, with the MSCI® EAFE® Index gaining 22.92% for the period. Meanwhile, foreign exchange and commodity weakness curbed results in resource-heavy emerging markets (EM), especially in the year's waning months. More generally, concern over EM's slowing growth, its declining share of global trade and uncertainty surrounding U.S. central bank intentions were all factors hampering performance. The MSCI Emerging Markets Index returned -2.27% for the period. On the bond side, U.S. high-yield securities rallied with equities for much of the period, with The BofA Merrill LynchSM US High Yield Constrained Index returning 7.41% for 2013. The more rate-sensitive U.S. investment-grade bond category faced headwinds though, as reflected in the -2.02% return of the Barclays® U.S. Aggregate Bond Index. Within the Barclays index, investment-grade corporate credit returned -2.01%, while ultra-safe U.S. Treasuries saw a -2.75% result. Major non-U.S. developed markets performed only slightly better, with the Citigroup® Non-USD Group-of-Seven (G7) Equal Weighted Index logging a -1.59% result. After several years of strong advances, EM debt reversed course in 2013, with the J.P. Morgan Emerging Markets Bond Index Global returning -6.58%.
Comments from Andrew Dierdorf and Christopher Sharpe, Co-Managers of VIP Investor Freedom Funds: Each VIP Investor Freedom Fund posted a positive return for the 12 months ending December 31, 2013. (For specific portfolio results, please refer to the performance section of this report.) The longer-dated Funds, designed for investors who have the longest time horizon until retirement, delivered the highest absolute returns. This is consistent with what we would anticipate, given that these Funds have greater exposure to underlying equity funds, which performed very well in 2013. On a relative basis - meaning how the Funds performed versus their respective Composite indexes - each Fund outperformed, thanks in part to the Funds' allocation to non-U.S. equities and bonds. Looking at the Funds' equity asset allocation, non-U.S. stocks provided the greatest boost on a relative basis. The MSCI® EAFE® Index, benchmark for the Funds' non-U.S. equity holdings, rose 22.92%. The Funds' core holding in this investment area - VIP Overseas Portfolio - outpaced the MSCI index, mainly on strong security selection within developed countries that fared better as they recovered from the region's financial and economic crises. In the U.S., despite strong absolute results, the Funds did not match the 33.47% result for The Dow Jones U.S. Total Stock Market IndexSM, a yardstick for the Funds' U.S.-equity exposure. Even though the Funds received a boost from the strong relative performance of their largest U.S. equity holding, VIP Growth & Income Portfolio, that positive performance could not overcome relative weakness from some other holdings, in particular two of the Funds' larger investments - VIP Contrafund Portfolio and VIP Equity-Income Portfolio - which lagged the Dow Jones index. Turning to the fixed-income arena, investment-grade bonds declined during the 12-month period, as concern about downside risk amid the prospect of higher interest rates weighed on sentiment. Investors sought higher yields and leaned more toward equity securities and higher-yielding bonds. In terms of the Funds' underlying investments, in aggregate they bettered the -2.02% return of the Barclays® U.S. Aggregate Bond Index, the benchmark for the Funds' fixed-income sleeve. Here, the allocation to VIP Investment Grade Bond Portfolio outpaced the Barclays index, helping the Funds' relative showing. VIP High Income Portfolio, with its nearly 6% return, also added to relative performance.
Note to shareholders: In recent months, Fidelity has made several changes to the target-date funds, including the VIP Investor Freedom Funds. The enhancements are primarily focused on enhancing the glide path, or the strategic asset allocation of equities, bonds and cash over time. Across most of the Funds, Fidelity is modifying the glide path to increase equity allocations, with a proportional decrease in other asset classes, most notably short-term debt. The changes are based on Fidelity's dedicated research, analysis of investor behavior and the ongoing evaluation of the Funds' investment structure that aims to improve outcomes for investors. Additionally, on or about January 1, 2014, in line with the changes to the Funds' lineup of underlying funds over the past several years, the non-U.S. equity component of the Funds' Composite indexes changed from the MSCI® EAFE® index to the MSCI® ACWI® (All Country World Index) ex USA Index, which extends exposure to emerging markets. We believe the broader representation of the non-U.S. equity stocks available through the MSCI® ACWI® serves as a more accurate comparison for the Funds' performance. Lastly, on January 21, 2014, Brett Sumsion will become a Co-Manager of the Funds. Brett will replace Chris Sharpe following a transition period that will be completed on or around March 31, 2014.
The views expressed above reflect those of the portfolio manager(s) only through the end of the period as stated on the cover of this report and do not necessarily represent the views of Fidelity or any other person in the Fidelity organization. Any such views are subject to change at any time based upon market or other conditions and Fidelity disclaims any responsibility to update such views. These views may not be relied on as investment advice and, because investment decisions for a Fidelity fund are based on numerous factors, may not be relied on as an indication of trading intent on behalf of any Fidelity fund.
Annual Report
As a shareholder of a Fund, you incur two types of costs: (1) transaction costs, and (2) ongoing costs, including other Fund expenses. This Example is intended to help you understand your ongoing costs (in dollars) of investing in the Funds and to compare these costs with the ongoing costs of investing in other mutual funds.
The Example is based on an investment of $1,000 invested at the beginning of the period and held for the entire period (July 1, 2013 to December 31, 2013).
Actual Expenses
The first line of the accompanying table for each fund provides information about actual account values and actual expenses. You may use the information in this line, together with the amount you invested, to estimate the expenses that you paid over the period. Simply divide your account value by $1,000.00 (for example, an $8,600 account value divided by $1,000.00 = 8.6), then multiply the result by the number in the first line for a fund under the heading entitled "Expenses Paid During Period" to estimate the expenses you paid on your account during this period. The estimate of expenses does not include any fees or other expenses of any variable annuity or variable life insurance product. If they were, the estimate of expenses you paid during the period would be higher, and your ending account value would be lower. In addition, each Fund, as a shareholder in underlying Fidelity Funds, will indirectly bear its pro-rata share of the fees and expenses incurred by the underlying Fidelity Funds. These fees and expenses are not included in each Fund's annualized expense ratio used to calculate the expense estimates in the table below.
Hypothetical Example for Comparison Purposes
The second line of the accompanying table for each fund provides information about hypothetical account values and hypothetical expenses based on a fund's actual expense ratio and an assumed rate of return of 5% per year before expenses, which is not the Fund's actual return. The hypothetical account values and expenses may not be used to estimate the actual ending account balance or expenses you paid for the period. You may use this information to compare the ongoing costs of investing in the Fund and other funds. To do so, compare this 5% hypothetical example with the 5% hypothetical examples that appear in the shareholder reports of the other funds. The estimate of expenses does not include any fees or other expenses of any variable annuity or variable life insurance product. If they were, the estimate of expenses you paid during the period would be higher, and your ending account value would be lower. In addition, each Fund, as a shareholder in underlying Fidelity Funds, will indirectly bear its pro-rata share of the fees and expenses incurred by the underlying Fidelity Funds. These fees and expenses are not included in each Fund's annualized expense ratio used to calculate the expense estimates in the table below.
Please note that the expenses shown in the table are meant to highlight your ongoing costs only and do not reflect any transaction costs. Therefore, the second line of the table is useful in comparing ongoing costs only, and will not help you determine the relative total costs of owning different funds.
| Annualized
Expense Ratio B | Beginning
Account Value
July 1, 2013 | Ending
Account Value
December 31, 2013 | Expenses Paid
During Period*
July 1, 2013
to December 31, 2013 |
VIP Investor Freedom Income | .00% | | | |
Actual | | $ 1,000.00 | $ 1,041.40 | $ .00 |
Hypothetical A | | $ 1,000.00 | $ 1,025.21 | $ .00 |
VIP Investor Freedom 2005 | .00% | | | |
Actual | | $ 1,000.00 | $ 1,065.30 | $ .00 |
Hypothetical A | | $ 1,000.00 | $ 1,025.21 | $ .00 |
VIP Investor Freedom 2010 | .00% | | | |
Actual | | $ 1,000.00 | $ 1,086.70 | $ .00 |
Hypothetical A | | $ 1,000.00 | $ 1,025.21 | $ .00 |
VIP Investor Freedom 2015 | .00% | | | |
Actual | | $ 1,000.00 | $ 1,094.60 | $ .00 |
Hypothetical A | | $ 1,000.00 | $ 1,025.21 | $ .00 |
VIP Investor Freedom 2020 | .00% | | | |
Actual | | $ 1,000.00 | $ 1,103.20 | $ .00 |
Hypothetical A | | $ 1,000.00 | $ 1,025.21 | $ .00 |
VIP Investor Freedom 2025 | .00% | | | |
Actual | | $ 1,000.00 | $ 1,124.70 | $ .00 |
Hypothetical A | | $ 1,000.00 | $ 1,025.21 | $ .00 |
VIP Investor Freedom 2030 | .00% | | | |
Actual | | $ 1,000.00 | $ 1,136.80 | $ .00 |
Hypothetical A | | $ 1,000.00 | $ 1,025.21 | $ .00 |
A 5% return per year before expenses
B Annualized expense ratio reflects expenses net of applicable fee waivers.
* Expenses are equal to each Fund's annualized expense ratio, multiplied by the average account value over the period, multiplied by 184/365 (to reflect the one-half year period). The fees and expenses of the underlying Fidelity Funds in which each Fund invests are not included in each Fund's annualized expense ratio.
Annual Report
VIP Investor Freedom Income Portfolio
Investment Changes (Unaudited)
The information in the following tables is based on the direct investments of the Fund. |
Fund Holdings as of December 31, 2013 |
| % of fund's
net assets | % of fund's net assets
6 months ago |
Domestic Equity Funds | | |
VIP Contrafund Portfolio Investor Class | 3.0 | 2.6 |
VIP Equity-Income Portfolio Investor Class | 3.1 | 2.8 |
VIP Growth & Income Portfolio Investor Class | 3.6 | 3.3 |
VIP Growth Portfolio Investor Class | 3.2 | 2.7 |
VIP Mid Cap Portfolio Investor Class | 0.9 | 0.8 |
VIP Value Portfolio Investor Class | 2.3 | 2.1 |
VIP Value Strategies Portfolio Investor Class | 1.1 | 1.0 |
| 17.2 | 15.3 |
Developed International Equity Funds | | |
VIP Overseas Portfolio Investor Class R | 5.9 | 4.4 |
Emerging Markets Equity Funds | | |
VIP Emerging Markets Portfolio Investor Class R | 1.5 | 1.2 |
High Yield Bond Funds | | |
VIP High Income Portfolio Investor Class | 6.0 | 5.0 |
Investment Grade Bond Funds | | |
VIP Investment Grade Bond Portfolio Investor Class | 39.7 | 34.2 |
Short-Term Funds | | |
VIP Money Market Portfolio Investor Class | 29.7 | 39.9 |
Net Other Assets (Liabilities)* | 0.0 | 0.0 |
| 100.0 | 100.0 |
* Amount represents less than 0.1%.
Asset Allocation (% of fund's net assets) |
Period end |
 | Domestic Equity Funds | 17.2% | |
 | Developed International Equity Funds | 5.9% | |
 | Emerging Markets Equity Funds | 1.5% | |
 | High Yield Bond Funds | 6.0% | |
 | Investment Grade Bond Funds | 39.7% | |
 | Short-Term Funds | 29.7% | |

Six months ago |
| Domestic Equity Funds | 15.3% | |
| Developed International Equity Funds | 4.4% | |
| Emerging Markets Equity Funds | 1.2% | |
| High Yield Bond Funds | 5.0% | |
| Investment Grade Bond Funds | 34.2% | |
| Short-Term Funds | 39.9% | |

Annual Report
VIP Investor Freedom Income Portfolio
Investments December 31, 2013
Showing Percentage of Net Assets
Domestic Equity Funds - 17.2% |
| Shares | | Value |
Domestic Equity Funds - 17.2% |
VIP Contrafund Portfolio Investor Class (b) | 53,434 | | $ 1,828,510 |
VIP Equity-Income Portfolio Investor Class (b) | 79,668 | | 1,849,086 |
VIP Growth & Income Portfolio Investor Class (b) | 112,668 | | 2,150,832 |
VIP Growth Portfolio Investor Class (b) | 33,450 | | 1,906,316 |
VIP Mid Cap Portfolio Investor Class (b) | 15,026 | | 544,698 |
VIP Value Portfolio Investor Class (b) | 91,614 | | 1,389,783 |
VIP Value Strategies Portfolio Investor Class (b) | 47,685 | | 682,371 |
TOTAL DOMESTIC EQUITY FUNDS (Cost $8,450,592) |
10,351,596
|
International Equity Funds - 7.4% |
| | | |
Developed International Equity Funds - 5.9% |
VIP Overseas Portfolio Investor Class R (b) | 171,925 | | 3,538,221 |
Emerging Markets Equity Funds - 1.5% |
VIP Emerging Markets Portfolio Investor Class R (b) | 102,844 | | 923,538 |
TOTAL INTERNATIONAL EQUITY FUNDS (Cost $3,622,504) |
4,461,759
|
Bond Funds - 45.7% |
| Shares | | Value |
High Yield Bond Funds - 6.0% |
VIP High Income Portfolio Investor Class (b) | 622,071 | | $ 3,595,571 |
Investment Grade Bond Funds - 39.7% |
VIP Investment Grade Bond Portfolio Investor Class (b) | 1,941,547 | | 23,919,858 |
TOTAL BOND FUNDS (Cost $28,289,515) |
27,515,429
|
Short-Term Funds - 29.7% |
| | | |
VIP Money Market Portfolio Investor Class 0.01% (a)(b)
(Cost $17,885,497) | 17,885,497 | |
17,885,497
|
TOTAL INVESTMENT PORTFOLIO - 100.0% (Cost $58,248,108) | | 60,214,281 |
NET OTHER ASSETS (LIABILITIES) - 0.0% | | (4) |
NET ASSETS - 100% | $ 60,214,277 |
Legend |
(a) The rate quoted is the annualized seven-day yield of the fund at period end. |
(b) Affiliated company |
Affiliated Underlying Funds |
Information regarding the Fund's fiscal year to date purchases and sales of the affiliated Underlying Funds and income earned by the Fund from investments in affiliated Underlying Funds is as follows: |
Affiliate | Value,
beginning of
period | Purchases | Sales
Proceeds | Dividend
Income | Value,
end of
period |
VIP Contrafund Portfolio Investor Class | $ 964,708 | $ 864,680 | $ 348,448 | $ 15,955 | $ 1,828,510 |
VIP Emerging Markets Portfolio Investor Class R | 505,646 | 523,019 | 128,924 | 5,584 | 923,538 |
VIP Equity-Income Portfolio Investor Class | 1,031,658 | 1,040,708 | 407,436 | 40,239 | 1,849,086 |
VIP Growth & Income Portfolio Investor Class | 1,166,272 | 1,051,454 | 486,272 | 34,047 | 2,150,832 |
VIP Growth Portfolio Investor Class | 956,886 | 870,267 | 343,851 | 3,569 | 1,906,316 |
VIP High Income Portfolio Investor Class | 1,956,835 | 2,186,934 | 513,928 | 185,909 | 3,595,571 |
VIP Investment Grade Bond Portfolio Investor Class | 13,531,998 | 15,041,794 | 3,592,086 | 525,904 | 23,919,858 |
VIP Mid Cap Portfolio Investor Class | 287,122 | 306,900 | 110,750 | 2,055 | 544,698 |
VIP Money Market Portfolio Investor Class | 15,345,950 | 11,678,234 | 9,138,688 | 3,333 | 17,885,497 |
VIP Overseas Portfolio Investor Class R | 1,651,330 | 1,863,512 | 564,310 | 38,302 | 3,538,221 |
VIP Value Portfolio Investor Class | 766,735 | 768,348 | 316,313 | 12,956 | 1,389,783 |
VIP Value Strategies Portfolio Investor Class | 380,185 | 323,537 | 151,096 | 5,099 | 682,371 |
Total | $ 38,545,325 | $ 36,519,387 | $ 16,102,102 | $ 872,952 | $ 60,214,281 |
Other Information |
All investments are categorized as Level 1 under the Fair Value Hierarchy. The inputs or methodology used for valuing securities may not be an indication of the risk associated with investing in those securities. For more information on valuation inputs, please refer to the Investment Valuation section in the accompanying Notes to Financial Statements. |
See accompanying notes which are an integral part of the financial statements.
Annual Report
VIP Investor Freedom Income Portfolio
Statement of Assets and Liabilities
| December 31, 2013 |
| | |
Assets | | |
Investment in securities, at value (cost $58,248,108) - See accompanying schedule | | $ 60,214,281 |
Receivable for fund shares sold | | 883,472 |
Total assets | | 61,097,753 |
| | |
Liabilities | | |
Payable for investments purchased | $ 883,449 | |
Payable for fund shares redeemed | 27 | |
Total liabilities | | 883,476 |
| | |
Net Assets | | $ 60,214,277 |
Net Assets consist of: | | |
Paid in capital | | $ 57,915,843 |
Accumulated undistributed net realized gain (loss) on investments | | 332,261 |
Net unrealized appreciation (depreciation) on investments | | 1,966,173 |
Net Assets, for 5,487,519 shares outstanding | | $ 60,214,277 |
Net Asset Value, offering price and redemption price per share ($60,214,277 ÷ 5,487,519 shares) | | $ 10.97 |
Statement of Operations
| Year ended December 31, 2013 |
| | |
Investment Income | | |
Income distributions from underlying funds | | $ 872,952 |
| | |
Expenses | | |
Independent trustees' compensation | $ 180 | |
Total expenses before reductions | 180 | |
Expense reductions | (180) | 0 |
Net investment income (loss) | | 872,952 |
Realized and Unrealized Gain (Loss) Realized gain (loss) on sale of underlying fund shares | 51,148 | |
Capital gain distributions from underlying funds | 555,452 | |
Total net realized gain (loss) | | 606,600 |
Change in net unrealized appreciation (depreciation) on underlying funds | | 1,200,525 |
Net gain (loss) | | 1,807,125 |
Net increase (decrease) in net assets resulting from operations | | $ 2,680,077 |
See accompanying notes which are an integral part of the financial statements.
Annual Report
VIP Investor Freedom Income Portfolio
Financial Statements - continued
Statement of Changes in Net Assets
| Year ended
December 31, 2013 | Year ended
December 31, 2012 |
Increase (Decrease) in Net Assets | | |
Operations | | |
Net investment income (loss) | $ 872,952 | $ 557,767 |
Net realized gain (loss) | 606,600 | 522,606 |
Change in net unrealized appreciation (depreciation) | 1,200,525 | 1,043,173 |
Net increase (decrease) in net assets resulting from operations | 2,680,077 | 2,123,546 |
Distributions to shareholders from net investment income | (877,001) | (555,168) |
Distributions to shareholders from net realized gain | (356,491) | (535,234) |
Total distributions | (1,233,492) | (1,090,402) |
Share transactions
Proceeds from sales of shares | 29,468,306 | 9,342,074 |
Reinvestment of distributions | 1,233,491 | 1,090,402 |
Cost of shares redeemed | (10,479,431) | (3,467,708) |
Net increase (decrease) in net assets resulting from share transactions | 20,222,366 | 6,964,768 |
Total increase (decrease) in net assets | 21,668,951 | 7,997,912 |
| | |
Net Assets | | |
Beginning of period | 38,545,326 | 30,547,414 |
End of period (including undistributed net investment income of $0 and undistributed net investment income of $2,112, respectively) | $ 60,214,277 | $ 38,545,326 |
Other Information Shares | | |
Sold | 2,716,873 | 879,805 |
Issued in reinvestment of distributions | 113,049 | 103,001 |
Redeemed | (962,614) | (327,632) |
Net increase (decrease) | 1,867,308 | 655,174 |
Financial Highlights
Years ended December 31, | 2013 | 2012 | 2011 | 2010 | 2009 |
Selected Per-Share Data | | | | | |
Net asset value, beginning of period | $ 10.65 | $ 10.30 | $ 10.40 | $ 9.95 | $ 9.10 |
Income from Investment Operations | | | | | |
Net investment income (loss) C | .19 | .17 | .18 | .21 | .40 |
Net realized and unrealized gain (loss) | .39 | .50 | (.02) | .54 | .94 |
Total from investment operations | .58 | .67 | .16 | .75 | 1.34 |
Distributions from net investment income | (.17) | (.16) | (.19) | (.20) | (.33) |
Distributions from net realized gain | (.09) | (.16) | (.07) | (.10) | (.16) |
Total distributions | (.26) | (.32) | (.26) | (.30) | (.49) |
Net asset value, end of period | $ 10.97 | $ 10.65 | $ 10.30 | $ 10.40 | $ 9.95 |
Total Return A, B | 5.43% | 6.54% | 1.54% | 7.50% | 14.85% |
Ratios to Average Net Assets D, F | | | | | |
Expenses before reductions E | .00% | .00% | .00% | .00% | .00% |
Expenses net of fee waivers, if any | .00% | .00% | .00% | .00% | .00% |
Expenses net of all reductions | .00% | .00% | .00% | .00% | .00% |
Net investment income (loss) | 1.77% | 1.63% | 1.74% | 2.00% | 4.12% |
Supplemental Data | | | | | |
Net assets, end of period (000 omitted) | $ 60,214 | $ 38,545 | $ 30,547 | $ 32,467 | $ 25,374 |
Portfolio turnover rate D | 33% | 15% | 28% | 24% | 30% |
A Total returns do not reflect charges attributable to your insurance company's separate account. Inclusion of these charges would reduce the total returns shown.
B Total returns would have been lower if certain expenses had not been reduced during the applicable periods shown.
C Calculated based on average shares outstanding during the period.
D Amounts do not include the activity of the Underlying Funds.
E Amount represents less than .01%.
F Expense ratios reflect operating expenses of the Fund. Expenses before reductions do not reflect amounts reimbursed by the investment adviser or reductions from expense offset arrangements and do not represent the amount paid by the Fund during periods when reimbursements or reductions occur. Expenses net of fee waivers reflect expenses after reimbursement by the investment adviser but prior to reductions from expense offset arrangements. Expenses net of all reductions represent the net expenses paid by the Fund but do not include expenses of the investment companies in which the Fund invests.
See accompanying notes which are an integral part of the financial statements.
Annual Report
VIP Investor Freedom 2005 Portfolio
Investment Changes (Unaudited)
The information in the following tables is based on the direct investments of the Fund. |
Fund Holdings as of December 31, 2013 |
| % of fund's
net assets | % of fund's net assets
6 months ago |
Domestic Equity Funds | | |
VIP Contrafund Portfolio Investor Class | 4.8 | 4.4 |
VIP Equity-Income Portfolio Investor Class | 4.9 | 4.7 |
VIP Growth & Income Portfolio Investor Class | 5.7 | 5.4 |
VIP Growth Portfolio Investor Class | 5.0 | 4.5 |
VIP Mid Cap Portfolio Investor Class | 1.5 | 1.3 |
VIP Value Portfolio Investor Class | 3.7 | 3.5 |
VIP Value Strategies Portfolio Investor Class | 1.8 | 1.7 |
| 27.4 | 25.5 |
Developed International Equity Funds | | |
VIP Overseas Portfolio Investor Class R | 9.4 | 7.1 |
Emerging Markets Equity Funds | | |
VIP Emerging Markets Portfolio Investor Class R | 2.4 | 2.0 |
High Yield Bond Funds | | |
VIP High Income Portfolio Investor Class | 6.2 | 4.9 |
Investment Grade Bond Funds | | |
VIP Investment Grade Bond Portfolio Investor Class | 34.2 | 28.8 |
Short-Term Funds | | |
VIP Money Market Portfolio Investor Class | 20.4 | 31.7 |
Net Other Assets (Liabilities)* | 0.0 | 0.0 |
| 100.0 | 100.0 |
* Amount represents less than 0.1%
Asset Allocation (% of fund's net assets) |
Period end |
| Domestic Equity Funds | 27.4% | |
| Developed International Equity Funds | 9.4% | |
| Emerging Markets Equity Funds | 2.4% | |
| High Yield Bond Funds | 6.2% | |
| Investment Grade Bond Funds | 34.2% | |
| Short-Term Funds | 20.4% | |

Six months ago |
| Domestic Equity Funds | 25.5% | |
| Developed International Equity Funds | 7.1% | |
| Emerging Markets Equity Funds | 2.0% | |
| High Yield Bond Funds | 4.9% | |
| Investment Grade Bond Funds | 28.8% | |
| Short-Term Funds | 31.7% | |

Annual Report
VIP Investor Freedom 2005 Portfolio
Investments December 31, 2013
Showing Percentage of Net Assets
Domestic Equity Funds - 27.4% |
| Shares | | Value |
Domestic Equity Funds - 27.4% |
VIP Contrafund Portfolio Investor Class (b) | 26,645 | | $ 911,805 |
VIP Equity-Income Portfolio Investor Class (b) | 39,731 | | 922,167 |
VIP Growth & Income Portfolio Investor Class (b) | 56,295 | | 1,074,680 |
VIP Growth Portfolio Investor Class (b) | 16,713 | | 952,455 |
VIP Mid Cap Portfolio Investor Class (b) | 7,664 | | 277,826 |
VIP Value Portfolio Investor Class (b) | 45,694 | | 693,182 |
VIP Value Strategies Portfolio Investor Class (b) | 24,253 | | 347,060 |
TOTAL DOMESTIC EQUITY FUNDS (Cost $4,395,719) |
5,179,175
|
International Equity Funds - 11.8% |
| | | |
Developed International Equity Funds - 9.4% |
VIP Overseas Portfolio Investor Class R (b) | 86,504 | | 1,780,247 |
Emerging Markets Equity Funds - 2.4% |
VIP Emerging Markets Portfolio Investor Class R (b) | 50,595 | | 454,347 |
TOTAL INTERNATIONAL EQUITY FUNDS (Cost $2,075,549) |
2,234,594
|
Bond Funds - 40.4% |
| Shares | | Value |
High Yield Bond Funds - 6.2% |
VIP High Income Portfolio Investor Class (b) | 202,020 | | $ 1,167,676 |
Investment Grade Bond Funds - 34.2% |
VIP Investment Grade Bond Portfolio Investor Class (b) | 524,907 | | 6,466,853 |
TOTAL BOND FUNDS (Cost $7,866,742) |
7,634,529
|
Short-Term Funds - 20.4% |
| | | |
VIP Money Market Portfolio Investor Class 0.01% (a)(b)
(Cost $3,863,625) | 3,863,625 | |
3,863,625
|
TOTAL INVESTMENT PORTFOLIO - 100.0% (Cost $18,201,635) | | 18,911,923 |
NET OTHER ASSETS (LIABILITIES) - 0.0% | | (5) |
NET ASSETS - 100% | $ 18,911,918 |
Legend |
(a) The rate quoted is the annualized seven-day yield of the fund at period end. |
(b) Affiliated company |
Affiliated Underlying Funds |
Information regarding the Fund's fiscal year to date purchases and sales of the affiliated Underlying Funds and income earned by the Fund from investments in affiliated Underlying Funds is as follows: |
Affiliate | Value,
beginning of
period | Purchases | Sales
Proceeds | Dividend
Income | Value,
end of
period |
VIP Contrafund Portfolio Investor Class | $ 640,684 | $ 396,885 | $ 321,081 | $ 7,991 | $ 911,805 |
VIP Emerging Markets Portfolio Investor Class R | 330,563 | 239,639 | 127,159 | 2,805 | 454,347 |
VIP Equity-Income Portfolio Investor Class | 685,091 | 484,382 | 363,758 | 20,160 | 922,167 |
VIP Growth & Income Portfolio Investor Class | 774,492 | 483,608 | 424,228 | 17,116 | 1,074,680 |
VIP Growth Portfolio Investor Class | 635,742 | 399,802 | 319,782 | 1,791 | 952,455 |
VIP High Income Portfolio Investor Class | 715,350 | 711,865 | 249,607 | 58,286 | 1,167,676 |
VIP Investment Grade Bond Portfolio Investor Class | 4,182,215 | 4,036,303 | 1,452,312 | 138,895 | 6,466,853 |
VIP Mid Cap Portfolio Investor Class | 190,668 | 145,333 | 95,704 | 1,052 | 277,826 |
VIP Money Market Portfolio Investor Class | 4,100,622 | 3,102,450 | 3,339,447 | 887 | 3,863,625 |
VIP Overseas Portfolio Investor Class R | 1,079,514 | 859,424 | 483,168 | 19,697 | 1,780,247 |
VIP Value Portfolio Investor Class | 509,085 | 357,675 | 278,428 | 6,492 | 693,182 |
VIP Value Strategies Portfolio Investor Class | 252,427 | 149,185 | 128,194 | 2,607 | 347,060 |
Total | $ 14,096,453 | $ 11,366,551 | $ 7,582,868 | $ 277,779 | $ 18,911,923 |
Other Information |
All investments are categorized as Level 1 under the Fair Value Hierarchy. The inputs or methodology used for valuing securities may not be an indication of the risk associated with investing in those securities. For more information on valuation inputs, please refer to the Investment Valuation section in the accompanying Notes to Financial Statements. |
See accompanying notes which are an integral part of the financial statements.
Annual Report
VIP Investor Freedom 2005 Portfolio
Statement of Assets and Liabilities
| December 31, 2013 |
| | |
Assets | | |
Investment in securities, at value (cost $18,201,635) - See accompanying schedule | | $ 18,911,923 |
Receivable for investments sold | | 68,776 |
Total assets | | 18,980,699 |
| | |
Liabilities | | |
Payable to custodian bank | $ 3 | |
Payable for fund shares redeemed | 68,778 | |
Total liabilities | | 68,781 |
| | |
Net Assets | | $ 18,911,918 |
Net Assets consist of: | | |
Paid in capital | | $ 18,097,020 |
Accumulated undistributed net realized gain (loss) on investments | | 104,610 |
Net unrealized appreciation (depreciation) on investments | | 710,288 |
Net Assets, for 1,735,804 shares outstanding | | $ 18,911,918 |
Net Asset Value, offering price and redemption price per share ($18,911,918 ÷ 1,735,804 shares) | | $ 10.90 |
Statement of Operations
| Year ended December 31, 2013 |
| | |
Investment Income | | |
Income distributions from underlying funds | | $ 277,779 |
| | |
Expenses | | |
Independent trustees' compensation | $ 61 | |
Total expenses before reductions | 61 | |
Expense reductions | (61) | 0 |
Net investment income (loss) | | 277,779 |
Realized and Unrealized Gain (Loss) Realized gain (loss) on sale of underlying fund shares | 57,544 | |
Capital gain distributions from underlying funds | 215,076 | |
Total net realized gain (loss) | | 272,620 |
Change in net unrealized appreciation (depreciation) on underlying funds | | 974,243 |
Net gain (loss) | | 1,246,863 |
Net increase (decrease) in net assets resulting from operations | | $ 1,524,642 |
See accompanying notes which are an integral part of the financial statements.
Annual Report
VIP Investor Freedom 2005 Portfolio
Financial Statements - continued
Statement of Changes in Net Assets
| Year ended
December 31,
2013 | Year ended
December 31,
2012 |
Increase (Decrease) in Net Assets | | |
Operations | | |
Net investment income (loss) | $ 277,779 | $ 215,935 |
Net realized gain (loss) | 272,620 | 225,142 |
Change in net unrealized appreciation (depreciation) | 974,243 | 607,784 |
Net increase (decrease) in net assets resulting from operations | 1,524,642 | 1,048,861 |
Distributions to shareholders from net investment income | (280,823) | (214,681) |
Distributions to shareholders from net realized gain | (184,678) | (188,769) |
Total distributions | (465,501) | (403,450) |
Share transactions
Proceeds from sales of shares | 8,395,343 | 5,978,733 |
Reinvestment of distributions | 465,501 | 403,450 |
Cost of shares redeemed | (5,104,519) | (2,708,259) |
Net increase (decrease) in net assets resulting from share transactions | 3,756,325 | 3,673,924 |
Total increase (decrease) in net assets | 4,815,466 | 4,319,335 |
| | |
Net Assets | | |
Beginning of period | 14,096,452 | 9,777,117 |
End of period (including undistributed net investment income of $0 and undistributed net investment income of $707, respectively) | $ 18,911,918 | $ 14,096,452 |
Other Information Shares | | |
Sold | 788,377 | 594,527 |
Issued in reinvestment of distributions | 43,353 | 39,925 |
Redeemed | (478,541) | (270,293) |
Net increase (decrease) | 353,189 | 364,159 |
Financial Highlights
Years ended December 31, | 2013 | 2012 | 2011 | 2010 | 2009 |
Selected Per-Share Data | | | | | |
Net asset value, beginning of period | $ 10.20 | $ 9.60 | $ 9.85 | $ 9.21 | $ 7.91 |
Income from Investment Operations | | | | | |
Net investment income (loss) C | .18 | .19 | .17 | .18 | .35 |
Net realized and unrealized gain (loss) | .81 | .73 | (.17) | .87 | 1.41 |
Total from investment operations | .99 | .92 | - G | 1.05 | 1.76 |
Distributions from net investment income | (.17) | (.16) | (.19) | (.19) | (.33) |
Distributions from net realized gain | (.12) | (.16) | (.07) | (.22) | (.14) |
Total distributions | (.29) | (.32) | (.25) I | (.41) | (.46) H |
Net asset value, end of period | $ 10.90 | $ 10.20 | $ 9.60 | $ 9.85 | $ 9.21 |
Total Return A, B | 9.73% | 9.61% | .02% | 11.41% | 22.71% |
Ratios to Average Net Assets D, F | | | | | |
Expenses before reductions E | .00% | .00% | .00% | .00% | .00% |
Expenses net of fee waivers, if any | .00% | .00% | .00% | .00% | .00% |
Expenses net of all reductions | .00% | .00% | .00% | .00% | .00% |
Net investment income (loss) | 1.68% | 1.87% | 1.72% | 1.90% | 4.12% |
Supplemental Data | | | | | |
Net assets, end of period (000 omitted) | $ 18,912 | $ 14,096 | $ 9,777 | $ 10,438 | $ 9,398 |
Portfolio turnover rate D | 46% | 33% | 45% | 63% | 47% |
A Total returns do not reflect charges attributable to your insurance company's separate account. Inclusion of these charges would reduce the total returns shown.
B Total returns would have been lower if certain expenses had not been reduced during the applicable periods shown.
C Calculated based on average shares outstanding during the period.
D Amounts do not include the activity of the Underlying Funds.
E Amount represents less than .01%.
F Expense ratios reflect operating expenses of the Fund. Expenses before reductions do not reflect amounts reimbursed by the investment adviser or reductions from expense offset arrangements and do not represent the amount paid by the Fund during periods when reimbursements or reductions occur. Expenses net of fee waivers reflect expenses after reimbursement by the investment adviser but prior to reductions from expense offset arrangements. Expenses net of all reductions represent the net expenses paid by the Fund but do not include expenses of the investment companies in which the Fund invests.
G Amount represents less than $.01 per share.
H Total distributions of $.46 per share is comprised of distributions from net investment income of $.325 and distributions from net realized gain of $.135 per share.
I Total distributions of $.25 per share is comprised of distributions from net investment income of $.185 and distributions from net realized gain of $.067 per share.
See accompanying notes which are an integral part of the financial statements.
Annual Report
VIP Investor Freedom 2010 Portfolio
Investment Changes (Unaudited)
The information in the following tables is based on the direct investments of the Fund. |
Fund Holdings as of December 31, 2013 |
| % of fund's
net assets | % of fund's net assets
6 months ago |
Domestic Equity Funds | | |
VIP Contrafund Portfolio Investor Class | 5.9 | 6.2 |
VIP Equity-Income Portfolio Investor Class | 6.0 | 6.6 |
VIP Growth & Income Portfolio Investor Class | 7.0 | 7.6 |
VIP Growth Portfolio Investor Class | 6.2 | 6.3 |
VIP Mid Cap Portfolio Investor Class | 1.8 | 1.8 |
VIP Value Portfolio Investor Class | 4.5 | 4.9 |
VIP Value Strategies Portfolio Investor Class | 2.2 | 2.4 |
| 33.6 | 35.8 |
Developed International Equity Funds | | |
VIP Overseas Portfolio Investor Class R | 11.6 | 9.9 |
Emerging Markets Equity Funds | | |
VIP Emerging Markets Portfolio Investor Class R | 2.9 | 2.8 |
High Yield Bond Funds | | |
VIP High Income Portfolio Investor Class | 6.3 | 5.0 |
Investment Grade Bond Funds | | |
VIP Investment Grade Bond Portfolio Investor Class | 30.4 | 33.3 |
Short-Term Funds | | |
VIP Money Market Portfolio Investor Class | 15.2 | 13.2 |
Net Other Assets (Liabilities)* | 0.0 | 0.0 |
| 100.0 | 100.0 |
* Amount represents less than 0.1%
Asset Allocation (% of fund's net assets) |
Period end |
| Domestic Equity Funds | 33.6% | |
| Developed International Equity Funds | 11.6% | |
| Emerging Markets Equity Funds | 2.9% | |
| High Yield Bond Funds | 6.3% | |
| Investment Grade Bond Funds | 30.4% | |
| Short-Term Funds | 15.2% | |

Six months ago |
| Domestic Equity Funds | 35.8% | |
| Developed International Equity Funds | 9.9% | |
| Emerging Markets Equity Funds | 2.8% | |
| High Yield Bond Funds | 5.0% | |
| Investment Grade Bond Funds | 33.3% | |
| Short-Term Funds | 13.2% | |

Annual Report
VIP Investor Freedom 2010 Portfolio
Investments December 31, 2013
Showing Percentage of Net Assets
Domestic Equity Funds - 33.6% |
| Shares | | Value |
Domestic Equity Funds - 33.6% |
VIP Contrafund Portfolio Investor Class (b) | 108,242 | | $ 3,704,040 |
VIP Equity-Income Portfolio Investor Class (b) | 160,407 | | 3,723,037 |
VIP Growth & Income Portfolio Investor Class (b) | 228,348 | | 4,359,163 |
VIP Growth Portfolio Investor Class (b) | 68,218 | | 3,887,719 |
VIP Mid Cap Portfolio Investor Class (b) | 31,174 | | 1,130,072 |
VIP Value Portfolio Investor Class (b) | 184,877 | | 2,804,584 |
VIP Value Strategies Portfolio Investor Class (b) | 98,120 | | 1,404,092 |
TOTAL DOMESTIC EQUITY FUNDS (Cost $17,979,792) |
21,012,707
|
International Equity Funds - 14.5% |
| | | |
Developed International Equity Funds - 11.6% |
VIP Overseas Portfolio Investor Class R (b) | 352,576 | | 7,256,024 |
Emerging Markets Equity Funds - 2.9% |
VIP Emerging Markets Portfolio Investor Class R (b) | 203,774 | | 1,829,893 |
TOTAL INTERNATIONAL EQUITY FUNDS (Cost $9,163,613) |
9,085,917
|
Bond Funds - 36.7% |
| Shares | | Value |
High Yield Bond Funds - 6.3% |
VIP High Income Portfolio Investor Class (b) | 682,245 | | $ 3,943,378 |
Investment Grade Bond Funds - 30.4% |
VIP Investment Grade Bond Portfolio Investor Class (b) | 1,541,620 | | 18,992,757 |
TOTAL BOND FUNDS (Cost $23,641,309) |
22,936,135
|
Short-Term Funds - 15.2% |
| | | |
VIP Money Market Portfolio Investor Class 0.01% (a)(b)
(Cost $9,536,485) | 9,536,485 | |
9,536,485
|
TOTAL INVESTMENT PORTFOLIO - 100.0% (Cost $60,321,199) | | 62,571,244 |
NET OTHER ASSETS (LIABILITIES) - 0.0% | | 9 |
NET ASSETS - 100% | $ 62,571,253 |
Legend |
(a) The rate quoted is the annualized seven-day yield of the fund at period end. |
(b) Affiliated company |
Affiliated Underlying Funds |
Information regarding the Fund's fiscal year to date purchases and sales of the affiliated Underlying Funds and income earned by the Fund from investments in affiliated Underlying Funds is as follows: |
Affiliate | Value,
beginning of
period | Purchases | Sales
Proceeds | Dividend
Income | Value,
end of
period |
VIP Contrafund Portfolio Investor Class | $ 3,318,362 | $ 565,615 | $ 1,132,353 | $ 36,228 | $ 3,704,040 |
VIP Emerging Markets Portfolio Investor Class R | 1,718,072 | 342,208 | 289,956 | 11,910 | 1,829,893 |
VIP Equity-Income Portfolio Investor Class | 3,553,271 | 895,365 | 1,329,133 | 91,239 | 3,723,037 |
VIP Growth & Income Portfolio Investor Class | 4,013,613 | 711,825 | 1,555,924 | 77,713 | 4,359,163 |
VIP Growth Portfolio Investor Class | 3,285,529 | 551,021 | 1,093,989 | 8,133 | 3,887,719 |
VIP High Income Portfolio Investor Class | 2,773,679 | 1,609,085 | 410,172 | 205,221 | 3,943,378 |
VIP Investment Grade Bond Portfolio Investor Class | 18,793,948 | 4,835,936 | 3,591,128 | 474,884 | 18,992,757 |
VIP Mid Cap Portfolio Investor Class | 988,410 | 298,477 | 348,402 | 4,760 | 1,130,072 |
VIP Money Market Portfolio Investor Class | 6,664,071 | 4,004,989 | 1,132,574 | 1,393 | 9,536,485 |
VIP Overseas Portfolio Investor Class R | 5,598,937 | 1,221,425 | 1,134,942 | 84,452 | 7,256,024 |
VIP Value Portfolio Investor Class | 2,641,605 | 666,466 | 1,042,590 | 29,370 | 2,804,584 |
VIP Value Strategies Portfolio Investor Class | 1,309,598 | 210,981 | 477,268 | 11,754 | 1,404,092 |
Total | $ 54,659,095 | $ 15,913,393 | $ 13,538,431 | $ 1,037,057 | $ 62,571,244 |
Other Information |
All investments are categorized as Level 1 under the Fair Value Hierarchy. The inputs or methodology used for valuing securities may not be an indication of the risk associated with investing in those securities. For more information on valuation inputs, please refer to the Investment Valuation section in the accompanying Notes to Financial Statements. |
See accompanying notes which are an integral part of the financial statements.
Annual Report
VIP Investor Freedom 2010 Portfolio
Statement of Assets and Liabilities
| December 31, 2013 |
| | |
Assets | | |
Investment in securities, at value (cost $60,321,199) - See accompanying schedule | | $ 62,571,244 |
Cash | | 10 |
Receivable for investments sold | | 1,246 |
Total assets | | 62,572,500 |
| | |
Liabilities | | |
Payable for fund shares redeemed | | 1,247 |
| | |
Net Assets | | $ 62,571,253 |
Net Assets consist of: | | |
Paid in capital | | $ 59,798,103 |
Accumulated undistributed net realized gain (loss) on investments | | 523,105 |
Net unrealized appreciation (depreciation) on investments | | 2,250,045 |
Net Assets, for 5,373,488 shares outstanding | | $ 62,571,253 |
Net Asset Value, offering price and redemption price per share ($62,571,253 ÷ 5,373,488 shares) | | $ 11.64 |
Statement of Operations
| Year ended December 31, 2013 |
| | |
Investment Income | | |
Income distributions from underlying funds | | $ 1,037,057 |
| | |
Expenses | | |
Independent trustees' compensation | $ 221 | |
Total expenses before reductions | 221 | |
Expense reductions | (221) | 0 |
Net investment income (loss) | | 1,037,057 |
Realized and Unrealized Gain (Loss) Realized gain (loss) on sale of underlying fund shares | 300,483 | |
Capital gain distributions from underlying funds | 895,016 | |
Total net realized gain (loss) | | 1,195,499 |
Change in net unrealized appreciation (depreciation) on underlying funds | | 5,236,706 |
Net gain (loss) | | 6,432,205 |
Net increase (decrease) in net assets resulting from operations | | $ 7,469,262 |
See accompanying notes which are an integral part of the financial statements.
Annual Report
Statement of Changes in Net Assets
| Year ended
December 31,
2013 | Year ended
December 31,
2012 |
Increase (Decrease) in Net Assets | | |
Operations | | |
Net investment income (loss) | $ 1,037,057 | $ 1,016,639 |
Net realized gain (loss) | 1,195,499 | 1,008,843 |
Change in net unrealized appreciation (depreciation) | 5,236,706 | 3,929,779 |
Net increase (decrease) in net assets resulting from operations | 7,469,262 | 5,955,261 |
Distributions to shareholders from net investment income | (1,045,621) | (1,008,856) |
Distributions to shareholders from net realized gain | (733,067) | (756,991) |
Total distributions | (1,778,688) | (1,765,847) |
Share transactions
Proceeds from sales of shares | 9,159,310 | 5,187,870 |
Reinvestment of distributions | 1,778,688 | 1,765,847 |
Cost of shares redeemed | (8,716,419) | (7,650,899) |
Net increase (decrease) in net assets resulting from share transactions | 2,221,579 | (697,182) |
Total increase (decrease) in net assets | 7,912,153 | 3,492,232 |
| | |
Net Assets | | |
Beginning of period | 54,659,100 | 51,166,868 |
End of period (including undistributed net investment income of $0 and undistributed net investment income of $7,783, respectively) | $ 62,571,253 | $ 54,659,100 |
Other Information Shares | | |
Sold | 821,710 | 499,333 |
Issued in reinvestment of distributions | 156,010 | 168,617 |
Redeemed | (773,835) | (732,865) |
Net increase (decrease) | 203,885 | (64,915) |
Financial Highlights
Years ended December 31, | 2013 | 2012 | 2011 | 2010 | 2009 |
Selected Per-Share Data | | | | | |
Net asset value, beginning of period | $ 10.57 | $ 9.77 | $ 10.06 | $ 9.14 | $ 7.77 |
Income from Investment Operations | | | | | |
Net investment income (loss) C | .20 | .20 | .21 | .21 | .35 |
Net realized and unrealized gain (loss) | 1.21 | .95 | (.24) | .97 | 1.49 |
Total from investment operations | 1.41 | 1.15 | (.03) | 1.18 | 1.84 |
Distributions from net investment income | (.20) | (.20) | (.21) | (.21) | (.35) |
Distributions from net realized gain | (.14) | (.15) | (.04) | (.05) | (.12) |
Total distributions | (.34) | (.35) | (.26) G | (.26) | (.47) |
Net asset value, end of period | $ 11.64 | $ 10.57 | $ 9.77 | $ 10.06 | $ 9.14 |
Total Return A, B | 13.41% | 11.82% | (.35)% | 12.88% | 24.09% |
Ratios to Average Net Assets D, F | | | | | |
Expenses before reductions E | .00% | .00% | .00% | .00% | .00% |
Expenses net of fee waivers, if any | .00% | .00% | .00% | .00% | .00% |
Expenses net of all reductions | .00% | .00% | .00% | .00% | .00% |
Net investment income (loss) | 1.76% | 1.88% | 2.02% | 2.20% | 4.18% |
Supplemental Data | | | | | |
Net assets, end of period (000 omitted) | $ 62,571 | $ 54,659 | $ 51,167 | $ 54,591 | $ 47,671 |
Portfolio turnover rate D | 23% | 21% | 24% | 31% | 28% |
A Total returns do not reflect charges attributable to your insurance company's separate account. Inclusion of these charges would reduce the total returns shown.
B Total returns would have been lower if certain expenses had not been reduced during the applicable periods shown.
C Calculated based on average shares outstanding during the period.
D Amounts do not include the activity of the Underlying Funds.
E Amount represents less than .01%.
F Expense ratios reflect operating expenses of the Fund. Expenses before reductions do not reflect amounts reimbursed by the investment adviser or reductions from expense offset arrangements and do not represent the amount paid by the Fund during periods when reimbursements or reductions occur. Expenses net of fee waivers reflect expenses after reimbursement by the investment adviser but prior to reductions from expense offset arrangements. Expenses net of all reductions represent the net expenses paid by the Fund but do not include expenses of the investment companies in which the Fund invests.
G Total distributions of $.26 per share is comprised of distributions from net investment income of $.214 and distributions from net realized gain of $.041 per share.
See accompanying notes which are an integral part of the financial statements.
Annual Report
VIP Investor Freedom 2015 Portfolio
Investment Changes (Unaudited)
The information in the following tables is based on the direct investments of the Fund. |
Fund Holdings as of December 31, 2013 |
| % of fund's
net assets | % of fund's net assets
6 months ago |
Domestic Equity Funds | | |
VIP Contrafund Portfolio Investor Class | 7.0 | 6.5 |
VIP Equity-Income Portfolio Investor Class | 7.1 | 6.9 |
VIP Growth & Income Portfolio Investor Class | 8.3 | 7.9 |
VIP Growth Portfolio Investor Class | 7.3 | 6.6 |
VIP Mid Cap Portfolio Investor Class | 2.1 | 1.9 |
VIP Value Portfolio Investor Class | 5.3 | 5.1 |
VIP Value Strategies Portfolio Investor Class | 2.6 | 2.4 |
| 39.7 | 37.3 |
Developed International Equity Funds | | |
VIP Overseas Portfolio Investor Class R | 13.6 | 10.4 |
Emerging Markets Equity Funds | | |
VIP Emerging Markets Portfolio Investor Class R | 3.5 | 3.0 |
High Yield Bond Funds | | |
VIP High Income Portfolio Investor Class | 6.5 | 4.9 |
Investment Grade Bond Funds | | |
VIP Investment Grade Bond Portfolio Investor Class | 26.6 | 34.4 |
Short-Term Funds | | |
VIP Money Market Portfolio Investor Class | 10.1 | 10.0 |
Net Other Assets (Liabilities)* | 0.0 | 0.0 |
| 100.0 | 100.0 |
* Amount represents less than 0.1%.
Asset Allocation (% of fund's net assets) |
Period end |
| Domestic Equity Funds | 39.7% | |
| Developed International Equity Funds | 13.6% | |
| Emerging Markets Equity Funds | 3.5% | |
| High Yield Bond Funds | 6.5% | |
| Investment Grade Bond Funds | 26.6% | |
| Short-Term Funds | 10.1% | |

Six months ago |
| Domestic Equity Funds | 37.3% | |
| Developed International Equity Funds | 10.4% | |
| Emerging Markets Equity Funds | 3.0% | |
| High Yield Bond Funds | 4.9% | |
| Investment Grade Bond Funds | 34.4% | |
| Short-Term Funds | 10.0% | |

Annual Report
VIP Investor Freedom 2015 Portfolio
Investments December 31, 2013
Showing Percentage of Net Assets
Domestic Equity Funds - 39.7% |
| Shares | | Value |
Domestic Equity Funds - 39.7% |
VIP Contrafund Portfolio Investor Class (b) | 198,722 | | $ 6,800,272 |
VIP Equity-Income Portfolio Investor Class (b) | 295,955 | | 6,869,108 |
VIP Growth & Income Portfolio Investor Class (b) | 420,082 | | 8,019,368 |
VIP Growth Portfolio Investor Class (b) | 124,746 | | 7,109,253 |
VIP Mid Cap Portfolio Investor Class (b) | 56,676 | | 2,054,489 |
VIP Value Portfolio Investor Class (b) | 339,980 | | 5,157,500 |
VIP Value Strategies Portfolio Investor Class (b) | 179,230 | | 2,564,781 |
TOTAL DOMESTIC EQUITY FUNDS (Cost $32,191,383) |
38,574,771
|
International Equity Funds - 17.1% |
| | | |
Developed International Equity Funds - 13.6% |
VIP Overseas Portfolio Investor Class R (b) | 644,825 | | 13,270,508 |
Emerging Markets Equity Funds - 3.5% |
VIP Emerging Markets Portfolio Investor Class R (b) | 377,229 | | 3,387,514 |
TOTAL INTERNATIONAL EQUITY FUNDS (Cost $15,644,005) |
16,658,022
|
Bond Funds - 33.1% |
| Shares | | Value |
High Yield Bond Funds - 6.5% |
VIP High Income Portfolio Investor Class (b) | 1,080,366 | | $ 6,244,518 |
Investment Grade Bond Funds - 26.6% |
VIP Investment Grade Bond Portfolio Investor Class (b) | 2,100,769 | | 25,881,469 |
TOTAL BOND FUNDS (Cost $33,163,756) |
32,125,987
|
Short-Term Funds - 10.1% |
| | | |
VIP Money Market Portfolio Investor Class 0.01% (a)(b)
(Cost $9,862,291) | 9,862,291 | |
9,862,291
|
TOTAL INVESTMENT PORTFOLIO - 100.0% (Cost $90,861,435) | | 97,221,071 |
NET OTHER ASSETS (LIABILITIES) - 0.0% | | (6) |
NET ASSETS - 100% | $ 97,221,065 |
Legend |
(a) The rate quoted is the annualized seven-day yield of the fund at period end. |
(b) Affiliated company |
Affiliated Underlying Funds |
Information regarding the Fund's fiscal year to date purchases and sales of the affiliated Underlying Funds and income earned by the Fund from investments in affiliated Underlying Funds is as follows: |
Affiliate | Value,
beginning of
period | Purchases | Sales
Proceeds | Dividend
Income | Value,
end of
period |
VIP Contrafund Portfolio Investor Class | $ 4,968,571 | $ 1,291,819 | $ 973,521 | $ 61,968 | $ 6,800,272 |
VIP Emerging Markets Portfolio Investor Class R | 2,569,761 | 1,079,878 | 355,199 | 20,893 | 3,387,514 |
VIP Equity-Income Portfolio Investor Class | 5,316,845 | 1,872,236 | 1,230,417 | 156,383 | 6,869,108 |
VIP Growth & Income Portfolio Investor Class | 6,007,850 | 1,606,501 | 1,468,803 | 132,929 | 8,019,368 |
VIP Growth Portfolio Investor Class | 4,924,389 | 1,274,249 | 908,191 | 13,888 | 7,109,253 |
VIP High Income Portfolio Investor Class | 4,016,021 | 2,791,353 | 505,378 | 318,425 | 6,244,518 |
VIP Investment Grade Bond Portfolio Investor Class | 27,644,494 | 9,019,945 | 9,216,122 | 707,165 | 25,881,469 |
VIP Mid Cap Portfolio Investor Class | 1,479,709 | 601,688 | 317,926 | 8,088 | 2,054,489 |
VIP Money Market Portfolio Investor Class | 7,779,096 | 3,098,230 | 1,015,035 | 1,577 | 9,862,291 |
VIP Overseas Portfolio Investor Class R | 8,382,509 | 3,823,081 | 1,429,605 | 146,557 | 13,270,508 |
VIP Value Portfolio Investor Class | 3,952,325 | 1,390,545 | 1,006,916 | 50,251 | 5,157,500 |
VIP Value Strategies Portfolio Investor Class | 1,960,097 | 483,118 | 450,487 | 20,022 | 2,564,781 |
Total | $ 79,001,667 | $ 28,332,643 | $ 18,877,600 | $ 1,638,146 | $ 97,221,071 |
Other Information |
All investments are categorized as Level 1 under the Fair Value Hierarchy. The inputs or methodology used for valuing securities may not be an indication of the risk associated with investing in those securities. For more information on valuation inputs, please refer to the Investment Valuation section in the accompanying Notes to Financial Statements. |
See accompanying notes which are an integral part of the financial statements.
Annual Report
VIP Investor Freedom 2015 Portfolio
Statement of Assets and Liabilities
| December 31, 2013 |
| | |
Assets | | |
Investment in securities, at value (cost $90,861,435) - See accompanying schedule | | $ 97,221,071 |
Receivable for investments sold | | 112,277 |
Total assets | | 97,333,348 |
| | |
Liabilities | | |
Payable to custodian bank | $ 2 | |
Payable for fund shares redeemed | 112,281 | |
Total liabilities | | 112,283 |
| | |
Net Assets | | $ 97,221,065 |
Net Assets consist of: | | |
Paid in capital | | $ 90,126,845 |
Accumulated undistributed net realized gain (loss) on investments | | 734,584 |
Net unrealized appreciation (depreciation) on investments | | 6,359,636 |
Net Assets, for 8,470,095 shares outstanding | | $ 97,221,065 |
Net Asset Value, offering price and redemption price per share ($97,221,065 ÷ 8,470,095 shares) | | $ 11.48 |
Statement of Operations
| Year ended December 31, 2013 |
| | |
Investment Income | | |
Income distributions from underlying funds | | $ 1,638,146 |
| | |
Expenses | | |
Independent trustees' compensation | $ 329 | |
Total expenses before reductions | 329 | |
Expense reductions | (329) | 0 |
Net investment income (loss) | | 1,638,146 |
Realized and Unrealized Gain (Loss) Realized gain (loss) on sale of underlying fund shares | 99,310 | |
Capital gain distributions from underlying funds | 1,472,409 | |
Total net realized gain (loss) | | 1,571,719 |
Change in net unrealized appreciation (depreciation) on underlying funds | | 8,665,051 |
Net gain (loss) | | 10,236,770 |
Net increase (decrease) in net assets resulting from operations | | $ 11,874,916 |
See accompanying notes which are an integral part of the financial statements.
Annual Report
Statement of Changes in Net Assets
| Year ended
December 31,
2013 | Year ended
December 31,
2012 |
Increase (Decrease) in Net Assets | | |
Operations | | |
Net investment income (loss) | $ 1,638,146 | $ 1,498,417 |
Net realized gain (loss) | 1,571,719 | 1,418,569 |
Change in net unrealized appreciation (depreciation) | 8,665,051 | 5,329,571 |
Net increase (decrease) in net assets resulting from operations | 11,874,916 | 8,246,557 |
Distributions to shareholders from net investment income | (1,649,772) | (1,486,028) |
Distributions to shareholders from net realized gain | (1,082,834) | (1,163,447) |
Total distributions | (2,732,606) | (2,649,475) |
Share transactions
Proceeds from sales of shares | 17,144,035 | 10,360,021 |
Reinvestment of distributions | 2,732,606 | 2,649,475 |
Cost of shares redeemed | (10,799,550) | (7,408,743) |
Net increase (decrease) in net assets resulting from share transactions | 9,077,091 | 5,600,753 |
Total increase (decrease) in net assets | 18,219,401 | 11,197,835 |
| | |
Net Assets | | |
Beginning of period | 79,001,664 | 67,803,829 |
End of period (including undistributed net investment income of $0 and undistributed net investment income of $10,370, respectively) | $ 97,221,065 | $ 79,001,664 |
Other Information Shares | | |
Sold | 1,564,617 | 1,012,596 |
Issued in reinvestment of distributions | 243,678 | 259,346 |
Redeemed | (981,805) | (729,961) |
Net increase (decrease) | 826,490 | 541,981 |
Financial Highlights
Years ended December 31, | 2013 | 2012 | 2011 | 2010 | 2009 |
Selected Per-Share Data | | | | | |
Net asset value, beginning of period | $ 10.34 | $ 9.55 | $ 9.87 | $ 9.11 | $ 7.69 |
Income from Investment Operations | | | | | |
Net investment income (loss) C | .20 | .21 | .21 | .21 | .34 |
Net realized and unrealized gain (loss) | 1.27 | .94 | (.24) | .97 | 1.58 |
Total from investment operations | 1.47 | 1.15 | (.03) | 1.18 | 1.92 |
Distributions from net investment income | (.20) | (.20) | (.21) | (.22) | (.34) |
Distributions from net realized gain | (.13) | (.16) | (.08) | (.20) | (.16) |
Total distributions | (.33) | (.36) | (.29) | (.42) | (.50) |
Net asset value, end of period | $ 11.48 | $ 10.34 | $ 9.55 | $ 9.87 | $ 9.11 |
Total Return A, B | 14.35% | 12.10% | (.33)% | 13.06% | 25.25% |
Ratios to Average Net Assets D, F | | | | | |
Expenses before reductions E | .00% | .00% | .00% | .00% | .00% |
Expenses net of fee waivers, if any | .00% | .00% | .00% | .00% | .00% |
Expenses net of all reductions | .00% | .00% | .00% | .00% | .00% |
Net investment income (loss) | 1.86% | 2.02% | 2.07% | 2.24% | 4.08% |
Supplemental Data | | | | | |
Net assets, end of period (000 omitted) | $ 97,221 | $ 79,002 | $ 67,804 | $ 69,259 | $ 60,033 |
Portfolio turnover rate D | 21% | 18% | 30% | 31% | 22% |
A Total returns do not reflect charges attributable to your insurance company's separate account. Inclusion of these charges would reduce the total returns shown.
B Total returns would have been lower if certain expenses had not been reduced during the applicable periods shown.
C Calculated based on average shares outstanding during the period.
D Amounts do not include the activity of the Underlying Funds.
E Amount represents less than .01%.
F Expense ratios reflect operating expenses of the Fund. Expenses before reductions do not reflect amounts reimbursed by the investment adviser or reductions from expense offset arrangements and do not represent the amount paid by the Fund during periods when reimbursements or reductions occur. Expenses net of fee waivers reflect expenses after reimbursement by the investment adviser but prior to reductions from expense offset arrangements. Expenses net of all reductions represent the net expenses paid by the Fund but do not include expenses of the investment companies in which the Fund invests.
See accompanying notes which are an integral part of the financial statements.
Annual Report
VIP Investor Freedom 2020 Portfolio
Investment Changes (Unaudited)
The information in the following tables is based on the direct investments of the Fund. |
Fund Holdings as of December 31, 2013 |
| % of fund's
net assets | % of fund's net assets
6 months ago |
Domestic Equity Funds | | |
VIP Contrafund Portfolio Investor Class | 7.8 | 7.1 |
VIP Equity-Income Portfolio Investor Class | 7.9 | 7.5 |
VIP Growth & Income Portfolio Investor Class | 9.2 | 8.6 |
VIP Growth Portfolio Investor Class | 8.1 | 7.2 |
VIP Mid Cap Portfolio Investor Class | 2.3 | 2.0 |
VIP Value Portfolio Investor Class | 5.9 | 5.5 |
VIP Value Strategies Portfolio Investor Class | 2.9 | 2.7 |
| 44.1 | 40.6 |
Developed International Equity Funds | | |
VIP Overseas Portfolio Investor Class R | 15.2 | 11.2 |
Emerging Markets Equity Funds | | |
VIP Emerging Markets Portfolio Investor Class R | 3.8 | 3.2 |
High Yield Bond Funds | | |
VIP High Income Portfolio Investor Class | 6.5 | 5.7 |
Investment Grade Bond Funds | | |
VIP Investment Grade Bond Portfolio Investor Class | 24.0 | 32.2 |
Short-Term Funds | | |
VIP Money Market Portfolio Investor Class | 6.4 | 7.1 |
Net Other Assets (Liabilities)* | 0.0 | 0.0 |
| 100.0 | 100.0 |
* Amount represents less than 0.1%.
Asset Allocation (% of fund's net assets) |
Period end |
| Domestic Equity Funds | 44.1% | |
| Developed International Equity Funds | 15.2% | |
| Emerging Markets Equity Funds | 3.8% | |
| High Yield Bond Funds | 6.5% | |
| Investment Grade Bond Funds | 24.0% | |
| Short-Term Funds | 6.4% | |

Six months ago |
| Domestic Equity Funds | 40.6% | |
| Developed International Equity Funds | 11.2% | |
| Emerging Markets Equity Funds | 3.2% | |
| High Yield Bond Funds | 5.7% | |
| Investment Grade Bond Funds | 32.2% | |
| Short-Term Funds | 7.1% | |

Annual Report
VIP Investor Freedom 2020 Portfolio
Investments December 31, 2013
Showing Percentage of Net Assets
Domestic Equity Funds - 44.1% |
| Shares | | Value |
Domestic Equity Funds - 44.1% |
VIP Contrafund Portfolio Investor Class (b) | 365,626 | | $ 12,511,725 |
VIP Equity-Income Portfolio Investor Class (b) | 545,495 | | 12,660,933 |
VIP Growth & Income Portfolio Investor Class (b) | 773,585 | | 14,767,731 |
VIP Growth Portfolio Investor Class (b) | 229,273 | | 13,066,290 |
VIP Mid Cap Portfolio Investor Class (b) | 104,292 | | 3,780,589 |
VIP Value Portfolio Investor Class (b) | 625,701 | | 9,491,884 |
VIP Value Strategies Portfolio Investor Class (b) | 330,174 | | 4,724,784 |
TOTAL DOMESTIC EQUITY FUNDS (Cost $59,287,905) |
71,003,936
|
International Equity Funds - 19.0% |
| | | |
Developed International Equity Funds - 15.2% |
VIP Overseas Portfolio Investor Class R (b) | 1,185,729 | | 24,402,297 |
Emerging Markets Equity Funds - 3.8% |
VIP Emerging Markets Portfolio Investor Class R (b) | 689,752 | | 6,193,977 |
TOTAL INTERNATIONAL EQUITY FUNDS (Cost $28,470,032) |
30,596,274
|
Bond Funds - 30.5% |
| Shares | | Value |
High Yield Bond Funds - 6.5% |
VIP High Income Portfolio Investor Class (b) | 1,820,024 | | $ 10,519,736 |
Investment Grade Bond Funds - 24.0% |
VIP Investment Grade Bond Portfolio Investor Class (b) | 3,134,936 | | 38,622,409 |
TOTAL BOND FUNDS (Cost $51,038,618) |
49,142,145
|
Short-Term Funds - 6.4% |
| | | |
VIP Money Market Portfolio Investor Class 0.01% (a)(b)
(Cost $10,350,270) | 10,350,270 | |
10,350,270
|
TOTAL INVESTMENT PORTFOLIO - 100.0% (Cost $149,146,825) | | 161,092,625 |
NET OTHER ASSETS (LIABILITIES) - 0.0% | | (1) |
NET ASSETS - 100% | $ 161,092,624 |
Legend |
(a) The rate quoted is the annualized seven-day yield of the fund at period end. |
(b) Affiliated company |
Affiliated Underlying Funds |
Information regarding the Fund's fiscal year to date purchases and sales of the affiliated Underlying Funds and income earned by the Fund from investments in affiliated Underlying Funds is as follows: |
Affiliate | Value,
beginning of
period | Purchases | Sales
Proceeds | Dividend
Income | Value,
end of
period |
VIP Contrafund Portfolio Investor Class | $ 8,653,318 | $ 2,942,652 | $ 1,757,058 | $ 109,464 | $ 12,511,725 |
VIP Emerging Markets Portfolio Investor Class R | 4,473,906 | 2,184,160 | 622,474 | 36,610 | 6,193,977 |
VIP Equity-Income Portfolio Investor Class | 9,260,199 | 4,000,676 | 2,200,292 | 276,326 | 12,660,933 |
VIP Growth & Income Portfolio Investor Class | 10,464,188 | 3,630,678 | 2,630,979 | 234,815 | 14,767,731 |
VIP Growth Portfolio Investor Class | 8,577,081 | 2,926,653 | 1,658,748 | 24,535 | 13,066,290 |
VIP High Income Portfolio Investor Class | 7,352,832 | 4,136,966 | 895,196 | 545,637 | 10,519,736 |
VIP Investment Grade Bond Portfolio Investor Class | 39,700,707 | 16,244,031 | 15,000,537 | 1,043,403 | 38,622,409 |
VIP Mid Cap Portfolio Investor Class | 2,576,987 | 1,254,902 | 563,551 | 14,311 | 3,780,589 |
VIP Money Market Portfolio Investor Class | 7,779,508 | 4,010,620 | 1,439,857 | 1,708 | 10,350,270 |
VIP Overseas Portfolio Investor Class R | 14,591,014 | 7,890,444 | 2,506,924 | 258,794 | 24,402,297 |
VIP Value Portfolio Investor Class | 6,883,598 | 2,965,590 | 1,797,223 | 88,725 | 9,491,884 |
VIP Value Strategies Portfolio Investor Class | 3,412,973 | 1,102,384 | 795,722 | 35,423 | 4,724,784 |
Total | $ 123,726,311 | $ 53,289,756 | $ 31,868,561 | $ 2,669,751 | $ 161,092,625 |
Other Information |
All investments are categorized as Level 1 under the Fair Value Hierarchy. The inputs or methodology used for valuing securities may not be an indication of the risk associated with investing in those securities. For more information on valuation inputs, please refer to the Investment Valuation section in the accompanying Notes to Financial Statements. |
See accompanying notes which are an integral part of the financial statements.
Annual Report
VIP Investor Freedom 2020 Portfolio
Statement of Assets and Liabilities
| December 31, 2013 |
| | |
Assets | | |
Investment in securities, at value (cost $149,146,825) - See accompanying schedule | | $ 161,092,625 |
Cash | | 1 |
Receivable for investments sold | | 20,006 |
Total assets | | 161,112,632 |
| | |
Liabilities | | |
Payable for fund shares redeemed | | 20,008 |
| | |
Net Assets | | $ 161,092,624 |
Net Assets consist of: | | |
Paid in capital | | $ 147,874,802 |
Accumulated undistributed net realized gain (loss) on investments | | 1,272,022 |
Net unrealized appreciation (depreciation) on investments | | 11,945,800 |
Net Assets, for 14,045,576 shares outstanding | | $ 161,092,624 |
Net Asset Value, offering price and redemption price per share ($161,092,624 ÷ 14,045,576 shares) | | $ 11.47 |
Statement of Operations
| Year ended December 31, 2013 |
| | |
Investment Income | | |
Income distributions from underlying funds | | $ 2,669,751 |
| | |
Expenses | | |
Independent trustees' compensation | $ 529 | |
Total expenses before reductions | 529 | |
Expense reductions | (529) | 0 |
Net investment income (loss) | | 2,669,751 |
Realized and Unrealized Gain (Loss) Realized gain (loss) on sale of underlying fund shares | 296,394 | |
Capital gain distributions from underlying funds | 2,491,712 | |
Total net realized gain (loss) | | 2,788,106 |
Change in net unrealized appreciation (depreciation) on underlying funds | | 15,648,706 |
Net gain (loss) | | 18,436,812 |
Net increase (decrease) in net assets resulting from operations | | $ 21,106,563 |
See accompanying notes which are an integral part of the financial statements.
Annual Report
Statement of Changes in Net Assets
| Year ended
December 31,
2013 | Year ended
December 31,
2012 |
Increase (Decrease) in Net Assets | | |
Operations | | |
Net investment income (loss) | $ 2,669,751 | $ 2,439,002 |
Net realized gain (loss) | 2,788,106 | 2,166,770 |
Change in net unrealized appreciation (depreciation) | 15,648,706 | 9,342,329 |
Net increase (decrease) in net assets resulting from operations | 21,106,563 | 13,948,101 |
Distributions to shareholders from net investment income | (2,693,134) | (2,416,925) |
Distributions to shareholders from net realized gain | (1,934,772) | (1,577,680) |
Total distributions | (4,627,906) | (3,994,605) |
Share transactions
Proceeds from sales of shares | 31,278,689 | 17,115,960 |
Reinvestment of distributions | 4,627,906 | 3,994,605 |
Cost of shares redeemed | (15,018,940) | (10,212,278) |
Net increase (decrease) in net assets resulting from share transactions | 20,887,655 | 10,898,287 |
Total increase (decrease) in net assets | 37,366,312 | 20,851,783 |
| | |
Net Assets | | |
Beginning of period | 123,726,312 | 102,874,529 |
End of period (including undistributed net investment income of $0 and undistributed net investment income of $22,077, respectively) | $ 161,092,624 | $ 123,726,312 |
Other Information Shares | | |
Sold | 2,878,040 | 1,700,191 |
Issued in reinvestment of distributions | 414,433 | 396,742 |
Redeemed | (1,376,924) | (1,016,607) |
Net increase (decrease) | 1,915,549 | 1,080,326 |
Financial Highlights
Years ended December 31, | 2013 | 2012 | 2011 | 2010 | 2009 |
Selected Per-Share Data | | | | | |
Net asset value, beginning of period | $ 10.20 | $ 9.31 | $ 9.68 | $ 8.77 | $ 7.12 |
Income from Investment Operations | | | | | |
Net investment income (loss) C | .20 | .21 | .21 | .21 | .30 |
Net realized and unrealized gain (loss) | 1.42 | 1.02 | (.32) | 1.05 | 1.72 |
Total from investment operations | 1.62 | 1.23 | (.11) | 1.26 | 2.02 |
Distributions from net investment income | (.20) | (.21) | (.21) | (.20) | (.28) |
Distributions from net realized gain | (.15) | (.14) | (.05) | (.15) | (.09) |
Total distributions | (.35) | (.34) G | (.26) | (.35) | (.37) |
Net asset value, end of period | $ 11.47 | $ 10.20 | $ 9.31 | $ 9.68 | $ 8.77 |
Total Return A, B | 15.96% | 13.30% | (1.11)% | 14.46% | 28.75% |
Ratios to Average Net Assets D, F | | | | | |
Expenses before reductions E | .00% | .00% | .00% | .00% | .00% |
Expenses net of fee waivers, if any | .00% | .00% | .00% | .00% | .00% |
Expenses net of all reductions | .00% | .00% | .00% | .00% | .00% |
Net investment income (loss) | 1.87% | 2.13% | 2.20% | 2.28% | 3.82% |
Supplemental Data | | | | | |
Net assets, end of period (000 omitted) | $ 161,093 | $ 123,726 | $ 102,875 | $ 96,543 | $ 80,478 |
Portfolio turnover rate D | 22% | 18% | 16% | 31% | 20% |
A Total returns do not reflect charges attributable to your insurance company's separate account. Inclusion of these charges would reduce the total returns shown.
B Total returns would have been lower if certain expenses had not been reduced during the applicable periods shown.
C Calculated based on average shares outstanding during the period.
D Amounts do not include the activity of the Underlying Funds.
E Amount represents less than .01%.
F Expense ratios reflect operating expenses of the Fund. Expenses before reductions do not reflect amounts reimbursed by the investment adviser or reductions from expense offset arrangements and do not represent the amount paid by the Fund during periods when reimbursements or reductions occur. Expenses net of fee waivers reflect expenses after reimbursement by the investment adviser but prior to reductions from expense offset arrangements. Expenses net of all reductions represent the net expenses paid by the Fund but do not include expenses of the investment companies in which the Fund invests.
G Total distributions of $.34 per share is comprised of distributions from net investment income of $.205 and distributions from net realized gain of $.137 per share.
See accompanying notes which are an integral part of the financial statements.
Annual Report
VIP Investor Freedom 2025 Portfolio
Investment Changes (Unaudited)
The information in the following tables is based on the direct investments of the Fund. |
Fund Holdings as of December 31, 2013 |
| % of fund's
net assets | % of fund's net assets
6 months ago |
Domestic Equity Funds | | |
VIP Contrafund Portfolio Investor Class | 9.2 | 8.7 |
VIP Equity-Income Portfolio Investor Class | 9.3 | 9.2 |
VIP Growth & Income Portfolio Investor Class | 10.8 | 10.5 |
VIP Growth Portfolio Investor Class | 9.6 | 8.8 |
VIP Mid Cap Portfolio Investor Class | 2.8 | 2.5 |
VIP Value Portfolio Investor Class | 7.0 | 6.8 |
VIP Value Strategies Portfolio Investor Class | 3.4 | 3.3 |
| 52.1 | 49.8 |
Developed International Equity Funds | | |
VIP Overseas Portfolio Investor Class R | 17.9 | 13.8 |
Emerging Markets Equity Funds | | |
VIP Emerging Markets Portfolio Investor Class R | 4.6 | 3.9 |
High Yield Bond Funds | | |
VIP High Income Portfolio Investor Class | 6.6 | 7.2 |
Investment Grade Bond Funds | | |
VIP Investment Grade Bond Portfolio Investor Class | 18.8 | 24.5 |
Short-Term Funds | | |
VIP Money Market Portfolio Investor Class | 0.0 | 0.8 |
Net Other Assets (Liabilities)* | 0.0 | 0.0 |
| 100.0 | 100.0 |
* Amount represents less than 0.1%.
Asset Allocation (% of fund's net assets) |
Period end |
 | Domestic Equity Funds | 52.1% | |
| Developed International Equity Funds | 17.9% | |
| Emerging Markets Equity Funds | 4.6% | |
| High Yield Bond Funds | 6.6% | |
| Investment Grade Bond Funds | 18.8% | |
| Short-Term Funds | 0.0% | |

Six months ago |
| Domestic Equity Funds | 49.8% | |
| Developed International Equity Funds | 13.8% | |
| Emerging Markets Equity Funds | 3.9% | |
| High Yield Bond Funds | 7.2% | |
| Investment Grade Bond Funds | 24.5% | |
| Short-Term Funds | 0.8% | |

Annual Report
VIP Investor Freedom 2025 Portfolio
Investments December 31, 2013
Showing Percentage of Net Assets
Domestic Equity Funds - 52.1% |
| Shares | | Value |
Domestic Equity Funds - 52.1% |
VIP Contrafund Portfolio Investor Class (b) | 307,332 | | $ 10,516,884 |
VIP Equity-Income Portfolio Investor Class (b) | 458,588 | | 10,643,828 |
VIP Growth & Income Portfolio Investor Class (b) | 650,568 | | 12,419,336 |
VIP Growth Portfolio Investor Class (b) | 192,589 | | 10,975,652 |
VIP Mid Cap Portfolio Investor Class (b) | 87,101 | | 3,157,396 |
VIP Value Portfolio Investor Class (b) | 525,601 | | 7,973,371 |
VIP Value Strategies Portfolio Investor Class (b) | 276,027 | | 3,949,942 |
TOTAL DOMESTIC EQUITY FUNDS (Cost $47,108,082) |
59,636,409
|
International Equity Funds - 22.5% |
| | | |
Developed International Equity Funds - 17.9% |
VIP Overseas Portfolio Investor Class R (b) | 994,231 | | 20,461,266 |
Emerging Markets Equity Funds - 4.6% |
VIP Emerging Markets Portfolio Investor Class R (b) | 582,490 | | 5,230,757 |
TOTAL INTERNATIONAL EQUITY FUNDS (Cost $22,579,533) |
25,692,023
|
Bond Funds - 25.4% |
| Shares | | Value |
High Yield Bond Funds - 6.6% |
VIP High Income Portfolio Investor Class (b) | 1,315,345 | | $ 7,602,691 |
Investment Grade Bond Funds - 18.8% |
VIP Investment Grade Bond Portfolio Investor Class (b) | 1,743,171 | | 21,475,869 |
TOTAL BOND FUNDS (Cost $30,173,745) |
29,078,560
|
Short-Term Funds - 0.0% |
| | | |
VIP Money Market Portfolio Investor Class 0.01% (a)(b)
(Cost $5) | 5 | |
5
|
TOTAL INVESTMENT PORTFOLIO - 100.0% (Cost $99,861,365) | | 114,406,997 |
NET OTHER ASSETS (LIABILITIES) - 0.0% | | 1 |
NET ASSETS - 100% | $ 114,406,998 |
Legend |
(a) The rate quoted is the annualized seven-day yield of the fund at period end. |
(b) Affiliated company |
Affiliated Underlying Funds |
Information regarding the Fund's fiscal year to date purchases and sales of the affiliated Underlying Funds and income earned by the Fund from investments in affiliated Underlying Funds is as follows: |
Affiliate | Value,
beginning of
period | Purchases | Sales
Proceeds | Dividend
Income | Value,
end of
period |
VIP Contrafund Portfolio Investor Class | $ 6,141,730 | $ 3,023,186 | $ 740,226 | $ 92,137 | $ 10,516,884 |
VIP Emerging Markets Portfolio Investor Class R | 3,166,749 | 2,153,047 | 225,696 | 29,581 | 5,230,757 |
VIP Equity-Income Portfolio Investor Class | 6,565,567 | 3,938,958 | 1,020,517 | 232,622 | 10,643,828 |
VIP Growth & Income Portfolio Investor Class | 7,423,579 | 3,711,246 | 1,262,725 | 197,579 | 12,419,336 |
VIP Growth Portfolio Investor Class | 6,098,912 | 3,022,000 | 677,182 | 20,635 | 10,975,652 |
VIP High Income Portfolio Investor Class | 5,449,809 | 2,838,683 | 628,176 | 440,822 | 7,602,691 |
VIP Investment Grade Bond Portfolio Investor Class | 17,671,390 | 10,985,514 | 5,916,280 | 599,367 | 21,475,869 |
VIP Mid Cap Portfolio Investor Class | 1,827,253 | 1,210,156 | 262,596 | 11,964 | 3,157,396 |
VIP Money Market Portfolio Investor Class | 407,923 | 570,979 | 978,897 | 109 | 5 |
VIP Overseas Portfolio Investor Class R | 10,339,044 | 7,589,777 | 969,549 | 207,666 | 20,461,266 |
VIP Value Portfolio Investor Class | 4,877,738 | 2,917,010 | 886,283 | 74,633 | 7,973,371 |
VIP Value Strategies Portfolio Investor Class | 2,417,397 | 1,133,481 | 383,093 | 29,646 | 3,949,942 |
Total | $ 72,387,091 | $ 43,094,037 | $ 13,951,220 | $ 1,936,761 | $ 114,406,997 |
Other Information |
All investments are categorized as Level 1 under the Fair Value Hierarchy. The inputs or methodology used for valuing securities may not be an indication of the risk associated with investing in those securities. For more information on valuation inputs, please refer to the Investment Valuation section in the accompanying Notes to Financial Statements. |
See accompanying notes which are an integral part of the financial statements.
Annual Report
VIP Investor Freedom 2025 Portfolio
Statement of Assets and Liabilities
| December 31, 2013 |
| | |
Assets | | |
Investment in securities, at value (cost $99,861,365) - See accompanying schedule | | $ 114,406,997 |
Cash | | 1 |
Receivable for fund shares sold | | 101,760 |
Total assets | | 114,508,758 |
| | |
Liabilities | | |
Payable for investments purchased | $ 101,711 | |
Payable for fund shares redeemed | 49 | |
Total liabilities | | 101,760 |
| | |
Net Assets | | $ 114,406,998 |
Net Assets consist of: | | |
Paid in capital | | $ 98,863,318 |
Accumulated undistributed net realized gain (loss) on investments | | 998,048 |
Net unrealized appreciation (depreciation) on investments | | 14,545,632 |
Net Assets, for 9,406,816 shares outstanding | | $ 114,406,998 |
Net Asset Value, offering price and redemption price per share ($114,406,998 ÷ 9,406,816 shares) | | $ 12.16 |
Statement of Operations
| Year ended December 31, 2013 |
| | |
Investment Income | | |
Income distributions from underlying funds | | $ 1,936,761 |
| | |
Expenses | | |
Independent trustees' compensation | $ 337 | |
Total expenses before reductions | 337 | |
Expense reductions | (337) | 0 |
Net investment income (loss) | | 1,936,761 |
Realized and Unrealized Gain (Loss) Realized gain (loss) on sale of underlying fund shares | 53,899 | |
Capital gain distributions from underlying funds | 1,940,154 | |
Total net realized gain (loss) | | 1,994,053 |
Change in net unrealized appreciation (depreciation) on underlying funds | | 12,823,189 |
Net gain (loss) | | 14,817,242 |
Net increase (decrease) in net assets resulting from operations | | $ 16,754,003 |
See accompanying notes which are an integral part of the financial statements.
Annual Report
Statement of Changes in Net Assets
| Year ended
December 31,
2013 | Year ended
December 31,
2012 |
Increase (Decrease) in Net Assets | | |
Operations | | |
Net investment income (loss) | $ 1,936,761 | $ 1,431,137 |
Net realized gain (loss) | 1,994,053 | 1,044,262 |
Change in net unrealized appreciation (depreciation) | 12,823,189 | 5,915,089 |
Net increase (decrease) in net assets resulting from operations | 16,754,003 | 8,390,488 |
Distributions to shareholders from net investment income | (1,950,892) | (1,413,412) |
Distributions to shareholders from net realized gain | (1,204,571) | (635,830) |
Total distributions | (3,155,463) | (2,049,242) |
Share transactions
Proceeds from sales of shares | 30,370,562 | 15,180,056 |
Reinvestment of distributions | 3,155,463 | 2,049,242 |
Cost of shares redeemed | (5,104,660) | (3,461,941) |
Net increase (decrease) in net assets resulting from share transactions | 28,421,365 | 13,767,357 |
Total increase (decrease) in net assets | 42,019,905 | 20,108,603 |
| | |
Net Assets | | |
Beginning of period | 72,387,093 | 52,278,490 |
End of period (including undistributed net investment income of $0 and undistributed net investment income of $12,050, respectively) | $ 114,406,998 | $ 72,387,093 |
Other Information Shares | | |
Sold | 2,662,862 | 1,482,314 |
Issued in reinvestment of distributions | 266,775 | 198,583 |
Redeemed | (447,523) | (339,917) |
Net increase (decrease) | 2,482,114 | 1,340,980 |
Financial Highlights
Years ended December 31, | 2013 | 2012 | 2011 | 2010 | 2009 |
Selected Per-Share Data | | | | | |
Net asset value, beginning of period | $ 10.45 | $ 9.36 | $ 9.83 | $ 8.73 | $ 7.04 |
Income from Investment Operations | | | | | |
Net investment income (loss) C | .24 | .24 | .22 | .21 | .28 |
Net realized and unrealized gain (loss) | 1.83 | 1.16 | (.44) | 1.17 | 1.79 |
Total from investment operations | 2.07 | 1.40 | (.22) | 1.38 | 2.07 |
Distributions from net investment income | (.21) | (.21) | (.21) | (.20) | (.25) |
Distributions from net realized gain | (.15) | (.10) | (.04) | (.08) | (.13) |
Total distributions | (.36) | (.31) | (.25) | (.28) | (.38) |
Net asset value, end of period | $ 12.16 | $ 10.45 | $ 9.36 | $ 9.83 | $ 8.73 |
Total Return A, B | 19.95% | 15.05% | (2.28)% | 15.80% | 29.95% |
Ratios to Average Net Assets D, F | | | | | |
Expenses before reductions E | .00% | .00% | .00% | .00% | .00% |
Expenses net of fee waivers, if any | .00% | .00% | .00% | .00% | .00% |
Expenses net of all reductions | .00% | .00% | .00% | .00% | .00% |
Net investment income (loss) | 2.09% | 2.33% | 2.26% | 2.28% | 3.65% |
Supplemental Data | | | | | |
Net assets, end of period (000 omitted) | $ 114,407 | $ 72,387 | $ 52,278 | $ 44,530 | $ 32,981 |
Portfolio turnover rate D | 15% | 13% | 15% | 29% | 18% |
A Total returns do not reflect charges attributable to your insurance company's separate account. Inclusion of these charges would reduce the total returns shown.
B Total returns would have been lower if certain expenses had not been reduced during the applicable periods shown.
C Calculated based on average shares outstanding during the period.
D Amounts do not include the activity of the Underlying Funds.
E Amount represents less than .01%.
F Expense ratios reflect operating expenses of the Fund. Expenses before reductions do not reflect amounts reimbursed by the investment adviser or reductions from expense offset arrangements and do not represent the amount paid by the Fund during periods when reimbursements or reductions occur. Expenses net of fee waivers reflect expenses after reimbursement by the investment adviser but prior to reductions from expense offset arrangements. Expenses net of all reductions represent the net expenses paid by the Fund but do not include expenses of the investment companies in which the Fund invests.
See accompanying notes which are an integral part of the financial statements.
Annual Report
VIP Investor Freedom 2030 Portfolio
Investment Changes (Unaudited)
The information in the following tables is based on the direct investments of the Fund. |
Fund Holdings as of December 31, 2013 |
| % of fund's
net assets | % of fund's net assets
6 months ago |
Domestic Equity Funds | | |
VIP Contrafund Portfolio Investor Class | 10.8 | 9.1 |
VIP Equity-Income Portfolio Investor Class | 11.0 | 9.7 |
VIP Growth & Income Portfolio Investor Class | 12.8 | 11.1 |
VIP Growth Portfolio Investor Class | 11.3 | 9.2 |
VIP Mid Cap Portfolio Investor Class | 3.2 | 2.7 |
VIP Value Portfolio Investor Class | 8.2 | 7.2 |
VIP Value Strategies Portfolio Investor Class | 4.1 | 3.5 |
| 61.4 | 52.5 |
Developed International Equity Funds | | |
VIP Overseas Portfolio Investor Class R | 21.0 | 14.5 |
Emerging Markets Equity Funds | | |
VIP Emerging Markets Portfolio Investor Class R | 5.4 | 4.2 |
High Yield Bond Funds | | |
VIP High Income Portfolio Investor Class | 6.8 | 7.3 |
Investment Grade Bond Funds | | |
VIP Investment Grade Bond Portfolio Investor Class | 5.4 | 21.5 |
Net Other Assets (Liabilities)* | 0.0 | 0.0 |
| 100.0 | 100.0 |
* Amount represents less than 0.1%.
Asset Allocation (% of fund's net assets) |
Period end |
| Domestic Equity Funds | 61.4% | |
 | Developed International Equity Funds | 21.0% | |
 | Emerging Markets Equity Funds | 5.4% | |
 | High Yield Bond Funds | 6.8% | |
| Investment Grade Bond Funds | 5.4% | |

Six months ago |
| Domestic Equity Funds | 52.5% | |
| Developed International Equity Funds | 14.5% | |
| Emerging Markets Equity Funds | 4.2% | |
| High Yield Bond Funds | 7.3% | |
| Investment Grade Bond Funds | 21.5% | |

Annual Report
VIP Investor Freedom 2030 Portfolio
Investments December 31, 2013
Showing Percentage of Net Assets
Domestic Equity Funds - 61.4% |
| Shares | | Value |
Domestic Equity Funds - 61.4% |
VIP Contrafund Portfolio Investor Class (a) | 351,562 | | $ 12,030,459 |
VIP Equity-Income Portfolio Investor Class (a) | 525,861 | | 12,205,231 |
VIP Growth & Income Portfolio Investor Class (a) | 744,635 | | 14,215,080 |
VIP Growth Portfolio Investor Class (a) | 219,957 | | 12,535,331 |
VIP Mid Cap Portfolio Investor Class (a) | 99,103 | | 3,592,490 |
VIP Value Portfolio Investor Class (a) | 601,540 | | 9,125,369 |
VIP Value Strategies Portfolio Investor Class (a) | 314,933 | | 4,506,694 |
TOTAL DOMESTIC EQUITY FUNDS (Cost $57,618,685) |
68,210,654
|
International Equity Funds - 26.4% |
| | | |
Developed International Equity Funds - 21.0% |
VIP Overseas Portfolio Investor Class R (a) | 1,137,508 | | 23,409,916 |
Emerging Markets Equity Funds - 5.4% |
VIP Emerging Markets Portfolio Investor Class R (a) | 665,707 | | 5,978,050 |
TOTAL INTERNATIONAL EQUITY FUNDS (Cost $26,825,604) |
29,387,966
|
Bond Funds - 12.2% |
| Shares | | Value |
High Yield Bond Funds - 6.8% |
VIP High Income Portfolio Investor Class (a) | 1,299,104 | | $ 7,508,823 |
Investment Grade Bond Funds - 5.4% |
VIP Investment Grade Bond Portfolio Investor Class (a) | 491,066 | | 6,049,929 |
TOTAL BOND FUNDS (Cost $14,150,208) |
13,558,752
|
TOTAL INVESTMENT PORTFOLIO - 100.0% (Cost $98,594,497) | | 111,157,372 |
NET OTHER ASSETS (LIABILITIES) - 0.0% | | (12) |
NET ASSETS - 100% | $ 111,157,360 |
Legend |
(a) Affiliated company |
Affiliated Underlying Funds |
Information regarding the Fund's fiscal year to date purchases and sales of the affiliated Underlying Funds and income earned by the Fund from investments in affiliated Underlying Funds is as follows: |
Affiliate | Value,
beginning of
period | Purchases | Sales
Proceeds | Dividend
Income | Value,
end of
period |
VIP Contrafund Portfolio Investor Class | $ 5,999,944 | $ 4,600,514 | $ 727,655 | $ 105,039 | $ 12,030,459 |
VIP Emerging Markets Portfolio Investor Class R | 3,100,173 | 2,999,927 | 259,588 | 36,645 | 5,978,050 |
VIP Equity-Income Portfolio Investor Class | 6,417,890 | 5,702,172 | 1,008,174 | 265,842 | 12,205,231 |
VIP Growth & Income Portfolio Investor Class | 7,253,950 | 5,615,686 | 1,247,692 | 225,200 | 14,215,080 |
VIP Growth Portfolio Investor Class | 5,950,361 | 4,625,695 | 660,200 | 23,489 | 12,535,331 |
VIP High Income Portfolio Investor Class | 5,141,337 | 3,068,865 | 644,399 | 432,811 | 7,508,823 |
VIP Investment Grade Bond Portfolio Investor Class | 14,706,193 | 8,745,078 | 16,800,419 | 230,973 | 6,049,929 |
VIP Mid Cap Portfolio Investor Class | 1,786,521 | 1,710,228 | 269,906 | 13,566 | 3,592,490 |
VIP Overseas Portfolio Investor Class R | 10,117,903 | 10,707,278 | 1,012,983 | 257,128 | 23,409,916 |
VIP Value Portfolio Investor Class | 4,770,607 | 4,216,082 | 882,585 | 85,122 | 9,125,369 |
VIP Value Strategies Portfolio Investor Class | 2,365,513 | 1,728,202 | 393,758 | 33,706 | 4,506,694 |
Total | $ 67,610,392 | $ 53,719,727 | $ 23,907,359 | $ 1,709,521 | $ 111,157,372 |
Other Information |
All investments are categorized as Level 1 under the Fair Value Hierarchy. The inputs or methodology used for valuing securities may not be an indication of the risk associated with investing in those securities. For more information on valuation inputs, please refer to the Investment Valuation section in the accompanying Notes to Financial Statements. |
See accompanying notes which are an integral part of the financial statements.
Annual Report
VIP Investor Freedom 2030 Portfolio
Statement of Assets and Liabilities
| December 31, 2013 |
| | |
Assets | | |
Investment in securities, at value (cost $98,594,497) - See accompanying schedule | | $ 111,157,372 |
Receivable for fund shares sold | | 190,999 |
Total assets | | 111,348,371 |
| | |
Liabilities | | |
Payable to custodian bank | $ 12 | |
Payable for investments purchased | 190,999 | |
Total liabilities | | 191,011 |
| | |
Net Assets | | $ 111,157,360 |
Net Assets consist of: | | |
Paid in capital | | $ 97,625,511 |
Accumulated undistributed net realized gain (loss) on investments | | 968,974 |
Net unrealized appreciation (depreciation) on investments | | 12,562,875 |
Net Assets, for 9,413,271 shares outstanding | | $ 111,157,360 |
Net Asset Value, offering price and redemption price per share ($111,157,360 ÷ 9,413,271 shares) | | $ 11.81 |
Statement of Operations
| Year ended December 31, 2013 |
| | |
Investment Income | | |
Income distributions from underlying funds | | $ 1,709,521 |
| | |
Expenses | | |
Independent trustees' compensation | $ 321 | |
Total expenses before reductions | 321 | |
Expense reductions | (321) | 0 |
Net investment income (loss) | | 1,709,521 |
Realized and Unrealized Gain (Loss) Realized gain (loss) on sale of underlying fund shares | 62,750 | |
Capital gain distributions from underlying funds | 1,975,430 | |
Total net realized gain (loss) | | 2,038,180 |
Change in net unrealized appreciation (depreciation) on underlying funds | | 13,671,862 |
Net gain (loss) | | 15,710,042 |
Net increase (decrease) in net assets resulting from operations | | $ 17,419,563 |
See accompanying notes which are an integral part of the financial statements.
Annual Report
Statement of Changes in Net Assets
| Year ended
December 31,
2013 | Year ended
December 31,
2012 |
Increase (Decrease) in Net Assets | | |
Operations | | |
Net investment income (loss) | $ 1,709,521 | $ 1,392,131 |
Net realized gain (loss) | 2,038,180 | 1,001,748 |
Change in net unrealized appreciation (depreciation) | 13,671,862 | 6,006,253 |
Net increase (decrease) in net assets resulting from operations | 17,419,563 | 8,400,132 |
Distributions to shareholders from net investment income | (1,740,415) | (1,374,905) |
Distributions to shareholders from net realized gain | (1,263,165) | (559,799) |
Total distributions | (3,003,580) | (1,934,704) |
Share transactions
Proceeds from sales of shares | 32,221,718 | 12,028,776 |
Reinvestment of distributions | 3,003,580 | 1,934,704 |
Cost of shares redeemed | (6,094,311) | (4,296,927) |
Net increase (decrease) in net assets resulting from share transactions | 29,130,987 | 9,666,553 |
Total increase (decrease) in net assets | 43,546,970 | 16,131,981 |
| | |
Net Assets | | |
Beginning of period | 67,610,390 | 51,478,409 |
End of period (including undistributed net investment income of $0 and undistributed net investment income of $18,120, respectively) | $ 111,157,360 | $ 67,610,390 |
Other Information Shares | | |
Sold | 2,942,684 | 1,232,069 |
Issued in reinvestment of distributions | 262,749 | 195,881 |
Redeemed | (550,526) | (437,722) |
Net increase (decrease) | 2,654,907 | 990,228 |
Financial Highlights
Years ended December 31, | 2013 | 2012 | 2011 | 2010 | 2009 |
Selected Per-Share Data | | | | | |
Net asset value, beginning of period | $ 10.00 | $ 8.92 | $ 9.41 | $ 8.38 | $ 6.66 |
Income from Investment Operations | | | | | |
Net investment income (loss) C | .21 | .22 | .20 | .19 | .21 |
Net realized and unrealized gain (loss) | 1.95 | 1.16 | (.46) | 1.15 | 1.85 |
Total from investment operations | 2.16 | 1.38 | (.26) | 1.34 | 2.06 |
Distributions from net investment income | (.19) | (.21) | (.20) | (.18) | (.20) |
Distributions from net realized gain | (.16) | (.09) | (.03) | (.13) | (.14) |
Total distributions | (.35) | (.30) | (.23) | (.31) | (.34) |
Net asset value, end of period | $ 11.81 | $ 10.00 | $ 8.92 | $ 9.41 | $ 8.38 |
Total Return A, B | 21.72% | 15.50% | (2.78)% | 16.12% | 31.57% |
Ratios to Average Net Assets D, F | | | | | |
Expenses before reductions E | .00% | .00% | .00% | .00% | .00% |
Expenses net of fee waivers, if any | .00% | .00% | .00% | .00% | .00% |
Expenses net of all reductions | .00% | .00% | .00% | .00% | .00% |
Net investment income (loss) | 1.94% | 2.28% | 2.16% | 2.20% | 2.86% |
Supplemental Data | | | | | |
Net assets, end of period (000 omitted) | $ 111,157 | $ 67,610 | $ 51,478 | $ 46,070 | $ 34,560 |
Portfolio turnover rate D | 27% | 14% | 14% | 26% | 21% |
A Total returns do not reflect charges attributable to your insurance company's separate account. Inclusion of these charges would reduce the total returns shown.
B Total returns would have been lower if certain expenses had not been reduced during the applicable periods shown.
C Calculated based on average shares outstanding during the period.
D Amounts do not include the activity of the Underlying Funds.
E Amount represents less than .01%.
F Expense ratios reflect operating expenses of the Fund. Expenses before reductions do not reflect amounts reimbursed by the investment adviser or reductions from expense offset arrangements and do not represent the amount paid by the Fund during periods when reimbursements or reductions occur. Expenses net of fee waivers reflect expenses after reimbursement by the investment adviser but prior to reductions from expense offset arrangements. Expenses net of all reductions represent the net expenses paid by the Fund but do not include expenses of the investment companies in which the Fund invests.
See accompanying notes which are an integral part of the financial statements.
Annual Report
Notes to Financial Statements
For the period ended December 31, 2013
1. Organization.
VIP Investor Freedom Income Portfolio, VIP Investor Freedom 2005 Portfolio, VIP Investor Freedom 2010 Portfolio, VIP Investor Freedom 2015 Portfolio, VIP Investor Freedom 2020 Portfolio, VIP Investor Freedom 2025 Portfolio and VIP Investor Freedom 2030 Portfolio (the Funds) are funds of Variable Insurance Products Fund V. The Variable Insurance Products Fund V (the Trust) is registered under the Investment Company Act of 1940, as amended (the 1940 Act), as an open-end management investment company organized as a Massachusetts business trust. Each Fund is authorized to issue an unlimited number of shares. The Funds invest primarily in a combination of other VIP equity, bond, and short-term funds (the Underlying Funds) managed by Fidelity Management & Research Company (FMR). Shares of each Fund may only be purchased by insurance companies for the purpose of funding variable annuity or variable life insurance contracts.
2. Significant Accounting Policies.
The financial statements have been prepared in conformity with accounting principles generally accepted in the United States of America (GAAP), which require management to make certain estimates and assumptions at the date of the financial statements. Actual results could differ from those estimates. Subsequent events, if any, through the date that the financial statements were issued have been evaluated in the preparation of the financial statements. The following summarizes the significant accounting policies of the Funds:
Investment Valuation. Investments are valued as of 4:00 p.m. Eastern time on the last calendar day of the period. Each Fund categorizes the inputs to valuation techniques used to value its investments into a disclosure hierarchy consisting of three levels as shown below:
Level 1 - quoted prices in active markets for identical investments
Level 2 - other significant observable inputs (including quoted prices for similar investments, interest rates, prepayment speeds, etc.)
Level 3 - unobservable inputs (including the Fund's own assumptions based on the best information available)
Valuation techniques used to value each Fund's investments by major category are as follows. Investments in the Underlying Funds are valued at their closing net asset value (NAV) each business day and are categorized as Level 1 in the hierarchy.
Investment Transactions and Income. For financial reporting purposes, the Funds' investment holdings and NAV include trades executed through the end of the last business day of the period. The NAV per share for processing shareholder transactions is calculated as of the close of business of the New York Stock Exchange (NYSE), normally 4:00 p.m. Eastern time and includes trades executed through the end of the prior business day. Gains and losses on securities sold are determined on the basis of identified cost. Income and capital gain distributions from the Underlying Funds, if any, are recorded on the ex-dividend date.
Expenses. Expenses directly attributable to a fund are charged to that fund. Expenses attributable to more than one fund are allocated among the respective funds on the basis of relative net assets or other appropriate methods. Expenses included in the accompanying financial statements reflect the expenses of each Fund and do not include any expenses associated with the Underlying Funds. Although not included in each Fund's expenses, each Fund indirectly bears its proportionate share of the Underlying Funds' expenses through the impact of these expenses on each Underlying Fund's NAV. Expense estimates are accrued in the period to which they relate and adjustments are made when actual amounts are known.
Income Tax Information and Distributions to Shareholders. Each year, each Fund intends to qualify as a regulated investment company under Subchapter M of the Internal Revenue Code, including distributing substantially all of its taxable income and realized gains. As a result, no provision for U.S. Federal income taxes is required. As of December 31, 2013, each Fund did not have any unrecognized tax benefits in the financial statements; nor is each Fund aware of any tax positions for which it is reasonably possible that the total amounts of unrecognized tax benefits will significantly change in the next twelve months. Each Fund files a U.S. federal tax return, in addition to state and local tax returns as required. Each Funds' federal income tax returns are subject to examination by the Internal Revenue Service (IRS) for a period of three fiscal years after they are filed. State and local tax returns may be subject to examination for an additional fiscal year depending on the jurisdiction.
Distributions are declared and recorded on the ex-dividend date. Income and capital gain distributions are determined in accordance with income tax regulations, which may differ from GAAP.
Capital accounts within the financial statements are adjusted for permanent book-tax differences. These adjustments have no impact on net assets or the results of operations. Capital accounts are not adjusted for temporary book-tax differences which will reverse in a subsequent period.
Book-tax differences are primarily due to the short-term gain distributions from the Underlying Funds and losses deferred due to wash sales.
Annual Report
2. Significant Accounting Policies - continued
Income Tax Information and Distributions to Shareholders - continued
The federal tax cost of investment securities and unrealized appreciation (depreciation) as of period end were as follows for each Fund:
| Tax cost | Gross unrealized
appreciation | Gross unrealized
depreciation | Net unrealized
appreciation
(depreciation) on
securities and
other investments |
VIP Investor Freedom Income | $ 58,370,642 | $ 2,880,395 | $ (1,036,756) | $ 1,843,639 |
VIP Investor Freedom 2005 | 18,272,145 | 1,060,095 | (420,317) | 639,778 |
VIP Investor Freedom 2010 | 60,596,248 | 3,775,625 | (1,800,629) | 1,974,996 |
VIP Investor Freedom 2015 | 91,254,719 | 8,182,308 | (2,215,956) | 5,966,352 |
VIP Investor Freedom 2020 | 149,776,057 | 15,400,607 | (4,084,039) | 11,316,568 |
VIP Investor Freedom 2025 | 100,256,590 | 16,307,253 | (2,156,846) | 14,150,407 |
VIP Investor Freedom 2030 | 98,984,399 | 14,207,626 | (2,034,653) | 12,172,973 |
The tax-based components of distributable earnings as of period end were as follows for each Fund:
| Undistributed
ordinary income | Undistributed
long-term
capital gain | Net unrealized
appreciation
(depreciation) |
VIP Investor Freedom Income | $ 1,791 | $ 453,004 | $ 1,843,639 |
VIP Investor Freedom 2005 | 1,002 | 174,118 | 639,778 |
VIP Investor Freedom 2010 | 56,779 | 741,374 | 1,974,996 |
VIP Investor Freedom 2015 | 36,265 | 1,091,603 | 5,966,352 |
VIP Investor Freedom 2020 | 15,814 | 1,885,439 | 11,316,568 |
VIP Investor Freedom 2025 | - | 1,393,273 | 14,150,407 |
VIP Investor Freedom 2030 | - | 1,358,875 | 12,172,973 |
The tax character of distributions paid was as follows:
December 31, 2013 | | | |
| Ordinary Income | Long-term
Capital Gains | Total |
VIP Investor Freedom Income | $ 1,018,212 | $ 215,280 | $ 1,233,492 |
VIP Investor Freedom 2005 | 359,192 | 106,309 | 465,501 |
VIP Investor Freedom 2010 | 1,392,529 | 386,159 | 1,778,688 |
VIP Investor Freedom 2015 | 2,103,619 | 628,987 | 2,732,606 |
VIP Investor Freedom 2020 | 3,527,780 | 1,100,126 | 4,627,906 |
VIP Investor Freedom 2025 | 2,565,746 | 589,717 | 3,155,463 |
VIP Investor Freedom 2030 | 2,420,697 | 582,883 | 3,003,580 |
December 31, 2012 | | | |
| Ordinary Income | Long-term
Capital Gains | Total |
VIP Investor Freedom Income | $ 848,664 | $ 241,738 | $ 1,090,402 |
VIP Investor Freedom 2005 | 329,447 | 74,003 | 403,450 |
VIP Investor Freedom 2010 | 1,550,928 | 214,919 | 1,765,847 |
VIP Investor Freedom 2015 | 2,199,321 | 450,154 | 2,649,475 |
VIP Investor Freedom 2020 | 3,407,274 | 587,331 | 3,994,605 |
VIP Investor Freedom 2025 | 1,858,007 | 191,235 | 2,049,242 |
VIP Investor Freedom 2030 | 1,780,830 | 153,874 | 1,934,704 |
Annual Report
Notes to Financial Statements - continued
3. Purchases and Sales of Investments.
Purchases and redemptions of the Underlying Fund shares are noted in the table below.
| Purchases ($) | Redemptions ($) |
VIP Investor Freedom Income | 36,519,387 | 16,102,102 |
VIP Investor Freedom 2005 | 11,366,551 | 7,582,868 |
VIP Investor Freedom 2010 | 15,913,393 | 13,538,431 |
VIP Investor Freedom 2015 | 28,332,643 | 18,877,600 |
VIP Investor Freedom 2020 | 53,289,756 | 31,868,561 |
VIP Investor Freedom 2025 | 43,094,037 | 13,951,220 |
VIP Investor Freedom 2030 | 53,719,727 | 23,907,359 |
4. Fees and Other Transactions with Affiliates.
Management Fee. Strategic Advisers, Inc. (the investment adviser), an affiliate of FMR, provides the Funds with investment management related services. The Funds do not pay any fees for these services.
Other Transactions. The investment adviser has entered into an administration agreement with FMR under which FMR provides management and administrative services (other than investment advisory services) necessary for the operation of each Fund. Pursuant to this agreement, FMR pays all expenses of each Fund, excluding the compensation of the independent Trustees and certain other expenses such as interest expense. FMR also contracts with other Fidelity companies to perform the services necessary for the operation of each Fund. The Funds do not pay any fees for these services.
5. Expense Reductions.
FMR voluntarily agreed to reimburse each Fund to the extent annual operating expenses exceeded certain levels of average net assets as noted in the table below. Some expenses, for example interest expense, are excluded from this reimbursement.
The following Funds were in reimbursement during the period:
| Expense Limitations | Reimbursement |
VIP Investor Freedom Income | 0% | $ 180 |
VIP Investor Freedom 2005 | 0% | 61 |
VIP Investor Freedom 2010 | 0% | 221 |
VIP Investor Freedom 2015 | 0% | 329 |
VIP Investor Freedom 2020 | 0% | 529 |
VIP Investor Freedom 2025 | 0% | 337 |
VIP Investor Freedom 2030 | 0% | 321 |
6. Other.
The Funds' organizational documents provide former and current trustees and officers with a limited indemnification against liabilities arising in connection with the performance of their duties to the Funds. In the normal course of business, the Funds may also enter into contracts that provide general indemnifications. The Funds' maximum exposure under these arrangements is unknown as this would be dependent on future claims that may be made against the Funds. The risk of material loss from such claims is considered remote.
At the end of the period, the investment adviser or its affiliates were owners of record of all of the outstanding shares of the Funds.
Annual Report
Report of Independent Registered Public Accounting Firm
To the Trustees of Variable Insurance Products V and the Shareholders of VIP Investor Freedom Income Portfolio, VIP Investor Freedom 2005 Portfolio, VIP Investor Freedom 2010 Portfolio, VIP Investor Freedom 2015 Portfolio, VIP Investor Freedom 2020 Portfolio, VIP Investor Freedom 2025 Portfolio and VIP Investor Freedom 2030 Portfolio:
In our opinion, the accompanying statements of assets and liabilities, including the schedules of investments, and the related statements of operations and of changes in net assets and the financial highlights present fairly, in all material respects, the financial position of VIP Investor Freedom Income Portfolio, VIP Investor Freedom 2005 Portfolio, VIP Investor Freedom 2010 Portfolio, VIP Investor Freedom 2015 Portfolio, VIP Investor Freedom 2020 Portfolio, VIP Investor Freedom 2025 Portfolio and VIP Investor Freedom 2030 Portfolio (the Funds), each a fund of Variable Insurance Products V Trust at December 31, 2013, the results of each of their operations for the year then ended, the changes in each of their net assets for each of the two years in the period then ended and the financial highlights for each of the five years in the period then ended, in conformity with accounting principles generally accepted in the United States of America. These financial statements and financial highlights (hereafter referred to as "financial statements") are the responsibility of the Funds' management. Our responsibility is to express an opinion on these financial statements based on our audits. We conducted our audits of these financial statements in accordance with the standards of the Public Company Accounting Oversight Board (United States). Those standards require that we plan and perform the audit to obtain reasonable assurance about whether the financial statements are free of material misstatement. An audit includes examining, on a test basis, evidence supporting the amounts and disclosures in the financial statements, assessing the accounting principles used and significant estimates made by management, and evaluating the overall financial statement presentation. We believe that our audits, which included confirmation of securities at December 31, 2013 by correspondence with the custodian and brokers, provide a reasonable basis for our opinion.
PricewaterhouseCoopers LLP
Boston, Massachusetts
February 20, 2014
Annual Report
The Trustees and officers of the trust and funds, as applicable, are listed below. The Board of Trustees governs each VIP Investor Freedom Portfolio and is responsible for protecting the interests of shareholders. The Trustees are experienced executives who meet periodically throughout the year to oversee each VIP Investor Freedom Portfolio's activities, review contractual arrangements with companies that provide services to each VIP Investor Freedom Portfolio, oversee management of the risks associated with such activities and contractual arrangements, and review each VIP Investor Freedom Portfolio's performance. If the interests of a VIP Investor Freedom Portfolio and an underlying Fidelity fund were to diverge, a conflict of interest could arise and affect how the Trustees fulfill their fiduciary duties to the affected funds. Strategic Advisers has structured the VIP Investor Freedom Portfolio to avoid these potential conflicts, although there may be situations where a conflict of interest is unavoidable. In such instances, Strategic Advisers and the Trustees would take reasonable steps to minimize and, if possible, eliminate the conflict. Except for Elizabeth S. Acton and James C. Curvey, each of the Trustees oversees 223 funds. Ms. Acton oversees 205 funds. Mr. Curvey oversees 396 funds.
The Trustees hold office without limit in time except that (a) any Trustee may resign; (b) any Trustee may be removed by written instrument, signed by at least two-thirds of the number of Trustees prior to such removal; (c) any Trustee who requests to be retired or who has become incapacitated by illness or injury may be retired by written instrument signed by a majority of the other Trustees; and (d) any Trustee may be removed at any special meeting of shareholders by a two-thirds vote of the outstanding voting securities of the trust. Each Trustee who is not an interested person (as defined in the 1940 Act) of the trust and the funds (Independent Trustee), shall retire not later than the last day of the month in which his or her 75th birthday occurs. The Independent Trustees may waive this mandatory retirement age policy with respect to individual Trustees. The officers hold office without limit in time, except that any officer may resign or may be removed by a vote of a majority of the Trustees at any regular meeting or any special meeting of the Trustees. Except as indicated, each individual has held the office shown or other offices in the same company for the past five years.
Experience, Skills, Attributes, and Qualifications of the Funds' Trustees. The Governance and Nominating Committee has adopted a statement of policy that describes the experience, qualifications, attributes, and skills that are necessary and desirable for potential Independent Trustee candidates (Statement of Policy). The Board believes that each Trustee satisfied at the time he or she was initially elected or appointed a Trustee, and continues to satisfy, the standards contemplated by the Statement of Policy. The Governance and Nominating Committee also engages professional search firms to help identify potential Independent Trustee candidates who have the experience, qualifications, attributes, and skills consistent with the Statement of Policy. From time to time, additional criteria based on the composition and skills of the current Independent Trustees, as well as experience or skills that may be appropriate in light of future changes to board composition, business conditions, and regulatory or other developments, have also been considered by the professional search firms and the Governance and Nominating Committee. In addition, the Board takes into account the Trustees' commitment and participation in Board and committee meetings, as well as their leadership of standing and ad hoc committees throughout their tenure.
In determining that a particular Trustee was and continues to be qualified to serve as a Trustee, the Board has considered a variety of criteria, none of which, in isolation, was controlling. The Board believes that, collectively, the Trustees have balanced and diverse experience, qualifications, attributes, and skills, which allow the Board to operate effectively in governing each fund and protecting the interests of shareholders. Information about the specific experience, skills, attributes, and qualifications of each Trustee, which in each case led to the Board's conclusion that the Trustee should serve (or continue to serve) as a trustee of the funds, is provided below.
Board Structure and Oversight Function. Abigail P. Johnson is an interested person (as defined in the 1940 Act) and currently serves as Chairman. The Trustees have determined that an interested Chairman is appropriate and benefits shareholders because an interested Chairman has a personal and professional stake in the quality and continuity of services provided to the funds. Independent Trustees exercise their informed business judgment to appoint an individual of their choosing to serve as Chairman, regardless of whether the Trustee happens to be independent or a member of management. The Independent Trustees have determined that they can act independently and effectively without having an Independent Trustee serve as Chairman and that a key structural component for assuring that they are in a position to do so is for the Independent Trustees to constitute a substantial majority for the Board. The Independent Trustees also regularly meet in executive session. Albert R. Gamper, Jr. serves as Chairman of the Independent Trustees and as such (i) acts as a liaison between the Independent Trustees and management with respect to matters important to the Independent Trustees and (ii) with management prepares agendas for Board meetings.
Fidelity funds are overseen by different Boards of Trustees. The funds' Board oversees Fidelity's investment-grade bond, money market, and asset allocation funds and another Board oversees Fidelity's equity and high income funds. The asset allocation funds may invest in Fidelity funds that are overseen by such other Board. The use of separate Boards, each with its own committee structure, allows the Trustees of each group of Fidelity funds to focus on the unique issues of the funds they oversee, including common research, investment, and operational issues. On occasion, the separate Boards establish joint committees to address issues of overlapping consequences for the Fidelity funds overseen by each Board.
The Trustees operate using a system of committees to facilitate the timely and efficient consideration of all matters of importance to the Trustees, each fund, and fund shareholders and to facilitate compliance with legal and regulatory requirements and oversight of the funds' activities and associated risks. The Board, acting through its committees, has charged FMR and its affiliates with (i) identifying events or circumstances the occurrence of which could have demonstrably adverse effects on the funds' business and/or reputation; (ii) implementing processes and controls to lessen the possibility that such events or circumstances occur or to mitigate the effects of such events or circumstances if they do occur; and (iii) creating and maintaining a system designed to evaluate continuously business and market conditions in order to facilitate the identification and implementation processes described in (i) and (ii) above. Because the day-to-day operations and activities of the funds are carried out by or through FMR, its affiliates, and other service providers, the funds' exposure to risks is mitigated but not eliminated by the processes overseen by the Trustees. While each of the Board's committees has responsibility for overseeing different aspects of the funds' activities, oversight is exercised primarily through the Operations and Audit Committees. In addition, an ad hoc Board committee of Independent Trustees has worked with FMR to enhance the Board's oversight of investment and financial risks, legal and regulatory risks, technology risks, and operational risks, including the development of additional risk reporting to the Board. Appropriate personnel, including but not limited to the funds' Chief Compliance Officer (CCO), FMR's internal auditor, the independent accountants, the funds' Treasurer and portfolio management personnel, make periodic reports to the Board's committees, as appropriate, including an annual review of FMR's risk management program for the Fidelity funds. The responsibilities of each standing committee, including their oversight responsibilities, are described further under "Standing Committees of the Funds' Trustees."
Annual Report
The funds' Statement of Additional Information (SAI) includes more information about the Trustees. To request a free copy, call Fidelity at 1-877-208-0098.
Interested Trustees*:
Correspondence intended for each Trustee who is an interested person may be sent to Fidelity Investments, 245 Summer Street, Boston, Massachusetts 02210.
Name, Year of Birth; Principal Occupations and Other Relevant Experience+ |
James C. Curvey (1935) |
Year of Election or Appointment: 2007 Trustee |
| Mr. Curvey also serves as Trustee of other Fidelity funds. Mr. Curvey is a Director of Fidelity Investments Money Management, Inc. (2009-present), Director of Fidelity Research & Analysis Co. (2009-present) and Director of FMR and FMR Co., Inc. (2007-present). Mr. Curvey is also Vice Chairman (2007-present) and Director of FMR LLC. In addition, Mr. Curvey serves as an Overseer for the Boston Symphony Orchestra and a member of the Trustees of Villanova University. Previously, Mr. Curvey was the Vice Chairman (2006-2007) and Director (2000-2007) of FMR Corp. |
Abigail P. Johnson (1961) |
Year of Election or Appointment: 2009 Trustee Chairman of the Board of Trustees |
| Ms. Johnson also serves as Trustee of other Fidelity funds. Ms. Johnson serves as President of FMR LLC (2013-present), President of Fidelity Financial Services (2012-present) and President of Personal, Workplace and Institutional Services (2005-present). Ms. Johnson is Chairman and Director of FMR Co., Inc. (2011-present), Chairman and Director of FMR (2011-present), and the Vice Chairman and Director (2007-present) of FMR LLC. Previously, Ms. Johnson served as President and a Director of FMR (2001-2005), a Trustee of other investment companies advised by FMR, Fidelity Investments Money Management, Inc., and FMR Co., Inc. (2001-2005), Senior Vice President of the Fidelity funds (2001-2005), and managed a number of Fidelity funds. Ms. Abigail P. Johnson and Mr. Arthur E. Johnson are not related. |
* Trustees have been determined to be "Interested Trustees" by virtue of, among other things, their affiliation with the trust or various entities under common control with FMR.
+ The information above includes each Trustee's principal occupation during the last five years and other information relating to the experience, attributes, and skills relevant to each Trustee's qualifications to serve as a Trustee, which led to the conclusion that each Trustee should serve as a Trustee for each fund.
Independent Trustees:
Correspondence intended for each Independent Trustee (that is, the Trustees other than the Interested Trustees) may be sent to Fidelity Investments, P.O. Box 55235, Boston, Massachusetts 02205-5235.
Name, Year of Birth; Principal Occupations and Other Relevant Experience+ |
Elizabeth S. Acton (1951) |
Year of Election or Appointment: 2013 Trustee |
| Ms. Acton also serves as Trustee or Member of the Advisory Board of other Fidelity funds. Prior to her retirement in April 2012, Ms. Acton was Executive Vice President, Finance (2011-2012), Executive Vice President, Chief Financial Officer (2002-2011), and Treasurer (2004-2005) of Comerica Incorporated (financial services). Prior to joining Comerica, Ms. Acton held a variety of positions at Ford Motor Company (1983-2002), including Vice President and Treasurer (2000-2002) and Executive Vice President and Chief Financial Officer of Ford Motor Credit Company (1998-2000). Ms. Acton currently serves as a member of the Board of Directors and Audit and Finance Committees of Beazer Homes USA, Inc. (homebuilding, 2012-present). |
Albert R. Gamper, Jr. (1942) |
Year of Election or Appointment: 2006 Trustee Chairman of the Independent Trustees |
| Mr. Gamper also serves as Trustee of other Fidelity funds. Prior to his retirement in December 2004, Mr. Gamper served as Chairman of the Board of CIT Group Inc. (commercial finance). During his tenure with CIT Group Inc. Mr. Gamper served in numerous senior management positions, including Chairman (1987-1989; 1999-2001; 2002-2004), Chief Executive Officer (1987-2004), and President (2002-2003). Mr. Gamper currently serves as a member of the Board of Directors of Public Service Enterprise Group (utilities, 2000-present), a member of the Board of Trustees, Rutgers University (2004-present), and Chairman of the Board of Barnabas Health Care System. Previously, Mr. Gamper served as Vice Chairman of the Independent Trustees of certain Fidelity funds (2011-2012) and as Chairman of the Board of Governors, Rutgers University (2004-2007). |
Robert F. Gartland (1951) |
Year of Election or Appointment: 2010 Trustee |
| Mr. Gartland also serves as Trustee of other Fidelity funds. Mr. Gartland is Chairman and an investor in Gartland and Mellina Group Corp. (consulting, 2009-present). Previously, Mr. Gartland served as a partner and investor of Vietnam Partners LLC (investments and consulting, 2008-2011). Prior to his retirement, Mr. Gartland held a variety of positions at Morgan Stanley (financial services, 1979-2007) including Managing Director (1987-2007). |
Arthur E. Johnson (1947) |
Year of Election or Appointment: 2008 Trustee |
| Mr. Johnson also serves as Trustee of other Fidelity funds. Mr. Johnson serves as a member of the Board of Directors of Eaton Corporation (diversified power management, 2009-present), AGL Resources, Inc. (holding company, 2002-present) and Booz Allen Hamilton (management consulting, 2011-present). Prior to his retirement, Mr. Johnson served as Senior Vice President of Corporate Strategic Development of Lockheed Martin Corporation (defense contractor, 1999-2009). He previously served on the Board of Directors of IKON Office Solutions, Inc. (1999-2008) and Delta Airlines (2005-2007). Mr. Arthur E. Johnson is not related to Ms. Abigail P. Johnson. |
Michael E. Kenneally (1954) |
Year of Election or Appointment: 2009 Trustee |
| Mr. Kenneally also serves as Trustee of other Fidelity funds. Mr. Kenneally served as a Member of the Advisory Board for certain Fidelity funds before joining the Board of Trustees (2008-2009). Prior to his retirement, Mr. Kenneally served as Chairman and Global Chief Executive Officer of Credit Suisse Asset Management. Before joining Credit Suisse, he was an Executive Vice President and Chief Investment Officer for Bank of America Corporation. Earlier roles at Bank of America included Director of Research, Senior Portfolio Manager and Research Analyst, and Mr. Kenneally was awarded the Chartered Financial Analyst (CFA) designation in 1991. |
James H. Keyes (1940) |
Year of Election or Appointment: 2007 Trustee |
| Mr. Keyes also serves as Trustee of other Fidelity funds. Mr. Keyes serves as a member of the Board and Non-Executive Chairman of Navistar International Corporation (manufacture and sale of trucks, buses, and diesel engines, since 2002). Previously, Mr. Keyes served as a member of the Board of Pitney Bowes, Inc. (integrated mail, messaging, and document management solutions, 1998-2013). Prior to his retirement, Mr. Keyes served as Chairman (1993-2002) and Chief Executive Officer (1988-2002) of Johnson Controls (automotive, building, and energy) and as a member of the Board of LSI Logic Corporation (semiconductor technologies, 1984-2008). |
Marie L. Knowles (1946) |
Year of Election or Appointment: 2001 Trustee Vice Chairman of the Independent Trustees |
| Ms. Knowles also serves as Trustee of other Fidelity funds. Prior to Ms. Knowles' retirement in June 2000, she served as Executive Vice President and Chief Financial Officer of Atlantic Richfield Company (ARCO) (diversified energy, 1996-2000). From 1993 to 1996, she was a Senior Vice President of ARCO and President of ARCO Transportation Company. She served as a Director of ARCO from 1996 to 1998. Ms. Knowles currently serves as a Director and Chairman of the Audit Committee of McKesson Corporation (healthcare service, since 2002). Ms. Knowles is a member of the Board of the Catalina Island Conservancy and of the Santa Catalina Island Company (2009-present). She also serves as a member of the Advisory Board for the School of Engineering of the University of Southern California. Previously, Ms. Knowles served as a Director of Phelps Dodge Corporation (copper mining and manufacturing, 1994-2007), URS Corporation (engineering and construction, 2000-2003) and America West (airline, 1999-2002). |
Kenneth L. Wolfe (1939) |
Year of Election or Appointment: 2005 Trustee |
| Mr. Wolfe also serves as Trustee of other Fidelity funds. Prior to his retirement, Mr. Wolfe served as Chairman and a Director (2007-2009) and Chairman and Chief Executive Officer (1994-2001) of Hershey Foods Corporation. He also served as a member of the Boards of Adelphia Communications Corporation (telecommunications, 2003-2006), Bausch & Lomb, Inc. (medical/pharmaceutical, 1993-2007), and Revlon, Inc. (personal care products, 2004-2009). Mr. Wolfe previously served as Chairman of the Independent Trustees of other Fidelity funds (2008-2012). |
+ The information above includes each Trustee's principal occupation during the last five years and other information relating to the experience, attributes, and skills relevant to each Trustee's qualifications to serve as a Trustee, which led to the conclusion that each Trustee should serve as a Trustee for each fund.
Officers:
Correspondence intended for each officer may be sent to Fidelity Investments, 245 Summer Street, Boston, Massachusetts 02210. Officers appear below in alphabetical order.
Name, Year of Birth; Principal Occupation |
Elizabeth Paige Baumann (1968) |
Year of Election or Appointment: 2012 Anti-Money Laundering (AML) Officer |
| Ms. Baumann also serves as AML Officer of other funds. She is Chief AML Officer of FMR LLC (2012-present) and is an employee of Fidelity Investments. Previously, Ms. Baumann served as Vice President and Deputy Anti-Money Laundering Officer (2007-2012). |
Marc Bryant (1966) |
Year of Election or Appointment: 2013 Assistant Secretary |
| Mr. Bryant also serves as an officer of other funds. He is Senior Vice President and Deputy General Counsel of FMR LLC. Prior to joining Fidelity Investments, Mr. Bryant served as a Senior Vice President and the Head of Global Retail Legal for AllianceBernstein L.P. (2006-2010), and as the General Counsel for ProFund Advisors LLC (2001-2006). |
Jonathan Davis (1968) |
Year of Election or Appointment: 2010 Assistant Treasurer |
| Mr. Davis also serves as Assistant Treasurer of other funds. Mr. Davis is an employee of Fidelity Investments. Previously, Mr. Davis served as Vice President and Associate General Counsel of FMR LLC (2003-2010). |
Adrien E. Deberghes (1967) |
Year of Election or Appointment: 2010 Assistant Treasurer |
| Mr. Deberghes also serves as an officer of other funds. He is an employee of Fidelity Investments (2008-present). Prior to joining Fidelity Investments, Mr. Deberghes was Senior Vice President of Mutual Fund Administration at State Street Corporation (2007-2008), Senior Director of Mutual Fund Administration at Investors Bank & Trust (2005-2007), and Director of Finance for Dunkin' Brands (2000-2005). |
Stephanie J. Dorsey (1969) |
Year of Election or Appointment: 2013 President and Treasurer |
| Ms. Dorsey also serves as an officer of other funds. She is an employee of Fidelity Investments (2008-present) and has served in other fund officer roles. Prior to joining Fidelity Investments, Ms. Dorsey served as Treasurer (2004-2008) of the JPMorgan Mutual Funds and Vice President (2004-2008) of JPMorgan Chase Bank. |
Scott C. Goebel (1968) |
Year of Election or Appointment: 2008 Secretary and Chief Legal Officer (CLO) |
| Mr. Goebel serves as Secretary and CLO of other funds. Mr. Goebel also serves as Secretary of Fidelity Investments Money Management, Inc. (FIMM) (2010-present) and Fidelity Research and Analysis Company (FRAC) (2010-present); General Counsel, Secretary, and Senior Vice President of FMR (2008-present) and FMR Co., Inc. (2008-present); Chief Legal Officer of Fidelity Management & Research (Hong Kong) Limited (2008-present) and Assistant Secretary of Fidelity Management & Research (Japan) Inc. (2008-present), and Fidelity Management & Research (U.K.) Inc. (2008-present). Previously, Mr. Goebel served as Secretary and CLO of other Fidelity funds (2008-2013), Assistant Secretary of FIMM (2008-2010), FRAC (2008-2010), and certain funds (2007-2008); and as Vice President and Secretary of Fidelity Distributors Corporation (FDC) (2005-2007). Mr. Goebel has been employed by FMR LLC or an affiliate since 2001. |
Bruce T. Herring (1965) |
Year of Election or Appointment: 2013 Vice President of Fidelity's Asset Allocation Funds |
| Mr. Herring also serves as Vice President of other funds. He serves as Chief Investment Officer of Fidelity Global Asset Allocation (GAA) (2013-present), Group Chief Investment Officer of FMR, and President of Fidelity Research & Analysis Company (2010-present). Previously, Mr. Herring served as Chief Investment Officer and Director of Fidelity Management & Research (U.K.) Inc. (2010-2013), Vice President (2005-2006) and Senior Vice President (2006-2007) of Fidelity Management & Research Company, Vice President of FMR Co., Inc. (2001-2007), and as a portfolio manager for Fidelity U.S. Equity Funds. |
Chris Maher (1972) |
Year of Election or Appointment: 2013 Assistant Treasurer |
| Mr. Maher serves as Assistant Treasurer of other funds. Mr. Maher is Vice President of Valuation Oversight and is an employee of Fidelity Investments. Previously, Mr. Maher served as Vice President of Asset Management Compliance (2013), Vice President of FMR's Program Management Group (2010-2013), and Vice President of Valuation Oversight (2008-2010). |
Charles S. Morrison (1960) |
Year of Election or Appointment: 2012 Vice President |
| Mr. Morrison also serves as Vice President of other funds. He serves as President, Fixed Income and is an employee of Fidelity Investments. Previously, Mr. Morrison served as Vice President of Fidelity's Money Market Funds (2005-2009), President, Money Market Group Leader of FMR (2009), and Senior Vice President, Money Market Group of FMR (2004-2009). Mr. Morrison also served as Vice President of Fidelity's Bond Funds (2002-2005), certain Balanced Funds (2002-2005), and certain Asset Allocation Funds (2002-2007), and as Senior Vice President (2002-2005) of Fidelity's Fixed Income Division. |
Christine Reynolds (1958) |
Year of Election or Appointment: 2008 Chief Financial Officer |
| Ms. Reynolds also serves as Chief Financial Officer of other funds. Ms. Reynolds became President of Fidelity Pricing and Cash Management Services (FPCMS) in August 2008. Ms. Reynolds served as Chief Operating Officer of FPCMS (2007-2008). Previously, Ms. Reynolds served as President, Treasurer, and Anti-Money Laundering officer of the Fidelity funds (2004-2007). |
Kenneth B. Robins (1969) |
Year of Election or Appointment: 2009 Assistant Treasurer |
| Mr. Robins also serves as an officer of other funds. Mr. Robins serves as Executive Vice President of Fidelity Investments Money Management, Inc. (FIMM) (2013-present) and is an employee of Fidelity Investments (2004-present). Previously, Mr. Robins served in other fund officer roles. |
Gary W. Ryan (1958) |
Year of Election or Appointment: 2005 Assistant Treasurer |
| Mr. Ryan also serves as Assistant Treasurer of other funds. Mr. Ryan is an employee of Fidelity Investments and has served in other fund officer roles. Previously, Mr. Ryan served as Vice President of Fund Reporting in Fidelity Pricing and Cash Management Services (FPCMS) (1999-2005). |
Stephen Sadoski (1971) |
Year of Election or Appointment: 2013 Deputy Treasurer |
| Mr. Sadoski also serves as Deputy Treasurer of other funds. He is an employee of Fidelity Investments (2012-present) and has served in another fund officer role. Prior to joining Fidelity Investments, Mr. Sadoski served as an assistant chief accountant in the Division of Investment Management of the Securities and Exchange Commission (SEC) (2009-2012) and as a senior manager at Deloitte & Touche LLP (1997-2009). |
Stacie M. Smith (1974) |
Year of Election or Appointment: 2013 Assistant Treasurer |
| Ms. Smith also serves as an officer of other funds. She is an employee of Fidelity Investments (2009-present) and has served in other fund officer roles. Prior to joining Fidelity Investments, Ms. Smith served as Senior Audit Manager of Ernst & Young LLP (1996-2009). |
Renee Stagnone (1975) |
Year of Election or Appointment: 2013 Deputy Treasurer |
| Ms. Stagnone also serves as Deputy Treasurer of other funds. Ms. Stagnone is an employee of Fidelity Investments. |
Michael H. Whitaker (1967) |
Year of Election or Appointment: 2008 Chief Compliance Officer |
| Mr. Whitaker also serves as Chief Compliance Officer of other funds. Mr. Whitaker is an employee of Fidelity Investments (2007-present). Prior to joining Fidelity Investments, Mr. Whitaker worked at MFS Investment Management where he served as Senior Vice President and Chief Compliance Officer (2004-2006), and Assistant General Counsel. |
Derek L. Young (1964) |
Year of Election or Appointment: 2009 Vice President of Fidelity's Asset Allocation Funds |
| Mr. Young also serves as Trustee or an officer of other funds. He is President and a Director of Strategic Advisers, Inc. (2011-present), President of Fidelity Global Asset Allocation (GAA) (2011-present), and Vice Chairman of Pyramis Global Advisors, LLC (2011-present). Previously, Mr. Young served as Chief Investment Officer of GAA (2009-2011) and as a portfolio manager. |
Joseph F. Zambello (1957) |
Year of Election or Appointment: 2011 Deputy Treasurer |
| Mr. Zambello also serves as Deputy Treasurer of other funds. Mr. Zambello is an employee of Fidelity Investments. Previously, Mr. Zambello served as Vice President of FMR's Program Management Group (2009-2011) and Vice President of the Transfer Agent Oversight Group (2005-2009). |
Annual Report
The Board of Trustees of each fund voted to pay to shareholders of record at the opening of business on record date, the following distributions per share derived from capital gains realized from sales of portfolio securities:
Fund | Pay Date | Record Date | Capital Gains |
VIP Investor Freedom Income Portfolio | 02/14/2014 | 02/14/2014 | $0.085 |
VIP Investor Freedom 2005 Portfolio | 02/14/2014 | 02/14/2014 | $0.102 |
VIP Investor Freedom 2010 Portfolio | 02/14/2014 | 02/14/2014 | $0.160 |
VIP Investor Freedom 2015 Portfolio | 02/14/2014 | 02/14/2014 | $0.135 |
VIP Investor Freedom 2020 Portfolio | 02/14/2014 | 02/14/2014 | $0.133 |
VIP Investor Freedom 2025 Portfolio | 02/14/2014 | 02/14/2014 | $0.144 |
VIP Investor Freedom 2030 Portfolio | 02/14/2014 | 02/14/2014 | $0.140 |
The funds hereby designate as capital gain dividend the amounts noted below for the taxable year ended December 31, 2013, or, if subsequently determined to be different, the net capital gain of such year.
Fund | |
VIP Investor Freedom Income Portfolio | $458,987 |
VIP Investor Freedom 2005 Portfolio | $175,310 |
VIP Investor Freedom 2010 Portfolio | $747,092 |
VIP Investor Freedom 2015 Portfolio | $1,099,775 |
VIP Investor Freedom 2020 Portfolio | $1,899,913 |
VIP Investor Freedom 2025 Portfolio | $1,417,812 |
VIP Investor Freedom 2030 Portfolio | $1,390,648 |
A percentage of the dividends distributed during the fiscal year for the following funds were derived from interest on U.S. Government securities which is generally exempt from state income tax:
VIP Investor Freedom Income Portfolio | 8.09% |
VIP Investor Freedom 2005 Portfolio | 5.87% |
VIP Investor Freedom 2010 Portfolio | 5.03% |
VIP Investor Freedom 2015 Portfolio | 4.79% |
VIP Investor Freedom 2020 Portfolio | 4.20% |
VIP Investor Freedom 2025 Portfolio | 3.22% |
VIP Investor Freedom 2030 Portfolio | 1.28% |
A percentage of the dividends distributed during the fiscal year for the following funds qualifies for the dividends-received deduction for corporate shareholders:
Fund | February 2013 | December 2013 |
VIP Investor Freedom Income Portfolio | 5% | 11% |
VIP Investor Freedom 2005 Portfolio | 8% | 16% |
VIP Investor Freedom 2010 Portfolio | 2% | 19% |
VIP Investor Freedom 2015 Portfolio | 7% | 21% |
VIP Investor Freedom 2020 Portfolio | 2% | 23% |
VIP Investor Freedom 2025 Portfolio | 4% | 26% |
VIP Investor Freedom 2030 Portfolio | 5% | 32% |
Annual Report
The amounts per share which represent income derived from sources within, and taxes paid to, foreign countries or possessions of the United States are as follows:
Fund | Pay Date | Income | Taxes |
VIP Investor Freedom Income Portfolio | 02/15/2013 | $0.0001 | $0.0000 |
| 12/27/2013 | $0.0113 | $0.0007 |
VIP Investor Freedom 2005 Portfolio | 02/15/2013 | $0.0001 | $0.0000 |
| 12/27/2013 | $0.0178 | $0.0011 |
VIP Investor Freedom 2010 Portfolio | 02/15/2013 | $0.0006 | $0.0000 |
| 12/27/2013 | $0.0248 | $0.0015 |
VIP Investor Freedom 2015 Portfolio | 02/15/2013 | $0.0002 | $0.0000 |
| 12/27/2013 | $0.0274 | $0.0017 |
VIP Investor Freedom 2020 Portfolio | 02/15/2013 | $0.0002 | $0.0000 |
| 12/27/2013 | $0.0291 | $0.0018 |
VIP Investor Freedom 2025 Portfolio | 02/15/2013 | $0.0003 | $0.0000 |
| 12/27/2013 | $0.0349 | $0.0021 |
VIP Investor Freedom 2030 Portfolio | 02/15/2013 | $0.0004 | $0.0000 |
| 12/27/2013 | $0.0431 | $0.0026 |
Annual Report
Board Approval of Investment Advisory Contracts and Management Fees
VIP Investor Freedom Funds
Each year, the Board of Trustees, including the Independent Trustees (together, the Board), votes on the renewal of the management contract (the Advisory Contract) with Strategic Advisers, Inc. (Strategic Advisers) and the administration agreement for each fund. The Board, assisted by the advice of fund counsel and Independent Trustees' counsel, requests and considers a broad range of information relevant to the renewal of the Advisory Contracts throughout the year.
The Board meets regularly and, at each of its meetings, covers an extensive agenda of topics and materials and considers factors that are relevant to its annual consideration of the renewal of each fund's Advisory Contract, including the services and support provided to each fund and its shareholders. The Board has established four standing committees, Operations, Audit, Fair Valuation, and Governance and Nominating, each composed of and chaired by Independent Trustees with varying backgrounds, to which the Board has assigned specific subject matter responsibilities in order to enhance effective decision-making by the Board. The Operations Committee, of which all of the Independent Trustees are members, meets regularly throughout the year and, among other matters, considers matters specifically related to the annual consideration of the renewal of each fund's Advisory Contract. The Board, acting directly and through its Committees, requests and receives information concerning the annual consideration of the renewal of each fund's Advisory Contract. The Board also meets as needed to consider matters specifically related to the Board's annual consideration of the renewal of Advisory Contracts. Members of the Board may also meet with trustees of other Fidelity funds through ad hoc joint committees to discuss certain matters relevant to the Fidelity funds.
At its September 2013 meeting, the Board, including the Independent Trustees, unanimously determined to renew each fund's Advisory Contract. In reaching its determination, the Board considered all factors it believed relevant and reached a determination, with the assistance of fund counsel and Independent Trustees' counsel and through the exercise of its business judgment, that the renewal of the Advisory Contract was in the best interests of each fund and its shareholders and the fact that no fees are payable under the Advisory Contracts was fair and reasonable. The Board's decision to renew the Advisory Contracts was not based on any single factor, but rather was based on a comprehensive consideration of all the information provided to the Board at its meetings throughout the year. In reaching its determination, the Board was aware that shareholders in each fund have a broad range of investment choices available to them, including a wide choice among mutual funds offered by Fidelity's competitors, and that each fund's shareholders, who have the opportunity to review and weigh the disclosure provided by the fund in its prospectus and other public disclosures, have chosen to invest in that fund, which is part of the Fidelity family of funds.
Nature, Extent, and Quality of Services Provided. The Board considered Fidelity's staffing as it relates to the funds, including the backgrounds of investment personnel of Strategic Advisers, and also considered the funds' investment objectives, strategies, and related investment philosophies. The Independent Trustees also had discussions with senior management of Fidelity's investment operations and investment groups with responsibility for the underlying Fidelity funds in which each fund invests. The Board considered the structure of the portfolio manager compensation program and whether this structure provides appropriate incentives to act in the best interests of each fund.
Resources Dedicated to Investment Management and Support Services. The Board reviewed the general qualifications and capabilities of Fidelity's investment staff, including its size, education, experience, and resources, as well as Fidelity's approach to recruiting, managing, and compensating investment personnel. The Board noted that Fidelity has continued to increase the resources devoted to non-U.S. offices, including expansion of Fidelity's global investment organization. The Board also noted that Fidelity's analysts have extensive resources, tools and capabilities that allow them to conduct sophisticated quantitative and fundamental analysis, as well as credit analysis of issuers, counterparties and guarantors. Further, the Board believes that Fidelity's investment professionals have sufficient access to global information and data so as to provide competitive investment results over time, and that those professionals also have access to sophisticated tools that permit them to assess portfolio construction and risk and performance attribution characteristics continuously, as well as to transmit new information and research conclusions rapidly around the world. Additionally, in its deliberations, the Board considered Fidelity's risk management capabilities and resources, which are an integral part of the investment management process.
Shareholder and Administrative Services. The Board considered (i) the nature, extent, quality, and cost of advisory, administrative, and shareholder services performed by Fidelity affiliates under the Advisory Contract and the administration agreement and under separate agreements covering transfer agency and pricing and bookkeeping services for each fund; (ii) the nature and extent of the supervision of third party service providers, principally custodians and subcustodians; and (iii) the resources devoted to, and the record of compliance with, each fund's compliance policies and procedures.
The Board noted that the growth of fund assets over time across the complex allows Fidelity to reinvest in the development of services designed to enhance the value or convenience of the Fidelity funds as investment vehicles. These services include 24-hour access to account information and market information through telephone representatives and over the Internet, investor education materials and asset allocation tools, and the expanded availability of Fidelity Investor Centers.
Investment in a Large Fund Family. The Board considered the benefits to shareholders of investing in a Fidelity fund, including the benefits of investing in a fund that is part of a large family of funds offering a variety of investment disciplines and providing a large variety of mutual fund investor services. The Board noted that Fidelity had taken, or had made recommendations that resulted in the Fidelity funds taking, a number of actions over the previous year that benefited particular funds, including (i) continuing to dedicate additional resources to investment research and to the support of the senior management team that oversees asset management; (ii) persisting in efforts to enhance Fidelity's global research capabilities; (iii) launching new funds and making other enhancements to meet client needs for global and income-oriented solutions; (iv) continuing to launch dedicated lower cost underlying funds to meet portfolio construction needs related to expanding underlying fund options for Fidelity funds of funds, specifically for the Freedom Fund product lines; (v) rationalizing product lines and gaining increased efficiencies through the combination of several funds with other funds; (vi) strengthening Fidelity's index fund offerings by reducing investment minimums and adopting or lowering existing expense caps for certain funds and classes; (vii) enhancing Global Asset Allocation product offerings by launching new funds and strategies, including "open architecture" target date funds that utilize affiliated and unaffiliated sub-advisers; (viii) modifying the eligibility criteria for Institutional Class shares of Advisor funds to increase their marketability to a portion of the defined contribution plan market; (ix) creating a new low-cost retirement share class for certain Advisor funds to appeal to large retirement plans; (x) transitioning the management of certain Fidelity commodity funds to Geode Capital Management LLC, a registered commodity pool operator, while retaining administrative responsibilities for the funds; and (xi) taking steps toward establishing a new Fidelity adviser to manage sector-based funds and products.
Annual Report
Investment Performance. The Board considered whether each fund has operated in accordance with its investment objective, as well as its record of compliance with its investment restrictions and its performance history.
The Board took into account discussions with the investment adviser about fund investment performance that occur at Board meetings throughout the year. In this regard the Board noted that as part of regularly scheduled fund reviews and other reports to the Board on fund performance, the Board periodically considers annualized return information for each fund for different time periods, measured against one or more securities market indices, including a customized blended index representative of the fund's asset classes (each a "benchmark index") and a peer group of mutual funds with similar objectives ("peer group"). In its evaluation of fund investment performance at meetings throughout the year, the Board gave particular attention to information indicating underperformance of certain Fidelity funds for specific time periods and the investment adviser's explanations for such underperformance.
In addition to reviewing absolute and relative fund performance, the Independent Trustees periodically consider the appropriateness of fund performance metrics in evaluating the results achieved. In general, the Independent Trustees believe that fund performance should be evaluated based on gross performance (before fees and expenses, including acquired fund fees and expenses, but after transaction costs, if any) compared to appropriate benchmark indices, over appropriate time periods that may include full market cycles, and on net performance (after fees and expenses) compared to peer groups, as applicable, over the same periods, taking into account relevant factors including the following: general market conditions; the extent to which particular underlying funds affected performance; and fund cash flows and other factors. Depending on the circumstances, the Independent Trustees may be satisfied with a fund's performance notwithstanding that it lags its benchmark index or peer group for certain periods.
The Independent Trustees recognize that shareholders evaluate performance on a net basis over their own holding periods, for which one-, three-, and five-year periods are often used as a proxy. For this reason, the performance information reviewed by the Board also included net cumulative calendar year total return information for each fund and an appropriate benchmark index for the most recent one-, three-, and five-year periods.
Based on its review, the Board concluded that the nature, extent, and quality of services provided to each fund under the Advisory Contract should benefit each fund's shareholders.
Competitiveness of Management Fee and Total Expense Ratio. The Board noted that the funds do not pay Strategic Advisers a management fee for investment advisory services. The Board considered each fund's management fee and total expense ratio compared to "mapped groups" of competitive funds and classes, and also considered that each fund bears indirectly the expenses of the underlying Fidelity funds in which it invests. Fidelity creates "mapped groups" by combining similar Lipper investment objective categories that have comparable investment mandates. Combining Lipper investment objective categories aids the Board's management fee and total expense ratio comparisons by broadening the competitive group used for comparison and by reducing the number of universes to which various Fidelity funds are compared.
Management Fee. The Board considered two proprietary management fee comparisons for the 12-month periods shown in the charts below. The group of Lipper funds used by the Board for management fee comparisons is referred to below as the "Total Mapped Group." The Total Mapped Group comparison focuses on a fund's standing in terms of gross management fees before expense reimbursements or caps relative to the total universe of funds with comparable investment mandates, regardless of whether their management fee structures also are comparable. "TMG %" represents the percentage of funds in the Total Mapped Group that had management fees that were lower than a fund's. For example, a hypothetical TMG % of 50% would mean that half of the funds in the Total Mapped Group had higher, and half had lower, management fees than a fund. The funds' actual TMG %s are in the charts below. The "Asset-Size Peer Group" (ASPG) comparison focuses on a fund's standing relative to a subset of non-Fidelity funds within the Total Mapped Group that are similar in size and management fee structure. For example, if a fund is in the first quartile of the ASPG, the fund's management fee ranks in the least expensive or lowest 25% of funds in the ASPG. The ASPG represents at least 15% of the funds in the Total Mapped Group with comparable asset size and management fee structures, subject to a minimum of 50 funds (or all funds in the Total Mapped Group if fewer than 50). Additional information, such as the ASPG quartile in which a fund's management fee rate ranked, is also included in the charts and considered by the Board.
Annual Report
Board Approval of Investment Advisory Contracts and Management Fees - continued
VIP Investor Freedom 2005 Portfolio
VIP Investor Freedom 2010 Portfolio
Annual Report
VIP Investor Freedom 2015 Portfolio
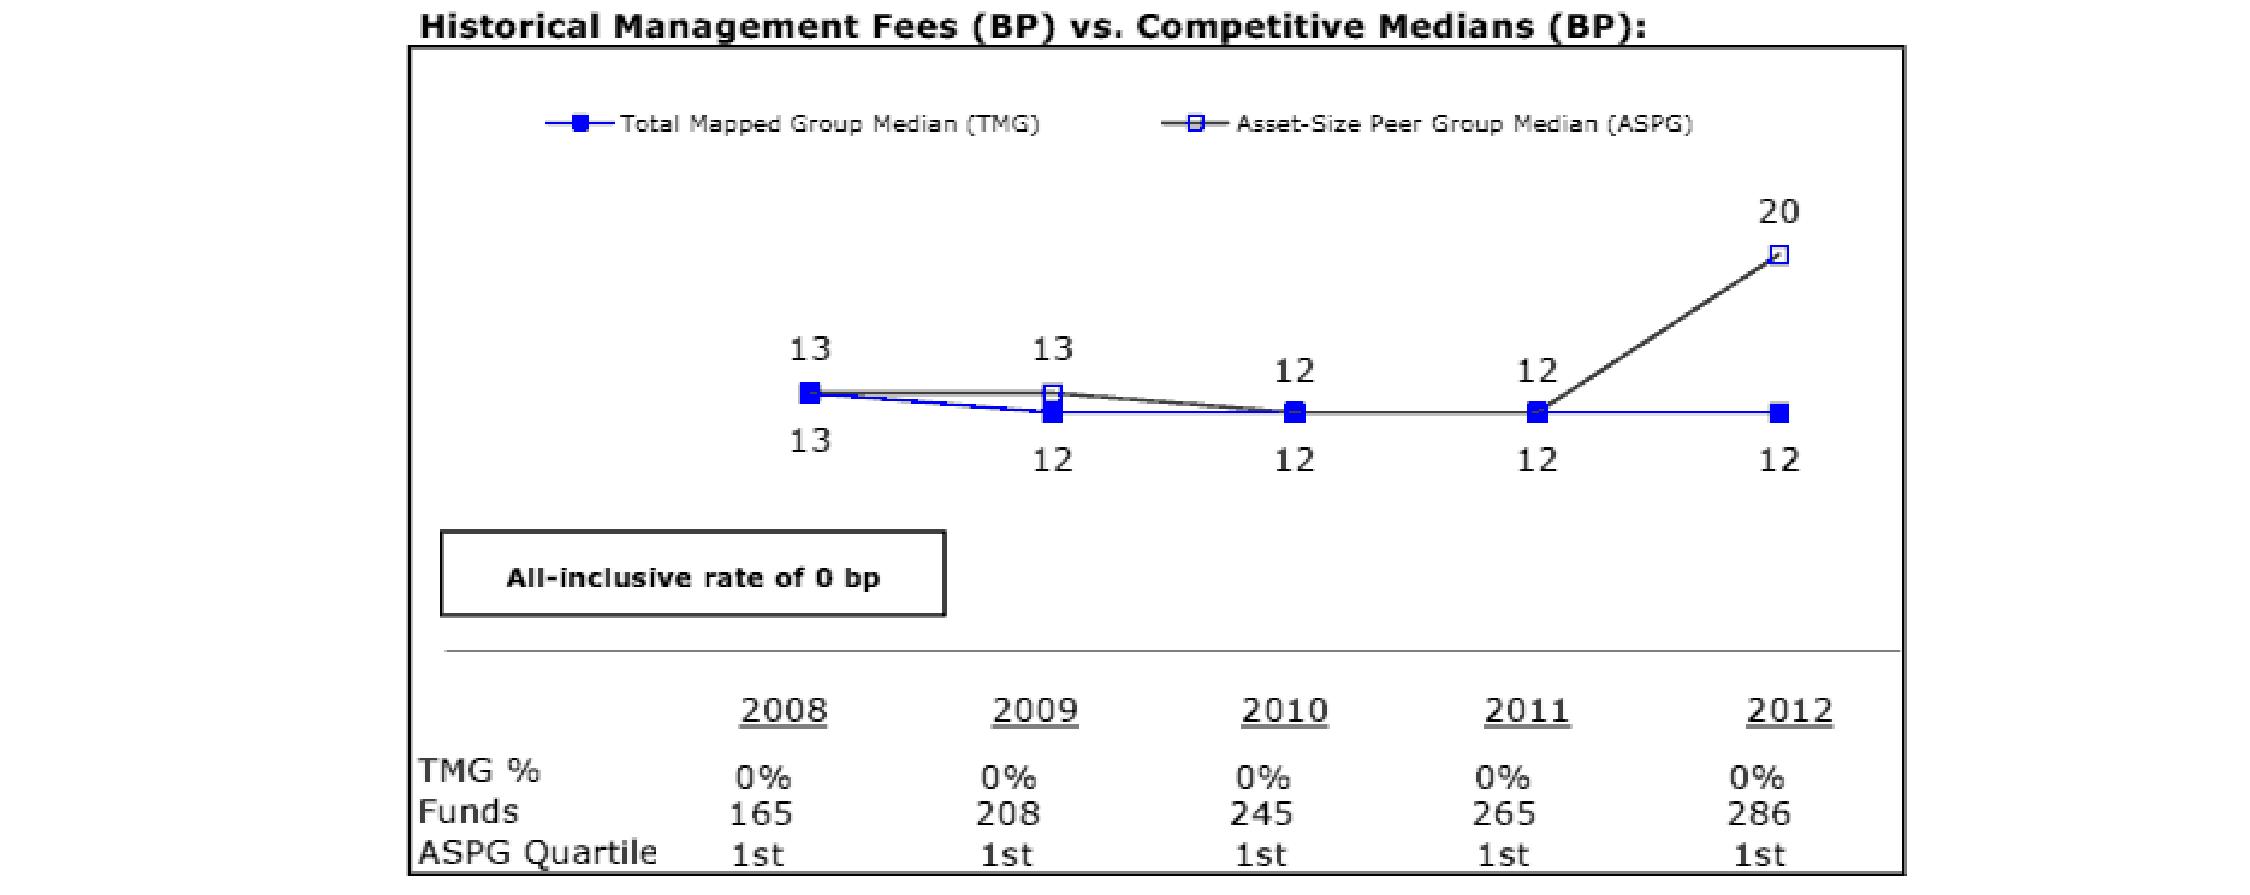
VIP Investor Freedom 2020 Portfolio
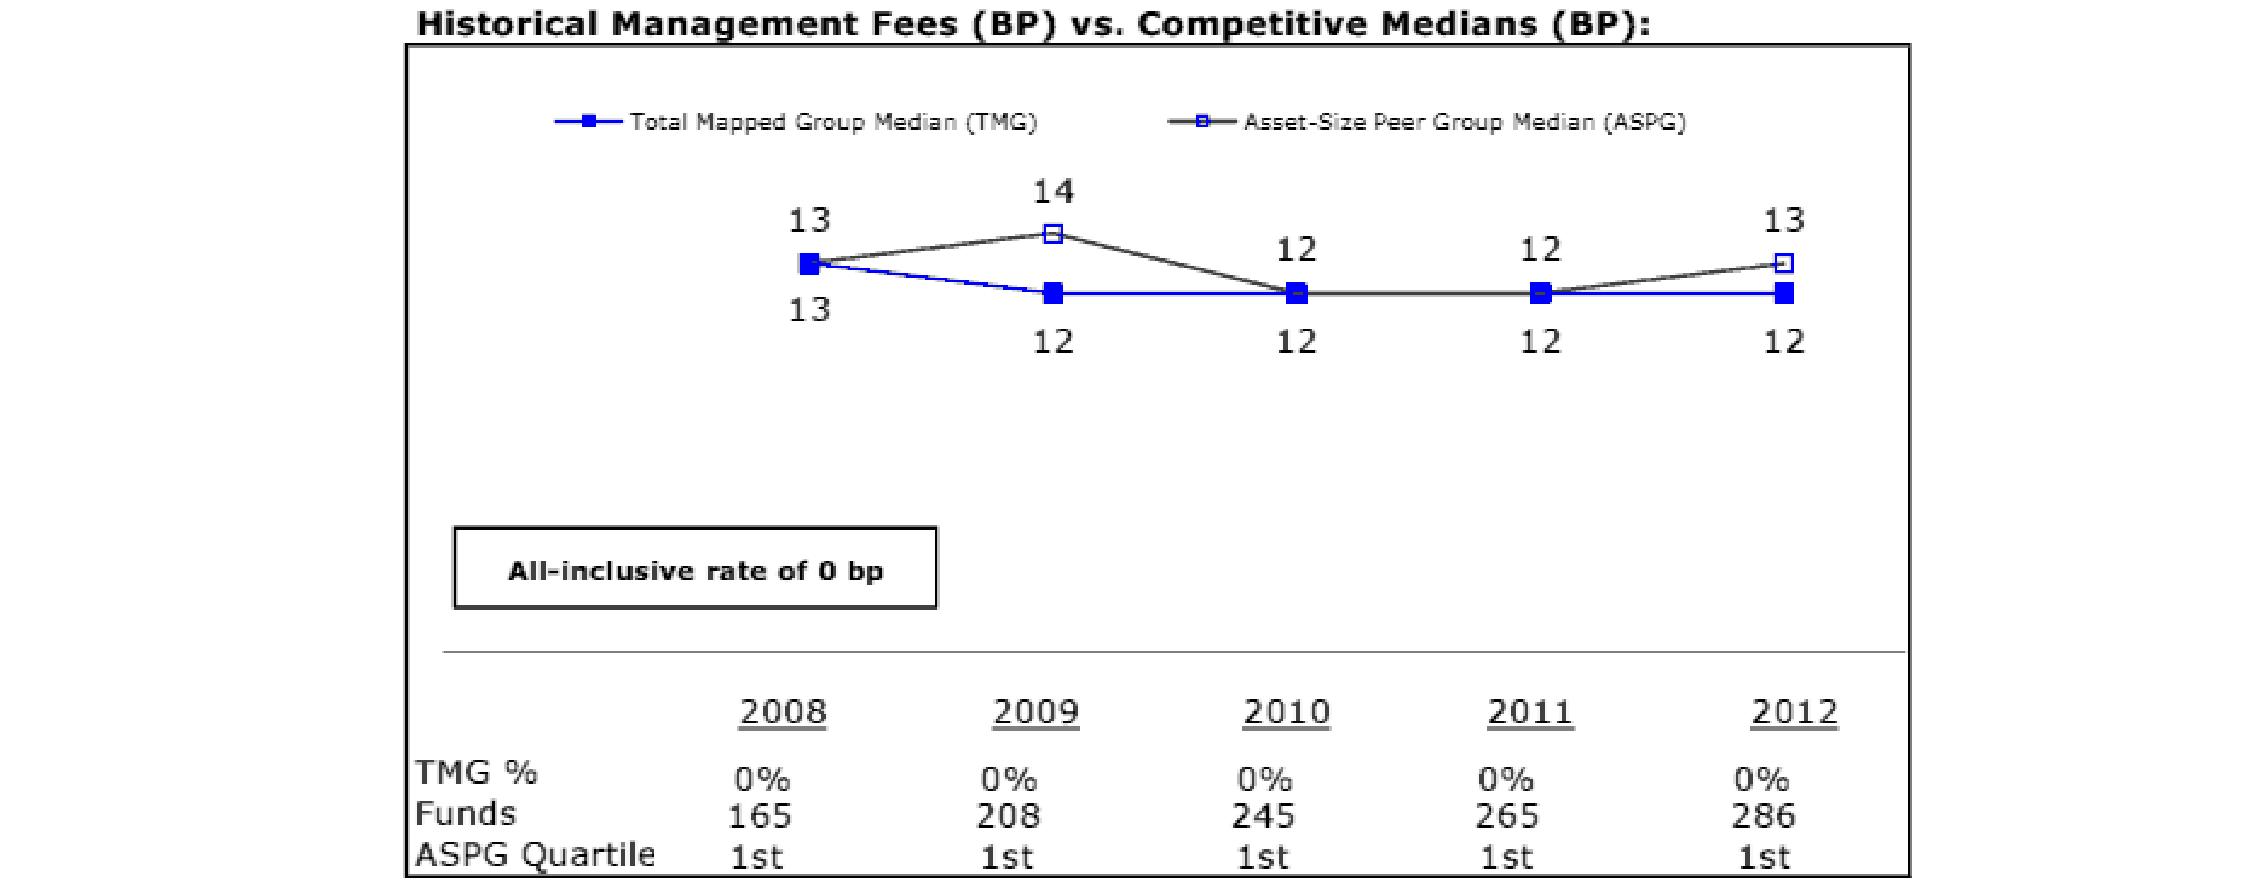
Annual Report
Board Approval of Investment Advisory Contracts and Management Fees - continued
VIP Investor Freedom 2025 Portfolio
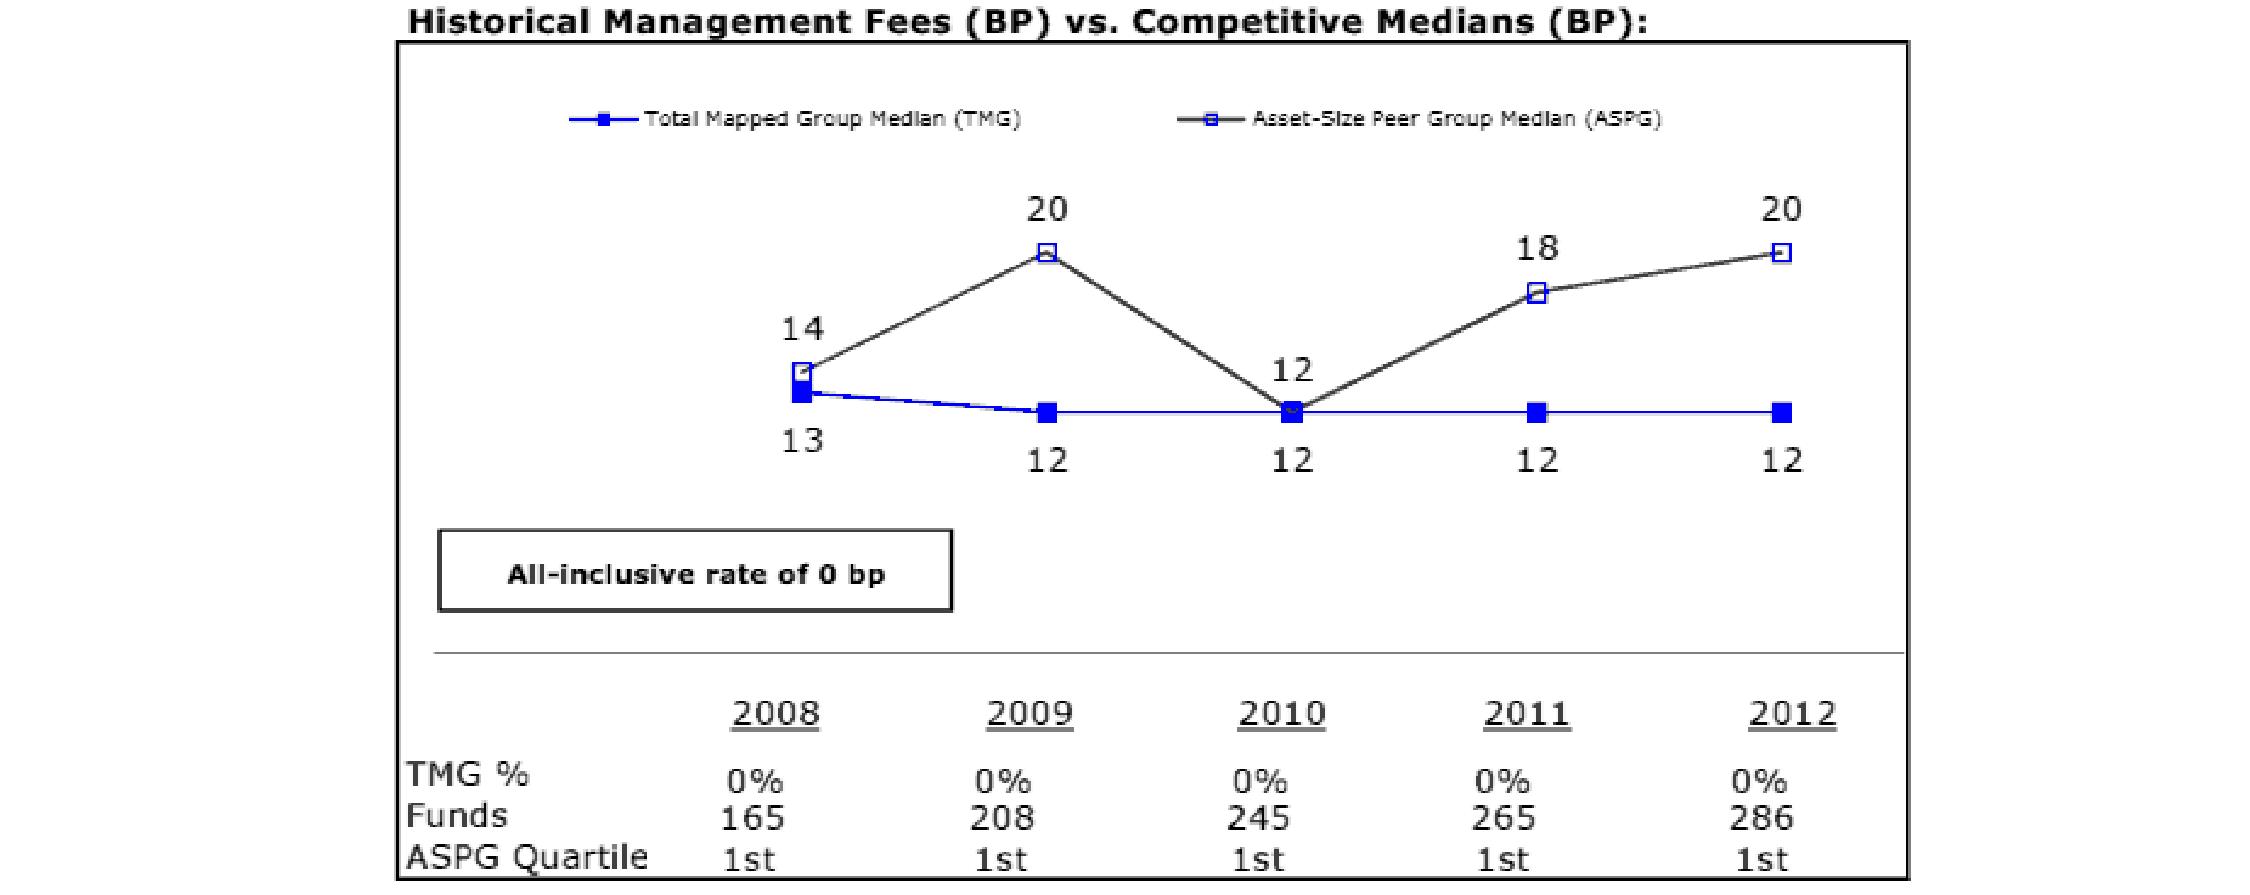
VIP Investor Freedom 2030 Portfolio
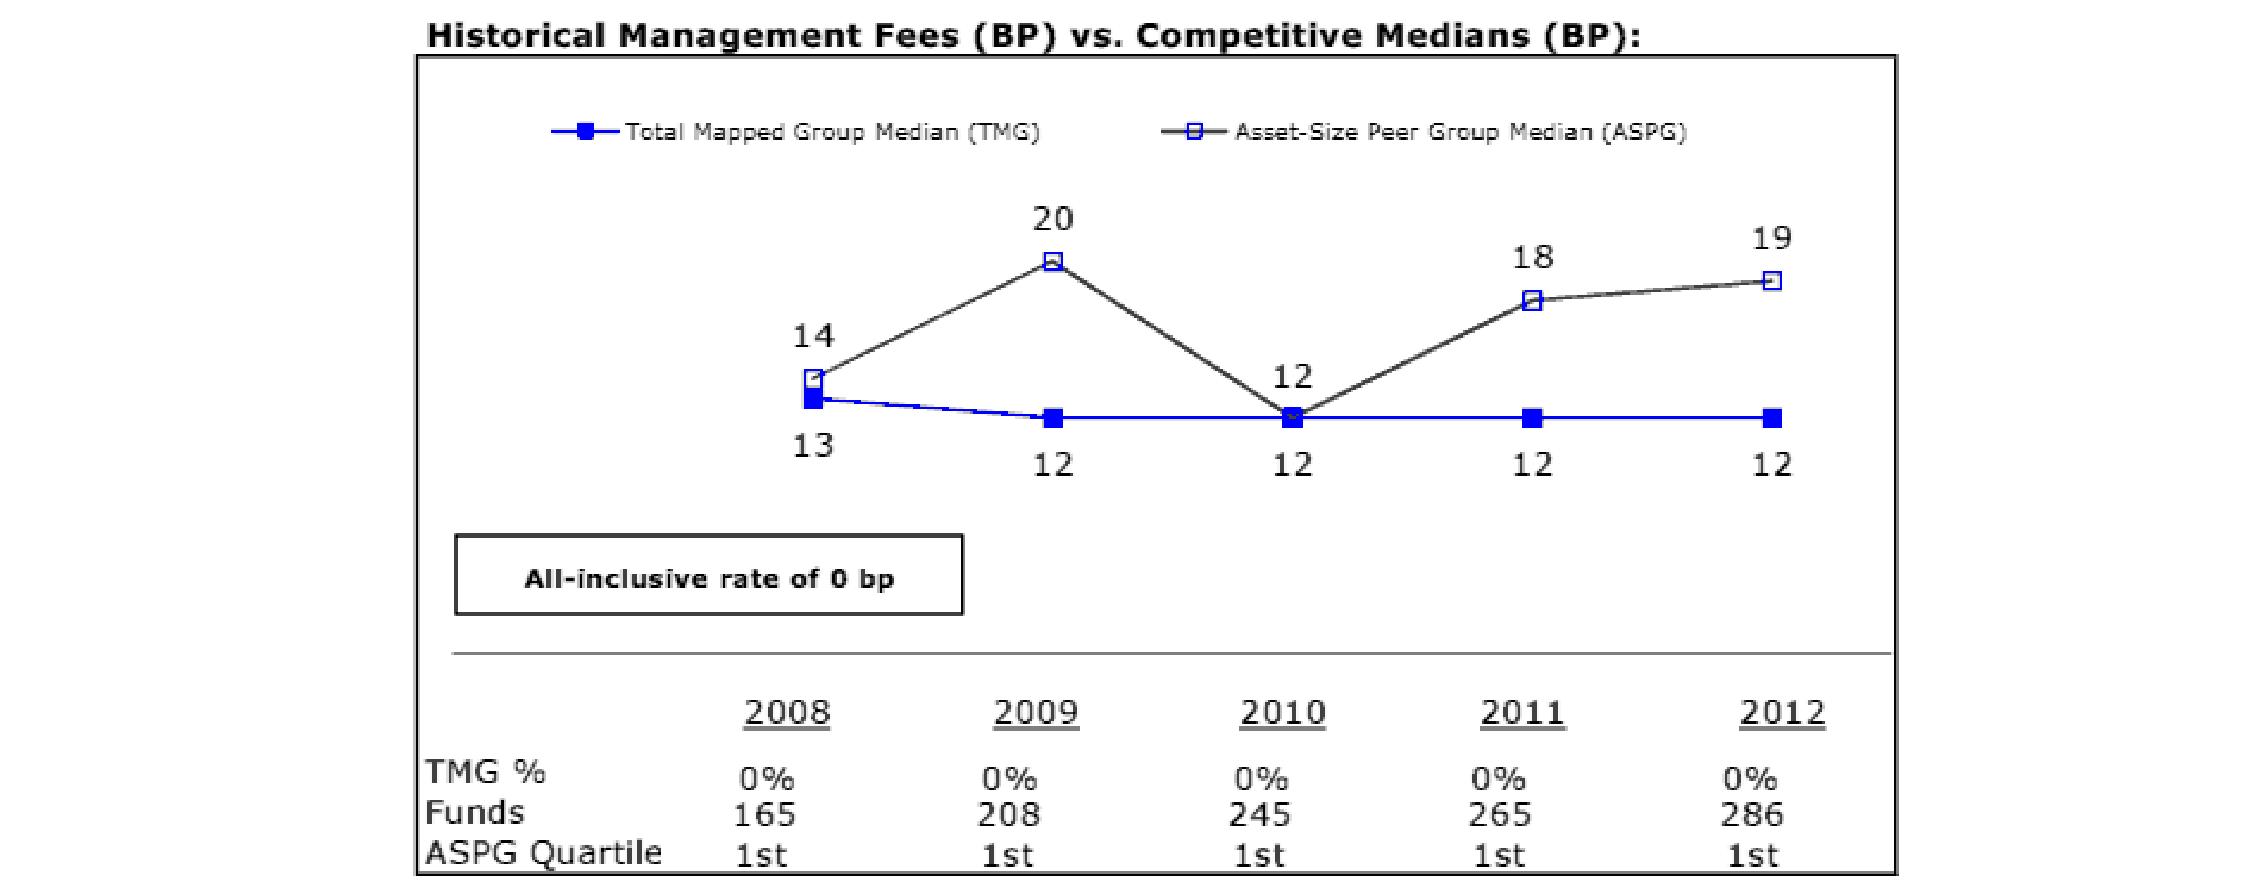
Annual Report
VIP Investor Freedom Income Portfolio
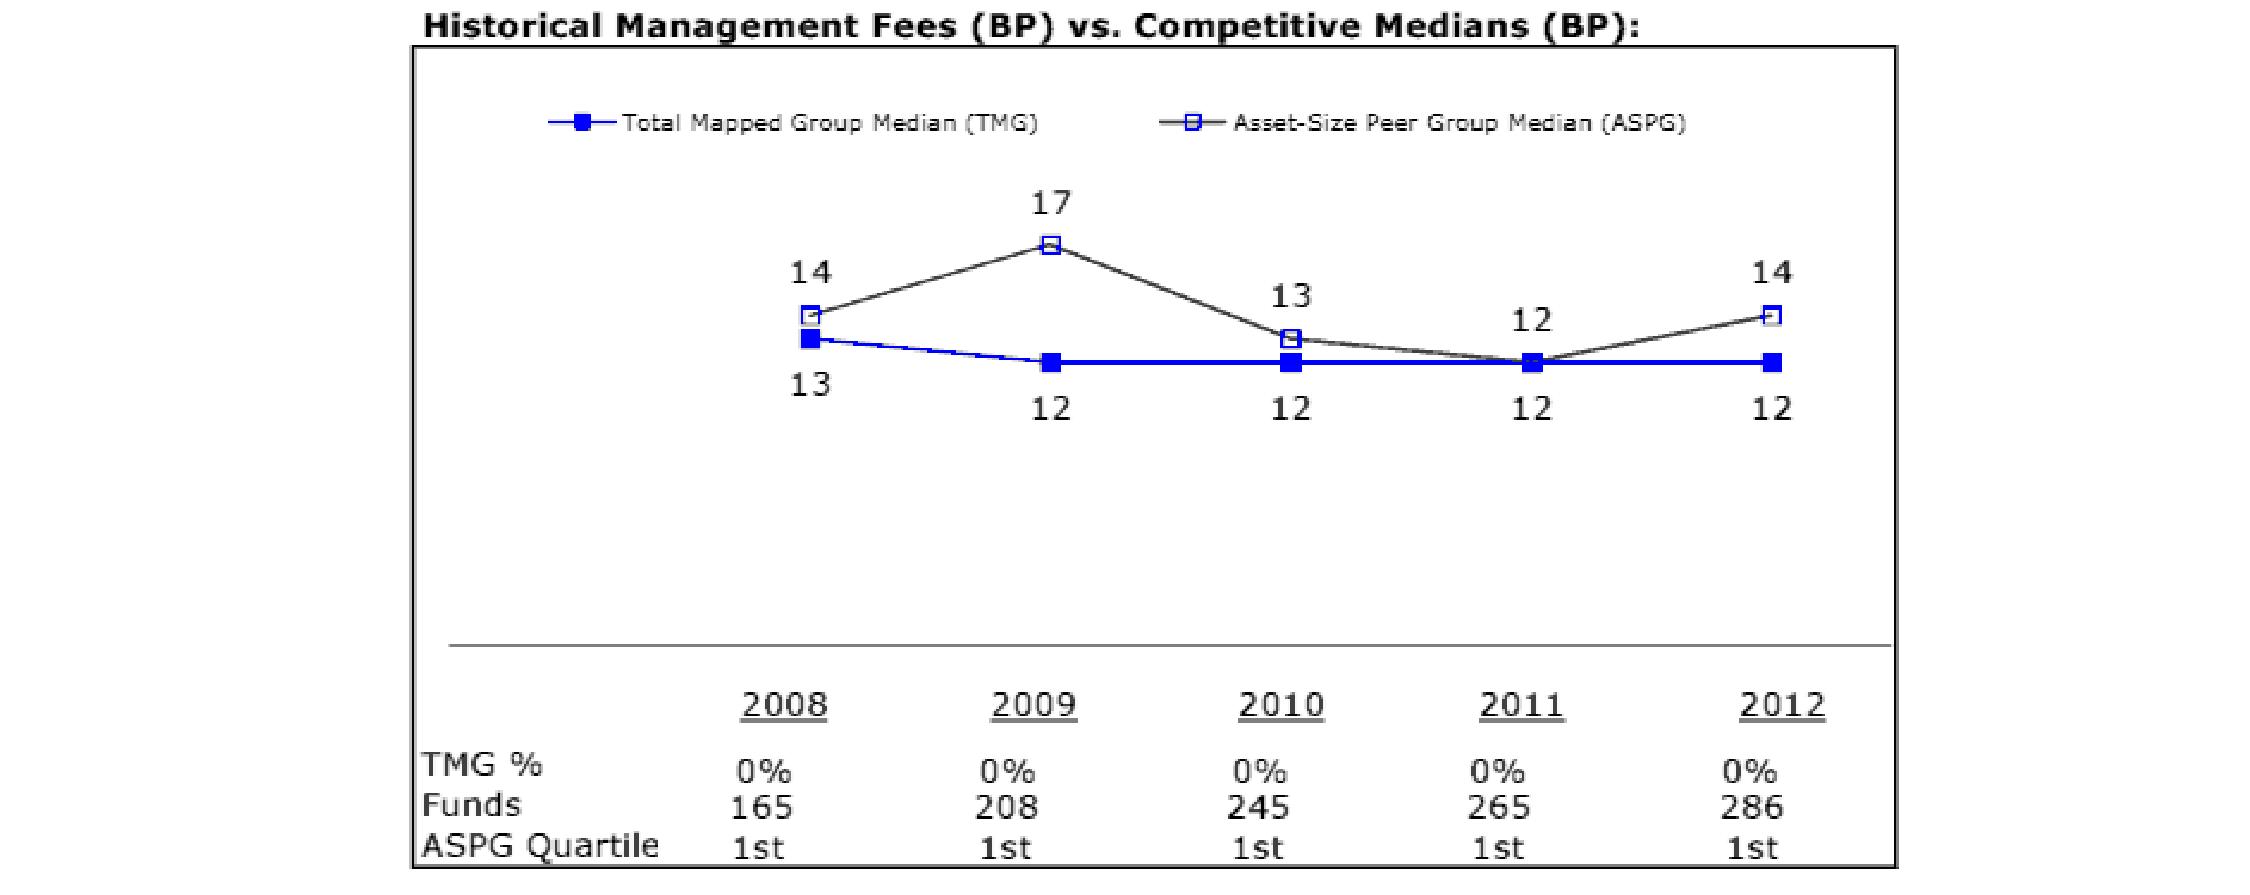
The Board noted that each fund's management fee rate of 0.00% ranked below the median of its Total Mapped Group and below the median of its ASPG for 2012. The Board further noted that many peer funds pay fund-level expenses, including management fees, to which the funds are not subject.
Based on its review, the Board concluded that each fund's management fee is fair and reasonable in light of the services that the fund receives and the other factors considered.
Total Expense Ratio. In its review of each fund's total expense ratio, the Board noted that each fund invests in Investor Class of the underlying Fidelity fund to avoid charging fund-paid 12b-1 fees at both fund levels. The Board considered that the funds do not pay transfer agent fees. Instead, Investor Class of each underlying Fidelity fund bears its pro rata portion of each fund's transfer agent fee according to the percentage of each fund's assets invested in that underlying fund. The Board further noted that Fidelity Management & Research Company (FMR) pays all other expenses of each fund, with limited exceptions.
The Board noted that each fund's total expense ratio ranked below its competitive median for 2012.
Fees Charged to Other Fidelity Clients. The Board also considered Fidelity fee structures and other information with respect to clients of Fidelity, such as other mutual funds advised or subadvised by Fidelity, pension plan clients, and other institutional clients. The Board noted the findings of the 2013 ad hoc joint committee (created with the board of other Fidelity funds), which reviewed and compared Fidelity's institutional investment advisory business with its business of providing services to the Fidelity funds, including the differences in services provided, fees charged, and costs incurred, as well as competition in their respective marketplaces.
Based on its review of total expense ratios and fees charged to other Fidelity clients, the Board concluded that each fund's total expense ratio was reasonable in light of the services that the fund and its shareholders receive and the other factors considered.
Costs of the Services and Profitability. The Board considered the level of Fidelity's profits in respect of all the Fidelity funds, including the Fidelity funds in which the funds invest.
PricewaterhouseCoopers LLP (PwC), independent registered public accounting firm and auditor to Fidelity and certain Fidelity funds, has been engaged annually by the Board as part of the Board's assessment of Fidelity's profitability analysis. PwC's engagement includes the review and assessment of the methodologies used by Fidelity in determining the revenues and expenses attributable to Fidelity's mutual fund business, and completion of agreed-upon procedures surrounding the mathematical accuracy of fund profitability and its conformity to allocation methodologies. After considering PwC's reports issued under the engagement and information provided by Fidelity, the Board concluded that while other allocation methods may also be reasonable, Fidelity's profitability methodologies are reasonable in all material respects.
The Board also reviewed Fidelity's non-fund businesses and fall-out benefits related to the mutual fund business as well as cases where Fidelity's affiliates may benefit from or be related to the funds' business.
The Board concluded that the costs of the services provided by and the profits realized by Fidelity in connection with the operation of each fund were not relevant to the renewal of each fund's Advisory Contract because the funds do not pay management fees and FMR pays all other expenses of each fund, with limited exceptions.
Annual Report
Board Approval of Investment Advisory Contracts and Management Fees - continued
Economies of Scale. The Board concluded that because the funds do not pay management fees and FMR pays all other expenses of each fund, with limited exceptions, economies of scale cannot be realized by the funds, but may be realized by the other Fidelity funds in which each fund invests, many of which may benefit from breakpoints in the group fee arrangement.
Additional Information Requested by the Board. In order to develop fully the factual basis for consideration of the Fidelity funds' Advisory Contracts, the Board requested and received additional information on certain topics, including: (i) Fidelity's fund profitability methodology, profitability trends for certain funds, and the impact of certain factors on fund profitability results; (ii) portfolio manager changes that have occurred during the past year and the amount of the investment that each portfolio manager has made in the Fidelity fund(s) that he or she manages; (iii) Fidelity's compensation structure for portfolio managers, research analysts, and other key personnel, including its effects on fund profitability, the rationale for the compensation structure, and the extent to which current market conditions have affected retention and recruitment; (iv) the arrangements with and compensation paid to certain fund sub-advisers on behalf of the Fidelity funds; (v) Fidelity's fee structures, including the group fee structure and definition of group assets, and the rationale for recommending different fees among different categories of funds and classes; (vi) Fidelity's voluntary waiver of its fees to maintain minimum yields for certain money market funds and classes as well as contractual waivers in place for certain funds; (vii) the methodology with respect to competitive fund data and peer group classifications; (viii) Fidelity's transfer agent fee, expense, and service structures for different funds and classes, and the impact of the increased use of omnibus accounts; and (ix) explanations regarding the relative total expense ratios of certain funds and classes, total expense competitive trends and methodologies for total expense competitive comparisons, and actions that might be taken by Fidelity to reduce total expense ratios for certain funds and classes or to achieve further economies of scale.
Based on its evaluation of all of the conclusions noted above, and after considering all factors it believed relevant, the Board ultimately concluded that the advisory fee structures are fair and reasonable, and that each fund's Advisory Contract should be renewed.
Annual Report
Investment Adviser
Strategic Advisers, Inc.
Boston, MA
Administrator
Fidelity Management & Research Company
Boston, MA
General Distributor
Fidelity Distributors Corporation
Smithfield, RI
Transfer and Service Agents
Fidelity Investments Institutional Operations Company, Inc.
Boston, MA
Fidelity Service Company, Inc.
Boston, MA
Custodian
The Bank of New York Mellon
New York, NY
VIPIFF-ANN-0214
1.814507.108
Fidelity® Variable Insurance Products:
Strategic Income Portfolio
Annual Report
December 31, 2013
(Fidelity Cover Art)
Contents
Performance | (Click Here) | How the fund has done over time. |
Management's Discussion of Fund Performance | (Click Here) | The Portfolio Manager's review of fund performance and strategy. |
Shareholder Expense Example | (Click Here) | An example of shareholder expenses. |
Investment Changes | (Click Here) | A summary of major shifts in the fund's investments over the past six months. |
Investments | (Click Here) | A complete list of the fund's investments with their market values. |
Financial Statements | (Click Here) | Statements of assets and liabilities, operations, and changes in net assets, as well as financial highlights. |
Notes | (Click Here) | Notes to the financial statements. |
Report of Independent Registered Public Accounting Firm | (Click Here) | |
Trustees and Officers | (Click Here) | |
Distributions | (Click Here) | |
Board Approval of Investment Advisory Contracts and Management Fees | (Click Here) | |
To view a fund's proxy voting guidelines and proxy voting record for the 12-month period ended June 30, visit http://www.fidelity.com/proxyvotingresults or visit the Securities and Exchange Commission's (SEC) web site at http://www.sec.gov. You may also call 1-877-208-0098 to request a free copy of the proxy voting guidelines.
Fidelity Variable Insurance Products are separate account options which are purchased through a variable insurance contract.
Standard & Poor's, S&P and S&P 500 are registered service marks of The McGraw-Hill Companies, Inc. and have been licensed for use by Fidelity Distributors Corporation.
Other third-party marks appearing herein are the property of their respective owners.
All other marks appearing herein are registered or unregistered trademarks or service marks of FMR LLC or an affiliated company. © 2014 FMR LLC. All rights reserved.
This report and the financial statements contained herein are submitted for the general information of the shareholders of the fund. This report is not authorized for distribution to prospective investors in the fund unless preceded or accompanied by an effective prospectus.
A fund files its complete schedule of portfolio holdings with the SEC for the first and third quarters of each fiscal year on Form N-Q. Forms N-Q are available on the SEC's web site at http://www.sec.gov. A fund's Forms N-Q may be reviewed and copied at the SEC's Public Reference Room in Washington, DC. Information regarding the operation of the SEC's Public Reference Room may be obtained by calling 1-800-SEC-0330. For a complete list of a fund's portfolio holdings, view the most recent holdings listing, semiannual report, or annual report on Fidelity's web site at http://www.fidelity.com, http://www.advisor.fidelity.com, or http://www.401k.com, as applicable.
NOT FDIC INSURED • MAY LOSE VALUE • NO BANK GUARANTEE
Neither the fund nor Fidelity Distributors Corporation is a bank.
Annual Report
Average annual total return reflects the change in the value of an investment, assuming reinvestment of the class' distributions from dividend income and capital gains (the profits earned upon the sale of securities that have grown in value, if any) and assuming a constant rate of performance each year. During periods of reimbursement by Fidelity, a fund's total return will be greater than it would be had the reimbursement not occurred. Performance numbers are net of all underlying fund operating expenses, but do not include any insurance charges imposed by your insurance company's separate account. If performance information included the effect of these additional charges, the total returns would have been lower. How a fund did yesterday is no guarantee of how it will do tomorrow.
Average Annual Total Returns
Periods ended December 31, 2013 | Past 1
year | Past 5
years | Past 10
years |
VIP Strategic Income Portfolio - Initial Class | 0.29% | 10.58% | 6.60% |
VIP Strategic Income Portfolio - Service Class | 0.19% | 10.48% | 6.48% |
VIP Strategic Income Portfolio - Service Class 2 | 0.03% | 10.32% | 6.32% |
VIP Strategic Income Portfolio - Investor Class A | 0.27% | 10.56% | 6.56% |
A The initial offering of Investor Class shares took place on July 21, 2005. Returns prior to July 21, 2005 are those of Initial Class. Had Investor Class's transfer agent fee been reflected, returns prior to July 21, 2005 would have been lower.
$10,000 Over 10 Years
Let's say hypothetically that $10,000 was invested in VIP Strategic Income Portfolio - Initial Class on December 31, 2003. The chart shows how the value of your investment would have changed, and also shows how The BofA Merrill LynchSM US High Yield Constrained Index performed over the same period.
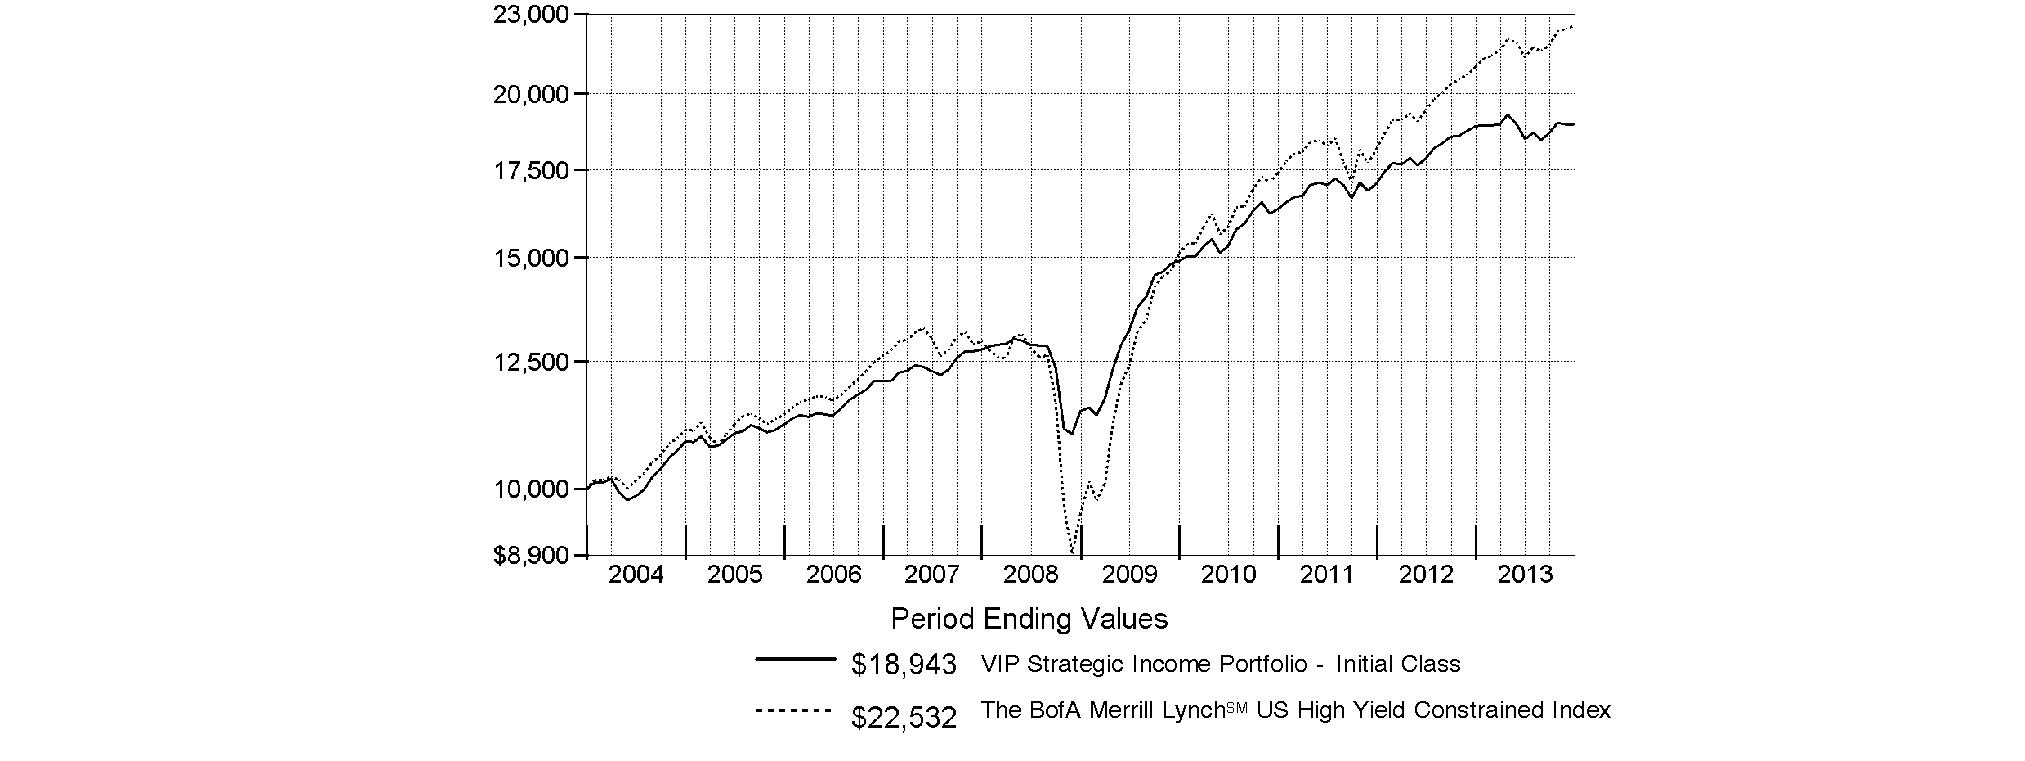
Annual Report
Market Recap: Global equity markets remained upbeat for the 12 months ending December 31, 2013, propelling the MSCI® ACWI® (All Country World Index) Index to a 23.24% return. Midyear turbulence gave way by autumn when policymakers in the U.S. and China had made clear their intentions to maintain accommodative monetary policies. That stance, combined with modest cyclical improvement around the globe and generally low valuations, underpinned the broad rally in equities, although the relative strength of the U.S. dollar generally tempered gains for U.S. investors holding foreign securities based in local currencies. During the period, the broad-market S&P 500® Index set a series of new highs, finishing the year up 32.39%. For the first time since 1995, the S&P® scored a "perfect 10," with all 10 economic sectors gaining at least 10% for the year. A resurgence in growth-oriented stocks lifted the Nasdaq Composite Index® to a 40.12% result for 2013, while the blue-chip Dow Jones Industrial AverageSM notched a relatively more modest 29.65% gain. International developed-markets equities rose in concert with their U.S. counterparts, with the MSCI® EAFE® Index gaining 22.92% for the period. Meanwhile, foreign exchange and commodity weakness curbed results in resource-heavy emerging markets (EM), especially in the year's waning months. More generally, concern over EM's slowing growth, its declining share of global trade and uncertainty surrounding U.S. central bank intentions were all factors hampering performance. The MSCI Emerging Markets Index returned -2.27% for the period. On the bond side, U.S. high-yield securities rallied with equities for much of the period, with The BofA Merrill LynchSM US High Yield Constrained Index returning 7.41% for 2013. The more rate-sensitive U.S. investment-grade bond category faced headwinds though, as reflected in the -2.02% return of the Barclays® U.S. Aggregate Bond Index. Within the Barclays index, investment-grade corporate credit returned -2.01%, while ultra-safe U.S. Treasuries saw a -2.75% result. Major non-U.S. developed markets performed only slightly better, with the Citigroup® Non-USD Group-of-Seven (G7) Equal Weighted Index logging a -1.59% result. After several years of strong advances, EM debt reversed course in 2013, with the J.P. Morgan Emerging Markets Bond Index Global returning -6.58%.
Comments from Joanna Bewick, Lead Portfolio Manager of VIP Strategic Income Portfolio: For the year, the fund's share classes fell short of the 0.87% result for the Fidelity Strategic Income Composite IndexSM. (For specific portfolio results, please refer to the performance section of this report). On a relative basis, security selection in the fund's high-yield bond subportfolio was the biggest detractor from results. It was a relatively healthy environment for high yield, as investors' appetite for riskier assets grew amid global economic improvement and yields were on the rise. So, the fund's overweighting in this asset class contributed, but not enough to offset what we lost from security selection. Conversely, relative results were boosted by our choices within emerging-markets (EM) debt. In aggregate, our asset allocation decisions benefited results; however, security selection within the fund's subportfolios was essentially flat. Within the individual subportfolios, the high-yield sleeve had a tough run due to investments in higher-quality, longer-duration credits, which came under pressure after the Fed announced it would begin tapering its asset-purchase program. On the flip side, security selection in the EM debt subportfolio was lifted by positioning in Argentina, including a notable overweighting and solid picks among corporate bonds and short-dated securities.
The views expressed above reflect those of the portfolio manager(s) only through the end of the period as stated on the cover of this report and do not necessarily represent the views of Fidelity or any other person in the Fidelity organization. Any such views are subject to change at any time based upon market or other conditions and Fidelity disclaims any responsibility to update such views. These views may not be relied on as investment advice and, because investment decisions for a Fidelity fund are based on numerous factors, may not be relied on as an indication of trading intent on behalf of any Fidelity fund.
Annual Report
As a shareholder of the Fund, you incur two types of costs: (1) transaction costs, and (2) ongoing costs, including management fees, distribution and/or service (12b-1) fees and other Fund expenses. This Example is intended to help you understand your ongoing costs (in dollars) of investing in the Fund and to compare these costs with the ongoing costs of investing in other mutual funds.
The Example is based on an investment of $1,000 invested at the beginning of the period and held for the entire period (July 1, 2013 to December 31, 2013).
Actual Expenses
The first line of the accompanying table for each class of the Fund provides information about actual account values and actual expenses. You may use the information in this line, together with the amount you invested, to estimate the expenses that you paid over the period. Simply divide your account value by $1,000.00 (for example, an $8,600 account value divided by $1,000.00 = 8.6), then multiply the result by the number in the first line for a class of the Fund under the heading entitled "Expenses Paid During Period" to estimate the expenses you paid on your account during this period. The estimate of expenses does not include any fees or other expenses of any variable annuity or variable life insurance product. If they were, the estimate of expenses you paid during the period would be higher, and your ending account value would be lower. In addition, the Fund, as a shareholder in the underlying Fidelity Central Funds, will indirectly bear its pro-rata share of the fees and expenses incurred by the underlying Fidelity Central Funds. These fees and expenses are not included in the Fund's annualized expense ratio used to calculate the expense estimate in the table below.
Hypothetical Example for Comparison Purposes
The second line of the accompanying table for each class of the Fund provides information about hypothetical account values and hypothetical expenses based on a Class' actual expense ratio and an assumed rate of return of 5% per year before expenses, which is not the Class' actual return. The hypothetical account values and expenses may not be used to estimate the actual ending account balance or expenses you paid for the period. You may use this information to compare the ongoing costs of investing in the Fund and other funds. To do so, compare this 5% hypothetical example with the 5% hypothetical examples that appear in the shareholder reports of the other funds. The estimate of expenses does not include any fees or other expenses of any variable annuity or variable life insurance product. If they were, the estimate of expenses you paid during the period would be higher, and your ending account value would be lower. In addition, the Fund, as a shareholder in the underlying Fidelity Central Funds, will indirectly bear its pro-rata share of the fees and expenses incurred by the underlying Fidelity Central Funds. These fees and expenses are not included in the Fund's annualized expense ratio used to calculate the expense estimate in the table below.
Please note that the expenses shown in the table are meant to highlight your ongoing costs only and do not reflect any transaction costs. Therefore, the second line of the table is useful in comparing ongoing costs only, and will not help you determine the relative total costs of owning different funds.
| Annualized
Expense Ratio B | Beginning
Account Value
July 1, 2013 | Ending
Account Value
December 31, 2013 | Expenses Paid
During Period*
July 1, 2013
to December 31, 2013 |
Initial Class | .67% | | | |
Actual | | $ 1,000.00 | $ 1,025.70 | $ 3.42 |
HypotheticalA | | $ 1,000.00 | $ 1,021.83 | $ 3.41 |
Service Class | .77% | | | |
Actual | | $ 1,000.00 | $ 1,024.70 | $ 3.93 |
HypotheticalA | | $ 1,000.00 | $ 1,021.32 | $ 3.92 |
Service Class 2 | .92% | | | |
Actual | | $ 1,000.00 | $ 1,025.00 | $ 4.70 |
HypotheticalA | | $ 1,000.00 | $ 1,020.57 | $ 4.69 |
Investor Class | .70% | | | |
Actual | | $ 1,000.00 | $ 1,025.50 | $ 3.57 |
HypotheticalA | | $ 1,000.00 | $ 1,021.68 | $ 3.57 |
A 5% return per year before expenses
B Annualized expense ratio reflects expenses net of applicable fee waivers.
* Expenses are equal to each Class' annualized expense ratio, multiplied by the average account value over the period, multiplied by 184/365 (to reflect the one-half year period). The fees and expenses of the underlying Fidelity Central Funds in which the Fund invests are not included in each Class' annualized expense ratio.
In addition to the expenses noted above, the Fund also indirectly bears its proportional share of the expenses of the underlying Fidelity Central Funds. Annualized expenses of the underlying non-money market Fidelity Central Funds as of their most recent fiscal half year were less than .01%.
Annual Report
Investment Changes (Unaudited)
The information in the following tables is based on the combined investments of the Fund and its pro-rata share of the investments of Fidelity's fixed-income central funds. |
Top Five Holdings as of December 31, 2013 |
(by issuer, excluding cash equivalents) | % of fund's
net assets | % of fund's net assets
6 months ago |
U.S. Treasury Obligations | 16.7 | 19.5 |
German Federal Republic | 2.5 | 2.7 |
Canadian Government | 2.4 | 2.3 |
Japan Government | 2.4 | 2.3 |
Freddie Mac | 2.2 | 2.3 |
| 26.2 | |
Top Five Market Sectors as of December 31, 2013 |
| % of fund's
net assets | % of fund's net assets
6 months ago |
Financials | 9.5 | 8.1 |
Consumer Discretionary | 7.6 | 6.7 |
Energy | 6.5 | 6.6 |
Telecommunication Services | 5.4 | 4.7 |
Industrials | 4.8 | 4.2 |
Quality Diversification (% of fund's net assets) |
As of December 31, 2013 | As of June 30, 2013 |
 | U.S. Government and
U.S. Government Agency Obligations† 25.2% | | | U.S. Government and
U.S. Government Agency Obligations† 28.9% | |
 | AAA,AA,A 11.6% | | | AAA,AA,A 12.1% | |
 | BBB 11.0% | | | BBB 9.5% | |
 | BB 18.1% | | | BB 14.3% | |
 | B 19.8% | | | B 22.3% | |
 | CCC,CC,C 7.3% | | | CCC,CC,C 5.6% | |
 | D 0.1% | | | D 0.1% | |
 | Not Rated 1.7% | | | Not Rated 2.5% | |
 | Equities 1.0% | | | Equities 0.7% | |
 | Short-Term
Investments and
Net Other Assets 4.2% | | | Short-Term
Investments and
Net Other Assets 4.0% | |

We have used ratings from Moody's Investors Service, Inc. Where Moody's® ratings are not available, we have used S&P® ratings. All ratings are as of the date indicated and do not reflect subsequent changes. |
Asset Allocation (% of fund's net assets) |
As of December 31, 2013* | As of June 30, 2013** |
| Preferred Securities 0.8% | | | Preferred Securities 0.6% | |
| Corporate Bonds 43.6% | | | Corporate Bonds 41.2% | |
| U.S. Government and
U.S. Government Agency Obligations† 25.2% | | | U.S. Government and
U.S. Government Agency Obligations† 28.9% | |
| Foreign Government & Government Agency Obligations 22.4% | | | Foreign Government & Government Agency Obligations 21.9% | |
| Bank Loan
Obligations 2.5% | | | Bank Loan
Obligations 2.5% | |
| Stocks 1.0% | | | Stocks 0.7% | |
 | Other Investments 0.3% | | | Other Investments 0.2% | |
| Short-Term
Investments and
Net Other Assets
(Liabilities) 4.2% | | | Short-Term
Investments and
Net Other Assets
(Liabilities) 4.0% | |

* Foreign investments | 35.7% | | ** Foreign investments | 35.1% | |
* Futures and Swaps | 1.1% | | ** Futures and Swaps | 0.2% | |
† Includes NCUA Guaranteed Notes |
An unaudited holdings listing for the Fund, which presents direct holdings as well as the pro-rata share of any securities and other investments held indirectly through its investment in underlying non-money market Fidelity Central Funds, is available at advisor.fidelity.com. |
Percentages in the above tables are adjusted for the effect of TBA Sale Commitments. |
Annual Report
Investments December 31, 2013
Showing Percentage of Net Assets
Nonconvertible Bonds - 43.6% |
| Principal Amount (d) | | Value |
CONSUMER DISCRETIONARY - 6.5% |
Auto Components - 0.8% |
Affinia Group, Inc. 7.75% 5/1/21 | | $ 110,000 | | $ 115,500 |
Chassix Holdings, Inc. 10% 12/15/18 pay-in-kind (f)(l) | | 240,000 | | 238,800 |
Chassix, Inc. 9.25% 8/1/18 (f) | | 715,000 | | 761,475 |
Cooper Standard Auto, Inc. 8.5% 5/1/18 | | 145,000 | | 153,700 |
Dana Holding Corp.: | | | | |
5.375% 9/15/21 | | 380,000 | | 381,425 |
6% 9/15/23 | | 380,000 | | 380,950 |
6.5% 2/15/19 | | 345,000 | | 366,563 |
6.75% 2/15/21 | | 1,105,000 | | 1,187,875 |
Delphi Corp.: | | | | |
5% 2/15/23 | | 953,000 | | 980,399 |
5.875% 5/15/19 | | 500,000 | | 528,750 |
6.125% 5/15/21 | | 490,000 | | 543,288 |
Exide Technologies 8.625% 2/1/18 (c) | | 1,190,000 | | 850,850 |
International Automotive Components Group SA 9.125% 6/1/18 (f) | | 495,000 | | 516,038 |
Lear Corp. 4.75% 1/15/23 (f) | | 665,000 | | 623,438 |
Pittsburgh Glass Works LLC 8% 11/15/18 (f) | | 230,000 | | 242,075 |
PT Gadjah Tunggal Tbk 7.75% 2/6/18 (f) | | 300,000 | | 294,750 |
Schaeffler Holding Finance BV 6.875% 8/15/18 pay-in-kind (f)(l) | | 445,000 | | 471,700 |
Stoneridge, Inc. 9.5% 10/15/17 (f) | | 200,000 | | 217,000 |
Tenneco, Inc. 6.875% 12/15/20 | | 545,000 | | 595,413 |
| | 9,449,989 |
Automobiles - 0.0% |
General Motors Corp.: | | | | |
6.75% 5/1/28 (c) | | 692,000 | | 0 |
7.125% 7/15/49 (c) | | 140,000 | | 0 |
7.2% 1/15/11 (c) | | 350,000 | | 0 |
7.4% 9/1/25 (c) | | 45,000 | | 0 |
7.7% 4/15/16 (c) | | 531,000 | | 0 |
8.25% 7/15/23 (c) | | 415,000 | | 0 |
8.375% 7/15/33 (c) | | 605,000 | | 0 |
| | 0 |
Distributors - 0.0% |
American Builders & Contractors Supply Co., Inc. 5.625% 4/15/21 (f) | | 160,000 | | 160,800 |
LKQ Corp. 4.75% 5/15/23 (f) | | 115,000 | | 106,950 |
| | 267,750 |
Diversified Consumer Services - 0.2% |
Laureate Education, Inc. 9.25% 9/1/19 (f) | | 1,950,000 | | 2,120,625 |
|
| Principal Amount (d) | | Value |
Hotels, Restaurants & Leisure - 1.2% |
Arcos Dorados Holdings, Inc. 10.25% 7/13/16 (f) | BRL | 1,900,000 | | $ 757,020 |
Caesars Entertainment Operating Co., Inc. 8.5% 2/15/20 | | 705,000 | | 678,563 |
Choice Hotels International, Inc. 5.75% 7/1/22 | | 145,000 | | 151,344 |
FelCor Lodging LP 5.625% 3/1/23 | | 440,000 | | 429,000 |
Graton Economic Development Authority 9.625% 9/1/19 (f) | | 1,080,000 | | 1,252,800 |
MCE Finance Ltd. 5% 2/15/21 (f) | | 1,175,000 | | 1,145,625 |
Mohegan Tribal Gaming Authority 11% 9/15/18 pay-in-kind (f)(l) | | 125,000 | | 125,469 |
MTR Gaming Group, Inc. 11.5% 8/1/19 pay-in-kind | | 317,080 | | 352,355 |
Palace Entertainment Holdings LLC/Corp. 8.875% 4/15/17 (f) | | 100,000 | | 100,000 |
Playa Resorts Holding BV 8% 8/15/20 (f) | | 1,085,000 | | 1,151,456 |
RHP Hotel Properties LP/RHP Finance Co. 5% 4/15/21 | | 460,000 | | 454,250 |
Seven Seas Cruises S de RL LLC 9.125% 5/15/19 | | 60,000 | | 66,075 |
Six Flags Entertainment Corp. 5.25% 1/15/21 (f) | | 785,000 | | 767,338 |
Waterford Gaming LLC/Waterford Gaming Finance Corp. 8.625% 9/15/14 (f) | | 36,247 | | 7,264 |
Wynn Las Vegas LLC/Wynn Las Vegas Capital Corp.: | | | | |
4.25% 5/30/23 (f) | | 790,000 | | 740,625 |
5.375% 3/15/22 | | 1,440,000 | | 1,454,400 |
7.75% 8/15/20 | | 2,890,000 | | 3,244,025 |
Wynn Macau Ltd. 5.25% 10/15/21 (f) | | 520,000 | | 522,600 |
| | 13,400,209 |
Household Durables - 1.0% |
Brookfield Residential Properties, Inc./Brookfield Residential U.S. Corp. 6.125% 7/1/22 (f) | | 335,000 | | 336,675 |
Brookfield Residential Properties, Inc. 6.5% 12/15/20 (f) | | 740,000 | | 767,750 |
D.R. Horton, Inc.: | | | | |
4.375% 9/15/22 | | 565,000 | | 526,863 |
4.75% 2/15/23 | | 225,000 | | 213,750 |
5.75% 8/15/23 | | 200,000 | | 203,500 |
Jarden Corp. 6.125% 11/15/22 | | 10,000 | | 10,700 |
Reliance Intermediate Holdings LP 9.5% 12/15/19 (f) | | 485,000 | | 528,650 |
Reynolds Group Issuer, Inc./Reynolds Group Issuer LLC/Reynolds Group Issuer (Luxembourg) SA: | | | | |
5.75% 10/15/20 | | 2,555,000 | | 2,606,100 |
6.875% 2/15/21 | | 565,000 | | 608,788 |
7.125% 4/15/19 | | 1,185,000 | | 1,262,025 |
Nonconvertible Bonds - continued |
| Principal Amount (d) | | Value |
CONSUMER DISCRETIONARY - continued |
Household Durables - continued |
Reynolds Group Issuer, Inc./Reynolds Group Issuer LLC/Reynolds Group Issuer (Luxembourg) SA: - continued | | | | |
8.25% 2/15/21 | | $ 625,000 | | $ 667,188 |
8.5% 5/15/18 (e) | | 45,000 | | 47,475 |
9% 4/15/19 | | 505,000 | | 541,613 |
9.875% 8/15/19 | | 405,000 | | 450,563 |
Standard Pacific Corp.: | | | | |
8.375% 5/15/18 | | 220,000 | | 258,500 |
8.375% 1/15/21 | | 420,000 | | 489,300 |
Tempur Sealy International, Inc. 6.875% 12/15/20 | | 210,000 | | 228,900 |
Toll Brothers Finance Corp.: | | | | |
4.375% 4/15/23 | | 675,000 | | 626,063 |
5.875% 2/15/22 | | 565,000 | | 584,775 |
William Lyon Homes, Inc. 8.5% 11/15/20 (f) | | 250,000 | | 270,625 |
| | 11,229,803 |
Internet & Catalog Retail - 0.0% |
Netflix, Inc. 5.375% 2/1/21 (f) | | 420,000 | | 425,250 |
Leisure Equipment & Products - 0.0% |
Easton-Bell Sports, Inc. 9.75% 12/1/16 | | 120,000 | | 125,701 |
Media - 2.7% |
AMC Networks, Inc. 4.75% 12/15/22 | | 320,000 | | 304,800 |
CCO Holdings LLC/CCO Holdings Capital Corp.: | | | | |
5.125% 2/15/23 | | 690,000 | | 639,975 |
5.25% 3/15/21 (f) | | 520,000 | | 496,600 |
5.25% 9/30/22 | | 740,000 | | 690,975 |
5.75% 9/1/23 (f) | | 415,000 | | 393,213 |
6.5% 4/30/21 | | 935,000 | | 960,713 |
6.625% 1/31/22 | | 820,000 | | 844,600 |
7.375% 6/1/20 | | 555,000 | | 600,788 |
8.125% 4/30/20 | | 565,000 | | 613,025 |
Cequel Communications Escrow I LLC/Cequel Communications Escrow Capital Corp. 6.375% 9/15/20 (f) | | 660,000 | | 676,500 |
Cequel Communications Holdings I LLC/Cequel Capital Corp. 5.125% 12/15/21 (f) | | 1,490,000 | | 1,396,875 |
Checkout Holding Corp. 0% 11/15/15 (f) | | 280,000 | | 231,000 |
Cinemark U.S.A., Inc.: | | | | |
4.875% 6/1/23 | | 525,000 | | 493,500 |
5.125% 12/15/22 | | 155,000 | | 149,963 |
Clear Channel Communications, Inc.: | | | | |
5.5% 9/15/14 | | 50,000 | | 49,750 |
|
| Principal Amount (d) | | Value |
14% 2/1/21 pay-in-kind (f) | | $ 781,155 | | $ 702,389 |
Clear Channel Worldwide Holdings, Inc.: | | | | |
6.5% 11/15/22 | | 825,000 | | 836,344 |
6.5% 11/15/22 | | 2,235,000 | | 2,282,494 |
DIRECTV Holdings LLC 2.75% 5/19/23 | EUR | 675,000 | | 867,263 |
DISH DBS Corp.: | | | | |
5% 3/15/23 | | 1,146,000 | | 1,068,645 |
5.125% 5/1/20 | | 50,000 | | 50,125 |
5.875% 7/15/22 | | 2,565,000 | | 2,565,000 |
6.75% 6/1/21 | | 890,000 | | 943,400 |
DreamWorks Animation SKG, Inc. 6.875% 8/15/20 (f) | | 245,000 | | 259,088 |
EchoStar Communications Corp. 7.125% 2/1/16 | | 760,000 | | 841,700 |
GLP Capital LP/GLP Financing II, Inc.: | | | | |
4.375% 11/1/18 (f) | | 210,000 | | 214,725 |
4.875% 11/1/20 (f) | | 545,000 | | 545,000 |
5.375% 11/1/23 (f) | | 430,000 | | 422,475 |
Harron Communications LP/Harron Finance Corp. 9.125% 4/1/20 (f) | | 180,000 | | 199,350 |
Liberty Media Corp.: | | | | |
8.25% 2/1/30 | | 1,295,000 | | 1,379,175 |
8.5% 7/15/29 | | 230,000 | | 247,825 |
McGraw-Hill Global Education Holdings LLC/McGraw-Hill Global Education Finance 9.75% 4/1/21 (f) | | 1,560,000 | | 1,723,800 |
MDC Partners, Inc. 6.75% 4/1/20 (f) | | 525,000 | | 549,281 |
Quebecor Media, Inc. 5.75% 1/15/23 | | 790,000 | | 764,325 |
RCN Telecom Services LLC/RCN Capital Corp. 8.5% 8/15/20 (f) | | 165,000 | | 166,650 |
Regal Entertainment Group: | | | | |
5.75% 6/15/23 | | 1,015,000 | | 997,238 |
5.75% 2/1/25 | | 150,000 | | 141,375 |
Sinclair Television Group, Inc. 5.375% 4/1/21 | | 520,000 | | 512,200 |
Sirius XM Radio, Inc.: | | | | |
4.25% 5/15/20 (f) | | 390,000 | | 368,550 |
4.625% 5/15/23 (f) | | 260,000 | | 235,300 |
5.25% 8/15/22 (f) | | 490,000 | | 494,900 |
Starz LLC/Starz Finance Corp. 5% 9/15/19 | | 440,000 | | 449,900 |
TV Azteca SA de CV 7.5% 5/25/18 (Reg. S) | | 800,000 | | 818,000 |
Unitymedia Hessen GmbH & Co. KG/Unitymedia NRW GmbH 5.5% 1/15/23 (f) | | 575,000 | | 557,750 |
| | 29,746,544 |
Nonconvertible Bonds - continued |
| Principal Amount (d) | | Value |
CONSUMER DISCRETIONARY - continued |
Specialty Retail - 0.3% |
Asbury Automotive Group, Inc. 8.375% 11/15/20 | | $ 125,000 | | $ 140,469 |
CST Brands, Inc. 5% 5/1/23 | | 140,000 | | 135,100 |
HT Intermediate Holdings Corp. 12% 5/15/19 pay-in-kind (f)(l) | | 265,000 | | 262,350 |
L Brands, Inc. 5.625% 10/15/23 | | 520,000 | | 527,800 |
Limited Brands, Inc. 5.625% 2/15/22 | | 685,000 | | 700,413 |
Petco Holdings, Inc. 8.5% 10/15/17 pay-in-kind (f) | | 540,000 | | 550,800 |
Sally Holdings LLC 6.875% 11/15/19 | | 325,000 | | 359,125 |
Sonic Automotive, Inc. 5% 5/15/23 | | 85,000 | | 79,688 |
Spencer Spirit Holdings, Inc./Spencer Gifts LLC/Spirit Halloween Superstores 11% 5/1/17 (f) | | 255,000 | | 273,488 |
Tenedora Nemak SA de CV 5.5% 2/28/23 (f) | | 200,000 | | 196,000 |
| | 3,225,233 |
Textiles, Apparel & Luxury Goods - 0.3% |
Burlington Holdings LLC/Burlington Holding Finance, Inc. 9% 2/15/18 pay-in-kind (f)(l) | | 209,000 | | 214,225 |
Hanesbrands, Inc. 6.375% 12/15/20 | | 640,000 | | 699,200 |
Levi Strauss & Co.: | | | | |
6.875% 5/1/22 | | 375,000 | | 412,500 |
7.625% 5/15/20 | | 775,000 | | 850,563 |
Polymer Group, Inc. 7.75% 2/1/19 | | 135,000 | | 143,944 |
PVH Corp. 4.5% 12/15/22 | | 1,137,000 | | 1,077,308 |
SIWF Merger Sub, Inc./Springs Industries, Inc. 6.25% 6/1/21 (f) | | 160,000 | | 161,400 |
| | 3,559,140 |
TOTAL CONSUMER DISCRETIONARY | | 73,550,244 |
CONSUMER STAPLES - 1.5% |
Food & Staples Retailing - 0.7% |
BI-LO LLC/BI-LO Finance Corp.: | | | | |
8.625% 9/15/18 pay-in-kind (f)(l) | | 465,000 | | 485,925 |
9.25% 2/15/19 (f) | | 830,000 | | 917,150 |
ESAL GmbH 6.25% 2/5/23 (f) | | 1,075,000 | | 964,813 |
Grifols, Inc. 8.25% 2/1/18 | | 430,000 | | 458,488 |
Hawk Acquisition Sub, Inc. 4.25% 10/15/20 (f) | | 1,040,000 | | 1,006,200 |
Rite Aid Corp.: | | | | |
6.75% 6/15/21 | | 1,740,000 | | 1,824,825 |
8% 8/15/20 | | 370,000 | | 416,250 |
9.25% 3/15/20 | | 845,000 | | 969,638 |
|
| Principal Amount (d) | | Value |
10.25% 10/15/19 | | $ 160,000 | | $ 179,200 |
Roundys Supermarket, Inc. 10.25% 12/15/20 (f) | | 130,000 | | 132,600 |
Shearers Foods LLC/Chip Finance Corp. 9% 11/1/19 (f) | | 152,000 | | 160,360 |
Tops Markets LLC 8.875% 12/15/17 (f) | | 295,000 | | 324,131 |
| | 7,839,580 |
Food Products - 0.4% |
B&G Foods, Inc. 4.625% 6/1/21 | | 565,000 | | 542,400 |
FAGE Dairy Industry SA/FAGE U.S.A. Dairy Industry, Inc. 9.875% 2/1/20 (f) | | 1,390,000 | | 1,452,550 |
Gruma S.A.B. de CV 7.75%
(Reg. S) (g) | | 930,000 | | 932,325 |
JBS U.S.A. LLC/JBS U.S.A. Finance, Inc. 8.25% 2/1/20 (f) | | 330,000 | | 358,050 |
Kazagro National Management Holding JSC 4.625% 5/24/23 (f) | | 200,000 | | 182,000 |
Michael Foods, Inc. 9.75% 7/15/18 | | 155,000 | | 168,563 |
Post Holdings, Inc.: | | | | |
7.375% 2/15/22 | | 815,000 | | 872,050 |
7.375% 2/15/22 (f) | | 155,000 | | 165,850 |
| | 4,673,788 |
Household Products - 0.1% |
Spectrum Brands Escrow Corp.: | | | | |
6.375% 11/15/20 (f) | | 850,000 | | 907,375 |
6.625% 11/15/22 (f) | | 175,000 | | 186,156 |
| | 1,093,531 |
Personal Products - 0.3% |
Elizabeth Arden, Inc. 7.375% 3/15/21 | | 135,000 | | 147,150 |
First Quality Finance Co., Inc. 4.625% 5/15/21 (f) | | 135,000 | | 128,250 |
NBTY, Inc. 9% 10/1/18 | | 425,000 | | 465,906 |
Prestige Brands, Inc.: | | | | |
5.375% 12/15/21 (f) | | 725,000 | | 732,250 |
8.125% 2/1/20 | | 75,000 | | 84,000 |
Revlon Consumer Products Corp. 5.75% 2/15/21 | | 1,979,000 | | 1,951,789 |
| | 3,509,345 |
TOTAL CONSUMER STAPLES | | 17,116,244 |
ENERGY - 6.2% |
Energy Equipment & Services - 0.5% |
Atwood Oceanics, Inc. 6.5% 2/1/20 | | 110,000 | | 117,425 |
Basic Energy Services, Inc. 7.75% 10/15/22 | | 375,000 | | 387,188 |
Chesapeake Oilfield Operating LLC 6.625% 11/15/19 (e) | | 560,000 | | 586,600 |
Forbes Energy Services Ltd. 9% 6/15/19 | | 350,000 | | 343,000 |
Nonconvertible Bonds - continued |
| Principal Amount (d) | | Value |
ENERGY - continued |
Energy Equipment & Services - continued |
Forum Energy Technologies, Inc. 6.25% 10/1/21 (f) | | $ 280,000 | | $ 294,000 |
Offshore Group Investment Ltd.: | | | | |
7.125% 4/1/23 | | 1,445,000 | | 1,473,900 |
7.5% 11/1/19 | | 258,000 | | 280,575 |
Pacific Drilling V Ltd. 7.25% 12/1/17 (f) | | 1,010,000 | | 1,090,800 |
Precision Drilling Corp. 6.5% 12/15/21 | | 90,000 | | 95,850 |
Summit Midstream Holdings LLC 7.5% 7/1/21 (f) | | 220,000 | | 229,900 |
Trinidad Drilling Ltd. 7.875% 1/15/19 (f) | | 140,000 | | 148,750 |
Vier Gas Transport GmbH: | | | | |
2.875% 6/12/25 (Reg. S) | EUR | 300,000 | | 402,931 |
3.125% 7/10/23 | EUR | 250,000 | | 350,416 |
| | 5,801,335 |
Oil, Gas & Consumable Fuels - 5.7% |
Access Midstream Partners LP/ACMP Finance Corp. 4.875% 5/15/23 | | 735,000 | | 709,275 |
Afren PLC: | | | | |
6.625% 12/9/20 (f) | | 270,000 | | 270,000 |
10.25% 4/8/19 (Reg. S) | | 200,000 | | 231,000 |
Atlas Pipeline Partners LP/Atlas Pipeline Finance Corp.: | | | | |
4.75% 11/15/21 (f) | | 340,000 | | 311,100 |
6.625% 10/1/20 | | 500,000 | | 522,500 |
Berry Petroleum Co. 10.25% 6/1/14 | | 145,000 | | 149,894 |
Calumet Specialty Products Partners LP/Calumet Finance Corp.: | | | | |
9.375% 5/1/19 | | 350,000 | | 388,500 |
9.625% 8/1/20 | | 485,000 | | 544,413 |
Carrizo Oil & Gas, Inc. 8.625% 10/15/18 | | 2,295,000 | | 2,484,338 |
Chaparral Energy, Inc. 9.875% 10/1/20 | | 155,000 | | 175,150 |
Concho Resources, Inc.: | | | | |
5.5% 4/1/23 | | 1,370,000 | | 1,411,100 |
6.5% 1/15/22 | | 575,000 | | 622,438 |
7% 1/15/21 | | 250,000 | | 275,000 |
Continental Resources, Inc.: | | | | |
5% 9/15/22 | | 2,440,000 | | 2,534,550 |
7.125% 4/1/21 | | 215,000 | | 243,756 |
8.25% 10/1/19 | | 65,000 | | 71,013 |
Crestwood Midstream Partners LP/Crestwood Midstream Finance Corp.: | | | | |
6% 12/15/20 | | 695,000 | | 715,850 |
6.125% 3/1/22 (f) | | 390,000 | | 399,750 |
|
| Principal Amount (d) | | Value |
7.75% 4/1/19 | | $ 675,000 | | $ 732,375 |
CVR Refining LLC/Coffeyville Finance, Inc. 6.5% 11/1/22 | | 755,000 | | 741,788 |
Denbury Resources, Inc. 8.25% 2/15/20 | | 308,000 | | 339,185 |
Eagle Rock Energy Partners
LP/Eagle Rock Energy Finance Corp. 8.375% 6/1/19 | | 480,000 | | 523,200 |
Energy Partners Ltd. 8.25% 2/15/18 | | 1,090,000 | | 1,171,750 |
Energy XXI Gulf Coast, Inc. 9.25% 12/15/17 | | 540,000 | | 600,750 |
Everest Acquisition LLC/Everest Acquisition Finance, Inc. 6.875% 5/1/19 | | 560,000 | | 602,700 |
Genesis Energy LP/Genesis Energy Finance Corp. 5.75% 2/15/21 | | 250,000 | | 252,813 |
Georgian Oil & Gas Corp. 6.875% 5/16/17 (f) | | 400,000 | | 411,000 |
Goodrich Petroleum Corp. 8.875% 3/15/19 | | 305,000 | | 317,200 |
Halcon Resources Corp.: | | | | |
8.875% 5/15/21 | | 430,000 | | 434,300 |
9.75% 7/15/20 (f) | | 265,000 | | 276,263 |
Hiland Partners LP/Finance Corp. 7.25% 10/1/20 (f) | | 395,000 | | 423,638 |
Holly Energy Partners LP/Holly Finance Corp. 6.5% 3/1/20 | | 485,000 | | 506,825 |
IPIC GMTN Ltd. 3.625% 5/30/23 | EUR | 450,000 | | 633,748 |
KazMunaiGaz Finance Sub BV: | | | | |
6.375% 4/9/21 (f) | | 320,000 | | 347,200 |
7% 5/5/20 (f) | | 360,000 | | 405,000 |
9.125% 7/2/18 (f) | | 380,000 | | 460,750 |
KazMunaiGaz National Co.: | | | | |
4.4% 4/30/23 (f) | | 285,000 | | 264,338 |
5.75% 4/30/43 (f) | | 485,000 | | 418,410 |
Kinder Morgan Holding Co. LLC: | | | | |
5% 2/15/21 (f) | | 435,000 | | 428,469 |
5.625% 11/15/23 (f) | | 525,000 | | 508,324 |
Kodiak Oil & Gas Corp. 5.5% 1/15/21 | | 215,000 | | 214,463 |
Laredo Pete, Inc. 7.375% 5/1/22 | | 600,000 | | 651,000 |
Markwest Energy Partners LP/Markwest Energy Finance Corp.: | | | | |
5.5% 2/15/23 | | 235,000 | | 236,763 |
6.25% 6/15/22 | | 608,000 | | 642,960 |
6.75% 11/1/20 | | 160,000 | | 173,600 |
Newfield Exploration Co.: | | | | |
5.625% 7/1/24 | | 525,000 | | 522,375 |
6.875% 2/1/20 | | 1,025,000 | | 1,098,031 |
Northern Tier Energy LLC/Northern Tier Finance Corp. 7.125% 11/15/20 | | 235,000 | | 245,575 |
Pacific Rubiales Energy Corp.: | | | | |
5.375% 1/26/19 (f) | | 275,000 | | 277,750 |
Nonconvertible Bonds - continued |
| Principal Amount (d) | | Value |
ENERGY - continued |
Oil, Gas & Consumable Fuels - continued |
Pacific Rubiales Energy Corp.: - continued | | | | |
7.25% 12/12/21 (f) | | $ 805,000 | | $ 853,300 |
Pan American Energy LLC 7.875% 5/7/21 (f) | | 520,000 | | 535,600 |
PBF Holding Co. LLC/PBF Finance Corp. 8.25% 2/15/20 | | 930,000 | | 1,009,050 |
Pemex Project Funding Master Trust: | | | | |
6.625% 6/15/35 | | 1,260,000 | | 1,323,000 |
6.625% 6/15/38 | | 50,000 | | 51,500 |
8.625% 12/1/23 | | 250,000 | | 304,375 |
Petrobras Global Finance BV 2.3836% 1/15/19 (l) | | 725,000 | | 708,688 |
Petrobras International Finance Co. Ltd.: | | | | |
5.375% 1/27/21 | | 525,000 | | 521,004 |
6.875% 1/20/40 | | 480,000 | | 451,200 |
8.375% 12/10/18 | | 495,000 | | 579,695 |
Petroleos de Venezuela SA: | | | | |
4.9% 10/28/14 | | 1,970,000 | | 1,797,625 |
8.5% 11/2/17 (f) | | 4,645,000 | | 3,866,963 |
9% 11/17/21 (Reg. S) | | 330,000 | | 245,025 |
9.75% 5/17/35 (f) | | 1,030,000 | | 722,545 |
12.75% 2/17/22 (f) | | 1,675,000 | | 1,528,438 |
Petroleos Mexicanos: | | | | |
3.5% 1/30/23 | | 495,000 | | 453,544 |
4.875% 1/24/22 | | 410,000 | | 420,865 |
4.875% 1/18/24 | | 280,000 | | 280,000 |
5.5% 1/21/21 | | 515,000 | | 554,140 |
5.5% 6/27/44 | | 755,000 | | 688,938 |
6% 3/5/20 | | 345,000 | | 380,880 |
6.5% 6/2/41 | | 1,040,000 | | 1,086,800 |
6.625% (f)(g) | | 1,835,000 | | 1,871,700 |
8% 5/3/19 | | 230,000 | | 278,875 |
Pioneer Natural Resources Co. 7.5% 1/15/20 | | 640,000 | | 775,978 |
PT Adaro Indonesia 7.625% 10/22/19 (f) | | 805,000 | | 849,275 |
PT Pertamina Persero: | | | | |
4.3% 5/20/23 (f) | | 400,000 | | 348,000 |
4.875% 5/3/22 (f) | | 675,000 | | 619,313 |
5.25% 5/23/21 (f) | | 295,000 | | 283,938 |
5.625% 5/20/43 (f) | | 400,000 | | 318,500 |
5.625% 5/20/43 (Reg. S) | | 200,000 | | 159,250 |
6% 5/3/42 (f) | | 475,000 | | 392,469 |
6.5% 5/27/41 (f) | | 515,000 | | 450,625 |
QEP Resources, Inc. 5.25% 5/1/23 | | 610,000 | | 571,875 |
QR Energy LP/QRE Finance Corp. 9.25% 8/1/20 | | 415,000 | | 429,525 |
Range Resources Corp.: | | | | |
5% 8/15/22 | | 635,000 | | 623,888 |
|
| Principal Amount (d) | | Value |
5% 3/15/23 | | $ 960,000 | | $ 938,400 |
5.75% 6/1/21 | | 210,000 | | 222,600 |
Rosetta Resources, Inc.: | | | | |
5.625% 5/1/21 | | 485,000 | | 483,788 |
5.875% 6/1/22 | | 545,000 | | 540,913 |
9.5% 4/15/18 | | 290,000 | | 310,300 |
Sabine Pass Liquefaction LLC: | | | | |
5.625% 2/1/21 (f) | | 525,000 | | 513,188 |
5.625% 4/15/23 (f) | | 785,000 | | 733,975 |
SemGroup Corp. 7.5% 6/15/21 (f) | | 440,000 | | 465,300 |
Southern Star Central Corp. 6.75% 3/1/16 | | 90,000 | | 90,563 |
Targa Resources Partners LP/Targa Resources Partners Finance Corp.: | | | | |
5.25% 5/1/23 | | 135,000 | | 130,781 |
6.375% 8/1/22 | | 199,000 | | 210,443 |
6.875% 2/1/21 | | 240,000 | | 258,000 |
Teekay Corp. 8.5% 1/15/20 | | 295,000 | | 318,969 |
Tennessee Gas Pipeline Co.: | | | | |
7% 10/15/28 | | 5,000 | | 5,888 |
7.625% 4/1/37 | | 50,000 | | 63,490 |
8.375% 6/15/32 | | 40,000 | | 51,600 |
Tesoro Corp.: | | | | |
4.25% 10/1/17 | | 305,000 | | 317,963 |
5.375% 10/1/22 | | 345,000 | | 349,313 |
Tesoro Logistics LP/Tesoro Logistics Finance Corp.: | | | | |
5.875% 10/1/20 | | 105,000 | | 107,363 |
6.125% 10/15/21 | | 300,000 | | 309,000 |
Venoco, Inc. 8.875% 2/15/19 | | 270,000 | | 265,950 |
W&T Offshore, Inc. 8.5% 6/15/19 | | 505,000 | | 534,038 |
Western Refining, Inc. 6.25% 4/1/21 | | 665,000 | | 669,988 |
Whiting Petroleum Corp.: | | | | |
5% 3/15/19 | | 385,000 | | 393,663 |
5.75% 3/15/21 | | 385,000 | | 398,475 |
WPX Energy, Inc. 6% 1/15/22 | | 690,000 | | 690,000 |
YPF SA 8.875% 12/19/18 (f) | | 470,000 | | 487,625 |
Zhaikmunai International BV 7.125% 11/13/19 (f) | | 565,000 | | 587,600 |
| | 63,707,732 |
TOTAL ENERGY | | 69,509,067 |
FINANCIALS - 7.5% |
Commercial Banks - 1.7% |
Akbank T.A.S. 7.5% 2/5/18 (f) | TRY | 540,000 | | 220,355 |
BBVA Paraguay SA 9.75% 2/11/16 (f) | | 450,000 | | 481,500 |
CBOM Finance PLC 8.25% 8/5/14 | | 200,000 | | 202,000 |
CIT Group, Inc.: | | | | |
5% 8/15/22 | | 845,000 | | 823,875 |
5.25% 3/15/18 | | 800,000 | | 858,000 |
Nonconvertible Bonds - continued |
| Principal Amount (d) | | Value |
FINANCIALS - continued |
Commercial Banks - continued |
CIT Group, Inc.: - continued | | | | |
5.375% 5/15/20 | | $ 1,055,000 | | $ 1,120,938 |
5.5% 2/15/19 (f) | | 3,535,000 | | 3,791,288 |
Credit Commercial de France 1.875% 1/16/20 | EUR | 1,000,000 | | 1,361,364 |
Development Bank of Kazakhstan JSC 4.125% 12/10/22 (f) | | 125,000 | | 111,563 |
Development Bank of Philippines 8.375% (g)(l) | | 720,000 | | 766,800 |
FBN Finance Co. BV 8.25% 8/7/20 (f)(l) | | 280,000 | | 286,300 |
Finansbank A/S: | | | | |
5.15% 11/1/17 (f) | | 945,000 | | 923,738 |
5.5% 5/11/16 (Reg. S) | | 400,000 | | 398,000 |
Georgia Bank Joint Stock Co.: | | | | |
7.75% 7/5/17 (f) | | 690,000 | | 714,150 |
7.75% 7/5/17 (Reg. S) | | 200,000 | | 207,000 |
HSBK BV 7.25% 5/3/17 (f) | | 435,000 | | 471,236 |
JSC Kazkommertsbank BV 8% 11/3/15 (f) | | 330,000 | | 333,300 |
Kazkommerts International BV 7.875% 4/7/14 (Reg. S) | | 375,000 | | 378,750 |
RSHB Capital SA 6% 6/3/21 (f)(l) | | 200,000 | | 204,740 |
Svenska Handelsbanken AB 2.25% 8/27/20 (Reg. S) | EUR | 659,000 | | 909,189 |
Vimpel Communications 8.25% 5/23/16 (Reg. S) (Issued by UBS Luxembourg SA for Vimpel Communications) | | 915,000 | | 1,014,461 |
Vnesheconombank Via VEB Finance PLC: | | | | |
6.025% 7/5/22 (f) | | 500,000 | | 511,250 |
6.8% 11/22/25 (f) | | 400,000 | | 418,000 |
6.902% 7/9/20 (f) | | 725,000 | | 797,500 |
Wells Fargo & Co. 2.25% 9/3/20 (Reg. S) | EUR | 1,050,000 | | 1,447,252 |
| | 18,752,549 |
Consumer Finance - 2.8% |
Ally Financial, Inc.: | | | | |
5.5% 2/15/17 | | 750,000 | | 811,875 |
7.5% 9/15/20 | | 4,620,000 | | 5,382,300 |
8% 3/15/20 | | 8,440,000 | | 10,117,450 |
General Motors Acceptance Corp. 8% 11/1/31 | | 2,545,000 | | 3,028,550 |
GMAC LLC 8% 11/1/31 | | 5,653,000 | | 6,762,401 |
SLM Corp.: | | | | |
5.5% 1/25/23 | | 2,410,000 | | 2,276,515 |
6% 1/25/17 | | 930,000 | | 1,006,725 |
7.25% 1/25/22 | | 1,340,000 | | 1,417,050 |
8% 3/25/20 | | 725,000 | | 821,063 |
| | 31,623,929 |
|
| Principal Amount (d) | | Value |
Diversified Financial Services - 1.9% |
Aquarius Investments Luxemburg 8.25% 2/18/16 | | $ 600,000 | | $ 625,500 |
Barry Callebaut Services NV 5.5% 6/15/23 (f) | | 635,000 | | 647,700 |
Biz Finance PLC 8.375% 4/27/15 (Reg. S) | | 970,000 | | 921,500 |
CDW LLC/CDW Finance Corp. 8% 12/15/18 | | 91,000 | | 99,190 |
Citigroup, Inc. 5.9% (g)(l) | | 1,455,000 | | 1,360,425 |
General Motors Financial Co., Inc.: | | | | |
3.25% 5/15/18 (f) | | 310,000 | | 310,000 |
4.25% 5/15/23 (f) | | 270,000 | | 256,838 |
6.75% 6/1/18 | | 575,000 | | 655,500 |
GTB Finance BV: | | | | |
6% 11/8/18 (f) | | 480,000 | | 472,800 |
7.5% 5/19/16 (f) | | 400,000 | | 424,000 |
Hilcorp Energy I LP/Hilcorp Finance Co. 7.625% 4/15/21 (f) | | 360,000 | | 390,600 |
Icahn Enterprises LP/Icahn Enterprises Finance Corp.: | | | | |
6% 8/1/20 (f) | | 1,035,000 | | 1,066,050 |
7.75% 1/15/16 | | 1,195,000 | | 1,218,900 |
8% 1/15/18 | | 2,653,000 | | 2,759,120 |
Indo Energy Finance BV 7% 5/7/18 (f) | | 925,000 | | 932,863 |
JPMorgan Chase & Co. 2.625% 4/23/21 | EUR | 1,000,000 | | 1,389,511 |
Landry's Acquisition Co. 9.375% 5/1/20 (f) | | 95,000 | | 103,550 |
Magnesita Finance Ltd. 8.625% (f)(g) | | 400,000 | | 385,000 |
Mozambique Ematum Finance 2020 6.305% 9/11/20 (Reg. S) | | 400,000 | | 380,000 |
MPH Intermediate Holding Co. 2 8.375% 8/1/18 pay-in-kind (f)(l) | | 850,000 | | 884,000 |
Myriad International Holding BV 6% 7/18/20 (f) | | 285,000 | | 307,800 |
Opal Acquisition, Inc. 8.875% 12/15/21 (f) | | 530,000 | | 526,025 |
Pacnet Ltd. 9% 12/12/18 (f) | | 200,000 | | 203,750 |
Perusahaan Penerbit SBSN 6.125% 3/15/19 (f) | | 400,000 | | 426,000 |
TMK Capital SA 7.75% 1/27/18 | | 850,000 | | 884,000 |
Transportation Union LLC/Transportation Union Financing Corp. 11.375% 6/15/18 | | 1,055,000 | | 1,149,950 |
TransUnion Holding Co., Inc. 9.625% 6/15/18 pay-in-kind | | 155,000 | | 166,625 |
Unicredit Luxembourg SA 5.1875% 10/13/15 (f) | | 395,000 | | 399,938 |
Unite (USAF) II PLC 3.374% 6/30/28 | GBP | 450,000 | | 701,569 |
Nonconvertible Bonds - continued |
| Principal Amount (d) | | Value |
FINANCIALS - continued |
Diversified Financial Services - continued |
Wind Acquisition Holdings Finance SA 12.25% 7/15/17 pay-in-kind (f)(l) | | $ 615,999 | | $ 613,544 |
Zhaikmunai Finance BV 10.5% 10/19/15 (f) | | 700,000 | | 735,000 |
| | 21,397,248 |
Insurance - 0.1% |
CNO Financial Group, Inc. 6.375% 10/1/20 (f) | | 255,000 | | 271,575 |
Hockey Merger Sub 2, Inc. 7.875% 10/1/21 (f) | | 710,000 | | 729,525 |
| | 1,001,100 |
Real Estate Investment Trusts - 0.4% |
Corrections Corp. of America: | | | | |
4.125% 4/1/20 | | 520,000 | | 509,600 |
4.625% 5/1/23 | | 520,000 | | 490,100 |
MPT Operating Partnership LP/MPT Finance Corp.: | | | | |
6.375% 2/15/22 | | 475,000 | | 491,625 |
6.875% 5/1/21 | | 725,000 | | 775,750 |
Omega Healthcare Investors, Inc.: | | | | |
5.875% 3/15/24 | | 1,385,000 | | 1,398,850 |
6.75% 10/15/22 | | 725,000 | | 787,531 |
7.5% 2/15/20 | | 385,000 | | 419,650 |
The Geo Group, Inc. 5.125% 4/1/23 | | 200,000 | | 185,000 |
| | 5,058,106 |
Real Estate Management & Development - 0.6% |
CBRE Group, Inc.: | | | | |
5% 3/15/23 | | 785,000 | | 754,581 |
6.625% 10/15/20 | | 480,000 | | 513,600 |
Howard Hughes Corp. 6.875% 10/1/21 (f) | | 1,210,000 | | 1,258,400 |
Inversiones y Representaciones SA 11.5% 7/20/20 (Reg. S) | | 85,000 | | 90,738 |
KWG Property Holding Ltd. 12.5% 8/18/17 (f) | | 100,000 | | 110,000 |
Realogy Corp.: | | | | |
7.625% 1/15/20 (f) | | 630,000 | | 707,175 |
7.875% 2/15/19 (f) | | 532,000 | | 583,870 |
9% 1/15/20 (f) | | 1,085,000 | | 1,264,025 |
Taylor Morrison Communities, Inc./Monarch Communities, Inc.: | | | | |
5.25% 4/15/21 (f) | | 785,000 | | 763,413 |
|
| Principal Amount (d) | | Value |
7.75% 4/15/20 (f) | | $ 277,000 | | $ 304,700 |
Tesco Property Finance 5 PLC 5.6611% 10/13/41 | GBP | 248,554 | | 434,182 |
| | 6,784,684 |
TOTAL FINANCIALS | | 84,617,616 |
HEALTH CARE - 4.3% |
Health Care Equipment & Supplies - 0.0% |
DJO Finance LLC/DJO Finance Corp. 8.75% 3/15/18 | | 230,000 | | 252,425 |
Health Care Providers & Services - 3.5% |
Community Health Systems, Inc.: | | | | |
5.125% 8/15/18 | | 495,000 | | 511,088 |
7.125% 7/15/20 | | 1,415,000 | | 1,468,063 |
CRC Health Group, Inc. 10.75% 2/1/16 | | 90,000 | | 90,225 |
DaVita, Inc.: | | | | |
5.75% 8/15/22 | | 1,030,000 | | 1,042,875 |
6.375% 11/1/18 | | 1,180,000 | | 1,239,000 |
6.625% 11/1/20 | | 2,030,000 | | 2,177,175 |
Fresenius Medical Care U.S. Finance II, Inc.: | | | | |
5.625% 7/31/19 (f) | | 1,510,000 | | 1,630,800 |
5.875% 1/31/22 (f) | | 1,670,000 | | 1,761,850 |
Gentiva Health Services, Inc. 11.5% 9/1/18 | | 475,000 | | 490,438 |
Hanger, Inc. 7.125% 11/15/18 | | 1,230,000 | | 1,316,100 |
HCA Holdings, Inc.: | | | | |
4.75% 5/1/23 | | 630,000 | | 592,200 |
5.875% 3/15/22 | | 1,915,000 | | 1,977,238 |
5.875% 5/1/23 | | 2,145,000 | | 2,118,188 |
6.25% 2/15/21 | | 610,000 | | 638,213 |
6.5% 2/15/16 | | 275,000 | | 300,781 |
6.5% 2/15/20 | | 2,410,000 | | 2,647,988 |
7.25% 9/15/20 | | 1,935,000 | | 2,109,150 |
7.5% 2/15/22 | | 1,175,000 | | 1,289,563 |
7.75% 5/15/21 | | 4,727,000 | | 5,164,248 |
8% 10/1/18 | | 135,000 | | 159,469 |
Health Management Associates, Inc. 7.375% 1/15/20 | | 290,000 | | 324,438 |
HealthSouth Corp.: | | | | |
5.75% 11/1/24 | | 310,000 | | 306,125 |
8.125% 2/15/20 | | 575,000 | | 630,344 |
IASIS Healthcare LLC/IASIS Capital Corp. 8.375% 5/15/19 | | 370,000 | | 392,200 |
InVentiv Health, Inc. 11% 8/15/18 (f) | | 75,000 | | 66,375 |
ResCare, Inc. 10.75% 1/15/19 | | 240,000 | | 268,800 |
Sabra Health Care LP/Sabra Capital Corp.: | | | | |
5.375% 6/1/23 | | 330,000 | | 320,925 |
8.125% 11/1/18 | | 293,000 | | 316,440 |
Nonconvertible Bonds - continued |
| Principal Amount (d) | | Value |
HEALTH CARE - continued |
Health Care Providers & Services - continued |
Tenet Healthcare Corp.: | | | | |
4.375% 10/1/21 | | $ 1,050,000 | | $ 987,000 |
4.5% 4/1/21 | | 450,000 | | 426,375 |
4.75% 6/1/20 | | 410,000 | | 400,775 |
6% 10/1/20 (f) | | 485,000 | | 506,219 |
6.25% 11/1/18 | | 1,950,000 | | 2,159,625 |
6.75% 2/1/20 | | 390,000 | | 399,750 |
6.875% 11/15/31 | | 1,210,000 | | 1,052,700 |
8.125% 4/1/22 | | 1,065,000 | | 1,147,538 |
Truven Health Analytics, Inc. 10.625% 6/1/20 | | 435,000 | | 492,094 |
UHS Escrow Corp. 7% 10/1/18 | | 85,000 | | 90,738 |
| | 39,013,113 |
Health Care Technology - 0.1% |
ConvaTec Healthcare ESA 10.5% 12/15/18 (f) | | 425,000 | | 477,594 |
Life Sciences Tools & Services - 0.0% |
Jaguar Holding Co. II/Jaguar Merger Sub, Inc. 9.5% 12/1/19 (f) | | 390,000 | | 438,750 |
Pharmaceuticals - 0.7% |
Pinnacle Merger Sub, Inc. 9.5% 10/1/23 (f) | | 1,095,000 | | 1,166,175 |
Salix Pharmaceuticals Ltd. 6% 1/15/21 (f) | | 155,000 | | 158,875 |
Valeant Pharmaceuticals International: | | | | |
5.625% 12/1/21 (f) | | 355,000 | | 358,550 |
6.75% 8/15/18 (f) | | 1,530,000 | | 1,681,088 |
6.75% 8/15/21 (f) | | 1,250,000 | | 1,325,000 |
6.875% 12/1/18 (f) | | 805,000 | | 861,350 |
7.5% 7/15/21 (f) | | 775,000 | | 850,563 |
VPI Escrow Corp. 6.375% 10/15/20 (f) | | 1,860,000 | | 1,959,975 |
| | 8,361,576 |
TOTAL HEALTH CARE | | 48,543,458 |
INDUSTRIALS - 4.3% |
Aerospace & Defense - 0.3% |
Alion Science & Technology Corp.: | | | | |
10.25% 2/1/15 | | 50,000 | | 35,375 |
12% 11/1/14 pay-in-kind | | 123,561 | | 125,620 |
Bombardier, Inc. 6.125% 1/15/23 (f) | | 505,000 | | 501,213 |
GenCorp, Inc. 7.125% 3/15/21 | | 140,000 | | 149,800 |
Huntington Ingalls Industries, Inc.: | | | | |
6.875% 3/15/18 | | 1,510,000 | | 1,630,800 |
|
| Principal Amount (d) | | Value |
7.125% 3/15/21 | | $ 150,000 | | $ 164,625 |
Triumph Group, Inc. 4.875% 4/1/21 | | 520,000 | | 504,400 |
| | 3,111,833 |
Airlines - 0.5% |
Air Canada: | | | | |
4.125% 5/15/25 (f) | | 280,000 | | 273,000 |
5.375% 11/15/22 (f) | | 185,000 | | 179,913 |
Aviation Capital Group Corp. 4.625% 1/31/18 (f) | | 372,000 | | 384,938 |
Continental Airlines, Inc.: | | | | |
pass-thru trust certificates 6.903% 4/19/22 | | 46,178 | | 48,542 |
6.125% 4/29/18 (f) | | 180,000 | | 188,100 |
7.25% 11/10/19 | | 322,170 | | 368,885 |
Delta Air Lines, Inc. pass-thru trust certificates: | | | | |
6.821% 8/10/22 | | 612,202 | | 690,258 |
8.021% 8/10/22 | | 196,389 | | 220,938 |
Hawaiian Airlines pass-thru certificates Series 2013-1
Class B, 4.95% 1/15/22 | | 265,000 | | 243,138 |
Northwest Airlines, Inc. pass-thru trust certificates: | | | | |
7.027% 11/1/19 | | 109,563 | | 121,615 |
8.028% 11/1/17 | | 32,991 | | 35,713 |
U.S. Airways Group, Inc. 6.125% 6/1/18 | | 790,000 | | 795,925 |
U.S. Airways pass-thru certificates: | | | | |
Series 2011-1 Class A, 7.125% 4/22/25 | | 430,285 | | 485,146 |
Series 2012-2: | | | | |
Class A, 4.625% 12/3/26 | | 249,142 | | 252,879 |
Class B, 6.75% 12/3/22 | | 194,239 | | 206,379 |
Series 2013-1: | | | | |
Class A, 3.95% 5/15/27 | | 595,000 | | 578,638 |
Class B, 5.375% 5/15/23 | | 245,000 | | 241,325 |
United Air Lines, Inc. pass-thru trust certificates 9.75% 1/15/17 | | 438,152 | | 503,874 |
United Continental Holdings, Inc. 6.375% 6/1/18 | | 105,000 | | 109,725 |
| | 5,928,931 |
Building Products - 0.0% |
Gibraltar Industries, Inc. 6.25% 2/1/21 | | 80,000 | | 82,200 |
USG Corp. 5.875% 11/1/21 (f) | | 110,000 | | 114,400 |
| | 196,600 |
Commercial Services & Supplies - 0.6% |
ADT Corp. 6.25% 10/15/21 (f) | | 485,000 | | 509,250 |
APX Group, Inc. 8.75% 12/1/20 (f) | | 155,000 | | 157,713 |
Bakercorp International, Inc. 8.25% 6/1/19 | | 270,000 | | 269,325 |
Nonconvertible Bonds - continued |
| Principal Amount (d) | | Value |
INDUSTRIALS - continued |
Commercial Services & Supplies - continued |
Brand Energy & Infrastructure Services, Inc. 8.5% 12/1/21 (f) | | $ 395,000 | | $ 401,419 |
Clean Harbors, Inc.: | | | | |
5.125% 6/1/21 | | 320,000 | | 323,200 |
5.25% 8/1/20 | | 1,050,000 | | 1,081,500 |
Covanta Holding Corp. 7.25% 12/1/20 | | 430,000 | | 469,428 |
Iron Mountain, Inc. 5.75% 8/15/24 | | 385,000 | | 357,088 |
LBC Tank Terminals Holding Netherlands BV 6.875% 5/15/23 (f) | | 200,000 | | 206,750 |
Office Depot de Mexico SA de CV 6.875% 9/20/20 (f) | | 470,000 | | 477,050 |
R.R. Donnelley & Sons Co.: | | | | |
7% 2/15/22 | | 385,000 | | 413,875 |
7.875% 3/15/21 | | 520,000 | | 577,200 |
Tervita Corp.: | | | | |
8% 11/15/18 (f) | | 450,000 | | 464,625 |
9.75% 11/1/19 (f) | | 505,000 | | 494,900 |
10.875% 2/15/18 (f) | | 290,000 | | 293,074 |
TMS International Corp. 7.625% 10/15/21 (f) | | 110,000 | | 116,875 |
United Rentals North America, Inc. 8.375% 9/15/20 | | 605,000 | | 674,575 |
WP Rocket Merger Sub, Inc. 10.125% 7/15/19 (c)(f) | | 320,000 | | 105,600 |
| | 7,393,447 |
Construction & Engineering - 0.2% |
Cementos Progreso Trust 7.125% 11/6/23 (f) | | 200,000 | | 202,000 |
MasTec, Inc. 4.875% 3/15/23 | | 555,000 | | 524,475 |
Odebrecht Finance Ltd. 7.5% (f)(g) | | 1,375,000 | | 1,320,000 |
| | 2,046,475 |
Electrical Equipment - 0.1% |
Sensata Technologies BV: | | | | |
4.875% 10/15/23 (f) | | 265,000 | | 249,100 |
6.5% 5/15/19 (f) | | 485,000 | | 520,163 |
| | 769,263 |
Machinery - 0.2% |
Schaeffler Finance BV 4.75% 5/15/21 (f) | | 520,000 | | 518,700 |
Terex Corp. 6% 5/15/21 | | 1,255,000 | | 1,297,356 |
TRAC Intermodal LLC/TRAC Intermodal Corp. 11% 8/15/19 | | 355,000 | | 405,588 |
| | 2,221,644 |
Marine - 0.2% |
Navios Maritime Acquisition Corp./Navios Acquisition Finance U.S., Inc. 8.125% 11/15/21 (f) | | 595,000 | | 606,900 |
|
| Principal Amount (d) | | Value |
Navios Maritime Holdings, Inc. 7.375% 1/15/22 (f) | | $ 660,000 | | $ 663,300 |
Navios South American Logistics, Inc./Navios Logistics Finance U.S., Inc. 9.25% 4/15/19 | | 265,000 | | 285,869 |
Ultrapetrol (Bahamas) Ltd. 8.875% 6/15/21 | | 350,000 | | 378,875 |
| | 1,934,944 |
Road & Rail - 0.1% |
JSC Georgian Railway 7.75% 7/11/22 (f) | | 200,000 | | 208,000 |
NESCO LLC/NESCO Holdings Corp. 11.75% 4/15/17 (f) | | 350,000 | | 393,750 |
Shortline PLC 9.5% 5/21/18 (f) | | 200,000 | | 179,500 |
Swift Services Holdings, Inc. 10% 11/15/18 | | 455,000 | | 506,188 |
Western Express, Inc. 12.5% 4/15/15 (f) | | 325,000 | | 204,750 |
| | 1,492,188 |
Trading Companies & Distributors - 2.0% |
Ahern Rentals, Inc. 9.5% 6/15/18 (f) | | 130,000 | | 140,725 |
Aircastle Ltd.: | | | | |
4.625% 12/15/18 | | 395,000 | | 397,963 |
6.25% 12/1/19 | | 610,000 | | 653,463 |
6.75% 4/15/17 | | 680,000 | | 758,200 |
7.625% 4/15/20 | | 380,000 | | 426,550 |
International Lease Finance Corp.: | | | | |
3.875% 4/15/18 | | 750,000 | | 751,875 |
4.625% 4/15/21 | | 700,000 | | 668,500 |
5.75% 5/15/16 | | 730,000 | | 782,013 |
5.875% 4/1/19 | | 3,655,000 | | 3,892,575 |
6.25% 5/15/19 | | 2,550,000 | | 2,760,375 |
6.75% 9/1/16 (f) | | 618,000 | | 689,070 |
7.125% 9/1/18 (f) | | 2,505,000 | | 2,899,538 |
8.25% 12/15/20 | | 2,870,000 | | 3,357,900 |
8.625% 1/15/22 | | 2,145,000 | | 2,534,858 |
8.75% 3/15/17 | | 1,420,000 | | 1,672,050 |
NES Rentals Holdings, Inc. 7.875% 5/1/18 (f) | | 160,000 | | 168,400 |
| | 22,554,055 |
Transportation Infrastructure - 0.1% |
Aeropuertos Argentina 2000 SA: | | | | |
10.75% 12/1/20 (f) | | 751,520 | | 759,035 |
10.75% 12/1/20 (Reg. S) | | 52,800 | | 53,328 |
| | 812,363 |
TOTAL INDUSTRIALS | | 48,461,743 |
INFORMATION TECHNOLOGY - 2.1% |
Communications Equipment - 0.4% |
Alcatel-Lucent U.S.A., Inc.: | | | | |
4.625% 7/1/17 (f) | | 365,000 | | 365,456 |
6.75% 11/15/20 (f) | | 1,580,000 | | 1,641,225 |
Nonconvertible Bonds - continued |
| Principal Amount (d) | | Value |
INFORMATION TECHNOLOGY - continued |
Communications Equipment - continued |
Alcatel-Lucent U.S.A., Inc.: - continued | | | | |
8.875% 1/1/20 (f) | | $ 295,000 | | $ 328,925 |
Avaya, Inc. 10.5% 3/1/21 (f) | | 465,000 | | 444,075 |
Brocade Communications Systems, Inc. 4.625% 1/15/23 (f) | | 350,000 | | 323,750 |
Lucent Technologies, Inc.: | | | | |
6.45% 3/15/29 | | 880,000 | | 778,800 |
6.5% 1/15/28 | | 265,000 | | 231,875 |
| | 4,114,106 |
Computers & Peripherals - 0.2% |
Seagate HDD Cayman: | | | | |
4.75% 6/1/23 (f) | | 1,050,000 | | 981,750 |
7% 11/1/21 | | 580,000 | | 640,175 |
| | 1,621,925 |
Electronic Equipment & Components - 0.1% |
Atkore International, Inc. 9.875% 1/1/18 | | 171,000 | | 183,825 |
Flextronics International Ltd.: | | | | |
4.625% 2/15/20 | | 500,000 | | 487,500 |
5% 2/15/23 | | 260,000 | | 243,750 |
Jabil Circuit, Inc. 4.7% 9/15/22 | | 265,000 | | 254,400 |
| | 1,169,475 |
Internet Software & Services - 0.1% |
Bankrate, Inc. 6.125% 8/15/18 (f) | | 385,000 | | 400,400 |
CyrusOne LP/CyrusOne Finance Corp. 6.375% 11/15/22 | | 370,000 | | 382,950 |
j2 Global, Inc. 8% 8/1/20 | | 350,000 | | 378,000 |
VeriSign, Inc. 4.625% 5/1/23 | | 465,000 | | 444,075 |
| | 1,605,425 |
IT Services - 0.6% |
Audatex North America, Inc.: | | | | |
6% 6/15/21 (f) | | 1,000,000 | | 1,047,500 |
6.125% 11/1/23 (f) | | 150,000 | | 154,500 |
Ceridian HCM Holding, Inc. 11% 3/15/21 (f) | | 250,000 | | 288,125 |
First Data Corp.: | | | | |
11.25% 1/15/21 (f) | | 440,000 | | 485,650 |
11.75% 8/15/21 (f) | | 1,810,000 | | 1,909,550 |
11.75% 8/15/21 (f)(h) | | 330,000 | | 348,150 |
Neustar, Inc. 4.5% 1/15/23 | | 195,000 | | 175,988 |
WideOpenWest Finance LLC/WideOpenWest Capital Corp.: | | | | |
10.25% 7/15/19 | | 1,300,000 | | 1,443,000 |
13.375% 10/15/19 | | 515,000 | | 596,113 |
| | 6,448,576 |
|
| Principal Amount (d) | | Value |
Semiconductors & Semiconductor Equipment - 0.2% |
NXP BV/NXP Funding LLC: | | | | |
3.75% 6/1/18 (f) | | $ 590,000 | | $ 594,425 |
5.75% 2/15/21 (f) | | 525,000 | | 548,625 |
5.75% 3/15/23 (f) | | 1,305,000 | | 1,327,838 |
Spansion LLC 11.25% 1/15/16 (c)(f) | | 255,000 | | 0 |
| | 2,470,888 |
Software - 0.5% |
Activision Blizzard, Inc.: | | | | |
5.625% 9/15/21 (f) | | 2,980,000 | | 3,084,300 |
6.125% 9/15/23 (f) | | 530,000 | | 552,525 |
BMC Software Finance, Inc. 8.125% 7/15/21 (f) | | 510,000 | | 525,300 |
Nuance Communications, Inc. 5.375% 8/15/20 (f) | | 250,000 | | 244,375 |
SAP AG 2.125% 11/13/19 | EUR | 900,000 | | 1,238,992 |
Sophia Holding Finance LP/Sophia Holding Finance, Inc. 9.625% 12/1/18 pay-in-kind (f)(l) | | 395,000 | | 406,850 |
| | 6,052,342 |
TOTAL INFORMATION TECHNOLOGY | | 23,482,737 |
MATERIALS - 3.5% |
Chemicals - 1.1% |
Axiall Corp. 4.875% 5/15/23 (f) | | 165,000 | | 155,925 |
Chemtura Corp. 5.75% 7/15/21 | | 255,000 | | 258,506 |
Eagle Spinco, Inc. 4.625% 2/15/21 (f) | | 280,000 | | 274,400 |
Hexion U.S. Finance Corp. 6.625% 4/15/20 | | 1,230,000 | | 1,260,750 |
LSB Industries, Inc. 7.75% 8/1/19 (f) | | 185,000 | | 194,250 |
Momentive Performance Materials, Inc. 10% 10/15/20 | | 1,865,000 | | 1,953,588 |
MPM Escrow LLC/MPM Finance Escrow Corp. 8.875% 10/15/20 | | 3,580,000 | | 3,767,950 |
Nufarm Australia Ltd. 6.375% 10/15/19 (f) | | 210,000 | | 217,350 |
Orion Engineered Carbons Finance & Co. SCA 9.25% 8/1/19 pay-in-kind (f)(l) | | 640,000 | | 668,800 |
PetroLogistics LP/PetroLogistics Finance Corp. 6.25% 4/1/20 (f) | | 355,000 | | 355,888 |
PolyOne Corp.: | | | | |
5.25% 3/15/23 | | 320,000 | | 312,000 |
7.375% 9/15/20 | | 155,000 | | 171,275 |
Rentech Nitrogen Partners LP/Rentech Nitrogen Finance Corp. 6.5% 4/15/21 (f) | | 225,000 | | 217,125 |
Rockwood Specialties Group, Inc. 4.625% 10/15/20 | | 920,000 | | 939,550 |
Taminco Global Chemical Corp. 9.75% 3/31/20 (f) | | 125,000 | | 141,875 |
Nonconvertible Bonds - continued |
| Principal Amount (d) | | Value |
MATERIALS - continued |
Chemicals - continued |
TPC Group, Inc. 8.75% 12/15/20 (f) | | $ 765,000 | | $ 812,813 |
Trinseo Materials Operating SCA/Trinseo Materials Finance, Inc. 8.75% 2/1/19 (f) | | 1,045,000 | | 1,078,963 |
U.S. Coatings Acquisition, Inc./Flash Dutch 2 BV 7.375% 5/1/21 (f) | | 255,000 | | 271,894 |
| | 13,052,902 |
Construction Materials - 0.1% |
CEMEX Finance LLC 9.375% 10/12/22 (f) | | 400,000 | | 451,000 |
Rearden G Holdings Eins GmbH 7.875% 3/30/20 (f) | | 320,000 | | 331,200 |
| | 782,200 |
Containers & Packaging - 0.8% |
Ardagh Packaging Finance PLC/Ardagh MP Holdings U.S.A., Inc.: | | | | |
4.875% 11/15/22 (f) | | 200,000 | | 198,000 |
7% 11/15/20 (f) | | 315,000 | | 318,150 |
Ball Corp. 5.75% 5/15/21 | | 3,000,000 | | 3,157,500 |
Beverage Packaging Holdings II SA (Luxembourg): | | | | |
5.625% 12/15/16 (f) | | 625,000 | | 637,500 |
6% 6/15/17 (f) | | 315,000 | | 318,938 |
BWAY Holding Co. 10% 6/15/18 | | 205,000 | | 222,425 |
Consolidated Container Co. LLC/Consolidated Container Capital, Inc. 10.125% 7/15/20 (f) | | 210,000 | | 223,650 |
Crown Cork & Seal, Inc.: | | | | |
7.375% 12/15/26 | | 1,210,000 | | 1,337,050 |
7.5% 12/15/96 | | 160,000 | | 148,000 |
Graphic Packaging International, Inc. 4.75% 4/15/21 | | 165,000 | | 163,350 |
Sappi Papier Holding GmbH: | | | | |
7.75% 7/15/17 (f) | | 265,000 | | 290,175 |
8.375% 6/15/19 (f) | | 355,000 | | 389,613 |
Sealed Air Corp. 5.25% 4/1/23 (f) | | 270,000 | | 262,575 |
Silgan Holdings, Inc. 5% 4/1/20 | | 960,000 | | 948,000 |
Tekni-Plex, Inc. 9.75% 6/1/19 (f) | | 321,000 | | 364,335 |
| | 8,979,261 |
Metals & Mining - 1.4% |
Aleris International, Inc.: | | | | |
6% 6/1/20 (f) | | 1,759 | | 3,503 |
9% 12/15/14 pay-in-kind (c)(l) | | 150,000 | | 0 |
Alrosa Finance SA 7.75% 11/3/20 (f) | | 400,000 | | 443,000 |
|
| Principal Amount (d) | | Value |
Bluescope Steel Ltd./Bluescope Steel Finance 7.125% 5/1/18 (f) | | $ 110,000 | | $ 115,225 |
Edgen Murray Corp. 8.75% 11/1/20 (f) | | 610,000 | | 698,450 |
EVRAZ Group SA: | | | | |
6.5% 4/22/20 (f) | | 280,000 | | 261,100 |
8.25% 11/10/15 (f) | | 970,000 | | 1,028,200 |
9.5% 4/24/18 (Reg. S) | | 325,000 | | 354,656 |
FMG Resources (August 2006) Pty Ltd.: | | | | |
6% 4/1/17 (f) | | 635,000 | | 674,688 |
6.875% 2/1/18 (f) | | 723,000 | | 760,958 |
6.875% 4/1/22 (f) | | 945,000 | | 1,030,050 |
8.25% 11/1/19 (f) | | 2,070,000 | | 2,323,575 |
Gold Fields Orogen Holding BVI Ltd. 4.875% 10/7/20 (f) | | 500,000 | | 404,335 |
IAMGOLD Corp. 6.75% 10/1/20 (f) | | 720,000 | | 619,200 |
Inmet Mining Corp. 7.5% 6/1/21 (f) | | 315,000 | | 329,175 |
Metinvest BV 10.25% 5/20/15 (f) | | 685,000 | | 697,056 |
Midwest Vanadium Pty Ltd. 11.5% 2/15/18 (f) | | 190,000 | | 157,700 |
Mirabela Nickel Ltd. 8.75% 4/15/18 (c)(f) | | 100,000 | | 25,000 |
New Gold, Inc.: | | | | |
6.25% 11/15/22 (f) | | 470,000 | | 454,725 |
7% 4/15/20 (f) | | 150,000 | | 154,125 |
Nord Gold NV 6.375% 5/7/18 (f) | | 490,000 | | 459,375 |
Polyus Gold International Ltd.: | | | | |
5.625% 4/29/20 (f) | | 470,000 | | 452,375 |
5.625% 4/29/20 (Reg. S) | | 200,000 | | 192,500 |
Prince Mineral Holding Corp. 11.5% 12/15/19 (f) | | 175,000 | | 194,688 |
Rain CII Carbon LLC/CII Carbon Corp. 8% 12/1/18 (f) | | 300,000 | | 310,500 |
Ryerson, Inc./Joseph T Ryerson & Son, Inc.: | | | | |
9% 10/15/17 | | 725,000 | | 768,500 |
11.25% 10/15/18 | | 1,100,000 | | 1,166,000 |
Severstal Columbus LLC 10.25% 2/15/18 | | 555,000 | | 588,300 |
Southern Copper Corp.: | | | | |
6.75% 4/16/40 | | 295,000 | | 285,638 |
7.5% 7/27/35 | | 450,000 | | 468,931 |
Steel Dynamics, Inc. 5.25% 4/15/23 | | 250,000 | | 250,000 |
| | 15,671,528 |
Paper & Forest Products - 0.1% |
Boise Cascade Co. 6.375% 11/1/20 | | 145,000 | | 152,613 |
Clearwater Paper Corp. 7.125% 11/1/18 | | 105,000 | | 112,088 |
NewPage Corp.: | | | | |
6.4919% 5/1/49 (c)(l) | | 90,000 | | 0 |
Nonconvertible Bonds - continued |
| Principal Amount (d) | | Value |
MATERIALS - continued |
Paper & Forest Products - continued |
NewPage Corp.: - continued | | | | |
11.375% 12/31/14 (c) | | $ 318,200 | | $ 0 |
Sino-Forest Corp. 6.25% 10/21/17 (c)(f) | | 565,000 | | 0 |
Verso Paper Holdings LLC/Verso Paper, Inc. 11.75% 1/15/19 | | 705,000 | | 747,300 |
| | 1,012,001 |
TOTAL MATERIALS | | 39,497,892 |
TELECOMMUNICATION SERVICES - 5.3% |
Diversified Telecommunication Services - 1.8% |
Alestra SA de RL de CV 11.75% 8/11/14 | | 265,000 | | 280,238 |
Altice Financing SA: | | | | |
6.5% 1/15/22 (f) | | 225,000 | | 227,250 |
7.875% 12/15/19 (f) | | 440,000 | | 478,500 |
Altice Finco SA: | | | | |
8.125% 1/15/24 (f) | | 905,000 | | 928,802 |
9.875% 12/15/20 (f) | | 655,000 | | 736,875 |
Citizens Communications Co.: | | | | |
7.875% 1/15/27 | | 280,000 | | 268,800 |
9% 8/15/31 | | 220,000 | | 216,150 |
Consolidated Communications, Inc. 10.875% 6/1/20 | | 245,000 | | 282,363 |
Eileme 1 AB 14.25% 8/15/20 pay-in-kind (f) | | 577,361 | | 598,242 |
Eileme 2 AB 11.625% 1/31/20 (f) | | 935,000 | | 1,120,812 |
FairPoint Communications, Inc. 8.75% 8/15/19 (f) | | 520,000 | | 551,200 |
Frontier Communications Corp.: | | | | |
7.625% 4/15/24 | | 895,000 | | 892,763 |
8.5% 4/15/20 | | 1,010,000 | | 1,131,200 |
8.75% 4/15/22 | | 565,000 | | 627,150 |
Indosat Palapa Co. BV: | | | | |
7.375% 7/29/20 (f) | | 300,000 | | 325,500 |
7.375% 7/29/20 | | 100,000 | | 108,500 |
Koninklijke KPN NV 3.25% 2/1/21 | EUR | 750,000 | | 1,045,314 |
Level 3 Communications, Inc. 8.875% 6/1/19 | | 165,000 | | 180,263 |
Level 3 Financing, Inc.: | | | | |
8.125% 7/1/19 | | 380,000 | | 416,100 |
8.625% 7/15/20 | | 875,000 | | 980,000 |
Lynx I Corp. 5.375% 4/15/21 (f) | | 335,000 | | 335,000 |
Lynx II Corp. 6.375% 4/15/23 (f) | | 200,000 | | 203,500 |
SBA Telecommunications, Inc. 5.75% 7/15/20 | | 585,000 | | 608,400 |
Sprint Capital Corp.: | | | | |
6.875% 11/15/28 | | 2,582,000 | | 2,433,535 |
|
| Principal Amount (d) | | Value |
8.75% 3/15/32 | | $ 971,000 | | $ 1,041,398 |
Telefonica Celular del Paraguay SA: | | | | |
6.75% 12/13/22 (f) | | 200,000 | | 208,000 |
6.75% 12/13/22 (Reg. S) | | 200,000 | | 208,000 |
Telenor ASA 2.5% 5/22/25
(Reg. S) | EUR | 950,000 | | 1,235,249 |
TW Telecom Holdings, Inc.: | | | | |
5.375% 10/1/22 | | 1,245,000 | | 1,223,213 |
5.375% 10/1/22 (f) | | 440,000 | | 432,300 |
6.375% 9/1/23 (f) | | 260,000 | | 270,400 |
U.S. West Communications: | | | | |
6.875% 9/15/33 | | 200,000 | | 193,250 |
7.25% 9/15/25 | | 35,000 | | 37,274 |
7.25% 10/15/35 | | 70,000 | | 67,798 |
Virgin Media Finance PLC 4.875% 2/15/22 | | 565,000 | | 491,550 |
| | 20,384,889 |
Wireless Telecommunication Services - 3.5% |
America Movil S.A.B. de CV 6.45% 12/5/22 | MXN | 5,000,000 | | 347,413 |
Crown Castle International Corp. 5.25% 1/15/23 | | 855,000 | | 837,900 |
Digicel Group Ltd.: | | | | |
6% 4/15/21 (f) | | 3,100,000 | | 2,991,500 |
7% 2/15/20 (f) | | 1,200,000 | | 1,212,000 |
8.25% 9/1/17 (f) | | 990,000 | | 1,029,600 |
8.25% 9/30/20 (f) | | 5,915,000 | | 6,122,025 |
10.5% 4/15/18 (f) | | 2,845,000 | | 3,044,150 |
Intelsat Jackson Holdings SA: | | | | |
5.5% 8/1/23 (f) | | 2,115,000 | | 2,011,894 |
6.625% 12/15/22 (Reg. S) | | 2,855,000 | | 2,940,650 |
7.25% 4/1/19 | | 1,000,000 | | 1,080,000 |
7.25% 10/15/20 | | 1,545,000 | | 1,689,844 |
7.5% 4/1/21 | | 2,485,000 | | 2,739,713 |
8.5% 11/1/19 | | 325,000 | | 354,656 |
MetroPCS Wireless, Inc.: | | | | |
6.25% 4/1/21 (f) | | 880,000 | | 913,000 |
6.625% 4/1/23 (f) | | 1,130,000 | | 1,166,725 |
7.875% 9/1/18 | | 385,000 | | 413,394 |
Millicom International Cellular SA 4.75% 5/22/20 (f) | | 275,000 | | 259,875 |
MTS International Funding Ltd.: | | | | |
5% 5/30/23 (f) | | 655,000 | | 612,425 |
8.625% 6/22/20 (f) | | 910,000 | | 1,072,617 |
NII Capital Corp. 7.625% 4/1/21 | | 193,000 | | 79,130 |
Sprint Corp. 7.125% 6/15/24 (f) | | 1,860,000 | | 1,887,900 |
T-Mobile U.S.A., Inc.: | | | | |
6.125% 1/15/22 | | 1,335,000 | | 1,358,363 |
6.464% 4/28/19 | | 780,000 | | 828,750 |
6.5% 1/15/24 | | 715,000 | | 723,938 |
6.542% 4/28/20 | | 780,000 | | 828,750 |
6.633% 4/28/21 | | 575,000 | | 605,188 |
6.731% 4/28/22 | | 425,000 | | 443,063 |
Nonconvertible Bonds - continued |
| Principal Amount (d) | | Value |
TELECOMMUNICATION SERVICES - continued |
Wireless Telecommunication Services - continued |
T-Mobile U.S.A., Inc.: - continued | | | | |
6.836% 4/28/23 | | $ 365,000 | | $ 378,688 |
Telemovil Finance Co. Ltd. 8% 10/1/17 (f) | | 730,000 | | 777,450 |
Vimpel Communications OJSC 7.748% 2/2/21 (Issued by VIP Finance Ireland Ltd. for Vimpel Communications) (f) | | 400,000 | | 434,000 |
VimpelCom Holdings BV 5.2% 2/13/19 (f) | | 290,000 | | 290,000 |
| | 39,474,601 |
TOTAL TELECOMMUNICATION SERVICES | | 59,859,490 |
UTILITIES - 2.4% |
Electric Utilities - 0.1% |
Comision Federal de Electricid 5.75% 2/14/42 (f) | | 200,000 | | 187,000 |
Empresa Distribuidora y Comercializadora Norte SA 9.75% 10/25/22 (f) | | 750,000 | | 508,125 |
Majapahit Holding BV 7.75% 1/20/20 (f) | | 265,000 | | 291,500 |
Mirant Americas Generation LLC 9.125% 5/1/31 | | 410,000 | | 417,175 |
| | 1,403,800 |
Gas Utilities - 0.3% |
Intergas Finance BV 6.375% 5/14/17 (Reg. S) | | 255,000 | | 274,444 |
Southern Natural Gas Co.: | | | | |
7.35% 2/15/31 | | 175,000 | | 208,534 |
8% 3/1/32 | | 350,000 | | 447,535 |
Star Gas Partners LP/Star Gas Finance Co. 8.875% 12/1/17 | | 210,000 | | 220,500 |
Suburban Propane Partners LP/Suburban Energy Finance Corp. 7.375% 8/1/21 | | 236,000 | | 257,240 |
Transportadora de Gas del Sur SA 7.875% 5/14/17 (f) | | 1,604,000 | | 1,543,850 |
| | 2,952,103 |
Independent Power Producers & Energy Traders - 2.0% |
Atlantic Power Corp. 9% 11/15/18 | | 885,000 | | 922,613 |
Calpine Corp.: | | | | |
7.5% 2/15/21 (f) | | 496,000 | | 541,260 |
7.875% 7/31/20 (f) | | 1,315,000 | | 1,439,925 |
7.875% 1/15/23 (f) | | 1,292,000 | | 1,411,510 |
Energy Future Holdings Corp.: | | | | |
10.875% 11/1/17 | | 1,125,000 | | 776,250 |
11.25% 11/1/17 pay-in-kind (l) | | 896,100 | | 618,309 |
|
| Principal Amount (d) | | Value |
Energy Future Intermediate Holding Co. LLC/Energy Future Intermediate Holding Finance, Inc.: | | | | |
6.875% 8/15/17 (f) | | $ 765,000 | | $ 791,775 |
10% 12/1/20 | | 3,025,000 | | 3,214,063 |
10% 12/1/20 (f) | | 2,955,000 | | 3,132,300 |
11% 10/1/21 | | 2,486,000 | | 2,765,675 |
12.25% 3/1/22 (f) | | 3,120,000 | | 3,666,000 |
Listrindo Capital BV 6.95% 2/21/19 (f) | | 200,000 | | 208,500 |
Power Sector Assets and Liabilities Management Corp. 7.39% 12/2/24 (f) | | 280,000 | | 342,300 |
The AES Corp. 4.875% 5/15/23 | | 590,000 | | 551,650 |
TXU Corp.: | | | | |
5.55% 11/15/14 | | 186,000 | | 75,330 |
6.5% 11/15/24 | | 3,225,000 | | 1,128,750 |
6.55% 11/15/34 | | 2,775,000 | | 971,250 |
| | 22,557,460 |
Multi-Utilities - 0.0% |
Puget Energy, Inc. 5.625% 7/15/22 | | 375,000 | | 407,814 |
TOTAL UTILITIES | | 27,321,177 |
TOTAL NONCONVERTIBLE BONDS (Cost $475,781,978) |
491,959,668
|
U.S. Government and Government Agency Obligations - 17.7% |
|
U.S. Government Agency Obligations - 0.4% |
Federal Home Loan Bank 1% 6/21/17 | | 880,000 | | 876,958 |
Tennessee Valley Authority: | | | | |
1.75% 10/15/18 | | 1,672,000 | | 1,660,736 |
3.5% 12/15/42 | | 510,000 | | 400,539 |
5.25% 9/15/39 | | 233,000 | | 246,443 |
5.375% 4/1/56 | | 1,200,000 | | 1,226,461 |
5.88% 4/1/36 | | 249,000 | | 287,583 |
TOTAL U.S. GOVERNMENT AGENCY OBLIGATIONS | | 4,698,720 |
U.S. Treasury Obligations - 16.7% |
U.S. Treasury Bonds: | | | | |
3.125% 2/15/43 | | 4,253,000 | | 3,625,683 |
3.625% 8/15/43 | | 13,202,000 | | 12,416,072 |
3.75% 11/15/43 | | 1,000,000 | | 962,656 |
4.375% 2/15/38 | | 675,000 | | 731,953 |
4.75% 2/15/37 | | 450,000 | | 515,953 |
5.25% 2/15/29 | | 2,310,000 | | 2,773,444 |
5.375% 2/15/31 | | 2,789,000 | | 3,408,682 |
6.25% 8/15/23 (j) | | 2,249,000 | | 2,884,343 |
7.5% 11/15/16 (k) | | 655,000 | | 780,473 |
U.S. Government and Government Agency Obligations - continued |
| Principal Amount (d) | | Value |
U.S. Treasury Obligations - continued |
U.S. Treasury Bonds: - continued | | | | |
7.875% 2/15/21 | | $ 200,000 | | $ 271,812 |
U.S. Treasury Notes: | | | | |
0.25% 7/15/15 | | 9,678,000 | | 9,678,000 |
0.25% 10/15/15 | | 12,752,000 | | 12,735,065 |
0.25% 10/31/15 | | 1,272,000 | | 1,270,212 |
0.25% 4/15/16 | | 385,000 | | 382,924 |
0.25% 5/15/16 | | 4,386,000 | | 4,358,930 |
0.375% 1/15/16 | | 18,777,000 | | 18,769,571 |
0.5% 7/31/17 | | 6,952,000 | | 6,803,728 |
0.625% 7/15/16 | | 4,724,000 | | 4,729,537 |
0.625% 8/15/16 | | 2,085,000 | | 2,085,163 |
0.625% 11/15/16 | | 392,000 | | 390,775 |
0.625% 12/15/16 | | 2,531,000 | | 2,520,519 |
0.625% 4/30/18 | | 2,970,000 | | 2,863,264 |
0.75% 6/30/17 | | 4,441,000 | | 4,393,814 |
0.875% 11/30/16 | | 456,000 | | 457,425 |
0.875% 1/31/17 | | 296,000 | | 296,278 |
0.875% 4/30/17 | | 4,330,000 | | 4,316,469 |
0.875% 1/31/18 | | 6,950,000 | | 6,814,802 |
0.875% 7/31/19 | | 4,926,000 | | 4,635,061 |
1% 9/30/16 | | 3,684,000 | | 3,715,373 |
1% 10/31/16 | | 2,237,000 | | 2,253,778 |
1% 5/31/18 | | 2,971,000 | | 2,905,079 |
1.25% 10/31/15 | | 1,715,000 | | 1,743,337 |
1.25% 10/31/18 | | 4,815,000 | | 4,717,573 |
1.25% 11/30/18 | | 3,700,000 | | 3,618,774 |
1.375% 7/31/18 | | 2,861,000 | | 2,833,955 |
1.375% 9/30/18 | | 1,503,000 | | 1,483,744 |
1.5% 12/31/18 | | 1,537,000 | | 1,518,868 |
1.75% 7/31/15 | | 1,453,000 | | 1,486,884 |
1.875% 8/31/17 | | 3,300,000 | | 3,386,882 |
1.875% 9/30/17 | | 1,900,000 | | 1,948,093 |
1.875% 10/31/17 | | 1,898,000 | | 1,945,006 |
2.375% 6/30/18 | | 1,912,000 | | 1,981,907 |
2.375% 12/31/20 | | 15,263,000 | | 15,184,304 |
2.5% 8/15/23 | | 5,348,000 | | 5,126,144 |
2.75% 11/30/16 | | 1,500,000 | | 1,585,313 |
2.75% 11/15/23 | | 9,441,000 | | 9,219,722 |
3% 2/28/17 | | 1,500,000 | | 1,598,321 |
3.125% 10/31/16 | | 1,340,000 | | 1,429,717 |
3.5% 2/15/18 | | 1,501,000 | | 1,628,702 |
4.5% 5/15/17 | | 1,172,000 | | 1,307,787 |
TOTAL U.S. TREASURY OBLIGATIONS | | 188,491,871 |
|
| Principal Amount (d) | | Value |
Other Government Related - 0.6% |
National Credit Union Administration Guaranteed Notes: | | | | |
Series 2010-A1 Class A, 0.5185% 12/7/20 (NCUA Guaranteed) (l) | | $ 255,437 | | $ 255,674 |
Series 2011-R1 Class 1A, 0.6185% 1/8/20 (NCUA Guaranteed) (l) | | 468,512 | | 471,202 |
Series 2011-R4 Class 1A, 0.5485% 3/6/20 (NCUA Guaranteed) (l) | | 228,893 | | 229,349 |
National Credit Union Administration Guaranteed Notes Master Trust: | | | | |
1.4% 6/12/15 (NCUA Guaranteed) | | 330,000 | | 335,092 |
2.35% 6/12/17 (NCUA Guaranteed) | | 2,930,000 | | 3,051,654 |
3.45% 6/12/21 (NCUA Guaranteed) | | 2,400,000 | | 2,501,520 |
TOTAL OTHER GOVERNMENT RELATED | | 6,844,491 |
TOTAL U.S. GOVERNMENT AND GOVERNMENT AGENCY OBLIGATIONS (Cost $201,544,500) |
200,035,082
|
U.S. Government Agency - Mortgage Securities - 2.8% |
|
Fannie Mae - 0.5% |
1.926% 9/1/33 (l) | | 31,634 | | 32,887 |
1.986% 11/1/35 (l) | | 18,877 | | 19,654 |
2.048% 10/1/35 (l) | | 2,012 | | 2,106 |
2.153% 11/1/33 (l) | | 5,620 | | 5,836 |
2.3% 1/1/35 (l) | | 16,405 | | 17,282 |
2.303% 6/1/36 (l) | | 2,701 | | 2,842 |
2.337% 9/1/36 (l) | | 8,824 | | 9,378 |
2.361% 3/1/33 (l) | | 8,319 | | 8,785 |
2.362% 2/1/36 (l) | | 3,650 | | 3,841 |
2.526% 11/1/36 (l) | | 4,566 | | 4,853 |
2.536% 6/1/42 (l) | | 51,574 | | 52,774 |
2.588% 5/1/36 (l) | | 3,341 | | 3,551 |
2.601% 7/1/35 (l) | | 26,113 | | 27,752 |
2.614% 6/1/47 (l) | | 8,229 | | 8,655 |
2.631% 2/1/37 (l) | | 32,043 | | 34,055 |
2.769% 4/1/36 (l) | | 21,477 | | 22,826 |
2.928% 8/1/35 (l) | | 49,308 | | 52,405 |
2.949% 11/1/40 (l) | | 40,968 | | 42,937 |
2.959% 9/1/41 (l) | | 47,168 | | 49,151 |
3.093% 10/1/41 (l) | | 19,182 | | 20,007 |
3.171% 3/1/42 (l) | | 1,612,932 | | 1,681,078 |
3.223% 7/1/41 (l) | | 63,127 | | 66,394 |
3.349% 10/1/41 (l) | | 40,634 | | 42,711 |
U.S. Government Agency - Mortgage Securities - continued |
| Principal Amount (d) | | Value |
Fannie Mae - continued |
3.551% 7/1/41 (l) | | $ 63,190 | | $ 66,714 |
5% 9/1/22 to 12/1/22 | | 1,170,382 | | 1,248,404 |
5.5% 10/1/20 to 11/1/34 | | 1,530,682 | | 1,676,745 |
6% 6/1/16 to 10/1/16 | | 3,700 | | 3,846 |
6.19% 3/1/37 (l) | | 1,538 | | 1,599 |
6.5% 3/1/16 to 8/1/36 | | 707,130 | | 793,577 |
TOTAL FANNIE MAE | | 6,002,645 |
Freddie Mac - 0.2% |
1.82% 3/1/35 (l) | | 9,142 | | 9,465 |
2.012% 5/1/37 (l) | | 4,368 | | 4,557 |
2.021% 2/1/37 (l) | | 3,002 | | 3,120 |
2.05% 6/1/37 (l) | | 1,858 | | 1,946 |
2.095% 8/1/37 (l) | | 5,269 | | 5,553 |
2.105% 1/1/36 (l) | | 5,646 | | 5,929 |
2.166% 6/1/33 (l) | | 18,738 | | 19,676 |
2.2% 3/1/37 (l) | | 2,219 | | 2,318 |
2.272% 1/1/37 (l) | | 22,695 | | 23,877 |
2.348% 10/1/35 (l) | | 14,630 | | 15,267 |
2.35% 7/1/35 (l) | | 10,103 | | 10,681 |
2.375% 10/1/36 (l) | | 24,329 | | 25,781 |
2.375% 5/1/37 (l) | | 4,448 | | 4,716 |
2.385% 5/1/37 (l) | | 32,555 | | 34,533 |
2.409% 5/1/37 (l) | | 60,784 | | 64,602 |
2.437% 6/1/37 (l) | | 17,068 | | 18,140 |
2.49% 9/1/35 (l) | | 4,570 | | 4,846 |
2.492% 4/1/35 (l) | | 380 | | 400 |
2.5% 6/1/37 (l) | | 3,673 | | 3,863 |
2.54% 7/1/36 (l) | | 335,025 | | 355,111 |
2.595% 4/1/37 (l) | | 475 | | 505 |
2.673% 7/1/35 (l) | | 14,311 | | 15,210 |
2.699% 4/1/37 (l) | | 5,794 | | 6,096 |
2.795% 7/1/36 (l) | | 8,000 | | 8,503 |
3.01% 10/1/35 (l) | | 3,336 | | 3,545 |
3.082% 9/1/41 (l) | | 352,308 | | 367,110 |
3.227% 4/1/41 (l) | | 37,959 | | 39,864 |
3.242% 9/1/41 (l) | | 42,169 | | 44,184 |
3.281% 6/1/41 (l) | | 53,001 | | 55,642 |
3.46% 5/1/41 (l) | | 40,003 | | 42,201 |
3.624% 6/1/41 (l) | | 60,052 | | 63,508 |
3.715% 5/1/41 (l) | | 58,543 | | 61,922 |
5.5% 2/1/19 to 7/1/35 | | 1,048,412 | | 1,126,465 |
6% 1/1/24 | | 217,635 | | 239,130 |
6.5% 12/1/14 to 3/1/22 | | 55,348 | | 60,153 |
TOTAL FREDDIE MAC | | 2,748,419 |
Ginnie Mae - 2.1% |
4% 10/15/24 to 9/15/25 | | 889,925 | | 945,476 |
4.3% 8/20/61 (q) | | 355,477 | | 382,878 |
|
| Principal Amount (d) | | Value |
4.5% 3/15/25 to 6/15/25 | | $ 651,064 | | $ 697,609 |
4.515% 3/20/62 (q) | | 1,174,700 | | 1,278,239 |
4.53% 10/20/62 (q) | | 346,307 | | 377,751 |
4.55% 5/20/62 (q) | | 2,166,975 | | 2,361,561 |
4.556% 12/20/61 (q) | | 1,287,443 | | 1,401,253 |
4.604% 3/20/62 (q) | | 615,631 | | 672,008 |
4.626% 3/20/62 (q) | | 436,094 | | 475,741 |
4.649% 2/20/62 (q) | | 233,382 | | 254,873 |
4.65% 3/20/62 (q) | | 409,033 | | 446,939 |
4.682% 2/20/62 (q) | | 309,452 | | 338,016 |
4.684% 1/20/62 (q) | | 1,373,427 | | 1,502,700 |
4.751% 12/20/60 (q) | | 514,105 | | 557,577 |
4.804% 3/20/61 (q) | | 813,377 | | 886,215 |
4.834% 3/20/61 (q) | | 1,449,212 | | 1,580,938 |
5.47% 8/20/59 (q) | | 215,676 | | 230,633 |
5.492% 4/20/60 (q) | | 758,703 | | 841,258 |
5.5% 11/15/35 | | 294,812 | | 325,572 |
5.612% 4/20/58 (q) | | 332,872 | | 347,822 |
6% 6/15/36 to 9/15/40 | | 2,965,056 | | 3,296,651 |
6.5% 8/20/38 to 9/20/38 | | 3,538,722 | | 3,968,573 |
TOTAL GINNIE MAE | | 23,170,283 |
TOTAL U.S. GOVERNMENT AGENCY - MORTGAGE SECURITIES (Cost $31,798,212) |
31,921,347
|
Asset-Backed Securities - 0.0% |
|
Tesco Property Finance 2 PLC 6.0517% 10/13/39
(Cost $182,688) | GBP | 94,918 | |
175,577
|
Collateralized Mortgage Obligations - 3.4% |
|
U.S. Government Agency - 3.4% |
Fannie Mae: | | | | |
floater: | | | | |
Series 2008-76 Class EF, 0.6646% 9/25/23 (l) | | 66,621 | | 66,960 |
Series 2010-15 Class FJ, 1.0946% 6/25/36 (l) | | 658,173 | | 674,890 |
Series 2010-86 Class FE, 0.6146% 8/25/25 (l) | | 67,488 | | 67,957 |
Series 2013-121 Class SA, 5.9354% 12/25/43 (l)(n)(o) | | 3,081,431 | | 405,993 |
pass-thru certificates Series 2012-127 Class DH, 4% 11/25/27 | | 413,230 | | 440,644 |
planned amortization class: | | | | |
Series 2002-9 Class PC, 6% 3/25/17 | | 1,555 | | 1,638 |
Series 2003-113 Class PE, 4% 11/25/18 | | 56,344 | | 59,329 |
Series 2003-70 Class BJ, 5% 7/25/33 | | 33,183 | | 35,915 |
Collateralized Mortgage Obligations - continued |
| Principal Amount (d) | | Value |
U.S. Government Agency - continued |
Fannie Mae: - continued | | | | |
planned amortization class: | | | | |
Series 2004-80 Class LD, 4% 1/25/19 | | $ 14,716 | | $ 14,882 |
Series 2005-19 Class PA, 5.5% 7/25/34 | | 249,370 | | 270,446 |
Series 2005-27 Class NE, 5.5% 5/25/34 | | 356,633 | | 377,530 |
Series 2005-52 Class PB, 6.5% 12/25/34 | | 12,805 | | 13,321 |
Series 2005-64 Class PX, 5.5% 6/25/35 | | 238,316 | | 261,366 |
Series 2010-118 Class PB, 4.5% 10/25/40 | | 300,000 | | 310,630 |
Series 2011-126 Class KB, 4% 12/25/41 | | 380,000 | | 370,444 |
sequential payer: | | | | |
Series 2002-57 Class BD, 5.5% 9/25/17 | | 6,165 | | 6,537 |
Series 2003-117 Class MD, 5% 12/25/23 | | 154,304 | | 167,402 |
Series 2004-52 Class KZ, 5.5% 7/25/34 | | 1,644,863 | | 1,796,710 |
Series 2004-91 Class Z, 5% 12/25/34 | | 503,480 | | 546,197 |
Series 2004-95 Class AN, 5.5% 1/25/25 | | 17,001 | | 17,361 |
Series 2005-117 Class JN, 4.5% 1/25/36 | | 40,000 | | 42,397 |
Series 2005-14 Class ZB, 5% 3/25/35 | | 233,081 | | 253,335 |
Series 2005-47 Class HK, 4.5% 6/25/20 | | 340,000 | | 359,096 |
Series 2006-72 Class CY, 6% 8/25/26 | | 121,377 | | 135,116 |
Series 2009-14 Class EB, 4.5% 3/25/24 | | 319,256 | | 338,624 |
Series 2009-59 Class HB, 5% 8/25/39 | | 290,000 | | 310,283 |
Series 2010-88 Class NA, 4% 8/25/28 | | 1,587,333 | | 1,653,587 |
Series 2010-97 Class CX, 4.5% 9/25/25 | | 500,000 | | 533,815 |
Series 2009-85 Class IB, 4.5% 8/25/24 (n) | | 46,531 | | 4,079 |
Series 2009-93 Class IC, 4.5% 9/25/24 (n) | | 69,437 | | 6,142 |
Series 2010-139 Class NI, 4.5% 2/25/40 (n) | | 329,403 | | 56,200 |
Series 2010-39 Class FG, 1.0846% 3/25/36 (l) | | 411,749 | | 422,041 |
Series 2010-97 Class CI, 4.5% 8/25/25 (n) | | 146,035 | | 15,128 |
Series 2011-67 Class AI, 4% 7/25/26 (n) | | 106,543 | | 12,526 |
Series 2013-40 Class PV, 2% 1/25/26 | | 567,359 | | 574,001 |
|
| Principal Amount (d) | | Value |
Freddie Mac: | | | | |
floater: | | | | |
Series 2630 Class FL, 0.6666% 6/15/18 (l) | | $ 1,040 | | $ 1,045 |
Series 2711 Class FC, 1.0666% 2/15/33 (l) | | 268,068 | | 272,831 |
floater planned amortization class Series 2770 Class FH, 0.5666% 3/15/34 (l) | | 265,049 | | 266,702 |
planned amortization class: | | | | |
Series 2006-3245 Class ME, 5.5% 6/15/35 | | 278,031 | | 286,834 |
Series 2101 Class PD, 6% 11/15/28 | | 4,474 | | 4,910 |
Series 2115 Class PE, 6% 1/15/14 | | 8 | | 8 |
Series 2376 Class JE, 5.5% 11/15/16 | | 5,854 | | 6,141 |
Series 2381 Class OG, 5.5% 11/15/16 | | 3,307 | | 3,455 |
Series 2425 Class JH, 6% 3/15/17 | | 8,058 | | 8,499 |
Series 2672 Class MG, 5% 9/15/23 | | 310,000 | | 339,780 |
Series 2695 Class DG, 4% 10/15/18 | | 126,413 | | 132,956 |
Series 2996 Class MK, 5.5% 6/15/35 | | 11,849 | | 13,045 |
Series 3415 Class PC, 5% 12/15/37 | | 122,823 | | 131,411 |
Series 3763 Class QA, 4% 4/15/34 | | 264,127 | | 277,474 |
planned amortization class sequential payer Series 2005-2963 Class VB, 5% 11/15/34 | | 370,000 | | 397,653 |
sequential payer: | | | | |
Series 2004-2802 Class ZG, 5.5% 5/15/34 | | 754,406 | | 842,506 |
Series 2303 Class ZV, 6% 4/15/31 | | 10,609 | | 11,696 |
Series 2877 Class ZD, 5% 10/15/34 | | 647,772 | | 697,196 |
Series 3277 Class B, 4% 2/15/22 | | 300,000 | | 317,875 |
Series 3372 Class BD, 4.5% 10/15/22 | | 790,000 | | 844,373 |
Series 3578 Class B, 4.5% 9/15/24 | | 340,000 | | 359,698 |
Series 4176 Class BA, 3% 2/15/33 | | 380,270 | | 390,250 |
Series 2715 Class NG, 4.5% 12/15/18 | | 768,693 | | 815,742 |
Series 4181 Class LA, 3% 3/15/37 | | 522,317 | | 530,101 |
Series 4182 Class BA, 3% 6/15/37 | | 2,126,232 | | 2,176,462 |
Collateralized Mortgage Obligations - continued |
| Principal Amount (d) | | Value |
U.S. Government Agency - continued |
Ginnie Mae guaranteed REMIC pass-thru certificates: | | | | |
floater: | | | | |
Series 2007-59 Class FC, 0.668% 7/20/37 (l) | | $ 144,466 | | $ 145,255 |
Series 2008-2 Class FD, 0.648% 1/20/38 (l) | | 36,007 | | 36,190 |
Series 2008-73 Class FA, 1.028% 8/20/38 (l) | | 209,803 | | 213,391 |
Series 2008-83 Class FB, 1.068% 9/20/38 (l) | | 215,998 | | 219,860 |
Series 2009-108 Class CF, 0.7666% 11/16/39 (l) | | 180,862 | | 182,438 |
Series 2009-116 Class KF, 0.6966% 12/16/39 (l) | | 157,420 | | 158,479 |
Series 2010-9 Class FA, 0.6866% 1/16/40 (l) | | 247,503 | | 249,070 |
Series 2010-H17 Class FA, 0.494% 7/20/60 (l)(q) | | 579,922 | | 571,786 |
Series 2010-H18 Class AF, 0.4685% 9/20/60 (l)(q) | | 626,641 | | 618,285 |
Series 2010-H19 Class FG, 0.4685% 8/20/60 (l)(q) | | 768,746 | | 758,715 |
Series 2010-H27 Series FA, 0.5485% 12/20/60 (l)(q) | | 290,460 | | 287,557 |
Series 2011-H05 Class FA, 0.6685% 12/20/60 (l)(q) | | 420,718 | | 418,950 |
Series 2011-H07 Class FA, 0.6685% 2/20/61 (l)(q) | | 670,460 | | 667,702 |
Series 2011-H12 Class FA, 0.6585% 2/20/61 (l)(q) | | 989,712 | | 985,191 |
Series 2011-H13 Class FA, 0.6685% 4/20/61 (l)(q) | | 380,252 | | 378,696 |
Series 2011-H14: | | | | |
Class FB, 0.6685% 5/20/61 (l)(q) | | 447,239 | | 445,192 |
Class FC, 0.6685% 5/20/61 (l)(q) | | 411,181 | | 409,400 |
Series 2011-H17 Class FA, 0.6985% 6/20/61 (l)(q) | | 536,740 | | 535,251 |
Series 2011-H21 Class FA, 0.7685% 10/20/61 (l)(q) | | 602,526 | | 602,513 |
Series 2012-H01 Class FA, 0.8685% 11/20/61 (l)(q) | | 507,151 | | 509,333 |
Series 2012-H03 Class FA, 0.8685% 1/20/62 (l)(q) | | 307,014 | | 308,349 |
Series 2012-H06 Class FA, 0.7985% 1/20/62 (l)(q) | | 481,797 | | 482,403 |
Series 2012-H07 Class FA, 0.7985% 3/20/62 (l)(q) | | 283,913 | | 284,188 |
floater sequential payer Series 2011-150 Class D, 3% 4/20/37 | | 82,710 | | 83,992 |
planned amortization class: | | | | |
Series 2010-112 Class PM, 3.25% 9/20/33 | | 62,940 | | 63,641 |
|
| Principal Amount (d) | | Value |
Series 2010-99 Class PT, 3.5% 8/20/33 | | $ 82,803 | | $ 83,745 |
Series 2011-136 Class WI, 4.5% 5/20/40 (n) | | 210,945 | | 43,547 |
sequential payer Series 2011-69 Class GX, 4.5% 5/16/40 | | 470,000 | | 489,072 |
Series 2010-H13 Class JA, 5.46% 10/20/59 (q) | | 902,972 | | 962,760 |
Series 2010-H15 Class TP, 5.15% 8/20/60 (q) | | 1,174,813 | | 1,296,371 |
Series 2010-H17 Class XP, 5.3019% 7/20/60 (l)(q) | | 1,682,699 | | 1,855,857 |
Series 2010-H18 Class PL, 5.01% 9/20/60 (l)(q) | | 1,271,842 | | 1,397,898 |
Series 2011-71: | | | | |
Class ZB, 5.5% 8/20/34 | | 1,067,204 | | 1,186,999 |
Class ZC, 5.5% 7/16/34 | | 1,061,667 | | 1,152,733 |
Series 2012-64 Class KB, 3.7316% 5/20/41 (l) | | 183,084 | | 206,894 |
TOTAL COLLATERALIZED MORTGAGE OBLIGATIONS (Cost $38,104,766) |
38,042,868
|
Commercial Mortgage Securities - 1.3% |
|
Freddie Mac: | | | | |
pass thru-certificates floater Series KF01 Class A, 0.516% 4/25/19 (l) | | 761,569 | | 760,113 |
pass-thru certificates sequential payer: | | | | |
Series K011 Class A2, 4.084% 11/25/20 | | 260,000 | | 276,740 |
Series K014 Class A2, 3.871% 4/25/21 | | 630,000 | | 660,582 |
Series K015 Class A2, 3.23% 7/25/21 | | 1,140,000 | | 1,146,682 |
sequential payer: | | | | |
Series K006 Class A2, 4.251% 1/25/20 | | 1,410,000 | | 1,524,121 |
Series K009 Class A2, 3.808% 8/25/20 | | 2,150,000 | | 2,263,877 |
Series K017 Class A2, 2.873% 12/25/21 | | 1,560,000 | | 1,523,752 |
Series K034 Class A1, 2.669% 2/25/23 | | 1,098,113 | | 1,103,722 |
Series K031 Class A2, 3.3% 4/25/23 | | 2,600,000 | | 2,565,060 |
Series K032 Class A1, 3.016% 2/25/23 | | 2,104,764 | | 2,171,494 |
Series K501 Class A2, 1.655% 11/25/16 | | 550,000 | | 558,110 |
TOTAL COMMERCIAL MORTGAGE SECURITIES (Cost $14,900,386) |
14,554,253
|
Foreign Government and Government Agency Obligations - 22.4% |
| Principal Amount (d) | | Value |
Argentine Republic: | | | | |
discount (with partial capitalization through 12/31/13) 8.28% 12/31/33 | | $ 560,815 | | $ 420,611 |
2.5% 12/31/38 (e) | | 275,000 | | 112,063 |
7% 10/3/15 | | 2,760,000 | | 2,706,180 |
Aruba Government 4.625% 9/14/23 (f) | | 245,000 | | 232,138 |
Bahamian Republic 6.95% 11/20/29 (f) | | 310,000 | | 337,900 |
Bahrain Kingdom: | | | | |
5.5% 3/31/20 | | 175,000 | | 180,250 |
6.125% 8/1/23 (f) | | 285,000 | | 292,838 |
Banco Nacional de Desenvolvimento Economico e Social 3.375% 9/26/16 (f) | | 400,000 | | 404,000 |
Barbados Government 7% 8/4/22 (f) | | 200,000 | | 175,000 |
Belarus Republic: | | | | |
8.75% 8/3/15 (Reg. S) | | 1,505,000 | | 1,523,813 |
8.95% 1/26/18 | | 300,000 | | 304,500 |
Brazilian Federative Republic: | | | | |
4.25% 1/7/25 | | 620,000 | | 590,550 |
5.625% 1/7/41 | | 1,290,000 | | 1,241,625 |
7.125% 1/20/37 | | 980,000 | | 1,122,100 |
8.25% 1/20/34 | | 625,000 | | 789,063 |
12.25% 3/6/30 | | 760,000 | | 1,295,800 |
Buenos Aires Province 10.875% 1/26/21 (Reg. S) | | 500,000 | | 436,250 |
Buoni Poliennali del Tesoro: | | | | |
2.25% 5/15/16 | EUR | 10,425,000 | | 14,580,844 |
5.5% 11/1/22 | EUR | 6,150,000 | | 9,521,509 |
Canadian Government: | | | | |
0.75% 5/1/14 | CAD | 10,850,000 | | 10,207,325 |
1.25% 3/1/18 | CAD | 8,500,000 | | 7,823,441 |
1.5% 6/1/23 | CAD | 7,150,000 | | 6,024,914 |
3.5% 12/1/45 | CAD | 2,850,000 | | 2,816,570 |
Central Bank of Nigeria warrants 11/15/20 (a)(p) | | 750 | | 132,368 |
City of Buenos Aires 12.5% 4/6/15 (f) | | 760,000 | | 799,900 |
Colombian Republic: | | | | |
6.125% 1/18/41 | | 520,000 | | 556,400 |
7.375% 9/18/37 | | 505,000 | | 619,888 |
10.375% 1/28/33 | | 845,000 | | 1,240,038 |
Congo Republic 3.5% 6/30/29 (e) | | 1,445,520 | | 1,279,285 |
Costa Rican Republic: | | | | |
4.25% 1/26/23 (f) | | 300,000 | | 273,000 |
4.375% 4/30/25 (f) | | 245,000 | | 216,213 |
Croatia Republic: | | | | |
5.5% 4/4/23 (f) | | 590,000 | | 575,250 |
6.25% 4/27/17 (f) | | 665,000 | | 708,225 |
6.375% 3/24/21 (f) | | 500,000 | | 525,600 |
6.625% 7/14/20 (f) | | 420,000 | | 450,450 |
|
| Principal Amount (d) | | Value |
6.75% 11/5/19 (f) | | $ 480,000 | | $ 519,600 |
Democratic Socialist Republic of Sri Lanka: | | | | |
5.875% 7/25/22 (f) | | 200,000 | | 187,000 |
6.25% 10/4/20 (f) | | 830,000 | | 817,550 |
6.25% 7/27/21 (f) | | 410,000 | | 398,725 |
7.4% 1/22/15 (f) | | 715,000 | | 741,813 |
Dominican Republic: | | | | |
1.1593% 8/30/24 (l) | | 745,000 | | 633,250 |
5.875% 4/18/24 (f) | | 285,000 | | 272,888 |
7.5% 5/6/21 (f) | | 615,000 | | 673,425 |
9.04% 1/23/18 (f) | | 489,872 | | 529,062 |
El Salvador Republic: | | | | |
7.625% 2/1/41 (f) | | 175,000 | | 169,313 |
7.65% 6/15/35 (Reg. S) | | 240,000 | | 234,000 |
8.25% 4/10/32 (Reg. S) | | 140,000 | | 149,275 |
European Economic Community 2.75% 4/4/22 (Reg. S) | EUR | 525,000 | | 764,494 |
European Union 2.75% 9/21/21 | EUR | 1,400,000 | | 2,050,591 |
Export Credit Bank of Turkey 5.375% 11/4/16 (f) | | 400,000 | | 410,920 |
French Government OAT 3.25% 5/25/45 | EUR | 775,000 | | 1,024,696 |
Gabonese Republic 8.2% 12/12/17 (f) | | 100,000 | | 115,750 |
Georgia Republic 6.875% 4/12/21 (f) | | 210,000 | | 224,700 |
German Federal Republic: | | | | |
0% 6/13/14 | EUR | 3,550,000 | | 4,881,386 |
0.25% 4/13/18 | EUR | 1,825,000 | | 2,453,151 |
1.5% 2/15/23 | EUR | 5,375,000 | | 7,174,035 |
3.25% 1/4/20 | EUR | 7,300,000 | | 11,242,712 |
4.75% 7/4/34 | EUR | 1,650,000 | | 2,992,098 |
Ghana Republic 7.875% 8/7/23 (f) | | 285,000 | | 274,370 |
Hungarian Republic: | | | | |
4.125% 2/19/18 | | 478,000 | | 480,390 |
5.75% 11/22/23 | | 275,000 | | 274,313 |
7.625% 3/29/41 | | 804,000 | | 879,375 |
Indonesian Republic: | | | | |
3.375% 4/15/23 (f) | | 280,000 | | 238,700 |
4.875% 5/5/21 (f) | | 900,000 | | 891,000 |
5.25% 1/17/42 (f) | | 695,000 | | 594,225 |
5.375% 10/17/23 | | 200,000 | | 199,510 |
5.875% 3/13/20 (f) | | 730,000 | | 770,150 |
6.625% 2/17/37 (f) | | 525,000 | | 530,250 |
7.75% 1/17/38 (f) | | 810,000 | | 919,350 |
8.5% 10/12/35 (Reg. S) | | 1,075,000 | | 1,306,125 |
11.625% 3/4/19 (f) | | 875,000 | | 1,172,500 |
Islamic Republic of Pakistan 7.125% 3/31/16 (f) | | 1,325,000 | | 1,310,094 |
Israeli State (guaranteed by U.S. Government through Agency for International Development): | | | | |
5.5% 9/18/23 | | 2,590,000 | | 2,985,542 |
Foreign Government and Government Agency Obligations - continued |
| Principal Amount (d) | | Value |
Israeli State (guaranteed by U.S. Government through Agency for International Development): - continued | | | | |
5.5% 12/4/23 | | $ 1,503,000 | | $ 1,729,066 |
Italian Republic 5% 9/1/40 | EUR | 3,200,000 | | 4,535,628 |
Ivory Coast 7.1% 12/31/32 (e) | | 400,000 | | 355,000 |
Japan Government: | | | | |
0.1% 4/15/15 | JPY | 295,000,000 | | 2,801,225 |
0.1% 10/15/15 | JPY | 766,700,000 | | 7,278,561 |
1.1% 6/20/20 | JPY | 798,000,000 | | 7,915,241 |
1.8% 3/20/43 | JPY | 135,000,000 | | 1,303,265 |
1.9% 9/20/30 | JPY | 720,000,000 | | 7,446,110 |
Jordanian Kingdom: | | | | |
2.503% 10/30/20 | | 2,924,000 | | 2,860,406 |
3.875% 11/12/15 | | 400,000 | | 400,000 |
Latvian Republic 2.75% 1/12/20 (f) | | 495,000 | | 472,106 |
Lebanese Republic: | | | | |
4% 12/31/17 | | 1,360,000 | | 1,332,800 |
4.75% 11/2/16 | | 265,000 | | 262,350 |
5.15% 11/12/18 | | 400,000 | | 394,520 |
5.45% 11/28/19 | | 580,000 | | 565,500 |
6.375% 3/9/20 | | 450,000 | | 458,460 |
Lithuanian Republic: | | | | |
6.125% 3/9/21 (f) | | 540,000 | | 611,712 |
6.625% 2/1/22 (f) | | 575,000 | | 671,313 |
7.375% 2/11/20 (f) | | 355,000 | | 425,556 |
Moroccan Kingdom: | | | | |
4.25% 12/11/22 (f) | | 495,000 | | 455,400 |
5.5% 12/11/42 (f) | | 200,000 | | 168,000 |
Panamanian Republic: | | | | |
4.3% 4/29/53 | | 290,000 | | 219,675 |
6.7% 1/26/36 | | 190,000 | | 212,325 |
8.875% 9/30/27 | | 200,000 | | 268,000 |
9.375% 4/1/29 | | 70,000 | | 97,125 |
Peruvian Republic: | | | | |
4% 3/7/27 (e) | | 570,000 | | 570,000 |
5.625% 11/18/50 | | 110,000 | | 110,275 |
8.75% 11/21/33 | | 765,000 | | 1,088,213 |
Philippine Republic: | | | | |
7.75% 1/14/31 | | 875,000 | | 1,155,000 |
9.5% 2/2/30 | | 810,000 | | 1,215,000 |
10.625% 3/16/25 | | 580,000 | | 890,300 |
Plurinational State of Bolivia: | | | | |
4.875% 10/29/22 (f) | | 425,000 | | 404,813 |
5.95% 8/22/23 (f) | | 335,000 | | 331,650 |
Provincia de Cordoba 12.375% 8/17/17 (f) | | 765,000 | | 701,888 |
|
| Principal Amount (d) | | Value |
Provincia de Neuquen Argentina 7.875% 4/26/21 (Reg. S) | | $ 546,000 | | $ 553,180 |
Republic of Angola 7% 8/16/19 (Issued by Northern Lights III BV for Republic of Angola) (Reg. S) | | 275,000 | | 297,344 |
Republic of Armenia 6% 9/30/20 (f) | | 520,000 | | 515,450 |
Republic of Iraq 5.8% 1/15/28 (Reg. S) | | 1,750,000 | | 1,478,750 |
Republic of Namibia 5.5% 11/3/21 (f) | | 330,000 | | 336,600 |
Republic of Nigeria: | | | | |
yield at date of purchase 0.12% 4/24/14 | NGN | 78,050,000 | | 470,166 |
5.125% 7/12/18 (f) | | 290,000 | | 296,163 |
6.75% 1/28/21 (f) | | 155,000 | | 167,400 |
Republic of Serbia: | | | | |
5.25% 11/21/17 (f) | | 280,000 | | 280,700 |
5.875% 12/3/18 (f) | | 520,000 | | 528,450 |
6.75% 11/1/24 (f) | | 1,017,693 | | 1,001,207 |
7.25% 9/28/21 (f) | | 400,000 | | 421,000 |
Republic of Zambia 5.375% 9/20/22 (f) | | 200,000 | | 173,000 |
Romanian Republic: | | | | |
4.375% 8/22/23 (f) | | 398,000 | | 383,573 |
6.75% 2/7/22 (f) | | 750,000 | | 851,250 |
6.75% 2/7/22 | | 50,000 | | 56,750 |
Russian Federation: | | | | |
4.875% 9/16/23 (f) | | 200,000 | | 202,000 |
5.625% 4/4/42 (f) | | 800,000 | | 793,040 |
5.875% 9/16/43 (f) | | 200,000 | | 203,300 |
7.5% 3/31/30 (Reg. S) | | 4,504,500 | | 5,256,751 |
12.75% 6/24/28 (Reg. S) | | 1,865,000 | | 3,158,751 |
South African Republic 5.875% 9/16/25 | | 200,000 | | 208,000 |
Spanish Kingdom: | | | | |
3.3% 7/30/16 | EUR | 3,025,000 | | 4,303,932 |
5.15% 10/31/44 | EUR | 1,150,000 | | 1,615,942 |
State Oil Co. of Azerbaijan Republic 4.75% 3/13/23
(Reg. S) | | 400,000 | | 377,000 |
Turkish Republic: | | | | |
5.125% 3/25/22 | | 485,000 | | 464,388 |
5.625% 3/30/21 | | 490,000 | | 497,350 |
6% 1/14/41 | | 575,000 | | 508,156 |
6.25% 9/26/22 | | 475,000 | | 489,820 |
6.75% 4/3/18 | | 680,000 | | 742,050 |
6.75% 5/30/40 | | 670,000 | | 653,250 |
6.875% 3/17/36 | | 1,265,000 | | 1,252,350 |
7% 9/26/16 | | 460,000 | | 506,000 |
7% 3/11/19 | | 295,000 | | 324,131 |
7.25% 3/5/38 | | 875,000 | | 899,063 |
7.375% 2/5/25 | | 1,200,000 | | 1,303,500 |
7.5% 11/7/19 | | 625,000 | | 706,250 |
8% 2/14/34 | | 260,000 | | 288,925 |
Foreign Government and Government Agency Obligations - continued |
| Principal Amount (d) | | Value |
Turkish Republic: - continued | | | | |
11.875% 1/15/30 | | $ 450,000 | | $ 675,563 |
Ukraine Financing of Infrastructure Projects State Enterprise 8.375% 11/3/17 (f) | | 755,000 | | 690,825 |
Ukraine Government: | | | | |
6.25% 6/17/16 (f) | | 430,000 | | 400,975 |
6.75% 11/14/17 (f) | | 260,000 | | 239,850 |
7.5% 4/17/23 (Reg. S) | | 200,000 | | 179,240 |
7.75% 9/23/20 (f) | | 500,000 | | 461,250 |
7.8% 11/28/22 (f) | | 500,000 | | 451,875 |
7.95% 6/4/14 (f) | | 1,340,000 | | 1,340,000 |
7.95% 6/4/14 (Reg.S) | | 400,000 | | 400,000 |
7.95% 2/23/21 (f) | | 400,000 | | 368,480 |
9.25% 7/24/17 (f) | | 790,000 | | 781,073 |
United Arab Emirates 7.75% 10/5/20 (Reg. S) | | 190,000 | | 226,575 |
United Kingdom, Great Britain and Northern Ireland: | | | | |
1.75% 9/7/22 | GBP | 2,100,000 | | 3,177,005 |
2.25% 3/7/14 | GBP | 9,900,000 | | 16,448,038 |
3.5% 7/22/68 | GBP | 3,625,000 | | 5,856,290 |
United Mexican States: | | | | |
4.75% 3/8/44 | | 1,116,000 | | 1,011,096 |
5.75% 10/12/2110 | | 554,000 | | 512,450 |
6.05% 1/11/40 | | 1,286,000 | | 1,398,525 |
6.75% 9/27/34 | | 970,000 | | 1,144,600 |
7.5% 4/8/33 | | 305,000 | | 383,538 |
8.3% 8/15/31 | | 250,000 | | 338,125 |
United Republic of Tanzania 6.3921% 3/9/20 (l) | | 400,000 | | 416,500 |
Uruguay Republic 7.875% 1/15/33 pay-in-kind | | 825,000 | | 1,023,000 |
Venezuelan Republic: | | | | |
oil recovery rights 4/15/20 (p) | | 10,236 | | 255,900 |
6% 12/9/20 | | 465,000 | | 309,923 |
7% 3/31/38 | | 360,000 | | 225,000 |
8.5% 10/8/14 | | 480,000 | | 468,720 |
9% 5/7/23 (Reg. S) | | 1,710,000 | | 1,273,950 |
9.25% 5/7/28 (Reg. S) | | 610,000 | | 451,400 |
9.375% 1/13/34 | | 545,000 | | 404,118 |
11.75% 10/21/26 (Reg. S) | | 880,000 | | 752,400 |
11.95% 8/5/31 (Reg. S) | | 1,590,000 | | 1,354,680 |
12.75% 8/23/22 | | 1,630,000 | | 1,503,675 |
13.625% 8/15/18 | | 806,000 | | 789,880 |
Vietnamese Socialist Republic: | | | | |
1.25% 3/12/16 (l) | | 339,130 | | 301,826 |
4% 3/12/28 (e) | | 1,474,167 | | 1,297,267 |
6.875% 1/15/16 (f) | | 530,000 | | 565,775 |
TOTAL FOREIGN GOVERNMENT AND GOVERNMENT AGENCY OBLIGATIONS (Cost $254,521,215) |
252,153,031
|
Supranational Obligations - 0.2% |
| Principal Amount (d) | | Value |
European Investment Bank 3% 10/14/33 | EUR | 750,000 | | $ 1,030,370 |
Korea Development Bank 1.5% 5/30/18 (Reg.S) | EUR | 600,000 | | 812,141 |
TOTAL SUPRANATIONAL OBLIGATIONS (Cost $1,777,465) |
1,842,511
|
Common Stocks - 0.5% |
| Shares | | |
CONSUMER DISCRETIONARY - 0.3% |
Auto Components - 0.2% |
Remy International, Inc. | 6,195 | | 144,468 |
TRW Automotive Holdings Corp. (a) | 22,706 | | 1,689,099 |
| | 1,833,567 |
Automobiles - 0.1% |
General Motors Co. (a) | 1,098 | | 44,875 |
General Motors Co.: | | | |
warrants 7/10/16 (a) | 10,738 | | 334,596 |
warrants 7/10/19 (a) | 10,738 | | 248,370 |
Motors Liquidation Co. GUC Trust (a) | 2,816 | | 90,534 |
| | 718,375 |
Diversified Consumer Services - 0.0% |
Houghton Mifflin Harcourt Co. warrants 6/22/19 (a)(s) | 2,218 | | 3,327 |
Media - 0.0% |
Haights Cross Communications, Inc. (a) | 107 | | 0 |
Interpublic Group of Companies, Inc. | 23,368 | | 413,614 |
RDA Holding Co. warrants 2/19/14 (a)(s) | 510 | | 0 |
| | 413,614 |
TOTAL CONSUMER DISCRETIONARY | | 2,968,883 |
CONSUMER STAPLES - 0.0% |
Food Products - 0.0% |
Reddy Ice Holdings, Inc. (a) | 5,683 | | 25,318 |
FINANCIALS - 0.0% |
Capital Markets - 0.0% |
Penson Worldwide, Inc. Class A (a) | 314,563 | | 3 |
HEALTH CARE - 0.0% |
Health Care Providers & Services - 0.0% |
Rotech Healthcare, Inc. | 6,068 | | 112,182 |
INDUSTRIALS - 0.2% |
Aerospace & Defense - 0.0% |
Alion Science & Technology Corp. warrants 3/15/17 (a) | 115 | | 0 |
Airlines - 0.0% |
Delta Air Lines, Inc. | 1,150 | | 31,591 |
Common Stocks - continued |
| Shares | | Value |
INDUSTRIALS - continued |
Building Products - 0.1% |
Nortek, Inc. (a) | 10,732 | | $ 800,607 |
Nortek, Inc. warrants 12/7/14 (a) | 524 | | 13,362 |
| | 813,969 |
Commercial Services & Supplies - 0.0% |
WP Rocket Holdings, Inc. rights (a) | 146,146 | | 1 |
Marine - 0.0% |
U.S. Shipping Partners Corp. (a) | 644 | | 0 |
U.S. Shipping Partners Corp. warrants 12/31/29 (a) | 6,028 | | 0 |
Trading Companies & Distributors - 0.0% |
Penhall Acquisition Co.: | | | |
Class A (a) | 321 | | 28,720 |
Class B (a) | 107 | | 9,573 |
| | 38,293 |
Transportation Infrastructure - 0.1% |
DeepOcean Group Holding BV (a)(f) | 31,897 | | 894,728 |
TOTAL INDUSTRIALS | | 1,778,582 |
INFORMATION TECHNOLOGY - 0.0% |
IT Services - 0.0% |
Unisys Corp. (a) | 417 | | 13,999 |
Semiconductors & Semiconductor Equipment - 0.0% |
MagnaChip Semiconductor Corp. (a) | 2,669 | | 52,046 |
Spansion, Inc. Class A (a) | 207 | | 2,875 |
| | 54,921 |
TOTAL INFORMATION TECHNOLOGY | | 68,920 |
MATERIALS - 0.0% |
Chemicals - 0.0% |
LyondellBasell Industries NV Class A | 36 | | 2,890 |
Containers & Packaging - 0.0% |
Rock-Tenn Co. Class A | 416 | | 43,684 |
Metals & Mining - 0.0% |
Aleris International, Inc. (a)(s) | 2,037 | | 65,566 |
Paper & Forest Products - 0.0% |
Emerald Plantation Holdings Ltd. (a) | 9,719 | | 1,458 |
NewPage Corp. (i) | 678 | | 58,986 |
| | 60,444 |
TOTAL MATERIALS | | 172,584 |
UTILITIES - 0.0% |
Electric Utilities - 0.0% |
Portland General Electric Co. | 140 | | 4,228 |
TOTAL COMMON STOCKS (Cost $3,748,637) |
5,130,700
|
Preferred Stocks - 0.5% |
| Shares | | Value |
Convertible Preferred Stocks - 0.0% |
CONSUMER STAPLES - 0.0% |
Food Products - 0.0% |
Reddy Ice Holdings, Inc. 7.00% pay-in-kind (a) | 2,286 | | $ 16,868 |
Nonconvertible Preferred Stocks - 0.5% |
FINANCIALS - 0.5% |
Commercial Banks - 0.2% |
SunTrust Banks, Inc. Series E, 5.875% | 31,443 | | 660,303 |
Wells Fargo & Co. 5.20% | 71,251 | | 1,430,720 |
| | 2,091,023 |
Consumer Finance - 0.2% |
Ally Financial, Inc. 7.00% (f) | 2,620 | | 2,502,100 |
Real Estate Investment Trusts - 0.1% |
Public Storage Series V, 5.375% | 40,000 | | 781,200 |
TOTAL FINANCIALS | | 5,374,323 |
TOTAL PREFERRED STOCKS (Cost $4,988,298) |
5,391,191
|
Bank Loan Obligations - 2.0% |
| Principal Amount (d) | | |
CONSUMER DISCRETIONARY - 0.5% |
Diversified Consumer Services - 0.0% |
Spotless Holdings Ltd.: | | | | |
Tranche B 1LN, term loan 5% 10/2/18 (l) | | $ 149,625 | | 151,495 |
Tranche 2LN, term loan 8.75% 4/2/19 (l) | | 190,000 | | 193,800 |
| | 345,295 |
Hotels, Restaurants & Leisure - 0.2% |
Centaur Acquisition LLC: | | | | |
Tranche 1LN, term loan 5.25% 2/20/19 (l) | | 163,763 | | 164,377 |
Tranche 2LN, term loan 8.75% 2/20/20 (l) | | 165,000 | | 167,577 |
CityCenter Holdings LLC Tranche B, term loan 5% 10/16/20 (l) | | 230,000 | | 232,875 |
Graton Economic Development Authority Tranche B, term loan 9% 8/22/18 (l) | | 235,000 | | 247,925 |
Harrah's Entertainment, Inc. Tranche B 6LN, term loan 5.4884% 1/28/18 (l) | | 295,404 | | 281,756 |
Bank Loan Obligations - continued |
| Principal Amount (d) | | Value |
CONSUMER DISCRETIONARY - continued |
Hotels, Restaurants & Leisure - continued |
Hilton Worldwide Finance, LLC Tranche B, term loan 3.75% 10/25/20 (l) | | $ 1,156,579 | | $ 1,165,253 |
MGM Mirage, Inc. Tranche B, term loan 3.5% 12/20/19 (l) | | 277,200 | | 276,867 |
| | 2,536,630 |
Media - 0.2% |
McGraw-Hill Global Education Holdings, LLC Tranche B, term loan 9% 3/18/19 (l) | | 401,625 | | 407,649 |
Springer Science+Business Media Deutschland GmbH Tranche B 2LN, term loan 5% 8/14/20 (l) | | 1,236,900 | | 1,233,808 |
TWCC Holding Corp. Tranche 2LN, term loan 7% 6/26/20 (l) | | 320,000 | | 328,400 |
| | 1,969,857 |
Specialty Retail - 0.1% |
General Nutrition Centers, Inc. Tranche B, term loan 3.25% 3/4/19 (l) | | 395,000 | | 393,519 |
TOTAL CONSUMER DISCRETIONARY | | 5,245,301 |
CONSUMER STAPLES - 0.2% |
Food & Staples Retailing - 0.1% |
BJ's Wholesale Club, Inc.: | | | | |
Tranche 2LN, term loan 8.5% 3/31/20 (l) | | 65,000 | | 66,300 |
Tranche B 1LN, term loan 4.5% 9/26/19 (l) | | 200,000 | | 201,250 |
Del Monte Foods Consumer Products: | | | | |
Tranche 2LN, term loan 5/26/21 (r) | | 150,000 | | 151,500 |
Tranche B 1LN, term loan 11/26/20 (r) | | 300,000 | | 300,750 |
Focus Brands, Inc. Tranche 2LN, term loan 10.25% 8/21/18 (l) | | 285,000 | | 289,275 |
Rite Aid Corp. Tranche 2LN, term loan 5.75% 8/21/20 (l) | | 55,000 | | 56,444 |
| | 1,065,519 |
Personal Products - 0.1% |
Revlon Consumer Products Corp.: | | | | |
term loan 4% 8/19/19 (l) | | 840,000 | | 842,100 |
Tranche B, term loan 4% 11/19/17 (l) | | 371,250 | | 373,570 |
| | 1,215,670 |
TOTAL CONSUMER STAPLES | | 2,281,189 |
|
| Principal Amount (d) | | Value |
ENERGY - 0.3% |
Oil, Gas & Consumable Fuels - 0.3% |
Alon U.S.A. Partners LP term loan 9.25% 11/26/18 (l) | | $ 332,750 | | $ 341,069 |
Arch Coal, Inc. Tranche B, term loan 6.25% 5/16/18 (l) | | 325,053 | | 319,787 |
Crestwood Holdings Partners LLC Tranche B, term loan 7% 6/19/19 (l) | | 487,539 | | 500,336 |
Fieldwood Energy, LLC Tranche 2LN, term loan 8.375% 9/30/20 (l) | | 1,545,000 | | 1,568,175 |
Panda Sherman Power, LLC term loan 9% 9/14/18 (l) | | 205,000 | | 209,613 |
Panda Temple Power, LLC term loan 7.25% 4/3/19 (l) | | 110,000 | | 113,713 |
Samson Investment Co. Tranche B 2LN, term loan 9/25/18 (r) | | 120,000 | | 120,000 |
Western Refining, Inc. Tranche B, term loan 4.25% 11/12/20 (l) | | 85,000 | | 86,063 |
| | 3,258,756 |
FINANCIALS - 0.0% |
Diversified Financial Services - 0.0% |
Moxie Patriot LLC Tranche B, term loan 12/19/20 (r) | | 130,000 | | 131,788 |
Sheridan Investment Partners I term loan 12/16/20 (r) | | 172,126 | | 172,780 |
Sheridan Production Partners I: | | | | |
Tranche A, term loan 12/16/20 (r) | | 23,944 | | 24,035 |
Tranche M, term loan 12/16/20 (r) | | 8,930 | | 8,964 |
| | 337,567 |
Real Estate Management & Development - 0.0% |
Realogy Corp. Credit-Linked Deposit 4.4463% 10/10/16 (l) | | 51,757 | | 51,627 |
TOTAL FINANCIALS | | 389,194 |
HEALTH CARE - 0.3% |
Health Care Providers & Services - 0.2% |
DaVita, Inc. Tranche A, term loan 2.92% 10/20/15 (l) | | 566,649 | | 568,066 |
Emergency Medical Services Corp. Tranche B, term loan 4% 5/25/18 (l) | | 1,073,512 | | 1,076,196 |
| | 1,644,262 |
Life Sciences Tools & Services - 0.1% |
Jaguar Holding Co. II Tranche B, term loan 4% 12/5/18 (l) | | 1,234,926 | | 1,234,926 |
Bank Loan Obligations - continued |
| Principal Amount (d) | | Value |
HEALTH CARE - continued |
Pharmaceuticals - 0.0% |
Salix Pharmaceuticals Ltd. Tranche B, term loan 1/2/20 (r) | | $ 50,000 | | $ 50,500 |
TOTAL HEALTH CARE | | 2,929,688 |
INDUSTRIALS - 0.2% |
Airlines - 0.0% |
Northwest Airlines Corp. Tranche A, term loan 2% 12/24/18 (l) | | 595,062 | | 547,457 |
Commercial Services & Supplies - 0.1% |
Arysta Lifescience SPC LLC: | | | | |
Tranche B 1LN, term loan 4.5% 5/29/20 (l) | | 189,050 | | 190,232 |
Tranche B 2LN, term loan 8.25% 11/30/20 (l) | | 375,000 | | 383,438 |
GCA Services Group, Inc. Tranche 2LN, term loan 9.25% 11/1/20 (l) | | 180,000 | | 181,800 |
Tervita Corp. Tranche B 1LN, term loan 6.25% 5/15/18 (l) | | 322,563 | | 323,369 |
WTG Holdings III Corp.: | | | | |
Tranche 2LN, term loan 12/12/21 (r) | | 50,000 | | 49,750 |
Tranche B, term loan 12/12/20 (r) | | 55,000 | | 54,725 |
| | 1,183,314 |
Machinery - 0.1% |
Pinafore LLC Tranche B 2LN, term loan 3.75% 9/21/16 (l) | | 744,311 | | 746,172 |
TOTAL INDUSTRIALS | | 2,476,943 |
INFORMATION TECHNOLOGY - 0.2% |
Electronic Equipment & Components - 0.0% |
Infor U.S., Inc. Tranche B 5LN, term loan 6/3/20 (r) | | 280,000 | | 278,964 |
Software - 0.2% |
BMC Software Finance, Inc. Tranche B, term loan 5% 9/10/20 (l) | | 635,000 | | 635,000 |
ION Trading Technologies Ltd.: | | | | |
Tranche 1LN, term loan 4.5% 5/22/20 (l) | | 69,650 | | 69,650 |
Tranche 2LN, term loan 8.25% 5/22/21 (l) | | 30,000 | | 30,544 |
Kronos, Inc. Tranche 2LN, term loan 9.75% 4/30/20 (l) | | 685,000 | | 715,825 |
| | 1,451,019 |
TOTAL INFORMATION TECHNOLOGY | | 1,729,983 |
|
| Principal Amount (d) | | Value |
MATERIALS - 0.1% |
Construction Materials - 0.0% |
Fairmount Minerals Ltd. Tranche B 2LN, term loan 5% 9/5/19 (l) | | $ 84,788 | | $ 86,165 |
Containers & Packaging - 0.1% |
Berry Plastics Corp. Tranche E, term loan 12/18/20 (r) | | 510,000 | | 508,725 |
Metals & Mining - 0.0% |
Ameriforge Group, Inc.: | | | | |
Tranche B 1LN, term loan 5% 1/25/20 (l) | | 84,152 | | 84,537 |
Tranche B 2LN, term loan 8.75% 1/25/21 (l) | | 50,000 | | 50,875 |
MRC Global, Inc. Tranche B, term loan 5% 11/9/19 (l) | | 339,150 | | 344,237 |
| | 479,649 |
TOTAL MATERIALS | | 1,074,539 |
TELECOMMUNICATION SERVICES - 0.1% |
Diversified Telecommunication Services - 0.1% |
Consolidated Communications, Inc. Tranche B, term loan 12/23/20 (r) | | 45,000 | | 45,000 |
FairPoint Communications, Inc. Tranche B, term loan 7.5% 2/14/19 (l) | | 749,338 | | 773,691 |
Integra Telecom Holdings, Inc. Tranche 2LN, term loan 9.75% 2/14/20 (l) | | 40,000 | | 41,000 |
| | 859,691 |
Wireless Telecommunication Services - 0.0% |
Digicel International Finance Ltd. Tranche D 1LN, term loan 3.75% 3/31/17 (l) | | 345,000 | | 344,138 |
Intelsat Jackson Holdings SA Tranche B 2LN, term loan 3.75% 6/30/19 (l) | | 415,000 | | 418,652 |
| | 762,790 |
TOTAL TELECOMMUNICATION SERVICES | | 1,622,481 |
UTILITIES - 0.1% |
Electric Utilities - 0.0% |
Essential Power LLC Tranche B, term loan 4.25% 8/8/19 (l) | | 309,464 | | 300,180 |
Gas Utilities - 0.0% |
Everest Acquisition LLC Tranche B 3LN, term loan 3.5% 5/24/18 (l) | | 176,667 | | 176,667 |
Bank Loan Obligations - continued |
| Principal Amount (d) | | Value |
UTILITIES - continued |
Independent Power Producers & Energy Traders - 0.1% |
LSP Madison Funding LLC Tranche 1LN, term loan 5.5% 6/28/19 (l) | | $ 278,087 | | $ 281,215 |
Tempus Public Foundation Generation Holdings LLC Tranche B, term loan 4.75% 12/31/17 (l) | | 263,675 | | 264,993 |
| | 546,208 |
TOTAL UTILITIES | | 1,023,055 |
TOTAL BANK LOAN OBLIGATIONS (Cost $21,506,866) |
22,031,129
|
Sovereign Loan Participations - 0.1% |
|
Indonesian Republic loan participation: | | | | |
Citibank 1.1875% 12/14/19 (l) | | 261,980 | | 244,951 |
Goldman Sachs 1.1875% 12/14/19 (l) | | 471,528 | | 440,878 |
1.1875% 12/14/19 (l) | | 352,587 | | 329,669 |
TOTAL SOVEREIGN LOAN PARTICIPATIONS (Cost $996,263) |
1,015,498
|
Fixed-Income Funds - 0.5% |
| Shares | | |
Fidelity Floating Rate Central Fund (m)
(Cost $4,455,711) | 55,212 | |
5,933,634
|
Preferred Securities - 0.8% |
| Principal Amount (d) | | |
CONSUMER DISCRETIONARY - 0.2% |
Media - 0.2% |
Globo Comunicacoes e Participacoes SA 6.25% (e)(f)(g) | $ 930,000 | | 978,730 |
NBCUniversal Enterprise, Inc. 5.25% (f)(g) | 770,000 | | 763,760 |
| | 1,742,490 |
CONSUMER STAPLES - 0.0% |
Food Products - 0.0% |
Cosan Overseas Ltd. 8.25% (g) | 400,000 | | 405,111 |
ENERGY - 0.0% |
Oil, Gas & Consumable Fuels - 0.0% |
Reliance Industries Ltd. 5.875% (f)(g) | 400,000 | | 347,515 |
FINANCIALS - 0.6% |
Commercial Banks - 0.0% |
Wells Fargo & Co. 7.98% (g)(l) | 135,000 | | 153,739 |
|
| Principal Amount (d) | | Value |
Diversified Financial Services - 0.6% |
Bank of America Corp.: | | | |
5.2% (g)(l) | $ 965,000 | | $ 872,774 |
8% (g)(l) | 255,000 | | 289,730 |
8.125% (g)(l) | 145,000 | | 162,842 |
Citigroup, Inc. 5.95% (g)(l) | 2,405,000 | | 2,285,739 |
JPMorgan Chase & Co. 6% (g)(l) | 2,580,000 | | 2,532,345 |
| | 6,143,430 |
TOTAL FINANCIALS | | 6,297,169 |
INDUSTRIALS - 0.0% |
Construction & Engineering - 0.0% |
Odebrecht Finance Ltd. 7.5%
(Reg. S) (g) | 100,000 | | 96,375 |
MATERIALS - 0.0% |
Metals & Mining - 0.0% |
CSN Islands XII Corp. 7%
(Reg. S) (g) | 720,000 | | 595,260 |
TOTAL PREFERRED SECURITIES (Cost $9,839,012) |
9,483,920
|
Other - 0.0% |
| Shares | | |
Other - 0.0% |
Idearc, Inc. Claim (a)
(Cost $1) | 108,228 | |
1
|
Money Market Funds - 3.3% |
| | | |
Fidelity Cash Central Fund, 0.11% (b)
(Cost $37,771,744) | 37,771,744 | |
37,771,744
|
TOTAL INVESTMENT PORTFOLIO - 99.1% (Cost $1,101,917,742) | | 1,117,442,154 |
NET OTHER ASSETS (LIABILITIES) - 0.9% | | 9,831,711 |
NET ASSETS - 100% | $ 1,127,273,865 |
Futures Contracts |
| Expiration Date | | Underlying Face Amount at Value | | Unrealized Appreciation/(Depreciation) |
Purchased |
Treasury Contracts |
20 CBOT 10 Year U.S. Treasury Note Contracts | March 2014 | | $ 2,460,938 | | $ (47,078) |
53 CBOT 2 Year U.S. Treasury Note Contracts | March 2014 | | 11,650,063 | | (18,321) |
Futures Contracts - continued |
| Expiration Date | | Underlying Face Amount at Value | | Unrealized Appreciation/(Depreciation) |
Purchased - continued |
Treasury Contracts - continued |
30 CBOT 5 Year U.S. Treasury Note Contracts | March 2014 | | $ 3,579,375 | | $ (45,301) |
13 CBOT Long Term U.S. Treasury Bond Contracts | March 2014 | | 1,668,063 | | (19,818) |
23 CBOT Ultra Long Term U.S. Treasury Bond Contracts | March 2014 | | 3,133,750 | | (73,165) |
TOTAL TREASURY CONTRACTS | | $ 22,492,189 | | $ (203,683) |
The face value of futures purchased as a percentage of net assets is 1.9% |
For the period, the average monthly underlying face amount for futures contracts in the aggregate was $15,067,007. |
Swaps |
Interest Rate Swaps |
Clearinghouse/Counterparty (1) | Expiration Date | Notional Amount | Payment Received | Payment Paid | Value | Upfront Premium Received/(Paid) (2) | Unrealized Appreciation/
(Depreciation) |
CME | Nov. 2023 | | $ 10,178,000 | 3-month LIBOR | 2.83% | $ 202,388 | $ 0 | $ 202,388 |
|
(1) Swaps with CME Group (CME) are centrally cleared over-the-counter (OTC) swaps. |
|
(2) Any premiums for centrally cleared OTC swaps are recorded periodically throughout the term of the swap to variation margin and included in unrealized appreciation (depreciation). |
For the period, the average monthly notional amount for swaps in the aggregate was $9,516,167. |
Currency Abbreviations |
BRL | - | Brazilian real |
CAD | - | Canadian dollar |
EUR | - | European Monetary Unit |
GBP | - | British pound |
JPY | - | Japanese yen |
MXN | - | Mexican peso |
NGN | - | Nigerian naira |
TRY | - | Turkish Lira |
Legend |
(a) Non-income producing |
(b) Affiliated fund that is generally available only to investment companies and other accounts managed by Fidelity Investments. The rate quoted is the annualized seven-day yield of the fund at period end. A complete unaudited listing of the fund's holdings as of its most recent quarter end is available upon request. In addition, each Fidelity Central Fund's financial statements, which are not covered by the Fund's Report of Independent Registered Public Accounting Firm, are available on the SEC's website or upon request. |
(c) Non-income producing - Security is in default. |
(d) Amount is stated in United States dollars unless otherwise noted. |
(e) Security initially issued at one coupon which converts to a higher coupon at a specified date. The rate shown is the rate at period end. |
(f) Security exempt from registration under Rule 144A of the Securities Act of 1933. These securities may be resold in transactions exempt from registration, normally to qualified institutional buyers. At the end of the period, the value of these securities amounted to $226,634,648 or 20.1% of net assets. |
(g) Security is perpetual in nature with no stated maturity date. |
(h) Security or a portion of the security purchased on a delayed delivery or when-issued basis. |
(i) A portion of the security sold on a delayed delivery basis. |
(j) Security or a portion of the security was pledged to cover margin requirements for futures contracts. At period end, the value of securities pledged amounted to $215,460. |
(k) Security or a portion of the security was pledged to cover margin requirements for centrally cleared OTC swaps. At period end, the value of securities pledged amounted to $272,868. |
(l) Coupon rates for floating and adjustable rate securities reflect the rates in effect at period end. |
(m) Affiliated fund that is generally available only to investment companies and other accounts managed by Fidelity Investments. A complete unaudited schedule of portfolio holdings for each Fidelity Central Fund is filed with the SEC for the first and third quarters of each fiscal year on Form N-Q and is available upon request or at the SEC's website at www.sec.gov. An unaudited holdings listing for the Fund, which presents direct holdings as well as the pro-rata share of securities and other investments held indirectly through its investment in underlying non-money market Fidelity Central Funds, is available at advisor.fidelity.com. In addition, each Fidelity Central Fund's financial statements, which are not covered by the Fund's Report of Independent Registered Public Accounting Firm, are available on the SEC's website or upon request. |
(n) Security represents right to receive monthly interest payments on an underlying pool of mortgages or assets. Principal shown is the outstanding par amount of the pool as of the end of the period. |
(o) Coupon is inversely indexed to a floating interest rate multiplied by a specified factor. The price may be considerably more volatile than the price of a comparable fixed rate security. |
(p) Quantity represents share amount. |
(q) Represents an investment in an underlying pool of reverse mortgages which typically do not require regular principal and interest payments as repayment is deferred until a maturity event. |
(r) The coupon rate will be determined upon settlement of the loan after period end. |
(s) Restricted securities - Investment in securities not registered under the Securities Act of 1933 (excluding 144A issues). At the end of the period, the value of restricted securities (excluding 144A issues) amounted to $68,893 or 0.0% of net assets. |
Additional information on each restricted holding is as follows: |
Security | Acquisition Date | Acquisition Cost |
Aleris International, Inc. | 6/1/10 | $ 71,295 |
Houghton Mifflin Harcourt Co. warrants 6/22/19 | 6/22/12 | $ 4,281 |
RDA Holding Co. warrants 2/19/14 | 2/27/07 | $ 160,000 |
Affiliated Central Funds |
Information regarding fiscal year to date income earned by the Fund from investments in Fidelity Central Funds is as follows: |
Fund | Income earned |
Fidelity Cash Central Fund | $ 54,714 |
Fidelity Floating Rate Central Fund | 313,525 |
Total | $ 368,239 |
Additional information regarding the Fund's fiscal year to date purchases and sales, including the ownership percentage, of the non Money Market Central Funds is as follows: |
Fund | Value, beginning of period | Purchases | Sales Proceeds | Value,
end of
period | % ownership, end of
period |
Fidelity Floating Rate Central Fund | $ 6,048,108 | $ 246,054 | $ 502,242 | $ 5,933,634 | 0.4% |
Other Information |
The following is a summary of the inputs used, as of December 31, 2013, involving the Fund's assets and liabilities carried at fair value. The inputs or methodology used for valuing securities may not be an indication of the risk associated with investing in those securities. For more information on valuation inputs, and their aggregation into the levels used in the table below, please refer to the Investment Valuation section in the accompanying Notes to Financial Statements. |
Valuation Inputs at Reporting Date: |
Description | Total | Level 1 | Level 2 | Level 3 |
Investments in Securities: | | | | |
Equities: | | | | |
Consumer Discretionary | $ 2,968,883 | $ 2,965,556 | $ - | $ 3,327 |
Consumer Staples | 42,186 | - | 25,318 | 16,868 |
Financials | 5,374,326 | 2,872,223 | 2,502,100 | 3 |
Health Care | 112,182 | - | - | 112,182 |
Industrials | 1,778,582 | 845,560 | - | 933,022 |
Information Technology | 68,920 | 68,920 | - | - |
Materials | 172,584 | 48,032 | - | 124,552 |
Utilities | 4,228 | 4,228 | - | - |
Corporate Bonds | 491,959,668 | - | 491,948,901 | 10,767 |
U.S. Government and Government Agency Obligations | 200,035,082 | - | 200,035,082 | - |
U.S. Government Agency - Mortgage Securities | 31,921,347 | - | 31,921,347 | - |
Asset-Backed Securities | 175,577 | - | 175,577 | - |
Collateralized Mortgage Obligations | 38,042,868 | - | 38,042,868 | - |
Commercial Mortgage Securities | 14,554,253 | - | 14,554,253 | - |
Foreign Government and Government Agency Obligations | 252,153,031 | - | 251,583,031 | 570,000 |
Supranational Obligations | 1,842,511 | - | 1,842,511 | - |
Bank Loan Obligations | 22,031,129 | - | 21,194,397 | 836,732 |
Sovereign Loan Participations | 1,015,498 | - | - | 1,015,498 |
Fixed-Income Funds | 5,933,634 | 5,933,634 | - | - |
Preferred Securities | 9,483,920 | - | 8,720,160 | 763,760 |
Other | 1 | - | - | 1 |
Money Market Funds | 37,771,744 | 37,771,744 | - | - |
Total Investments in Securities: | $ 1,117,442,154 | $ 50,509,897 | $ 1,062,545,545 | $ 4,386,712 |
Derivative Instruments: | | | | |
Assets | | | | |
Swaps | $ 202,388 | $ - | $ 202,388 | $ - |
Liabilities | | | | |
Futures Contracts | $ (203,683) | $ (203,683) | $ - | $ - |
Total Derivative Instruments: | $ (1,295) | $ (203,683) | $ 202,388 | $ - |
Value of Derivative Instruments |
The following table is a summary of the Fund's value of derivative instruments by primary risk exposure as of December 31, 2013. For additional information on derivative instruments, please refer to the Derivative Instruments section in the accompanying Notes to Financial Statements. |
Primary Risk Exposure /
Derivative Type | Value |
| Asset | Liability |
Interest Rate Risk | | |
Futures Contracts (a) | $ - | $ (203,683) |
Swaps (b) | 202,388 | - |
Total Value of Derivatives | $ 202,388 | $ (203,683) |
(a) Reflects gross cumulative appreciation (depreciation) on futures contracts as presented in the Schedule of Investments. Only the period end receivable or payable for daily variation margin and net unrealized appreciation (depreciation) are presented in the Statement of Assets and Liabilities. |
(b) For centrally cleared OTC swaps, reflects gross cumulative appreciation (depreciation) as presented in the Schedule of Investments. For centrally cleared OTC swaps, only the period end receivable or payable for daily variation margin and net unrealized appreciation (depreciation) are presented in the Statement of Assets and Liabilities. |
Other Information |
Distribution of investments by country or territory of incorporation, as a percentage of total net assets, is as follows (Unaudited): |
United States of America | 64.3% |
Canada | 3.5% |
Germany | 2.9% |
United Kingdom | 2.6% |
Italy | 2.6% |
Japan | 2.5% |
Luxembourg | 2.1% |
Bermuda | 1.5% |
Venezuela | 1.3% |
Netherlands | 1.2% |
Mexico | 1.2% |
Turkey | 1.2% |
Argentina | 1.1% |
Indonesia | 1.0% |
Others (Individually Less Than 1%) | 11.0% |
| 100.0% |
The information in the above table is based on the combined investments of the Fund and its pro-rata share of the investments of Fidelity's fixed-income central funds. |
See accompanying notes which are an integral part of the financial statements.
Annual Report
Statement of Assets and Liabilities
| December 31, 2013 |
| | |
Assets | | |
Investment in securities, at value - See accompanying schedule: Unaffiliated issuers (cost $1,059,690,287) | $ 1,073,736,776 | |
Fidelity Central Funds (cost $42,227,455) | 43,705,378 | |
Total Investments (cost $1,101,917,742) | | $ 1,117,442,154 |
Cash | | 848,746 |
Restricted cash | | 146,146 |
Receivable for investments sold
Regular delivery | | 4,028,248 |
Delayed delivery | | 63,531 |
Receivable for fund shares sold | | 51,846 |
Dividends receivable | | 39 |
Interest receivable | | 13,193,966 |
Distributions receivable from Fidelity Central Funds | | 28,545 |
Receivable for daily variation margin for derivative instruments | | 26,436 |
Prepaid expenses | | 2,553 |
Total assets | | 1,135,832,210 |
| | |
Liabilities | | |
Payable for investments purchased
Regular delivery | $ 4,782,039 | |
Delayed delivery | 364,815 | |
Payable for fund shares redeemed | 2,658,116 | |
Accrued management fee | 533,985 | |
Distribution and service plan fees payable | 14,068 | |
Other affiliated payables | 122,999 | |
Other payables and accrued expenses | 82,323 | |
Total liabilities | | 8,558,345 |
| | |
Net Assets | | $ 1,127,273,865 |
Net Assets consist of: | | |
Paid in capital | | $ 1,112,453,753 |
Undistributed net investment income | | 2,375,391 |
Accumulated undistributed net realized gain (loss) on investments and foreign currency transactions | | (2,957,877) |
Net unrealized appreciation (depreciation) on investments and assets and liabilities in foreign currencies | | 15,402,598 |
Net Assets | | $ 1,127,273,865 |
Statement of Assets and Liabilities - continued
| December 31, 2013 |
| | |
Initial Class:
Net Asset Value, offering price and redemption price per share ($119,063,069 ÷ 10,630,334 shares) | | $ 11.20 |
| | |
Service Class:
Net Asset Value, offering price and redemption price per share ($837,114 ÷ 74,800 shares) | | $ 11.19 |
| | |
Service Class 2:
Net Asset Value, offering price and redemption price per share ($68,196,456 ÷ 6,122,944 shares) | | $ 11.14 |
| | |
Investor Class:
Net Asset Value, offering price and redemption price per share ($939,177,226 ÷ 84,076,376 shares) | | $ 11.17 |
See accompanying notes which are an integral part of the financial statements.
Annual Report
Statement of Operations
| Year ended December 31, 2013 |
| | |
Investment Income | | |
Dividends | | $ 706,219 |
Interest | | 52,832,634 |
Income from Fidelity Central Funds | | 368,239 |
Total income | | 53,907,092 |
| | |
Expenses | | |
Management fee | $ 6,875,572 | |
Transfer agent fees | 1,203,283 | |
Distribution and service plan fees | 135,304 | |
Accounting fees and expenses | 424,498 | |
Custodian fees and expenses | 76,792 | |
Independent trustees' compensation | 4,668 | |
Registration fees | 3 | |
Audit | 78,591 | |
Legal | 5,228 | |
Miscellaneous | 10,963 | |
Total expenses before reductions | 8,814,902 | |
Expense reductions | (48,442) | 8,766,460 |
Net investment income (loss) | | 45,140,632 |
Realized and Unrealized Gain (Loss) Net realized gain (loss) on: | | |
Investment securities: | | |
Unaffiliated issuers | 5,490,456 | |
Fidelity Central Funds | 28,106 | |
Foreign currency transactions | (48,073) | |
Futures contracts | 54,228 | |
Swaps | 1,132,199 | |
Total net realized gain (loss) | | 6,656,916 |
Change in net unrealized appreciation (depreciation) on: Investment securities | (51,213,743) | |
Assets and liabilities in foreign currencies | 7,559 | |
Futures contracts | (192,494) | |
Swaps | (28,527) | |
Total change in net unrealized appreciation (depreciation) | | (51,427,205) |
Net gain (loss) | | (44,770,289) |
Net increase (decrease) in net assets resulting from operations | | $ 370,343 |
Statement of Changes in Net Assets
| Year ended
December 31, 2013 | Year ended
December 31, 2012 |
Increase (Decrease) in Net Assets | | |
Operations | | |
Net investment income (loss) | $ 45,140,632 | $ 45,709,728 |
Net realized gain (loss) | 6,656,916 | 14,431,522 |
Change in net unrealized appreciation (depreciation) | (51,427,205) | 54,466,654 |
Net increase (decrease) in net assets resulting from operations | 370,343 | 114,607,904 |
Distributions to shareholders from net investment income | (46,718,517) | (44,510,315) |
Distributions to shareholders from net realized gain | (11,002,756) | (13,812,434) |
Total distributions | (57,721,273) | (58,322,749) |
Share transactions - net increase (decrease) | (107,057,354) | 227,501,664 |
Total increase (decrease) in net assets | (164,408,284) | 283,786,819 |
| | |
Net Assets | | |
Beginning of period | 1,291,682,149 | 1,007,895,330 |
End of period (including undistributed net investment income of $2,375,391 and undistributed net investment income of $5,044,072, respectively) | $ 1,127,273,865 | $ 1,291,682,149 |
See accompanying notes which are an integral part of the financial statements.
Annual Report
Financial Highlights - Initial Class
Years ended December 31, | 2013 | 2012 | 2011 | 2010 | 2009 |
Selected Per-Share Data | | | | | |
Net asset value, beginning of period | $ 11.76 | $ 11.15 | $ 11.36 | $ 11.11 | $ 8.94 |
Income from Investment Operations | | | | | |
Net investment income (loss) C | .437 | .465 | .511 | .588 | .619 |
Net realized and unrealized gain (loss) | (.403) | .704 | .013 | .473 | 2.065 |
Total from investment operations | .034 | 1.169 | .524 | 1.061 | 2.684 |
Distributions from net investment income | (.483) | (.425) | (.486) | (.517) | (.439) |
Distributions from net realized gain | (.111) | (.134) | (.248) | (.294) | (.075) |
Total distributions | (.594) | (.559) | (.734) | (.811) | (.514) |
Net asset value, end of period | $ 11.20 | $ 11.76 | $ 11.15 | $ 11.36 | $ 11.11 |
Total Return A,B | .29% | 10.50% | 4.66% | 9.64% | 30.02% |
Ratios to Average Net Assets D,F | | | | | |
Expenses before reductions | .68% | .69% | .69% | .71% | .74% |
Expenses net of fee waivers, if any | .68% | .69% | .69% | .70% | .74% |
Expenses net of all reductions | .68% | .69% | .69% | .70% | .74% |
Net investment income (loss) | 3.74% | 3.97% | 4.38% | 5.07% | 5.98% |
Supplemental Data | | | | | |
Net assets, end of period (000 omitted) | $ 119,063 | $ 164,166 | $ 164,168 | $ 154,861 | $ 166,898 |
Portfolio turnover rate E | 141% | 129% | 224% | 208% | 199% |
A Total returns do not reflect charges attributable to your insurance company's separate account. Inclusion of these charges would reduce the total returns shown.
B Total returns would have been lower if certain expenses had not been reduced during the applicable periods shown.
C Calculated based on average shares outstanding during the period.
D Fees and expenses of any underlying Fidelity Central Funds are not included in the Fund's expense ratio. The Fund indirectly bears its proportionate share of the expenses of any underlying Fidelity Central Funds. Based on their most recent shareholder report date, the expenses of any underlying non-money market Fidelity Central Funds were less than .01%.
E Amount does not include the portfolio activity of any underlying Fidelity Central Funds.
F Expense ratios reflect operating expenses of the class. Expenses before reductions do not reflect amounts reimbursed by the investment adviser or reductions from brokerage service arrangements or reductions from other expense offset arrangements and do not represent the amount paid by the class during periods when reimbursements or reductions occur. Expenses net of fee waivers reflect expenses after reimbursement by the investment adviser but prior to reductions from brokerage service arrangements or other expense offset arrangements. Expenses net of all reductions represent the net expenses paid by the class.
Financial Highlights - Service Class
Years ended December 31, | 2013 | 2012 | 2011 | 2010 | 2009 |
Selected Per-Share Data | | | | | |
Net asset value, beginning of period | $ 11.75 | $ 11.14 | $ 11.35 | $ 11.10 | $ 8.92 |
Income from Investment Operations | | | | | |
Net investment income (loss) C | .425 | .453 | .499 | .574 | .594 |
Net realized and unrealized gain (loss) | (.403) | .704 | .009 | .469 | 2.083 |
Total from investment operations | .022 | 1.157 | .508 | 1.043 | 2.677 |
Distributions from net investment income | (.471) | (.413) | (.470) | (.499) | (.422) |
Distributions from net realized gain | (.111) | (.134) | (.248) | (.294) | (.075) |
Total distributions | (.582) | (.547) | (.718) | (.793) | (.497) |
Net asset value, end of period | $ 11.19 | $ 11.75 | $ 11.14 | $ 11.35 | $ 11.10 |
Total Return A,B | .19% | 10.40% | 4.52% | 9.48% | 30.01% |
Ratios to Average Net Assets D,F | | | | | |
Expenses before reductions | .78% | .78% | .80% | .81% | .84% |
Expenses net of fee waivers, if any | .78% | .78% | .80% | .81% | .84% |
Expenses net of all reductions | .78% | .78% | .80% | .81% | .84% |
Net investment income (loss) | 3.64% | 3.87% | 4.28% | 4.96% | 5.88% |
Supplemental Data | | | | | |
Net assets, end of period (000 omitted) | $ 837 | $ 975 | $ 883 | $ 1,199 | $ 1,898 |
Portfolio turnover rate E | 141% | 129% | 224% | 208% | 199% |
A Total returns do not reflect charges attributable to your insurance company's separate account. Inclusion of these charges would reduce the total returns shown.
B Total returns would have been lower if certain expenses had not been reduced during the applicable periods shown.
C Calculated based on average shares outstanding during the period.
D Fees and expenses of any underlying Fidelity Central Funds are not included in the Fund's expense ratio. The Fund indirectly bears its proportionate share of the expenses of any underlying Fidelity Central Funds. Based on their most recent shareholder report date, the expenses of any underlying non-money market Fidelity Central Funds were less than .01%.
E Amount does not include the portfolio activity of any underlying Fidelity Central Funds.
F Expense ratios reflect operating expenses of the class. Expenses before reductions do not reflect amounts reimbursed by the investment adviser or reductions from brokerage service arrangements or reductions from other expense offset arrangements and do not represent the amount paid by the class during periods when reimbursements or reductions occur. Expenses net of fee waivers reflect expenses after reimbursement by the investment adviser but prior to reductions from brokerage service arrangements or other expense offset arrangements. Expenses net of all reductions represent the net expenses paid by the class.
See accompanying notes which are an integral part of the financial statements.
Annual Report
Financial Highlights - Service Class 2
Years ended December 31, | 2013 | 2012 | 2011 | 2010 | 2009 |
Selected Per-Share Data | | | | | |
Net asset value, beginning of period | $ 11.71 | $ 11.11 | $ 11.33 | $ 11.11 | $ 8.92 |
Income from Investment Operations | | | | | |
Net investment income (loss) C | .404 | .434 | .478 | .560 | .578 |
Net realized and unrealized gain (loss) | (.400) | .701 | .021 | .457 | 2.087 |
Total from investment operations | .004 | 1.135 | .499 | 1.017 | 2.665 |
Distributions from net investment income | (.463) | (.401) | (.471) | (.503) | (.400) |
Distributions from net realized gain | (.111) | (.134) | (.248) | (.294) | (.075) |
Total distributions | (.574) | (.535) | (.719) | (.797) | (.475) |
Net asset value, end of period | $ 11.14 | $ 11.71 | $ 11.11 | $ 11.33 | $ 11.11 |
Total Return A,B | .03% | 10.23% | 4.45% | 9.23% | 29.88% |
Ratios to Average Net Assets D,F | | | | | |
Expenses before reductions | .93% | .94% | .95% | .97% | .99% |
Expenses net of fee waivers, if any | .93% | .94% | .94% | .96% | .99% |
Expenses net of all reductions | .93% | .94% | .94% | .96% | .99% |
Net investment income (loss) | 3.49% | 3.72% | 4.13% | 4.81% | 5.72% |
Supplemental Data | | | | | |
Net assets, end of period (000 omitted) | $ 68,196 | $ 41,502 | $ 25,652 | $ 7,599 | $ 1,918 |
Portfolio turnover rate E | 141% | 129% | 224% | 208% | 199% |
A Total returns do not reflect charges attributable to your insurance company's separate account. Inclusion of these charges would reduce the total returns shown.
B Total returns would have been lower if certain expenses had not been reduced during the applicable periods shown.
C Calculated based on average shares outstanding during the period.
D Fees and expenses of any underlying Fidelity Central Funds are not included in the Fund's expense ratio. The Fund indirectly bears its proportionate share of the expenses of any underlying Fidelity Central Funds. Based on their most recent shareholder report date, the expenses of any underlying non-money market Fidelity Central Funds were less than .01%.
E Amount does not include the portfolio activity of any underlying Fidelity Central Funds.
F Expense ratios reflect operating expenses of the class. Expenses before reductions do not reflect amounts reimbursed by the investment adviser or reductions from brokerage service arrangements or reductions from other expense offset arrangements and do not represent the amount paid by the class during periods when reimbursements or reductions occur. Expenses net of fee waivers reflect expenses after reimbursement by the investment adviser but prior to reductions from brokerage service arrangements or other expense offset arrangements. Expenses net of all reductions represent the net expenses paid by the class.
Financial Highlights - Investor Class
Years ended December 31, | 2013 | 2012 | 2011 | 2010 | 2009 |
Selected Per-Share Data | | | | | |
Net asset value, beginning of period | $ 11.73 | $ 11.12 | $ 11.34 | $ 11.09 | $ 8.92 |
Income from Investment Operations | | | | | |
Net investment income (loss) C | .432 | .461 | .506 | .584 | .617 |
Net realized and unrealized gain (loss) | (.401) | .705 | .005 | .474 | 2.065 |
Total from investment operations | .031 | 1.166 | .511 | 1.058 | 2.682 |
Distributions from net investment income | (.480) | (.422) | (.483) | (.514) | (.437) |
Distributions from net realized gain | (.111) | (.134) | (.248) | (.294) | (.075) |
Total distributions | (.591) | (.556) | (.731) | (.808) | (.512) |
Net asset value, end of period | $ 11.17 | $ 11.73 | $ 11.12 | $ 11.34 | $ 11.09 |
Total Return A,B | .27% | 10.50% | 4.55% | 9.63% | 30.06% |
Ratios to Average Net Assets D,F | | | | | |
Expenses before reductions | .72% | .72% | .73% | .74% | .77% |
Expenses net of fee waivers, if any | .71% | .72% | .73% | .74% | .77% |
Expenses net of all reductions | .71% | .72% | .73% | .74% | .77% |
Net investment income (loss) | 3.70% | 3.94% | 4.35% | 5.03% | 5.95% |
Supplemental Data | | | | | |
Net assets, end of period (000 omitted) | $ 939,177 | $ 1,085,039 | $ 817,192 | $ 628,706 | $ 475,890 |
Portfolio turnover rate E | 141% | 129% | 224% | 208% | 199% |
A Total returns do not reflect charges attributable to your insurance company's separate account. Inclusion of these charges would reduce the total returns shown.
B Total returns would have been lower if certain expenses had not been reduced during the applicable periods shown.
C Calculated based on average shares outstanding during the period.
D Fees and expenses of any underlying Fidelity Central Funds are not included in the Fund's expense ratio. The Fund indirectly bears its proportionate share of the expenses of any underlying Fidelity Central Funds. Based on their most recent shareholder report date, the expenses of any underlying non-money market Fidelity Central Funds were less than .01%.
E Amount does not include the portfolio activity of any underlying Fidelity Central Funds.
F Expense ratios reflect operating expenses of the class. Expenses before reductions do not reflect amounts reimbursed by the investment adviser or reductions from brokerage service arrangements or reductions from other expense offset arrangements and do not represent the amount paid by the class during periods when reimbursements or reductions occur. Expenses net of fee waivers reflect expenses after reimbursement by the investment adviser but prior to reductions from brokerage service arrangements or other expense offset arrangements. Expenses net of all reductions represent the net expenses paid by the class.
See accompanying notes which are an integral part of the financial statements.
Annual Report
Notes to Financial Statements
For the period ended December 31, 2013
1. Organization.
VIP Strategic Income Portfolio (the Fund) is a fund of Variable Insurance Products Fund V (the Trust) and is authorized to issue an unlimited number of shares. The Trust is registered under the Investment Company Act of 1940, as amended (the 1940 Act), as an open-end management investment company organized as a Massachusetts business trust. Shares of the Fund may only be purchased by insurance companies for the purpose of funding variable annuity or variable life insurance contracts. The Fund offers the following classes of shares: Initial Class shares, Service Class shares, Service Class 2 shares and Investor Class shares. All classes have equal rights and voting privileges, except for matters affecting a single class.
2. Investments in Fidelity Central Funds.
The Fund invests in Fidelity Central Funds, which are open-end investment companies generally available only to other investment companies and accounts managed by the investment adviser and its affiliates. The Fund's Schedule of Investments lists each of the Fidelity Central Funds held as of period end, if any, as an investment of the Fund, but does not include the underlying holdings of each Fidelity Central Fund. As an Investing Fund, the Fund indirectly bears its proportionate share of the expenses of the underlying Fidelity Central Funds.
Based on its investment objective, each Fidelity Central Fund may invest or participate in various investment vehicles or strategies that are similar to those of the Fund. These strategies are consistent with the investment objectives of the Fund and may involve certain economic risks which may cause a decline in value of each of the Fidelity Central Funds and thus a decline in the value of the Fund. The Money Market Central Funds seek preservation of capital and current income and are managed by Fidelity Investments Money Management, Inc. (FIMM), an affiliate of the investment adviser. Annualized expenses of the Money Market Central Funds as of their most recent shareholder report date are less than .01%. The following summarizes the Fund's investment in each non-money market Fidelity Central Fund.
Fidelity Central Fund | Investment Manager | Investment Objective | Investment Practices | Expense Ratio* |
Fidelity Floating Rate Central Fund | FMR Co., Inc. (FMRC) | Seeks a high level of income by normally investing in floating rate loans and other floating rate securities. | Loans & Direct Debt Instruments Repurchase Agreements Restricted Securities | Less than 0.01% |
* Expenses expressed as a percentage of average net assets and are as of each underlying Central Fund's most recent annual or semi-annual shareholder report.
An unaudited holdings listing for the Fund, which presents direct holdings as well as the pro-rata share of any securities and other investments held indirectly through its investment in underlying non-money market Fidelity Central Funds, is available at advisor.fidelity.com. A complete unaudited list of holdings for each Fidelity Central Fund is available upon request or at the Securities and Exchange Commission (the SEC) website at www.sec.gov. In addition, the financial statements of the Fidelity Central Funds which contain the significant accounting policies (including investment valuation policies) of those funds, which are not covered by the Fund's Report of Independent Registered Public Accounting Firm, are available on the SEC website or upon request.
3. Significant Accounting Policies.
The financial statements have been prepared in conformity with accounting principles generally accepted in the United States of America (GAAP), which require management to make certain estimates and assumptions at the date of the financial statements. Actual results could differ from those estimates. Subsequent events, if any, through the date that the financial statements were issued have been evaluated in the preparation of the financial statements. The following summarizes the significant accounting policies of the Fund:
Investment Valuation. Investments are valued as of 4:00 p.m. Eastern time on the last calendar day of the period. In accordance with valuation policies and procedures approved by the Board of Trustees (the Board), the Fund attempts to obtain prices from one or more third party pricing vendors or brokers to value its investments. When current market prices, quotations or currency exchange rates are not readily available or reliable, investments will be fair valued in good faith by the Fidelity Management & Research Company (FMR) Fair Value Committee (the Committee), in accordance with procedures adopted by the Board. Factors used in determining fair value vary by investment type and may include market or investment specific events, changes in interest rates and credit quality. The frequency with which these procedures are used cannot be predicted and they may be utilized to a significant extent. The Committee oversees the Fund's valuation policies and procedures and is responsible for approving and reporting to the Board all fair value determinations.
Annual Report
Notes to Financial Statements - continued
3. Significant Accounting Policies - continued
Investment Valuation - continued
The Fund categorizes the inputs to valuation techniques used to value its investments into a disclosure hierarchy consisting of three levels as shown below:
Level 1 - quoted prices in active markets for identical investments
Level 2 - other significant observable inputs (including quoted prices for similar investments, interest rates, prepayment speeds, etc.)
Level 3 - unobservable inputs (including the Fund's own assumptions based on the best information available)
Valuation techniques used to value the Fund's investments by major category are as follows:
Debt securities, including restricted securities, are valued based on evaluated prices received from third party pricing vendors or from brokers who make markets in such securities. Corporate bonds, bank loan obligations, foreign government and government agency obligations, preferred securities, supranational obligations, U.S. government and government agency obligations and sovereign loan participations, are valued by pricing vendors who utilize matrix pricing which considers yield or price of bonds of comparable quality, coupon, maturity and type or by broker-supplied prices. Asset backed securities, collateralized mortgage obligations, commercial mortgage securities and U.S. government agency mortgage securities, are valued by pricing vendors who utilize matrix pricing which considers prepayment speed assumptions, attributes of the collateral, yield or price of bonds of comparable quality, coupon, maturity and type or by broker-supplied prices. Swaps are marked-to-market daily based on valuations from third party pricing vendors, registered derivatives clearing organizations (clearinghouses) or broker-supplied valuations. These pricing sources may utilize inputs such as interest rate curves, credit spread curves, default possibilities and recovery rates. When independent prices are unavailable or unreliable, debt securities and swaps may be valued utilizing pricing methodologies which consider similar factors that would be used by third party pricing vendors. Debt securities and swaps are generally categorized as Level 2 in the hierarchy but may be Level 3 depending on the circumstances. The Fund invests a significant portion of its assets in below investment grade securities. The value of these securities can be more volatile due to changes in the credit quality of the issuer and is sensitive to changes in economic, market and regulatory conditions.
Equity securities, including restricted securities, for which market quotations are readily available, are valued at the last reported sale price or official closing price as reported by a third party pricing vendor on the primary market or exchange on which they are traded and are categorized as Level 1 in the hierarchy. In the event there were no sales during the day or closing prices are not available, securities are valued at the last quoted bid price or may be valued using the last available price and are generally categorized as Level 2 in the hierarchy. For foreign equity securities, when market or security specific events arise, comparisons to the valuation of American Depositary Receipts (ADRs), futures contracts, Exchange-Traded Funds (ETFs) and certain indexes as well as quoted prices for similar securities may be used and would be categorized as Level 2 in the hierarchy. Utilizing these techniques may result in transfers between Level 1 and Level 2. For equity securities, including restricted securities, where observable inputs are limited, assumptions about market activity and risk are used and these securities may be categorized as Level 3 in the hierarchy.
Futures contracts are valued at the settlement price established each day by the board of trade or exchange on which they are traded and are categorized as Level 1 in the hierarchy. Investments in open-end mutual funds, including the Fidelity Central Funds, are valued at their closing net asset value (NAV) each business day and are categorized as Level 1 in the hierarchy.
Changes in valuation techniques may result in transfers in or out of an assigned level within the disclosure hierarchy. The aggregate value of investments by input level, as of December 31, 2013, is included at the end of the Fund's Schedule of Investments.
Foreign Currency. The Fund may use foreign currency contracts to facilitate transactions in foreign-denominated securities. Gains and losses from these transactions may arise from changes in the value of the foreign currency or if the counterparties do not perform under the contracts' terms.
Foreign-denominated assets, including investment securities, and liabilities are translated into U.S. dollars at the exchange rates at period end. Purchases and sales of investment securities, income and dividends received and expenses denominated in foreign currencies are translated into U.S. dollars at the exchange rate in effect on the transaction date.
The effects of exchange rate fluctuations on investments are included with the net realized and unrealized gain (loss) on investment securities. Other foreign currency transactions resulting in realized and unrealized gain (loss) are disclosed separately.
Investment Transactions and Income. For financial reporting purposes, the Fund's investment holdings and NAV include trades executed through the end of the last business day of the period. The NAV per share for processing shareholder transactions is calculated as of the close of business of the New York Stock Exchange (NYSE), normally 4:00 p.m. Eastern time and includes trades executed through the end of the prior business day. Gains and losses on securities sold are determined on the basis of identified cost and may include proceeds received from litigation. Dividend income is recorded on the ex-dividend date, except for certain dividends from foreign securities where the ex-dividend date may have passed, which are recorded as soon as the Fund is informed of the ex-dividend date. Non-cash dividends included in dividend income, if any, are recorded at the fair market value of the
Annual Report
3. Significant Accounting Policies - continued
Investment Transactions and Income - continued
securities received. Distributions received on securities that represent a return of capital or capital gain are recorded as a reduction of cost of investments and/or as a realized gain. Subsequent to ex-dividend date the Fund determines the components of these distributions, based upon receipt of tax filings or other correspondence relating to the underlying investment. Interest income and distributions from the Fidelity Central Funds are accrued as earned. Interest income includes coupon interest and amortization of premium and accretion of discount on debt securities. The principal amount on inflation-indexed securities is periodically adjusted to the rate of inflation and interest is accrued based on the principal amount. The adjustments to principal due to inflation are reflected as increases or decreases to Interest in the accompanying Statement of Operations. Investment income is recorded net of foreign taxes withheld where recovery of such taxes is uncertain. Debt obligations may be placed on non-accrual status and related interest income may be reduced by ceasing current accruals and writing off interest receivables when the collection of all or a portion of interest has become doubtful based on consistently applied procedures. A debt obligation is removed from non-accrual status when the issuer resumes interest payments or when collectability of interest is reasonably assured.
Class Allocations and Expenses. Investment income, realized and unrealized capital gains and losses, common expenses of the Fund, and certain fund-level expense reductions, if any, are allocated daily on a pro-rata basis to each class based on the relative net assets of each class to the total net assets of the Fund. Each class differs with respect to transfer agent and distribution and service plan fees incurred. Certain expense reductions may also differ by class. For the reporting period, the allocated portion of income and expenses to each class as a percent of its average net assets may vary due to the timing of recording these transactions in relation to fluctuating net assets of the classes. Expenses directly attributable to a fund are charged to that fund. Expenses attributable to more than one fund are allocated among the respective funds on the basis of relative net assets or other appropriate methods. Expense estimates are accrued in the period to which they relate and adjustments are made when actual amounts are known.
Income Tax Information and Distributions to Shareholders. Each year, the Fund intends to qualify as a regulated investment company under Subchapter M of the Internal Revenue Code, including distributing substantially all of its taxable income and realized gains. As a result, no provision for U.S. Federal income taxes is required. As of December 31, 2013, the Fund did not have any unrecognized tax benefits in the financial statements; nor is the Fund aware of any tax positions for which it is reasonably possible that the total amounts of unrecognized tax benefits will significantly change in the next twelve months. The Fund files a U.S. federal tax return, in addition to state and local tax returns as required. The Fund's federal income tax returns are subject to examination by the Internal Revenue Service (IRS) for a period of three fiscal years after they are filed. State and local tax returns may be subject to examination for an additional fiscal year depending on the jurisdiction. Foreign taxes are provided for based on the Fund's understanding of the tax rules and rates that exist in the foreign markets in which it invests.
Distributions are declared and recorded on the ex-dividend date. Income dividends and capital gain distributions are declared separately for each class. Income and capital gain distributions are determined in accordance with income tax regulations, which may differ from GAAP.
Capital accounts within the financial statements are adjusted for permanent book-tax differences. These adjustments have no impact on net assets or the results of operations. Capital accounts are not adjusted for temporary book-tax differences which will reverse in a subsequent period.
Book-tax differences are primarily due to futures contracts, swaps, foreign currency transactions, market discount, partnerships (including allocations from Fidelity Central Funds) and losses deferred due to wash sales, futures transactions and excise tax regulations.
The federal tax cost of investment securities and unrealized appreciation (depreciation) as of period end were as follows:
Gross unrealized appreciation | $ 40,953,983 |
Gross unrealized depreciation | (24,890,480) |
Net unrealized appreciation (depreciation) on securities and other investments | $ 16,063,503 |
| |
Tax Cost | $ 1,101,378,651 |
The tax-based components of distributable earnings as of period end were as follows:
Net unrealized appreciation (depreciation) | $ 16,173,940 |
Annual Report
Notes to Financial Statements - continued
3. Significant Accounting Policies - continued
Income Tax Information and Distributions to Shareholders - continued
The tax character of distributions paid was as follows:
| December 31, 2013 | December 31, 2012 |
Ordinary Income | $ 47,484,207 | $ 50,737,319 |
Long-term Capital Gains | 10,237,066 | 7,585,430 |
Total | $ 57,721,273 | $ 58,322,749 |
Delayed Delivery Transactions and When-Issued Securities. During the period, the Fund transacted in securities on a delayed delivery or when-issued basis. Payment and delivery may take place after the customary settlement period for that security. The price of the underlying securities and the date when the securities will be delivered and paid for are fixed at the time the transaction is negotiated. The securities purchased on a delayed delivery or when-issued basis are identified as such in the Fund's Schedule of Investments. The Fund may receive compensation for interest forgone in the purchase of a delayed delivery or when-issued security. With respect to purchase commitments, the Fund identifies securities as segregated in its records with a value at least equal to the amount of the commitment. Losses may arise due to changes in the value of the underlying securities or if the counterparty does not perform under the contract's terms, or if the issuer does not issue the securities due to political, economic, or other factors.
Restricted Securities. The Fund may invest in securities that are subject to legal or contractual restrictions on resale. These securities generally may be resold in transactions exempt from registration or to the public if the securities are registered. Disposal of these securities may involve time-consuming negotiations and expense, and prompt sale at an acceptable price may be difficult. Information regarding restricted securities is included at the end of the Fund's Schedule of Investments.
Restricted Cash. The Fund entered into transactions where cash was required to be held in escrow. The amount of restricted cash is reflected in the Fund's Statement of Assets and Liabilities.
Loans and Other Direct Debt Instruments. The Fund invests in direct debt instruments which are interests in amounts owed to lenders by corporate or other borrowers. These instruments may be in the form of loans, trade claims or other receivables and may include standby financing commitments such as revolving credit facilities that obligate the Fund to supply additional cash to the borrower on demand. Loans may be acquired through assignment or participation, or may be made directly to a borrower. The Fund may be contractually obligated to receive approval from the agent bank and/or borrower prior to the sale of these loans. The Fund did not have any unfunded loan commitments, which are contractual obligations for future funding, at period end.
4. Derivative Instruments.
Risk Exposures and the Use of Derivative Instruments. The Fund's investment objective allows the Fund to enter into various types of derivative contracts, including futures contracts, options and swaps. Derivatives are investments whose value is primarily derived from underlying assets, indices or reference rates and may be transacted on an exchange or over-the-counter (OTC). Derivatives may involve a future commitment to buy or sell a specified asset based on specified terms, to exchange future cash flows at periodic intervals based on a notional principal amount, or for one party to make one or more payments upon the occurrence of specified events in exchange for periodic payments from the other party.
The Fund used derivatives to increase returns, to gain exposure to certain types of assets and to manage exposure to certain risks as defined below. The success of any strategy involving derivatives depends on analysis of numerous economic factors, and if the strategies for investment do not work as intended, the Fund may not achieve its objectives.
The Fund's use of derivatives increased or decreased its exposure to the following risk:
Interest Rate Risk | Interest rate risk relates to the fluctuations in the value of interest-bearing securities due to changes in the prevailing levels of market interest rates. |
The Fund is also exposed to additional risks from investing in derivatives, such as liquidity risk and counterparty credit risk. Liquidity risk is the risk that the Fund will be unable to close out the derivative in the open market in a timely manner. Counterparty credit risk is the risk that the counterparty will not be able to fulfill its obligation to the Fund. Derivative counterparty credit risk is managed through formal evaluation of the creditworthiness of all potential counterparties. On certain OTC derivatives such as options and bi-lateral swaps, the Fund attempts to reduce its exposure to counterparty credit risk by entering into an International Swaps and Derivatives Association, Inc. (ISDA) Master Agreement with each of its counterparties. The ISDA Master Agreement gives the Fund the right to terminate all transactions traded under such agreement upon the deterioration in the credit quality of the counterparty beyond specified levels. The ISDA Master Agreement gives each party the right, upon an event of default by the other party or a termination of the agreement, to close out all transactions traded under such agreement and to net amounts owed under each transaction to one net payable by one party to the other. To mitigate counterparty credit risk on bi-lateral OTC derivatives, the Fund receives collateral in the form of cash or
Annual Report
4. Derivative Instruments - continued
Risk Exposures and the Use of Derivative Instruments - continued
securities once the Fund's net unrealized appreciation on outstanding derivative contracts under an ISDA Master Agreement exceeds certain applicable thresholds, subject to certain minimum transfer provisions. The collateral received is held in segregated accounts with the Fund's custodian bank in accordance with the collateral agreements entered into between the Fund, the counterparty and the Fund's custodian bank. The Fund could experience delays and costs in gaining access to the collateral even though it is held by the Fund's custodian bank. The Fund's maximum risk of loss from counterparty credit risk related to bi-lateral OTC derivatives is generally the aggregate unrealized appreciation and unpaid counterparty payments in excess of any collateral pledged by the counterparty to the Fund. The Fund may be required to pledge collateral for the benefit of the counterparties on bi-lateral OTC derivatives in an amount not less than each counterparty's unrealized appreciation on outstanding derivative contracts, subject to certain minimum transfer provisions, and any such pledged collateral is identified in the Schedule of Investments. Exchange-traded futures contracts are not covered by the ISDA Master Agreement; however counterparty credit risk related to exchange-traded futures contracts may be mitigated by the protection provided by the exchange on which they trade. Counterparty credit risk related to centrally cleared OTC swaps may be mitigated by the protection provided by the clearinghouse.
Investing in derivatives may involve greater risks than investing in the underlying assets directly and, to varying degrees, may involve risk of loss in excess of any initial investment and collateral received and amounts recognized in the Statement of Assets and Liabilities. In addition, there may be the risk that the change in value of the derivative contract does not correspond to the change in value of the underlying instrument.
Net Realized Gain (Loss) and Change in Net Unrealized Appreciation (Depreciation) on Derivatives. The table below, which reflects the impacts of derivatives on the financial performance of the Fund, summarizes the net realized gain (loss) and change in net unrealized appreciation (depreciation) for derivatives during the period as presented in the Statement of Operations.
Primary Risk Exposure / Derivative Type | Net Realized
Gain (Loss) | Change in Net Unrealized Appreciation (Depreciation) |
Interest Rate Risk | | |
Futures Contracts | $ 54,228 | $ (192,494) |
Purchased Options | 142,269 | - |
Swaps | 1,132,199 | (28,527) |
Totals (a) | $ 1,328,696 | $ (221,021) |
(a) A summary of the value of derivatives by primary risk exposure as of period end is included at the end of the Schedule of Investments.
Futures Contracts. A futures contract is an agreement between two parties to buy or sell a specified underlying instrument for a fixed price at a specified future date. The Fund used futures contracts to manage its exposure to the bond market, and to fluctuations in interest rates.
Upon entering into a futures contract, a fund is required to deposit either cash or securities (initial margin) with a clearing broker in an amount equal to a certain percentage of the face value of the contract. Futures contracts are marked-to-market daily and subsequent daily payments (variation margin) are made or received by a fund depending on the daily fluctuations in the value of the futures contracts and are recorded as unrealized appreciation or (depreciation). This receivable and/or payable, if any, is included in daily variation margin for derivative instruments in the Statement of Assets and Liabilities. Realized gain or (loss) is recorded upon the expiration or closing of a futures contract. The net realized gain (loss) and change in net unrealized appreciation (depreciation) on futures contracts during the period is included in the Statement of Operations.
Any open futures contracts at period end are presented in the Schedule of Investments under the caption "Futures Contracts." The underlying face amount at value reflects each contract's exposure to the underlying instrument or index at period end. Securities deposited to meet initial margin requirements are identified in the Schedule of Investments.
Options. Options give the purchaser the right, but not the obligation, to buy (call) or sell (put) an underlying security or financial instrument at an agreed exercise or strike price between or on certain dates. Options obligate the seller (writer) to buy (put) or sell (call) an underlying instrument at the exercise or strike price or cash settle an underlying derivative instrument if the holder exercises the option on or before the expiration date. The Fund used OTC options, such as swaptions, which are options where the underlying instrument is a swap, to manage its exposure to fluctuations in interest rates.
Upon entering into an options contract, a fund will pay or receive a premium. Premiums paid on purchased options are reflected as cost of investments and premiums received on written options are reflected as a liability on the Statement of Assets and Liabilities. Certain options may be purchased or written with premiums to be paid or received on a future date. Options are valued daily and any unrealized appreciation (depreciation) is reflected on the Statement of Assets and Liabilities. When an option is exercised, the cost or proceeds of the underlying instrument purchased or sold is adjusted by the amount of the premium. When an option is closed the Fund will realize a gain or loss depending on whether the proceeds or amount paid for the closing sale transaction is greater or less than the premium received or paid. When an option expires, gains and losses are realized to the extent of premiums received and paid, respectively. The net realized and unrealized gains (losses) on purchased options are included on the Statement of
Annual Report
Notes to Financial Statements - continued
4. Derivative Instruments - continued
Options - continued
Operations in net realized gain (loss) and change in net unrealized appreciation (depreciation) on investment securities. The net realized gain (loss) and change in net unrealized appreciation (depreciation) on written options are reflected separately on the Statement of Operations.
Any open options at period end are presented in the Schedule of Investments under the captions "Purchased Options," "Purchased Swaptions," "Written Options" and "Written Swaptions," as applicable. For the period, the average monthly notional amount for purchased swaptions was $1,570,150.
Writing puts and buying calls tend to increase exposure to the underlying instrument while buying puts and writing calls tend to decrease exposure to the underlying instrument. For purchased options, risk of loss is limited to the premium paid, and for written options, risk of loss is the change in value in excess of the premium received.
Swaps. A swap is a contract between two parties to exchange future cash flows at periodic intervals based on a notional principal amount. A bi-lateral OTC swap is a transaction between a fund and a dealer counterparty where cash flows are exchanged between the two parties for the life of the swap. A centrally cleared OTC swap is a transaction executed between a fund and a dealer counterparty, then cleared by a futures commission merchant (FCM) through a clearinghouse. Once cleared, the clearinghouse serves as a central counterparty, with whom a fund exchanges cash flows for the life of the transaction, similar to transactions in futures contracts.
Bi-lateral OTC swaps are marked-to-market daily and changes in value are reflected in the Statement of Assets and Liabilities in the bi-lateral OTC swaps at value line items. Any upfront premiums paid or received upon entering a bi-lateral OTC swap to compensate for differences between stated terms of the swap and prevailing market conditions (e.g. credit spreads, interest rates or other factors) are recorded in net unrealized appreciation (depreciation) in the Statement of Assets and Liabilities and amortized to realized gain or (loss) ratably over the term of the swap. Any unamortized upfront premiums are presented in the Schedule of Investments.
Centrally cleared OTC swaps require a fund to deposit either cash or securities (initial margin) with the FCM, at the instruction of and for the benefit of the clearinghouse. Securities deposited to meet initial margin requirements are identified in the Schedule of Investments. Cash deposited to meet initial margin requirements is presented in segregated cash with brokers for derivative instruments in the Statement of Assets and Liabilities. Centrally cleared OTC swaps are marked-to-market daily and subsequent payments (variation margin) are made or received depending on the daily fluctuations in the value of the swaps and are recorded as unrealized appreciation or (depreciation). These daily payments, if any, are included in receivable or payable for daily variation margin for derivative instruments in the Statement of Assets and Liabilities. Any premiums for centrally cleared OTC swaps are recorded periodically throughout the term of the swap to variation margin and included in unrealized appreciation (depreciation) in the Statement of Assets and Liabilities. Any premiums are recognized as realized gain (loss) upon termination or maturity of the swap.
For both bi-lateral and centrally cleared OTC swaps, payments are exchanged at specified intervals, accrued daily commencing with the effective date of the contract and recorded as realized gain or (loss). Realized gain or (loss) is also recorded in the event of an early termination of a swap. The net realized gain (loss) and change in net unrealized appreciation (depreciation) on swaps during the period is included in the Statement of Operations.
Any open swaps at period end are included in the Schedule of Investments under the caption "Swaps."
Interest Rate Swaps. Interest rate swaps are agreements between counterparties to exchange cash flows, one based on a fixed rate, and the other on a floating rate. The Fund entered into interest rate swaps to manage its exposure to interest rate changes. Changes in interest rates can have an effect on both the value of bond holdings as well as the amount of interest income earned. In general, the value of bonds can fall when interest rates rise and can rise when interest rates fall.
5. Purchases and Sales of Investments.
Purchases and sales of securities (including the Fixed-Income Central Funds), other than short-term securities and U.S. government securities, aggregated $823,161,041 and $862,776,480, respectively.
6. Fees and Other Transactions with Affiliates.
Management Fee. Fidelity Management & Research Company (the investment adviser) and its affiliates provide the Fund with investment management related services for which the Fund pays a monthly management fee. The management fee is the sum of an individual fund fee rate that is based on an annual rate of .45% of the Fund's average net assets and an annualized group fee rate that averaged .11% during the period. The group fee rate is based upon the average net assets of all the mutual funds advised by the investment adviser, including any mutual funds previously advised by the investment adviser that are currently advised by Fidelity SelectCo, LLC, an affiliate of the investment adviser. The group fee rate decreases as assets
Annual Report
6. Fees and Other Transactions with Affiliates - continued
Management Fee - continued
under management increase and increases as assets under management decrease. For the reporting period, the total annual management fee rate was .56% of the Fund's average net assets.
Distribution and Service Plan Fees. In accordance with Rule 12b-1 of the 1940 Act, the Fund has adopted separate 12b-1 Plans for each Service Class of shares. Each Service Class pays Fidelity Distributors Corporation (FDC), an affiliate of the investment adviser, a service fee. For the period, the service fee is based on an annual rate of .10% of Service Class' average net assets and .25% of Service Class 2's average net assets.
For the period, total fees, all of which were re-allowed to insurance companies for the distribution of shares and providing shareholder support services were as follows:
Service Class | $ 961 |
Service Class 2 | 134,343 |
| $ 135,304 |
Transfer Agent Fees. Fidelity Investments Institutional Operations Company, Inc. (FIIOC), an affiliate of the investment adviser, is the Fund's transfer, dividend disbursing, and shareholder servicing agent. FIIOC receives an asset-based fee with respect to each class. Each class (with the exception of Investor Class) pays a transfer agent fee, excluding out of pocket expenses, equal to an annual rate of .07% of average net assets. Investor Class pays a monthly asset-based transfer agent fee of .10% of average net assets. In addition, FIIOC receives an asset-based fee of .0035% of average net assets for typesetting, printing and mailing of shareholder reports, except proxy statements. FIIOC voluntarily agreed to reimburse or waive this fee for the period January 1, 2013 through December 31, 2013 (see Expense Reductions note). For the period, transfer agent fees for each class, including printing and out of pocket expenses, were as follows:
Initial Class | $ 99,638 |
Service Class | 669 |
Service Class 2 | 38,113 |
Investor Class | 1,064,863 |
| $ 1,203,283 |
Effective February 1, 2014, the Board of Trustees approved an amendment to the transfer agent fee agreement whereby each class (with the exception of the Investor Class) pays a single fee of .07% of average net assets for transfer agent services, typesetting, printing and mailing of shareholder reports, excluding mailing of proxy statements and out of pocket expenses. Investor Class pays a single fee of .10% of average net assets.
Accounting Fees. Fidelity Service Company, Inc. (FSC), an affiliate of the investment adviser, maintains the Fund's accounting records. The fee is based on the level of average net assets for each month.
Other. During the period, the investment adviser reimbursed the Fund for certain losses in the amount of $5,297.
7. Committed Line of Credit.
The Fund participates with other funds managed by the investment adviser or an affiliate in a $4.25 billion credit facility (the "line of credit") to be utilized for temporary or emergency purposes to fund shareholder redemptions or for other short-term liquidity purposes. The Fund has agreed to pay commitment fees on its pro-rata portion of the line of credit, which amounted to $2,748 and is reflected in Miscellaneous expenses on the Statement of Operations. During the period, there were no borrowings on this line of credit.
8. Expense Reductions.
The investment adviser or its affiliates agreed to reimburse or waive certain fees during the period as noted in the table below.
Initial Class | $ 5,521 |
Service Class | 38 |
Service Class 2 | 2,128 |
Investor Class | 40,573 |
| $ 48,260 |
Commissions paid to certain brokers with whom the investment adviser, or its affiliates, places trades on behalf of the Fund include an amount in addition to trade execution, which may be rebated back to the Fund to offset certain expenses. This amount totaled $3 for the period. In addition, through arrangements with the Fund's custodian, credits realized as a result of uninvested cash balances were used to reduce the Fund's expenses. During the period, these credits reduced the Fund's custody expenses by $179.
Annual Report
Notes to Financial Statements - continued
9. Distributions to Shareholders.
Distributions to shareholders of each class were as follows:
Years ended December 31, | 2013 | 2012 |
From net investment income | | |
Initial Class | $ 5,053,580 | $ 5,803,567 |
Service Class | 35,255 | 32,799 |
Service Class 2 | 2,666,002 | 1,314,731 |
Investor Class | 38,963,680 | 37,359,218 |
Total | $ 46,718,517 | $ 44,510,315 |
From net realized gain | | |
Initial Class | $ 1,204,917 | $ 1,841,471 |
Service Class | 8,433 | 10,637 |
Service Class 2 | 607,316 | 421,763 |
Investor Class | 9,182,090 | 11,538,563 |
Total | $ 11,002,756 | $ 13,812,434 |
10. Share Transactions.
Transactions for each class of shares were as follows:
| Shares | Dollars |
Years ended December 31, | 2013 | 2012 | 2013 | 2012 |
Initial Class | | | | |
Shares sold | 623,949 | 1,518,545 | $ 7,325,056 | $ 17,854,388 |
Reinvestment of distributions | 557,794 | 651,036 | 6,258,497 | 7,645,038 |
Shares redeemed | (4,508,150) | (2,937,183) | (52,458,877) | (34,054,527) |
Net increase (decrease) | (3,326,407) | (767,602) | $ (38,875,324) | $ (8,555,101) |
Service Class | | | | |
Reinvestment of distributions | 3,898 | 3,702 | 43,688 | 43,436 |
Shares redeemed | (12,042) | - | (139,470) | - |
Net increase (decrease) | (8,144) | 3,702 | $ (95,782) | $ 43,436 |
Service Class 2 | | | | |
Shares sold | 3,120,590 | 1,922,851 | $ 36,207,352 | $ 22,404,382 |
Reinvestment of distributions | 293,554 | 148,466 | 3,273,318 | 1,736,494 |
Shares redeemed | (835,537) | (836,478) | (9,659,462) | (9,669,581) |
Net increase (decrease) | 2,578,607 | 1,234,839 | $ 29,821,208 | $ 14,471,295 |
Investor Class | | | | |
Shares sold | 4,595,613 | 16,759,934 | $ 53,868,632 | $ 195,088,604 |
Reinvestment of distributions | 4,303,289 | 4,173,707 | 48,145,770 | 48,897,781 |
Shares redeemed | (17,295,535) | (1,921,565) | (199,921,858) | (22,444,351) |
Net increase (decrease) | (8,396,633) | 19,012,076 | $ (97,907,456) | $ 221,542,034 |
11. Other.
The Fund's organizational documents provide former and current trustees and officers with a limited indemnification against liabilities arising in connection with the performance of their duties to the Fund. In the normal course of business, the Fund may also enter into contracts that provide general indemnifications. The Fund's maximum exposure under these arrangements is unknown as this would be dependent on future claims that may be made against the Fund. The risk of material loss from such claims is considered remote.
At the end of the period, the investment adviser or its affiliates were the owners of record of 93% of the total outstanding shares of the Fund.
12. Credit Risk.
The Fund's relatively large investment in countries with limited or developing capital markets may involve greater risks than investments in more developed markets and the prices of such investments may be volatile. The yields of emerging market debt obligations reflect, among other things, perceived credit risk. The consequences of political, social or economic changes in these markets may have disruptive effects on the market prices of the Fund's investments and the income they generate, as well as the Fund's ability to repatriate such amounts.
Annual Report
Report of Independent Registered Public Accounting Firm
To the Trustees of Variable Insurance Products Fund V and the Shareholders of VIP Strategic Income Portfolio:
In our opinion, the accompanying statement of assets and liabilities, including the schedule of investments, and the related statements of operations and of changes in net assets and the financial highlights present fairly, in all material respects, the financial position of VIP Strategic Income Portfolio (a fund of Variable Insurance Products Fund V) at December 31, 2013, the results of its operations for the year then ended, the changes in its net assets for each of the two years in the period then ended and the financial highlights for each of the five years in the period then ended, in conformity with accounting principles generally accepted in the United States of America. These financial statements and financial highlights (hereafter referred to as "financial statements") are the responsibility of the VIP Strategic Income Portfolio's management. Our responsibility is to express an opinion on these financial statements based on our audits. We conducted our audits of these financial statements in accordance with the standards of the Public Company Accounting Oversight Board (United States). Those standards require that we plan and perform the audit to obtain reasonable assurance about whether the financial statements are free of material misstatement. An audit includes examining, on a test basis, evidence supporting the amounts and disclosures in the financial statements, assessing the accounting principles used and significant estimates made by management, and evaluating the overall financial statement presentation. We believe that our audits, which included confirmation of securities at December 31, 2013 by correspondence with the custodian, agent banks and brokers, provide a reasonable basis for our opinion.
PricewaterhouseCoopers LLP
Boston, Massachusetts
February 20, 2014
Annual Report
The Trustees and officers of the trust and fund, as applicable, are listed below. The Board of Trustees governs the fund and is responsible for protecting the interests of shareholders. The Trustees are experienced executives who meet periodically throughout the year to oversee the fund's activities, review contractual arrangements with companies that provide services to the fund, oversee management of the risks associated with such activities and contractual arrangements, and review the fund's performance. Except for Elizabeth S. Acton and James C. Curvey, each of the Trustees oversees 223 funds. Ms. Acton oversees 205 funds. Mr. Curvey oversees 396 funds.
The Trustees hold office without limit in time except that (a) any Trustee may resign; (b) any Trustee may be removed by written instrument, signed by at least two-thirds of the number of Trustees prior to such removal; (c) any Trustee who requests to be retired or who has become incapacitated by illness or injury may be retired by written instrument signed by a majority of the other Trustees; and (d) any Trustee may be removed at any special meeting of shareholders by a two-thirds vote of the outstanding voting securities of the trust. Each Trustee who is not an interested person (as defined in the 1940 Act) of the trust and the fund (Independent Trustee), shall retire not later than the last day of the month in which his or her 75th birthday occurs. The Independent Trustees may waive this mandatory retirement age policy with respect to individual Trustees. The officers hold office without limit in time, except that any officer may resign or may be removed by a vote of a majority of the Trustees at any regular meeting or any special meeting of the Trustees. Except as indicated, each individual has held the office shown or other offices in the same company for the past five years.
Experience, Skills, Attributes, and Qualifications of the Fund's Trustees. The Governance and Nominating Committee has adopted a statement of policy that describes the experience, qualifications, attributes, and skills that are necessary and desirable for potential Independent Trustee candidates (Statement of Policy). The Board believes that each Trustee satisfied at the time he or she was initially elected or appointed a Trustee, and continues to satisfy, the standards contemplated by the Statement of Policy. The Governance and Nominating Committee also engages professional search firms to help identify potential Independent Trustee candidates who have the experience, qualifications, attributes, and skills consistent with the Statement of Policy. From time to time, additional criteria based on the composition and skills of the current Independent Trustees, as well as experience or skills that may be appropriate in light of future changes to board composition, business conditions, and regulatory or other developments, have also been considered by the professional search firms and the Governance and Nominating Committee. In addition, the Board takes into account the Trustees' commitment and participation in Board and committee meetings, as well as their leadership of standing and ad hoc committees throughout their tenure.
In determining that a particular Trustee was and continues to be qualified to serve as a Trustee, the Board has considered a variety of criteria, none of which, in isolation, was controlling. The Board believes that, collectively, the Trustees have balanced and diverse experience, qualifications, attributes, and skills, which allow the Board to operate effectively in governing the fund and protecting the interests of shareholders. Information about the specific experience, skills, attributes, and qualifications of each Trustee, which in each case led to the Board's conclusion that the Trustee should serve (or continue to serve) as a trustee of the fund, is provided below.
Board Structure and Oversight Function. Abigail P. Johnson is an interested person (as defined in the 1940 Act) and currently serves as Chairman. The Trustees have determined that an interested Chairman is appropriate and benefits shareholders because an interested Chairman has a personal and professional stake in the quality and continuity of services provided to the fund. Independent Trustees exercise their informed business judgment to appoint an individual of their choosing to serve as Chairman, regardless of whether the Trustee happens to be independent or a member of management. The Independent Trustees have determined that they can act independently and effectively without having an Independent Trustee serve as Chairman and that a key structural component for assuring that they are in a position to do so is for the Independent Trustees to constitute a substantial majority for the Board. The Independent Trustees also regularly meet in executive session. Albert R. Gamper, Jr. serves as Chairman of the Independent Trustees and as such (i) acts as a liaison between the Independent Trustees and management with respect to matters important to the Independent Trustees and (ii) with management prepares agendas for Board meetings.
Fidelity funds are overseen by different Boards of Trustees. The funds' Board oversees Fidelity's investment-grade bond, money market, and asset allocation funds and another Board oversees Fidelity's equity and high income funds. The asset allocation funds may invest in Fidelity funds that are overseen by such other Board. The use of separate Boards, each with its own committee structure, allows the Trustees of each group of Fidelity funds to focus on the unique issues of the funds they oversee, including common research, investment, and operational issues. On occasion, the separate Boards establish joint committees to address issues of overlapping consequences for the Fidelity funds overseen by each Board.
The Trustees operate using a system of committees to facilitate the timely and efficient consideration of all matters of importance to the Trustees, the fund, and fund shareholders and to facilitate compliance with legal and regulatory requirements and oversight of the fund's activities and associated risks. The Board, acting through its committees, has charged FMR and its affiliates with (i) identifying events or circumstances the occurrence of which could have demonstrably adverse effects on the fund's business and/or reputation; (ii) implementing processes and controls to lessen the possibility that such events or circumstances occur or to mitigate the effects of such events or circumstances if they do occur; and (iii) creating and maintaining a system designed to evaluate continuously business and market conditions in order to facilitate the identification and implementation processes described in (i) and (ii) above. Because the day-to-day operations and activities of the fund are carried out by or through FMR, its affiliates, and other service providers, the fund's exposure to risks is mitigated but not eliminated by the processes overseen by the Trustees. While each of the Board's committees has responsibility for overseeing different aspects of the fund's activities, oversight is exercised primarily through the Operations and Audit Committees. In addition, an ad hoc Board committee of Independent Trustees has worked with FMR to enhance the Board's oversight of investment and financial risks, legal and regulatory risks, technology risks, and operational risks, including the development of additional risk reporting to the Board. Appropriate personnel, including but not limited to the fund's Chief Compliance Officer (CCO), FMR's internal auditor, the independent accountants, the fund's Treasurer and portfolio management personnel, make periodic reports to the Board's committees, as appropriate, including an annual review of FMR's risk management program for the Fidelity fund. The responsibilities of each standing committee, including their oversight responsibilities, are described further under "Standing Committees of the Fund's Trustees."
Annual Report
The fund's Statement of Additional Information (SAI) includes more information about the Trustees. To request a free copy, call Fidelity at 1-877-208-0098.
Interested Trustees*:
Correspondence intended for each Trustee who is an interested person may be sent to Fidelity Investments, 245 Summer Street, Boston, Massachusetts 02210.
Name, Year of Birth; Principal Occupations and Other Relevant Experience+ |
James C. Curvey (1935) |
Year of Election or Appointment: 2007 Trustee |
| Mr. Curvey also serves as Trustee of other Fidelity funds. Mr. Curvey is a Director of Fidelity Investments Money Management, Inc. (2009-present), Director of Fidelity Research & Analysis Co. (2009-present) and Director of FMR and FMR Co., Inc. (2007-present). Mr. Curvey is also Vice Chairman (2007-present) and Director of FMR LLC. In addition, Mr. Curvey serves as an Overseer for the Boston Symphony Orchestra and a member of the Trustees of Villanova University. Previously, Mr. Curvey was the Vice Chairman (2006-2007) and Director (2000-2007) of FMR Corp. |
Abigail P. Johnson (1961) |
Year of Election or Appointment: 2009 Trustee Chairman of the Board of Trustees |
| Ms. Johnson also serves as Trustee of other Fidelity funds. Ms. Johnson serves as President of FMR LLC (2013-present), President of Fidelity Financial Services (2012-present) and President of Personal, Workplace and Institutional Services (2005-present). Ms. Johnson is Chairman and Director of FMR Co., Inc. (2011-present), Chairman and Director of FMR (2011-present), and the Vice Chairman and Director (2007-present) of FMR LLC. Previously, Ms. Johnson served as President and a Director of FMR (2001-2005), a Trustee of other investment companies advised by FMR, Fidelity Investments Money Management, Inc., and FMR Co., Inc. (2001-2005), Senior Vice President of the Fidelity funds (2001-2005), and managed a number of Fidelity funds. Ms. Abigail P. Johnson and Mr. Arthur E. Johnson are not related. |
* Trustees have been determined to be "Interested Trustees" by virtue of, among other things, their affiliation with the trust or various entities under common control with FMR.
+ The information above includes each Trustee's principal occupation during the last five years and other information relating to the experience, attributes, and skills relevant to each Trustee's qualifications to serve as a Trustee, which led to the conclusion that each Trustee should serve as a Trustee for each fund.
Independent Trustees:
Correspondence intended for each Independent Trustee (that is, the Trustees other than the Interested Trustees) may be sent to Fidelity Investments, P.O. Box 55235, Boston, Massachusetts 02205-5235.
Name, Year of Birth; Principal Occupations and Other Relevant Experience+ |
Elizabeth S. Acton (1951) |
Year of Election or Appointment: 2013 Trustee |
| Ms. Acton also serves as Trustee or Member of the Advisory Board of other Fidelity funds. Prior to her retirement in April 2012, Ms. Acton was Executive Vice President, Finance (2011-2012), Executive Vice President, Chief Financial Officer (2002-2011), and Treasurer (2004-2005) of Comerica Incorporated (financial services). Prior to joining Comerica, Ms. Acton held a variety of positions at Ford Motor Company (1983-2002), including Vice President and Treasurer (2000-2002) and Executive Vice President and Chief Financial Officer of Ford Motor Credit Company (1998-2000). Ms. Acton currently serves as a member of the Board of Directors and Audit and Finance Committees of Beazer Homes USA, Inc. (homebuilding, 2012-present). |
Albert R. Gamper, Jr. (1942) |
Year of Election or Appointment: 2007 Trustee Chairman of the Independent Trustees |
| Mr. Gamper also serves as Trustee of other Fidelity funds. Prior to his retirement in December 2004, Mr. Gamper served as Chairman of the Board of CIT Group Inc. (commercial finance). During his tenure with CIT Group Inc. Mr. Gamper served in numerous senior management positions, including Chairman (1987-1989; 1999-2001; 2002-2004), Chief Executive Officer (1987-2004), and President (2002-2003). Mr. Gamper currently serves as a member of the Board of Directors of Public Service Enterprise Group (utilities, 2000-present), a member of the Board of Trustees, Rutgers University (2004-present), and Chairman of the Board of Barnabas Health Care System. Previously, Mr. Gamper served as Vice Chairman of the Independent Trustees of certain Fidelity funds (2011-2012) and as Chairman of the Board of Governors, Rutgers University (2004-2007). |
Robert F. Gartland (1951) |
Year of Election or Appointment: 2010 Trustee |
| Mr. Gartland also serves as Trustee of other Fidelity funds. Mr. Gartland is Chairman and an investor in Gartland and Mellina Group Corp. (consulting, 2009-present). Previously, Mr. Gartland served as a partner and investor of Vietnam Partners LLC (investments and consulting, 2008-2011). Prior to his retirement, Mr. Gartland held a variety of positions at Morgan Stanley (financial services, 1979-2007) including Managing Director (1987-2007). |
Arthur E. Johnson (1947) |
Year of Election or Appointment: 2008 Trustee |
| Mr. Johnson also serves as Trustee of other Fidelity funds. Mr. Johnson serves as a member of the Board of Directors of Eaton Corporation (diversified power management, 2009-present), AGL Resources, Inc. (holding company, 2002-present) and Booz Allen Hamilton (management consulting, 2011-present). Prior to his retirement, Mr. Johnson served as Senior Vice President of Corporate Strategic Development of Lockheed Martin Corporation (defense contractor, 1999-2009). He previously served on the Board of Directors of IKON Office Solutions, Inc. (1999-2008) and Delta Airlines (2005-2007). Mr. Arthur E. Johnson is not related to Ms. Abigail P. Johnson. |
Michael E. Kenneally (1954) |
Year of Election or Appointment: 2009 Trustee |
| Mr. Kenneally also serves as Trustee of other Fidelity funds. Mr. Kenneally served as a Member of the Advisory Board for certain Fidelity funds before joining the Board of Trustees (2008-2009). Prior to his retirement, Mr. Kenneally served as Chairman and Global Chief Executive Officer of Credit Suisse Asset Management. Before joining Credit Suisse, he was an Executive Vice President and Chief Investment Officer for Bank of America Corporation. Earlier roles at Bank of America included Director of Research, Senior Portfolio Manager and Research Analyst, and Mr. Kenneally was awarded the Chartered Financial Analyst (CFA) designation in 1991. |
James H. Keyes (1940) |
Year of Election or Appointment: 2007 Trustee |
| Mr. Keyes also serves as Trustee of other Fidelity funds. Mr. Keyes serves as a member of the Board and Non-Executive Chairman of Navistar International Corporation (manufacture and sale of trucks, buses, and diesel engines, since 2002). Previously, Mr. Keyes served as a member of the Board of Pitney Bowes, Inc. (integrated mail, messaging, and document management solutions, 1998-2013). Prior to his retirement, Mr. Keyes served as Chairman (1993-2002) and Chief Executive Officer (1988-2002) of Johnson Controls (automotive, building, and energy) and as a member of the Board of LSI Logic Corporation (semiconductor technologies, 1984-2008). |
Marie L. Knowles (1946) |
Year of Election or Appointment: 2001 Trustee Vice Chairman of the Independent Trustees |
| Ms. Knowles also serves as Trustee of other Fidelity funds. Prior to Ms. Knowles' retirement in June 2000, she served as Executive Vice President and Chief Financial Officer of Atlantic Richfield Company (ARCO) (diversified energy, 1996-2000). From 1993 to 1996, she was a Senior Vice President of ARCO and President of ARCO Transportation Company. She served as a Director of ARCO from 1996 to 1998. Ms. Knowles currently serves as a Director and Chairman of the Audit Committee of McKesson Corporation (healthcare service, since 2002). Ms. Knowles is a member of the Board of the Catalina Island Conservancy and of the Santa Catalina Island Company (2009-present). She also serves as a member of the Advisory Board for the School of Engineering of the University of Southern California. Previously, Ms. Knowles served as a Director of Phelps Dodge Corporation (copper mining and manufacturing, 1994-2007), URS Corporation (engineering and construction, 2000-2003) and America West (airline, 1999-2002). |
Kenneth L. Wolfe (1939) |
Year of Election or Appointment: 2007 Trustee |
| Mr. Wolfe also serves as Trustee of other Fidelity funds. Prior to his retirement, Mr. Wolfe served as Chairman and a Director (2007-2009) and Chairman and Chief Executive Officer (1994-2001) of Hershey Foods Corporation. He also served as a member of the Boards of Adelphia Communications Corporation (telecommunications, 2003-2006), Bausch & Lomb, Inc. (medical/pharmaceutical, 1993-2007), and Revlon, Inc. (personal care products, 2004-2009). Mr. Wolfe previously served as Chairman of the Independent Trustees of other Fidelity funds (2008-2012). |
+ The information above includes each Trustee's principal occupation during the last five years and other information relating to the experience, attributes, and skills relevant to each Trustee's qualifications to serve as a Trustee, which led to the conclusion that each Trustee should serve as a Trustee for the fund.
Officers:
Correspondence intended for each officer may be sent to Fidelity Investments, 245 Summer Street, Boston, Massachusetts 02210. Officers appear below in alphabetical order.
Name, Year of Birth; Principal Occupation |
Elizabeth Paige Baumann (1968) |
Year of Election or Appointment: 2012 Anti-Money Laundering (AML) Officer |
| Ms. Baumann also serves as AML Officer of other funds. She is Chief AML Officer of FMR LLC (2012-present) and is an employee of Fidelity Investments. Previously, Ms. Baumann served as Vice President and Deputy Anti-Money Laundering Officer (2007-2012). |
Marc Bryant (1966) |
Year of Election or Appointment: 2013 Assistant Secretary |
| Mr. Bryant also serves as an officer of other funds. He is Senior Vice President and Deputy General Counsel of FMR LLC. Prior to joining Fidelity Investments, Mr. Bryant served as a Senior Vice President and the Head of Global Retail Legal for AllianceBernstein L.P. (2006-2010), and as the General Counsel for ProFund Advisors LLC (2001-2006). |
Jonathan Davis (1968) |
Year of Election or Appointment: 2010 Assistant Treasurer |
| Mr. Davis also serves as Assistant Treasurer of other funds. Mr. Davis is an employee of Fidelity Investments. Previously, Mr. Davis served as Vice President and Associate General Counsel of FMR LLC (2003-2010). |
Adrien E. Deberghes (1967) |
Year of Election or Appointment: 2010 Assistant Treasurer |
| Mr. Deberghes also serves as an officer of other funds. He is an employee of Fidelity Investments (2008-present). Prior to joining Fidelity Investments, Mr. Deberghes was Senior Vice President of Mutual Fund Administration at State Street Corporation (2007-2008), Senior Director of Mutual Fund Administration at Investors Bank & Trust (2005-2007), and Director of Finance for Dunkin' Brands (2000-2005). |
Stephanie J. Dorsey (1969) |
Year of Election or Appointment: 2013 President and Treasurer |
| Ms. Dorsey also serves as an officer of other funds. She is an employee of Fidelity Investments (2008-present) and has served in other fund officer roles. Prior to joining Fidelity Investments, Ms. Dorsey served as Treasurer (2004-2008) of the JPMorgan Mutual Funds and Vice President (2004-2008) of JPMorgan Chase Bank. |
Scott C. Goebel (1968) |
Year of Election or Appointment: 2008 Secretary and Chief Legal Officer (CLO) |
| Mr. Goebel serves as Secretary and CLO of other funds. Mr. Goebel also serves as Secretary of Fidelity Investments Money Management, Inc. (FIMM) (2010-present) and Fidelity Research and Analysis Company (FRAC) (2010-present); General Counsel, Secretary, and Senior Vice President of FMR (2008-present) and FMR Co., Inc. (2008-present); Chief Legal Officer of Fidelity Management & Research (Hong Kong) Limited (2008-present) and Assistant Secretary of Fidelity Management & Research (Japan) Inc. (2008-present), and Fidelity Management & Research (U.K.) Inc. (2008-present). Previously, Mr. Goebel served as Secretary and CLO of other Fidelity funds (2008-2013), Assistant Secretary of FIMM (2008-2010), FRAC (2008-2010), and certain funds (2007-2008); and as Vice President and Secretary of Fidelity Distributors Corporation (FDC) (2005-2007). Mr. Goebel has been employed by FMR LLC or an affiliate since 2001. |
Bruce T. Herring (1965) |
Year of Election or Appointment: 2013 Vice President of Fidelity's Asset Allocation Funds |
| Mr. Herring also serves as Vice President of other funds. He serves as Chief Investment Officer of Fidelity Global Asset Allocation (GAA) (2013-present), Group Chief Investment Officer of FMR, and President of Fidelity Research & Analysis Company (2010-present). Previously, Mr. Herring served as Chief Investment Officer and Director of Fidelity Management & Research (U.K.) Inc. (2010-2013), Vice President (2005-2006) and Senior Vice President (2006-2007) of Fidelity Management & Research Company, Vice President of FMR Co., Inc. (2001-2007), and as a portfolio manager for Fidelity U.S. Equity Funds. |
Chris Maher (1972) |
Year of Election or Appointment: 2013 Assistant Treasurer |
| Mr. Maher serves as Assistant Treasurer of other funds. Mr. Maher is Vice President of Valuation Oversight and is an employee of Fidelity Investments. Previously, Mr. Maher served as Vice President of Asset Management Compliance (2013), Vice President of FMR's Program Management Group (2010-2013), and Vice President of Valuation Oversight (2008-2010). |
Charles S. Morrison (1960) |
Year of Election or Appointment: 2012 Vice President |
| Mr. Morrison also serves as Vice President of other funds. He serves as President, Fixed Income and is an employee of Fidelity Investments. Previously, Mr. Morrison served as Vice President of Fidelity's Money Market Funds (2005-2009), President, Money Market Group Leader of FMR (2009), and Senior Vice President, Money Market Group of FMR (2004-2009). Mr. Morrison also served as Vice President of Fidelity's Bond Funds (2002-2005), certain Balanced Funds (2002-2005), and certain Asset Allocation Funds (2002-2007), and as Senior Vice President (2002-2005) of Fidelity's Fixed Income Division. |
Christine Reynolds (1958) |
Year of Election or Appointment: 2008 Chief Financial Officer |
| Ms. Reynolds also serves as Chief Financial Officer of other funds. Ms. Reynolds became President of Fidelity Pricing and Cash Management Services (FPCMS) in August 2008. Ms. Reynolds served as Chief Operating Officer of FPCMS (2007-2008). Previously, Ms. Reynolds served as President, Treasurer, and Anti-Money Laundering officer of the Fidelity funds (2004-2007). |
Kenneth B. Robins (1969) |
Year of Election or Appointment: 2009 Assistant Treasurer |
| Mr. Robins also serves as an officer of other funds. Mr. Robins serves as Executive Vice President of Fidelity Investments Money Management, Inc. (FIMM) (2013-present) and is an employee of Fidelity Investments (2004-present). Previously, Mr. Robins served in other fund officer roles. |
Gary W. Ryan (1958) |
Year of Election or Appointment: 2005 Assistant Treasurer |
| Mr. Ryan also serves as Assistant Treasurer of other funds. Mr. Ryan is an employee of Fidelity Investments and has served in other fund officer roles. Previously, Mr. Ryan served as Vice President of Fund Reporting in Fidelity Pricing and Cash Management Services (FPCMS) (1999-2005). |
Stephen Sadoski (1971) |
Year of Election or Appointment: 2013 Deputy Treasurer |
| Mr. Sadoski also serves as Deputy Treasurer of other funds. He is an employee of Fidelity Investments (2012-present) and has served in another fund officer role. Prior to joining Fidelity Investments, Mr. Sadoski served as an assistant chief accountant in the Division of Investment Management of the Securities and Exchange Commission (SEC) (2009-2012) and as a senior manager at Deloitte & Touche LLP (1997-2009). |
Stacie M. Smith (1974) |
Year of Election or Appointment: 2013 Assistant Treasurer |
| Ms. Smith also serves as an officer of other funds. She is an employee of Fidelity Investments (2009-present) and has served in other fund officer roles. Prior to joining Fidelity Investments, Ms. Smith served as Senior Audit Manager of Ernst & Young LLP (1996-2009). |
Renee Stagnone (1975) |
Year of Election or Appointment: 2013 Deputy Treasurer |
| Ms. Stagnone also serves as Deputy Treasurer of other funds. Ms. Stagnone is an employee of Fidelity Investments. |
Michael H. Whitaker (1967) |
Year of Election or Appointment: 2008 Chief Compliance Officer |
| Mr. Whitaker also serves as Chief Compliance Officer of other funds. Mr. Whitaker is an employee of Fidelity Investments (2007-present). Prior to joining Fidelity Investments, Mr. Whitaker worked at MFS Investment Management where he served as Senior Vice President and Chief Compliance Officer (2004-2006), and Assistant General Counsel. |
Derek L. Young (1964) |
Year of Election or Appointment: 2009 Vice President of Fidelity's Asset Allocation Funds |
| Mr. Young also serves as Trustee or an officer of other funds. He is President and a Director of Strategic Advisers, Inc. (2011-present), President of Fidelity Global Asset Allocation (GAA) (2011-present), and Vice Chairman of Pyramis Global Advisors, LLC (2011-present). Previously, Mr. Young served as Chief Investment Officer of GAA (2009-2011) and as a portfolio manager. |
Joseph F. Zambello (1957) |
Year of Election or Appointment: 2011 Deputy Treasurer |
| Mr. Zambello also serves as Deputy Treasurer of other funds. Mr. Zambello is an employee of Fidelity Investments. Previously, Mr. Zambello served as Vice President of FMR's Program Management Group (2009-2011) and Vice President of the Transfer Agent Oversight Group (2005-2009). |
Annual Report
The fund hereby designates as a capital gain dividend with respect to the taxable year ended December 31, 2013, $9,219,755 or, if subsequently determined to be different, the net capital gain of such year.
A total of 6.27% of the dividends distributed during the fiscal year was derived from interest on U.S. Government securities which is generally exempt from state income tax.
Initial Class, Service Class, Service Class 2 and Investor Class designates 1% of the dividends distributed during the fiscal year as qualifying for the dividends-received deduction for corporate shareholders.
Annual Report
Board Approval of Investment Advisory Contracts and Management Fees
VIP Strategic Income Portfolio
Each year, the Board of Trustees, including the Independent Trustees (together, the Board), votes on the renewal of the management contract with Fidelity Management & Research Company (FMR) and the sub-advisory agreements (together, the Advisory Contracts) for the fund. The Board, assisted by the advice of fund counsel and Independent Trustees' counsel, requests and considers a broad range of information relevant to the renewal of the Advisory Contracts throughout the year.
The Board meets regularly and, at each of its meetings, covers an extensive agenda of topics and materials and considers factors that are relevant to its annual consideration of the renewal of the fund's Advisory Contracts, including the services and support provided to the fund and its shareholders. The Board has established four standing committees, Operations, Audit, Fair Valuation, and Governance and Nominating, each composed of and chaired by Independent Trustees with varying backgrounds, to which the Board has assigned specific subject matter responsibilities in order to enhance effective decision-making by the Board. The Operations Committee, of which all of the Independent Trustees are members, meets regularly throughout the year and, among other matters, considers matters specifically related to the annual consideration of the renewal of the fund's Advisory Contracts. The Board, acting directly and through its Committees, requests and receives information concerning the annual consideration of the renewal of the fund's Advisory Contracts. The Board also meets as needed to consider matters specifically related to the Board's annual consideration of the renewal of Advisory Contracts. Members of the Board may also meet with trustees of other Fidelity funds through ad hoc joint committees to discuss certain matters relevant to the Fidelity funds.
At its September 2013 meeting, the Board, including the Independent Trustees, unanimously determined to renew the fund's Advisory Contracts. In reaching its determination, the Board considered all factors it believed relevant, including (i) the nature, extent, and quality of the services to be provided to the fund and its shareholders (including the investment performance of the fund); (ii) the competitiveness of the fund's management fee and total expense ratio relative to peer funds; (iii) the total costs of the services to be provided by and the profits to be realized by Fidelity from its relationship with the fund; (iv) the extent to which economies of scale exist and would be realized as the fund grows; and (v) whether fee levels reflect these economies of scale, if any, for the benefit of fund shareholders.
In considering whether to renew the Advisory Contracts for the fund, the Board reached a determination, with the assistance of fund counsel and Independent Trustees' counsel and through the exercise of its business judgment, that the renewal of the Advisory Contracts was in the best interests of the fund and its shareholders and that the compensation payable under the Advisory Contracts was fair and reasonable. The Board's decision to renew the Advisory Contracts was not based on any single factor, but rather was based on a comprehensive consideration of all the information provided to the Board at its meetings throughout the year. The Board, in reaching its determination to renew the Advisory Contracts, was aware that shareholders in the fund have a broad range of investment choices available to them, including a wide choice among mutual funds offered by Fidelity's competitors, and that the fund's shareholders, who have the opportunity to review and weigh the disclosure provided by the fund in its prospectus and other public disclosures, have chosen to invest in this fund, which is part of the Fidelity family of funds.
Nature, Extent, and Quality of Services Provided. The Board considered Fidelity's staffing as it relates to the fund, including the backgrounds of investment personnel of FMR and the sub-advisers (together, with the Investment Advisers), and also considered the fund's investment objective, strategies, and related investment philosophy. The Independent Trustees also had discussions with senior management of Fidelity's investment operations and investment groups. The Board considered the structure of the portfolio manager compensation program and whether this structure provides appropriate incentives to act in the best interests of the fund.
Resources Dedicated to Investment Management and Support Services. The Board reviewed the general qualifications and capabilities of Fidelity's investment staff, including its size, education, experience, and resources, as well as Fidelity's approach to recruiting, managing, and compensating investment personnel. The Board noted that Fidelity has continued to increase the resources devoted to non-U.S. offices, including expansion of Fidelity's global investment organization. The Board also noted that Fidelity's analysts have extensive resources, tools and capabilities that allow them to conduct sophisticated quantitative and fundamental analysis, as well as credit analysis of issuers, counterparties and guarantors. Further, the Board believes that Fidelity's investment professionals have sufficient access to global information and data so as to provide competitive investment results over time, and that those professionals also have access to sophisticated tools that permit them to assess portfolio construction and risk and performance attribution characteristics continuously, as well as to transmit new information and research conclusions rapidly around the world. Additionally, in its deliberations, the Board considered Fidelity's trading and risk management capabilities and resources, which are an integral part of the investment management process.
Shareholder and Administrative Services. The Board considered (i) the nature, extent, quality, and cost of advisory, administrative, and shareholder services performed by the Investment Advisers and their affiliates under the Advisory Contracts and under separate agreements covering transfer agency, pricing and bookkeeping, and securities lending services for the fund; (ii) the nature and extent of the supervision of third party service providers, principally custodians and subcustodians; and (iii) the resources devoted to, and the record of compliance with, the fund's compliance policies and procedures. The Board also reviewed the allocation of fund brokerage, including allocations to brokers affiliated with the Investment Advisers, the use of brokerage commissions to pay fund expenses, and the use of "soft" commission dollars to pay for research services.
Annual Report
Board Approval of Investment Advisory Contracts and Management Fees - continued
The Board noted that the growth of fund assets over time across the complex allows Fidelity to reinvest in the development of services designed to enhance the value or convenience of the Fidelity funds as investment vehicles. These services include 24-hour access to account information and market information through telephone representatives and over the Internet, investor education materials and asset allocation tools, and the expanded availability of Fidelity Investor Centers.
Investment in a Large Fund Family. The Board considered the benefits to shareholders of investing in a Fidelity fund, including the benefits of investing in a fund that is part of a large family of funds offering a variety of investment disciplines and providing a large variety of mutual fund investor services. The Board noted that Fidelity had taken, or had made recommendations that resulted in the Fidelity funds taking, a number of actions over the previous year that benefited particular funds, including (i) continuing to dedicate additional resources to investment research and to the support of the senior management team that oversees asset management; (ii) persisting in efforts to enhance Fidelity's global research capabilities; (iii) launching new funds and making other enhancements to meet client needs for global and income-oriented solutions; (iv) continuing to launch dedicated lower cost underlying funds to meet portfolio construction needs related to expanding underlying fund options for Fidelity funds of funds, specifically for the Freedom Fund product lines; (v) rationalizing product lines and gaining increased efficiencies through the combination of several funds with other funds; (vi) strengthening Fidelity's index fund offerings by reducing investment minimums and adopting or lowering existing expense caps for certain funds and classes; (vii) enhancing Global Asset Allocation product offerings by launching new funds and strategies, including "open architecture" target date funds that utilize affiliated and unaffiliated sub-advisers; (viii) modifying the eligibility criteria for Institutional Class shares of Advisor funds to increase their marketability to a portion of the defined contribution plan market; (ix) creating a new low-cost retirement share class for certain Advisor funds to appeal to large retirement plans; (x) transitioning the management of certain Fidelity commodity funds to Geode Capital Management LLC, a registered commodity pool operator, while retaining administrative responsibilities for the funds; and (xi) taking steps toward establishing a new Fidelity adviser to manage sector-based funds and products.
Investment Performance. The Board considered whether the fund has operated in accordance with its investment objective, as well as its record of compliance with its investment restrictions and its performance history.
The Board took into account discussions with the Investment Advisers about fund investment performance that occur at Board meetings throughout the year. In this regard the Board noted that as part of regularly scheduled fund reviews and other reports to the Board on fund performance, the Board periodically considers annualized return information for the fund for different time periods, measured against one or more securities market indices, including a customized blended index representative of the fund's asset classes (each a "benchmark index") and a peer group of mutual funds with similar objectives ("peer group"). In its evaluation of fund investment performance at meetings throughout the year, the Board gave particular attention to information indicating underperformance of certain Fidelity funds for specific time periods and the Investment Advisers' explanations for such underperformance.
In addition to reviewing absolute and relative fund performance, the Independent Trustees periodically consider the appropriateness of fund performance metrics in evaluating the results achieved. In general, the Independent Trustees believe that fund performance should be evaluated based on gross performance (before fees and expenses but after transaction costs) compared to appropriate benchmark indices, over appropriate time periods that may include full market cycles, and on net performance (after fees and expenses) compared to peer groups, as applicable, over the same periods, taking into account relevant factors including the following: general market conditions; expectations for interest rate levels and credit conditions; issuer-specific information including credit quality; tactical opportunities for investment; and fund cash flows and other factors. Depending on the circumstances, the Independent Trustees may be satisfied with a fund's performance notwithstanding that it lags its benchmark index or peer group for certain periods.
The Independent Trustees recognize that shareholders evaluate performance on a net basis over their own holding periods, for which one-, three-, and five-year periods are often used as a proxy. For this reason, the performance information reviewed by the Board also included net cumulative calendar year total return information for the fund and an appropriate benchmark index and peer group for the most recent one-, three-, and five-year periods.
Based on its review, the Board concluded that the nature, extent, and quality of services provided to the fund under the Advisory Contracts should benefit the fund's shareholders.
Competitiveness of Management Fee and Total Expense Ratio. The Board considered the fund's management fee and total expense ratio compared to "mapped groups" of competitive funds and classes. Fidelity creates "mapped groups" by combining similar Lipper investment objective categories that have comparable investment mandates. Combining Lipper investment objective categories aids the Board's management fee and total expense ratio comparisons by broadening the competitive group used for comparison and by reducing the number of universes to which various Fidelity funds are compared.
Management Fee. The Board considered two proprietary management fee comparisons for the 12-month periods shown in the chart below. The group of Lipper funds used by the Board for management fee comparisons is referred to below as the "Total Mapped Group." The Total Mapped Group comparison focuses on a fund's standing in terms of gross management fees before expense reimbursements or caps relative to the total universe of funds with comparable investment mandates, regardless of whether their management fee structures also are comparable. "TMG %" represents the percentage of funds in the Total Mapped Group that had management fees that were lower than the fund's. For example, a hypothetical TMG % of 50% would mean that half of the funds in the Total Mapped Group had higher, and half had lower, management fees than the fund. The fund's actual TMG %s are in the chart below. The "Asset-Size Peer Group" (ASPG) comparison focuses on a fund's standing relative to a subset of non-Fidelity funds within the Total Mapped Group that are similar in size and management fee structure. For example, if a fund is in the first quartile of the ASPG, the fund's management fee ranks in the least expensive or lowest 25% of funds in the ASPG. The ASPG represents at least 15% of the funds in the Total Mapped Group with comparable asset size and management fee structures, subject to a minimum of 50 funds (or all funds in the Total Mapped Group if fewer than 50). Additional information, such as the ASPG quartile in which the fund's management fee rate ranked, is also included in the chart and considered by the Board.
Annual Report
VIP Strategic Income Portfolio
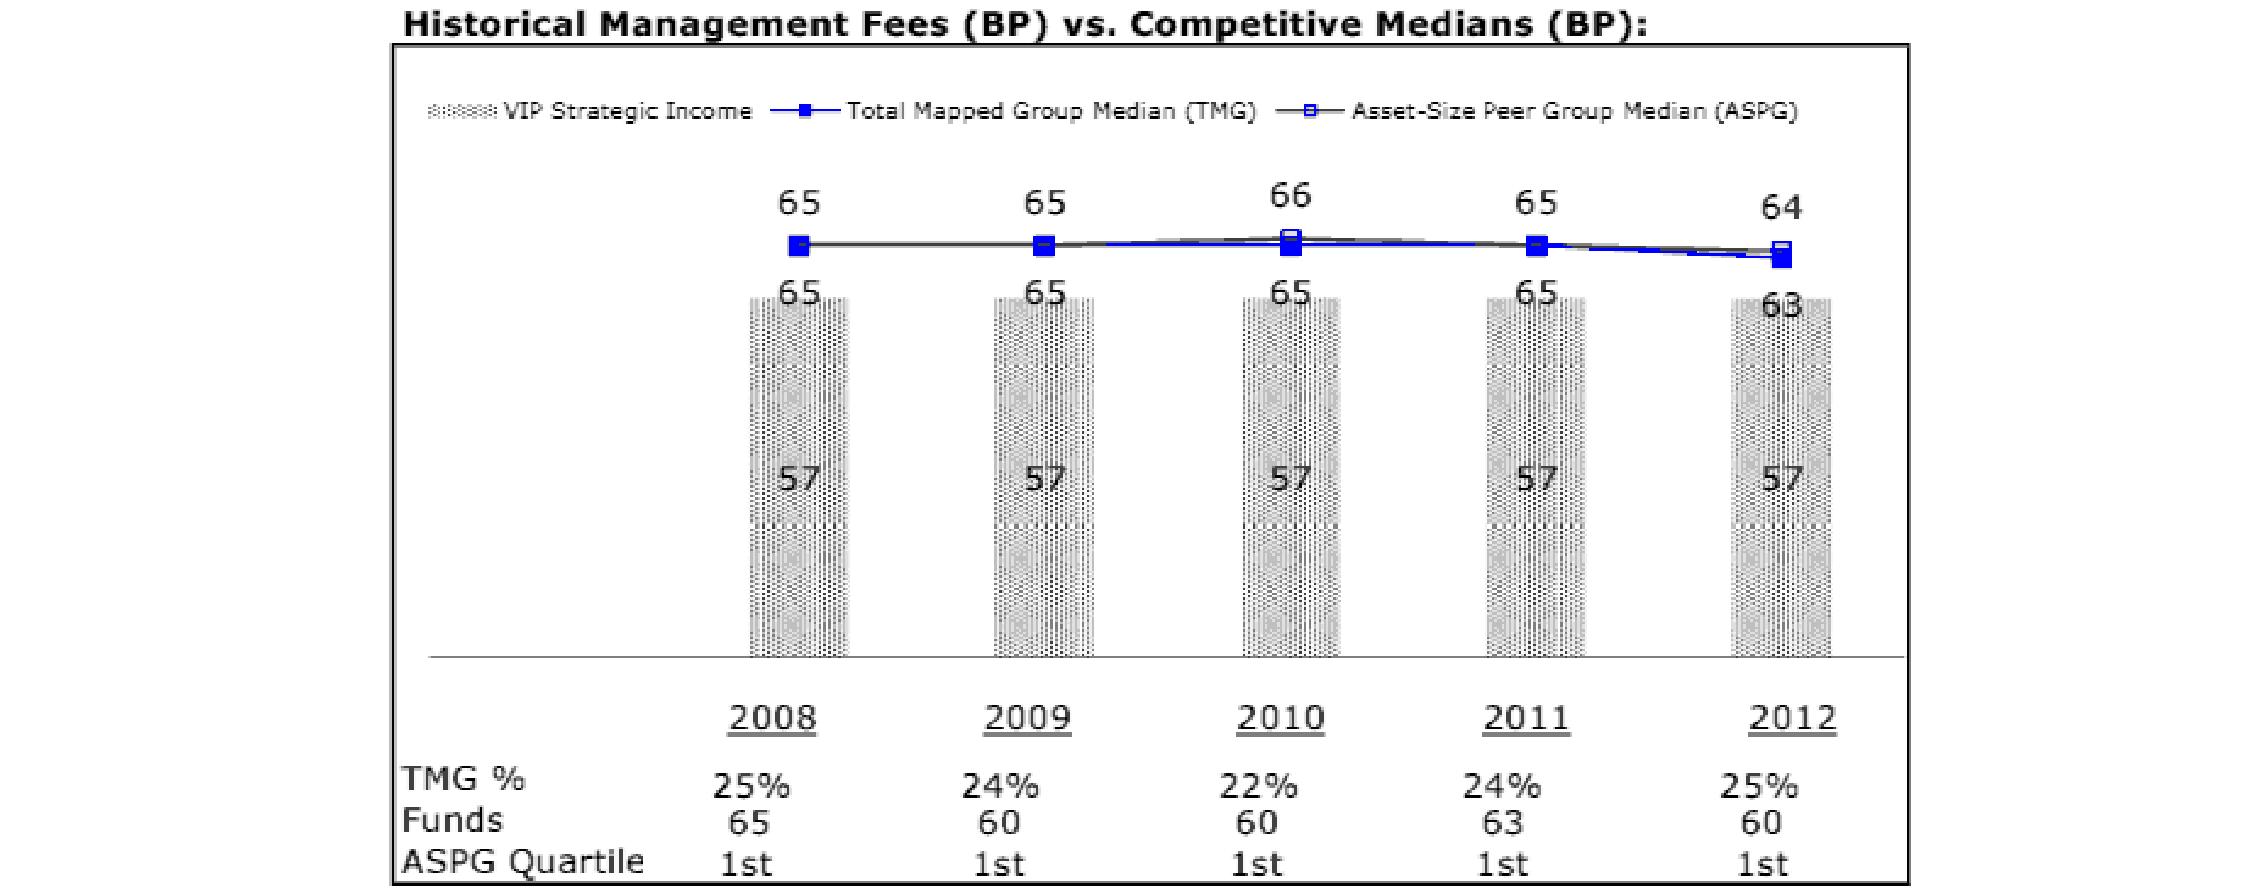
The Board noted that the fund's management fee rate ranked below the median of its Total Mapped Group and below the median of its ASPG for 2012.
Based on its review, the Board concluded that the fund's management fee is fair and reasonable in light of the services that the fund receives and the other factors considered.
Total Expense Ratio. In its review of each class's total expense ratio, the Board considered the fund's management fee as well as other fund or class expenses, as applicable, such as transfer agent fees, pricing and bookkeeping fees, fund-paid 12b-1 fees, and custodial, legal, and audit fees. The Board also noted the effects of any waivers and reimbursements on fees and expenses. As part of its review, the Board also considered the current and historical total expense ratios of each class of the fund compared to competitive fund median expenses. Each class of the fund is compared to those funds and classes in the Total Mapped Group (used by the Board for management fee comparisons) that have a similar sales load structure.
The Board noted that the total expense ratio of each of Initial Class, Investor Class, and Service Class ranked below its competitive median for 2012 and the total expense ratio of Service Class 2 ranked above its competitive median for 2012. The Board considered that, in general, various factors can affect total expense ratios. The Board noted that the total expense ratio of Service Class 2 was above the competitive median primarily because of higher 12b-1 fees for Service Class 2 as compared to most competitor funds. The Board noted that the fund offers multiple classes, each of which has a different 12b-1 fee structure, and that the multiple structures are intended to offer a range of pricing options for the intermediary market. The Board also noted that the total expense ratios of the classes vary primarily by the level of their 12b-1 fees, although differences in transfer agent fees may also cause expenses to vary from class to class.
Fees Charged to Other Fidelity Clients. The Board also considered Fidelity fee structures and other information with respect to clients of Fidelity, such as other mutual funds advised or subadvised by Fidelity, pension plan clients, and other institutional clients. The Board noted the findings of the 2013 ad hoc joint committee (created with the board of other Fidelity funds), which reviewed and compared Fidelity's institutional investment advisory business with its business of providing services to the Fidelity funds, including the differences in services provided, fees charged, and costs incurred, as well as competition in their respective marketplaces.
Based on its review of total expense ratios and fees charged to other Fidelity clients, the Board concluded that the total expense ratio of each class of the fund was reasonable, although Service Class 2 was above the median of the universe presented for comparison, in light of the services that the fund and its shareholders receive and the other factors considered.
Annual Report
Board Approval of Investment Advisory Contracts and Management Fees - continued
Costs of the Services and Profitability. The Board considered the revenues earned and the expenses incurred by Fidelity in conducting the business of developing, marketing, distributing, managing, administering and servicing the fund and servicing the fund's shareholders. The Board also considered the level of Fidelity's profits in respect of all the Fidelity funds.
On an annual basis, Fidelity presents to the Board Fidelity's profitability for the fund. Fidelity calculates the profitability for each fund, as well as aggregate profitability for groups of Fidelity funds and all Fidelity funds, using a series of detailed revenue and cost allocation methodologies which originate with the books and records of Fidelity on which Fidelity's audited financial statements are based. The Audit Committee of the Board reviews any significant changes from the prior year's methodologies.
PricewaterhouseCoopers LLP (PwC), independent registered public accounting firm and auditor to Fidelity and certain Fidelity funds, has been engaged annually by the Board as part of the Board's assessment of Fidelity's profitability analysis. PwC's engagement includes the review and assessment of the methodologies used by Fidelity in determining the revenues and expenses attributable to Fidelity's mutual fund business, and completion of agreed-upon procedures surrounding the mathematical accuracy of fund profitability and its conformity to allocation methodologies. After considering PwC's reports issued under the engagement and information provided by Fidelity, the Board concluded that while other allocation methods may also be reasonable, Fidelity's profitability methodologies are reasonable in all material respects.
The Board also reviewed Fidelity's non-fund businesses and fall-out benefits related to the mutual fund business as well as cases where Fidelity's affiliates may benefit from or be related to the fund's business.
The Board considered the costs of the services provided by and the profits realized by Fidelity in connection with the operation of the fund and was satisfied that the profitability was not excessive in the circumstances.
Economies of Scale. The Board considered whether there have been economies of scale in respect of the management of the Fidelity funds, whether the Fidelity funds (including the fund) have appropriately benefited from any such economies of scale, and whether there is potential for realization of any further economies of scale. The Board considered the extent to which the fund will benefit from economies of scale through increased services to the fund, through waivers or reimbursements, or through fee or expense reductions. The Board also noted that in 2009, it and the board of other Fidelity funds created an ad hoc committee (the Economies of Scale Committee) to analyze whether Fidelity attains economies of scale in respect of the management and servicing of the Fidelity funds, whether the Fidelity funds have appropriately benefited from such economies of scale, and whether there is potential for realization of any further economies of scale.
The Board recognized that the fund's management contract incorporates a "group fee" structure, which provides for lower group fee rates as total fund assets under FMR's management increase, and for higher group fee rates as total fund assets under FMR's management decrease. FMR calculates the group fee rates based on a tiered asset "breakpoint" schedule that varies based on asset class. The Board considered that the group fee is designed to deliver the benefits of economies of scale to fund shareholders when total Fidelity fund assets increase, even if assets of any particular fund are unchanged or have declined, because some portion of Fidelity's costs are attributable to services provided to all Fidelity funds, and all funds benefit if those costs can be allocated among more assets. The Board concluded that, given the group fee structure, fund shareholders will benefit from lower management fees as assets under FMR's management increase at the fund complex level, regardless of whether Fidelity achieves any such economies of scale.
The Board concluded, taking into account the analysis of the Economies of Scale Committee, that economies of scale, if any, are being appropriately shared between fund shareholders and Fidelity.
Amendment to Description of Group Fee Rate. At its September 2013 meeting, the Board voted to approve an amendment to the fund's management contract to modify the description of the "group fee rate." The Board noted that under the prior description in the contract, the group fee rate was based on the average net assets of all registered investment companies with which FMR has management contracts. Under the contract's tiered asset breakpoint schedule, the group fee rate is lower as total fund assets under FMR's management increase, and higher as total fund assets under FMR's management decrease. The Board considered that the prior description would have excluded the assets of 64 Fidelity sector funds from the group fee rate calculation once Fidelity SelectCo, LLC, an affiliate of FMR, assumed management responsibilities for those funds. The Board noted that modifying the description of the group fee rate to continue to include the assets of those 64 funds for purposes of determining group fee rate breakpoints would avoid an immediate adverse impact on the group fee rate for any fund.
Additional Information Requested by the Board. In order to develop fully the factual basis for consideration of the Fidelity funds' Advisory Contracts, the Board requested and received additional information on certain topics, including: (i) Fidelity's fund profitability methodology, profitability trends for certain funds, and the impact of certain factors on fund profitability results; (ii) portfolio manager changes that have occurred during the past year and the amount of the investment that each portfolio manager has made in the Fidelity fund(s) that he or she manages; (iii) Fidelity's compensation structure for portfolio managers, research analysts, and other key personnel, including its effects on fund profitability, the rationale for the compensation structure, and the extent to which current market conditions have affected retention and recruitment; (iv) the arrangements with and compensation paid to certain fund sub-advisers on behalf of the Fidelity funds; (v) Fidelity's fee structures, including the group fee structure and definition of group assets, and the rationale for recommending different fees among different categories of funds and classes; (vi) Fidelity's voluntary waiver of its fees to maintain minimum yields for certain money market funds and classes as well as contractual waivers in place for certain funds; (vii) the methodology with respect to competitive fund data and peer group classifications; (viii) Fidelity's transfer agent fee, expense, and service structures for different funds and classes, and the impact of the increased use of omnibus accounts; and (ix) explanations regarding the relative total expense ratios of certain funds and classes, total expense competitive trends and methodologies for total expense competitive comparisons, and actions that might be taken by Fidelity to reduce total expense ratios for certain funds and classes or to achieve further economies of scale.
Annual Report
Based on its evaluation of all of the conclusions noted above, and after considering all factors it believed relevant, the Board ultimately concluded that the advisory fee structures are fair and reasonable, and that the fund's Advisory Contracts should be renewed.
Annual Report
Investment Adviser
Fidelity Management & Research Company
Boston, MA
Investment Sub-Advisers
FMR Co., Inc.
Fidelity Investments Money Management, Inc.
FIL Investments (Japan) Limited
FIL Investment Advisors
FIL Investment Advisors (U.K.) Ltd.
Fidelity Management & Research (U.K.) Inc.
Fidelity Management & Research (Japan) Inc.
Fidelity Management & Research (Hong Kong) Limited
General Distributor
Fidelity Distributors Corporation
Smithfield, RI
Transfer and Service Agents
Fidelity Investments Institutional Operations Company, Inc.
Boston, MA
Fidelity Service Company, Inc.
Boston, MA
Custodian
State Street Bank and Trust Company
Quincy, MA
VIPSI-ANN-0214
1.796350.111
Fidelity® Variable Insurance Products:
Target Volatility Portfolio
Annual Report
December 31, 2013
(Fidelity Cover Art)
Contents
Performance | (Click Here) | How the fund has done over time. |
Management's Discussion of Fund Performance | (Click Here) | The Portfolio Manager's review of fund performance and strategy. |
Shareholder Expense Example | (Click Here) | An example of shareholder expenses. |
Investment Changes | (Click Here) | A summary of major shifts in the fund's investments over the past six months. |
Investments | (Click Here) | A complete list of the fund's investments with their market values. |
Financial Statements | (Click Here) | Statements of assets and liabilities, operations, and changes in net assets, as well as financial highlights. |
Notes | (Click Here) | Notes to the financial statements. |
Report of Independent Registered Public Accounting Firm | (Click Here) | |
Trustees and Officers | (Click Here) | |
Distributions | (Click Here) | |
To view a fund's proxy voting guidelines and proxy voting record for the 12-month period ended June 30, visit http://www.fidelity.com/proxyvotingresults or visit the Securities and Exchange Commission's (SEC) web site at http://www.sec.gov. You may also call 1-877-208-0098 to request a free copy of the proxy voting guidelines.
Fidelity Variable Insurance Products are separate account options which are purchased through a variable insurance contract.
Standard & Poor's, S&P and S&P 500 are registered service marks of The McGraw-Hill Companies, Inc. and have been licensed for use by Fidelity Distributors Corporation.
Other third-party marks appearing herein are the property of their respective owners.
All other marks appearing herein are registered or unregistered trademarks or service marks of FMR LLC or an affiliated company. © 2014 FMR LLC. All rights reserved.
This report and the financial statements contained herein are submitted for the general information of the shareholders of the fund. This report is not authorized for distribution to prospective investors in the fund unless preceded or accompanied by an effective prospectus.
A fund files its complete schedule of portfolio holdings with the SEC for the first and third quarters of each fiscal year on Form N-Q. Forms N-Q are available on the SEC's web site at http://www.sec.gov. A fund's Forms N-Q may be reviewed and copied at the SEC's Public Reference Room in Washington, DC. Information regarding the operation of the SEC's Public Reference Room may be obtained by calling 1-800-SEC-0330. For a complete list of a fund's portfolio holdings, view the most recent holdings listing, semiannual report, or annual report on Fidelity's web site at http://www.fidelity.com, http://www.advisor.fidelity.com, or http://www.401k.com, as applicable.
NOT FDIC INSURED • MAY LOSE VALUE • NO BANK GUARANTEE
Neither the fund nor Fidelity Distributors Corporation is a bank.
Annual Report
Average annual total return reflects the change in the value of an investment, assuming reinvestment of the class' distributions from dividend income and capital gains (the profits earned upon the sale of securities that have grown in value, if any) and assuming a constant rate of performance each year. During periods of reimbursement by Fidelity, a fund's total return will be greater than it would be had the reimbursement not occurred. Performance numbers are net of all underlying fund operating expenses, but do not include any insurance charges imposed by your insurance company's separate account. If performance information included the effect of these additional charges, the total returns would have been lower. How a fund did yesterday is no guarantee of how it will do tomorrow.
Average annual total returns take VIP Target Volatility Portfolio - Service Class's and Service Class 2's cumulative total return and show you what would have happened if Service Class and Service Class 2 shares had performed at a constant rate each year. These numbers will be reported once the fund is a year old.
$10,000 Over Life of Fund
Let's say hypothetically that $10,000 was invested in VIP Target Volatility Portfolio - Service Class on February 13, 2013, when the fund started. The chart shows how the value of your investment would have changed, and also shows how the S&P 500® Index performed over the same period.
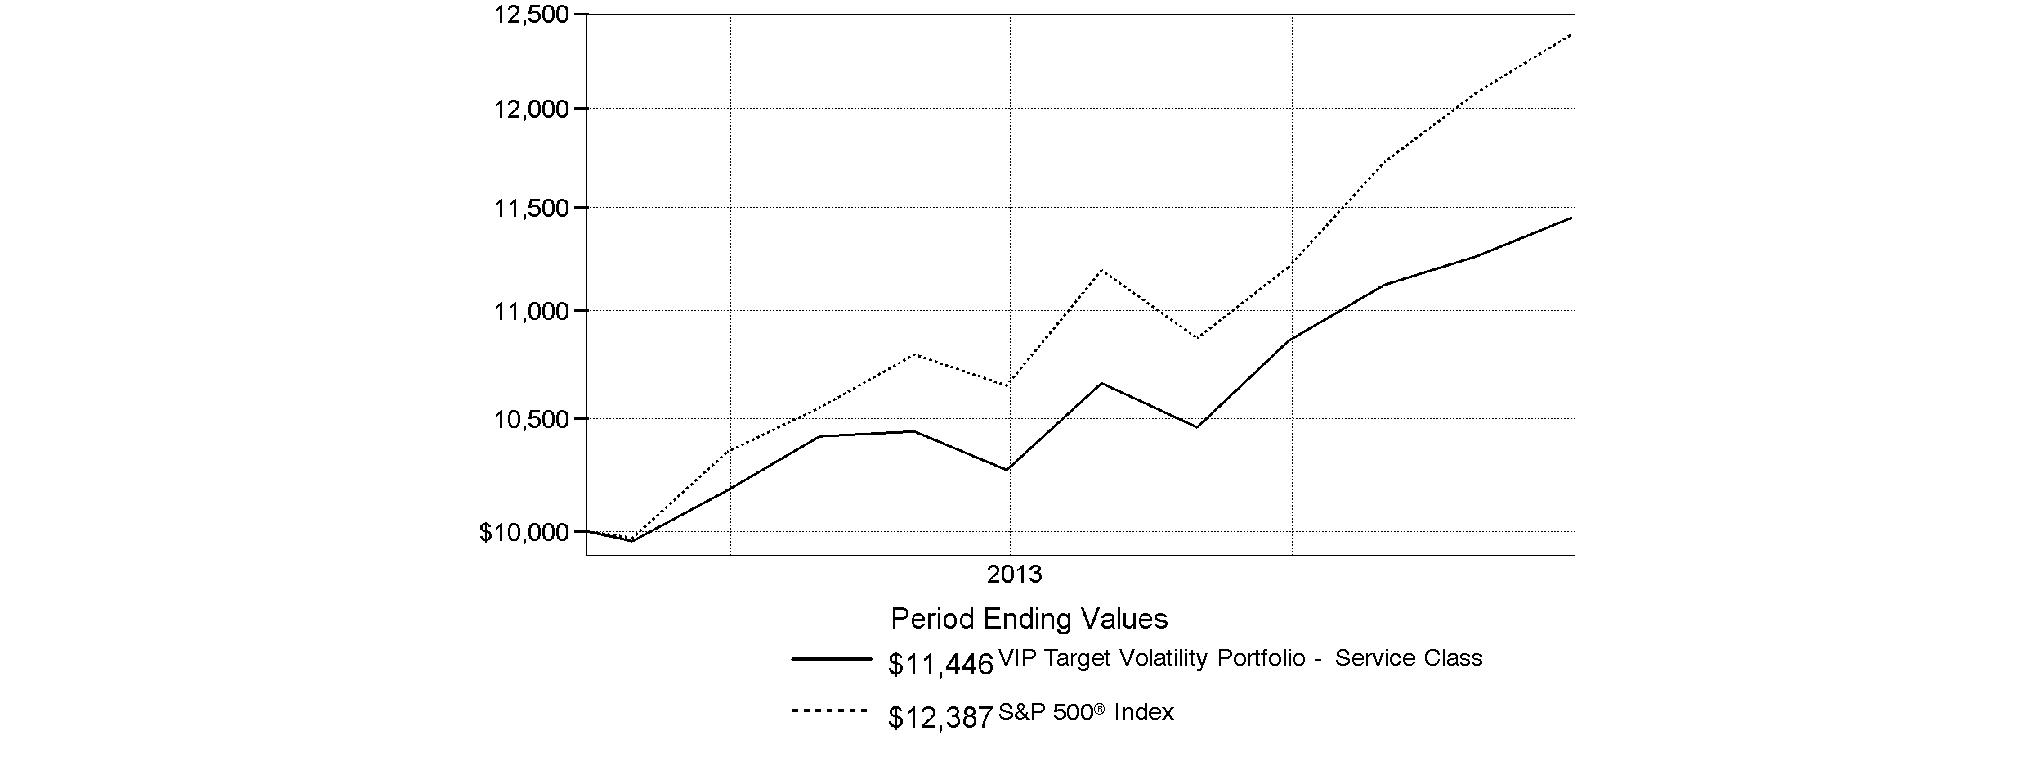
Annual Report
Market Recap: Global equity markets remained upbeat for the 12 months ending December 31, 2013, propelling the MSCI® ACWI® (All Country World Index) Index to a 23.24% return. Midyear turbulence gave way by autumn when policymakers in the U.S. and China had made clear their intentions to maintain accommodative monetary policies. That stance, combined with modest cyclical improvement around the globe and generally low valuations, underpinned the broad rally in equities, although the relative strength of the U.S. dollar generally tempered gains for U.S. investors holding foreign securities based in local currencies. During the period, the broad-market S&P 500® Index set a series of new highs, finishing the year up 32.39%. For the first time since 1995, the S&P® scored a "perfect 10," with all 10 economic sectors gaining at least 10% for the year. A resurgence in growth-oriented stocks lifted the Nasdaq Composite Index® to a 40.12% result for 2013, while the blue-chip Dow Jones Industrial AverageSM notched a relatively more modest 29.65% gain. International developed-markets equities rose in concert with their U.S. counterparts, with the MSCI® EAFE® Index gaining 22.92% for the period. Meanwhile, foreign exchange and commodity weakness curbed results in resource-heavy emerging markets (EM), especially in the year's waning months. More generally, concern over EM's slowing growth, its declining share of global trade and uncertainty surrounding U.S. central bank intentions were all factors hampering performance. The MSCI Emerging Markets Index returned -2.27% for the period. On the bond side, U.S. high-yield securities rallied with equities for much of the period, with The BofA Merrill LynchSM US High Yield Constrained Index returning 7.41% for 2013. The more rate-sensitive U.S. investment-grade bond category faced headwinds though, as reflected in the -2.02% return of the Barclays® U.S. Aggregate Bond Index. Within the Barclays index, investment-grade corporate credit returned -2.01%, while ultra-safe U.S. Treasuries saw a -2.75% result. Major non-U.S. developed markets performed only slightly better, with the Citigroup® Non-USD Group-of-Seven (G7) Equal Weighted Index logging a -1.59% result. After several years of strong advances, EM debt reversed course in 2013, with the J.P. Morgan Emerging Markets Bond Index Global returning -6.58%.
Comments from Xuehai En, Lead Portfolio Manager of Target Volatility Portfolio: From inception on February 13, 2013, through December 31, 2013, the fund's share classes solidly outperformed the 12.46% gain of the Fidelity VIP Target Volatility Portfolio Composite IndexSM. (For specific portfolio results, please refer to the financial highlights section of this report). During the early part of the period, the portfolio had a significant underweighting in U.S. investment-grade debt versus the Composite index. In addition, the portfolio was meaningfully overweighted in equities, particularly in the U.S., reflecting a high-conviction level for developed markets, as most economies here remained in early- or mid-cycle expansion. The portfolio remained overweighted in equities throughout the period, with modest exposure to emerging-markets stocks, as growth continued to slow in developing economies. During the summer, fears that the U.S. Federal Reserve would begin tapering its aggressive monetary stimulus program caused a sharp increase in interest rates. Credit spreads also widened as some investors reduced bond positions. In this environment, the portfolio reduced its underweighting in investment-grade debt by adding to its bond holdings, particularly corporate issues. Offering negative real returns, cash was reduced during the period and remained an underweight allocation. Overall, asset allocation provided a sizable boost to relative performance, with our underweighting in investment-grade debt, overweighting in equities and underweighting in cash/cash equivalents more than offsetting weak results from a small out-of-benchmark position in emerging-markets equities. Security selection, particularly in U.S. and non-U.S. developed equities, also was a major contributor.
The views expressed above reflect those of the portfolio manager(s) only through the end of the period as stated on the cover of this report and do not necessarily represent the views of Fidelity or any other person in the Fidelity organization. Any such views are subject to change at any time based upon market or other conditions and Fidelity disclaims any responsibility to update such views. These views may not be relied on as investment advice and, because investment decisions for a Fidelity fund are based on numerous factors, may not be relied on as an indication of trading intent on behalf of any Fidelity fund.
Annual Report
As a shareholder of the Fund, you incur two types of costs: (1) transaction costs, and (2) ongoing costs, including management fees, distribution and/or service (12b-1) fees and other Fund expenses. This Example is intended to help you understand your ongoing costs (in dollars) of investing in the Fund and to compare these costs with the ongoing costs of investing in other mutual funds.
The Example is based on an investment of $1,000 invested at the beginning of the period and held for the entire period (July 1, 2013 to December 31, 2013).
Actual Expenses
The first line of the accompanying table for each class of the Fund provides information about actual account values and actual expenses. You may use the information in this line, together with the amount you invested, to estimate the expenses that you paid over the period. Simply divide your account value by $1,000.00 (for example, an $8,600 account value divided by $1,000.00 = 8.6), then multiply the result by the number in the first line for a class of the Fund under the heading entitled "Expenses Paid During Period" to estimate the expenses you paid on your account during this period. The estimate of expenses does not include any fees or other expenses of any variable annuity or variable life insurance product. If they were, the estimate of expenses you paid during the period would be higher, and your ending account value would be lower. In addition, the Fund, as a shareholder in underlying mutual funds and exchange-traded funds (ETFs)(the Underlying Funds), will indirectly bear its pro-rata share of the fees and expenses incurred by the underlying Fidelity Funds. These fees and expenses are not included in the Fund's annualized expense ratio used to calculate the expense estimate in the table below.
Hypothetical Example for Comparison Purposes
The second line of the accompanying table for each class of the Fund provides information about hypothetical account values and hypothetical expenses based on a Class' actual expense ratio and an assumed rate of return of 5% per year before expenses, which is not the Class' actual return. The hypothetical account values and expenses may not be used to estimate the actual ending account balance or expenses you paid for the period. You may use this information to compare the ongoing costs of investing in the Fund and other funds. To do so, compare this 5% hypothetical example with the 5% hypothetical examples that appear in the shareholder reports of the other funds. The estimate of expenses does not include any fees or other expenses of any variable annuity or variable life insurance product. If they were, the estimate of expenses you paid during the period would be higher, and your ending account value would be lower. In addition, the Fund, as a shareholder in underlying mutual funds and exchange-traded funds (ETFs)(the Underlying Funds), will indirectly bear its pro-rata share of the fees and expenses incurred by the underlying Fidelity Funds. These fees and expenses are not included in the Fund's annualized expense ratio used to calculate the expense estimate in the table below.
Please note that the expenses shown in the table are meant to highlight your ongoing costs only and do not reflect any transaction costs. Therefore, the second line of the table is useful in comparing ongoing costs only, and will not help you determine the relative total costs of owning different funds.
| Annualized
Expense Ratio B | Beginning
Account Value
July 1, 2013 | Ending
Account Value
December 31, 2013 | Expenses Paid
During Period*
July 1, 2013 to
December 31, 2013 |
Service Class | .25% | | | |
Actual | | $ 1,000.00 | $ 1,114.50 | $ 1.33 |
HypotheticalA | | $ 1,000.00 | $ 1,023.95 | $ 1.28 |
Service Class 2 | .41% | | | |
Actual | | $ 1,000.00 | $ 1,114.20 | $ 2.18 |
HypotheticalA | | $ 1,000.00 | $ 1,023.14 | $ 2.09 |
A 5% return per year before expenses
B Annualized expense ratio reflects expenses net of applicable fee waivers.
* Expenses are equal to each Class' annualized expense ratio, multiplied by the average account value over the period, multiplied by 184/365 (to reflect the one-half year period).
Annual Report
Investment Changes (Unaudited)
The information in the following tables is based on the direct investments of the Fund. |
Fund Holdings as of December 31, 2013 |
| % of fund's
net assets | % of fund's net assets
6 months ago |
Domestic Equity Funds | | |
Fidelity Air Transportation Portfolio | 0.3 | 0.3 |
Fidelity Automotive Portfolio | 0.0* | 0.5 |
Fidelity Banking Portfolio | 1.6 | 0.3 |
Fidelity Biotechnology Portfolio | 0.3 | 0.0 |
Fidelity Blue Chip Growth Fund | 4.0 | 0.0 |
Fidelity Brokerage & Investment Management Portfolio | 0.7 | 0.9 |
Fidelity Chemicals Portfolio | 0.8 | 0.0* |
Fidelity Communications Equipment Portfolio | 0.1 | 0.5 |
Fidelity Computers Portfolio | 0.0 | 0.6 |
Fidelity Consumer Discretionary Portfolio | 0.6 | 0.8 |
Fidelity Consumer Finance Portfolio | 0.0 | 0.3 |
Fidelity Consumer Staples Portfolio | 0.7 | 0.5 |
Fidelity Contrafund | 1.8 | 0.0 |
Fidelity Disciplined Equity Fund | 2.9 | 0.0 |
Fidelity Electronics Portfolio | 0.0 | 0.3 |
Fidelity Energy Portfolio | 0.5 | 0.0 |
Fidelity Energy Service Portfolio | 0.1 | 0.8 |
Fidelity Equity-Income Fund | 0.4 | 0.5 |
Fidelity Financial Services Portfolio | 0.2 | 0.0 |
Fidelity Growth & Income Portfolio | 0.0 | 6.9 |
Fidelity Health Care Portfolio | 1.5 | 0.0* |
Fidelity Industrial Equipment Portfolio | 0.4 | 0.0 |
Fidelity Industrials Portfolio | 2.1 | 0.5 |
Fidelity Insurance Portfolio | 1.0 | 0.0* |
Fidelity Large Cap Stock Fund | 4.2 | 6.3 |
Fidelity Large Cap Value Enhanced Index Fund | 0.0 | 1.1 |
Fidelity Leveraged Company Stock Fund | 0.0 | 0.8 |
Fidelity Low-Priced Stock Fund | 2.9 | 0.0 |
Fidelity Materials Portfolio | 0.3 | 0.0 |
Fidelity Medical Equipment & Systems Portfolio | 0.1 | 0.5 |
Fidelity Mega Cap Stock Fund | 2.2 | 4.4 |
Fidelity Mid Cap Value Fund | 0.9 | 0.7 |
Fidelity Multimedia Portfolio | 0.2 | 0.3 |
Fidelity New Millennium Fund | 1.9 | 0.3 |
Fidelity OTC Portfolio | 0.6 | 3.3 |
Fidelity Pharmaceuticals Portfolio | 0.5 | 0.8 |
|
| % of fund's
net assets | % of fund's net assets
6 months ago |
Fidelity Real Estate Investment Portfolio | 0.0* | 0.0* |
Fidelity Small Cap Enhanced Index Fund | 0.1 | 0.9 |
Fidelity Small Cap Growth Fund | 1.1 | 1.0 |
Fidelity Small Cap Value Fund | 1.1 | 1.2 |
Fidelity Software & Computer Services Portfolio | 1.1 | 1.0 |
Fidelity Technology Portfolio | 0.9 | 0.0 |
Fidelity Telecommunications Portfolio | 0.0* | 0.1 |
Fidelity Transportation Portfolio | 0.5 | 0.0 |
Fidelity Value Fund | 1.6 | 0.0* |
SPDR S&P 500 ETF | 0.4 | 2.4 |
Vanguard Value ETF | 1.5 | 0.0 |
| 42.1 | 38.8 |
International Equity Funds | | |
Fidelity Diversified International Fund | 1.7 | 0.0* |
Fidelity Emerging Europe, Middle East, Africa (EMEA) Fund | 0.0* | 0.0* |
Fidelity Emerging Markets Discovery Fund | 0.0* | 0.1 |
Fidelity Emerging Markets Fund | 0.3 | 0.7 |
Fidelity Europe Capital Appreciation Fund | 0.0* | 0.0 |
Fidelity Europe Fund | 3.4 | 2.0 |
Fidelity International Discovery Fund | 5.6 | 6.2 |
Fidelity International Small Cap Fund | 3.1 | 1.5 |
Fidelity International Small Cap Opportunities Fund | 0.9 | 1.6 |
Fidelity Japan Smaller Companies Fund | 1.5 | 1.1 |
Fidelity Nordic Fund | 1.9 | 0.0 |
Fidelity Pacific Basin Fund | 0.0* | 0.1 |
iShares MSCI EAFE Index ETF | 0.9 | 0.5 |
iShares MSCI Japan Small Capital Index ETF | 0.0 | 1.1 |
WisdomTree Japan Hedged Equity ETF | 0.8 | 0.8 |
| 20.1 | 15.7 |
Fixed-Income Funds | | |
Fidelity Conservative Income Bond Fund | 0.3 | 9.2 |
Fidelity Corporate Bond Fund | 5.7 | 0.0 |
Fund Holdings as of December 31, 2013 - continued |
| % of fund's
net assets | % of fund's net assets
6 months ago |
Fixed-Income Funds - continued | | |
Fidelity Floating Rate High Income Fund | 0.4 | 0.7 |
Fidelity High Income Fund | 0.2 | 0.0 |
Fidelity Intermediate Bond Fund | 0.0 | 13.4 |
Fidelity Real Estate Income Fund | 0.0* | 0.0* |
Fidelity Total Bond Fund | 23.7 | 11.9 |
SPDR Lehman High Yield Bond ETF | 1.2 | 0.0 |
| 31.5 | 35.2 |
U.S. Treasury Obligations | | |
U.S. Treasury Bills, yield at date of purchase 0.02% to 0.07% 1/2/14 to 2/27/14 | 0.2 | 0.0 |
U.S. Treasury Bills, yield at date of purchase 0.05% 7/5/13 | 0.0 | 0.6 |
| 0.2 | 0.6 |
Net Other Assets (Liabilities) | 6.1 | 9.7 |
| 100.0 | 100.0 |
* Amount represents less than 0.1%
Asset Allocation (% of fund's net assets) |
As of December 31, 2013* |
 | Domestic Equity Funds | 42.1% | |
 | International Equity Funds | 20.1% | |
 | Fixed-Income Funds | 31.5% | |
 | Short-Term Investments | 0.2% | |
 | Net Other Assets (Liabilities) | 6.1% | |
* Futures | 4.5% | |

As of June 30, 2013* |
| Domestic Equity Funds | 38.8% | |
| International Equity Funds | 15.7% | |
| Fixed Income Funds | 35.2% | |
| Short-Term Investments | 0.6% | |
| Net Other Assets (Liabilities) | 9.7% | |
* Futures | 9.7% | |

Annual Report
Investments December 31, 2013
Showing Percentage of Net Assets
Equity Funds - 62.2% |
| Shares | | Value |
Domestic Equity Funds - 42.1% |
Fidelity Air Transportation Portfolio (a) | 3,532 | | $ 209,440 |
Fidelity Automotive Portfolio (a) | 559 | | 31,477 |
Fidelity Banking Portfolio (a) | 39,713 | | 1,039,280 |
Fidelity Biotechnology Portfolio (a) | 875 | | 159,089 |
Fidelity Blue Chip Growth Fund (a) | 39,435 | | 2,499,014 |
Fidelity Brokerage & Investment Management Portfolio (a) | 6,143 | | 456,119 |
Fidelity Chemicals Portfolio (a) | 3,305 | | 482,150 |
Fidelity Communications Equipment Portfolio (a) | 2,121 | | 62,560 |
Fidelity Consumer Discretionary Portfolio (a) | 12,095 | | 400,585 |
Fidelity Consumer Staples Portfolio (a) | 4,581 | | 413,214 |
Fidelity Contrafund (a) | 11,575 | | 1,112,860 |
Fidelity Disciplined Equity Fund (a) | 55,899 | | 1,806,653 |
Fidelity Energy Portfolio (a) | 5,158 | | 289,435 |
Fidelity Energy Service Portfolio (a) | 1,049 | | 88,968 |
Fidelity Equity-Income Fund (a) | 4,615 | | 270,886 |
Fidelity Financial Services Portfolio (a) | 1,252 | | 102,376 |
Fidelity Health Care Portfolio (a) | 5,100 | | 961,354 |
Fidelity Industrial Equipment Portfolio (a) | 5,718 | | 262,007 |
Fidelity Industrials Portfolio (a) | 39,915 | | 1,343,952 |
Fidelity Insurance Portfolio (a) | 9,281 | | 636,498 |
Fidelity Large Cap Stock Fund (a) | 97,253 | | 2,648,195 |
Fidelity Low-Priced Stock Fund (a) | 36,661 | | 1,813,267 |
Fidelity Materials Portfolio (a) | 2,133 | | 181,107 |
Fidelity Medical Equipment & Systems Portfolio (a) | 2,150 | | 76,837 |
Fidelity Mega Cap Stock Fund (a) | 92,323 | | 1,423,614 |
Fidelity Mid Cap Value Fund (a) | 25,622 | | 579,054 |
Fidelity Multimedia Portfolio (a) | 1,216 | | 98,463 |
Fidelity New Millennium Fund (a) | 29,841 | | 1,177,807 |
Fidelity OTC Portfolio (a) | 5,245 | | 405,892 |
Fidelity Pharmaceuticals Portfolio (a) | 17,230 | | 330,992 |
Fidelity Real Estate Investment Portfolio (a) | 138 | | 4,418 |
Fidelity Small Cap Enhanced Index Fund (a) | 4,575 | | 58,106 |
Fidelity Small Cap Growth Fund (a) | 36,398 | | 701,386 |
Fidelity Small Cap Value Fund (a) | 36,070 | | 722,853 |
Fidelity Software & Computer Services Portfolio (a) | 5,833 | | 692,186 |
Fidelity Technology Portfolio (a) | 4,736 | | 582,773 |
Fidelity Telecommunications Portfolio (a) | 98 | | 5,918 |
Fidelity Transportation Portfolio (a) | 4,129 | | 304,946 |
Fidelity Value Fund (a) | 9,918 | | 1,027,270 |
|
| Shares | | Value |
SPDR S&P 500 ETF | 1,231 | | $ 227,329 |
Vanguard Value ETF | 12,442 | | 950,444 |
TOTAL DOMESTIC EQUITY FUNDS | | 26,640,774 |
International Equity Funds - 20.1% |
Fidelity Diversified International Fund (a) | 28,480 | | 1,051,203 |
Fidelity Emerging Europe, Middle East, Africa (EMEA) Fund (a) | 101 | | 932 |
Fidelity Emerging Markets Discovery Fund (a) | 2,727 | | 33,135 |
Fidelity Emerging Markets Fund (a) | 6,649 | | 160,167 |
Fidelity Europe Capital Appreciation Fund (a) | 242 | | 5,696 |
Fidelity Europe Fund (a) | 56,147 | | 2,183,567 |
Fidelity International Discovery Fund (a) | 87,222 | | 3,532,493 |
Fidelity International Small Cap Fund (a) | 72,727 | | 1,948,358 |
Fidelity International Small Cap Opportunities Fund (a) | 38,768 | | 541,201 |
Fidelity Japan Smaller Companies Fund (a) | 71,504 | | 961,008 |
Fidelity Nordic Fund (a) | 27,354 | | 1,224,918 |
Fidelity Pacific Basin Fund (a) | 493 | | 13,632 |
iShares MSCI EAFE Index ETF | 8,082 | | 541,979 |
WisdomTree Japan Hedged Equity ETF | 9,541 | | 485,064 |
TOTAL INTERNATIONAL EQUITY FUNDS | | 12,683,353 |
TOTAL EQUITY FUNDS (Cost $37,462,488) |
39,324,127
|
Fixed-Income Funds - 31.5% |
| | | |
Fidelity Conservative Income Bond Fund (a) | 15,716 | | 157,790 |
Fidelity Corporate Bond Fund (a) | 331,244 | | 3,623,807 |
Fidelity Floating Rate High Income Fund (a) | 24,126 | | 240,294 |
Fidelity High Income Fund (a) | 15,759 | | 147,660 |
Fidelity Real Estate Income Fund (a) | 134 | | 1,485 |
Fidelity Total Bond Fund (a) | 1,433,462 | | 14,965,343 |
SPDR Lehman High Yield Bond ETF | 19,202 | | 778,833 |
TOTAL FIXED-INCOME FUNDS (Cost $20,095,374) |
19,915,212
|
U.S. Treasury Obligations - 0.2% |
| Principal Amount | | Value |
U.S. Treasury Bills, yield at date of purchase 0.02% to 0.07% 1/2/14 to 2/27/14 (b)
(Cost $149,997) | | $ 150,000 | | $ 149,998 |
TOTAL INVESTMENT PORTFOLIO - 93.9% (Cost $57,707,859) | | 59,389,337 |
NET OTHER ASSETS (LIABILITIES) - 6.1% | | 3,863,540 |
NET ASSETS - 100% | $ 63,252,877 |
Futures Contracts |
| Expiration Date | | Underlying Face Amount at Value | | Unrealized Appreciation/(Depreciation) |
Purchased |
Equity Index Contracts |
23 CME E-mini S&P 500 Index Contracts (United States) | March 2014 | | $ 2,117,265 | | $ 83,532 |
3 NYSE E-mini MSCI EAFE Index Contracts (United States) | March 2014 | | 287,670 | | 12,444 |
9 NYSE E-mini MSCI Emerging Markets Index Contracts (United States) | March 2014 | | 457,560 | | 9,388 |
TOTAL EQUITY INDEX CONTRACTS | | $ 2,862,495 | | $ 105,364 |
For the period, the average monthly underlying face amount at value for futures contracts in the aggregate was $1,709,012 |
|
The face value of futures purchased as a percentage of net assets is 4.5% |
Security Type Abbreviations |
ETF | - | Exchange-Traded Fund |
Legend |
(a) Affiliated company |
(b) Security or a portion of the security was pledged to cover margin requirements for futures contracts. At period end, the value of securities pledged amounted to $144,998. |
Affiliated Underlying Funds |
Information regarding the Fund's fiscal year to date purchases and sales of the affiliated Underlying Funds and income earned by the Fund from investments in affiliated Underlying Funds is as follows: |
Affiliate | Value,
beginning of
period | Purchases | Sales
Proceeds | Dividend
Income | Value,
end of
period |
Fidelity Air Transportation Portfolio | $ - | $ 184,102 | $ - | $ 132 | $ 209,440 |
Fidelity Automotive Portfolio | - | 716,749 | 716,310 | 82 | 31,477 |
Fidelity Banking Portfolio | - | 1,104,132 | 71,427 | 5,747 | 1,039,280 |
Fidelity Biotechnology Portfolio | - | 654,431 | 495,323 | - | 159,089 |
Fidelity Blue Chip Growth Fund | - | 2,513,981 | 107,532 | 3,163 | 2,499,014 |
Fidelity Brokerage & Investment Management Portfolio | - | 577,426 | 153,639 | 2,370 | 456,119 |
Fidelity Chemicals Portfolio | - | 456,872 | - | 2,589 | 482,150 |
Fidelity China Region Fund | - | 27,412 | 27,511 | - | - |
Fidelity Communications Equipment Portfolio | - | 52,921 | - | 421 | 62,560 |
Fidelity Computers Portfolio | - | 113,583 | 118,328 | 17 | - |
Fidelity Conservative Income Bond Fund | - | 1,606,303 | 1,447,962 | 509 | 157,790 |
Fidelity Construction & Housing Portfolio | - | 39,721 | 39,501 | 7 | - |
Fidelity Consumer Discretionary Portfolio | - | 482,119 | 93,916 | 307 | 400,585 |
Fidelity Consumer Finance Portfolio | - | 28,864 | 31,325 | 16 | - |
Fidelity Consumer Staples Portfolio | - | 781,194 | 345,985 | 6,416 | 413,214 |
Fidelity Contrafund | - | 1,090,457 | - | 1,221 | 1,112,860 |
Fidelity Corporate Bond Fund | - | 3,630,592 | 5,556 | 36,437 | 3,623,807 |
Fidelity Disciplined Equity Fund | - | 1,765,756 | - | 32,094 | 1,806,653 |
Affiliate | Value,
beginning of
period | Purchases | Sales
Proceeds | Dividend
Income | Value,
end of
period |
Fidelity Diversified International Fund | $ - | $ 1,394,602 | $ 387,928 | $ 3,817 | $ 1,051,203 |
Fidelity Electronics Portfolio | - | 26,501 | 29,413 | 1 | - |
Fidelity Emerging Asia Fund | - | 27,412 | 25,546 | - | - |
Fidelity Emerging Europe, Middle East, Africa (EMEA) Fund | - | 27,425 | 24,412 | 13 | 932 |
Fidelity Emerging Markets Discovery Fund | - | 73,457 | 36,847 | 225 | 33,135 |
Fidelity Emerging Markets Fund | - | 198,034 | 34,570 | 112 | 160,167 |
Fidelity Energy Portfolio | - | 311,385 | - | 1,774 | 289,435 |
Fidelity Energy Service Portfolio | - | 665,072 | 592,520 | 184 | 88,968 |
Fidelity Equity-Income Fund | - | 1,337,119 | 1,117,405 | 6,197 | 270,886 |
Fidelity Europe Capital Appreciation Fund | - | 5,087 | - | 87 | 5,696 |
Fidelity Europe Fund | - | 1,995,383 | - | 28,204 | 2,183,567 |
Fidelity Financial Services Portfolio | - | 99,136 | - | 840 | 102,376 |
Fidelity Floating Rate High Income Fund | - | 239,777 | - | 3,250 | 240,294 |
Fidelity Focused Stock Fund | - | 89,084 | 88,536 | - | - |
Fidelity Growth & Income Portfolio | - | 1,029,506 | 1,105,709 | 4,899 | - |
Fidelity Growth Discovery Fund | - | 2,125,133 | 2,165,487 | - | - |
Fidelity Health Care Portfolio | - | 939,118 | - | 1 | 961,354 |
Fidelity High Income Fund | - | 147,886 | - | 676 | 147,660 |
Fidelity Industrial Equipment Portfolio | - | 252,237 | - | 1,387 | 262,007 |
Fidelity Industrials Portfolio | - | 1,264,980 | - | 5,867 | 1,343,952 |
Fidelity Insurance Portfolio | - | 631,305 | 23,557 | 3,968 | 636,498 |
Fidelity Intermediate Bond Fund | - | 2,003,339 | 2,007,644 | 6,532 | - |
Fidelity International Discovery Fund | - | 3,425,511 | 116,266 | 38,232 | 3,532,493 |
Fidelity International Small Cap Fund | - | 2,231,899 | 393,764 | 6,520 | 1,948,358 |
Fidelity International Small Cap Opportunities Fund | - | 496,410 | - | 3,484 | 541,201 |
Fidelity International Value Fund | - | 445,682 | 438,682 | - | - |
Fidelity Investment Grade Bond Fund | - | 434,509 | 420,240 | 2,784 | - |
Fidelity Japan Smaller Companies Fund | - | 1,232,338 | 253,134 | 1,186 | 961,008 |
Fidelity Large Cap Growth Fund | - | 17,933 | 18,743 | - | - |
Fidelity Large Cap Stock Fund | - | 2,958,990 | 558,519 | 16,012 | 2,648,195 |
Fidelity Large Cap Value Enhanced Index Fund | - | 109,892 | 121,305 | 423 | - |
Fidelity Leveraged Company Stock Fund | - | 79,348 | 90,271 | 348 | - |
Fidelity Low-Priced Stock Fund | - | 1,731,244 | - | 6,817 | 1,813,267 |
Fidelity Materials Portfolio | - | 172,178 | - | 870 | 181,107 |
Fidelity Medical Equipment & Systems Portfolio | - | 68,958 | - | - | 76,837 |
Fidelity Mega Cap Stock Fund | - | 2,537,376 | 1,190,330 | 11,816 | 1,423,614 |
Fidelity Mid Cap Value Fund | - | 563,278 | - | 5,806 | 579,054 |
Fidelity Multimedia Portfolio | - | 349,547 | 267,575 | 221 | 98,463 |
Fidelity New Millennium Fund | - | 1,134,912 | - | 4,673 | 1,177,807 |
Fidelity Nordic Fund | - | 1,140,342 | - | 21,350 | 1,224,918 |
Fidelity OTC Portfolio | - | 1,249,748 | 866,409 | 534 | 405,892 |
Fidelity Pacific Basin Fund | - | 13,851 | - | 77 | 13,632 |
Fidelity Pharmaceuticals Portfolio | - | 322,202 | - | 2,227 | 330,992 |
Fidelity Real Estate Income Fund | - | 50,251 | 48,884 | 391 | 1,485 |
Fidelity Real Estate Investment Portfolio | - | 136,301 | 130,060 | 445 | 4,418 |
Fidelity Small Cap Enhanced Index Fund | - | 170,021 | 133,351 | 307 | 58,106 |
Fidelity Small Cap Growth Fund | - | 993,307 | 309,454 | - | 701,386 |
Fidelity Small Cap Value Fund | - | 808,311 | 105,957 | 1,761 | 722,853 |
Fidelity Software & Computer Services Portfolio | - | 622,744 | - | - | 692,186 |
Fidelity Technology Portfolio | - | 573,543 | - | 564 | 582,773 |
Fidelity Telecommunications Portfolio | - | 50,295 | 50,393 | 295 | 5,918 |
Fidelity Total Bond Fund | - | 15,716,118 | 568,275 | 129,285 | 14,965,343 |
Fidelity Transportation Portfolio | - | 289,063 | - | 679 | 304,946 |
Fidelity Value Fund | - | 1,500,456 | 580,611 | 13,425 | 1,027,270 |
Fidelity Wireless Portfolio | - | 239,680 | 251,795 | - | - |
Spartan U.S. Bond Index Fund Investor Class | - | 116,027 | 117,330 | 369 | - |
Total | $ - | $ 72,691,858 | $ 18,325,237 | $ 430,463 | $ 56,255,690 |
Other Information |
The following is a summary of the inputs used, as of December 31, 2013, involving the Fund's assets and liabilities carried at fair value. The inputs or methodology used for valuing securities may not be an indication of the risk associated with investing in those securities. For more information on valuation inputs, and their aggregation into the levels used in the table below, please refer to the Investment Valuation section in the accompanying Notes to Financial Statements. |
Valuation Inputs at Reporting Date: |
Description | Total | Level 1 | Level 2 | Level 3 |
Investments in Securities: | | | | |
Equity Funds | $ 39,324,127 | $ 39,324,127 | $ - | $ - |
Fixed-Income Funds | 19,915,212 | 19,915,212 | - | - |
U.S. Treasury Obligations | 149,998 | - | 149,998 | - |
Total Investments in Securities: | $ 59,389,337 | $ 59,239,339 | $ 149,998 | $ - |
Derivative Instruments: | | | | |
Assets | | | | |
Futures Contracts | $ 105,364 | $ 105,364 | $ - | $ - |
Value of Derivative Instruments |
The following table is a summary of the Fund's value of derivative instruments by primary risk exposure as of December 31, 2013. For additional information on derivative instruments, please refer to the Derivative Instruments section in the accompanying Notes to Financial Statements. |
Primary Risk Exposure /
Derivative Type | Value |
| Asset | Liability |
Equity Risk | | |
Futures Contracts (a) | $ 105,364 | $ - |
Total Value of Derivatives | $ 105,364 | $ - |
(a) Reflects gross cumulative appreciation (depreciation) on futures contracts as presented in the Schedule of Investments. Only the period end receivable or payable for daily variation margin and net unrealized appreciation (depreciation) are presented in the Statement of Assets and Liabilities. |
See accompanying notes which are an integral part of the financial statements.
Annual Report
Statement of Assets and Liabilities
| December 31, 2013 |
| | |
Assets | | |
Investment in securities, at value - See accompanying schedule: Unaffiliated issuers (cost $3,031,443) | $ 3,133,647 | |
Affiliated underlying funds (cost $54,676,416) | 56,255,690 | |
Total Investments (cost $57,707,859) | | $ 59,389,337 |
Cash | | 3,844,812 |
Receivable for investments sold | | 11,702 |
Receivable for fund shares sold | | 502,676 |
Dividends receivable | | 4,992 |
Interest receivable | | 46 |
Receivable for daily variation margin for derivative instruments | | 11,875 |
Total assets | | 63,765,440 |
| | |
Liabilities | | |
Payable for investments purchased | $ 462,054 | |
Payable for fund shares redeemed | 30,711 | |
Accrued management fee | 12,345 | |
Distribution and service plan fees payable | 7,056 | |
Other affiliated payables | 397 | |
Total liabilities | | 512,563 |
| | |
Net Assets | | $ 63,252,877 |
Net Assets consist of: | | |
Paid in capital | | $ 60,767,835 |
Undistributed net investment income | | 13,465 |
Accumulated undistributed net realized gain (loss) on investments | | 684,735 |
Net unrealized appreciation (depreciation) on investments | | 1,786,842 |
Net Assets | | $ 63,252,877 |
Statement of Assets and Liabilities - continued
| December 31, 2013 |
| | |
Service Class:
Net Asset Value, offering price and redemption price per share ($2,802,115 ÷ 250,301 shares) | | $ 11.19 |
| | |
Service Class 2:
Net Asset Value, offering price and redemption price per share ($60,450,762 ÷ 5,405,173 shares) | | $ 11.18 |
See accompanying notes which are an integral part of the financial statements.
Annual Report
Statement of Operations
| For the period February 13, 2013
(commencement of operations) to
December 31, 2013 |
| | |
Investment Income | | |
Dividends from underlying funds: | | |
Unaffiliated | | $ 35,096 |
Affiliated | | 430,463 |
Interest | | 1,116 |
Total income | | 466,675 |
| | |
Expenses | | |
Management fee | $ 62,240 | |
Transfer agent fees | 2,587 | |
Distribution and service plan fees | 48,616 | |
Independent trustees' compensation | 61 | |
Total expenses before reductions | 113,504 | |
Expense reductions | (32,461) | 81,043 |
Net investment income (loss) | | 385,632 |
Realized and Unrealized Gain (Loss) Net realized gain (loss) on: | | |
Sale of underlying fund shares: | | |
Unaffiliated | (20,394) | |
Affiliated | 309,100 | |
Realized gain distributions from underlying funds: | | |
Unaffiliated | 5,931 | |
Affiliated | 1,176,889 | |
Futures contracts | 212,081 | |
Total net realized gain (loss) | | 1,683,607 |
Change in net unrealized appreciation (depreciation) on: Investment securities | 1,681,478 | |
Futures contracts | 105,364 | |
Total change in net unrealized appreciation (depreciation) | | 1,786,842 |
Net gain (loss) | | 3,470,449 |
Net increase (decrease) in net assets resulting from operations | | $ 3,856,081 |
Statement of Changes in Net Assets
| For the period
February 13, 2013
(commencement of
operations) to
December 31,
2013 |
Increase (Decrease) in Net Assets | |
Operations | |
Net investment income (loss) | $ 385,632 |
Net realized gain (loss) | 1,683,607 |
Change in net unrealized appreciation (depreciation) | 1,786,842 |
Net increase (decrease) in net assets resulting from operations | 3,856,081 |
Distributions to shareholders from net investment income | (372,167) |
Distributions to shareholders from net realized gain | (998,871) |
Total distributions | (1,371,038) |
Share transactions - net increase (decrease) | 60,767,834 |
Total increase (decrease) in net assets | 63,252,877 |
| |
Net Assets | |
Beginning of period | - |
End of period (including undistributed net investment income of $13,465) | $ 63,252,877 |
See accompanying notes which are an integral part of the financial statements.
Annual Report
Financial Highlights - Service Class
| Period ended
December 31, 2013 F |
Selected Per-Share Data | |
Net asset value, beginning of period | $ 10.00 |
Income from Investment Operations | |
Net investment income (loss) E | .19 |
Net realized and unrealized gain (loss) | 1.26 |
Total from investment operations | 1.45 |
Distributions from net investment income | (.07) |
Distributions from net realized gain | (.18) |
Total distributions | (.26) H |
Net asset value, end of period | $ 11.19 |
Total Return B, C, D | 14.46% |
Ratios to Average Net Assets G | |
Expenses before reductions | .42% A |
Expenses net of fee waivers, if any | .26% A |
Expenses net of all reductions | .26% A |
Net investment income (loss) | 1.98% A |
Supplemental Data | |
Net assets, end of period (000 omitted) | $ 2,802 |
Portfolio turnover rate | 91% A |
A Annualized
B Total returns for periods of less than one year are not annualized.
C Total returns do not reflect charges attributable to your insurance company's separate account. Inclusion of these charges would reduce the total returns shown.
D Total returns would have been lower if certain expenses had not been reduced during the applicable periods shown.
E Calculated based on average shares outstanding during the period.
F For the period February 13, 2013 (commencement of operations) to December 31, 2013.
G Expense ratios reflect operating expenses of the class. Expenses before reductions do not reflect amounts reimbursed by the investment adviser or reductions from brokerage service arrangements or reductions from other expense offset arrangements and do not represent the amount paid by the class during periods when reimbursements or reductions occur. Expense ratios before reductions for start-up periods may not be representative of longer-term operating periods. Expenses net of fee waivers reflect expenses after reimbursement by the investment adviser but prior to reductions from brokerage service arrangements or other expense offset arrangements. Expenses net of all reductions represent the net expenses paid by the class.
H Total distributions of $.26 per share is comprised of distributions from net investment income of $.072 and distributions from net realized gain of $.183 per share.
Financial Highlights - Service Class 2
| Period ended
December 31, 2013 F |
Selected Per-Share Data | |
Net asset value, beginning of period | $ 10.00 |
Income from Investment Operations | |
Net investment income (loss) E | .17 |
Net realized and unrealized gain (loss) | 1.26 |
Total from investment operations | 1.43 |
Distributions from net investment income | (.07) |
Distributions from net realized gain | (.18) |
Total distributions | (.25) |
Net asset value, end of period | $ 11.18 |
Total Return B, C, D | 14.32% |
Ratios to Average Net Assets G | |
Expenses before reductions | .56% A |
Expenses net of fee waivers, if any | .41% A |
Expenses net of all reductions | .40% A |
Net investment income (loss) | 1.83% A |
Supplemental Data | |
Net assets, end of period (000 omitted) | $ 60,451 |
Portfolio turnover rate | 91% A |
A Annualized
B Total returns for periods of less than one year are not annualized.
C Total returns do not reflect charges attributable to your insurance company's separate account. Inclusion of these charges would reduce the total returns shown.
D Total returns would have been lower if certain expenses had not been reduced during the applicable periods shown.
E Calculated based on average shares outstanding during the period.
F For the period February 13, 2013 (commencement of operations) to December 31, 2013.
G Expense ratios reflect operating expenses of the class. Expenses before reductions do not reflect amounts reimbursed by the investment adviser or reductions from brokerage service arrangements or reductions from other expense offset arrangements and do not represent the amount paid by the class during periods when reimbursements or reductions occur. Expense ratios before reductions for start-up periods may not be representative of longer-term operating periods. Expenses net of fee waivers reflect expenses after reimbursement by the investment adviser but prior to reductions from brokerage service arrangements or other expense offset arrangements. Expenses net of all reductions represent the net expenses paid by the class.
See accompanying notes which are an integral part of the financial statements.
Annual Report
Notes to Financial Statements
For the period ended December 31, 2013
1. Organization.
VIP Target Volatility Portfolio (the Fund) is a fund of Variable Insurance Products Fund V (the Trust) and is authorized to issue an unlimited number of shares. The Trust is registered under the Investment Company Act of 1940, as amended (the 1940 Act), as an open-end management investment company organized as a Massachusetts business trust. Shares of the Fund may only be purchased by insurance companies for the purpose of funding variable annuity or variable life insurance contracts. The Fund offers the following classes of shares: Service Class shares and Service Class 2 shares. All classes have equal rights and voting privileges, except for matters affecting a single class.
2. Significant Accounting Policies.
The financial statements have been prepared in conformity with accounting principles generally accepted in the United States of America (GAAP), which require management to make certain estimates and assumptions at the date of the financial statements. Actual results could differ from those estimates. Subsequent events, if any, through the date that the financial statements were issued have been evaluated in the preparation of the financial statements. The Fund's Schedule of Investments lists each underlying mutual fund and exchange-traded fund (ETF)(the Underlying Funds) as an investment of the Fund but does not include the underlying holdings of each Underlying Fund. The following summarizes the significant accounting policies of the Fund:
Investment Valuation. Investments are valued as of 4:00 p.m. Eastern time on the last calendar day of the period. The Fund uses a third party pricing vendor approved by the Board of Trustees (the Board) to value its investments. In accordance with valuation policies and procedures approved by the Board, the Fund attempts to obtain prices from one or more third party pricing vendors or brokers to value its investments. When current market prices, quotations or currency exchange rates are not readily available or reliable, investments will be fair valued in good faith by the Strategic Advisers, Inc. (Strategic Advisers) Fair Value Committee (the Committee), in accordance with procedures adopted by the Board. Factors used in determining fair value vary by investment type and may include market or investment specific events, changes in interest rates and credit quality. The Fund categorizes the inputs to valuation techniques used to value its investments into a disclosure hierarchy consisting of three levels as shown below:
Level 1 - quoted prices in active markets for identical investments
Level 2 - other significant observable inputs (including quoted prices for similar investments, interest rates, prepayment speeds, etc.)
Level 3 - unobservable inputs (including the Fund's own assumptions based on the best information available)
Valuation techniques used to value the Fund's investments by major category are as follows. Investments in open-end mutual funds are valued at their closing net asset value (NAV) each business day and are categorized as Level 1 in the hierarchy. If an unaffiliated open-end mutual fund's NAV is unavailable, shares of that fund may be valued by another method that the Board believes reflects fair value in accordance with the Board's fair value pricing policies and is categorized as Level 2 in the hierarchy. Debt securities, including restricted securities, are valued based on evaluated prices received from third party pricing vendors or brokers who make markets in such securities. For U.S. government and government agency obligations, pricing vendors utilize matrix pricing which considers yield of price of bonds of comparable quality, coupon, maturity and type as well as broker-supplied prices. When independent prices are unavailable or unreliable, debt securities may be valued utilizing pricing methodologies which consider similar factors that would be used by third party pricing vendors. Debt securities are generally categorized as Level 2 in the hierarchy but may be Level 3 depending on the circumstances. ETFs are valued at their last sale price or official closing price as reported by a third party pricing vendor on the primary market or exchange on which they are traded and are categorized as Level 1 in the hierarchy. In the event there were no sales during the day but the exchange reports a closing bid level, ETFs are valued at the closing bid and would be categorized as Level 1 in the hierarchy. In the event there was no closing bid, ETFs may be valued by another method that the Board believes reflects fair value in accordance with the Board's fair value pricing policies and may be categorized as Level 2 in the hierarchy.
Futures contracts are valued at the settlement price established each day by the board of trade or exchange on which they are traded and are categorized as Level 1 in the hierarchy.
Changes in valuation techniques may result in transfers in or out of an assigned level within the disclosure hierarchy. The aggregate value of investments by input level, as of December 31, 2013, is included at the end of the Fund's Schedule of Investments.
Investment Transactions and Income. For financial reporting purposes, the Fund's investment holdings and NAV include trades executed through the end of the last business day of the period. The NAV per share for processing shareholder transactions is calculated as of the close of business of the New York Stock Exchange (NYSE), normally 4:00 p.m. Eastern time and includes trades executed through the end of the prior business day. Gains and losses on securities sold are determined on the basis of identified cost. Income and capital gain distributions from the Underlying Funds, if any, are recorded on the ex-dividend date. Interest income is accrued as earned. Interest income includes coupon interest and amortization of premium and accretion of discount on debt securities.
Annual Report
Notes to Financial Statements - continued
2. Significant Accounting Policies - continued
Class Allocations and Expenses. Investment income, realized and unrealized capital gains and losses, common expenses of the Fund, and certain fund-level expense reductions, if any, are allocated daily on a pro-rata basis to each class based on the relative net assets of each class to the total net assets of the Fund. Each class differs with respect to transfer agent and distribution and service plan fees incurred. Certain expense reductions may also differ by class. For the reporting period, the allocated portion of income and expenses to each class as a percent of its average net assets may vary due to the timing of recording these transactions in relation to fluctuating net assets of the classes. Expenses directly attributable to a fund are charged to that fund. Expenses attributable to more than one fund are allocated among the respective funds on the basis of relative net assets or other appropriate methods. Expenses included in the accompanying financial statements reflect the expenses of the Fund and do not include any expenses associated with the Underlying Funds. Although not included in the Fund's expenses, the Fund indirectly bears its proportionate share of the Underlying Funds' expenses through the impact of these expenses on each Underlying Fund's NAV. Expense estimates are accrued in the period to which they relate and adjustments are made when actual amounts are known.
Income Tax Information and Distributions to Shareholders. Each year, the Fund intends to qualify as a regulated investment company under Subchapter M of the Internal Revenue Code, including distributing substantially all of its taxable income and realized gains. As a result, no provision for U.S. Federal income taxes is required. As of December 31, 2013, the Fund did not have any unrecognized tax benefits in the financial statements; nor is the Fund aware of any tax positions for which it is reasonably possible that the total amounts of unrecognized tax benefits will significantly change in the next twelve months. The Fund files a U.S. federal tax return, in addition to state and local tax returns as required. The Fund's federal income tax returns are subject to examination by the Internal Revenue Service (IRS) for a period of three fiscal years after they are filed. State and local tax returns may be subject to examination for an additional fiscal year depending on the jurisdiction.
Distributions are declared and recorded on the ex-dividend date. Income dividends and capital gain distributions are declared separately for each class. Income and capital gain distributions are determined in accordance with income tax regulations, which may differ from GAAP.
Capital accounts within the financial statements are adjusted for permanent book-tax differences. These adjustments have no impact on net assets or the results of operations. Capital accounts are not adjusted for temporary book-tax differences which will reverse in a subsequent period.
Book-tax differences are primarily due to short-term gain distributions from the Underlying Funds, futures contracts and losses deferred due to wash sales.
The federal tax cost of investment securities and unrealized appreciation (depreciation) as of period end were as follows:
Gross unrealized appreciation | $ 1,960,868 |
Gross unrealized depreciation | (300,840) |
Net unrealized appreciation (depreciation) on securities and other investments | $ 1,660,028 |
| |
Tax Cost | $ 57,729,309 |
The tax-based components of distributable earnings as of period end were as follows:
Undistributed ordinary income | $ 211,192 |
Undistributed long-term capital gain | $ 613,824 |
Net unrealized appreciation (depreciation) | $ 1,660,028 |
The tax character of distributions paid was as follows:
| December 31, 2013 |
Ordinary Income | $ 999,873 |
Long-term Capital Gains | 371,165 |
Total | $ 1,371,038 |
3. Derivative Instruments.
Risk Exposures and the Use of Derivative Instruments. The Fund's investment objective allows the Fund to enter into various types of derivative contracts, including futures contracts. Derivatives are investments whose value is primarily derived from underlying assets, indices or reference rates and may be transacted on an exchange or over-the-counter (OTC). Derivatives may involve a future commitment to buy or sell a specified asset based on specified terms, to exchange future cash flows at periodic intervals based on a notional principal amount, or for one party to make one or more payments upon the occurrence of specified events in exchange for periodic payments from the other party.
Annual Report
3. Derivative Instruments - continued
Risk Exposures and the Use of Derivative Instruments - continued
The Fund used derivatives to increase returns and to manage exposure to certain risks as defined below. The success of any strategy involving derivatives depends on analysis of numerous economic factors, and if the strategies for investment do not work as intended, the Fund may not achieve its objectives.
The Fund's use of derivatives increased or decreased its exposure to the following risk:
Equity Risk | Equity risk relates to the fluctuations in the value of financial instruments as a result of changes in market prices (other than those arising from interest rate risk or foreign exchange risk), whether caused by factors specific to an individual investment, its issuer, or all factors affecting all instruments traded in a market or market segment. |
The Fund is also exposed to additional risks from investing in derivatives, such as liquidity risk and counterparty credit risk. Liquidity risk is the risk that the Fund will be unable to close out the derivative in the open market in a timely manner. Counterparty credit risk is the risk that the counterparty will not be able to fulfill its obligation to the Fund. Counterparty credit risk related to exchange-traded futures contracts may be mitigated by the protection provided by the exchange on which they trade.
Investing in derivatives may involve greater risks than investing in the underlying assets directly and, to varying degrees, may involve risk of loss in excess of any initial investment and collateral received and amounts recognized in the Statement of Assets and Liabilities. In addition, there may be the risk that the change in value of the derivative contract does not correspond to the change in value of the underlying instrument.
Futures Contracts. A futures contract is an agreement between two parties to buy or sell a specified underlying instrument for a fixed price at a specified future date. The Fund used futures contracts to manage its exposure to the stock market.
Upon entering into a futures contract, a fund is required to deposit either cash or securities (initial margin) with a clearing broker in an amount equal to a certain percentage of the face value of the contract. Futures contracts are marked-to-market daily and subsequent daily payments (variation margin) are made or received by a fund depending on the daily fluctuations in the value of the futures contracts and are recorded as unrealized appreciation or (depreciation). This receivable and/or payable, if any, is included in daily variation margin for derivative instruments in the Statement of Assets and Liabilities. Realized gain or (loss) is recorded upon the expiration or closing of a futures contract.
Any open futures contracts at period end are presented in the Schedule of Investments under the caption "Futures Contracts." The underlying face amount at value reflects each contract's exposure to the underlying instrument or index at period end and is representative of volume of activity during the period. Securities deposited to meet initial margin requirements are identified in the Schedule of Investments.
During the period the Fund recognized net realized gain (loss) of $212,081 and a change in net unrealized appreciation (depreciation) of $105,364 related to its investment in futures contracts. These amounts are included in the Statement of Operations.
4. Purchases and Sales of Investments.
Purchases and redemptions of the Underlying Fund shares aggregated $76,814,159 and $19,545,657, respectively.
5. Fees and Other Transactions with Affiliates.
Management Fee. Strategic Advisers, Inc. (the investment adviser), an affiliate of Fidelity Management & Research Company (FMR), provides the Fund with investment management related services. For these services the Fund pays a monthly management fee to the investment adviser. The management fee is computed at an annual rate of .30% of the Fund's average net assets.
During the period, the investment adviser waived a portion of its management fee as described in the Expense Reductions note.
Other Transactions. The investment adviser has entered into an administration agreement with FMR under which FMR provides management and administrative services (other than investment advisory services) necessary for the operation of the Fund. Pursuant to this agreement, FMR pays all expenses of the Fund, excluding the distribution and service fees, the transfer agent fees, the compensation of the independent Trustees and certain other expenses such as interest expense. FMR also contracts with other Fidelity companies to perform the services necessary for the operation of the Fund.
Distribution and Service Plan Fees. In accordance with Rule 12b-1 of the 1940 Act, the Fund has adopted separate 12b-1 Plans for each Service Class of shares. Each Service Class pays Fidelity Distributors Corporation (FDC), an affiliate of the investment adviser, a service fee. For the period, the service fee is based on an annual rate of .10% of Service Class' average net assets and .25% of Service Class 2's average net assets.
Annual Report
Notes to Financial Statements - continued
5. Fees and Other Transactions with Affiliates - continued
Distribution and Service Plan Fees - continued
For the period, total fees, all of which were re-allowed to insurance companies for the distribution of shares and providing shareholder support services were as follows:
Service Class | $ 2,344 |
Service Class 2 | 46,272 |
| $ 48,616 |
Transfer Agent Fees. Fidelity Investments Institutional Operations Company, Inc. (FIIOC), an affiliate of the investment adviser, is the Fund's transfer, dividend disbursing, and shareholder servicing agent. FIIOC receives an asset-based fee with respect to each class. Each class pays a transfer agent fee, excluding out of pocket expenses, equal to an annual rate of .15% of average net assets invested in Underlying Funds that are not managed by the investment adviser or its affiliates. In addition, FIIOC receives an asset-based fee of .0035% of average net assets for typesetting, printing and mailing of shareholder reports, except proxy statements. FIIOC voluntarily agreed to reimburse or waive this fee for the period February 13, 2013 through December 31, 2013 (see Expense Reductions note). For the period, transfer agent fees for each class, including printing and out of pocket expenses, were as follows:
Service Class | $ 403 |
Service Class 2 | 2,184 |
| $ 2,587 |
Effective February 1, 2014, the Board of Trustees approved an amendment to the transfer agent fee agreement whereby each class pays a single fee of .15% of average net assets invested in Underlying Funds that are not managed by the investment adviser or its affiliates for transfer agent services, typesetting, printing and mailing of shareholder reports, excluding mailing of proxy statements and out of pocket expenses.
6. Committed Line of Credit.
The Fund participates with other funds managed by the investment adviser or an affiliate in a $4.25 billion credit facility (the "line of credit") to be utilized for temporary or emergency purposes to fund shareholder redemptions or for other short-term liquidity purposes. The Fund has agreed to pay commitment fees on its pro-rata portion of the line of credit, which amounted to less than $1 and is reflected in Miscellaneous expenses on the Statement of Operations. During the period, there were no borrowings on this line of credit.
7. Expense Reductions.
The investment adviser contractually agreed to waive the Fund's management fee in an amount equal to .05% of the Fund's average net assets until April 30, 2014. During the period, the Fund's management fee was reduced by $10,426.
The investment adviser or its affiliates agreed to reimburse or waive certain fees during the period as noted in the table below.
Service Class | $ 84 |
Service Class 2 | 666 |
| $ 750 |
In addition, FMR has contractually agreed to reimburse .10% of class-level expenses for Service Class and Service Class 2. During the period, this reimbursement reduced the Fund's Service Class and Service Class 2's expenses by the following amounts:
Service Class | $ 2,344 |
Service Class 2 | 18,698 |
Commissions paid to certain brokers with whom the investment adviser, or its affiliates, places trades on behalf of the Fund include an amount in addition to trade execution, which may be rebated back to the Fund to offset certain expenses. This amount totaled $215 for the period. In addition, through arrangements with the Fund's custodian, credits realized as a result of uninvested cash balances were used to reduce the Fund's expenses. During the period, these credits reduced the Fund's custody expenses by $28.
Annual Report
8. Distributions to Shareholders.
Distributions to shareholders of each class were as follows:
Years ended December 31, | 2013A |
From net investment income | |
Service Class | $ 18,021 |
Service Class 2 | 354,146 |
Total | $ 372,167 |
From net realized gain | |
Service Class | $ 45,803 |
Service Class 2 | 953,068 |
Total | $ 998,871 |
A For the period February 13, 2013 (commencement of operations) to December 31, 2013.
9. Share Transactions.
Transactions for each class of shares were as follows:
| Shares | Dollars |
Years ended December 31, | 2013 A | 2013 A |
Service Class | | |
Shares sold | 250,295 | $ 2,503,060 |
Reinvestment of distributions | 5,724 | 63,824 |
Shares redeemed | (5,718) | (63,869) |
Net increase (decrease) | 250,301 | $ 2,503,015 |
Service Class 2 | | |
Shares sold | 5,531,253 | $ 59,610,791 |
Reinvestment of distributions | 117,344 | 1,307,214 |
Shares redeemed | (243,424) | (2,653,186) |
Net increase (decrease) | 5,405,173 | $ 58,264,819 |
A For the period February 13, 2013 (commencement of operations) to December 31, 2013.
10. Other.
The Fund's organizational documents provide former and current trustees and officers with a limited indemnification against liabilities arising in connection with the performance of their duties to the Fund. In the normal course of business, the Fund may also enter into contracts that provide general indemnifications. The Fund's maximum exposure under these arrangements is unknown as this would be dependent on future claims that may be made against the Fund. The risk of material loss from such claims is considered remote.
At the end of the period, one otherwise unaffiliated shareholder was the owner of record of 87% of the total outstanding shares of the Fund.
Annual Report
Report of Independent Registered Public Accounting Firm
To the Trustees of Variable Insurance Products Fund V and the Shareholders of VIP Target Volatility Portfolio:
In our opinion, the accompanying statement of assets and liabilities, including the schedule of investments, and the related statements of operations and of changes in net assets and the financial highlights present fairly, in all material respects, the financial position of VIP Target Volatility Portfolio (a fund of Variable Insurance Products Fund V) at December 31, 2013, and the results of its operations, the changes in its net assets and the financial highlights for the period from February 13, 2013 (commencement of operations) to December 31, 2013, in conformity with accounting principles generally accepted in the United States of America. These financial statements and financial highlights (hereafter referred to as "financial statements") are the responsibility of the VIP Target Volatility Portfolio's management. Our responsibility is to express an opinion on these financial statements based on our audit. We conducted our audit of these financial statements in accordance with the standards of the Public Company Accounting Oversight Board (United States). Those standards require that we plan and perform the audit to obtain reasonable assurance about whether the financial statements are free of material misstatement. An audit includes examining, on a test basis, evidence supporting the amounts and disclosures in the financial statements, assessing the accounting principles used and significant estimates made by management, and evaluating the overall financial statement presentation. We believe that our audit, which included confirmation of securities at December 31, 2013 by correspondence with the custodian and brokers, provide a reasonable basis for our opinion.
PricewaterhouseCoopers LLP
Boston, Massachusetts
February 19, 2014
Annual Report
The Trustees and officers of the trust and fund, as applicable, are listed below. The Board of Trustees governs VIP Target Volatility Portfolio and is responsible for protecting the interests of shareholders. The Trustees are experienced executives who meet periodically throughout the year to oversee VIP Target Volatility Portfolio's activities, review contractual arrangements with companies that provide services to VIP Target Volatility Portfolio, oversee management of the risks associated with such activities and contractual arrangements, and review VIP Target Volatility Portfolio's performance. If the interests of VIP Target Volatility Portfolio and an underlying Fidelity fund were to diverge, a conflict of interest could arise and affect how the Trustees fulfill their fiduciary duties to the affected funds. Strategic Advisers has structured VIP Target Volatility Portfolio to avoid these potential conflicts, although there may be situations where a conflict of interest is unavoidable. In such instances, Strategic Advisers and the Trustees would take reasonable steps to minimize and, if possible, eliminate the conflict. Except for Elizabeth S. Acton and James C. Curvey, each of the Trustees oversees 223 funds. Ms. Acton oversees 205 funds. Mr. Curvey oversees 396 funds.
The Trustees hold office without limit in time except that (a) any Trustee may resign; (b) any Trustee may be removed by written instrument, signed by at least two-thirds of the number of Trustees prior to such removal; (c) any Trustee who requests to be retired or who has become incapacitated by illness or injury may be retired by written instrument signed by a majority of the other Trustees; and (d) any Trustee may be removed at any special meeting of shareholders by a two-thirds vote of the outstanding voting securities of the trust. Each Trustee who is not an interested person (as defined in the 1940 Act) of the trust and the fund (Independent Trustee), shall retire not later than the last day of the month in which his or her 75th birthday occurs. The Independent Trustees may waive this mandatory retirement age policy with respect to individual Trustees. The officers hold office without limit in time, except that any officer may resign or may be removed by a vote of a majority of the Trustees at any regular meeting or any special meeting of the Trustees. Except as indicated, each individual has held the office shown or other offices in the same company for the past five years.
Experience, Skills, Attributes, and Qualifications of the Fund's Trustees. The Governance and Nominating Committee has adopted a statement of policy that describes the experience, qualifications, attributes, and skills that are necessary and desirable for potential Independent Trustee candidates (Statement of Policy). The Board believes that each Trustee satisfied at the time he or she was initially elected or appointed a Trustee, and continues to satisfy, the standards contemplated by the Statement of Policy. The Governance and Nominating Committee also engages professional search firms to help identify potential Independent Trustee candidates who have the experience, qualifications, attributes, and skills consistent with the Statement of Policy. From time to time, additional criteria based on the composition and skills of the current Independent Trustees, as well as experience or skills that may be appropriate in light of future changes to board composition, business conditions, and regulatory or other developments, have also been considered by the professional search firms and the Governance and Nominating Committee. In addition, the Board takes into account the Trustees' commitment and participation in Board and committee meetings, as well as their leadership of standing and ad hoc committees throughout their tenure.
In determining that a particular Trustee was and continues to be qualified to serve as a Trustee, the Board has considered a variety of criteria, none of which, in isolation, was controlling. The Board believes that, collectively, the Trustees have balanced and diverse experience, qualifications, attributes, and skills, which allow the Board to operate effectively in governing the fund and protecting the interests of shareholders. Information about the specific experience, skills, attributes, and qualifications of each Trustee, which in each case led to the Board's conclusion that the Trustee should serve (or continue to serve) as a trustee of the fund, is provided below.
Board Structure and Oversight Function. Abigail P. Johnson is an interested person (as defined in the 1940 Act) and currently serves as Chairman. The Trustees have determined that an interested Chairman is appropriate and benefits shareholders because an interested Chairman has a personal and professional stake in the quality and continuity of services provided to the fund. Independent Trustees exercise their informed business judgment to appoint an individual of their choosing to serve as Chairman, regardless of whether the Trustee happens to be independent or a member of management. The Independent Trustees have determined that they can act independently and effectively without having an Independent Trustee serve as Chairman and that a key structural component for assuring that they are in a position to do so is for the Independent Trustees to constitute a substantial majority for the Board. The Independent Trustees also regularly meet in executive session. Albert R. Gamper, Jr. serves as Chairman of the Independent Trustees and as such (i) acts as a liaison between the Independent Trustees and management with respect to matters important to the Independent Trustees and (ii) with management prepares agendas for Board meetings.
Fidelity funds are overseen by different Boards of Trustees. The fund's Board oversees Fidelity's investment-grade bond, money market, and asset allocation funds and another Board oversees Fidelity's equity and high income funds. The asset allocation funds may invest in Fidelity funds that are overseen by such other Board. The use of separate Boards, each with its own committee structure, allows the Trustees of each group of Fidelity funds to focus on the unique issues of the funds they oversee, including common research, investment, and operational issues. On occasion, the separate Boards establish joint committees to address issues of overlapping consequences for the Fidelity funds overseen by each Board.
The Trustees operate using a system of committees to facilitate the timely and efficient consideration of all matters of importance to the Trustees, the fund, and fund shareholders and to facilitate compliance with legal and regulatory requirements and oversight of the fund's activities and associated risks. The Board, acting through its committees, has charged FMR and its affiliates with (i) identifying events or circumstances the occurrence of which could have demonstrably adverse effects on the fund's business and/or reputation; (ii) implementing processes and controls to lessen the possibility that such events or circumstances occur or to mitigate the effects of such events or circumstances if they do occur; and (iii) creating and maintaining a system designed to evaluate continuously business and market conditions in order to facilitate the identification and implementation processes described in (i) and (ii) above. Because the day-to-day operations and activities of the fund are carried out by or through FMR, its affiliates, and other service providers, the fund's exposure to risks is mitigated but not eliminated by the processes overseen by the Trustees. While each of the Board's committees has responsibility for overseeing different aspects of the fund's activities, oversight is exercised primarily through the Operations and Audit Committees. In addition, an ad hoc Board committee of Independent Trustees has worked with FMR to enhance the Board's oversight of investment and financial risks, legal and regulatory risks, technology risks, and operational risks, including the development of additional risk reporting to the Board. Appropriate personnel, including but not limited to the fund's Chief Compliance Officer (CCO), FMR's internal auditor, the independent accountants, the fund's Treasurer and portfolio management personnel, make periodic reports to the Board's committees, as appropriate, including an annual review of FMR's risk management program for the Fidelity funds. The responsibilities of each standing committee, including their oversight responsibilities, are described further under "Standing Committees of the Fund's Trustees."
Annual Report
The fund's Statement of Additional Information (SAI) includes more information about the Trustees. To request a free copy, call Fidelity at 1-877-208-0098.
Interested Trustees*:
Correspondence intended for each Trustee who is an interested person may be sent to Fidelity Investments, 245 Summer Street, Boston, Massachusetts 02210.
Name, Year of Birth; Principal Occupations and Other Relevant Experience+ |
James C. Curvey (1935) |
Year of Election or Appointment: 2007 Trustee |
| Mr. Curvey also serves as Trustee of other Fidelity funds. Mr. Curvey is a Director of Fidelity Investments Money Management, Inc. (2009-present), Director of Fidelity Research & Analysis Co. (2009-present) and Director of FMR and FMR Co., Inc. (2007-present). Mr. Curvey is also Vice Chairman (2007-present) and Director of FMR LLC. In addition, Mr. Curvey serves as an Overseer for the Boston Symphony Orchestra and a member of the Trustees of Villanova University. Previously, Mr. Curvey was the Vice Chairman (2006-2007) and Director (2000-2007) of FMR Corp. |
Abigail P. Johnson (1961) |
Year of Election or Appointment: 2009 Trustee Chairman of the Board of Trustees |
| Ms. Johnson also serves as Trustee of other Fidelity funds. Ms. Johnson serves as President of FMR LLC (2013-present), President of Fidelity Financial Services (2012-present) and President of Personal, Workplace and Institutional Services (2005-present). Ms. Johnson is Chairman and Director of FMR Co., Inc. (2011-present), Chairman and Director of FMR (2011-present), and the Vice Chairman and Director (2007-present) of FMR LLC. Previously, Ms. Johnson served as President and a Director of FMR (2001-2005), a Trustee of other investment companies advised by FMR, Fidelity Investments Money Management, Inc., and FMR Co., Inc. (2001-2005), Senior Vice President of the Fidelity funds (2001-2005), and managed a number of Fidelity funds. Ms. Abigail P. Johnson and Mr. Arthur E. Johnson are not related. |
* Trustees have been determined to be "Interested Trustees" by virtue of, among other things, their affiliation with the trust or various entities under common control with FMR.
+ The information above includes each Trustee's principal occupation during the last five years and other information relating to the experience, attributes, and skills relevant to each Trustee's qualifications to serve as a Trustee, which led to the conclusion that each Trustee should serve as a Trustee for the fund.
Independent Trustees:
Correspondence intended for each Independent Trustee (that is, the Trustees other than the Interested Trustees) may be sent to Fidelity Investments, P.O. Box 55235, Boston, Massachusetts 02205-5235.
Name, Year of Birth; Principal Occupations and Other Relevant Experience+ |
Elizabeth S. Acton (1951) |
Year of Election or Appointment: 2013 Trustee |
| Ms. Acton also serves as Trustee or Member of the Advisory Board of other Fidelity funds. Prior to her retirement in April 2012, Ms. Acton was Executive Vice President, Finance (2011-2012), Executive Vice President, Chief Financial Officer (2002-2011), and Treasurer (2004-2005) of Comerica Incorporated (financial services). Prior to joining Comerica, Ms. Acton held a variety of positions at Ford Motor Company (1983-2002), including Vice President and Treasurer (2000-2002) and Executive Vice President and Chief Financial Officer of Ford Motor Credit Company (1998-2000). Ms. Acton currently serves as a member of the Board of Directors and Audit and Finance Committees of Beazer Homes USA, Inc. (homebuilding, 2012-present). |
Albert R. Gamper, Jr. (1942) |
Year of Election or Appointment: 2006 Trustee Chairman of the Independent Trustees |
| Mr. Gamper also serves as Trustee of other Fidelity funds. Prior to his retirement in December 2004, Mr. Gamper served as Chairman of the Board of CIT Group Inc. (commercial finance). During his tenure with CIT Group Inc. Mr. Gamper served in numerous senior management positions, including Chairman (1987-1989; 1999-2001; 2002-2004), Chief Executive Officer (1987-2004), and President (2002-2003). Mr. Gamper currently serves as a member of the Board of Directors of Public Service Enterprise Group (utilities, 2000-present), a member of the Board of Trustees, Rutgers University (2004-present), and Chairman of the Board of Barnabas Health Care System. Previously, Mr. Gamper served as Vice Chairman of the Independent Trustees of certain Fidelity funds (2011-2012) and as Chairman of the Board of Governors, Rutgers University (2004-2007). |
Robert F. Gartland (1951) |
Year of Election or Appointment: 2010 Trustee |
| Mr. Gartland also serves as Trustee of other Fidelity funds. Mr. Gartland is Chairman and an investor in Gartland and Mellina Group Corp. (consulting, 2009-present). Previously, Mr. Gartland served as a partner and investor of Vietnam Partners LLC (investments and consulting, 2008-2011). Prior to his retirement, Mr. Gartland held a variety of positions at Morgan Stanley (financial services, 1979-2007) including Managing Director (1987-2007). |
Arthur E. Johnson (1947) |
Year of Election or Appointment: 2008 Trustee |
| Mr. Johnson also serves as Trustee of other Fidelity funds. Mr. Johnson serves as a member of the Board of Directors of Eaton Corporation (diversified power management, 2009-present), AGL Resources, Inc. (holding company, 2002-present) and Booz Allen Hamilton (management consulting, 2011-present). Prior to his retirement, Mr. Johnson served as Senior Vice President of Corporate Strategic Development of Lockheed Martin Corporation (defense contractor, 1999-2009). He previously served on the Board of Directors of IKON Office Solutions, Inc. (1999-2008) and Delta Airlines (2005-2007). Mr. Arthur E. Johnson is not related to Ms. Abigail P. Johnson. |
Michael E. Kenneally (1954) |
Year of Election or Appointment: 2009 Trustee |
| Mr. Kenneally also serves as Trustee of other Fidelity funds. Mr. Kenneally served as a Member of the Advisory Board for certain Fidelity funds before joining the Board of Trustees (2008-2009). Prior to his retirement, Mr. Kenneally served as Chairman and Global Chief Executive Officer of Credit Suisse Asset Management. Before joining Credit Suisse, he was an Executive Vice President and Chief Investment Officer for Bank of America Corporation. Earlier roles at Bank of America included Director of Research, Senior Portfolio Manager and Research Analyst, and Mr. Kenneally was awarded the Chartered Financial Analyst (CFA) designation in 1991. |
James H. Keyes (1940) |
Year of Election or Appointment: 2007 Trustee |
| Mr. Keyes also serves as Trustee of other Fidelity funds. Mr. Keyes serves as a member of the Board and Non-Executive Chairman of Navistar International Corporation (manufacture and sale of trucks, buses, and diesel engines, since 2002). Previously, Mr. Keyes served as a member of the Board of Pitney Bowes, Inc. (integrated mail, messaging, and document management solutions, 1998-2013). Prior to his retirement, Mr. Keyes served as Chairman (1993-2002) and Chief Executive Officer (1988-2002) of Johnson Controls (automotive, building, and energy) and as a member of the Board of LSI Logic Corporation (semiconductor technologies, 1984-2008). |
Marie L. Knowles (1946) |
Year of Election or Appointment: 2001 Trustee Vice Chairman of the Independent Trustees |
| Ms. Knowles also serves as Trustee of other Fidelity funds. Prior to Ms. Knowles' retirement in June 2000, she served as Executive Vice President and Chief Financial Officer of Atlantic Richfield Company (ARCO) (diversified energy, 1996-2000). From 1993 to 1996, she was a Senior Vice President of ARCO and President of ARCO Transportation Company. She served as a Director of ARCO from 1996 to 1998. Ms. Knowles currently serves as a Director and Chairman of the Audit Committee of McKesson Corporation (healthcare service, since 2002). Ms. Knowles is a member of the Board of the Catalina Island Conservancy and of the Santa Catalina Island Company (2009-present). She also serves as a member of the Advisory Board for the School of Engineering of the University of Southern California. Previously, Ms. Knowles served as a Director of Phelps Dodge Corporation (copper mining and manufacturing, 1994-2007), URS Corporation (engineering and construction, 2000-2003) and America West (airline, 1999-2002). |
Kenneth L. Wolfe (1939) |
Year of Election or Appointment: 2005 Trustee |
| Mr. Wolfe also serves as Trustee of other Fidelity funds. Prior to his retirement, Mr. Wolfe served as Chairman and a Director (2007-2009) and Chairman and Chief Executive Officer (1994-2001) of Hershey Foods Corporation. He also served as a member of the Boards of Adelphia Communications Corporation (telecommunications, 2003-2006), Bausch & Lomb, Inc. (medical/pharmaceutical, 1993-2007), and Revlon, Inc. (personal care products, 2004-2009). Mr. Wolfe previously served as Chairman of the Independent Trustees of other Fidelity funds (2008-2012). |
+ The information above includes each Trustee's principal occupation during the last five years and other information relating to the experience, attributes, and skills relevant to each Trustee's qualifications to serve as a Trustee, which led to the conclusion that each Trustee should serve as a Trustee for the fund.
Officers:
Correspondence intended for each officer may be sent to Fidelity Investments, 245 Summer Street, Boston, Massachusetts 02210. Officers appear below in alphabetical order.
Name, Year of Birth; Principal Occupation |
Elizabeth Paige Baumann (1968) |
Year of Election or Appointment: 2012 Anti-Money Laundering (AML) Officer |
| Ms. Baumann also serves as AML Officer of other funds. She is Chief AML Officer of FMR LLC (2012-present) and is an employee of Fidelity Investments. Previously, Ms. Baumann served as Vice President and Deputy Anti-Money Laundering Officer (2007-2012). |
Marc Bryant (1966) |
Year of Election or Appointment: 2013 Assistant Secretary |
| Mr. Bryant also serves as an officer of other funds. He is Senior Vice President and Deputy General Counsel of FMR LLC. Prior to joining Fidelity Investments, Mr. Bryant served as a Senior Vice President and the Head of Global Retail Legal for AllianceBernstein L.P. (2006-2010), and as the General Counsel for ProFund Advisors LLC (2001-2006). |
Jonathan Davis (1968) |
Year of Election or Appointment: 2010 Assistant Treasurer |
| Mr. Davis also serves as Assistant Treasurer of other funds. Mr. Davis is an employee of Fidelity Investments. Previously, Mr. Davis served as Vice President and Associate General Counsel of FMR LLC (2003-2010). |
Adrien E. Deberghes (1967) |
Year of Election or Appointment: 2010 Assistant Treasurer |
| Mr. Deberghes also serves as an officer of other funds. He is an employee of Fidelity Investments (2008-present). Prior to joining Fidelity Investments, Mr. Deberghes was Senior Vice President of Mutual Fund Administration at State Street Corporation (2007-2008), Senior Director of Mutual Fund Administration at Investors Bank & Trust (2005-2007), and Director of Finance for Dunkin' Brands (2000-2005). |
Stephanie J. Dorsey (1969) |
Year of Election or Appointment: 2013 President and Treasurer |
| Ms. Dorsey also serves as an officer of other funds. She is an employee of Fidelity Investments (2008-present) and has served in other fund officer roles. Prior to joining Fidelity Investments, Ms. Dorsey served as Treasurer (2004-2008) of the JPMorgan Mutual Funds and Vice President (2004-2008) of JPMorgan Chase Bank. |
Scott C. Goebel (1968) |
Year of Election or Appointment: 2008 Secretary and Chief Legal Officer (CLO) |
| Mr. Goebel serves as Secretary and CLO of other funds. Mr. Goebel also serves as Secretary of Fidelity Investments Money Management, Inc. (FIMM) (2010-present) and Fidelity Research and Analysis Company (FRAC) (2010-present); General Counsel, Secretary, and Senior Vice President of FMR (2008-present) and FMR Co., Inc. (2008-present); Chief Legal Officer of Fidelity Management & Research (Hong Kong) Limited (2008-present) and Assistant Secretary of Fidelity Management & Research (Japan) Inc. (2008-present), and Fidelity Management & Research (U.K.) Inc. (2008-present). Previously, Mr. Goebel served as Secretary and CLO of other Fidelity funds (2008-2013), Assistant Secretary of FIMM (2008-2010), FRAC (2008-2010), and certain funds (2007-2008); and as Vice President and Secretary of Fidelity Distributors Corporation (FDC) (2005-2007). Mr. Goebel has been employed by FMR LLC or an affiliate since 2001. |
Bruce T. Herring (1965) |
Year of Election or Appointment: 2013 Vice President of Fidelity's Asset Allocation Funds |
| Mr. Herring also serves as Vice President of other funds. He serves as Chief Investment Officer of Fidelity Global Asset Allocation (GAA) (2013-present), Group Chief Investment Officer of FMR, and President of Fidelity Research & Analysis Company (2010-present). Previously, Mr. Herring served as Chief Investment Officer and Director of Fidelity Management & Research (U.K.) Inc. (2010-2013), Vice President (2005-2006) and Senior Vice President (2006-2007) of Fidelity Management & Research Company, Vice President of FMR Co., Inc. (2001-2007), and as a portfolio manager for Fidelity U.S. Equity Funds. |
Chris Maher (1972) |
Year of Election or Appointment: 2013 Assistant Treasurer |
| Mr. Maher serves as Assistant Treasurer of other funds. Mr. Maher is Vice President of Valuation Oversight and is an employee of Fidelity Investments. Previously, Mr. Maher served as Vice President of Asset Management Compliance (2013), Vice President of FMR's Program Management Group (2010-2013), and Vice President of Valuation Oversight (2008-2010). |
Charles S. Morrison (1960) |
Year of Election or Appointment: 2012 Vice President |
| Mr. Morrison also serves as Vice President of other funds. He serves as President, Fixed Income and is an employee of Fidelity Investments. Previously, Mr. Morrison served as Vice President of Fidelity's Money Market Funds (2005-2009), President, Money Market Group Leader of FMR (2009), and Senior Vice President, Money Market Group of FMR (2004-2009). Mr. Morrison also served as Vice President of Fidelity's Bond Funds (2002-2005), certain Balanced Funds (2002-2005), and certain Asset Allocation Funds (2002-2007), and as Senior Vice President (2002-2005) of Fidelity's Fixed Income Division. |
Christine Reynolds (1958) |
Year of Election or Appointment: 2008 Chief Financial Officer |
| Ms. Reynolds also serves as Chief Financial Officer of other funds. Ms. Reynolds became President of Fidelity Pricing and Cash Management Services (FPCMS) in August 2008. Ms. Reynolds served as Chief Operating Officer of FPCMS (2007-2008). Previously, Ms. Reynolds served as President, Treasurer, and Anti-Money Laundering officer of the Fidelity funds (2004-2007). |
Kenneth B. Robins (1969) |
Year of Election or Appointment: 2009 Assistant Treasurer |
| Mr. Robins also serves as an officer of other funds. Mr. Robins serves as Executive Vice President of Fidelity Investments Money Management, Inc. (FIMM) (2013-present) and is an employee of Fidelity Investments (2004-present). Previously, Mr. Robins served in other fund officer roles. |
Gary W. Ryan (1958) |
Year of Election or Appointment: 2005 Assistant Treasurer |
| Mr. Ryan also serves as Assistant Treasurer of other funds. Mr. Ryan is an employee of Fidelity Investments and has served in other fund officer roles. Previously, Mr. Ryan served as Vice President of Fund Reporting in Fidelity Pricing and Cash Management Services (FPCMS) (1999-2005). |
Stephen Sadoski (1971) |
Year of Election or Appointment: 2013 Deputy Treasurer |
| Mr. Sadoski also serves as Deputy Treasurer of other funds. He is an employee of Fidelity Investments (2012-present) and has served in another fund officer role. Prior to joining Fidelity Investments, Mr. Sadoski served as an assistant chief accountant in the Division of Investment Management of the Securities and Exchange Commission (SEC) (2009-2012) and as a senior manager at Deloitte & Touche LLP (1997-2009). |
Stacie M. Smith (1974) |
Year of Election or Appointment: 2013 Assistant Treasurer |
| Ms. Smith also serves as an officer of other funds. She is an employee of Fidelity Investments (2009-present) and has served in other fund officer roles. Prior to joining Fidelity Investments, Ms. Smith served as Senior Audit Manager of Ernst & Young LLP (1996-2009). |
Renee Stagnone (1975) |
Year of Election or Appointment: 2013 Deputy Treasurer |
| Ms. Stagnone also serves as Deputy Treasurer of other funds. Ms. Stagnone is an employee of Fidelity Investments. |
Michael H. Whitaker (1967) |
Year of Election or Appointment: 2008 Chief Compliance Officer |
| Mr. Whitaker also serves as Chief Compliance Officer of other funds. Mr. Whitaker is an employee of Fidelity Investments (2007-present). Prior to joining Fidelity Investments, Mr. Whitaker worked at MFS Investment Management where he served as Senior Vice President and Chief Compliance Officer (2004-2006), and Assistant General Counsel. |
Derek L. Young (1964) |
Year of Election or Appointment: 2009 Vice President of Fidelity's Asset Allocation Funds |
| Mr. Young also serves as Trustee or an officer of other funds. He is President and a Director of Strategic Advisers, Inc. (2011-present), President of Fidelity Global Asset Allocation (GAA) (2011-present), and Vice Chairman of Pyramis Global Advisors, LLC (2011-present). Previously, Mr. Young served as Chief Investment Officer of GAA (2009-2011) and as a portfolio manager. |
Joseph F. Zambello (1957) |
Year of Election or Appointment: 2011 Deputy Treasurer |
| Mr. Zambello also serves as Deputy Treasurer of other funds. Mr. Zambello is an employee of Fidelity Investments. Previously, Mr. Zambello served as Vice President of FMR's Program Management Group (2009-2011) and Vice President of the Transfer Agent Oversight Group (2005-2009). |
Annual Report
The Board of Trustees of VIP Target Volatility Portfolio voted to pay to shareholders of record at the opening of business on record date, the following distributions per share derived from capital gains realized from sales of portfolio securities, and dividends derived from net investment income:
| Pay Date | Record Date | Dividends | Capital Gains |
Service Class | 02/14/14 | 02/14/14 | $0.004 | $0.131 |
Service Class 2 | 02/14/14 | 02/14/14 | $0.004 | $0.131 |
The fund hereby designates as a capital gain dividend with respect to the taxable year ended December 31, 2013, $984,989, or, if subsequently determined to be different, the net capital gain of such year.
Service Class designates 21% and Service Class 2 designates 22% of the dividends distributed in December 2013 respectively, during the fiscal year as qualifying for the dividends-received deduction for corporate shareholders.
The amounts per share which represent income derived from sources within, and taxes paid to, foreign countries or possessions of the United States are as follows:
| Pay Date | Income | Taxes |
Service Class | 12/27/13 | $0.0331 | $0.0019 |
Service Class 2 | 12/27/13 | $0.0324 | $0.0019 |
Annual Report
Investment Adviser
Strategic Advisers, Inc.
Boston, MA
General Distributor
Fidelity Distributors Corporation
Smithfield, RI
Transfer and Service Agents
Fidelity Investments Institutional Operations Company, Inc.
Boston, MA
Fidelity Service Company, Inc.
Boston, MA
Custodian
The Bank of New York Mellon
New York, NY
Administrator
Fidelity Management & Research Company
Boston, MA
VIPTV-ANN-0214
1.955015.100
Item 2. Code of Ethics
As of the end of the period, December 31, 2013, Variable Insurance Products Fund V (the trust) has adopted a code of ethics, as defined in Item 2 of Form N-CSR, that applies to its President and Treasurer and its Chief Financial Officer. A copy of the code of ethics is filed as an exhibit to this Form N-CSR.
Item 3. Audit Committee Financial Expert
The Board of Trustees of the trust has determined that James H. Keyes is an audit committee financial expert, as defined in Item 3 of Form N-CSR. Mr. Keyes is independent for purposes of Item 3 of Form N-CSR.
Item 4. Principal Accountant Fees and Services
Fees and Services
The following table presents fees billed by Deloitte & Touche LLP, the member firms of Deloitte Touche Tohmatsu, and their respective affiliates (collectively, "Deloitte Entities") in each of the last two fiscal years for services rendered to Asset Manager Portfolio, Asset Manager: Growth Portfolio, Freedom 2005 Portfolio, Freedom 2010 Portfolio, Freedom 2015 Portfolio, Freedom 2020 Portfolio, Freedom 2025 Portfolio, Freedom 2030 Portfolio, Freedom 2035 Portfolio, Freedom 2040 Portfolio, Freedom 2045 Portfolio, Freedom 2050 Portfolio, Freedom Income Portfolio, Freedom Lifetime Income I Portfolio, Freedom Lifetime Income II Portfolio, Freedom Lifetime Income III Portfolio and Investment Grade Bond Portfolio (the "Funds"):
Services Billed by Deloitte Entities
December 31, 2013 FeesA
| Audit Fees | Audit-Related Fees | Tax Fees | All Other Fees |
Asset Manager Portfolio | $36,000 | $- | $7,400 | $800 |
Asset Manager: Growth Portfolio | $34,000 | $- | $5,200 | $600 |
Freedom 2005 Portfolio | $22,000 | $- | $4,900 | $500 |
Freedom 2010 Portfolio | $22,000 | $- | $4,700 | $500 |
Freedom 2015 Portfolio | $22,000 | $- | $4,900 | $500 |
Freedom 2020 Portfolio | $22,000 | $- | $4,900 | $500 |
Freedom 2025 Portfolio | $22,000 | $- | $4,900 | $500 |
Freedom 2030 Portfolio | $22,000 | $- | $4,900 | $500 |
Freedom 2035 Portfolio | $21,000 | $- | $4,900 | $500 |
Freedom 2040 Portfolio | $21,000 | $- | $4,900 | $500 |
Freedom 2045 Portfolio | $21,000 | $- | $4,900 | $500 |
Freedom 2050 Portfolio | $21,000 | $- | $4,900 | $500 |
Freedom Income Portfolio | $22,000 | $- | $4,900 | $500 |
Freedom Lifetime Income I Portfolio | $22,000 | $- | $4,900 | $500 |
Freedom Lifetime Income II Portfolio | $22,000 | $- | $4,900 | $500 |
Freedom Lifetime Income III Portfolio | $22,000 | $- | $4,900 | $500 |
Investment Grade Bond Portfolio | $39,000 | $- | $6,000 | $1,100 |
December 31, 2012 FeesA
| Audit Fees | Audit-Related Fees | Tax Fees | All Other Fees |
Asset Manager Portfolio | $31,000 | $- | $6,700 | $500 |
Asset Manager: Growth Portfolio | $30,000 | $- | $4,600 | $400 |
Freedom 2005 Portfolio | $22,000 | $- | $4,600 | $400 |
Freedom 2010 Portfolio | $22,000 | $- | $4,600 | $400 |
Freedom 2015 Portfolio | $22,000 | $- | $4,600 | $400 |
Freedom 2020 Portfolio | $22,000 | $- | $4,600 | $400 |
Freedom 2025 Portfolio | $22,000 | $- | $4,600 | $400 |
Freedom 2030 Portfolio | $22,000 | $- | $4,600 | $400 |
Freedom 2035 Portfolio | $20,000 | $- | $4,600 | $400 |
Freedom 2040 Portfolio | $20,000 | $- | $4,600 | $400 |
Freedom 2045 Portfolio | $20,000 | $- | $4,600 | $400 |
Freedom 2050 Portfolio | $20,000 | $- | $4,600 | $400 |
Freedom Income Portfolio | $22,000 | $- | $4,600 | $400 |
Freedom Lifetime Income I Portfolio | $22,000 | $- | $4,600 | $400 |
Freedom Lifetime Income II Portfolio | $22,000 | $- | $4,600 | $400 |
Freedom Lifetime Income III Portfolio | $22,000 | $- | $4,600 | $400 |
Investment Grade Bond Portfolio | $35,000 | $- | $5,700 | $800 |
A Amounts may reflect rounding.
The following table presents fees billed by PricewaterhouseCoopers LLP ("PwC") in each of the last two fiscal years for services rendered to FundsManager 20% Portfolio, FundsManager 50% Portfolio, FundsManager 60%, FundsManager 70% Portfolio, FundsManager 85% Portfolio, Investor Freedom 2005 Portfolio, Investor Freedom 2010 Portfolio, Investor Freedom 2015 Portfolio, Investor Freedom 2020 Portfolio, Investor Freedom 2025 Portfolio, Investor Freedom 2030 Portfolio, Investor Freedom Income Portfolio, Strategic Income Portfolio and VIP Target Volatility Portfolio (the "Funds"):
Services Billed by PwC
December 31, 2013 FeesA,B
| Audit Fees | Audit-Related Fees | Tax Fees | All Other Fees |
FundsManager 20% Portfolio | $29,000 | $- | $2,700 | $- |
FundsManager 50% Portfolio | $29,000 | $- | $2,700 | $- |
FundsManager 60% Portfolio | $29,000 | $- | $2,700 | $- |
FundsManager 70% Portfolio | $29,000 | $- | $2,700 | $- |
FundsManager 85% Portfolio | $29,000 | $- | $2,700 | $- |
Investor Freedom 2005 Portfolio | $20,000 | $- | $2,900 | $- |
Investor Freedom 2010 Portfolio | $20,000 | $- | $2,900 | $- |
Investor Freedom 2015 Portfolio | $20,000 | $- | $2,900 | $- |
Investor Freedom 2020 Portfolio | $20,000 | $- | $2,900 | $- |
Investor Freedom 2025 Portfolio | $20,000 | $- | $2,900 | $- |
Investor Freedom 2030 Portfolio | $20,000 | $- | $2,900 | $- |
Investor Freedom Income Portfolio | $20,000 | $- | $2,900 | $- |
Strategic Income Portfolio | $78,000 | $- | $3,500 | $1,900 |
VIP Target Volatility Portfolio | $27,000 | $- | $3,100 | $1,200 |
December 31, 2012 FeesA,B
| Audit Fees | Audit-Related Fees | Tax Fees | All Other Fees |
FundsManager 20% Portfolio | $29,000 | $- | $2,600 | $- |
FundsManager 50% Portfolio | $29,000 | $- | $2,600 | $- |
FundsManager 60% Portfolio | $29,000 | $- | $2,600 | $- |
FundsManager 70% Portfolio | $29,000 | $- | $2,600 | $- |
FundsManager 85% Portfolio | $29,000 | $- | $2,600 | $- |
Investor Freedom 2005 Portfolio | $29,000 | $- | $2,600 | $- |
Investor Freedom 2010 Portfolio | $29,000 | $- | $2,600 | $- |
Investor Freedom 2015 Portfolio | $29,000 | $- | $2,600 | $- |
Investor Freedom 2020 Portfolio | $29,000 | $- | $2,600 | $- |
Investor Freedom 2025 Portfolio | $29,000 | $- | $2,600 | $- |
Investor Freedom 2030 Portfolio | $29,000 | $- | $2,600 | $- |
Investor Freedom Income Portfolio | $29,000 | $- | $2,600 | $- |
Strategic Income Portfolio | $74,000 | $- | $3,500 | $2,000 |
VIP Target Volatility Portfolio | $- | $- | $- | $- |
A Amounts may reflect rounding.
B VIP Target Volatility Portfolio commenced operations on February 13, 2013.
The following table presents fees billed by PwC and Deloitte Entities that were required to be approved by the Audit Committee for services that relate directly to the operations and financial reporting of the Funds and that are rendered on behalf of Fidelity Management & Research Company ("FMR") and entities controlling, controlled by, or under common control with FMR (not including any sub-adviser whose role is primarily portfolio management and is subcontracted with or overseen by another investment adviser) that provide ongoing services to the Funds ("Fund Service Providers"):
Services Billed by Deloitte Entities
| December 31, 2013A | December 31, 2012A |
Audit-Related Fees | $765,000 | $910,000 |
Tax Fees | $- | $- |
All Other Fees | $795,000 | $955,000 |
A Amounts may reflect rounding.
Services Billed by PwC
| December 31, 2013A,B | December 31, 2012A,B |
Audit-Related Fees | $4,920,000 | $4,805,000 |
Tax Fees | $- | $- |
All Other Fees | $50,000 | $- |
A Amounts may reflect rounding.
B May include amounts billed prior to the VIP Target Volatility Portfolio's commencement of operations.
"Audit-Related Fees" represent fees billed for assurance and related services that are reasonably related to the performance of the fund audit or the review of the fund's financial statements and that are not reported under Audit Fees.
"Tax Fees" represent fees billed for tax compliance, tax advice or tax planning that relate directly to the operations and financial reporting of the fund.
"All Other Fees" represent fees billed for services provided to the fund or Fund Service Provider, a significant portion of which are assurance related, that relate directly to the operations and financial reporting of the fund, excluding those services that are reported under Audit Fees, Audit-Related Fees or Tax Fees.
Assurance services must be performed by an independent public accountant.
* * *
The aggregate non-audit fees billed by PwC and Deloitte Entities for services rendered to the Funds, FMR (not including any sub-adviser whose role is primarily portfolio management and is subcontracted with or overseen by another investment adviser), and any Fund Service Provider for each of the last two fiscal years of the Funds are as follows:
Billed By | December 31, 2013 A,B | December 31, 2012 A,B,C |
PwC | $5,565,000 | $5,645,000 |
Deloitte Entities | $1,775,000 | $1,985,000 |
A Amounts may reflect rounding.
B May include amounts billed prior to the VIP Target Volatility Portfolio's commencement of operations.
C Reflects current period presentation.
The trust's Audit Committee has considered non-audit services that were not pre-approved that were provided by PwC and Deloitte Entities to Fund Service Providers to be compatible with maintaining the independence of PwC and Deloitte Entities in their audits of the Funds, taking into account representations from PwC and Deloitte Entities, in accordance with Public Company Accounting Oversight Board rules, regarding their independence from the Funds and their related entities and FMR's review of the appropriateness and permissibility under applicable law of such non-audit services prior to their provision to the Fund Service Providers.
Audit Committee Pre-Approval Policies and Procedures
The trust's Audit Committee must pre-approve all audit and non-audit services provided by a fund's independent registered public accounting firm relating to the operations or financial reporting of the fund. Prior to the commencement of any audit or non-audit services to a fund, the Audit Committee reviews the services to determine whether they are appropriate and permissible under applicable law.
The Audit Committee has adopted policies and procedures to, among other purposes, provide a framework for the Committee's consideration of non-audit services by the audit firms that audit the Fidelity funds. The policies and procedures require that any non-audit service provided by a fund audit firm to a Fidelity fund and any non-audit service provided by a fund auditor to a Fund Service Provider that relates directly to the operations and financial reporting of a Fidelity fund ("Covered Service") are subject to approval by the Audit Committee before such service is provided.
All Covered Services must be approved in advance of provision of the service either: (i) by formal resolution of the Audit Committee, or (ii) by oral or written approval of the service by the Chair of the Audit Committee (or if the Chair is unavailable, such other member of the Audit Committee as may be designated by the Chair to act in the Chair's absence). The approval contemplated by (ii) above is permitted where the Treasurer determines that action on such an engagement is necessary before the next meeting of the Audit Committee.
Non-audit services provided by a fund audit firm to a Fund Service Provider that do not relate directly to the operations and financial reporting of a Fidelity fund are reported to the Audit Committee on a periodic basis.
Non-Audit Services Approved Pursuant to Rule 2-01(c)(7)(i)(C) and (ii) of Regulation S-X ("De Minimis Exception")
There were no non-audit services approved or required to be approved by the Audit Committee pursuant to the De Minimis Exception during the Funds' last two fiscal years relating to services provided to (i) the Funds or (ii) any Fund Service Provider that relate directly to the operations and financial reporting of the Funds.
Item 5. Audit Committee of Listed Registrants
Not applicable.
Item 6. Investments
(a) Not applicable.
(b) Not applicable
Item 7. Disclosure of Proxy Voting Policies and Procedures for Closed-End Management Investment Companies
Not applicable.
Item 8. Portfolio Managers of Closed-End Management Investment Companies
Not applicable.
Item 9. Purchase of Equity Securities by Closed-End Management Investment Company and Affiliated Purchasers
Not applicable.
Item 10. Submission of Matters to a Vote of Security Holders
There were no material changes to the procedures by which shareholders may recommend nominees to the trust's Board of Trustees.
Item 11. Controls and Procedures
(a)(i) The President and Treasurer and the Chief Financial Officer have concluded that the disclosure controls and procedures (as defined in Rule 30a-3(c) under the Investment Company Act) for each Fund provide reasonable assurances that material information relating to such Fund is made known to them by the appropriate persons, based on their evaluation of these controls and procedures as of a date within 90 days of the filing date of this report.
(a)(ii) There was no change in a Fund's internal control over financial reporting (as defined in Rule 30a-3(d) under the Investment Company Act) that occurred during the second fiscal quarter of the period covered by this report that has materially affected, or is reasonably likely to materially affect, a Fund's internal control over financial reporting.
Item 12. Exhibits
(a) | (1) | Code of Ethics pursuant to Item 2 of Form N-CSR is filed and attached hereto as EX-99.CODE ETH. |
(a) | (2) | Certification pursuant to Rule 30a-2(a) under the Investment Company Act of 1940 (17 CFR 270.30a-2(a)) is filed and attached hereto as Exhibit 99.CERT. |
(a) | (3) | Not applicable. |
(b) | | Certification pursuant to Rule 30a-2(b) under the Investment Company Act of 1940 (17 CFR 270.30a-2(b)) is furnished and attached hereto as Exhibit 99.906CERT. |
SIGNATURES
Pursuant to the requirements of the Securities Exchange Act of 1934 and the Investment Company Act of 1940, the registrant has duly caused this report to be signed on its behalf by the undersigned, thereunto duly authorized.
Variable Insurance Products Fund V
By: | /s/Stephanie J. Dorsey |
| Stephanie J. Dorsey |
| President and Treasurer |
| |
Date: | February 26, 2014 |
Pursuant to the requirements of the Securities Exchange Act of 1934 and the Investment Company Act of 1940, this report has been signed below by the following persons on behalf of the registrant and in the capacities and on the dates indicated.
By: | /s/Stephanie J. Dorsey |
| Stephanie J. Dorsey |
| President and Treasurer |
| |
Date: | February 26, 2014 |
By: | /s/Christine Reynolds |
| Christine Reynolds |
| Chief Financial Officer |
| |
Date: | February 26, 2014 |