UNITED STATES
SECURITIES AND EXCHANGE COMMISSION
Washington, D.C. 20549
FORM N-CSR
CERTIFIED SHAREHOLDER REPORT OF REGISTERED
MANAGEMENT INVESTMENT COMPANIES
Investment Company Act file number 811-5361
Variable Insurance Products Fund V
(Exact name of registrant as specified in charter)
82 Devonshire St., Boston, Massachusetts 02109
(Address of principal executive offices) (Zip code)
Eric D. Roiter, Secretary
82 Devonshire St.
Boston, Massachusetts 02109
(Name and address of agent for service)
Registrant's telephone number, including area code: 617-563-7000
Date of fiscal year end: | December 31 |
| |
Date of reporting period: | December 31, 2007 |
This report on Form N-CSR relates solely to the Registrant's Asset Manager Portfolio, Asset Manager: Growth Portfolio, Freedom 2005 Portfolio, Freedom 2010 Portfolio, Freedom 2015 Portfolio, Freedom 2020 Portfolio, Freedom 2025 Portfolio, Freedom 2030 Portfolio, Freedom Income Portfolio, Freedom Lifetime Income I Portfolio, Freedom Lifetime Income II Portfolio, Freedom Lifetime Income III Portfolio, FundsManager 20% Portfolio, FundsManager 50% Portfolio, FundsManager 60%, FundsManager 70% Portfolio, FundsManager 85% Portfolio, Investment Grade Bond Portfolio, Investor Freedom 2005 Portfolio, Investor Freedom 2010 Portfolio, Investor Freedom 2015 Portfolio, Investor Freedom 2020 Portfolio, Investor Freedom 2025 Portfolio, Investor Freedom 2030 Portfolio, Investor Freedom Income Portfolio and Strategic Income Portfolio series (each, a "Fund" and collectively, the "Funds").
Item 1. Reports to Stockholders
Fidelity® Variable Insurance Products:
Asset ManagerSM Portfolio
Annual Report
December 31, 2007
(2_fidelity_logos) (Registered_Trademark)
Contents
Performance | <Click Here> | How the fund has done over time. |
Management's Discussion | <Click Here> | The managers' review of fund performance, strategy and outlook. |
Shareholder Expense Example | <Click Here> | An example of shareholder expenses. |
Investment Changes | <Click Here> | A summary of major shifts in the fund's investments over the past six months. |
Investments | <Click Here> | A complete list of the fund's investments with their
market values. |
Financial Statements | <Click Here> | Statements of assets and liabilities, operations, and
changes in net assets, as well as financial highlights. |
Notes | <Click Here> | Notes to the financial statements. |
Report of Independent Registered Public Accounting Firm | <Click Here> | |
Trustees and Officers | <Click Here> | |
Distributions | <Click Here> | |
Board Approval of Investment Advisory Contracts and Management Fees | <Click Here> | |
To view a fund's proxy voting guidelines and proxy voting record for the 12-month period ended June 30, visit http://www.fidelity.com (search for "proxy voting guidelines") or visit the Securities and Exchange Commission's (SEC) web site at http://www.sec.gov. You may also call 1-877-208-0098 to request a free copy of the proxy voting guidelines.
Fidelity Variable Insurance Products are separate account options which are purchased through a variable insurance contract.
Standard & Poor's, S&P and S&P 500 are registered service marks of The McGraw-Hill Companies, Inc. and have been licensed for use by Fidelity Distributors Corporation.
Other third party marks appearing herein are the property of their respective owners.
All other marks appearing herein are registered or unregistered trademarks or service marks of FMR LLC or an affiliated company.
This report and the financial statements contained herein are submitted for the general information of the shareholders of the fund. This report is not authorized for distribution to prospective investors in the fund unless preceded or accompanied by an effective prospectus.
A fund files its complete schedule of portfolio holdings with the SEC for the first and third quarters of each fiscal year on Form N-Q. Forms N-Q are available on the SEC's web site at http://www.sec.gov. A fund's Forms N-Q may be reviewed and copied at the SEC's Public Reference Room in Washington, DC. Information regarding the operation of the SEC's Public Reference Room may be obtained by calling 1-800-SEC-0330. For a complete list of a fund's portfolio holdings, view the most recent holdings listing, semiannual report, or annual report on Fidelity's web site at http://www.fidelity.com or http://www.advisor.fidelity.com, as applicable.
NOT FDIC INSURED · MAY LOSE VALUE · NO BANK GUARANTEE
Neither the fund nor Fidelity Distributors Corporation is a bank.
Annual Report
Performance: The Bottom Line
Average annual total return reflects the change in the value of an investment, assuming reinvestment of the class' dividend income and capital gains (the profits earned upon the sale of securities that have grown in value, if any) and assuming a constant rate of performance each year. During periods of reimbursement by Fidelity, a fund's total return will be greater than it would be had the reimbursement not occurred. Performance numbers are net of all underlying fund operating expenses, but do not include any insurance charges imposed by your insurance company's separate account. If performance information included the effect of these additional charges, the total returns would have been lower. How a fund did yesterday is no guarantee of how it will do tomorrow.
Average Annual Total Returns
Periods ended December 31, 2007 | Past 1
year | Past 5
years | Past 10
years |
VIP Asset Manager - Initial Class | 15.57% | 9.93% | 5.61% |
VIP Asset Manager - Service Class A | 15.36% | 9.82% | 5.48% |
VIP Asset Manager - Service Class 2 B | 15.24% | 9.66% | 5.35% |
VIP Asset Manager - Investor Class C | 15.38% | 9.85% | 5.57% |
A Performance for Service Class shares reflects on asset-based distribution fee (12b-1 fee).
B The initial offering of Service Class 2 shares took place on January 12, 2000. Performance for Service Class 2 shares reflect an asset based distribution fee (12b-1 fee). Returns prior to January 12, 2000 are those of Service Class which reflect a different 12b-1 fee. Had Service Class 2's 12b-1 fee been reflected, returns prior to January 12, 2000 would have been lower.
C The initial offering of Investor Class shares took place on July 21, 2005. Returns prior to July 21, 2005 are those of Initial Class. If Investor Class's transfer agent fee had been reflected, returns prior to July 21, 2005 would have been lower.
$10,000 Over 10 Years
Let's say hypothetically that $10,000 was invested in VIP Asset Manager Portfolio - Initial Class on December 31, 1997. The chart shows how the value of your investment would have changed, and also shows how the Standard & Poor's 500SM Index (S&P 500®) performed over the same period.
Annual Report
Management's Discussion of Fund Performance
Comments from Richard Habermann and Derek Young, Lead Co-Managers of VIP Asset Manager Portfolio
U.S. equity markets, as measured by the bellwether Dow Jones Industrial AverageSM and the Standard & Poor's 500SM Index, registered their fifth consecutive year of positive returns in 2007, as the Dow rose 8.88% and the S&P 500® index advanced 5.49%. The tech-heavy NASDAQ Composite® Index did even better, increasing 10.55%. However, credit- and recession-related concerns carved deeply into stock prices late in 2007, pushing some major market measures into negative territory for the year overall, particularly smaller-cap and value-oriented benchmarks. Based largely on a weak U.S. dollar that boosted returns for U.S. investors, the Morgan Stanley Capital InternationalSM Europe, Australasia, and Far East (MSCI® EAFE®) Index - a gauge of developed stock markets outside the United States and Canada - beat most domestic equity measures, gaining 11.33%. Several European countries had outstanding performance, including Finland and Germany, while Australia also did very well. However, fallout from the credit crunch and concerns about export growth tempered U.K. stocks, while fears that Japanese financial companies would become embroiled in the U.S. subprime mortgage crisis contributed to a loss of more than 4% for the Japanese portion of the index. The emerging-markets stock asset class soared 39.78% according to the MSCI Emerging Markets index. The U.S. investment-grade bond market climbed 6.97% as measured by the Lehman Brothers® U.S. Aggregate Index, beating the 2.53% gain for the Merrill Lynch® U.S. High Yield Master II Constrained Index. The emerging-markets bond category shook off a sluggish first half of 2007 to finish the year with a respectable gain of 6.28% as measured by the J.P. Morgan Emerging Markets Bond Index (EMBI) Global, while the Citigroup® Non-U.S. Group of 7 Index - representing the debt performance of major global economies, excluding the United States - rose 13.05%.
Returns in the mid-teens placed the fund's share classes several lengths ahead of their benchmarks for the year, with the Fidelity Asset Manager 50% Composite Index rising just 6.53%. Stellar performance from the domestic equity subportfolio is what fueled the fund's success during the period. Asset allocation and excess returns from our short-term (cash) holdings provided only a minor boost. (For specific portfolio performance results, please refer to the performance section of this report.) The fund benefited from its slight bias toward equities, which outperformed investment-grade debt and cash through October. Unfortunately, we gave up most of these gains in the final two months of the period as investors fled riskier assets for high-quality fixed-income securities. Within equities, overweighting foreign securities overall was helpful, as overseas markets beat their U.S. counterparts. Unfortunately, subpar security selection within the international equity component - which transitioned in December to a Fidelity central fund - more than offset the benefit from overweighting foreign stocks. In fixed income, underweighting investment-grade debt and cash paid off, but out-of-benchmark allocations to high-yield and floating-rate securities detracted when the credit crisis spread to these markets. Security selection helped the domestic equity portion of the fund beat the Dow Jones Wilshire 5000 Composite IndexSM by a wide margin, with the strongest picks coming within materials, technology, financials and consumer discretionary. Holdings in more-internationally focused companies were particularly beneficial to performance. Sector positioning also contributed, led by large overweightings in energy and materials - which increased during the period - and a sizable underweighting in financials. Results were tempered by an underweighting and some weak picks within consumer staples, as well as by ineffective stock selection in transportation. Among the top individual contributors were several materials stocks, including crop seed producer Monsanto and fertilizer producers Mosaic and Potash Corp. of Saskatchewan. Canada's Research In Motion, maker of the BlackBerry mobile messaging device, also was a standout performer. Detractors included biotechnology company Celgene, Canadian gold miner Goldcorp and Latin American wireless provider NII Holdings. The fund's collective bond holdings trailed the Lehman Brothers Aggregate index due to weak results from the investment-grade central fund, which had exposure to the sell-off in subprime mortgage securities. Although allocations to high yield and floating rate detracted, strong security and market selection helped these two central funds beat their respective indexes. The strategic cash portion of the fund - including the money market central fund - topped its benchmark as well.
The views expressed above reflect those of the portfolio manager(s) only through the end of the period as stated on the cover of this report and do not necessarily represent the views of Fidelity or any other person in the Fidelity organization. Any such views are subject to change at any time based upon market or other conditions and Fidelity disclaims any responsibility to update such views. These views may not be relied on as investment advice and, because investment decisions for a Fidelity fund are based on numerous factors, may not be relied on as an indication of trading intent on behalf of any Fidelity fund.
Annual Report
Shareholder Expense Example
As a shareholder of the Fund, you incur two types of costs: (1) transaction costs, and (2) ongoing costs, including management fees, distribution and/or service (12b-1) fees and other Fund expenses. This Example is intended to help you understand your ongoing costs (in dollars) of investing in the Fund and to compare these costs with the ongoing costs of investing in other mutual funds.
The Example is based on an investment of $1,000 invested at the beginning of the period and held for the entire period (July 1, 2007 to December 31, 2007).
Actual Expenses
The first line of the accompanying table for each class of the Fund provides information about actual account values and actual expenses. You may use the information in this line, together with the amount you invested, to estimate the expenses that you paid over the period. Simply divide your account value by $1,000.00 (for example, an $8,600 account value divided by $1,000.00 = 8.6), then multiply the result by the number in the first line for a class of the Fund under the heading entitled "Expenses Paid During Period" to estimate the expenses you paid on your account during this period. The estimate of expenses does not include any fees or other expenses of any variable annuity or variable life insurance product. If they were, the estimate of expenses you paid during the period would be higher, and your ending account value would be lower. In addition, the Fund, as a shareholder in the underlying Fidelity Central Funds, will indirectly bear its pro rata share of the fees and expenses incurred by the underlying Fidelity Central Funds. These fees and expenses are not included in the Fund's annualized expense ratio used to calculate the expense estimate in the table below.
Hypothetical Example for Comparison Purposes
The second line of the accompanying table for each class of the Fund provides information about hypothetical account values and hypothetical expenses based on a Class' actual expense ratio and an assumed rate of return of 5% per year before expenses, which is not the Class' actual return. The hypothetical account values and expenses may not be used to estimate the actual ending account balance or expenses you paid for the period. You may use this information to compare the ongoing costs of investing in the Fund and other funds. To do so, compare this 5% hypothetical example with the 5% hypothetical examples that appear in the shareholder reports of the other funds. The estimate of expenses does not include any fees or other expenses of any variable annuity or variable life insurance product. If they were, the estimate of expenses you paid during the period would be higher, and your ending account value would be lower. In addition, the Fund, as a shareholder in the underlying Fidelity Central Funds, will indirectly bear its pro rata share of the fees and expenses incurred by the underlying Fidelity Central Funds. These fees and expenses are not included in the Fund's annualized expense ratio used to calculate the expense estimate in the table below.
Please note that the expenses shown in the table are meant to highlight your ongoing costs only and do not reflect any transaction costs. Therefore, the second line of the table is useful in comparing ongoing costs only, and will not help you determine the relative total costs of owning different funds.
| Beginning
Account Value
July 1, 2007 | Ending
Account Value
December 31, 2007 | Expenses Paid
During Period*
July 1, 2007 to
December 31, 2007 |
Initial Class | | | |
Actual | $ 1,000.00 | $ 1,074.70 | $ 3.24 |
HypotheticalA | $ 1,000.00 | $ 1,022.08 | $ 3.16 |
Service Class | | | |
Actual | $ 1,000.00 | $ 1,074.10 | $ 3.87 |
HypotheticalA | $ 1,000.00 | $ 1,021.48 | $ 3.77 |
Service Class 2 | | | |
Actual | $ 1,000.00 | $ 1,073.90 | $ 4.65 |
HypotheticalA | $ 1,000.00 | $ 1,020.72 | $ 4.53 |
Investor Class | | | |
Actual | $ 1,000.00 | $ 1,074.10 | $ 3.92 |
HypotheticalA | $ 1,000.00 | $ 1,021.42 | $ 3.82 |
A 5% return per year before expenses
* Expenses are equal to each Class' annualized expense ratio (shown in the table below); multiplied by the average account value over the period, multiplied by 184/365 (to reflect the one-half year period). The fees and expenses of the underlying Fidelity Central Funds in which the Fund invests are not included in the Fund's annualized expense ratio.
| Annualized
Expense Ratio |
Initial Class | .62% |
Service Class | .74% |
Service Class 2 | .89% |
Investor Class | .75% |
Annual Report
Investment Changes
The information in the following tables is based on the combined investments of the Fund and its pro-rata share of its investments in each Fidelity Central Fund.
Top Five Stocks as of December 31, 2007 |
| % of fund's
net assets | % of fund's net assets
6 months ago |
The Mosaic Co. | 2.1 | 0.7 |
Potash Corp. of Saskatchewan, Inc. | 1.8 | 0.7 |
Apple, Inc. | 1.5 | 0.8 |
Monsanto Co. | 1.5 | 1.2 |
Valero Energy Corp. | 1.4 | 1.2 |
| 8.3 | |
Top Five Bond Issuers as of December 31, 2007 |
(with maturities greater than one year) | % of fund's
net assets | % of fund's net assets
6 months ago |
Fannie Mae | 11.4 | 9.7 |
U.S. Treasury Obligations | 9.3 | 9.7 |
Freddie Mac | 3.3 | 2.7 |
Government National Mortgage Association | 0.7 | 0.8 |
Morgan Stanley Capital I Trust | 0.6 | 0.4 |
| 25.3 | |
Top Five Market Sectors as of December 31, 2007 |
| % of fund's
net assets | % of fund's net assets
6 months ago |
Energy | 13.8 | 10.8 |
Financials | 10.2 | 8.9 |
Materials | 9.4 | 5.7 |
Industrials | 8.4 | 5.2 |
Information Technology | 5.6 | 7.7 |
Asset Allocation (% of fund's net assets) |
As of December 31, 2007* | As of June 30, 2007* * |
 | Stock Class and
Equity Futures 54.8% | | | Stock Class and
Equity Futures 49.0% | |
 | Bond Class 45.9% | | | Bond Class 47.4% | |
 | Short-Term Class(dagger) (0.7)% | |  | Short-Term Class 3.6% | |
* Foreign investments | 20.3% | | * * Foreign investments | 17.2% | |

Asset allocations in the pie charts reflect the categorization of assets as defined in the fund's prospectus in effect as of the time periods indicated above. Financial Statement categorizations conform to accounting standards and will differ from the pie chart. Percentages are adjusted for the effect of futures contracts and swap contracts, if applicable.
A holdings listing for the Fund, which presents direct holdings as well as the pro rata share of securities and other investments held indirectly through its investment in underlying non-money market Fidelity Central Funds, is available at advisor.fidelity.com.
8 The Short-Term Class is not included in the pie chart.
Annual Report
Investments December 31, 2007
Showing Percentage of Net Assets
Common Stocks - 47.7% |
| Shares | | Value |
CONSUMER DISCRETIONARY - 2.4% |
Diversified Consumer Services - 0.3% |
Sotheby's Class A (ltd. vtg.) | 132,800 | | $ 5,059,680 |
Hotels, Restaurants & Leisure - 0.9% |
Burger King Holdings, Inc. | 143,300 | | 4,085,483 |
Home Inns & Hotels Management, Inc. ADR (a) | 115,700 | | 4,123,548 |
McDonald's Corp. | 99,500 | | 5,861,545 |
Nissin Healthcare Food Service Co. | 14,300 | | 163,465 |
Vail Resorts, Inc. (a)(d) | 45,900 | | 2,469,879 |
| | 16,703,920 |
Internet & Catalog Retail - 0.4% |
Priceline.com, Inc. (a) | 68,500 | | 7,867,910 |
Media - 0.4% |
Focus Media Holding Ltd. ADR (a) | 120,600 | | 6,851,286 |
Virgin Media, Inc. | 27,750 | | 475,635 |
| | 7,326,921 |
Multiline Retail - 0.2% |
JCPenney Co., Inc. | 49,600 | | 2,181,904 |
Kohl's Corp. (a) | 41,900 | | 1,919,020 |
| | 4,100,924 |
Textiles, Apparel & Luxury Goods - 0.2% |
Crocs, Inc. (a) | 135,200 | | 4,976,712 |
TOTAL CONSUMER DISCRETIONARY | | 46,036,067 |
CONSUMER STAPLES - 0.6% |
Food & Staples Retailing - 0.6% |
ABB Grain Ltd. | 294 | | 2,176 |
Costco Wholesale Corp. | 77,500 | | 5,406,400 |
Whole Foods Market, Inc. (d) | 135,300 | | 5,520,240 |
| | 10,928,816 |
Tobacco - 0.0% |
Philip Morris CR AS | 105 | | 45,154 |
TOTAL CONSUMER STAPLES | | 10,973,970 |
ENERGY - 12.2% |
Energy Equipment & Services - 3.2% |
Atwood Oceanics, Inc. (a) | 97,900 | | 9,813,496 |
Cameron International Corp. (a) | 198,000 | | 9,529,740 |
FMC Technologies, Inc. (a) | 92,600 | | 5,250,420 |
National Oilwell Varco, Inc. (a) | 82,600 | | 6,067,796 |
Oceaneering International, Inc. (a) | 117,500 | | 7,913,625 |
|
| Shares | | Value |
Schlumberger Ltd. (NY Shares) | 59,400 | | $ 5,843,178 |
Smith International, Inc. | 36,500 | | 2,695,525 |
Transocean, Inc. (a) | 64,083 | | 9,173,481 |
Weatherford International Ltd. (a) | 70,800 | | 4,856,880 |
| | 61,144,141 |
Oil, Gas & Consumable Fuels - 9.0% |
Apache Corp. | 61,100 | | 6,570,694 |
Arch Coal, Inc. | 258,700 | | 11,623,391 |
Cabot Oil & Gas Corp. | 205,000 | | 8,275,850 |
Cameco Corp. | 125,100 | | 4,982,343 |
Chesapeake Energy Corp. | 158,000 | | 6,193,600 |
China Shenhua Energy Co. Ltd. (H Shares) | 1,037,000 | | 6,197,715 |
Exxon Mobil Corp. | 110,000 | | 10,305,900 |
Hess Corp. | 135,000 | | 13,616,100 |
Marathon Oil Corp. | 62,900 | | 3,828,094 |
Peabody Energy Corp. | 190,500 | | 11,742,420 |
Petroplus Holdings AG | 111,880 | | 8,657,792 |
Quicksilver Resources, Inc. (a) | 105,100 | | 6,262,909 |
Range Resources Corp. | 140,000 | | 7,190,400 |
SandRidge Energy, Inc. | 8,600 | | 308,396 |
Sunoco, Inc. | 75,700 | | 5,483,708 |
Tesoro Corp. | 104,700 | | 4,994,190 |
Ultra Petroleum Corp. (a) | 327,700 | | 23,430,550 |
Valero Energy Corp. | 375,000 | | 26,261,250 |
Williams Companies, Inc. | 191,000 | | 6,833,980 |
| | 172,759,282 |
TOTAL ENERGY | | 233,903,423 |
FINANCIALS - 4.9% |
Capital Markets - 1.1% |
Fortress Investment Group LLC (d) | 193,900 | | 3,020,962 |
GLG Partners, Inc. (a) | 149,500 | | 2,033,200 |
Goldman Sachs Group, Inc. | 32,500 | | 6,989,125 |
Lehman Brothers Holdings, Inc. | 41,500 | | 2,715,760 |
Och-Ziff Capital Management Group LLC Class A | 201,400 | | 5,292,792 |
The Blackstone Group LP | 77,700 | | 1,719,501 |
| | 21,771,340 |
Commercial Banks - 1.1% |
Banco Itau Holding Financeira SA sponsored ADR (non-vtg.) | 391,000 | | 10,111,260 |
Raiffeisen International Bank Holding AG | 9,966 | | 1,506,798 |
Uniao de Bancos Brasileiros SA (Unibanco) GDR | 63,200 | | 8,825,248 |
| | 20,443,306 |
Diversified Financial Services - 1.8% |
Apollo Global Management LLC (e) | 315,200 | | 6,855,600 |
Bolsa de Mercadorias & Futuros - BM&F SA | 137,500 | | 1,911,868 |
Common Stocks - continued |
| Shares | | Value |
FINANCIALS - continued |
Diversified Financial Services - continued |
Bovespa Holding SA | 300,400 | | $ 5,626,593 |
CME Group, Inc. | 28,800 | | 19,756,800 |
| | 34,150,861 |
Insurance - 0.6% |
American International Group, Inc. | 77,300 | | 4,506,590 |
Principal Financial Group, Inc. | 85,500 | | 5,885,820 |
| | 10,392,410 |
Real Estate Investment Trusts - 0.3% |
Annaly Capital Management, Inc. | 324,900 | | 5,906,682 |
TOTAL FINANCIALS | | 92,664,599 |
HEALTH CARE - 4.5% |
Biotechnology - 1.4% |
Biogen Idec, Inc. (a) | 59,700 | | 3,398,124 |
Celgene Corp. (a) | 199,000 | | 9,195,790 |
CSL Ltd. | 33,300 | | 1,060,529 |
Gilead Sciences, Inc. (a) | 266,200 | | 12,247,862 |
| | 25,902,305 |
Health Care Equipment & Supplies - 0.5% |
Beckman Coulter, Inc. | 76,900 | | 5,598,320 |
Becton, Dickinson & Co. | 42,200 | | 3,527,076 |
| | 9,125,396 |
Health Care Providers & Services - 1.6% |
Express Scripts, Inc. (a) | 78,800 | | 5,752,400 |
Humana, Inc. (a) | 128,600 | | 9,684,866 |
Medco Health Solutions, Inc. (a) | 84,000 | | 8,517,600 |
UnitedHealth Group, Inc. | 129,300 | | 7,525,260 |
| | 31,480,126 |
Pharmaceuticals - 1.0% |
Elan Corp. PLC sponsored ADR (a) | 486,800 | | 10,699,864 |
Merck & Co., Inc. | 150,000 | | 8,716,500 |
| | 19,416,364 |
TOTAL HEALTH CARE | | 85,924,191 |
INDUSTRIALS - 6.6% |
Aerospace & Defense - 3.7% |
General Dynamics Corp. | 150,400 | | 13,384,096 |
Honeywell International, Inc. | 78,000 | | 4,802,460 |
L-3 Communications Holdings, Inc. | 137,300 | | 14,545,562 |
Lockheed Martin Corp. | 142,000 | | 14,946,920 |
Precision Castparts Corp. | 63,200 | | 8,765,840 |
Raytheon Co. | 185,800 | | 11,278,060 |
The Boeing Co. | 43,100 | | 3,769,526 |
| | 71,492,464 |
|
| Shares | | Value |
Airlines - 0.2% |
Delta Air Lines, Inc. (a) | 87,300 | | $ 1,299,897 |
UAL Corp. | 47,200 | | 1,683,152 |
| | 2,983,049 |
Commercial Services & Supplies - 0.0% |
EnergySolutions, Inc. | 11,400 | | 307,686 |
Electrical Equipment - 1.1% |
ABB Ltd. sponsored ADR | 352,100 | | 10,140,480 |
Alstom SA | 27,400 | | 5,878,171 |
Suntech Power Holdings Co. Ltd. sponsored ADR (a) | 56,100 | | 4,618,152 |
| | 20,636,803 |
Industrial Conglomerates - 0.2% |
McDermott International, Inc. (a) | 63,900 | | 3,772,017 |
Machinery - 1.3% |
Caterpillar, Inc. | 16,900 | | 1,226,264 |
Cummins, Inc. | 73,100 | | 9,310,747 |
Eaton Corp. | 97,100 | | 9,413,845 |
MAN AG | 17,500 | | 2,906,395 |
NGK Insulators Ltd. | 25,000 | | 671,485 |
Sulzer AG (Reg.) | 1,100 | | 1,616,077 |
| | 25,144,813 |
Marine - 0.1% |
DryShips, Inc. | 14,500 | | 1,122,300 |
TOTAL INDUSTRIALS | | 125,459,132 |
INFORMATION TECHNOLOGY - 4.9% |
Communications Equipment - 0.9% |
Cisco Systems, Inc. (a) | 266,800 | | 7,222,276 |
Harris Corp. | 74,400 | | 4,663,392 |
Infinera Corp. | 84,600 | | 1,255,464 |
Research In Motion Ltd. (a) | 32,500 | | 3,685,500 |
Starent Networks Corp. | 75,100 | | 1,370,575 |
| | 18,197,207 |
Computers & Peripherals - 1.7% |
Apple, Inc. (a) | 144,100 | | 28,543,328 |
Data Domain, Inc. | 80,200 | | 2,112,468 |
EMC Corp. (a) | 72,300 | | 1,339,719 |
| | 31,995,515 |
Electronic Equipment & Instruments - 0.1% |
Ibiden Co. Ltd. | 20,900 | | 1,447,802 |
Internet Software & Services - 0.4% |
Google, Inc. Class A (sub. vtg.) (a) | 12,000 | | 8,297,760 |
Semiconductors & Semiconductor Equipment - 0.8% |
Cree, Inc. (a) | 115,600 | | 3,175,532 |
Entropic Communications, Inc. | 149,900 | | 1,091,272 |
Intel Corp. | 215,900 | | 5,755,894 |
SiRF Technology Holdings, Inc. (a) | 203,200 | | 5,106,416 |
| | 15,129,114 |
Common Stocks - continued |
| Shares | | Value |
INFORMATION TECHNOLOGY - continued |
Software - 1.0% |
Nintendo Co. Ltd. | 32,700 | | $ 19,371,479 |
TOTAL INFORMATION TECHNOLOGY | | 94,438,877 |
MATERIALS - 8.7% |
Chemicals - 5.6% |
Monsanto Co. | 253,000 | | 28,257,570 |
Potash Corp. of Saskatchewan, Inc. | 232,200 | | 33,427,512 |
The Mosaic Co. (a) | 432,500 | | 40,802,050 |
Uralkali JSC: | | | |
ADR (a)(e) | 22,600 | | 841,850 |
unit (a) | 107,500 | | 4,004,375 |
| | 107,333,357 |
Metals & Mining - 3.1% |
ArcelorMittal SA (NY Reg.) Class A | 100,600 | | 7,781,410 |
BHP Billiton Ltd. sponsored ADR | 76,800 | | 5,379,072 |
Companhia Vale do Rio Doce sponsored ADR | 195,700 | | 6,393,519 |
European Goldfields Ltd. (a) | 22,400 | | 123,549 |
Freeport-McMoRan Copper & Gold, Inc. Class B | 153,300 | | 15,704,052 |
Goldcorp, Inc. | 552,000 | | 18,778,723 |
Kinross Gold Corp. (a) | 154,800 | | 2,851,230 |
RTI International Metals, Inc. (a) | 33,600 | | 2,316,048 |
| | 59,327,603 |
TOTAL MATERIALS | | 166,660,960 |
TELECOMMUNICATION SERVICES - 0.9% |
Diversified Telecommunication Services - 0.2% |
Telefonica SA sponsored ADR | 35,900 | | 3,503,481 |
Wireless Telecommunication Services - 0.7% |
China Mobile (Hong Kong) Ltd. sponsored ADR | 116,500 | | 10,120,355 |
NII Holdings, Inc. (a) | 83,900 | | 4,054,048 |
| | 14,174,403 |
TOTAL TELECOMMUNICATION SERVICES | | 17,677,884 |
UTILITIES - 2.0% |
Electric Utilities - 1.1% |
Duke Energy Corp. | 265,100 | | 5,347,067 |
Entergy Corp. | 71,700 | | 8,569,584 |
Reliant Energy, Inc. (a) | 239,100 | | 6,273,984 |
| | 20,190,635 |
|
| Shares | | Value |
Independent Power Producers & Energy Traders - 0.9% |
Constellation Energy Group, Inc. | 79,900 | | $ 8,192,147 |
NRG Energy, Inc. (a) | 205,300 | | 8,897,702 |
| | 17,089,849 |
TOTAL UTILITIES | | 37,280,484 |
TOTAL COMMON STOCKS (Cost $732,920,448) | 911,019,587 |
U.S. Treasury Obligations - 0.2% |
| Principal Amount | | |
U.S. Treasury Bills, yield at date of purchase 3.03% to 3.89% 1/10/08 to 2/28/08 (f)
(Cost $3,868,607) | $ 3,875,000 | | 3,870,491 |
International Equity Fund - 4.5% |
| Shares | | |
Fidelity International Equity Central Fund (g)
(Cost $88,376,768) | 890,000 | 86,481,300 |
Fixed-Income Funds - 44.4% |
| | | |
Fidelity Floating Rate Central Fund (g) | 517,744 | | 49,563,633 |
Fidelity High Income Central Fund 1 (g) | 287,744 | | 27,775,965 |
Fidelity VIP Investment Grade Central Fund (g) | 7,520,111 | | 770,811,422 |
TOTAL FIXED-INCOME FUNDS (Cost $852,241,681) | 848,151,020 |
Money Market Funds - 3.9% |
| | | |
Fidelity Cash Central Fund, 4.58% (b) | 4,317,385 | | 4,317,385 |
Fidelity Money Market Central Fund, 5.27% (b) | 64,260,162 | | 64,260,162 |
Fidelity Securities Lending Cash Central Fund, 4.65% (b)(c) | 6,061,075 | | 6,061,075 |
TOTAL MONEY MARKET FUNDS (Cost $74,638,622) | 74,638,622 |
TOTAL INVESTMENT PORTFOLIO - 100.7% (Cost $1,752,046,126) | | 1,924,161,020 |
NET OTHER ASSETS - (0.7)% | | (12,760,102) |
NET ASSETS - 100% | $ 1,911,400,918 |
Futures Contracts |
| Expiration Date | | Underlying Face Amount at Value | | Unrealized Appreciation/
(Depreciation) |
Purchased |
Equity Index Contracts |
49 Dow Jones Euro Stoxx 50 Index Contracts (Germany) | March 2008 | | $ 3,171,495 | | $ 66,312 |
24 FTSE 100 Index Contracts (United Kingdom) | March 2008 | | 3,078,028 | | 82,605 |
123 S&P 500 Index Contracts | March 2008 | | 45,423,900 | | (655,467) |
23 TOPIX 150 Index Contracts (Japan) | March 2008 | | 3,031,879 | | (208,682) |
TOTAL EQUITY INDEX CONTRACTS | | $ 54,705,302 | | $ (715,232) |
|
The face value of futures purchased as a percentage of net assets - 2.9% |
Legend |
(a) Non-income producing |
(b) Affiliated fund that is available only to investment companies and other accounts managed by Fidelity Investments. The rate quoted is the annualized seven-day yield of the fund at period end. A complete unaudited listing of the fund's holdings as of its most recent quarter end is available upon request. |
(c) Investment made with cash collateral received from securities on loan. |
(d) Security or a portion of the security is on loan at period end. |
(e) Security exempt from registration under Rule 144A of the Securities Act of 1933. These securities may be resold in transactions exempt from registration, normally to qualified institutional buyers. At the end of the period, the value of these securities amounted to $7,697,450 or 0.4% of net assets. |
(f) Security or a portion of the security was pledged to cover margin requirements for futures contracts. At the period end, the value of securities pledged amounted to $3,870,491. |
(g) Affiliated fund that is available only to investment companies and other accounts managed by Fidelity Investments. A complete schedule of portfolio holdings for each Fidelity Central Fund is filed with the SEC for the first and third quarters of each fiscal year on Form N-Q and is available upon request or at the SEC's web site at www.sec.gov. A holdings listing for the Fund, which presents direct holdings as well as the pro rata share of securities and other investments held indirectly through its investment in underlying non-money market Fidelity Central Funds, is available at advisor.fidelity.com. In addition, each Fidelity Central Fund's financial statements, which are not covered by the Fund's Report of Independent Registered Public Accounting Firm, are available on the SEC's web site or upon request. |
Affiliated Central Funds |
Information regarding fiscal year to date income earned by the Fund from investments in Fidelity Central Funds is as follows: |
Fund | Income earned |
Fidelity Cash Central Fund | $ 4,082,573 |
Fidelity Floating Rate Central Fund | 4,627,993 |
Fidelity High Income Central Fund 1 | 3,693,166 |
Fidelity Money Market Central Fund | 4,667,716 |
Fidelity Securities Lending Cash Central Fund | 59,477 |
Fidelity VIP Investment Grade Central Fund | 40,661,437 |
Total | $ 57,792,362 |
|
Additional information regarding the Fund's fiscal year to date purchases and sales, including the ownership percentage, of the non Money Market Central Funds is as follows: |
Fund | Value, beginning of period | Purchases | Sales Proceeds | Value, end of period | % ownership, end of period |
Fidelity Floating Rate Central Fund | $ 70,731,860 | $ - | $ 18,503,550 | $ 49,563,633 | 2.0% |
Fidelity High Income Central Fund 1 | 80,596,646 | - | 52,155,243 | 27,775,965 | 10.6% |
Fidelity International Equity Central Fund | - | 88,376,768 | - | 86,481,300 | 10.0% |
Fidelity VIP Investment Grade Central Fund | 791,098,507 | 78,709,511 | 99,842,753 | 770,811,422 | 21.5% |
Total | $ 942,427,013 | $ 167,086,279 | $ 170,501,546 | $ 934,632,320 | |
Other Information |
The composition of credit quality ratings as a percentage of net assets is as follows (ratings are unaudited): |
U.S. Government and U.S. Government Agency Obligations | 24.9% |
AAA,AA,A | 10.5% |
BBB | 6.0% |
BB | 2.3% |
B | 1.6% |
CCC,CC,C | 0.3% |
Not Rated | 0.3% |
Equities | 55.1% |
Short-Term Investments and Net Other Assets | (1.0)% |
| 100.0% |
We have used ratings from Moody's® Investors Services, Inc. Where Moody's ratings are not available, we have used S&P® ratings. All ratings are as of the report date and do not reflect subsequent downgrades. Percentages are adjusted for the effect of futures contracts, if applicable. |
Distribution of investments by country of issue, as a percentage of total net assets, is as follows: |
United States of America | 79.7% |
Canada | 4.8% |
United Kingdom | 1.9% |
Brazil | 1.7% |
Japan | 1.5% |
Switzerland | 1.5% |
Others (individually less than 1%) | 8.9% |
| 100.0% |
See accompanying notes which are an integral part of the financial statements.
Annual Report
Financial Statements
Statement of Assets and Liabilities
| December 31, 2007 |
| | |
Assets | | |
Investment in securities, at value (including securities loaned of $5,842,997) - See accompanying schedule: Unaffiliated issuers
(cost $736,789,055) | $ 914,890,078 | |
Fidelity Central Funds
(cost $1,015,257,071) | 1,009,270,942 | |
Total Investments
(cost $1,752,046,126) | | $ 1,924,161,020 |
Foreign currency held at value
(cost $493) | | 412 |
Receivable for investments sold | | 1,709,308 |
Receivable for fund shares sold | | 1,107,204 |
Dividends receivable | | 692,452 |
Distributions receivable from Fidelity Central Funds | | 4,979,619 |
Prepaid expenses | | 6,094 |
Other receivables | | 715,324 |
Total assets | | 1,933,371,433 |
| | |
Liabilities | | |
Payable to custodian bank | $ 2,563,648 | |
Payable for investments purchased | 4,032,549 | |
Payable for fund shares redeemed | 7,839,307 | |
Accrued management fee | 803,618 | |
Distribution fees payable | 13,430 | |
Payable for daily variation on futures contracts | 279,374 | |
Other affiliated payables | 176,235 | |
Other payables and accrued expenses | 201,279 | |
Collateral on securities loaned, at value | 6,061,075 | |
Total liabilities | | 21,970,515 |
| | |
Net Assets | | $ 1,911,400,918 |
Net Assets consist of: | | |
Paid in capital | | $ 1,571,439,928 |
Undistributed net investment income | | 123,645 |
Accumulated undistributed net realized gain (loss) on investments and foreign currency transactions | | 168,435,757 |
Net unrealized appreciation (depreciation) on investments and assets and liabilities in foreign currencies | | 171,401,588 |
Net Assets | | $ 1,911,400,918 |
Statement of Assets and Liabilities - continued
| December 31, 2007 |
| | |
Initial Class:
Net Asset Value, offering price and redemption price per share ($1,791,646,783 ÷ 108,085,296 shares) | | $ 16.58 |
| | |
Service Class:
Net Asset Value, offering price and redemption price per share ($13,530,072 ÷ 820,821 shares) | | $ 16.48 |
| | |
Service Class 2:
Net Asset Value, offering price and redemption price per share ($59,669,534 ÷ 3,652,795 shares) | | $ 16.34 |
| | |
Investor Class:
Net Asset Value, offering price and redemption price per share ($46,554,529 ÷ 2,815,990 shares) | | $ 16.53 |
See accompanying notes which are an integral part of the financial statements.
Annual Report
Statement of Operations
| Year ended December 31, 2007 |
| | |
Investment Income | | |
Dividends | | $ 9,202,349 |
Interest | | 282,137 |
Income from Fidelity Central Funds | | 57,792,362 |
Total income | | 67,276,848 |
| | |
Expenses | | |
Management fee | $ 10,168,447 | |
Transfer agent fees | 1,392,167 | |
Distribution fees | 159,334 | |
Accounting and security lending fees | 776,558 | |
Custodian fees and expenses | 85,856 | |
Independent trustees' compensation | 6,989 | |
Appreciation in deferred trustee compensation account | 730 | |
Audit | 83,510 | |
Legal | 15,392 | |
Interest | 3,177 | |
Miscellaneous | 59,238 | |
Total expenses before reductions | 12,751,398 | |
Expense reductions | (86,549) | 12,664,849 |
Net investment income (loss) | | 54,611,999 |
Realized and Unrealized Gain (Loss) Net realized gain (loss) on: | | |
Investment securities: | | |
Unaffiliated issuers (net of foreign taxes of $47,708) | 165,240,489 | |
Fidelity Central Funds | 5,540,327 | |
Foreign currency transactions | (244,533) | |
Futures contracts | 2,269,483 | |
Capital gain distributions from Fidelity Central Funds | 594,304 | |
Total net realized gain (loss) | | 173,400,070 |
Change in net unrealized appreciation (depreciation) on: Investment securities | 62,642,255 | |
Assets and liabilities in foreign currencies | 12,639 | |
Futures contracts | (1,234,991) | |
Total change in net unrealized appreciation (depreciation) | | 61,419,903 |
Net gain (loss) | | 234,819,973 |
Net increase (decrease) in net assets resulting from operations | | $ 289,431,972 |
Statement of Changes in Net Assets
| Year ended
December 31,
2007 | Year ended
December 31,
2006 |
Increase (Decrease) in Net Assets | | |
Operations | | |
Net investment income (loss) | $ 54,611,999 | $ 66,787,201 |
Net realized gain (loss) | 173,400,070 | 162,523,758 |
Change in net unrealized appreciation (depreciation) | 61,419,903 | (68,032,199) |
Net increase (decrease) in net assets resulting from operations | 289,431,972 | 161,278,760 |
Distributions to shareholders from net investment income | (123,782,842) | (65,774,370) |
Distributions to shareholders from net realized gain | (61,310,603) | - |
Total distributions | (185,093,445) | (65,774,370) |
Share transactions - net increase (decrease) | (380,180,594) | (405,651,778) |
Total increase (decrease) in net assets | (275,842,067) | (310,147,388) |
| | |
Net Assets | | |
Beginning of period | 2,187,242,985 | 2,497,390,373 |
End of period (including undistributed net investment income of $123,645 and undistributed net investment income of $61,631,634, respectively) | $ 1,911,400,918 | $ 2,187,242,985 |
See accompanying notes which are an integral part of the financial statements.
Annual Report
Financial Highlights - Initial Class
Years ended December 31, | 2007 | 2006 | 2005 | 2004 | 2003 |
Selected Per-Share Data | | | | | |
Net asset value, beginning of period | $ 15.71 | $ 15.04 | $ 14.85 | $ 14.46 | $ 12.75 |
Income from Investment Operations | | | | | |
Net investment income (loss) C | .44 | .44 | .38 | .36 F | .36 |
Net realized and unrealized gain (loss) | 1.88 | .64 | .21 | .42 | 1.83 |
Total from investment operations | 2.32 | 1.08 | .59 | .78 | 2.19 |
Distributions from net investment income | (1.00) | (.41) | (.39) | (.39) | (.48) |
Distributions from net realized gain | (.45) | - | (.01) | - | - |
Total distributions | (1.45) | (.41) | (.40) H | (.39) | (.48) |
Net asset value, end of period | $ 16.58 | $ 15.71 | $ 15.04 | $ 14.85 | $ 14.46 |
Total Return A, B | 15.57% | 7.32% | 4.04% | 5.47% | 17.97% |
Ratios to Average Net Assets D, G | | | | | |
Expenses before reductions | .63% | .65% | .64% | .66% | .63% |
Expenses net of fee waivers, if any | .63% | .65% | .64% | .66% | .63% |
Expenses net of all reductions | .62% | .63% | .63% | .65% | .62% |
Net investment income (loss) | 2.75% | 2.90% | 2.60% | 2.53% | 2.71% |
Supplemental Data | | | | | |
Net assets, end of period (000 omitted) | $ 1,791,647 | $ 2,080,545 | $ 2,407,113 | $ 2,751,094 | $ 3,011,837 |
Portfolio turnover rate E | 99% | 173% | 44% | 66% | 82% |
A Total returns do not reflect charges attributable to your insurance company's separate account. Inclusion of these charges would reduce the total returns shown.
B Total returns would have been lower had certain expenses not been reduced during the periods shown.
C Calculated based on average shares outstanding during the period.
D Fees and expenses of the underlying Fidelity Central Funds are not included in the Fund's expense ratio. The Fund indirectly bears its proportionate share of the expenses of any underlying Fidelity Central Funds.
E Amount does not include the portfolio activity of any underlying Fidelity Central Funds.
F Investment income per share reflects a special dividend which amounted to $.04 per share.
G Expense ratios reflect operating expenses of the class. Expenses before reductions do not reflect amounts reimbursed by the investment adviser or reductions from brokerage service arrangements or other expense offset arrangements and do not represent the amount paid by the class during periods when reimbursements or reductions occur. Expenses net of fee waivers reflect expenses after reimbursement by the investment adviser but prior to reductions from brokerage service arrangements or other expense offset arrangements. Expenses net of all reductions represent the net expenses paid by the class.
H Total distributions of $.40 per share is comprised of distributions from net investment income of $.39 and distributions from net realized gain of $.005 per share.
Financial Highlights - Service Class
Years ended December 31, | 2007 | 2006 | 2005 | 2004 | 2003 |
Selected Per-Share Data | | | | | |
Net asset value, beginning of period | $ 15.61 | $ 14.94 | $ 14.75 | $ 14.37 | $ 12.66 |
Income from Investment Operations | | | | | |
Net investment income (loss) C | .42 | .42 | .36 | .34 F | .34 |
Net realized and unrealized gain (loss) | 1.86 | .64 | .21 | .42 | 1.83 |
Total from investment operations | 2.28 | 1.06 | .57 | .76 | 2.17 |
Distributions from net investment income | (.96) | (.39) | (.37) | (.38) | (.46) |
Distributions from net realized gain | (.45) | - | (.01) | - | - |
Total distributions | (1.41) | (.39) | (.38) H | (.38) | (.46) |
Net asset value, end of period | $ 16.48 | $ 15.61 | $ 14.94 | $ 14.75 | $ 14.37 |
Total Return A, B | 15.36% | 7.24% | 3.93% | 5.36% | 17.91% |
Ratios to Average Net Assets D, G | | | | | |
Expenses before reductions | .74% | .76% | .74% | .77% | .74% |
Expenses net of fee waivers, if any | .74% | .76% | .74% | .77% | .74% |
Expenses net of all reductions | .74% | .74% | .73% | .76% | .73% |
Net investment income (loss) | 2.63% | 2.79% | 2.50% | 2.41% | 2.59% |
Supplemental Data | | | | | |
Net assets, end of period (000 omitted) | $ 13,530 | $ 24,021 | $ 29,382 | $ 33,118 | $ 32,087 |
Portfolio turnover rate E | 99% | 173% | 44% | 66% | 82% |
A Total returns do not reflect charges attributable to your insurance company's separate account. Inclusion of these charges would reduce the total returns shown.
B Total returns would have been lower had certain expenses not been reduced during the periods shown.
C Calculated based on average shares outstanding during the period.
D Fees and expenses of the underlying Fidelity Central Funds are not included in the Fund's expense ratio. The Fund indirectly bears its proportionate share of the expenses of any underlying Fidelity Central Funds.
E Amount does not include the portfolio activity of any underlying Fidelity Central Funds.
F Investment income per share reflects a special dividend which amounted to $.04 per share.
G Expense ratios reflect operating expenses of the class. Expenses before reductions do not reflect amounts reimbursed by the investment adviser or reductions from brokerage service arrangements or other expense offset arrangements and do not represent the amount paid by the class during periods when reimbursements or reductions occur. Expenses net of fee waivers reflect expenses after reimbursement by the investment adviser but prior to reductions from brokerage service arrangements or other expense offset arrangements. Expenses net of all reductions represent the net expenses paid by the class.
H Total distributions of $.38 per share is comprised of distributions from net investment income of $.37 and distributions from net realized gain of $.005 per share.
See accompanying notes which are an integral part of the financial statements.
Annual Report
Financial Highlights - Service Class 2
Years ended December 31, | 2007 | 2006 | 2005 | 2004 | 2003 |
Selected Per-Share Data | | | | | |
Net asset value, beginning of period | $ 15.47 | $ 14.82 | $ 14.64 | $ 14.27 | $ 12.59 |
Income from Investment Operations | | | | | |
Net investment income (loss) C | .39 | .39 | .34 | .32 F | .32 |
Net realized and unrealized gain (loss) | 1.85 | .63 | .21 | .41 | 1.81 |
Total from investment operations | 2.24 | 1.02 | .55 | .73 | 2.13 |
Distributions from net investment income | (.92) | (.37) | (.37) | (.36) | (.45) |
Distributions from net realized gain | (.45) | - | (.01) | - | - |
Total distributions | (1.37) | (.37) | (.37) H | (.36) | (.45) |
Net asset value, end of period | $ 16.34 | $ 15.47 | $ 14.82 | $ 14.64 | $ 14.27 |
Total Return A, B | 15.24% | 7.06% | 3.85% | 5.18% | 17.66% |
Ratios to Average Net Assets D, G | | | | | |
Expenses before reductions | .89% | .92% | .90% | .93% | .91% |
Expenses net of fee waivers, if any | .89% | .92% | .90% | .93% | .91% |
Expenses net of all reductions | .89% | .90% | .89% | .92% | .89% |
Net investment income (loss) | 2.48% | 2.64% | 2.34% | 2.25% | 2.43% |
Supplemental Data | | | | | |
Net assets, end of period (000 omitted) | $ 59,670 | $ 55,585 | $ 51,574 | $ 36,763 | $ 22,456 |
Portfolio turnover rate E | 99% | 173% | 44% | 66% | 82% |
A Total returns do not reflect charges attributable to your insurance company's separate account. Inclusion of these charges would reduce the total returns shown.
B Total returns would have been lower had certain expenses not been reduced during the periods shown.
C Calculated based on average shares outstanding during the period.
D Fees and expenses of the underlying Fidelity Central Funds are not included in the Fund's expense ratio. The Fund indirectly bears its proportionate share of the expenses of any underlying Fidelity Central Funds.
E Amount does not include the portfolio activity of any underlying Fidelity Central Funds.
F Investment income per share reflects a special dividend which amounted to $.04 per share.
G Expense ratios reflect operating expenses of the class. Expenses before reductions do not reflect amounts reimbursed by the investment adviser or reductions from brokerage service arrangements or other expense offset arrangements and do not represent the amount paid by the class during periods when reimbursements or reductions occur. Expenses net of fee waivers reflect expenses after reimbursement by the investment adviser but prior to reductions from brokerage service arrangements or other expense offset arrangements. Expenses net of all reductions represent the net expenses paid by the class.
H Total distributions of $.37 per share is comprised of distributions from net investment income of $.365 and distributions from net realized gain of $.005 per share.
Financial Highlights - Investor Class
Years ended December 31, | 2007 | 2006 | 2005 H |
Selected Per-Share Data | | | |
Net asset value, beginning of period | $ 15.67 | $ 15.03 | $ 14.63 |
Income from Investment Operations | | | |
Net investment income (loss) E | .42 | .42 | .16 |
Net realized and unrealized gain (loss) | 1.87 | .63 | .24 |
Total from investment operations | 2.29 | 1.05 | .40 |
Distributions from net investment income | (.98) | (.41) | - |
Distributions from net realized gain | (.45) | - | - |
Total distributions | (1.43) | (.41) | - |
Net asset value, end of period | $ 16.53 | $ 15.67 | $ 15.03 |
Total Return B, C, D | 15.38% | 7.16% | 2.73% |
Ratios to Average Net Assets F, I | | | |
Expenses before reductions | .75% | .78% | .82% A |
Expenses net of fee waivers, if any | .75% | .78% | .82% A |
Expenses net of all reductions | .74% | .76% | .81% A |
Net investment income (loss) | 2.63% | 2.77% | 2.52% A |
Supplemental Data | | | |
Net assets, end of period (000 omitted) | $ 46,555 | $ 27,092 | $ 9,322 |
Portfolio turnover rate G | 99% | 173% | 44% |
A Annualized
B Total returns for periods of less than one year are not annualized.
C Total returns do not reflect charges attributable to your insurance company's separate account. Inclusion of these charges would reduce the total returns shown.
D Total returns would have been lower had certain expenses not been reduced during the periods shown.
E Calculated based on average shares outstanding during the period.
F Fees and expenses of the underlying Fidelity Central Funds are not included in the Fund's expense ratio. The Fund indirectly bears its proportionate share of the expenses of any underlying Fidelity Central Funds.
G Amount does not include the portfolio activity of any underlying Fidelity Central Funds.
H For the period July 21, 2005 (commencement of sale of shares) to December 31, 2005.
I Expense ratios reflect operating expenses of the class. Expenses before reductions do not reflect amounts reimbursed by the investment adviser or reductions from brokerage service arrangements or other expense offset arrangements and do not represent the amount paid by the class during periods when reimbursements or reductions occur. Expense ratios before reductions for start-up periods may not be representative of longer-term operating periods. Expenses net of fee waivers reflect expenses after reimbursement by the investment adviser but prior to reductions from brokerage service arrangements or other expense offset arrangements. Expenses net of all reductions represent the net expenses paid by the class.
See accompanying notes which are an integral part of the financial statements.
Annual Report
Notes to Financial Statements
For the period ended December 31, 2007
1. Organization.
VIP Asset Manager Portfolio (the Fund) is a fund of Variable Insurance Products Fund V (the trust) (formerly of Variable Insurance Products Fund II) and is authorized to issue an unlimited number of shares. Effective April 19, 2007, the Board of Trustees approved an Agreement and Plan of Reorganization whereby the Fund reorganized into Variable Insurance Products V effective June 29, 2007 (Trust Reorganization). The Trust Reorganization does not impact the Fund's investment strategies or Fidelity Management & Research Company's (FMR) management of the Fund. The trust is registered under the Investment Company Act of 1940, as amended (the 1940 Act), as an open-end management investment company organized as a Massachusetts business trust. Shares of the Fund may only be purchased by insurance companies for the purpose of funding variable annuity or variable life insurance contracts. The Fund offers the following classes of shares: Initial Class shares, Service Class shares, Service Class 2 shares, and Investor Class shares. All classes have equal rights and voting privileges, except for matters affecting a single class. Investment income, realized and unrealized capital gains and losses, the common expenses of the Fund, and certain fund-level expense reductions, if any, are allocated on a pro rata basis to each class based on the relative net assets of each class to the total net assets of the Fund. Each class differs with respect to transfer agent and distribution and service plan fees incurred. Certain expense reductions also differ by class.
2. Investments in Fidelity Central Funds.
The Fund may invest in Fidelity Central Funds, which are open-end investment companies available only to other investment companies and accounts managed by FMR and its affiliates. The Fund's Schedule of Investments lists each of the Fidelity Central Funds as an investment of the Fund, but does not include the underlying holdings of each Fidelity Central Fund. As an Investing Fund, the Fund indirectly bears its proportionate share of the expenses of the underlying Fidelity Central Funds.
Based on their investment objective, each Fidelity Central Fund may invest or participate in various investment vehicles or strategies that are similar to those of the Fund. These strategies are consistent with the investment objectives of the Fund and may involve certain economic risks which may cause a decline in value of each of the Fidelity Central Funds and thus a decline in the value of the Fund. The following summarizes the Fund's investment in each Fidelity Central Fund.
Fidelity Central Fund | Investment Manager | | Investment Objective | | Investment Practices |
Fidelity International Equity Central Fund | Fidelity Management & Research Company, Inc. (FMRC) | | Seeks capital appreciation by investing primarily in non-US based common stocks, including securities of issuers located in emerging markets. | | Delayed Delivery & When Issued Securities, Foreign Securities, Repurchase Agreements |
Fidelity Floating Rate Central Fund | FMRC | | Seeks a high level of income by normally investing in floating rate loans and other floating rate securities. | | Loans & Direct Debt Instruments, Repurchase Agreements, Restricted Securities |
Fidelity High Income Central Fund 1 | FMRC | | Seeks a high level of income and may also seek capital appreciation by investing primarily in debt securities, preferred stocks, and convertible securities, with an emphasis on lower-quality debt securities. | | Loans & Direct Debt Instruments, Repurchase Agreements, Restricted Securities |
Fidelity Money Market Central Funds | Fidelity Investment Money Management, Inc. (FIMM) | | Seeks to obtain a high level of current income consistent with the preservation of capital and liquidity. | | Short-term investments |
Fidelity VIP Investment Grade Central Fund | FIMM | | Seeks a high level of current income by normally investing in investment-grade debt securities and repurchase agreements. | | Delayed Delivery & When Issued Securities, Mortgage Dollar Rolls, Repurchase Agreements, Restricted Securities, Swap Agreements |
The Central Funds may invest a portion of their assets in securities or funds that invest in securities, of issuers that hold mortgage securities including subprime mortgage securities. The value and related income of these securities is sensitive to changes in economic conditions, including delinquencies and/or defaults, and may be adversely affected by shifts in the market's perception of the issuers and changes in interest rates.
Annual Report
2. Investments in Fidelity Central Funds - continued
A holdings listing for the Fund, which presents direct holdings as well as the pro rata share of any securities and other investments held indirectly through its investment in underlying non-money market Fidelity Central Funds, is available at advisor.fidelity.com. A complete list of holdings for each Fidelity Central Fund is available upon request or at the SEC's web site at www.sec.gov. In addition, the financial statements of the Fidelity Central Funds, which are not covered by the Fund's Report of Independent Registered Public Accounting Firm, are available on the SEC's web site or upon request.
3. Significant Accounting Policies.
The financial statements have been prepared in conformity with accounting principles generally accepted in the United States of America, which require management to make certain estimates and assumptions at the date of the financial statements. The following summarizes the significant accounting policies of the Fund:
Security Valuation. Investments are valued and net asset value (NAV) per share is calculated (NAV calculation) as of the close of business of the New York Stock Exchange (NYSE), normally 4:00 p.m. Eastern time. Wherever possible, the Fund uses independent pricing services approved by the Board of Trustees to value its investments.
Equity securities, including restricted securities, for which market quotations are readily available, are valued at the last reported sale price or official closing price as reported by an independent pricing service on the primary market or exchange on which they are traded. In the event there were no sales during the day or closing prices are not available, securities are valued at the last quoted bid price. Investments in open-end mutual funds, including the Fidelity Central Funds, are valued at their closing net asset value each business day. Short-term securities with remaining maturities of sixty days or less for which quotations are not readily available are valued at amortized cost, which approximates value.
When current market prices or quotations are not readily available or do not accurately reflect fair value, valuations may be determined in accordance with procedures adopted by the Board of Trustees. For example, when developments occur between the close of a market and the close of the NYSE that may materially affect the value of some or all of the securities, or when trading in a security is halted, those securities may be fair valued. Factors used in the determination of fair value may include monitoring news to identify significant market or security specific events such as changes in the value of U.S. securities markets, reviewing developments in foreign markets and evaluating the performance of ADRs, futures contracts and exchange-traded funds and monitoring current market trading activity, interest rates, credit quality and default rates for debt instruments. Because the Fund's utilization of fair value pricing depends on market activity, the frequency with which fair value pricing is used cannot be predicted and may be utilized to a significant extent. The value of securities used for NAV calculation under fair value pricing may differ from published prices for the same securities.
Foreign Currency. The Fund uses foreign currency contracts to facilitate transactions in foreign-denominated securities. Losses from these transactions may arise from changes in the value of the foreign currency or if the counterparties do not perform under the contracts' terms.
Foreign-denominated assets, including investment securities, and liabilities are translated into U.S. dollars at the exchange rate at period end. Purchases and sales of investment securities, income and dividends received and expenses denominated in foreign currencies are translated into U.S. dollars at the exchange rate in effect on the transaction date.
The effects of exchange rate fluctuations on investments are included with the net realized and unrealized gain (loss) on investment securities. Other foreign currency transactions resulting in realized and unrealized gain (loss) are disclosed separately.
Investment Transactions and Income. For financial reporting purposes, the Fund's investment holdings and NAV include trades executed through the end of the last business day of the period. The NAV for processing shareholder transactions includes trades executed through the end of the prior business day. Gains and losses on securities sold are determined on the basis of identified cost and may include proceeds received from litigation. Dividend income is recorded on the ex-dividend date, except for certain dividends from foreign securities where the ex-dividend date may have passed, which are recorded as soon as the Fund is informed of the ex-dividend date. Non-cash dividends included in dividend income, if any, are recorded at the fair market value of the securities received. Distributions received on securities that represent a return of capital or capital gain are recorded as a reduction of cost of investments and/or as a realized gain. The Fund estimates the components of distributions received that may be considered return of capital distributions or capital gain distributions. Interest income and distributions from the Fidelity Central Funds are accrued as earned. Interest income includes coupon interest and amortization of premium and accretion of discount on debt securities. Investment income is recorded net of foreign taxes withheld where recovery of such taxes is uncertain.
Expenses. Most expenses of the trust can be directly attributed to a fund. Expenses which cannot be directly attributed are apportioned among each Fund in the trust. Expense estimates are accrued in the period to which they relate and adjustments are made when actual amounts are known. All legal and other expenses associated with the Trust Reorganization will be paid by FMR.
Annual Report
Notes to Financial Statements - continued
3. Significant Accounting Policies - continued
Deferred Trustee Compensation. Under a Deferred Compensation Plan (the Plan), Independent Trustees must defer receipt of a portion of, and may elect to defer receipt of an additional portion of, their annual compensation. Deferred amounts are invested in a cross-section of Fidelity funds, are marked-to-market and remain in the Fund until distributed in accordance with the Plan. The investment of deferred amounts and the offsetting payable to the Trustees are included in the accompanying Statement of Assets and Liabilities.
Income Tax Information and Distributions to Shareholders. Each year, the Fund intends to qualify as a regulated investment company by distributing substantially all of its taxable income and realized gains under Subchapter M of the Internal Revenue Code and filing its U.S. federal tax return. As a result, no provision for income taxes is required. The Fund adopted the provisions of FASB Interpretation No. 48, Accounting for Uncertainties in Income Taxes (FIN 48), on June 29, 2007. FIN 48 sets forth a minimum threshold for financial statement recognition of the benefit of a tax position taken or expected to be taken in a tax return. The implementation of FIN 48 did not result in any unrecognized tax benefits in the accompanying financial statements. Each of the Fund's federal tax returns for the prior three fiscal years remains subject to examination by the Internal Revenue Service. Foreign taxes are provided for based on the Fund's understanding of the tax rules and rates that exist in the foreign markets in which it invests.
Distributions are recorded on the ex-dividend date. Income dividends and capital gain distributions are declared separately for each class. Income and capital gain distributions are determined in accordance with income tax regulations, which may differ from generally accepted accounting principles.
Capital accounts within the financial statements are adjusted for permanent book-tax differences. Certain adjustments have been made to the accounts relating to prior periods. Collectively, these adjustments have no impact on net assets or the results of operations. Temporary book-tax differences will reverse in a subsequent period.
Book-tax differences are primarily due to short-term gain distributions from underlying funds, futures transactions, foreign currency transactions, certain foreign taxes, passive foreign investment companies (PFIC), partnerships (including allocations from Fidelity Central Funds), deferred trustee compensation and losses deferred due to wash sales.
The tax-basis components of distributable earnings and the federal tax cost as of period end were as follows:
Unrealized appreciation | $ 214,644,003 | |
Unrealized depreciation | (24,460,210) | |
Net unrealized appreciation (depreciation) | 190,183,793 | |
Undistributed ordinary income | 99,487,078 | |
Undistributed long-term capital gain | 71,906,443 | |
| | |
Cost for federal income tax purposes | $ 1,733,977,227 | |
The tax character of distributions paid was as follows:
| December 31, 2007 | December 31, 2006 |
Ordinary Income | $ 123,782,842 | $ 65,774,370 |
Long-term Capital Gains | 61,310,603 | - |
Total | $ 185,093,445 | $ 65,774,370 |
New Accounting Pronouncement. In September 2006, Statement of Financial Accounting Standards No. 157, Fair Value Measurements (SFAS 157), was issued and is effective for fiscal years beginning after November 15, 2007. SFAS 157 defines fair value, establishes a framework for measuring fair value and expands disclosures about fair value measurements. Management is currently evaluating the impact the adoption of SFAS 157 will have on the Fund's financial statement disclosures.
4. Operating Policies.
Repurchase Agreements. FMR has received an Exemptive Order from the Securities and Exchange Commission (the SEC) which permits the Fund and other affiliated entities of FMR to transfer uninvested cash balances into joint trading accounts which are then invested in repurchase agreements. The Fund may also invest directly with institutions in repurchase agreements. Repurchase agreements are collateralized by government or non-government securities. Upon settlement date, collateral is held in segregated accounts with custodian banks and may be obtained in the event of a default of the counterparty. The Fund monitors, on a daily basis, the value of the collateral to ensure it is at least equal to the principal amount of the repurchase agreement (including accrued interest). In the event of a default by the counterparty, realization of the collateral proceeds could be delayed, during which time the value of the collateral may decline.
Annual Report
4. Operating Policies - continued
Futures Contracts. The Fund may use futures contracts to manage its exposure to the stock market. Buying futures tends to increase a fund's exposure to the underlying instrument, while selling futures tends to decrease a fund's exposure to the underlying instrument or hedge other fund investments. Upon entering into a futures contract, a fund is required to deposit with a clearing broker, no later than the following business day, an amount ("initial margin") equal to a certain percentage of the face value of the contract. The initial margin may be in the form of cash or securities and is transferred to a segregated account on settlement date. Subsequent payments ("variation margin") are made or received by a fund depending on the daily fluctuations in the value of the futures contract and are accounted for as unrealized gains or losses. Realized gains (losses) are recorded upon the expiration or closing of the futures contract. Securities deposited to meet margin requirements are identified in the Schedule of Investments. Futures contracts involve, to varying degrees, risk of loss in excess of any futures variation margin reflected in the Statement of Assets and Liabilities. The underlying face amount at value of any open futures contracts at period end is shown in the Schedule of Investments under the caption "Futures Contracts." This amount reflects each contract's exposure to the underlying instrument at period end. Losses may arise from changes in the value of the underlying instruments or if the counterparties do not perform under the contract's terms. Futures contracts are valued at the settlement price established each day by the board of trade or exchange on which they are traded.
Restricted Securities. The Fund may invest in securities that are subject to legal or contractual restrictions on resale. These securities generally may be resold in transactions exempt from registration or to the public if the securities are registered. Disposal of these securities may involve time-consuming negotiations and expense, and prompt sale at an acceptable price may be difficult. Information regarding restricted securities is included at the end of the Fund's Schedule of Investments.
5. Purchases and Sales of Investments.
Purchases and sales of securities (including the Equity and Fixed-Income Central Funds), other than short-term securities and U.S. government securities, aggregated $1,796,578,104 and $2,140,223,505, respectively.
6. Fees and Other Transactions with Affiliates.
Management Fee. FMR and its affiliates provide the Fund with investment management related services for which the Fund pays a monthly management fee. The management fee is the sum of an individual fund fee rate that is based on an annual rate of .25% of the Fund's average net assets and a group fee rate that averaged .26% during the period. The group fee rate is based upon the average net assets of all the mutual funds advised by FMR. The group fee rate decreases as assets under management increase and increases as assets under management decrease. For the period, the total annual management fee rate was .51% of the Fund's average net assets.
Distribution and Service Plan. In accordance with Rule 12b-1 of the 1940 Act, the Fund has adopted separate 12b-1 Plans for each Service Class of shares. Each Service Class pays Fidelity Distributors Corporation (FDC), an affiliate of FMR, a service fee. For the period, the service fee is based on an annual rate of .10% of Service Class' average net assets and .25% of Service Class 2's average net assets.
For the period, each class paid FDC the following amounts, all of which were re-allowed to insurance companies for the distribution of shares and providing shareholder support services:
Service Class | $ 17,463 | |
Service Class 2 | 141,871 | |
| $ 159,334 | |
Annual Report
Notes to Financial Statements - continued
6. Fees and Other Transactions with Affiliates - continued
Transfer Agent Fees. Fidelity Investments Institutional Operations Company, Inc. (FIIOC), an affiliate of FMR, is the Fund's transfer, dividend disbursing, and shareholder servicing agent. FIIOC receives an asset-based fee with respect to each class. Each class with the exception of Investor Class pays a transfer agent fee, excluding out of pocket expenses, equal to an annual rate of .07% of average net assets. Investor Class pays a monthly asset-based transfer agent fee of .18% of average net assets. The total transfer agent fees paid by each class to FIIOC, including out of pocket expenses, were as follows:
Initial Class | $ 1,267,601 | |
Service Class | 13,808 | |
Service Class 2 | 44,835 | |
Investor Class | 65,923 | |
| $ 1,392,167 | |
Effective February 1, 2008, the Board of Trustees approved a decrease to Investor Class' asset-based fee from .18% to .15% of average net assets.
Accounting and Security Lending Fees. Fidelity Service Company, Inc. (FSC), an affiliate of FMR, maintains the Fund's accounting records. The accounting fee is based on the level of average net assets for the month. Under a separate contract, FSC administers the security lending program. The security lending fee is based on the number and duration of lending transactions.
Brokerage Commissions. The Fund placed a portion of its portfolio transactions with brokerage firms which are affiliates of the investment adviser. The commissions paid to these affiliated firms were $7,572 for the period.
Interfund Lending Program. Pursuant to an Exemptive Order issued by the SEC, the Fund, along with other registered investment companies having management contracts with FMR, may participate in an interfund lending program. This program provides an alternative credit facility allowing the funds to borrow from, or lend money to, other participating affiliated funds. At period end, there were no interfund loans outstanding. The Fund's activity in this program during the period for which loans were outstanding was as follows:
Borrower or Lender | Average Daily
Loan Balance | Weighted Average
Interest Rate | Interest
Expense |
Borrower | $ 25,792,000 | 4.43% | $ 3,177 |
7. Committed Line of Credit.
The Fund participates with other funds managed by FMR in a $4.2 billion credit facility (the "line of credit") to be utilized for temporary or emergency purposes to fund shareholder redemptions or for other short-term liquidity purposes. The Fund has agreed to pay commitment fees on its pro rata portion of the line of credit, which amounted to $4,411 and is reflected in Miscellaneous Expense on the Statement of Operations. During the period, there were no borrowings on this line of credit.
8. Security Lending.
The Fund lends portfolio securities from time to time in order to earn additional income. On the settlement date of the loan, the Fund receives collateral (in the form of U.S. Treasury obligations, letters of credit and/or cash) against the loaned securities and maintains collateral in an amount not less than 100% of the market value of the loaned securities during the period of the loan. The market value of the loaned securities is determined at the close of business of the Fund and any additional required collateral is delivered to the Fund on the next business day. If the borrower defaults on its obligation to return the securities loaned because of insolvency or other reasons, a fund could experience delays and costs in recovering the securities loaned or in gaining access to the collateral. Any cash collateral received is invested in the Fidelity Securities Lending Cash Central Fund. The value of loaned securities and cash collateral at period end are disclosed on the Fund's Statement of Assets and Liabilities. Security lending income represents the income earned on investing cash collateral, less fees and expenses associated with the loan, plus any premium payments that may be received on the loan of certain types of securities. Security lending income is presented in the Statement of Operations as a component of income from Fidelity Central Funds. Net income from lending portfolio securities during the period amounted to $59,477.
9. Expense Reductions.
Many of the brokers with whom FMR places trades on behalf of the Fund provided services to the Fund in addition to trade execution. These services included payments of certain expenses on behalf of the Fund totaling $79,669 for the period. In addition, through arrangements with the Fund's custodian, credits realized as a result of uninvested cash balances were used to reduce the Fund's expenses. During the period, these credits reduced the Fund's custody expenses by $6,376.
Annual Report
10. Other.
The Fund's organizational documents provide former and current trustees and officers with a limited indemnification against liabilities arising in connection with the performance of their duties to the Fund. In the normal course of business, the Fund may also enter into contracts that provide general indemnifications. The Fund's maximum exposure under these arrangements is unknown as this would be dependent on future claims that may be made against the Fund. The risk of material loss from such claims is considered remote.
At the end of the period, FMR or its affiliates were the owners of record of 28% of the total outstanding shares of the Fund and one otherwise unaffiliated shareholder was the owner of record of 19% of the total outstanding shares of the Fund.
The United States Securities and Exchange Commission ("SEC") is conducting an investigation of FMR (covering the years 2002 to 2004) arising from gifts, gratuities and business entertainment provided by certain brokers to certain individuals who were employed on FMR's domestic equity trading desk during that period. FMR is in discussions with the SEC staff regarding the possible resolution of the matter, but as of period-end no final resolution has been reached.
In December 2006, the Independent Trustees completed their own investigation of the matter with the assistance of independent counsel. The Independent Trustees and FMR agree that, despite the absence of proof that the Fidelity mutual funds experienced diminished execution quality as a result of the improper receipt of gifts and business entertainment, the conduct at issue was serious and is worthy of redress. Accordingly, the Independent Trustees have requested and FMR has agreed to pay $42 million to Fidelity mutual funds, plus interest to be determined at the time that payment is made. A method of allocating this payment among the funds has not yet been determined. The total payment to the Fund is not anticipated to have a material impact on the Fund's net assets. In addition, FMR reimbursed related legal expenses which are recorded in the accompanying Statement of Operations as an expense reduction.
11. Distributions to Shareholders.
Distributions to shareholders of each class were as follows:
Years ended December 31, | 2007 | 2006 |
From net investment income | | |
Initial Class | $ 117,226,118 | $ 63,434,414 |
Service Class | 1,107,972 | 706,426 |
Service Class 2 | 3,252,325 | 1,331,968 |
Investor Class | 2,196,427 | 301,562 |
Total | $ 123,782,842 | $ 65,774,370 |
From net realized gain | | |
Initial Class | $ 58,256,317 | $ - |
Service Class | 687,641 | - |
Service Class 2 | 1,584,992 | - |
Investor Class | 781,653 | - |
Total | $ 61,310,603 | $ - |
Annual Report
Notes to Financial Statements - continued
12. Share Transactions.
Transactions for each class of shares were as follows:
| Shares | Dollars |
Years ended December 31, | 2007 | 2006 | 2007 | 2006 |
Initial Class | | | | |
Shares sold | 2,612,166 | 2,117,965 | $ 42,425,316 | $ 31,923,801 |
Reinvestment of distributions | 11,325,893 | 4,291,909 | 175,482,435 | 63,434,414 |
Shares redeemed | (38,252,281) | (34,074,425) | (605,126,794) | (513,616,796) |
Net increase (decrease) | (24,314,222) | (27,664,551) | $ (387,219,043) | $ (418,258,581) |
Service Class | | | | |
Shares sold | 219,346 | 138,220 | $ 3,525,031 | $ 2,085,823 |
Reinvestment of distributions | 117,606 | 48,056 | 1,795,613 | 706,426 |
Shares redeemed | (1,054,962) | (614,188) | (16,540,256) | (9,243,261) |
Net increase (decrease) | (718,010) | (427,912) | $ (11,219,612) | $ (6,451,012) |
Service Class 2 | | | | |
Shares sold | 675,528 | 2,616,207 | $ 10,786,206 | $ 38,570,263 |
Reinvestment of distributions | 315,652 | 91,356 | 4,837,317 | 1,331,968 |
Shares redeemed | (931,541) | (2,595,506) | (14,765,977) | (37,521,668) |
Net increase (decrease) | 59,639 | 112,057 | $ 857,546 | $ 2,380,563 |
Investor Class | | | | |
Shares sold | 1,161,487 | 1,227,221 | $ 18,608,136 | $ 18,486,890 |
Reinvestment of distributions | 189,870 | 20,431 | 2,978,080 | 301,562 |
Shares redeemed | (264,027) | (139,388) | (4,185,701) | (2,111,200) |
Net increase (decrease) | 1,087,330 | 1,108,264 | $ 17,400,515 | $ 16,677,252 |
Annual Report
Report of Independent Registered Public Accounting Firm
To the Trustees of Variable Insurance Products Fund V and Shareholders of VIP Asset Manager Portfolio:
We have audited the accompanying statement of assets and liabilities of VIP Asset Manager Portfolio (the Fund), a fund of Variable Insurance Products Fund V, including the schedule of investments, as of December 31, 2007, and the related statement of operations for the year then ended, the statement of changes in net assets for each of the two years in the period then ended, and the financial highlights for each of the five years in the period then ended. These financial statements and financial highlights are the responsibility of the Fund's management. Our responsibility is to express an opinion on these financial statements and financial highlights based on our audits.
We conducted our audits in accordance with standards of the Public Company Accounting Oversight Board (United States). Those standards require that we plan and perform the audit to obtain reasonable assurance about whether the financial statements and financial highlights are free of material misstatement. The Fund is not required to have, nor were we engaged to perform, an audit of its internal control over financial reporting. Our audits included consideration of internal control over financial reporting as a basis for designing audit procedures that are appropriate in the circumstances, but not for the purpose of expressing an opinion on the effectiveness of the Fund's internal control over financial reporting. Accordingly, we express no such opinion. An audit also includes examining, on a test basis, evidence supporting the amounts and disclosures in the financial statements, assessing the accounting principles used and significant estimates made by management, as well as evaluating the overall financial statement presentation. Our procedures included confirmation of securities owned as of December 31, 2007, by correspondence with the custodians and brokers; where replies were not received from brokers, we performed other auditing procedures. We believe that our audits provide a reasonable basis for our opinion.
In our opinion, the financial statements and financial highlights referred to above present fairly, in all material respects, the financial position of VIP Asset Manager Portfolio as of December 31, 2007, the results of its operations for the year then ended, the changes in its net assets for each of the two years in the period then ended, and its financial highlights for each of the five years in the period then ended, in conformity with accounting principles generally accepted in the United States of America.
/s/ Deloitte & Touche LLP
DELOITTE & TOUCHE LLP
Boston, Massachusetts
February 28, 2008
Annual Report
Trustees and Officers
The Trustees, Members of the Advisory Board, and executive officers of the trust and fund, as applicable, are listed below. The Board of Trustees governs the fund and is responsible for protecting the interests of shareholders. The Trustees are experienced executives who meet periodically throughout the year to oversee the fund's activities, review contractual arrangements with companies that provide services to the fund, and review the fund's performance. Except for James C. Curvey, each of the Trustees oversees 373 funds advised by FMR or an affiliate. Mr. Curvey oversees 368 funds advised by FMR or an affiliate.
The Trustees hold office without limit in time except that (a) any Trustee may resign; (b) any Trustee may be removed by written instrument, signed by at least two-thirds of the number of Trustees prior to such removal; (c) any Trustee who requests to be retired or who has become incapacitated by illness or injury may be retired by written instrument signed by a majority of the other Trustees; and (d) any Trustee may be removed at any special meeting of shareholders by a two-thirds vote of the outstanding voting securities of the trust. Each Trustee who is not an interested person (as defined in the 1940 Act) (Independent Trustee), shall retire not later than the last day of the calendar year in which his or her 72nd birthday occurs. The Independent Trustees may waive this mandatory retirement age policy with respect to individual Trustees. The executive officers and Advisory Board Members hold office without limit in time, except that any officer and Advisory Board Member may resign or may be removed by a vote of a majority of the Trustees at any regular meeting or any special meeting of the Trustees. Except as indicated, each individual has held the office shown or other offices in the same company for the past five years.
The fund's Statement of Additional Information (SAI) includes more information about the Trustees. To request a free copy, call Fidelity at 1-800-544-8544.
Interested Trustees*:
Correspondence intended for each Trustee who is an interested person may be sent to Fidelity Investments, 82 Devonshire Street, Boston, Massachusetts 02109.
Name, Age; Principal Occupation |
Edward C. Johnson 3d (77) |
| Year of Election or Appointment: 1989 Mr. Johnson is Chairman of the Board of Trustees. Mr. Johnson serves as President (2006-present), Chief Executive Officer, Chairman, and a Director of FMR LLC; Chairman and a Director of FMR; Chairman and a Director of Fidelity Research & Analysis Company (FRAC); Chairman and a Director of Fidelity Investments Money Management, Inc.; and Chairman (2001-present) and a Director of FMR Co., Inc. In addition, Mr. Johnson serves as Chairman and Director of Fidelity International Limited (FIL). Mr. Edward C. Johnson 3d and Mr. Arthur E. Johnson are not related. |
James C. Curvey (72) |
| Year of Election or Appointment: 2007 Mr. Curvey also serves as Trustee (2007-present) or Member of the Advisory Board (2007-present) of other investment companies advised by FMR. Mr. Curvey is a Director of FMR and FMR Co., Inc. (2007-present). Mr. Curvey is also Vice Chairman (2006-present) and Director of FMR LLC. Mr. Curvey joined Fidelity in 1982 and served in numerous senior management positions, including President and Chief Operating Officer of FMR LLC (1997-2000) and President of Fidelity Strategic Investments (2000-2002). In addition, he serves as a member of the Board of Directors of Geerlings & Wade, Inc. (wine distribution). |
* Trustees have been determined to be "Interested Trustees" by virtue of, among other things, their affiliation with the trust or various entities under common control with FMR. FMR Corp. merged with and into FMR LLC on October 1, 2007. Any references to FMR LLC for prior periods are deemed to be references to the prior entity.
Independent Trustees:
Correspondence intended for each Independent Trustee (that is, the Trustees other than the Interested Trustees) may be sent to Fidelity Investments, P.O. Box 55235, Boston, Massachusetts 02205-5235.
Name, Age; Principal Occupation |
Dennis J. Dirks (59) |
| Year of Election or Appointment: 2005 Prior to his retirement in May 2003, Mr. Dirks was Chief Operating Officer and a member of the Board of The Depository Trust & Clearing Corporation (DTCC) (1999-2003). He also served as President, Chief Operating Officer, and Board member of The Depository Trust Company (DTC) (1999-2003) and President and Board member of the National Securities Clearing Corporation (NSCC) (1999-2003). In addition, Mr. Dirks served as Chief Executive Officer and Board member of the Government Securities Clearing Corporation (2001-2003) and Chief Executive Officer and Board member of the Mortgage-Backed Securities Clearing Corporation (2001-2003). Mr. Dirks also serves as a Trustee and a member of the Finance Committee of Manhattan College (2005-present) and a Trustee and a member of the Finance Committee of AHRC of Nassau County (2006-present). |
Albert R. Gamper, Jr. (65) |
| Year of Election or Appointment: 2006 Prior to his retirement in December 2004, Mr. Gamper served as Chairman of the Board of CIT Group Inc. (commercial finance). During his tenure with CIT Group Inc. Mr. Gamper served in numerous senior management positions, including Chairman (1987-1989; 1999-2001; 2002-2004), Chief Executive Officer (1987-2004), and President (1989-2002). He currently serves as a member of the Board of Directors of Public Service Enterprise Group (utilities, 2001-present), Chairman of the Board of Governors, Rutgers University (2004-present), and Chairman of the Board of Saint Barnabas Health Care System. |
George H. Heilmeier (71) |
| Year of Election or Appointment: 2004 Dr. Heilmeier is Chairman Emeritus of Telcordia Technologies (communication software and systems), where prior to his retirement, he served as company Chairman and Chief Executive Officer. He currently serves on the Boards of Directors of The Mitre Corporation (systems engineering and information technology support for the government), and HRL Laboratories (private research and development, 2004-present). He is Chairman of the General Motors Science & Technology Advisory Board and a Life Fellow of the Institute of Electrical and Electronics Engineers (IEEE). Dr. Heilmeier is a member of the Defense Science Board and the National Security Agency Advisory Board. He is also a member of the National Academy of Engineering, the American Academy of Arts and Sciences, and the Board of Overseers of the School of Engineering and Applied Science of the University of Pennsylvania. Previously, Dr. Heilmeier served as a Director of TRW Inc. (automotive, space, defense, and information technology, 1992-2002), Compaq (1994-2002), Automatic Data Processing, Inc. (ADP) (technology-based business outsourcing, 1995-2002), INET Technologies Inc. (telecommunications network surveillance, 2001-2004), and Teletech Holdings (customer management services). He is the recipient of the 2005 Kyoto Prize in Advanced Technology for his invention of the liquid crystal display, and a member of the Consumer Electronics Hall of Fame. |
James H. Keyes (67) |
| Year of Election or Appointment: 2007 Prior to his retirement in 2003, Mr. Keyes was Chairman, President, and Chief Executive Officer of Johnson Controls, Inc. (automotive supplier, 1993-2003). He currently serves as a member of the boards of LSI Logic Corporation (semiconductor technologies), Navistar International Corporation (manufacture and sale of trucks, buses, and diesel engines, 2002-present), and Pitney Bowes, Inc. (integrated mail, messaging, and document management solutions). |
Marie L. Knowles (61) |
| Year of Election or Appointment: 2001 Prior to Ms. Knowles' retirement in June 2000, she served as Executive Vice President and Chief Financial Officer of Atlantic Richfield Company (ARCO) (diversified energy, 1996-2000). From 1993 to 1996, she was a Senior Vice President of ARCO and President of ARCO Transportation Company. She served as a Director of ARCO from 1996 to 1998. She currently serves as a Director of Phelps Dodge Corporation (copper mining and manufacturing) and McKesson Corporation (healthcare service, 2002-present). Ms. Knowles is a Trustee of the Brookings Institution and the Catalina Island Conservancy and also serves as a member of the Advisory Board for the School of Engineering of the University of Southern California. |
Ned C. Lautenbach (63) |
| Year of Election or Appointment: 2000 Mr. Lautenbach is Chairman of the Independent Trustees (2006-present). Mr. Lautenbach has been a partner of Clayton, Dubilier & Rice, Inc. (private equity investment firm) since September 1998. Previously, Mr. Lautenbach was with the International Business Machines Corporation (IBM) from 1968 until his retirement in 1998. Mr. Lautenbach serves as a Director of Sony Corporation (2006-present) and Eaton Corporation (diversified industrial) as well as the Philharmonic Center for the Arts in Naples, Florida. He also is a member of the Board of Trustees of Fairfield University (2005-present), as well as a member of the Council on Foreign Relations. |
Cornelia M. Small (63) |
| Year of Election or Appointment: 2005 Ms. Small is a member (2000-present) and Chairperson (2002-present) of the Investment Committee, and a member (2002-present) of the Board of Trustees of Smith College. Previously, she served as Chief Investment Officer (1999-2000), Director of Global Equity Investments (1996-1999), and a member of the Board of Directors of Scudder, Stevens & Clark (1990-1997) and Scudder Kemper Investments (1997-1999). In addition, Ms. Small served as Co-Chair (2000-2003) of the Annual Fund for the Fletcher School of Law and Diplomacy. |
William S. Stavropoulos (68) |
| Year of Election or Appointment: 2001 Mr. Stavropoulos is Chairman Emeritus of the Board of Directors of The Dow Chemical Company. Since joining The Dow Chemical Company in 1967, Mr. Stavropoulos served in numerous senior management positions, including President (1993-2000; 2002-2003), CEO (1995-2000; 2002-2004), and Chairman of the Executive Committee (2000-2004). Currently, he is a Director of NCR Corporation (data warehousing and technology solutions), Chemical Financial Corporation, Maersk Inc. (industrial conglomerate, 2002-present), Tyco International, Inc. (multinational manufacturing and services, 2007-present), and a member of the Advisory Board for Metalmark Capital (private equity investment firm, 2005-present). He is a special advisor to Clayton, Dubilier & Rice, Inc., a private equity investment firm. He also serves as a member of the Board of Trustees of the American Enterprise Institute for Public Policy Research. In addition, Mr. Stavropoulos is a member of The Business Council, J.P. Morgan International Council and the University of Notre Dame Advisory Council for the College of Science. |
Kenneth L. Wolfe (68) |
| Year of Election or Appointment: 2005 Mr. Wolfe is Chairman and a Director of Hershey Foods Corporation (2007-present), where prior to his retirement in 2001, he was Chairman and Chief Executive Officer. Mr. Wolfe currently serves as a member of the board of Revlon Inc. (2004-present). Previously, Mr. Wolfe served as a member of the boards of Adelphia Communications Corporation (2003-2006) and Bausch & Lomb, Inc. (1993-2007). |
Advisory Board Members and Executive Officers**:
Correspondence intended for Mr. Mauriello, Mr. Thomas, Mr. Wiley, Mr. Lacy, and Mr. Arthur Johnson may be sent to Fidelity Investments, P.O. Box 55235, Boston, Massachusetts 02205-5235. Correspondence intended for each executive officer and Mr. Lynch may be sent to Fidelity Investments, 82 Devonshire Street, Boston, Massachusetts 02109.
Name, Age; Principal Occupation |
Arthur E. Johnson (60) |
| Year of Election or Appointment: 2008 Member of the Advisory Board of Variable Insurance Products Fund V. Mr. Johnson serves as Senior Vice President of Corporate Strategic Development of Lockheed Martin Corporation (defense contractor). In addition, Mr. Johnson serves as a member of the Board of Directors of AGL Resources, Inc. (holding company, 2002-present), and IKON Office Solutions, Inc. (document management systems and services). Mr. Arthur E. Johnson and Mr. Edward C. Johnson 3d are not related. |
Alan J. Lacy (54) |
| Year of Election or Appointment: 2008 Member of the Advisory Board of Variable Insurance Products Fund V. Mr. Lacy serves as Senior Adviser (2007-present) of Oak Hill Capital Partners, L.P. (a private equity firm). Mr. Lacy also served as Vice Chairman and Chief Executive Officer of Sears Holdings Corporation and Sears, Roebuck and Co. (retail, 2005-2006; 2000-2005). In addition, Mr. Lacy serves as a member of the Board of Directors of The Western Union Company (global money transfer, 2006-present) and Bristol-Myers Squibb (global pharmaceuticals, 2007-present). Mr. Lacy is a Trustee of the National Parks Conservation Association and The Field Museum of Natural History. |
Peter S. Lynch (63) |
| Year of Election or Appointment: 2003 Member of the Advisory Board of Variable Insurance Products Fund V. Mr. Lynch is Vice Chairman and a Director of FMR, and Vice Chairman (2001-present) and a Director of FMR Co., Inc. Previously, Mr. Lynch served as a Trustee of the Fidelity funds (1990-2003). In addition, he serves as a Trustee of Boston College and as the Chairman of the Inner-City Scholarship Fund. |
Joseph Mauriello (63) |
| Year of Election or Appointment: 2007 Member of the Advisory Board of Variable Insurance Products Fund V. Prior to his retirement in January 2006, Mr. Mauriello served in numerous senior management positions including Deputy Chairman and Chief Operating Officer (2004-2005), and Vice Chairman of Financial Services (2002-2004) of KPMG LLP US (professional services firm, 1965-2005). Mr. Mauriello currently serves as a member of the Board of Directors of XL Capital Ltd. (global insurance and re-insurance company, 2006-present) and of Arcadia Resources Inc. (health care services and products, 2007-present). He also served as a Director of the Hamilton Funds of the Bank of New York (2006-2007). |
David M. Thomas (58) |
| Year of Election or Appointment: 2007 Member of the Advisory Board of Variable Insurance Products Fund V. Previously, Mr. Thomas served as Executive Chairman (2005-2006) and Chairman and Chief Executive Officer (2000-2005) of IMS Health, Inc. (pharmaceutical and healthcare information solutions). In addition, Mr. Thomas serves as a member of the Board of Directors of Fortune Brands, Inc. (consumer products holding company), and Interpublic Group of Companies, Inc. (marketing communication, 2004-present). |
Michael E. Wiley (57) |
| Year of Election or Appointment: 2007 Member of the Advisory Board of Variable Insurance Products Fund V. Mr. Wiley also serves as a member of the Board of Trustees of the University of Tulsa (2000-2006; 2007-present). He serves as a Director of Tesoro Corporation (independent oil refiner and marketer, 2005-present), and a Director of Bill Barrett Corporation (exploration and production company, 2005-present). In addition, he also serves as a Director of Post Oak Bank (privately-held bank, 2004-present). Previously, Mr. Wiley served as a Sr. Energy Advisor of Katzenbach Partners, LLC (consulting firm, 2006-2007), as an Advisory Director of Riverstone Holdings (private investment firm), Chairman, President, and CEO of Baker Hughes, Inc. (oilfield services company, 2000-2004), and as Director of Spinnaker Exploration Company (exploration and production company, 2001-2005). |
Kimberley H. Monasterio (44) |
| Year of Election or Appointment: 2007 President and Treasurer of VIP Asset Manager. Ms. Monasterio also serves as President and Treasurer of other Fidelity funds (2007-present) and is an employee of FMR (2004-present). Previously, Ms. Monasterio served as Deputy Treasurer of the Fidelity funds (2004-2006). Before joining Fidelity Investments, Ms. Monasterio served as Treasurer (2000-2004) and Chief Financial Officer (2002-2004) of the Franklin Templeton Funds and Senior Vice President of Franklin Templeton Services, LLC (2000-2004). |
Ren Y. Cheng (50) |
| Year of Election or Appointment: 2007 Vice President of VIP Asset Manager. Mr. Cheng also serves as Vice President of certain Asset Allocation Funds (2007-present). Mr. Cheng is Chief Investment Officer of the Global Asset Allocation group (2007-present). Mr. Cheng also serves as Vice President of FMR and FMR Co., Inc. Mr. Cheng served as Managing Director of the Global Asset Allocation group (2005-2007). Previously, Mr. Cheng served as a portfolio manager for the Fidelity Freedom Funds. |
Boyce I. Greer (51) |
| Year of Election or Appointment: 2005 Vice President of VIP Asset Manager. Mr. Greer also serves as Vice President of certain Asset Allocation Funds (2005-present), Fixed-Income Funds (2006-present), and Money Market Funds (2006-present). Mr. Greer is also a Trustee of other investment companies advised by FMR (2003-present). Mr. Greer is an Executive Vice President of FMR (2005-present) and FMR Co., Inc. (2005-present), and Senior Vice President of Fidelity Investments Money Management, Inc. (2006-present). Previously, Mr. Greer served as Vice President of certain Fidelity Equity Funds (2005-2007), a Director and Managing Director of Strategic Advisers, Inc. (2002-2005), and Executive Vice President (2000-2002) and Money Market Group Leader (1997-2002) of the Fidelity Investments Fixed Income Division. Mr. Greer also served as Vice President of Fidelity's Money Market Funds (1997-2002), Senior Vice President of FMR (1997-2002), and Vice President of FIMM (1998-2002). |
Eric D. Roiter (59) |
| Year of Election or Appointment: 1998 Secretary of VIP Asset Manager. He also serves as Secretary of other Fidelity funds; Vice President, General Counsel, and Secretary of FMR Co., Inc. (2001-present) and FMR; Assistant Secretary of Fidelity Management & Research (U.K.) Inc. (2001-present), Fidelity Research & Analysis Company (2001-present), and Fidelity Investments Money Management, Inc. (2001-present). Mr. Roiter is an Adjunct Member, Faculty of Law, at Boston College Law School (2003-present). Previously, Mr. Roiter served as Vice President and Secretary of Fidelity Distributors Corporation (FDC) (1998-2005). |
John B. McGinty, Jr. (45) |
| Year of Election or Appointment: 2008 Assistant Secretary of VIP Asset Manager. Mr. McGinty also serves as Assistant Secretary of other Fidelity funds (2008-present) and is an employee of FMR LLC (2004-present). Mr. McGinty also serves as Senior Vice President, Secretary, and Chief Legal Officer of FDC (2007-present). Before joining Fidelity Investments, Mr. McGinty practiced law at Ropes & Gray, LLP. |
R. Stephen Ganis (41) |
| Year of Election or Appointment: 2006 Anti-Money Laundering (AML) officer of VIP Asset Manager. Mr. Ganis also serves as AML officer of other Fidelity funds (2006-present) and FMR LLC (2003-present). Before joining Fidelity Investments, Mr. Ganis practiced law at Goodwin Procter, LLP (2000-2002). |
Joseph B. Hollis (59) |
| Year of Election or Appointment: 2006 Chief Financial Officer of VIP Asset Manager. Mr. Hollis also serves as Chief Financial Officer of other Fidelity funds. Mr. Hollis is President of Fidelity Pricing and Cash Management Services (FPCMS) (2005-present). Mr. Hollis also serves as President and Director of Fidelity Service Company, Inc. (2006-present). Previously, Mr. Hollis served as Senior Vice President of Cash Management Services (1999-2002) and Investment Management Operations (2002-2005). |
Kenneth A. Rathgeber (60) |
| Year of Election or Appointment: 2004 Chief Compliance Officer of VIP Asset Manager. Mr. Rathgeber also serves as Chief Compliance Officer of other Fidelity funds (2004-present) and Executive Vice President of Risk Oversight for Fidelity Investments (2002-present). He is Chief Compliance Officer of FMR (2005-present), FMR Co., Inc. (2005-present), Fidelity Management & Research (U.K.) Inc. (2005-present), Fidelity Research & Analysis Company (2005-present), Fidelity Investments Money Management, Inc. (2005-present), and Strategic Advisers, Inc. (2005-present). Previously, Mr. Rathgeber served as Executive Vice President and Chief Operating Officer for Fidelity Investments Institutional Services Company, Inc. (1998-2002). |
Bryan A. Mehrmann (46) |
| Year of Election or Appointment: 2005 Deputy Treasurer of VIP Asset Manager. Mr. Mehrmann also serves as Deputy Treasurer of other Fidelity funds (2005-present) and is an employee of FMR. Previously, Mr. Mehrmann served as Vice President of Fidelity Investments Institutional Services Group (FIIS)/Fidelity Investments Institutional Operations Corporation, Inc. (FIIOC) Client Services (1998-2004). |
Kenneth B. Robins (38) |
| Year of Election or Appointment: 2005 Deputy Treasurer of VIP Asset Manager. Mr. Robins also serves as Deputy Treasurer of other Fidelity funds (2005-present) and is an employee of FMR (2004-present). Before joining Fidelity Investments, Mr. Robins worked at KPMG LLP, where he was a partner in KPMG's department of professional practice (2002-2004) and a Senior Manager (1999-2000). In addition, Mr. Robins served as Assistant Chief Accountant, United States Securities and Exchange Commission (2000-2002). |
Robert G. Byrnes (41) |
| Year of Election or Appointment: 2005 Assistant Treasurer of VIP Asset Manager. Mr. Byrnes also serves as Assistant Treasurer of other Fidelity funds (2005-present) and is an employee of FMR (2005-present). Previously, Mr. Byrnes served as Vice President of FPCMS (2003-2005). Before joining Fidelity Investments, Mr. Byrnes worked at Deutsche Asset Management where he served as Vice President of the Investment Operations Group (2000-2003). |
Peter L. Lydecker (53) |
| Year of Election or Appointment: 2004 Assistant Treasurer of VIP Asset Manager. Mr. Lydecker also serves as Assistant Treasurer of other Fidelity funds (2004) and is an employee of FMR. |
Paul M. Murphy (60) |
| Year of Election or Appointment: 2007 Assistant Treasurer of VIP Asset Manager. Mr. Murphy also serves as Assistant Treasurer of other Fidelity funds (2007-present) and is an employee of FMR (2007-present). Previously, Mr. Murphy served as Chief Financial Officer of the Fidelity Funds (2005-2006), Vice President and Associate General Counsel of FMR (2007), and Senior Vice President of Fidelity Pricing and Cash Management Services Group (FPCMS) (1994-2007). |
Gary W. Ryan (49) |
| Year of Election or Appointment: 2005 Assistant Treasurer of VIP Asset Manager. Mr. Ryan also serves as Assistant Treasurer of other Fidelity funds (2005-present) and is an employee of FMR (2005-present). Previously, Mr. Ryan served as Vice President of Fund Reporting in FPCMS (1999-2005). |
** FMR Corp. merged with and into FMR LLC on October 1, 2007. Any references to FMR LLC for prior periods are deemed to be references to the prior entity.
Annual Report
Distributions
The Board of Trustees of VIP Asset Manager Portfolio voted to pay to shareholders of record at the opening of business on record date, the following distributions per share derived from capital gains realized from sales of portfolio securities:
Fund | Pay Date | Record Date | Capital Gains |
Initial Class | 02/15/08 | 02/15/08 | $1.51 |
Service Class | 02/15/08 | 02/15/08 | $1.51 |
Service Class 2 | 02/15/08 | 02/15/08 | $1.51 |
Investor Class | 02/15/08 | 02/15/08 | $1.51 |
The fund hereby designates as a capital gain dividend with respect to the taxable year ended December 31, 2007, $72,703,142, or, if subsequently determined to be different, the net capital gain of such year.
Initial Class designates 12% and 9%; Service Class designates 12% and 10%; Service Class 2 designates 13% and 10%; and Investor Class designates 12% and 10%; of the dividends distributed in February and December 2007, respectively as qualifying for the dividends-received deduction for corporate shareholders.
The fund will notify shareholders in January 2008 of amounts for use in preparing 2007 income tax returns.
Annual Report
Board Approval of Investment Advisory Contracts and Management Fees
VIP Asset Manager Portfolio
Each year, typically in July, the Board of Trustees, including the Independent Trustees (together, the Board), votes on the renewal of the management contract and sub-advisory agreements (together, the Advisory Contracts) for the fund. The Board, assisted by the advice of fund counsel and Independent Trustees' counsel, requests and considers a broad range of information throughout the year.
The Board meets regularly each month except August and takes into account throughout the year matters bearing on Advisory Contracts. The Board, acting directly and through its separate committees, considers at each of its meetings factors that are relevant to the annual renewal of the fund's Advisory Contracts, including the services and support provided to the fund and its shareholders. At the time of the renewal, the Board had 12 standing committees, each composed of Independent Trustees with varying backgrounds, to which the Board has assigned specific subject matter responsibilities in order to enhance effective decision-making by the Board. Each committee has adopted a written charter outlining the structure and purposes of the committee. One such committee, the Equity Contract Committee, meets periodically as needed throughout the year to consider matters specifically related to the annual renewal of Advisory Contracts. The committee requests and receives information on, and makes recommendations to the Independent Trustees concerning, the approval and annual review of the Advisory Contracts.
At its July 2007 meeting, the Board of Trustees, including the Independent Trustees, unanimously determined to renew the Advisory Contracts for the fund. In reaching its determination, the Board considered all factors it believed relevant, including (i) the nature, extent, and quality of the services to be provided to the fund and its shareholders (including the investment performance of the fund); (ii) the competitiveness of the management fee and total expenses of the fund; (iii) the total costs of the services to be provided by and the profits to be realized by the investment adviser and its affiliates from the relationship with the fund; (iv) the extent to which economies of scale would be realized as the fund grows; and (v) whether fee levels reflect these economies of scale, if any, for the benefit of fund shareholders. The Board also approved amendments to the fund's agreements with foreign sub-advisers to clarify that each sub-adviser provides services as an independent contractor.
In determining whether to renew the Advisory Contracts for the fund, the Board ultimately reached a determination, with the assistance of fund counsel and Independent Trustees' counsel, that the renewal of the Advisory Contracts and the compensation to be received by Fidelity under the management contract is consistent with Fidelity's fiduciary duty under applicable law. In addition to evaluating the specific factors noted above, the Board, in reaching its determination, is aware that shareholders in the fund have a broad range of investment choices available to them, including a wide choice among mutual funds offered by competitors to Fidelity, and that the fund's shareholders, with the opportunity to review and weigh the disclosure provided by the fund in its prospectus and other public disclosures, have chosen to invest in this fund, managed by Fidelity.
Nature, Extent, and Quality of Services Provided. The Board considered staffing within the investment adviser, FMR, and the sub-advisers (together, the Investment Advisers), including the backgrounds of the fund's portfolio managers and the fund's investment objective and discipline. The Independent Trustees also had discussions with senior management of Fidelity's investment operations and investment groups. The Board considered the structure of the portfolio manager compensation program and whether this structure provides appropriate incentives.
Resources Dedicated to Investment Management and Support Services. The Board reviewed the size, education, and experience of the Investment Advisers' investment staff, their use of technology, and the Investment Advisers' approach to recruiting, training, and retaining portfolio managers and other research, advisory, and management personnel. The Board considered Fidelity's extensive global research capabilities that enable the Investment Advisers to aggregate data from various sources in an effort to produce positive investment results. The Board noted that Fidelity's analysts have access to a variety of technological tools that enable them to perform both fundamental and quantitative analysis and to specialize in various disciplines. The Board also considered that Fidelity's portfolio managers and analysts have access to daily portfolio attribution that allows for monitoring of a fund's portfolio, as well as an electronic communication system that provides immediate real-time access to research concerning issuers and credit enhancers.
Shareholder and Administrative Services. The Board considered (i) the nature, extent, quality, and cost of advisory, administrative, distribution, and shareholder services performed by the Investment Advisers and their affiliates under the Advisory Contracts and under separate agreements covering transfer agency, pricing and bookkeeping, and securities lending services for the fund; (ii) the nature and extent of the Investment Advisers' supervision of third party service providers, principally custodians and subcustodians; and (iii) the resources devoted to, and the record of compliance with, the fund's compliance policies and procedures. The Board reviewed the allocation of fund brokerage, including allocations to brokers affiliated with the Investment Advisers, the use of brokerage commissions to pay fund expenses, and the use of "soft" commission dollars to pay for research services. The Board also considered that Fidelity voluntarily pays for market data out of its own resources. The Board also considered the agreement reached between the Independent Trustees and Fidelity in December 2006 following an independent review of matters relating to receipt of travel, entertainment, gifts and gratuities in violation of Fidelity policies.
The Board noted that the growth of fund assets across the complex allows Fidelity to reinvest in the development of services designed to enhance the value or convenience of the Fidelity funds as investment vehicles. These services include 24-hour access to account information and market information through phone representatives and over the Internet, and investor education materials and asset allocation tools.
Annual Report
Investment in a Large Fund Family. The Board considered the benefits to shareholders of investing in a Fidelity fund, including the benefits of investing in a fund that is part of a large family of funds offering a variety of investment disciplines and providing for a large variety of mutual fund investor services. The Board noted that, since the last Advisory Contract renewals in July 2006, Fidelity has taken a number of actions that benefited particular funds, including (i) dedicating additional resources to investment research and to restructure the investment research teams; (ii) contractually agreeing to reduce the management fee on Fidelity Advisor Floating Rate High Income Fund; (iii) contractually agreeing to reduce the management fees on Fidelity's California, Massachusetts, New Jersey, and New York AMT Tax-Free Money Market Funds, launching new Institutional Classes and Service Classes of these funds, and contractually agreeing to impose expense limitations on these funds; (iv) eliminating the exchange fee on the Fidelity Select Portfolios and reducing the pricing and bookkeeping fee rates for these funds; (v) reducing the maximum transfer agency fee rates on high income funds and certain equity funds; (vi) proposing amended management contracts that, if approved by shareholders, will add a performance adjustment component to the management fees paid by 18 Fidelity Advisor equity funds; (vii) contractually agreeing to reduce fees for Ultra-Short Central Fund and the money market Central Funds; (viii) waiving the Fidelity Advisor funds' contingent deferred sales charge on certain redemptions made through systematic withdrawal programs; and (ix) amending the management contracts for equity and fixed-income funds whose management contracts incorporate a "group fee" structure by adding four new fee "breakpoints" to the group fee rate schedules.
Investment Performance and Compliance. The Board considered whether the fund has operated within its investment objective, as well as its record of compliance with its investment restrictions. It also reviewed the fund's absolute investment performance for each class, as well as the fund's relative investment performance for each class measured against (i) a proprietary custom index, and (ii) a peer group of mutual funds deemed appropriate by the Board over multiple periods. The following charts considered by the Board show, over the one-, three-, and five-year periods ended December 31, 2006, the cumulative total returns of Initial Class and Service Class 2 of the fund, the cumulative total returns of a proprietary custom index ("benchmark"), and a range of cumulative total returns of a peer group of mutual funds identified by Morningstar, Inc. as having an investment style similar to that of the fund based on underlying portfolio holdings. The returns of Initial Class and Service Class 2 show the performance of the highest and lowest performing classes, respectively (based on three-year performance). The box within each chart shows the 25th percentile return (bottom of box) and the 75th percentile return (top of box) of the peer group. Returns shown above the box are in the first quartile and returns shown below the box are in the fourth quartile. The percentage beaten numbers noted below each chart correspond to the percentile box and represent the percentage of funds in the peer group whose performance was equal to or lower than that of the class indicated. The fund's proprietary custom index is an index developed by FMR that represents the performance of the fund's three asset classes according to their respective weightings in the fund's neutral mix.
VIP Asset Manager Portfolio
The Board reviewed the fund's relative investment performance against its peer group and stated that the performance of Initial Class of the fund was in the fourth quartile for all the periods shown. The Board also stated that the investment performance of the fund was lower than its benchmark for all the periods shown. The Board considered that the variations in performance among the fund's classes reflect the variations in class expenses, which result in lower performance for higher expense classes. The Board discussed with FMR actions to be taken by FMR to improve the fund's disappointing performance relative to its peer group. The Board will continue to closely monitor the performance of the fund in the coming year and discuss with FMR other appropriate actions to address the performance of the fund.
The Board considered that FMR has taken steps to refocus and strengthen equity research, equity portfolio management, and compliance.
Annual Report
Board Approval of Investment Advisory Contracts and Management Fees - continued
Based on its review, and giving particular weight to the nature and quality of the resources dedicated by the Investment Advisers to maintain and improve relative performance, the Board concluded that the nature, extent, and quality of the services provided to the fund will benefit the fund's shareholders, particularly in light of the Board's view that the fund's shareholders benefit from investing in a fund that is part of a large family of funds offering a variety of investment disciplines and services.
Competitiveness of Management Fee and Total Fund Expenses. The Board considered the fund's management fee and total expenses compared to "mapped groups" of competitive funds and classes. Fidelity creates "mapped groups" by combining similar Lipper investment objective categories that have comparable management fee characteristics. Combining Lipper investment objective categories aids the Board's management fee and total expense comparisons by broadening the competitive group used for comparison and by reducing the number of universes to which various Fidelity funds are compared. The Board also considered supplemental information about how the fund's management fee and total expenses ranked relative to groups based on Lipper classifications, which take into account a fund's market capitalization and style.
The Board considered two proprietary management fee comparisons for the 12-month periods shown in the chart below. The group of Lipper funds used by the Board for management fee comparisons is referred to below as the "Total Mapped Group." The Total Mapped Group comparison focuses on a fund's standing relative to the total universe of comparable funds available to investors, in terms of gross management fees before expense reimbursements or caps. "TMG %" represents the percentage of funds in the Total Mapped Group that had management fees that were lower than the fund's. For example, a TMG % of 23% means that 77% of the funds in the Total Mapped Group had higher management fees than the fund. The "Asset-Size Peer Group" (ASPG) comparison focuses on a fund's standing relative to non-Fidelity funds similar in size to the fund within the Total Mapped Group. The ASPG represents at least 15% of the funds in the Total Mapped Group with comparable asset size and management fee characteristics, subject to a minimum of 50 funds (or all funds in the Total Mapped Group if fewer than 50). Additional information, such as the ASPG quartile in which the fund's management fee ranked, is also included in the chart and considered by the Board.
VIP Asset Manager Portfolio
The Board noted that the fund's management fee ranked below the median of its Total Mapped Group and below the median of its ASPG for 2006.
Based on its review, the Board concluded that the fund's management fee was fair and reasonable in light of the services that the fund receives and the other factors considered.
In its review of each class's total expenses, the Board considered the fund's management fee as well as other fund or class expenses, as applicable, such as transfer agent fees, pricing and bookkeeping fees, fund-paid 12b-1 fees, and custodial, legal, and audit fees. The Board also noted the effects of any waivers and reimbursements on fees and expenses. As part of its review, the Board also considered current and historical total expenses of each class of the fund compared to competitive fund median expenses. Each class of the fund is compared to those funds and classes in the Total Mapped Group (used by the Board for management fee comparisons) that have a similar sales load structure.
The Board noted that the total expenses of each of Initial Class, Investor Class and Service Class ranked below its competitive median for 2006, and the total expenses of Service Class 2 ranked above its competitive median for 2006. The Board noted that the fund offers multiple classes, each of which has a different 12b-1 fee structure, and that the multiple structures are intended to offer a range of pricing options for the intermediary market. The Board also noted that the total expenses of the classes vary primarily by the level of their 12b-1 fees, although differences in transfer agent fees may also cause expenses to vary from class to class.
Annual Report
In its review of total expenses, the Board also considered Fidelity fee structures and other information on clients that FMR and its affiliates service in other competitive markets, such as other mutual funds advised or subadvised by FMR or its affiliates, pension plan clients, and other institutional clients.
Based on its review, the Board concluded that the total expenses of each class of the fund were reasonable, although in one case above the median of the universe presented for comparison, in light of the services that the fund and its shareholders receive and the other factors considered.
Costs of the Services and Profitability. The Board considered the revenues earned and the expenses incurred by Fidelity in conducting the business of developing, marketing, distributing, managing, administering and servicing the fund and its shareholders. The Board also considered the level of Fidelity's profits in respect of all the Fidelity funds.
On an annual basis, FMR presents to the Board Fidelity's profitability for the fund. Fidelity calculates the profitability for each fund, as well as aggregate profitability for groups of Fidelity funds and all Fidelity funds, using a series of detailed revenue and cost allocation methodologies which originate with the audited books and records of Fidelity. The Audit Committee of the Board reviews any significant changes from the prior year's methodologies.
PricewaterhouseCoopers LLP (PwC), independent registered public accounting firm and auditor to Fidelity and certain Fidelity funds, has been engaged annually by the Board as part of the Board's assessment of the results of Fidelity's profitability analysis. PwC's engagement includes the review and assessment of Fidelity's methodologies used in determining the revenues and expenses attributable to Fidelity's mutual fund business, and completion of agreed-upon procedures surrounding the mathematical accuracy of fund profitability and its conformity to allocation methodologies. After considering PwC's reports issued under the engagement and information provided by Fidelity, the Board believes that while other allocation methods may also be reasonable, Fidelity's profitability methodologies are reasonable in all material respects.
The Board has also reviewed Fidelity's non-fund businesses and any fall-out benefits related to the mutual fund business as well as cases where Fidelity's affiliates may benefit from or be related to the fund's business.
The Board considered the costs of the services provided by and the profits realized by Fidelity in connection with the operation of the fund and determined that the amount of profit is a fair entrepreneurial profit for the management of the fund.
Economies of Scale. The Board considered whether there have been economies of scale in respect of the management of the Fidelity funds, whether the Fidelity funds (including the fund) have appropriately benefited from any such economies of scale, and whether there is potential for realization of any further economies of scale. The Board considered the extent to which the fund will benefit from economies of scale through increased services to the fund, through waivers or reimbursements, or through fee or expense reductions.
The Board recognized that the fund's management contract incorporates a "group fee" structure, which provides for lower group fee rates as total fund assets under FMR's management increase, and for higher group fee rates as total fund assets under FMR's management decrease. FMR determines the group fee rates based on a tiered asset "breakpoint" schedule. In connection with the renewal of the fund's management contract, the Board approved amendments to the fund's management contract that added four new fee breakpoints to the group fee rate schedule for assets under FMR's management above $1,386 billion. The Board considered that the group fee rate declines under both the present and amended schedules, but that under the amended schedule, the group fee rate declines faster as assets under FMR's management exceed $1,386 billion. The Board considered that the group fee is designed to deliver the benefits of economies of scale to fund shareholders when total fund assets increase, even if assets of any particular fund are unchanged or have declined, because some portion of Fidelity's costs are attributable to services provided to all Fidelity funds, and all funds benefit if those costs can be allocated among more assets. The Board concluded that, given the group fee structure, fund shareholders will achieve a certain level of economies of scale as assets under FMR's management increase at the fund complex level, regardless of whether Fidelity achieves any such economies of scale.
The Board further concluded that any potential economies of scale are being shared between fund shareholders and Fidelity in an appropriate manner.
Additional Information Requested by the Board. In order to develop fully the factual basis for consideration of the Fidelity funds' Advisory Contracts, the Board requested and received additional information on several topics, including (i) fund performance trends and actions to be taken by FMR to improve certain funds' overall performance; (ii) Fidelity's portfolio manager compensation structure, including its effects on fund profitability and the extent to which portfolio manager compensation is linked to fund performance; (iii) Fidelity's fee structures; (iv) the funds' sub-advisory arrangements; and (v) accounts managed by Fidelity other than the Fidelity funds.
Based on its evaluation of all of the conclusions noted above, and after considering all material factors, the Board ultimately concluded that the advisory fee structures are fair and reasonable, and that the fund's Advisory Contracts should be renewed.
Annual Report
Annual Report
Annual Report
Investment Adviser
Fidelity Management & Research Company
Boston, MA
Investment Sub-Advisers
FMR Co., Inc.
Fidelity Management & Research (U.K.) Inc.
Fidelity Research & Analysis Company
Fidelity Investments Money Management, Inc.
Fidelity Investments Japan Limited
Fidelity International Investment Advisors
Fidelity International Investment Advisors
(U.K.) Limited
General Distributor
Fidelity Distributors Corporation
Boston, MA
Transfer and Service Agents
Fidelity Investments Institutional Operations Co., Inc.
Boston, MA
Fidelity Service Company, Inc.
Boston, MA
Custodian
JPMorgan Chase Bank
New York, NY
VIPAM-ANN-0208
1.540206.110
Fidelity® Variable Insurance Products:
Asset Manager: Growth® Portfolio
Annual Report
December 31, 2007
(2_fidelity_logos) (Registered_Trademark)
Contents
Performance | <Click Here> | How the fund has done over time. |
Management's Discussion | <Click Here> | The managers' review of fund performance, strategy and outlook. |
Shareholder Expense Example | <Click Here> | An example of shareholder expenses. |
Investment Changes | <Click Here> | A summary of major shifts in the fund's investments over the past six months. |
Investments | <Click Here> | A complete list of the fund's investments with their
market values. |
Financial Statements | <Click Here> | Statements of assets and liabilities, operations, and
changes in net assets, as well as financial highlights. |
Notes | <Click Here> | Notes to the financial statements. |
Report of Independent Registered Public Accounting Firm | <Click Here> | |
Trustees and Officers | <Click Here> | |
Distributions | <Click Here> | |
Board Approval of Investment Advisory Contracts and Management Fees | <Click Here> | |
To view a fund's proxy voting guidelines and proxy voting record for the 12-month period ended June 30, visit http://www.fidelity.com (search for "proxy voting guidelines") or visit the Securities and Exchange Commission's (SEC) web site at http://www.sec.gov. You may also call 1-877-208-0098 to request a free copy of the proxy voting guidelines.
Fidelity Variable Insurance Products are separate account options which are purchased through a variable insurance contract.
Standard & Poor's, S&P and S&P 500 are registered service marks of The McGraw-Hill Companies, Inc. and have been licensed for use by Fidelity Distributors Corporation.
Other third party marks appearing herein are the property of their respective owners.
All other marks appearing herein are registered or unregistered trademarks or service marks of FMR LLC or an affiliated company.
This report and the financial statements contained herein are submitted for the general information of the shareholders of the fund. This report is not authorized for distribution to prospective investors in the fund unless preceded or accompanied by an effective prospectus.
A fund files its complete schedule of portfolio holdings with the SEC for the first and third quarters of each fiscal year on Form N-Q. Forms N-Q are available on the SEC's web site at http://www.sec.gov. A fund's Forms N-Q may be reviewed and copied at the SEC's Public Reference Room in Washington, DC. Information regarding the operation of the SEC's Public Reference Room may be obtained by calling 1-800-SEC-0330. For a complete list of a fund's portfolio holdings, view the most recent holdings listings, semiannual report, or annual report on Fidelity's web site at http://www.fidelity.com or http://www.advisor.fidelity.com, as applicable.
NOT FDIC INSURED · MAY LOSE VALUE · NO BANK GUARANTEE
Neither the fund nor Fidelity Distributors Corporation is a bank.
Annual Report
Performance: The Bottom Line
Average annual total return reflects the change in the value of an investment, assuming reinvestment of the class' dividend income and capital gains (the profits earned upon the sale of securities that have grown in value, if any) and assuming a constant rate of performance each year. During periods of reimbursement by Fidelity, a fund's total return will be greater than it would be had the reimbursement not occurred. Performance numbers are net of all underlying fund operating expenses, but do not include any insurance charges imposed by your insurance company's separate account. If performance information included the effect of these additional charges, the total returns would have been lower. How a fund did yesterday is no guarantee of how it will do tomorrow.
Average Annual Total Returns
Periods ended December 31, 2007 | Past 1
year | Past 5
years | Past 10
years |
VIP Asset Manager: Growth - Initial Class | 18.97% | 11.57% | 4.84% |
VIP Asset Manager: Growth - Service Class A | 18.79% | 11.44% | 4.70% |
VIP Asset Manager: Growth - Service Class 2 B | 18.68% | 11.26% | 4.55% |
VIP Asset Manager: Growth - Investor Class C | 18.78% | 11.47% | 4.79% |
A Performance for Service Class shares reflects an asset-based service fee (12b-1 fee).
B The initial offering of Service Class 2 shares took place on January 12, 2000. Performance for Service Class 2 shares reflects an asset-based service fee (12b-1 fee). Returns prior to January 12, 2000 are those of Service Class which reflect a different 12b-1 fee. Had Service Class 2's 12b-1 fee been reflected, returns prior to January 12, 2000 would have been lower.
C The initial offering of Investor Class shares took place on July 21, 2005. Returns prior to July 21, 2005 are those of Initial Class. If Investor Class's transfer agent fee had been reflected, returns prior to July 21, 2005 would have been lower.
$10,000 Over 10 Years
Let's say hypothetically that $10,000 was invested in VIP Asset Manager: Growth Portfolio - Initial Class on December 31, 1997. The chart shows how the value of your investment would have changed, and also shows how the Standard & Poor's 500SM Index (S&P 500®) performed over the same period.
Annual Report
Management's Discussion of Fund Performance
Comments from Richard Habermann and Derek Young, Lead Co-Managers of VIP Asset Manager: Growth Portfolio
U.S. equity markets, as measured by the bellwether Dow Jones Industrial AverageSM and the Standard & Poor's 500SM Index, registered their fifth consecutive year of positive returns in 2007, as the Dow rose 8.88% and the S&P 500® index advanced 5.49%. The tech-heavy NASDAQ Composite® Index did even better, increasing 10.55%. However, credit- and recession-related concerns carved deeply into stock prices late in 2007, pushing some major market measures into negative territory for the year overall, particularly smaller-cap and value-oriented benchmarks. Based largely on a weak U.S. dollar that boosted returns for U.S. investors, the Morgan Stanley Capital InternationalSM Europe, Australasia, and Far East (MSCI® EAFE®) Index - a gauge of developed stock markets outside the United States and Canada - beat most domestic equity measures, gaining 11.33%. Several European countries had outstanding performance, including Finland and Germany, while Australia also did very well. However, fallout from the credit crunch and concerns about export growth tempered U.K. stocks, while fears that Japanese financial companies would become embroiled in the U.S. subprime mortgage crisis contributed to a loss of more than 4% for the Japanese portion of the index. The emerging-markets stock asset class soared 39.78% according to the MSCI Emerging Markets index. The U.S. investment-grade bond market climbed 6.97% as measured by the Lehman Brothers® U.S. Aggregate Index, beating the 2.53% gain for the Merrill Lynch® U.S. High Yield Master II Constrained Index. The emerging-markets bond category shook off a sluggish first half of 2007 to finish the year with a respectable gain of 6.28% as measured by the J.P. Morgan Emerging Markets Bond Index (EMBI) Global, while the Citigroup® Non-U.S. Group of 7 Index - representing the debt performance of major global economies, excluding the United States - rose 13.05%.
Returns in the high-teens placed the fund's share classes several lengths ahead of their benchmarks for the year, with the Fidelity Asset Manager 70% Composite Index rising just 6.62%. Stellar performance from the domestic equity subportfolio is what fueled the fund's success during the period. Asset allocation and excess returns from our short-term (cash) holdings provided only a minor boost. (For specific portfolio performance results, please refer to the performance section of this report.) The fund benefited from its slight bias toward equities, which outperformed investment-grade debt and cash through October. Unfortunately, we gave up most of these gains in the final two months of the period as investors fled riskier assets for high-quality fixed-income securities. Within equities, overweighting foreign securities overall was helpful, as overseas markets beat their U.S. counterparts. Unfortunately, subpar security selection within the international equity component - which transitioned in December to a Fidelity central fund - more than offset the benefit from overweighting foreign stocks. In fixed income, underweighting investment-grade debt and cash paid off, but out-of-benchmark allocations to high-yield and floating-rate securities detracted when the credit crisis spread to these markets. Security selection helped the domestic equity portion of the fund beat the Dow Jones Wilshire 5000 Composite IndexSM by a wide margin, with the strongest picks coming within materials, technology, financials and consumer discretionary. Holdings in more-internationally focused companies were particularly beneficial to performance. Sector positioning also contributed, led by large overweightings in energy and materials - which increased during the period - and a sizable underweighting in financials. Results were tempered by an underweighting and some weak picks within consumer staples, as well as by ineffective stock selection in transportation. Among the top individual contributors were several materials stocks, including crop seed producer Monsanto and fertilizer producers Mosaic and Potash Corp. of Saskatchewan. Canada's Research In Motion, maker of the BlackBerry mobile messaging device, also was a standout performer. Detractors included biotechnology company Celgene, Canadian gold miner Goldcorp and Latin American wireless provider NII Holdings. The fund's collective bond holdings trailed the Lehman Brothers Aggregate index due to weak results from the investment-grade central fund, which had exposure to the sell-off in subprime mortgage securities. Although allocations to high yield and floating rate detracted, strong security and market selection helped these two central funds beat their respective indexes. The cash component of the fund topped its benchmark as well.
The views expressed above reflect those of the portfolio manager(s) only through the end of the period as stated on the cover of this report and do not necessarily represent the views of Fidelity or any other person in the Fidelity organization. Any such views are subject to change at any time based upon market or other conditions and Fidelity disclaims any responsibility to update such views. These views may not be relied on as investment advice and, because investment decisions for a Fidelity fund are based on numerous factors, may not be relied on as an indication of trading intent on behalf of any Fidelity fund.
Annual Report
Shareholder Expense Example
As a shareholder of the Fund, you incur two types of costs: (1) transaction costs, and (2) ongoing costs, including management fees, distribution and/or service (12b-1) fees and other Fund expenses. This Example is intended to help you understand your ongoing costs (in dollars) of investing in the Fund and to compare these costs with the ongoing costs of investing in other mutual funds.
The Example is based on an investment of $1,000 invested at the beginning of the period and held for the entire period (July 1, 2007 to
December 31, 2007).
Actual Expenses
The first line of the accompanying table for each class of the Fund provides information about actual account values and actual expenses. You may use the information in this line, together with the amount you invested, to estimate the expenses that you paid over the period. Simply divide your account value by $1,000.00 (for example, an $8,600 account value divided by $1,000.00 = 8.6), then multiply the result by the number in the first line for a class of the Fund under the heading entitled "Expenses Paid During Period" to estimate the expenses you paid on your account during this period. The estimate of expenses does not include any fees or other expenses of any variable annuity or variable life insurance product. If they were, the estimate of expenses you paid during the period would be higher, and your ending account value would be lower. In addition, the Fund, as a shareholder in the underlying Fidelity Central Funds, will indirectly bear its pro rata share of the fees and expenses incurred by the underlying Fidelity Central Funds. These fees and expenses are not included in the Fund's annualized expense ratio used to calculate the expense estimate in the table below.
Hypothetical Example for Comparison Purposes
The second line of the accompanying table for each class of the Fund provides information about hypothetical account values and hypothetical expenses based on a Class' actual expense ratio and an assumed rate of return of 5% per year before expenses, which is not the Class' actual return. The hypothetical account values and expenses may not be used to estimate the actual ending account balance or expenses you paid for the period. You may use this information to compare the ongoing costs of investing in the Fund and other funds. To do so, compare this 5% hypothetical example with the 5% hypothetical examples that appear in the shareholder reports of the other funds. The estimate of expenses does not include any fees or other expenses of any variable annuity or variable life insurance product. If they were, the estimate of expenses you paid during the period would be higher, and your ending account value would be lower. In addition, the Fund, as a shareholder in the underlying Fidelity Central Funds, will indirectly bear its pro rata share of the fees and expenses incurred by the underlying Fidelity Central Funds. These fees and expenses are not included in the Fund's annualized expense ratio used to calculate the expense estimate in the table below.
Please note that the expenses shown in the table are meant to highlight your ongoing costs only and do not reflect any transaction costs. Therefore, the second line of the table is useful in comparing ongoing costs only, and will not help you determine the relative total costs of owning different funds.
|
Beginning
Account Value
July 1, 2007
|
Ending
Account Value
December 31, 2007
| Expenses Paid
During Period*
July 1, 2007 to
December 31, 2007 |
Initial Class | | | |
Actual | $ 1,000.00 | $ 1,083.90 | $ 3.83 |
HypotheticalA | $ 1,000.00 | $ 1,021.53 | $ 3.72 |
Service Class | | | |
Actual | $ 1,000.00 | $ 1,082.70 | $ 4.36 |
HypotheticalA | $ 1,000.00 | $ 1,021.02 | $ 4.23 |
Service Class 2 | | | |
Actual | $ 1,000.00 | $ 1,082.70 | $ 5.35 |
HypotheticalA | $ 1,000.00 | $ 1,020.06 | $ 5.19 |
Investor Class | | | |
Actual | $ 1,000.00 | $ 1,082.70 | $ 4.51 |
HypotheticalA | $ 1,000.00 | $ 1,020.87 | $ 4.38 |
A 5% return per year before expenses
* Expenses are equal to each Class' annualized expense ratio (shown in the table below); multiplied by the average account value over the period, multiplied by 184/365 (to reflect the one-half year period). The fees and expenses of the underlying Fidelity Central Funds in which the Fund invests are not included in the Fund's annualized expense ratio.
| Annualized
Expense Ratio |
Initial Class | .73% |
Service Class | .83% |
Service Class 2 | 1.02% |
Investor Class | .86% |
Annual Report
Investment Changes
The information in the following tables is based on the combined investments of the Fund and its pro-rata share of its investments in each Fidelity Central Fund.
Top Ten Stocks as of December 31, 2007 |
| % of fund's
net assets | % of fund's net assets
6 months ago |
The Mosaic Co. | 2.7 | 1.0 |
Potash Corp. of Saskatchewan, Inc. | 2.2 | 1.0 |
Monsanto Co. | 1.9 | 1.5 |
Apple, Inc. | 1.9 | 1.1 |
Valero Energy Corp. | 1.8 | 1.6 |
Ultra Petroleum Corp. | 1.4 | 1.1 |
CME Group, Inc. | 1.3 | 0.0 |
Nintendo Co. Ltd. | 1.3 | 0.5 |
Goldcorp, Inc. | 1.2 | 0.0 |
Freeport-McMoRan Copper & Gold, Inc. Class B | 1.1 | 0.7 |
| 16.8 | |
Market Sectors as of December 31, 2007 |
(stocks only) | % of fund's
net assets | % of fund's net assets
6 months ago |
Energy | 16.1 | 12.1 |
Materials | 12.0 | 6.9 |
Industrials | 9.5 | 5.1 |
Financials | 8.4 | 5.6 |
Information Technology | 6.7 | 9.5 |
Health Care | 6.2 | 6.2 |
Consumer Discretionary | 3.9 | 5.5 |
Utilities | 2.9 | 2.6 |
Telecommunication Services | 1.7 | 4.1 |
Consumer Staples | 1.4 | 2.1 |
Asset Allocation (% of fund's net assets) |
As of December 31, 2007 * | As of June 30, 2007 ** |
 | Stock Class and
Equity Futures 73.0% | | | Stock Class and
Equity Futures 68.5% | |
 | Bond Class 26.0% | | | Bond Class 28.3% | |
 | Short-Term Class 1.0% | | | Short-Term Class 3.2% | |
* Foreign investments | 26.3% | | ** Foreign investments | 20.2% | |

Asset allocations in the pie chart reflect the categorization of assets as defined in the fund's prospectus in effect as of the time period indicated above. Financial Statement categorizations conform to accounting standards and will differ from the pie chart. Percentages are adjusted for the effect of futures contracts and swap contracts, if applicable.
A holdings listing for the Fund, which presents direct holdings as well as the pro rata share of any securities and other investments held indirectly through its investment in underlying non-money market Fidelity Central Funds is available at advisor.fidelity.com.
Annual Report
Investments December 31, 2007
Showing Percentage of Net Assets
Common Stocks - 60.6% |
| Shares | | Value |
CONSUMER DISCRETIONARY - 3.1% |
Diversified Consumer Services - 0.4% |
Sotheby's Class A (ltd. vtg.) | 21,600 | | $ 822,960 |
Hotels, Restaurants & Leisure - 1.1% |
Burger King Holdings, Inc. | 23,500 | | 669,985 |
Home Inns & Hotels Management, Inc. ADR (a) | 18,600 | | 662,904 |
McDonald's Corp. | 16,200 | | 954,342 |
Nissin Healthcare Food Service Co. | 1,300 | | 14,860 |
Vail Resorts, Inc. (a)(d) | 7,500 | | 403,575 |
| | 2,705,666 |
Internet & Catalog Retail - 0.5% |
Priceline.com, Inc. (a)(d) | 11,300 | | 1,297,918 |
Media - 0.5% |
Focus Media Holding Ltd. ADR (a) | 19,100 | | 1,085,071 |
Virgin Media, Inc. | 4,050 | | 69,417 |
| | 1,154,488 |
Multiline Retail - 0.3% |
JCPenney Co., Inc. | 8,000 | | 351,920 |
Kohl's Corp. (a) | 6,700 | | 306,860 |
| | 658,780 |
Textiles, Apparel & Luxury Goods - 0.3% |
Crocs, Inc. (a) | 22,200 | | 817,182 |
TOTAL CONSUMER DISCRETIONARY | | 7,456,994 |
CONSUMER STAPLES - 0.7% |
Food & Staples Retailing - 0.7% |
ABB Grain Ltd. | 44 | | 326 |
Costco Wholesale Corp. | 12,500 | | 872,000 |
Whole Foods Market, Inc. | 21,800 | | 889,440 |
| | 1,761,766 |
ENERGY - 15.4% |
Energy Equipment & Services - 4.1% |
Atwood Oceanics, Inc. (a) | 15,800 | | 1,583,792 |
Cameron International Corp. (a) | 31,400 | | 1,511,282 |
FMC Technologies, Inc. (a) | 14,900 | | 844,830 |
National Oilwell Varco, Inc. (a) | 13,200 | | 969,672 |
Oceaneering International, Inc. (a) | 19,000 | | 1,279,650 |
Schlumberger Ltd. (NY Shares) | 9,700 | | 954,189 |
Smith International, Inc. | 6,100 | | 450,485 |
Transocean, Inc. (a) | 10,424 | | 1,492,196 |
Weatherford International Ltd. (a) | 11,700 | | 802,620 |
| | 9,888,716 |
|
| Shares | | Value |
Oil, Gas & Consumable Fuels - 11.3% |
Apache Corp. | 9,900 | | $ 1,064,646 |
Arch Coal, Inc. | 41,600 | | 1,869,088 |
Cabot Oil & Gas Corp. | 28,800 | | 1,162,656 |
Cameco Corp. | 20,600 | | 820,434 |
Chesapeake Energy Corp. | 25,200 | | 987,840 |
China Shenhua Energy Co. Ltd.
(H Shares) | 166,500 | | 995,101 |
Exxon Mobil Corp. | 18,000 | | 1,686,420 |
Hess Corp. | 21,800 | | 2,198,748 |
Marathon Oil Corp. | 10,500 | | 639,030 |
Peabody Energy Corp. | 30,700 | | 1,892,348 |
Petroplus Holdings AG | 18,242 | | 1,411,650 |
Quicksilver Resources, Inc. (a) | 17,500 | | 1,042,825 |
Range Resources Corp. | 21,800 | | 1,119,648 |
SandRidge Energy, Inc. | 1,100 | | 39,446 |
Sunoco, Inc. | 12,500 | | 905,500 |
Tesoro Corp. | 17,000 | | 810,900 |
Ultra Petroleum Corp. (a) | 45,700 | | 3,267,550 |
Valero Energy Corp. | 60,500 | | 4,236,815 |
Williams Companies, Inc. | 30,400 | | 1,087,712 |
| | 27,238,357 |
TOTAL ENERGY | | 37,127,073 |
FINANCIALS - 6.1% |
Capital Markets - 1.4% |
Fortress Investment Group LLC (d) | 31,200 | | 486,096 |
GLG Partners, Inc. (a) | 24,000 | | 326,400 |
Goldman Sachs Group, Inc. | 5,000 | | 1,075,250 |
Lehman Brothers Holdings, Inc. | 6,700 | | 438,448 |
Och-Ziff Capital Management Group LLC Class A | 32,400 | | 851,472 |
The Blackstone Group LP | 12,500 | | 276,625 |
| | 3,454,291 |
Commercial Banks - 1.3% |
Banco Itau Holding Financeira SA sponsored ADR (non-vtg.) | 63,800 | | 1,649,868 |
Raiffeisen International Bank Holding AG | 1,516 | | 229,210 |
Uniao de Bancos Brasileiros SA (Unibanco) GDR | 9,500 | | 1,326,580 |
| | 3,205,658 |
Diversified Financial Services - 2.3% |
Apollo Global Management LLC (e) | 50,700 | | 1,102,725 |
Bolsa de Mercadorias & Futuros -
BM&F SA | 19,600 | | 272,528 |
Bovespa Holding SA | 47,600 | | 891,564 |
CME Group, Inc. | 4,700 | | 3,224,200 |
| | 5,491,017 |
Common Stocks - continued |
| Shares | | Value |
FINANCIALS - continued |
Insurance - 0.7% |
American International Group, Inc. | 12,400 | | $ 722,920 |
Principal Financial Group, Inc. | 13,700 | | 943,108 |
| | 1,666,028 |
Real Estate Investment Trusts - 0.4% |
Annaly Capital Management, Inc. | 53,800 | | 978,084 |
TOTAL FINANCIALS | | 14,795,078 |
HEALTH CARE - 5.7% |
Biotechnology - 1.7% |
Biogen Idec, Inc. (a) | 9,600 | | 546,432 |
Celgene Corp. (a) | 32,500 | | 1,501,825 |
CSL Ltd. | 3,600 | | 114,652 |
Gilead Sciences, Inc. (a) | 43,500 | | 2,001,435 |
| | 4,164,344 |
Health Care Equipment & Supplies - 0.6% |
Beckman Coulter, Inc. | 12,700 | | 924,560 |
Becton, Dickinson & Co. | 6,900 | | 576,702 |
| | 1,501,262 |
Health Care Providers & Services - 2.1% |
Express Scripts, Inc. (a) | 12,700 | | 927,100 |
Humana, Inc. (a) | 19,700 | | 1,483,607 |
Medco Health Solutions, Inc. (a) | 13,600 | | 1,379,040 |
UnitedHealth Group, Inc. | 20,800 | | 1,210,560 |
| | 5,000,307 |
Pharmaceuticals - 1.3% |
Elan Corp. PLC sponsored ADR (a) | 78,400 | | 1,723,232 |
Merck & Co., Inc. | 24,100 | | 1,400,451 |
| | 3,123,683 |
TOTAL HEALTH CARE | | 13,789,596 |
INDUSTRIALS - 8.4% |
Aerospace & Defense - 4.7% |
General Dynamics Corp. | 24,100 | | 2,144,659 |
Honeywell International, Inc. | 12,500 | | 769,625 |
L-3 Communications Holdings, Inc. | 22,400 | | 2,373,056 |
Lockheed Martin Corp. | 22,900 | | 2,410,454 |
Precision Castparts Corp. | 10,100 | | 1,400,870 |
Raytheon Co. | 29,900 | | 1,814,930 |
The Boeing Co. | 7,000 | | 612,220 |
| | 11,525,814 |
Airlines - 0.2% |
Delta Air Lines, Inc. (a) | 13,600 | | 202,504 |
UAL Corp. | 7,300 | | 260,318 |
| | 462,822 |
Commercial Services & Supplies - 0.0% |
EnergySolutions, Inc. | 1,400 | | 37,786 |
|
| Shares | | Value |
Electrical Equipment - 1.4% |
ABB Ltd. sponsored ADR | 57,600 | | $ 1,658,880 |
Alstom SA | 4,400 | | 943,940 |
Suntech Power Holdings Co. Ltd. sponsored ADR (a) | 9,000 | | 740,880 |
| | 3,343,700 |
Industrial Conglomerates - 0.3% |
McDermott International, Inc. (a) | 11,000 | | 649,330 |
Machinery - 1.7% |
Caterpillar, Inc. | 3,000 | | 217,680 |
Cummins, Inc. | 11,900 | | 1,515,703 |
Eaton Corp. | 15,600 | | 1,512,420 |
MAN AG | 2,900 | | 481,631 |
NGK Insulators Ltd. | 4,000 | | 107,438 |
Sulzer AG (Reg.) | 200 | | 293,832 |
| | 4,128,704 |
Marine - 0.1% |
DryShips, Inc. | 2,300 | | 178,020 |
TOTAL INDUSTRIALS | | 20,326,176 |
INFORMATION TECHNOLOGY - 6.3% |
Communications Equipment - 1.2% |
Cisco Systems, Inc. (a) | 43,300 | | 1,172,131 |
Harris Corp. | 12,100 | | 758,428 |
Infinera Corp. | 12,600 | | 186,984 |
Research In Motion Ltd. (a) | 5,200 | | 589,680 |
Starent Networks Corp. | 12,100 | | 220,825 |
| | 2,928,048 |
Computers & Peripherals - 2.1% |
Apple, Inc. (a) | 23,300 | | 4,615,264 |
Data Domain, Inc. | 12,900 | | 339,786 |
EMC Corp. (a) | 12,600 | | 233,478 |
| | 5,188,528 |
Electronic Equipment & Instruments - 0.1% |
Ibiden Co. Ltd. | 3,400 | | 235,528 |
Internet Software & Services - 0.6% |
Google, Inc. Class A (sub. vtg.) (a) | 2,100 | | 1,452,108 |
Semiconductors & Semiconductor Equipment - 1.0% |
Cree, Inc. (a) | 18,500 | | 508,195 |
Entropic Communications, Inc. | 24,100 | | 175,448 |
Intel Corp. | 34,800 | | 927,768 |
SiRF Technology Holdings, Inc. (a) | 31,400 | | 789,082 |
| | 2,400,493 |
Software - 1.3% |
Nintendo Co. Ltd. | 5,300 | | 3,139,720 |
TOTAL INFORMATION TECHNOLOGY | | 15,344,425 |
MATERIALS - 11.2% |
Chemicals - 7.2% |
Monsanto Co. | 41,400 | | 4,623,966 |
Common Stocks - continued |
| Shares | | Value |
MATERIALS - continued |
Chemicals - continued |
Potash Corp. of Saskatchewan, Inc. | 37,600 | | $ 5,412,896 |
The Mosaic Co. (a) | 70,300 | | 6,632,102 |
Uralkali JSC: | | | |
ADR (a)(e) | 2,800 | | 104,300 |
unit (a) | 17,300 | | 644,425 |
| | 17,417,689 |
Metals & Mining - 4.0% |
ArcelorMittal SA (NY Reg.) Class A | 16,500 | | 1,276,275 |
BHP Billiton Ltd. sponsored ADR | 12,400 | | 868,496 |
Companhia Vale do Rio Doce
sponsored ADR | 31,700 | | 1,035,639 |
European Goldfields Ltd. (a) | 3,200 | | 17,650 |
Freeport-McMoRan Copper & Gold, Inc. Class B | 24,900 | | 2,550,756 |
Goldcorp, Inc. | 88,800 | | 3,020,925 |
Kinross Gold Corp. (a) | 24,900 | | 458,628 |
RTI International Metals, Inc. (a) | 5,400 | | 372,222 |
| | 9,600,591 |
TOTAL MATERIALS | | 27,018,280 |
TELECOMMUNICATION SERVICES - 1.2% |
Diversified Telecommunication Services - 0.2% |
Telefonica SA sponsored ADR | 5,800 | | 566,022 |
Wireless Telecommunication Services - 1.0% |
China Mobile (Hong Kong) Ltd. sponsored ADR | 18,900 | | 1,641,843 |
NII Holdings, Inc. (a) | 13,800 | | 666,816 |
| | 2,308,659 |
TOTAL TELECOMMUNICATION SERVICES | | 2,874,681 |
UTILITIES - 2.5% |
Electric Utilities - 1.3% |
Duke Energy Corp. | 42,600 | | 859,242 |
Entergy Corp. | 11,700 | | 1,398,384 |
Reliant Energy, Inc. (a) | 38,700 | | 1,015,488 |
| | 3,273,114 |
Independent Power Producers & Energy Traders - 1.2% |
Constellation Energy Group, Inc. | 13,100 | | 1,343,143 |
NRG Energy, Inc. (a) | 33,600 | | 1,456,224 |
| | 2,799,367 |
TOTAL UTILITIES | | 6,072,481 |
TOTAL COMMON STOCKS (Cost $118,253,545) | 146,566,550 |
Nonconvertible Preferred Stocks - 0.1% |
| Shares | | Value |
FINANCIALS - 0.1% |
Diversified Financial Services - 0.1% |
Istituto Finanziario Industriale SpA (IFI) (a) | 5,500 | | $ 187,022 |
TOTAL NONCONVERTIBLE PREFERRED STOCKS (Cost $213,299) | 187,022 |
U.S. Treasury Obligations - 0.5% |
| Principal Amount | | |
U.S. Treasury Bills, yield at date of purchase 3.03% to 4.11% 1/10/08 to 3/6/08 (f)
(Cost $1,154,002) | $ 1,160,000 | | 1,154,216 |
International Equity Funds - 8.3% |
| Shares | | |
Fidelity International Equity
Central Fund (g)
(Cost $20,646,496) | 208,200 | | 20,230,794 |
Fixed-Income Funds - 25.2% |
| | | |
Fidelity Floating Rate Central Fund (g) | 64,488 | | 6,173,436 |
Fidelity High Income Central Fund 1 (g) | 35,216 | | 3,399,366 |
Fidelity VIP Investment Grade Central Fund (g) | 500,696 | | 51,321,331 |
TOTAL FIXED-INCOME FUNDS (Cost $60,762,419) | 60,894,133 |
Money Market Funds - 4.6% |
| | | |
Fidelity Cash Central Fund, 4.58% (b) | 9,249,039 | | 9,249,039 |
Fidelity Securities Lending Cash Central Fund, 4.65% (b)(c) | 1,981,500 | | 1,981,500 |
TOTAL MONEY MARKET FUNDS (Cost $11,230,539) | 11,230,539 |
Cash Equivalents - 1.1% |
| Maturity Amount | | Value |
Investments in repurchase agreements in a joint trading account at: | | | |
1.28%, dated 12/31/07 due 1/2/08 (Collateralized by U.S. Government Obligations) # | $ 2,693,191 | | $ 2,693,000 |
1.41%, dated 12/31/07 due 1/2/08 (Collateralized by U.S. Government Obligations) # | 30,002 | | 30,000 |
TOTAL CASH EQUIVALENTS (Cost $2,723,000) | 2,723,000 |
TOTAL INVESTMENT PORTFOLIO - 100.4% (Cost $214,983,300) | 242,986,254 |
NET OTHER ASSETS - (0.4)% | (1,014,641) |
NET ASSETS - 100% | $ 241,971,613 |
Futures Contracts |
| Expiration Date | | Underlying Face Amount at Value | | Unrealized Appreciation/(Depreciation) |
Purchased |
Equity Index Contracts |
12 Dow Jones Euro Stoxx 50 Index Contracts (Germany) | March 2008 | | $ 776,693 | | $ 16,240 |
6 FTSE 100 Index Contracts (United Kingdom) | March 2008 | | 769,507 | | 20,651 |
20 S&P 500 Index Contracts | March 2008 | | 7,386,000 | | (106,580) |
5 TOPIX 150 Index Contracts (Japan) | March 2008 | | 659,104 | | (45,112) |
TOTAL EQUITY INDEX CONTRACTS | | $ 9,591,304 | | $ (114,801) |
|
The face value of futures purchased as a percentage of net assets - 4.0% |
Legend |
(a) Non-income producing |
(b) Affiliated fund that is available only to investment companies and other accounts managed by Fidelity Investments. The rate quoted is the annualized seven-day yield of the fund at period end. A complete unaudited listing of the fund's holdings as of its most recent quarter end is available upon request. |
(c) Investment made with cash collateral received from securities on loan. |
(d) Security or a portion of the security is on loan at period end. |
(e) Security exempt from registration under Rule 144A of the Securities Act of 1933. These securities may be resold in transactions exempt from registration, normally to qualified institutional buyers. At the end of the period, the value of these securities amounted to $1,207,025 or 0.5% of net assets. |
(f) Security or a portion of the security was pledged to cover margin requirements for futures contracts. At the period end, the value of securities pledged amounted to $1,129,350. |
(g) Affiliated fund that is available only to investment companies and other accounts managed by Fidelity Investments. A complete schedule of portfolio holdings for each Fidelity Central Fund is filed with the SEC for the first and third quarters of each fiscal year on Form N-Q and is available upon request or at the SEC's web site at www.sec.gov. A holdings listing for the Fund, which presents direct holdings as well as the pro rata share of securities and other investments held indirectly through its investment in underlying non-money market Fidelity Central Funds, is available at advisor.fidelity.com. In addition, each Fidelity Central Fund's financial statements, which are not covered by the Fund's Report of Independent Registered Public Accounting Firm, are available on the SEC's web site or upon request. |
# Additional Information on each counterparty to the repurchase agreement is as follows: |
Repurchase Agreement / Counterparty | Value |
$2,693,000 due 1/02/08 at 1.28% |
Banc of America Securities LLC | $ 511,788 |
Barclays Capital, Inc. | 878,544 |
Goldman, Sachs & Co. | 1,302,668 |
| $ 2,693,000 |
$30,000 due 1/02/08 at 1.41% |
ABN AMRO Bank N.V., New York Branch | $ 13,102 |
Lehman Brothers, Inc. | 8,156 |
Merrill Lynch Government Securities, Inc. | 8,742 |
| $ 30,000 |
Affiliated Central Funds |
Information regarding fiscal year to date income earned by the Fund from investments in Fidelity Central Funds is as follows: |
Fund | Income earned |
Fidelity Cash Central Fund | $ 1,243,042 |
Fidelity Floating Rate Central Fund | 529,674 |
Fidelity High Income Central Fund 1 | 391,766 |
Fidelity Securities Lending Cash Central Fund | 19,030 |
Fidelity VIP Investment Grade Central Fund | 2,637,937 |
Total | $ 4,821,449 |
|
Additional information regarding the Fund's fiscal year to date purchases and sales, including the ownership percentage, of the non Money Market Central Funds is as follows: |
Fund | Value, beginning of period | Purchases | Sales Proceeds | Value, end of period | % ownership, end of period |
Fidelity Floating Rate Central Fund | $ 7,094,413 | $ - | $ 589,907 | $ 6,173,436 | 0.2% |
Fidelity High Income Central Fund 1 | 5,260,980 | 2,502,684 | 4,258,109 | 3,399,366 | 1.3% |
Fidelity International Equity Central Fund | - | 20,646,493 | - | 20,230,794 | 2.3% |
Fidelity VIP Investment Grade Central Fund | 51,656,430 | 3,555,972 | 3,698,155 | 51,321,331 | 1.4% |
Total | $ 64,011,823 | $ 26,705,149 | $ 8,546,171 | $ 81,124,927 | |
Other Information |
The composition of credit quality ratings as a percentage of net assets is as follows (ratings are unaudited): |
U.S. Government and U.S. Government Agency Obligations | 13.1% |
AAA,AA,A | 5.5% |
BBB | 3.5% |
BB | 1.7% |
B | 1.5% |
CCC,CC,C | 0.3% |
Not Rated | 0.2% |
Equities | 72.8% |
Short-Term Investments and Net Other Assets | 1.4% |
| 100.0% |
We have used ratings from Moody's Investors Services, Inc. Where Moody's ratings are not available, we have used S&P ratings. All ratings are as of the report date and do not reflect subsequent downgrades. Percentages are adjusted for the effect of futures contracts, if applicable. |
Distribution of investments by country of issue, as a percentage of total net assets, is as follows: |
United States of America | 73.7% |
Canada | 5.8% |
Japan | 2.2% |
Brazil | 2.2% |
Switzerland | 2.0% |
United Kingdom | 1.8% |
Germany | 1.7% |
France | 1.3% |
China | 1.3% |
Australia | 1.1% |
Hong Kong | 1.0% |
Others (individually less than 1%) | 5.9% |
| 100.0% |
Income Tax Information |
At December 31, 2007, the fund had a capital loss carryforward of approximately $15,645,137 of which $7,031,250 and $8,613,887 will expire on December 31, 2010 and 2011, respectively. |
See accompanying notes which are an integral part of the financial statements.
Annual Report
Financial Statements
Statement of Assets and Liabilities
| December 31, 2007 |
| | |
Assets | | |
Investment in securities, at value (including securities loaned of $1,904,990 and repurchase agreements of $2,723,000) - See accompanying schedule: Unaffiliated issuers
(cost $122,343,846) | $ 150,630,788 | |
Fidelity Central Funds
(cost $92,639,454) | 92,355,466 | |
Total Investments
(cost $214,983,300) | | $ 242,986,254 |
Cash | | 18,116 |
Foreign currency held at value
(cost $8) | | 9 |
Receivable for investments sold | | 226,023 |
Receivable for fund shares sold | | 840,057 |
Dividends receivable | | 123,084 |
Distributions receivable from Fidelity Central Funds | | 406,596 |
Prepaid expenses | | 756 |
Other receivables | | 3,936 |
Total assets | | 244,604,831 |
| | |
Liabilities | | |
Payable for investments purchased | $ 268,270 | |
Payable for fund shares redeemed | 122,255 | |
Accrued management fee | 110,712 | |
Distribution fees payable | 2,112 | |
Payable for daily variation on futures contracts | 60,433 | |
Other affiliated payables | 24,465 | |
Other payables and accrued expenses | 63,471 | |
Collateral on securities loaned, at value | 1,981,500 | |
Total liabilities | | 2,633,218 |
| | |
Net Assets | | $ 241,971,613 |
Net Assets consist of: | | |
Paid in capital | | $ 229,988,449 |
Distributions in excess of net investment income | | (57) |
Accumulated undistributed net realized gain (loss) on investments and foreign currency transactions | | (15,906,229) |
Net unrealized appreciation (depreciation) on investments and assets and liabilities in foreign currencies | | 27,889,450 |
Net Assets | | $ 241,971,613 |
Statement of Assets and Liabilities - continued
| December 31, 2007 |
| | |
Initial Class:
Net Asset Value, offering price and redemption price per share ($211,867,040 ÷ 13,659,556 shares) | | $ 15.51 |
| | |
Service Class:
Net Asset Value, offering price and redemption price per share ($5,112,838 ÷ 331,745 shares) | | $ 15.41 |
| | |
Service Class 2:
Net Asset Value, offering price and redemption price per share ($8,621,815 ÷ 562,179 shares) | | $ 15.34 |
| | |
Investor Class:
Net Asset Value, offering price and redemption price per share ($16,369,920 ÷ 1,058,603 shares) | | $ 15.46 |
See accompanying notes which are an integral part of the financial statements.
Annual Report
Statement of Operations
| Year ended December 31, 2007 |
| | |
Investment Income | | |
Dividends | | $ 1,398,771 |
Interest | | 86,083 |
Income from Fidelity Central Funds | | 4,821,449 |
Total income | | 6,306,303 |
| | |
Expenses | | |
Management fee | $ 1,296,369 | |
Transfer agent fees | 177,539 | |
Distribution fees | 22,086 | |
Accounting and security lending fees | 114,714 | |
Custodian fees and expenses | 53,283 | |
Independent trustees' compensation | 802 | |
Audit | 75,298 | |
Legal | 1,751 | |
Miscellaneous | 7,198 | |
Total expenses before reductions | 1,749,040 | |
Expense reductions | (11,975) | 1,737,065 |
Net investment income (loss) | | 4,569,238 |
Realized and Unrealized Gain (Loss) Net realized gain (loss) on: | | |
Investment securities: | | |
Unaffiliated issuers (net of foreign taxes of $7,221) | 23,279,856 | |
Fidelity Central Funds | 166,608 | |
Foreign currency transactions | (87,728) | |
Futures contracts | 539,117 | |
Capital gain distributions from Fidelity Central Funds | 35,641 | |
Total net realized gain (loss) | | 23,933,494 |
Change in net unrealized appreciation (depreciation) on: Investment securities | 12,203,908 | |
Assets and liabilities in foreign currencies | 1,548 | |
Futures contracts | (404,090) | |
Total change in net unrealized appreciation (depreciation) | | 11,801,366 |
Net gain (loss) | | 35,734,860 |
Net increase (decrease) in net assets resulting from operations | | $ 40,304,098 |
Statement of Changes in Net Assets
| Year ended
December 31, 2007 | Year ended
December 31, 2006 |
Increase (Decrease) in Net Assets | | |
Operations | | |
Net investment income (loss) | $ 4,569,238 | $ 4,942,223 |
Net realized gain (loss) | 23,933,494 | 20,416,971 |
Change in net unrealized appreciation (depreciation) | 11,801,366 | (8,351,251) |
Net increase (decrease) in net assets resulting from operations | 40,304,098 | 17,007,943 |
Distributions to shareholders from net investment income | (9,798,205) | (5,395,505) |
Share transactions - net increase (decrease) | (18,820,400) | (55,081,737) |
Total increase (decrease) in net assets | 11,685,493 | (43,469,299) |
| | |
Net Assets | | |
Beginning of period | 230,286,120 | 273,755,419 |
End of period (including distributions in excess of net investment income of $57 and undistributed net investment
income of $4,929,195, respectively) | $ 241,971,613 | $ 230,286,120 |
See accompanying notes which are an integral part of the financial statements.
Annual Report
Financial Highlights - Initial Class
| | |
Years ended December 31, | 2007 | 2006 | 2005 | 2004 | 2003 |
Selected Per-Share Data | | | | | |
Net asset value, beginning of period | $ 13.60 | $ 12.97 | $ 12.78 | $ 12.33 | $ 10.33 |
Income from Investment Operations | | | | | |
Net investment income (loss) C | .29 | .26 | .24 | .26 F | .26 |
Net realized and unrealized gain (loss) | 2.24 | .63 | .25 | .47 | 2.06 |
Total from investment operations | 2.53 | .89 | .49 | .73 | 2.32 |
Distributions from net investment income | (.62) | (.26) | (.30) | (.28) | (.32) |
Net asset value, end of period | $ 15.51 | $ 13.60 | $ 12.97 | $ 12.78 | $ 12.33 |
Total Return A, B | 18.97% | 6.99% | 3.89% | 5.98% | 23.34% |
Ratios to Average Net Assets D, G | | | | | |
Expenses before reductions | .74% | .77% | .74% | .75% | .73% |
Expenses net of fee waivers, if any | .74% | .77% | .74% | .75% | .73% |
Expenses net of all reductions | .73% | .73% | .72% | .74% | .72% |
Net investment income (loss) | 1.98% | 2.01% | 1.93% | 2.15% | 2.33% |
Supplemental Data | | | | | |
Net assets, end of period (000 omitted) | $ 211,867 | $ 212,222 | $ 260,968 | $ 306,137 | $ 335,285 |
Portfolio turnover rate E | 132% | 233% | 43% | 57% | 65% |
A Total returns do not reflect charges attributable to your insurance company's separate account. Inclusion of these charges would reduce the total returns shown.
B Total returns would have been lower had certain expenses not been reduced during the periods shown.
C Calculated based on average shares outstanding during the period.
D Fees and expenses of the underlying Fidelity Central Funds are not included in the Fund's expense ratio. The Fund indirectly bears its proportionate share of the expenses of any underlying Fidelity Central Funds.
E Amount does not include the portfolio activity of any underlying Fidelity Central Funds.
F Investment income per share reflects a special dividend which amounted to $.04 per share.
G Expense ratios reflect operating expenses of the class. Expenses before reductions do not reflect amounts reimbursed by the investment adviser or reductions from brokerage service arrangements or other expense offset arrangements and do not represent the amount paid by the class during periods when reimbursements or reductions occur. Expenses net of fee waivers reflect expenses after reimbursement by the investment adviser but prior to reductions from brokerage service arrangements or other expense offset arrangements. Expenses net of all reductions represent the net expenses paid by the class.
Financial Highlights - Service Class
| | |
Years ended December 31, | 2007 | 2006 | 2005 | 2004 | 2003 |
Selected Per-Share Data | | | | | |
Net asset value, beginning of period | $ 13.51 | $ 12.88 | $ 12.69 | $ 12.25 | $ 10.27 |
Income from Investment Operations | | | | | |
Net investment income (loss) C | .27 | .25 | .23 | .25 F | .24 |
Net realized and unrealized gain (loss) | 2.22 | .63 | .24 | .46 | 2.05 |
Total from investment operations | 2.49 | .88 | .47 | .71 | 2.29 |
Distributions from net investment income | (.59) | (.25) | (.28) | (.27) | (.31) |
Net asset value, end of period | $ 15.41 | $ 13.51 | $ 12.88 | $ 12.69 | $ 12.25 |
Total Return A, B | 18.79% | 6.93% | 3.79% | 5.85% | 23.15% |
Ratios to Average Net Assets D, G | | | | | |
Expenses before reductions | .84% | .87% | .84% | .88% | .85% |
Expenses net of fee waivers, if any | .84% | .87% | .84% | .88% | .85% |
Expenses net of all reductions | .83% | .83% | .82% | .87% | .84% |
Net investment income (loss) | 1.88% | 1.91% | 1.83% | 2.02% | 2.21% |
Supplemental Data | | | | | |
Net assets, end of period (000 omitted) | $ 5,113 | $ 4,977 | $ 5,604 | $ 5,907 | $ 6,692 |
Portfolio turnover rate E | 132% | 233% | 43% | 57% | 65% |
A Total returns do not reflect charges attributable to your insurance company's separate account. Inclusion of these charges would reduce the total returns shown.
B Total returns would have been lower had certain expenses not been reduced during the periods shown.
C Calculated based on average shares outstanding during the period.
D Fees and expenses of the underlying Fidelity Central Funds are not included in the Fund's expense ratio. The Fund indirectly bears its proportionate share of the expenses of any underlying Fidelity Central Funds.
E Amount does not include the portfolio activity of any underlying Fidelity Central Funds.
F Investment income per share reflects a special dividend which amounted to $.04 per share.
G Expense ratios reflect operating expenses of the class. Expenses before reductions do not reflect amounts reimbursed by the investment adviser or reductions from brokerage service arrangements or other expense offset arrangements and do not represent the amount paid by the class during periods when reimbursements or reductions occur. Expenses net of fee waivers reflect expenses after reimbursement by the investment adviser but prior to reductions from brokerage service arrangements or other expense offset arrangements. Expenses net of all reductions represent the net expenses paid by the class.
See accompanying notes which are an integral part of the financial statements.
Annual Report
Financial Highlights - Service Class 2
| | |
Years ended December 31, | 2007 | 2006 | 2005 | 2004 | 2003 |
Selected Per-Share Data | | | | | |
Net asset value, beginning of period | $ 13.42 | $ 12.81 | $ 12.61 | $ 12.19 | $ 10.21 |
Income from Investment Operations | | | | | |
Net investment income (loss) C | .25 | .22 | .20 | .22 F | .22 |
Net realized and unrealized gain (loss) | 2.21 | .62 | .25 | .46 | 2.05 |
Total from investment operations | 2.46 | .84 | .45 | .68 | 2.27 |
Distributions from net investment income | (.54) | (.23) | (.25) | (.26) | (.29) |
Net asset value, end of period | $ 15.34 | $ 13.42 | $ 12.81 | $ 12.61 | $ 12.19 |
Total Return A, B | 18.68% | 6.64% | 3.65% | 5.63% | 23.03% |
Ratios to Average Net Assets D, G | | | | | |
Expenses before reductions | 1.02% | 1.05% | 1.03% | 1.06% | 1.05% |
Expenses net of fee waivers, if any | 1.02% | 1.05% | 1.03% | 1.06% | 1.05% |
Expenses net of all reductions | 1.01% | 1.02% | 1.02% | 1.05% | 1.04% |
Net investment income (loss) | 1.70% | 1.73% | 1.64% | 1.84% | 2.01% |
Supplemental Data | | | | | |
Net assets, end of period (000 omitted) | $ 8,622 | $ 6,205 | $ 5,854 | $ 6,399 | $ 6,694 |
Portfolio turnover rate E | 132% | 233% | 43% | 57% | 65% |
A Total returns do not reflect charges attributable to your insurance company's separate account. Inclusion of these charges would reduce the total returns shown.
B Total returns would have been lower had certain expenses not been reduced during the periods shown.
C Calculated based on average shares outstanding during the period.
D Fees and expenses of the underlying Fidelity Central Funds are not included in the Fund's expense ratio. The Fund indirectly bears its proportionate share of the expenses of any underlying Fidelity Central Funds.
E Amount does not include the portfolio activity of any underlying Fidelity Central Funds.
F Investment income per share reflects a special dividend which amounted to $.04 per share.
G Expense ratios reflect operating expenses of the class. Expenses before reductions do not reflect amounts reimbursed by the investment adviser or reductions from brokerage service arrangements or other expense offset arrangements and do not represent the amount paid by the class during periods when reimbursements or reductions occur. Expenses net of fee waivers reflect expenses after reimbursement by the investment adviser but prior to reductions from brokerage service arrangements or other expense offset arrangements. Expenses net of all reductions represent the net expenses paid by the class.
Financial Highlights - Investor Class
|
| |
Years ended December 31, | 2007 | 2006 | 2005 H |
Selected Per-Share Data | | | |
Net asset value, beginning of period | $ 13.56 | $ 12.96 | $ 12.60 |
Income from Investment Operations | | | |
Net investment income (loss) E | .27 | .24 | .10 |
Net realized and unrealized gain (loss) | 2.23 | .63 | .26 |
Total from investment operations | 2.50 | .87 | .36 |
Distributions from net investment income | (.60) | (.27) | - |
Net asset value, end of period | $ 15.46 | $ 13.56 | $ 12.96 |
Total Return B, C, D | 18.78% | 6.80% | 2.86% |
Ratios to Average Net Assets F, I | | | |
Expenses before reductions | .86% | .92% | .96% A |
Expenses net of fee waivers, if any | .86% | .92% | .96% A |
Expenses net of all reductions | .86% | .89% | .94% A |
Net investment income (loss) | 1.86% | 1.86% | 1.83% A |
Supplemental Data | | | |
Net assets, end of period (000 omitted) | $ 16,370 | $ 6,882 | $ 1,330 |
Portfolio turnover rate G | 132% | 233% | 43% |
A Annualized
B Total returns for periods of less than one year are not annualized.
C Total returns do not reflect charges attributable to your insurance company's separate account. Inclusion of these charges would reduce the total returns shown.
D Total returns would have been lower had certain expenses not been reduced during the periods shown.
E Calculated based on average shares outstanding during the period.
F Fees and expenses of the underlying Fidelity Central Funds are not included in the Fund's expense ratio. The Fund indirectly bears its proportionate share of the expenses of any underlying Fidelity Central Funds.
G Amount does not include the portfolio activity of any underlying Fidelity Central Funds.
H For the period July 21, 2005 (commencement of sale of shares) to December 31, 2005.
I Expense ratios reflect operating expenses of the class. Expenses before reductions do not reflect amounts reimbursed by the investment adviser or reductions from brokerage service arrangements or other expense offset arrangements and do not represent the amount paid by the class during periods when reimbursements or reductions occur. Expense ratios before reductions for start-up periods may not be representative of longer-term operating periods. Expenses net of fee waivers reflect expenses after reimbursement by the investment adviser but prior to reductions from brokerage service arrangements or other expense offset arrangements. Expenses net of all reductions represent the net expenses paid by the class.
See accompanying notes which are an integral part of the financial statements.
Annual Report
Notes to Financial Statements
For the period ended December 31, 2007
1. Organization.
VIP Asset Manager: Growth Portfolio (the Fund) is a fund of Variable Insurance Products Fund V (the trust) (formerly of Variable Insurance Products Fund II) and is authorized to issue an unlimited number of shares. Effective, April 19, 2007, the Board of Trustees approved an Agreement and Plan of Reorganization whereby the Fund reorganized into Variable Insurance Products V effective June 29, 2007 (Trust Reorganization). The Trust Reorganization does not impact the Fund's investment strategies or Fidelity Management & Research Company's (FMR) management of the Fund. The trust is registered under the Investment Company Act of 1940, as amended (the 1940 Act), as an open-end management investment company organized as a Massachusetts business trust. Shares of the Fund may only be purchased by insurance companies for the purpose of funding variable annuity or variable life insurance contracts. The Fund offers the following classes of shares: Initial Class shares, Service Class shares, Service Class 2 shares, and Investor Class shares. All classes have equal rights and voting privileges, except for matters affecting a single class. Investment income, realized and unrealized capital gains and losses, the common expenses of the Fund, and certain fund-level expense reductions, if any, are allocated on a pro rata basis to each class based on the relative net assets of each class to the total net assets of the Fund. Each class differs with respect to transfer agent and distribution and service plan fees incurred. Certain expense reductions also differ by class.
2. Investments in Fidelity Central Funds.
The Fund may invest in Fidelity Central Funds, which are open-end investment companies available only to other investment companies and accounts managed by FMR and its affiliates. The Fund's Schedule of Investments lists each of the Fidelity Central Funds as an investment of the Fund, but does not include the underlying holdings of each Fidelity Central Fund. As an Investing Fund, the Fund indirectly bears its proportionate share of the expenses of the underlying Fidelity Central Funds.
Based on their investment objective, each Fidelity Central Fund may invest or participate in various investment vehicles or strategies that are similar to those of the Fund. These strategies are consistent with the investment objectives of the Fund and may involve certain economic risks which may cause a decline in value of each of the Fidelity Central Funds and thus a decline in the value of the Fund. The following summarizes the Fund's investment in each Fidelity Central Fund.
Fidelity Central Fund | Investment Manager | | Investment Objective | | Investment Practices |
Fidelity International Equity Central Fund | Fidelity Management & Research Company, Inc. (FMRC) | | Seeks capital appreciation by investing primarily in non-US based common stocks, including securities of issuers located in emerging markets. | | Delayed Delivery & When Issued Securities, Foreign Securities, Repurchase Agreements |
Fidelity Floating Rate Central Fund | FMRC | | Seeks a high level of income by normally investing in floating rate loans and other floating rate securities. | | Loans & Direct Debt Instruments, Repurchase Agreements, Restricted Securities |
Fidelity High Income Central Fund 1 | FMRC | | Seeks a high level of income and may also seek capital appreciation by investing primarily in debt securities, preferred stocks, and convertible securities, with an emphasis on lower-quality debt securities. | | Loans & Direct Debt Instruments, Repurchase Agreements, Restricted Securities |
VIP Investment Grade Central Fund | Fidelity Investments Money Management, Inc. (FIMM) | | Seeks a high level of current income by normally investing in investment-grade debt securities and repurchase agreements. | | Delayed Delivery & When Issued Securities, Mortgage Dollar Rolls, Repurchase Agreements, Restricted Securities Swap Agreements |
Fidelity Money Market Central Funds | FIMM | | Seeks to obtain a high level of current income consistent with the preservation of capital and liquidity. | | Short-term investments |
The Central Funds may have direct or indirect exposure to securities of issuers that hold mortgage securities, including securities backed by subprime mortgage loans. The value and related income of these securities is sensitive to changes in economic conditions, including delinquencies and/or defaults, and may be adversely affected by shifts in the market's perception of the issuers and changes in interest rates.
Annual Report
2. Investments in Fidelity Central Funds - continued
A holdings listing for the Fund, which presents direct holdings as well as the pro rata share of any securities and other investments held indirectly through its investment in underlying non-money market Fidelity Central Funds, is available at advisor.fidelity.com. A complete list of holdings for each Fidelity Central Fund is available upon request or at the SEC's web site at www.sec.gov. In addition, the financial statements of the Fidelity Central Funds, which are not covered by the Fund's Report of Independent Registered Public Accounting Firm, are available on the SEC's web site or upon request.
3. Significant Accounting Policies.
The financial statements have been prepared in conformity with accounting principles generally accepted in the United States of America, which require management to make certain estimates and assumptions at the date of the financial statements. The following summarizes the significant accounting policies of the Fund:
Security Valuation. Investments are valued and net asset value (NAV) per share is calculated (NAV calculation) as of the close of business of the New York Stock Exchange (NYSE), normally 4:00 p.m. Eastern time. Wherever possible, the Fund uses independent pricing services approved by the Board of Trustees to value its investments.
Equity securities, including restricted securities, for which market quotations are readily available, are valued at the last reported sale price or official closing price as reported by an independent pricing service on the primary market or exchange on which they are traded. In the event there were no sales during the day or closing prices are not available, securities are valued at the last quoted bid price. Debt securities, including restricted securities, for which quotations are readily available, are valued by independent pricing services or by dealers who make markets in such securities. Pricing services consider yield or price of bonds of comparable quality, coupon, maturity and type as well as available dealer supplied prices. Investments in open-end mutual funds, including the Fidelity Central Funds, are valued at their closing net asset value each business day. Short-term securities with remaining maturities of sixty days or less for which quotations are not readily available are valued at amortized cost, which approximates value.
When current market prices or quotations are not readily available or do not accurately reflect fair value, valuations may be determined in accordance with procedures adopted by the Board of Trustees. For example, when developments occur between the close of a market and the close of the NYSE that may materially affect the value of some or all of the securities, or when trading in a security is halted, those securities may be fair valued. Factors used in the determination of fair value may include monitoring news to identify significant market or security specific events such as changes in the value of U.S. securities markets, reviewing developments in foreign markets and evaluating the performance of ADRs, futures contracts and exchange-traded funds and monitoring current market trading activity, interest rates, credit quality and default rates for debt instruments. Because the Fund's utilization of fair value pricing depends on market activity, the frequency with which fair value pricing is used cannot be predicted and may be utilized to a significant extent. The value of securities used for NAV calculation under fair value pricing may differ from published prices for the same securities.
Foreign Currency. The Fund uses foreign currency contracts to facilitate transactions in foreign-denominated securities. Losses from these transactions may arise from changes in the value of the foreign currency or if the counterparties do not perform under the contracts' terms.
Foreign-denominated assets, including investment securities, and liabilities are translated into U.S. dollars at the exchange rate at period end. Purchases and sales of investment securities, income and dividends received and expenses denominated in foreign currencies are translated into U.S. dollars at the exchange rate in effect on the transaction date.
The effects of exchange rate fluctuations on investments are included with the net realized and unrealized gain (loss) on investment securities. Other foreign currency transactions resulting in realized and unrealized gain (loss) are disclosed separately.
Investment Transactions and Income. For financial reporting purposes, the Fund's investment holdings and NAV include trades executed through the end of the last business day of the period. The NAV for processing shareholder transactions includes trades executed through the end of the prior business day. Gains and losses on securities sold are determined on the basis of identified cost and may include proceeds received from litigation. Dividend income is recorded on the ex-dividend date, except for certain dividends from foreign securities where the ex-dividend date may have passed, which are recorded as soon as the Fund is informed of the ex-dividend date. Non-cash dividends included in dividend income, if any, are recorded at the fair market value of the securities received. Distributions received on securities that represent a return of capital or capital gain are recorded as a reduction of cost of investments and/or as a realized gain. The Fund estimates the components of distributions received that may be considered return of capital distributions or capital gain distributions. Interest income and distributions from the Fidelity Central Funds are accrued as earned. Interest income includes coupon interest and amortization of premium and accretion of discount on debt securities. Investment income is recorded net of foreign taxes withheld where recovery of such taxes is uncertain.
Annual Report
Notes to Financial Statements - continued
3. Significant Accounting Policies - continued
Expenses. Most expenses of the trust can be directly attributed to a fund. Expenses which cannot be directly attributed are apportioned among each Fund in the trust. Expense estimates are accrued in the period to which they relate and adjustments are made when actual amounts are known. All legal and other expenses associated with the Trust Reorganization will be paid by FMR.
Income Tax Information and Distributions to Shareholders. Each year, the Fund intends to qualify as a regulated investment company by distributing substantially all of its taxable income and realized gains under Subchapter M of the Internal Revenue Code and filing its U.S. federal tax return. As a result, no provision for income taxes is required. The Fund adopted the provisions of FASB Interpretation No. 48, Accounting for Uncertainties in Income Taxes (FIN 48), on June 29, 2007. FIN 48 sets forth a minimum threshold for financial statement recognition of the benefit of a tax position taken or expected to be taken in a tax return. The implementation of FIN 48 did not result in any unrecognized tax benefits in the accompanying financial statements. Each of the Fund's federal tax returns for the prior three fiscal years remains subject to examination by the Internal Revenue Service. Foreign taxes are provided for based on the Fund's understanding of the tax rules and rates that exist in the foreign markets in which it invests.
Distributions are recorded on the ex-dividend date. Income dividends and capital gain distributions are declared separately for each class. Income and capital gain distributions are determined in accordance with income tax regulations, which may differ from generally accepted accounting principles.
Capital accounts within the financial statements are adjusted for permanent book-tax differences. Certain adjustments have been made to the accounts relating to prior periods. Collectively, these adjustments have no impact on net assets or the results of operations. Temporary book-tax differences will reverse in a subsequent period.
Book-tax differences are primarily due to the short-term gain distributions from the Underlying Funds, futures transactions, foreign currency transactions, certain foreign taxes, passive foreign investment companies (PFIC), market discount, partnerships (including allocations from Fidelity Central Funds), deferred trustees compensation, financing transactions, capital loss carryforwards and losses deferred due to wash sales.
The tax-basis components of distributable earnings and the federal tax cost as of period end were as follows:
Unrealized appreciation | $ 31,670,586 |
Unrealized depreciation | (4,162,995) |
Net unrealized appreciation (depreciation) | 27,507,591 |
Undistributed ordinary income | 120,520 |
Capital loss carryforward | (15,645,137) |
| |
Cost for federal income tax purposes | $ 215,478,663 |
The tax character of distributions paid was as follows:
| December 31, 2007 | December 31, 2006 |
Ordinary Income | $ 9,798,205 | $ 5,395,505 |
New Accounting Pronouncement. In September 2006, Statement of Financial Accounting Standards No. 157, Fair Value Measurements
(SFAS 157), was issued and is effective for fiscal years beginning after November 15, 2007. SFAS 157 defines fair value, establishes a framework for measuring fair value and expands disclosures about fair value measurements. Management is currently evaluating the impact the adoption of SFAS 157 will have on the Fund's financial statement disclosures.
4. Operating Policies.
Repurchase Agreements. FMR has received an Exemptive Order from the Securities and Exchange Commission (the SEC) which permits the Fund and other affiliated entities of FMR to transfer uninvested cash balances into joint trading accounts which are then invested in repurchase agreements. The Fund may also invest directly with institutions in repurchase agreements. Repurchase agreements are collateralized by government or non-government securities. Upon settlement date, collateral is held in segregated accounts with custodian banks and may be obtained in the event of a default of the counterparty. The Fund monitors, on a daily basis, the value of the collateral to ensure it is at least equal to the principal amount of the repurchase agreement (including accrued interest). In the event of a default by the counterparty, realization of the collateral proceeds could be delayed, during which time the value of the collateral may decline.
Annual Report
4. Operating Policies - continued
Futures Contracts. The Fund may use futures contracts to manage its exposure to the stock market. Buying futures tends to increase a fund's exposure to the underlying instrument, while selling futures tends to decrease a fund's exposure to the underlying instrument or hedge other fund investments. Upon entering into a futures contract, a fund is required to deposit with a clearing broker, no later than the following business day, an amount ("initial margin") equal to a certain percentage of the face value of the contract. The initial margin may be in the form of cash or securities and is transferred to a segregated account on settlement date. Subsequent payments ("variation margin") are made or received by a fund depending on the daily fluctuations in the value of the futures contract and are accounted for as unrealized gains or losses. Realized gains (losses) are recorded upon the expiration or closing of the futures contract. Securities deposited to meet margin requirements are identified in the Schedule of Investments. Futures contracts involve, to varying degrees, risk of loss in excess of any futures variation margin reflected in the Statement of Assets and Liabilities. The underlying face amount at value of any open futures contracts at period end is shown in the Schedule of Investments under the caption "Futures Contracts." This amount reflects each contract's exposure to the underlying instrument at period end. Losses may arise from changes in the value of the underlying instruments or if the counterparties do not perform under the contract's terms. Futures contracts are valued at the settlement price established each day by the board of trade or exchange on which they are traded.
Restricted Securities. The Fund may invest in securities that are subject to legal or contractual restrictions on resale. These securities generally may be resold in transactions exempt from registration or to the public if the securities are registered. Disposal of these securities may involve time-consuming negotiations and expense, and prompt sale at an acceptable price may be difficult. Information regarding restricted securities is included at the end of the Fund's Schedule of Investments.
5. Purchases and Sales of Investments.
Purchases and sales of securities including the Equity and Fixed-Income Central Funds, other than short-term securities and U.S. government securities, aggregated $272,919,922 and $293,782,683, respectively.
6. Fees and Other Transactions with Affiliates.
Management Fee. FMR and its affiliates provide the Fund with investment management related services for which the Fund pays a monthly management fee. The management fee is the sum of an individual fund fee rate that is based on an annual rate of .30% of the Fund's average net assets and a group fee rate that averaged .26% during the period. The group fee rate is based upon the average net assets of all the mutual funds advised by FMR. The group fee rate decreases as assets under management increase and increases as assets under management decrease. For the period, the total annual management fee rate was .56% of the Fund's average net assets.
Distribution and Service Plan. In accordance with Rule 12b-1 of the 1940 Act, the Fund has adopted separate 12b-1 Plans for each Service Class of shares. Each Service Class pays Fidelity Distributors Corporation (FDC), an affiliate of FMR, a service fee. For the period, the service fee is based on an annual rate of .10% of Service Class' average net assets and .25% of Service Class 2's average net assets.
For the period, each class paid FDC the following amounts, all of which were re-allowed to insurance companies for the distribution of shares and providing shareholder support services:
Service Class | $ 4,969 |
Service Class 2 | 17,117 |
| $ 22,086 |
Transfer Agent Fees. Fidelity Investments Institutional Operations Company, Inc. (FIIOC), an affiliate of FMR, is the Fund's transfer, dividend disbursing, and shareholder servicing agent. FIIOC receives an asset-based fee with respect to each class. Each class with the exception of Investor Class pays a transfer agent fee, excluding out of pocket expenses, equal to an annual rate of .07% of average net assets. Investor Class pays a monthly asset-based transfer agent fee of .18% of average net assets. The total transfer agent fees paid by each class to FIIOC, including out of pocket expenses, were as follows:
Initial Class | $ 145,784 |
Service Class | 3,489 |
Service Class 2 | 7,008 |
Investor Class | 21,258 |
| $ 177,539 |
Effective February 1, 2008, the Board of Trustees approved a decrease to Investor Class' asset-based fee from .18% to .15% of average net assets.
Annual Report
Notes to Financial Statements - continued
6. Fees and Other Transactions with Affiliates - continued
Accounting and Security Lending Fees. Fidelity Service Company, Inc. (FSC), an affiliate of FMR, maintains the Fund's accounting records. The accounting fee is based on the level of average net assets for the month. Under a separate contract, FSC administers the security lending program. The security lending fee is based on the number and duration of lending transactions.
Brokerage Commissions. The Fund placed a portion of its portfolio transactions with brokerage firms which are affiliates of the investment adviser. The commissions paid to these affiliated firms were $1,556 for the period.
7. Committed Line of Credit.
The Fund participates with other funds managed by FMR in a $4.2 billion credit facility (the "line of credit") to be utilized for temporary or emergency purposes to fund shareholder redemptions or for other short-term liquidity purposes. The Fund has agreed to pay commitment fees on its pro rata portion of the line of credit, which amounted to $487 and is reflected in Miscellaneous Expense on the Statement of Operations. During the period, there were no borrowings on this line of credit.
8. Security Lending.
The Fund lends portfolio securities from time to time in order to earn additional income. On the settlement date of the loan, the Fund receives collateral (in the form of U.S. Treasury obligations, letters of credit and/or cash) against the loaned securities and maintains collateral in an amount not less than 100% of the market value of the loaned securities during the period of the loan. The market value of the loaned securities is determined at the close of business of the Fund and any additional required collateral is delivered to the Fund on the next business day. If the borrower defaults on its obligation to return the securities loaned because of insolvency or other reasons, a fund could experience delays and costs in recovering the securities loaned or in gaining access to the collateral. Any cash collateral received is invested in the Fidelity Securities Lending Cash Central Fund. The value of loaned securities and cash collateral at period end are disclosed on the Fund's Statement of Assets and Liabilities. Security lending income represents the income earned on investing cash collateral, less fees and expenses associated with the loan, plus any premium payments that may be received on the loan of certain types of securities. Security lending income is presented in the Statement of Operations as a component of income from Fidelity Central Funds. Net income from lending portfolio securities during the period amounted to $19,030.
9. Expense Reductions.
Many of the brokers with whom FMR places trades on behalf of the Fund provided services to the Fund in addition to trade execution. These services included payments of certain expenses on behalf of the Fund totaling $11,360 for the period. In addition, through arrangements with the Fund's custodian, credits realized as a result of uninvested cash balances were used to reduce the Fund's expenses. During the period, these credits reduced the Fund's custody expenses by $561.
10. Other.
The Fund's organizational documents provide former and current trustees and officers with a limited indemnification against liabilities arising in connection with the performance of their duties to the Fund. In the normal course of business, the Fund may also enter into contracts that provide general indemnifications. The Fund's maximum exposure under these arrangements is unknown as this would be dependent on future claims that may be made against the Fund. The risk of material loss from such claims is considered remote.
At the end of the period, FMR or its affiliates were the owners of record of 73% of the total outstanding shares of the Fund.
The United States Securities and Exchange Commission ("SEC") is conducting an investigation of FMR (covering the years 2002 to 2004) arising from gifts, gratuities and business entertainment provided by certain brokers to certain individuals who were employed on FMR's domestic equity trading desk during that period. FMR is in discussions with the SEC staff regarding the possible resolution of the matter, but as of period-end no final resolution has been reached.
In December 2006, the Independent Trustees completed their own investigation of the matter with the assistance of independent counsel. The Independent Trustees and FMR agree that, despite the absence of proof that the Fidelity mutual funds experienced diminished execution quality as a result of the improper receipt of gifts and business entertainment, the conduct at issue was serious and is worthy of redress. Accordingly, the Independent Trustees have requested and FMR has agreed to pay $42 million to Fidelity mutual funds, plus interest to be determined at the time that payment is made. A method of allocating this payment among the funds has not yet been determined. The total payment to the Fund is not anticipated to have a material impact on the Fund's net assets. In addition, FMR reimbursed related legal expenses which are recorded in the accompanying Statement of Operations as an expense reduction.
Annual Report
11. Distributions to Shareholders.
Distributions to shareholders of each class were as follows:
Years ended December 31, | 2007 | 2006 |
From net investment income | | |
Initial Class | $ 8,859,832 | $ 5,133,316 |
Service Class | 204,868 | 109,477 |
Service Class 2 | 261,814 | 111,371 |
Investor Class | 471,691 | 41,341 |
Total | $ 9,798,205 | $ 5,395,505 |
12. Share Transactions.
Transactions for each class of shares were as follows:
| Shares | Dollars |
Years ended December 31, | 2007 | 2006 | 2007 | 2006 |
Initial Class | | | | |
Shares sold | 362,169 | 471,898 | $ 5,422,430 | $ 6,042,415 |
Reinvestment of distributions | 614,047 | 399,480 | 8,859,831 | 5,133,316 |
Shares redeemed | (2,920,445) | (5,386,526) | (42,137,623) | (70,711,679) |
Net increase (decrease) | (1,944,229) | (4,515,148) | $ (27,855,362) | $ (59,535,948) |
Service Class | | | | |
Shares sold | 20,432 | 20,643 | $ 287,973 | $ 268,081 |
Reinvestment of distributions | 14,289 | 8,573 | 204,868 | 109,477 |
Shares redeemed | (71,493) | (95,735) | (1,011,333) | (1,232,677) |
Net increase (decrease) | (36,772) | (66,519) | $ (518,492) | $ (855,119) |
Service Class 2 | | | | |
Shares sold | 308,193 | 122,361 | $ 4,486,311 | $ 1,590,518 |
Reinvestment of distributions | 18,038 | 8,762 | 261,814 | 111,371 |
Shares redeemed | (226,400) | (125,933) | (3,287,598) | (1,612,989) |
Net increase (decrease) | 99,831 | 5,190 | $ 1,460,527 | $ 88,900 |
Investor Class | | | | |
Shares sold | 724,903 | 550,642 | $ 10,617,048 | $ 7,124,044 |
Reinvestment of distributions | 31,989 | 3,225 | 471,691 | 41,341 |
Shares redeemed | (205,796) | (148,989) | (2,995,812) | (1,944,955) |
Net increase (decrease) | 551,096 | 404,878 | $ 8,092,927 | $ 5,220,430 |
Annual Report
Report of Independent Registered Public Accounting Firm
To the Trustees of Variable Insurance Products Fund V and Shareholders of VIP Asset Manager: Growth Portfolio:
We have audited the accompanying statement of assets and liabilities of VIP Asset Manager: Growth Portfolio (the Fund), a fund of Variable Insurance Products Fund V, including the schedule of investments, as of December 31, 2007, and the related statement of operations for the year then ended, the statement of changes in net assets for each of the two years in the period then ended, and the financial highlights for each of the five years in the period then ended. These financial statements and financial highlights are the responsibility of the Fund's management. Our responsibility is to express an opinion on these financial statements and financial highlights based on our audits.
We conducted our audits in accordance with standards of the Public Company Accounting Oversight Board (United States). Those standards require that we plan and perform the audit to obtain reasonable assurance about whether the financial statements and financial highlights are free of material misstatement. The Fund is not required to have, nor were we engaged to perform, an audit of its internal control over financial reporting. Our audits included consideration of internal control over financial reporting as a basis for designing audit procedures that are appropriate in the circumstances, but not for the purpose of expressing an opinion on the effectiveness of the Fund's internal control over financial reporting. Accordingly, we express no such opinion. An audit also includes examining, on a test basis, evidence supporting the amounts and disclosures in the financial statements, assessing the accounting principles used and significant estimates made by management, as well as evaluating the overall financial statement presentation. Our procedures included confirmation of securities owned as of December 31, 2007, by correspondence with the custodians and brokers; where replies were not received from brokers, we performed other auditing procedures. We believe that our audits provide a reasonable basis for our opinion.
In our opinion, the financial statements and financial highlights referred to above present fairly, in all material respects, the financial position of VIP Asset Manager: Growth Portfolio as of December 31, 2007, the results of its operations for the year then ended, the changes in its net assets for each of the two years in the period then ended, and its financial highlights for each of the five years in the period then ended, in conformity with accounting principles generally accepted in the United States of America.
/s/ Deloitte & Touche LLP
DELOITTE & TOUCHE LLP
Boston, Massachusetts
February 28, 2008
Annual Report
Trustees and Officers
The Trustees, Members of the Advisory Board, and executive officers of the trust and fund, as applicable, are listed below. The Board of Trustees governs the fund and is responsible for protecting the interests of shareholders. The Trustees are experienced executives who meet periodically throughout the year to oversee the fund's activities, review contractual arrangements with companies that provide services to the fund, and review the fund's performance. Except for James C. Curvey, each of the Trustees oversees 373 funds advised by FMR or an affiliate. Mr. Curvey oversees 368 funds advised by FMR or an affiliate.
The Trustees hold office without limit in time except that (a) any Trustee may resign; (b) any Trustee may be removed by written instrument, signed by at least two-thirds of the number of Trustees prior to such removal; (c) any Trustee who requests to be retired or who has become incapacitated by illness or injury may be retired by written instrument signed by a majority of the other Trustees; and (d) any Trustee may be removed at any special meeting of shareholders by a two-thirds vote of the outstanding voting securities of the trust. Each Trustee who is not an interested person (as defined in the 1940 Act) (Independent Trustee), shall retire not later than the last day of the calendar year in which his or her 72nd birthday occurs. The Independent Trustees may waive this mandatory retirement age policy with respect to individual Trustees. The executive officers and Advisory Board Members hold office without limit in time, except that any officer and Advisory Board Member may resign or may be removed by a vote of a majority of the Trustees at any regular meeting or any special meeting of the Trustees. Except as indicated, each individual has held the office shown or other offices in the same company for the past five years.
The fund's Statement of Additional Information (SAI) includes more information about the Trustees. To request a free copy, call Fidelity at 1-877-208-0098.
Interested Trustees*:
Correspondence intended for each Trustee who is an interested person may be sent to Fidelity Investments, 82 Devonshire Street, Boston, Massachusetts 02109.
Name, Age; Principal Occupation |
Edward C. Johnson 3d (77) |
| Year of Election or Appointment: 1989 Mr. Johnson is Chairman of the Board of Trustees. Mr. Johnson serves as President (2006-present), Chief Executive Officer, Chairman, and a Director of FMR LLC; Chairman and a Director of FMR; Chairman and a Director of Fidelity Research & Analysis Company (FRAC); Chairman and a Director of Fidelity Investments Money Management, Inc.; and Chairman (2001-present) and a Director of FMR Co., Inc. In addition, Mr. Johnson serves as Chairman and Director of Fidelity International Limited (FIL). Mr. Edward C. Johnson 3d and Mr. Arthur E. Johnson are not related. |
James C. Curvey (72) |
| Year of Election or Appointment: 2007 Mr. Curvey also serves as Trustee (2007-present) or Member of the Advisory Board (2007-present) of other investment companies advised by FMR. Mr. Curvey is a Director of FMR and FMR Co., Inc. (2007-present). Mr. Curvey is also Vice Chairman (2006-present) and Director of FMR LLC. Mr. Curvey joined Fidelity in 1982 and served in numerous senior management positions, including President and Chief Operating Officer of FMR LLC (1997-2000) and President of Fidelity Strategic Investments (2000-2002). In addition, he serves as a member of the Board of Directors of Geerlings & Wade, Inc. (wine distribution). |
* Trustees have been determined to be "Interested Trustees" by virtue of, among other things, their affiliation with the trust or various entities under common control with FMR. FMR Corp. merged with and into FMR LLC on October 1, 2007. Any references to FMR LLC for prior periods are deemed to be references to the prior entity.
Independent Trustees:
Correspondence intended for each Independent Trustee (that is, the Trustees other than the Interested Trustees) may be sent to Fidelity Investments, P.O. Box 55235, Boston, Massachusetts 02205-5235.
Name, Age; Principal Occupation |
Dennis J. Dirks (59) |
| Year of Election or Appointment: 2005 Prior to his retirement in May 2003, Mr. Dirks was Chief Operating Officer and a member of the Board of The Depository Trust & Clearing Corporation (DTCC) (1999-2003). He also served as President, Chief Operating Officer, and Board member of The Depository Trust Company (DTC) (1999-2003) and President and Board member of the National Securities Clearing Corporation (NSCC) (1999-2003). In addition, Mr. Dirks served as Chief Executive Officer and Board member of the Government Securities Clearing Corporation (2001-2003) and Chief Executive Officer and Board member of the Mortgage-Backed Securities Clearing Corporation (2001-2003). Mr. Dirks also serves as a Trustee and a member of the Finance Committee of Manhattan College (2005-present) and a Trustee and a member of the Finance Committee of AHRC of Nassau County (2006-present). |
Albert R. Gamper, Jr. (65) |
| Year of Election or Appointment: 2006 Prior to his retirement in December 2004, Mr. Gamper served as Chairman of the Board of CIT Group Inc. (commercial finance). During his tenure with CIT Group Inc. Mr. Gamper served in numerous senior management positions, including Chairman (1987-1989; 1999-2001; 2002-2004), Chief Executive Officer (1987-2004), and President (1989-2002). He currently serves as a member of the Board of Directors of Public Service Enterprise Group (utilities, 2001-present), Chairman of the Board of Governors, Rutgers University (2004-present), and Chairman of the Board of Saint Barnabas Health Care System. |
George H. Heilmeier (71) |
| Year of Election or Appointment: 2004 Dr. Heilmeier is Chairman Emeritus of Telcordia Technologies (communication software and systems), where prior to his retirement, he served as company Chairman and Chief Executive Officer. He currently serves on the Boards of Directors of The Mitre Corporation (systems engineering and information technology support for the government), and HRL Laboratories (private research and development, 2004-present). He is Chairman of the General Motors Science & Technology Advisory Board and a Life Fellow of the Institute of Electrical and Electronics Engineers (IEEE). Dr. Heilmeier is a member of the Defense Science Board and the National Security Agency Advisory Board. He is also a member of the National Academy of Engineering, the American Academy of Arts and Sciences, and the Board of Overseers of the School of Engineering and Applied Science of the University of Pennsylvania. Previously, Dr. Heilmeier served as a Director of TRW Inc. (automotive, space, defense, and information technology, 1992-2002), Compaq (1994-2002), Automatic Data Processing, Inc. (ADP) (technology-based business outsourcing, 1995-2002), INET Technologies Inc. (telecommunications network surveillance, 2001-2004), and Teletech Holdings (customer management services). He is the recipient of the 2005 Kyoto Prize in Advanced Technology for his invention of the liquid crystal display, and a member of the Consumer Electronics Hall of Fame. |
James H. Keyes (67) |
| Year of Election or Appointment: 2007 Prior to his retirement in 2003, Mr. Keyes was Chairman, President, and Chief Executive Officer of Johnson Controls, Inc. (automotive supplier, 1993-2003). He currently serves as a member of the boards of LSI Logic Corporation (semiconductor technologies), Navistar International Corporation (manufacture and sale of trucks, buses, and diesel engines, 2002-present), and Pitney Bowes, Inc. (integrated mail, messaging, and document management solutions). |
Marie L. Knowles (61) |
| Year of Election or Appointment: 2001 Prior to Ms. Knowles' retirement in June 2000, she served as Executive Vice President and Chief Financial Officer of Atlantic Richfield Company (ARCO) (diversified energy, 1996-2000). From 1993 to 1996, she was a Senior Vice President of ARCO and President of ARCO Transportation Company. She served as a Director of ARCO from 1996 to 1998. She currently serves as a Director of Phelps Dodge Corporation (copper mining and manufacturing) and McKesson Corporation (healthcare service, 2002-present). Ms. Knowles is a Trustee of the Brookings Institution and the Catalina Island Conservancy and also serves as a member of the Advisory Board for the School of Engineering of the University of Southern California. |
Ned C. Lautenbach (63) |
| Year of Election or Appointment: 2000 Mr. Lautenbach is Chairman of the Independent Trustees (2006-present). Mr. Lautenbach has been a partner of Clayton, Dubilier & Rice, Inc. (private equity investment firm) since September 1998. Previously, Mr. Lautenbach was with the International Business Machines Corporation (IBM) from 1968 until his retirement in 1998. Mr. Lautenbach serves as a Director of Sony Corporation (2006-present) and Eaton Corporation (diversified industrial) as well as the Philharmonic Center for the Arts in Naples, Florida. He also is a member of the Board of Trustees of Fairfield University (2005-present), as well as a member of the Council on Foreign Relations. |
Cornelia M. Small (63) |
| Year of Election or Appointment: 2005 Ms. Small is a member (2000-present) and Chairperson (2002-present) of the Investment Committee, and a member (2002-present) of the Board of Trustees of Smith College. Previously, she served as Chief Investment Officer (1999-2000), Director of Global Equity Investments (1996-1999), and a member of the Board of Directors of Scudder, Stevens & Clark (1990-1997) and Scudder Kemper Investments (1997-1999). In addition, Ms. Small served as Co-Chair (2000-2003) of the Annual Fund for the Fletcher School of Law and Diplomacy. |
William S. Stavropoulos (68) |
| Year of Election or Appointment: 2001 Mr. Stavropoulos is Chairman Emeritus of the Board of Directors of The Dow Chemical Company. Since joining The Dow Chemical Company in 1967, Mr. Stavropoulos served in numerous senior management positions, including President (1993-2000; 2002-2003), CEO (1995-2000; 2002-2004), and Chairman of the Executive Committee (2000-2004). Currently, he is a Director of NCR Corporation (data warehousing and technology solutions), Chemical Financial Corporation, Maersk Inc. (industrial conglomerate, 2002-present), Tyco International, Inc. (multinational manufacturing and services, 2007-present), and a member of the Advisory Board for Metalmark Capital (private equity investment firm, 2005-present). He is a special advisor to Clayton, Dubilier & Rice, Inc., a private equity investment firm. He also serves as a member of the Board of Trustees of the American Enterprise Institute for Public Policy Research. In addition, Mr. Stavropoulos is a member of The Business Council, J.P. Morgan International Council and the University of Notre Dame Advisory Council for the College of Science. |
Kenneth L. Wolfe (68) |
| Year of Election or Appointment: 2005 Mr. Wolfe is Chairman and a Director of Hershey Foods Corporation (2007-present), where prior to his retirement in 2001, he was Chairman and Chief Executive Officer. Mr. Wolfe currently serves as a member of the board of Revlon Inc. (2004-present). Previously, Mr. Wolfe served as a member of the boards of Adelphia Communications Corporation (2003-2006) and Bausch & Lomb, Inc. (1993-2007). |
Advisory Board Members and Executive Officers**:
Correspondence intended for Mr. Mauriello, Mr. Thomas, Mr. Wiley, Mr. Lacy, and Mr. Arthur Johnson may be sent to Fidelity Investments, P.O. Box 55235, Boston, Massachusetts 02205-5235. Correspondence intended for each executive officer and Mr. Lynch may be sent to Fidelity Investments, 82 Devonshire Street, Boston, Massachusetts 02109.
Name, Age; Principal Occupation |
Arthur E. Johnson (60) |
| Year of Election or Appointment: 2008 Member of the Advisory Board of Variable Insurance Products Fund V. Mr. Johnson serves as Senior Vice President of Corporate Strategic Development of Lockheed Martin Corporation (defense contractor). In addition, Mr. Johnson serves as a member of the Board of Directors of AGL Resources, Inc. (holding company, 2002-present), and IKON Office Solutions, Inc. (document management systems and services). Mr. Arthur E. Johnson and Mr. Edward C. Johnson 3d are not related. |
Alan J. Lacy (54) |
| Year of Election or Appointment: 2008 Member of the Advisory Board of Variable Insurance Products Fund V. Mr. Lacy serves as Senior Adviser (2007-present) of Oak Hill Capital Partners, L.P. (a private equity firm). Mr. Lacy also served as Vice Chairman and Chief Executive Officer of Sears Holdings Corporation and Sears, Roebuck and Co. (retail, 2005-2006; 2000-2005). In addition, Mr. Lacy serves as a member of the Board of Directors of The Western Union Company (global money transfer, 2006-present) and Bristol-Myers Squibb (global pharmaceuticals, 2007-present). Mr. Lacy is a Trustee of the National Parks Conservation Association and The Field Museum of Natural History. |
Peter S. Lynch (63) |
| Year of Election or Appointment: 2003 Member of the Advisory Board of Variable Insurance Products Fund V. Mr. Lynch is Vice Chairman and a Director of FMR, and Vice Chairman (2001-present) and a Director of FMR Co., Inc. Previously, Mr. Lynch served as a Trustee of the Fidelity funds (1990-2003). In addition, he serves as a Trustee of Boston College and as the Chairman of the Inner-City Scholarship Fund. |
Joseph Mauriello (63) |
| Year of Election or Appointment: 2007 Member of the Advisory Board of Variable Insurance Products Fund V. Prior to his retirement in January 2006, Mr. Mauriello served in numerous senior management positions including Deputy Chairman and Chief Operating Officer (2004-2005), and Vice Chairman of Financial Services (2002-2004) of KPMG LLP US (professional services firm, 1965-2005). Mr. Mauriello currently serves as a member of the Board of Directors of XL Capital Ltd. (global insurance and re-insurance company, 2006-present) and of Arcadia Resources Inc. (health care services and products, 2007-present). He also served as a Director of the Hamilton Funds of the Bank of New York (2006-2007). |
David M. Thomas (58) |
| Year of Election or Appointment: 2007 Member of the Advisory Board of Variable Insurance Products Fund V. Previously, Mr. Thomas served as Executive Chairman (2005-2006) and Chairman and Chief Executive Officer (2000-2005) of IMS Health, Inc. (pharmaceutical and healthcare information solutions). In addition, Mr. Thomas serves as a member of the Board of Directors of Fortune Brands, Inc. (consumer products holding company), and Interpublic Group of Companies, Inc. (marketing communication, 2004-present). |
Michael E. Wiley (57) |
| Year of Election or Appointment: 2007 Member of the Advisory Board of Variable Insurance Products Fund V. Mr. Wiley also serves as a member of the Board of Trustees of the University of Tulsa (2000-2006; 2007-present). He serves as a Director of Tesoro Corporation (independent oil refiner and marketer, 2005-present), and a Director of Bill Barrett Corporation (exploration and production company, 2005-present). In addition, he also serves as a Director of Post Oak Bank (privately-held bank, 2004-present). Previously, Mr. Wiley served as a Sr. Energy Advisor of Katzenbach Partners, LLC (consulting firm, 2006-2007), as an Advisory Director of Riverstone Holdings (private investment firm), Chairman, President, and CEO of Baker Hughes, Inc. (oilfield services company, 2000-2004), and as Director of Spinnaker Exploration Company (exploration and production company, 2001-2005). |
Kimberley H. Monasterio (44) |
| Year of Election or Appointment: 2007 President and Treasurer of VIP Asset Manager: Growth. Ms. Monasterio also serves as President and Treasurer of other Fidelity funds (2007-present) and is an employee of FMR (2004-present). Previously, Ms. Monasterio served as Deputy Treasurer of the Fidelity funds (2004-2006). Before joining Fidelity Investments, Ms. Monasterio served as Treasurer (2000-2004) and Chief Financial Officer (2002-2004) of the Franklin Templeton Funds and Senior Vice President of Franklin Templeton Services, LLC (2000-2004). |
Ren Y. Cheng (50) |
| Year of Election or Appointment: 2007 Vice President of VIP Asset Manager: Growth. Mr. Cheng also serves as Vice President of certain Asset Allocation Funds (2007-present). Mr. Cheng is Chief Investment Officer of the Global Asset Allocation group (2007-present). Mr. Cheng also serves as Vice President of FMR and FMR Co., Inc. Mr. Cheng served as Managing Director of the Global Asset Allocation group (2005-2007). Previously, Mr. Cheng served as a portfolio manager for the Fidelity Freedom Funds. |
Boyce I. Greer (51) |
| Year of Election or Appointment: 2005 Vice President of VIP Asset Manager: Growth. Mr. Greer also serves as Vice President of certain Asset Allocation Funds (2005-present), Fixed-Income Funds (2006-present), and Money Market Funds (2006-present). Mr. Greer is also a Trustee of other investment companies advised by FMR (2003-present). Mr. Greer is an Executive Vice President of FMR (2005-present) and FMR Co., Inc. (2005-present), and Senior Vice President of Fidelity Investments Money Management, Inc. (2006-present). Previously, Mr. Greer served as Vice President of certain Fidelity Equity Funds (2005-2007), a Director and Managing Director of Strategic Advisers, Inc. (2002-2005), and Executive Vice President (2000-2002) and Money Market Group Leader (1997-2002) of the Fidelity Investments Fixed Income Division. Mr. Greer also served as Vice President of Fidelity's Money Market Funds (1997-2002), Senior Vice President of FMR (1997-2002), and Vice President of FIMM (1998-2002). |
Thomas J. Silvia (46) |
| Year of Election or Appointment: 2005 Vice President of VIP Asset Manager: Growth. Mr. Silvia also serves as Vice President of Fidelity's Fixed-Income Funds (2005-present) and Senior Vice President and Bond Group Leader of the Fidelity Investments Fixed-Income Division (2005-present). Previously, Mr. Silvia served as Vice President of certain Balanced Funds (2005-2007), certain Asset Allocation Funds (2005-2007), a Director of Fidelity's Taxable Bond portfolio managers (2002-2004) and a portfolio manager in the Bond Group (1997-2004). |
Eric D. Roiter (59) |
| Year of Election or Appointment: 1998 Secretary of VIP Asset Manager: Growth. He also serves as Secretary of other Fidelity funds; Vice President, General Counsel, and Secretary of FMR Co., Inc. (2001-present) and FMR; Assistant Secretary of Fidelity Management & Research (U.K.) Inc. (2001-present), Fidelity Research & Analysis Company (2001-present), and Fidelity Investments Money Management, Inc. (2001-present). Mr. Roiter is an Adjunct Member, Faculty of Law, at Boston College Law School (2003-present). Previously, Mr. Roiter served as Vice President and Secretary of Fidelity Distributors Corporation (FDC) (1998-2005). |
John B. McGinty, Jr. (45) |
| Year of Election or Appointment: 2008 Assistant Secretary of VIP Asset Manager Growth. Mr. McGinty also serves as Assistant Secretary of other Fidelity funds (2008-present) and is an employee of FMR LLC (2004-present). Mr. McGinty also serves as Senior Vice President, Secretary, and Chief Legal Officer of FDC (2007-present). Before joining Fidelity Investments, Mr. McGinty practiced law at Ropes & Gray, LLP. |
Joseph B. Hollis (59) |
| Year of Election or Appointment: 2006 Chief Financial Officer of VIP Asset Manager: Growth. Mr. Hollis also serves as Chief Financial Officer of other Fidelity funds. Mr. Hollis is President of Fidelity Pricing and Cash Management Services (FPCMS) (2005-present). Mr. Hollis also serves as President and Director of Fidelity Service Company, Inc. (2006-present). Previously, Mr. Hollis served as Senior Vice President of Cash Management Services (1999-2002) and Investment Management Operations (2002-2005). |
Kenneth A. Rathgeber (60) |
| Year of Election or Appointment: 2004 Chief Compliance Officer of VIP Asset Manager: Growth. Mr. Rathgeber also serves as Chief Compliance Officer of other Fidelity funds (2004-present) and Executive Vice President of Risk Oversight for Fidelity Investments (2002-present). He is Chief Compliance Officer of FMR (2005-present), FMR Co., Inc. (2005-present), Fidelity Management & Research (U.K.) Inc. (2005-present), Fidelity Research & Analysis Company (2005-present), Fidelity Investments Money Management, Inc. (2005-present), and Strategic Advisers, Inc. (2005-present). Previously, Mr. Rathgeber served as Executive Vice President and Chief Operating Officer for Fidelity Investments Institutional Services Company, Inc. (1998-2002). |
Bryan A. Mehrmann (46) |
| Year of Election or Appointment: 2005 Deputy Treasurer of VIP Asset Manager: Growth. Mr. Mehrmann also serves as Deputy Treasurer of other Fidelity funds (2005-present) and is an employee of FMR. Previously, Mr. Mehrmann served as Vice President of Fidelity Investments Institutional Services Group (FIIS)/Fidelity Investments Institutional Operations Corporation, Inc. (FIIOC) Client Services (1998-2004). |
Kenneth B. Robins (38) |
| Year of Election or Appointment: 2005 Deputy Treasurer of VIP Asset Manager: Growth. Mr. Robins also serves as Deputy Treasurer of other Fidelity funds (2005-present) and is an employee of FMR (2004-present). Before joining Fidelity Investments, Mr. Robins worked at KPMG LLP, where he was a partner in KPMG's department of professional practice (2002-2004) and a Senior Manager (1999-2000). In addition, Mr. Robins served as Assistant Chief Accountant, United States Securities and Exchange Commission (2000-2002). |
Robert G. Byrnes (41) |
| Year of Election or Appointment: 2005 Assistant Treasurer of VIP Asset Manager: Growth. Mr. Byrnes also serves as Assistant Treasurer of other Fidelity funds (2005-present) and is an employee of FMR (2005-present). Previously, Mr. Byrnes served as Vice President of FPCMS (2003-2005). Before joining Fidelity Investments, Mr. Byrnes worked at Deutsche Asset Management where he served as Vice President of the Investment Operations Group (2000-2003). |
Peter L. Lydecker (53) |
| Year of Election or Appointment: 2004 Assistant Treasurer of VIP Asset Manager: Growth. Mr. Lydecker also serves as Assistant Treasurer of other Fidelity funds (2004) and is an employee of FMR. |
Paul M. Murphy (60) |
| Year of Election or Appointment: 2007 Assistant Treasurer of VIP Asset Manager: Growth. Mr. Murphy also serves as Assistant Treasurer of other Fidelity funds (2007-present) and is an employee of FMR (2007-present). Previously, Mr. Murphy served as Chief Financial Officer of the Fidelity Funds (2005-2006), Vice President and Associate General Counsel of FMR (2007), and Senior Vice President of Fidelity Pricing and Cash Management Services Group (FPCMS) (1994-2007). |
Gary W. Ryan (49) |
| Year of Election or Appointment: 2005 Assistant Treasurer of VIP Asset Manager: Growth. Mr. Ryan also serves as Assistant Treasurer of other Fidelity funds (2005-present) and is an employee of FMR (2005-present). Previously, Mr. Ryan served as Vice President of Fund Reporting in FPCMS (1999-2005). |
** FMR Corp. merged with and into FMR LLC on October 1, 2007. Any references to FMR LLC for prior periods are deemed to be references to the prior entity.
Annual Report
Distributions
The Board of Trustees of VIP Asset Manager: Growth Portfolio voted to pay to shareholders of record at the opening of business on record date, the following distributions per share derived from capital gains realized from sales of portfolio securities:
| Pay Date | Record Date | Capital Gains |
Initial Class | 02/15/08 | 02/15/08 | $0.01 |
Service Class | 02/15/08 | 02/15/08 | $0.01 |
Service Class 2 | 02/15/08 | 02/15/08 | $0.01 |
Investor Class | 02/15/08 | 02/15/08 | $0.01 |
Service Class designates 26% and 18%; Investor Class designates 26% and 18%; Initial Class designates 25% and 17%; and Service Class 2 designates 29% and 19%; of the dividends distributed in February and December 2007 respectively as qualifying for the dividends-received deduction for corporate shareholders.
The fund will notify shareholders in January 2008 of amounts for use in preparing 2007 income tax returns.
Annual Report
Board Approval of Investment Advisory Contracts and Management Fees
VIP Asset Manager: Growth Portfolio
Each year, typically in July, the Board of Trustees, including the Independent Trustees (together, the Board), votes on the renewal of the management contract and sub-advisory agreements (together, the Advisory Contracts) for the fund. The Board, assisted by the advice of fund counsel and Independent Trustees' counsel, requests and considers a broad range of information throughout the year.
The Board meets regularly each month except August and takes into account throughout the year matters bearing on Advisory Contracts. The Board, acting directly and through its separate committees, considers at each of its meetings factors that are relevant to the annual renewal of the fund's Advisory Contracts, including the services and support provided to the fund and its shareholders. At the time of the renewal, the Board had 12 standing committees, each composed of Independent Trustees with varying backgrounds, to which the Board has assigned specific subject matter responsibilities in order to enhance effective decision-making by the Board. Each committee has adopted a written charter outlining the structure and purposes of the committee. One such committee, the Equity Contract Committee, meets periodically as needed throughout the year to consider matters specifically related to the annual renewal of Advisory Contracts. The committee requests and receives information on, and makes recommendations to the Independent Trustees concerning, the approval and annual review of the Advisory Contracts.
At its July 2007 meeting, the Board of Trustees, including the Independent Trustees, unanimously determined to renew the Advisory Contracts for the fund. In reaching its determination, the Board considered all factors it believed relevant, including (i) the nature, extent, and quality of the services to be provided to the fund and its shareholders (including the investment performance of the fund); (ii) the competitiveness of the management fee and total expenses of the fund; (iii) the total costs of the services to be provided by and the profits to be realized by the investment adviser and its affiliates from the relationship with the fund; (iv) the extent to which economies of scale would be realized as the fund grows; and (v) whether fee levels reflect these economies of scale, if any, for the benefit of fund shareholders. The Board also approved amendments to the fund's agreements with foreign sub-advisers to clarify that each sub-adviser provides services as an independent contractor.
In determining whether to renew the Advisory Contracts for the fund, the Board ultimately reached a determination, with the assistance of fund counsel and Independent Trustees' counsel, that the renewal of the Advisory Contracts and the compensation to be received by Fidelity under the management contract is consistent with Fidelity's fiduciary duty under applicable law. In addition to evaluating the specific factors noted above, the Board, in reaching its determination, is aware that shareholders in the fund have a broad range of investment choices available to them, including a wide choice among mutual funds offered by competitors to Fidelity, and that the fund's shareholders, with the opportunity to review and weigh the disclosure provided by the fund in its prospectus and other public disclosures, have chosen to invest in this fund, managed by Fidelity.
Nature, Extent, and Quality of Services Provided. The Board considered staffing within the investment adviser, FMR, and the sub-advisers (together, the Investment Advisers), including the backgrounds of the fund's portfolio managers and the fund's investment objective and discipline. The Independent Trustees also had discussions with senior management of Fidelity's investment operations and investment groups. The Board considered the structure of the portfolio manager compensation program and whether this structure provides appropriate incentives.
Resources Dedicated to Investment Management and Support Services. The Board reviewed the size, education, and experience of the Investment Advisers' investment staff, their use of technology, and the Investment Advisers' approach to recruiting, training, and retaining portfolio managers and other research, advisory, and management personnel. The Board considered Fidelity's extensive global research capabilities that enable the Investment Advisers to aggregate data from various sources in an effort to produce positive investment results. The Board noted that Fidelity's analysts have access to a variety of technological tools that enable them to perform both fundamental and quantitative analysis and to specialize in various disciplines. The Board also considered that Fidelity's portfolio managers and analysts have access to daily portfolio attribution that allows for monitoring of a fund's portfolio, as well as an electronic communication system that provides immediate real-time access to research concerning issuers and credit enhancers.
Shareholder and Administrative Services. The Board considered (i) the nature, extent, quality, and cost of advisory, administrative, distribution, and shareholder services performed by the Investment Advisers and their affiliates under the Advisory Contracts and under separate agreements covering transfer agency, pricing and bookkeeping, and securities lending services for the fund; (ii) the nature and extent of the Investment Advisers' supervision of third party service providers, principally custodians and subcustodians; and (iii) the resources devoted to, and the record of compliance with, the fund's compliance policies and procedures. The Board reviewed the allocation of fund brokerage, including allocations to brokers affiliated with the Investment Advisers, the use of brokerage commissions to pay fund expenses, and the use of "soft" commission dollars to pay for research services. The Board also considered that Fidelity voluntarily pays for market data out of its own resources. The Board also considered the agreement reached between the Independent Trustees and Fidelity in December 2006 following an independent review of matters relating to receipt of travel, entertainment, gifts and gratuities in violation of Fidelity policies.
The Board noted that the growth of fund assets across the complex allows Fidelity to reinvest in the development of services designed to enhance the value or convenience of the Fidelity funds as investment vehicles. These services include 24-hour access to account information and market information through phone representatives and over the Internet, and investor education materials and asset allocation tools.
Annual Report
Investment in a Large Fund Family. The Board considered the benefits to shareholders of investing in a Fidelity fund, including the benefits of investing in a fund that is part of a large family of funds offering a variety of investment disciplines and providing for a large variety of mutual fund investor services. The Board noted that, since the last Advisory Contract renewals in July 2006, Fidelity has taken a number of actions that benefited particular funds, including (i) dedicating additional resources to investment research and to restructure the investment research teams; (ii) contractually agreeing to reduce the management fee on Fidelity Advisor Floating Rate High Income Fund; (iii) contractually agreeing to reduce the management fees on Fidelity's California, Massachusetts, New Jersey, and New York AMT Tax-Free Money Market Funds, launching new Institutional Classes and Service Classes of these funds, and contractually agreeing to impose expense limitations on these funds; (iv) eliminating the exchange fee on the Fidelity Select Portfolios and reducing the pricing and bookkeeping fee rates for these funds; (v) reducing the maximum transfer agency fee rates on high income funds and certain equity funds; (vi) proposing amended management contracts that, if approved by shareholders, will add a performance adjustment component to the management fees paid by 18 Fidelity Advisor equity funds; (vii) contractually agreeing to reduce fees for Ultra-Short Central Fund and the money market Central Funds; (viii) waiving the Fidelity Advisor funds' contingent deferred sales charge on certain redemptions made through systematic withdrawal programs; and (ix) amending the management contracts for equity and fixed-income funds whose management contracts incorporate a "group fee" structure by adding four new fee "breakpoints" to the group fee rate schedules.
Investment Performance and Compliance. The Board considered whether the fund has operated within its investment objective, as well as its record of compliance with its investment restrictions. It also reviewed the fund's absolute investment performance for each class, as well as the fund's relative investment performance for each class measured against (i) a proprietary custom index, and (ii) a peer group of mutual funds deemed appropriate by the Board over multiple periods. The following charts considered by the Board show, over the one-, three-, and five-year periods ended December 31, 2006, the cumulative total returns of Initial Class and Service Class 2 of the fund, the cumulative total returns of a proprietary custom index ("benchmark"), and a range of cumulative total returns of a peer group of mutual funds identified by Morningstar, Inc. as having an investment style similar to that of the fund based on underlying portfolio holdings. The returns of Initial Class and Service Class 2 show the performance of the highest and lowest performing classes, respectively (based on three-year performance). The box within each chart shows the 25th percentile return (bottom of box) and the 75th percentile return (top of box) of the peer group. Returns shown above the box are in the first quartile and returns shown below the box are in the fourth quartile. The percentage beaten numbers noted below each chart correspond to the percentile box and represent the percentage of funds in the peer group whose performance was equal to or lower than that of the class indicated. The fund's proprietary custom index is an index developed by FMR that represents the performance of the fund's three asset classes according to their respective weightings in the fund's neutral mix.
VIP Asset Manager: Growth Portfolio
The Board reviewed the fund's relative investment performance against its peer group and stated that the performance of Initial Class of the fund was in the fourth quartile for all the periods shown. The Board also stated that the investment performance of the fund was lower than its benchmark for all the periods shown. The Board considered that the variations in performance among the fund's classes reflect the variations in class expenses, which result in lower performance for higher expense classes. The Board discussed with FMR actions to be taken by FMR to improve the fund's disappointing performance relative to its peer group. The Board will continue to closely monitor the performance of the fund in the coming year and discuss with FMR other appropriate actions to address the performance of the fund.
The Board considered that FMR has taken steps to refocus and strengthen equity research, equity portfolio management, and compliance.
Annual Report
Board Approval of Investment Advisory Contracts and Management Fees - continued
Based on its review, and giving particular weight to the nature and quality of the resources dedicated by the Investment Advisers to maintain and improve relative performance, the Board concluded that the nature, extent, and quality of the services provided to the fund will benefit the fund's shareholders, particularly in light of the Board's view that the fund's shareholders benefit from investing in a fund that is part of a large family of funds offering a variety of investment disciplines and services.
Competitiveness of Management Fee and Total Fund Expenses. The Board considered the fund's management fee and total expenses compared to "mapped groups" of competitive funds and classes. Fidelity creates "mapped groups" by combining similar Lipper investment objective categories that have comparable management fee characteristics. Combining Lipper investment objective categories aids the Board's management fee and total expense comparisons by broadening the competitive group used for comparison and by reducing the number of universes to which various Fidelity funds are compared. The Board also considered supplemental information about how the fund's management fee and total expenses ranked relative to groups based on Lipper classifications, which take into account a fund's market capitalization and style.
The Board considered two proprietary management fee comparisons for the 12-month periods shown in the chart below. The group of Lipper funds used by the Board for management fee comparisons is referred to below as the "Total Mapped Group." The Total Mapped Group comparison focuses on a fund's standing relative to the total universe of comparable funds available to investors, in terms of gross management fees before expense reimbursements or caps. "TMG %" represents the percentage of funds in the Total Mapped Group that had management fees that were lower than the fund's. For example, a TMG % of 30% means that 70% of the funds in the Total Mapped Group had higher management fees than the fund. The "Asset-Size Peer Group" (ASPG) comparison focuses on a fund's standing relative to non-Fidelity funds similar in size to the fund within the Total Mapped Group. The ASPG represents at least 15% of the funds in the Total Mapped Group with comparable asset size and management fee characteristics, subject to a minimum of 50 funds (or all funds in the Total Mapped Group if fewer than 50). Additional information, such as the ASPG quartile in which the fund's management fee ranked, is also included in the chart and considered by the Board.
VIP Asset Manager: Growth Portfolio
The Board noted that the fund's management fee ranked below the median of its Total Mapped Group and below the median of its ASPG for 2006.
Based on its review, the Board concluded that the fund's management fee was fair and reasonable in light of the services that the fund receives and the other factors considered.
In its review of each class's total expenses, the Board considered the fund's management fee as well as other fund or class expenses, as applicable, such as transfer agent fees, pricing and bookkeeping fees, fund-paid 12b-1 fees, and custodial, legal, and audit fees. The Board also noted the effects of any waivers and reimbursements on fees and expenses. As part of its review, the Board also considered current and historical total expenses of each class of the fund compared to competitive fund median expenses. Each class of the fund is compared to those funds and classes in the Total Mapped Group (used by the Board for management fee comparisons) that have a similar sales load structure.
The Board noted that the total expenses of Initial Class ranked below its competitive median for 2006, and the total expenses of each of Investor Class, Service Class, and Service Class 2 ranked above its competitive median for 2006. The Board considered that the total expenses of Investor Class were above the median primarily due to its higher transfer agent fee. The Board noted that the fund offers multiple classes, each of which has a different 12b-1 fee structure, and that the multiple structures are intended to offer a range of pricing options for the intermediary market. The Board also noted that the total expenses of the classes vary primarily by the level of their 12b-1 fees, although differences in transfer agent fees may also cause expenses to vary from class to class.
Annual Report
In its review of total expenses, the Board also considered Fidelity fee structures and other information on clients that FMR and its affiliates service in other competitive markets, such as other mutual funds advised or subadvised by FMR or its affiliates, pension plan clients, and other institutional clients.
Based on its review, the Board concluded that the total expenses of each class of the fund were reasonable, although in some cases above the median of the universe presented for comparison, in light of the services that the fund and its shareholders receive and the other factors considered.
Costs of the Services and Profitability. The Board considered the revenues earned and the expenses incurred by Fidelity in conducting the business of developing, marketing, distributing, managing, administering and servicing the fund and its shareholders. The Board also considered the level of Fidelity's profits in respect of all the Fidelity funds.
On an annual basis, FMR presents to the Board Fidelity's profitability for the fund. Fidelity calculates the profitability for each fund, as well as aggregate profitability for groups of Fidelity funds and all Fidelity funds, using a series of detailed revenue and cost allocation methodologies which originate with the audited books and records of Fidelity. The Audit Committee of the Board reviews any significant changes from the prior year's methodologies.
PricewaterhouseCoopers LLP (PwC), independent registered public accounting firm and auditor to Fidelity and certain Fidelity funds, has been engaged annually by the Board as part of the Board's assessment of the results of Fidelity's profitability analysis. PwC's engagement includes the review and assessment of Fidelity's methodologies used in determining the revenues and expenses attributable to Fidelity's mutual fund business, and completion of agreed-upon procedures surrounding the mathematical accuracy of fund profitability and its conformity to allocation methodologies. After considering PwC's reports issued under the engagement and information provided by Fidelity, the Board believes that while other allocation methods may also be reasonable, Fidelity's profitability methodologies are reasonable in all material respects.
The Board has also reviewed Fidelity's non-fund businesses and any fall-out benefits related to the mutual fund business as well as cases where Fidelity's affiliates may benefit from or be related to the fund's business.
The Board considered the costs of the services provided by and the profits realized by Fidelity in connection with the operation of the fund and determined that the amount of profit is a fair entrepreneurial profit for the management of the fund.
Economies of Scale. The Board considered whether there have been economies of scale in respect of the management of the Fidelity funds, whether the Fidelity funds (including the fund) have appropriately benefited from any such economies of scale, and whether there is potential for realization of any further economies of scale. The Board considered the extent to which the fund will benefit from economies of scale through increased services to the fund, through waivers or reimbursements, or through fee or expense reductions.
The Board recognized that the fund's management contract incorporates a "group fee" structure, which provides for lower group fee rates as total fund assets under FMR's management increase, and for higher group fee rates as total fund assets under FMR's management decrease. FMR determines the group fee rates based on a tiered asset "breakpoint" schedule. In connection with the renewal of the fund's management contract, the Board approved amendments to the fund's management contract that added four new fee breakpoints to the group fee rate schedule for assets under FMR's management above $1,386 billion. The Board considered that the group fee rate declines under both the present and amended schedules, but that under the amended schedule, the group fee rate declines faster as assets under FMR's management exceed $1,386 billion. The Board considered that the group fee is designed to deliver the benefits of economies of scale to fund shareholders when total fund assets increase, even if assets of any particular fund are unchanged or have declined, because some portion of Fidelity's costs are attributable to services provided to all Fidelity funds, and all funds benefit if those costs can be allocated among more assets. The Board concluded that, given the group fee structure, fund shareholders will achieve a certain level of economies of scale as assets under FMR's management increase at the fund complex level, regardless of whether Fidelity achieves any such economies of scale.
The Board further concluded that any potential economies of scale are being shared between fund shareholders and Fidelity in an appropriate manner.
Additional Information Requested by the Board. In order to develop fully the factual basis for consideration of the Fidelity funds' Advisory Contracts, the Board requested and received additional information on several topics, including (i) fund performance trends and actions to be taken by FMR to improve certain funds' overall performance; (ii) Fidelity's portfolio manager compensation structure, including its effects on fund profitability and the extent to which portfolio manager compensation is linked to fund performance; (iii) Fidelity's fee structures; (iv) the funds' sub-advisory arrangements; and (v) accounts managed by Fidelity other than the Fidelity funds.
Based on its evaluation of all of the conclusions noted above, and after considering all material factors, the Board ultimately concluded that the advisory fee structures are fair and reasonable, and that the fund's Advisory Contracts should be renewed.
Annual Report
Annual Report
Annual Report
Investment Adviser
Fidelity Management & Research Company
Boston, MA
Investment Sub-Advisers
FMR Co., Inc.
Fidelity Management & Research (U.K.) Inc.
Fidelity Research & Analysis Company
Fidelity Investments Money Management, Inc.
Fidelity Investments Japan Limited
Fidelity International Investment Advisors
Fidelity International Investment Advisors
(U.K.) Limited
General Distributor
Fidelity Distributors Corporation
Boston, MA
Transfer and Service Agents
Fidelity Investments Institutional Operations Company, Inc.
Boston, MA
Fidelity Service Company, Inc.
Boston, MA
Custodian
JPMorgan Chase Bank
New York, NY
VIPAMG-ANN-0208
1.540207.110
Fidelity® Variable Insurance Products:
Freedom Funds -
Income, 2005, 2010, 2015, 2020, 2025, 2030
Annual Report
December 31, 2007
(2_fidelity_logos) (Registered_Trademark)
Contents
To view a fund's proxy voting guidelines and proxy voting record for the 12-month period ended June 30, visit http://www.fidelity.com (search for "proxy voting guidelines") or visit the Securities and Exchange Commission's (SEC) web site at http://www.sec.gov. You may also call 1-877-208-0098 to request a free copy of the proxy voting guidelines.
Fidelity Variable Insurance Products are separate account options which are purchased through a variable insurance contract.
Standard & Poor's, S&P and S&P 500 are registered service marks of The McGraw-Hill Companies, Inc. and have been licensed for use by Fidelity Distributors Corporation.
Other third party marks appearing herein are the property of their respective owners.
All other marks appearing herein are registered or unregistered trademarks or service marks of FMR LLC or an affiliated company.
This report and the financial statements contained herein are submitted for the general information of the shareholders of the funds. This report is not authorized for distribution to prospective investors in the funds unless preceded or accompanied by an effective prospectus.
A fund files its complete schedule of portfolio holdings with the SEC for the first and third quarters of each fiscal year on Form N-Q. Forms N-Q are available on the SEC's web site at http://www.sec.gov. A fund's Forms N-Q may be reviewed and copied at the SEC's Public Reference Room in Washington, DC. Information regarding the operation of the SEC's Public Reference Room may be obtained by calling 1-800-SEC-0330. For a complete list of a fund's portfolio holdings, view the most recent holdings listing, semiannual report, or annual report on Fidelity's web site at http://www.fidelity.com or http://www.advisor.fidelity.com, as applicable.
NOT FDIC INSURED · MAY LOSE VALUE · NO BANK GUARANTEE
Neither the fund nor Fidelity Distributors Corporation is a bank.
VIP Freedom Funds Portfolio
VIP Freedom Income Portfolio
Performance: The Bottom Line
Average annual total return reflects the change in the value of an investment, assuming reinvestment of the class' dividend income and capital gains (the profits earned upon the sale of securities that have grown in value, if any) and assuming a constant rate of performance each year. During periods of reimbursement by Fidelity, a fund's total return will be greater than it would be had the reimbursement not occurred. Performance numbers are net of all underlying fund operating expenses, but do not include any insurance charges imposed by your insurance company's separate account. If performance information included the effect of these additional charges, the total returns would have been lower. How a fund did yesterday is no guarantee of how it will do tomorrow.
Average Annual Total Returns
Periods ended December 31, 2007 | Past 1
year | Life of
FundA |
VIP Freedom Income - Initial Class | 6.10% | 6.59% |
A From April 26, 2005.
$10,000 Over Life of Fund
Let's say hypothetically that $10,000 was invested in VIP Freedom Income Portfolio - Initial Class on April 26, 2005, when the fund started. The chart shows how the value of your investment would have changed, and also shows how the Lehman Brothers U.S. Aggregate Index performed over the same period.
Annual Report
VIP Freedom 2005 Portfolio
Performance: The Bottom Line
Average annual total return reflects the change in the value of an investment, assuming reinvestment of the class' dividend income and capital gains (the profits earned upon the sale of securities that have grown in value, if any) and assuming a constant rate of performance each year. During periods of reimbursement by Fidelity, a fund's total return will be greater than it would be had the reimbursement not occurred. Performance numbers are net of all underlying fund operating expenses, but do not include any insurance charges imposed by your insurance company's separate account. If performance information included the effect of these additional charges, the total returns would have been lower. How a fund did yesterday is no guarantee of how it will do tomorrow.
Average Annual Total Returns
Periods ended December 31, 2007 | Past 1
year | Life of FundA |
VIP Freedom 2005 - Initial Class | 8.65% | 9.82% |
A From April 26, 2005.
$10,000 Over Life of Fund
Let's say hypothetically that $10,000 was invested in VIP Freedom 2005 Portfolio - Initial Class on April 26, 2005, when the fund started. The chart shows how the value of your investment would have changed, and also shows how the Lehman Brothers U.S. Aggregate Index performed over the same period.
VIP Freedom Funds Portfolio
VIP Freedom 2010 Portfolio
Performance: The Bottom Line
Average annual total return reflects the change in the value of an investment, assuming reinvestment of the class' dividend income and capital gains (the profits earned upon the sale of securities that have grown in value, if any) and assuming a constant rate of performance each year. During periods of reimbursement by Fidelity, a fund's total return will be greater than it would be had the reimbursement not occurred. Performance numbers are net of all underlying fund operating expenses, but do not include any insurance charges imposed by your insurance company's separate account. If performance information included the effect of these additional charges, the total returns would have been lower. How a fund did yesterday is no guarantee of how it will do tomorrow.
Average Annual Total Returns
Periods ended December 31, 2007 | Past 1
year | Life of FundA |
VIP Freedom 2010 - Initial Class | 8.71% | 10.07% |
A From April 26, 2005.
$10,000 Over Life of Fund
Let's say hypothetically that $10,000 was invested in VIP Freedom 2010 Portfolio - Initial Class on April 26, 2005, when the fund started. The chart shows how the value of your investment would have changed, and also shows how the Lehman Brothers U.S. Aggregate Index performed over the same period.
Annual Report
VIP Freedom 2015 Portfolio
Performance: The Bottom Line
Average annual total return reflects the change in the value of an investment, assuming reinvestment of the class' dividend income and capital gains (the profits earned upon the sale of securities that have grown in value, if any) and assuming a constant rate of performance each year. During periods of reimbursement by Fidelity, a fund's total return will be greater than it would be had the reimbursement not occurred. Performance numbers are net of all underlying fund operating expenses, but do not include any insurance charges imposed by your insurance company's separate account. If performance information included the effect of these additional charges, the total returns would have been lower. How a fund did yesterday is no guarantee of how it will do tomorrow.
Average Annual Total Returns
Periods ended December 31, 2007 | Past 1
year | Life of
FundA |
VIP Freedom 2015 - Initial Class | 9.33% | 11.43% |
A From April 26, 2005.
$10,000 Over Life of Fund
Let's say hypothetically that $10,000 was invested in VIP Freedom 2015 Portfolio - Initial Class on April 26, 2005, when the fund started. The chart shows how the value of your investment would have changed, and also shows how the Standard & Poor's 500SM Index (S&P 500®) performed over the same period.
VIP Freedom Funds Portfolio
VIP Freedom 2020 Portfolio
Performance: The Bottom Line
Average annual total return reflects the change in the value of an investment, assuming reinvestment of the class' dividend income and capital gains (the profits earned upon the sale of securities that have grown in value, if any) and assuming a constant rate of performance each year. During periods of reimbursement by Fidelity, a fund's total return will be greater than it would be had the reimbursement not occurred. Performance numbers are net of all underlying fund operating expenses, but do not include any insurance charges imposed by your insurance company's separate account. If performance information included the effect of these additional charges, the total returns would have been lower. How a fund did yesterday is no guarantee of how it will do tomorrow.
Average Annual Total Returns
Periods ended December 31, 2007 | Past 1
year | Life of
FundA |
VIP Freedom 2020 - Initial Class | 10.23% | 12.58% |
A From April 26, 2005.
$10,000 Over Life of Fund
Let's say hypothetically that $10,000 was invested in VIP Freedom 2020 Portfolio - Initial Class on April 26, 2005, when the fund started. The chart shows how the value of your investment would have changed, and also shows how the Standard & Poor's 500SM Index (S&P 500®) performed over the same period.
Annual Report
VIP Freedom 2025 Portfolio
Performance: The Bottom Line
Average annual total return reflects the change in the value of an investment, assuming reinvestment of the class' dividend income and capital gains (the profits earned upon the sale of securities that have grown in value, if any) and assuming a constant rate of performance each year. During periods of reimbursement by Fidelity, a fund's total return will be greater than it would be had the reimbursement not occurred. Performance numbers are net of all underlying fund operating expenses, but do not include any insurance charges imposed by your insurance company's separate account. If performance information included the effect of these additional charges, the total returns would have been lower. How a fund did yesterday is no guarantee of how it will do tomorrow.
Average Annual Total Returns
Periods ended December 31, 2007 | Past 1
year | Life of FundA |
VIP Freedom 2025 - Initial Class | 10.50% | 13.22% |
A From April 26, 2005.
$10,000 Over Life of Fund
Let's say hypothetically that $10,000 was invested in VIP Freedom 2025 Portfolio - Initial Class on April 26, 2005, when the fund started. The chart shows how the value of your investment would have changed, and also shows how the Standard & Poor's 500SM Index (S&P 500®) performed over the same period.
VIP Freedom Funds Portfolio
VIP Freedom 2030 Portfolio
Performance: The Bottom Line
Average annual total return reflects the change in the value of an investment, assuming reinvestment of the class' dividend income and capital gains (the profits earned upon the sale of securities that have grown in value, if any) and assuming a constant rate of performance each year. During periods of reimbursement by Fidelity, a fund's total return will be greater than it would be had the reimbursement not occurred. Performance numbers are net of all underlying fund operating expenses, but do not include any insurance charges imposed by your insurance company's separate account. If performance information included the effect of these additional charges, the total returns would have been lower. How a fund did yesterday is no guarantee of how it will do tomorrow.
Average Annual Total Returns
Periods ended December 31, 2007 | Past 1
year | Life of
FundA |
VIP Freedom 2030 - Initial Class | 11.37% | 14.23% |
A From April 26, 2005.
$10,000 Over Life of Fund
Let's say hypothetically that $10,000 was invested in VIP Freedom 2030 Portfolio - Initial Class on April 26, 2005, when the fund started. The chart shows how the value of your investment would have changed, and also shows how the Standard & Poor's 500SM Index (S&P 500®) performed over the same period.
Annual Report
Management's Discussion of Fund Performance
Comments from Christopher Sharpe and Jonathan Shelon, Co-Portfolio Managers of VIP Freedom Funds
U.S. equity markets, as measured by the bellwether Dow Jones Industrial AverageSM and the Standard & Poor's 500SM Index, registered their fifth consecutive year of positive returns in 2007, as the Dow rose 8.88% and the S&P 500® index advanced 5.49%. The tech-heavy NASDAQ Composite® Index did even better, increasing 10.55%. However, credit- and recession-related concerns carved deeply into stock prices late in 2007, pushing some major market measures into negative territory for the year overall, particularly smaller-cap and value-oriented benchmarks. Based largely on a weak U.S. dollar that boosted returns for U.S. investors, the Morgan Stanley Capital InternationalSM Europe, Australasia, and Far East (MSCI® EAFE®) Index - a gauge of developed stock markets outside the United States and Canada - beat most domestic equity measures, gaining 11.33%. Several European countries had outstanding performance, including Finland and Germany, while Australia also did very well. However, fallout from the credit crunch and concerns about export growth tempered U.K. stocks, while fears that Japanese financial companies would become embroiled in the U.S. subprime mortgage crisis contributed to a loss of more than 4% for the Japanese portion of the index. The emerging-markets stock asset class soared 39.78% according to the MSCI Emerging Markets index. The U.S. investment-grade bond market climbed 6.97% as measured by the Lehman Brothers® U.S. Aggregate Index, beating the 2.53% gain for the Merrill Lynch® U.S. High Yield Master II Constrained Index. The emerging-markets bond category shook off a sluggish first half of 2007 to finish the year with a respectable gain of 6.28% as measured by the J.P. Morgan Emerging Markets Bond Index (EMBI) Global, while the Citigroup® Non-U.S. Group of 7 Index - representing the debt performance of major global economies, excluding the United States - rose 13.05%.
VIP Freedom Funds all recorded positive results for the year. (For specific portfolio performance results, please refer to the performance section of this report.) On an absolute basis, these returns were consistent with the kind of performance we would expect to see from a series of portfolios with different asset-allocation levels based on age-appropriate risks. On a relative basis versus their individual composite indexes, the Funds also did well, with all of them beating their respective benchmarks for the period. Overall performance was led by the Funds' underlying domestic and international equity asset classes. Both equity classes outperformed their benchmarks - the Dow Jones Wilshire 5000 Composite IndexSM, which rose 5.62%, and the MSCI EAFE, respectively - - thanks mostly to effective stock selection within their underlying funds. The Funds' investments in both short-term and high-yield bonds performed in line with their respective benchmarks, with returns of 5.11% for the Lehman Brothers 3-Month Treasury Bill Index and 2.53% for the Merrill Lynch U.S. High Yield Master II Constrained Index. Meanwhile, the investment-grade bond class underperformed the 6.97% return of the Lehman Brothers U.S. Aggregate Index, in part because of its exposure to subprime-mortgage-backed securities, which saw their prices fall as the credit crunch worsened during the year.
Note to shareholders: Jonathan Shelon became Co-Portfolio Manager on September 4, 2007, replacing Ren Cheng, who was promoted to Chief Investment Officer of Fidelity's Global Asset Allocation Group.
The views expressed above reflect those of the portfolio manager(s) only through the end of the period as stated on the cover of this report and do not necessarily represent the views of Fidelity or any other person in the Fidelity organization. Any such views are subject to change at any time based upon market or other conditions and Fidelity disclaims any responsibility to update such views. These views may not be relied on as investment advice and, because investment decisions for a Fidelity fund are based on numerous factors, may not be relied on as an indication of trading intent on behalf of any Fidelity fund.
VIP Freedom Funds Portfolio
Shareholder Expense Example
As a shareholder of a Fund, you incur two types of costs: (1) transaction costs, and (2) ongoing costs, including distribution and/or service (12b-1) fees and other Fund expenses. This Example is intended to help you understand your ongoing costs (in dollars) of investing in the Funds and to compare these costs with the ongoing costs of investing in other mutual funds.
The Example is based on an investment of $1,000 invested at the beginning of the period and held for the entire period (July 1, 2007 to December 31, 2007).
Actual Expenses
The first line of the accompanying table for each class of each fund provides information about actual account values and actual expenses. You may use the information in this line, together with the amount you invested, to estimate the expenses that you paid over the period. Simply divide your account value by $1,000.00 (for example, an $8,600 account value divided by $1,000.00 = 8.6), then multiply the result by the number in the first line for a class of the fund under the heading entitled "Expenses Paid During Period" to estimate the expenses you paid on your account during this period. The estimate of expenses does not include any fees or other expenses of any variable annuity or variable life insurance product. If they were, the estimate of expenses you paid during the period would be higher, and your ending account value would be lower. In addition, each Fund, as a shareholder in underlying Fidelity Funds, will indirectly bear its pro rata share of the fees and expenses incurred by the underlying Fidelity Funds. These fees and expenses are not included in each Fund's annualized expense ratio used to calculate the expense estimates in the table below.
Hypothetical Example for Comparison Purposes
The second line of the accompanying table for each class of each fund provides information about hypothetical account values and hypothetical expenses based on a Class' actual expense ratio and an assumed rate of return of 5% per year before expenses, which is not the Class' actual return. The hypothetical account values and expenses may not be used to estimate the actual ending account balance or expenses you paid for the period. You may use this information to compare the ongoing costs of investing in the Fund and other funds. To do so, compare this 5% hypothetical example with the 5% hypothetical examples that appear in the shareholder reports of the other funds. The estimate of expenses does not include any fees or other expenses of any variable annuity or variable life insurance product. If they were, the estimate of expenses you paid during the period would be higher, and your ending account value would be lower. In addition, each Fund, as a shareholder in underlying Fidelity Funds, will indirectly bear its pro rata share of the fees and expenses incurred by the underlying Fidelity Funds. These fees and expenses are not included in each Fund's annualized expense ratio used to calculate the expense estimates in the table below.
Please note that the expenses shown in the table are meant to highlight your ongoing costs only and do not reflect any transaction costs. Therefore, the second line of the table is useful in comparing ongoing costs only, and will not help you determine the relative total costs of owning different funds.
| Beginning
Account Value
July 1, 2007 | Ending
Account Value
December 31, 2007 | Expenses Paid
During Period*
July 1, 2007 to December 31, 2007 |
VIP Freedom Income | | | |
Initial Class | | | |
Actual | $ 1,000.00 | $ 1,026.40 | $ .00 |
HypotheticalA | $ 1,000.00 | $ 1,025.21 | $ .00 |
Service Class | | | |
Actual | $ 1,000.00 | $ 1,026.40 | $ .51 |
HypotheticalA | $ 1,000.00 | $ 1,024.70 | $ .51 |
Service Class 2 | | | |
Actual | $ 1,000.00 | $ 1,025.00 | $ 1.28 |
HypotheticalA | $ 1,000.00 | $ 1,023.95 | $ 1.28 |
VIP Freedom 2005 | | | |
Initial Class | | | |
Actual | $ 1,000.00 | $ 1,024.50 | $ .00 |
HypotheticalA | $ 1,000.00 | $ 1,025.21 | $ .00 |
Service Class | | | |
Actual | $ 1,000.00 | $ 1,024.40 | $ .51 |
HypotheticalA | $ 1,000.00 | $ 1,024.70 | $ .51 |
Service Class 2 | | | |
Actual | $ 1,000.00 | $ 1,023.90 | $ 1.28 |
HypotheticalA | $ 1,000.00 | $ 1,023.95 | $ 1.28 |
VIP Freedom 2010 | | | |
Initial Class | | | |
Actual | $ 1,000.00 | $ 1,024.80 | $ .00 |
HypotheticalA | $ 1,000.00 | $ 1,025.21 | $ .00 |
Service Class | | | |
Actual | $ 1,000.00 | $ 1,025.00 | $ .51 |
HypotheticalA | $ 1,000.00 | $ 1,024.70 | $ .51 |
| Beginning
Account Value
July 1, 2007 | Ending
Account Value
December 31, 2007 | Expenses Paid
During Period*
July 1, 2007 to December 31, 2007 |
Service Class 2 | | | |
Actual | $ 1,000.00 | $ 1,023.60 | $ 1.28 |
HypotheticalA | $ 1,000.00 | $ 1,023.95 | $ 1.28 |
VIP Freedom 2015 | | | |
Initial Class | | | |
Actual | $ 1,000.00 | $ 1,023.50 | $ .00 |
HypotheticalA | $ 1,000.00 | $ 1,025.21 | $ .00 |
Service Class | | | |
Actual | $ 1,000.00 | $ 1,023.40 | $ .51 |
HypotheticalA | $ 1,000.00 | $ 1,024.70 | $ .51 |
Service Class 2 | | | |
Actual | $ 1,000.00 | $ 1,022.60 | $ 1.27 |
HypotheticalA | $ 1,000.00 | $ 1,023.95 | $ 1.28 |
VIP Freedom 2020 | | | |
Initial Class | | | |
Actual | $ 1,000.00 | $ 1,021.80 | $ .00 |
HypotheticalA | $ 1,000.00 | $ 1,025.21 | $ .00 |
Service Class | | | |
Actual | $ 1,000.00 | $ 1,021.90 | $ .51 |
HypotheticalA | $ 1,000.00 | $ 1,024.70 | $ .51 |
Service Class 2 | | | |
Actual | $ 1,000.00 | $ 1,020.80 | $ 1.27 |
HypotheticalA | $ 1,000.00 | $ 1,023.95 | $ 1.28 |
VIP Freedom 2025 | | | |
Initial Class | | | |
Actual | $ 1,000.00 | $ 1,021.10 | $ .00 |
HypotheticalA | $ 1,000.00 | $ 1,025.21 | $ .00 |
Service Class | | | |
Actual | $ 1,000.00 | $ 1,020.10 | $ .51 |
HypotheticalA | $ 1,000.00 | $ 1,024.70 | $ .51 |
Service Class 2 | | | |
Actual | $ 1,000.00 | $ 1,020.40 | $ 1.27 |
HypotheticalA | $ 1,000.00 | $ 1,023.95 | $ 1.28 |
VIP Freedom 2030 | | | |
Initial Class | | | |
Actual | $ 1,000.00 | $ 1,018.60 | $ .00 |
HypotheticalA | $ 1,000.00 | $ 1,025.21 | $ .00 |
Service Class | | | |
Actual | $ 1,000.00 | $ 1,018.60 | $ .51 |
HypotheticalA | $ 1,000.00 | $ 1,024.70 | $ .51 |
Service Class 2 | | | |
Actual | $ 1,000.00 | $ 1,017.30 | $ 1.27 |
HypotheticalA | $ 1,000.00 | $ 1,023.95 | $ 1.28 |
A 5% return per year before expenses
* Expenses are equal to each Class' annualized expense ratio (shown in the table below); multiplied by the average account value over the period, multiplied by 184/ 365 (to reflect the one-half year period). The fees and expenses of the underlying Fidelity Funds in which the Fund invests are not included in each class' annualized expense ratio.
| Annualized
Expense Ratio |
VIP Freedom Income | |
Initial Class | .00% |
Service Class | .10% |
Service Class 2 | .25% |
VIP Freedom 2005 | |
Initial Class | .00% |
Service Class | .10% |
Service Class 2 | .25% |
VIP Freedom 2010 | |
Initial Class | .00% |
Service Class | .10% |
Service Class 2 | .25% |
VIP Freedom 2015 | |
Initial Class | .00% |
Service Class | .10% |
Service Class 2 | .25% |
VIP Freedom 2020 | |
Initial Class | .00% |
Service Class | .10% |
Service Class 2 | .25% |
VIP Freedom 2025 | |
Initial Class | .00% |
Service Class | .10% |
Service Class 2 | .25% |
VIP Freedom 2030 | |
Initial Class | .00% |
Service Class | .10% |
Service Class 2 | .25% |
Annual Report
VIP Freedom Income Portfolio
Investment Changes
Fund Holdings as of December 31, 2007 |
| % of fund's investments | % of fund's investments 6 months ago |
Domestic Equity Funds | | |
VIP Contrafund Portfolio Initial Class | 3.2 | 3.2 |
VIP Equity-Income Portfolio Initial Class | 3.3 | 3.6 |
VIP Growth & Income Portfolio Initial Class | 3.6 | 3.6 |
VIP Growth Portfolio Initial Class | 3.9 | 3.7 |
VIP Mid Cap Portfolio Initial Class | 1.3 | 1.3 |
VIP Value Portfolio Initial Class | 2.8 | 3.1 |
VIP Value Strategies Portfolio Initial Class | 1.1 | 1.3 |
| 19.2 | 19.8 |
High Yield Fixed-Income Funds | | |
VIP High Income Portfolio Initial Class | 4.9 | 4.9 |
Investment Grade Fixed-Income Funds | | |
VIP Investment Grade Bond Portfolio Initial Class | 35.7 | 34.9 |
Short-Term Funds | | |
VIP Money Market Portfolio Initial Class | 40.2 | 40.4 |
| 100.0 | 100.0 |
Asset Allocation (% of fund's investments) |
Current |
 | Domestic Equity Funds | 19.2% | |
 | Investment Grade Fixed-Income Funds | 35.7% | |
 | High Yield Fixed-Income Funds | 4.9% | |
 | Short-Term Funds | 40.2% | |

Six months ago |
| Domestic Equity Funds | 19.8% | |
| Investment Grade Fixed-Income Funds | 34.9% | |
| High Yield Fixed-Income Funds | 4.9% | |
| Short-Term Funds | 40.4% | |

The six months ago allocation is based on the fund's holdings as of June 30, 2007. The current allocation is based on the fund's holdings as of December 31, 2007. |
VIP Freedom Funds Portfolio
VIP Freedom Income Portfolio
Investments December 31, 2007
Showing Percentage of Total Value of Investment in Securities
Equity Funds - 19.2% |
| Shares | | Value |
Domestic Equity Funds - 19.2% |
VIP Contrafund Portfolio Initial Class | 16,318 | | $ 455,262 |
VIP Equity-Income Portfolio Initial Class | 19,041 | | 455,271 |
VIP Growth & Income Portfolio Initial Class | 29,707 | | 505,316 |
VIP Growth Portfolio Initial Class | 12,195 | | 550,247 |
VIP Mid Cap Portfolio Initial Class | 4,973 | | 179,817 |
VIP Value Portfolio Initial Class | 29,506 | | 386,819 |
VIP Value Strategies Portfolio Initial Class | 12,742 | | 160,298 |
TOTAL EQUITY FUNDS (Cost $2,497,118) | 2,693,030 |
Fixed-Income Funds - 40.6% |
| | | |
High Yield Fixed-Income Funds - 4.9% |
VIP High Income Portfolio Initial Class | 114,847 | | 686,786 |
Investment Grade Fixed-Income Funds - 35.7% |
VIP Investment Grade Bond Portfolio Initial Class | 392,974 | | 5,014,350 |
TOTAL FIXED-INCOME FUNDS (Cost $5,619,604) | 5,701,136 |
Short-Term Funds - 40.2% |
| | | |
VIP Money Market Portfolio Initial Class
(Cost $5,645,598) | 5,645,598 | | 5,645,598 |
TOTAL INVESTMENT IN SECURITIES - 100% (Cost $13,762,320) | $ 14,039,764 |
Annual Report
VIP Freedom Income Portfolio
Financial Statements
Statement of Assets and Liabilities
| December 31, 2007 |
| | |
Assets | | |
Investment in securities, at value (cost $13,762,320) - See accompanying schedule | | $ 14,039,764 |
Cash | | 19,080 |
Receivable for investments sold | | 64,925 |
Receivable for fund shares sold | | 6,182 |
Total assets | | 14,129,951 |
| | |
Liabilities | | |
Payable for investments purchased | $ 19,992 | |
Payable for fund shares redeemed | 71,052 | |
Distribution fees payable | 769 | |
Total liabilities | | 91,813 |
| | |
Net Assets | | $ 14,038,138 |
Net Assets consist of: | | |
Paid in capital | | $ 13,604,857 |
Undistributed net investment income | | 3,810 |
Accumulated undistributed net realized gain (loss) on investments | | 152,027 |
Net unrealized appreciation (depreciation) on investments | | 277,444 |
Net Assets | | $ 14,038,138 |
| | |
Initial Class: Net Asset Value, offering price and redemption price per share ($10,035,068 ÷ 928,788 shares) | | $ 10.80 |
| | |
Service Class:
Net Asset Value, offering price and redemption price per share ($414,447 ÷ 38,355 shares) | | $ 10.81 |
| | |
Service Class 2:
Net Asset Value, offering price and redemption price per share ($3,588,623 ÷ 332,880 shares) | | $ 10.78 |
Statement of Operations
| Year ended December 31, 2007 |
| | |
Investment Income | | |
Income distributions from underlying funds | | $ 543,553 |
| | |
Expenses | | |
Distribution fees | $ 7,311 | |
Independent trustees' compensation | 47 | |
Total expenses before reductions | 7,358 | |
Expense reductions | (47) | 7,311 |
Net investment income (loss) | | 536,242 |
Realized and Unrealized Gain (Loss) Realized gain (loss) on sale of underlying fund shares | 19,770 | |
Capital gain distributions from underlying funds | 234,346 | 254,116 |
Change in net unrealized appreciation (depreciation) on underlying funds | | 20,918 |
Net gain (loss) | | 275,034 |
Net increase (decrease) in net assets resulting from operations | | $ 811,276 |
See accompanying notes which are an integral part of the financial statements.
VIP Freedom Funds Portfolio
Statement of Changes in Net Assets
| Year ended
December 31, 2007 | Year ended
December 31, 2006 |
Increase (Decrease) in Net Assets | | |
Operations | | |
Net investment income (loss) | $ 536,242 | $ 313,672 |
Net realized gain (loss) | 254,116 | 91,629 |
Change in net unrealized appreciation (depreciation) | 20,918 | 167,067 |
Net increase (decrease) in net assets resulting from operations | 811,276 | 572,368 |
Distributions to shareholders from net investment income | (536,930) | (309,765) |
Distributions to shareholders from net realized gain | (143,697) | (49,069) |
Total distributions | (680,627) | (358,834) |
Share transactions - net increase (decrease) | 3,057,630 | 3,951,196 |
Total increase (decrease) in net assets | 3,188,279 | 4,164,730 |
| | |
Net Assets | | |
Beginning of period | 10,849,859 | 6,685,129 |
End of period (including undistributed net investment income of $3,810 and undistributed net investment income of $4,498, respectively) | $ 14,038,138 | $ 10,849,859 |
Financial Highlights - Initial Class
Years ended December 31, | 2007 | 2006 | 2005 G |
Selected Per-Share Data | | | |
Net asset value, beginning of period | $ 10.71 | $ 10.36 | $ 10.00 |
Income from Investment Operations | | | |
Net investment income (loss) E | .43 | .40 | .16 |
Net realized and unrealized gain (loss) | .22 | .32 | .30 |
Total from investment operations | .65 | .72 | .46 |
Distributions from net investment income | (.44) | (.32) | (.10) |
Distributions from net realized gain | (.12) | (.05) | - |
Total distributions | (.56) | (.37) | (.10) |
Net asset value, end of period | $ 10.80 | $ 10.71 | $ 10.36 |
Total Return B,C,D | 6.10% | 6.94% | 4.58% |
Ratios to Average Net Assets F,H | | | |
Expenses before reductions | .00% | .00% | .00% A |
Expenses net of fee waivers, if any | .00% | .00% | .00% A |
Expenses net of all reductions | .00% | .00% | .00% A |
Net investment income (loss) | 3.93% | 3.75% | 2.34% A |
Supplemental Data | | | |
Net assets, end of period (000 omitted) | $ 10,035 | $ 9,398 | $ 5,954 |
Portfolio turnover rate | 56% | 44% | 12% A |
A Annualized
B Total returns for periods of less than one year are not annualized.
C Total returns do not reflect charges attributable to your insurance company's separate account. Inclusion of these charges would reduce the total returns shown.
D Total returns would have been lower had certain expenses not been reduced during the periods shown.
E Calculated based on average shares outstanding during the period.
F Amounts do not include the activity of the underlying funds.
G For the period April 26, 2005 (commencement of operations) to December 31, 2005.
H Expense ratios reflect operating expenses of the class. Expenses before reductions do not reflect amounts reimbursed by the investment adviser or expense offset arrangements and do not represent the amount paid by the class during periods when reimbursements or reductions occur. Expenses net of fee waivers reflect expenses after reimbursement by the investment adviser but prior to reductions from expense offset arrangements. Expenses net of all reductions represent the net expenses paid by the class but do not include expenses of the investment companies in which the Fund invests.
See accompanying notes which are an integral part of the financial statements.
Annual Report
VIP Freedom Income Portfolio
Financial Statements - continued
Financial Highlights - Service Class
Years ended December 31, | 2007 | 2006 | 2005 G |
Selected Per-Share Data | | | |
Net asset value, beginning of period | $ 10.71 | $ 10.36 | $ 10.00 |
Income from Investment Operations | | | |
Net investment income (loss) E | .42 | .39 | .16 |
Net realized and unrealized gain (loss) | .23 | .32 | .29 |
Total from investment operations | .65 | .71 | .45 |
Distributions from net investment income | (.43) | (.31) | (.09) |
Distributions from net realized gain | (.12) | (.05) | - |
Total distributions | (.55) | (.36) | (.09) |
Net asset value, end of period | $ 10.81 | $ 10.71 | $ 10.36 |
Total Return B,C,D | 6.10% | 6.83% | 4.51% |
Ratios to Average Net Assets F,H | | | |
Expenses before reductions | .10% | .10% | .10% A |
Expenses net of fee waivers, if any | .10% | .10% | .10% A |
Expenses net of all reductions | .10% | .10% | .10% A |
Net investment income (loss) | 3.83% | 3.65% | 2.24% A |
Supplemental Data | | | |
Net assets, end of period (000 omitted) | $ 414 | $ 391 | $ 366 |
Portfolio turnover rate | 56% | 44% | 12% A |
A Annualized
B Total returns for periods of less than one year are not annualized.
C Total returns do not reflect charges attributable to your insurance company's separate account. Inclusion of these charges would reduce the total returns shown.
D Total returns would have been lower had certain expenses not been reduced during the periods shown.
E Calculated based on average shares outstanding during the period.
F Amounts do not include the activity of the underlying funds.
G For the period April 26, 2005 (commencement of operations) to December 31, 2005.
H Expense ratios reflect operating expenses of the class. Expenses before reductions do not reflect amounts reimbursed by the investment adviser or expense offset arrangements and do not represent the amount paid by the class during periods when reimbursements or reductions occur. Expenses net of fee waivers reflect expenses after reimbursement by the investment adviser but prior to reductions from expense offset arrangements. Expenses net of all reductions represent the net expenses paid by the class but do not include expenses of the investment companies in which the Fund invests.
Financial Highlights - Service Class 2
Years ended December 31, | 2007 | 2006 | 2005 G |
Selected Per-Share Data | | | |
Net asset value, beginning of period | $ 10.69 | $ 10.36 | $ 10.00 |
Income from Investment Operations | | | |
Net investment income (loss) E | .40 | .37 | .15 |
Net realized and unrealized gain (loss) | .23 | .32 | .29 |
Total from investment operations | .63 | .69 | .44 |
Distributions from net investment income | (.42) | (.31) | (.08) |
Distributions from net realized gain | (.12) | (.05) | - |
Total distributions | (.54) | (.36) | (.08) |
Net asset value, end of period | $ 10.78 | $ 10.69 | $ 10.36 |
Total Return B,C,D | 5.92% | 6.61% | 4.41% |
Ratios to Average Net Assets F,H | | | |
Expenses before reductions | .25% | .25% | .25% A |
Expenses net of fee waivers, if any | .25% | .25% | .25% A |
Expenses net of all reductions | .25% | .25% | .25% A |
Net investment income (loss) | 3.68% | 3.50% | 2.09% A |
Supplemental Data | | | |
Net assets, end of period (000 omitted) | $ 3,589 | $ 1,061 | $ 365 |
Portfolio turnover rate | 56% | 44% | 12% A |
A Annualized
B Total returns for periods of less than one year are not annualized.
C Total returns do not reflect charges attributable to your insurance company's separate account. Inclusion of these charges would reduce the total returns shown.
D Total returns would have been lower had certain expenses not been reduced during the periods shown.
E Calculated based on average shares outstanding during the period.
F Amounts do not include the activity of the underlying funds.
G For the period April 26, 2005 (commencement of operations) to December 31, 2005.
H Expense ratios reflect operating expenses of the class. Expenses before reductions do not reflect amounts reimbursed by the investment adviser or expense offset arrangements and do not represent the amount paid by the class during periods when reimbursements or reductions occur. Expenses net of fee waivers reflect expenses after reimbursement by the investment adviser but prior to reductions from expense offset arrangements. Expenses net of all reductions represent the net expenses paid by the class but do not include expenses of the investment companies in which the Fund invests.
See accompanying notes which are an integral part of the financial statements.
VIP Freedom Funds Portfolio
VIP Freedom 2005 Portfolio
Investment Changes
Fund Holdings as of December 31, 2007 |
| % of fund's investments | % of fund's investments 6 months ago |
Domestic Equity Funds | | |
VIP Contrafund Portfolio Initial Class | 6.4 | 6.2 |
VIP Equity-Income Portfolio Initial Class | 6.6 | 7.2 |
VIP Growth & Income Portfolio Initial Class | 7.2 | 7.2 |
VIP Growth Portfolio Initial Class | 7.7 | 7.3 |
VIP Mid Cap Portfolio Initial Class | 2.5 | 2.6 |
VIP Value Portfolio Initial Class | 5.6 | 6.1 |
VIP Value Strategies Portfolio Initial Class | 2.3 | 2.6 |
| 38.3 | 39.2 |
International Equity Funds | | |
VIP Overseas Portfolio Initial Class | 9.2 | 9.4 |
High Yield Fixed-Income Funds | | |
VIP High Income Portfolio Initial Class | 4.9 | 5.0 |
Investment Grade Fixed-Income Funds | | |
VIP Investment Grade Bond Portfolio Initial Class | 35.4 | 34.5 |
Short-Term Funds | | |
VIP Money Market Portfolio Initial Class | 12.2 | 11.9 |
| 100.0 | 100.0 |
Asset Allocation (% of fund's investments) |
Current |
| Domestic Equity Funds | 38.3% | |
| International Equity Funds | 9.2% | |
 | Investment Grade Fixed-Income Funds | 35.4% | |
 | High Yield Fixed-Income Funds | 4.9% | |
| Short-Term Funds | 12.2% | |

Six months ago |
| Domestic Equity Funds | 39.2% | |
| International Equity Funds | 9.4% | |
| Investment Grade Fixed-Income Funds | 34.5% | |
| High Yield Fixed-Income Funds | 5.0% | |
| Short-Term Funds | 11.9% | |

Expected |
| Domestic Equity Funds | 38.8% | |
| International Equity Funds | 8.8% | |
| Investment Grade Fixed-Income Funds | 33.8% | |
| High Yield Fixed-Income Funds | 5.0% | |
| Short-Term Funds | 13.6% | |

The fund invests according to an asset allocation strategy that becomes increasingly conservative over time. The six months ago allocation is based on the fund's holdings as of June 30, 2007. The current allocation is based on the fund's holdings as of December 31, 2007. The expected allocation represents the fund's anticipated allocation at June 30, 2008. |
Annual Report
VIP Freedom 2005 Portfolio
Investments December 31, 2007
Showing Percentage of Total Value of Investment in Securities
Equity Funds - 47.5% |
| Shares | | Value |
Domestic Equity Funds - 38.3% |
VIP Contrafund Portfolio Initial Class | 23,196 | | $ 647,155 |
VIP Equity-Income Portfolio Initial Class | 27,928 | | 667,767 |
VIP Growth & Income Portfolio Initial Class | 42,686 | | 726,081 |
VIP Growth Portfolio Initial Class | 17,163 | | 774,410 |
VIP Mid Cap Portfolio Initial Class | 7,112 | | 257,168 |
VIP Value Portfolio Initial Class | 43,092 | | 564,930 |
VIP Value Strategies Portfolio Initial Class | 18,583 | | 233,769 |
TOTAL DOMESTIC EQUITY FUNDS | | 3,871,280 |
International Equity Funds - 9.2% |
VIP Overseas Portfolio Initial Class | 36,628 | | 927,421 |
TOTAL EQUITY FUNDS (Cost $4,329,454) | 4,798,701 |
Fixed-Income Funds - 40.3% |
| | | |
High Yield Fixed - Income Funds - 4.9% |
VIP High Income Portfolio Initial Class | 83,712 | | 500,596 |
Investment Grade Fixed - Income Funds - 35.4% |
VIP Investment Grade Bond Portfolio Initial Class | 280,222 | | 3,575,631 |
TOTAL FIXED-INCOME FUNDS (Cost $4,012,873) | 4,076,227 |
Short-Term Funds - 12.2% |
| | | |
VIP Money Market Portfolio Initial Class
(Cost $1,232,880) | 1,232,880 | | 1,232,880 |
TOTAL INVESTMENT IN SECURITIES - 100% (Cost $9,575,207) | $ 10,107,808 |
See accompanying notes which are an integral part of the financial statements.
VIP Freedom Funds Portfolio
VIP Freedom 2005 Portfolio
Financial Statements
Statement of Assets and Liabilities
| December 31, 2007 |
| | |
Assets | | |
Investment in securities, at value (cost $9,575,207) - See accompanying schedule | | $ 10,107,808 |
Receivable for investments sold | | 874 |
Total assets | | 10,108,682 |
| | |
Liabilities | | |
Payable for investments purchased | $ 167 | |
Payable for fund shares redeemed | 588 | |
Distribution fees payable | 133 | |
Total liabilities | | 888 |
| | |
Net Assets | | $ 10,107,794 |
Net Assets consist of: | | |
Paid in capital | | $ 9,396,095 |
Undistributed net investment income | | 3,921 |
Accumulated undistributed net realized gain (loss) on investments | | 175,177 |
Net unrealized appreciation (depreciation) on investments | | 532,601 |
Net Assets | | $ 10,107,794 |
| | |
Initial Class: Net Asset Value, offering price and redemption price per share ($9,202,915 ÷ 793,728 shares) | | $ 11.59 |
| | |
Service Class:
Net Asset Value, offering price and redemption price per share ($448,953 ÷ 38,728 shares) | | $ 11.59 |
| | |
Service Class 2:
Net Asset Value, offering price and redemption price per share ($455,926 ÷ 39,342 shares) | | $ 11.59 |
Statement of Operations
| Year ended December 31, 2007 |
| | |
Investment Income | | |
Income distributions from underlying funds | | $ 280,010 |
| | |
Expenses | | |
Distribution fees | $ 1,542 | |
Independent trustees' compensation | 30 | |
Total expenses before reductions | 1,572 | |
Expense reductions | (30) | 1,542 |
Net investment income (loss) | | 278,468 |
Realized and Unrealized Gain (Loss) Realized gain (loss) on sale of underlying fund shares | 70,688 | |
Capital gain distributions from underlying funds | 386,389 | 457,077 |
Change in net unrealized appreciation (depreciation) on underlying funds | | (51,770) |
Net gain (loss) | | 405,307 |
Net increase (decrease) in net assets resulting from operations | | $ 683,775 |
See accompanying notes which are an integral part of the financial statements.
Annual Report
VIP Freedom 2005 Portfolio
Financial Statements - continued
Statement of Changes in Net Assets
| Year ended
December 31, 2007 | Year ended
December 31, 2006 |
Increase (Decrease) in Net Assets | | |
Operations | | |
Net investment income (loss) | $ 278,468 | $ 223,838 |
Net realized gain (loss) | 457,077 | 126,531 |
Change in net unrealized appreciation (depreciation) | (51,770) | 371,871 |
Net increase (decrease) in net assets resulting from operations | 683,775 | 722,240 |
Distributions to shareholders from net investment income | (274,547) | (227,593) |
Distributions to shareholders from net realized gain | (365,943) | (36,950) |
Total distributions | (640,490) | (264,543) |
Share transactions - net increase (decrease) | 1,367,317 | 2,200,656 |
Total increase (decrease) in net assets | 1,410,602 | 2,658,353 |
| | |
Net Assets | | |
Beginning of period | 8,697,192 | 6,038,839 |
End of period (including undistributed net investment income of $3,921 and undistributed net investment income of $0, respectively) | $ 10,107,794 | $ 8,697,192 |
Financial Highlights - Initial Class
Years ended December 31, | 2007 | 2006 | 2005 G |
Selected Per-Share Data | | | |
Net asset value, beginning of period | $ 11.41 | $ 10.74 | $ 10.00 |
Income from Investment Operations | | | |
Net investment income (loss) E | .38 | .31 | .09 |
Net realized and unrealized gain (loss) | .60 | .72 | .71 |
Total from investment operations | .98 | 1.03 | .80 |
Distributions from net investment income | (.34) | (.31) | (.06) |
Distributions from net realized gain | (.47) | (.05) | - |
Total distributions | (.80) I | (.36) | (.06) |
Net asset value, end of period | $ 11.59 | $ 11.41 | $ 10.74 |
Total Return B,C,D | 8.65% | 9.59% | 7.98% |
Ratios to Average Net Assets F,H | | | |
Expenses before reductions | .00% | .00% | .00% A |
Expenses net of fee waivers, if any | .00% | .00% | .00% A |
Expenses net of all reductions | .00% | .00% | .00% A |
Net investment income (loss) | 3.20% | 2.82% | 1.24% A |
Supplemental Data | | | |
Net assets, end of period (000 omitted) | $ 9,203 | $ 7,871 | $ 5,284 |
Portfolio turnover rate | 51% | 56% | 43% A |
A Annualized
B Total returns for periods of less than one year are not annualized.
C Total returns do not reflect charges attributable to your insurance company's separate account. Inclusion of these charges would reduce the total returns shown.
D Total returns would have been lower had certain expenses not been reduced during the periods shown.
E Calculated based on average shares outstanding during the period.
F Amounts do not include the activity of the underlying funds.
G For the period April 26, 2005 (commencement of operations) to December 31, 2005.
H Expense ratios reflect operating expenses of the class. Expenses before reductions do not reflect amounts reimbursed by the investment adviser or expense offset arrangements and do not represent the amount paid by the class during periods when reimbursements or reductions occur. Expenses net of fee waivers reflect expenses after reimbursement by the investment adviser but prior to reductions from expense offset arrangements. Expenses net of all reductions represent the net expenses paid by the class but do not include expenses of the investment companies in which the Fund invests.
I Total distributions of $.800 per share is comprised of distributions from net investment income of $.335 and distributions from net realized gain of $.465 per share.
See accompanying notes which are an integral part of the financial statements.
VIP Freedom Funds Portfolio
Financial Highlights - Service Class
Years ended December 31, | 2007 | 2006 | 2005 G |
Selected Per-Share Data | | | |
Net asset value, beginning of period | $ 11.41 | $ 10.74 | $ 10.00 |
Income from Investment Operations | | | |
Net investment income (loss) E | .37 | .30 | .08 |
Net realized and unrealized gain (loss) | .60 | .72 | .71 |
Total from investment operations | .97 | 1.02 | .79 |
Distributions from net investment income | (.32) | (.30) | (.05) |
Distributions from net realized gain | (.47) | (.05) | - |
Total distributions | (.79) I | (.35) | (.05) |
Net asset value, end of period | $ 11.59 | $ 11.41 | $ 10.74 |
Total Return B,C,D | 8.55% | 9.48% | 7.91% |
Ratios to Average Net Assets F,H | | | |
Expenses before reductions | .10% | .10% | .10% A |
Expenses net of fee waivers, if any | .10% | .10% | .10% A |
Expenses net of all reductions | .10% | .10% | .10% A |
Net investment income (loss) | 3.10% | 2.72% | 1.14% A |
Supplemental Data | | | |
Net assets, end of period (000 omitted) | $ 449 | $ 414 | $ 378 |
Portfolio turnover rate | 51% | 56% | 43% A |
A Annualized
B Total returns for periods of less than one year are not annualized.
C Total returns do not reflect charges attributable to your insurance company's separate account. Inclusion of these charges would reduce the total returns shown.
D Total returns would have been lower had certain expenses not been reduced during the periods shown.
E Calculated based on average shares outstanding during the period.
F Amounts do not include the activity of the underlying funds.
G For the period April 26, 2005 (commencement of operations) to December 31, 2005.
H Expense ratios reflect operating expenses of the class. Expenses before reductions do not reflect amounts reimbursed by the investment adviser or expense offset arrangements and do not represent the amount paid by the class during periods when reimbursements or reductions occur. Expenses net of fee waivers reflect expenses after reimbursement by the investment adviser but prior to reductions from expense offset arrangements. Expenses net of all reductions represent the net expenses paid by the class but do not include expenses of the investment companies in which the Fund invests.
I Total distributions of $.788 per share is comprised of distributions from net investment income of $.323 and distributions from net realized gain of $.465 per share.
Financial Highlights - Service Class 2
Years ended December 31, | 2007 | 2006 | 2005 G |
Selected Per-Share Data | | | |
Net asset value, beginning of period | $ 11.41 | $ 10.74 | $ 10.00 |
Income from Investment Operations | | | |
Net investment income (loss) E | .35 | .29 | .07 |
Net realized and unrealized gain (loss) | .60 | .71 | .71 |
Total from investment operations | .95 | 1.00 | .78 |
Distributions from net investment income | (.31) | (.28) | (.04) |
Distributions from net realized gain | (.47) | (.05) | - |
Total distributions | (.77) I | (.33) | (.04) |
Net asset value, end of period | $ 11.59 | $ 11.41 | $ 10.74 |
Total Return B,C,D | 8.40% | 9.34% | 7.80% |
Ratios to Average Net Assets F,H | | | |
Expenses before reductions | .25% | .25% | .25% A |
Expenses net of fee waivers, if any | .25% | .25% | .25% A |
Expenses net of all reductions | .25% | .25% | .25% A |
Net investment income (loss) | 2.95% | 2.57% | 1.00% A |
Supplemental Data | | | |
Net assets, end of period (000 omitted) | $ 456 | $ 413 | $ 377 |
Portfolio turnover rate | 51% | 56% | 43% A |
A Annualized
B Total returns for periods of less than one year are not annualized.
C Total returns do not reflect charges attributable to your insurance company's separate account. Inclusion of these charges would reduce the total returns shown.
D Total returns would have been lower had certain expenses not been reduced during the periods shown.
E Calculated based on average shares outstanding during the period.
F Amounts do not include the activity of the underlying funds.
G For the period April 26, 2005 (commencement of operations) to December 31, 2005.
H Expense ratios reflect operating expenses of the class. Expenses before reductions do not reflect amounts reimbursed by the investment adviser or expense offset arrangements and do not represent the amount paid by the class during periods when reimbursements or reductions occur. Expenses net of fee waivers reflect expenses after reimbursement by the investment adviser but prior to reductions from expense offset arrangements. Expenses net of all reductions represent the net expenses paid by the class but do not include expenses of the investment companies in which the Fund invests.
I Total distributions of $.771 per share is comprised of distributions from net investment income of $.306 and distributions from net realized gain of $.465 per share.
See accompanying notes which are an integral part of the financial statements.
Annual Report
VIP Freedom 2010 Portfolio
Investment Changes
Fund Holdings as of December 31, 2007 |
| % of fund's investments | % of fund's investments 6 months ago |
Domestic Equity Funds | | |
VIP Contrafund Portfolio Initial Class | 6.6 | 6.4 |
VIP Equity-Income Portfolio Initial Class | 6.7 | 7.3 |
VIP Growth & Income Portfolio Initial Class | 7.3 | 7.3 |
VIP Growth Portfolio Initial Class | 7.9 | 7.5 |
VIP Mid Cap Portfolio Initial Class | 2.6 | 2.7 |
VIP Value Portfolio Initial Class | 5.7 | 6.3 |
VIP Value Strategies Portfolio Initial Class | 2.4 | 2.6 |
| 39.2 | 40.1 |
International Equity Funds | | |
VIP Overseas Portfolio Initial Class | 9.9 | 10.0 |
High Yield Fixed-Income Funds | | |
VIP High Income Portfolio Initial Class | 5.0 | 5.0 |
Investment Grade Fixed-Income Funds | | |
VIP Investment Grade Bond Portfolio Initial Class | 35.9 | 34.9 |
Short-Term Funds | | |
VIP Money Market Portfolio Initial Class | 10.0 | 10.0 |
| 100.0 | 100.0 |
Asset Allocation (% of fund's investments) |
Current |
| Domestic Equity Funds | 39.2% | |
| International Equity Funds | 9.9% | |
| Investment Grade Fixed-Income Funds | 35.9% | |
| High Yield Fixed-Income Funds | 5.0% | |
| Short-Term Funds | 10.0% | |

Six months ago |
| Domestic Equity Funds | 40.1% | |
| International Equity Funds | 10.0% | |
| Investment Grade Fixed-Income Funds | 34.9% | |
| High Yield Fixed-Income Funds | 5.0% | |
| Short-Term Funds | 10.0% | |

Expected |
| Domestic Equity Funds | 40.0% | |
| International Equity Funds | 10.0% | |
| Investment Grade Fixed-Income Funds | 35.0% | |
| High Yield Fixed-Income Funds | 5.0% | |
| Short-Term Funds | 10.0% | |

The fund invests according to an asset allocation strategy that becomes increasingly conservative over time. The six months ago allocation is based on the fund's holdings as of June 30, 2007. The current allocation is based on the fund's holdings as of December 31, 2007. The expected allocation represents the fund's anticipated allocation at June 30, 2008. |
VIP Freedom Funds Portfolio
VIP Freedom 2010 Portfolio
Investments December 31, 2007
Showing Percentage of Total Value of Investment in Securities
Equity Funds - 49.1% |
| Shares | | Value |
Domestic Equity Funds - 39.2% |
VIP Contrafund Portfolio Initial Class | 254,960 | | $ 7,113,376 |
VIP Equity-Income Portfolio Initial Class | 304,653 | | 7,284,258 |
VIP Growth & Income Portfolio Initial Class | 467,900 | | 7,958,977 |
VIP Growth Portfolio Initial Class | 188,986 | | 8,527,037 |
VIP Mid Cap Portfolio Initial Class | 78,220 | | 2,828,431 |
VIP Value Portfolio Initial Class | 471,278 | | 6,178,453 |
VIP Value Strategies Portfolio Initial Class | 203,634 | | 2,561,712 |
TOTAL DOMESTIC EQUITY FUNDS | | 42,452,244 |
International Equity Funds - 9.9% |
VIP Overseas Portfolio Initial Class | 424,796 | | 10,755,844 |
TOTAL EQUITY FUNDS (Cost $49,992,550) | 53,208,088 |
Fixed-Income Funds - 40.9% |
| | | |
High Yield Fixed-Income Funds - 5.0% |
VIP High Income Portfolio Initial Class | 903,104 | | 5,400,563 |
Investment Grade Fixed-Income Funds - 35.9% |
VIP Investment Grade Bond Portfolio Initial Class | 3,055,501 | | 38,988,188 |
TOTAL FIXED-INCOME FUNDS (Cost $43,788,242) | 44,388,751 |
Short-Term Funds - 10.0% |
| | | |
VIP Money Market Portfolio Initial Class
(Cost $10,852,346) | 10,852,346 | | 10,852,346 |
TOTAL INVESTMENT IN SECURITIES - 100% (Cost $104,633,138) | $ 108,449,185 |
Annual Report
VIP Freedom 2010 Portfolio
Financial Statements
Statement of Assets and Liabilities
| December 31, 2007 |
| | |
Assets | | |
Investment in securities, at value (cost $104,633,138) - See accompanying schedule | | $ 108,449,185 |
Cash | | 11,640 |
Receivable for investments sold | | 14 |
Receivable for fund shares sold | | 723,528 |
Total assets | | 109,184,367 |
| | |
Liabilities | | |
Payable for investments purchased | $ 723,801 | |
Payable for fund shares redeemed | 12,741 | |
Distribution fees payable | 14,249 | |
Total liabilities | | 750,791 |
| | |
Net Assets | | $ 108,433,576 |
Net Assets consist of: | | |
Paid in capital | | $ 102,814,050 |
Undistributed net investment income | | 699 |
Accumulated undistributed net realized gain (loss) on investments | | 1,802,780 |
Net unrealized appreciation (depreciation) on investments | | 3,816,047 |
Net Assets | | $ 108,433,576 |
| | |
Initial Class: Net Asset Value, offering price and redemption price per share ($26,628,604 ÷ 2,226,247 shares) | | $ 11.96 |
| | |
Service Class:
Net Asset Value, offering price and redemption price per share ($19,294,967 ÷ 1,614,701 shares) | | $ 11.95 |
| | |
Service Class 2:
Net Asset Value, offering price and redemption price per share ($62,510,005 ÷ 5,242,579 shares) | | $ 11.92 |
Statement of Operations
| Year ended December 31, 2007 |
| | |
Investment Income | | |
Income distributions from underlying funds | | $ 2,643,400 |
Interest | | 74 |
Total income | | 2,643,474 |
| | |
Expenses | | |
Distribution fees | $ 143,620 | |
Independent trustees' compensation | 298 | |
Total expenses before reductions | 143,918 | |
Expense reductions | (298) | 143,620 |
Net investment income (loss) | | 2,499,854 |
Realized and Unrealized Gain (Loss) Realized gain (loss) on sale of underlying fund shares | (108,553) | |
Capital gain distributions from underlying funds | 3,850,599 | 3,742,046 |
Change in net unrealized appreciation (depreciation) on underlying funds | | 672,345 |
Net gain (loss) | | 4,414,391 |
Net increase (decrease) in net assets resulting from operations | | $ 6,914,245 |
See accompanying notes which are an integral part of the financial statements.
VIP Freedom Funds Portfolio
Statement of Changes in Net Assets
| Year ended
December 31, 2007 | Year ended
December 31, 2006 |
Increase (Decrease) in Net Assets | | |
Operations | | |
Net investment income (loss) | $ 2,499,854 | $ 1,029,176 |
Net realized gain (loss) | 3,742,046 | 902,834 |
Change in net unrealized appreciation (depreciation) | 672,345 | 2,551,775 |
Net increase (decrease) in net assets resulting from operations | 6,914,245 | 4,483,785 |
Distributions to shareholders from net investment income | (2,484,126) | (1,040,763) |
Distributions to shareholders from net realized gain | (2,555,478) | (276,865) |
Total distributions | (5,039,604) | (1,317,628) |
Share transactions - net increase (decrease) | 40,920,991 | 38,663,621 |
Total increase (decrease) in net assets | 42,795,632 | 41,829,778 |
| | |
Net Assets | | |
Beginning of period | 65,637,944 | 23,808,166 |
End of period (including undistributed net investment income of $699 and undistributed net investment income of
$0, respectively) | $ 108,433,576 | $ 65,637,944 |
Financial Highlights - Initial Class
Years ended December 31, | 2007 | 2006 | 2005 G |
Selected Per-Share Data | | | |
Net asset value, beginning of period | $ 11.59 | $ 10.78 | $ 10.00 |
Income from Investment Operations | | | |
Net investment income (loss) E | .36 | .28 | .11 |
Net realized and unrealized gain (loss) | .64 | .78 | .72 |
Total from investment operations | 1.00 | 1.06 | .83 |
Distributions from net investment income | (.30) | (.20) | (.05) |
Distributions from net realized gain | (.33) | (.05) | - |
Total distributions | (.63) | (.25) | (.05) |
Net asset value, end of period | $ 11.96 | $ 11.59 | $ 10.78 |
Total Return B,C,D | 8.71% | 9.82% | 8.33% |
Ratios to Average Net Assets F,H | | | |
Expenses before reductions | .00% | .00% | .00% A |
Expenses net of fee waivers, if any | .00% | .00% | .00% A |
Expenses net of all reductions | .00% | .00% | .00% A |
Net investment income (loss) | 2.95% | 2.48% | 1.56% A |
Supplemental Data | | | |
Net assets, end of period (000 omitted) | $ 26,629 | $ 20,992 | $ 13,343 |
Portfolio turnover rate | 21% | 24% | 24% A |
A Annualized
B Total returns for periods of less than one year are not annualized.
C Total returns do not reflect charges attributable to your insurance company's separate account. Inclusion of these charges would reduce the total returns shown.
D Total returns would have been lower had certain expenses not been reduced during the periods shown.
E Calculated based on average shares outstanding during the period.
F Amounts do not include the activity of the underlying funds.
G For the period April 26, 2005 (commencement of operations) to December 31, 2005.
H Expense ratios reflect operating expenses of the class. Expenses before reductions do not reflect amounts reimbursed by the investment adviser or expense offset arrangements and do not represent the amount paid by the class during periods when reimbursements or reductions occur. Expenses net of fee waivers reflect expenses after reimbursement by the investment adviser but prior to reductions from expense offset arrangements. Expenses net of all reductions represent the net expenses paid by the class but do not include expenses of the investment companies in which the Fund invests.
See accompanying notes which are an integral part of the financial statements.
Annual Report
VIP Freedom 2010 Portfolio
Financial Statements - continued
Financial Highlights - Service Class
Years ended December 31, | 2007 | 2006 | 2005 G |
Selected Per-Share Data | | | |
Net asset value, beginning of period | $ 11.58 | $ 10.77 | $ 10.00 |
Income from Investment Operations | | | |
Net investment income (loss) E | .35 | .27 | .10 |
Net realized and unrealized gain (loss) | .64 | .78 | .72 |
Total from investment operations | .99 | 1.05 | .82 |
Distributions from net investment income | (.29) | (.19) | (.05) |
Distributions from net realized gain | (.33) | (.05) | - |
Total distributions | (.62) | (.24) | (.05) |
Net asset value, end of period | $ 11.95 | $ 11.58 | $ 10.77 |
Total Return B,C,D | 8.65% | 9.78% | 8.17% |
Ratios to Average Net Assets F,H | | | |
Expenses before reductions | .10% | .10% | .10% A |
Expenses net of fee waivers, if any | .10% | .10% | .10% A |
Expenses net of all reductions | .10% | .10% | .10% A |
Net investment income (loss) | 2.85% | 2.39% | 1.46% A |
Supplemental Data | | | |
Net assets, end of period (000 omitted) | $ 19,295 | $ 5,984 | $ 764 |
Portfolio turnover rate | 21% | 24% | 24% A |
A Annualized
B Total returns for periods of less than one year are not annualized.
C Total returns do not reflect charges attributable to your insurance company's separate account. Inclusion of these charges would reduce the total returns shown.
D Total returns would have been lower had certain expenses not been reduced during the periods shown.
E Calculated based on average shares outstanding during the period.
F Amounts do not include the activity of the underlying funds.
G For the period April 26, 2005 (commencement of operations) to December 31, 2005.
H Expense ratios reflect operating expenses of the class. Expenses before reductions do not reflect amounts reimbursed by the investment adviser or expense offset arrangements and do not represent the amount paid by the class during periods when reimbursements or reductions occur. Expenses net of fee waivers reflect expenses after reimbursement by the investment adviser but prior to reductions from expense offset arrangements. Expenses net of all reductions represent the net expenses paid by the class but do not include expenses of the investment companies in which the Fund invests.
Financial Highlights - Service Class 2
Years ended December 31, | 2007 | 2006 | 2005 G |
Selected Per-Share Data | | | |
Net asset value, beginning of period | $ 11.56 | $ 10.76 | $ 10.00 |
Income from Investment Operations | | | |
Net investment income (loss) E | .33 | .25 | .09 |
Net realized and unrealized gain (loss) | .64 | .78 | .72 |
Total from investment operations | .97 | 1.03 | .81 |
Distributions from net investment income | (.28) | (.18) | (.05) |
Distributions from net realized gain | (.33) | (.05) | - |
Total distributions | (.61) | (.23) | (.05) |
Net asset value, end of period | $ 11.92 | $ 11.56 | $ 10.76 |
Total Return B,C,D | 8.42% | 9.58% | 8.07% |
Ratios to Average Net Assets F,H | | | |
Expenses before reductions | .25% | .25% | .25% A |
Expenses net of fee waivers, if any | .25% | .25% | .25% A |
Expenses net of all reductions | .25% | .25% | .25% A |
Net investment income (loss) | 2.70% | 2.24% | 1.31% A |
Supplemental Data | | | |
Net assets, end of period (000 omitted) | $ 62,510 | $ 38,662 | $ 9,702 |
Portfolio turnover rate | 21% | 24% | 24% A |
A Annualized
B Total returns for periods of less than one year are not annualized.
C Total returns do not reflect charges attributable to your insurance company's separate account. Inclusion of these charges would reduce the total returns shown.
D Total returns would have been lower had certain expenses not been reduced during the periods shown.
E Calculated based on average shares outstanding during the period.
F Amounts do not include the activity of the underlying funds.
G For the period April 26, 2005 (commencement of operations) to December 31, 2005.
H Expense ratios reflect operating expenses of the class. Expenses before reductions do not reflect amounts reimbursed by the investment adviser or expense offset arrangements and do not represent the amount paid by the class during periods when reimbursements or reductions occur. Expenses net of fee waivers reflect expenses after reimbursement by the investment adviser but prior to reductions from expense offset arrangements. Expenses net of all reductions represent the net expenses paid by the class but do not include expenses of the investment companies in which the Fund invests.
See accompanying notes which are an integral part of the financial statements.
VIP Freedom Funds Portfolio
VIP Freedom 2015 Portfolio
Investment Changes
Fund Holdings as of December 31, 2007 |
| % of fund's investments | % of fund's investments 6 months ago |
Domestic Equity Funds | | |
VIP Contrafund Portfolio Initial Class | 7.4 | 7.2 |
VIP Equity-Income Portfolio Initial Class | 7.6 | 8.2 |
VIP Growth & Income Portfolio Initial Class | 8.3 | 8.3 |
VIP Growth Portfolio Initial Class | 8.8 | 8.5 |
VIP Mid Cap Portfolio Initial Class | 2.9 | 3.0 |
VIP Value Portfolio Initial Class | 6.4 | 7.1 |
VIP Value Strategies Portfolio Initial Class | 2.7 | 2.9 |
| 44.1 | 45.2 |
International Equity Funds | | |
VIP Overseas Portfolio Initial Class | 11.2 | 11.3 |
High Yield Fixed-Income Funds | | |
VIP High Income Portfolio Initial Class | 5.9 | 5.9 |
Investment Grade Fixed-Income Funds | | |
VIP Investment Grade Bond Portfolio Initial Class | 32.7 | 31.7 |
Short-Term Funds | | |
VIP Money Market Portfolio Initial Class | 6.1 | 5.9 |
| 100.0 | 100.0 |
Asset Allocation (% of fund's investments) |
Current |
| Domestic Equity Funds | 44.1% | |
| International Equity Funds | 11.2% | |
| Investment Grade Fixed-Income Funds | 32.7% | |
| High Yield Fixed-Income Funds | 5.9% | |
| Short-Term Funds | 6.1% | |

Six months ago |
| Domestic Equity Funds | 45.2% | |
| International Equity Funds | 11.3% | |
 | Investment Grade Fixed-Income Funds | 31.7% | |
| High Yield Fixed-Income Funds | 5.9% | |
| Short-Term Funds | 5.9% | |

Expected |
| Domestic Equity Funds | 43.3% | |
| International Equity Funds | 10.8% | |
| Investment Grade Fixed-Income Funds | 33.0% | |
| High Yield Fixed-Income Funds | 5.5% | |
| Short-Term Funds | 7.4% | |

The fund invests according to an asset allocation strategy that becomes increasingly conservative over time. The six months ago allocation is based on the fund's holdings as of June 30, 2007. The current allocation is based on the fund's holdings as of December 31, 2007. The expected allocation represents the fund's anticipated allocation at June 30, 2008. |
Annual Report
VIP Freedom 2015 Portfolio
Investments December 31, 2007
Showing Percentage of Total Value of Investment in Securities
Equity Funds - 55.3% |
| Shares | | Value |
Domestic Equity Funds - 44.1% |
VIP Contrafund Portfolio Initial Class | 155,157 | | $ 4,328,893 |
VIP Equity-Income Portfolio Initial Class | 186,984 | | 4,470,795 |
VIP Growth & Income Portfolio Initial Class | 285,789 | | 4,861,265 |
VIP Growth Portfolio Initial Class | 114,859 | | 5,182,451 |
VIP Mid Cap Portfolio Initial Class | 47,842 | | 1,729,979 |
VIP Value Portfolio Initial Class | 288,675 | | 3,784,527 |
VIP Value Strategies Portfolio Initial Class | 125,162 | | 1,574,540 |
TOTAL DOMESTIC EQUITY FUNDS | | 25,932,450 |
International Equity Funds - 11.2% |
VIP Overseas Portfolio Initial Class | 258,905 | | 6,555,484 |
TOTAL EQUITY FUNDS (Cost $30,470,657) | 32,487,934 |
Fixed-Income Funds - 38.6% |
| | | |
High Yield Fixed-Income Funds - 5.9% |
VIP High Income Portfolio Initial Class | 583,121 | | 3,487,064 |
Investment Grade Fixed-Income Funds - 32.7% |
VIP Investment Grade Bond Portfolio Initial Class | 1,506,063 | | 19,217,364 |
TOTAL FIXED-INCOME FUNDS (Cost $22,526,485) | 22,704,428 |
Short-Term Funds - 6.1% |
| | | |
VIP Money Market Portfolio Initial Class
(Cost $3,566,469) | 3,566,469 | | 3,566,469 |
TOTAL INVESTMENT IN SECURITIES - 100% (Cost $56,563,611) | $ 58,758,831 |
See accompanying notes which are an integral part of the financial statements.
VIP Freedom Funds Portfolio
VIP Freedom 2015 Portfolio
Financial Statements
Statement of Assets and Liabilities
| December 31, 2007 |
| | |
Assets | | |
Investment in securities, at value (cost $56,563,611) - See accompanying schedule | | $ 58,758,831 |
Cash | | 58 |
Receivable for investments sold | | 161 |
Receivable for fund shares sold | | 102,702 |
Total assets | | 58,861,752 |
| | |
Liabilities | | |
Payable for investments purchased | $ 100,576 | |
Payable for fund shares redeemed | 2,572 | |
Distribution fees payable | 5,016 | |
Total liabilities | | 108,164 |
| | |
Net Assets | | $ 58,753,588 |
Net Assets consist of: | | |
Paid in capital | | $ 55,437,652 |
Accumulated undistributed net realized gain (loss) on investments | | 1,120,716 |
Net unrealized appreciation (depreciation) on investments | | 2,195,220 |
Net Assets | | $ 58,753,588 |
| | |
Initial Class:
Net Asset Value, offering price and
redemption price per share ($33,779,761 ÷ 2,747,596 shares) | | $ 12.29 |
| | |
Service Class:
Net Asset Value, offering price and redemption price per share ($477,253 ÷ 38,820 shares) | | $ 12.29 |
| | |
Service Class 2:
Net Asset Value, offering price and redemption price per share ($24,496,574 ÷ 1,998,015 shares) | | $ 12.26 |
Statement of Operations
| Year ended December 31, 2007 |
| | |
Investment Income | | |
Income distributions from underlying funds | | $ 1,381,702 |
Interest | | 8 |
Total income | | 1,381,710 |
| | |
Expenses | | |
Distribution fees | $ 43,080 | |
Independent trustees' compensation | 157 | |
Total expenses before reductions | 43,237 | |
Expense reductions | (157) | 43,080 |
Net investment income (loss) | | 1,338,630 |
Realized and Unrealized Gain (Loss) Realized gain (loss) on sale of underlying fund shares | (50,193) | |
Capital gain distributions from underlying funds | 2,392,687 | 2,342,494 |
Change in net unrealized appreciation (depreciation) on underlying funds | | 140,064 |
Net gain (loss) | | 2,482,558 |
Net increase (decrease) in net assets resulting from operations | | $ 3,821,188 |
See accompanying notes which are an integral part of the financial statements.
Annual Report
VIP Freedom 2015 Portfolio
Financial Statements - continued
Statement of Changes in Net Assets
| Year ended
December 31, 2007 | Year ended
December 31, 2006 |
Increase (Decrease) in Net Assets | | |
Operations | | |
Net investment income (loss) | $ 1,338,630 | $ 552,971 |
Net realized gain (loss) | 2,342,494 | 627,270 |
Change in net unrealized appreciation (depreciation) | 140,064 | 1,475,662 |
Net increase (decrease) in net assets resulting from operations | 3,821,188 | 2,655,903 |
Distributions to shareholders from net investment income | (1,528,528) | (379,299) |
Distributions to shareholders from net realized gain | (1,568,554) | (252,774) |
Total distributions | (3,097,082) | (632,073) |
Share transactions - net increase (decrease) | 23,906,125 | 17,131,091 |
Total increase (decrease) in net assets | 24,630,231 | 19,154,921 |
| | |
Net Assets | | |
Beginning of period | 34,123,357 | 14,968,436 |
End of period (including undistributed net investment income of $0 and undistributed net investment income of $172,565, respectively) | $ 58,753,588 | $ 34,123,357 |
Financial Highlights - Initial Class
Years ended December 31, | 2007 | 2006 | 2005 G |
Selected Per-Share Data | | | |
Net asset value, beginning of period | $ 11.93 | $ 10.95 | $ 10.00 |
Income from Investment Operations | | | |
Net investment income (loss) E | .37 | .27 | .11 |
Net realized and unrealized gain (loss) | .73 | .94 | .90 |
Total from investment operations | 1.10 | 1.21 | 1.01 |
Distributions from net investment income | (.36) | (.14) | (.06) |
Distributions from net realized gain | (.38) | (.09) | - |
Total distributions | (.74) | (.23) | (.06) |
Net asset value, end of period | $ 12.29 | $ 11.93 | $ 10.95 |
Total Return B,C,D | 9.33% | 11.04% | 10.11% |
Ratios to Average Net Assets F,H | | | |
Expenses before reductions | .00% | .00% | .00% A |
Expenses net of fee waivers, if any | .00% | .00% | .00% A |
Expenses net of all reductions | .00% | .00% | .00% A |
Net investment income (loss) | 2.93% | 2.34% | 1.50% A |
Supplemental Data | | | |
Net assets, end of period (000 omitted) | $ 33,780 | $ 23,712 | $ 13,930 |
Portfolio turnover rate | 18% | 24% | 38% A |
A Annualized
B Total returns for periods of less than one year are not annualized.
C Total returns do not reflect charges attributable to your insurance company's separate account. Inclusion of these charges would reduce the total returns shown.
D Total returns would have been lower had certain expenses not been reduced during the periods shown.
E Calculated based on average shares outstanding during the period.
F Amounts do not include the activity of the underlying funds.
G For the period April 26, 2005 (commencement of operations) to December 31, 2005.
H Expense ratios reflect operating expenses of the class. Expenses before reductions do not reflect amounts reimbursed by the investment adviser or expense offset arrangements and do not represent the amount paid by the class during periods when reimbursements or reductions occur. Expenses net of fee waivers reflect expenses after reimbursement by the investment adviser but prior to reductions from expense offset arrangements. Expenses net of all reductions represent the net expenses paid by the class but do not include expenses of the investment companies in which the Fund invests.
See accompanying notes which are an integral part of the financial statements.
VIP Freedom Funds Portfolio
Financial Highlights - Service Class
Years ended December 31, | 2007 | 2006 | 2005 G |
Selected Per-Share Data | | | |
Net asset value, beginning of period | $ 11.93 | $ 10.95 | $ 10.00 |
Income from Investment Operations | | | |
Net investment income (loss) E | .35 | .26 | .10 |
Net realized and unrealized gain (loss) | .74 | .94 | .90 |
Total from investment operations | 1.09 | 1.20 | 1.00 |
Distributions from net investment income | (.35) | (.13) | (.05) |
Distributions from net realized gain | (.38) | (.09) | - |
Total distributions | (.73) | (.22) | (.05) |
Net asset value, end of period | $ 12.29 | $ 11.93 | $ 10.95 |
Total Return B,C,D | 9.23% | 10.94% | 10.04% |
Ratios to Average Net Assets F,H | | | |
Expenses before reductions | .10% | .10% | .10% A |
Expenses net of fee waivers, if any | .10% | .10% | .10% A |
Expenses net of all reductions | .10% | .10% | .10% A |
Net investment income (loss) | 2.83% | 2.24% | 1.40% A |
Supplemental Data | | | |
Net assets, end of period (000 omitted) | $ 477 | $ 427 | $ 385 |
Portfolio turnover rate | 18% | 24% | 38% A |
A Annualized
B Total returns for periods of less than one year are not annualized.
C Total returns do not reflect charges attributable to your insurance company's separate account. Inclusion of these charges would reduce the total returns shown.
D Total returns would have been lower had certain expenses not been reduced during the periods shown.
E Calculated based on average shares outstanding during the period.
F Amounts do not include the activity of the underlying funds.
G For the period April 26, 2005 (commencement of operations) to December 31, 2005.
H Expense ratios reflect operating expenses of the class. Expenses before reductions do not reflect amounts reimbursed by the investment adviser or expense offset arrangements and do not represent the amount paid by the class during periods when reimbursements or reductions occur. Expenses net of fee waivers reflect expenses after reimbursement by the investment adviser but prior to reductions from expense offset arrangements. Expenses net of all reductions represent the net expenses paid by the class but do not include expenses of the investment companies in which the Fund invests.
Financial Highlights - Service Class 2
Years ended December 31, | 2007 | 2006 | 2005 G |
Selected Per-Share Data | | | |
Net asset value, beginning of period | $ 11.91 | $ 10.94 | $ 10.00 |
Income from Investment Operations | | | |
Net investment income (loss) E | .33 | .24 | .09 |
Net realized and unrealized gain (loss) | .74 | .95 | .90 |
Total from investment operations | 1.07 | 1.19 | .99 |
Distributions from net investment income | (.34) | (.13) | (.05) |
Distributions from net realized gain | (.38) | (.09) | - |
Total distributions | (.72) | (.22) | (.05) |
Net asset value, end of period | $ 12.26 | $ 11.91 | $ 10.94 |
Total Return B,C,D | 9.07% | 10.84% | 9.90% |
Ratios to Average Net Assets F.H | | | |
Expenses before reductions | .25% | .25% | .25% A |
Expenses net of fee waivers, if any | .25% | .25% | .25% A |
Expenses net of all reductions | .25% | .25% | .25% A |
Net investment income (loss) | 2.68% | 2.09% | 1.25% A |
Supplemental Data | | | |
Net assets, end of period (000 omitted) | $ 24,497 | $ 9,984 | $ 653 |
Portfolio turnover rate | 18% | 24% | 38% A |
A Annualized
B Total returns for periods of less than one year are not annualized.
C Total returns do not reflect charges attributable to your insurance company's separate account. Inclusion of these charges would reduce the total returns shown.
D Total returns would have been lower had certain expenses not been reduced during the periods shown.
E Calculated based on average shares outstanding during the period.
F Amounts do not include the activity of the underlying funds.
G For the period April 26, 2005 (commencement of operations) to December 31, 2005.
H Expense ratios reflect operating expenses of the class. Expenses before reductions do not reflect amounts reimbursed by the investment adviser or expense offset arrangements and do not represent the amount paid by the class during periods when reimbursements or reductions occur. Expenses net of fee waivers reflect expenses after reimbursement by the investment adviser but prior to reductions from expense offset arrangements. Expenses net of all reductions represent the net expenses paid by the class but do not include expenses of the investment companies in which the Fund invests.
See accompanying notes which are an integral part of the financial statements.
Annual Report
VIP Freedom 2020 Portfolio
Investment Changes
Fund Holdings as of December 31, 2007 |
| % of fund's investments | % of fund's investments 6 months ago |
Domestic Equity Funds | | |
VIP Contrafund Portfolio Initial Class | 9.0 | 8.6 |
VIP Equity-Income Portfolio Initial Class | 9.2 | 10.0 |
VIP Growth & Income Portfolio Initial Class | 10.0 | 10.0 |
VIP Growth Portfolio Initial Class | 10.7 | 10.2 |
VIP Mid Cap Portfolio Initial Class | 3.6 | 3.6 |
VIP Value Portfolio Initial Class | 7.8 | 8.5 |
VIP Value Strategies Portfolio Initial Class | 3.3 | 3.6 |
| 53.6 | 54.5 |
International Equity Funds | | |
VIP Overseas Portfolio Initial Class | 13.6 | 13.6 |
High Yield Fixed-Income Funds | | |
VIP High Income Portfolio Initial Class | 7.5 | 7.4 |
Investment Grade Fixed-Income Funds | | |
VIP Investment Grade Bond Portfolio Initial Class | 24.9 | 24.1 |
Short-Term Funds | | |
VIP Money Market Portfolio Initial Class | 0.4 | 0.4 |
| 100.0 | 100.0 |
Asset Allocation (% of fund's investments) |
Current |
| Domestic Equity Funds | 53.6% | |
| International Equity Funds | 13.6% | |
| Investment Grade Fixed-Income Funds | 24.9% | |
| High Yield Fixed-Income Funds | 7.5% | |
| Short-Term Funds | 0.4% | |

Six months ago |
| Domestic Equity Funds | 54.5% | |
| International Equity Funds | 13.6% | |
| Investment Grade Fixed-Income Funds | 24.1% | |
| High Yield Fixed-Income Funds | 7.4% | |
| Short-Term Funds | 0.4% | |

Expected |
| Domestic Equity Funds | 53.2% | |
| International Equity Funds | 13.3% | |
| Investment Grade Fixed-Income Funds | 25.2% | |
| High Yield Fixed-Income Funds | 7.4% | |
| Short-Term Funds | 0.9% | |

The fund invests according to an asset allocation strategy that becomes increasingly conservative over time. The six months ago allocation is based on the fund's holdings as of June 30, 2007. The current allocation is based on the fund's holdings as of December 31, 2007. The expected allocation represents the fund's anticipated allocation at June 30, 2008. |
VIP Freedom Funds Portfolio
VIP Freedom 2020 Portfolio
Investments December 31, 2007
Showing Percentage of Total Value of Investment in Securities
Equity Funds - 67.2% |
| Shares | | Value |
Domestic Equity Funds - 53.6% |
VIP Contrafund Portfolio Initial Class | 547,972 | | $ 15,288,427 |
VIP Equity-Income Portfolio Initial Class | 659,663 | | 15,772,549 |
VIP Growth & Income Portfolio Initial Class | 1,008,591 | | 17,156,130 |
VIP Growth Portfolio Initial Class | 405,498 | | 18,296,055 |
VIP Mid Cap Portfolio Initial Class | 168,762 | | 6,102,427 |
VIP Value Portfolio Initial Class | 1,020,429 | | 13,377,822 |
VIP Value Strategies Portfolio Initial Class | 442,086 | | 5,561,441 |
TOTAL DOMESTIC EQUITY FUNDS | | 91,554,851 |
International Equity Funds - 13.6% |
VIP Overseas Portfolio Initial Class | 915,593 | | 23,182,816 |
TOTAL EQUITY FUNDS (Cost $109,679,895) | 114,737,667 |
Fixed-Income Funds - 32.4% |
| | | |
High Yield Fixed-Income Funds - 7.5% |
VIP High Income Portfolio Initial Class | 2,130,969 | | 12,743,192 |
Investment Grade Fixed-Income Funds - 24.9% |
VIP Investment Grade Bond Portfolio Initial Class | 3,333,019 | | 42,529,320 |
TOTAL FIXED-INCOME FUNDS (Cost $55,258,828) | 55,272,512 |
Short-Term Funds - 0.4% |
| | | |
VIP Money Market Portfolio Initial Class
(Cost $756,893) | 756,893 | | 756,893 |
TOTAL INVESTMENT IN SECURITIES - 100% (Cost $165,695,616) | $ 170,767,072 |
See accompanying notes which are an integral part of the financial statements.
Annual Report
VIP Freedom 2020 Portfolio
Financial Statements
Statement of Assets and Liabilities
| December 31, 2007 |
| | |
Assets | | |
Investment in securities, at value (cost $165,695,616) - See accompanying schedule | | $ 170,767,072 |
Receivable for fund shares sold | | 631,639 |
Total assets | | 171,398,711 |
| | |
Liabilities | | |
Payable to custodian bank | $ 1,119 | |
Payable for investments purchased | 610,084 | |
Payable for fund shares redeemed | 20,501 | |
Distribution fees payable | 25,728 | |
Total liabilities | | 657,432 |
| | |
Net Assets | | $ 170,741,279 |
Net Assets consist of: | | |
Paid in capital | | $ 161,789,388 |
Accumulated undistributed net realized gain (loss) on investments | | 3,880,435 |
Net unrealized appreciation (depreciation) on investments | | 5,071,456 |
Net Assets | | $ 170,741,279 |
| | |
Initial Class: Net Asset Value, offering price and redemption price per share ($31,465,332 ÷ 2,490,792 shares) | | $ 12.63 |
| | |
Service Class:
Net Asset Value, offering price and redemption price per share ($19,881,344 ÷ 1,575,772 shares) | | $ 12.62 |
| | |
Service Class 2:
Net Asset Value, offering price and redemption price per share ($119,394,603 ÷ 9,478,162 shares) | | $ 12.60 |
Statement of Operations
| Year ended December 31, 2007 |
| | |
Investment Income | | |
Income distributions from underlying funds | | $ 3,529,119 |
Interest | | 37 |
Total income | | 3,529,156 |
| | |
Expenses | | |
Distribution fees | $ 232,635 | |
Independent trustees' compensation | 420 | |
Total expenses before reductions | 233,055 | |
Expense reductions | (420) | 232,635 |
Net investment income (loss) | | 3,296,521 |
Realized and Unrealized Gain (Loss) Realized gain (loss) on sale of underlying fund shares | (224,091) | |
Capital gain distributions from underlying funds | 7,776,078 | 7,551,987 |
Change in net unrealized appreciation (depreciation) on underlying funds | | (232,295) |
Net gain (loss) | | 7,319,692 |
Net increase (decrease) in net assets resulting from operations | | $ 10,616,213 |
See accompanying notes which are an integral part of the financial statements.
VIP Freedom Funds Portfolio
Statement of Changes in Net Assets
| Year ended
December 31, 2007 | Year ended
December 31, 2006 |
Increase (Decrease) in Net Assets | | |
Operations | | |
Net investment income (loss) | $ 3,296,521 | $ 1,178,471 |
Net realized gain (loss) | 7,551,987 | 1,816,338 |
Change in net unrealized appreciation (depreciation) | (232,295) | 4,058,003 |
Net increase (decrease) in net assets resulting from operations | 10,616,213 | 7,052,812 |
Distributions to shareholders from net investment income | (3,307,398) | (1,169,624) |
Distributions to shareholders from net realized gain | (4,726,644) | (753,339) |
Total distributions | (8,034,042) | (1,922,963) |
Share transactions - net increase (decrease) | 83,437,561 | 45,506,036 |
Total increase (decrease) in net assets | 86,019,732 | 50,635,885 |
| | |
Net Assets | | |
Beginning of period | 84,721,547 | 34,085,662 |
End of period (including undistributed net investment income of $0 and undistributed net investment income
of $8,841, respectively) | $ 170,741,279 | $ 84,721,547 |
Financial Highlights - Initial Class
Years ended December 31, | 2007 | 2006 | 2005 G |
Selected Per-Share Data | | | |
Net asset value, beginning of period | $ 12.10 | $ 11.07 | $ 10.00 |
Income from Investment Operations | | | |
Net investment income (loss) E | .35 | .26 | .13 |
Net realized and unrealized gain (loss) | .88 | 1.06 | 1.00 |
Total from investment operations | 1.23 | 1.32 | 1.13 |
Distributions from net investment income | (.27) | (.18) | (.06) |
Distributions from net realized gain | (.43) | (.11) | - |
Total distributions | (.70) I | (.29) | (.06) |
Net asset value, end of period | $ 12.63 | $ 12.10 | $ 11.07 |
Total Return B,C,D | 10.23% | 11.95% | 11.34% |
Ratios to Average Net Assets F,H | | | |
Expenses before reductions | .00% | .00% | .00% A |
Expenses net of fee waivers, if any | .00% | .00% | .00% A |
Expenses net of all reductions | .00% | .00% | .00% A |
Net investment income (loss) | 2.76% | 2.21% | 1.80% A |
Supplemental Data | | | |
Net assets, end of period (000 omitted) | $ 31,465 | $ 21,356 | $ 16,085 |
Portfolio turnover rate | 12% | 21% | 14% A |
A Annualized
B Total returns for periods of less than one year are not annualized.
C Total returns do not reflect charges attributable to your insurance company's separate account. Inclusion of these charges would reduce the total returns shown.
D Total returns would have been lower had certain expenses not been reduced during the periods shown.
E Calculated based on average shares outstanding during the period.
F Amounts do not include the activity of the underlying funds.
G For the period April 26, 2005 (commencement of operations) to December 31, 2005.
H Expense ratios reflect operating expenses of the class. Expenses before reductions do not reflect amounts reimbursed by the investment adviser or expense offset arrangements and do not represent the amount paid by the class during periods when reimbursements or reductions occur. Expenses net of fee waivers reflect expenses after reimbursement by the investment adviser but prior to reductions from expense offset arrangements. Expenses net of all reductions represent the net expenses paid by the class but do not include expenses of the investment companies in which the Fund invests.
I Total distributions of $.698 per share is comprised of distributions from net investment income of $.273 and distributions from net realized gain of $.425 per share.
See accompanying notes which are an integral part of the financial statements.
Annual Report
VIP Freedom 2020 Portfolio
Financial Statements - continued
Financial Highlights - Service Class
Years ended December 31, | 2007 | 2006 | 2005 G |
Selected Per-Share Data | | | |
Net asset value, beginning of period | $ 12.09 | $ 11.07 | $ 10.00 |
Income from Investment Operations | | | |
Net investment income (loss) E | .34 | .25 | .12 |
Net realized and unrealized gain (loss) | .88 | 1.06 | 1.01 |
Total from investment operations | 1.22 | 1.31 | 1.13 |
Distributions from net investment income | (.26) | (.18) | (.06) |
Distributions from net realized gain | (.43) | (.11) | - |
Total distributions | (.69) I | (.29) | (.06) |
Net asset value, end of period | $ 12.62 | $ 12.09 | $ 11.07 |
Total Return B,C,D | 10.17% | 11.81% | 11.30% |
Ratios to Average Net Assets F,H | | | |
Expenses before reductions | .10% | .10% | .10% A |
Expenses net of fee waivers, if any | .10% | .10% | .10% A |
Expenses net of all reductions | .10% | .10% | .10% A |
Net investment income (loss) | 2.66% | 2.11% | 1.70% A |
Supplemental Data | | | |
Net assets, end of period (000 omitted) | $ 19,881 | $ 6,555 | $ 1,586 |
Portfolio turnover rate | 12% | 21% | 14% A |
A Annualized
B Total returns for periods of less than one year are not annualized.
C Total returns do not reflect charges attributable to your insurance company's separate account. Inclusion of these charges would reduce the total returns shown.
D Total returns would have been lower had certain expenses not been reduced during the periods shown.
E Calculated based on average shares outstanding during the period.
F Amounts do not include the activity of the underlying funds.
G For the period April 26, 2005 (commencement of operations) to December 31, 2005.
H Expense ratios reflect operating expenses of the class. Expenses before reductions do not reflect amounts reimbursed by the investment adviser or expense offset arrangements and do not represent the amount paid by the class during periods when reimbursements or reductions occur. Expenses net of fee waivers reflect expenses after reimbursement by the investment adviser but prior to reductions from expense offset arrangements. Expenses net of all reductions represent the net expenses paid by the class but do not include expenses of the investment companies in which the Fund invests.
I Total distributions of $.689 per share is comprised of distributions from net investment income of $.264 and distributions from net realized gain of $.425 per share.
Financial Highlights - Service Class 2
Years ended December 31, | 2007 | 2006 | 2005 G |
Selected Per-Share Data | | | |
Net asset value, beginning of period | $ 12.08 | $ 11.06 | $ 10.00 |
Income from Investment Operations | | | |
Net investment income (loss) E | .32 | .23 | .11 |
Net realized and unrealized gain (loss) | .87 | 1.07 | 1.01 |
Total from investment operations | 1.19 | 1.30 | 1.12 |
Distributions from net investment income | (.25) | (.17) | (.06) |
Distributions from net realized gain | (.43) | (.11) | - |
Total distributions | (.67) I | (.28) | (.06) |
Net asset value, end of period | $ 12.60 | $ 12.08 | $ 11.06 |
Total Return B,C,D | 9.97% | 11.70% | 11.17% |
Ratios to Average Net Assets F,H | | | |
Expenses before reductions | .25% | .25% | .25% A |
Expenses net of fee waivers, if any | .25% | .25% | .25% A |
Expenses net of all reductions | .25% | .25% | .25% A |
Net investment income (loss) | 2.51% | 1.96% | 1.55% A |
Supplemental Data | | | |
Net assets, end of period (000 omitted) | $ 119,395 | $ 56,810 | $ 16,414 |
Portfolio turnover rate | 12% | 21% | 14% A |
A Annualized
B Total returns for periods of less than one year are not annualized.
C Total returns do not reflect charges attributable to your insurance company's separate account. Inclusion of these charges would reduce the total returns shown.
D Total returns would have been lower had certain expenses not been reduced during the periods shown.
E Calculated based on average shares outstanding during the period.
F Amounts do not include the activity of the underlying funds.
G For the period April 26, 2005 (commencement of operations) to December 31, 2005.
H Expense ratios reflect operating expenses of the class. Expenses before reductions do not reflect amounts reimbursed by the investment adviser or expense offset arrangements and do not represent the amount paid by the class during periods when reimbursements or reductions occur. Expenses net of fee waivers reflect expenses after reimbursement by the investment adviser but prior to reductions from expense offset arrangements. Expenses net of all reductions represent the net expenses paid by the class but do not include expenses of the investment companies in which the Fund invests.
I Total distributions of $.674 per share is comprised of distributions from net investment income of $.249 and distributions from net realized gain of $.425 per share.
See accompanying notes which are an integral part of the financial statements.
VIP Freedom Funds Portfolio
VIP Freedom 2025 Portfolio
Investment Changes
Fund Holdings as of December 31, 2007 |
| % of fund's investments | % of fund's investments 6 months ago |
Domestic Equity Funds | | |
VIP Contrafund Portfolio Initial Class | 9.4 | 9.0 |
VIP Equity-Income Portfolio Initial Class | 9.8 | 10.4 |
VIP Growth & Income Portfolio Initial Class | 10.6 | 10.4 |
VIP Growth Portfolio Initial Class | 11.1 | 10.6 |
VIP Mid Cap Portfolio Initial Class | 3.8 | 3.8 |
VIP Value Portfolio Initial Class | 8.3 | 8.9 |
VIP Value Strategies Portfolio Initial Class | 3.5 | 3.7 |
| 56.5 | 56.8 |
International Equity Funds | | |
VIP Overseas Portfolio Initial Class | 14.1 | 14.2 |
High Yield Fixed-Income Funds | | |
VIP High Income Portfolio Initial Class | 7.5 | 7.5 |
Investment Grade Fixed-Income Funds | | |
VIP Investment Grade Bond Portfolio Initial Class | 21.9 | 21.5 |
| 100.0 | 100.0 |
Asset Allocation (% of fund's investments) |
Current |
| Domestic Equity Funds | 56.5% | |
| International Equity Funds | 14.1% | |
| Investment Grade Fixed-Income Funds | 21.9% | |
| High Yield Fixed-Income Funds | 7.5% | |

Six months ago |
| Domestic Equity Funds | 56.8% | |
| International Equity Funds | 14.2% | |
| Investment Grade Fixed-Income Funds | 21.5% | |
| High Yield Fixed-Income Funds | 7.5% | |

Expected |
| Domestic Equity Funds | 56.2% | |
| International Equity Funds | 14.0% | |
| Investment Grade Fixed-Income Funds | 22.3% | |
 | High Yield Fixed-Income Funds | 7.5% | |

The fund invests according to an asset allocation strategy that becomes increasingly conservative over time. The six months ago allocation is based on the fund's holdings as of June 30, 2007. The current allocation is based on the fund's holdings as of December 31, 2007. The expected allocation represents the fund's anticipated allocation at June 30, 2008. |
Annual Report
VIP Freedom 2025 Portfolio
Investments December 31, 2007
Showing Percentage of Total Value of Investment in Securities
Equity Funds - 70.6% |
| Shares | | Value |
Domestic Equity Funds - 56.5% |
VIP Contrafund Portfolio Initial Class | 66,143 | | $ 1,845,389 |
VIP Equity-Income Portfolio Initial Class | 80,891 | | 1,934,107 |
VIP Growth & Income Portfolio Initial Class | 122,387 | | 2,081,810 |
VIP Growth Portfolio Initial Class | 48,676 | | 2,196,244 |
VIP Mid Cap Portfolio Initial Class | 20,443 | | 739,201 |
VIP Value Portfolio Initial Class | 124,991 | | 1,638,634 |
VIP Value Strategies Portfolio Initial Class | 54,134 | | 681,000 |
TOTAL DOMESTIC EQUITY FUNDS | | 11,116,385 |
International Equity Funds - 14.1% |
VIP Overseas Portfolio Initial Class | 109,968 | | 2,784,386 |
TOTAL EQUITY FUNDS (Cost $13,253,032) | 13,900,771 |
Fixed-Income Funds - 29.4% |
| | | |
High Yield Fixed-Income Funds - 7.5% |
VIP High Income Portfolio Initial Class | 247,612 | | 1,480,721 |
Investment Grade Fixed-Income Funds - 21.9% |
VIP Investment Grade Bond Portfolio Initial Class | 337,850 | | 4,310,967 |
TOTAL FIXED-INCOME FUNDS (Cost $5,802,961) | 5,791,688 |
TOTAL INVESTMENT IN SECURITIES - 100% (Cost $19,055,993) | $ 19,692,459 |
See accompanying notes which are an integral part of the financial statements.
VIP Freedom Funds Portfolio
VIP Freedom 2025 Portfolio
Financial Statements
Statement of Assets and Liabilities
| December 31, 2007 |
| | |
Assets | | |
Investment in securities, at value (cost $19,055,993) - See accompanying schedule | | $ 19,692,459 |
Receivable for investments sold | | 128,688 |
Receivable for fund shares sold | | 1,807 |
Total assets | | 19,822,954 |
| | |
Liabilities | | |
Payable to custodian bank | $ 746 | |
Payable for fund shares redeemed | 129,492 | |
Distribution fees payable | 837 | |
Total liabilities | | 131,075 |
| | |
Net Assets | | $ 19,691,879 |
Net Assets consist of: | | |
Paid in capital | | $ 18,579,501 |
Accumulated undistributed net realized gain (loss) on investments | | 475,912 |
Net unrealized appreciation (depreciation) on investments | | 636,466 |
Net Assets | | $ 19,691,879 |
| | |
Initial Class: Net Asset Value, offering price and redemption price per share ($15,197,022 ÷ 1,195,987 shares) | | $ 12.71 |
| | |
Service Class:
Net Asset Value, offering price and redemption price per share ($497,310 ÷ 39,148 shares) | | $ 12.70 |
| | |
Service Class 2:
Net Asset Value, offering price and redemption price per share ($3,997,547 ÷ 315,356 shares) | | $ 12.68 |
Statement of Operations
| Year ended December 31, 2007 |
| | |
Investment Income | | |
Income distributions from underlying funds | | $ 393,889 |
Interest | | 50 |
Total income | | 393,939 |
| | |
Expenses | | |
Distribution fees | $ 3,466 | |
Independent trustees' compensation | 44 | |
Total expenses before reductions | 3,510 | |
Expense reductions | (44) | 3,466 |
Net investment income (loss) | | 390,473 |
Realized and Unrealized Gain (Loss) Realized gain (loss) on sale of underlying fund shares | (28,453) | |
Capital gain distributions from underlying funds | 927,529 | 899,076 |
Change in net unrealized appreciation (depreciation) on underlying funds | | (188,158) |
Net gain (loss) | | 710,918 |
Net increase (decrease) in net assets resulting from operations | | $ 1,101,391 |
See accompanying notes which are an integral part of the financial statements.
Annual Report
VIP Freedom 2025 Portfolio
Financial Statements - continued
Statement of Changes in Net Assets
| Year ended
December 31, 2007 | Year ended
December 31, 2006 |
Increase (Decrease) in Net Assets | | |
Operations | | |
Net investment income (loss) | $ 390,473 | $ 150,496 |
Net realized gain (loss) | 899,076 | 283,979 |
Change in net unrealized appreciation (depreciation) | (188,158) | 528,242 |
Net increase (decrease) in net assets resulting from operations | 1,101,391 | 962,717 |
Distributions to shareholders from net investment income | (392,829) | (151,306) |
Distributions to shareholders from net realized gain | (575,210) | (126,743) |
Total distributions | (968,039) | (278,049) |
Share transactions - net increase (decrease) | 10,198,355 | 3,065,781 |
Total increase (decrease) in net assets | 10,331,707 | 3,750,449 |
| | |
Net Assets | | |
Beginning of period | 9,360,172 | 5,609,723 |
End of period | $ 19,691,879 | $ 9,360,172 |
Financial Highlights - Initial Class
Years ended December 31, | 2007 | 2006 | 2005 G |
Selected Per-Share Data | | | |
Net asset value, beginning of period | $ 12.18 | $ 11.16 | $ 10.00 |
Income from Investment Operations | | | |
Net investment income (loss) E | .38 | .23 | .11 |
Net realized and unrealized gain (loss) | .89 | 1.17 | 1.12 |
Total from investment operations | 1.27 | 1.40 | 1.23 |
Distributions from net investment income | (.27) | (.21) | (.07) |
Distributions from net realized gain | (.47) | (.17) | - |
Total distributions | (.74) | (.38) | (.07) |
Net asset value, end of period | $ 12.71 | $ 12.18 | $ 11.16 |
Total Return B,C,D | 10.50% | 12.49% | 12.25% |
Ratios to Average Net Assets F,H | | | |
Expenses before reductions | .00% | .00% | .00% A |
Expenses net of fee waivers, if any | .00% | .00% | .00% A |
Expenses net of all reductions | .00% | .00% | .00% A |
Net investment income (loss) | 2.95% | 1.95% | 1.44% A |
Supplemental Data | | | |
Net assets, end of period (000 omitted) | $ 15,197 | $ 8,363 | $ 4,825 |
Portfolio turnover rate | 20% | 49% | 9% A |
A Annualized
B Total returns for periods of less than one year are not annualized.
C Total returns do not reflect charges attributable to your insurance company's separate account. Inclusion of these charges would reduce the total returns shown.
D Total returns would have been lower had certain expenses not been reduced during the periods shown.
E Calculated based on average shares outstanding during the period.
F Amounts do not include the activity of the underlying funds.
G For the period April 26, 2005 (commencement of operations) to December 31, 2005.
H Expense ratios reflect operating expenses of the class. Expenses before reductions do not reflect amounts reimbursed by the investment adviser or expense offset arrangements and do not represent the amount paid by the class during periods when reimbursements or reductions occur. Expenses net of fee waivers reflect expenses after reimbursement by the investment adviser but prior to reductions from expense offset arrangements. Expenses net of all reductions represent the net expenses paid by the class but do not include expenses of the investment companies in which the Fund invests.
See accompanying notes which are an integral part of the financial statements.
VIP Freedom Funds Portfolio
Financial Highlights - Service Class
Years ended December 31, | 2007 | 2006 | 2005 G |
Selected Per-Share Data | | | |
Net asset value, beginning of period | $ 12.18 | $ 11.16 | $ 10.00 |
Income from Investment Operations | | | |
Net investment income (loss) E | .37 | .22 | .10 |
Net realized and unrealized gain (loss) | .87 | 1.16 | 1.12 |
Total from investment operations | 1.24 | 1.38 | 1.22 |
Distributions from net investment income | (.25) | (.19) | (.06) |
Distributions from net realized gain | (.47) | (.17) | - |
Total distributions | (.72) | (.36) | (.06) |
Net asset value, end of period | $ 12.70 | $ 12.18 | $ 11.16 |
Total Return B,C,D | 10.31% | 12.39% | 12.18% |
Ratios to Average Net Assets F,H | | | |
Expenses before reductions | .10% | .10% | .10% A |
Expenses net of fee waivers, if any | .10% | .10% | .10% A |
Expenses net of all reductions | .10% | .10% | .10% A |
Net investment income (loss) | 2.85% | 1.85% | 1.34% A |
Supplemental Data | | | |
Net assets, end of period (000 omitted) | $ 497 | $ 441 | $ 393 |
Portfolio turnover rate | 20% | 49% | 9% A |
A Annualized
B Total returns for periods of less than one year are not annualized.
C Total returns do not reflect charges attributable to your insurance company's separate account. Inclusion of these charges would reduce the total returns shown.
D Total returns would have been lower had certain expenses not been reduced during the periods shown.
E Calculated based on average shares outstanding during the period.
F Amounts do not include the activity of the underlying funds.
G For the period April 26, 2005 (commencement of operations) to December 31, 2005.
H Expense ratios reflect operating expenses of the class. Expenses before reductions do not reflect amounts reimbursed by the investment adviser or expense offset arrangements and do not represent the amount paid by the class during periods when reimbursements or reductions occur. Expenses net of fee waivers reflect expenses after reimbursement by the investment adviser but prior to reductions from expense offset arrangements. Expenses net of all reductions represent the net expenses paid by the class but do not include expenses of the investment companies in which the Fund invests.
Financial Highlights - Service Class 2
Years ended December 31, | 2007 | 2006 | 2005 G |
Selected Per-Share Data | | | |
Net asset value, beginning of period | $ 12.17 | $ 11.16 | $ 10.00 |
Income from Investment Operations | | | |
Net investment income (loss) E | .35 | .20 | .09 |
Net realized and unrealized gain (loss) | .89 | 1.16 | 1.12 |
Total from investment operations | 1.24 | 1.36 | 1.21 |
Distributions from net investment income | (.26) | (.18) | (.05) |
Distributions from net realized gain | (.47) | (.17) | - |
Total distributions | (.73) | (.35) | (.05) |
Net asset value, end of period | $ 12.68 | $ 12.17 | $ 11.16 |
Total Return B,C,D | 10.26% | 12.18% | 12.07% |
Ratios to Average Net Assets F,H | | | |
Expenses before reductions | .25% | .25% | .25% A |
Expenses net of fee waivers, if any | .25% | .25% | .25% A |
Expenses net of all reductions | .25% | .25% | .25% A |
Net investment income (loss) | 2.70% | 1.70% | 1.19% A |
Supplemental Data | | | |
Net assets, end of period (000 omitted) | $ 3,998 | $ 556 | $ 392 |
Portfolio turnover rate | 20% | 49% | 9% A |
A Annualized
B Total returns for periods of less than one year are not annualized.
C Total returns do not reflect charges attributable to your insurance company's separate account. Inclusion of these charges would reduce the total returns shown.
D Total returns would have been lower had certain expenses not been reduced during the periods shown.
E Calculated based on average shares outstanding during the period.
F Amounts do not include the activity of the underlying funds.
G For the period April 26, 2005 (commencement of operations) to December 31, 2005.
H Expense ratios reflect operating expenses of the class. Expenses before reductions do not reflect amounts reimbursed by the investment adviser or expense offset arrangements and do not represent the amount paid by the class during periods when reimbursements or reductions occur. Expenses net of fee waivers reflect expenses after reimbursement by the investment adviser but prior to reductions from expense offset arrangements. Expenses net of all reductions represent the net expenses paid by the class but do not include expenses of the investment companies in which the Fund invests.
See accompanying notes which are an integral part of the financial statements.
Annual Report
VIP Freedom 2030 Portfolio
Investment Changes
Fund Holdings as of December 31, 2007 |
| % of fund's investments | % of fund's investments 6 months ago |
Domestic Equity Funds | | |
VIP Contrafund Portfolio Initial Class | 10.8 | 10.4 |
VIP Equity-Income Portfolio Initial Class | 11.2 | 12.0 |
VIP Growth & Income Portfolio Initial Class | 12.2 | 12.0 |
VIP Growth Portfolio Initial Class | 13.0 | 12.3 |
VIP Mid Cap Portfolio Initial Class | 4.3 | 4.3 |
VIP Value Portfolio Initial Class | 9.5 | 10.3 |
VIP Value Strategies Portfolio Initial Class | 3.9 | 4.3 |
| 64.9 | 65.6 |
International Equity Funds | | |
VIP Overseas Portfolio Initial Class | 16.5 | 16.4 |
High Yield Fixed-Income Funds | | |
VIP High Income Portfolio Initial Class | 7.6 | 7.5 |
Investment Grade Fixed-Income Funds | | |
VIP Investment Grade Bond Portfolio Initial Class | 11.0 | 10.5 |
| 100.0 | 100.0 |
Asset Allocation (% of fund's investments) |
Current |
| Domestic Equity Funds | 64.9% | |
| International Equity Funds | 16.5% | |
| Investment Grade Fixed-Income Funds | 11.0% | |
| High Yield Fixed-Income Funds | 7.6% | |

Six months ago |
| Domestic Equity Funds | 65.6% | |
| International Equity Funds | 16.4% | |
| Investment Grade Fixed-Income Funds | 10.5% | |
| High Yield Fixed-Income Funds | 7.5% | |

Expected |
| Domestic Equity Funds | 64.6% | |
| International Equity Funds | 16.2% | |
| Investment Grade Fixed-Income Funds | 11.7% | |
| High Yield Fixed-Income Funds | 7.5% | |

The fund invests according to an asset allocation strategy that becomes increasingly conservative over time. The six months ago allocation is based on the fund's holdings as of June 30, 2007. The current allocation is based on the fund's holdings as of December 31, 2007. The expected allocation represents the fund's anticipated allocation at June 30, 2008. |
VIP Freedom Funds Portfolio
VIP Freedom 2030 Portfolio
Investments December 31, 2007
Showing Percentage of Total Value of Investment in Securities
Equity Funds - 81.4% |
| Shares | | Value |
Domestic Equity Funds - 64.9% |
VIP Contrafund Portfolio Initial Class | 236,756 | | $ 6,605,485 |
VIP Equity-Income Portfolio Initial Class | 284,108 | | 6,793,012 |
VIP Growth & Income Portfolio Initial Class | 435,175 | | 7,402,330 |
VIP Growth Portfolio Initial Class | 175,318 | | 7,910,331 |
VIP Mid Cap Portfolio Initial Class | 72,739 | | 2,630,242 |
VIP Value Portfolio Initial Class | 439,306 | | 5,759,300 |
VIP Value Strategies Portfolio Initial Class | 189,907 | | 2,389,030 |
TOTAL DOMESTIC EQUITY FUNDS | | 39,489,730 |
International Equity Funds - 16.5% |
VIP Overseas Portfolio Initial Class | 395,491 | | 10,013,843 |
TOTAL EQUITY FUNDS (Cost $46,783,040) | 49,503,573 |
Fixed-Income Funds - 18.6% |
| | | |
High Yield Fixed-Income Funds - 7.6% |
VIP High Income Portfolio Initial Class | 767,910 | | 4,592,102 |
Investment Grade Fixed-Income Funds - 11.0% |
VIP Investment Grade Bond Portfolio Initial Class | 525,781 | | 6,708,967 |
TOTAL FIXED-INCOME FUNDS (Cost $11,493,515) | 11,301,069 |
TOTAL INVESTMENT IN SECURITIES - 100% (Cost $58,276,555) | $ 60,804,642 |
See accompanying notes which are an integral part of the financial statements.
Annual Report
VIP Freedom 2030 Portfolio
Financial Statements
Statement of Assets and Liabilities
| December 31, 2007 |
| | |
Assets | | |
Investment in securities, at value (cost $58,276,555) - See accompanying schedule | | $ 60,804,642 |
Cash | | 740 |
Receivable for investments sold | | 296 |
Receivable for fund shares sold | | 136,185 |
Total assets | | 60,941,863 |
| | |
Liabilities | | |
Payable for investments purchased | $ 58,464 | |
Payable for fund shares redeemed | 78,400 | |
Distribution fees payable | 5,969 | |
Total liabilities | | 142,833 |
| | |
Net Assets | | $ 60,799,030 |
Net Assets consist of: | | |
Paid in capital | | $ 56,554,649 |
Accumulated undistributed net realized gain (loss) on investments | | 1,716,294 |
Net unrealized appreciation (depreciation) on investments | | 2,528,087 |
Net Assets | | $ 60,799,030 |
| | |
Initial Class: Net Asset Value, offering price and redemption price per share ($23,767,106 ÷ 1,824,858 shares) | | $ 13.02 |
| | |
Service Class:
Net Asset Value, offering price and redemption price per share ($12,884,375 ÷ 990,205 shares) | | $ 13.01 |
| | |
Service Class 2:
Net Asset Value, offering price and redemption price per share ($24,147,549 ÷ 1,858,544 shares) | | $ 12.99 |
Statement of Operations
| Year ended December 31, 2007 |
| | |
Investment Income | | |
Income distributions from underlying funds | | $ 1,244,983 |
Interest | | 60 |
Total income | | 1,245,043 |
| | |
Expenses | | |
Distribution fees | $ 56,747 | |
Independent trustees' compensation | 160 | |
Total expenses before reductions | 56,907 | |
Expense reductions | (160) | 56,747 |
Net investment income (loss) | | 1,188,296 |
Realized and Unrealized Gain (Loss) Realized gain (loss) on sale of underlying fund shares | (163,667) | |
Capital gain distributions from underlying funds | 3,555,296 | 3,391,629 |
Change in net unrealized appreciation (depreciation) on underlying funds | | (28,674) |
Net gain (loss) | | 3,362,955 |
Net increase (decrease) in net assets resulting from operations | | $ 4,551,251 |
See accompanying notes which are an integral part of the financial statements.
VIP Freedom Funds Portfolio
Statement of Changes in Net Assets
| Year ended
December 31, 2007 | Year ended
December 31, 2006 |
Increase (Decrease) in Net Assets | | |
Operations | | |
Net investment income (loss) | $ 1,188,296 | $ 454,629 |
Net realized gain (loss) | 3,391,629 | 870,615 |
Change in net unrealized appreciation (depreciation) | (28,674) | 1,738,118 |
Net increase (decrease) in net assets resulting from operations | 4,551,251 | 3,063,362 |
Distributions to shareholders from net investment income | (1,194,475) | (470,715) |
Distributions to shareholders from net realized gain | (2,163,007) | (345,367) |
Total distributions | (3,357,482) | (816,082) |
Share transactions - net increase (decrease) | 25,665,961 | 15,075,481 |
Total increase (decrease) in net assets | 26,859,730 | 17,322,761 |
| | |
Net Assets | | |
Beginning of period | 33,939,300 | 16,616,539 |
End of period | $ 60,799,030 | $ 33,939,300 |
Financial Highlights - Initial Class
Years ended December 31, | 2007 | 2006 | 2005 G |
Selected Per-Share Data | | | |
Net asset value, beginning of period | $ 12.44 | $ 11.27 | $ 10.00 |
Income from Investment Operations | | | |
Net investment income (loss) E | .34 | .24 | .13 |
Net realized and unrealized gain (loss) | 1.06 | 1.25 | 1.21 |
Total from investment operations | 1.40 | 1.49 | 1.34 |
Distributions from net investment income | (.28) | (.19) | (.07) |
Distributions from net realized gain | (.54) | (.13) | - |
Total distributions | (.82) | (.32) | (.07) |
Net asset value, end of period | $ 13.02 | $ 12.44 | $ 11.27 |
Total Return B,C,D | 11.37% | 13.20% | 13.35% |
Ratios to Average Net Assets F,H | | | |
Expenses before reductions | .00% | .00% | .00% A |
Expenses net of fee waivers, if any | .00% | .00% | .00% A |
Expenses net of all reductions | .00% | .00% | .00% A |
Net investment income (loss) | 2.56% | 2.05% | 1.71% A |
Supplemental Data | | | |
Net assets, end of period (000 omitted) | $ 23,767 | $ 14,298 | $ 8,262 |
Portfolio turnover rate | 17% | 32% | 33% A |
A Annualized
B Total returns for periods of less than one year are not annualized.
C Total returns do not reflect charges attributable to your insurance company's separate account. Inclusion of these charges would reduce the total returns shown.
D Total returns would have been lower had certain expenses not been reduced during the periods shown.
E Calculated based on average shares outstanding during the period.
F Amounts do not include the activity of the underlying funds.
G For the period April 26, 2005 (commencement of operations) to December 31, 2005.
H Expense ratios reflect operating expenses of the class. Expenses before reductions do not reflect amounts reimbursed by the investment adviser or expense offset arrangements and do not represent the amount paid by the class during periods when reimbursements or reductions occur. Expenses net of fee waivers reflect expenses after reimbursement by the investment adviser but prior to reductions from expense offset arrangements. Expenses net of all reductions represent the net expenses paid by the class but do not include expenses of the investment companies in which the Fund invests.
See accompanying notes which are an integral part of the financial statements.
Annual Report
VIP Freedom 2030 Portfolio
Financial Statements - continued
Financial Highlights - Service Class
Years ended December 31, | 2007 | 2006 | 2005 G |
Selected Per-Share Data | | | |
Net asset value, beginning of period | $ 12.44 | $ 11.27 | $ 10.00 |
Income from Investment Operations | | | |
Net investment income (loss) E | .33 | .23 | .12 |
Net realized and unrealized gain (loss) | 1.05 | 1.25 | 1.21 |
Total from investment operations | 1.38 | 1.48 | 1.33 |
Distributions from net investment income | (.27) | (.18) | (.06) |
Distributions from net realized gain | (.54) | (.13) | - |
Total distributions | (.81) | (.31) | (.06) |
Net asset value, end of period | $ 13.01 | $ 12.44 | $ 11.27 |
Total Return B,C,D | 11.21% | 13.15% | 13.30% |
Ratios to Average Net Assets F,H | | | |
Expenses before reductions | .10% | .10% | .10% A |
Expenses net of fee waivers, if any | .10% | .10% | .10% A |
Expenses net of all reductions | .10% | .10% | .10% A |
Net investment income (loss) | 2.46% | 1.95% | 1.62% A |
Supplemental Data | | | |
Net assets, end of period (000 omitted) | $ 12,884 | $ 3,867 | $ 958 |
Portfolio turnover rate | 17% | 32% | 33% A |
A Annualized
B Total returns for periods of less than one year are not annualized.
C Total returns do not reflect charges attributable to your insurance company's separate account. Inclusion of these charges would reduce the total returns shown.
D Total returns would have been lower had certain expenses not been reduced during the periods shown.
E Calculated based on average shares outstanding during the period.
F Amounts do not include the activity of the underlying funds.
G For the period April 26, 2005 (commencement of operations) to December 31, 2005.
H Expense ratios reflect operating expenses of the class. Expenses before reductions do not reflect amounts reimbursed by the investment adviser or expense offset arrangements and do not represent the amount paid by the class during periods when reimbursements or reductions occur. Expenses net of fee waivers reflect expenses after reimbursement by the investment adviser but prior to reductions from expense offset arrangements. Expenses net of all reductions represent the net expenses paid by the class but do not include expenses of the investment companies in which the Fund invests.
Financial Highlights - Service Class 2
Years ended December 31, | 2007 | 2006 | 2005 G |
Selected Per-Share Data | | | |
Net asset value, beginning of period | $ 12.42 | $ 11.26 | $ 10.00 |
Income from Investment Operations | | | |
Net investment income (loss) E | .31 | .21 | .11 |
Net realized and unrealized gain (loss) | 1.05 | 1.25 | 1.21 |
Total from investment operations | 1.36 | 1.46 | 1.32 |
Distributions from net investment income | (.25) | (.17) | (.06) |
Distributions from net realized gain | (.54) | (.13) | - |
Total distributions | (.79) | (.30) | (.06) |
Net asset value, end of period | $ 12.99 | $ 12.42 | $ 11.26 |
Total Return B,C,D | 11.08% | 12.92% | 13.16% |
Ratios to Average Net Assets F,H | | | |
Expenses before reductions | .25% | .25% | .25% A |
Expenses net of fee waivers, if any | .25% | .25% | .25% A |
Expenses net of all reductions | .25% | .25% | .25% A |
Net investment income (loss) | 2.31% | 1.80% | 1.47% A |
Supplemental Data | | | |
Net assets, end of period (000 omitted) | $ 24,148 | $ 15,774 | $ 7,396 |
Portfolio turnover rate | 17% | 32% | 33% A |
A Annualized
B Total returns for periods of less than one year are not annualized.
C Total returns do not reflect charges attributable to your insurance company's separate account. Inclusion of these charges would reduce the total returns shown.
D Total returns would have been lower had certain expenses not been reduced during the periods shown.
E Calculated based on average shares outstanding during the period.
F Amounts do not include the activity of the underlying funds.
G For the period April 26, 2005 (commencement of operations) to December 31, 2005.
H Expense ratios reflect operating expenses of the class. Expenses before reductions do not reflect amounts reimbursed by the investment adviser or expense offset arrangements and do not represent the amount paid by the class during periods when reimbursements or reductions occur. Expenses net of fee waivers reflect expenses after reimbursement by the investment adviser but prior to reductions from expense offset arrangements. Expenses net of all reductions represent the net expenses paid by the class but do not include expenses of the investment companies in which the Fund invests.
See accompanying notes which are an integral part of the financial statements.
VIP Freedom Funds Portfolio
Notes to Financial Statements
For the period ended December 31, 2007
1. Organization.
VIP Freedom Income Portfolio, VIP Freedom 2005 Portfolio, VIP Freedom 2010 Portfolio, VIP Freedom 2015 Portfolio, VIP Freedom 2020 Portfolio, VIP Freedom 2025 Portfolio and VIP Freedom 2030 Portfolio (the Funds) are funds of Variable Insurance Products Fund V (formerly of Variable Insurance Products Fund IV). Effective, April 19, 2007, the Board of Trustees approved an Agreement and Plan of Reorganization whereby the Funds reorganized into Variable Insurance Products Fund V effective June 29, 2007 (Trust Reorganization). The Trust Reorganization does not impact the Funds' investment strategies or Fidelity Management & Research Company's (FMR) management of the Funds. The Variable Insurance Products Fund V (the trust) (referred to in this report as Fidelity Variable Insurance Products) is registered under the Investment Company Act of 1940, as amended (the 1940 Act), as an open-end management investment company organized as a Massachusetts business trust. Each Fund is authorized to issue an unlimited number of shares. The Funds invest primarily in a combination of other VIP equity, fixed income, and short-term funds (the Underlying Funds) managed by FMR. Shares of each Fund may only be purchased by insurance companies for the purpose of funding variable annuity or variable life insurance contracts. Each Fund offers three classes of shares: Initial Class shares, Service Class shares and Service Class 2 shares. All classes have equal rights and voting privileges, except for matters affecting a single class. Investment income, realized and unrealized capital gains and losses, the common expenses of the Fund, and certain fund-level expense reductions, if any, are allocated on a pro rata basis to each class based on the relative net assets of each class to the total net assets of the Fund. Each class differs with respect to distribution and service plan fees incurred. Certain expense reductions also differ by class.
2. Significant Accounting Policies.
The financial statements have been prepared in conformity with accounting principles generally accepted in the United States of America, which require management to make certain estimates and assumptions at the date of the financial statements. The following summarizes the significant accounting policies of the Funds:
Security Valuation. Net asset value per share is calculated as of the close of business of the New York Stock Exchange, normally 4:00 p.m. Eastern time. Investments in the Underlying Funds are valued at their closing net asset value each business day. Short-term securities with remaining maturities of sixty days or less for which quotations are not readily available are valued on the basis of amortized cost, which approximates value.
Investment Transactions and Income. For financial reporting purposes, the Funds' investment holdings and NAV include trades executed through the end of the last business day of the period. The NAV for processing shareholder transactions includes trades executed through the end of the prior business day. Gains and losses on securities sold are determined on the basis of identified cost. Income and capital gain distributions from the Underlying Funds, if any, are recorded on the ex-dividend date. Interest income is accrued as earned. Interest income includes coupon interest and amortization of premium and accretion of discount on debt securities.
Expenses. Most expenses of the trust can be directly attributed to a fund. Expenses which cannot be directly attributed are apportioned among each fund in the trust. Expenses included in the accompanying financial statements reflect the expenses of each Fund and do not include any expenses associated with the Underlying Funds. Expense estimates are accrued in the period to which they relate and adjustments are made when actual amounts are known. All legal and other expenses associated with the Trust Reorganization will be paid by FMR.
Income Tax Information and Distributions to Shareholders. Each year, each Fund intends to qualify as a regulated investment company by distributing substantially all of its taxable income and realized gains under Subchapter M of the Internal Revenue Code and filing its U.S. federal tax return. As a result, no provision for income taxes is required. Each Fund adopted the provisions of FASB Interpretation No. 48, Accounting for Uncertainties in Income Taxes (FIN 48), on June 29, 2007. FIN 48 sets forth a minimum threshold for financial statement recognition of the benefit of a tax position taken or expected to be taken in a tax return. The implementation of FIN 48 did not result in any unrecognized tax benefits in the accompanying financial statements. Each of the Funds' federal tax returns for the prior three fiscal years remains subject to examination by the Internal Revenue Service.
Distributions are recorded on the ex-dividend date. Income dividends and capital gain distributions are declared separately for each class. Income and capital gain distributions are determined in accordance with income tax regulations, which may differ from generally accepted accounting principles.
Capital accounts within the financial statements are adjusted for permanent book-tax differences. These adjustments have no impact on net assets or the results of operations. Temporary book-tax differences will reverse in a subsequent period.
Book-tax differences are primarily due to the short-term gain distributions from the Underlying Funds and losses deferred due to wash sales.
Annual Report
Notes to Financial Statements - continued
2. Significant Accounting Policies - continued
Income Tax Information and Distributions to Shareholders - continued
The tax-basis components of distributable earnings and the federal tax cost as of period end were as follows for each Fund:
| Cost for
Federal Income
Tax Purposes | Unrealized
Appreciation | Unrealized
Depreciation | Net Unrealized
Appreciation/
(Depreciation) |
VIP Freedom Income | $ 13,762,916 | $ 374,797 | $ (97,949) | $ 276,848 |
VIP Freedom 2005 | 9,575,326 | 648,712 | (116,230) | 532,482 |
VIP Freedom 2010 | 104,635,716 | 5,699,728 | (1,886,259) | 3,813,469 |
VIP Freedom 2015 | 56,564,005 | 3,385,358 | (1,190,532) | 2,194,826 |
VIP Freedom 2020 | 165,696,046 | 10,045,279 | (4,974,253) | 5,071,026 |
VIP Freedom 2025 | 19,056,227 | 1,229,343 | (593,111) | 636,232 |
VIP Freedom 2030 | 58,276,787 | 4,460,341 | (1,932,486) | 2,527,855 |
| Undistributed
Ordinary Income | Undistributed
Long-term
Capital Gain |
VIP Freedom Income | $ 30,027 | $ 126,402 |
VIP Freedom 2005 | 5,682 | 173,534 |
VIP Freedom 2010 | 699 | 1,805,358 |
VIP Freedom 2015 | - | 1,121,109 |
VIP Freedom 2020 | - | 3,880,865 |
VIP Freedom 2025 | - | 476,148 |
VIP Freedom 2030 | - | 1,716,528 |
The tax character of distributions paid was as follows:
December 31, 2007 | | | |
| Ordinary
Income | Long-term
Capital Gains | Total |
VIP Freedom Income | $ 623,460 | $ 57,167 | $ 680,627 |
VIP Freedom 2005 | 389,918 | 250,572 | 640,490 |
VIP Freedom 2010 | 3,554,163 | 1,485,441 | 5,039,604 |
VIP Freedom 2015 | 2,166,906 | 930,176 | 3,097,082 |
VIP Freedom 2020 | 5,419,053 | 2,614,989 | 8,034,042 |
VIP Freedom 2025 | 671,787 | 296,252 | 968,039 |
VIP Freedom 2030 | 2,172,376 | 1,185,106 | 3,357,482 |
| | | |
December 31, 2006 | | | |
| Ordinary
Income | Long-term
Capital Gains | Total |
VIP Freedom Income | $ 319,579 | $ 39,255 | $ 358,834 |
VIP Freedom 2005 | 242,373 | 22,170 | 264,543 |
VIP Freedom 2010 | 1,096,136 | 221,492 | 1,317,628 |
VIP Freedom 2015 | 435,471 | 196,602 | 632,073 |
VIP Freedom 2020 | 1,306,595 | 616,368 | 1,922,963 |
VIP Freedom 2025 | 173,672 | 104,377 | 278,049 |
VIP Freedom 2030 | 550,416 | 265,666 | 816,082 |
New Accounting Pronouncement. In September 2006, Statement of Financial Accounting Standards No. 157, Fair Value Measurements (SFAS 157), was issued and is effective for fiscal years beginning after November 15, 2007. SFAS 157 defines fair value, establishes a framework for measuring fair value and expands disclosures about fair value measurements. Management is currently evaluating the impact the adoption of SFAS 157 will have on the Funds' financial statement disclosures.
3. Operating Policies.
Repurchase Agreements. FMR has received an Exemptive Order from the Securities and Exchange Commission (the SEC) which permits certain Funds and other affiliated entities of FMR to transfer uninvested cash balances into joint trading accounts which are then invested in repurchase agreements. Certain Funds may also invest directly with institutions in repurchase agreements. Repurchase agreements are collateralized by government or non-government securities. Upon settlement date, collateral is held in segregated accounts with custodian banks and may be obtained in the
VIP Freedom Funds Portfolio
3. Operating Policies - continued
Repurchase Agreements - continued
event of a default of the counterparty. Each applicable Fund monitors, on a daily basis, the value of the collateral to ensure it is at least equal to the principal amount of the repurchase agreement (including accrued interest). In the event of a default by the counterparty, realization of the collateral proceeds could be delayed, during which time the value of the collateral may decline.
4. Purchases and Sales of Investments.
Purchases and redemptions of the Underlying Fund shares are noted in the table below.
| Purchases ($) | Redemptions ($) |
VIP Freedom Income | 10,897,240 | 7,747,034 |
VIP Freedom 2005 | 5,833,597 | 4,441,758 |
VIP Freedom 2010 | 61,101,521 | 18,860,644 |
VIP Freedom 2015 | 33,112,500 | 8,568,390 |
VIP Freedom 2020 | 102,133,272 | 15,643,365 |
VIP Freedom 2025 | 13,202,526 | 2,653,770 |
VIP Freedom 2030 | 35,220,205 | 8,150,990 |
5. Fees and Other Transactions with Affiliates.
Management Fee. Strategic Advisers, Inc. (Strategic Advisers), an affiliate of FMR, provides the Funds with investment management related services. The Funds do not pay any fees for these services.
Other Transactions. Strategic Advisers has entered into an administration agreement with FMR under which FMR provides management and administrative services (other than investment advisory services) necessary for the operation of each Fund. Pursuant to this agreement, FMR pays all expenses of each Fund, excluding the distribution and service fees, the compensation of the independent Trustees and certain other expenses such as interest expense. FMR also contracts with other Fidelity companies to perform the services necessary for the operation of each Fund. The Funds do not pay any fees for these services.
Distribution and Service Plan. In accordance with Rule 12b-1 of the 1940 Act, the Funds have adopted separate 12b-1 Plans for each Service Class of shares. Each Service Class pays Fidelity Distributors Corporation (FDC), an affiliate of FMR, a service fee. For the period, the service fee is based on an annual rate of .10% of Service Class' average net assets and .25% of Service Class 2's average net assets.
For the period, each class paid FDC the following amounts, all of which were reallowed to insurance companies for the distribution of shares and providing shareholder support services:
| Service
Class | Service
Class 2 | Total |
VIP Freedom Income | $ 406 | $ 6,905 | $ 7,311 |
VIP Freedom 2005 | 435 | 1,107 | 1,542 |
VIP Freedom 2010 | 12,962 | 130,658 | 143,620 |
VIP Freedom 2015 | 459 | 42,621 | 43,080 |
VIP Freedom 2020 | 14,102 | 218,533 | 232,635 |
VIP Freedom 2025 | 479 | 2,987 | 3,466 |
VIP Freedom 2030 | 8,629 | 48,118 | 56,747 |
6. Expense Reductions.
FMR voluntarily agreed to reimburse funds to the extent annual operating expenses exceeded certain levels of average net assets as noted in the table below. Total expenses for each class are limited to 0.00% of average net assets plus the distribution and service fees applicable to each class. Some expenses, for example interest expense, are excluded from this reimbursement.
The following classes of each applicable Fund were in reimbursement during the period:
| Expense
Limitations | Reimbursement
from adviser |
VIP Freedom Income | | |
Initial Class | 0% | $ 33 |
Service Class | .10% | 2 |
Service Class 2 | .25% | 12 |
Annual Report
Notes to Financial Statements - continued
6. Expense Reductions - continued
The following classes of each applicable Fund were in reimbursement during the period: - continued
| Expense
Limitations | Reimbursement
from adviser |
VIP Freedom 2005 | | |
Initial Class | 0% | $ 28 |
Service Class | .10% | 1 |
Service Class 2 | .25% | 1 |
VIP Freedom 2010 | | |
Initial Class | 0% | 73 |
Service Class | .10% | 53 |
Service Class 2 | .25% | 172 |
VIP Freedom 2015 | | |
Initial Class | 0% | 90 |
Service Class | .10% | 1 |
Service Class 2 | .25% | 66 |
VIP Freedom 2020 | | |
Initial Class | 0% | 77 |
Service Class | .10% | 49 |
Service Class 2 | .25% | 294 |
VIP Freedom 2025 | | |
Initial Class | 0% | 34 |
Service Class | .10% | 1 |
Service Class 2 | .25% | 9 |
VIP Freedom 2030 | | |
Initial Class | 0% | 63 |
Service Class | .10% | 34 |
Service Class 2 | .25% | 63 |
7. Other.
The Funds' organizational documents provide former and current trustees and officers with a limited indemnification against liabilities arising in connection with the performance of their duties to the Funds. In the normal course of business, the Funds may also enter into contracts that provide general indemnifications. The Funds' maximum exposure under these arrangements is unknown as this would be dependent on future claims that may be made against the Funds. The risk of material loss from such claims is considered remote.
The Funds do not invest in the Underlying Funds for the purpose of exercising management or control; however, investments by the Funds within their principal investment strategies may represent a significant portion of the Underlying Fund's net assets. At the end of the period, FMR or its affiliates and certain otherwise unaffiliated shareholders each were owners of record of more than 10% of the outstanding shares of the following funds:
| Affiliated % | Number of
Unaffiliated
Shareholders | Unaffiliated
Shareholders % |
VIP Freedom Income | 68% | 1 | 15% |
VIP Freedom 2005 | 98% | - | - |
VIP Freedom 2010 | 25% | 1 | 59% |
VIP Freedom 2015 | 56% | 1 | 34% |
VIP Freedom 2020 | 16% | 2 | 75% |
VIP Freedom 2025 | 73% | 1 | 12% |
VIP Freedom 2030 | 35% | 1 | 52% |
VIP Freedom Funds Portfolio
8. Distributions to Shareholders.
Distributions to shareholders of each class were as follows:
Years ended December 31, | 2007 | 2006 |
VIP Freedom Income | | |
From net investment income | | |
Initial Class | $ 389,472 | $ 269,889 |
Service Class | 15,761 | 10,880 |
Service Class 2 | 131,697 | 28,996 |
Total | $ 536,930 | $ 309,765 |
From net realized gain | | |
Initial Class | $ 105,776 | $ 42,500 |
Service Class | 4,392 | 1,766 |
Service Class 2 | 33,529 | 4,803 |
Total | $ 143,697 | $ 49,069 |
VIP Freedom 2005 | | |
From net investment income | | |
Initial Class | $ 251,310 | $ 207,132 |
Service Class | 11,833 | 10,517 |
Service Class 2 | 11,404 | 9,944 |
Total | $ 274,547 | $ 227,593 |
From net realized gain | | |
Initial Class | $ 331,682 | $ 33,434 |
Service Class | 16,986 | 1,759 |
Service Class 2 | 17,275 | 1,757 |
Total | $ 365,943 | $ 36,950 |
VIP Freedom 2010 | | |
From net investment income | | |
Initial Class | $ 656,116 | $ 353,057 |
Service Class | 445,976 | 98,166 |
Service Class 2 | 1,382,034 | 589,540 |
Total | $ 2,484,126 | $ 1,040,763 |
From net realized gain | | |
Initial Class | $ 670,107 | $ 88,708 |
Service Class | 394,049 | 25,301 |
Service Class 2 | 1,491,322 | 162,856 |
Total | $ 2,555,478 | $ 276,865 |
VIP Freedom 2015 | | |
From net investment income | | |
Initial Class | $ 919,677 | $ 271,006 |
Service Class | 12,891 | 4,502 |
Service Class 2 | 595,960 | 103,791 |
Total | $ 1,528,528 | $ 379,299 |
From net realized gain | | |
Initial Class | $ 938,900 | $ 175,471 |
Service Class | 13,956 | 3,166 |
Service Class 2 | 615,698 | 74,137 |
Total | $ 1,568,554 | $ 252,774 |
VIP Freedom 2020 | | |
From net investment income | | |
Initial Class | $ 652,197 | $ 316,990 |
Service Class | 399,422 | 94,245 |
Service Class 2 | 2,255,779 | 758,389 |
Total | $ 3,307,398 | $ 1,169,624 |
From net realized gain | | |
Initial Class | $ 924,317 | $ 189,505 |
Service Class | 520,253 | 58,242 |
Service Class 2 | 3,282,074 | 505,592 |
Total | $ 4,726,644 | $ 753,339 |
Annual Report
Notes to Financial Statements - continued
8. Distributions to Shareholders - continued
Distributions to shareholders of each class were as follows: - continued
Years ended December 31, | 2007 | 2006 |
VIP Freedom 2025 | | |
From net investment income | | |
Initial Class | $ 306,188 | $ 136,529 |
Service Class | 9,470 | 6,790 |
Service Class 2 | 77,171 | 7,987 |
Total | $ 392,829 | $ 151,306 |
From net realized gain | | |
Initial Class | $ 464,560 | $ 113,219 |
Service Class | 17,406 | 5,981 |
Service Class 2 | 93,244 | 7,543 |
Total | $ 575,210 | $ 126,743 |
VIP Freedom 2030 | | |
From net investment income | | |
Initial Class | $ 488,612 | $ 210,649 |
Service Class | 255,840 | 54,452 |
Service Class 2 | 450,023 | 205,614 |
Total | $ 1,194,475 | $ 470,715 |
From net realized gain | | |
Initial Class | $ 856,913 | $ 145,662 |
Service Class | 417,687 | 38,682 |
Service Class 2 | 888,407 | 161,023 |
Total | $ 2,163,007 | $ 345,367 |
9. Share Transactions.
Transactions for each class of shares were as follows:
| Shares | Dollars |
Years ended December 31, | 2007 | 2006 | 2007 | 2006 |
VIP Freedom Income | | | | |
Initial Class | | | | |
Shares sold | 685,787 | 628,341 | $ 7,557,523 | $ 6,697,181 |
Reinvestment of distributions | 45,868 | 29,149 | 495,249 | 312,388 |
Shares redeemed | (680,725) | (354,600) | (7,558,034) | (3,763,363) |
Net increase (decrease) | 50,930 | 302,890 | $ 494,738 | $ 3,246,206 |
Service Class | | | | |
Reinvestment of distributions | 1,867 | 1,180 | $ 20,153 | $ 12,646 |
Net increase (decrease) | 1,867 | 1,180 | $ 20,153 | $ 12,646 |
Service Class 2 | | | | |
Shares sold | 255,437 | 77,795 | $ 2,785,548 | $ 837,357 |
Reinvestment of distributions | 15,330 | 3,159 | 165,225 | 33,799 |
Shares redeemed | (37,092) | (17,023) | (408,034) | (178,812) |
Net increase (decrease) | 233,675 | 63,931 | $ 2,542,739 | $ 692,344 |
VIP Freedom 2005 | | | | |
Initial Class | | | | |
Shares sold | 398,715 | 512,176 | $ 4,787,205 | $ 5,650,369 |
Reinvestment of distributions | 50,295 | 21,052 | 582,992 | 240,567 |
Shares redeemed | (344,897) | (335,528) | (4,068,626) | (3,714,256) |
Net increase (decrease) | 104,113 | 197,700 | $ 1,301,571 | $ 2,176,680 |
Service Class | | | | |
Reinvestment of distributions | 2,487 | 1,074 | $ 28,820 | $ 12,275 |
Net increase (decrease) | 2,487 | 1,074 | $ 28,820 | $ 12,275 |
Service Class 2 | | | | |
Shares sold | 726 | - | $ 8,434 | $ - |
Reinvestment of distributions | 2,477 | 1,024 | 28,679 | 11,701 |
Shares redeemed | (16) | - | (187) | - |
Net increase (decrease) | 3,187 | 1,024 | $ 36,926 | $ 11,701 |
VIP Freedom Funds Portfolio
9. Share Transactions - continued
Transactions for each class of shares were as follows: - continued
| Shares | Dollars |
Years ended December 31, | 2007 | 2006 | 2007 | 2006 |
VIP Freedom 2010 | | | | |
Initial Class | | | | |
Shares sold | 828,873 | 1,085,640 | $ 10,012,337 | $ 12,091,220 |
Reinvestment of distributions | 111,133 | 38,083 | 1,326,223 | 441,765 |
Shares redeemed | (525,621) | (550,105) | (6,297,794) | (6,137,550) |
Net increase (decrease) | 414,385 | 573,618 | $ 5,040,766 | $ 6,395,435 |
Service Class | | | | |
Shares sold | 1,541,928 | 461,171 | $ 18,694,544 | $ 5,186,749 |
Reinvestment of distributions | 70,366 | 10,644 | 840,025 | 123,467 |
Shares redeemed | (514,426) | (25,858) | (6,273,125) | (288,627) |
Net increase (decrease) | 1,097,868 | 445,957 | $ 13,261,444 | $ 5,021,589 |
Service Class 2 | | | | |
Shares sold | 2,466,070 | 2,611,488 | $ 29,558,142 | $ 29,083,720 |
Reinvestment of distributions | 241,528 | 65,030 | 2,873,356 | 752,397 |
Shares redeemed | (810,681) | (232,684) | (9,812,717) | (2,589,520) |
Net increase (decrease) | 1,896,917 | 2,443,834 | $ 22,618,781 | $ 27,246,597 |
VIP Freedom 2015 | | | | |
Initial Class | | | | |
Shares sold | 1,246,967 | 1,063,240 | $ 15,630,773 | $ 12,155,808 |
Reinvestment of distributions | 151,849 | 37,362 | 1,858,577 | 446,476 |
Shares redeemed | (639,202) | (384,997) | (8,014,311) | (4,436,992) |
Net increase (decrease) | 759,614 | 715,605 | $ 9,475,039 | $ 8,165,292 |
Service Class | | | | |
Shares sold | 810 | - | $ 10,000 | $ - |
Reinvestment of distributions | 2,195 | 642 | 26,847 | 7,668 |
Net increase (decrease) | 3,005 | 642 | $ 36,847 | $ 7,668 |
Service Class 2 | | | | |
Shares sold | 1,142,941 | 825,508 | $ 14,217,661 | $ 9,476,778 |
Reinvestment of distributions | 99,078 | 14,914 | 1,211,658 | 177,928 |
Shares redeemed | (82,606) | (61,528) | (1,035,080) | (696,575) |
Net increase (decrease) | 1,159,413 | 778,894 | $ 14,394,239 | $ 8,958,131 |
VIP Freedom 2020 | | | | |
Initial Class | | | | |
Shares sold | 1,051,777 | 858,421 | $ 13,569,797 | $ 9,934,015 |
Reinvestment of distributions | 125,271 | 41,756 | 1,576,514 | 506,495 |
Shares redeemed | (450,780) | (588,301) | (5,731,905) | (6,802,896) |
Net increase (decrease) | 726,268 | 311,876 | $ 9,414,406 | $ 3,637,614 |
Service Class | | | | |
Shares sold | 1,195,293 | 411,929 | $ 15,239,157 | $ 4,798,643 |
Reinvestment of distributions | 72,983 | 12,581 | 919,675 | 152,487 |
Shares redeemed | (234,570) | (25,736) | (3,023,931) | (305,071) |
Net increase (decrease) | 1,033,706 | 398,774 | $ 13,134,901 | $ 4,646,059 |
Service Class 2 | | | | |
Shares sold | 4,990,327 | 3,353,614 | $ 63,745,796 | $ 38,778,034 |
Reinvestment of distributions | 440,649 | 104,461 | 5,537,853 | 1,263,981 |
Shares redeemed | (656,261) | (238,340) | (8,395,395) | (2,819,652) |
Net increase (decrease) | 4,774,715 | 3,219,735 | $ 60,888,254 | $ 37,222,363 |
VIP Freedom 2025 | | | | |
Initial Class | | | | |
Shares sold | 622,753 | 508,046 | $ 8,070,203 | $ 5,956,062 |
Reinvestment of distributions | 60,941 | 20,454 | 770,748 | 249,748 |
Shares redeemed | (174,322) | (274,265) | (2,213,504) | (3,281,077) |
Net increase (decrease) | 509,372 | 254,235 | $ 6,627,447 | $ 2,924,733 |
Annual Report
Notes to Financial Statements - continued
9. Share Transactions - continued
Transactions for each class of shares were as follows: - continued
| Shares | Dollars |
Years ended December 31, | 2007 | 2006 | 2007 | 2006 |
VIP Freedom 2025 - continued | | | | |
Service Class | | | | |
Shares sold | 788 | - | $ 10,000 | $ - |
Reinvestment of distributions | 2,131 | 1,047 | 26,876 | 12,771 |
Net increase (decrease) | 2,919 | 1,047 | $ 36,876 | $ 12,771 |
Service Class 2 | | | | |
Shares sold | 265,377 | 9,336 | $ 3,480,937 | $ 114,122 |
Reinvestment of distributions | 13,434 | 1,273 | 170,415 | 15,530 |
Shares redeemed | (9,100) | (112) | (117,320) | (1,375) |
Net increase (decrease) | 269,711 | 10,497 | $ 3,534,032 | $ 128,277 |
VIP Freedom 2030 | | | | |
Initial Class | | | | |
Shares sold | 996,989 | 710,684 | $ 13,223,488 | $ 8,499,790 |
Reinvestment of distributions | 103,604 | 28,573 | 1,345,525 | 356,311 |
Shares redeemed | (424,689) | (323,491) | (5,631,778) | (3,808,183) |
Net increase (decrease) | 675,904 | 415,766 | $ 8,937,235 | $ 5,047,918 |
Service Class | | | | |
Shares sold | 734,873 | 235,504 | $ 9,669,259 | $ 2,842,204 |
Reinvestment of distributions | 51,784 | 7,469 | 673,527 | 93,133 |
Shares redeemed | (107,374) | (17,091) | (1,424,042) | (204,059) |
Net increase (decrease) | 679,283 | 225,882 | $ 8,918,744 | $ 2,731,278 |
Service Class 2 | | | | |
Shares sold | 711,415 | 819,368 | $ 9,456,604 | $ 9,707,801 |
Reinvestment of distributions | 103,352 | 29,449 | 1,338,430 | 366,637 |
Shares redeemed | (226,223) | (235,970) | (2,985,052) | (2,778,153) |
Net increase (decrease) | 588,544 | 612,847 | $ 7,809,982 | $ 7,296,285 |
VIP Freedom Funds Portfolio
Report of Independent Registered Public Accounting Firm
To the Trustees of Variable Insurance Products Fund V and the Shareholders of VIP Freedom Income Portfolio, VIP Freedom 2005 Portfolio, VIP Freedom 2010 Portfolio, VIP Freedom 2015 Portfolio, VIP Freedom 2020 Portfolio, VIP Freedom 2025 Portfolio, and VIP Freedom 2030 Portfolio:
We have audited the accompanying statements of assets and liabilities of VIP Freedom Income Portfolio, VIP Freedom 2005 Portfolio, VIP Freedom 2010 Portfolio, VIP Freedom 2015 Portfolio, VIP Freedom 2020 Portfolio, VIP Freedom 2025 Portfolio, and VIP Freedom 2030 Portfolio (the Funds), each a fund of the Variable Insurance Products Fund V (formerly of Variable Insurance Products Fund IV), including the schedules of investments, as of December 31, 2007, and the related statements of operations for the year then ended, the statements of changes in net assets for each of the two years in the period then ended, and the financial highlights for each of the three years in the period then ended. These financial statements and financial highlights are the responsibility of the Funds' management. Our responsibility is to express an opinion on these financial statements and financial highlights based on our audits.
We conducted our audits in accordance with standards of the Public Company Accounting Oversight Board (United States). Those standards require that we plan and perform the audit to obtain reasonable assurance about whether the financial statements and financial highlights are free of material misstatement. The Funds are not required to have, nor were we engaged to perform, an audit of its internal control over financial reporting. Our audits included consideration of internal control over financial reporting as a basis for designing audit procedures that are appropriate in the circumstances, but not for the purpose of expressing an opinion on the effectiveness of the Funds' internal control over financial reporting. Accordingly, we express no such opinion. An audit also includes examining, on a test basis, evidence supporting the amounts and disclosures in the financial statements, assessing the accounting principles used and significant estimates made by management, as well as evaluating the overall financial statement presentation. Our procedures included confirmation of securities owned as of December 31, 2007, by correspondence with the custodians. We believe that our audits provide a reasonable basis for our opinion.
In our opinion, the financial statements and financial highlights referred to above present fairly, in all material respects, the financial positions of VIP Freedom Income Portfolio, VIP Freedom 2005 Portfoio, VIP Freedom 2010 Portfolio, VIP Freedom 2015 Portfolio, VIP Freedom 2020 Portfolio, VIP Freedom 2025 Portfolio, and VIP Freedom 2030 Portfolio as of December 31, 2007, the results of their operations for the year then ended, the changes in their net assets for each of the two years in the period then ended, and their financial highlights for each of the three years in the period then ended, in conformity with accounting principles generally accepted in the United States of America.
/s/ Deloitte & Touche LLP
DELOITTE & TOUCHE LLP
Boston, Massachusetts
February 28, 2008
Annual Report
Trustees and Officers
The Trustees, Members of the Advisory Board, and executive officers of the trust and funds, as applicable, are listed below. The Board of Trustees governs each fund and is responsible for protecting the interests of shareholders. The Trustees are experienced executives who meet periodically throughout the year to oversee each fund's activities, review contractual arrangements with companies that provide services to each fund, and review each fund's performance. If the interests of a fund and an underlying Fidelity fund were to diverge, a conflict of interest could arise and affect how the Trustees and Members of the Advisory Board fulfill their fiduciary duties to the affected funds. Strategic Advisers has structured the funds to avoid these potential conflicts, although there may be situations where a conflict of interest is unavoidable. In such instances, Strategic Advisers, the Trustees, and Members of the Advisory Board would take reasonable steps to minimize and, if possible, eliminate the conflict. Except for James C. Curvey, each of the Trustees oversees 373 funds advised by FMR or an affiliate. Mr. Curvey oversees 368 funds advised by FMR or an affiliate.
The Trustees hold office without limit in time except that (a) any Trustee may resign; (b) any Trustee may be removed by written instrument, signed by at least two-thirds of the number of Trustees prior to such removal; (c) any Trustee who requests to be retired or who has become incapacitated by illness or injury may be retired by written instrument signed by a majority of the other Trustees; and (d) any Trustee may be removed at any special meeting of shareholders by a two-thirds vote of the outstanding voting securities of the trust. Each Trustee who is not an interested person (as defined in the 1940 Act) (Independent Trustee), shall retire not later than the last day of the calendar year in which his or her 72nd birthday occurs. The Independent Trustees may waive this mandatory retirement age policy with respect to individual Trustees. The executive officers and Advisory Board Members hold office without limit in time, except that any officer and Advisory Board Member may resign or may be removed by a vote of a majority of the Trustees at any regular meeting or any special meeting of the Trustees. Except as indicated, each individual has held the office shown or other offices in the same company for the past five years.
The fund's Statement of Additional Information (SAI) includes more information about the Trustees. To request a free copy, call Fidelity at 1-877-208-0098.
Interested Trustees*:
Correspondence intended for each Trustee who is an interested person may be sent to Fidelity Investments, 82 Devonshire Street, Boston, Massachusetts 02109.
Name, Age; Principal Occupation |
Edward C. Johnson 3d (77) |
| Year of Election or Appointment: 1989 Mr. Johnson is Chairman of the Board of Trustees. Mr. Johnson serves as President (2006-present), Chief Executive Officer, Chairman, and a Director of FMR LLC; Chairman and a Director of FMR; Chairman and a Director of Fidelity Research & Analysis Company (FRAC); Chairman and a Director of Fidelity Investments Money Management, Inc.; and Chairman (2001-present) and a Director of FMR Co., Inc. In addition, Mr. Johnson serves as Chairman and Director of Fidelity International Limited (FIL). Mr. Edward C. Johnson 3d and Mr. Arthur E. Johnson are not related. |
James C. Curvey (72) |
| Year of Election or Appointment: 2007 Mr. Curvey also serves as Trustee (2007-present) or Member of the Advisory Board (2007-present) of other investment companies advised by FMR. Mr. Curvey is a Director of FMR and FMR Co., Inc. (2007-present). Mr. Curvey is also Vice Chairman (2006-present) and Director of FMR LLC. Mr. Curvey joined Fidelity in 1982 and served in numerous senior management positions, including President and Chief Operating Officer of FMR LLC (1997-2000) and President of Fidelity Strategic Investments (2000-2002). In addition, he serves as a member of the Board of Directors of Geerlings & Wade, Inc. (wine distribution). |
* Trustees have been determined to be "Interested Trustees" by virtue of, among other things, their affiliation with the trust or various entities under common control with FMR. FMR Corp. merged with and into FMR LLC on October 1, 2007. Any references to FMR LLC for prior periods are deemed to be references to the prior entity.
Independent Trustees:
Correspondence intended for each Independent Trustee (that is, the Trustees other than the Interested Trustees) may be sent to Fidelity Investments, P.O. Box 55235, Boston, Massachusetts 02205-5235.
Name, Age; Principal Occupation |
Dennis J. Dirks (59) |
| Year of Election or Appointment: 2007 Prior to his retirement in May 2003, Mr. Dirks was Chief Operating Officer and a member of the Board of The Depository Trust & Clearing Corporation (DTCC) (1999-2003). He also served as President, Chief Operating Officer, and Board member of The Depository Trust Company (DTC) (1999-2003) and President and Board member of the National Securities Clearing Corporation (NSCC) (1999-2003). In addition, Mr. Dirks served as Chief Executive Officer and Board member of the Government Securities Clearing Corporation (2001-2003) and Chief Executive Officer and Board member of the Mortgage-Backed Securities Clearing Corporation (2001-2003). Mr. Dirks also serves as a Trustee and a member of the Finance Committee of Manhattan College (2005-present) and a Trustee and a member of the Finance Committee of AHRC of Nassau County (2006-present). |
Albert R. Gamper, Jr. (65) |
| Year of Election or Appointment: 2007 Prior to his retirement in December 2004, Mr. Gamper served as Chairman of the Board of CIT Group Inc. (commercial finance). During his tenure with CIT Group Inc. Mr. Gamper served in numerous senior management positions, including Chairman (1987-1989; 1999-2001; 2002-2004), Chief Executive Officer (1987-2004), and President (1989-2002). He currently serves as a member of the Board of Directors of Public Service Enterprise Group (utilities, 2001-present), Chairman of the Board of Governors, Rutgers University (2004-present), and Chairman of the Board of Saint Barnabas Health Care System. |
George H. Heilmeier (71) |
| Year of Election or Appointment: 2004 Dr. Heilmeier is Chairman Emeritus of Telcordia Technologies (communication software and systems), where prior to his retirement, he served as company Chairman and Chief Executive Officer. He currently serves on the Boards of Directors of The Mitre Corporation (systems engineering and information technology support for the government), and HRL Laboratories (private research and development, 2004-present). He is Chairman of the General Motors Science & Technology Advisory Board and a Life Fellow of the Institute of Electrical and Electronics Engineers (IEEE). Dr. Heilmeier is a member of the Defense Science Board and the National Security Agency Advisory Board. He is also a member of the National Academy of Engineering, the American Academy of Arts and Sciences, and the Board of Overseers of the School of Engineering and Applied Science of the University of Pennsylvania. Previously, Dr. Heilmeier served as a Director of TRW Inc. (automotive, space, defense, and information technology, 1992-2002), Compaq (1994-2002), Automatic Data Processing, Inc. (ADP) (technology-based business outsourcing, 1995-2002), INET Technologies Inc. (telecommunications network surveillance, 2001-2004), and Teletech Holdings (customer management services). He is the recipient of the 2005 Kyoto Prize in Advanced Technology for his invention of the liquid crystal display, and a member of the Consumer Electronics Hall of Fame. |
James H. Keyes (67) |
| Year of Election or Appointment: 2007 Prior to his retirement in 2003, Mr. Keyes was Chairman, President, and Chief Executive Officer of Johnson Controls, Inc. (automotive supplier, 1993-2003). He currently serves as a member of the boards of LSI Logic Corporation (semiconductor technologies), Navistar International Corporation (manufacture and sale of trucks, buses, and diesel engines, 2002-present), and Pitney Bowes, Inc. (integrated mail, messaging, and document management solutions). |
Marie L. Knowles (61) |
| Year of Election or Appointment: 2007 Prior to Ms. Knowles' retirement in June 2000, she served as Executive Vice President and Chief Financial Officer of Atlantic Richfield Company (ARCO) (diversified energy, 1996-2000). From 1993 to 1996, she was a Senior Vice President of ARCO and President of ARCO Transportation Company. She served as a Director of ARCO from 1996 to 1998. She currently serves as a Director of Phelps Dodge Corporation (copper mining and manufacturing) and McKesson Corporation (healthcare service, 2002-present). Ms. Knowles is a Trustee of the Brookings Institution and the Catalina Island Conservancy and also serves as a member of the Advisory Board for the School of Engineering of the University of Southern California. |
Ned C. Lautenbach (63) |
| Year of Election or Appointment: 2000 Mr. Lautenbach is Chairman of the Independent Trustees (2006-present). Mr. Lautenbach has been a partner of Clayton, Dubilier & Rice, Inc. (private equity investment firm) since September 1998. Previously, Mr. Lautenbach was with the International Business Machines Corporation (IBM) from 1968 until his retirement in 1998. Mr. Lautenbach serves as a Director of Sony Corporation (2006-present) and Eaton Corporation (diversified industrial) as well as the Philharmonic Center for the Arts in Naples, Florida. He also is a member of the Board of Trustees of Fairfield University (2005-present), as well as a member of the Council on Foreign Relations. |
Cornelia M. Small (63) |
| Year of Election or Appointment: 2005 Ms. Small is a member (2000-present) and Chairperson (2002-present) of the Investment Committee, and a member (2002-present) of the Board of Trustees of Smith College. Previously, she served as Chief Investment Officer (1999-2000), Director of Global Equity Investments (1996-1999), and a member of the Board of Directors of Scudder, Stevens & Clark (1990-1997) and Scudder Kemper Investments (1997-1999). In addition, Ms. Small served as Co-Chair (2000-2003) of the Annual Fund for the Fletcher School of Law and Diplomacy. |
William S. Stavropoulos (68) |
| Year of Election or Appointment: 2001 Mr. Stavropoulos is Chairman Emeritus of the Board of Directors of The Dow Chemical Company. Since joining The Dow Chemical Company in 1967, Mr. Stavropoulos served in numerous senior management positions, including President (1993-2000; 2002-2003), CEO (1995-2000; 2002-2004), and Chairman of the Executive Committee (2000-2004). Currently, he is a Director of NCR Corporation (data warehousing and technology solutions), Chemical Financial Corporation, Maersk Inc. (industrial conglomerate, 2002-present), Tyco International, Inc. (multinational manufacturing and services, 2007-present), and a member of the Advisory Board for Metalmark Capital (private equity investment firm, 2005-present). He is a special advisor to Clayton, Dubilier & Rice, Inc., a private equity investment firm. He also serves as a member of the Board of Trustees of the American Enterprise Institute for Public Policy Research. In addition, Mr. Stavropoulos is a member of The Business Council, J.P. Morgan International Council and the University of Notre Dame Advisory Council for the College of Science. |
Kenneth L. Wolfe (68) |
| Year of Election or Appointment: 2007 Mr. Wolfe is Chairman and a Director of Hershey Foods Corporation (2007-present), where prior to his retirement in 2001, he was Chairman and Chief Executive Officer. Mr. Wolfe currently serves as a member of the board of Revlon Inc. (2004-present). Previously, Mr. Wolfe served as a member of the boards of Adelphia Communications Corporation (2003-2006) and Bausch & Lomb, Inc. (1993-2007). |
Advisory Board Members and Executive Officers**:
Correspondence intended for Mr. Mauriello, Mr. Thomas, Mr. Wiley, Mr. Lacy, and Mr. Arthur Johnson may be sent to Fidelity Investments, P.O. Box 55235, Boston, Massachusetts 02205-5235. Correspondence intended for each executive officer and Mr. Lynch may be sent to Fidelity Investments, 82 Devonshire Street, Boston, Massachusetts 02109.
Name, Age; Principal Occupation |
Arthur E. Johnson (60) |
| Year of Election or Appointment: 2008 Member of the Advisory Board of Variable Insurance Products Fund V. Mr. Johnson serves as Senior Vice President of Corporate Strategic Development of Lockheed Martin Corporation (defense contractor). In addition, Mr. Johnson serves as a member of the Board of Directors of AGL Resources, Inc. (holding company, 2002-present), and IKON Office Solutions, Inc. (document management systems and services). Mr. Arthur E. Johnson and Mr. Edward C. Johnson 3d are not related. |
Alan J. Lacy (54) |
| Year of Election or Appointment: 2008 Member of the Advisory Board of Variable Insurance Products Fund V. Mr. Lacy serves as Senior Adviser (2007-present) of Oak Hill Capital Partners, L.P. (a private equity firm). Mr. Lacy also served as Vice Chairman and Chief Executive Officer of Sears Holdings Corporation and Sears, Roebuck and Co. (retail, 2005-2006; 2000-2005). In addition, Mr. Lacy serves as a member of the Board of Directors of The Western Union Company (global money transfer, 2006-present) and Bristol-Myers Squibb (global pharmaceuticals, 2007-present). Mr. Lacy is a Trustee of the National Parks Conservation Association and The Field Museum of Natural History. |
Peter S. Lynch (63) |
| Year of Election or Appointment: 2003 Member of the Advisory Board of Variable Insurance Products Fund V. Mr. Lynch is Vice Chairman and a Director of FMR, and Vice Chairman (2001-present) and a Director of FMR Co., Inc. Previously, Mr. Lynch served as a Trustee of the Fidelity funds (1990-2003). In addition, he serves as a Trustee of Boston College and as the Chairman of the Inner-City Scholarship Fund. |
Joseph Mauriello (63) |
| Year of Election or Appointment: 2007 Member of the Advisory Board of Variable Insurance Products Fund V. Prior to his retirement in January 2006, Mr. Mauriello served in numerous senior management positions including Deputy Chairman and Chief Operating Officer (2004-2005), and Vice Chairman of Financial Services (2002-2004) of KPMG LLP US (professional services firm, 1965-2005). Mr. Mauriello currently serves as a member of the Board of Directors of XL Capital Ltd. (global insurance and re-insurance company, 2006-present) and of Arcadia Resources Inc. (health care services and products, 2007-present). He also served as a Director of the Hamilton Funds of the Bank of New York (2006-2007). |
David M. Thomas (58) |
| Year of Election or Appointment: 2007 Member of the Advisory Board of Variable Insurance Products Fund V. Previously, Mr. Thomas served as Executive Chairman (2005-2006) and Chairman and Chief Executive Officer (2000-2005) of IMS Health, Inc. (pharmaceutical and healthcare information solutions). In addition, Mr. Thomas serves as a member of the Board of Directors of Fortune Brands, Inc. (consumer products holding company), and Interpublic Group of Companies, Inc. (marketing communication, 2004-present). |
Michael E. Wiley (57) |
| Year of Election or Appointment: 2007 Member of the Advisory Board of Variable Insurance Products Fund V. Mr. Wiley also serves as a member of the Board of Trustees of the University of Tulsa (2000-2006; 2007-present). He serves as a Director of Tesoro Corporation (independent oil refiner and marketer, 2005-present), and a Director of Bill Barrett Corporation (exploration and production company, 2005-present). In addition, he also serves as a Director of Post Oak Bank (privately-held bank, 2004-present). Previously, Mr. Wiley served as a Sr. Energy Advisor of Katzenbach Partners, LLC (consulting firm, 2006-2007), as an Advisory Director of Riverstone Holdings (private investment firm), Chairman, President, and CEO of Baker Hughes, Inc. (oilfield services company, 2000-2004), and as Director of Spinnaker Exploration Company (exploration and production company, 2001-2005). |
Kimberley H. Monasterio (44) |
| Year of Election or Appointment: 2007 President and Treasurer of VIP Freedom Income, VIP Freedom 2005, VIP Freedom 2010, VIP Freedom 2015, VIP Freedom 2020, VIP Freedom 2025, and VIP Freedom 2030. Ms. Monasterio also serves as President and Treasurer of other Fidelity funds (2007-present) and is an employee of FMR (2004-present). Previously, Ms. Monasterio served as Deputy Treasurer of the Fidelity funds (2004-2006). Before joining Fidelity Investments, Ms. Monasterio served as Treasurer (2000-2004) and Chief Financial Officer (2002-2004) of the Franklin Templeton Funds and Senior Vice President of Franklin Templeton Services, LLC (2000-2004). |
Ren Y. Cheng (50) |
| Year of Election or Appointment: 2007 Vice President of VIP Freedom Income, VIP Freedom 2005, VIP Freedom 2010, VIP Freedom 2015, VIP Freedom 2020, VIP Freedom 2025, and VIP Freedom 2030. Mr. Cheng also serves as Vice President of certain Asset Allocation Funds (2007-present). Mr. Cheng is Chief Investment Officer of the Global Asset Allocation group (2007-present). Mr. Cheng also serves as Vice President of FMR and FMR Co., Inc. Mr. Cheng served as Managing Director of the Global Asset Allocation group (2005-2007). Previously, Mr. Cheng served as a portfolio manager for the Fidelity Freedom Funds. |
Boyce I. Greer (51) |
| Year of Election or Appointment: 2005 Vice President of VIP Freedom Income, VIP Freedom 2005, VIP Freedom 2010, VIP Freedom 2015, VIP Freedom 2020, VIP Freedom 2025, and VIP Freedom 2030. Mr. Greer also serves as Vice President of certain Asset Allocation Funds (2005-present), Fixed-Income Funds (2006-present), and Money Market Funds (2006-present). Mr. Greer is also a Trustee of other investment companies advised by FMR (2003-present). Mr. Greer is an Executive Vice President of FMR (2005-present) and FMR Co., Inc. (2005-present), and Senior Vice President of Fidelity Investments Money Management, Inc. (2006-present). Previously, Mr. Greer served as Vice President of certain Fidelity Equity Funds (2005-2007), a Director and Managing Director of Strategic Advisers, Inc. (2002-2005), and Executive Vice President (2000-2002) and Money Market Group Leader (1997-2002) of the Fidelity Investments Fixed Income Division. Mr. Greer also served as Vice President of Fidelity's Money Market Funds (1997-2002), Senior Vice President of FMR (1997-2002), and Vice President of FIMM (1998-2002). |
Eric D. Roiter (59) |
| Year of Election or Appointment: 2005 Secretary of VIP Freedom Income, VIP Freedom 2005, VIP Freedom 2010, VIP Freedom 2015, VIP Freedom 2020, VIP Freedom 2025, and VIP Freedom 2030. He also serves as Secretary of other Fidelity funds; Vice President, General Counsel, and Secretary of FMR Co., Inc. (2001-present) and FMR; Assistant Secretary of Fidelity Management & Research (U.K.) Inc. (2001-present), Fidelity Research & Analysis Company (2001-present), and Fidelity Investments Money Management, Inc. (2001-present). Mr. Roiter is an Adjunct Member, Faculty of Law, at Boston College Law School (2003-present). Previously, Mr. Roiter served as Vice President and Secretary of Fidelity Distributors Corporation (FDC) (1998-2005). |
John B. McGinty, Jr. (45) |
| Year of Election or Appointment: 2008 Assistant Secretary of VIP Investor Freedom Income, VIP Investor Freedom 2005, VIP Investor Freedom 2010, VIP Investor Freedom 2015, VIP Investor Freedom 2020, VIP Investor Freedom 2025, VIP Investor Freedom 2030. Mr. McGinty also serves as Assistant Secretary of other Fidelity funds (2008-present) and is an employee of FMR LLC (2004-present). Mr. McGinty also serves as Senior Vice President, Secretary, and Chief Legal Officer of [Fidelity Distributors Corporation (FDC)/FDC] (2007-present). Before joining Fidelity Investments, Mr. McGinty practiced law at Ropes & Gray, LLP. |
R. Stephen Ganis (41) |
| Year of Election or Appointment: 2006 Anti-Money Laundering (AML) officer of VIP Freedom Income, VIP Freedom 2005, VIP Freedom 2010, VIP Freedom 2015, VIP Freedom 2020, VIP Freedom 2025, and VIP Freedom 2030. Mr. Ganis also serves as AML officer of other Fidelity funds (2006-present) and FMR LLC (2003-present). Before joining Fidelity Investments, Mr. Ganis practiced law at Goodwin Procter, LLP (2000-2002). |
Joseph B. Hollis (59) |
| Year of Election or Appointment: 2006 Chief Financial Officer of VIP Freedom Income, VIP Freedom 2005, VIP Freedom 2010, VIP Freedom 2015, VIP Freedom 2020, VIP Freedom 2025, and VIP Freedom 2030. Mr. Hollis also serves as Chief Financial Officer of other Fidelity funds. Mr. Hollis is President of Fidelity Pricing and Cash Management Services (FPCMS) (2005-present). Mr. Hollis also serves as President and Director of Fidelity Service Company, Inc. (2006-present). Previously, Mr. Hollis served as Senior Vice President of Cash Management Services (1999-2002) and Investment Management Operations (2002-2005). |
Kenneth A. Rathgeber (60) |
| Year of Election or Appointment: 2005 Chief Compliance Officer of VIP Freedom Income, VIP Freedom 2005, VIP Freedom 2010, VIP Freedom 2015, VIP Freedom 2020, VIP Freedom 2025, and VIP Freedom 2030. Mr. Rathgeber also serves as Chief Compliance Officer of other Fidelity funds (2004-present) and Executive Vice President of Risk Oversight for Fidelity Investments (2002-present). He is Chief Compliance Officer of FMR (2005-present), FMR Co., Inc. (2005-present), Fidelity Management & Research (U.K.) Inc. (2005-present), Fidelity Research & Analysis Company (2005-present), Fidelity Investments Money Management, Inc. (2005-present), and Strategic Advisers, Inc. (2005-present). Previously, Mr. Rathgeber served as Executive Vice President and Chief Operating Officer for Fidelity Investments Institutional Services Company, Inc. (1998-2002). |
Bryan A. Mehrmann (46) |
| Year of Election or Appointment: 2005 Deputy Treasurer of VIP Freedom Income, VIP Freedom 2005, VIP Freedom 2010, VIP Freedom 2015, VIP Freedom 2020, VIP Freedom 2025, and VIP Freedom 2030. Mr. Mehrmann also serves as Deputy Treasurer of other Fidelity funds (2005-present) and is an employee of FMR. Previously, Mr. Mehrmann served as Vice President of Fidelity Investments Institutional Services Group (FIIS)/Fidelity Investments Institutional Operations Corporation, Inc. (FIIOC) Client Services (1998-2004). |
Kenneth B. Robins (38) |
| Year of Election or Appointment: 2005 Deputy Treasurer of VIP Freedom Income, VIP Freedom 2005, VIP Freedom 2010, VIP Freedom 2015, VIP Freedom 2020, VIP Freedom 2025, and VIP Freedom 2030. Mr. Robins also serves as Deputy Treasurer of other Fidelity funds (2005-present) and is an employee of FMR (2004-present). Before joining Fidelity Investments, Mr. Robins worked at KPMG LLP, where he was a partner in KPMG's department of professional practice (2002-2004) and a Senior Manager (1999-2000). In addition, Mr. Robins served as Assistant Chief Accountant, United States Securities and Exchange Commission (2000-2002). |
Robert G. Byrnes (41) |
| Year of Election or Appointment: 2005 Assistant Treasurer of VIP Freedom Income, VIP Freedom 2005, VIP Freedom 2010, VIP Freedom 2015, VIP Freedom 2020, VIP Freedom 2025, and VIP Freedom 2030. Mr. Byrnes also serves as Assistant Treasurer of other Fidelity funds (2005-present) and is an employee of FMR (2005-present). Previously, Mr. Byrnes served as Vice President of FPCMS (2003-2005). Before joining Fidelity Investments, Mr. Byrnes worked at Deutsche Asset Management where he served as Vice President of the Investment Operations Group (2000-2003). |
Peter L. Lydecker (53) |
| Year of Election or Appointment: 2005 Assistant Treasurer of VIP Freedom Income, VIP Freedom 2005, VIP Freedom 2010, VIP Freedom 2015, VIP Freedom 2020, VIP Freedom 2025, and VIP Freedom 2030. Mr. Lydecker also serves as Assistant Treasurer of other Fidelity funds (2004) and is an employee of FMR. |
Paul M. Murphy (60) |
| Year of Election or Appointment: 2007 Assistant Treasurer of VIP Freedom Income, VIP Freedom 2005, VIP Freedom 2010, VIP Freedom 2015, VIP Freedom 2020, VIP Freedom 2025, and VIP Freedom 2030. Mr. Murphy also serves as Assistant Treasurer of other Fidelity funds (2007-present) and is an employee of FMR (2007-present). Previously, Mr. Murphy served as Chief Financial Officer of the Fidelity Funds (2005-2006), Vice President and Associate General Counsel of FMR (2007), and Senior Vice President of Fidelity Pricing and Cash Management Services Group (FPCMS) (1994-2007). |
Gary W. Ryan (49) |
| Year of Election or Appointment: 2005 Assistant Treasurer of VIP Freedom Income, VIP Freedom 2005, VIP Freedom 2010, VIP Freedom 2015, VIP Freedom 2020, VIP Freedom 2025, and VIP Freedom 2030. Mr. Ryan also serves as Assistant Treasurer of other Fidelity funds (2005-present) and is an employee of FMR (2005-present). Previously, Mr. Ryan served as Vice President of Fund Reporting in FPCMS (1999-2005). |
** FMR Corp. merged with and into FMR LLC on October 1, 2007. Any references to FMR LLC for prior periods are deemed to be references to the prior entity.
Annual Report
Distributions
The Board of Trustees of each fund voted to pay to shareholders of record at the opening of business on record date, the following distributions per share derived from capital gains realized from sales of portfolio securities and dividends derived from net investment income:
| Pay Date | Record Date | Dividends | Capital Gains |
VIP Freedom Income Portfolio | | | | |
Initial Class | 02/15/08 | 02/15/08 | $0.005 | $0.105 |
Service Class | 02/15/08 | 02/15/08 | $0.005 | $0.105 |
Service Class 2 | 02/15/08 | 02/15/08 | $0.005 | $0.105 |
VIP Freedom 2005 Portfolio | | | | |
Initial Class | 02/15/08 | 02/15/08 | $0.005 | $0.245 |
Service Class | 02/15/08 | 02/15/08 | $0.005 | $0.245 |
Service Class 2 | 02/15/08 | 02/15/08 | $0.005 | $0.245 |
VIP Freedom 2010 Portfolio | | | | |
Initial Class | 02/15/08 | 02/15/08 | $0.000 | $0.180 |
Service Class | 02/15/08 | 02/15/08 | $0.000 | $0.180 |
Service Class 2 | 02/15/08 | 02/15/08 | $0.000 | $0.180 |
VIP Freedom 2015 Portfolio | | | | |
Initial Class | 02/15/08 | 02/15/08 | $0.000 | $0.230 |
Service Class | 02/15/08 | 02/15/08 | $0.000 | $0.230 |
Service Class 2 | 02/15/08 | 02/15/08 | $0.000 | $0.230 |
VIP Freedom 2020 Portfolio | | | | |
Initial Class | 02/15/08 | 02/15/08 | $0.000 | $0.280 |
Service Class | 02/15/08 | 02/15/08 | $0.000 | $0.280 |
Service Class 2 | 02/15/08 | 02/15/08 | $0.000 | $0.280 |
VIP Freedom 2025 Portfolio | | | | |
Initial Class | 02/15/08 | 02/15/08 | $0.000 | $0.300 |
Service Class | 02/15/08 | 02/15/08 | $0.000 | $0.300 |
Service Class 2 | 02/15/08 | 02/15/08 | $0.000 | $0.300 |
VIP Freedom 2030 Portfolio | | | | |
Initial Class | 02/15/08 | 02/15/08 | $0.000 | $0.355 |
Service Class | 02/15/08 | 02/15/08 | $0.000 | $0.355 |
Service Class 2 | 02/15/08 | 02/15/08 | $0.000 | $0.355 |
The funds hereby designate as capital gain dividend the amounts noted below for the taxable year ended December 31, 2007, or, if subsequently determined to be different, the net capital gain of such year.
VIP Freedom Income Portfolio | $141,963 |
VIP Freedom 2005 Portfolio | $340,125 |
VIP Freedom 2010 Portfolio | $2,697,309 |
VIP Freedom 2015 Portfolio | $1,687,736 |
VIP Freedom 2020 Portfolio | $5,475,164 |
VIP Freedom 2025 Portfolio | $653,372 |
VIP Freedom 2030 Portfolio | $2,428,457 |
VIP Freedom Funds Portfolio
A percentage of the dividends distributed during the fiscal year for the following funds qualifies for the dividends-received deduction for corporate shareholders:
| February 2007 | December 2007 |
VIP Freedom Income Portfolio | | |
Initial Class | 3% | 5% |
Service Class | 3% | 5% |
Service Class 2 | 3% | 5% |
VIP Freedom 2005 Portfolio | | |
Initial Class | -% | 11% |
Service Class | -% | 11% |
Service Class 2 | -% | 12% |
VIP Freedom 2010 Portfolio | | |
Initial Class | 9% | 12% |
Service Class | 9% | 12% |
Service Class 2 | 9% | 13% |
VIP Freedom 2015 Portfolio | | |
Initial Class | -% | 13% |
Service Class | -% | 14% |
Service Class 2 | -% | 14% |
VIP Freedom 2020 Portfolio | | |
Initial Class | 8% | 16% |
Service Class | 8% | 16% |
Service Class 2 | 8% | 17% |
VIP Freedom 2025 Portfolio | | |
Initial Class | -% | 17% |
Service Class | -% | 17% |
Service Class 2 | -% | 17% |
VIP Freedom 2030 Portfolio | | |
Initial Class | -% | 18% |
Service Class | -% | 19% |
Service Class 2 | -% | 19% |
The funds will notify shareholders in January 2008 of amounts for use in preparing 2007 income tax returns.
Annual Report
Board Approval of Investment Advisory Contracts and Management Fees
VIP Freedom Funds
Each year, typically in July, the Board of Trustees, including the Independent Trustees (together, the Board), votes on the renewal of the management contract and administration agreement (together, the Advisory Contracts) for each fund. The Board, assisted by the advice of fund counsel and Independent Trustees' counsel, requests and considers a broad range of information throughout the year.
The Board meets regularly each month except August and takes into account throughout the year matters bearing on Advisory Contracts. The Board, acting directly and through its separate committees, considers at each of its meetings factors that are relevant to the annual renewal of each fund's Advisory Contracts, including the services and support provided to each fund and its shareholders. At the time of the renewal, the Board had 12 standing committees, each composed of Independent Trustees with varying backgrounds, to which the Board has assigned specific subject matter responsibilities in order to enhance effective decision-making by the Board. Each committee has adopted a written charter outlining the structure and purposes of the committee. One such committee, the Equity Contract Committee, meets periodically as needed throughout the year to consider matters specifically related to the annual renewal of Advisory Contracts. The committee requests and receives information on, and makes recommendations to the Independent Trustees concerning, the approval and annual review of the Advisory Contracts.
At its July 2007 meeting, the Board of Trustees, including the Independent Trustees, unanimously determined to renew the Advisory Contracts for each fund. In reaching its determination, the Board considered all factors it believed relevant and ultimately reached a determination, with the assistance of fund counsel and Independent Trustees' counsel, that the renewal of the Advisory Contracts and the compensation to be received by Fidelity under the management contracts is consistent with Fidelity's fiduciary duty under applicable law. In reaching its determination, the Board is aware that shareholders in each fund have a broad range of investment choices available to them, including a wide choice among mutual funds offered by competitors to Fidelity, and that each fund's shareholders, with the opportunity to review and weigh the disclosure provided by the fund in its prospectus and other public disclosures, have chosen to invest in that fund, managed by Fidelity.
Nature, Extent, and Quality of Services Provided. The Board considered staffing within the investment adviser, Strategic Advisers, Inc. (Strategic Advisers), and the administrator, FMR, including the backgrounds of the funds' portfolio managers and the funds' investment objectives and disciplines. The Independent Trustees also had discussions with senior management of Fidelity's investment operations and investment groups. The Board considered the structure of the portfolio manager compensation program and whether this structure provides appropriate incentives.
Resources Dedicated to Investment Management and Support Services. The Board reviewed the size, education, and experience of Strategic Advisers' investment staff, their use of technology, and Strategic Advisers' and FMR's approach to recruiting, training, and retaining portfolio managers and other research, advisory, and management personnel. The Board noted that Fidelity's analysts have access to a variety of technological tools that enable them to perform both fundamental and quantitative analysis and to specialize in various disciplines.
Shareholder and Administrative Services. The Board considered (i) the nature, extent, quality, and cost of advisory, administrative, distribution, and shareholder services performed by FMR and its affiliates under the Advisory Contracts and under separate agreements covering transfer agency, pricing and bookkeeping, and securities lending services for each fund; (ii) the nature and extent of FMR's supervision of third party service providers, principally custodians and subcustodians; and (iii) the resources devoted to, and the record of compliance with, each fund's compliance policies and procedures.
The Board noted that the growth of fund assets across the complex allows Fidelity to reinvest in the development of services designed to enhance the value or convenience of the Fidelity funds as investment vehicles. These services include 24-hour access to account information and market information through phone representatives and over the Internet, and investor education materials and asset allocation tools.
Investment in a Large Fund Family. The Board considered the benefits to shareholders of investing in a Fidelity fund, including the benefits of investing in a fund that is part of a large family of funds offering a variety of investment disciplines and providing for a large variety of mutual fund investor services. The Board noted that, since the last Advisory Contract renewals in July 2006, Fidelity has taken a number of actions that benefited particular funds, including (i) dedicating additional resources to investment research and to restructure the investment research teams; (ii) contractually agreeing to reduce the management fee on Fidelity Advisor Floating Rate High Income Fund; (iii) contractually agreeing to reduce the management fees on Fidelity's California, Massachusetts, New Jersey, and New York AMT Tax-Free Money Market Funds, launching new Institutional Classes and Service Classes of these funds, and contractually agreeing to impose expense limitations on these funds; (iv) eliminating the exchange fee on the Fidelity Select Portfolios and reducing the pricing and bookkeeping fee rates for these funds; (v) reducing the maximum transfer agency fee rates on high income funds and certain equity funds; (vi) proposing amended management contracts that, if approved by shareholders, will add a performance adjustment component to the management fees paid by 18 Fidelity Advisor equity funds; (vii) contractually agreeing to reduce fees for Ultra-Short Central Fund and the money market Central Funds; (viii) waiving the Fidelity Advisor funds' contingent deferred sales charge on certain redemptions made through systematic withdrawal programs; and (ix) amending the management contracts for equity and fixed-income funds whose management contracts incorporate a "group fee" structure by adding four new fee "breakpoints" to the group fee rate schedules.
Investment Performance and Compliance. The Board considered whether each fund has operated within its investment objective, as well as its record of compliance with its investment restrictions. It also reviewed each fund's absolute investment performance for each class, as well as each fund's relative investment performance for each class measured against a proprietary custom index. The Board noted that FMR does not believe that a meaningful peer group exists against which to compare any of the funds' performance. Because each fund had been in existence less than three calendar years, for each fund the following chart considered by the Board shows, for the one-year period ended December 31, 2006, the total returns of Initial Class and Service Class 2 of the fund and the total returns of a proprietary custom index ("benchmark"). The returns of Initial Class and Service Class 2 show the performance of the highest and lowest performing classes, respectively. For each fund, the proprietary custom index is an index developed by FMR that represents the performance of the fund's asset classes according to their respective weightings, (for each fund other than VIP Freedom Income Portfolio) adjusted on June 30 and December 31 of each calendar year to reflect the fund's increasingly conservative asset allocations.
VIP Freedom Funds Portfolio
VIP Freedom 2005 Portfolio
The Board stated that the relative investment performance of the fund was lower than its benchmark for the period shown. The Board considered that the variations in performance among the fund's classes reflect the variations in class expenses, which result in lower performance for higher expense classes. The Board stated that it is difficult to evaluate in any comprehensive fashion the performance of the fund, in light of its relatively recent commencement of operations.
VIP Freedom 2010 Portfolio
The Board stated that the relative investment performance of the fund was lower than its benchmark for the period shown. The Board considered that the variations in performance among the fund's classes reflect the variations in class expenses, which result in lower performance for higher expense classes. The Board stated that it is difficult to evaluate in any comprehensive fashion the performance of the fund, in light of its relatively recent commencement of operations.
Annual Report
Board Approval of Investment Advisory Contracts and Management Fees - continued
VIP Freedom 2015 Portfolio
The Board stated that the relative investment performance of the fund was lower than its benchmark for the period shown. The Board considered that the variations in performance among the fund's classes reflect the variations in class expenses, which result in lower performance for higher expense classes. The Board stated that it is difficult to evaluate in any comprehensive fashion the performance of the fund, in light of its relatively recent commencement of operations.
VIP Freedom 2020 Portfolio
The Board stated that the relative investment performance of the fund was lower than its benchmark for the period shown. The Board considered that the variations in performance among the fund's classes reflect the variations in class expenses, which result in lower performance for higher expense classes. The Board stated that it is difficult to evaluate in any comprehensive fashion the performance of the fund, in light of its relatively recent commencement of operations.
VIP Freedom Funds Portfolio
VIP Freedom 2025 Portfolio
The Board stated that the relative investment performance of the fund was lower than its benchmark for the period shown. The Board considered that the variations in performance among the fund's classes reflect the variations in class expenses, which result in lower performance for higher expense classes. The Board stated that it is difficult to evaluate in any comprehensive fashion the performance of the fund, in light of its relatively recent commencement of operations.
VIP Freedom 2030 Portfolio
The Board stated that the relative investment performance of the fund was lower than its benchmark for the period shown. The Board considered that the variations in performance among the fund's classes reflect the variations in class expenses, which result in lower performance for higher expense classes. The Board stated that it is difficult to evaluate in any comprehensive fashion the performance of the fund, in light of its relatively recent commencement of operations.
Annual Report
Board Approval of Investment Advisory Contracts and Management Fees - continued
VIP Freedom Income Portfolio
The Board stated that the relative investment performance of the fund was lower than its benchmark for the period shown. The Board considered that the variations in performance among the fund's classes reflect the variations in class expenses, which result in lower performance for higher expense classes. The Board stated that it is difficult to evaluate in any comprehensive fashion the performance of the fund, in light of its relatively recent commencement of operations.
The Board considered that FMR has taken steps to refocus and strengthen equity research, equity portfolio management, and compliance.
Based on its review, and giving particular weight to the nature and quality of the resources dedicated by Strategic Advisers and FMR to maintain and improve relative performance, the Board concluded that the nature, extent, and quality of the services provided to each fund will benefit each fund's shareholders, particularly in light of the Board's view that each fund's shareholders benefit from investing in a fund that is part of a large family of funds offering a variety of investment disciplines and services.
Competitiveness of Management Fee and Total Fund Expenses. The Board noted that the funds do not pay Strategic Advisers a management fee for investment advisory services. The Board considered each fund's management fee and total expenses compared to "mapped groups" of competitive funds and classes. Fidelity creates "mapped groups" by combining similar Lipper investment objective categories that have comparable management fee characteristics. Combining Lipper investment objective categories aids the Board's management fee and total expense comparisons by broadening the competitive group used for comparison and by reducing the number of universes to which various Fidelity funds are compared. The Board also considered supplemental information about how each fund's management fee and total expenses ranked relative to groups based on Lipper classifications, which take into account a fund's market capitalization and style.
The Board considered two proprietary management fee comparisons for the 12-month (or shorter) periods shown in the charts below. The group of Lipper funds used by the Board for management fee comparisons is referred to below as the "Total Mapped Group." The Total Mapped Group comparison focuses on a fund's standing relative to the total universe of comparable funds available to investors, in terms of gross management fees before expense reimbursements or caps. "TMG %" represents the percentage of funds in the Total Mapped Group that had management fees that were lower than a fund's. For example, a TMG % of 1% means that 99% of the funds in the Total Mapped Group had higher management fees than a fund. The "Asset-Size Peer Group" (ASPG) comparison focuses on a fund's standing relative to non-Fidelity funds similar in size to the fund within the Total Mapped Group. The ASPG represents at least 15% of the funds in the Total Mapped Group with comparable asset size and management fee characteristics, subject to a minimum of 50 funds (or all funds in the Total Mapped Group if fewer than 50). Additional information, such as the ASPG quartile in which a fund's management fee ranked, is also included in the charts and considered by the Board.
VIP Freedom Funds Portfolio
VIP Freedom 2005 Portfolio
VIP Freedom 2010 Portfolio
Annual Report
Board Approval of Investment Advisory Contracts and Management Fees - continued
VIP Freedom 2015 Portfolio
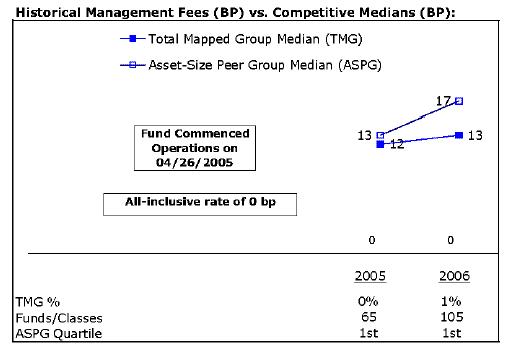
VIP Freedom 2020 Portfolio
VIP Freedom Funds Portfolio
VIP Freedom 2025 Portfolio
VIP Freedom 2030 Portfolio
Annual Report
Board Approval of Investment Advisory Contracts and Management Fees - continued
VIP Freedom Income Portfolio
The Board noted that each fund's management fee ranked below the median of its Total Mapped Group and below the median of its ASPG for 2006.
Based on its review, the Board concluded that each fund's management fee was fair and reasonable in light of the services that the fund receives and the other factors considered.
In its review of the total expenses of each class of each fund, the Board noted that each fund invests in Initial Class of the underlying fund to avoid charging fund-paid 12b-1 fees at both fund levels. The Board considered that the funds do not pay transfer agency fees. Instead, Initial Class of each underlying fund bears its pro rata portion of each fund's transfer agency fee according to the percentage of each fund's assets invested in that underlying fund. The Board further noted that FMR pays all other expenses of each fund, with limited exceptions.
The Board noted that the total expenses of each of Initial Class and Service Class of each fund ranked below its competitive median for 2006, and the total expenses of Service Class 2 of each fund ranked equal to its competitive median for 2006.
In its review of total expenses, the Board also considered Fidelity fee structures and other information on clients that FMR and its affiliates service in other competitive markets, such as other mutual funds advised or subadvised by FMR or its affiliates, pension plan clients, and other institutional clients.
Based on its review, the Board concluded that the total expenses of each class of each fund were reasonable in light of the services that the fund and its shareholders receive and the other factors considered.
Costs of the Services and Profitability. The Board considered the level of Fidelity's profits in respect of all the Fidelity funds, as well as the profitability of each underlying fund.
PricewaterhouseCoopers LLP (PwC), independent registered public accounting firm and auditor to Fidelity and certain Fidelity funds, has been engaged annually by the Board as part of the Board's assessment of the results of Fidelity's profitability analysis. PwC's engagement includes the review and assessment of Fidelity's methodologies used in determining the revenues and expenses attributable to Fidelity's mutual fund business, and completion of agreed-upon procedures surrounding the mathematical accuracy of fund profitability and its conformity to allocation methodologies. After considering PwC's reports issued under the engagement and information provided by Fidelity, the Board believes that while other allocation methods may also be reasonable, Fidelity's profitability methodologies are reasonable in all material respects.
The Board has also reviewed Fidelity's non-fund businesses and any fall-out benefits related to the mutual fund business as well as cases where Fidelity's affiliates may benefit from or be related to the funds' business.
The Board concluded that the costs of the services provided by and the profits realized by Fidelity in connection with the operation of each fund were not relevant to the renewal of each fund's Advisory Contracts because the funds do not pay management fees and FMR pays all other expenses of each fund, with limited exceptions.
Economies of Scale. The Board concluded that the realization of economies of scale was not relevant to the renewal of each fund's Advisory Contracts because the funds do not pay management fees and FMR pays all other expenses of each fund, with limited exceptions.
VIP Freedom Funds Portfolio
Additional Information Requested by the Board. In order to develop fully the factual basis for consideration of the Fidelity funds' Advisory Contracts, the Board requested and received additional information on several topics, including (i) fund performance trends and actions to be taken by FMR to improve certain funds' overall performance; (ii) Fidelity's portfolio manager compensation structure, including its effects on fund profitability and the extent to which portfolio manager compensation is linked to fund performance; (iii) Fidelity's fee structures; (iv) the funds' sub-advisory arrangements; and (v) accounts managed by Fidelity other than the Fidelity funds.
Based on its evaluation of all of the conclusions noted above, and after considering all material factors, the Board ultimately concluded that the advisory fee structures are fair and reasonable, and that each fund's Advisory Contracts should be renewed.
Annual Report
Investment Adviser
Strategic Advisers, Inc.
Boston, MA
General Distributor
Fidelity Distributors Corporation
Boston, MA
Transfer and Service Agents
Fidelity Investments Institutional Operations Company, Inc.
Boston, MA
Fidelity Service Company, Inc.
Boston, MA
Custodian
Mellon Bank, N.A.
Pittsburgh, PA
VIPFF2K-ANN-0208
1.826371.103
Fidelity® Variable Insurance Products:
Freedom Lifetime Income Funds -
Portfolios I, II, & III
Annual Report
December 31, 2007
(2_fidelity_logos) (Registered_Trademark)
Contents
To view a fund's proxy voting guidelines and proxy voting record for the 12-month period ended June 30, visit http://www.fidelity.com (search for "proxy voting guidelines") or visit the Securities and Exchange Commission's (SEC) web site at http://www.sec.gov. You may also call 1-877-208-0098 to request a free copy of the proxy voting guidelines.
Fidelity Variable Insurance Products are separate account options which are purchased through a variable insurance contract.
Standard & Poor's, S&P and S&P 500 are registered service marks of The McGraw-Hill Companies, Inc. and have been licensed for use by Fidelity Distributors Corporation.
Other third party marks appearing herein are the property of their respective owners.
All other marks appearing herein are registered or unregistered trademarks or service marks of FMR LLC or an affiliated company.
This report and the financial statements contained herein are submitted for the general information of the shareholders of the funds. This report is not authorized for distribution to prospective investors in the funds unless preceded or accompanied by an effective prospectus.
A fund files its complete schedule of portfolio holdings with the SEC for the first and third quarters of each fiscal year on Form N-Q. Forms N-Q are available on the SEC's web site at http://www.sec.gov. A fund's Forms N-Q may be reviewed and copied at the SEC's Public Reference Room in Washington, DC. Information regarding the operation of the SEC's Public Reference Room may be obtained by calling 1-800-SEC-0330. For a complete list of a fund's portfolio holdings, view the most recent holdings report, semiannual report, or annual report on Fidelity's web site at http://www.fidelity.com or http://www.advisor.fidelity.com, as applicable.
NOT FDIC INSURED · MAY LOSE VALUE · NO BANK GUARANTEE
Neither the fund nor Fidelity Distributors Corporation is a bank.
VIP Lifetime Income Funds Portfolio
VIP Freedom Lifetime Income I Portfolio
Performance: The Bottom Line
Average annual total return reflects the change in the value of an investment, assuming reinvestment of the fund's dividend income and capital gains (the profits earned upon the sale of securities that have grown in value, if any) and assuming a constant rate of performance each year. During periods of reimbursement by Fidelity, a fund's total return will be greater than it would be had the reimbursement not occurred. Performance numbers are net of all underlying fund operating expenses, but do not include any insurance charges imposed by your insurance company's separate account. If performance information included the effect of these additional charges, the total returns would have been lower. How a fund did yesterday is no guarantee of how it will do tomorrow.
Average Annual Total Returns
Periods ended December 31, 2007 | | Past 1
year | Life of fund A |
VIP Freedom Lifetime Income I | | 8.16% | 8.60% |
A From July 26, 2005.
$10,000 Over Life of Fund
Let's say hypothetically that $10,000 was invested in VIP Freedom Lifetime Income I on July 26, 2005, when the fund started. The chart shows how the value of your investment would have changed, and also shows how the Standard & Poor's 500SM (S&P 500®) Index performed over the same period.
Annual Report
VIP Freedom Lifetime Income II Portfolio
Performance: The Bottom Line
Average annual total return reflects the change in the value of an investment, assuming reinvestment of the fund's dividend income and capital gains (the profits earned upon the sale of securities that have grown in value, if any) and assuming a constant rate of performance each year. During periods of reimbursement by Fidelity, a fund's total return will be greater than it would be had the reimbursement not occurred. Performance numbers are net of all underlying fund operating expenses, but do not include any insurance charges imposed by your insurance company's separate account. If performance information included the effect of these additional charges, the total returns would have been lower. How a fund did yesterday is no guarantee of how it will do tomorrow.
Average Annual Total Returns
Periods ended December 31, 2007 | | Past 1
year | Life of fund A |
VIP Freedom Lifetime Income II | | 9.67% | 10.77% |
A From July 26, 2005.
$10,000 Over Life of Fund
Let's say hypothetically that $10,000 was invested in VIP Freedom Lifetime Income II on July 26, 2005, when the fund started. The chart shows how the value of your investment would have changed, and also shows how the S&P 500 Index performed over the same period.
VIP Lifetime Income Funds Portfolio
VIP Freedom Lifetime Income III Portfolio
Performance: The Bottom Line
Average annual total return reflects the change in the value of an investment, assuming reinvestment of the fund's dividend income and capital gains (the profits earned upon the sale of securities that have grown in value, if any) and assuming a constant rate of performance each year. During periods of reimbursement by Fidelity, a fund's total return will be greater than it would be had the reimbursement not occurred. Performance numbers are net of all underlying fund operating expenses, but do not include any insurance charges imposed by your insurance company's separate account. If performance information included the effect of these additional charges, the total returns would have been lower. How a fund did yesterday is no guarantee of how it will do tomorrow.
Average Annual Total Returns
Periods ended December 31, 2007 | | Past 1
year | Life of fund A |
VIP Freedom Lifetime Income III | | 10.88% | 12.32% |
A From July 26, 2005.
$10,000 Over Life of Fund
Let's say hypothetically that $10,000 was invested in VIP Freedom Lifetime Income III on July 26, 2005, when the fund started. The chart shows how the value of your investment would have changed, and also shows how the S&P 500 Index performed over the same period.
Annual Report
Management's Discussion of Fund Performance
Comments from Christopher Sharpe and Jonathan Shelon, Co-Portfolio Managers of VIP Freedom Lifetime Income Funds
U.S. equity markets, as measured by the bellwether Dow Jones Industrial AverageSM and the Standard & Poor's 500SM Index, registered their fifth consecutive year of positive returns in 2007, as the Dow rose 8.88% and the S&P 500® index advanced 5.49%. The tech-heavy NASDAQ Composite® Index did even better, increasing 10.55%. However, credit- and recession-related concerns carved deeply into stock prices late in 2007, pushing some major market measures into negative territory for the year overall, particularly smaller-cap and value-oriented benchmarks. Based largely on a weak U.S. dollar that boosted returns for U.S. investors, the Morgan Stanley Capital InternationalSM Europe, Australasia, and Far East (MSCI® EAFE®) Index - a gauge of developed stock markets outside the United States and Canada - beat most domestic equity measures, gaining 11.33%. Several European countries had outstanding performance, including Finland and Germany, while Australia also did very well. However, fallout from the credit crunch and concerns about export growth tempered U.K. stocks, while fears that Japanese financial companies would become embroiled in the U.S. subprime mortgage crisis contributed to a loss of more than 4% for the Japanese portion of the index. The emerging-markets stock asset class soared 39.78% according to the MSCI Emerging Markets index. The U.S. investment-grade bond market climbed 6.97% as measured by the Lehman Brothers® U.S. Aggregate Index, beating the 2.53% gain for the Merrill Lynch® U.S. High Yield Master II Constrained Index. The emerging-markets bond category shook off a sluggish first half of 2007 to finish the year with a respectable gain of 6.28% as measured by the J.P. Morgan Emerging Markets Bond Index (EMBI) Global, while the Citigroup® Non-U.S. Group of 7 Index - representing the debt performance of major global economies, excluding the United States - rose 13.05%.
Each of the three VIP Freedom Lifetime Income Funds recorded positive results for the year. (For specific portfolio performance results, please refer to the performance section of this report.) On an absolute basis, these returns were consistent with the kind of performance we would expect to see from a series of portfolios with different asset-allocation levels based on age-appropriate risks. On a relative basis versus their individual composite indexes, the Funds also did well, with all of them beating their respective benchmarks for the period. Overall performance was led by the Funds' underlying domestic and international equity asset classes. Both equity classes outperformed their benchmarks - the Dow Jones Wilshire 5000 Composite IndexSM, which rose 5.62%, and the MSCI EAFE, respectively - thanks mostly to effective stock selection within their underlying funds. The Funds' investments in both short-term and high-yield bonds performed in line with their respective benchmarks, with returns of 5.11% for the Lehman Brothers 3-Month Treasury Bill Index and 2.53% for the Merrill Lynch U.S. High Yield Master II Constrained Index. Meanwhile, the investment-grade bond class underperformed the 6.97% return of the Lehman Brothers U.S. Aggregate Index, in part because of its exposure to subprime-mortgage-backed securities, which saw their prices fall as the credit crunch worsened during the year.
Note to shareholders: Jonathan Shelon became Co-Portfolio Manager on September 4, 2007 replacing Ren Cheng, who was promoted to Chief Investment Officer of Fidelity's Global Asset Allocation Group.
The views expressed above reflect those of the portfolio manager(s) only through the end of the period as stated on the cover of this report and do not necessarily represent the views of Fidelity or any other person in the Fidelity organization. Any such views are subject to change at any time based upon market or other conditions and Fidelity disclaims any responsibility to update such views. These views may not be relied on as investment advice and, because investment decisions for a Fidelity fund are based on numerous factors, may not be relied on as an indication of trading intent on behalf of any Fidelity fund.
VIP Lifetime Income Funds Portfolio
Shareholder Expense Example
As a shareholder of a Fund, you incur two types of costs: (1) transaction costs, and (2) ongoing costs, including other Fund expenses. This Example is intended to help you understand your ongoing costs (in dollars) of investing in the Funds and to compare these costs with the ongoing costs of investing in other mutual funds.
The Example is based on an investment of $1,000 invested at the beginning of the period and held for the entire period (July 1, 2007 to December 31, 2007).
Actual Expenses
The first line of the accompanying table for each fund provides information about actual account values and actual expenses. You may use the information in this line, together with the amount you invested, to estimate the expenses that you paid over the period. Simply divide your account value by $1,000.00 (for example, an $8,600 account value divided by $1,000.00 = 8.6), then multiply the result by the number in the first line for a fund under the heading entitled "Expenses Paid During Period" to estimate the expenses you paid on your account during this period. The estimate of expenses does not include any fees or other expenses of any variable annuity or variable life insurance product. If they were, the estimate of expenses you paid during the period would be higher, and your ending account value would be lower. In addition, each Fund, as a shareholder in underlying Fidelity Funds, will indirectly bear its pro rata share of the fees and expenses incurred by the underlying Fidelity Funds. These fees and expenses are not included in each Fund's annualized expense ratio used to calculate the expense estimates in the table below.
Hypothetical Example for Comparison Purposes
The second line of the accompanying table for each fund provides information about hypothetical account values and hypothetical expenses based on a fund's actual expense ratio and an assumed rate of return of 5% per year before expenses, which is not the Fund's actual return. The hypothetical account values and expenses may not be used to estimate the actual ending account balance or expenses you paid for the period. You may use this information to compare the ongoing costs of investing in the Fund and other funds. To do so, compare this 5% hypothetical example with the 5% hypothetical examples that appear in the shareholder reports of the other funds. The estimate of expenses does not include any fees or other expenses of any variable annuity or variable life insurance product. If they were, the estimate of expenses you paid during the period would be higher, and your ending account value would be lower. In addition, each Fund, as a shareholder in underlying Fidelity Funds, will indirectly bear its pro rata share of the fees and expenses incurred by the underlying Fidelity Funds. These fees and expenses are not included in each Fund's annualized expense ratio used to calculate the expense estimates in the table below.
Please note that the expenses shown in the table are meant to highlight your ongoing costs only and do not reflect any transaction costs. Therefore, the second line of the table is useful in comparing ongoing costs only, and will not help you determine the relative total costs of owning different funds.
| Beginning
Account Value
July 1, 2007 | Ending
Account Value
December 31, 2007 | Expenses Paid
During Period*
July 1, 2007
to December 31, 2007 |
VIP Freedom Lifetime Income I | | | |
Actual | $ 1,000.00 | $ 1,025.20 | $ .00 |
HypotheticalA | $ 1,000.00 | $ 1,025.21 | $ .00 |
VIP Freedom Lifetime Income II | | | |
Actual | $ 1,000.00 | $ 1,022.30 | $ .00 |
HypotheticalA | $ 1,000.00 | $ 1,025.21 | $ .00 |
VIP Freedom Lifetime Income III | | | |
Actual | $ 1,000.00 | $ 1,020.00 | $ .00 |
HypotheticalA | $ 1,000.00 | $ 1,025.21 | $ .00 |
A 5% return per year before expenses
* Expenses are equal to each Fund's annualized expense ratio of .00%; multiplied by the average account value over the period, multiplied by 184/365 (to reflect the one-half year period). The fees and expenses of the underlying Fidelity Funds in which the Fund invests are not included in the Fund's annualized expense ratio.
Annual Report
VIP Freedom Lifetime Income I Portfolio
Investment Changes
Fund Holdings as of December 31, 2007 |
| % of fund's investments | % of fund's investments 6 months ago |
Domestic Equity Funds | | |
VIP Contrafund Portfolio Investor Class | 5.9 | 5.7 |
VIP Equity-Income Portfolio Investor Class | 6.0 | 6.5 |
VIP Growth & Income Portfolio Investor Class | 6.6 | 6.6 |
VIP Growth Portfolio Investor Class | 7.1 | 6.7 |
VIP Mid Cap Portfolio Investor Class | 2.3 | 2.4 |
VIP Value Portfolio Investor Class | 5.0 | 5.6 |
VIP Value Strategies Portfolio Investor Class | 2.1 | 2.3 |
| 35.0 | 35.8 |
International Equity Funds | | |
VIP Overseas Portfolio Investor Class R | 8.8 | 8.9 |
High Yield Fixed-Income Funds | | |
VIP High Income Portfolio Investor Class | 4.9 | 5.0 |
Investment Grade Fixed-Income Funds | | |
VIP Investment Grade Bond Portfolio Investor Class | 39.4 | 38.7 |
Short-Term Funds | | |
VIP Money Market Portfolio Investor Class | 11.9 | 11.6 |
| 100.0 | 100.0 |
Asset Allocation (% of fund's investments) |
Current |
 | Domestic Equity Funds | 35.0% | |
 | International Equity Funds | 8.8% | |
 | Investment Grade Fixed-Income Funds | 39.4% | |
 | High Yield Fixed-Income Funds | 4.9% | |
 | Short-Term Funds | 11.9% | |

Six months ago |
| Domestic Equity Funds | 35.8% | |
| International Equity Funds | 8.9% | |
| Investment Grade Fixed-Income Funds | 38.7% | |
| High Yield Fixed-Income Funds | 5.0% | |
| Short-Term Funds | 11.6% | |

Expected |
| Domestic Equity Funds | 35.9% | |
| International Equity Funds | 8.9% | |
| Investment Grade Fixed-Income Funds | 36.9% | |
| High Yield Fixed-Income Funds | 5.0% | |
| Short-Term Funds | 13.3% | |

The fund invests according to an asset allocation strategy that becomes increasingly conservative over time. The six months ago allocation is based on the fund's holdings as of June 30, 2007. The current allocation is based on the fund's holdings as of December 31, 2007. The expected allocation represents the fund's anticipated allocation at June 30, 2008. |
VIP Lifetime Income Funds Portfolio
VIP Freedom Lifetime Income I Portfolio
Investments December 31, 2007
Showing Percentage of Total Value of Investment in Securities
Equity Funds - 43.8% |
| Shares | | Value |
Domestic Equity Funds - 35.0% |
VIP Contrafund Portfolio Investor Class | 26,521 | | $ 737,813 |
VIP Equity-Income Portfolio Investor Class | 31,414 | | 749,223 |
VIP Growth & Income Portfolio Investor Class | 48,609 | | 824,417 |
VIP Growth Portfolio Investor Class | 19,731 | | 887,887 |
VIP Mid Cap Portfolio Investor Class | 8,117 | | 292,794 |
VIP Value Portfolio Investor Class | 48,444 | | 634,126 |
VIP Value Strategies Portfolio Investor Class | 21,016 | | 263,325 |
TOTAL DOMESTIC EQUITY FUNDS | | 4,389,585 |
International Equity Funds - 8.8% |
VIP Overseas Portfolio Investor Class R | 43,413 | | 1,096,606 |
TOTAL EQUITY FUNDS (Cost $5,101,699) | 5,486,191 |
Fixed-Income Funds - 44.3% |
| | | |
High Yield Fixed-Income Funds - 4.9% |
VIP High Income Portfolio Investor Class | 104,148 | | 620,720 |
Investment Grade Fixed-Income Funds - 39.4% |
VIP Investment Grade Bond Portfolio Investor Class | 387,613 | | 4,934,314 |
TOTAL FIXED-INCOME FUNDS (Cost $5,476,277) | 5,555,034 |
Short-Term Funds - 11.9% |
| | | |
VIP Money Market Portfolio Investor Class
(Cost $1,492,173) | 1,492,173 | | 1,492,173 |
TOTAL INVESTMENT IN SECURITIES - 100% (Cost $12,070,149) | $ 12,533,398 |
See accompanying notes which are an integral part of the financial statements.
Annual Report
VIP Freedom Lifetime Income I Portfolio
Financial Statements
Statement of Assets and Liabilities
| December 31, 2007 |
| | |
Assets | | |
Investment in securities, at value (cost $12,070,149) - See accompanying schedule | | $ 12,533,398 |
Cash | | 89 |
Receivable for investments sold | | 566 |
Total assets | | 12,534,053 |
| | |
Liabilities | | |
Payable for investments purchased | $ 201 | |
Payable for fund shares redeemed | 560 | |
Total liabilities | | 761 |
| | |
Net Assets | | $ 12,533,292 |
Net Assets consist of: | | |
Paid in capital | | $ 11,873,589 |
Undistributed net investment income | | 724 |
Accumulated undistributed net realized gain (loss) on investments | | 195,730 |
Net unrealized appreciation (depreciation) on investments | | 463,249 |
Net Assets, for 1,118,082 shares outstanding | | $ 12,533,292 |
Net Asset Value, offering price and redemption price per share ($12,533,292 ÷ 1,118,082 shares) | | $ 11.21 |
Statement of Operations
| Year ended December 31, 2007 |
| | |
Investment Income | | |
Income distributions from underlying funds | | $ 363,583 |
| | |
Expenses | | |
Independent trustees' compensation | $ 39 | |
Total expenses before reductions | 39 | |
Expense reductions | (39) | 0 |
Net investment income (loss) | | 363,583 |
Realized and Unrealized Gain (Loss) Realized gain (loss) on sale of underlying fund shares | (1,056) | |
Capital gain distributions from underlying funds | 444,130 | 443,074 |
Change in net unrealized appreciation (depreciation) on underlying funds | | 85,222 |
Net gain (loss) | | 528,296 |
Net increase (decrease) in net assets resulting from operations | | $ 891,879 |
See accompanying notes which are an integral part of the financial statements.
VIP Lifetime Income Funds Portfolio
Statement of Changes in Net Assets
| Year ended
December 31, 2007 | Year ended
December 31, 2006 |
Increase (Decrease) in Net Assets | | |
Operations | | |
Net investment income (loss) | $ 363,583 | $ 160,138 |
Net realized gain (loss) | 443,074 | 127,086 |
Change in net unrealized appreciation (depreciation) | 85,222 | 348,399 |
Net increase (decrease) in net assets resulting from operations | 891,879 | 635,623 |
Distributions to shareholders from net investment income | (361,791) | (162,340) |
Distributions to shareholders from net realized gain | (328,199) | (45,095) |
Total distributions | (689,990) | (207,435) |
Share transactions
Proceeds from sales of shares | 2,994,715 | 7,602,656 |
Reinvestment of distributions | 689,990 | 207,435 |
Cost of shares redeemed | (1,459,058) | (1,038,565) |
Net increase (decrease) in net assets resulting from share transactions | 2,225,647 | 6,771,526 |
Total increase (decrease) in net assets | 2,427,536 | 7,199,714 |
| | |
Net Assets | | |
Beginning of period | 10,105,756 | 2,906,042 |
End of period (including undistributed net investment income of $724 and $0, respectively) | $ 12,533,292 | $ 10,105,756 |
Other Information Shares | | |
Sold | 263,784 | 715,785 |
Issued in reinvestment of distributions | 61,611 | 18,875 |
Redeemed | (128,066) | (96,908) |
Net increase (decrease) | 197,329 | 637,752 |
Financial Highlights
Years ended December 31, | 2007 | 2006 | 2005 G |
Selected Per-Share Data | | | |
Net asset value, beginning of period | $ 10.98 | $ 10.27 | $ 10.00 |
Income from Investment Operations | | | |
Net investment income (loss) E | .36 | .27 | .10 |
Net realized and unrealized gain (loss) | .53 | .67 | .26 |
Total from investment operations | .89 | .94 | .36 |
Distributions from net investment income | (.34) | (.18) | (.05) |
Distributions from net realized gain | (.32) | (.05) | (.04) |
Total distributions | (.66) | (.23) | (.09) |
Net asset value, end of period | $ 11.21 | $ 10.98 | $ 10.27 |
Total Return B, C, D | 8.16% | 9.15% | 3.55% |
Ratios to Average Net Assets F, H | | | |
Expenses before reductions | .00% | .00% | .00% A |
Expenses net of fee waivers, if any | .00% | .00% | .00%A |
Expenses net of all reductions | .00% | .00% | .00%A |
Net investment income (loss) | 3.15% | 2.50% | 2.23%A |
Supplemental Data | | | |
Net assets, end of period (000 omitted) | $ 12,533 | $ 10,106 | $ 2,906 |
Portfolio turnover rate | 16% | 28% | 71% |
A Annualized
B Total returns for periods of less than one year are not annualized.
C Total returns do not reflect charges attributable to your insurance company's separate account. Inclusion of these charges would reduce the total returns shown.
D Total returns would have been lower had certain expenses not been reduced during the periods shown.
E Calculated based on average shares outstanding during the period.
F Amounts do not include the activity of the underlying funds.
G For the period July 26, 2005 (commencement of operations) to December 31, 2005.
H Expense ratios reflect operating expenses of the Fund. Expenses before reductions do not reflect amounts reimbursed by the investment adviser or expense offset arrangements and do not represent the amount paid by the Fund during periods when reimbursements or reductions occur. Expense ratios before reductions for start-up periods may not be representative of longer term operating periods. Expenses net of fee waivers reflect expenses after reimbursement by the investment adviser but prior to reductions from expense offset arrangements. Expenses net of all reductions represent the net expenses paid by the Fund but do not include expenses of the investment companies in which the Fund invests.
See accompanying notes which are an integral part of the financial statements.
Annual Report
VIP Freedom Lifetime Income II Portfolio
Investment Changes
Fund Holdings as of December 31, 2007 |
| % of fund's investments | % of fund's investments 6 months ago |
Domestic Equity Funds | | |
VIP Contrafund Portfolio Investor Class | 7.9 | 7.7 |
VIP Equity-Income Portfolio Investor Class | 8.1 | 8.9 |
VIP Growth & Income Portfolio Investor Class | 8.9 | 9.0 |
VIP Growth Portfolio Investor Class | 9.5 | 9.1 |
VIP Mid Cap Portfolio Investor Class | 3.2 | 3.2 |
VIP Value Portfolio Investor Class | 6.9 | 7.6 |
VIP Value Strategies Portfolio Investor Class | 2.8 | 3.2 |
| 47.3 | 48.7 |
International Equity Funds | | |
VIP Overseas Portfolio Investor Class R | 11.9 | 12.1 |
High Yield Fixed-Income Funds | | |
VIP High Income Portfolio Investor Class | 6.8 | 6.9 |
Investment Grade Fixed-Income Funds | | |
VIP Investment Grade Bond Portfolio Investor Class | 30.8 | 29.4 |
Short-Term Funds | | |
VIP Money Market Portfolio Investor Class | 3.2 | 2.9 |
| 100.0 | 100.0 |
Asset Allocation (% of fund's investments) |
Current |
| Domestic Equity Funds | 47.3% | |
| International Equity Funds | 11.9% | |
| Investment Grade Fixed-Income Funds | 30.8% | |
| High Yield Fixed-Income Funds | 6.8% | |
| Short-Term Funds | 3.2% | |

Six months ago |
| Domestic Equity Funds | 48.7% | |
| International Equity Funds | 12.1% | |
| Investment Grade Fixed-Income Funds | 29.4% | |
| High Yield Fixed-Income Funds | 6.9% | |
| Short-Term Funds | 2.9% | |

Expected |
| Domestic Equity Funds | 45.8% | |
| International Equity Funds | 11.4% | |
| Investment Grade Fixed-Income Funds | 32.0% | |
| High Yield Fixed-Income Funds | 6.5% | |
| Short-Term Funds | 4.3% | |

The fund invests according to an asset allocation strategy that becomes increasingly conservative over time. The six months ago allocation is based on the fund's holdings as of June 30, 2007. The current allocation is based on the fund's holdings as of December 31, 2007. The expected allocation represents the fund's anticipated allocation at June 30, 2008. |
VIP Lifetime Income Funds Portfolio
VIP Freedom Lifetime Income II Portfolio
Investments December 31, 2007
Showing Percentage of Total Value of Investment in Securities
Equity Funds - 59.2% |
| Shares | | Value |
Domestic Equity Funds - 47.3% |
VIP Contrafund Portfolio Investor Class | 64,854 | | $ 1,804,238 |
VIP Equity-Income Portfolio Investor Class | 77,184 | | 1,840,845 |
VIP Growth & Income Portfolio Investor Class | 118,981 | | 2,017,913 |
VIP Growth Portfolio Investor Class | 48,179 | | 2,168,046 |
VIP Mid Cap Portfolio Investor Class | 19,893 | | 717,554 |
VIP Value Portfolio Investor Class | 119,049 | | 1,558,350 |
VIP Value Strategies Portfolio Investor Class | 51,622 | | 646,828 |
TOTAL DOMESTIC EQUITY FUNDS | | 10,753,774 |
International Equity Funds - 11.9% |
VIP Overseas Portfolio Investor Class R | 106,742 | | 2,696,314 |
TOTAL EQUITY FUNDS (Cost $12,663,591) | 13,450,088 |
Fixed-Income Funds - 37.6% |
| | | |
High Yield Fixed-Income Funds - 6.8% |
VIP High Income Portfolio Investor Class | 257,909 | | 1,537,136 |
Investment Grade Fixed-Income Funds - 30.8% |
VIP Investment Grade Bond Portfolio Investor Class | 549,725 | | 6,998,003 |
TOTAL FIXED-INCOME FUNDS (Cost $8,445,764) | 8,535,139 |
Short-Term Funds - 3.2% |
| | | |
VIP Money Market Portfolio Investor Class
(Cost $715,805) | 715,805 | | 715,805 |
TOTAL INVESTMENT IN SECURITIES - 100% (Cost $21,825,160) | $ 22,701,032 |
See accompanying notes which are an integral part of the financial statements.
Annual Report
VIP Freedom Lifetime Income II Portfolio
Financial Statements
Statement of Assets and Liabilities
| December 31, 2007 |
| | |
Assets | | |
Investment in securities, at value (cost $21,825,160) - See accompanying schedule | | $ 22,701,032 |
Cash | | 90 |
Receivable for investments sold | | 1,077 |
Total assets | | 22,702,199 |
| | |
Liabilities | | |
Payable for investments purchased | $ 98 | |
Payable for fund shares redeemed | 1,062 | |
Total liabilities | | 1,160 |
| | |
Net Assets | | $ 22,701,039 |
Net Assets consist of: | | |
Paid in capital | | $ 21,344,859 |
Undistributed net investment income | | 6,993 |
Accumulated undistributed net realized gain (loss) on investments | | 473,315 |
Net unrealized appreciation (depreciation) on investments | | 875,872 |
Net Assets, for 1,942,909 shares outstanding | | $ 22,701,039 |
Net Asset Value, offering price and redemption price per share ($22,701,039 ÷ 1,942,909 shares) | | $ 11.68 |
Statement of Operations
| Year ended December 31, 2007 |
| | |
Investment Income | | |
Income distributions from underlying funds | | $ 545,664 |
| | |
Expenses | | |
Independent trustees' compensation | $ 69 | |
Total expenses before reductions | 69 | |
Expense reductions | (69) | 0 |
Net investment income (loss) | | 545,664 |
Realized and Unrealized Gain (Loss) Realized gain (loss) on sale of underlying fund shares | 27,875 | |
Capital gain distributions from underlying funds | 1,076,319 | 1,104,194 |
Change in net unrealized appreciation (depreciation) on underlying funds | | 186,662 |
Net gain (loss) | | 1,290,856 |
Net increase (decrease) in net assets resulting from operations | | $ 1,836,520 |
See accompanying notes which are an integral part of the financial statements.
VIP Lifetime Income Funds Portfolio
Statement of Changes in Net Assets
| Year ended
December 31, 2007 | Year ended
December 31, 2006 |
Increase (Decrease) in Net Assets | | |
Operations | | |
Net investment income (loss) | $ 545,664 | $ 212,416 |
Net realized gain (loss) | 1,104,194 | 277,462 |
Change in net unrealized appreciation (depreciation) | 186,662 | 641,870 |
Net increase (decrease) in net assets resulting from operations | 1,836,520 | 1,131,748 |
Distributions to shareholders from net investment income | (542,373) | (208,713) |
Distributions to shareholders from net realized gain | (833,778) | (74,541) |
Total distributions | (1,376,151) | (283,254) |
Share transactions
Proceeds from sales of shares | 5,718,549 | 14,411,163 |
Reinvestment of distributions | 1,376,151 | 283,254 |
Cost of shares redeemed | (2,074,997) | (688,332) |
Net increase (decrease) in net assets resulting from share transactions | 5,019,703 | 14,006,085 |
Total increase (decrease) in net assets | 5,480,072 | 14,854,579 |
| | |
Net Assets | | |
Beginning of period | 17,220,967 | 2,366,388 |
End of period (including undistributed net investment income of $6,993 and $3,703, respectively) | $ 22,701,039 | $ 17,220,967 |
Other Information Shares | | |
Sold | 481,833 | 1,326,173 |
Issued in reinvestment of distributions | 117,952 | 24,891 |
Redeemed | (172,555) | (63,508) |
Net increase (decrease) | 427,230 | 1,287,556 |
Financial Highlights
Years ended December 31, | 2007 | 2006 | 2005 G |
Selected Per-Share Data | | | |
Net asset value, beginning of period | $ 11.36 | $ 10.37 | $ 10.00 |
Income from Investment Operations | | | |
Net investment income (loss) E | .32 | .23 | .10 |
Net realized and unrealized gain (loss) | .77 | .95 | .40 |
Total from investment operations | 1.09 | 1.18 | .50 |
Distributions from net investment income | (.30) | (.14) | (.06) |
Distributions from net realized gain | (.48) | (.05) | (.07) |
Total distributions | (.77) I | (.19) | (.13) |
Net asset value, end of period | $ 11.68 | $ 11.36 | $ 10.37 |
Total Return B, C, D | 9.67% | 11.38% | 5.00% |
Ratios to Average Net AssetsF, H | | | |
Expenses before reductions | .00% | .00% | .00% A |
Expenses net of fee waivers, if any | .00% | .00% | .00%A |
Expenses net of all reductions | .00% | .00% | .00%A |
Net investment income (loss) | 2.67% | 2.12% | 2.18%A |
Supplemental Data | | | |
Net assets, end of period (000 omitted) | $ 22,701 | $ 17,221 | $ 2,366 |
Portfolio turnover rate | 18% | 16% | 69% |
A Annualized
B Total returns for periods of less than one year are not annualized.
C Total returns do not reflect charges attributable to your insurance company's separate account. Inclusion of these charges would reduce the total returns shown.
D Total returns would have been lower had certain expenses not been reduced during the periods shown.
E Calculated based on average shares outstanding during the period.
F Amounts do not include the activity of the underlying funds.
G For the period July 26, 2005 (commencement of operations) to December 31, 2005.
H Expense ratios reflect operating expenses of the Fund. Expenses before reductions do not reflect amounts reimbursed by the investment adviser or expense offset arrangements and do not represent the amount paid by the Fund during periods when reimbursements or reductions occur. Expense ratios before reductions for start-up periods may not be representative of longer term operating periods. Expenses net of fee waivers reflect expenses after reimbursement by the investment adviser but prior to reductions from expense offset arrangements. Expenses net of all reductions represent the net expenses paid by the Fund but do not include expenses of the investment companies in which the Fund invests.
I Total distributions of $.77 per share is comprised of distributions from net investment income of $.295 and distributions from net realized gain of $.475 per share.
See accompanying notes which are an integral part of the financial statements.
Annual Report
VIP Freedom Lifetime Income III Portfolio
Investment Changes
Fund Holdings as of December 31, 2007 |
| % of fund's investments | % of fund's investments 6 months ago |
Domestic Equity Funds | | |
VIP Contrafund Portfolio Investor Class | 10.0 | 9.7 |
VIP Equity-Income Portfolio Investor Class | 10.2 | 11.2 |
VIP Growth & Income Portfolio Investor Class | 11.2 | 11.2 |
VIP Growth Portfolio Investor Class | 12.0 | 11.4 |
VIP Mid Cap Portfolio Investor Class | 3.9 | 4.0 |
VIP Value Portfolio Investor Class | 8.6 | 9.5 |
VIP Value Strategies Portfolio Investor Class | 3.6 | 4.0 |
| 59.5 | 61.0 |
International Equity Funds | | |
VIP Overseas Portfolio Investor Class R | 15.1 | 15.1 |
High Yield Fixed-Income Funds | | |
VIP High Income Portfolio Investor Class | 7.5 | 7.5 |
Investment Grade Fixed-Income Funds | | |
VIP Investment Grade Bond Portfolio Investor Class | 17.9 | 16.4 |
Short-Term Funds | | |
VIP Money Market Portfolio Investor Class | 0.0 | 0.0 |
| 100.0 | 100.0 |
Asset Allocation (% of fund's investments) |
Current |
| Domestic Equity Funds | 59.5% | |
| International Equity Funds | 15.1% | |
| Investment Grade Fixed-Income Funds | 17.9% | |
| High Yield Fixed-Income Funds | 7.5% | |
| Short-Term Funds | 0.0% | |

Six months ago |
| Domestic Equity Funds | 61.0% | |
| International Equity Funds | 15.1% | |
| Investment Grade Fixed-Income Funds | 16.4% | |
| High Yield Fixed-Income Funds | 7.5% | |
| Short-Term Funds | 0.0% | |

Expected |
 | Domestic Equity Funds | 58.3% | |
| International Equity Funds | 14.6% | |
| Investment Grade Fixed-Income Funds | 19.6% | |
| High Yield Fixed-Income Funds | 7.5% | |
| Short-Term Funds | 0.0% | |

The fund invests according to an asset allocation strategy that becomes increasingly conservative over time. The six months ago allocation is based on the fund's holdings as of June 30, 2007. The current allocation is based on the fund's holdings as of December 31, 2007. The expected allocation represents the fund's anticipated allocation at June 30, 2008. |
VIP Lifetime Income Funds Portfolio
VIP Freedom Lifetime Income III Portfolio
Investments December 31, 2007
Showing Percentage of Total Value of Investment in Securities
Equity Funds - 74.6% |
| Shares | | Value |
Domestic Equity Funds - 59.5% |
VIP Contrafund Portfolio Investor Class | 39,866 | | $ 1,109,079 |
VIP Equity-Income Portfolio Investor Class | 47,283 | | 1,127,689 |
VIP Growth & Income Portfolio Investor Class | 73,024 | | 1,238,480 |
VIP Growth Portfolio Investor Class | 29,591 | | 1,331,617 |
VIP Mid Cap Portfolio Investor Class | 12,192 | | 439,769 |
VIP Value Portfolio Investor Class | 72,998 | | 955,537 |
VIP Value Strategies Portfolio Investor Class | 31,589 | | 395,805 |
TOTAL DOMESTIC EQUITY FUNDS | | 6,597,976 |
International Equity Funds - 15.1% |
VIP Overseas Portfolio Investor Class R | 66,138 | | 1,670,658 |
TOTAL EQUITY FUNDS (Cost $7,621,747) | 8,268,634 |
Fixed-Income Funds - 25.4% |
| | | |
High Yield Fixed-Income Funds - 7.5% |
VIP High Income Portfolio Investor Class | 139,921 | | 833,931 |
Investment Grade Fixed-Income Funds - 17.9% |
VIP Investment Grade Bond Portfolio Investor Class | 155,526 | | 1,979,851 |
TOTAL FIXED-INCOME FUNDS (Cost $2,812,642) | 2,813,782 |
Short-Term Funds - 0.0% |
| | | |
VIP Money Market Portfolio Investor Class
(Cost $2,216) | 2,216 | | 2,216 |
TOTAL INVESTMENT IN SECURITIES - 100% (Cost $10,436,605) | $ 11,084,632 |
See accompanying notes which are an integral part of the financial statements.
Annual Report
VIP Freedom Lifetime Income III Portfolio
Financial Statements
Statement of Assets and Liabilities
| December 31, 2007 |
| | |
Assets | | |
Investment in securities, at value (cost $10,436,605) - See accompanying schedule | | $ 11,084,632 |
Cash | | 88 |
Receivable for investments sold | | 493 |
Total assets | | 11,085,213 |
| | |
Liabilities | | |
Payable for investments purchased | $ 12 | |
Payable for fund shares redeemed | 484 | |
Total liabilities | | 496 |
| | |
Net Assets | | $ 11,084,717 |
Net Assets consist of: | | |
Paid in capital | | $ 10,144,386 |
Accumulated undistributed net realized gain (loss) on investments | | 292,304 |
Net unrealized appreciation (depreciation) on investments | | 648,027 |
Net Assets, for 931,677 shares outstanding | | $ 11,084,717 |
Net Asset Value, offering price and redemption price per share ($11,084,717 ÷ 931,677 shares) | | $ 11.90 |
Statement of Operations
| Year ended December 31, 2007 |
| | |
Investment Income | | |
Income distributions from underlying funds | | $ 247,764 |
| | |
Expenses | | |
Independent trustees' compensation | $ 35 | |
Total expenses before reductions | 35 | |
Expense reductions | (35) | 0 |
Net investment income (loss) | | 247,764 |
Realized and Unrealized Gain (Loss) Realized gain (loss) on sale of underlying fund shares | 6,748 | |
Capital gain distributions from underlying funds | 682,498 | 689,246 |
Change in net unrealized appreciation (depreciation) on underlying funds | | 81,118 |
Net gain (loss) | | 770,364 |
Net increase (decrease) in net assets resulting from operations | | $ 1,018,128 |
See accompanying notes which are an integral part of the financial statements.
VIP Lifetime Income Funds Portfolio
Statement of Changes in Net Assets
| Year ended
December 31, 2007 | Year ended
December 31, 2006 |
Increase (Decrease) in Net Assets | | |
Operations | | |
Net investment income (loss) | $ 247,764 | $ 112,758 |
Net realized gain (loss) | 689,246 | 219,068 |
Change in net unrealized appreciation (depreciation) | 81,118 | 469,611 |
Net increase (decrease) in net assets resulting from operations | 1,018,128 | 801,437 |
Distributions to shareholders from net investment income | (249,881) | (112,128) |
Distributions to shareholders from net realized gain | (532,048) | (82,227) |
Total distributions | (781,929) | (194,355) |
Share transactions
Proceeds from sales of shares | 1,768,038 | 5,427,409 |
Reinvestment of distributions | 781,929 | 194,355 |
Cost of shares redeemed | (536,548) | (352,017) |
Net increase (decrease) in net assets resulting from share transactions | 2,013,419 | 5,269,747 |
Total increase (decrease) in net assets | 2,249,618 | 5,876,829 |
| | |
Net Assets | | |
Beginning of period | 8,835,099 | 2,958,270 |
End of period (including undistributed net investment income of $0 and $630, respectively) | $ 11,084,717 | $ 8,835,099 |
Other Information Shares | | |
Sold | 145,013 | 496,103 |
Issued in reinvestment of distributions | 65,782 | 16,769 |
Redeemed | (43,397) | (30,993) |
Net increase (decrease) | 167,398 | 481,879 |
Financial Highlights
Years ended December 31, | 2007 | 2006 | 2005 G |
Selected Per-Share Data | | | |
Net asset value, beginning of period | $ 11.56 | $ 10.48 | $ 10.00 |
Income from Investment Operations | | | |
Net investment income (loss) E | .29 | .19 | .11 |
Net realized and unrealized gain (loss) | .96 | 1.15 | .50 |
Total from investment operations | 1.25 | 1.34 | .61 |
Distributions from net investment income | (.29) | (.15) | (.06) |
Distributions from net realized gain | (.62) | (.11) | (.07) |
Total distributions | (.91) | (.26) | (.13) |
Net asset value, end of period | $ 11.90 | $ 11.56 | $ 10.48 |
Total Return B, C, D | 10.88% | 12.78% | 6.10% |
Ratios to Average Net AssetsF, H | | | |
Expenses before reductions | .00% | .00% | .00% A |
Expenses net of fee waivers, if any | .00% | .00% | .00%A |
Expenses net of all reductions | .00% | .00% | .00%A |
Net investment income (loss) | 2.41% | 1.76% | 2.39%A |
Supplemental Data | | | |
Net assets, end of period (000 omitted) | $ 11,085 | $ 8,835 | $ 2,958 |
Portfolio turnover rate | 11% | 15% | 59% |
A Annualized
B Total returns for periods of less than one year are not annualized.
C Total returns do not reflect charges attributable to your insurance company's separate account. Inclusion of these charges would reduce the total returns shown.
D Total returns would have been lower had certain expenses not been reduced during the periods shown.
E Calculated based on average shares outstanding during the period.
F Amounts do not include the activity of the underlying funds.
G For the period July 26, 2005 (commencement of operations) to December 31, 2005.
H Expense ratios reflect operating expenses of the Fund. Expenses before reductions do not reflect amounts reimbursed by the investment adviser or expense offset arrangements and do not represent the amount paid by the Fund during periods when reimbursements or reductions occur. Expense ratios before reductions for start-up periods may not be representative of longer term operating periods. Expenses net of fee waivers reflect expenses after reimbursement by the investment adviser but prior to reductions from expense offset arrangements. Expenses net of all reductions represent the net expenses paid by the Fund but do not include expenses of the investment companies in which the Fund invests.
See accompanying notes which are an integral part of the financial statements.
Annual Report
Notes to Financial Statements
For the period ended December 31, 2007
1. Organization.
VIP Freedom Lifetime Income I Portfolio, VIP Freedom Lifetime Income II Portfolio, and VIP Freedom Lifetime Income III Portfolio (the Funds) are funds of Variable Insurance Products Fund V (formerly of Variable Insurance Products IV). Effective, April 19, 2007, the Board of Trustees approved an Agreement and Plan of Reorganization whereby the Funds reorganized into Variable Insurance Products V effective June 29, 2007 (Trust Reorganization). The Trust Reorganization does not impact the Funds' investment strategies or Fidelity Management & Research Company's (FMR) management of the Funds. The Variable Insurance Products Fund V (the trust) (referred to in this report as Fidelity Variable Insurance Products) is registered under the Investment Company Act of 1940, as amended (the 1940 Act), as an open-end management investment company organized as a Massachusetts business trust. Each Fund is authorized to issue an unlimited number of shares. The Funds invest primarily in a combination of other VIP equity, fixed income, and short-term funds (the Underlying Funds) managed by FMR. Shares of each Fund may only be purchased by insurance companies for the purpose of funding variable annuity or variable life insurance contracts.
2. Significant Accounting Policies.
The financial statements have been prepared in conformity with accounting principles generally accepted in the United States of America, which require management to make certain estimates and assumptions at the date of the financial statements. The following summarizes the significant accounting policies of the Funds:
Security Valuation. Net asset value per share is calculated as of the close of business of the New York Stock Exchange, normally 4:00 p.m. Eastern time. Investments in the Underlying Funds are valued at their closing net asset value each business day. Short-term securities with remaining maturities of sixty days or less for which quotations are not readily available are valued on the basis of amortized cost, which approximates value.
Investment Transactions and Income. For financial reporting purposes, the Funds' investment holdings and NAV include trades executed through the end of the last business day of the period. The NAV for processing shareholder transactions includes trades executed through the end of the prior business day. Gains and losses on securities sold are determined on the basis of identified cost. Income and capital gain distributions from the Underlying Funds, if any, are recorded on the ex-dividend date.
Expenses. Most expenses of the trust can be directly attributed to a fund. Expenses which cannot be directly attributed are apportioned among each fund in the trust. Expenses included in the accompanying financial statements reflect the expenses of each Fund and do not include any expenses associated with the Underlying Funds. Expense estimates are accrued in the period to which they relate and adjustments are made when actual amounts are known. All legal and other expenses associated with the Trust Reorganization will be paid by FMR.
Income Tax Information and Distributions to Shareholders. Each year, each Fund intends to qualify as a regulated investment company by distributing substantially all of its taxable income and realized gains under Subchapter M of the Internal Revenue Code and filing its U.S. federal tax return. As a result, no provision for income taxes is required. Each Fund adopted the provisions of FASB Interpretation No. 48, Accounting for Uncertainties in Income Taxes (FIN 48), on June 29, 2007. FIN 48 sets forth a minimum threshold for financial statement recognition of the benefit of a tax position taken or expected to be taken in a tax return. The implementation of FIN 48 did not result in any unrecognized tax benefits in the accompanying financial statements. Each of the Funds' federal tax returns for the prior three fiscal years remains subject to examination by the Internal Revenue Service.
Distributions are recorded on the ex-dividend date. Income and capital gain distributions are determined in accordance with income tax regulations, which may differ from generally accepted accounting principles.
Capital accounts within the financial statements are adjusted for permanent book-tax differences. These adjustments have no impact on net assets or the results of operations. Temporary book-tax differences will reverse in a subsequent period.
Book-tax differences are primarily due to the short-term gain distributions from the Underlying Funds and losses deferred due to wash sales.
VIP Lifetime Income Funds Portfolio
2. Significant Accounting Policies - continued
Income Tax Information and Distributions to Shareholders - continued
The tax-basis components of distributable earnings and the federal tax cost as of period end were as follows for each Fund:
| Cost for Federal
Income Tax Purposes | Unrealized
Appreciation | Unrealized
Depreciation | Net Unrealized
Appreciation/
(Depreciation) |
VIP Freedom Lifetime Income I | $ 12,070,181 | $ 636,371 | $ (173,154) | $ 463,217 |
VIP Freedom Lifetime Income II | 21,825,326 | 1,349,610 | (473,904) | 875,706 |
VIP Freedom Lifetime Income III | 10,436,709 | 886,743 | (238,820) | 647,923 |
| Undistributed
Ordinary Income | Undistributed
Long-term
Capital Gain | Capital Loss
Carryforward |
VIP Freedom Lifetime Income I | $ 724 | $ 195,763 | $ - |
VIP Freedom Lifetime Income II | 7,840 | 472,634 | - |
VIP Freedom Lifetime Income III | - | 292,410 | - |
The tax character of distributions paid was as follows:
December 31, 2007 | Ordinary Income | Long-term
Capital Gains | Total |
VIP Freedom Lifetime Income I | $ 489,482 | $ 200,508 | $ 689,990 |
VIP Freedom Lifetime Income II | 863,486 | 512,665 | 1,376,151 |
VIP Freedom Lifetime Income III | 447,079 | 334,850 | 781,929 |
December 31, 2006 | Ordinary Income | Long-term
Capital Gains | Total |
VIP Freedom Lifetime Income I | $ 171,359 | $ 36,076 | $ 207,435 |
VIP Freedom Lifetime Income II | 223,622 | 59,632 | 283,254 |
VIP Freedom Lifetime Income III | 127,078 | 67,277 | 194,355 |
New Accounting Pronouncement. In September 2006, Statement of Financial Accounting Standards No. 157, Fair Value Measurements (SFAS 157), was issued and is effective for fiscal years beginning after November 15, 2007. SFAS 157 defines fair value, establishes a framework for measuring fair value and expands disclosures about fair value measurements. Management is currently evaluating the impact the adoption of SFAS 157 will have on the Funds' financial statement disclosures.
3. Operating Policies.
Repurchase Agreements. FMR has received an Exemptive Order from the Securities and Exchange Commission (the SEC) which permits certain Funds and other affiliated entities of FMR to transfer uninvested cash balances into joint trading accounts which are then invested in repurchase agreements. Certain Funds may also invest directly with institutions in repurchase agreements. Repurchase agreements are collateralized by government or non-government securities. Upon settlement date, collateral is held in segregated accounts with custodian banks and may be obtained in the event of a default of the counterparty. Each applicable Fund monitors, on a daily basis, the value of the collateral to ensure it is at least equal to the principal amount of the repurchase agreement (including accrued interest). In the event of a default by the counterparty, realization of the collateral proceeds could be delayed, during which time the value of the collateral may decline.
4. Purchases and Sales of Investments.
Purchases and redemptions of the Underlying Fund shares are noted in the table below.
| Purchases ($) | Redemptions ($) |
VIP Freedom Lifetime Income I | 4,227,483 | 1,883,627 |
VIP Freedom Lifetime Income II | 8,858,680 | 3,592,975 |
VIP Freedom Lifetime Income III | 3,255,319 | 1,093,562 |
Annual Report
Notes to Financial Statements - continued
5. Fees and Other Transactions with Affiliates.
Management Fee. Strategic Advisers, Inc. (Strategic Advisers), an affiliate of FMR, provides the Funds with investment management related services. The Funds do not pay any fees for these services.
Other Transactions. Strategic Advisers has entered into an administration agreement with FMR under which FMR provides management and administrative services (other than investment advisory services) necessary for the operation of each Fund. Pursuant to this agreement, FMR pays all expenses of each Fund, excluding the compensation of the independent Trustees and certain other expenses such as interest expense. FMR also contracts with other Fidelity companies to perform the services necessary for the operation of each Fund. The Funds do not pay any fees for these services.
6. Expense Reductions.
FMR voluntarily agreed to reimburse Funds to the extent annual operating expenses exceeded certain levels of average net assets as noted in the table below. Some expenses, for example interest expense, are excluded from this reimbursement.
The following Funds were in reimbursement during the period:
| Expense Limitations | Reimbursement
from adviser |
| | |
VIP Freedom Lifetime Income I | 0% | $ 39 |
VIP Freedom Lifetime Income II | 0% | $ 69 |
VIP Freedom Lifetime Income III | 0% | $ 35 |
7. Other.
The Funds' organizational documents provide former and current trustees and officers with a limited indemnification against liabilities arising in connection with the performance of their duties to the Funds. In the normal course of business, the Funds may also enter into contracts that provide general indemnifications. The Funds' maximum exposure under these arrangements is unknown as this would be dependent on future claims that may be made against the Funds. The risk of material loss from such claims is considered remote.
The Funds do not invest in the Underlying Funds for the purpose of exercising management or control; however, investments by the Funds within their principal investment strategies may represent a significant portion of the Underlying Fund's net assets.
At the end of the period, FMR or its affiliates were owners of record of all of the outstanding shares of the Funds.
VIP Lifetime Income Funds Portfolio
Report of Independent Registered Public Accounting Firm
To the Trustees of Variable Insurance Products Fund V and the Shareholders of VIP Freedom Lifetime Income I Portfolio, VIP Freedom Lifetime Income II Portfolio, VIP Freedom Lifetime Income III Portfolio
We have audited the accompanying statements of assets and liabilities of VIP Freedom Lifetime Income I Portfolio, VIP Freedom Lifetime Income II Portfolio and VIP Freedom Lifetime Income III Portfolio (the Funds), each a fund of Variable Insurance Products Fund V (formerly of Variable Insurance Products IV), including the schedules of investments, as of December 31, 2007, and the related statements of operations for the year then ended, the statements of changes in net assets for each of the two years in the period then ended, and the financial highlights for each of the two years in the period then ended and the period July 26, 2005 (commencement of operations) to December 31, 2005. These financial statements and financial highlights are the responsibility of the Funds' management. Our responsibility is to express an opinion on these financial statements and financial highlights based on our audits.
We conducted our audits in accordance with standards of the Public Company Accounting Oversight Board (United States). Those standards require that we plan and perform the audit to obtain reasonable assurance about whether the financial statements and financial highlights are free of material misstatement. The Funds are not required to have, nor were we engaged to perform, an audit of their internal control over financial reporting. Our audits included consideration of internal control over financial reporting as a basis for designing audit procedures that are appropriate in the circumstances, but not for the purpose of expressing an opinion on the effectiveness of the Funds' internal control over financial reporting. Accordingly, we express no such opinion. An audit also includes examining, on a test basis, evidence supporting the amounts and disclosures in the financial statements, assessing the accounting principles used and significant estimates made by management, as well as evaluating the overall financial statement presentation. Our procedures included confirmation of securities owned as of December 31, 2007, by correspondence with the custodians. We believe that our audits provide a reasonable basis for our opinion.
In our opinion, the financial statements and financial highlights referred to above present fairly, in all material respects, the financial positions of VIP Freedom Lifetime Income I Portfolio, VIP Freedom Lifetime Income II Portfolio, VIP Freedom Lifetime Income III Portfolio as of December 31, 2007, the results of their operations for the year then ended, the changes in their net assets for each of the two years in the period then ended, and their financial highlights for each of the two years in the period then ended and the period July 26, 2005 (commencement of operations) to December 31, 2005, in conformity with accounting principles generally accepted in the United States of America.
/s/ Deloitte & Touche LLP
DELOITTE & TOUCHE LLP
Boston, Massachusetts
February 28, 2008
Annual Report
Trustees and Officers
The Trustees, Members of the Advisory Board, and executive officers of the trust and funds, as applicable, are listed below. The Board of Trustees governs each VIP Freedom Lifetime Income Fund and is responsible for protecting the interests of shareholders. The Trustees are experienced executives who meet periodically throughout the year to oversee each VIP Freedom Lifetime Income Fund's activities, review contractual arrangements with companies that provide services to each VIP Freedom Lifetime Income Fund, and review each VIP Freedom Lifetime Income Fund's performance. If the interests of a VIP Freedom Lifetime Income Fund and an underlying Fidelity fund were to diverge, a conflict of interest could arise and affect how the Trustees and Members of the Advisory Board fulfill their fiduciary duties to the affected funds. Strategic Advisers has structured the VIP Freedom Lifetime Income Fund to avoid these potential conflicts, although there may be situations where a conflict of interest is unavoidable. In such instances, Strategic Advisers, the Trustees, and Members of the Advisory Board would take reasonable steps to minimize and, if possible, eliminate the conflict. Except for James C. Curvey, each of the Trustees oversees 373 funds advised by FMR or an affiliate. Mr. Curvey oversees 368 funds advised by FMR or an affiliate.
The Trustees hold office without limit in time except that (a) any Trustee may resign; (b) any Trustee may be removed by written instrument, signed by at least two-thirds of the number of Trustees prior to such removal; (c) any Trustee who requests to be retired or who has become incapacitated by illness or injury may be retired by written instrument signed by a majority of the other Trustees; and (d) any Trustee may be removed at any special meeting of shareholders by a two-thirds vote of the outstanding voting securities of the trust. Each Trustee who is not an interested person (as defined in the 1940 Act) (Independent Trustee), shall retire not later than the last day of the calendar year in which his or her 72nd birthday occurs. The Independent Trustees may waive this mandatory retirement age policy with respect to individual Trustees. The executive officers and Advisory Board Members hold office without limit in time, except that any officer and Advisory Board Member may resign or may be removed by a vote of a majority of the Trustees at any regular meeting or any special meeting of the Trustees. Except as indicated, each individual has held the office shown or other offices in the same company for the past five years.
The funds' Statement of Additional Information (SAI) includes more information about the Trustees. To request a free copy, call Fidelity at 1-877-208-0098.
Interested Trustees*:
Correspondence intended for each Trustee who is an interested person may be sent to Fidelity Investments, 82 Devonshire Street, Boston, Massachusetts 02109.
Name, Age; Principal Occupation |
Edward C. Johnson 3d (77) |
| Year of Election or Appointment: 1989 Mr. Johnson is Chairman of the Board of Trustees. Mr. Johnson serves as President (2006-present), Chief Executive Officer, Chairman, and a Director of FMR LLC; Chairman and a Director of FMR; Chairman and a Director of Fidelity Research & Analysis Company (FRAC); Chairman and a Director of Fidelity Investments Money Management, Inc.; and Chairman (2001-present) and a Director of FMR Co., Inc. In addition, Mr. Johnson serves as Chairman and Director of Fidelity International Limited (FIL).
Mr. Edward C. Johnson 3d and Mr. Arthur E. Johnson are not related. |
James C. Curvey (72) |
| Year of Election or Appointment: 2007 Mr. Curvey also serves as Trustee (2007-present) or Member of the Advisory Board (2007-present) of other investment companies advised by FMR. Mr. Curvey is a Director of FMR and FMR Co., Inc. (2007-present). Mr. Curvey is also Vice Chairman (2006-present) and Director of FMR LLC. Mr. Curvey joined Fidelity in 1982 and served in numerous senior management positions, including President and Chief Operating Officer of FMR LLC (1997-2000) and President of Fidelity Strategic Investments (2000-2002). In addition, he serves as a member of the Board of Directors of Geerlings & Wade, Inc. (wine distribution). |
* Trustees have been determined to be "Interested Trustees" by virtue of, among other things, their affiliation with the trust or various entities under common control with FMR. FMR Corp. merged with and into FMR LLC on October 1, 2007. Any references to FMR LLC for prior periods are deemed to be references to the prior entity.
Independent Trustees:
Correspondence intended for each Independent Trustee (that is, the Trustees other than the Interested Trustees) may be sent to Fidelity Investments, P.O. Box 55235, Boston, Massachusetts 02205-5235.
Name, Age; Principal Occupation |
Dennis J. Dirks (59) |
| Year of Election or Appointment: 2007 Prior to his retirement in May 2003, Mr. Dirks was Chief Operating Officer and a member of the Board of The Depository Trust & Clearing Corporation (DTCC) (1999-2003). He also served as President, Chief Operating Officer, and Board member of The Depository Trust Company (DTC) (1999-2003) and President and Board member of the National Securities Clearing Corporation (NSCC) (1999-2003). In addition, Mr. Dirks served as Chief Executive Officer and Board member of the Government Securities Clearing Corporation (2001-2003) and Chief Executive Officer and Board member of the Mortgage-Backed Securities Clearing Corporation (2001-2003). Mr. Dirks also serves as a Trustee and a member of the Finance Committee of Manhattan College (2005-present) and a Trustee and a member of the Finance Committee of AHRC of Nassau County (2006-present). |
Albert R. Gamper, Jr. (65) |
| Year of Election or Appointment: 2007 Prior to his retirement in December 2004, Mr. Gamper served as Chairman of the Board of CIT Group Inc. (commercial finance). During his tenure with CIT Group Inc. Mr. Gamper served in numerous senior management positions, including Chairman (1987-1989; 1999-2001; 2002-2004), Chief Executive Officer (1987-2004), and President (1989-2002). He currently serves as a member of the Board of Directors of Public Service Enterprise Group (utilities, 2001-present), Chairman of the Board of Governors, Rutgers University (2004-present), and Chairman of the Board of Saint Barnabas Health Care System. |
George H. Heilmeier (71) |
| Year of Election or Appointment: 2004 Dr. Heilmeier is Chairman Emeritus of Telcordia Technologies (communication software and systems), where prior to his retirement, he served as company Chairman and Chief Executive Officer. He currently serves on the Boards of Directors of The Mitre Corporation (systems engineering and information technology support for the government), and HRL Laboratories (private research and development, 2004-present). He is Chairman of the General Motors Science & Technology Advisory Board and a Life Fellow of the Institute of Electrical and Electronics Engineers (IEEE). Dr. Heilmeier is a member of the Defense Science Board and the National Security Agency Advisory Board. He is also a member of the National Academy of Engineering, the American Academy of Arts and Sciences, and the Board of Overseers of the School of Engineering and Applied Science of the University of Pennsylvania. Previously, Dr. Heilmeier served as a Director of TRW Inc. (automotive, space, defense, and information technology, 1992-2002), Compaq (1994-2002), Automatic Data Processing, Inc. (ADP) (technology-based business outsourcing, 1995-2002), INET Technologies Inc. (telecommunications network surveillance, 2001-2004), and Teletech Holdings (customer management services). He is the recipient of the 2005 Kyoto Prize in Advanced Technology for his invention of the liquid crystal display, and a member of the Consumer Electronics Hall of Fame. |
James H. Keyes (67) |
| Year of Election or Appointment: 2007 Prior to his retirement in 2003, Mr. Keyes was Chairman, President, and Chief Executive Officer of Johnson Controls, Inc. (automotive supplier, 1993-2003). He currently serves as a member of the boards of LSI Logic Corporation (semiconductor technologies), Navistar International Corporation (manufacture and sale of trucks, buses, and diesel engines, 2002-present), and Pitney Bowes, Inc. (integrated mail, messaging, and document management solutions). |
Marie L. Knowles (61) |
| Year of Election or Appointment: 2007 Prior to Ms. Knowles' retirement in June 2000, she served as Executive Vice President and Chief Financial Officer of Atlantic Richfield Company (ARCO) (diversified energy, 1996-2000). From 1993 to 1996, she was a Senior Vice President of ARCO and President of ARCO Transportation Company. She served as a Director of ARCO from 1996 to 1998. She currently serves as a Director of Phelps Dodge Corporation (copper mining and manufacturing) and McKesson Corporation (healthcare service, 2002-present). Ms. Knowles is a Trustee of the Brookings Institution and the Catalina Island Conservancy and also serves as a member of the Advisory Board for the School of Engineering of the University of Southern California. |
Ned C. Lautenbach (63) |
| Year of Election or Appointment: 2000 Mr. Lautenbach is Chairman of the Independent Trustees (2006-present). Mr. Lautenbach has been a partner of Clayton, Dubilier & Rice, Inc. (private equity investment firm) since September 1998. Previously, Mr. Lautenbach was with the International Business Machines Corporation (IBM) from 1968 until his retirement in 1998. Mr. Lautenbach serves as a Director of Sony Corporation (2006-present) and Eaton Corporation (diversified industrial) as well as the Philharmonic Center for the Arts in Naples, Florida. He also is a member of the Board of Trustees of Fairfield University (2005-present), as well as a member of the Council on Foreign Relations. |
Cornelia M. Small (63) |
| Year of Election or Appointment: 2005 Ms. Small is a member (2000-present) and Chairperson (2002-present) of the Investment Committee, and a member (2002-present) of the Board of Trustees of Smith College. Previously, she served as Chief Investment Officer (1999-2000), Director of Global Equity Investments (1996-1999), and a member of the Board of Directors of Scudder, Stevens & Clark (1990-1997) and Scudder Kemper Investments (1997-1999). In addition, Ms. Small served as Co-Chair (2000-2003) of the Annual Fund for the Fletcher School of Law and Diplomacy. |
William S. Stavropoulos (68) |
| Year of Election or Appointment: 2001 Mr. Stavropoulos is Chairman Emeritus of the Board of Directors of The Dow Chemical Company. Since joining The Dow Chemical Company in 1967, Mr. Stavropoulos served in numerous senior management positions, including President (1993-2000; 2002-2003), CEO (1995-2000; 2002-2004), and Chairman of the Executive Committee (2000-2004). Currently, he is a Director of NCR Corporation (data warehousing and technology solutions), Chemical Financial Corporation, Maersk Inc. (industrial conglomerate, 2002-present), Tyco International, Inc. (multinational manufacturing and services, 2007-present), and a member of the Advisory Board for Metalmark Capital (private equity investment firm, 2005-present). He is a special advisor to Clayton, Dubilier & Rice, Inc., a private equity investment firm. He also serves as a member of the Board of Trustees of the American Enterprise Institute for Public Policy Research. In addition, Mr. Stavropoulos is a member of The Business Council, J.P. Morgan International Council and the University of Notre Dame Advisory Council for the College of Science. |
Kenneth L. Wolfe (68) |
| Year of Election or Appointment: 2007 Mr. Wolfe is Chairman and a Director of Hershey Foods Corporation (2007-present), where prior to his retirement in 2001, he was Chairman and Chief Executive Officer. Mr. Wolfe currently serves as a member of the board of Revlon Inc. (2004-present). Previously, Mr. Wolfe served as a member of the boards of Adelphia Communications Corporation (2003-2006) and Bausch & Lomb, Inc. (1993-2007). |
Advisory Board Members and Executive Officers**:
Correspondence intended for Mr. Mauriello, Mr. Thomas, Mr. Wiley, Mr. Lacy, and Mr. Arthur Johnson may be sent to Fidelity Investments, P.O. Box 55235, Boston, Massachusetts 02205-5235. Correspondence intended for each executive officer and Mr. Lynch may be sent to Fidelity Investments, 82 Devonshire Street, Boston, Massachusetts 02109.
Name, Age; Principal Occupation |
Arthur E. Johnson (60) |
| Year of Election or Appointment: 2008 Member of the Advisory Board of Variable Insurance Products Fund V. Mr. Johnson serves as Senior Vice President of Corporate Strategic Development of Lockheed Martin Corporation (defense contractor). In addition, Mr. Johnson serves as a member of the Board of Directors of AGL Resources, Inc. (holding company, 2002-present), and IKON Office Solutions, Inc. (document management systems and services). Mr. Arthur E. Johnson and Mr. Edward C. Johnson 3d are not related. |
Alan J. Lacy (54) |
| Year of Election or Appointment: 2008 Member of the Advisory Board of Variable Insurance Products Fund V. Mr. Lacy serves as Senior Adviser (2007-present) of Oak Hill Capital Partners, L.P. (a private equity firm). Mr. Lacy also served as Vice Chairman and Chief Executive Officer of Sears Holdings Corporation and Sears, Roebuck and Co. (retail, 2005-2006; 2000-2005). In addition, Mr. Lacy serves as a member of the Board of Directors of The Western Union Company (global money transfer, 2006-present) and Bristol-Myers Squibb (global pharmaceuticals, 2007-present). Mr. Lacy is a Trustee of the National Parks Conservation Association and The Field Museum of Natural History. |
Peter S. Lynch (63) |
| Year of Election or Appointment: 2003 Member of the Advisory Board of Variable Insurance Products Fund V. Mr. Lynch is Vice Chairman and a Director of FMR, and Vice Chairman (2001-present) and a Director of FMR Co., Inc. Previously, Mr. Lynch served as a Trustee of the Fidelity funds (1990-2003). In addition, he serves as a Trustee of Boston College and as the Chairman of the Inner-City Scholarship Fund. |
Joseph Mauriello (63) |
| Year of Election or Appointment: 2007 Member of the Advisory Board of Variable Insurance Products Fund V. Prior to his retirement in January 2006, Mr. Mauriello served in numerous senior management positions including Deputy Chairman and Chief Operating Officer (2004-2005), and Vice Chairman of Financial Services (2002-2004) of KPMG LLP US (professional services firm, 1965-2005). Mr. Mauriello currently serves as a member of the Board of Directors of XL Capital Ltd. (global insurance and re-insurance company, 2006-present) and of Arcadia Resources Inc. (health care services and products, 2007-present). He also served as a Director of the Hamilton Funds of the Bank of New York (2006-2007). |
David M. Thomas (58) |
| Year of Election or Appointment: 2007 Member of the Advisory Board of Variable Insurance Products Fund V. Previously, Mr. Thomas served as Executive Chairman (2005-2006) and Chairman and Chief Executive Officer (2000-2005) of IMS Health, Inc. (pharmaceutical and healthcare information solutions). In addition, Mr. Thomas serves as a member of the Board of Directors of Fortune Brands, Inc. (consumer products holding company), and Interpublic Group of Companies, Inc. (marketing communication, 2004-present). |
Michael E. Wiley (57) |
| Year of Election or Appointment: 2007 Member of the Advisory Board of Variable Insurance Products Fund V. Mr. Wiley also serves as a member of the Board of Trustees of the University of Tulsa (2000-2006; 2007-present). He serves as a Director of Tesoro Corporation (independent oil refiner and marketer, 2005-present), and a Director of Bill Barrett Corporation (exploration and production company, 2005-present). In addition, he also serves as a Director of Post Oak Bank (privately-held bank, 2004-present). Previously, Mr. Wiley served as a Sr. Energy Advisor of Katzenbach Partners, LLC (consulting firm, 2006-2007), as an Advisory Director of Riverstone Holdings (private investment firm), Chairman, President, and CEO of Baker Hughes, Inc. (oilfield services company, 2000-2004), and as Director of Spinnaker Exploration Company (exploration and production company, 2001-2005). |
Kimberley H. Monasterio (44) |
| Year of Election or Appointment: 2007 President and Treasurer of VIP Freedom Lifetime Income I, VIP Freedom Lifetime Income II, and VIP Freedom Lifetime Income III.
Ms. Monasterio also serves as President and Treasurer of other Fidelity funds (2007-present) and is an employee of FMR (2004-present). Previously, Ms. Monasterio served as Deputy Treasurer of the Fidelity funds (2004-2006). Before joining Fidelity Investments, Ms. Monasterio served as Treasurer (2000-2004) and Chief Financial Officer (2002-2004) of the Franklin Templeton Funds and Senior Vice President of Franklin Templeton Services, LLC (2000-2004). |
Ren Y. Cheng (50) |
| Year of Election or Appointment: 2007 Vice President of VIP Freedom Lifetime Income I, VIP Freedom Lifetime Income II, and VIP Freedom Lifetime Income III. Mr. Cheng also serves as Vice President of certain Asset Allocation Funds (2007-present). Mr. Cheng is Chief Investment Officer of the Global Asset Allocation group (2007-present). Mr. Cheng also serves as Vice President of FMR and FMR Co., Inc. Mr. Cheng served as Managing Director of the Global Asset Allocation group (2005-2007). Previously, Mr. Cheng served as a portfolio manager for the Fidelity Freedom Funds. |
Boyce I. Greer (51) |
| Year of Election or Appointment: 2006 Vice President of VIP Freedom Lifetime Income I, VIP Freedom Lifetime Income II, and VIP Freedom Lifetime Income III. Mr. Greer also serves as Vice President of certain Asset Allocation Funds (2005-present), Fixed-Income Funds (2006-present), and Money Market Funds (2006-present). Mr. Greer is also a Trustee of other investment companies advised by FMR (2003-present). Mr. Greer is an Executive Vice President of FMR (2005-present) and FMR Co., Inc. (2005-present), and Senior Vice President of Fidelity Investments Money Management, Inc. (2006-present). Previously, Mr. Greer served as Vice President of certain Fidelity Equity Funds (2005-2007), a Director and Managing Director of Strategic Advisers, Inc. (2002-2005), and Executive Vice President (2000-2002) and Money Market Group Leader (1997-2002) of the Fidelity Investments Fixed Income Division. Mr. Greer also served as Vice President of Fidelity's Money Market Funds (1997-2002), Senior Vice President of FMR (1997-2002), and Vice President of FIMM (1998-2002). |
Eric D. Roiter (59) |
| Year of Election or Appointment: 2005 Secretary of VIP Freedom Lifetime Income I, VIP Freedom Lifetime Income II, and VIP Freedom Lifetime Income III. He also serves as Secretary of other Fidelity funds; Vice President, General Counsel, and Secretary of FMR Co., Inc. (2001-present) and FMR; Assistant Secretary of Fidelity Management & Research (U.K.) Inc. (2001-present), Fidelity Research & Analysis Company (2001-present), and Fidelity Investments Money Management, Inc. (2001-present). Mr. Roiter is an Adjunct Member, Faculty of Law, at Boston College Law School (2003-present). Previously, Mr. Roiter served as Vice President and Secretary of Fidelity Distributors Corporation (FDC) (1998-2005). |
John B. McGinty, Jr. (45) |
| Year of Election or Appointment: 2008 Assistant Secretary of VIP Freedom Lifetime Income I, VIP Freedom Lifetime Income II, and VIP Freedom Lifetime Income III. Mr. McGinty also serves as Assistant Secretary of other Fidelity funds (2008-present) and is an employee of FMR LLC (2004-present). Mr. McGinty also serves as Senior Vice President, Secretary, and Chief Legal Officer of FDC (2007-present). Before joining Fidelity Investments, Mr. McGinty practiced law at Ropes & Gray, LLP. |
R. Stephen Ganis (41) |
| Year of Election or Appointment: 2006 Anti-Money Laundering (AML) officer of VIP Freedom Lifetime Income I, VIP Freedom Lifetime Income II, and VIP Freedom Lifetime Income III. Mr. Ganis also serves as AML officer of other Fidelity funds (2006-present) and FMR LLC (2003-present). Before joining Fidelity Investments, Mr. Ganis practiced law at Goodwin Procter, LLP (2000-2002). |
Joseph B. Hollis (59) |
| Year of Election or Appointment: 2006 Chief Financial Officer of VIP Freedom Lifetime Income I, VIP Freedom Lifetime Income II, and VIP Freedom Lifetime Income III.
Mr. Hollis also serves as Chief Financial Officer of other Fidelity funds. Mr. Hollis is President of Fidelity Pricing and Cash Management Services (FPCMS) (2005-present). Mr. Hollis also serves as President and Director of Fidelity Service Company, Inc. (2006-present). Previously, Mr. Hollis served as Senior Vice President of Cash Management Services (1999-2002) and Investment Management Operations (2002-2005). |
Kenneth A. Rathgeber (60) |
| Year of Election or Appointment: 2005 Chief Compliance Officer of VIP Freedom Lifetime Income I, VIP Freedom Lifetime Income II, and VIP Freedom Lifetime Income III. Mr. Rathgeber also serves as Chief Compliance Officer of other Fidelity funds (2004-present) and Executive Vice President of Risk Oversight for Fidelity Investments (2002-present). He is Chief Compliance Officer of FMR (2005-present), FMR Co., Inc. (2005-present), Fidelity Management & Research (U.K.) Inc. (2005-present), Fidelity Research & Analysis Company (2005-present), Fidelity Investments Money Management, Inc. (2005-present), and Strategic Advisers, Inc. (2005-present). Previously, Mr. Rathgeber served as Executive Vice President and Chief Operating Officer for Fidelity Investments Institutional Services Company, Inc. (1998-2002). |
Bryan A. Mehrmann (46) |
| Year of Election or Appointment: 2005 Deputy Treasurer of VIP Freedom Lifetime Income I, VIP Freedom Lifetime Income II, and VIP Freedom Lifetime Income III.
Mr. Mehrmann also serves as Deputy Treasurer of other Fidelity funds (2005-present) and is an employee of FMR. Previously,
Mr. Mehrmann served as Vice President of Fidelity Investments Institutional Services Group (FIIS)/Fidelity Investments Institutional Operations Corporation, Inc. (FIIOC) Client Services (1998-2004). |
Kenneth B. Robins (38) |
| Year of Election or Appointment:2005 Deputy Treasurer of VIP Freedom Lifetime Income I, VIP Freedom Lifetime Income II, and VIP Freedom Lifetime Income III. Mr. Robins also serves as Deputy Treasurer of other Fidelity funds (2005-present) and is an employee of FMR (2004-present). Before joining Fidelity Investments, Mr. Robins worked at KPMG LLP, where he was a partner in KPMG's department of professional practice (2002-2004) and a Senior Manager (1999-2000). In addition, Mr. Robins served as Assistant Chief Accountant, United States Securities and Exchange Commission (2000-2002). |
Robert G. Byrnes (41) |
| Year of Election or Appointment: 2005 Assistant Treasurer of VIP Freedom Lifetime Income I, VIP Freedom Lifetime Income II, and VIP Freedom Lifetime Income III.
Mr. Byrnes also serves as Assistant Treasurer of other Fidelity funds (2005-present) and is an employee of FMR (2005-present). Previously, Mr. Byrnes served as Vice President of FPCMS (2003-2005). Before joining Fidelity Investments, Mr. Byrnes worked at Deutsche Asset Management where he served as Vice President of the Investment Operations Group (2000-2003). |
Peter L. Lydecker (53) |
| Year of Election or Appointment: 2004 Assistant Treasurer of VIP Freedom Lifetime Income I, VIP Freedom Lifetime Income II, and VIP Freedom Lifetime Income III.
Mr. Lydecker also serves as Assistant Treasurer of other Fidelity funds (2004) and is an employee of FMR. |
Paul M. Murphy (60) |
| Year of Election or Appointment: 2007 Assistant Treasurer of VIP Freedom Lifetime Income I, VIP Freedom Lifetime Income II, and VIP Freedom Lifetime Income III.
Mr. Murphy also serves as Assistant Treasurer of other Fidelity funds (2007-present) and is an employee of FMR (2007-present). Previously, Mr. Murphy served as Chief Financial Officer of the Fidelity Funds (2005-2006), Vice President and Associate General Counsel of FMR (2007), and Senior Vice President of Fidelity Pricing and Cash Management Services Group (FPCMS) (1994-2007). |
Gary W. Ryan (49) |
| Year of Election or Appointment: 2005 Assistant Treasurer of VIP Freedom Lifetime Income I, VIP Freedom Lifetime Income II, and VIP Freedom Lifetime Income III.
Mr. Ryan also serves as Assistant Treasurer of other Fidelity funds (2005-present) and is an employee of FMR (2005-present). Previously, Mr. Ryan served as Vice President of Fund Reporting in FPCMS (1999-2005). |
** FMR Corp. merged with and into FMR LLC on October 1, 2007. Any references to FMR LLC for prior periods are deemed to be references to the prior entity.
Annual Report
Distributions
The Board of Trustees of each fund voted to pay to shareholders of record at the opening of business on record date, the following distributions per share derived from capital gains realized from sales of portfolio securities:
Fund | Pay Date | Record Date | Capital Gains |
VIP Freedom Lifetime Income I | 02/15/08 | 02/15/08 | $0.19 |
VIP Freedom Lifetime Income II | 02/15/08 | 02/15/08 | $0.25 |
VIP Freedom Lifetime Income III | 02/15/08 | 02/15/08 | $0.32 |
The funds hereby designate as capital gain dividends the amounts noted below for the taxable year ended December 31, 2007, or, if subsequently determined to be different, the net capital gain of such year.
Fund |
VIP Freedom Lifetime Income I | $316,482 |
VIP Freedom Lifetime Income II | $785,785 |
VIP Freedom Lifetime Income III | $494,555 |
A percentage of the dividends distributed during the fiscal year for the following funds qualifies for the dividends-received deduction for corporate shareholders:
Fund |
VIP Freedom Lifetime Income I | |
February, 2007 | 0% |
December, 2007 | 10% |
VIP Freedom Lifetime Income II | |
February, 2007 | 7% |
December, 2007 | 14% |
VIP Freedom Lifetime Income III | |
February, 2007 | 5% |
December, 2007 | 11% |
The funds will notify shareholders in January 2008 of amounts for use in preparing 2007 income tax returns.
VIP Lifetime Income Funds Portfolio
Board Approval of Investment Advisory Contracts and Management Fees
VIP Freedom Lifetime Income Funds
Each year, typically in July, the Board of Trustees, including the Independent Trustees (together, the Board), votes on the renewal of the management contract and administration agreement (together, the Advisory Contracts) for each fund. The Board, assisted by the advice of fund counsel and Independent Trustees' counsel, requests and considers a broad range of information throughout the year.
The Board meets regularly each month except August and takes into account throughout the year matters bearing on Advisory Contracts. The Board, acting directly and through its separate committees, considers at each of its meetings factors that are relevant to the annual renewal of each fund's Advisory Contracts, including the services and support provided to each fund and its shareholders. At the time of the renewal, the Board had 12 standing committees, each composed of Independent Trustees with varying backgrounds, to which the Board has assigned specific subject matter responsibilities in order to enhance effective decision-making by the Board. Each committee has adopted a written charter outlining the structure and purposes of the committee. One such committee, the Equity Contract Committee, meets periodically as needed throughout the year to consider matters specifically related to the annual renewal of Advisory Contracts. The committee requests and receives information on, and makes recommendations to the Independent Trustees concerning, the approval and annual review of the Advisory Contracts.
At its July 2007 meeting, the Board of Trustees, including the Independent Trustees, unanimously determined to renew the Advisory Contracts for each fund. In reaching its determination, the Board considered all factors it believed relevant and ultimately reached a determination, with the assistance of fund counsel and Independent Trustees' counsel, that the renewal of the Advisory Contracts and the compensation to be received by Fidelity under the management contracts is consistent with Fidelity's fiduciary duty under applicable law. In reaching its determination, the Board is aware that shareholders in each fund have a broad range of investment choices available to them, including a wide choice among mutual funds offered by competitors to Fidelity, and that each fund's shareholders, with the opportunity to review and weigh the disclosure provided by the fund in its prospectus and other public disclosures, have chosen to invest in that fund, managed by Fidelity.
Nature, Extent, and Quality of Services Provided. The Board considered staffing within the investment adviser, Strategic Advisers, Inc. (Strategic Advisers), and the administrator, FMR, including the backgrounds of the funds' portfolio managers and the funds' investment objectives and disciplines. The Independent Trustees also had discussions with senior management of Fidelity's investment operations and investment groups. The Board considered the structure of the portfolio manager compensation program and whether this structure provides appropriate incentives.
Resources Dedicated to Investment Management and Support Services. The Board reviewed the size, education, and experience of Strategic Advisers' investment staff, their use of technology, and Strategic Advisers' and FMR's approach to recruiting, training, and retaining portfolio managers and other research, advisory, and management personnel. The Board noted that Fidelity's analysts have access to a variety of technological tools that enable them to perform both fundamental and quantitative analysis and to specialize in various disciplines.
Shareholder and Administrative Services. The Board considered (i) the nature, extent, quality, and cost of advisory, administrative, distribution, and shareholder services performed by FMR and its affiliates under the Advisory Contracts and under separate agreements covering transfer agency, pricing and bookkeeping, and securities lending services for each fund; (ii) the nature and extent of FMR's supervision of third party service providers, principally custodians and subcustodians; and (iii) the resources devoted to, and the record of compliance with, each fund's compliance policies and procedures.
The Board noted that the growth of fund assets across the complex allows Fidelity to reinvest in the development of services designed to enhance the value or convenience of the Fidelity funds as investment vehicles. These services include 24-hour access to account information and market information through phone representatives and over the Internet, and investor education materials and asset allocation tools.
Investment in a Large Fund Family. The Board considered the benefits to shareholders of investing in a Fidelity fund, including the benefits of investing in a fund that is part of a large family of funds offering a variety of investment disciplines and providing for a large variety of mutual fund investor services. The Board noted that, since the last Advisory Contract renewals in July 2006, Fidelity has taken a number of actions that benefited particular funds, including (i) dedicating additional resources to investment research and to restructure the investment research teams; (ii) contractually agreeing to reduce the management fee on Fidelity Advisor Floating Rate High Income Fund; (iii) contractually agreeing to reduce the management fees on Fidelity's California, Massachusetts, New Jersey, and New York AMT Tax-Free Money Market Funds, launching new Institutional Classes and Service Classes of these funds, and contractually agreeing to impose expense limitations on these funds; (iv) eliminating the exchange fee on the Fidelity Select Portfolios and reducing the pricing and bookkeeping fee rates for these funds; (v) reducing the maximum transfer agency fee rates on high income funds and certain equity funds; (vi) proposing amended management contracts that, if approved by shareholders, will add a performance adjustment component to the management fees paid by 18 Fidelity Advisor equity funds; (vii) contractually agreeing to reduce fees for Ultra-Short Central Fund and the money market Central Funds; (viii) waiving the Fidelity Advisor funds' contingent deferred sales charge on certain redemptions made through systematic withdrawal programs; and (ix) amending the management contracts for equity and fixed-income funds whose management contracts incorporate a "group fee" structure by adding four new fee "breakpoints" to the group fee rate schedules.
Investment Performance and Compliance. The Board considered whether each fund has operated within its investment objective, as well as its record of compliance with its investment restrictions. It also reviewed each fund's absolute investment performance, as well as each fund's relative investment performance measured against a proprietary custom index. The Board noted that FMR does not believe that a meaningful peer group exists against which to compare any of the funds' performance. Because each fund had been in existence less than three calendar years, for each fund the following chart considered by the Board shows, for the one-year period ended December 31, 2006, the fund's total return and the total return of a proprietary custom index ("benchmark"). For each fund, the proprietary custom index is an index developed by FMR that represents the performance of the fund's asset classes according to their respective weightings, adjusted on June 30 and December 31 of each calendar year to reflect the fund's increasingly conservative asset allocations.
Annual Report
Board Approval of Investment Advisory Contracts and Management Fees - continued
VIP Freedom Lifetime Income I Portfolio
The Board stated that the relative investment performance of the fund was lower than its benchmark for the period shown. The Board stated that it is difficult to evaluate in any comprehensive fashion the performance of the fund, in light of its relatively recent commencement of operations.
VIP Freedom Lifetime Income II Portfolio
The Board stated that the relative investment performance of the fund was lower than its benchmark for the period shown. The Board stated that it is difficult to evaluate in any comprehensive fashion the performance of the fund, in light of its relatively recent commencement of operations.
VIP Lifetime Income Funds Portfolio
VIP Freedom Lifetime Income III Portfolio
The Board stated that the relative investment performance of the fund was lower than its benchmark for the period shown. The Board stated that it is difficult to evaluate in any comprehensive fashion the performance of the fund, in light of its relatively recent commencement of operations.
The Board considered that FMR has taken steps to refocus and strengthen equity research, equity portfolio management, and compliance.
Based on its review, and giving particular weight to the nature and quality of the resources dedicated by Strategic Advisers and FMR to maintain and improve relative performance, the Board concluded that the nature, extent, and quality of the services provided to each fund will benefit each fund's shareholders, particularly in light of the Board's view that each fund's shareholders benefit from investing in a fund that is part of a large family of funds offering a variety of investment disciplines and services.
Competitiveness of Management Fee and Total Fund Expenses. The Board noted that the funds do not pay Strategic Advisers a management fee for investment advisory services. The Board considered each fund's management fee and total expenses compared to "mapped groups" of competitive funds and classes. Fidelity creates "mapped groups" by combining similar Lipper investment objective categories that have comparable management fee characteristics. Combining Lipper investment objective categories aids the Board's management fee and total expense comparisons by broadening the competitive group used for comparison and by reducing the number of universes to which various Fidelity funds are compared. The Board also considered supplemental information about how each fund's management fee and total expenses ranked relative to groups based on Lipper classifications, which take into account a fund's market capitalization and style.
The Board considered two proprietary management fee comparisons for the 12-month (or shorter) periods shown in the charts below. The group of Lipper funds used by the Board for management fee comparisons is referred to below as the "Total Mapped Group." The Total Mapped Group comparison focuses on a fund's standing relative to the total universe of comparable funds available to investors, in terms of gross management fees before expense reimbursements or caps. "TMG %" represents the percentage of funds in the Total Mapped Group that had management fees that were lower than a fund's. For example, a TMG % of 1% means that 99% of the funds in the Total Mapped Group had higher management fees than a fund. The "Asset-Size Peer Group" (ASPG) comparison focuses on a fund's standing relative to non-Fidelity funds similar in size to the fund within the Total Mapped Group. The ASPG represents at least 15% of the funds in the Total Mapped Group with comparable asset size and management fee characteristics, subject to a minimum of 50 funds (or all funds in the Total Mapped Group if fewer than 50). Additional information, such as the ASPG quartile in which a fund's management fee ranked, is also included in the charts and considered by the Board.
Annual Report
Board Approval of Investment Advisory Contracts and Management Fees - continued
VIP Freedom Lifetime Income I Portfolio
VIP Freedom Lifetime Income II Portfolio
VIP Lifetime Income Funds Portfolio
VIP Freedom Lifetime Income III Portfolio
The Board noted that each fund's management fee ranked below the median of its Total Mapped Group and below the median of its ASPG for 2006.
In its review of each fund's total expenses, the Board noted that each fund invests in Investor Class of the underlying fund to avoid charging fund-paid 12b-1 fees at both fund levels. The Board considered that the funds do not pay transfer agency fees. Instead, Investor Class of each underlying fund bears its pro rata portion of each fund's transfer agency fee according to the percentage of each fund's assets invested in that underlying fund. The Board further noted that FMR pays all other expenses of each fund, with limited exceptions.
The Board noted that each fund's total expenses ranked below its competitive median for 2006.
In its review of total expenses, the Board also considered Fidelity fee structures and other information on clients that FMR and its affiliates service in other competitive markets, such as other mutual funds advised or subadvised by FMR or its affiliates, pension plan clients, and other institutional clients.
Based on its review, the Board concluded that each fund's management fee and total expenses were fair and reasonable in light of the services that the fund and its shareholders receive and the other factors considered.
Costs of the Services and Profitability. The Board considered the level of Fidelity's profits in respect of all the Fidelity funds, as well as the profitability of each underlying fund.
PricewaterhouseCoopers LLP (PwC), independent registered public accounting firm and auditor to Fidelity and certain Fidelity funds, has been engaged annually by the Board as part of the Board's assessment of the results of Fidelity's profitability analysis. PwC's engagement includes the review and assessment of Fidelity's methodologies used in determining the revenues and expenses attributable to Fidelity's mutual fund business, and completion of agreed-upon procedures surrounding the mathematical accuracy of fund profitability and its conformity to allocation methodologies. After considering PwC's reports issued under the engagement and information provided by Fidelity, the Board believes that while other allocation methods may also be reasonable, Fidelity's profitability methodologies are reasonable in all material respects.
The Board has also reviewed Fidelity's non-fund businesses and any fall-out benefits related to the mutual fund business as well as cases where Fidelity's affiliates may benefit from or be related to the funds' business.
The Board concluded that the costs of the services provided by and the profits realized by Fidelity in connection with the operation of each fund were not relevant to the renewal of each fund's Advisory Contracts because the funds do not pay management fees and FMR pays all other expenses of each fund, with limited exceptions.
Economies of Scale. The Board concluded that the realization of economies of scale was not relevant to the renewal of each fund's Advisory Contracts because the funds do not pay management fees and FMR pays all other expenses of each fund, with limited exceptions.
Additional Information Requested by the Board. In order to develop fully the factual basis for consideration of the Fidelity funds' Advisory Contracts, the Board requested and received additional information on several topics, including (i) fund performance trends and actions to be taken by FMR to improve certain funds' overall performance; (ii) Fidelity's portfolio manager compensation structure, including its effects on fund profitability and the extent to which portfolio manager compensation is linked to fund performance; (iii) Fidelity's fee structures; (iv) the funds' sub-advisory arrangements; and (v) accounts managed by Fidelity other than the Fidelity funds.
Annual Report
Board Approval of Investment Advisory Contracts and Management Fees - continued
Based on its evaluation of all of the conclusions noted above, and after considering all material factors, the Board ultimately concluded that the advisory fee structures are fair and reasonable, and that each fund's Advisory Contracts should be renewed.
VIP Lifetime Income Funds Portfolio
Annual Report
VIP Lifetime Income Funds Portfolio
Annual Report
Investment Adviser
Strategic Advisers, Inc.
Boston, MA
General Distributor
Fidelity Distributors Corporation
Boston, MA
Transfer and Service Agents
Fidelity Investments Institutional Operations Company, Inc.
Boston, MA
Fidelity Service Company, Inc.
Boston, MA
Custodian
Mellon Bank, N.A.
Pittsburgh, PA
VIPFLI-ANN-0208
1.816199.102
Fidelity® Variable Insurance Products:
FundsManager - 20%, 50%, 60%, 70%, 85% Portfolio
Annual Report
December 31, 2007
(2_fidelity_logos) (Registered_Trademark)
Contents
To view a fund's proxy voting guidelines and proxy voting record for the 12-month period ended June 30, visit http://www.fidelity.com (search for "proxy voting guidelines") or visit the Securities and Exchange Commission's (SEC) web site at http://www.sec.gov. You may also call 1-877-208-0098 to request a free copy of the proxy voting guidelines.
Fidelity Variable Insurance Products are separate account options which are purchased through a variable insurance contract.
Standard & Poor's, S&P and S&P 500 are registered service marks of The McGraw-Hill Companies, Inc. and have been licensed for use by Fidelity Distributors Corporation.
Other third party marks appearing herein are the property of their respective owners.
All other marks appearing herein are registered or unregistered trademarks or service marks of FMR LLC or an affiliated company.
This report and the financial statements contained herein are submitted for the general information of the shareholders of the funds. This report is not authorized for distribution to prospective investors in the funds unless preceded or accompanied by an effective prospectus.
A fund files its complete schedule of portfolio holdings with the SEC for the first and third quarters of each fiscal year on Form N-Q. Forms N-Q are available on the SEC's web site at http://www.sec.gov. A fund's Forms N-Q may be reviewed and copied at the SEC's Public Reference Room in Washington, DC. Information regarding the operation of the SEC's Public Reference Room may be obtained by calling 1-800-SEC-0330. For a complete list of a fund's portfolio holdings, view the most recent holdings listing, semiannual report, or annual report on Fidelity's web site at http://www.fidelity.com or http://www.advisor.fidelity.com, as applicable.
NOT FDIC INSURED · MAY LOSE VALUE · NO BANK GUARANTEE
Neither the fund nor Fidelity Distributors Corporation is a bank.
VIP FundsManager Portfolio
VIP FundsManager 20% Portfolio
Performance: The Bottom Line
Average annual total return reflects the change in the value of an investment, assuming reinvestment of the class' dividend income and capital gains (the profits earned upon the sale of securities that have grown in value, if any) and assuming a constant rate of performance each year. During periods of reimbursement by Fidelity, a fund's total return will be greater than it would be had the reimbursement not occurred. Performance numbers are net of all underlying fund operating expenses, but do not include any insurance charges imposed by your insurance company's separate account. If performance information included the effect of these additional charges, the total returns would have been lower. How a fund did yesterday is no guarantee of how it will do tomorrow.
Average Annual Total Returns
Periods ended December 31, 2007 | | Past 1
year | Life of Fund A |
VIP FundsManager 20% - Investor Class | | 6.12% | 6.70% |
VIP FundsManager 20% - Service Class B | | 6.12% | 6.70% |
VIP FundsManager 20% - Service Class 2 C | | 5.96% | 6.54% |
A From April 13, 2006.
B Performance for Service Class shares reflects an asset-based service fee (12b-1 fee).
C Performance for Service Class 2 shares reflects an asset-based service fee (12b-1 fee).
$10,000 Over Life of Fund
Let's say hypothetically that $10,000 was invested in VIP FundsManager 20% Portfolio-Investor Class on April 13, 2006, when the fund started. The chart shows how the value of your investment would have changed, and also shows how the Lehman Brothers® U.S. Aggregate Index performed over the same period.
Annual Report
VIP FundsManager 50% Portfolio
Performance: The Bottom Line
Average annual total return reflects the change in the value of an investment, assuming reinvestment of the class' dividend income and capital gains (the profits earned upon the sale of securities that have grown in value, if any) and assuming a constant rate of performance each year. During periods of reimbursement by Fidelity, a fund's total return will be greater than it would be had the reimbursement not occurred. Performance numbers are net of all underlying fund operating expenses, but do not include any insurance charges imposed by your insurance company's separate account. If performance information included the effect of these additional charges, the total returns would have been lower. How a fund did yesterday is no guarantee of how it will do tomorrow.
Average Annual Total Returns
Periods ended December 31, 2007 | | Past 1
year | Life of Fund A |
VIP FundsManager 50% - Investor Class | | 6.99% | 8.37% |
VIP FundsManager 50% - Service Class B | | 6.99% | 8.37% |
VIP FundsManager 50% - Service Class 2 C | | 6.93% | 8.21% |
A From April 13, 2006.
B Performance for Service Class shares reflects an asset-based service fee (12b-1 fee).
C Performance for Service Class 2 shares reflects an asset-based service fee (12b-1 fee).
$10,000 Over Life of Fund
Let's say hypothetically that $10,000 was invested in VIP FundsManager 50% Portfolio-Investor Class on April 13, 2006, when the fund started. The chart shows how the value of your investment would have changed, and also shows how the Standard & Poor's 500SM Index (S&P 500®) performed over the same period.
VIP FundsManager Portfolio
VIP FundsManager 70% Portfolio
Performance: The Bottom Line
Average annual total return reflects the change in the value of an investment, assuming reinvestment of the class' dividend income and capital gains (the profits earned upon the sale of securities that have grown in value, if any) and assuming a constant rate of performance each year. During periods of reimbursement by Fidelity, a fund's total return will be greater than it would be had the reimbursement not occurred. Performance numbers are net of all underlying fund operating expenses, but do not include any insurance charges imposed by your insurance company's separate account. If performance information included the effect of these additional charges, the total returns would have been lower. How a fund did yesterday is no guarantee of how it will do tomorrow.
Average Annual Total Returns
Periods ended December 31, 2007 | | Past 1
year | Life of Fund A |
VIP FundsManager 70% - Investor Class | | 7.80% | 9.58% |
VIP FundsManager 70% - Service Class B | | 7.80% | 9.58% |
VIP FundsManager 70% - Service Class 2 C | | 7.63% | 9.42% |
A From April 13, 2006.
B Performance for Service Class shares reflects an asset-based service fee (12b-1 fee).
C Performance for Service Class 2 shares reflects an asset-based service fee (12b-1 fee).
$10,000 Over Life of Fund
Let's say hypothetically that $10,000 was invested in VIP FundsManager 70% Portfolio-Investor Class on April 13, 2006, when the fund started. The chart shows how the value of your investment would have changed, and also shows how the S&P 500 Index performed over the same period.
Annual Report
VIP FundsManager 85% Portfolio
Performance: The Bottom Line
Average annual total return reflects the change in the value of an investment, assuming reinvestment of the class' dividend income and capital gains (the profits earned upon the sale of securities that have grown in value, if any) and assuming a constant rate of performance each year. During periods of reimbursement by Fidelity, a fund's total return will be greater than it would be had the reimbursement not occurred. Performance numbers are net of all underlying fund operating expenses, but do not include any insurance charges imposed by your insurance company's separate account. If performance information included the effect of these additional charges, the total returns would have been lower. How a fund did yesterday is no guarantee of how it will do tomorrow.
Average Annual Total Returns
Periods ended December 31, 2007 | | Past 1
year | Life of Fund A |
VIP FundsManager 85% - Investor Class | | 8.63% | 10.39% |
VIP FundsManager 85% - Service Class B | | 8.52% | 10.33% |
VIP FundsManager 85% - Service Class 2 C | | 8.36% | 10.17% |
A From April 13, 2006.
B Performance for Service Class shares reflects an asset-based service fee (12b-1 fee).
C Performance for Service Class 2 shares reflects an asset-based service fee (12b-1 fee).
$10,000 Over Life of Fund
Let's say hypothetically that $10,000 was invested in VIP FundsManager 85% Portfolio-Investor Class on April 13, 2006, when the fund started. The chart shows how the value of your investment would have changed, and also shows how the S&P 500 Index performed over the same period.
VIP FundsManager Portfolio
Management's Discussion of Fund Performance
Comments from Scott Kuldell, Portfolio Manager of VIP FundsManager Portfolios
U.S. equity markets, as measured by the bellwether Dow Jones Industrial AverageSM and the Standard & Poor's 500SM Index, registered their fifth consecutive year of positive returns in 2007, as the Dow rose 8.88% and the S&P 500® index advanced 5.49%. The tech-heavy NASDAQ Composite® Index did even better, increasing 10.55%. However, credit- and recession-related concerns carved deeply into stock prices late in 2007, pushing some major market measures into negative territory for the year overall, particularly smaller-cap and value-oriented benchmarks. Based largely on a weak U.S. dollar that boosted returns for U.S. investors, the Morgan Stanley Capital InternationalSM Europe, Australasia, and Far East (MSCI® EAFE®) Index - a gauge of developed stock markets outside the United States and Canada - beat most domestic equity measures, gaining 11.33%. Several European countries had outstanding performance, including Finland and Germany, while Australia also did very well. However, fallout from the credit crunch and concerns about export growth tempered U.K. stocks, while fears that Japanese financial companies would become embroiled in the U.S. subprime mortgage crisis contributed to a loss of more than 4% for the Japanese portion of the index. The emerging-markets stock asset class soared 39.78% according to the MSCI Emerging Markets index. The U.S. investment-grade bond market climbed 6.97% as measured by the Lehman Brothers® U.S. Aggregate Index, beating the 2.53% gain for the Merrill Lynch® U.S. High Yield Master II Constrained Index. The emerging-markets bond category shook off a sluggish first half of 2007 to finish the year with a respectable gain of 6.28% as measured by the J.P. Morgan Emerging Markets Bond Index (EMBI) Global, while the Citigroup® Non-U.S. Group of 7 Index - representing the debt performance of major global economies, excluding the United States - rose 13.05%.
For the year ending December 31, 2007, all but one of the VIP FundsManager Portfolios exceeded their composite benchmarks; the 20% Portfolio trailed its index slightly. (For specific portfolio performance results, please refer to the performance section of this report.) The 60% Portfolio, which launched on August 22, 2007, solidly outperformed its benchmark during this abbreviated period. Across the portfolios, greater equity exposure resulted in higher absolute returns and also greater outperformance relative to the benchmarks. Many Fidelity domestic equity fund managers beat their benchmarks in 2007. As a result, a broad range of domestic equity funds contributed to results. Several international equity funds also helped returns. As for the 20% Portfolio, Fidelity® U.S. Bond Index Fund was a significant drag on results because of its exposure to Fidelity Ultra-Short Central Fund - a diversified pool of short-term assets - which suffered from exposure to subprime mortgage bonds. Fidelity U.S. Bond Index Fund detracted from the fixed-income return in all the portfolios, but, because the 20% Portfolio had the greatest exposure to this fund, it experienced the greatest impact.
The views expressed above reflect those of the portfolio manager(s) only through the end of the period as stated on the cover of this report and do not necessarily represent the views of Fidelity or any other person in the Fidelity organization. Any such views are subject to change at any time based upon market or other conditions and Fidelity disclaims any responsibility to update such views. These views may not be relied on as investment advice and, because investment decisions for a Fidelity fund are based on numerous factors, may not be relied on as an indication of trading intent on behalf of any Fidelity fund.
Annual Report
Shareholder Expense Example
As a shareholder of a Fund, you incur two types of costs: (1) transaction costs, and (2) ongoing costs, including distribution and/or service (12b-1) fees and other Fund expenses. This Example is intended to help you understand your ongoing costs (in dollars) of investing in the Funds and to compare these costs with the ongoing costs of investing in other mutual funds.
The actual expense Example is based on an investment of $1,000 invested at the beginning of the period and held for the entire period (July 1, 2007 to December 31, 2007), except for VIP FundsManager 60% Portfolio. The actual Expense Example is based on an investment of $1,000 invested at the beginning of the period and held for the entire period (August 22, 2007 to December 31, 2007). The hypothetical expense Example is based on an investment of $1,000 invested for the one-half year period (July 1, 2007 to December 31, 2007).
Actual Expenses
The first line of the accompanying table for each class of each fund provides information about actual account values and actual expenses. You may use the information in this line, together with the amount you invested, to estimate the expenses that you paid over the period. Simply divide your account value by $1,000.00 (for example, an $8,600 account value divided by $1,000.00 = 8.6), then multiply the result by the number in the first line for a class of the fund under the heading entitled "Expenses Paid During Period" to estimate the expenses you paid on your account during this period. The estimate of expenses does not include any fees or other expenses of any variable annuity or variable life insurance product. If they were, the estimate of expenses you paid during the period would be higher, and your ending account value would be lower. In addition, each Fund, as a shareholder in underlying Fidelity Funds, will indirectly bear its pro rata share of the fees and expenses incurred by the underlying Fidelity Funds. These fees and expenses are not included in each Fund's annualized expense ratio used to calculate the expense estimates in the table below.
Hypothetical Example for Comparison Purposes
The second line of the accompanying table for each class of each fund provides information about hypothetical account values and hypothetical expenses based on a Class' actual expense ratio and an assumed rate of return of 5% per year before expenses, which is not the Class' actual return. The hypothetical account values and expenses may not be used to estimate the actual ending account balance or expenses you paid for the period. You may use this information to compare the ongoing costs of investing in the Fund and other funds. To do so, compare this 5% hypothetical example with the 5% hypothetical examples that appear in the shareholder reports of the other funds. The estimate of expenses does not include any fees or other expenses of any variable annuity or variable life insurance product. If they were, the estimate of expenses you paid during the period would be higher, and your ending account value would be lower. In addition, each Fund, as a shareholder in underlying Fidelity Funds, will indirectly bear its pro rata share of the fees and expenses incurred by the underlying Fidelity Funds. These fees and expenses are not included in each Fund's annualized expense ratio used to calculate the expense estimates in the table below.
Please note that the expenses shown in the table are meant to highlight your ongoing costs only and do not reflect any transaction costs. Therefore, the second line of the table is useful in comparing ongoing costs only, and will not help you determine the relative total costs of owning different funds.
| Beginning
Account Value
July 1, 2007 | Ending
Account Value
December 31, 2007 | Expenses Paid
During Period
July 1, 2007 to
December 31, 2007 |
VIP FundsManager 20% Portfolio | | | |
Service Class | | | |
Actual | $ 1,000.00 | $ 1,024.40 | $ 1.02 C |
Hypothetical A | $ 1,000.00 | $ 1,024.20 | $ 1.02 C |
Service Class 2 | | | |
Actual | $ 1,000.00 | $ 1,023.80 | $ 1.79 C |
HypotheticalA | $ 1,000.00 | $ 1,023.44 | $ 1.79 C |
Investor Class | | | |
Actual | $ 1,000.00 | $ 1,024.40 | $ 1.02 C |
HypotheticalA | $ 1,000.00 | $ 1,024.20 | $ 1.02 C |
VIP FundsManager 50% Portfolio | | | |
Service Class | | | |
Actual | $ 1,000.00 | $ 1,011.60 | $ 1.01 C |
HypotheticalA | $ 1,000.00 | $ 1,024.20 | $ 1.02 C |
Service Class 2 | | | |
Actual | $ 1,000.00 | $ 1,011.00 | $ 1.77 C |
HypotheticalA | $ 1,000.00 | $ 1,023.44 | $ 1.79 C |
Investor Class | | | |
Actual | $ 1,000.00 | $ 1,011.60 | $ 1.01 C |
HypotheticalA | $ 1,000.00 | $ 1,024.20 | $ 1.02 C |
| Beginning
Account Value
July 1, 2007 | Ending
Account Value
December 31, 2007 | Expenses Paid
During Period
July 1, 2007 to
December 31, 2007 |
VIP FundsManager 60% Portfolio | | | |
Service Class | | | |
Actual | $ 1,000.00 | $ 1,040.70 | $ .74 B |
Hypothetical A | $ 1,000.00 | $ 1,024.20 | $ 1.02 C |
Service Class 2 | | | |
Actual | $ 1,000.00 | $ 1,040.10 | $ 1.29 B |
Hypothetical A | $ 1,000.00 | $ 1,023.44 | $ 1.79 C |
Investor Class | | | |
Actual | $ 1,000.00 | $ 1,040.70 | $ .74 B |
Hypothetical A | $ 1,000.00 | $ 1,024.20 | $ 1.02 C |
VIP FundsManager 70% Portfolio | | | |
Service Class | | | |
Actual | $ 1,000.00 | $ 1,001.90 | $ 1.01 C |
Hypothetical A | $ 1,000.00 | $ 1,024.20 | $ 1.02 C |
Service Class 2 | | | |
Actual | $ 1,000.00 | $ 1,001.30 | $ 1.77 C |
Hypothetical A | $ 1,000.00 | $ 1,023.44 | $ 1.79 C |
Investor Class | | | |
Actual | $ 1,000.00 | $ 1,001.90 | $ 1.01 C |
Hypothetical A | $ 1,000.00 | $ 1,024.20 | $ 1.02 C |
VIP FundsManager 85% Portfolio | | | |
Service Class | | | |
Actual | $ 1,000.00 | $ 997.10 | $ 1.01 C |
Hypothetical A | $ 1,000.00 | $ 1,024.20 | $ 1.02 C |
Service Class 2 | | | |
Actual | $ 1,000.00 | $ 996.50 | $ 1.76 C |
Hypothetical A | $ 1,000.00 | $ 1,023.44 | $ 1.79 C |
Investor Class | | | |
Actual | $ 1,000.00 | $ 998.00 | $ 1.01 C |
Hypothetical A | $ 1,000.00 | $ 1,024.20 | $ 1.02 C |
A 5% return per year before expenses.
B Actual expenses are equal to each Class' annualized expense ratio (shown in the table below); multiplied by the average account value over the period, multiplied by 132/365 (to reflect the period August 22, 2007 to December 31, 2007.)
C Expenses are equal to each Class' annualized expense ratio (shown in the table below); multiplied by the average account value over the period, multiplied by 184/365 (to reflect the one-half year period).
The fees and expenses of the underlying Fidelity Funds in which each Fund invests are not included in each class' annualized expense ratio.
| Annualized
Expense Ratio |
VIP FundsManager 20% Portfolio | |
Service Class | .20% |
Service Class 2 | .35% |
Investor Class | .20% |
VIP FundsManager 50% Portfolio | |
Service Class | .20% |
Service Class 2 | .35% |
Investor Class | .20% |
VIP FundsManager 60% Portfolio | |
Service Class | .20% |
Service Class 2 | .35% |
Investor Class | .20% |
VIP FundsManager 70% Portfolio | |
Service Class | .20% |
Service Class 2 | .35% |
Investor Class | .20% |
VIP FundsManager 85% Portfolio | |
Service Class | .20% |
Service Class 2 | .35% |
Investor Class | .20% |
Annual Report
VIP FundsManager 20% Portfolio
Investment Summary
Fund Holdings as of December 31, 2007 |
| % of fund's investments |
Domestic Equity Funds | |
Fidelity 100 Index Fund | 1.0 |
Fidelity Contrafund | 1.7 |
Fidelity Equity-Income II Fund | 0.5 |
Fidelity Fund | 3.4 |
Fidelity Growth Company Fund | 0.1 |
Fidelity Large Cap Stock Fund | 1.5 |
Fidelity Leveraged Company Stock Fund | 2.1 |
Fidelity Mid-Cap Stock Fund | 0.1 |
Fidelity New Millennium Fund | 1.9 |
Fidelity Real Estate Investment Portfolio | 0.2 |
Fidelity Small Cap Growth Fund | 0.2 |
Fidelity Small Cap Stock Fund | 0.1 |
Fidelity Small Cap Value Fund | 0.1 |
Fidelity Stock Selector Fund | 2.3 |
Fidelity Value Discovery Fund | 0.2 |
VIP Growth & Income Portfolio Investor Class | 1.8 |
VIP Growth Portfolio Investor Class | 1.3 |
| 18.5 |
International Equity Funds | |
Fidelity International Discovery Fund | 0.7 |
Fidelity International Real Estate Fund | 0.7 |
Fidelity Overseas Fund | 0.7 |
| 2.1 |
Fixed-Income Funds | |
Fidelity Capital & Income Fund | 4.0 |
Fidelity Floating Rate High Income Fund | 2.0 |
Fidelity New Markets Income Fund | 3.0 |
Fidelity U.S. Bond Index Fund | 42.0 |
| 51.0 |
Money Market Funds | |
Fidelity Institutional Prime Money Market Portfolio Class I | 28.4 |
| 100.0 |
Asset Allocation (% of fund's investments) |
As of December 31, 2007 |
 | Domestic
Equity Funds | 18.5% | |
 | International
Equity Funds | 2.1% | |
 | Fixed Income
Funds | 51.0% | |
 | Money Market
Funds | 28.4% | |

As of June 30, 2007 |
| Domestic
Equity Funds | 18.4% | |
| International
Equity Funds | 2.2% | |
| Fixed Income
Funds | 50.8% | |
| Money Market
Funds | 28.6% | |

VIP FundsManager Portfolio
VIP FundsManager 20% Portfolio
Investments December 31, 2007
Showing Percentage of Total Value of Investment in Securities
Equity Funds - 20.6% |
| Shares | | Value |
Domestic Equity Funds - 18.5% |
Fidelity 100 Index Fund | 107,581 | | $ 1,140,358 |
Fidelity Contrafund | 27,705 | | 2,025,529 |
Fidelity Equity-Income II Fund | 24,824 | | 570,452 |
Fidelity Fund | 99,249 | | 3,955,061 |
Fidelity Growth Company Fund | 1,385 | | 114,944 |
Fidelity Large Cap Stock Fund | 87,368 | | 1,688,828 |
Fidelity Leveraged Company Stock Fund | 76,102 | | 2,460,363 |
Fidelity Mid-Cap Stock Fund | 3,967 | | 115,992 |
Fidelity New Millennium Fund | 73,455 | | 2,188,227 |
Fidelity Real Estate Investment Portfolio | 10,715 | | 278,370 |
Fidelity Small Cap Growth Fund | 11,502 | | 181,503 |
Fidelity Small Cap Stock Fund | 6,575 | | 114,600 |
Fidelity Small Cap Value Fund | 7,656 | | 104,117 |
Fidelity Stock Selector Fund | 91,069 | | 2,686,534 |
Fidelity Value Discovery Fund | 12,774 | | 229,174 |
VIP Growth & Income Portfolio Investor Class | 121,904 | | 2,067,498 |
VIP Growth Portfolio Investor Class | 33,378 | | 1,502,007 |
TOTAL DOMESTIC EQUITY FUNDS | | 21,423,557 |
International Equity Funds - 2.1% |
Fidelity International Discovery Fund | 20,126 | | 867,017 |
Fidelity International Real Estate Fund | 63,493 | | 850,809 |
Fidelity Overseas Fund | 17,893 | | 865,842 |
TOTAL INTERNATIONAL EQUITY FUNDS | | 2,583,668 |
TOTAL EQUITY FUNDS (Cost $25,324,991) | 24,007,225 |
Fixed-Income Funds - 51.0% |
| | | |
Fidelity Capital & Income Fund | 535,399 | | 4,647,267 |
Fidelity Floating Rate High Income Fund | 243,279 | | 2,328,176 |
Fidelity New Markets Income Fund | 237,593 | | 3,487,871 |
Fidelity U.S. Bond Index Fund | 4,477,801 | | 48,763,256 |
TOTAL FIXED-INCOME FUNDS (Cost $58,948,400) | 59,226,570 |
Money Market Funds - 28.4% |
| | | |
Fidelity Institutional Prime Money Market Portfolio Class I
(Cost $32,971,194) | 32,971,194 | | 32,971,194 |
TOTAL INVESTMENT IN SECURITIES - 100% (Cost $117,244,585) | $ 116,204,989 |
See accompanying notes which are an integral part of the financial statements.
Annual Report
VIP FundsManager 20% Portfolio
Financial Statements
Statement of Assets and Liabilities
| December 31, 2007 |
Assets | | |
Investment in securities, at value (cost $117,244,585) - See accompanying schedule | | $ 116,204,989 |
Receivable for fund shares sold | | 308,349 |
Total assets | | 116,513,338 |
| | |
Liabilities | | |
Payable for investments purchased | $ 307,986 | |
Payable for fund shares redeemed | 347 | |
Accrued management fee | 18,836 | |
Distribution fees payable | 14 | |
Total liabilities | | 327,183 |
| | |
Net Assets | | $ 116,186,155 |
Net Assets consist of: | | |
Paid in capital | | $ 116,822,530 |
Accumulated undistributed net realized gain (loss) on investments | | 403,221 |
Net unrealized appreciation (depreciation) on investments | | (1,039,596) |
Net Assets | | $ 116,186,155 |
Statement of Assets and Liabilities - continued
| December 31, 2007 |
Service Class:
Net Asset Value, offering price and redemption price per share ($111,799 ÷ 10,667 shares) | | $ 10.48 |
| | |
Service Class 2:
Net Asset Value, offering price and redemption price per share ($111,512 ÷ 10,641 shares) | | $ 10.48 |
| | |
Investor Class:
Net Asset Value, offering price and redemption price per share ($115,962,844 ÷ 11,069,590 shares) | | $ 10.48 |
See accompanying notes which are an integral part of the financial statements.
VIP FundsManager Portfolio
Statement of Operations
| Year ended December 31, 2007 |
Investment Income | | |
Income distributions from underlying funds | | $ 3,138,167 |
Interest | | 277 |
Total income | | 3,138,444 |
| | |
Expenses | | |
Management fee | $ 177,146 | |
Distribution fees | 380 | |
Independent trustees' compensation | 222 | |
Total expenses before reductions | 177,748 | |
Expense reductions | (36,170) | 141,578 |
Net investment income (loss) | | 2,996,866 |
Realized and Unrealized Gain (Loss) Realized gain (loss) on sale of underlying fund shares | 933,405 | |
Capital gain distributions from underlying funds | 1,112,171 | 2,045,576 |
Change in net unrealized appreciation (depreciation) on underlying funds | | (1,206,656) |
Net gain (loss) | | 838,920 |
Net increase (decrease) in net assets resulting from operations | | $ 3,835,786 |
Statement of Changes in Net Assets
| Year ended
December 31, 2007 | For the period
April 13, 2006
(Commencement of Operations) to
December 31, 2006 |
Increase (Decrease) in Net Assets | | |
Operations | | |
Net investment income (loss) | $ 2,996,866 | $ 327,696 |
Net realized gain (loss) | 2,045,576 | 255,502 |
Change in net unrealized appreciation (depreciation) | (1,206,656) | 167,060 |
Net increase (decrease) in net assets resulting from operations | 3,835,786 | 750,258 |
Distributions to shareholders from net investment income | (3,045,063) | (329,928) |
Distributions to shareholders from net realized gain | (1,732,833) | (114,596) |
Total distributions | (4,777,896) | (444,524) |
Share transactions - net increase (decrease) | 92,872,808 | 23,949,723 |
Total increase (decrease) in net assets | 91,930,698 | 24,255,457 |
| | |
Net Assets | | |
Beginning of period | 24,255,457 | - |
End of period | $ 116,186,155 | $ 24,255,457 |
See accompanying notes which are an integral part of the financial statements.
Annual Report
Financial Highlights - Service Class
Years ended December 31, | 2007 | 2006 G |
Selected Per-Share Data | | |
Net asset value, beginning of period | $ 10.34 | $ 10.00 |
Income from Investment Operations | | |
Net investment income (loss) E | .45 | .33 |
Net realized and unrealized gain (loss) | .18 | .20 |
Total from investment operations | .63 | .53 |
Distributions from net investment income | (.29) | (.14) |
Distributions from net realized gain | (.20) | (.05) |
Total distributions | (.49) | (.19) |
Net asset value, end of period | $ 10.48 | $ 10.34 |
Total Return B,C,D | 6.12% | 5.34% |
Ratios to Average Net Assets F,H | | |
Expenses before reductions | .35% | .35% A |
Expenses net of fee waivers, if any | .20% | .20% A |
Expenses net of all reductions | .20% | .20% A |
Net investment income (loss) | 4.20% | 4.52% A |
Supplemental Data | | |
Net assets, end of period (000 omitted) | $ 112 | $ 105 |
Portfolio turnover rate | 76% | 92% A |
A Annualized
B Total returns for periods of less than one year are not annualized.
C Total returns do not reflect charges attributable to your insurance company's separate account. Inclusion of these charges would reduce the total returns shown.
D Total returns would have been lower had certain expenses not been reduced during the periods shown.
E Calculated based on average shares outstanding during the period.
F Amounts do not include the activity of the underlying funds.
G For the period April 13, 2006 (commencement of operations) to December 31, 2006.
H Expense ratios reflect operating expenses of the class. Expenses before reductions do not reflect amounts reimbursed by the investment adviser or expense offset arrangements and do not represent the amount paid by the class during periods when reimbursements or reductions occur. Expense ratios before reductions for start-up periods may not be representative of longer-term operating periods. Expenses net of fee waivers reflect expenses after reimbursement by the investment adviser but prior to reductions from expense offset arrangements. Expenses net of all reductions represent the net expenses paid by the class but do not include expenses of the investment companies in which the Fund invests.
Financial Highlights - Service Class 2
Years ended December 31, | 2007 | 2006 G |
Selected Per-Share Data | | |
Net asset value, beginning of period | $ 10.34 | $ 10.00 |
Income from Investment Operations | | |
Net investment income (loss) E | .43 | .32 |
Net realized and unrealized gain (loss) | .18 | .20 |
Total from investment operations | .61 | .52 |
Distributions from net investment income | (.27) | (.13) |
Distributions from net realized gain | (.20) | (.05) |
Total distributions | (.47) | (.18) |
Net asset value, end of period | $ 10.48 | $ 10.34 |
Total Return B,C,D | 5.96% | 5.23% |
Ratios to Average Net Assets F,H | | |
Expenses before reductions | .50% | .50% A |
Expenses net of fee waivers, if any | .35% | .35% A |
Expenses net of all reductions | .35% | .35% A |
Net investment income (loss) | 4.05% | 4.38% A |
Supplemental Data | | |
Net assets, end of period (000 omitted) | $ 112 | $ 105 |
Portfolio turnover rate | 76% | 92% A |
A Annualized
B Total returns for periods of less than one year are not annualized.
C Total returns do not reflect charges attributable to your insurance company's separate account. Inclusion of these charges would reduce the total returns shown.
D Total returns would have been lower had certain expenses not been reduced during the periods shown.
E Calculated based on average shares outstanding during the period.
F Amounts do not include the activity of the underlying funds.
G For the period April 13, 2006 (commencement of operations) to December 31, 2006.
H Expense ratios reflect operating expenses of the class. Expenses before reductions do not reflect amounts reimbursed by the investment adviser or expense offset arrangements and do not represent the amount paid by the class during periods when reimbursements or reductions occur. Expense ratios before reductions for start-up periods may not be representative of longer-term operating periods. Expenses net of fee waivers reflect expenses after reimbursement by the investment adviser but prior to reductions from expense offset arrangements. Expenses net of all reductions represent the net expenses paid by the class but do not include expenses of the investment companies in which the Fund invests.
See accompanying notes which are an integral part of the financial statements.
VIP FundsManager Portfolio
Financial Highlights - Investor Class
Years ended December 31, | 2007 | 2006 G |
Selected Per-Share Data | | |
Net asset value, beginning of period | $ 10.34 | $ 10.00 |
Income from Investment Operations | | |
Net investment income (loss) E | .45 | .33 |
Net realized and unrealized gain (loss) | .18 | .20 |
Total from investment operations | .63 | .53 |
Distributions from net investment income | (.29) | (.14) |
Distributions from net realized gain | (.20) | (.05) |
Total distributions | (.49) | (.19) |
Net asset value, end of period | $ 10.48 | $ 10.34 |
Total Return B,C,D | 6.12% | 5.34% |
Ratios to Average Net Assets F,H | | |
Expenses before reductions | .25% | .25% A |
Expenses net of fee waivers, if any | .20% | .20% A |
Expenses net of all reductions | .20% | .20% A |
Net investment income (loss) | 4.20% | 4.52% A |
Supplemental Data | | |
Net assets, end of period (000 omitted) | $ 115,963 | $ 24,045 |
Portfolio turnover rate | 76% | 92% A |
A Annualized
B Total returns for periods of less than one year are not annualized.
C Total returns do not reflect charges attributable to your insurance company's separate account. Inclusion of these charges would reduce the total returns shown.
D Total returns would have been lower had certain expenses not been reduced during the periods shown.
E Calculated based on average shares outstanding during the period.
F Amounts do not include the activity of the underlying funds.
G For the period April 13, 2006 (commencement of operations) to December 31, 2006.
H Expense ratios reflect operating expenses of the class. Expenses before reductions do not reflect amounts reimbursed by the investment adviser or expense offset arrangements and do not represent the amount paid by the class during periods when reimbursements or reductions occur. Expense ratios before reductions for start-up periods may not be representative of longer-term operating periods. Expenses net of fee waivers reflect expenses after reimbursement by the investment adviser but prior to reductions from expense offset arrangements. Expenses net of all reductions represent the net expenses paid by the class but do not include expenses of the investment companies in which the Fund invests.
See accompanying notes which are an integral part of the financial statements.
Annual Report
VIP FundsManager 50% Portfolio
Investment Summary
Fund Holdings as of December 31, 2007 |
| % of fund's investments |
Domestic Equity Funds | |
Fidelity Contrafund | 3.6 |
Fidelity Disciplined Equity Fund | 2.8 |
Fidelity Equity Income Fund | 0.5 |
Fidelity Equity-Income II Fund | 6.9 |
Fidelity Fund | 5.0 |
Fidelity Growth Company Fund | 0.1 |
Fidelity Large Cap Stock Fund | 4.2 |
Fidelity Large Cap Value Fund | 3.5 |
Fidelity Leveraged Company Stock Fund | 2.3 |
Fidelity Mid Cap Value Fund | 2.3 |
Fidelity Mid-Cap Stock Fund | 0.1 |
Fidelity Nasdaq Composite Index Fund | 0.8 |
Fidelity New Millennium Fund | 0.8 |
Fidelity Real Estate Investment Portfolio | 0.7 |
Fidelity Small Cap Growth Fund | 0.2 |
Fidelity Small Cap Stock Fund | 0.1 |
Fidelity Small Cap Value Fund | 0.2 |
Fidelity Stock Selector Fund | 2.5 |
Fidelity Value Discovery Fund | 0.3 |
Fidelity Value Strategies Fund | 1.2 |
Spartan Total Market Index Fund Investor Class | 2.0 |
Spartan U.S. Equity Index Fund Investor Class | 0.6 |
VIP Growth & Income Portfolio Investor Class | 3.3 |
VIP Growth Opportunities Portfolio Investor Class | 1.0 |
VIP Growth Portfolio Investor Class | 0.9 |
| 45.9 |
International Equity Funds | |
Fidelity International Discovery Fund | 2.2 |
Fidelity International Real Estate Fund | 1.2 |
Fidelity Overseas Fund | 2.3 |
| 5.7 |
Fixed-Income Funds | |
Fidelity Capital & Income Fund | 4.0 |
Fidelity Floating Rate High Income Fund | 1.0 |
Fidelity New Markets Income Fund | 2.0 |
Fidelity U.S. Bond Index Fund | 32.7 |
| 39.7 |
Money Market Funds | |
Fidelity Institutional Prime Money Market Portfolio Class I | 8.7 |
| 100.0 |
Asset Allocation (% of fund's investments) |
As of December 31, 2007 |
| Domestic
Equity Funds | 45.9% | |
| International
Equity Funds | 5.7% | |
| Fixed Income
Funds | 39.7% | |
| Money Market
Funds | 8.7% | |

As of June 30, 2007 |
| Domestic
Equity Funds | 45.9% | |
| International
Equity Funds | 5.7% | |
| Fixed Income
Funds | 39.6% | |
| Money Market
Funds | 8.8% | |

VIP FundsManager Portfolio
VIP FundsManager 50% Portfolio
Investments December 31, 2007
Showing Percentage of Total Value of Investment in Securities
Equity Funds - 51.6% |
| Shares | | Value |
Domestic Equity Funds - 45.9% |
Fidelity Contrafund | 180,559 | | $ 13,200,645 |
Fidelity Disciplined Equity Fund | 355,907 | | 10,506,370 |
Fidelity Equity Income Fund | 32,729 | | 1,805,339 |
Fidelity Equity-Income II Fund | 1,115,695 | | 25,638,660 |
Fidelity Fund | 465,078 | | 18,533,375 |
Fidelity Growth Company Fund | 4,466 | | 370,573 |
Fidelity Large Cap Stock Fund | 808,333 | | 15,625,072 |
Fidelity Large Cap Value Fund | 893,495 | | 12,955,671 |
Fidelity Leveraged Company Stock Fund | 267,378 | | 8,644,319 |
Fidelity Mid Cap Value Fund | 520,884 | | 8,479,995 |
Fidelity Mid-Cap Stock Fund | 12,693 | | 371,133 |
Fidelity Nasdaq Composite Index Fund | 84,709 | | 2,974,149 |
Fidelity New Millennium Fund | 97,685 | | 2,910,041 |
Fidelity Real Estate Investment Portfolio | 102,819 | | 2,671,236 |
Fidelity Small Cap Growth Fund | 56,251 | | 887,634 |
Fidelity Small Cap Stock Fund | 21,194 | | 369,413 |
Fidelity Small Cap Value Fund | 54,661 | | 743,388 |
Fidelity Stock Selector Fund | 309,731 | | 9,137,075 |
Fidelity Value Discovery Fund | 61,433 | | 1,102,104 |
Fidelity Value Strategies Fund | 150,230 | | 4,323,630 |
Spartan Total Market Index Fund Investor Class | 178,660 | | 7,307,189 |
Spartan U.S. Equity Index Fund Investor Class | 45,934 | | 2,383,961 |
VIP Growth & Income Portfolio Investor Class | 722,085 | | 12,246,562 |
VIP Growth Opportunities Portfolio Investor Class (a) | 171,912 | | 3,830,196 |
VIP Growth Portfolio Investor Class | 74,278 | | 3,342,515 |
TOTAL DOMESTIC EQUITY FUNDS | | 170,360,245 |
International Equity Funds - 5.7% |
Fidelity International Discovery Fund | 192,962 | | 8,312,823 |
Fidelity International Real Estate Fund | 338,808 | | 4,540,027 |
Fidelity Overseas Fund | 172,731 | | 8,358,472 |
TOTAL INTERNATIONAL EQUITY FUNDS | | 21,211,322 |
TOTAL EQUITY FUNDS (Cost $199,519,113) | 191,571,567 |
Fixed-Income Funds - 39.7% |
| | | |
Fidelity Capital & Income Fund | 1,714,818 | | 14,884,621 |
Fidelity Floating Rate High Income Fund | 389,593 | | 3,728,405 |
Fidelity New Markets Income Fund | 508,566 | | 7,465,742 |
Fidelity U.S. Bond Index Fund | 11,158,522 | | 121,516,309 |
TOTAL FIXED-INCOME FUNDS (Cost $146,868,956) | 147,595,077 |
Money Market Funds - 8.7% |
| Shares | | Value |
Fidelity Institutional Prime Money Market Portfolio Class I
(Cost $32,421,122) | 32,421,122 | | $ 32,421,122 |
TOTAL INVESTMENT IN SECURITIES - 100% (Cost $378,809,191) | $ 371,587,766 |
Legend |
(a) Non-income producing |
See accompanying notes which are an integral part of the financial statements.
Annual Report
VIP FundsManager 50% Portfolio
Financial Statements
Statement of Assets and Liabilities
| December 31, 2007 |
Assets | | |
Investment in securities, at value (cost $378,809,191) - See accompanying schedule | | $ 371,587,766 |
Receivable for fund shares sold | | 662,014 |
Total assets | | 372,249,780 |
| | |
Liabilities | | |
Payable to custodian bank | $ 2 | |
Payable for investments purchased | 661,963 | |
Payable for fund shares redeemed | 17 | |
Accrued management fee | 60,842 | |
Distribution fees payable | 14 | |
Total liabilities | | 722,838 |
| | |
Net Assets | | $ 371,526,942 |
Net Assets consist of: | | |
Paid in capital | | $ 374,308,536 |
Accumulated undistributed net realized gain (loss) on investments | | 4,439,831 |
Net unrealized appreciation (depreciation) on investments | | (7,221,425) |
Net Assets | | $ 371,526,942 |
Statement of Assets and Liabilities - continued
| December 31, 2007 |
Service Class:
Net Asset Value, offering price and redemption price per share ($114,798 ÷ 10,924 shares) | | $ 10.51 |
| | |
Service Class 2:
Net Asset Value, offering price and redemption price per share ($114,502 ÷ 10,897 shares) | | $ 10.51 |
| | |
Investor Class:
Net Asset Value, offering price and redemption price per share ($371,297,642 ÷ 35,340,109 shares) | | $ 10.51 |
See accompanying notes which are an integral part of the financial statements.
VIP FundsManager Portfolio
Statement of Operations
| Year ended December 31, 2007 |
Investment Income | | |
Income distributions from underlying funds | | $ 8,430,564 |
Interest | | 396 |
Total income | | 8,430,960 |
| | |
Expenses | | |
Management fee | $ 664,247 | |
Distribution fees | 390 | |
Independent trustees' compensation | 861 | |
Total expenses before reductions | 665,498 | |
Expense reductions | (133,499) | 531,999 |
Net investment income (loss) | | 7,898,961 |
Realized and Unrealized Gain (Loss) Realized gain (loss) on sale of underlying fund shares | 7,352,614 | |
Capital gain distributions from underlying funds | 8,917,129 | 16,269,743 |
Change in net unrealized appreciation (depreciation) on underlying funds | | (9,534,386) |
Net gain (loss) | | 6,735,357 |
Net increase (decrease) in net assets resulting from operations | | $ 14,634,318 |
Statement of Changes in Net Assets
| Year ended
December 31,
2007 | For the period
April 13, 2006
(Commencement of Operations) to
December 31, 2006 |
Increase (Decrease) in Net Assets | | |
Operations | | |
Net investment income (loss) | $ 7,898,961 | $ 1,609,708 |
Net realized gain (loss) | 16,269,743 | 3,559,783 |
Change in net unrealized appreciation (depreciation) | (9,534,386) | 2,312,961 |
Net increase (decrease) in net assets resulting from operations | 14,634,318 | 7,482,452 |
Distributions to shareholders from net investment income | (7,948,355) | (1,627,619) |
Distributions to shareholders from net realized gain | (14,111,683) | (1,210,707) |
Total distributions | (22,060,038) | (2,838,326) |
Share transactions - net increase (decrease) | 234,994,088 | 139,314,448 |
Total increase (decrease) in net assets | 227,568,368 | 143,958,574 |
| | |
Net Assets | | |
Beginning of period | 143,958,574 | - |
End of period | $ 371,526,942 | $ 143,958,574 |
See accompanying notes which are an integral part of the financial statements.
Annual Report
Financial Highlights - Service Class
Years ended December 31, | 2007 | 2006 G |
Selected Per-Share Data | | |
Net asset value, beginning of period | $ 10.52 | $ 10.00 |
Income from Investment Operations | | |
Net investment income (loss) E | .32 | .26 |
Net realized and unrealized gain (loss) | .41 | .47 |
Total from investment operations | .73 | .73 |
Distributions from net investment income | (.24) | (.12) |
Distributions from net realized gain | (.50) | (.09) |
Total distributions | (.74) | (.21) |
Net asset value, end of period | $ 10.51 | $ 10.52 |
Total Return B,C,D | 6.99% | 7.31% |
Ratios to Average Net Assets F,H | | |
Expenses before reductions | .35% | .35% A |
Expenses net of fee waivers, if any | .20% | .20% A |
Expenses net of all reductions | .20% | .20% A |
Net investment income (loss) | 2.97% | 3.48% A |
Supplemental Data | | |
Net assets, end of period (000 omitted) | $ 115 | $ 107 |
Portfolio turnover rate | 92% | 103% A |
A Annualized
B Total returns for periods of less than one year are not annualized.
C Total returns do not reflect charges attributable to your insurance company's separate account. Inclusion of these charges would reduce the total returns shown.
D Total returns would have been lower had certain expenses not been reduced during the periods shown.
E Calculated based on average shares outstanding during the period.
F Amounts do not include the activity of the underlying funds.
G For the period April 13, 2006 (commencement of operations) to December 31, 2006.
H Expense ratios reflect operating expenses of the class. Expenses before reductions do not reflect amounts reimbursed by the investment adviser or expense offset arrangements and do not represent the amount paid by the class during periods when reimbursements or reductions occur. Expense ratios before reductions for start-up periods may not be representative of longer-term operating periods. Expenses net of fee waivers reflect expenses after reimbursement by the investment adviser but prior to reductions from expense offset arrangements. Expenses net of all reductions represent the net expenses paid by the class but do not include expenses of the investment companies in which the Fund invests.
Financial Highlights - Service Class 2
Years ended December 31, | 2007 | 2006 G |
Selected Per-Share Data | | |
Net asset value, beginning of period | $ 10.51 | $ 10.00 |
Income from Investment Operations | | |
Net investment income (loss) E | .31 | .24 |
Net realized and unrealized gain (loss) | .41 | .47 |
Total from investment operations | .72 | .71 |
Distributions from net investment income | (.22) | (.11) |
Distributions from net realized gain | (.50) | (.09) |
Total distributions | (.72) | (.20) |
Net asset value, end of period | $ 10.51 | $ 10.51 |
Total Return B,C,D | 6.93% | 7.09% |
Ratios to Average Net Assets F,H | | |
Expenses before reductions | .50% | .50% A |
Expenses net of fee waivers, if any | .35% | .35% A |
Expenses net of all reductions | .35% | .35% A |
Net investment income (loss) | 2.82% | 3.34% A |
Supplemental Data | | |
Net assets, end of period (000 omitted) | $ 115 | $ 107 |
Portfolio turnover rate | 92% | 103% A |
A Annualized
B Total returns for periods of less than one year are not annualized.
C Total returns do not reflect charges attributable to your insurance company's separate account. Inclusion of these charges would reduce the total returns shown.
D Total returns would have been lower had certain expenses not been reduced during the periods shown.
E Calculated based on average shares outstanding during the period.
F Amounts do not include the activity of the underlying funds.
G For the period April 13, 2006 (commencement of operations) to December 31, 2006.
H Expense ratios reflect operating expenses of the class. Expenses before reductions do not reflect amounts reimbursed by the investment adviser or expense offset arrangements and do not represent the amount paid by the class during periods when reimbursements or reductions occur. Expense ratios before reductions for start-up periods may not be representative of longer-term operating periods. Expenses net of fee waivers reflect expenses after reimbursement by the investment adviser but prior to reductions from expense offset arrangements. Expenses net of all reductions represent the net expenses paid by the class but do not include expenses of the investment companies in which the Fund invests.
See accompanying notes which are an integral part of the financial statements.
VIP FundsManager Portfolio
Financial Highlights - Investor Class
Years ended December 31, | 2007 | 2006 G |
Selected Per-Share Data | | |
Net asset value, beginning of period | $ 10.52 | $ 10.00 |
Income from Investment Operations | | |
Net investment income (loss) E | .32 | .26 |
Net realized and unrealized gain (loss) | .41 | .47 |
Total from investment operations | .73 | .73 |
Distributions from net investment income | (.24) | (.12) |
Distributions from net realized gain | (.50) | (.09) |
Total distributions | (.74) | (.21) |
Net asset value, end of period | $ 10.51 | $ 10.52 |
Total Return B,C,D | 6.99% | 7.31% |
Ratios to Average Net Assets F,H | | |
Expenses before reductions | .25% | .25% A |
Expenses net of fee waivers, if any | .20% | .20% A |
Expenses net of all reductions | .20% | .20% A |
Net investment income (loss) | 2.97% | 3.48% A |
Supplemental Data | | |
Net assets, end of period (000 omitted) | $ 371,298 | $ 143,744 |
Portfolio turnover rate | 92% | 103% A |
A Annualized
B Total returns for periods of less than one year are not annualized.
C Total returns do not reflect charges attributable to your insurance company's separate account. Inclusion of these charges would reduce the total returns shown.
D Total returns would have been lower had certain expenses not been reduced during the periods shown.
E Calculated based on average shares outstanding during the period.
F Amounts do not include the activity of the underlying funds.
G For the period April 13, 2006 (commencement of operations) to December 31, 2006.
H Expense ratios reflect operating expenses of the class. Expenses before reductions do not reflect amounts reimbursed by the investment adviser or expense offset arrangements and do not represent the amount paid by the class during periods when reimbursements or reductions occur. Expense ratios before reductions for start-up periods may not be representative of longer-term operating periods. Expenses net of fee waivers reflect expenses after reimbursement by the investment adviser but prior to reductions from expense offset arrangements. Expenses net of all reductions represent the net expenses paid by the class but do not include expenses of the investment companies in which the Fund invests.
See accompanying notes which are an integral part of the financial statements.
Annual Report
VIP FundsManager 60% Portfolio
Investment Summary
Fund Holdings as of December 31, 2007 |
| % of fund's investments |
Domestic Equity Funds | |
Fidelity 100 Index Fund | 1.0 |
Fidelity Contrafund | 4.3 |
Fidelity Equity-Income II Fund | 6.8 |
Fidelity Fund | 5.6 |
Fidelity Large Cap Stock Fund | 1.7 |
Fidelity Large Cap Value Fund | 6.4 |
Fidelity Leveraged Company Stock Fund | 4.6 |
Fidelity Mid Cap Value Fund | 4.5 |
Fidelity Real Estate Investment Portfolio | 1.0 |
Fidelity Small Cap Value Fund | 1.9 |
Fidelity Stock Selector Fund | 3.9 |
Fidelity Value Discovery Fund | 0.5 |
Spartan Total Market Index Fund Investor Class | 2.0 |
VIP Growth & Income Portfolio Investor Class | 3.0 |
VIP Growth Portfolio Investor Class | 4.0 |
| 51.2 |
International Equity Funds | |
Fidelity Emerging Markets Fund | 0.5 |
Fidelity International Discovery Fund | 4.1 |
Fidelity International Real Estate Fund | 2.0 |
Fidelity Overseas Fund | 4.1 |
| 10.7 |
Fixed-Income Funds | |
Fidelity Capital & Income Fund | 4.1 |
Fidelity Floating Rate High Income Fund | 1.0 |
Fidelity New Markets Income Fund | 2.0 |
Fidelity U.S. Bond Index Fund | 28.0 |
| 35.1 |
Money Market Funds | |
Fidelity Institutional Prime Money Market Portfolio Class I | 3.0 |
| 100.0 |
Asset Allocation (% of fund's investments) |
As of December 31, 2007 |
| Domestic
Equity Funds | 51.2% | |
| International
Equity Funds | 10.7% | |
| Fixed Income
Funds | 35.1% | |
| Money Market
Funds | 3.0% | |

VIP FundsManager Portfolio
VIP FundsManager 60% Portfolio
Investments December 31, 2007
Showing Percentage of Total Value of Investment in Securities
Equity Funds - 61.9% |
| Shares | | Value |
Domestic Equity Funds - 51.2% |
Fidelity 100 Index Fund | 110,603 | | $ 1,172,387 |
Fidelity Contrafund | 67,490 | | 4,934,226 |
Fidelity Equity-Income II Fund | 337,649 | | 7,759,171 |
Fidelity Fund | 158,984 | | 6,335,507 |
Fidelity Large Cap Stock Fund | 100,072 | | 1,934,388 |
Fidelity Large Cap Value Fund | 504,810 | | 7,319,746 |
Fidelity Leveraged Company Stock Fund | 163,301 | | 5,279,524 |
Fidelity Mid Cap Value Fund | 314,066 | | 5,112,989 |
Fidelity Real Estate Investment Portfolio | 43,772 | | 1,137,192 |
Fidelity Small Cap Value Fund | 156,977 | | 2,134,889 |
Fidelity Stock Selector Fund | 150,095 | | 4,427,790 |
Fidelity Value Discovery Fund | 33,189 | | 595,408 |
Spartan Total Market Index Fund Investor Class | 57,218 | | 2,340,230 |
VIP Growth & Income Portfolio Investor Class | 198,739 | | 3,370,618 |
VIP Growth Portfolio Investor Class | 101,659 | | 4,574,640 |
TOTAL DOMESTIC EQUITY FUNDS | | 58,428,705 |
International Equity Funds - 10.7% |
Fidelity Emerging Markets Fund | 18,026 | | 610,163 |
Fidelity International Discovery Fund | 106,993 | | 4,609,260 |
Fidelity International Real Estate Fund | 168,472 | | 2,257,519 |
Fidelity Overseas Fund | 95,985 | | 4,644,709 |
TOTAL INTERNATIONAL EQUITY FUNDS | | 12,121,651 |
TOTAL EQUITY FUNDS (Cost $73,508,459) | 70,550,356 |
Fixed-Income Funds - 35.1% |
| | | |
Fidelity Capital & Income Fund | 530,574 | | 4,605,379 |
Fidelity Floating Rate High Income Fund | 123,297 | | 1,179,952 |
Fidelity New Markets Income Fund | 157,919 | | 2,318,254 |
Fidelity U.S. Bond Index Fund | 2,930,389 | | 31,911,936 |
TOTAL FIXED-INCOME FUNDS (Cost $40,011,004) | 40,015,521 |
Money Market Funds - 3.0% |
| | | |
Fidelity Institutional Prime Money Market Portfolio Class I
(Cost $3,463,727) | 3,463,727 | | 3,463,727 |
TOTAL INVESTMENT IN SECURITIES - 100% (Cost $116,983,190) | $ 114,029,604 |
See accompanying notes which are an integral part of the financial statements.
Annual Report
VIP FundsManager 60% Portfolio
Financial Statements
Statement of Assets and Liabilities
| December 31, 2007 |
Assets | | |
Investment in securities, at value (cost $116,983,190) - See accompanying schedule | | $ 114,029,604 |
Cash | | 21 |
Receivable for fund shares sold | | 3,000,186 |
Total assets | | 117,029,811 |
| | |
Liabilities | | |
Payable for investments purchased | $ 2,999,173 | |
Payable for fund shares redeemed | 1,005 | |
Accrued management fee | 15,190 | |
Distribution fees payable | 13 | |
Total liabilities | | 3,015,381 |
| | |
Net Assets | | $ 114,014,430 |
Net Assets consist of: | | |
Paid in capital | | $ 115,766,511 |
Undistributed net investment income | | 43,897 |
Accumulated undistributed net realized gain (loss) on investments | | 1,157,608 |
Net unrealized appreciation (depreciation) on investments | | (2,953,586) |
Net Assets | | $ 114,014,430 |
Statement of Assets and Liabilities - continued
| December 31, 2007 |
Service Class:
Net Asset Value, offering price and redemption price per share ($104,054 ÷ 10,114 shares) | | $ 10.29 |
| | |
Service Class 2:
Net Asset Value, offering price and redemption price per share ($103,999 ÷ 10,109 shares) | | $ 10.29 |
| | |
Investor Class:
Net Asset Value, offering price and redemption price per share ($113,806,377 ÷ 11,064,852 shares) | | $ 10.29 |
See accompanying notes which are an integral part of the financial statements.
VIP FundsManager Portfolio
Statement of Operations
| | For the period
August 22, 2007
(Commencement of Operations) to
December 31, 2007 |
Investment Income | | |
Income distributions from underlying funds | | $ 669,377 |
Interest | | 23 |
Total income | | 669,400 |
| | |
Expenses | | |
Management fee | $ 34,017 | |
Distribution fees | 129 | |
Independent trustees' compensation | 22 | |
Total expenses before reductions | 34,168 | |
Expense reductions | (6,837) | 27,331 |
Net investment income (loss) | | 642,069 |
Realized and Unrealized Gain (Loss) Realized gain (loss) on sale of underlying fund shares | (271,295) | |
Capital gain distributions from underlying funds | 2,058,621 | 1,787,326 |
Change in net unrealized appreciation (depreciation) on underlying funds | | (2,953,586) |
Net gain (loss) | | (1,166,260) |
Net increase (decrease) in net assets resulting from operations | | $ (524,191) |
Statement of Changes in Net Assets
| For the period
August 22, 2007
(Commencement of Operations) to
December 31, 2007 |
Increase (Decrease) in Net Assets | |
Operations | |
Net investment income (loss) | $ 642,069 |
Net realized gain (loss) | 1,787,326 |
Change in net unrealized appreciation (depreciation) | (2,953,586) |
Net increase (decrease) in net assets resulting from operations | (524,191) |
Distributions to shareholders from net investment income | (598,172) |
Distributions to shareholders from net realized gain | (629,718) |
Total distributions | (1,227,890) |
Share transactions - net increase (decrease) | 115,766,511 |
Total increase (decrease) in net assets | 114,014,430 |
| |
Net Assets | |
Beginning of period | - |
End of period (including undistributed net investment income of $43,897) | $ 114,014,430 |
See accompanying notes which are an integral part of the financial statements.
Annual Report
Financial Highlights - Service Class
Year ended December 31, | 2007 H |
Selected Per-Share Data | |
Net asset value, beginning of period | $ 10.00 |
Income from Investment Operations | |
Net investment income (loss) E | .18 |
Net realized and unrealized gain (loss) | .23 G |
Total from investment operations | .41 |
Distributions from net investment income | (.06) |
Distributions from net realized gain | (.06) |
Total distributions | (.12) |
Net asset value, end of period | $ 10.29 |
Total Return B,C,D | 4.07% |
Ratios to Average Net Assets F,I | |
Expenses before reductions | .35% A |
Expenses net of fee waivers, if any | .20% A |
Expenses net of all reductions | .20% A |
Net investment income (loss) | 4.76% A |
Supplemental Data | |
Net assets, end of period (000 omitted) | $ 104 |
Portfolio turnover rate | 60% A |
A Annualized
B Total returns for periods of less than one year are not annualized.
C Total returns do not reflect charges attributable to your insurance company's separate account. Inclusion of these charges would reduce the total returns shown.
D Total returns would have been lower had certain expenses not been reduced during the periods shown.
E Calculated based on average shares outstanding during the period.
F Amounts do not include the activity of the underlying funds.
G The amount shown for a share outstanding does not correspond with the aggregate net gain (loss) on investments for the period due to the timing of sales and repurchases of shares in relation to fluctuating market values of the investments of the Fund.
H For the period August 22, 2007 (commencement of operations) to December 31, 2007.
I Expense ratios reflect operating expenses of the class. Expenses before reductions do not reflect amounts reimbursed by the investment adviser or expense offset arrangements and do not represent the amount paid by the class during periods when reimbursements or reductions occur. Expense ratios before reductions for start-up periods may not be representative of longer-term operating periods. Expenses net of fee waivers reflect expenses after reimbursement by the investment adviser but prior to reductions from expense offset arrangements. Expenses net of all reductions represent the net expenses paid by the class but do not include expenses of the investment companies in which the Fund invests.
Financial Highlights - Service Class 2
Year ended December 31, | 2007 H |
Selected Per-Share Data | |
Net asset value, beginning of period | $ 10.00 |
Income from Investment Operations | |
Net investment income (loss) E | .17 |
Net realized and unrealized gain (loss) | .23 G |
Total from investment operations | .40 |
Distributions from net investment income | (.05) |
Distributions from net realized gain | (.06) |
Total distributions | (.11) |
Net asset value, end of period | $ 10.29 |
Total Return B,C,D | 4.01% |
Ratios to Average Net Assets F,I | |
Expenses before reductions | .50% A |
Expenses net of fee waivers, if any | .35% A |
Expenses net of all reductions | .35% A |
Net investment income (loss) | 4.61% A |
Supplemental Data | |
Net assets, end of period (000 omitted) | $ 104 |
Portfolio turnover rate | 60% A |
A Annualized
B Total returns for periods of less than one year are not annualized.
C Total returns do not reflect charges attributable to your insurance company's separate account. Inclusion of these charges would reduce the total returns shown.
D Total returns would have been lower had certain expenses not been reduced during the periods shown.
E Calculated based on average shares outstanding during the period.
F Amounts do not include the activity of the underlying funds.
G The amount shown for a share outstanding does not correspond with the aggregate net gain (loss) on investments for the period due to the timing of sales and repurchases of shares in relation to fluctuating market values of the investments of the Fund.
H For the period August 22, 2007 (commencement of operations) to December 31, 2007.
I Expense ratios reflect operating expenses of the class. Expenses before reductions do not reflect amounts reimbursed by the investment adviser or expense offset arrangements and do not represent the amount paid by the class during periods when reimbursements or reductions occur. Expense ratios before reductions for start-up periods may not be representative of longer-term operating periods. Expenses net of fee waivers reflect expenses after reimbursement by the investment adviser but prior to reductions from expense offset arrangements. Expenses net of all reductions represent the net expenses paid by the class but do not include expenses of the investment companies in which the Fund invests.
See accompanying notes which are an integral part of the financial statements.
VIP FundsManager Portfolio
Financial Highlights - Investor Class
Year ended December 31, | 2007 H |
Selected Per-Share Data | |
Net asset value, beginning of period | $ 10.00 |
Income from Investment Operations | |
Net investment income (loss) E | .17 |
Net realized and unrealized gain (loss) | .24 G |
Total from investment operations | .41 |
Distributions from net investment income | (.06) |
Distributions from net realized gain | (.06) |
Total distributions | (.12) |
Net asset value, end of period | $ 10.29 |
Total Return B,C,D | 4.07% |
Ratios to Average Net Assets F,I | |
Expenses before reductions | .25% A |
Expenses net of fee waivers, if any | .20% A |
Expenses net of all reductions | .20% A |
Net investment income (loss) | 4.76% A |
Supplemental Data | |
Net assets, end of period (000 omitted) | $ 113,806 |
Portfolio turnover rate | 60% A |
A Annualized
B Total returns for periods of less than one year are not annualized.
C Total returns do not reflect charges attributable to your insurance company's separate account. Inclusion of these charges would reduce the total returns shown.
D Total returns would have been lower had certain expenses not been reduced during the periods shown.
E Calculated based on average shares outstanding during the period.
F Amounts do not include the activity of the underlying funds.
G The amount shown for a share outstanding does not correspond with the aggregate net gain (loss) on investments for the period due to the timing of sales and repurchases of shares in relation to fluctuating market values of the investments of the Fund.
H For the period August 22, 2007 (commencement of operations) to December 31, 2007.
I Expense ratios reflect operating expenses of the class. Expenses before reductions do not reflect amounts reimbursed by the investment adviser or expense offset arrangements and do not represent the amount paid by the class during periods when reimbursements or reductions occur. Expense ratios before reductions for start-up periods may not be representative of longer-term operating periods. Expenses net of fee waivers reflect expenses after reimbursement by the investment adviser but prior to reductions from expense offset arrangements. Expenses net of all reductions represent the net expenses paid by the class but do not include expenses of the investment companies in which the Fund invests.
See accompanying notes which are an integral part of the financial statements.
Annual Report
VIP FundsManager 70% Portfolio
Investment Summary
Fund Holdings as of December 31, 2007 |
| % of fund's investments |
Domestic Equity Funds | |
Fidelity Contrafund | 3.4 |
Fidelity Disciplined Equity Fund | 4.5 |
Fidelity Equity Income Fund | 3.3 |
Fidelity Equity-Income II Fund | 8.9 |
Fidelity Fund | 5.1 |
Fidelity Growth Company Fund | 0.1 |
Fidelity Large Cap Stock Fund | 7.0 |
Fidelity Large Cap Value Fund | 3.6 |
Fidelity Leveraged Company Stock Fund | 2.3 |
Fidelity Mid Cap Value Fund | 2.2 |
Fidelity Mid-Cap Stock Fund | 0.1 |
Fidelity Nasdaq Composite Index Fund | 1.9 |
Fidelity New Millennium Fund | 2.1 |
Fidelity Real Estate Investment Portfolio | 1.0 |
Fidelity Small Cap Growth Fund | 0.2 |
Fidelity Small Cap Stock Fund | 0.1 |
Fidelity Small Cap Value Fund | 0.3 |
Fidelity Stock Selector Fund | 2.4 |
Fidelity Value Discovery Fund | 0.3 |
Fidelity Value Strategies Fund | 2.7 |
Spartan Total Market Index Fund Investor Class | 2.0 |
Spartan U.S. Equity Index Fund Investor Class | 3.2 |
VIP Growth & Income Portfolio Investor Class | 3.3 |
VIP Growth Opportunities Portfolio Investor Class | 1.3 |
VIP Growth Portfolio Investor Class | 0.0* |
| 61.3 |
International Equity Funds | |
Fidelity Emerging Markets Fund | 1.0 |
Fidelity International Discovery Fund | 3.7 |
Fidelity International Real Estate Fund | 2.0 |
Fidelity Overseas Fund | 3.8 |
Spartan International Index Fund Investor Class | 0.5 |
| 11.0 |
Fixed-Income Funds | |
Fidelity Capital & Income Fund | 4.0 |
Fidelity Floating Rate High Income Fund | 1.0 |
Fidelity New Markets Income Fund | 2.0 |
Fidelity U.S. Bond Index Fund | 17.4 |
| 24.4 |
Money Market Funds | |
Fidelity Institutional Prime Money Market Portfolio Class I | 3.3 |
| 100.0 |
* Amount represents less than 0.1% |
Asset Allocation (% of fund's investments) |
As of December 31, 2007 |
| Domestic
Equity Funds | 61.3% | |
| International
Equity Funds | 11.0% | |
| Fixed Income
Funds | 24.4% | |
| Money Market
Funds | 3.3% | |

As of June 30, 2007 |
| Domestic
Equity Funds | 61.3% | |
| International
Equity Funds | 11.0% | |
| Fixed Income
Funds | 24.3% | |
| Money Market
Funds | 3.4% | |

VIP FundsManager Portfolio
VIP FundsManager 70% Portfolio
Investments December 31, 2007
Showing Percentage of Total Value of Investment in Securities
Equity Funds - 72.3% |
| Shares | | Value |
Domestic Equity Funds - 61.3% |
Fidelity Contrafund | 204,909 | | $ 14,980,895 |
Fidelity Disciplined Equity Fund | 679,304 | | 20,053,054 |
Fidelity Equity Income Fund | 269,543 | | 14,867,999 |
Fidelity Equity-Income II Fund | 1,725,334 | | 39,648,177 |
Fidelity Fund | 569,967 | | 22,713,180 |
Fidelity Growth Company Fund | 4,883 | | 405,171 |
Fidelity Large Cap Stock Fund | 1,601,417 | | 30,955,393 |
Fidelity Large Cap Value Fund | 1,115,779 | | 16,178,795 |
Fidelity Leveraged Company Stock Fund | 312,802 | | 10,112,878 |
Fidelity Mid Cap Value Fund | 606,418 | | 9,872,482 |
Fidelity Mid-Cap Stock Fund | 15,229 | | 445,299 |
Fidelity Nasdaq Composite Index Fund | 246,612 | | 8,658,555 |
Fidelity New Millennium Fund | 310,449 | | 9,248,280 |
Fidelity Real Estate Investment Portfolio | 164,562 | | 4,275,315 |
Fidelity Small Cap Growth Fund | 57,566 | | 908,397 |
Fidelity Small Cap Stock Fund | 25,417 | | 443,027 |
Fidelity Small Cap Value Fund | 104,993 | | 1,427,899 |
Fidelity Stock Selector Fund | 360,263 | | 10,627,771 |
Fidelity Value Discovery Fund | 73,695 | | 1,322,084 |
Fidelity Value Strategies Fund | 425,352 | | 12,241,641 |
Spartan Total Market Index Fund Investor Class | 215,476 | | 8,812,981 |
Spartan U.S. Equity Index Fund Investor Class | 271,003 | | 14,065,078 |
VIP Growth & Income Portfolio Investor Class | 871,118 | | 14,774,156 |
VIP Growth Opportunities Portfolio Investor Class (a) | 253,219 | | 5,641,712 |
VIP Growth Portfolio Investor Class | 1,065 | | 47,903 |
TOTAL DOMESTIC EQUITY FUNDS | | 272,728,122 |
International Equity Funds - 11.0% |
Fidelity Emerging Markets Fund | 132,307 | | 4,478,596 |
Fidelity International Discovery Fund | 386,280 | | 16,640,939 |
Fidelity International Real Estate Fund | 651,006 | | 8,723,484 |
Fidelity Overseas Fund | 345,391 | | 16,713,449 |
Spartan International Index Fund Investor Class | 45,552 | | 2,154,614 |
TOTAL INTERNATIONAL EQUITY FUNDS | | 48,711,082 |
TOTAL EQUITY FUNDS (Cost $334,245,254) | 321,439,204 |
Fixed-Income Funds - 24.4% |
| | | |
Fidelity Capital & Income Fund | 2,059,614 | | 17,877,447 |
Fidelity Floating Rate High Income Fund | 467,989 | | 4,478,658 |
Fidelity New Markets Income Fund | 610,937 | | 8,968,562 |
Fidelity U.S. Bond Index Fund | 7,093,841 | | 77,251,936 |
TOTAL FIXED-INCOME FUNDS (Cost $108,474,677) | 108,576,603 |
Money Market Funds - 3.3% |
| Shares | | Value |
Fidelity Institutional Prime Money Market Portfolio Class I
(Cost $14,757,606) | 14,757,606 | | $ 14,757,606 |
TOTAL INVESTMENT IN SECURITIES - 100% (Cost $457,477,537) | $ 444,773,413 |
Legend |
(a) Non-income producing |
See accompanying notes which are an integral part of the financial statements.
Annual Report
VIP FundsManager 70% Portfolio
Financial Statements
Statement of Assets and Liabilities
| December 31, 2007 |
Assets | | |
Investment in securities, at value
(cost $457,477,537) - See accompanying schedule | | $ 444,773,413 |
Receivable for investments sold | | 76 |
Receivable for fund shares sold | | 1,718,778 |
Total assets | | 446,492,267 |
| | |
Liabilities | | |
Payable to custodian bank | $ 1 | |
Payable for investments purchased | 1,718,602 | |
Payable for fund shares redeemed | 166 | |
Accrued management fee | 73,177 | |
Distribution fees payable | 15 | |
Total liabilities | | 1,791,961 |
| | |
Net Assets | | $ 444,700,306 |
Net Assets consist of: | | |
Paid in capital | | $ 447,178,271 |
Accumulated undistributed net
realized gain (loss) on investments | | 10,226,159 |
Net unrealized appreciation
(depreciation) on investments | | (12,704,124) |
Net Assets | | $ 444,700,306 |
Statement of Assets and Liabilities - continued
| December 31, 2007 |
Service Class:
Net Asset Value, offering price and redemption price per share ($117,029 ÷ 10,989 shares) | | $ 10.65 |
| | |
Service Class 2:
Net Asset Value, offering price and redemption price per share ($116,730 ÷ 10,961 shares) | | $ 10.65 |
| | |
Investor Class:
Net Asset Value, offering price and redemption price per share ($444,466,547 ÷ 41,742,880 shares) | | $ 10.65 |
See accompanying notes which are an integral part of the financial statements.
VIP FundsManager Portfolio
Statement of Operations
| Year ended December 31, 2007 |
Investment Income | | |
Income distributions from underlying funds | | $ 7,780,392 |
Interest | | 815 |
Total income | | 7,781,207 |
| | |
Expenses | | |
Management fee | $ 830,374 | |
Distribution fees | 400 | |
Independent trustees' compensation | 1,079 | |
Total expenses before reductions | 831,853 | |
Expense reductions | (167,049) | 664,804 |
Net investment income (loss) | | 7,116,403 |
Realized and Unrealized Gain (Loss) Realized gain (loss) on sale of underlying fund shares | 12,844,763 | |
Capital gain distributions from underlying funds | 16,362,786 | 29,207,549 |
Change in net unrealized appreciation (depreciation) on underlying funds | | (17,190,342) |
Net gain (loss) | | 12,017,207 |
Net increase (decrease) in net assets resulting from operations | | $ 19,133,610 |
Statement of Changes in Net Assets
| Year ended
December 31,
2007 | For the period
April 13, 2006,
(Commencement of Operations) to
December 31, 2006 |
Increase (Decrease) in Net Assets | | |
Operations | | |
Net investment income (loss) | $ 7,116,403 | $ 1,553,731 |
Net realized gain (loss) | 29,207,549 | 4,862,432 |
Change in net unrealized appreciation (depreciation) | (17,190,342) | 4,486,218 |
Net increase (decrease) in net assets resulting from operations | 19,133,610 | 10,902,381 |
Distributions to shareholders from net investment income | (7,181,365) | (1,730,930) |
Distributions to shareholders from net realized gain | (21,805,300) | (1,796,362) |
Total distributions | (28,986,665) | (3,527,292) |
Share transactions - net increase (decrease) | 276,358,393 | 170,819,879 |
Total increase (decrease) in net assets | 266,505,338 | 178,194,968 |
| | |
Net Assets | | |
Beginning of period | 178,194,968 | - |
End of period | $ 444,700,306 | $ 178,194,968 |
See accompanying notes which are an integral part of the financial statements.
Annual Report
Financial Highlights - Service Class
Years ended December 31, | 2007 | 2006 G |
Selected Per-Share Data | | |
Net asset value, beginning of period | $ 10.64 | $ 10.00 |
Income from Investment Operations | | |
Net investment income (loss) E | .24 | .21 |
Net realized and unrealized gain (loss) | .58 | .65 |
Total from investment operations | .82 | .86 |
Distributions from net investment income | (.18) | (.11) |
Distributions from net realized gain | (.63) | (.11) |
Total distributions | (.81) | (.22) |
Net asset value, end of period | $ 10.65 | $ 10.64 |
Total Return B,C,D | 7.80% | 8.56% |
Ratios to Average Net Assets F,H | | |
Expenses before reductions | .35% | .35% A |
Expenses net of fee waivers, if any | .20% | .20% A |
Expenses net of all reductions | .20% | .20% A |
Net investment income (loss) | 2.14% | 2.87% A |
Supplemental Data | | |
Net assets, end of period (000 omitted) | $ 117 | $ 109 |
Portfolio turnover rate | 105% | 106% A |
A Annualized
B Total returns for periods of less than one year are not annualized.
C Total returns do not reflect charges attributable to your insurance company's separate account. Inclusion of these charges would reduce the total returns shown.
D Total returns would have been lower had certain expenses not been reduced during the periods shown.
E Calculated based on average shares outstanding during the period.
F Amounts do not include the activity of the underlying funds.
G For the period April 13, 2006 (commencement of operations) to December 31, 2006.
H Expense ratios reflect operating expenses of the class. Expenses before reductions do not reflect amounts reimbursed by the investment adviser or expense offset arrangements and do not represent the amount paid by the class during periods when reimbursements or reductions occur. Expense ratios before reductions for start-up periods may not be representative of longer-term operating periods. Expenses net of fee waivers reflect expenses after reimbursement by the investment adviser but prior to reductions from expense offset arrangements. Expenses net of all reductions represent the net expenses paid by the class but do not include expenses of the investment companies in which the Fund invests.
Financial Highlights - Service Class 2
Years ended December 31, | 2007 | 2006 G |
Selected Per-Share Data | | |
Net asset value, beginning of period | $ 10.64 | $ 10.00 |
Income from Investment Operations | | |
Net investment income (loss) E | .22 | .20 |
Net realized and unrealized gain (loss) | .59 | .65 |
Total from investment operations | .81 | .85 |
Distributions from net investment income | (.17) | (.10) |
Distributions from net realized gain | (.63) | (.11) |
Total distributions | (.80) | (.21) |
Net asset value, end of period | $ 10.65 | $ 10.64 |
Total Return B,C,D | 7.63% | 8.45% |
Ratios to Average Net Assets F,H | | |
Expenses before reductions | .50% | .50% A |
Expenses net of fee waivers, if any | .35% | .35% A |
Expenses net of all reductions | .35% | .35% A |
Net investment income (loss) | 1.99% | 2.72% A |
Supplemental Data | | |
Net assets, end of period (000 omitted) | $ 117 | $ 108 |
Portfolio turnover rate | 105% | 106% A |
A Annualized
B Total returns for periods of less than one year are not annualized.
C Total returns do not reflect charges attributable to your insurance company's separate account. Inclusion of these charges would reduce the total returns shown.
D Total returns would have been lower had certain expenses not been reduced during the periods shown.
E Calculated based on average shares outstanding during the period.
F Amounts do not include the activity of the underlying funds.
G For the period April 13, 2006 (commencement of operations) to December 31, 2006.
H Expense ratios reflect operating expenses of the class. Expenses before reductions do not reflect amounts reimbursed by the investment adviser or expense offset arrangements and do not represent the amount paid by the class during periods when reimbursements or reductions occur. Expense ratios before reductions for start-up periods may not be representative of longer-term operating periods. Expenses net of fee waivers reflect expenses after reimbursement by the investment adviser but prior to reductions from expense offset arrangements. Expenses net of all reductions represent the net expenses paid by the class but do not include expenses of the investment companies in which the Fund invests.
See accompanying notes which are an integral part of the financial statements.
VIP FundsManager Portfolio
Financial Highlights - Investor Class
Years ended December 31, | 2007 | 2006 G |
Selected Per-Share Data | | |
Net asset value, beginning of period | $ 10.64 | $ 10.00 |
Income from Investment Operations | | |
Net investment income (loss) E | .24 | .21 |
Net realized and unrealized gain (loss) | .58 | .65 |
Total from investment operations | .82 | .86 |
Distributions from net investment income | (.18) | (.11) |
Distributions from net realized gain | (.63) | (.11) |
Total distributions | (.81) | (.22) |
Net asset value, end of period | $ 10.65 | $ 10.64 |
Total Return B,C,D | 7.80% | 8.56% |
Ratios to Average Net Assets F,H | | |
Expenses before reductions | .25% | .25% A |
Expenses net of fee waivers, if any | .20% | .20% A |
Expenses net of all reductions | .20% | .20% A |
Net investment income (loss) | 2.14% | 2.86% A |
Supplemental Data | | |
Net assets, end of period (000 omitted) | $ 444,467 | $ 177,978 |
Portfolio turnover rate | 105% | 106% A |
A Annualized
B Total returns for periods of less than one year are not annualized.
C Total returns do not reflect charges attributable to your insurance company's separate account. Inclusion of these charges would reduce the total returns shown.
D Total returns would have been lower had certain expenses not been reduced during the periods shown.
E Calculated based on average shares outstanding during the period.
F Amounts do not include the activity of the underlying funds.
G For the period April 13, 2006 (commencement of operations) to December 31, 2006.
H Expense ratios reflect operating expenses of the class. Expenses before reductions do not reflect amounts reimbursed by the investment adviser or expense offset arrangements and do not represent the amount paid by the class during periods when reimbursements or reductions occur. Expense ratios before reductions for start-up periods may not be representative of longer-term operating periods. Expenses net of fee waivers reflect expenses after reimbursement by the investment adviser but prior to reductions from expense offset arrangements. Expenses net of all reductions represent the net expenses paid by the class but do not include expenses of the investment companies in which the Fund invests.
See accompanying notes which are an integral part of the financial statements.
Annual Report
VIP FundsManager 85% Portfolio
Investment Summary
Fund Holdings as of December 31, 2007 |
| % of fund's investments |
Domestic Equity Funds | |
Fidelity Contrafund | 2.9 |
Fidelity Disciplined Equity Fund | 6.2 |
Fidelity Equity Income Fund | 6.2 |
Fidelity Equity-Income II Fund | 10.0 |
Fidelity Fund | 4.6 |
Fidelity Growth Company Fund | 0.1 |
Fidelity Large Cap Stock Fund | 8.4 |
Fidelity Large Cap Value Fund | 3.6 |
Fidelity Leveraged Company Stock Fund | 2.7 |
Fidelity Mid Cap Value Fund | 2.0 |
Fidelity Mid-Cap Stock Fund | 0.1 |
Fidelity Nasdaq Composite Index Fund | 2.8 |
Fidelity New Millennium Fund | 2.1 |
Fidelity Real Estate Investment Portfolio | 1.0 |
Fidelity Small Cap Growth Fund | 0.2 |
Fidelity Small Cap Stock Fund | 0.1 |
Fidelity Small Cap Value Fund | 0.8 |
Fidelity Stock Selector Fund | 2.1 |
Fidelity Value Discovery Fund | 0.3 |
Fidelity Value Strategies Fund | 3.7 |
Spartan Total Market Index Fund Investor Class | 2.0 |
Spartan U.S. Equity Index Fund Investor Class | 5.1 |
VIP Growth & Income Portfolio Investor Class | 3.2 |
VIP Growth Opportunities Portfolio Investor Class | 1.6 |
VIP Growth Portfolio Investor Class | 0.0* |
| 71.8 |
International Equity Funds | |
Fidelity Emerging Markets Fund | 1.0 |
Fidelity International Discovery Fund | 8.3 |
Fidelity International Real Estate Fund | 2.0 |
Fidelity Overseas Fund | 3.8 |
Spartan International Index Fund Investor Class | 0.9 |
| 16.0 |
Fixed-Income Funds | |
Fidelity Capital & Income Fund | 2.0 |
Fidelity New Markets Income Fund | 2.0 |
Fidelity U.S. Bond Index Fund | 8.2 |
| 12.2 |
| 100.0 |
* Amount represents less than 0.1% |
Asset Allocation (% of fund's investments) |
As of December 31, 2007 |
| Domestic
Equity Funds | 71.8% | |
 | International
Equity Funds | 16.0% | |
| Fixed Income
Funds | 12.2% | |

As of June 30, 2007 |
| Domestic
Equity Funds | 71.9% | |
| International
Equity Funds | 16.0% | |
| Fixed Income
Funds | 12.1% | |

VIP FundsManager Portfolio
VIP FundsManager 85% Portfolio
Investments December 31, 2007
Showing Percentage of Total Value of Investment in Securities
Equity Funds - 87.8% |
| Shares | | Value |
Domestic Equity Funds - 71.8% |
Fidelity Contrafund | 69,449 | | $ 5,077,411 |
Fidelity Disciplined Equity Fund | 372,863 | | 11,006,928 |
Fidelity Equity Income Fund | 197,985 | | 10,920,869 |
Fidelity Equity-Income II Fund | 765,689 | | 17,595,530 |
Fidelity Fund | 204,881 | | 8,164,507 |
Fidelity Growth Company Fund | 2,135 | | 177,144 |
Fidelity Large Cap Stock Fund | 770,498 | | 14,893,717 |
Fidelity Large Cap Value Fund | 442,934 | | 6,422,550 |
Fidelity Leveraged Company Stock Fund | 149,853 | | 4,844,737 |
Fidelity Mid Cap Value Fund | 217,117 | | 3,534,661 |
Fidelity Mid-Cap Stock Fund | 6,072 | | 177,533 |
Fidelity Nasdaq Composite Index Fund | 141,198 | | 4,957,460 |
Fidelity New Millennium Fund | 125,324 | | 3,733,398 |
Fidelity Real Estate Investment Portfolio | 65,623 | | 1,704,892 |
Fidelity Small Cap Growth Fund | 23,287 | | 367,467 |
Fidelity Small Cap Stock Fund | 10,129 | | 176,550 |
Fidelity Small Cap Value Fund | 100,909 | | 1,372,365 |
Fidelity Stock Selector Fund | 127,922 | | 3,773,713 |
Fidelity Value Discovery Fund | 29,390 | | 527,248 |
Fidelity Value Strategies Fund | 227,413 | | 6,544,936 |
Spartan Total Market Index Fund Investor Class | 85,863 | | 3,511,792 |
Spartan U.S. Equity Index Fund Investor Class | 174,679 | | 9,065,832 |
VIP Growth & Income Portfolio Investor Class | 331,228 | | 5,617,629 |
VIP Growth Opportunities Portfolio Investor Class (a) | 124,268 | | 2,768,685 |
VIP Growth Portfolio Investor Class | 942 | | 42,381 |
TOTAL DOMESTIC EQUITY FUNDS | | 126,979,935 |
International Equity Funds - 16.0% |
Fidelity Emerging Markets Fund | 52,861 | | 1,789,344 |
Fidelity International Discovery Fund | 339,071 | | 14,607,174 |
Fidelity International Real Estate Fund | 260,155 | | 3,486,072 |
Fidelity Overseas Fund | 137,808 | | 6,668,506 |
Spartan International Index Fund Investor Class | 35,888 | | 1,697,507 |
TOTAL INTERNATIONAL EQUITY FUNDS | | 28,248,603 |
TOTAL EQUITY FUNDS (Cost $159,813,273) | 155,228,538 |
Fixed-Income Funds - 12.2% |
| | | |
Fidelity Capital & Income Fund | 410,043 | | 3,559,171 |
Fidelity New Markets Income Fund | 243,229 | | 3,570,609 |
Fidelity U.S. Bond Index Fund | 1,318,916 | | 14,362,995 |
TOTAL FIXED-INCOME FUNDS (Cost $21,456,377) | 21,492,775 |
TOTAL INVESTMENT IN SECURITIES - 100% (Cost $181,269,650) | $ 176,721,313 |
Legend |
(a) Non-income producing |
See accompanying notes which are an integral part of the financial statements.
Annual Report
VIP FundsManager 85% Portfolio
Financial Statements
Statement of Assets and Liabilities
| December 31, 2007 |
Assets | | |
Investment in securities, at value
(cost $181,269,650) -
See accompanying schedule | | $ 176,721,313 |
Receivable for investments sold | | 115,070 |
Receivable for fund shares sold | | 46,737 |
Total assets | | 176,883,120 |
| | |
Liabilities | | |
Payable to custodian bank | $ 14 | |
Payable for fund shares redeemed | 161,782 | |
Accrued management fee | 29,120 | |
Distribution fees payable | 15 | |
Total liabilities | | 190,931 |
| | |
Net Assets | | $ 176,692,189 |
Net Assets consist of: | | |
Paid in capital | | 176,322,521 |
Undistributed net investment income | | 7,998 |
Accumulated undistributed net realized gain (loss) on investments | | 4,910,007 |
Net unrealized appreciation (depreciation) on investments | | (4,548,337) |
Net Assets | | $ 176,692,189 |
Statement of Assets and Liabilities - continued
| December 31, 2007 |
Service Class:
Net Asset Value, offering price and redemption price per share ($118,431 ÷ 11,005 shares) | | $ 10.76 |
| | |
Service Class 2:
Net Asset Value, offering price and redemption price per share ($118,128 ÷ 10,977 shares) | | $ 10.76 |
| | |
Investor Class:
Net Asset Value, offering price and redemption price per share ($176,455,630 ÷ 16,387,837 shares) | | $ 10.77 |
See accompanying notes which are an integral part of the financial statements.
VIP FundsManager Portfolio
Statement of Operations
| Year ended December 31, 2007 |
Investment Income | | |
Income distributions from underlying funds | | $ 2,291,671 |
Interest | | 408 |
Total income | | 2,292,079 |
| | |
Expenses | | |
Management fee | $ 339,637 | |
Distribution fees | 406 | |
Independent trustees' compensation | 442 | |
Total expenses before reductions | 340,485 | |
Expense reductions | (68,503) | 271,982 |
Net investment income (loss) | | 2,020,097 |
Realized and Unrealized Gain (Loss) Realized gain (loss) on sale of underlying fund shares | 5,346,730 | |
Capital gain distributions from underlying funds | 7,837,799 | 13,184,529 |
Change in net unrealized appreciation (depreciation) on underlying funds | | (6,607,832) |
Net gain (loss) | | 6,576,697 |
Net increase (decrease) in net assets resulting from operations | | $ 8,596,794 |
Statement of Changes in Net Assets
| Year ended
December 31,
2007 | For the period
April 13, 2006
(Commencement of
Operations) to
December 31, 2006 |
Increase (Decrease) in Net Assets | | |
Operations | | |
Net investment income (loss) | $ 2,020,097 | $ 524,191 |
Net realized gain (loss) | 13,184,529 | 2,296,173 |
Change in net unrealized appreciation (depreciation) | (6,607,832) | 2,059,495 |
Net increase (decrease) in net assets resulting from operations | 8,596,794 | 4,879,859 |
Distributions to shareholders from net investment income | (2,012,099) | (528,972) |
Distributions to shareholders from net realized gain | (9,838,427) | (727,487) |
Total distributions | (11,850,526) | (1,256,459) |
Share transactions - net increase (decrease) | 107,632,395 | 68,690,126 |
Total increase (decrease) in net assets | 104,378,663 | 72,313,526 |
| | |
Net Assets | | |
Beginning of period | 72,313,526 | - |
End of period (including undistributed net investment income of $7,998 and $0, respectively) | $ 176,692,189 | $ 72,313,526 |
See accompanying notes which are an integral part of the financial statements.
Annual Report
Financial Highlights - Service Class
Years ended December 31, | 2007 | 2006 G |
Selected Per-Share Data | | |
Net asset value, beginning of period | $ 10.72 | $ 10.00 |
Income from Investment Operations | | |
Net investment income (loss) E | .17 | .17 |
Net realized and unrealized gain (loss) | .74 | .74 |
Total from investment operations | .91 | .91 |
Distributions from net investment income | (.13) | (.08) |
Distributions from net realized gain | (.74) | (.11) |
Total distributions | (.87) | (.19) |
Net asset value, end of period | $ 10.76 | $ 10.72 |
Total Return B,C,D | 8.52% | 9.09% |
Ratios to Average Net Assets F,H | | |
Expenses before reductions | .35% | .35% A |
Expenses net of fee waivers, if any | .20% | .20% A |
Expenses net of all reductions | .20% | .20% A |
Net investment income (loss) | 1.48% | 2.33% A |
Supplemental Data | | |
Net assets, end of period (000 omitted) | $ 118 | $ 109 |
Portfolio turnover rate | 104% | 111% A |
A Annualized
B Total returns for periods of less than one year are not annualized.
C Total returns do not reflect charges attributable to your insurance company's separate account. Inclusion of these charges would reduce the total returns shown.
D Total returns would have been lower had certain expenses not been reduced during the periods shown.
E Calculated based on average shares outstanding during the period.
F Amounts do not include the activity of the underlying funds.
G For the period April 13, 2006 (commencement of operations) to December 31, 2006.
H Expense ratios reflect operating expenses of the class. Expenses before reductions do not reflect amounts reimbursed by the investment adviser or expense offset arrangements and do not represent the amount paid by the class during periods when reimbursements or reductions occur. Expense ratios before reductions for start-up periods may not be representative of longer-term operating periods. Expenses net of fee waivers reflect expenses after reimbursement by the investment adviser but prior to reductions from expense offset arrangements. Expenses net of all reductions represent the net expenses paid by the class but do not include expenses of the investment companies in which the Fund invests.
Financial Highlights - Service Class 2
Years ended December 31, | 2007 | 2006 G |
Selected Per-Share Data | | |
Net asset value, beginning of period | $ 10.72 | $ 10.00 |
Income from Investment Operations | | |
Net investment income (loss) E | .15 | .16 |
Net realized and unrealized gain (loss) | .74 | .74 |
Total from investment operations | .89 | .90 |
Distributions from net investment income | (.11) | (.07) |
Distributions from net realized gain | (.74) | (.11) |
Total distributions | (.85) | (.18) |
Net asset value, end of period | $ 10.76 | $ 10.72 |
Total Return B,C,D | 8.36% | 8.99% |
Ratios to Average Net Assets F,H | | |
Expenses before reductions | .50% | .50% A |
Expenses net of fee waivers, if any | .35% | .35% A |
Expenses net of all reductions | .35% | .35% A |
Net investment income (loss) | 1.33% | 2.17% A |
Supplemental Data | | |
Net assets, end of period (000 omitted) | $ 118 | $ 109 |
Portfolio turnover rate | 104% | 111% A |
A Annualized
B Total returns for periods of less than one year are not annualized.
C Total returns do not reflect charges attributable to your insurance company's separate account. Inclusion of these charges would reduce the total returns shown.
D Total returns would have been lower had certain expenses not been reduced during the periods shown.
E Calculated based on average shares outstanding during the period.
F Amounts do not include the activity of the underlying funds.
G For the period April 13, 2006 (commencement of operations) to December 31, 2006.
H Expense ratios reflect operating expenses of the class. Expenses before reductions do not reflect amounts reimbursed by the investment adviser or expense offset arrangements and do not represent the amount paid by the class during periods when reimbursements or reductions occur. Expense ratios before reductions for start-up periods may not be representative of longer-term operating periods. Expenses net of fee waivers reflect expenses after reimbursement by the investment adviser but prior to reductions from expense offset arrangements. Expenses net of all reductions represent the net expenses paid by the class but do not include expenses of the investment companies in which the Fund invests.
See accompanying notes which are an integral part of the financial statements.
VIP FundsManager Portfolio
Financial Highlights - Investor Class
Years ended December 31, | 2007 | 2006 G |
Selected Per-Share Data | | |
Net asset value, beginning of period | $ 10.72 | $ 10.00 |
Income from Investment Operations | | |
Net investment income (loss) E | .17 | .17 |
Net realized and unrealized gain (loss) | .75 | .74 |
Total from investment operations | .92 | .91 |
Distributions from net investment income | (.13) | (.08) |
Distributions from net realized gain | (.74) | (.11) |
Total distributions | (.87) | (.19) |
Net asset value, end of period | $ 10.77 | $ 10.72 |
Total Return B,C,D | 8.63% | 9.09% |
Ratios to Average Net Assets F,H | | |
Expenses before reductions | .25% | .25% A |
Expenses net of fee waivers, if any | .20% | .20% A |
Expenses net of all reductions | .20% | .20% A |
Net investment income (loss) | 1.48% | 2.32% A |
Supplemental Data | | |
Net assets, end of period (000 omitted) | $ 176,456 | $ 72,095 |
Portfolio turnover rate | 104% | 111% A |
A Annualized
B Total returns for periods of less than one year are not annualized.
C Total returns do not reflect charges attributable to your insurance company's separate account. Inclusion of these charges would reduce the total returns shown.
D Total returns would have been lower had certain expenses not been reduced during the periods shown.
E Calculated based on average shares outstanding during the period.
F Amounts do not include the activity of the underlying funds.
G For the period April 13, 2006 (commencement of operations) to December 31, 2006.
H Expense ratios reflect operating expenses of the class. Expenses before reductions do not reflect amounts reimbursed by the investment adviser or expense offset arrangements and do not represent the amount paid by the class during periods when reimbursements or reductions occur. Expense ratios before reductions for start-up periods may not be representative of longer-term operating periods. Expenses net of fee waivers reflect expenses after reimbursement by the investment adviser but prior to reductions from expense offset arrangements. Expenses net of all reductions represent the net expenses paid by the class but do not include expenses of the investment companies in which the Fund invests.
See accompanying notes which are an integral part of the financial statements.
Annual Report
Notes to Financial Statements
For the period ended December 31, 2007
1. Organization.
VIP FundsManager 20% Portfolio, VIP FundsManager 50% Portfolio, VIP FundsManager 60% Portfolio, VIP FundsManager 70% Portfolio, and VIP FundsManager 85% Portfolio (the Funds) are funds of Variable Insurance Products Fund V (the trust)(formerly of Variable Insurance Products Fund IV). Effective April 19, 2007, the Board of Trustees approved an Agreement and Plan of Reorganization whereby the Funds (with the exception of VIP FundsManager 60% Portfolio, which commenced operations on August 22, 2007) reorganized into Variable Insurance Products Fund V effective June 29, 2007 (Trust Reorganization). The Trust Reorganization does not impact the Funds' investment strategies or Fidelity Management & Research Company's (FMR) management of the Funds. The Trust is registered under the Investment Company Act of 1940, as amended (the 1940 Act), as an open-end management investment company organized as Massachusetts business trust. Each Fund is authorized to issue an unlimited number of shares. The Funds invest primarily in a combination of other VIP and Fidelity retail equity, fixed income, and money market funds (the Underlying Funds) managed by Fidelity Management & Research Company (FMR) and its affiliates. Shares of each Fund may only be purchased by insurance companies for the purpose of funding variable annuity or variable life insurance contracts. Each Fund offers three classes of shares: Investor Class shares, Service Class shares and Service Class 2 shares. All classes have equal rights and voting privileges, except for matters affecting a single class. Investment income, realized and unrealized capital gains and losses, the common expenses of the Fund, and certain fund-level expense reductions, if any, are allocated on a pro rata basis to each class based on the relative net assets of each class to the total net assets of the Fund. Each class differs with respect to distribution and service plan fees incurred. Certain expense reductions also differ by class.
2. Significant Accounting Policies.
The financial statements have been prepared in conformity with accounting principles generally accepted in the United States of America, which require management to make certain estimates and assumptions at the date of the financial statements. The following summarizes the significant accounting policies of the Funds:
Security Valuation. Net asset value per share is calculated as of the close of business of the New York Stock Exchange, normally 4:00 p.m. Eastern time. Investments in the Underlying Funds are valued at their closing net asset value each business day. Short-term securities with remaining maturities of sixty days or less for which quotations are not readily available are valued on the basis of amortized cost, which approximates value.
Investment Transactions and Income. For financial reporting purposes, the Funds' investment holdings and NAV include trades executed through the end of the last business day of the period. The NAV for processing shareholder transactions includes trades executed through the end of the prior business day. Gains and losses on securities sold are determined on the basis of identified cost. Income and capital gain distributions from the Underlying Funds, if any, are recorded on the ex-dividend date. Interest income is accrued as earned. Interest income includes coupon interest and amortization of premium and accretion of discount on debt securities.
Expenses. Most expenses of the trust can be directly attributed to a fund. Expenses which cannot be directly attributed are apportioned among each Fund in the trust. Expenses included in the accompanying financial statements reflect the expenses of each Fund and do not include any expenses associated with the Underlying Funds. Expense estimates are accrued in the period to which they relate and adjustments are made when actual amounts are known. All legal and other expenses associated with the Trust Reorganization will be paid by FMR.
Income Tax Information and Distributions to Shareholders. Each year, each Fund intends to qualify as a regulated investment company by distributing substantially all of its taxable income and realized gains under Subchapter M of the Internal Revenue Code and filing its U.S. federal tax return. As a result, no provision for income taxes is required. Each Fund adopted the provisions of FASB Interpretation No. 48, Accounting for Uncertainties in Income Taxes, on June 29, 2007. VIP FundsManager 60% Portfolio has been subject to the provisions of FIN 48 since its commencement of operations. FIN 48 sets forth a minimum threshold for financial statement recognition of the benefit of a tax position taken or expected to be taken in a tax return. The implementation of FIN 48 did not result in any unrecognized tax benefits in the accompanying financial statements. For VIP FundsManager 60% Portfolio there are no unrecognized tax benefits in the accompanying financial statements in connection with the tax positions expected to be taken in the initial filing of its federal tax return. Each of the Fund's federal tax returns for the prior three fiscal years (except for VIP FundsManager 60% Portfolio) remains subject to examination by the Internal Revenue Service.
Distributions are recorded on the ex-dividend date. Income dividends and capital gain distributions are declared separately for each class. Income and capital gain distributions are determined in accordance with income tax regulations, which may differ from generally accepted accounting principles.
Capital accounts within the financial statements are adjusted for permanent book-tax differences. These adjustments have no impact on net assets or the results of operations. Temporary book-tax differences will reverse in a subsequent period.
Book-tax differences are primarily due to the short-term gain distributions from the Underlying Funds and losses deferred due to wash sales.
VIP FundsManager Portfolio
2. Significant Accounting Policies - continued
Income Tax Information and Distributions to Shareholders - continued
The tax-basis components of distributable earnings and the federal tax cost as of period end were as follows for each Fund:
| Cost for
Federal Income
Tax Purposes | Unrealized
Appreciation | Unrealized
Depreciation | Net Unrealized
Appreciation/
(Depreciation) |
VIP FundsManager 20% Portfolio | $ 117,246,273 | $ 584,491 | $ (1,625,775) | $ (1,041,284) |
VIP FundsManager 50% Portfolio | 378,818,080 | 3,783,478 | (11,013,792) | (7,230,314) |
VIP FundsManager 60% Portfolio | 116,983,211 | 288,107 | (3,241,714) | (2,953,607) |
VIP FundsManager 70% Portfolio | 457,486,834 | 6,754,776 | (19,468,197) | (12,713,421) |
VIP FundsManager 85% Portfolio | 181,272,951 | 3,915,768 | (8,467,406) | (4,551,638) |
| Undistributed
Ordinary
Income | Undistributed
Long-term
Capital Gain |
VIP FundsManager 20% Portfolio | $ - | $ 404,909 |
VIP FundsManager 50% Portfolio | - | 4,448,719 |
VIP FundsManager 60% Portfolio | 43,897 | 1,157,628 |
VIP FundsManager 70% Portfolio | - | 10,235,457 |
VIP FundsManager 85% Portfolio | 16,999 | 4,904,308 |
The tax character of distributions paid was as follows:
December 31, 2007 | | | |
| Ordinary
Income | Long-term
Capital Gains | Total |
VIP FundsManager 20% Portfolio | $ 4,473,251 | $ 304,645 | $ 4,777,896 |
VIP FundsManager 50% Portfolio | 18,441,095 | 3,618,943 | 22,060,038 |
VIP FundsManager 60% Portfolio | 1,017,984 | 209,906 | 1,227,890 |
VIP FundsManager 70% Portfolio | 23,666,951 | 5,319,714 | 28,986,665 |
VIP FundsManager 85% Portfolio | 9,256,735 | 2,593,791 | 11,850,526 |
December 31, 2006 | | | |
| Ordinary
Income | Long-term
Capital Gains | Total |
VIP FundsManager 20% Portfolio | $ 421,605 | $ 22,919 | $ 444,524 |
VIP FundsManager 50% Portfolio | 2,569,280 | 269,046 | 2,838,326 |
VIP FundsManager 70% Portfolio | 3,200,680 | 326,612 | 3,527,292 |
VIP FundsManager 85% Portfolio | 1,058,054 | 198,405 | 1,256,459 |
New Accounting Pronouncement. In September 2006, Statement of Financial Accounting Standards No. 157, Fair Value Measurements (SFAS 157), was issued and is effective for fiscal years beginning after November 15, 2007. SFAS 157 defines fair value, establishes a framework for measuring fair value and expands disclosures about fair value measurements. Management is currently evaluating the impact the adoption of SFAS 157 will have on the Funds' financial statement disclosures.
3. Operating Policies.
Repurchase Agreements. FMR has received an Exemptive Order from the Securities and Exchange Commission (the SEC) which permits certain Funds and other affiliated entities of FMR to transfer uninvested cash balances into joint trading accounts which are then invested in repurchase agreements. Certain Funds may also invest directly with institutions in repurchase agreements. Repurchase agreements are collateralized by government or non-government securities. Upon settlement date, collateral is held in segregated accounts with custodian banks and may be obtained in the event of a default of the counterparty. Each applicable Fund monitors, on a daily basis, the value of the collateral to ensure it is at least equal to the principal amount of the repurchase agreement (including accrued interest). In the event of a default by the counterparty, realization of the collateral proceeds could be delayed, during which time the value of the collateral may decline.
Annual Report
Notes to Financial Statements - continued
4. Purchases and Sales of Investments.
Purchases and redemptions of the Underlying Fund shares are noted in the table below.
| Purchases ($) | Redemptions ($) |
VIP FundsManager 20% Portfolio | 146,087,004 | 53,904,613 |
VIP FundsManager 50% Portfolio | 474,604,492 | 244,883,980 |
VIP FundsManager 60% Portfolio | 127,255,957 | 10,034,260 |
VIP FundsManager 70% Portfolio | 620,778,968 | 350,004,177 |
VIP FundsManager 85% Portfolio | 246,290,088 | 140,668,072 |
5. Fees and Other Transactions with Affiliates.
Management Fee. Strategic Advisers, Inc. (Strategic Advisers), an affiliate of FMR, provides the funds with investment management related services. For these services each fund pays a monthly management fee to Strategic Advisers. The management fee is based on an annual rate of .25% of each fund's average net assets. The management fee is reduced by an amount equal to the fees and expenses paid by the fund to the independent Trustees.
Strategic Advisers has contractually agreed to waive 0.05% of its management fee, thereby limiting each fund's management fee to an annual rate of 0.20% of average net assets, until July 31, 2008.
Other Transactions. Strategic Advisers has entered into an administration agreement with FMR under which FMR provides management and administrative services (other than investment advisory services) necessary for the operation of each Fund. Pursuant to this agreement, FMR pays all expenses of each Fund, excluding the distribution and service fees, the compensation of the independent Trustees and certain other expenses such as interest expense. FMR also contracts with other Fidelity companies to perform the services necessary for the operation of each Fund.
Distribution and Service Plan. In accordance with Rule 12b-1 of the 1940 Act, the Funds have adopted separate 12b-1 Plans for each Service Class of shares. Each Service Class pays Fidelity Distributors Corporation (FDC), an affiliate of FMR, a service fee. For the period, the service fee is based on an annual rate of .10% of Service Class' average net assets and .25% of Service Class 2's average net assets.
For the period, each class paid FDC the following amounts, all of which were reallowed to insurance companies for the distribution of shares and providing shareholder support services:
| Service Class | Service Class 2 | Total |
VIP FundsManager 20% Portfolio | $ 109 | $ 271 | $ 380 |
VIP FundsManager 50% Portfolio | 112 | 278 | 390 |
VIP FundsManager 60% Portfolio | 37 | 92 | 129 |
VIP FundsManager 70% Portfolio | 115 | 285 | 400 |
VIP FundsManager 85% Portfolio | 116 | 290 | 406 |
6. Expense Reductions.
Strategic Advisers contractually agreed to limit each funds' management fee to an annual rate of 0.20% of each funds' average net assets until July 31, 2008. For the period, each fund's management fees were reduced by the following amounts:
| Management
Fee Waiver |
| |
VIP FundsManager 20% Portfolio | $ 35,639 |
VIP FundsManager 50% Portfolio | 132,853 |
VIP FundsManager 60% Portfolio | 6,751 |
VIP FundsManager 70% Portfolio | 166,110 |
VIP FundsManager 85% Portfolio | 68,248 |
In addition, FMR has contractually agreed to reimburse 0.10% of class-level expenses for each fund's Service class and Service Class 2. During the period, this reimbursement reduced each fund's Service class and Service class 2's expenses by the following amounts:
| Reimbursement |
VIP FundsManager 20% Portfolio | |
Service Class | $ 109 |
Service Class 2 | 106 |
VIP FundsManager Portfolio
6. Expense Reductions - continued
| Reimbursement |
VIP FundsManager 50% Portfolio | |
Service Class | $ 112 |
Service Class 2 | 106 |
| |
VIP FundsManager 60% Portfolio | |
Service Class | 37 |
Service Class 2 | 37 |
| |
VIP FundsManager 70% Portfolio | |
Service Class | 115 |
Service Class 2 | 112 |
| |
VIP FundsManager 85% Portfolio | |
Service Class | 116 |
Service Class 2 | 114 |
In addition, through arrangements with each applicable Fund's custodian, credits realized as a result of uninvested cash balances were used to reduce each applicable Fund's management fee. During the period, these credits reduced management fee by the following amounts:
VIP FundsManager 20% Portfolio | $ 316 |
VIP FundsManager 50% Portfolio | 428 |
VIP FundsManager 60% Portfolio | 12 |
VIP FundsManager 70% Portfolio | 712 |
VIP FundsManager 85% Portfolio | 25 |
7. Other.
The Funds' organizational documents provide former and current trustees and officers with a limited indemnification against liabilities arising in connection with the performance of their duties to the Funds. In the normal course of business, the Funds may also enter into contracts that provide general indemnifications. The Funds' maximum exposure under these arrangements is unknown as this would be dependent on future claims that may be made against the Funds. The risk of material loss from such claims is considered remote.
The Funds do not invest in the Underlying Funds for the purpose of exercising management or control; however, investments by the Funds within their principal investment strategies may represent a significant portion of the Underlying Funds' net assets. At the end of the period, FMR or its affiliates were owners of record of all of the outstanding shares of the Funds.
8. Distributions to Shareholders.
Distributions to shareholders of each class were as follows:
Years ended December 31, | 2007 | 2006 A |
VIP FundsManager 20% Portfolio | | |
From net investment income | | |
Service Class | $ 2,969 | $ 1,440 |
Service Class 2 | 2,802 | 1,330 |
Investor Class | 3,039,292 | 327,158 |
Total | $ 3,045,063 | $ 329,928 |
From net realized gain | | |
Service Class | $ 2,045 | $ 500 |
Service Class 2 | 2,043 | 500 |
Investor Class | 1,728,745 | 113,596 |
Total | $ 1,732,833 | $ 114,596 |
Annual Report
Notes to Financial Statements - continued
8. Distributions to Shareholders - continued
Distributions to shareholders of each class were as follows:
Years ended December 31, | 2007 | 2006 A |
VIP FundsManager 50% Portfolio | | |
From net investment income | | |
Service Class | $ 2,462 | $ 1,210 |
Service Class 2 | 2,284 | 1,100 |
Investor Class | 7,943,609 | 1,625,309 |
Total | $ 7,948,355 | $ 1,627,619 |
From net realized gain | | |
Service Class | $ 5,151 | $ 900 |
Service Class 2 | 5,146 | 900 |
Investor Class | 14,101,386 | 1,208,907 |
Total | $ 14,111,683 | $ 1,210,707 |
| | |
VIP FundsManager 60% Portfolio B | | |
From net investment income | | |
Service Class | $ 570 | $ - |
Service Class 2 | 510 | - |
Investor Class | 597,092 | - |
Total | $ 598,172 | $ - |
From net realized gain | | |
Service Class | $ 600 | $ - |
Service Class 2 | 600 | - |
Investor Class | 628,518 | - |
Total | $ 629,718 | $ - |
| | |
VIP FundsManager 70% Portfolio | | |
From net investment income | | |
Service Class | $ 1,893 | $ 1,060 |
Service Class 2 | 1,716 | 950 |
Investor Class | 7,177,756 | 1,728,920 |
Total | $ 7,181,365 | $ 1,730,930 |
From net realized gain | | |
Service Class | $ 6,497 | $ 1,100 |
Service Class 2 | 6,490 | 1,100 |
Investor Class | 21,792,313 | 1,794,162 |
Total | $ 21,805,300 | $ 1,796,362 |
| | |
VIP FundsManager 85% Portfolio | | |
From net investment income | | |
Service Class | $ 1,348 | $ 800 |
Service Class 2 | 1,171 | 690 |
Investor Class | 2,009,580 | 527,482 |
Total | $ 2,012,099 | $ 528,972 |
From net realized gain | | |
Service Class | $ 7,583 | $ 1,100 |
Service Class 2 | 7,576 | 1,100 |
Investor Class | 9,823,268 | 725,287 |
Total | $ 9,838,427 | $ 727,487 |
A Distributions for Service Class, Service Class 2 and Investor Class are for the period April 13, 2006 (commencement of sale of shares) to December 31, 2006.
B For the period August 22, 2007 (commencement of operations) to December 31, 2007.
VIP FundsManager Portfolio
9. Share Transactions.
Transactions for each class of shares were as follows:
| Shares | Dollars |
Years ended December 31, | 2007 | 2006 A | 2007 | 2006 A |
VIP FundsManager 20% Portfolio | | | | |
Service Class | | | | |
Shares sold | - | 10,001 | $ - | $ 100,010 |
Reinvestment of distributions | 479 | 187 | 5,014 | 1,940 |
Net increase (decrease) | 479 | 10,188 | $ 5,014 | $ 101,950 |
Service Class 2 | | | | |
Shares sold | - | 10,001 | $ - | $ 100,010 |
Reinvestment of distributions | 463 | 177 | 4,845 | 1,830 |
Net increase (decrease) | 463 | 10,178 | $ 4,845 | $ 101,840 |
Investor Class | | | | |
Shares sold | 9,012,043 | 2,582,277 | $ 95,847,467 | $ 26,408,816 |
Reinvestment of distributions | 455,501 | 42,585 | 4,768,037 | 440,754 |
Shares redeemed | (723,608) | (299,208) | (7,752,555) | (3,103,637) |
Net increase (decrease) | 8,743,936 | 2,325,654 | $ 92,862,949 | $ 23,745,933 |
| | | | |
VIP FundsManager 50% Portfolio | | | | |
Service Class | | | | |
Shares sold | - | 10,001 | $ - | $ 100,010 |
Reinvestment of distributions | 723 | 200 | 7,613 | 2,110 |
Net increase (decrease) | 723 | 10,201 | $ 7,613 | $ 102,120 |
Service Class 2 | | | | |
Shares sold | - | 10,001 | $ - | $ 100,010 |
Reinvestment of distributions | 706 | 190 | 7,430 | 2,000 |
Net increase (decrease) | 706 | 10,191 | $ 7,430 | $ 102,010 |
Investor Class | | | | |
Shares sold | 20,445,178 | 13,626,238 | $ 222,343,167 | $ 138,574,548 |
Reinvestment of distributions | 2,094,878 | 268,901 | 22,044,995 | 2,834,216 |
Shares redeemed | (869,854) | (225,232) | (9,409,117) | (2,298,446) |
Net increase (decrease) | 21,670,202 | 13,669,907 | $ 234,979,045 | $ 139,110,318 |
| | | | |
VIP FundsManager 60% Portfolio B | | | | |
Service Class | | | | |
Shares sold | 10,001 | - | $ 100,010 | $ - |
Reinvestment of distributions | 113 | - | 1,170 | - |
Net increase (decrease) | 10,114 | - | $ 101,180 | $ - |
Service Class 2 | | | | |
Shares sold | 10,001 | - | $ 100,010 | $ - |
Reinvestment of distributions | 108 | - | 1,110 | - |
Net increase (decrease) | 10,109 | - | $ 101,120 | $ - |
Investor Class | | | | |
Shares sold | 10,959,715 | - | $ 114,483,306 | $ - |
Reinvestment of distributions | 118,876 | - | 1,225,610 | - |
Shares redeemed | (13,739) | - | (144,705) | - |
Net increase (decrease) | 11,064,852 | - | $ 115,564,211 | $ - |
| | | | |
Annual Report
Notes to Financial Statements - continued
9. Share Transactions - continued
Transactions for each class of shares were as follows:
| Shares | Dollars |
Years ended December 31, | 2007 | 2006 A | 2007 | 2006 A |
VIP FundsManager 70% Portfolio | | | | |
Service Class | | | | |
Shares sold | - | 10,001 | $ - | $ 100,010 |
Reinvestment of distributions | 785 | 203 | 8,390 | 2,160 |
Net increase (decrease) | 785 | 10,204 | $ 8,390 | $ 102,170 |
Service Class 2 | | | | |
Shares sold | - | 10,001 | $ - | $ 100,010 |
Reinvestment of distributions | 768 | 192 | 8,206 | 2,050 |
Net increase (decrease) | 768 | 10,193 | $ 8,206 | $ 102,060 |
Investor Class | | | | |
Shares sold | 23,324,108 | 16,535,121 | $ 258,786,944 | $ 168,412,346 |
Reinvestment of distributions | 2,711,517 | 330,495 | 28,970,069 | 3,523,082 |
Shares redeemed | (1,025,874) | (132,487) | (11,415,216) | (1,319,779) |
Net increase (decrease) | 25,009,751 | 16,733,129 | $ 276,341,797 | $ 170,615,649 |
| | |
VIP FundsManager 85% Portfolio | | | | |
Service Class | | | | |
Shares sold | - | 10,001 | $ - | $ 100,010 |
Reinvestment of distributions | 827 | 177 | 8,931 | 1,900 |
Net increase (decrease) | 827 | 10,178 | $ 8,931 | $ 101,910 |
Service Class 2 | | | | |
Shares sold | - | 10,001 | $ - | $ 100,010 |
Reinvestment of distributions | 809 | 167 | 8,746 | 1,790 |
Net increase (decrease) | 809 | 10,168 | $ 8,746 | $ 101,800 |
Investor Class | | | | |
Shares sold | 9,802,668 | 6,665,215 | $ 109,712,701 | $ 67,823,047 |
Reinvestment of distributions | 1,094,900 | 116,537 | 11,832,849 | 1,252,769 |
Shares redeemed | (1,232,709) | (58,774) | (13,930,832) | (589,400) |
Net increase (decrease) | 9,664,859 | 6,722,978 | $ 107,614,718 | $ 68,486,416 |
A Share transactions for Service Class, Service Class 2 and Investor Class are for the period April 13, 2006 (commencement of sale of shares) to December 31, 2006.
B For the period August 22, 2007 (commencement of operations) to December 31, 2007.
VIP FundsManager Portfolio
Report of Independent Registered Public Accounting Firm
To the Trustees of Variable Insurance Products Fund V and the Shareholders of VIP FundsManager 20% Portfolio, VIP FundsManager 50% Portfolio, VIP FundsManager 60% Portfolio, VIP FundsManager 70% Portfolio and VIP FundsManager 85% Portfolio:
In our opinion, the accompanying statements of assets and liabilities, including the schedules of investments, and the related statements of operations and of changes in net assets and the financial highlights present fairly, in all material respects, the financial position of VIP FundsManager 20% Portflio, VIP FundsManager 50% Portfolio, VIP FundsManager 60% Portfolio, VIP FundsManager 70% Portfolio, and VIP FundsManager 85% Portfolio (funds of Variable Insurance Products Fund V) at December 31, 2007, the results of each of their operations for the periods indicated, the changes in each of their net assets for each of the periods indicated and the financial highlights for each of the periods indicated, in conformity with accounting principles generally accepted in the United States of America. These financial statements and financial highlights (hereafter referred to as "financial statements") are the responsibility of the Variable Insurance Products Fund V's management. Our responsibility is to express an opinion on these financial statements based on our audits. We conducted our audits of these financial statements in accordance with the standards of the Public Company Accounting Oversight Board (United States). Those standards require that we plan and perform the audit to obtain reasonable assurance about whether the financial statements are free of material misstatement. An audit includes examining, on a test basis, evidence supporting the amounts and disclosures in the financial statements, assessing the accounting principles used and significant estimates made by management, and evaluating the overall financial statement presentation. We believe that our audits, which included confirmation of securities at December 31, 2007 by correspondence with the transfer agent, provide a reasonable basis for our opinion.
/s/ PricewaterhouseCoopers LLP
PricewaterhouseCoopers LLP
Boston, Massachusetts
February 28, 2008
Annual Report
Trustees and Officers
The Trustees, Members of the Advisory Board, and executive officers of the trust and, as applicable, are listed below. The Board of Trustees governs each VIP FundsManager Portfolio and is responsible for protecting the interests of shareholders. The Trustees are experienced executives who meet periodically throughout the year to oversee each VIP FundsManager Portfolio's activities, review contractual arrangements with companies that provide services to each VIP FundsManager Portfolio, and review each VIP FundsManager Portfolio's performance. If the interests of a VIP FundsManager Portfolio and an underlying Fidelity fund were to diverge, a conflict of interest could arise and affect how the Trustees and Members of the Advisory Board fulfill their fiduciary duties to the affected funds. Strategic Advisors has structured the VIP FundsManager Portfolios to avoid these potential conflicts, although there may be situations where a conflict of interest is unavoidable. In such instances, Strategic Advisors, the Trustees, and Members of the Advisory Board would take reasonable steps to minimize, and, if possible, eliminate the conflict. Except for James C. Curvey, each of the Trustees oversees 373 funds advised by FMR or an affiliate. Mr. Curvey oversees 368 funds advised by FMR or an affiliate.
The Trustees hold office without limit in time except that (a) any Trustee may resign; (b) any Trustee may be removed by written instrument, signed by at least two-thirds of the number of Trustees prior to such removal; (c) any Trustee who requests to be retired or who has become incapacitated by illness or injury may be retired by written instrument signed by a majority of the other Trustees; and (d) any Trustee may be removed at any special meeting of shareholders by a two-thirds vote of the outstanding voting securities of the trust. Each Trustee who is not an interested person (as defined in the 1940 Act) (Independent Trustee), shall retire not later than the last day of the calendar year in which his or her 72nd birthday occurs. The Independent Trustees may waive this mandatory retirement age policy with respect to individual Trustees. The executive officers and Advisory Board Members hold office without limit in time, except that any officer and Advisory Board Member may resign or may be removed by a vote of a majority of the Trustees at any regular meeting or any special meeting of the Trustees. Except as indicated, each individual has held the office shown or other offices in the same company for the past five years.
The fund's Statement of Additional Information (SAI) includes more information about the Trustees. To request a free copy, call Fidelity at 1-877-208-0098.
Interested Trustees*:
Correspondence intended for each Trustee who is an interested person may be sent to Fidelity Investments, 82 Devonshire Street, Boston, Massachusetts 02109.
Name, Age; Principal Occupation |
Edward C. Johnson 3d (77) |
| Year of Election or Appointment: 1989 Mr. Johnson is Chairman of the Board of Trustees. Mr. Johnson serves as President (2006-present), Chief Executive Officer, Chairman, and a Director of FMR LLC; Chairman and a Director of FMR; Chairman and a Director of Fidelity Research & Analysis Company (FRAC); Chairman and a Director of Fidelity Investments Money Management, Inc.; and Chairman (2001-present) and a Director of FMR Co., Inc. In addition, Mr. Johnson serves as Chairman and Director of Fidelity International Limited (FIL). Mr. Edward C. Johnson 3d and Mr. Arthur E. Johnson are not related. |
James C. Curvey (72) |
| Year of Election or Appointment: 2007 Mr. Curvey also serves as Trustee (2007-present) or Member of the Advisory Board (2007-present) of other investment companies advised by FMR. Mr. Curvey is a Director of FMR and FMR Co., Inc. (2007-present). Mr. Curvey is also Vice Chairman (2006-present) and Director of FMR LLC. Mr. Curvey joined Fidelity in 1982 and served in numerous senior management positions, including President and Chief Operating Officer of FMR LLC (1997-2000) and President of Fidelity Strategic Investments (2000-2002). In addition, he serves as a member of the Board of Directors of Geerlings & Wade, Inc. (wine distribution). |
* Trustees have been determined to be "Interested Trustees" by virtue of, among other things, their affiliation with the trusts or various entities under common control with FMR. FMR Corp. merged with and into FMR LLC on October 1, 2007. Any references to FMR LLC for prior periods are deemed to be references to the prior entity.
Independent Trustees:
Correspondence intended for each Independent Trustee (that is, the Trustees other than the Interested Trustees) may be sent to Fidelity Investments, P.O. Box 55235, Boston, Massachusetts 02205-5235.
Name, Age; Principal Occupation |
Dennis J. Dirks (59) |
| Year of Election or Appointment: 2005 Prior to his retirement in May 2003, Mr. Dirks was Chief Operating Officer and a member of the Board of The Depository Trust & Clearing Corporation (DTCC) (1999-2003). He also served as President, Chief Operating Officer, and Board member of The Depository Trust Company (DTC) (1999-2003) and President and Board member of the National Securities Clearing Corporation (NSCC) (1999-2003). In addition, Mr. Dirks served as Chief Executive Officer and Board member of the Government Securities Clearing Corporation (2001-2003) and Chief Executive Officer and Board member of the Mortgage-Backed Securities Clearing Corporation (2001-2003). Mr. Dirks also serves as a Trustee and a member of the Finance Committee of Manhattan College (2005-present) and a Trustee and a member of the Finance Committee of AHRC of Nassau County (2006-present). |
Albert R. Gamper, Jr. (65) |
| Year of Election or Appointment: 2006 Prior to his retirement in December 2004, Mr. Gamper served as Chairman of the Board of CIT Group Inc. (commercial finance). During his tenure with CIT Group Inc. Mr. Gamper served in numerous senior management positions, including Chairman (1987-1989; 1999-2001; 2002-2004), Chief Executive Officer (1987-2004), and President (1989-2002). He currently serves as a member of the Board of Directors of Public Service Enterprise Group (utilities, 2001-present), Chairman of the Board of Governors, Rutgers University (2004-present), and Chairman of the Board of Saint Barnabas Health Care System. |
George H. Heilmeier (71) |
| Year of Election or Appointment: 2004 Dr. Heilmeier is Chairman Emeritus of Telcordia Technologies (communication software and systems), where prior to his retirement, he served as company Chairman and Chief Executive Officer. He currently serves on the Boards of Directors of The Mitre Corporation (systems engineering and information technology support for the government), and HRL Laboratories (private research and development, 2004-present). He is Chairman of the General Motors Science & Technology Advisory Board and a Life Fellow of the Institute of Electrical and Electronics Engineers (IEEE). Dr. Heilmeier is a member of the Defense Science Board and the National Security Agency Advisory Board. He is also a member of the National Academy of Engineering, the American Academy of Arts and Sciences, and the Board of Overseers of the School of Engineering and Applied Science of the University of Pennsylvania. Previously, Dr. Heilmeier served as a Director of TRW Inc. (automotive, space, defense, and information technology, 1992-2002), Compaq (1994-2002), Automatic Data Processing, Inc. (ADP) (technology-based business outsourcing, 1995-2002), INET Technologies Inc. (telecommunications network surveillance, 2001-2004), and Teletech Holdings (customer management services). He is the recipient of the 2005 Kyoto Prize in Advanced Technology for his invention of the liquid crystal display, and a member of the Consumer Electronics Hall of Fame. |
James H. Keyes (67) |
| Year of Election or Appointment: 2007 Prior to his retirement in 2003, Mr. Keyes was Chairman, President, and Chief Executive Officer of Johnson Controls, Inc. (automotive supplier, 1993-2003). He currently serves as a member of the boards of LSI Logic Corporation (semiconductor technologies), Navistar International Corporation (manufacture and sale of trucks, buses, and diesel engines, 2002-present), and Pitney Bowes, Inc. (integrated mail, messaging, and document management solutions). |
Marie L. Knowles (61) |
| Year of Election or Appointment: 2001 Prior to Ms. Knowles' retirement in June 2000, she served as Executive Vice President and Chief Financial Officer of Atlantic Richfield Company (ARCO) (diversified energy, 1996-2000). From 1993 to 1996, she was a Senior Vice President of ARCO and President of ARCO Transportation Company. She served as a Director of ARCO from 1996 to 1998. She currently serves as a Director of Phelps Dodge Corporation (copper mining and manufacturing) and McKesson Corporation (healthcare service, 2002-present). Ms. Knowles is a Trustee of the Brookings Institution and the Catalina Island Conservancy and also serves as a member of the Advisory Board for the School of Engineering of the University of Southern California. |
Ned C. Lautenbach (63) |
| Year of Election or Appointment: 2000 Mr. Lautenbach is Chairman of the Independent Trustees (2006-present). Mr. Lautenbach has been a partner of Clayton, Dubilier & Rice, Inc. (private equity investment firm) since September 1998. Previously, Mr. Lautenbach was with the International Business Machines Corporation (IBM) from 1968 until his retirement in 1998. Mr. Lautenbach serves as a Director of Sony Corporation (2006-present) and Eaton Corporation (diversified industrial) as well as the Philharmonic Center for the Arts in Naples, Florida. He also is a member of the Board of Trustees of Fairfield University (2005-present), as well as a member of the Council on Foreign Relations. |
Cornelia M. Small (63) |
| Year of Election or Appointment: 2005 Ms. Small is a member (2000-present) and Chairperson (2002-present) of the Investment Committee, and a member (2002-present) of the Board of Trustees of Smith College. Previously, she served as Chief Investment Officer (1999-2000), Director of Global Equity Investments (1996-1999), and a member of the Board of Directors of Scudder, Stevens & Clark (1990-1997) and Scudder Kemper Investments (1997-1999). In addition, Ms. Small served as Co-Chair (2000-2003) of the Annual Fund for the Fletcher School of Law and Diplomacy. |
William S. Stavropoulos (68) |
| Year of Election or Appointment: 2001 Mr. Stavropoulos is Chairman Emeritus of the Board of Directors of The Dow Chemical Company. Since joining The Dow Chemical Company in 1967, Mr. Stavropoulos served in numerous senior management positions, including President (1993-2000; 2002-2003), CEO (1995-2000; 2002-2004), and Chairman of the Executive Committee (2000-2004). Currently, he is a Director of NCR Corporation (data warehousing and technology solutions), Chemical Financial Corporation, Maersk Inc. (industrial conglomerate, 2002-present), Tyco International, Inc. (multinational manufacturing and services, 2007-present), and a member of the Advisory Board for Metalmark Capital (private equity investment firm, 2005-present). He is a special advisor to Clayton, Dubilier & Rice, Inc., a private equity investment firm. He also serves as a member of the Board of Trustees of the American Enterprise Institute for Public Policy Research. In addition, Mr. Stavropoulos is a member of The Business Council, J.P. Morgan International Council and the University of Notre Dame Advisory Council for the College of Science. |
Kenneth L. Wolfe (68) |
| Year of Election or Appointment: 2005 Mr. Wolfe is Chairman and a Director of Hershey Foods Corporation (2007-present), where prior to his retirement in 2001, he was Chairman and Chief Executive Officer. Mr. Wolfe currently serves as a member of the board of Revlon Inc. (2004-present). Previously, Mr. Wolfe served as a member of the boards of Adelphia Communications Corporation (2003-2006) and Bausch & Lomb, Inc. (1993-2007). |
Advisory Board Members and Executive Officers**:
Correspondence intended for Mr. Mauriello, Mr. Thomas, Mr. Wiley, Mr. Lacy, and Mr. Arthur Johnson may be sent to Fidelity Investments, P.O. Box 55235, Boston, Massachusetts 02205-5235. Correspondence intended for each executive officer and Mr. Lynch may be sent to Fidelity Investments, 82 Devonshire Street, Boston, Massachusetts 02109.
Name, Age; Principal Occupation |
Arthur E. Johnson (60) |
| Year of Election or Appointment: 2008 Member of the Advisory Board of Variable Insurance Products Fund V. Mr. Johnson serves as Senior Vice President of Corporate Strategic Development of Lockheed Martin Corporation (defense contractor). In addition, Mr. Johnson serves as a member of the Board of Directors of AGL Resources, Inc. (holding company, 2002-present), and IKON Office Solutions, Inc. (document management systems and services). Mr. Arthur E. Johnson and Mr. Edward C. Johnson 3d are not related. |
Alan J. Lacy (54) |
| Year of Election or Appointment: 2008 Member of the Advisory Board of Variable Insurance Products Fund V. Mr. Lacy serves as Senior Adviser (2007-present) of Oak Hill Capital Partners, L.P. (a private equity firm). Mr. Lacy also served as Vice Chairman and Chief Executive Officer of Sears Holdings Corporation and Sears, Roebuck and Co. (retail, 2005-2006; 2000-2005). In addition, Mr. Lacy serves as a member of the Board of Directors of The Western Union Company (global money transfer, 2006-present) and Bristol-Myers Squibb (global pharmaceuticals, 2007-present). Mr. Lacy is a Trustee of the National Parks Conservation Association and The Field Museum of Natural History. |
Peter S. Lynch (63) |
| Year of Election or Appointment: 2003 Member of the Advisory Board of Variable Insurance Products Fund V. Mr. Lynch is Vice Chairman and a Director of FMR, and Vice Chairman (2001-present) and a Director of FMR Co., Inc. Previously, Mr. Lynch served as a Trustee of the Fidelity funds (1990-2003). In addition, he serves as a Trustee of Boston College and as the Chairman of the Inner-City Scholarship Fund. |
Joseph Mauriello (63) |
| Year of Election or Appointment: 2007 Member of the Advisory Board of Variable Insurance Products Fund V. Prior to his retirement in January 2006, Mr. Mauriello served in numerous senior management positions including Deputy Chairman and Chief Operating Officer (2004-2005), and Vice Chairman of Financial Services (2002-2004) of KPMG LLP US (professional services firm, 1965-2005). Mr. Mauriello currently serves as a member of the Board of Directors of XL Capital Ltd. (global insurance and re-insurance company, 2006-present) and of Arcadia Resources Inc. (health care services and products, 2007-present). He also served as a Director of the Hamilton Funds of the Bank of New York (2006-2007). |
David M. Thomas (58) |
| Year of Election or Appointment: 2007 Member of the Advisory Board of Variable Insurance Products Fund V. Previously, Mr. Thomas served as Executive Chairman (2005-2006) and Chairman and Chief Executive Officer (2000-2005) of IMS Health, Inc. (pharmaceutical and healthcare information solutions). In addition, Mr. Thomas serves as a member of the Board of Directors of Fortune Brands, Inc. (consumer products holding company), and Interpublic Group of Companies, Inc. (marketing communication, 2004-present). |
Michael E. Wiley (57) |
| Year of Election or Appointment: 2007 Member of the Advisory Board of Variable Insurance Products Fund V. Mr. Wiley also serves as a member of the Board of Trustees of the University of Tulsa (2000-2006; 2007-present). He serves as a Director of Tesoro Corporation (independent oil refiner and marketer, 2005-present), and a Director of Bill Barrett Corporation (exploration and production company, 2005-present). In addition, he also serves as a Director of Post Oak Bank (privately-held bank, 2004-present). Previously, Mr. Wiley served as a Sr. Energy Advisor of Katzenbach Partners, LLC (consulting firm, 2006-2007), as an Advisory Director of Riverstone Holdings (private investment firm), Chairman, President, and CEO of Baker Hughes, Inc. (oilfield services company, 2000-2004), and as Director of Spinnaker Exploration Company (exploration and production company, 2001-2005). |
Kimberley H. Monasterio (44) |
| Year of Election or Appointment: 2007 President and Treasurer of VIP FundsManager 20% Portfolio, VIP FundsManager 50% Portfolio, VIP FundsManager 60% Portfolio, VIP FundsManager 70% Portfolio, and VIP FundsManager 85% Portfolio. Ms. Monasterio also serves as President and Treasurer of other Fidelity funds (2007-present) and is an employee of FMR (2004-present). Previously, Ms. Monasterio served as Deputy Treasurer of the Fidelity funds (2004-2006). Before joining Fidelity Investments, Ms. Monasterio served as Treasurer (2000-2004) and Chief Financial Officer (2002-2004) of the Franklin Templeton Funds and Senior Vice President of Franklin Templeton Services, LLC (2000-2004). |
Boyce I. Greer (51) |
| Year of Election or Appointment: 2006 or 2007 Vice President of VIP FundsManager 20% Portfolio (2006), VIP FundsManager 50% Portfolio (2006), VIP FundsManager 60% Portfolio (2007), VIP FundsManager 70% Portfolio (2006), and VIP FundsManager 85% Portfolio (2006). Mr. Greer also serves as Vice President of certain Asset Allocation Funds (2005-present), Fixed-Income Funds (2006-present), and Money Market Funds (2006-present). Mr. Greer is also a Trustee of other investment companies advised by FMR (2003-present). Mr. Greer is an Executive Vice President of FMR (2005-present) and FMR Co., Inc. (2005-present), and Senior Vice President of Fidelity Investments Money Management, Inc. (2006-present). Previously, Mr. Greer served as Vice President of certain Fidelity Equity Funds (2005-2007), a Director and Managing Director of Strategic Advisers, Inc. (2002-2005), and Executive Vice President (2000-2002) and Money Market Group Leader (1997-2002) of the Fidelity Investments Fixed Income Division. Mr. Greer also served as Vice President of Fidelity's Money Market Funds (1997-2002), Senior Vice President of FMR (1997-2002), and Vice President of FIMM (1998-2002). |
Eric D. Roiter (59) |
| Year of Election or Appointment: 2006 or 2007 Secretary of VIP FundsManager 20% Portfolio (2006), VIP FundsManager 50% Portfolio (2006), VIP FundsManager 60% Portfolio (2007), VIP FundsManager 70% Portfolio (2006), and VIP FundsManager 85% Portfolio (2006). He also serves as Secretary of other Fidelity funds; Vice President, General Counsel, and Secretary of FMR Co., Inc. (2001-present) and FMR; Assistant Secretary of Fidelity Management & Research (U.K.) Inc. (2001-present), Fidelity Research & Analysis Company (2001-present), and Fidelity Investments Money Management, Inc. (2001-present). Mr. Roiter is an Adjunct Member, Faculty of Law, at Boston College Law School (2003-present). Previously, Mr. Roiter served as Vice President and Secretary of Fidelity Distributors Corporation (FDC) (1998-2005). |
John B. McGinty, Jr. (45) |
| Year of Election or Appointment: 2008 Assistant Secretary of VIP FundsManager 20% Portfolio, VIP FundsManager 50% Portfolio, VIP FundsManager 60% Portfolio, VIP FundsManager 70% Portfolio, and VIP FundsManager 85% Portfolio. Mr. McGinty also serves as Assistant Secretary of other Fidelity funds (2008-present) and is an employee of FMR LLC (2004-present). Mr. McGinty also serves as Senior Vice President, Secretary, and Chief Legal Officer of FDC (2007-present). Before joining Fidelity Investments, Mr. McGinty practiced law at Ropes & Gray, LLP. |
R. Stephen Ganis (41) |
| Year of Election or Appointment: 2006 or 2007 Anti-Money Laundering (AML) officer of VIP FundsManager 20% Portfolio (2006), VIP FundsManager 50% Portfolio (2006), VIP FundsManager 60% Portfolio (2007), VIP FundsManager 70% Portfolio (2006), and VIP FundsManager 85% Portfolio (2006). Mr. Ganis also serves as AML officer of other Fidelity funds (2006-present) and FMR LLC (2003-present). Before joining Fidelity Investments, Mr. Ganis practiced law at Goodwin Procter, LLP (2000-2002). |
Joseph B. Hollis (59) |
| Year of Election or Appointment: 2006 or 2007 Chief Financial Officer of VIP FundsManager 20% Portfolio (2006), VIP FundsManager 50% Portfolio (2006), VIP FundsManager 60% Portfolio (2007), VIP FundsManager 70% Portfolio (2006), and VIP FundsManager 85% Portfolio (2006). Mr. Hollis also serves as Chief Financial Officer of other Fidelity funds. Mr. Hollis is President of Fidelity Pricing and Cash Management Services (FPCMS) (2005-present). Mr. Hollis also serves as President and Director of Fidelity Service Company, Inc. (2006-present). Previously, Mr. Hollis served as Senior Vice President of Cash Management Services (1999-2002) and Investment Management Operations (2002-2005). |
Kenneth A. Rathgeber (60) |
| Year of Election or Appointment: 2006 or 2007 Chief Compliance Officer of VIP FundsManager 20% Portfolio (2006), VIP FundsManager 50% Portfolio (2006), VIP FundsManager 60% Portfolio (2007), VIP FundsManager 70% Portfolio (2006), and VIP FundsManager 85% Portfolio (2006). Mr. Rathgeber also serves as Chief Compliance Officer of other Fidelity funds (2004-present) and Executive Vice President of Risk Oversight for Fidelity Investments (2002-present). He is Chief Compliance Officer of FMR (2005-present), FMR Co., Inc. (2005-present), Fidelity Management & Research (U.K.) Inc. (2005-present), Fidelity Research & Analysis Company (2005-present), Fidelity Investments Money Management, Inc. (2005-present), and Strategic Advisers, Inc. (2005-present). Previously, Mr. Rathgeber served as Executive Vice President and Chief Operating Officer for Fidelity Investments Institutional Services Company, Inc. (1998-2002). |
Bryan A. Mehrmann (46) |
| Year of Election or Appointment: 2006 or 2007 Deputy Treasurer of VIP FundsManager 20% Portfolio (2006), VIP FundsManager 50% Portfolio (2006), VIP FundsManager 60% Portfolio (2007), VIP FundsManager 70% Portfolio (2006), and VIP FundsManager 85% Portfolio (2006). Mr. Mehrmann also serves as Deputy Treasurer of other Fidelity funds (2005-present) and is an employee of FMR. Previously, Mr. Mehrmann served as Vice President of Fidelity Investments Institutional Services Group (FIIS)/Fidelity Investments Institutional Operations Corporation, Inc. (FIIOC) Client Services (1998-2004). |
Kenneth B. Robins (38) |
| Year of Election or Appointment: 2006 or 2007 Deputy Treasurer of VIP FundsManager 20% Portfolio (2006), VIP FundsManager 50% Portfolio (2006), VIP FundsManager 60% Portfolio (2007), VIP FundsManager 70% Portfolio (2006), and VIP FundsManager 85% Portfolio (2006). Mr. Robins also serves as Deputy Treasurer of other Fidelity funds (2005-present) and is an employee of FMR (2004-present). Before joining Fidelity Investments, Mr. Robins worked at KPMG LLP, where he was a partner in KPMG's department of professional practice (2002-2004) and a Senior Manager (1999-2000). In addition, Mr. Robins served as Assistant Chief Accountant, United States Securities and Exchange Commission (2000-2002). |
Robert G. Byrnes (41) |
| Year of Election or Appointment: 2006 or 2007 Assistant Treasurer of VIP FundsManager 20% Portfolio (2006), VIP FundsManager 50% Portfolio (2006), VIP FundsManager 60% Portfolio (2007), VIP FundsManager 70% Portfolio (2006), and VIP FundsManager 85% Portfolio (2006). Mr. Byrnes also serves as Assistant Treasurer of other Fidelity funds (2005-present) and is an employee of FMR (2005-present). Previously, Mr. Byrnes served as Vice President of FPCMS (2003-2005). Before joining Fidelity Investments, Mr. Byrnes worked at Deutsche Asset Management where he served as Vice President of the Investment Operations Group (2000-2003). |
Peter L. Lydecker (53) |
| Year of Election or Appointment: 2006 or 2007 Assistant Treasurer of VIP FundsManager 20% Portfolio (2006), VIP FundsManager 50% Portfolio (2006), VIP FundsManager 60% Portfolio (2007), VIP FundsManager 70% Portfolio (2006), and VIP FundsManager 85% Portfolio (2006). Mr. Lydecker also serves as Assistant Treasurer of other Fidelity funds (2004) and is an employee of FMR. |
Paul M. Murphy (60) |
| Year of Election or Appointment: 2007 Assistant Treasurer of VIP FundsManager 20% Portfolio, VIP FundsManager 50% Portfolio, VIP FundsManager 60% Portfolio, VIP FundsManager 70% Portfolio, and VIP FundsManager 85% Portfolio. Mr. Murphy also serves as Assistant Treasurer of other Fidelity funds (2007-present) and is an employee of FMR (2007-present). Previously, Mr. Murphy served as Chief Financial Officer of the Fidelity Funds (2005-2006), Vice President and Associate General Counsel of FMR (2007), and Senior Vice President of Fidelity Pricing and Cash Management Services Group (FPCMS) (1994-2007). |
Gary W. Ryan (49) |
| Year of Election or Appointment: 2006 or 2007 Assistant Treasurer of VIP FundsManager 20% Portfolio (2006), VIP FundsManager 50% Portfolio (2006), VIP FundsManager 60% Portfolio (2007), VIP FundsManager 70% Portfolio (2006), and VIP FundsManager 85% Portfolio (2006). Mr. Ryan also serves as Assistant Treasurer of other Fidelity funds (2005-present) and is an employee of FMR (2005-present). Previously, Mr. Ryan served as Vice President of Fund Reporting in FPCMS (1999-2005). |
** FMR Corp. merged with and into FMR LLC on October 1, 2007. Any references to FMR LLC for prior periods are deemed to be references to the prior entity.
Annual Report
Distributions
The Board of Trustees of each voted to pay to shareholders of record at the opening of business on record date, the following distributions per share derived from capital gains realized from sales of portfolio securities, and dividends derived from net investment income:
VIP Funds Manager 20% | Pay Date | Record Date | Dividends | Capital Gains |
Service Class | 02/08/08 | 02/08/08 | - | $0.035 |
Service Class 2 | 02/08/08 | 02/08/08 | - | $0.035 |
Investor Class | 02/08/08 | 02/08/08 | - | $0.035 |
VIP Funds Manager 50% | Pay Date | Record Date | Dividends | Capital Gains |
Service Class | 02/08/08 | 02/08/08 | - | $0.125 |
Service Class 2 | 02/08/08 | 02/08/08 | - | $0.125 |
Investor Class | 02/08/08 | 02/08/08 | - | $0.125 |
VIP Funds Manager 60% | Pay Date | Record Date | Dividends | Capital Gains |
Service Class | 02/08/08 | 02/08/08 | $0.003 | $0.075 |
Service Class 2 | 02/08/08 | 02/08/08 | $0.003 | $0.075 |
Investor Class | 02/08/08 | 02/08/08 | $0.003 | $0.075 |
VIP Funds Manager 70% | Pay Date | Record Date | Dividends | Capital Gains |
Service Class | 02/08/08 | 02/08/08 | - | $0.245 |
Service Class 2 | 02/08/08 | 02/08/08 | - | $0.245 |
Investor Class | 02/08/08 | 02/08/08 | - | $0.245 |
VIP Funds Manager 85% | Pay Date | Record Date | Dividends | Capital Gains |
Service Class | 02/08/08 | 02/08/08 | $0.005 | $0.29 |
Service Class 2 | 02/08/08 | 02/08/08 | $0.005 | $0.29 |
Investor Class | 02/08/08 | 02/08/08 | $0.005 | $0.29 |
The funds hereby designate as capital gain dividend the amounts noted below for the taxable year ended December 31, 2007, or, if subsequently determined to be different, the net capital gain of such year.
Fund |
|
VIP Funds Manager 20% | $667,174 |
VIP Funds Manager 50% | $6,658,664 |
VIP Funds Manager 60% | $1,423,319 |
VIP Funds Manager 70% | $13,241,384 |
VIP Funds Manager 85% | $6,206,568 |
A percentage of the dividends distributed during the fiscal year for the following funds qualifies for the dividends-received deduction for corporate shareholders:
Fund | February 2007 | December 2007 |
VIP Funds Manager 20% | | |
Service Class | 3% | 3% |
Service Class 2 | 3% | 3% |
Investor Class | 3% | 3% |
VIP Funds Manager 50% | | |
Service Class | | 9% |
Service Class 2 | | 9% |
Investor Class | | 9% |
Fund | February 2007 | December 2007 |
VIP Funds Manager 60% | | |
Service Class | | 26% |
Service Class 2 | | 27% |
Investor Class | | 26% |
VIP Funds Manager 70% | | |
Service Class | 2% | 12% |
Service Class 2 | 2% | 12% |
Investor Class | 2% | 12% |
VIP Funds Manager 85% | | |
Service Class | | 14% |
Service Class 2 | | 15% |
Investor Class | | 14% |
The fund will notify shareholders in January 2008 of amounts for use in preparing 2007 income tax returns.
Annual Report
Board Approval of Investment Advisory Contracts and Management Fees
VIP FundsManager 60% Portfolio
On May 17, 2007, the Board of Trustees, including the Independent Trustees (together, the Board), voted to approve the management contract and administration agreements (together, the Advisory Contracts) for the fund. The Board, assisted by the advice of fund counsel and Independent Trustees' counsel, considered a broad range of information.
In determining whether to approve the Advisory Contracts for the fund, the Board was aware that shareholders have a broad range of investment choices available to them, including a wide choice among mutual funds offered by competitors to Fidelity, and that shareholders, with the opportunity to review and weigh the disclosure provided by the fund in its prospectus and other public disclosures, may choose to invest in this fund, managed by Fidelity.
Nature, Extent, and Quality of Services Provided. The Board considered staffing within the investment adviser, Strategic Advisers, Inc. (Strategic) and the administrator, FMR, including the background of the fund's portfolio manager and the fund's investment objective and discipline.
Resources Dedicated to Investment Management and Support Services. The Board considered the size, education, and experience of Strategic's investment staff, their use of technology, and Strategic's and FMR's approach to recruiting, training, and retaining portfolio managers and other research, advisory, and management personnel. The Board noted that Fidelity's analysts have access to a variety of technological tools that enable them to perform both fundamental and quantitative analysis and to specialize in various disciplines.
Shareholder and Administrative Services. The Board considered the nature, quality, cost and extent of advisory, administrative, distribution, and shareholder services performed by Strategic and FMR and their affiliates under the Advisory Contracts and under separate agreements covering transfer agency, pricing and bookkeeping, and securities lending services for the fund. The Board also considered the nature and extent of Strategic's and FMR's supervision of third-party service providers, principally custodians and subcustodians.
The Board noted that the growth of fund assets across the complex allows Fidelity to reinvest in the development of services designed to enhance the value or convenience of the Fidelity funds as investment vehicles. These services include 24-hour access to account information and market information through phone representatives and over the Internet, and investor education materials and asset allocation tools.
Investment in a Large Fund Family. The Board considered the benefits to shareholders of investing in a Fidelity fund, including the benefits of investing in a fund that is part of a large family of funds offering a variety of investment disciplines and providing for a large variety of mutual fund investor services.
Investment Performance. VIP FundsManager 60% Portfolio is a new fund and therefore had no historical performance for the Board to review at the time it approved the fund's Advisory Contracts. Once the fund has been in operation for at least one calendar year, the Board will review the fund's absolute investment performance for each class, as well as the fund's relative investment performance for each class measured against (i) a proprietary custom index and (ii) a peer group of mutual funds deemed appropriate by the Board.
Based on its review, the Board concluded that the nature, extent, and quality of the services provided to the fund will benefit the fund's shareholders, particularly in light of the Board's view that the fund's shareholders benefit from investing in a fund that is part of a large family of funds offering a variety of investment disciplines and services.
Competitiveness of Management Fee and Total Fund Expenses. The Board considered the fund's proposed management fee and projected total operating expenses in reviewing the Advisory Contracts. The Board noted that the fund's proposed management fee rate would rank above the median of competitive insurance-dedicated funds that invest in affiliated mutual funds. The Board noted, however, that the proposed management fee would cover substantially all fund expenses other than transfer agency fees (which are paid by the underlying funds) and 12b-1 fees. The Board considered that the fund will be fully actively managed and invest in a mix of underlying Fidelity retail and VIP funds.
In its review of the fund's total expenses, the Board noted that the fund invests in retail underlying funds and classes and in Investor Class of the VIP underlying funds to avoid charging fund-paid 12b-1 fees at both fund levels. The Board considered that the fund does not pay transfer agency fees. Instead, each retail underlying fund or class and Investor Class of each VIP underlying fund bears its pro rata portion of the VIP transfer agency fee according to the percentage of the fund's assets invested in that underlying fund. The Board also considered that FMR has contractually agreed to reimburse 0.10% of class-level expenses for Service Class and Service Class 2 of the fund. Based on its review, the Board concluded that the fund's management fee and the total expenses for each class of the fund were fair and reasonable in light of the services that the fund and its shareholders receive and the other factors considered.
Based on its review, the Board concluded that the fund's management fee and the total expenses for each class of the fund were fair and reasonable in light of the services that the fund and its shareholders receive and the other factors considered.
Costs of the Services and Profitability. The fund is a new fund and therefore no revenue, cost, or profitability data was available for the Board to review in respect of the fund at the time it approved the Advisory Contracts. In connection with its future renewal of the fund's Advisory Contracts, the Board will consider the revenues earned and the expenses incurred by Fidelity in conducting the business of developing, marketing, distributing, managing, administering and servicing the fund and its shareholders.
VIP FundsManager Portfolio
Economies of Scale. The Board considered the extent to which the fund will benefit from economies of scale through increased services to the fund, through waivers or reimbursements, or through fee or expense reductions.
Based on its evaluation of all of the conclusions noted above, and after considering all material factors, the Board ultimately concluded that the advisory fee structures are fair and reasonable, and that the fund's Advisory Contracts should be approved.
VIP FundsManager Funds
Each year, typically in July, the Board of Trustees, including the Independent Trustees (together, the Board), votes on the renewal of the management contract and administration agreement (together, the Advisory Contracts) for each fund. The Board, assisted by the advice of fund counsel and Independent Trustees' counsel, requests and considers a broad range of information throughout the year.
The Board meets regularly each month except August and takes into account throughout the year matters bearing on Advisory Contracts. The Board, acting directly and through its separate committees, considers at each of its meetings factors that are relevant to the annual renewal of each fund's Advisory Contracts, including the services and support provided to each fund and its shareholders. At the time of the renewal, the Board had 12 standing committees, each composed of Independent Trustees with varying backgrounds, to which the Board has assigned specific subject matter responsibilities in order to enhance effective decision-making by the Board. Each committee has adopted a written charter outlining the structure and purposes of the committee. One such committee, the Equity Contract Committee, meets periodically as needed throughout the year to consider matters specifically related to the annual renewal of Advisory Contracts. The committee requests and receives information on, and makes recommendations to the Independent Trustees concerning, the approval and annual review of the Advisory Contracts.
At its July 2007 meeting, the Board of Trustees, including the Independent Trustees, unanimously determined to renew the Advisory Contracts for each fund. In reaching its determination, the Board considered all factors it believed relevant, including (i) the nature, extent, and quality of the services to be provided to each fund and its shareholders (including the investment performance of each fund); (ii) the competitiveness of the management fee and total expenses of each fund; (iii) the total costs of the services to be provided by and the profits to be realized by the investment adviser and its affiliates from the relationship with each fund; (iv) the extent to which economies of scale would be realized as each fund grows; and (v) whether fee levels reflect these economies of scale, if any, for the benefit of fund shareholders.
In determining whether to renew the Advisory Contracts for each fund, the Board ultimately reached a determination, with the assistance of fund counsel and Independent Trustees' counsel, that the renewal of the Advisory Contracts and the compensation to be received by Fidelity under the management contracts is consistent with Fidelity's fiduciary duty under applicable law. In addition to evaluating the specific factors noted above, the Board, in reaching its determination, is aware that shareholders in each fund have a broad range of investment choices available to them, including a wide choice among mutual funds offered by competitors to Fidelity, and that each fund's shareholders, with the opportunity to review and weigh the disclosure provided by the fund in its prospectus and other public disclosures, have chosen to invest in that fund, managed by Fidelity.
Nature, Extent, and Quality of Services Provided. The Board considered staffing within the investment adviser, Strategic Advisers, Inc. (Strategic Advisers), and the administrator, FMR, including the background of the funds' portfolio manager and the funds' investment objectives and disciplines. The Independent Trustees also had discussions with senior management of Fidelity's investment operations and investment groups. The Board considered the structure of the portfolio manager compensation program and whether this structure provides appropriate incentives.
Resources Dedicated to Investment Management and Support Services. The Board reviewed the size, education, and experience of Strategic Advisers' investment staff, their use of technology, and Strategic Advisers' and FMR's approach to recruiting, training, and retaining portfolio managers and other research, advisory, and management personnel. The Board noted that Fidelity's analysts have access to a variety of technological tools that enable them to perform both fundamental and quantitative analysis and to specialize in various disciplines.
Shareholder and Administrative Services. The Board considered (i) the nature, extent, quality, and cost of advisory, administrative, distribution, and shareholder services performed by FMR and its affiliates under the Advisory Contracts and under separate agreements covering transfer agency, pricing and bookkeeping, and securities lending services for each fund; (ii) the nature and extent of FMR's supervision of third party service providers, principally custodians and subcustodians; and (iii) the resources devoted to, and the record of compliance with, each fund's compliance policies and procedures.
The Board noted that the growth of fund assets across the complex allows Fidelity to reinvest in the development of services designed to enhance the value or convenience of the Fidelity funds as investment vehicles. These services include 24-hour access to account information and market information through phone representatives and over the Internet, and investor education materials and asset allocation tools.
Investment in a Large Fund Family. The Board considered the benefits to shareholders of investing in a Fidelity fund, including the benefits of investing in a fund that is part of a large family of funds offering a variety of investment disciplines and providing for a large variety of mutual fund investor services. The Board noted that, since July 2006, Fidelity has taken a number of actions that benefited particular funds, including (i) dedicating additional resources to investment research and to restructure the investment research teams; (ii) contractually agreeing to reduce the management fee on Fidelity Advisor Floating Rate High Income Fund; (iii) contractually agreeing to reduce the management fees on Fidelity's California, Massachusetts, New Jersey, and New York AMT Tax-Free Money Market Funds, launching new Institutional Classes and Service Classes of these funds, and contractually agreeing to impose expense limitations on these funds; (iv) eliminating the exchange fee on the Fidelity Select Portfolios and reducing the pricing and bookkeeping fee rates for these funds; (v) reducing the maximum transfer agency fee rates on high income funds and certain equity funds; (vi) proposing amended management contracts that, if approved by shareholders, will add a performance adjustment component to the management fees paid by 18 Fidelity Advisor equity funds; (vii) contractually agreeing to reduce fees for Ultra-Short Central Fund and the money market Central Funds; (viii) waiving the Fidelity Advisor funds' contingent deferred sales charge on certain redemptions made through systematic withdrawal programs; and (ix) amending the management contracts for equity and fixed-income funds whose management contracts incorporate a "group fee" structure by adding four new fee "breakpoints" to the group fee rate schedules.
Annual Report
Board Approval of Investment Advisory Contracts and Management Fees - continued
Investment Performance and Compliance. The Board considered whether each fund has operated within its investment objective, as well as its record of compliance with its investment restrictions. The Board noted that it is not possible to evaluate performance in any comprehensive fashion because each fund had been in operation for less than one calendar year. Once a fund has been in operation for at least one calendar year, the Board will review the fund's absolute investment performance for each class, as well as the fund's relative investment performance for each class measured against a proprietary custom index and, if a meaningful peer group exists, a peer group of mutual funds.
The Board considered that FMR has taken steps to refocus and strengthen equity research, equity portfolio management, and compliance.
Based on its review, and giving particular weight to the nature and quality of the resources dedicated by Strategic Advisers and FMR to maintain and improve relative performance, the Board concluded that the nature, extent, and quality of the services provided to each fund will benefit each fund's shareholders, particularly in light of the Board's view that each fund's shareholders benefit from investing in a fund that is part of a large family of funds offering a variety of investment disciplines and services.
Competitiveness of Management Fee and Total Fund Expenses. The Board considered each fund's management fee and total expenses compared to "mapped groups" of competitive funds and classes. Fidelity creates "mapped groups" by combining similar Lipper investment objective categories that have comparable management fee characteristics. Combining Lipper investment objective categories aids the Board's management fee and total expense comparisons by broadening the competitive group used for comparison and by reducing the number of universes to which various Fidelity funds are compared. The Board also considered supplemental information about how each fund's management fee and total expenses ranked relative to groups based on Lipper classifications, which take into account a fund's market capitalization and style.
The Board considered two proprietary management fee comparisons for the period of each fund's operations shown in the charts below. The group of Lipper funds used by the Board for management fee comparisons is referred to below as the "Total Mapped Group." The Total Mapped Group comparison focuses on a fund's standing relative to the total universe of comparable funds available to investors, in terms of gross management fees before expense reimbursements or caps. "TMG %" represents the percentage of funds in the Total Mapped Group that had management fees that were lower than a fund's. For example, a TMG % of 71% would mean that 29% of the funds in the Total Mapped Group had higher management fees than a fund. The "Asset-Size Peer Group" (ASPG) comparison focuses on a fund's standing relative to non-Fidelity funds similar in size to the fund within the Total Mapped Group. The ASPG represents at least 15% of the funds in the Total Mapped Group with comparable asset size and management fee characteristics, subject to a minimum of 50 funds (or all funds in the Total Mapped Group if fewer than 50). Additional information, such as the ASPG quartile in which a fund's management fee ranked, is also included in the charts and considered by the Board. For a more meaningful comparison of management fees, each fund is compared on the basis of a hypothetical "net management fee," which is derived by subtracting payments made by FMR (under the administration agreement) for non-management expenses (including pricing and bookkeeping fees and custody fees) from the fund's all-inclusive fee. In this regard, the Board realizes that net management fees can vary from year to year because of differences in non-management expenses, and that non-management expenses may exceed the fund's all-inclusive fee and result in a negative net management fee.
VIP FundsManager Portfolio
VIP FundsManager 20%
The Board noted that the fund's hypothetical net management fee ranked below the median of its Total Mapped Group and below the median of its ASPG for the period.
VIP FundsManager 50%
The Board noted that the fund's hypothetical net management fee ranked above the median of its Total Mapped Group and above the median of its ASPG for the period.
Annual Report
Board Approval of Investment Advisory Contracts and Management Fees - continued
VIP FundsManager 70%

The Board noted that the fund's hypothetical net management fee ranked above the median of its Total Mapped Group and above the median of its ASPG for the period.
VIP FundsManager 85%
The Board noted that the fund's hypothetical net management fee ranked below the median of its Total Mapped Group and below the median of its ASPG for the period.
Based on its review, the Board concluded that each fund's management fee was fair and reasonable in light of the services that the fund receives and the other factors considered.
In its review of the total expenses of each class of each fund, the Board considered the fund's hypothetical net management fee as well as the fund's all-inclusive fee. The Board also considered other expenses, such as pricing and bookkeeping fees and custodial, legal, and audit fees paid by FMR under the administration agreement. The Board also noted the effects of any waivers and reimbursements on fees and expenses. As part of its review, the Board also considered current and historical total expenses of each fund compared to competitive fund median expenses. Each fund is compared to those funds and classes in the Total Mapped Group (used by the Board for management fee comparisons) that have a similar sales load structure.
The Board noted that the total expenses of Investor Class and Service Class of each fund ranked below its competitive median for the period, and the total expenses of Service Class 2 of each fund ranked above its competitive median for the period. The Board noted that each fund offers multiple classes, each of which has a different 12b-1 fee structure, and that the multiple structures are intended to offer a range of pricing options for the intermediary market. The Board also noted that the total expenses of the classes of each fund vary primarily by the level of their 12b-1 fees.
VIP FundsManager Portfolio
In its review of total expenses, the Board also considered Fidelity fee structures and other information on clients that FMR and its affiliates service in other competitive markets, such as other mutual funds advised or subadvised by FMR or its affiliates, pension plan clients, and other institutional clients.
Based on its review, the Board concluded that the total expenses of each class of each fund were reasonable, although in one case above the median of the universe presented for comparison, in light of the services that the fund and its shareholders receive and the other factors considered.
Costs of the Services and Profitability. The Board considered the revenues earned and the expenses incurred by Fidelity in conducting the business of developing, marketing, distributing, managing, administering and servicing each fund and its shareholders. The Board also considered the level of Fidelity's profits in respect of all the Fidelity funds, as well as the profitability of each underlying fund.
On an annual basis, FMR presents to the Board Fidelity's profitability for each fund. Fidelity calculates the profitability for each fund, as well as aggregate profitability for groups of Fidelity funds and all Fidelity funds, using a series of detailed revenue and cost allocation methodologies which originate with the audited books and records of Fidelity. The Audit Committee of the Board reviews any significant changes from the prior year's methodologies.
PricewaterhouseCoopers LLP (PwC), independent registered public accounting firm and auditor to Fidelity and certain Fidelity funds, has been engaged annually by the Board as part of the Board's assessment of the results of Fidelity's profitability analysis. PwC's engagement includes the review and assessment of Fidelity's methodologies used in determining the revenues and expenses attributable to Fidelity's mutual fund business, and completion of agreed-upon procedures surrounding the mathematical accuracy of fund profitability and its conformity to allocation methodologies. After considering PwC's reports issued under the engagement and information provided by Fidelity, the Board believes that while other allocation methods may also be reasonable, Fidelity's profitability methodologies are reasonable in all material respects.
The Board has also reviewed Fidelity's non-fund businesses and any fall-out benefits related to the mutual fund business as well as cases where Fidelity's affiliates may benefit from or be related to the funds' business.
The Board considered the costs of the services provided by and the profits realized by Fidelity in connection with the operation of each fund and determined that the amount of profit is a fair entrepreneurial profit for the management of each fund.
Economies of Scale. The Board considered whether there have been economies of scale in respect of the management of the Fidelity funds, whether the Fidelity funds (including each fund) have appropriately benefited from any such economies of scale, and whether there is potential for realization of any further economies of scale. The Board considered the extent to which each fund will benefit from economies of scale through increased services to the fund, through waivers or reimbursements, or through fee or expense reductions. The Board concluded that any potential economies of scale are being shared between fund shareholders and Fidelity in an appropriate manner.
Additional Information Requested by the Board. In order to develop fully the factual basis for consideration of the Fidelity funds' Advisory Contracts, the Board requested and received additional information on several topics, including (i) fund performance trends and actions to be taken by FMR to improve certain funds' overall performance; (ii) Fidelity's portfolio manager compensation structure, including its effects on fund profitability and the extent to which portfolio manager compensation is linked to fund performance; (iii) Fidelity's fee structures; (iv) the funds' sub-advisory arrangements; and (v) accounts managed by Fidelity other than the Fidelity funds.
Based on its evaluation of all of the conclusions noted above, and after considering all material factors, the Board ultimately concluded that the advisory fee structures are fair and reasonable, and that each fund's Advisory Contracts should be renewed.
Annual Report
VIP FundsManager Portfolio
Annual Report
VIP FundsManager Portfolio
Annual Report
VIP FundsManager Portfolio
Annual Report
VIP FundsManager Portfolio
Investment Adviser
Strategic Advisers, Inc.
Boston, MA
General Distributor
Fidelity Distributors Corporation
Boston, MA
Transfer and Service Agents
Fidelity Investments Institutional Operations Company, Inc.
Boston, MA
Fidelity Service Company, Inc.
Boston, MA
Custodian
The Bank of New York
New York, NY
VIPFM-ANN-0208
1.843208.101
Fidelity® Variable Insurance Products:
Investment Grade Bond Portfolio
Annual Report
December 31, 2007
(2_fidelity_logos) (Registered_Trademark)
Contents
Performance | <Click Here> | How the fund has done over time. |
Management's Discussion | <Click Here> | The manager's review of fund performance, strategy and outlook. |
Shareholder Expense Example | <Click Here> | An example of shareholder expenses. |
Investment Changes | <Click Here> | A summary of major shifts in the fund's investments over the past six months. |
Investments | <Click Here> | A complete list of the fund's investments with their
market values. |
Financial Statements | <Click Here> | Statements of assets and liabilities, operations, and
changes in net assets, as well as financial highlights. |
Notes | <Click Here> | Notes to the financial statements. |
Report of Independent Registered Public Accounting Firm | <Click Here> | |
Trustees and Officers | <Click Here> | |
Distributions | <Click Here> | |
Fidelity VIP Investment Grade Central Fund Financial Statements | <Click Here> | Complete list of investments and financial statements for
Fidelity VIP Investment Grade Central Fund. |
To view a fund's proxy voting guidelines and proxy voting record for the 12-month period ended June 30, visit http://www.fidelity.com (search for "proxy voting guidelines") or visit the Securities and Exchange Commission's (SEC) web site at http://www.sec.gov. You may also call 1-877-208-0098 to request a free copy of the proxy voting guidelines.
Fidelity Variable Insurance Products are separate account options which are purchased through a variable insurance contract.
Standard & Poor's, S&P and S&P 500 are registered service marks of The McGraw-Hill Companies, Inc. and have been licensed for use by Fidelity Distributors Corporation.
Other third party marks appearing herein are the property of their respective owners.
All other marks appearing herein are registered or unregistered trademarks or service marks of FMR LLC or an affiliated company.
This report and the financial statements contained herein are submitted for the general information of the shareholders of the fund. This report is not authorized for distribution to prospective investors in the fund unless preceded or accompanied by an effective prospectus.
A fund files its complete schedule of portfolio holdings with the SEC for the first and third quarters of each fiscal year on Form N-Q. Forms N-Q are available on the SEC's web site at http://www.sec.gov. A fund's Forms N-Q may be reviewed and copied at the SEC's Public Reference Room in Washington, DC. Information regarding the operation of the SEC's Public Reference Room may be obtained by calling 1-800-SEC-0330. For a complete list of a fund's portfolio holdings, view the most recent holdings listing, semiannual report, or annual report on Fidelity's web site at http://www.fidelity.com or http://www.advisor.fidelity.com, as applicable.
NOT FDIC INSURED · MAY LOSE VALUE · NO BANK GUARANTEE
Neither the fund nor Fidelity Distributors Corporation is a bank.
Annual Report
Performance: The Bottom Line
Average annual total return reflects the change in the value of an investment, assuming reinvestment of the class' dividend income and capital gains (the profits earned upon the sale of securities that have grown in value, if any) and assuming a constant rate of performance each year. During periods of reimbursement by Fidelity, a fund's total return will be greater than it would be had the reimbursement not occurred. Performance numbers are net of all underlying fund operating expenses, but do not include any insurance charges imposed by your insurance company's separate account. If performance information included the effect of these additional charges, the total returns would have been lower. How a fund did yesterday is no guarantee of how it will do tomorrow.
Average Annual Total Returns
Periods ended December 31, 2007 | Past 1
year | Past 5
years | Past 10
years |
VIP Investment Grade Bond - Initial Class | 4.35% | 4.10% | 5.77% |
VIP Investment Grade Bond - Service Class A | 4.29% | 4.01% | 5.69% |
VIP Investment Grade Bond - Service Class 2 B | 4.17% | 3.86% | 5.55% |
VIP Investment Grade Bond - Investor Class C | 4.28% | 4.07% | 5.76% |
A The initial offering of Service Class shares took place on July 7, 2000. Performance for Service Class shares reflects an asset-based service fee (12b-1 fee), and returns prior to July 7, 2000 are those of Initial Class and do not include the effects of Service Class' 12b-1 fee. Had Service Class' 12b-1 fee been reflected, returns prior to July 7, 2000 would have been lower.
B The initial offering of Service Class 2 shares took place on January 12, 2000. Performance for Service Class 2 shares reflects an asset-based service fee (12b-1 fee), and returns prior to January 12, 2000 are those of Initial Class and do not include the effects of Service Class 2's 12b-1 fee. Had Service Class 2's 12b-1 fee been reflected, returns prior to January 12, 2000 would have been lower.
C The initial offering of Investor Class shares took place on July 21, 2005. Returns prior to July 21, 2005 are those of Initial Class. If Investor Class's transfer agent fee had been reflected, returns prior to July 21, 2005 would have been lower.
$10,000 Over 10 Years
Let's say hypothetically that $10,000 was invested in VIP Investment Grade Bond Portfolio - Initial Class on December 31, 1997. The chart shows how the value of your investment would have changed, and also shows how the Lehman Brothers® U.S. Aggregate Index performed over the same period.
Annual Report
Management's Discussion of Fund Performance
Comments from Ford O'Neil, Portfolio Manager of VIP Investment Grade Bond Portfolio
In 2007, the U.S. investment-grade bond market outperformed the domestic stock market, as measured by the Standard & Poor's 500SM Index, for the first time in five years. High-quality debt, as measured by the Lehman Brothers® U.S. Aggregate Index, climbed 6.97%, beating the 5.49% return of the S&P 500®. Bonds with the lowest levels of risk ended the year with the highest returns, benefiting from a massive flight to quality as investors sought safer havens given the turmoil in the credit markets and deteriorating economic conditions. Treasuries, which are government guaranteed, had the best showing within the Aggregate index, gaining 9.01% according to the Lehman Brothers U.S. Treasury Index. Treasuries were among the few securities in any asset class that didn't feel the pain of the subprime mortgage crisis, which gripped the financial markets for most of the second half of 2007. The asset-backed category - home to weak subprime debt - had the most disappointing performance, returning only 2.21% according to the Lehman Brothers U.S. Fixed-Rate Asset-Backed Securities Index.
During the past year, the fund's performance significantly lagged the Lehman Brothers U.S. Aggregate Index. (For specific portfolio performance results, please refer to the performance section of this report.) To review my strategy, virtually all of the fund's assets were invested in VIP Investment Grade Central Fund, which I also manage and which included a large holding in Fidelity® Ultra-Short Central Fund, a diversified pool of short-term assets. The remainder was invested in individual securities, short-term repurchase agreements and Fidelity Specialized High Income Central Fund. My discussion of the fund's performance reflects its holdings in aggregate, including the underlying central funds and other investments I just mentioned. The main factor behind the fund's weak showing was its exposure - mainly through Ultra-Short Central - to asset-backed securities backed by subprime mortgages, which suffered steep losses amid weakening housing fundamentals and deteriorating market technical factors. Given its heightened level of volatility, I cut back VIP Investment Grade Central's exposure to Ultra-Short Central by year end. As difficult conditions within the mortgage market extended broadly to other segments of the fixed-income market, our sector selection also worked against us. In particular, our decisions to invest outside the benchmark in collateralized mortgage obligations and to modestly overweight commercial mortgage-backed securities, investment-grade corporate bonds, high-yield corporate bonds and other asset-backed securities dampened our absolute and relative returns because they lagged the index. In the Treasury sector, we made some good decisions. Specifically, our out-of-benchmark position in Treasury Inflation-Protected Securities (TIPS) helped. TIPS fared especially well amid a global flight to safety, rising inflation worries and a realized increase in the inflation rate. A significant underweighting in mortgage pass-through securities further boosted relative performance, as did yield-curve positioning. In particular, the fund benefited from concentrating investments in bonds with intermediate-range maturities, which performed well, and underweighting longer-term bonds, which lagged.
The views expressed above reflect those of the portfolio manager(s) only through the end of the period as stated on the cover of this report and do not necessarily represent the views of Fidelity or any other person in the Fidelity organization. Any such views are subject to change at any time based upon market or other conditions and Fidelity disclaims any responsibility to update such views. These views may not be relied on as investment advice and, because investment decisions for a Fidelity fund are based on numerous factors, may not be relied on as an indication of trading intent on behalf of any Fidelity fund.
Annual Report
Shareholder Expense Example
The Fund invests in Fidelity Central Funds, which are open-end investment companies with similar objectives to those of the Fund, available only to other mutual funds and accounts managed by Fidelity Management & Research Company, (FMR) and its affiliates. In addition to the direct expenses incurred by the Fund presented in the table, as a shareholder of the underlying Fidelity Central Funds, the Fund also indirectly bears its proportionate share of the expenses of the underlying Fidelity Central Funds. These expenses are not included in the Fund's annualized expense ratio used to calculate either the actual or hypothetical expense estimates presented in the table but are summarized in a footnote to the table.
As a shareholder of the Fund, you incur two types of costs: (1) transaction costs, and (2) ongoing costs, including management fees, distribution and/or service (12b-1) fees and other Fund expenses. This Example is intended to help you understand your ongoing costs (in dollars) of investing in the Fund and to compare these costs with the ongoing costs of investing in other mutual funds.
The Example is based on an investment of $1,000 invested at the beginning of the period and held for the entire period (July 1, 2007 to December 31, 2007).
Actual Expenses
The first line of the accompanying table for each class of the Fund provides information about actual account values and actual expenses. You may use the information in this line, together with the amount you invested, to estimate the expenses that you paid over the period. Simply divide your account value by $1,000.00 (for example, an $8,600 account value divided by $1,000.00 = 8.6), then multiply the result by the number in the first line for a class of the Fund under the heading entitled "Expenses Paid During Period" to estimate the expenses you paid on your account during this period. The estimate of expenses does not include any fees or other expenses of any variable annuity or variable life insurance product. If they were, the estimate of expenses you paid during the period would be higher, and your ending account value would be lower.
Hypothetical Example for Comparison Purposes
The second line of the accompanying table for each class of the Fund provides information about hypothetical account values and hypothetical expenses based on a Class' actual expense ratio and an assumed rate of return of 5% per year before expenses, which is not the Class' actual return. The hypothetical account values and expenses may not be used to estimate the actual ending account balance or expenses you paid for the period. You may use this information to compare the ongoing costs of investing in the Fund and other funds. To do so, compare this 5% hypothetical example with the 5% hypothetical examples that appear in the shareholder reports of the other funds. The estimate of expenses does not include any fees or other expenses of any variable annuity or variable life insurance product. If they were, the estimate of expenses you paid during the period would be higher, and your ending account value would be lower.
Please note that the expenses shown in the table are meant to highlight your ongoing costs only and do not reflect any transaction costs. Therefore, the second line of the table is useful in comparing ongoing costs only, and will not help you determine the relative total costs of owning different funds.
| Beginning
Account Value
July 1, 2007 | Ending
Account Value
December 31, 2007 | Expenses Paid
During Period*
July 1, 2007
to December 31, 2007 |
Initial Class | | | |
Actual | $ 1,000.00 | $ 1,037.40 | $ 2.16 |
HypotheticalA | $ 1,000.00 | $ 1,023.09 | $ 2.14 |
Service Class | | | |
Actual | $ 1,000.00 | $ 1,037.60 | $ 2.67 |
HypotheticalA | $ 1,000.00 | $ 1,022.58 | $ 2.65 |
Service Class 2 | | | |
Actual | $ 1,000.00 | $ 1,037.20 | $ 3.44 |
HypotheticalA | $ 1,000.00 | $ 1,021.83 | $ 3.41 |
Investor Class | | | |
Actual | $ 1,000.00 | $ 1,037.50 | $ 2.36 |
HypotheticalA | $ 1,000.00 | $ 1,022.89 | $ 2.35 |
A 5% return per year before expenses
* Expenses are equal to each Class' annualized expense ratio (shown in the table below); multiplied by the average account value over the period, multiplied by 184/365 (to reflect the one-half year period). The fees and expenses of the underlying Fidelity Central Funds in which the Fund invests are not included in the Fund's annualized expense ratio.
| Annualized
Expense Ratio |
Initial Class | .42% |
Service Class | .52% |
Service Class 2 | .67% |
Investor Class | .46% |
In addition to the expenses noted above, the Fund also indirectly bears its proportionate share of the expenses of the underlying Fidelity Central Funds. Annualized expenses of Fidelity VIP Investment Grade Central Fund and Fidelity Specialized High Income Central Fund as of their most recent fiscal half-year were less than .01%.
Annual Report
Investment Changes
The information in the following tables is based on the combined investments of the Fund and its pro-rata share of the investments of Fidelity VIP Investment Grade Central Fund and Fidelity Specialized High Income Central Fund.
Quality Diversification (% of fund's net assets) |
As of December 31, 2007 | As of June 30, 2007 |
 | U.S. Government
and U.S. Government
Agency Obligations 60.2% | | | U.S. Government
and U.S. Government
Agency Obligations 58.1% | |
 | AAA 13.8% | | | AAA 16.4% | |
 | AA 4.4% | | | AA 6.1% | |
 | A 7.1% | |  | A 5.8% | |
 | BBB 15.2% | | | BBB 17.1% | |
 | BB and Below 2.5% | | | BB and Below 3.3% | |
 | Not Rated 0.2% | | | Not Rated 0.7% | |
 | Short-Term
Investments and
Net Other Assets*** (3.4)% | | | Short-Term
Investments and
Net Other Assets*** (7.5)% | |

We have used ratings from Moody's® Investors Services, Inc. Where Moody's ratings are not available, we have used S&P® ratings. All ratings are as of the report date and do not reflect subsequent downgrades. |
Weighted Average Maturity as of December 31, 2007 |
| | 6 months ago |
Years | 6.0 | 5.6 |
The weighted average maturity is based on the dollar-weighted average length of time until principal payments are expected or until securities reach maturity, taking into account any maturity shortening feature such as a call, refunding or redemption provision. |
Duration as of December 31, 2007 |
| | 6 months ago |
Years | 4.4 | 4.5 |
Duration shows how much a bond fund's price fluctuates with changes in comparable interest rates. If rates rise 1%, for example, a fund with a five-year duration is likely to lose about 5% of its value. Other factors also can influence a bond fund's performance and share price. Accordingly, a bond fund's actual performance may differ from this example. |
Asset Allocation (% of fund's net assets) |
As of December 31, 2007 * | As of June 30, 2007 ** |
| Corporate Bonds 22.9% | | | Corporate Bonds 23.6% | |
| U.S. Government
and U.S. Government
Agency Obligations 60.2% | | | U.S. Government
and U.S. Government
Agency Obligations 58.1% | |
| Asset-Backed Securities 7.2% | | | Asset-Backed Securities 11.3% | |
| CMOs and
Other Mortgage
Related Securities 12.9% | | | CMOs and
Other Mortgage
Related Securities 14.3% | |
| Other Investments 0.2% | | | Other Investments 0.2% | |
| Short-Term
Investments and
Net Other Assets*** (3.4)% | | | Short-Term
Investments and
Net Other Assets*** (7.5)% | |
* Foreign investments | 6.6% | | ** Foreign investments | 6.9% | |
* Futures and Swaps | 13.0% | | ** Futures and Swaps | 15.3% | |

*** Short-Term Investments and Net Other Assets are not included in the pie chart.
A holdings listing for the Fund, which presents direct holdings as well as the pro rata share of any securities and other investments held indirectly through its investment in underlying non-money market Fidelity Central Funds is available at advisor.fidelity.com. Fidelity VIP Investment Grade Central Fund's holdings and financial statements are included at the end of this report.
Annual Report
Investments December 31, 2007
Showing Percentage of Net Assets
Fixed-Income Central Funds - 98.8% |
| | Shares | | Value |
INVESTMENT GRADE FIXED-INCOME FUNDS - 97.4% |
Fidelity VIP Investment Grade Central Fund (d) | | 24,562,994 | | $ 2,517,706,878 |
HIGH YIELD FIXED-INCOME FUNDS - 1.4% |
Fidelity Specialized High Income Central Fund (c) | | 367,424 | | 35,871,563 |
TOTAL FIXED-INCOME FUNDS (Cost $2,570,678,657) | | 2,553,578,441 |
Nonconvertible Bonds - 0.1% |
| Principal Amount | | |
UTILITIES - 0.1% |
Multi-Utilities - 0.1% |
CMS Energy Corp. 6.55% 7/17/17 (Cost $2,388,864) | | $ 2,425,000 | | 2,377,230 |
Asset-Backed Securities - 0.2% |
|
Advanta Business Card Master Trust Series 2007-D1 Class D, 5.406% 1/22/13 (a)(b) | | 1,800,000 | | 1,731,616 |
AmeriCredit Prime Automobile Receivables Trust Series 2007-1 Class E, 6.96% 3/31/16 (a) | | 1,045,000 | | 951,305 |
Ford Credit Auto Owner Trust: | | | | |
Series 2006-C Class D, 6.89% 5/15/13 (a) | | 725,000 | | 719,837 |
Series 2007-A Class D, 7.05% 12/15/13 (a) | | 425,000 | | 406,024 |
GS Auto Loan Trust Series 2006-1 Class D, 6.25% 1/15/14 (a) | | 1,151,488 | | 1,107,294 |
Wachovia Auto Loan Trust Series 2006-2A Class E, 7.05% 5/20/14 (a) | | 1,175,000 | | 1,044,047 |
WaMu Asset-Backed Certificates Series 2006-HE5 Class B1, 7.365% 10/25/36 (a)(b) | | 1,025,000 | | 124,090 |
TOTAL ASSET-BACKED SECURITIES (Cost $7,181,124) | 6,084,213 |
Collateralized Mortgage Obligations - 0.1% |
|
Private Sponsor - 0.0% |
Nomura Home Equity Loan Trust floater Series 2006-FM2 Class B1, 7.165% 7/25/36 (a)(b) | | 3,535,000 | | 290,586 |
Structured Asset Securities Corp. floater Series 2006-BC5 Class B, 7.365% 12/25/36 (a)(b) | | 810,000 | | 91,117 |
TOTAL PRIVATE SPONSOR | | 381,703 |
|
| Principal Amount | | Value |
U.S. Government Agency - 0.1% |
Fannie Mae subordinate REMIC pass-thru certificates planned amortization class Series 2003-128 Class NE, 4% 12/25/16 | | $ 3,576,143 | | $ 3,513,632 |
TOTAL COLLATERALIZED MORTGAGE OBLIGATIONS (Cost $7,252,707) | 3,895,335 |
Cash Equivalents - 0.8% |
| Maturity Amount | | |
Investments in repurchase agreements in a joint trading account at 4.71%, dated 12/31/07 due 1/2/08 (Collateralized by U.S. Government Obligations) #
(Cost $20,311,000) | $ 20,316,309 | | 20,311,000 |
TOTAL INVESTMENT
PORTFOLIO - 100.0% (Cost $2,607,812,352) | 2,586,246,219 |
NET OTHER ASSETS - 0.0% | | (1,101,108) |
NET ASSETS - 100% | $ 2,585,145,111 |
Swap Agreements |
| Expiration Date | | Notional Amount | | |
Credit Default Swaps |
Receive quarterly notional amount multiplied by .72% and pay Bank of America upon credit event of Allegheny Energy Supply Co. LLC, par value of the notional amount of Allegheny Energy Supply Co. LLC 8.25% 4/15/12 | June 2012 | | $ 1,900,000 | | $ (36,289) |
Receive quarterly notional amount multiplied by .78% and pay Deutsche Bank upon credit event of Allegheny Energy Supply Co. LLC, par value of the notional amount of Allegheny Energy Supply Co. LLC 8.25% 4/15/12 | June 2012 | | 1,865,000 | | (31,087) |
| | $ 3,765,000 | | $ (67,376) |
Legend |
(a) Security exempt from registration under Rule 144A of the Securities Act of 1933. These securities may be resold in transactions exempt from registration, normally to qualified institutional buyers. At the end of the period, the value of these securities amounted to $ 6,465,916 or 0.3% of net assets. |
(b) The coupon rate shown on floating or adjustable rate securities represents the rate at period end. |
(c) Affiliated fund that is available only to investment companies and other accounts managed by Fidelity Investments. A complete schedule of portfolio holdings for each Fidelity Central Fund is filed with the SEC for the first and third quarters of each fiscal year on Form N-Q and is available upon request or at the SEC's web site at www.sec.gov. A holdings listing for the Fund, which presents direct holdings as well as the pro rata share of securities and other investments held indirectly through its investment in underlying non-money market Fidelity Central Funds, is available at advisor.fidelity.com. In addition, each Fidelity Central Fund's financial statements, which are not covered by the Fund's Report of Independent Registered Public Accounting Firm, are available on the SEC's web site or upon request. |
(d) Affiliated fund that is available only to investment companies and other accounts managed by Fidelity Investments. Fidelity VIP Investment Grade Central Fund's investment and financial statements are included at the end of this report as an attachment. |
# Additional Information on each counterparty to the repurchase agreement is as follows: |
Repurchase Agreement / Counterparty | Value |
$20,311,000 due 1/02/08 at 4.71% |
Banc of America Securities LLC | $ 9,212,758 |
Bank of America, NA | 3,799,015 |
Barclays Capital, Inc. | 6,331,691 |
ING Financial Markets LLC | 777,585 |
WestLB AG | 189,951 |
| $ 20,311,000 |
Affiliated Central Funds |
Information regarding fiscal year to date income earned by the Fund from investments in Fidelity Central Funds is as follows: |
Fund | Income earned |
Fidelity Specialized High Income Central Fund | $ 1,841,578 |
Fidelity VIP Investment Grade Central Fund | 115,012,379 |
Total | $ 116,853,957 |
|
Additional information regarding the Fund's fiscal year to date purchases and sales, including the ownership percentage, of the non Money Market Central Funds is as follows: |
Fund | Value,
beginning of period | Purchases | Sales Proceeds | Value,
end of period | % ownership,
end of period |
Fidelity Specialized High Income Central Fund | $ 20,241,104 | $ 16,130,418 | $ - | $ 35,871,563 | 9.9% |
Fidelity VIP Investment Grade Central Fund | 1,824,890,441 | 728,867,899 | 30,123,642 | 2,517,706,878 | 70.2% |
Total | $ 1,845,131,545 | $ 744,998,317 | $ 30,123,642 | $ 2,553,578,441 | |
Income Tax Information |
At December 31, 2007, the fund had a capital loss carryforward of approximately $7,863,643 all of which will expire on December 31, 2014. |
See accompanying notes which are an integral part of the financial statements.
Annual Report
Financial Statements
Statement of Assets and Liabilities
| December 31, 2007 |
| | |
Assets | | |
Investment in securities, at value (including repurchase agreements of $20,311,000) -
See accompanying schedule: Unaffiliated issuers
(cost $37,133,695) | $ 32,667,778 | |
Fidelity Central Funds
(cost $2,570,678,657) | 2,553,578,441 | |
Total Investments
(cost $2,607,812,352) | | $ 2,586,246,219 |
Cash | | 834 |
Receivable for fund shares sold | | 2,374,709 |
Interest receivable | | 111,636 |
Distributions receivable from Fidelity Central Funds | | 13,205,570 |
Prepaid expenses | | 7,602 |
Other affiliated receivables | | 2,264 |
Total assets | | 2,601,948,834 |
| | |
Liabilities | | |
Payable for investments purchased | $ 13,219,344 | |
Payable for fund shares redeemed | 2,314,465 | |
Swap agreements, at value | 67,376 | |
Accrued management fee | 669,873 | |
Distribution fees payable | 219,823 | |
Other affiliated payables | 216,656 | |
Other payables and accrued
expenses | 96,186 | |
Total liabilities | | 16,803,723 |
| | |
Net Assets | | $ 2,585,145,111 |
Net Assets consist of: | | |
Paid in capital | | $ 2,506,906,646 |
Undistributed net investment income | | 106,317,579 |
Accumulated undistributed net realized gain (loss) on investments | | (6,445,605) |
Net unrealized appreciation (depreciation) on investments | | (21,633,509) |
Net Assets | | $ 2,585,145,111 |
Statement of Assets and Liabilities - continued
| December 31, 2007 |
| | |
Initial Class:
Net Asset Value, offering price and redemption price per share ($1,134,914,670 ÷ 88,908,946 shares) | | $ 12.76 |
| | |
Service Class:
Net Asset Value, offering price and redemption price per share ($147,990,096 ÷ 11,674,327 shares) | | $ 12.68 |
| | |
Service Class 2:
Net Asset Value, offering price and redemption price per share ($1,018,017,166 ÷ 81,148,836 shares) | | $ 12.55 |
| | |
Investor Class:
Net Asset Value, offering price and redemption price per share ($284,223,179 ÷ 22,318,807 shares) | | $ 12.73 |
See accompanying notes which are an integral part of the financial statements.
Annual Report
Financial Statements - continued
Statement of Operations
| Year ended December 31, 2007 |
| | |
Investment Income | | |
Interest | | $ 2,439,559 |
Income from Fidelity Central Funds | | 116,853,957 |
Total income | | 119,293,516 |
| | |
Expenses | | |
Management fee | $ 7,095,973 | |
Transfer agent fees | 1,612,765 | |
Distribution fees | 1,953,201 | |
Accounting fees and expenses | 732,874 | |
Custodian fees and expenses | 1,353 | |
Independent trustees' compensation | 7,626 | |
Audit | 54,791 | |
Legal | 12,933 | |
Interest | 3,957 | |
Miscellaneous | 185,558 | |
Total expenses before reductions | 11,661,031 | |
Expense reductions | (1,065) | 11,659,966 |
Net investment income | | 107,633,550 |
Realized and Unrealized Gain (Loss) Net realized gain (loss) on: | | |
Investment securities: | | |
Unaffiliated issuers | (27,855) | |
Fidelity Central Funds | (3,006) | |
Swap agreements | 16,281 | |
Capital gain distributions from Fidelity Central Funds | 1,401,757 | |
Total net realized gain (loss) | | 1,387,177 |
Change in net unrealized appreciation (depreciation) on: Investment securities | (10,863,303) | |
Swap agreements | (67,376) | |
Total change in net unrealized appreciation (depreciation) | | (10,930,679) |
Net gain (loss) | | (9,543,502) |
Net increase (decrease) in net assets resulting from operations | | $ 98,090,048 |
Statement of Changes in Net Assets
| Year ended
December 31,
2007 | Year ended
December 31,
2006 |
Increase (Decrease) in Net Assets | | |
Operations | | |
Net investment income | $ 107,633,550 | $ 83,673,466 |
Net realized gain (loss) | 1,387,177 | (4,151,411) |
Change in net unrealized appreciation (depreciation) | (10,930,679) | (2,243,592) |
Net increase (decrease) in net assets resulting from operations | 98,090,048 | 77,278,463 |
Distributions to shareholders from net investment income | (82,169,011) | (66,380,131) |
Distributions to shareholders from net realized gain | - | (4,008,845) |
Total distributions | (82,169,011) | (70,388,976) |
Share transactions - net increase (decrease) | 618,689,233 | 251,368,493 |
Total increase (decrease) in net assets | 634,610,270 | 258,257,980 |
| | |
Net Assets | | |
Beginning of period | 1,950,534,841 | 1,692,276,861 |
End of period (including undistributed net investment income of $106,317,579 and undistributed net investment income of $80,623,359, respectively) | $ 2,585,145,111 | $ 1,950,534,841 |
See accompanying notes which are an integral part of the financial statements.
Annual Report
Financial Highlights - Initial Class
Years ended December 31, | 2007 | 2006 | 2005 | 2004 | 2003 |
Selected Per-Share Data | | | | | |
Net asset value, beginning of period | $ 12.76 | $ 12.76 | $ 13.25 | $ 13.65 | $ 13.70 |
Income from Investment Operations | | | | | |
Net investment income C | .610 | .591 | .523 | .476 | .467 |
Net realized and unrealized gain (loss) | (.076) | (.060) | (.243) | .104 | .213 |
Total from investment operations | .534 | .531 | .280 | .580 | .680 |
Distributions from net investment income | (.534) | (.501) | (.480) | (.570) | (.540) |
Distributions from net realized gain | - | (.030) | (.290) | (.410) | (.190) |
Total distributions | (.534) | (.531) | (.770) | (.980) | (.730) |
Net asset value, end of period | $ 12.76 | $ 12.76 | $ 12.76 | $ 13.25 | $ 13.65 |
Total Return A, B | 4.35% | 4.35% | 2.19% | 4.46% | 5.20% |
Ratios to Average Net Assets D, F | | | | | |
Expenses before reductions | .43% | .44% | .49% | .56% | .54% |
Expenses net of fee waivers, if any | .43% | .44% | .49% | .56% | .54% |
Expenses net of all reductions | .43% | .44% | .49% | .56% | .54% |
Net investment income | 4.88% | 4.75% | 4.12% | 3.65% | 3.48% |
Supplemental Data | | | | | |
Net assets, end of period (000 omitted) | $ 1,134,915 | $ 1,184,942 | $ 1,284,600 | $ 1,374,972 | $ 1,528,417 |
Portfolio turnover rate E | 2% | 34% | 157% | 170% | 218% |
A Total returns do not reflect charges attributable to your insurance company's separate account. Inclusion of these charges would reduce the total returns shown.
B Total returns would have been lower had certain expenses not been reduced during the periods shown.
C Calculated based on average shares outstanding during the period.
D Fees and expenses of the underlying Fidelity Central Funds are not included in the Fund's expense ratio. The Fund indirectly bears its proportionate share of the expenses of any underlying Fidelity Central Funds.
E Amount does not include the portfolio activity of any underlying Fidelity Central Funds.
F Expense ratios reflect operating expenses of the class. Expenses before reductions do not reflect amounts reimbursed by the investment adviser or expense offset arrangements and do not represent the amount paid by the class during periods when reimbursements or reductions occur. Expenses net of fee waivers reflect expenses after reimbursement by the investment adviser but prior to reductions from expense offset arrangements. Expenses net of all reductions represent the net expenses paid by the class. Fees and expenses of the underlying Fidelity Central Funds are not included in the Fund's expense ratio. The Fund indirectly bears its proportionate share of the expenses of any Fidelity Central Funds. Based on their most recent shareholder report date, the annualized expenses for Fidelity VIP Investment Grade Central Fund and Fidelity Specialized High Income Central Fund were less than .01%.
Financial Highlights - Service Class
Years ended December 31, | 2007 | 2006 | 2005 | 2004 | 2003 |
Selected Per-Share Data | | | | | |
Net asset value, beginning of period | $ 12.68 | $ 12.68 | $ 13.18 | $ 13.61 | $ 13.66 |
Income from Investment Operations | | | | | |
Net investment income C | .593 | .575 | .511 | .456 | .448 |
Net realized and unrealized gain (loss) | (.069) | (.053) | (.246) | .104 | .212 |
Total from investment operations | .524 | .522 | .265 | .560 | .660 |
Distributions from net investment income | (.524) | (.492) | (.475) | (.580) | (.520) |
Distributions from net realized gain | - | (.030) | (.290) | (.410) | (.190) |
Total distributions | (.524) | (.522) | (.765) | (.990) | (.710) |
Net asset value, end of period | $ 12.68 | $ 12.68 | $ 12.68 | $ 13.18 | $ 13.61 |
Total Return A, B | 4.29% | 4.30% | 2.08% | 4.32% | 5.06% |
Ratios to Average Net Assets D, F | | | | | |
Expenses before reductions | .53% | .54% | .58% | .66% | .64% |
Expenses net of fee waivers, if any | .53% | .54% | .58% | .66% | .64% |
Expenses net of all reductions | .53% | .54% | .58% | .66% | .64% |
Net investment income | 4.78% | 4.65% | 4.06% | 3.54% | 3.38% |
Supplemental Data | | | | | |
Net assets, end of period (000 omitted) | $ 147,990 | $ 99,633 | $ 79,205 | $ 50,143 | $ 18,305 |
Portfolio turnover rate E | 2% | 34% | 157% | 170% | 218% |
A Total returns do not reflect charges attributable to your insurance company's separate account. Inclusion of these charges would reduce the total returns shown.
B Total returns would have been lower had certain expenses not been reduced during the periods shown.
C Calculated based on average shares outstanding during the period.
D Fees and expenses of the underlying Fidelity Central Funds are not included in the Fund's expense ratio. The Fund indirectly bears its proportionate share of the expenses of any underlying Fidelity Central Funds.
E Amount does not include the portfolio activity of any underlying Fidelity Central Funds.
F Expense ratios reflect operating expenses of the class. Expenses before reductions do not reflect amounts reimbursed by the investment adviser or expense offset arrangements and do not represent the amount paid by the class during periods when reimbursements or reductions occur. Expenses net of fee waivers reflect expenses after reimbursement by the investment adviser but prior to reductions from expense offset arrangements. Expenses net of all reductions represent the net expenses paid by the class. Fees and expenses of the underlying Fidelity Central Funds are not included in the Fund's expense ratio. The Fund indirectly bears its proportionate share of the expenses of any Fidelity Central Funds. Based on their most recent shareholder report date, the annualized expenses for Fidelity VIP Investment Grade Central Fund and Fidelity Specialized High Income Central Fund were less than .01%.
See accompanying notes which are an integral part of the financial statements.
Annual Report
Financial Highlights - Service Class 2
Years ended December 31, | 2007 | 2006 | 2005 | 2004 | 2003 |
Selected Per-Share Data | | | | | |
Net asset value, beginning of period | $ 12.56 | $ 12.57 | $ 13.08 | $ 13.50 | $ 13.57 |
Income from Investment Operations | | | | | |
Net investment income C | .568 | .551 | .488 | .435 | .427 |
Net realized and unrealized gain (loss) | (.064) | (.053) | (.248) | .105 | .213 |
Total from investment operations | .504 | .498 | .240 | .540 | .640 |
Distributions from net investment income | (.514) | (.478) | (.460) | (.550) | (.520) |
Distributions from net realized gain | - | (.030) | (.290) | (.410) | (.190) |
Total distributions | (.514) | (.508) | (.750) | (.960) | (.710) |
Net asset value, end of period | $ 12.55 | $ 12.56 | $ 12.57 | $ 13.08 | $ 13.50 |
Total Return A, B | 4.17% | 4.14% | 1.89% | 4.19% | 4.94% |
Ratios to Average Net Assets D, F | | | | | |
Expenses before reductions | .68% | .69% | .73% | .81% | .79% |
Expenses net of fee waivers, if any | .68% | .69% | .73% | .81% | .79% |
Expenses net of all reductions | .68% | .69% | .73% | .81% | .79% |
Net investment income | 4.63% | 4.50% | 3.90% | 3.39% | 3.23% |
Supplemental Data | | | | | |
Net assets, end of period (000 omitted) | $ 1,018,017 | $ 497,504 | $ 285,528 | $ 186,302 | $ 115,411 |
Portfolio turnover rate E | 2% | 34% | 157% | 170% | 218% |
A Total returns do not reflect charges attributable to your insurance company's separate account. Inclusion of these charges would reduce the total returns shown.
B Total returns would have been lower had certain expenses not been reduced during the periods shown.
C Calculated based on average shares outstanding during the period.
D Fees and expenses of the underlying Fidelity Central Funds are not included in the Fund's expense ratio. The Fund indirectly bears its proportionate share of the expenses of any underlying Fidelity Central Funds.
E Amount does not include the portfolio activity of any underlying Fidelity Central Funds.
F Expense ratios reflect operating expenses of the class. Expenses before reductions do not reflect amounts reimbursed by the investment adviser or expense offset arrangements and do not represent the amount paid by the class during periods when reimbursements or reductions occur. Expenses net of fee waivers reflect expenses after reimbursement by the investment adviser but prior to reductions from expense offset arrangements. Expenses net of all reductions represent the net expenses paid by the class. Fees and expenses of the underlying Fidelity Central Funds are not included in the Fund's expense ratio. The Fund indirectly bears its proportionate share of the expenses of any Fidelity Central Funds. Based on their most recent shareholder report date, the annualized expenses for Fidelity VIP Investment Grade Central Fund and Fidelity Specialized High Income Central Fund were less than .01%.
Financial Highlights - Investor Class
Years ended December 31, | 2007 | 2006 | 2005 H |
Selected Per-Share Data | | | |
Net asset value, beginning of period | $ 12.74 | $ 12.75 | $ 12.65 |
Income from Investment Operations | | | |
Net investment income E | .603 | .583 | .242 |
Net realized and unrealized gain (loss) | (.079) | (.055) | (.142) |
Total from investment operations | .524 | .528 | .100 |
Distributions from net investment income | (.534) | (.508) | - |
Distributions from net realized gain | - | (.030) | - |
Total distributions | (.534) | (.538) | - |
Net asset value, end of period | $ 12.73 | $ 12.74 | $ 12.75 |
Total Return B, C, D | 4.28% | 4.33% | .79% |
Ratios to Average Net Assets F, I | | | |
Expenses before reductions | .46% | .48% | .49% A |
Expenses net of fee waivers, if any | .46% | .48% | .49% A |
Expenses net of all reductions | .46% | .48% | .49% A |
Net investment income | 4.84% | 4.72% | 4.40% A |
Supplemental Data | | | |
Net assets, end of period (000 omitted) | $ 284,223 | $ 168,456 | $ 42,944 |
Portfolio turnover rate G | 2% | 34% | 157% |
A Annualized
B Total returns for periods of less than one year are not annualized.
C Total returns do not reflect charges attributable to your insurance company's separate account. Inclusion of these charges would reduce the total returns shown.
D Total returns would have been lower had certain expenses not been reduced during the periods shown.
E Calculated based on average shares outstanding during the period.
F Fees and expenses of the underlying Fidelity Central Funds are not included in the Fund's expense ratio. The Fund indirectly bears its proportionate share of the expenses of any underlying Fidelity Central Funds.
G Amount does not include the portfolio activity of any underlying Fidelity Central Funds.
H For the period July 21, 2005 (commencement of sale of shares) to December 31, 2005.
I Expense ratios reflect operating expenses of the class. Expenses before reductions do not reflect amounts reimbursed by the investment adviser or expense offset arrangements and do not represent the amount paid by the class during periods when reimbursements or reductions occur. Expense ratios before reductions for start-up periods may not be representative of longer-term operating periods. Expenses net of fee waivers reflect expenses after reimbursement by the investment adviser but prior to reductions from expense offset arrangements. Expenses net of all reductions represent the net expenses paid by the class. Fees and expenses of the underlying Fidelity Central Funds are not included in the Fund's expense ratio. The Fund indirectly bears its proportionate share of the expenses of any Fidelity Central Funds. Based on their most recent shareholder report date, the annualized expenses for Fidelity VIP Investment Grade Central Fund and Fidelity Specialized High Income Central Fund were less than .01%.
See accompanying notes which are an integral part of the financial statements.
Annual Report
Notes to Financial Statements
For the period ended December 31, 2007
1. Organization.
VIP Investment Grade Bond Portfolio (the Fund) is a fund of Variable Insurance Products Fund V (the trust) (formerly of Variable Insurance Products Fund II) and is authorized to issue an unlimited number of shares. Effective April 19, 2007, the Board of Trustees approved an Agreement and Plan of Reorganization whereby the Fund reorganized into Variable Insurance Products Fund V effective June 29, 2007 (Trust Reorganization). The Trust Reorganization does not impact the Fund's investment strategies or Fidelity Management & Research Company's (FMR) management of the Fund. The trust is registered under the Investment Company Act of 1940, as amended (the 1940 Act), as an open-end management investment company organized as a Massachusetts business trust. Shares of the Fund may only be purchased by insurance companies for the purpose of funding variable annuity or variable life insurance contracts. The Fund offers the following classes of shares: Initial Class shares, Service Class shares, Service Class 2 shares, and Investor Class shares. All classes have equal rights and voting privileges, except for matters affecting a single class. Investment income, realized and unrealized capital gains and losses, the common expenses of the Fund, and certain fund-level expense reductions, if any, are allocated on a pro rata basis to each class based on the relative net assets of each class to the total net assets of the Fund. Each class differs with respect to transfer agent and distribution and service plan fees incurred. Certain expense reductions also differ by class.
2. Investments in Fidelity Central Funds.
The Fund may invest in Fidelity Central Funds, which are open-end investment companies available only to other investment companies and accounts managed by FMR and its affiliates. The Fund's Schedule of Investments lists each of the Fidelity Central Funds as an investment of the Fund, but does not include the underlying holdings of each Fidelity Central Fund. The Fund invests substantially all of its assets in VIP Investment Grade Central Fund which is managed by Fidelity Investments Money Management, Inc. (FIMM), an affiliate of FMR and seeks a high level of income by normally investing in investment-grade debt securities. VIP Investment Grade Central Fund's operating and accounting policies are outlined in its financial statements, included at the end of this report as an attachment.
Based on their investment objective, each Fidelity Central Fund may invest or participate in various investment vehicles or strategies that are similar to those of the Fund. These strategies are consistent with the investment objectives of the Fund and may involve certain economic risks which may cause a decline in value of each of the Fidelity Central Funds and thus a decline in the value of the Fund. The following summarizes the Fund's investment in each Fidelity Central Fund.
Fidelity Central Fund | | Investment Manager | | Investment Objective | | Investment Practices |
VIP Investment Grade Central Fund | | FIMM | | Seeks a high level of current income by normally investing in investment-grade debt securities and repurchase agreements. | | Delayed Delivery & When Issued Securities Mortgage Dollar Rolls Repurchase Agreements Restricted Securities Swap Agreements |
Fidelity Specialized High Income Central Fund | | Fidelity Management & Research Company, Inc. (FMRC) | | Seeks a high level of current income by normally investing in income-producing debt securities, with an emphasis on lower-quality debt securities. | | Loans & Direct Debt Instruments Repurchase Agreements Restricted Securities |
The Central Funds may have direct or indirect exposure to securities of issuers that hold mortgage securities, including securities backed by subprime mortgage loans. The value and related income of these securities is sensitive to changes in economic conditions, including delinquencies and/or defaults, and may be adversely affected by shifts in the market's perception of the issuers and changes in interest rates.
A holdings listing for the Fund, which presents direct holdings as well as the pro rata share of any securities and other investments held indirectly through its investment in underlying non-money market Fidelity Central Funds, is available at advisor.fidelity.com. A complete list of holdings for the Fidelity Specialized High Income Central Fund is available upon request or at the SEC's web site at www.sec.gov. In addition, the financial statements of the Fidelity Specialized High Income Central Fund, which are not covered by the Fund's Report of Independent Registered Public Accounting Firm, are available on the SEC's web site or upon request.
Annual Report
Notes to Financial Statements - continued
3. Significant Accounting Policies.
The financial statements have been prepared in conformity with accounting principles generally accepted in the United States of America, which require management to make certain estimates and assumptions at the date of the financial statements. The following summarizes the significant accounting policies of the Fund:
Security Valuation. Investments are valued and net asset value per share is calculated (NAV calculation) as of the close of business of the New York Stock Exchange, normally 4:00 p.m. Eastern time. Wherever possible, the Fund uses independent pricing services approved by the Board of Trustees to value its investments. Debt securities, including restricted securities, for which quotations are readily available, are valued by independent pricing services or by dealers who make markets in such securities. Pricing services consider yield or price of bonds of comparable quality, coupon, maturity and type as well as available dealer supplied prices. Certain of the Fund's securities may be valued by a single source or dealer.
When current market prices or quotations are not readily available or do not accurately reflect fair value, valuations may be determined in accordance with procedures adopted by the Board of Trustees. Factors used in the determination of fair value may include current market trading activity, interest rates, credit quality and default rates. The frequency of when fair value pricing is used is unpredictable. The value of securities used for NAV calculation under fair value pricing may differ from published prices for the same securities. Investments in open-end mutual funds, including the Fidelity Central Funds, are valued at their closing net asset value each business day. Short-term securities with remaining maturities of sixty days or less for which quotations are not readily available are valued at amortized cost, which approximates value.
Investment Transactions and Income. For financial reporting purposes, the Fund's investment holdings and NAV include trades executed through the end of the last business day of the period. The NAV for processing shareholder transactions includes trades executed through the end of the prior business day. Gains and losses on securities sold are determined on the basis of identified cost and may include proceeds received from litigation. Interest income and distributions from the Fidelity Central Funds are accrued as earned. Interest income includes coupon interest and amortization of premium and accretion of discount on debt securities.
Expenses. Most expenses of the trust can be directly attributed to a fund. Expenses which cannot be directly attributed are apportioned among each Fund in the trust. Expense estimates are accrued in the period to which they relate and adjustments are made when actual amounts are known. All legal and other expenses associated with the Trust Reorganization will be paid by FMR.
Income Tax Information and Distributions to Shareholders. Each year, the Fund intends to qualify as a regulated investment company by distributing substantially all of its taxable income and realized gains under Subchapter M of the Internal Revenue Code and filing its U.S. federal tax return. As a result, no provision for income taxes is required. The Fund adopted the provisions of FASB Interpretation No. 48, Accounting for Uncertainties in Income Taxes (FIN 48), on June 29, 2007. FIN 48 sets forth a minimum threshold for financial statement recognition of the benefit of a tax position taken or expected to be taken in a tax return. The implementation of FIN 48 did not result in any unrecognized tax benefits in the accompanying financial statements. Each of the Fund's federal tax returns for the prior three fiscal years remains subject to examination by the Internal Revenue Service.
Distributions are recorded on the ex-dividend date. Income dividends and capital gain distributions are declared separately for each class. Income and capital gain distributions are determined in accordance with income tax regulations, which may differ from generally accepted accounting principles.
Capital accounts within the financial statements are adjusted for permanent book-tax differences. Certain adjustments have been made to the accounts relating to prior periods. Collectively, these adjustments have no impact on net assets or the results of operations. Temporary book-tax differences will reverse in a subsequent period.
Book-tax differences are primarily due to the short-term gain distributions from the Fidelity Central Funds, swap agreements, market discount, partnerships (including allocations from Fidelity Central Funds), deferred trustees compensation, and capital loss carryforwards.
The tax-basis components of distributable earnings and the federal tax cost as of period end were as follows:
Unrealized appreciation | $ 45,287,094 | |
Unrealized depreciation | (7,058,551) | |
Net unrealized appreciation (depreciation) | 38,228,543 | |
Undistributed ordinary income | 107,094,598 | |
Capital loss carryforward | (7,863,643) | |
| | |
Cost for federal income tax purposes | $ 2,548,017,676 | |
Annual Report
3. Significant Accounting Policies - continued
Income Tax Information and Distributions to Shareholders - continued
The tax character of distributions paid was as follows:
| December 31, 2007 | December 31, 2006 |
Ordinary Income | $ 82,169,011 | $ 67,821,193 |
Long-term Capital Gains | - | 2,567,783 |
Total | $ 82,169,011 | $ 70,388,976 |
New Accounting Pronouncement. In September 2006, Statement of Financial Accounting Standards No. 157, Fair Value Measurements (SFAS 157), was issued and is effective for fiscal years beginning after November 15, 2007. SFAS 157 defines fair value, establishes a framework for measuring fair value and expands disclosures about fair value measurements. Management is currently evaluating the impact the adoption of SFAS 157 will have on the Fund's financial statement disclosures.
4. Operating Policies.
Repurchase Agreements. FMR has received an Exemptive Order from the Securities and Exchange Commission (the SEC) which permits the Fund and other affiliated entities of FMR to transfer uninvested cash balances into joint trading accounts which are then invested in repurchase agreements. The Fund may also invest directly with institutions in repurchase agreements. Repurchase agreements are collateralized by government or non-government securities. Upon settlement date, collateral is held in segregated accounts with custodian banks and may be obtained in the event of a default of the counterparty. The Fund monitors, on a daily basis, the value of the collateral to ensure it is at least equal to the principal amount of the repurchase agreement (including accrued interest). In the event of a default by the counterparty, realization of the collateral proceeds could be delayed, during which time the value of the collateral may decline.
Restricted Securities. The Fund may invest in securities that are subject to legal or contractual restrictions on resale. These securities generally may be resold in transactions exempt from registration or to the public if the securities are registered. Disposal of these securities may involve time-consuming negotiations and expense, and prompt sale at an acceptable price may be difficult. Information regarding restricted securities is included at the end of the Fund's Schedule of Investments.
Swap Agreements. The Fund may invest in swaps for the purpose of managing its exposure to interest rate, credit or market risk.
Credit default swaps involve the exchange of a fixed rate premium for protection against the loss in value of an underlying debt instrument in the event of a defined credit event (such as payment default or bankruptcy). Under the terms of the swap, one party acts as a "guarantor" receiving a periodic payment that is a fixed percentage applied to a notional principal amount. In return the party agrees to purchase the notional amount of the underlying instrument, at par, if a credit event occurs during the term of the swap. The Fund may enter into credit default swaps in which either it or its counterparty act as guarantors. By acting as the guarantor of a swap, a fund assumes the market and credit risk of the underlying instrument including liquidity and loss of value.
Swaps are marked-to-market daily based on dealer-supplied valuations and changes in value are recorded as unrealized appreciation (depreciation). Periodic payments and premiums received or made by the Fund are recorded in the accompanying Statement of Operations as realized gains or losses, respectively. Gains or losses are realized upon early termination of the swap agreement. Collateral, in the form of cash or securities, may be required to be held in segregated accounts with a fund's custodian in compliance with swap contracts. Risks may exceed amounts recognized on the Statement of Assets and Liabilities. These risks include changes in the returns of the underlying instruments, failure of the counterparties to perform under the contracts' terms and the possible lack of liquidity with respect to the swap agreements. Details of swap agreements open at period end are included in the Fund's Schedule of Investments under the caption "Swap Agreements."
5. Purchases and Sales of Investments.
Purchases and sales of securities (including the Fixed-Income Central Funds), other than short-term securities and U.S. government securities, aggregated $749,941,709 and $33,817,241, respectively.
6. Fees and Other Transactions with Affiliates.
Management Fee. FMR and its affiliates provide the Fund with investment management related services for which the Fund pays a monthly management fee. The management fee is the sum of an individual fund fee rate that is based on an annual rate of .20% of the Fund's average net assets and a group fee rate that averaged .12% during the period. The group fee rate is based upon the average net assets of all the mutual funds advised by FMR. The group fee rate decreases as assets under management increase and increases as assets under management decrease. For the period, the total annual management fee rate was .32% of the Fund's average net assets.
Annual Report
Notes to Financial Statements - continued
6. Fees and Other Transactions with Affiliates - continued
Distribution and Service Plan. In accordance with Rule 12b-1 of the 1940 Act, the Fund has adopted separate 12b-1 Plans for each Service Class of shares. Each Service Class pays Fidelity Distributors Corporation (FDC), an affiliate of FMR, a service fee. For the period, the service fee is based on an annual rate of .10% of Service Class' and .25% of Service Class 2's average net assets.
For the period, each class paid FDC the following amounts, all of which were re-allowed to insurance companies for the distribution of shares and providing shareholder support services:
Service Class | $ 124,402 | |
Service Class 2 | 1,828,799 | |
| $ 1,953,201 | |
Transfer Agent Fees. Fidelity Investments Institutional Operations Company, Inc. (FIIOC), an affiliate of FMR, is the Fund's transfer, dividend disbursing, and shareholder servicing agent. FIIOC receives an asset-based fee with respect to each class. Each class with the exception of Investor Class pays a transfer agent fee, excluding out of pocket expenses, equal to an annual rate of .07% of average net assets. Investor Class pays a monthly asset-based transfer agent fee of .10% of average net assets. The total transfer agent fees paid by each class to FIIOC, including out of pocket expenses, were as follows:
Initial Class | $ 801,961 | |
Service Class | 84,085 | |
Service Class 2 | 490,569 | |
Investor Class | 236,150 | |
| $ 1,612,765 | |
Accounting Fees. Fidelity Service Company, Inc. (FSC), an affiliate of FMR, maintains the Fund's accounting records. The fee is based on the level of average net assets for the month.
Interfund Lending Program. Pursuant to an Exemptive Order issued by the SEC, the Fund, along with other registered investment companies having management contracts with FMR, may participate in an interfund lending program. This program provides an alternative credit facility allowing the funds to borrow from, or lend money to, other participating affiliated funds. At period end, there were no interfund loans outstanding. The Fund's activity in this program during the period for which loans were outstanding was as follows:
Borrower or Lender | Average Daily
Loan Balance | Weighted Average Interest Rate | Interest Expense |
Borrower | $ 6,114,000 | 4.93% | $ 2,511 |
7. Committed Line of Credit.
The Fund participates with other funds managed by FMR in a $4.2 billion credit facility (the "line of credit") to be utilized for temporary or emergency purposes to fund shareholder redemptions or for other short-term liquidity purposes. The Fund has agreed to pay commitment fees on its pro rata portion of the line of credit, which amounted to $4,363 and is reflected in Miscellaneous Expense on the Statement of Operations. During the period, there were no borrowings on this line of credit.
8. Bank Borrowings.
The Fund is permitted to have bank borrowings for temporary or emergency purposes to fund shareholder redemptions. The Fund has established borrowing arrangements with certain banks. The interest rate on the borrowings is the bank's base rate, as revised from time to time. The average daily loan balance during the period for which loans were outstanding amounted to $10,414,000. The weighted average interest rate was 5.00%. The interest expense amounted to $1,446 under the bank borrowing program. At period end, there were no bank borrowings outstanding.
9. Expense Reductions.
Through arrangements with the Fund's custodian, credits realized as a result of uninvested cash balances were used to reduce the Fund's expenses. During the period, these credits reduced the Fund's custody expenses by $1,065.
Annual Report
10. Other.
The Fund's organizational documents provide former and current trustees and officers with a limited indemnification against liabilities arising in connection with the performance of their duties to the Fund. In the normal course of business, the Fund may also enter into contracts that provide general indemnifications. The Fund's maximum exposure under these arrangements is unknown as this would be dependent on future claims that may be made against the Fund. The risk of material loss from such claims is considered remote.
At the end of the period, FMR or its affiliates were the owners of record of 34% of the total outstanding shares of the Fund and one otherwise unaffiliated shareholder was the owner of record of 25% of the total outstanding shares of the Fund.
11. Distributions to Shareholders.
Distributions to shareholders of each class were as follows:
Years ended December 31, | 2007 | 2006 |
From net investment income | | |
Initial Class | $ 48,915,672 | $ 49,399,358 |
Service Class | 4,212,943 | 3,145,302 |
Service Class 2 | 21,635,659 | 11,428,030 |
Investor Class | 7,404,737 | 2,407,441 |
Total | $ 82,169,011 | $ 66,380,131 |
From net realized gain | | |
Initial Class | $ - | $ 2,958,053 |
Service Class | - | 191,787 |
Service Class 2 | - | 717,240 |
Investor Class | - | 141,765 |
Total | $ - | $ 4,008,845 |
12. Share Transactions.
Transactions for each class of shares were as follows:
| Shares | Dollars |
Years ended December 31, | 2007 | 2006 | 2007 | 2006 |
Initial Class | | | | |
Shares sold | 14,387,790 | 10,837,814 | $ 179,571,725 | $ 135,193,195 |
Reinvestment of distributions | 3,978,791 | 4,287,542 | 48,915,672 | 52,350,889 |
Shares redeemed | (22,289,170) | (22,975,071) | (278,600,560) | (284,993,124) |
Net increase (decrease) | (3,922,589) | (7,849,715) | $ (50,113,163) | $ (97,449,040) |
Service Class | | | | |
Shares sold | 5,832,754 | 3,518,243 | $ 72,283,870 | $ 43,182,084 |
Reinvestment of distributions | 344,884 | 274,884 | 4,212,943 | 3,337,089 |
Shares redeemed | (2,359,701) | (2,181,355) | (29,213,717) | (26,768,294) |
Net increase (decrease) | 3,817,937 | 1,611,772 | $ 47,283,096 | $ 19,750,879 |
Service Class 2 | | | | |
Shares sold | 43,988,735 | 19,973,590 | $ 538,885,002 | $ 244,806,904 |
Reinvestment of distributions | 1,787,104 | 1,008,743 | 21,635,659 | 12,145,271 |
Shares redeemed | (4,226,093) | (4,090,898) | (52,037,853) | (50,132,793) |
Net increase (decrease) | 41,549,746 | 16,891,435 | $ 508,482,808 | $ 206,819,382 |
Investor Class | | | | |
Shares sold | 9,943,802 | 10,523,797 | $ 123,816,926 | $ 130,549,386 |
Reinvestment of distributions | 603,684 | 208,558 | 7,404,737 | 2,542,317 |
Shares redeemed | (1,451,398) | (878,446) | (18,185,171) | (10,844,431) |
Net increase (decrease) | 9,096,088 | 9,853,909 | $ 113,036,492 | $ 122,247,272 |
13. Credit Risk.
The Fund may have direct or indirect exposure to securities of issuers that hold mortgage securities, including securities backed by subprime mortgage loans. The value and related income of these securities is sensitive to changes in economic conditions, including delinquencies and/or defaults, and may be adversely affected by shifts in the market's perception of the issuers and changes in interest rates.
Annual Report
Report of Independent Registered Public Accounting Firm
To the Trustees of Variable Insurance Products Fund V and Shareholders of VIP Investment Grade Bond Portfolio:
We have audited the accompanying statement of assets and liabilities of VIP Investment Grade Bond Portfolio (the Fund), a fund of Variable Insurance Products Fund V, including the schedule of investments, as of December 31, 2007, and the related statement of operations for the year then ended, the statement of changes in net assets for each of the two years in the period then ended, and the financial highlights for each of the five years in the period then ended. These financial statements and financial highlights are the responsibility of the Fund's management. Our responsibility is to express an opinion on these financial statements and financial highlights based on our audits.
We conducted our audits in accordance with standards of the Public Company Accounting Oversight Board (United States). Those standards require that we plan and perform the audit to obtain reasonable assurance about whether the financial statements and financial highlights are free of material misstatement. The Fund is not required to have, nor were we engaged to perform, an audit of its internal control over financial reporting. Our audits included consideration of internal control over financial reporting as a basis for designing audit procedures that are appropriate in the circumstances, but not for the purpose of expressing an opinion on the effectiveness of the Fund's internal control over financial reporting. Accordingly, we express no such opinion. An audit also includes examining, on a test basis, evidence supporting the amounts and disclosures in the financial statements, assessing the accounting principles used and significant estimates made by management, as well as evaluating the overall financial statement presentation. Our procedures included confirmation of securities owned as of December 31, 2007, by correspondence with the custodians and brokers; where replies were not received from brokers, we performed other auditing procedures. We believe that our audits provide a reasonable basis for our opinion.
In our opinion, the financial statements and financial highlights referred to above present fairly, in all material respects, the financial position of VIP Investment Grade Bond Portfolio as of December 31, 2007, the results of its operations for the year then ended, the changes in its net assets for each of the two years in the period then ended, and its financial highlights for each of the five years in the period then ended, in conformity with accounting principles generally accepted in the United States of America.
/s/ Deloitte & Touche LLP
DELOITTE & TOUCHE LLP
Boston, Massachusetts
February 28, 2008
Annual Report
Trustees and Officers
The Trustees, Members of the Advisory Board, and executive officers of the trust and fund, as applicable, are listed below. The Board of Trustees governs the fund and is responsible for protecting the interests of shareholders. The Trustees are experienced executives who meet periodically throughout the year to oversee the fund's activities, review contractual arrangements with companies that provide services to the fund, and review the fund's performance. Except for James C. Curvey, each of the Trustees oversees 373 funds advised by FMR or an affiliate. Mr. Curvey oversees 368 funds advised by FMR or an affiliate.
The Trustees hold office without limit in time except that (a) any Trustee may resign; (b) any Trustee may be removed by written instrument, signed by at least two-thirds of the number of Trustees prior to such removal; (c) any Trustee who requests to be retired or who has become incapacitated by illness or injury may be retired by written instrument signed by a majority of the other Trustees; and (d) any Trustee may be removed at any special meeting of shareholders by a two-thirds vote of the outstanding voting securities of the trust. Each Trustee who is not an interested person (as defined in the 1940 Act) (Independent Trustee), shall retire not later than the last day of the calendar year in which his or her 72nd birthday occurs. The Independent Trustees may waive this mandatory retirement age policy with respect to individual Trustees. The executive officers and Advisory Board Members hold office without limit in time, except that any officer and Advisory Board Member may resign or may be removed by a vote of a majority of the Trustees at any regular meeting or any special meeting of the Trustees. Except as indicated, each individual has held the office shown or other offices in the same company for the past five years.
The fund's Statement of Additional Information (SAI) includes more information about the Trustees. To request a free copy, call Fidelity at 1-877-208-0098.
Interested Trustees*:
Correspondence intended for each Trustee who is an interested person may be sent to Fidelity Investments, 82 Devonshire Street, Boston, Massachusetts 02109.
Name, Age; Principal Occupation |
Edward C. Johnson 3d (77) |
| Year of Election or Appointment: 1989 Mr. Johnson is Chairman of the Board of Trustees. Mr. Johnson serves as President (2006-present), Chief Executive Officer, Chairman, and a Director of FMR LLC; Chairman and a Director of FMR; Chairman and a Director of Fidelity Research & Analysis Company (FRAC); Chairman and a Director of Fidelity Investments Money Management, Inc.; and Chairman (2001-present) and a Director of FMR Co., Inc. In addition, Mr. Johnson serves as Chairman and Director of Fidelity International Limited (FIL). Mr. Edward C. Johnson 3d and Mr. Arthur E. Johnson are not related. |
James C. Curvey (72) |
| Year of Election or Appointment: 2007 Mr. Curvey also serves as Trustee (2007-present) or Member of the Advisory Board (2007-present) of other investment companies advised by FMR. Mr. Curvey is a Director of FMR and FMR Co., Inc. (2007-present). Mr. Curvey is also Vice Chairman (2006-present) and Director of FMR LLC. Mr. Curvey joined Fidelity in 1982 and served in numerous senior management positions, including President and Chief Operating Officer of FMR LLC (1997-2000) and President of Fidelity Strategic Investments (2000-2002). In addition, he serves as a member of the Board of Directors of Geerlings & Wade, Inc. (wine distribution). |
* Trustees have been determined to be "Interested Trustees" by virtue of, among other things, their affiliation with the trust or various entities under common control with FMR. FMR Corp. merged with and into FMR LLC on October 1, 2007. Any references to FMR LLC for prior periods are deemed to be references to the prior entity.
Independent Trustees:
Correspondence intended for each Independent Trustee (that is, the Trustees other than the Interested Trustees) may be sent to Fidelity Investments, P.O. Box 55235, Boston, Massachusetts 02205-5235.
Name, Age; Principal Occupation |
Dennis J. Dirks (59) |
| Year of Election or Appointment: 2005 Prior to his retirement in May 2003, Mr. Dirks was Chief Operating Officer and a member of the Board of The Depository Trust & Clearing Corporation (DTCC) (1999-2003). He also served as President, Chief Operating Officer, and Board member of The Depository Trust Company (DTC) (1999-2003) and President and Board member of the National Securities Clearing Corporation (NSCC) (1999-2003). In addition, Mr. Dirks served as Chief Executive Officer and Board member of the Government Securities Clearing Corporation (2001-2003) and Chief Executive Officer and Board member of the Mortgage-Backed Securities Clearing Corporation (2001-2003). Mr. Dirks also serves as a Trustee and a member of the Finance Committee of Manhattan College (2005-present) and a Trustee and a member of the Finance Committee of AHRC of Nassau County (2006-present). |
Albert R. Gamper, Jr. (65) |
| Year of Election or Appointment: 2006 Prior to his retirement in December 2004, Mr. Gamper served as Chairman of the Board of CIT Group Inc. (commercial finance). During his tenure with CIT Group Inc. Mr. Gamper served in numerous senior management positions, including Chairman (1987-1989; 1999-2001; 2002-2004), Chief Executive Officer (1987-2004), and President (1989-2002). He currently serves as a member of the Board of Directors of Public Service Enterprise Group (utilities, 2001-present), Chairman of the Board of Governors, Rutgers University (2004-present), and Chairman of the Board of Saint Barnabas Health Care System. |
George H. Heilmeier (71) |
| Year of Election or Appointment: 2004 Dr. Heilmeier is Chairman Emeritus of Telcordia Technologies (communication software and systems), where prior to his retirement, he served as company Chairman and Chief Executive Officer. He currently serves on the Boards of Directors of The Mitre Corporation (systems engineering and information technology support for the government), and HRL Laboratories (private research and development, 2004-present). He is Chairman of the General Motors Science & Technology Advisory Board and a Life Fellow of the Institute of Electrical and Electronics Engineers (IEEE). Dr. Heilmeier is a member of the Defense Science Board and the National Security Agency Advisory Board. He is also a member of the National Academy of Engineering, the American Academy of Arts and Sciences, and the Board of Overseers of the School of Engineering and Applied Science of the University of Pennsylvania. Previously, Dr. Heilmeier served as a Director of TRW Inc. (automotive, space, defense, and information technology, 1992-2002), Compaq (1994-2002), Automatic Data Processing, Inc. (ADP) (technology-based business outsourcing, 1995-2002), INET Technologies Inc. (telecommunications network surveillance, 2001-2004), and Teletech Holdings (customer management services). He is the recipient of the 2005 Kyoto Prize in Advanced Technology for his invention of the liquid crystal display, and a member of the Consumer Electronics Hall of Fame. |
James H. Keyes (67) |
| Year of Election or Appointment: 2007 Prior to his retirement in 2003, Mr. Keyes was Chairman, President, and Chief Executive Officer of Johnson Controls, Inc. (automotive supplier, 1993-2003). He currently serves as a member of the boards of LSI Logic Corporation (semiconductor technologies), Navistar International Corporation (manufacture and sale of trucks, buses, and diesel engines, 2002-present), and Pitney Bowes, Inc. (integrated mail, messaging, and document management solutions). |
Marie L. Knowles (61) |
| Year of Election or Appointment: 2001 Prior to Ms. Knowles' retirement in June 2000, she served as Executive Vice President and Chief Financial Officer of Atlantic Richfield Company (ARCO) (diversified energy, 1996-2000). From 1993 to 1996, she was a Senior Vice President of ARCO and President of ARCO Transportation Company. She served as a Director of ARCO from 1996 to 1998. She currently serves as a Director of Phelps Dodge Corporation (copper mining and manufacturing) and McKesson Corporation (healthcare service, 2002-present). Ms. Knowles is a Trustee of the Brookings Institution and the Catalina Island Conservancy and also serves as a member of the Advisory Board for the School of Engineering of the University of Southern California. |
Ned C. Lautenbach (63) |
| Year of Election or Appointment: 2000 Mr. Lautenbach is Chairman of the Independent Trustees (2006-present). Mr. Lautenbach has been a partner of Clayton, Dubilier & Rice, Inc. (private equity investment firm) since September 1998. Previously, Mr. Lautenbach was with the International Business Machines Corporation (IBM) from 1968 until his retirement in 1998. Mr. Lautenbach serves as a Director of Sony Corporation (2006-present) and Eaton Corporation (diversified industrial) as well as the Philharmonic Center for the Arts in Naples, Florida. He also is a member of the Board of Trustees of Fairfield University (2005-present), as well as a member of the Council on Foreign Relations. |
Cornelia M. Small (63) |
| Year of Election or Appointment: 2005 Ms. Small is a member (2000-present) and Chairperson (2002-present) of the Investment Committee, and a member (2002-
present) of the Board of Trustees of Smith College. Previously, she served as Chief Investment Officer (1999-2000), Director of Global Equity Investments (1996-1999), and a member of the Board of Directors of Scudder, Stevens & Clark (1990-1997) and Scudder Kemper Investments (1997-1999). In addition, Ms. Small served as Co-Chair (2000-2003) of the Annual Fund for the Fletcher School of Law and Diplomacy. |
William S. Stavropoulos (68) |
| Year of Election or Appointment: 2001 Mr. Stavropoulos is Chairman Emeritus of the Board of Directors of The Dow Chemical Company. Since joining The Dow Chemical Company in 1967, Mr. Stavropoulos served in numerous senior management positions, including President (1993-2000; 2002-2003), CEO (1995-2000; 2002-2004), and Chairman of the Executive Committee (2000-2004). Currently, he is a Director of NCR Corporation (data warehousing and technology solutions), Chemical Financial Corporation, Maersk Inc. (industrial conglomerate, 2002-present), Tyco International, Inc. (multinational manufacturing and services, 2007-present), and a member of the Advisory Board for Metalmark Capital (private equity investment firm, 2005-present). He is a special advisor to Clayton, Dubilier & Rice, Inc., a private equity investment firm. He also serves as a member of the Board of Trustees of the American Enterprise Institute for Public Policy Research. In addition, Mr. Stavropoulos is a member of The Business Council, J.P. Morgan International Council and the University of Notre Dame Advisory Council for the College of Science. |
Kenneth L. Wolfe (68) |
| Year of Election or Appointment: 2005 Mr. Wolfe is Chairman and a Director of Hershey Foods Corporation (2007-present), where prior to his retirement in 2001, he was Chairman and Chief Executive Officer. Mr. Wolfe currently serves as a member of the board of Revlon Inc. (2004-present). Previously, Mr. Wolfe served as a member of the boards of Adelphia Communications Corporation (2003-2006) and Bausch & Lomb, Inc. (1993-2007). |
Advisory Board Members and Executive Officers**:
Correspondence intended for Mr. Mauriello, Mr. Thomas, Mr. Wiley, Mr. Lacy, and Mr. Arthur Johnson may be sent to Fidelity Investments, P.O. Box 55235, Boston, Massachusetts 02205-5235. Correspondence intended for each executive officer and Mr. Lynch may be sent to Fidelity Investments, 82 Devonshire Street, Boston, Massachusetts 02109.
Name, Age; Principal Occupation |
Arthur E. Johnson (60) |
| Year of Election or Appointment: 2008 Member of the Advisory Board of Variable Insurance Products Fund V. Mr. Johnson serves as Senior Vice President of Corporate Strategic Development of Lockheed Martin Corporation (defense contractor). In addition, Mr. Johnson serves as a member of the Board of Directors of AGL Resources, Inc. (holding company, 2002-present), and IKON Office Solutions, Inc. (document management systems and services). Mr. Arthur E. Johnson and Mr. Edward C. Johnson 3d are not related. |
Alan J. Lacy (54) |
| Year of Election or Appointment: 2008 Member of the Advisory Board of Variable Insurance Products Fund V. Mr. Lacy serves as Senior Adviser (2007-present) of Oak Hill Capital Partners, L.P. (a private equity firm). Mr. Lacy also served as Vice Chairman and Chief Executive Officer of Sears Holdings Corporation and Sears, Roebuck and Co. (retail, 2005-2006; 2000-2005). In addition, Mr. Lacy serves as a member of the Board of Directors of The Western Union Company (global money transfer, 2006-present) and Bristol-Myers Squibb (global pharmaceuticals, 2007-present). Mr. Lacy is a Trustee of the National Parks Conservation Association and The Field Museum of Natural History. |
Peter S. Lynch (63) |
| Year of Election or Appointment: 2003 Member of the Advisory Board of Variable Insurance Products Fund V. Mr. Lynch is Vice Chairman and a Director of FMR, and Vice Chairman (2001-present) and a Director of FMR Co., Inc. Previously, Mr. Lynch served as a Trustee of the Fidelity funds (1990-2003). In addition, he serves as a Trustee of Boston College and as the Chairman of the Inner-City Scholarship Fund. |
Joseph Mauriello (63) |
| Year of Election or Appointment: 2007 Member of the Advisory Board of Variable Insurance Products Fund V. Prior to his retirement in January 2006, Mr. Mauriello served in numerous senior management positions including Deputy Chairman and Chief Operating Officer (2004-2005), and Vice Chairman of Financial Services (2002-2004) of KPMG LLP US (professional services firm, 1965-2005). Mr. Mauriello currently serves as a member of the Board of Directors of XL Capital Ltd. (global insurance and re-insurance company, 2006-present) and of Arcadia Resources Inc. (health care services and products, 2007-present). He also served as a Director of the Hamilton Funds of the Bank of New York (2006-2007). |
David M. Thomas (58) |
| Year of Election or Appointment: 2007 Member of the Advisory Board of Variable Insurance Products Fund V. Previously, Mr. Thomas served as Executive Chairman (2005-2006) and Chairman and Chief Executive Officer (2000-2005) of IMS Health, Inc. (pharmaceutical and healthcare information solutions). In addition, Mr. Thomas serves as a member of the Board of Directors of Fortune Brands, Inc. (consumer products holding company), and Interpublic Group of Companies, Inc. (marketing communication, 2004-present). |
Michael E. Wiley (57) |
| Year of Election or Appointment: 2007 Member of the Advisory Board of Variable Insurance Products Fund V. Mr. Wiley also serves as a member of the Board of Trustees of the University of Tulsa (2000-2006; 2007-present). He serves as a Director of Tesoro Corporation (independent oil refiner and marketer, 2005-present), and a Director of Bill Barrett Corporation (exploration and production company, 2005-present). In addition, he also serves as a Director of Post Oak Bank (privately-held bank, 2004-present). Previously, Mr. Wiley served as a Sr. Energy Advisor of Katzenbach Partners, LLC (consulting firm, 2006-2007), as an Advisory Director of Riverstone Holdings (private investment firm), Chairman, President, and CEO of Baker Hughes, Inc. (oilfield services company, 2000-2004), and as Director of Spinnaker Exploration Company (exploration and production company, 2001-2005). |
Kimberley H. Monasterio (44) |
| Year of Election or Appointment: 2007 President and Treasurer of VIP Investment Grade Bond. Ms. Monasterio also serves as President and Treasurer of other Fidelity funds (2007-present) and is an employee of FMR (2004-present). Previously, Ms. Monasterio served as Deputy Treasurer of the Fidelity funds (2004-2006). Before joining Fidelity Investments, Ms. Monasterio served as Treasurer (2000-2004) and Chief Financial Officer (2002-2004) of the Franklin Templeton Funds and Senior Vice President of Franklin Templeton Services, LLC (2000-2004). |
Boyce I. Greer (51) |
| Year of Election or Appointment: 2006 Vice President of VIP Investment Grade Bond. Mr. Greer also serves as Vice President of certain Asset Allocation Funds (2005-present), Fixed-Income Funds (2006-present), and Money Market Funds (2006-present). Mr. Greer is also a Trustee of other investment companies advised by FMR (2003-present). Mr. Greer is an Executive Vice President of FMR (2005-present) and FMR Co., Inc. (2005-present), and Senior Vice President of Fidelity Investments Money Management, Inc. (2006-present). Previously, Mr. Greer served as Vice President of certain Fidelity Equity Funds (2005-2007), a Director and Managing Director of Strategic Advisers, Inc. (2002-2005), and Executive Vice President (2000-2002) and Money Market Group Leader (1997-2002) of the Fidelity Investments Fixed Income Division. Mr. Greer also served as Vice President of Fidelity's Money Market Funds (1997-2002), Senior Vice President of FMR (1997-2002), and Vice President of FIMM (1998-2002). |
Thomas J. Silvia (46) |
| Year of Election or Appointment: 2005 Vice President of VIP Investment Grade Bond. Mr. Silvia also serves as Vice President of Fidelity's Fixed-Income Funds (2005-
present) and Senior Vice President and Bond Group Leader of the Fidelity Investments Fixed-Income Division (2005-present). Previously, Mr. Silvia served as Vice President of certain Balanced Funds (2005-2007), certain Asset Allocation Funds (2005-2007), a Director of Fidelity's Taxable Bond portfolio managers (2002-2004) and a portfolio manager in the Bond Group (1997-2004). |
Eric D. Roiter (59) |
| Year of Election or Appointment: 1998 Secretary of VIP Investment Grade Bond. He also serves as Secretary of other Fidelity funds; Vice President, General Counsel, and Secretary of FMR Co., Inc. (2001-present) and FMR; Assistant Secretary of Fidelity Management & Research (U.K.) Inc. (2001-present), Fidelity Research & Analysis Company (2001-present), and Fidelity Investments Money Management, Inc. (2001-present). Mr. Roiter is an Adjunct Member, Faculty of Law, at Boston College Law School (2003-present). Previously, Mr. Roiter served as Vice President and Secretary of Fidelity Distributors Corporation (FDC) (1998-2005). |
John B. McGinty, Jr. (45) |
| Year of Election or Appointment: 2008 Assistant Secretary of VIP Investment Grade Bond. Mr. McGinty also serves as Assistant Secretary of other Fidelity funds (2008-present) and is an employee of FMR LLC (2004-present). Mr. McGinty also serves as Senior Vice President, Secretary, and Chief Legal Officer of FDC (2007-present). Before joining Fidelity Investments, Mr. McGinty practiced law at Ropes & Gray, LLP. |
R. Stephen Ganis (41) |
| Year of Election or Appointment: 2006 Anti-Money Laundering (AML) officer of VIP Investment Grade Bond. Mr. Ganis also serves as AML officer of other Fidelity funds (2006-present) and FMR LLC (2003-present). Before joining Fidelity Investments, Mr. Ganis practiced law at Goodwin Procter, LLP (2000-2002). |
Joseph B. Hollis (59) |
| Year of Election or Appointment: 2006 Chief Financial Officer of VIP Investment Grade Bond. Mr. Hollis also serves as Chief Financial Officer of other Fidelity funds. Mr. Hollis is President of Fidelity Pricing and Cash Management Services (FPCMS) (2005-present). Mr. Hollis also serves as President and Director of Fidelity Service Company, Inc. (2006-present). Previously, Mr. Hollis served as Senior Vice President of Cash Management Services (1999-2002) and Investment Management Operations (2002-2005). |
Kenneth A. Rathgeber (60) |
| Year of Election or Appointment: 2004 Chief Compliance Officer of VIP Investment Grade Bond. Mr. Rathgeber also serves as Chief Compliance Officer of other Fidelity funds (2004-present) and Executive Vice President of Risk Oversight for Fidelity Investments (2002-present). He is Chief Compliance Officer of FMR (2005-present), FMR Co., Inc. (2005-present), Fidelity Management & Research (U.K.) Inc. (2005-present), Fidelity Research & Analysis Company (2005-present), Fidelity Investments Money Management, Inc. (2005-present), and Strategic Advisers, Inc. (2005-present). Previously, Mr. Rathgeber served as Executive Vice President and Chief Operating Officer for Fidelity Investments Institutional Services Company, Inc. (1998-2002). |
Bryan A. Mehrmann (46) |
| Year of Election or Appointment: 2005 Deputy Treasurer of VIP Investment Grade Bond. Mr. Mehrmann also serves as Deputy Treasurer of other Fidelity funds (2005-present) and is an employee of FMR. Previously, Mr. Mehrmann served as Vice President of Fidelity Investments Institutional Services Group (FIIS)/Fidelity Investments Institutional Operations Corporation, Inc. (FIIOC) Client Services (1998-2004). |
Kenneth B. Robins (38) |
| Year of Election or Appointment: 2005 Deputy Treasurer of VIP Investment Grade Bond. Mr. Robins also serves as Deputy Treasurer of other Fidelity funds (2005-present) and is an employee of FMR (2004-present). Before joining Fidelity Investments, Mr. Robins worked at KPMG LLP, where he was a partner in KPMG's department of professional practice (2002-2004) and a Senior Manager (1999-2000). In addition, Mr. Robins served as Assistant Chief Accountant, United States Securities and Exchange Commission (2000-2002). |
Robert G. Byrnes (41) |
| Year of Election or Appointment: 2005 Assistant Treasurer of VIP Investment Grade Bond. Mr. Byrnes also serves as Assistant Treasurer of other Fidelity funds (2005-
present) and is an employee of FMR (2005-present). Previously, Mr. Byrnes served as Vice President of FPCMS (2003-2005). Before joining Fidelity Investments, Mr. Byrnes worked at Deutsche Asset Management where he served as Vice President of the Investment Operations Group (2000-2003). |
Peter L. Lydecker (53) |
| Year of Election or Appointment: 2004 Assistant Treasurer of VIP Investment Grade Bond. Mr. Lydecker also serves as Assistant Treasurer of other Fidelity funds (2004) and is an employee of FMR. |
Paul M. Murphy (60) |
| Year of Election or Appointment: 2007 Assistant Treasurer of VIP Investment Grade Bond. Mr. Murphy also serves as Assistant Treasurer of other Fidelity funds (2007-present) and is an employee of FMR (2007-present). Previously, Mr. Murphy served as Chief Financial Officer of the Fidelity Funds (2005-2006), Vice President and Associate General Counsel of FMR (2007), and Senior Vice President of Fidelity Pricing and Cash Management Services Group (FPCMS) (1994-2007). |
Gary W. Ryan (49) |
| Year of Election or Appointment: 2005 Assistant Treasurer of VIP Investment Grade Bond. Mr. Ryan also serves as Assistant Treasurer of other Fidelity funds (2005-
present) and is an employee of FMR (2005-present). Previously, Mr. Ryan served as Vice President of Fund Reporting in FPCMS (1999-2005). |
** FMR Corp. merged with and into FMR LLC on October 1, 2007. Any references to FMR LLC for prior periods are deemed to be references to the prior entity.
Annual Report
Distributions
The Board of Trustees of VIP Investment Grade Bond Portfolio voted to pay to shareholders of record at the opening of business on record date, the following distributions per share derived from capital gains realized from sales of portfolio securities, and dividends derived from net investment income.
| Pay Date | Record Date | Dividends | Capital Gains |
Initial Class | 02/15/08 | 02/15/08 | $0.515 | $0.01 |
Service Class | 02/15/08 | 02/15/08 | $0.506 | $0.01 |
Service Class 2 | 02/15/08 | 02/15/08 | $0.496 | $0.01 |
Investor Class | 02/15/08 | 02/15/08 | $0.513 | $0.01 |
A total of 11.96% of the dividends distributed during the fiscal year was derived from interest on U.S. Government securities which is generally exempt from state income tax.
The fund will notify shareholders in January 2008 of amounts for use in preparing 2007 income tax returns.
Annual Report
The following are the financial statements for the Fidelity VIP Investment
Grade Central Fund as of December 31, 2007 which is a direct investment of
VIP Investment Grade Bond Portfolio.
Not Part of Financial Report
Performance: The Bottom Line
Average annual total return reflects the change in the value of an investment, assuming reinvestment of the fund's dividend income and capital gains (the profits earned upon the sale of securities that have grown in value, if any) and assuming a constant rate of performance each year. The $10,000 table and the fund's returns do not reflect the deduction of taxes that a shareholder would pay on fund distributions or the redemption of fund shares. During periods of reimbursement by Fidelity, a fund's total return will be greater than it would be had the reimbursement not occurred. How a fund did yesterday is no guarantee of how it will do tomorrow.
Average Annual Total Returns
Periods ended December 31, 2007 | Past 1
year | Life of
Fund A |
VIP Investment Grade Central Fund | 4.94% | 7.21% |
A From June 23, 2006
$10,000 Over Life of Fund
Let's say hypothetically that $10,000 was invested in VIP Investment Grade Central Fund on June 23, 2006, when the fund started. The chart shows how the value of your investment would have changed, and also shows how the Lehman Brothers® U.S. Aggregate Index performed over the same period.
Not Part of Financial Report
Management's Discussion of Fund Performance
Comments from Ford O'Neil, Portfolio Manager of VIP Investment Grade Central Fund
In 2007, the U.S. investment-grade bond market outperformed the domestic stock market, as measured by the Standard & Poor's 500SM Index, for the first time in five years. High-quality debt, as measured by the Lehman Brothers® U.S. Aggregate Index, climbed 6.97%, beating the 5.49% return of the S&P 500®. Bonds with the lowest levels of risk ended the year with the highest returns, benefiting from a massive flight to quality as investors sought safer havens given the turmoil in the credit markets and deteriorating economic conditions. Treasuries, which are government guaranteed, had the best showing within the Aggregate index, gaining 9.01% according to the Lehman Brothers U.S. Treasury Index. Treasuries were among the few securities in any asset class that didn't feel the pain of the subprime mortgage crisis, which gripped the financial markets for most of the second half of 2007. The asset-backed category - home to weak subprime debt - had the most disappointing performance, returning only 2.21% according to the Lehman Brothers U.S. Fixed-Rate Asset-Backed Securities Index.
During the past year, the fund returned 4.94%, significantly lagging the Lehman Brothers U.S. Aggregate Index. My discussion of the fund's performance reflects its holdings in aggregate, including direct investments and holdings in underlying central funds. The main factor behind the fund's weak showing was its exposure - mainly through Fidelity® Ultra-Short Central Fund - to asset-backed securities backed by subprime mortgages, which suffered steep losses amid weakening housing fundamentals and deteriorating market technical factors. Given its heightened level of volatility, I cut back the fund's stake in Ultra-Short Central by year end. As difficult conditions within the mortgage market extended broadly to other segments of the fixed-income market, our sector selection also worked against us. In particular, our decisions to invest outside the benchmark in collateralized mortgage obligations and to modestly overweight commercial mortgage-backed securities, investment-grade corporate bonds, high-yield corporate bonds and other asset-backed securities dampened our absolute and relative returns because they lagged the index. Elsewhere, our out-of-benchmark position in Treasury Inflation-Protected Securities (TIPS) worked in our favor. TIPS fared especially well amid a global flight to safety, rising inflation worries and a realized increase in the inflation rate. A significant underweighting in mortgage pass-through securities further boosted relative performance, as did yield-curve positioning. Specifically, the fund benefited from concentrating investments in bonds with intermediate-range maturities, which performed well, and underweighting longer-term bonds, which lagged.
The views expressed above reflect those of the portfolio manager(s) only through the end of the period as stated on the cover of this report and do not necessarily represent the views of Fidelity or any other person in the Fidelity organization. Any such views are subject to change at any time based upon market or other conditions and Fidelity disclaims any responsibility to update such views. These views may not be relied on as investment advice and, because investment decisions for a Fidelity fund are based on numerous factors, may not be relied on as an indication of trading intent on behalf of any Fidelity fund.
Not Part of Financial Report
Shareholder Expense Example
As a shareholder of the Fund, you incur two types of costs: (1) transaction costs, and (2) ongoing costs, including management fees and other Fund expenses. This Example is intended to help you understand your ongoing costs (in dollars) of investing in the Fund and to compare these costs with the ongoing costs of investing in other mutual funds.
The Example is based on an investment of $1,000 invested at the beginning of the period and held for the entire period (July 1, 2007 to December 31, 2007).
Actual Expenses
The first line of the accompanying table provides information about actual account values and actual expenses. You may use the information in this line, together with the amount you invested, to estimate the expenses that you paid over the period. Simply divide your account value by $1,000.00 (for example, an $8,600 account value divided by $1,000.00 = 8.6), then multiply the result by the number in the first line under the heading entitled "Expenses Paid During Period" to estimate the expenses you paid on your account during this period. In addition, the Fund, as a shareholder in the underlying Fidelity Central Funds, will indirectly bear its pro rata share of the fees and expenses incurred by the underlying Fidelity Central Funds. These fees and expenses are not included in the Fund's annualized expense ratio used to calculate the expense estimate in the table below.
Hypothetical Example for Comparison Purposes
The second line of the accompanying table provides information about hypothetical account values and hypothetical expenses based on the Fund's actual expense ratio and an assumed rate of return of 5% per year before expenses, which is not the Fund's actual return. The hypothetical account values and expenses may not be used to estimate the actual ending account balance or expenses you paid for the period. You may use this information to compare the ongoing costs of investing in the Fund and other funds. To do so, compare this 5% hypothetical example with the 5% hypothetical examples that appear in the shareholder reports of the other funds. In addition, the Fund, as a shareholder in the underlying Fidelity Central Funds, will indirectly bear its pro rata share of the fees and expenses incurred by the underlying Fidelity Central Funds. These fees and expenses are not included in the Fund's annualized expense ratio used to calculate the expense estimate in the table below.
Please note that the expenses shown in the table are meant to highlight your ongoing costs only and do not reflect any transaction costs. Therefore, the second line of the table is useful in comparing ongoing costs only, and will not help you determine the relative total costs of owning different funds.
| Beginning
Account Value
July 1, 2007 | Ending
Account Value
December 31, 2007 | Expenses Paid
During Period*
July 1, 2007
to December 31, 2007 |
Actual | $ 1,000.00 | $ 1,040.70 | $ .01 |
Hypothetical (5% return per year before expenses) | $ 1,000.00 | $ 1,025.19 | $ .01 |
* Expenses are equal to the Fund's annualized expense ratio of .0028%; multiplied by the average account value over the period, multiplied by 184/365 (to reflect the one-half year period). The fees and expenses of the underlying Fidelity Central Funds in which the Fund invests are not included in the Fund's annualized expense ratio.
Not Part of Financial Report
Investment Changes
The information in the following tables is based on the combined investments of the Fund and its pro-rata share of its investments in each Fidelity Central Fund.
Quality Diversification (% of fund's net assets) |
As of December 31, 2007 | As of June 30, 2007 |
| U.S. Government and
U.S. Government Agency
Obligations 61.7% | | | U.S. Government and
U.S. Government Agency
Obligations 60.4% | |
| AAA 14.1% | | | AAA 17.3% | |
| AA 4.5% | | | AA 6.3% | |
| A 7.3% | | | A 6.0% | |
| BBB 15.7% | | | BBB 17.6% | |
| BB and Below 0.9% | | | BB and Below 2.0% | |
| Not Rated 0.2% | | | Not Rated 0.7% | |
 | Short-Term Investments and
Net Other Assets*** (4.4)% | | | Short-Term Investments and
Net Other Assets*** (10.3)% | |

We have used ratings from Moody's® Investors Services, Inc. Where Moody's ratings are not available, we have used S&P® ratings. All ratings are as of the report date and do not reflect subsequent downgrades. |
Weighted Average Maturity as of December 31, 2007 |
| | 6 months ago |
Years | 6.1 | 5.8 |
The weighted average maturity is based on the dollar-weighted average length of time until principal payments are expected or until securities reach maturity, taking into account any maturity shortening feature such as a call, refunding or redemption provision. |
Duration as of December 31, 2007 |
| | 6 months ago |
Years | 4.4 | 4.5 |
Duration shows how much a bond fund's price fluctuates with changes in comparable interest rates. If rates rise 1%, for example, a fund with a five-year duration is likely to lose about 5% of its value. Other factors also can influence a bond fund's performance and share price. Accordingly, a bond fund's actual performance may differ from this example. |
Asset Allocation (% of fund's net assets) |
As of December 31, 2007 * | As of June 30, 2007 ** |
| Corporate Bonds 22.1% | | | Corporate Bonds 23.4% | |
| U.S. Government and
U.S. Government Agency
Obligations 61.7% | | | U.S. Government and
U.S. Government Agency
Obligations 60.4% | |
| Asset-Backed Securities 7.2% | | | Asset-Backed Securities 11.5% | |
| CMOs and Other Mortgage
Related Securities 13.2% | | | CMOs and Other Mortgage
Related Securities 14.8% | |
| Other Investments 0.2% | | | Other Investments 0.2% | |
| Short-Term Investments
and Net Other Assets*** (4.4)% | | | Short-Term Investments
and Net Other Assets*** (10.3)% | |
* Foreign investments | 6.6% | | ** Foreign investments | 6.9% | |
* Futures and Swaps | 13.2% | | ** Futures and Swaps | 16.0% | |

*** Short-Term Investments and Net Other Assets are not included in the pie chart.
Not Part of Financial Report
Investments December 31, 2007
Showing Percentage of Net Assets
Nonconvertible Bonds - 20.8% |
| Principal Amount | | Value |
CONSUMER DISCRETIONARY - 1.2% |
Household Durables - 0.1% |
Fortune Brands, Inc.: | | | | |
5.125% 1/15/11 | | $ 4,010,000 | | $ 4,001,864 |
5.875% 1/15/36 | | 695,000 | | 634,294 |
| | 4,636,158 |
Media - 1.1% |
AOL Time Warner, Inc.: | | | | |
6.75% 4/15/11 | | 100,000 | | 104,154 |
6.875% 5/1/12 | | 290,000 | | 305,373 |
7.625% 4/15/31 | | 1,625,000 | | 1,798,258 |
Comcast Corp.: | | | | |
4.95% 6/15/16 | | 2,975,000 | | 2,801,450 |
5.5% 3/15/11 | | 2,675,000 | | 2,700,565 |
Cox Communications, Inc.: | | | | |
4.625% 1/15/10 | | 3,350,000 | | 3,324,011 |
4.625% 6/1/13 | | 3,475,000 | | 3,324,567 |
6.45% 12/1/36 (a) | | 1,560,000 | | 1,547,759 |
News America Holdings, Inc. 7.75% 12/1/45 | | 1,905,000 | | 2,066,093 |
News America, Inc.: | | | | |
6.15% 3/1/37 | | 1,745,000 | | 1,685,651 |
6.2% 12/15/34 | | 6,695,000 | | 6,599,864 |
Time Warner Cable, Inc.: | | | | |
5.85% 5/1/17 | | 2,467,000 | | 2,473,089 |
6.55% 5/1/37 | | 5,604,000 | | 5,719,980 |
Time Warner, Inc. 5.875% 11/15/16 | | 400,000 | | 397,542 |
Viacom, Inc.: | | | | |
5.75% 4/30/11 | | 1,410,000 | | 1,427,735 |
6.125% 10/5/17 | | 2,710,000 | | 2,709,883 |
6.75% 10/5/37 | | 935,000 | | 927,518 |
| | 39,913,492 |
TOTAL CONSUMER DISCRETIONARY | | 44,549,650 |
CONSUMER STAPLES - 1.1% |
Beverages - 0.2% |
Diageo Capital PLC: | | | | |
5.2% 1/30/13 | | 1,705,000 | | 1,712,783 |
5.75% 10/23/17 | | 3,817,000 | | 3,838,677 |
FBG Finance Ltd. 5.125% 6/15/15 (a) | | 2,185,000 | | 2,124,500 |
| | 7,675,960 |
Food & Staples Retailing - 0.3% |
CVS Caremark Corp.: | | | | |
6.036% 12/10/28 (a) | | 7,279,933 | | 6,989,900 |
6.302% 6/1/37 (e) | | 5,910,000 | | 5,712,263 |
| | 12,702,163 |
Food Products - 0.4% |
Cargill, Inc. 6.625% 9/15/37 (a) | | 3,333,000 | | 3,317,525 |
|
| Principal Amount | | Value |
H.J. Heinz Co. 6.428% 12/1/08 (a)(e) | | $ 2,935,000 | | $ 2,987,977 |
Kraft Foods, Inc.: | | | | |
6.125% 2/1/18 | | 2,376,000 | | 2,394,165 |
6.875% 2/1/38 | | 3,900,000 | | 4,048,937 |
| | 12,748,604 |
Tobacco - 0.2% |
Altria Group, Inc. 7% 11/4/13 | | 505,000 | | 564,760 |
Philip Morris Companies, Inc. 7.65% 7/1/08 | | 2,500,000 | | 2,540,178 |
Reynolds American, Inc. 7.25% 6/15/37 | | 3,055,000 | | 3,087,627 |
| | 6,192,565 |
TOTAL CONSUMER STAPLES | | 39,319,292 |
ENERGY - 2.0% |
Energy Equipment & Services - 0.2% |
Petronas Capital Ltd. 7% 5/22/12 (a) | | 6,135,000 | | 6,670,224 |
Oil, Gas & Consumable Fuels - 1.8% |
Anadarko Petroleum Corp.: | | | | |
5.95% 9/15/16 | | 1,845,000 | | 1,878,634 |
6.45% 9/15/36 | | 1,155,000 | | 1,176,178 |
Devon Financing Corp. U.L.C. 6.875% 9/30/11 | | 3,000,000 | | 3,212,673 |
Duke Capital LLC: | | | | |
4.37% 3/1/09 | | 3,575,000 | | 3,546,686 |
6.25% 2/15/13 | | 855,000 | | 886,355 |
6.75% 2/15/32 | | 4,255,000 | | 4,248,286 |
Duke Energy Field Services 6.45% 11/3/36 (a) | | 3,300,000 | | 3,210,471 |
El Paso Natural Gas Co. 5.95% 4/15/17 | | 3,330,000 | | 3,286,760 |
Empresa Nacional de Petroleo 6.75% 11/15/12 (a) | | 6,135,000 | | 6,541,524 |
EnCana Holdings Finance Corp. 5.8% 5/1/14 | | 320,000 | | 327,890 |
Kinder Morgan Energy Partners LP 5.125% 11/15/14 | | 6,045,000 | | 5,889,940 |
Nakilat, Inc. 6.067% 12/31/33 (a) | | 4,015,000 | | 3,663,487 |
National Gas Co. of Trinidad & Tobago Ltd. 6.05% 1/15/36 (a) | | 925,000 | | 879,353 |
Nexen, Inc.: | | | | |
5.875% 3/10/35 | | 1,655,000 | | 1,559,358 |
6.4% 5/15/37 | | 2,125,000 | | 2,121,434 |
NGPL PipeCo LLC 6.514% 12/15/12 (a) | | 1,980,000 | | 2,010,338 |
Pemex Project Funding Master Trust: | | | | |
5.7238% 12/3/12 (a)(e) | | 410,000 | | 403,645 |
6.125% 8/15/08 | | 236,000 | | 236,732 |
6.2906% 6/15/10 (a)(e) | | 4,480,000 | | 4,497,920 |
Plains All American Pipeline LP: | | | | |
6.125% 1/15/17 | | 1,250,000 | | 1,266,823 |
Nonconvertible Bonds - continued |
| Principal Amount | | Value |
ENERGY - continued |
Oil, Gas & Consumable Fuels - continued |
Plains All American Pipeline LP: - continued | | | | |
6.65% 1/15/37 | | $ 3,190,000 | | $ 3,210,400 |
Ras Laffan Liquid Natural Gas Co. Ltd. III: | | | | |
5.832% 9/30/16 (a) | | 2,375,000 | | 2,413,428 |
6.332% 9/30/27 (a) | | 2,415,000 | | 2,288,913 |
Talisman Energy, Inc. yankee 6.25% 2/1/38 | | 1,335,000 | | 1,301,036 |
Texas Eastern Transmission LP 6% 9/15/17 (a) | | 2,434,000 | | 2,497,016 |
Transcontinental Gas Pipe Line Corp. 6.4% 4/15/16 | | 615,000 | | 625,763 |
Valero Energy Corp. 6.625% 6/15/37 | | 1,575,000 | | 1,586,140 |
| | 64,767,183 |
TOTAL ENERGY | | 71,437,407 |
FINANCIALS - 8.6% |
Capital Markets - 2.4% |
Bear Stearns Companies, Inc. 6.95% 8/10/12 | | 7,170,000 | | 7,372,194 |
BlackRock, Inc. 6.25% 9/15/17 | | 3,685,000 | | 3,793,450 |
Goldman Sachs Group, Inc.: | | | | |
5.25% 10/15/13 | | 3,770,000 | | 3,771,293 |
5.625% 1/15/17 | | 3,000,000 | | 2,929,728 |
5.7% 9/1/12 | | 2,935,000 | | 3,019,593 |
6.6% 1/15/12 | | 4,610,000 | | 4,877,375 |
6.75% 10/1/37 | | 6,705,000 | | 6,569,411 |
Janus Capital Group, Inc.: | | | | |
5.875% 9/15/11 | | 2,041,000 | | 2,062,698 |
6.25% 6/15/12 | | 6,015,000 | | 6,158,602 |
JPMorgan Chase Capital XVII 5.85% 8/1/35 | | 6,975,000 | | 5,954,076 |
JPMorgan Chase Capital XX 6.55% 9/29/36 | | 3,090,000 | | 2,788,064 |
Lazard Group LLC: | | | | |
6.85% 6/15/17 | | 3,230,000 | | 3,190,174 |
7.125% 5/15/15 | | 5,585,000 | | 5,683,363 |
Lehman Brothers Holdings, Inc.: | | | | |
6.2% 9/26/14 | | 3,100,000 | | 3,157,251 |
6.75% 12/28/17 | | 3,145,000 | | 3,241,548 |
6.875% 7/17/37 | | 3,100,000 | | 3,030,824 |
Merrill Lynch & Co., Inc. 4.25% 2/8/10 | | 7,275,000 | | 7,131,668 |
Morgan Stanley: | | | | |
4.75% 4/1/14 | | 1,500,000 | | 1,405,281 |
|
| Principal Amount | | Value |
6.6% 4/1/12 | | $ 7,695,000 | | $ 8,085,306 |
UBS AG, Stamford 5.875% 12/20/17 | | 3,145,000 | | 3,167,157 |
| | 87,389,056 |
Commercial Banks - 1.1% |
Bank of America NA: | | | | |
5.3% 3/15/17 | | 1,480,000 | | 1,439,116 |
6% 10/15/36 | | 143,000 | | 136,769 |
Credit Suisse (Guernsey) Ltd. 5.86% | | 4,785,000 | | 4,283,522 |
Export-Import Bank of Korea 5.5% 10/17/12 | | 6,570,000 | | 6,597,075 |
HSBC Holdings PLC 6.5% 9/15/37 | | 4,355,000 | | 4,220,997 |
Korea Development Bank 3.875% 3/2/09 | | 5,775,000 | | 5,719,000 |
SouthTrust Corp. 5.8% 6/15/14 | | 1,440,000 | | 1,487,015 |
Standard Chartered Bank 6.4% 9/26/17 (a) | | 4,625,000 | | 4,696,655 |
Wachovia Bank NA: | | | | |
4.875% 2/1/15 | | 4,405,000 | | 4,193,375 |
5.85% 2/1/37 | | 3,000,000 | | 2,703,402 |
Wachovia Corp. 4.875% 2/15/14 | | 785,000 | | 753,803 |
Wells Fargo & Co. 5.625% 12/11/17 | | 4,754,000 | | 4,756,905 |
| | 40,987,634 |
Consumer Finance - 1.0% |
American Express Co. 6.15% 8/28/17 | | 3,625,000 | | 3,720,243 |
American General Finance Corp. 6.9% 12/15/17 | | 2,370,000 | | 2,372,370 |
Capital One Financial Corp. 5.7% 9/15/11 | | 1,375,000 | | 1,328,334 |
Discover Financial Services 5.6625% 6/11/10 (a)(e) | | 7,050,000 | | 6,709,767 |
General Electric Capital Corp.: | | | | |
5.625% 9/15/17 | | 2,420,000 | | 2,482,862 |
6.375% 11/15/67 (e) | | 4,000,000 | | 4,129,928 |
MBNA America Bank NA 7.125% 11/15/12 | | 1,075,000 | | 1,167,936 |
MBNA Corp. 7.5% 3/15/12 | | 1,860,000 | | 2,028,737 |
SLM Corp.: | | | | |
4% 1/15/09 | | 1,020,000 | | 982,635 |
4.5% 7/26/10 | | 2,555,000 | | 2,343,441 |
5.2238% 7/27/09 (e) | | 1,064,000 | | 1,000,874 |
5.2438% 7/26/10 (e) | | 6,312,000 | | 5,810,013 |
| | 34,077,140 |
Diversified Financial Services - 0.8% |
Bank of America Corp. 7.4% 1/15/11 | | 9,125,000 | | 9,807,623 |
Citigroup, Inc.: | | | | |
5% 9/15/14 | | 1,175,000 | | 1,119,592 |
5.875% 5/29/37 | | 1,400,000 | | 1,306,568 |
JPMorgan Chase & Co.: | | | | |
4.891% 9/1/15 (e) | | 20,000 | | 19,260 |
5.6% 6/1/11 | | 127,000 | | 131,052 |
Nonconvertible Bonds - continued |
| Principal Amount | | Value |
FINANCIALS - continued |
Diversified Financial Services - continued |
JPMorgan Chase & Co.: - continued | | | | |
5.75% 1/2/13 | | $ 3,500,000 | | $ 3,566,693 |
Prime Property Funding, Inc.: | | | | |
5.125% 6/1/15 (a) | | 3,375,000 | | 3,201,849 |
5.5% 1/15/14 (a) | | 2,405,000 | | 2,393,148 |
TECO Finance, Inc. 7% 5/1/12 (a) | | 1,740,000 | | 1,842,564 |
ZFS Finance USA Trust II 6.45% 12/15/65 (a)(e) | | 3,400,000 | | 3,168,521 |
ZFS Finance USA Trust V 6.5% 5/9/67 (a)(e) | | 4,035,000 | | 3,725,064 |
| | 30,281,934 |
Insurance - 0.5% |
American International Group, Inc. 5.85% 1/16/18 | | 4,750,000 | | 4,781,103 |
Axis Capital Holdings Ltd. 5.75% 12/1/14 | | 420,000 | | 411,694 |
Lincoln National Corp. 7% 5/17/66 (e) | | 1,475,000 | | 1,480,934 |
Marsh & McLennan Companies, Inc. 7.125% 6/15/09 | | 4,259,000 | | 4,403,529 |
Principal Life Global Funding I 6.25% 2/15/12 (a) | | 2,310,000 | | 2,460,924 |
Symetra Financial Corp. 6.125% 4/1/16 (a) | | 3,855,000 | | 3,838,562 |
| | 17,376,746 |
Real Estate Investment Trusts - 2.1% |
AMB Property LP 5.9% 8/15/13 | | 2,575,000 | | 2,651,094 |
Arden Realty LP 5.25% 3/1/15 | | 625,000 | | 628,071 |
Brandywine Operating Partnership LP: | | | | |
4.5% 11/1/09 | | 1,365,000 | | 1,350,485 |
5.625% 12/15/10 | | 2,260,000 | | 2,281,931 |
5.7% 5/1/17 | | 5,000,000 | | 4,631,785 |
5.75% 4/1/12 | | 1,115,000 | | 1,103,752 |
Camden Property Trust 5.375% 12/15/13 | | 1,655,000 | | 1,600,575 |
Colonial Properties Trust: | | | | |
4.75% 2/1/10 | | 690,000 | | 673,647 |
5.5% 10/1/15 | | 6,290,000 | | 5,704,627 |
Developers Diversified Realty Corp.: | | | | |
3.875% 1/30/09 | | 1,010,000 | | 986,888 |
4.625% 8/1/10 | | 225,000 | | 219,134 |
5% 5/3/10 | | 2,435,000 | | 2,396,033 |
5.25% 4/15/11 | | 1,395,000 | | 1,376,710 |
5.375% 10/15/12 | | 1,240,000 | | 1,205,538 |
Duke Realty LP: | | | | |
4.625% 5/15/13 | | 925,000 | | 876,740 |
5.5% 3/1/16 | | 1,270,000 | | 1,202,606 |
5.625% 8/15/11 | | 2,325,000 | | 2,338,115 |
5.95% 2/15/17 | | 695,000 | | 672,823 |
|
| Principal Amount | | Value |
6.5% 1/15/18 | | $ 2,445,000 | | $ 2,458,863 |
6.95% 3/15/11 | | 1,535,000 | | 1,609,117 |
Equity One, Inc. 6% 9/15/17 | | 1,760,000 | | 1,651,887 |
Federal Realty Investment Trust 5.4% 12/1/13 | | 1,390,000 | | 1,374,130 |
Hospitality Properties Trust 5.625% 3/15/17 | | 4,210,000 | | 3,895,875 |
HRPT Properties Trust: | | | | |
5.75% 11/1/15 | | 670,000 | | 627,238 |
6.25% 6/15/17 | | 4,455,000 | | 4,182,452 |
Liberty Property LP: | | | | |
5.5% 12/15/16 | | 1,715,000 | | 1,604,595 |
6.625% 10/1/17 | | 1,850,000 | | 1,851,014 |
Mack-Cali Realty LP: | | | | |
5.05% 4/15/10 | | 1,735,000 | | 1,758,249 |
7.25% 3/15/09 | | 1,085,000 | | 1,114,196 |
Reckson Operating Partnership LP: | | | | |
5.15% 1/15/11 | | 795,000 | | 801,371 |
6% 3/31/16 | | 3,099,000 | | 2,936,303 |
Simon Property Group LP: | | | | |
4.6% 6/15/10 | | 2,965,000 | | 2,947,397 |
4.875% 8/15/10 | | 2,455,000 | | 2,432,937 |
5% 3/1/12 | | 2,060,000 | | 2,009,347 |
5.1% 6/15/15 | | 2,220,000 | | 2,087,220 |
5.375% 6/1/11 | | 2,020,000 | | 1,994,443 |
7.75% 1/20/11 | | 595,000 | | 636,752 |
UDR, Inc. 5.5% 4/1/14 | | 2,690,000 | | 2,532,431 |
United Dominion Realty Trust, Inc. 5.25% 1/15/15 | | 890,000 | | 826,918 |
Washington (REIT) 5.95% 6/15/11 | | 3,015,000 | | 2,998,059 |
| | 76,231,348 |
Real Estate Management & Development - 0.3% |
ERP Operating LP 5.5% 10/1/12 | | 1,585,000 | | 1,571,222 |
Post Apartment Homes LP 6.3% 6/1/13 | | 2,655,000 | | 2,786,385 |
Regency Centers LP: | | | | |
5.875% 6/15/17 | | 3,005,000 | | 2,903,855 |
6.75% 1/15/12 | | 2,035,000 | | 2,112,818 |
| | 9,374,280 |
Thrifts & Mortgage Finance - 0.4% |
Capmark Financial Group, Inc.: | | | | |
5.875% 5/10/12 (a) | | 3,610,000 | | 2,857,546 |
6.3% 5/10/17 (a) | | 1,400,000 | | 1,043,648 |
Independence Community Bank Corp. 3.75% 4/1/14 (e) | | 3,820,000 | | 3,772,670 |
Residential Capital LLC 8% 6/1/12 (e) | | 6,000,000 | | 3,690,000 |
Washington Mutual, Inc. 4.625% 4/1/14 | | 4,255,000 | | 3,324,440 |
| | 14,688,304 |
TOTAL FINANCIALS | | 310,406,442 |
Nonconvertible Bonds - continued |
| Principal Amount | | Value |
HEALTH CARE - 0.2% |
Pharmaceuticals - 0.2% |
AstraZeneca PLC: | | | | |
5.9% 9/15/17 | | $ 1,990,000 | | $ 2,089,609 |
6.45% 9/15/37 | | 1,485,000 | | 1,627,079 |
Teva Pharmaceutical Finance LLC 5.55% 2/1/16 | | 2,940,000 | | 2,905,276 |
| | 6,621,964 |
INDUSTRIALS - 2.1% |
Aerospace & Defense - 0.2% |
BAE Systems Holdings, Inc. 4.75% 8/15/10 (a) | | 3,465,000 | | 3,489,556 |
Bombardier, Inc.: | | | | |
6.3% 5/1/14 (a) | | 4,515,000 | | 4,413,413 |
7.45% 5/1/34 (a) | | 420,000 | | 413,700 |
| | 8,316,669 |
Airlines - 1.2% |
American Airlines, Inc. pass thru trust certificates: | | | | |
6.855% 10/15/10 | | 179,770 | | 181,118 |
6.978% 10/1/12 | | 526,026 | | 532,286 |
7.024% 4/15/11 | | 2,180,000 | | 2,188,175 |
7.858% 4/1/13 | | 3,480,000 | | 3,652,921 |
Continental Airlines, Inc. pass thru trust certificates: | | | | |
6.648% 3/15/19 | | 2,055,027 | | 2,065,302 |
6.795% 2/2/20 | | 3,717,714 | | 3,310,624 |
Delta Air Lines, Inc. pass thru trust certificates: | | | | |
6.821% 8/10/22 (a) | | 3,060,000 | | 3,083,650 |
7.57% 11/18/10 | | 5,885,000 | | 5,943,850 |
Northwest Airlines, Inc. pass thru trust certificates 7.027% 11/1/19 | | 3,024,000 | | 2,903,040 |
Southwest Airlines Co. Pass-thru Trust Certificates 6.15% 8/1/22 | | 2,400,000 | | 2,409,600 |
U.S. Airways pass thru trust certificates: | | | | |
6.85% 7/30/19 | | 1,530,452 | | 1,511,322 |
8.36% 7/20/20 | | 5,415,799 | | 5,605,352 |
United Air Lines, Inc. pass-thru certificates Class 1A, 6.636% 7/2/22 | | 2,976,818 | | 2,795,232 |
United Air Lines, Inc. pass-thru trust certificates: | | | | |
6.071% 9/1/14 | | 591,759 | | 593,978 |
6.201% 3/1/10 | | 251,421 | | 250,163 |
6.602% 9/1/13 | | 758,940 | | 759,889 |
7.032% 4/1/12 | | 1,247,669 | | 1,253,907 |
7.186% 10/1/12 | | 3,094,245 | | 3,103,528 |
| | 42,143,937 |
|
| Principal Amount | | Value |
Commercial Services & Supplies - 0.1% |
R.R. Donnelley & Sons Co. 5.5% 5/15/15 | | $ 3,395,000 | | $ 3,266,608 |
Industrial Conglomerates - 0.6% |
Covidien International Finance SA: | | | | |
5.45% 10/15/12 (a) | | 2,155,000 | | 2,218,764 |
6.55% 10/15/37 (a) | | 1,865,000 | | 1,936,870 |
General Electric Co. 5.25% 12/6/17 | | 7,130,000 | | 7,114,785 |
Hutchison Whampoa International 03/33 Ltd. 5.45% 11/24/10 (a) | | 3,600,000 | | 3,635,644 |
Hutchison Whampoa International Ltd. 6.5% 2/13/13 (a) | | 6,485,000 | | 6,817,304 |
| | 21,723,367 |
TOTAL INDUSTRIALS | | 75,450,581 |
INFORMATION TECHNOLOGY - 0.2% |
Electronic Equipment & Instruments - 0.0% |
Tyco Electronics Group SA 7.125% 10/1/37 (a) | | 1,225,000 | | 1,289,616 |
Semiconductors & Semiconductor Equipment - 0.2% |
Chartered Semiconductor Manufacturing Ltd. 5.75% 8/3/10 | | 195,000 | | 198,750 |
National Semiconductor Corp. 6.15% 6/15/12 | | 5,265,000 | | 5,367,046 |
| | 5,565,796 |
TOTAL INFORMATION TECHNOLOGY | | 6,855,412 |
MATERIALS - 0.2% |
Metals & Mining - 0.1% |
United States Steel Corp. 6.65% 6/1/37 | | 2,270,000 | | 2,024,940 |
Vale Overseas Ltd. 6.25% 1/23/17 | | 3,115,000 | | 3,124,672 |
| | 5,149,612 |
Paper & Forest Products - 0.1% |
International Paper Co. 4.25% 1/15/09 | | 1,900,000 | | 1,880,761 |
TOTAL MATERIALS | | 7,030,373 |
TELECOMMUNICATION SERVICES - 1.8% |
Diversified Telecommunication Services - 1.5% |
AT&T Broadband Corp. 8.375% 3/15/13 | | 2,150,000 | | 2,412,048 |
AT&T, Inc.: | | | | |
6.3% 1/15/38 | | 364,000 | | 369,821 |
6.8% 5/15/36 | | 10,939,000 | | 11,836,961 |
BellSouth Capital Funding Corp. 7.875% 2/15/30 | | 620,000 | | 722,285 |
British Telecommunications PLC 9.125% 12/15/30 | | 2,250,000 | | 2,978,156 |
Nonconvertible Bonds - continued |
| Principal Amount | | Value |
TELECOMMUNICATION SERVICES - continued |
Diversified Telecommunication Services - continued |
Deutsche Telekom International Finance BV 5.25% 7/22/13 | | $ 2,500,000 | | $ 2,489,947 |
SBC Communications, Inc.: | | | | |
6.15% 9/15/34 | | 1,180,000 | | 1,178,025 |
6.45% 6/15/34 | | 3,620,000 | | 3,731,022 |
Sprint Capital Corp.: | | | | |
6.875% 11/15/28 | | 5,040,000 | | 4,779,750 |
8.75% 3/15/32 | | 1,730,000 | | 1,950,053 |
Telecom Italia Capital SA: | | | | |
4.95% 9/30/14 | | 2,000,000 | | 1,926,164 |
7.2% 7/18/36 | | 3,620,000 | | 3,991,282 |
Telefonica Emisiones SAU: | | | | |
6.221% 7/3/17 | | 2,885,000 | | 2,997,492 |
7.045% 6/20/36 | | 4,335,000 | | 4,845,602 |
Verizon Communications, Inc. 6.25% 4/1/37 | | 1,380,000 | | 1,415,172 |
Verizon Global Funding Corp. 7.75% 12/1/30 | | 5,043,000 | | 5,914,743 |
Verizon New York, Inc. 6.875% 4/1/12 | | 1,095,000 | | 1,161,803 |
| | 54,700,326 |
Wireless Telecommunication Services - 0.3% |
America Movil SAB de CV 4.125% 3/1/09 | | 1,755,000 | | 1,743,952 |
AT&T Wireless Services, Inc.: | | | | |
7.875% 3/1/11 | | 740,000 | | 801,395 |
8.125% 5/1/12 | | 1,130,000 | | 1,256,468 |
Sprint Nextel Corp. 6% 12/1/16 | | 2,710,000 | | 2,595,619 |
Vodafone Group PLC 5% 12/16/13 | | 3,890,000 | | 3,824,383 |
| | 10,221,817 |
TOTAL TELECOMMUNICATION SERVICES | | 64,922,143 |
UTILITIES - 3.4% |
Electric Utilities - 1.6% |
AmerenUE 6.4% 6/15/17 | | 6,014,000 | | 6,302,786 |
Cleveland Electric Illuminating Co. 5.65% 12/15/13 | | 4,640,000 | | 4,585,995 |
Commonwealth Edison Co.: | | | | |
5.4% 12/15/11 | | 2,394,000 | | 2,419,396 |
6.15% 9/15/17 | | 2,890,000 | | 2,978,185 |
EDP Finance BV 6% 2/2/18 (a) | | 2,864,000 | | 2,793,362 |
Enel Finance International SA: | | | | |
6.25% 9/15/17 (a) | | 1,455,000 | | 1,472,335 |
6.8% 9/15/37 (a) | | 5,224,000 | | 5,248,579 |
Exelon Corp.: | | | | |
4.9% 6/15/15 | | 5,075,000 | | 4,777,184 |
6.75% 5/1/11 | | 2,230,000 | | 2,330,696 |
FirstEnergy Corp. 6.45% 11/15/11 | | 2,980,000 | | 3,077,196 |
|
| Principal Amount | | Value |
Illinois Power Co. 6.125% 11/15/17 (a) | | $ 1,465,000 | | $ 1,480,092 |
Nevada Power Co. 6.5% 5/15/18 | | 3,165,000 | | 3,228,300 |
Pennsylvania Electric Co. 6.05% 9/1/17 (a) | | 2,905,000 | | 2,887,126 |
PPL Capital Funding, Inc. 6.7% 3/30/67 (e) | | 6,230,000 | | 5,732,211 |
Progress Energy, Inc.: | | | | |
5.625% 1/15/16 | | 2,000,000 | | 1,998,806 |
7.1% 3/1/11 | | 3,277,000 | | 3,487,364 |
West Penn Power Co. 5.95% 12/15/17 (a) | | 3,275,000 | | 3,290,969 |
| | 58,090,582 |
Gas Utilities - 0.3% |
NiSource Finance Corp.: | | | | |
5.4% 7/15/14 | | 3,885,000 | | 3,805,276 |
5.45% 9/15/20 | | 2,135,000 | | 1,910,494 |
6.4% 3/15/18 | | 3,220,000 | | 3,212,758 |
7.875% 11/15/10 | | 925,000 | | 981,259 |
Texas Eastern Transmission Corp. 7.3% 12/1/10 | | 185,000 | | 198,313 |
| | 10,108,100 |
Independent Power Producers & Energy Traders - 0.5% |
Constellation Energy Group, Inc. 7% 4/1/12 | | 5,735,000 | | 6,134,271 |
Exelon Generation Co. LLC 6.2% 10/1/17 | | 5,545,000 | | 5,510,782 |
PPL Energy Supply LLC: | | | | |
5.7% 10/15/35 | | 3,030,000 | | 2,949,275 |
6.2% 5/15/16 | | 2,715,000 | | 2,726,338 |
TXU Corp. 5.55% 11/15/14 | | 980,000 | | 754,600 |
| | 18,075,266 |
Multi-Utilities - 1.0% |
Dominion Resources, Inc.: | | | | |
4.75% 12/15/10 | | 3,540,000 | | 3,546,850 |
6.25% 6/30/12 | | 1,938,000 | | 2,030,435 |
6.3% 9/30/66 (e) | | 9,255,000 | | 8,999,858 |
DTE Energy Co. 7.05% 6/1/11 | | 3,500,000 | | 3,716,566 |
MidAmerican Energy Holdings, Co.: | | | | |
5.875% 10/1/12 | | 2,880,000 | | 2,985,083 |
6.5% 9/15/37 | | 3,280,000 | | 3,425,258 |
National Grid PLC 6.3% 8/1/16 | | 7,060,000 | | 7,207,540 |
WPS Resources Corp. 6.11% 12/1/66 (e) | | 2,330,000 | | 2,145,653 |
| | 34,057,243 |
TOTAL UTILITIES | | 120,331,191 |
TOTAL NONCONVERTIBLE BONDS (Cost $752,193,620) | 746,924,455 |
U.S. Government and Government Agency Obligations - 26.0% |
| Principal Amount | | Value |
U.S. Government Agency Obligations - 2.9% |
Fannie Mae: | | | | |
3.25% 2/15/09 | | $ 3,286,000 | | $ 3,262,107 |
4.75% 11/19/12 | | 13,310,000 | | 13,775,850 |
5% 2/16/12 | | 12,000,000 | | 12,506,250 |
6.625% 9/15/09 | | 3,020,000 | | 3,169,626 |
Federal Home Loan Bank 5.375% 8/19/11 | | 8,940,000 | | 9,432,987 |
Freddie Mac: | | | | |
4% 6/12/13 | | 17,620,000 | | 17,610,820 |
4.125% 12/21/12 | | 11,690,000 | | 11,772,356 |
4.75% 3/5/09 | | 5,462,000 | | 5,515,899 |
4.75% 1/18/11 | | 9,565,000 | | 9,871,817 |
5.25% 7/18/11 | | 413,000 | | 434,011 |
5.75% 1/15/12 | | 6,410,000 | | 6,859,931 |
6.625% 9/15/09 | | 3,475,000 | | 3,647,169 |
Tennessee Valley Authority 5.375% 4/1/56 | | 2,375,000 | | 2,526,489 |
U.S. Department of Housing and Urban Development Government guaranteed participation certificates Series 1996-A, 7.63% 8/1/14 | | 2,330,000 | | 2,333,553 |
TOTAL U.S. GOVERNMENT AGENCY OBLIGATIONS | | 102,718,865 |
U.S. Treasury Inflation Protected Obligations - 6.6% |
U.S. Treasury Inflation-Indexed Notes: | | | | |
0.875% 4/15/10 | | 7,940,232 | | 7,917,264 |
2% 4/15/12 | | 10,295,700 | | 10,674,541 |
2% 1/15/14 (c) | | 158,407,408 | | 163,753,085 |
2% 7/15/14 | | 5,541,800 | | 5,726,219 |
2.375% 4/15/11 | | 19,478,860 | | 20,306,760 |
2.625% 7/15/17 | | 15,120,450 | | 16,330,494 |
3.5% 1/15/11 | | 12,003,900 | | 12,911,666 |
TOTAL U.S. TREASURY INFLATION PROTECTED OBLIGATIONS | | 237,620,029 |
U.S. Treasury Obligations - 16.5% |
U.S. Treasury Bonds 6.25% 5/15/30 | | 46,558,000 | | 58,102,941 |
U.S. Treasury Notes: | | | | |
3.375% 11/30/12 (b) | | 185,367,000 | | 184,729,871 |
4.25% 8/15/13 (c) | | 49,752,000 | | 51,567,152 |
4.25% 8/15/14 (c) | | 130,000,000 | | 134,417,920 |
|
| Principal Amount | | Value |
4.5% 4/30/12 | | $ 67,557,000 | | $ 70,570,650 |
4.875% 6/30/12 | | 86,080,000 | | 91,298,600 |
TOTAL U.S. TREASURY OBLIGATIONS | | 590,687,134 |
TOTAL U.S. GOVERNMENT AND GOVERNMENT AGENCY OBLIGATIONS (Cost $897,703,491) | 931,026,028 |
U.S. Government Agency - Mortgage Securities - 31.9% |
|
Fannie Mae - 26.6% |
3.751% 10/1/33 (e) | | 250,661 | | 250,744 |
3.783% 6/1/34 (e) | | 1,271,438 | | 1,265,332 |
3.797% 6/1/33 (e) | | 211,755 | | 212,596 |
3.817% 10/1/33 (e) | | 2,915,700 | | 2,911,001 |
3.844% 10/1/33 (e) | | 6,016,793 | | 6,058,484 |
3.915% 5/1/33 (e) | | 67,394 | | 68,042 |
4% 8/1/18 to 6/1/19 | | 3,409,110 | | 3,288,170 |
4.062% 10/1/18 (e) | | 173,567 | | 173,966 |
4.076% 4/1/34 (e) | | 4,319,204 | | 4,304,447 |
4.104% 1/1/35 (e) | | 378,279 | | 383,401 |
4.105% 2/1/35 (e) | | 127,082 | | 128,666 |
4.172% 1/1/35 (e) | | 567,874 | | 565,559 |
4.25% 2/1/35 (e) | | 264,254 | | 263,453 |
4.263% 10/1/33 (e) | | 104,136 | | 104,804 |
4.268% 6/1/33 (e) | | 115,165 | | 116,481 |
4.288% 3/1/33 (e) | | 222,631 | | 225,293 |
4.294% 3/1/35 (e) | | 235,747 | | 237,156 |
4.299% 3/1/33 (e) | | 142,873 | | 142,414 |
4.299% 4/1/35 (e) | | 117,765 | | 119,138 |
4.336% 8/1/33 (e) | | 436,463 | | 437,954 |
4.341% 5/1/35 (e) | | 239,477 | | 242,627 |
4.345% 1/1/35 (e) | | 295,544 | | 295,415 |
4.363% 2/1/34 (e) | | 510,801 | | 512,029 |
4.391% 2/1/35 (e) | | 429,005 | | 428,508 |
4.406% 5/1/35 (e) | | 198,729 | | 200,799 |
4.421% 8/1/34 (e) | | 726,832 | | 727,553 |
4.434% 3/1/35 (e) | | 396,392 | | 396,123 |
4.478% 1/1/35 (e) | | 296,134 | | 295,765 |
4.479% 3/1/35 (e) | | 876,404 | | 876,919 |
4.5% 4/1/18 to 10/1/35 | | 93,234,260 | | 90,337,102 |
4.5% 1/1/23 (b) | | 12,000,000 | | 11,812,897 |
4.5% 1/1/23 (b) | | 4,000,000 | | 3,937,632 |
4.501% 2/1/35 (e) | | 3,639,890 | | 3,642,318 |
4.504% 3/1/35 (e) | | 866,175 | | 866,713 |
4.529% 7/1/35 (e) | | 833,944 | | 839,744 |
4.53% 2/1/35 (e) | | 193,749 | | 196,223 |
4.531% 5/1/35 (e) | | 675,969 | | 678,479 |
4.539% 2/1/35 (e) | | 1,193,611 | | 1,212,537 |
4.565% 11/1/34 (e) | | 713,844 | | 714,234 |
U.S. Government Agency - Mortgage Securities - continued |
| Principal Amount | | Value |
Fannie Mae - continued |
4.565% 2/1/35 (e) | | $ 2,646,015 | | $ 2,649,725 |
4.569% 10/1/35 (e) | | 58,827 | | 59,150 |
4.57% 7/1/35 (e) | | 854,791 | | 858,233 |
4.598% 2/1/35 (e) | | 707,073 | | 708,286 |
4.598% 2/1/35 (e) | | 96,307 | | 97,801 |
4.603% 9/1/34 (e) | | 777,922 | | 779,701 |
4.622% 4/1/33 (e) | | 50,301 | | 50,790 |
4.628% 2/1/35 (e) | | 8,738,700 | | 8,762,487 |
4.665% 11/1/34 (e) | | 884,178 | | 887,247 |
4.665% 5/1/35 (e) | | 3,564,746 | | 3,599,502 |
4.678% 3/1/35 (e) | | 1,617,423 | | 1,641,960 |
4.693% 10/1/34 (e) | | 868,061 | | 870,343 |
4.714% 7/1/34 (e) | | 711,430 | | 714,347 |
4.721% 12/1/34 (e) | | 569,659 | | 571,324 |
4.721% 3/1/35 (e) | | 66,707 | | 67,775 |
4.77% 12/1/34 (e) | | 229,198 | | 229,805 |
4.796% 11/1/34 (e) | | 679,043 | | 681,529 |
4.799% 6/1/35 (e) | | 1,088,200 | | 1,098,252 |
4.857% 10/1/34 (e) | | 2,857,081 | | 2,872,670 |
4.87% 5/1/33 (e) | | 6,751 | | 6,871 |
5% 10/1/17 to 8/1/35 | | 61,819,635 | | 61,444,810 |
5% 1/1/23 (b) | | 33,000,000 | | 33,031,796 |
5% 1/1/38 (b) | | 40,000,000 | | 39,032,692 |
5% 1/1/38 (b) | | 25,000,000 | | 24,395,433 |
5% 1/1/38 (b) | | 50,000,000 | | 48,790,865 |
5.016% 7/1/34 (e) | | 118,882 | | 119,586 |
5.033% 8/1/34 (e) | | 181,841 | | 182,151 |
5.042% 5/1/35 (e) | | 1,357,806 | | 1,376,229 |
5.067% 9/1/34 (e) | | 1,920,806 | | 1,933,247 |
5.095% 5/1/35 (e) | | 3,494,313 | | 3,541,914 |
5.144% 5/1/35 (e) | | 851,823 | | 860,146 |
5.156% 5/1/35 (e) | | 2,517,812 | | 2,542,615 |
5.18% 6/1/35 (e) | | 970,522 | | 983,487 |
5.184% 8/1/33 (e) | | 319,360 | | 321,818 |
5.194% 5/1/35 (e) | | 2,846,700 | | 2,878,407 |
5.299% 2/1/36 (e) | | 3,235,912 | | 3,278,684 |
5.31% 12/1/35 (e) | | 1,577,988 | | 1,597,413 |
5.315% 7/1/35 (e) | | 124,159 | | 125,722 |
5.462% 2/1/36 (e) | | 4,637,644 | | 4,700,391 |
5.5% 6/1/09 to 12/1/37 | | 299,612,954 | | 299,887,037 |
5.559% 9/1/36 (e) | | 1,639,686 | | 1,659,738 |
5.609% 1/1/36 (e) | | 1,378,302 | | 1,399,612 |
5.648% 7/1/37 (e) | | 915,485 | | 929,966 |
5.668% 9/1/35 (e) | | 1,300,823 | | 1,320,733 |
5.792% 2/1/36 (e) | | 751,678 | | 765,627 |
5.8% 1/1/36 (e) | | 850,298 | | 865,250 |
6% 6/1/14 to 12/1/37 | | 187,074,960 | | 190,119,796 |
6% 1/1/23 (b) | | 3,000,000 | | 3,070,052 |
6.035% 4/1/36 (e) | | 657,344 | | 671,134 |
|
| Principal Amount | | Value |
6.224% 6/1/36 (e) | | $ 329,199 | | $ 334,155 |
6.32% 4/1/36 (e) | | 599,077 | | 612,669 |
6.5% 6/1/11 to 7/1/34 | | 41,111,938 | | 42,521,501 |
6.561% 9/1/36 (e) | | 3,773,567 | | 3,876,117 |
7% 3/1/15 to 8/1/32 | | 3,441,166 | | 3,633,386 |
7.5% 8/1/08 to 11/1/31 | | 2,774,040 | | 2,994,868 |
8% 1/1/30 to 5/1/30 | | 69,490 | | 75,527 |
8.5% 3/1/25 to 6/1/25 | | 1,273 | | 1,405 |
TOTAL FANNIE MAE | | 952,554,495 |
Freddie Mac - 3.6% |
4% 2/1/20 | | 3,497,572 | | 3,363,908 |
4.103% 1/1/35 (e) | | 764,673 | | 770,082 |
4.299% 12/1/34 (e) | | 371,282 | | 369,559 |
4.306% 3/1/35 (e) | | 289,255 | | 290,111 |
4.314% 2/1/35 (e) | | 593,879 | | 596,012 |
4.332% 3/1/35 (e) | | 599,822 | | 597,055 |
4.374% 2/1/35 (e) | | 724,100 | | 720,777 |
4.413% 6/1/35 (e) | | 416,421 | | 419,025 |
4.417% 2/1/34 (e) | | 294,532 | | 293,263 |
4.423% 3/1/35 (e) | | 417,370 | | 415,521 |
4.45% 3/1/35 (e) | | 372,760 | | 371,389 |
4.5% 5/1/19 | | 39,050 | | 38,501 |
4.54% 2/1/35 (e) | | 672,626 | | 671,037 |
4.774% 10/1/34 (e) | | 1,127,351 | | 1,129,246 |
4.803% 3/1/33 (e) | | 104,801 | | 106,354 |
4.816% 9/1/34 (e) | | 548,735 | | 550,313 |
5% 4/1/35 (e) | | 1,554,888 | | 1,573,367 |
5.13% 4/1/35 (e) | | 1,602,334 | | 1,613,216 |
5.278% 3/1/36 (e) | | 580,510 | | 583,950 |
5.433% 11/1/35 (e) | | 790,321 | | 798,620 |
5.53% 1/1/36 (e) | | 2,112,644 | | 2,134,537 |
5.758% 10/1/35 (e) | | 574,303 | | 581,715 |
5.847% 6/1/36 (e) | | 754,212 | | 765,280 |
6% 5/1/33 to 11/1/37 | | 93,926,770 | | 95,345,365 |
6.031% 7/1/37 (e) | | 3,849,504 | | 3,900,652 |
6.046% 6/1/36 (e) | | 719,856 | | 729,967 |
6.095% 4/1/36 (e) | | 1,164,187 | | 1,183,765 |
6.107% 6/1/36 (e) | | 676,640 | | 689,386 |
6.455% 10/1/36 (e) | | 3,802,162 | | 3,873,894 |
6.624% 7/1/36 (e) | | 5,034,811 | | 5,154,655 |
6.71% 8/1/36 (e) | | 643,288 | | 657,625 |
7.5% 5/1/17 to 11/1/31 | | 316,117 | | 338,420 |
8% 7/1/17 to 5/1/27 | | 42,848 | | 46,412 |
8.5% 3/1/20 to 1/1/28 | | 185,143 | | 204,130 |
TOTAL FREDDIE MAC | | 130,877,109 |
Government National Mortgage Association - 1.7% |
4.5% 2/20/37 (e) | | 7,472,941 | | 7,447,705 |
4.75% 1/20/34 (e) | | 1,616,985 | | 1,624,445 |
U.S. Government Agency - Mortgage Securities - continued |
| Principal Amount | | Value |
Government National Mortgage Association - continued |
5.25% 7/20/34 (e) | | $ 482,348 | | $ 487,137 |
6% 8/15/08 to 8/15/29 | | 604,495 | | 624,560 |
6.5% 6/15/08 to 10/15/37 | | 41,176,181 | | 42,714,654 |
7% 1/15/28 to 11/15/32 | | 6,034,300 | | 6,331,216 |
7.5% 4/15/22 to 10/15/28 | | 1,361,626 | | 1,454,548 |
8% 2/15/17 to 11/15/30 | | 150,199 | | 163,833 |
8.5% 12/15/16 to 3/15/30 | | 60,204 | | 66,380 |
TOTAL GOVERNMENT NATIONAL MORTGAGE ASSOCIATION | | 60,914,478 |
TOTAL U.S. GOVERNMENT AGENCY - MORTGAGE SECURITIES (Cost $1,134,217,218) | 1,144,346,082 |
Asset-Backed Securities - 2.8% |
|
ACE Securities Corp. Home Equity Loan Trust Series 2005-SD1 Class A1, 5.265% 11/25/50 (e) | | 185,233 | | 156,840 |
Aesop Funding II LLC Series 2005-1A Class A1, 3.95% 4/20/08 (a) | | 800,000 | | 798,798 |
Airspeed Ltd. Series 2007-1A Class C1, 7.5275% 4/15/24 (a)(e) | | 3,011,799 | | 2,891,327 |
AmeriCredit Automobile Receivables Trust Series 2006-1: | | | | |
Class A3, 5.11% 10/6/10 | | 65,149 | | 65,087 |
Class B1, 5.2% 3/6/11 | | 305,000 | | 302,653 |
Class C1, 5.28% 11/6/11 | | 1,850,000 | | 1,819,915 |
Class E1, 6.62% 5/6/13 (a) | | 527,272 | | 521,999 |
Amortizing Residential Collateral Trust Series 2002-BC1 Class M2, 5.965% 1/25/32 (e) | | 129,113 | | 123,086 |
ARG Funding Corp. Series 2005-1A Class A1, 4.02% 4/20/09 (a) | | 866,667 | | 865,594 |
Argent Securities, Inc. Series 2004-W5 Class M1, 5.465% 4/25/34 (e) | | 1,730,000 | | 1,570,090 |
Capital Auto Receivables Asset Trust: | | | | |
Series 2006-1: | | | | |
Class A3, 5.03% 10/15/09 | | 868,417 | | 868,916 |
Class B, 5.26% 10/15/10 | | 945,000 | | 955,733 |
Class C, 5.55% 1/18/11 | | 5,965,000 | | 6,054,221 |
Class D, 7.16% 1/15/13 (a) | | 645,000 | | 652,231 |
Series 2006-SN1A: | | | | |
Class B, 5.5% 4/20/10 (a) | | 445,000 | | 448,599 |
Class C, 5.77% 5/20/10 (a) | | 430,000 | | 431,449 |
Class D, 6.15% 4/20/11 (a) | | 725,000 | | 726,122 |
Series 2007-SN1: | | | | |
Class B, 5.52% 3/15/11 | | 1,140,000 | | 1,133,410 |
Class C, 5.73% 3/15/11 | | 660,000 | | 662,346 |
|
| Principal Amount | | Value |
Class D, 6.05% 1/17/12 | | $ 1,630,000 | | $ 1,629,950 |
Capital One Multi-Asset Execution Trust Series 2004-6 Class B, 4.15% 7/16/12 | | 4,465,000 | | 4,415,917 |
CarMax Auto Owner Trust Series 2007-2 Class C, 5.61% 11/15/13 | | 4,260,000 | | 4,178,513 |
Carrington Mortgage Loan Trust Series 2006-NC3 Class M10, 6.865% 8/25/36 (a)(e) | | 255,000 | | 33,150 |
Cendant Timeshare Receivables Funding LLC Series 2005-1A Class A1, 4.67% 5/20/17 (a) | | 653,534 | | 641,794 |
CIT Equipment Collateral Trust Series 2006-VT1 Class A3, 5.13% 12/21/08 | | 2,245,142 | | 2,252,429 |
Citibank Credit Card Issuance Trust: | | | | |
Series 2005-B1 Class B1, 4.4% 9/15/10 | | 5,120,000 | | 5,104,394 |
Series 2006-B2 Class B2, 5.15% 3/7/11 | | 2,270,000 | | 2,273,369 |
Series 2007-B6 Class B6, 5.03% 11/8/12 | | 7,680,000 | | 7,701,300 |
CNH Equipment Trust Series 2006-A Class A3, 5.2% 8/16/10 | | 2,332,273 | | 2,334,913 |
Crown Castle Towers LLC/Crown Atlantic Holdings Sub LLC/Crown Communication, Inc. Series 2005-1A: | | | | |
Class B, 4.878% 6/15/35 (a) | | 2,052,000 | | 2,020,892 |
Class C, 5.074% 6/15/35 (a) | | 1,862,000 | | 1,818,653 |
DB Master Finance LLC Series 2006-1 Class M1, 8.285% 6/20/31 (a) | | 840,000 | | 848,511 |
Drive Auto Receivables Trust Series 2006-2 Class A3, 5.33% 4/15/14 (a) | | 4,995,000 | | 5,024,444 |
DT Auto Owner Trust Series 2007-A Class A3, 5.6% 3/15/13 (a) | | 5,175,000 | | 5,099,801 |
Ford Credit Auto Owner Trust: | | | | |
Series 2006-A Class A3, 5.05% 11/15/09 | | 1,634,064 | | 1,636,733 |
Series 2006-B Class D, 7.26% 2/15/13 (a) | | 1,025,000 | | 975,330 |
GSAMP Trust Series 2004-AR1 Class B4, 5% 6/25/34 (a)(e) | | 301,611 | | 180,967 |
Hyundai Auto Receivables Trust: | | | | |
Series 2004-1 Class A4, 5.26% 11/15/12 | | 2,010,000 | | 2,029,307 |
Series 2006-1: | | | | |
Class A3, 5.13% 6/15/10 | | 501,418 | | 502,497 |
Class B, 5.29% 11/15/12 | | 308,454 | | 309,878 |
Class C, 5.34% 11/15/12 | | 396,583 | | 393,809 |
Leafs CMBS I Ltd./Leafs CMBS I Corp. Series 2002-1A: | | | | |
Class B, 4.13% 11/20/37 (a) | | 3,860,000 | | 3,588,789 |
Class C, 4.13% 11/20/37 (a) | | 3,760,000 | | 3,290,203 |
Asset-Backed Securities - continued |
| Principal Amount | | Value |
Long Beach Mortgage Loan Trust Series 2004-2 Class M1, 5.395% 6/25/34 (e) | | $ 525,000 | | $ 464,756 |
Merna Reinsurance Ltd. Series 2007-1 Class B, 6.58% 6/30/12 (a)(e) | | 3,285,000 | | 3,245,252 |
National Collegiate Student Loan Trust Series 2005-GT1 Class AIO, 6.75% 12/25/09 (g) | | 1,750,000 | | 219,570 |
Park Place Securities, Inc. Series 2005-WCH1 Class M2, 5.385% 1/25/35 (e) | | 1,700,000 | | 1,423,687 |
Pinnacle Capital Asset Trust Series 2006-A: | | | | |
Class B, 5.51% 9/25/09 (a) | | 1,460,000 | | 1,460,824 |
Class C, 5.77% 5/25/10 (a) | | 1,355,000 | | 1,356,647 |
Providian Master Note Trust Series 2006-B1A Class B1, 5.35% 3/15/13 (a) | | 4,570,000 | | 4,536,473 |
Specialty Underwriting & Residential Finance Trust Series 2003-BC4 Class M1, 5.465% 11/25/34 (e) | | 685,000 | | 577,697 |
Swift Master Auto Receivables Trust Series 2007-1: | | | | |
Class B, 5.2475% 6/15/12 (e) | | 2,235,000 | | 2,168,689 |
Class C, 5.5275% 6/15/12 (e) | | 1,335,000 | | 1,298,427 |
Wachovia Auto Loan Trust Series 2006-2A Class A4, 5.23% 3/20/12 (a) | | 4,000,000 | | 3,999,978 |
World Omni Auto Receivables Trust Series 2006-A Class A3, 5.01% 10/15/10 | | 1,381,022 | | 1,382,994 |
TOTAL ASSET-BACKED SECURITIES (Cost $102,913,160) | 101,468,953 |
Collateralized Mortgage Obligations - 5.5% |
|
Private Sponsor - 2.4% |
Banc of America Commercial Mortgage Trust Series 2007-2: | | | | |
Class B, 5.6984% 4/10/17 | | 485,000 | | 445,312 |
Class C, 5.6984% 4/10/17 | | 1,290,000 | | 1,168,298 |
Class D, 5.6984% 5/10/17 | | 650,000 | | 560,557 |
Banc of America Mortgage Securities, Inc.: | | | | |
Series 2004-J Class 2A1, 4.7598% 11/25/34 (e) | | 1,661,300 | | 1,633,919 |
Series 2005-E Class 2A7, 4.6074% 6/25/35 (e) | | 2,680,000 | | 2,615,450 |
Chase Mortgage Finance Trust: | | | | |
Series 2007-A1 Class 1A5, 4.3552% 2/25/37 (e) | | 333,523 | | 328,598 |
Series 2007-A2 Class 3A1, 4.5604% 7/25/37 (e) | | 8,075,473 | | 7,954,260 |
|
| Principal Amount | | Value |
Citigroup Mortgage Loan Trust Series 2004-UST1 Class A4, 4.4065% 8/25/34 (e) | | $ 4,395,632 | | $ 4,315,671 |
Credit Suisse First Boston Mortgage Securities Corp. floater Series 2007-AR7 Class 2A1, 4.6276% 11/25/34 (e) | | 1,739,471 | | 1,710,202 |
GSR Mortgage Loan Trust Series 2007-AR2 Class 2A1, 4.836% 4/25/35 (e) | | 1,720,491 | | 1,693,725 |
Holmes Master Issuer PLC floater Series 2007-2A Class 2C1, 5.6525% 7/15/40 (e) | | 1,950,000 | | 1,800,045 |
JPMorgan Chase Commercial Mortgage Securities Trust Series 2007-CB18 Class A3, 5.447% 6/12/47 (e) | | 6,185,000 | | 6,160,707 |
JPMorgan Mortgage Trust: | | | | |
sequential payer Series 2006-A3 Class 3A3, 5.7408% 5/25/36 (e) | | 7,815,000 | | 7,568,829 |
Series 2005-A8 Class 2A3, 4.9484% 11/25/35 (e) | | 760,000 | | 744,518 |
Series 2006-A3 Class 6A1, 3.768% 8/25/34 (e) | | 2,613,600 | | 2,549,039 |
Series 2007-A1 Class 3A2, 5.0057% 7/25/35 (e) | | 8,876,637 | | 8,760,132 |
MASTR Alternative Loan Trust Series 2004-3 Class 3A1, 6% 4/25/34 | | 421,791 | | 424,163 |
Merrill Lynch/Countrywide Commercial Mortgage Trust Series 2006-3 Class ASB, 5.382% 7/12/46 (e) | | 4,570,000 | | 4,591,156 |
Provident Funding Mortgage Loan Trust Series 2005-2 Class 3A, 4.6502% 10/25/35 (e) | | 3,490,790 | | 3,449,092 |
RESI Finance LP/RESI Finance DE Corp. floater Series 2003-CB1: | | | | |
Class B4, 6.8925% 6/10/35 (a)(e) | | 1,010,129 | | 952,087 |
Class B5, 7.4925% 6/10/35 (a)(e) | | 690,179 | | 647,178 |
Class B6, 7.9925% 6/10/35 (a)(e) | | 406,794 | | 366,496 |
Residential Asset Mortgage Products, Inc. sequential payer Series 2004-SL2 Class A1, 6.5% 10/25/16 | | 208,689 | | 214,405 |
Wachovia Mortgage Loan Trust LLC Series 2005-B Class 2A4, 5.169% 10/20/35 (e) | | 605,000 | | 595,934 |
Wells Fargo Mortgage Backed Securities Trust: | | | | |
sequential payer Series 2006-AR13 Class A4, 5.7599% 9/25/36 (e) | | 2,890,000 | | 2,874,807 |
Series 2005-AR10 Class 2A2, 4.1099% 6/25/35 (e) | | 4,078,435 | | 3,988,374 |
Series 2005-AR12 Class 2A6, 4.3221% 7/25/35 (e) | | 6,503,380 | | 6,373,404 |
Collateralized Mortgage Obligations - continued |
| Principal Amount | | Value |
Private Sponsor - continued |
Wells Fargo Mortgage Backed Securities Trust: - continued | | | | |
Series 2005-AR3 Class 2A1, 4.1973% 3/25/35 (e) | | $ 859,371 | | $ 852,501 |
Series 2005-AR4 Class 2A2, 4.5237% 4/25/35 (e) | | 3,351,638 | | 3,286,241 |
Series 2006-AR8 Class 2A6, 5.2378% 4/25/36 (e) | | 6,240,000 | | 6,168,023 |
TOTAL PRIVATE SPONSOR | | 84,793,123 |
U.S. Government Agency - 3.1% |
Fannie Mae planned amortization class: | | | | |
Series 1999-54 Class PH, 6.5% 11/18/29 | | 3,400,000 | | 3,521,563 |
Series 1999-57 Class PH, 6.5% 12/25/29 | | 2,391,401 | | 2,491,613 |
Fannie Mae Grantor Trust floater Series 2005-90 Class FG, 5.115% 10/25/35 (e) | | 2,579,946 | | 2,565,416 |
Fannie Mae subordinate REMIC pass-thru certificates: | | | | |
planned amortization class: | | | | |
Series 2001-68 Class QZ, 5.5% 12/25/16 | | 2,485,397 | | 2,512,256 |
Series 2002-9 Class PC, 6% 3/25/17 | | 458,426 | | 468,488 |
Series 2004-81: | | | | |
Class KC, 4.5% 4/25/17 | | 11,215,000 | | 11,208,398 |
Class KD, 4.5% 7/25/18 | | 2,625,000 | | 2,604,108 |
sequential payer: | | | | |
Series 2004-3 Class BA, 4% 7/25/17 | | 205,674 | | 202,630 |
Series 2004-86 Class KC, 4.5% 5/25/19 | | 939,821 | | 931,646 |
Series 2004-91 Class AH, 4.5% 5/25/29 | | 1,983,917 | | 1,967,541 |
Freddie Mac planned amortization class Series 3033 Class UD, 5.5% 10/15/30 | | 1,910,000 | | 1,944,128 |
Freddie Mac Multi-class participation certificates guaranteed: | | | | |
planned amortization class: | | | | |
Series 2500 Class TE, 5.5% 9/15/17 | | 10,275,186 | | 10,509,717 |
Series 2677 Class LD, 4.5% 3/15/17 | | 8,800,218 | | 8,770,450 |
Series 2695 Class GC, 4.5% 11/15/18 | | 7,215,000 | | 7,216,472 |
Series 2702 Class WB, 5% 4/15/17 | | 2,947,632 | | 2,951,481 |
Series 2770 Class UD, 4.5% 5/15/17 | | 7,473,000 | | 7,448,651 |
|
| Principal Amount | | Value |
Series 2885 Class PC, 4.5% 3/15/18 | | $ 2,560,000 | | $ 2,547,986 |
Series 3018 Class UD, 5.5% 9/15/30 | | 2,825,000 | | 2,875,295 |
Series 3049 Class DB, 5.5% 6/15/31 | | 4,440,000 | | 4,519,327 |
Series 3117 Class PC, 5% 6/15/31 | | 20,000,000 | | 20,148,732 |
sequential payer: | | | | |
Series 2508 Class CK, 5% 10/15/17 | | 10,000,000 | | 10,000,369 |
Series 2528 Class HN, 5% 11/15/17 | | 3,195,000 | | 3,188,642 |
Series 2750 Class ZT, 5% 2/15/34 | | 2,348,922 | | 2,161,903 |
Ginnie Mae guaranteed REMIC pass-thru securities Series 2007-35 Class SC, 10.035% 6/16/37 (e) | | 273,286 | | 346,807 |
TOTAL U.S. GOVERNMENT AGENCY | | 113,103,619 |
TOTAL COLLATERALIZED MORTGAGE OBLIGATIONS (Cost $196,677,891) | 197,896,742 |
Commercial Mortgage Securities - 7.6% |
|
Asset Securitization Corp. Series 1997-D5: | | | | |
Class A2, 7.055% 2/14/43 (e) | | 1,435,000 | | 1,558,255 |
Class A3, 7.105% 2/14/43 (e) | | 1,545,000 | | 1,652,909 |
Banc of America Commercial Mortgage Trust: | | | | |
sequential payer: | | | | |
Series 2006-2 Class AAB, 5.9118% 5/10/45 (e) | | 2,100,000 | | 2,153,520 |
Series 2006-5: | | | | |
Class A2, 5.317% 10/10/11 | | 8,745,000 | | 8,774,495 |
Class A3, 5.39% 2/10/14 | | 1,985,000 | | 1,984,485 |
Series 2007-2 Class A1, 5.421% 1/10/12 | | 2,229,525 | | 2,249,504 |
Series 2007-3 Class A3, 5.8378% 6/10/49 (e) | | 6,100,000 | | 6,186,244 |
Banc of America Commercial Mortgage, Inc.: | | | | |
sequential payer Series 2005-1 Class A3, 4.877% 11/10/42 | | 3,855,000 | | 3,844,665 |
Series 2001-3 Class H, 6.562% 4/11/37 (a) | | 4,889,139 | | 5,189,000 |
Bayview Commercial Asset Trust floater: | | | | |
Series 2007-2A: | | | | |
Class B1, 6.465% 7/25/37 (a)(e) | | 212,387 | | 163,007 |
Class B2, 7.115% 7/25/37 (a)(e) | | 183,425 | | 128,483 |
Commercial Mortgage Securities - continued |
| Principal Amount | | Value |
Bayview Commercial Asset Trust floater: - continued | | | | |
Series 2007-2A: | | | | |
Class B3, 8.215% 7/25/37 (a)(e) | | $ 207,560 | | $ 147,594 |
Class M2, 5.275% 7/25/37 (a)(e) | | 125,501 | | 115,775 |
Class M3, 5.355% 7/25/37 (a)(e) | | 125,501 | | 115,226 |
Class M4, 5.515% 7/25/37 (a)(e) | | 265,483 | | 226,864 |
Class M5, 5.615% 7/25/37 (a)(e) | | 236,521 | | 197,200 |
Class M6, 5.865% 7/25/37 (a)(e) | | 294,445 | | 242,135 |
Series 2007-3: | | | | |
Class B1, 5.815% 7/25/37 (a)(e) | | 202,005 | | 196,955 |
Class B2, 6.465% 7/25/37 (a)(e) | | 532,560 | | 519,246 |
Class B3, 8.865% 7/25/37 (a)(e) | | 270,871 | | 262,745 |
Class M1, 5.175% 7/25/37 (a)(e) | | 179,050 | | 177,260 |
Class M2, 5.205% 7/25/37 (a)(e) | | 188,232 | | 186,350 |
Class M3, 5.235% 7/25/37 (a)(e) | | 307,599 | | 304,139 |
Class M4, 5.365% 7/25/37 (a)(e) | | 486,649 | | 479,350 |
Class M5, 5.465% 7/25/37 (a)(e) | | 243,325 | | 238,458 |
Class M6, 5.665% 7/25/37 (a)(e) | | 183,641 | | 179,968 |
Series 2007-4A: | | | | |
Class B1, 7.415% 9/25/37 (a)(e) | | 284,516 | | 214,232 |
Class B2, 8.315% 9/25/37 (a)(e) | | 1,079,200 | | 788,997 |
Class M4, 6.465% 9/25/37 (a)(e) | | 706,386 | | 614,666 |
Class M5, 6.615% 9/25/37 (a)(e) | | 706,386 | | 611,465 |
Class M6, 6.815% 9/25/37 (a)(e) | | 706,386 | | 599,103 |
Bear Stearns Commercial Mortgage Securities Trust: | | | | |
sequential payer Series 2007-PW16 Class AM, 5.7129% 6/11/40 | | 1,898,000 | | 1,904,530 |
Series 2006-PW13 Class A3, 5.518% 9/11/41 | | 2,010,000 | | 2,022,459 |
Series 2007-PW15: | | | | |
Class A1, 5.016% 2/11/44 | | 1,987,240 | | 1,986,962 |
Class X2, 0.5584% 2/11/44 (a)(e)(g) | | 146,305,000 | | 2,597,075 |
|
| Principal Amount | | Value |
Series 2007-PW16: | | | | |
Class B, 5.713% 6/11/40 (a) | | $ 1,405,000 | | $ 1,306,026 |
Class C, 5.713% 6/11/40 (a) | | 1,170,000 | | 1,065,138 |
Class D, 5.713% 6/11/40 (a) | | 1,170,000 | | 1,050,500 |
Chase Commercial Mortgage Securities Corp. Series 2001-245 Class A2, 6.4842% 2/12/16 (a)(e) | | 1,345,000 | | 1,408,463 |
Chase Manhattan Bank-First Union National Bank Commercial Mortgage Trust sequential payer Series 1999-1 Class A2, 7.439% 8/15/31 | | 4,671,543 | | 4,831,781 |
Citigroup Commercial Mortgage Trust Series 2007-C6 Class A1, 5.622% 12/10/49 (e) | | 6,030,748 | | 6,112,561 |
Citigroup/Deutsche Bank Commercial Mortgage Trust Series 2007-CD4 Class A3, 5.293% 12/11/49 | | 5,940,000 | | 5,900,860 |
COMM Series 2004-LBN2 Class X2, 1.0925% 3/10/39 (a)(e)(g) | | 5,978,266 | | 120,813 |
COMM pass-thru certificates sequential payer Series 2006-CN2A Class A2FX, 5.449% 2/5/19 | | 2,745,000 | | 2,772,795 |
Credit Suisse Commercial Mortgage Trust: | | | | |
Series 2006-C4 Class AAB, 5.439% 9/15/39 | | 5,350,000 | | 5,389,581 |
Series 2007-C5 Class A4, 5.695% 9/15/40 (e) | | 2,750,000 | | 2,799,222 |
Credit Suisse First Boston Mortgage Securities Corp.: | | | | |
sequential payer: | | | | |
Series 1999-C1 Class A2, 7.29% 9/15/41 | | 4,311,682 | | 4,441,589 |
Series 2000-C1 Class A2, 7.545% 4/15/62 | | 1,600,000 | | 1,672,242 |
Series 2004-C1: | | | | |
Class A3, 4.321% 1/15/37 | | 2,235,000 | | 2,216,525 |
Class A4, 4.75% 1/15/37 | | 3,035,000 | | 2,999,911 |
Series 1997-C2 Class D, 7.27% 1/17/35 | | 1,058,394 | | 1,061,456 |
Series 1998-C1: | | | | |
Class C, 6.78% 5/17/40 | | 5,000,000 | | 5,052,353 |
Class D, 7.17% 5/17/40 | | 595,000 | | 628,132 |
Series 2001-CKN5 Class AX, 0.9731% 9/15/34 (a)(e)(g) | | 26,802,417 | | 1,282,957 |
Series 2002-CP3 Class G, 6.639% 7/15/35 (a) | | 250,000 | | 259,604 |
Series 2004-C1 Class ASP, 0.9487% 1/15/37 (a)(e)(g) | | 29,710,838 | | 625,134 |
Series 2006-C1 Class A3, 5.711% 2/15/39 (e) | | 3,895,000 | | 3,941,502 |
Commercial Mortgage Securities - continued |
| Principal Amount | | Value |
Credit Suisse Mortgage Capital Certificates sequential payer Series 2007-C1 Class A1, 5.227% 2/15/40 | | $ 1,421,435 | | $ 1,425,496 |
Deutsche Mortgage & Asset Receiving Corp. sequential payer Series 1998-C1 Class D, 7.231% 6/15/31 | | 4,940,000 | | 4,939,693 |
DLJ Commercial Mortgage Corp. sequential payer Series 2000-CF1 Class A1B, 7.62% 6/10/33 | | 3,406,273 | | 3,599,277 |
GE Capital Commercial Mortgage Corp. sequential payer Series 2007-C1 Class A4, 5.543% 2/10/17 | | 3,720,000 | | 3,762,091 |
Ginnie Mae guaranteed REMIC pass-thru securities sequential payer Series 2003-22 Class B, 3.963% 5/16/32 | | 3,217,434 | | 3,178,000 |
Greenwich Capital Commercial Funding Corp.: | | | | |
sequential payer: | | | | |
Series 2004-GG1 Class A4, 4.755% 6/10/36 | | 1,615,000 | | 1,619,132 |
Series 2007-GG9 Class A1, 5.233% 3/10/39 | | 1,751,253 | | 1,758,077 |
Series 2006-GG7 Class A3, 6.1101% 7/10/38 | | 3,460,000 | | 3,561,385 |
GS Mortgage Securities Corp. II: | | | | |
floater Series 2007-EOP: | | | | |
Class C, 5.5719% 3/1/20 (a)(e) | | 1,335,000 | | 1,288,275 |
Class D, 5.6219% 3/1/20 (a)(e) | | 400,000 | | 383,568 |
Class E, 5.6919% 3/1/20 (a)(e) | | 670,000 | | 643,200 |
Class F, 5.7319% 3/1/20 (a)(e) | | 335,000 | | 320,763 |
Class G, 5.7719% 3/1/20 (a)(e) | | 165,000 | | 155,516 |
Class H, 5.9019% 3/1/20 (a)(e) | | 275,000 | | 261,938 |
Class J, 6.1019% 3/1/20 (a)(e) | | 395,000 | | 375,250 |
sequential payer: | | | | |
Series 2003-C1 Class A2A, 3.59% 1/10/40 | | 1,300,593 | | 1,297,984 |
Series 2004-GG2 Class A4, 4.964% 8/10/38 | | 2,725,000 | | 2,743,870 |
Series 1998-GLII Class E, 7.1716% 4/13/31 (e) | | 1,615,000 | | 1,621,413 |
Series 2006-GG6 Class A2, 5.506% 4/10/38 (e) | | 2,990,000 | | 3,023,438 |
GS Mortgage Securities Trust: | | | | |
sequential payer Series 2007-GG10 Class A4, 5.9933% 8/10/45 (e) | | 3,965,000 | | 4,083,473 |
|
| Principal Amount | | Value |
Series 2007-GG10 Class A1, 5.69% 8/10/45 | | $ 1,978,286 | | $ 2,006,079 |
JPMorgan Chase Commercial Mortgage Securities Corp. sequential payer: | | | | |
Series 2006-CB15 Class A3, 5.819% 6/12/43 (e) | | 5,840,000 | | 5,955,670 |
Series 2006-LDP9 Class A2, 5.134% 5/15/47 (e) | | 5,065,000 | | 4,961,170 |
JPMorgan Chase Commercial Mortgage Securities Trust: | | | | |
sequential payer: | | | | |
Series 2006-CB14 Class A3B, 5.6682% 12/12/44 (e) | | 4,625,000 | | 4,662,039 |
Series 2006-CB17 Class A4, 5.429% 12/12/43 | | 1,898,000 | | 1,908,538 |
Series 2007-LDPX Class A3, 5.412% 1/15/49 | | 3,796,000 | | 3,783,679 |
Series 2007-CB19: | | | | |
Class B, 5.7442% 2/12/49 | | 755,000 | | 698,254 |
Class C, 5.7462% 2/12/49 | | 1,971,000 | | 1,802,854 |
Class D, 5.7462% 2/12/49 | | 2,075,000 | | 1,872,044 |
Series 2007-LDP10: | | | | |
Class A1, 5.122% 5/15/49 | | 1,323,269 | | 1,325,093 |
Class BS, 5.437% 1/15/49 (e) | | 1,725,000 | | 1,607,298 |
Class CS, 5.466% 1/15/49 (e) | | 745,000 | | 685,645 |
Class ES, 5.7356% 1/15/49 (a)(e) | | 4,663,000 | | 4,032,941 |
LB Conduit Commercial Mortgage Trust Series 2007-C3: | | | | |
Class F, 6.1339% 7/15/44 (e) | | 1,815,000 | | 1,502,488 |
Class G, 6.1339% 7/15/44 (a)(e) | | 3,200,000 | | 2,577,546 |
LB-UBS Commercial Mortgage Trust: | | | | |
sequential payer: | | | | |
Series 2000-C3 Class A2, 7.95% 1/15/10 | | 2,145,791 | | 2,265,950 |
Series 2001-C3 Class A1, 6.058% 6/15/20 | | 1,618,992 | | 1,646,853 |
Series 2005-C3 Class A2, 4.553% 7/15/30 | | 1,746,000 | | 1,729,879 |
Series 2006-C1 Class A2, 5.084% 2/15/31 | | 1,495,000 | | 1,496,451 |
Series 2006-C7 Class A1, 5.279% 11/15/38 | | 788,200 | | 793,539 |
Series 2007-C1 Class A1, 5.391% 2/15/40 (e) | | 1,158,202 | | 1,167,134 |
Series 2001-C3 Class B, 6.512% 6/15/36 | | 1,810,000 | | 1,912,356 |
Series 2007-C2 Class AM, 5.493% 2/15/40 (e) | | 1,898,000 | | 1,866,517 |
Merrill Lynch Mortgage Trust: | | | | |
sequential payer: | | | | |
Series 2004-KEY2 Class A2, 4.166% 8/12/39 | | 208,193 | | 206,366 |
Commercial Mortgage Securities - continued |
| Principal Amount | | Value |
Merrill Lynch Mortgage Trust: - continued | | | | |
sequential payer: | | | | |
Series 2005-MCP1 Class A2, 4.556% 6/12/43 | | $ 2,120,000 | | $ 2,096,749 |
Series 2007-C1 Class A4, 6.0228% 7/12/40 (e) | | 3,796,000 | | 3,939,843 |
Merrill Lynch-CFC Commercial Mortgage Trust: | | | | |
sequential payer: | | | | |
Series 2007-9 Class A4, 5.7% 9/12/49 | | 5,500,000 | | 5,558,818 |
Series 2007-5 Class A1, 4.275% 12/12/11 | | 1,036,767 | | 1,022,077 |
Series 2007-7 Class B, 5.75% 6/25/50 | | 770,000 | | 697,240 |
Morgan Stanley Capital I Trust: | | | | |
sequential payer: | | | | |
Series 2004-HQ3 Class A2, 4.05% 1/13/41 | | 2,235,000 | | 2,212,622 |
Series 2006-HQ10 Class A1, 5.131% 11/12/41 | | 4,099,779 | | 4,106,153 |
Series 2006-T23 Class A1, 5.682% 8/12/41 | | 1,210,067 | | 1,227,073 |
Series 2007-HQ11 Class A31, 5.439% 2/20/44 (e) | | 4,745,000 | | 4,734,090 |
Series 2007-IQ13 Class A1, 5.05% 3/15/44 | | 1,833,708 | | 1,829,740 |
Series 2007-IQ14: | | | | |
Class A1, 5.38% 4/15/49 | | 3,895,926 | | 3,920,826 |
Class AM, 5.8768% 4/15/49 (e) | | 1,898,000 | | 1,899,999 |
Series 2007-T25 Class A2, 5.507% 11/12/49 | | 10,320,000 | | 10,373,220 |
Series 2005-IQ9 Class X2, 1.1689% 7/15/56 (a)(e)(g) | | 25,112,174 | | 823,732 |
Series 2007-IQ14 Class B, 5.914% 4/15/49 | | 2,175,000 | | 2,002,146 |
Providence Place Group Ltd. Partnership Series 2000-C1 Class A2, 7.75% 7/20/28 | | 2,387,332 | | 2,847,060 |
TrizecHahn Office Properties Trust Series 2001-TZHA Class E3, 7.253% 3/15/13 (a) | | 752,838 | | 753,646 |
Wachovia Bank Commercial Mortgage Trust: | | | | |
sequential payer: | | | | |
Series 2003-C6 Class A2, 4.498% 8/15/35 | | 3,595,000 | | 3,581,124 |
Series 2003-C7 Class A1, 4.241% 10/15/35 (a) | | 1,262,473 | | 1,252,669 |
|
| Principal Amount | | Value |
Series 2007-C30: | | | | |
Class A3, 5.246% 12/15/43 | | $ 5,940,000 | | $ 5,929,312 |
Class A5, 5.342% 12/15/43 | | 3,796,000 | | 3,784,412 |
Series 2007-C31 Class A1, 5.14% 4/15/47 | | 1,214,734 | | 1,215,826 |
Series 2007-C30 Class E, 5.553% 12/15/43 (e) | | 6,257,000 | | 5,256,784 |
Series 2007-C31: | | | | |
Class AM, 5.591% 4/15/47 | | 1,898,000 | | 1,876,712 |
Class C, 5.8818% 4/15/47 (e) | | 2,455,000 | | 2,213,013 |
TOTAL COMMERCIAL MORTGAGE SECURITIES (Cost $276,756,671) | 273,415,574 |
Foreign Government and Government Agency Obligations - 0.1% |
|
Israeli State 4.625% 6/15/13 | | 525,000 | | 532,980 |
United Mexican States 5.875% 1/15/14 | | 1,665,000 | | 1,731,600 |
TOTAL FOREIGN GOVERNMENT AND GOVERNMENT AGENCY OBLIGATIONS (Cost $2,164,120) | 2,264,580 |
Supranational Obligations - 0.0% |
|
Corporacion Andina de Fomento: | | | | |
5.2% 5/21/13 | | 630,000 | | 629,114 |
6.875% 3/15/12 | | 425,000 | | 453,485 |
TOTAL SUPRANATIONAL OBLIGATIONS (Cost $1,047,687) | 1,082,599 |
Fixed-Income Funds - 12.2% |
| Shares | | |
Fidelity Ultra-Short Central Fund (f)
(Cost $484,713,504) | 4,877,015 | | 435,371,129 |
Preferred Securities - 0.1% |
| Principal Amount | | |
FINANCIALS - 0.1% |
Diversified Financial Services - 0.1% |
MUFG Capital Finance 1 Ltd. 6.346% (e) (Cost $3,520,000) | $ 3,520,000 | | 3,430,426 |
Cash Equivalents - 1.2% |
| Maturity Amount | | Value |
Investments in repurchase agreements in a joint trading account at 4.71%, dated 12/31/07 due 1/2/08 (Collateralized by U.S. Government Obligations) #
(Cost $43,682,000) | $ 43,693,418 | | $ 43,682,000 |
TOTAL INVESTMENT PORTFOLIO - 108.2% (Cost $3,895,589,362) | | 3,880,908,568 |
NET OTHER ASSETS - (8.2)% | | (293,101,102) |
NET ASSETS - 100% | $ 3,587,807,466 |
Swap Agreements |
| Expiration Date | | Notional Amount | | |
Credit Default Swaps |
Pay monthly a fixed rate of .15% multiplied by the notional amount and receive from Credit Suisse First Boston upon each credit event of one of the issues of Dow Jones ABX AA 07-1 Index, par value of the proportional notional amount (d) | August 2037 | | $ 4,400,000 | | 2,332,000 |
Receive monthly notional amount multiplied by 3.86% and pay Morgan Stanley, Inc. upon credit event of Merrill Lynch Mortgage Investors Trust, Inc., par value of the notional amount of Merrill Lynch Mortgage Investors Trust, Inc. Series 2006 HE5, Class B3, 7.32% 8/25/37 | Sept. 2037 | | 1,600,000 | | (1,360,771) |
Receive monthly notional amount multiplied by 3.35% and pay Morgan Stanley, Inc. upon credit event of Morgan Stanley ABS Capital I, Inc., par value of the notional amount of Morgan Stanley ABS Capital I, Inc. Series 2004-HE8 Class B3, 7.3913% 9/25/34 | Oct. 2034 | | 465,000 | | (116,604) |
|
| Expiration Date | | Notional Amount | | Value |
Receive monthly notional amount multiplied by 3.3% and pay to Morgan Stanley, Inc. upon credit event of Ameriquest Mortgage Securities, Inc., par value of the notional amount of Ameriquest Mortgage Securities, Inc. Series 2004-R11 Class M9, 6.88% 11/25/34 | Dec. 2034 | | $ 775,000 | | $ (220,701) |
Receive monthly notional amount multiplied by 3.35% and pay Morgan Stanley, Inc. upon credit event of Morgan Stanley ABS Capital I, Inc., par value of the notional amount of Morgan Stanley ABS Capital I, Inc. Series 2004-HE7 Class B3, 9.01% 8/25/34 | Sept. 2034 | | 141,097 | | (38,832) |
Receive monthly notional amount multiplied by 3.35% and pay Morgan Stanley, Inc. upon credit event of Morgan Stanley ABS Capital I, Inc., par value of the notional amount of Morgan Stanley ABS Capital I, Inc. Series 2004-NC7 Class B3, 7.6913% 7/25/34 | August 2034 | | 315,084 | | (81,948) |
Receive monthly notional amount multiplied by 2.7% and pay Lehman Brothers, Inc. upon credit event of Morgan Stanley ABS Capital I, Inc., par value of the notional amount of Morgan Stanley ABS Capital I, Inc. Series 2006 WMC1, Class B3, 7.5% 12/25/35 | Jan. 2036 | | 1,600,000 | | (1,323,680) |
Receive from Citibank upon credit event of Bristol-Myers Squibb Co., par value of the notional amount of Bristol-Myers Squibb Co. 5.25% 8/15/13, and pay quarterly notional amount multiplied by .32% | Sept. 2017 | | 1,000,000 | | 1,685 |
Swap Agreements - continued |
| Expiration Date | | Notional Amount | | Value |
Credit Default Swaps - continued |
Receive from Deutsche Bank upon credit event of Household Finance Corp., par value of the notional amount of Household Finance Corp. 7% 5/15/12, and pay quarterly notional amount multiplied by .73% | Sept. 2012 | | $ 3,400,000 | | $ (51,473) |
Receive from Goldman Sachs upon credit event of AMBAC Assurance Corp., par value of the notional amount of AMBAC Assurance Corp. 5.90% 2/22/21, and pay quarterly notional amount multiplied by 1.80% | Dec. 2012 | | 900,000 | | 52,953 |
Receive from Goldman Sachs upon credit event of CSX Corp., par value of the notional amount of CSX Corp. 5.30% 2/15/14, and pay quarterly notional amount multiplied by .77% | Sept. 2017 | | 3,200,000 | | 45,906 |
Receive from Lehman Brothers, Inc. upon credit event of AMBAC Assurance Corp., par value of the notional amount of AMBAC Assurance Corp. 5.90% 2/22/21, and pay quarterly notional amount multiplied by 1.65% | Dec. 2012 | | 900,000 | | 58,375 |
Receive from Merrill Lynch, Inc. upon credit event of R.R. Donnelley & Sons Co., par value of the notional amount of R.R. Donnelley & Sons Co. 5.5% 5/15/15, and pay quarterly notional amount multiplied by 2.12% | Sept. 2013 | | 1,360,000 | | (81,299) |
|
| Expiration Date | | Notional Amount | | Value |
Receive from Merrill Lynch, Inc., upon credit event of R.R. Donnelley & Sons Co., par value of the notional amount of R.R. Donnelley & Sons Co. 5.5% 5/15/15 and pay quarterly notional amount multiplied by 1.68% | Sept. 2013 | | $ 2,035,000 | | $ (76,583) |
Receive monthly notional amount multiplied by 2.6% and pay Merrill Lynch, Inc. upon credit event of Ameriquest Mortgage Securities, Inc., par value of the notional amount of Ameriquest Mortgage Securities, Inc. Series 2004-R8 Class M9, 8.07% 9/25/34 | Oct. 2034 | | 610,794 | | (370,859) |
Receive monthly notional amount multiplied by 3.05% and pay Morgan Stanley, Inc. upon credit event of Morgan Stanley ABS Capital I, Inc., par value of the notional amount of Morgan Stanley ABS Capital I, Inc. Series 2006-HE3 Class B3, 7.22% 4/25/36 | May 2036 | | 1,300,000 | | (1,118,275) |
Receive monthly a fixed rate of .15% multiplied by the notional amount and pay JPMorgan Chase, Inc. upon each credit event of one of the issues of Dow Jones ABX AA 07-01 Index, par value of the proportional notional amount (d) | Sept. 2037 | | 3,100,000 | | (1,736,000) |
Receive monthly a fixed rate of .15% multiplied by the notional amount and pay to Credit Suisse First Boston upon each credit event of one of the issues of Dow Jones ABX AA 07-01 Index, par value of the proportional notional amount (d) | Sept. 2037 | | 2,600,000 | | (1,456,000) |
Swap Agreements - continued |
| Expiration Date | | Notional Amount | | Value |
Credit Default Swaps - continued |
Receive monthly a fixed rate of .15% multiplied by the notional amount and pay to Credit Suisse First Boston upon each credit event of one of the issues of Dow Jones ABX AA 07-1 Index, par value of the proportional notional amount (d) | August 2037 | | $ 3,000,000 | | $ (1,680,000) |
Receive monthly a fixed rate of .15% multiplied by the notional amount and pay to JPMorgan Chase, Inc. upon each credit event of one of the issues of Dow Jones ABX AA 07-01 Index, par value of the proportional notional amount (d) | Sept. 2037 | | 1,500,000 | | (840,000) |
Receive monthly a fixed rate of .15% multiplied by the notional amount and pay to Lehman Brothers, Inc. upon credit event of one of the issues of Dow Jones ABX AA 07-1 Index, par vale of the proportional notional amount (d) | Sept. 2037 | | 1,800,000 | | (1,008,000) |
Receive monthly a fixed rate of .15% multiplied by the notional amount and pay to Lehman Brothers, Inc. upon credit event of one of the issues of Dow Jones ABX AA 07-1 Index, par value of the proportional amount (d) | Sept. 2037 | | 2,300,000 | | (1,288,000) |
Receive monthly a fixed rate of .15% multiplied by the notional amount and pay to UBS upon each credit event of one of the issues of Dow Jones ABX AA 07-1 Index, par value of the proportional notional amount (d) | August 2037 | | 4,400,000 | | (2,464,000) |
|
| Expiration Date | | Notional Amount | | Value |
Receive monthly a fixed rate of .15% multiplied by the notional amount and pay to UBS upon each credit event of one of the issues of Dow Jones ABX AA 07-1 Index, par value of the proportional notional amount (d) | August 2037 | | $ 1,600,000 | | $ (896,000) |
Receive monthly a fixed rate of .15% multiplied by the notional amount and pay to UBS upon each credit event of one of the issues of Dow Jones ABX AA 07-1 Index, par value of the proportional notional amount (d) | Sept. 2037 | | 4,600,000 | | (2,576,000) |
Receive monthly notional amount multiplied by .82% and pay UBS upon credit event of Morgan Stanley ABS Capital I, Inc., par value of the notional amount of Morgan Stanley ABS Capital I, Inc. Series 2004-NC6 Class M3, 5.6413% 7/25/34 | August 2034 | | 412,580 | | (39,627) |
Receive monthly notional amount multiplied by .85% and pay UBS upon credit event of Ameriquest Mortgage Securities, Inc., par value of the notional amount of Ameriquest Mortgage Securities, Inc. Series 2004-R9 Class M5, 5.5913% 10/25/34 | Nov. 2034 | | 465,000 | | (85,868) |
Swap Agreements - continued |
| Expiration Date | | Notional Amount | | Value |
Credit Default Swaps - continued |
Receive monthly notional amount multiplied by .85% and pay UBS upon credit event of Morgan Stanley ABS Capital I, Inc., par value of the notional amount of Morgan Stanley ABS Capital I, Inc. Series 2004-NC8 Class M6, 5.4413% 9/25/34 | Oct. 2034 | | $ 465,000 | | $ (57,014) |
Receive monthly notional amount multiplied by 1.32% and pay Goldman Sachs upon credit event of Securitized Asset Backed Receivables LLC Trust, par value of the notional amount of Securitized Asset Backed Receivables LLC Trust Series | Nov. 2035 | | 1,900,000 | | (1,388,569) |
Receive monthly notional amount multiplied by 1.6% and pay Morgan Stanley, Inc. upon credit event of Park Place Securities, Inc., par value of the notional amount of Park Place Securities, Inc. Series 2005-WHQ2 Class M7, 5.4413% 5/25/35 | June 2035 | | 640,000 | | (272,937) |
Receive monthly notional amount multiplied by 1.66% and pay Morgan Stanley, Inc. upon credit event of Park Place Securities, Inc., par value of the notional amount of Park Place Securities, Inc. Series 2005-WHQ2 Class M7, 5.4413% 5/25/35 | June 2035 | | 465,000 | | (197,913) |
|
| Expiration Date | | Notional Amount | | Value |
Receive monthly notional amount multiplied by 2.36% and pay Morgan Stanley, Inc. upon credit event of GE-WMC Mortgage Securities, LLC, par value of the notional amount of GE-WMC Mortgage Securities, LLC Series 2006-01 Class B3, 7.13% 8/25/36 | Sept. 2036 | | $ 3,700,000 | | $ (3,330,609) |
Receive monthly notional amount multiplied by 2.39% and pay UBS upon credit event of Fremont Home Loan Trust, par value of the notional amount of Fremont Home Loan Trust Series 2004-1 Class M9, 7.73% 2/25/34 | March 2034 | | 515,880 | | (83,772) |
Receive monthly notional amount multiplied by 2.4% and pay Deutsche Bank upon credit event of Fremont Home Loan Trust, par value of the notional amount of Fremont Home Loan Trust Series 2004-A Class B3, 7.2288% 1/25/34 | Feb. 2034 | | 231,256 | | (191,518) |
Receive monthly notional amount multiplied by 2.5% and pay Bank of America upon credit event of Ameriquest Mortgage Securities, Inc., par value of the notional amount of Ameriquest Mortgage Securities, Inc. Series 2004-R11 Class M9, 6.102% 11/25/34 | Dec. 2034 | | 1,800,000 | | (527,379) |
Swap Agreements - continued |
| Expiration Date | | Notional Amount | | Value |
Credit Default Swaps - continued |
Receive monthly notional amount multiplied by 2.5% and pay Bank of America upon credit event of Ameriquest Mortgage Securities, Inc., par value of the notional amount of Ameriquest Mortgage Securities, Inc. Series 2004-R8 Class M9, 8.07% 9/25/34 | Oct. 2034 | | $ 610,794 | | $ (371,188) |
Receive monthly notional amount multiplied by 2.5% and pay Credit Suisse First Boston upon credit event of Ameriquest Mortgage Securities, Inc., par value of the notional amount of Ameriquest Mortgage Securities, Inc. Series 2004-R11 Class M9, 8.03% 11/25/34 | Dec. 2034 | | 1,075,000 | | (314,962) |
Receive monthly notional amount multiplied by 2.54% and pay Merrill Lynch upon credit event of Countrywide Home Loans, Inc., par value of the notional amount of Countrywide Home Loans, Inc. Series 2003-BC1 Class B1, 7.6913% 3/25/32 | April 2032 | | 40,946 | | (33,963) |
Receive monthly notional amount multiplied by 2.7% and pay Morgan Stanley, Inc. upon credit event of Park Place Securities, Inc., par value of the notional amount of Park Place Securities, Inc. Series 2005-WHQ2 Class M9, 6.41% 5/25/35 | June 2035 | | 770,000 | | (350,312) |
|
| Expiration Date | | Notional Amount | | Value |
Receive monthly notional amount multiplied by 2.79% and pay Merrill Lynch, Inc. upon credit event of New Century Home Equity Loan Trust, par value of the notional amount of New Century Home Equity Loan Trust Series 2004-4 Class M9, 7.0788% 2/25/35 | March 2035 | | $ 565,599 | | $ (172,801) |
Receive monthly notional amount multiplied by 3% and pay JPMorgan Chase, Inc. upon credit event of GSAMP Trust, par value of the notional amount of GSAMP Trust Series 2006-NC2 Class M9, 7.3744% 6/25/36 | July 2036 | | 1,900,000 | | (1,642,930) |
Receive monthly notional amount multiplied by 3.66% and pay Deutsche Bank upon credit event of Park Place Securities, Inc., par value of the notional amount of Park Place Securities, Inc. Series 2005-WHQ2 Class M9, 7.2% 5/25/35 | June 2035 | | 1,900,000 | | (836,413) |
Receive monthly notional amount multiplied by 3.83% and pay Morgan Stanley, Inc. upon credit event of Park Place Securities, Inc., par value of the notional amount of Park Place Securities, Inc. Series 2005-WHQ2 Class M9, 7.2% 5/25/35 | June 2035 | | 600,000 | | (262,565) |
Receive monthly notional amount multiplied by 5% and pay Deutsche Bank upon credit event of MASTR Asset Backed Securities Trust, par value of the notional amount of MASTR Asset Backed Securities Trust Series 2003-NC1 Class M6, 8.1913% 4/25/33 | May 2033 | | 465,000 | | (141,124) |
Swap Agreements - continued |
| Expiration Date | | Notional Amount | | Value |
Credit Default Swaps - continued |
Receive monthly notional amount multiplied by 5.12% and pay Bank of America upon credit event of Structured Asset Securities Corp., par value of the notional amount of Structured Asset Securities Corp. Series 2005-AR1 Class M8, 7.32% 9/25/35 | Oct. 2035 | | $ 2,000,000 | | $ (1,201,449) |
Receive quarterly notional amount multiplied by .35% and pay Goldman Sachs upon credit event of Southern California Edison Co., par value of the notional amount of Southern California Edison Co. 7.625% 1/15/10 | Sept. 2010 | | 1,900,000 | | 1,124 |
Receive quarterly notional amount multiplied by .41% and pay Merrill Lynch, Inc. upon credit event of Talisman Energy, Inc., par value of the notional amount of Talisman Energy, Inc. 7.25% 10/15/27 | March 2009 | | 1,400,000 | | 3,876 |
Receive quarterly notional amount multiplied by .62% and pay UBS upon credit event of Countrywide Home Loans, Inc., par value of the notional amount of Countrywide Home Loans, Inc. 4% 3/22/11 | March 2012 | | 1,070,000 | | (266,884) |
|
| Expiration Date | | Notional Amount | | Value |
Receive semi-annually notional amount multiplied by .61% and pay JPMorgan Chase, Inc. upon credit event of United Mexican States, par value of the notional amount of United Mexican States 7.5% 4/8/33 | May 2011 | | $ 4,290,000 | | $ 7,451 |
Receive semi-annually notional amount multiplied by .625% and pay Deutsche Bank upon credit event of United Mexican States, par value of the notional amount of United Mexican States 7.5% 4/8/33 | May 2011 | | 2,260,000 | | 5,006 |
TOTAL CREDIT DEFAULT SWAPS | | 80,344,030 | | (28,046,446) |
Interest Rate Swaps |
Receive quarterly a fixed rate equal to 4% and pay quarterly a floating rate based on 3-month LIBOR with JPMorgan Chase, Inc. | July 2009 | | 42,000,000 | | (31,605) |
Receive quarterly a fixed rate equal to 4.3875% and pay quarterly a floating rate based on 3-month LIBOR with Credit Suisse First Boston | March 2010 | | 11,825,000 | | 129,055 |
Receive quarterly a fixed rate equal to 4.774% and pay quarterly a floating rate based on 3-month LIBOR with Credit Suisse First Boston | March 2015 | | 11,825,000 | | 371,168 |
Receive semi-annually a fixed rate equal to 4.378% and pay quarterly a floating rate based on 3-month LIBOR with Lehman Brothers, Inc. | Sept. 2008 | | 25,400,000 | | 275,798 |
Receive semi-annually a fixed rate equal to 4.492% and pay quarterly a floating rate based on 3-month LIBOR with Lehman Brothers, Inc. | Sept. 2010 | | 1,500,000 | | 39,621 |
Swap Agreements - continued |
| Expiration Date | | Notional Amount | | Value |
Interest Rate Swaps - continued |
Receive semi-annually a fixed rate equal to 4.93% and pay quarterly a floating rate based on 3-month LIBOR with Lehman Brothers, Inc. | Nov. 2010 | | $ 1,000,000 | | $ 27,297 |
Receive semi-annually a fixed rate equal to 5.095% and pay quarterly a floating rate based on 3-month LIBOR with Bank of America | Feb. 2012 | | 50,000,000 | | 2,544,655 |
Receive semi-annually a fixed rate equal to 5.145% and pay quarterly a floating rate based on 3-month LIBOR with Credit Suisse First Boston | Feb. 2012 | | 30,000,000 | | 1,593,618 |
Receive semi-annually a fixed rate equal to 5.186% and pay quarterly a floating rate based on 3-month LIBOR with JPMorgan Chase, Inc. | Sept. 2011 | | 20,000,000 | | 1,051,590 |
Receive semi-annually a fixed rate equal to 5.276% and pay quarterly a floating rate based on 3-month LIBOR with Deutsche Bank | April 2011 | | 52,500,000 | | 2,094,614 |
Receive semi-annually a fixed rate equal to 5.312% and pay quarterly a floating rate based on the 3-month LIBOR with Lehman Brothers, Inc. | April 2011 | | 105,000,000 | | 4,345,184 |
Receive semi-annually a fixed rate equal to 5.3315% and pay quarterly a floating rate based on 3-month LIBOR with JPMorgan Chase, Inc. | April 2011 | | 15,000,000 | | 626,039 |
|
| Expiration Date | | Notional Amount | | Value |
Receive semi-annually a fixed rate equal to 5.354% and pay quarterly a floating rate based on 3-month LIBOR with Deutsche Bank | April 2011 | | $ 32,000,000 | | $ 1,378,029 |
Receive semi-annually a fixed rate equal to 5.45% and pay quarterly a floating rate based on 3-month LIBOR with JPMorgan Chase, Inc. | August 2012 | | 25,000,000 | | 1,702,861 |
TOTAL INTEREST RATE SWAPS | | 423,050,000 | | 16,147,924 |
| | $ 503,394,030 | | $ (11,898,522) |
Legend |
(a) Security exempt from registration under Rule 144A of the Securities Act of 1933. These securities may be resold in transactions exempt from registration, normally to qualified institutional buyers. At the end of the period, the value of these securities amounted to $214,359,768 or 6.0% of net assets. |
(b) Security or a portion of the security purchased on a delayed delivery or when-issued basis. |
(c) Security or a portion of the security has been segregated as collateral for open swap agreements. At the period end, the value of securities pledged amounted to $14,427,412. |
(d) Represents a tradable index of credit default swaps on home equity asset-backed debt securities. |
(e) The coupon rate shown on floating or adjustable rate securities represents the rate at period end. |
(f) Affiliated fund that is available only to investment companies and other accounts managed by Fidelity Investments. A complete schedule of portfolio holdings for each Fidelity Central Fund is filed with the SEC for the first and third quarters of each fiscal year on Form N-Q and is available upon request or at the SEC's web site at www.sec.gov. A holdings listing for the Fund, which presents direct holdings as well as the pro rata share of securities and other investments held indirectly through its investment in underlying non-money market Fidelity Central Funds, is available at advisor.fidelity.com. In addition, each Fidelity Central Fund's financial statements, which are not covered by the Fund's Report of Independent Registered Public Accounting Firm, are available on the SEC's web site or upon request. |
(g) Security represents right to receive monthly interest payments on an underlying pool of mortgages or assets. Principal shown is the outstanding par amount of the pool held as of the end of the period. |
# Additional Information on each counterparty to the repurchase agreement is as follows: |
Repurchase Agreement / Counterparty | Value |
$43,682,000 due 1/02/08 at 4.71% |
Banc of America Securities LLC | $ 19,813,485 |
Bank of America, NA | 8,170,379 |
Barclays Capital, Inc. | 13,617,298 |
ING Financial Markets LLC | 1,672,319 |
WestLB AG | 408,519 |
| $ 43,682,000 |
Affiliated Central Funds |
Information regarding fiscal year to date income earned by the Fund from investments in Fidelity Central Funds is as follows: |
Fund | Income earned |
Fidelity Ultra-Short Central Fund | $ 30,690,722 |
|
Additional information regarding the Fund's fiscal year to date purchases and sales, including the ownership percentage, of the non Money Market Central Funds is as follows: |
Fund | Value, beginning of period | Purchases | Sales Proceeds | Value, end of period | % ownership, end of period |
Fidelity Ultra-Short Central Fund | $ 528,129,201 | $ 128,603,122 | $ 163,773,986 | $ 435,371,129 | 4.3% |
See accompanying notes which are an integral part of the financial statements.
Not Part of Financial Report
Financial Statements
Statement of Assets and Liabilities
| December 31, 2007 |
| | |
Assets | | |
Investment in securities, at value (including repurchase agreements of $43,682,000) - See accompanying schedule: Unaffiliated issuers (cost $3,410,875,858) | $ 3,445,537,439 | |
Fidelity Central Funds (cost $484,713,504) | 435,371,129 | |
Total Investments (cost $3,895,589,362) | | $ 3,880,908,568 |
Cash | | 180,500 |
Receivable for investments sold | | 704,770 |
Receivable for swap agreements | | 65,881 |
Interest receivable | | 25,143,664 |
Distributions receivable from Fidelity Central Funds | | 1,955,292 |
Total assets | | 3,908,958,675 |
| | |
Liabilities | | |
Payable for investments purchased
Regular delivery | $ 11,339 | |
Delayed delivery | 309,232,247 | |
Swap agreements, at value | 11,898,522 | |
Other payables and accrued expenses | 9,101 | |
Total liabilities | | 321,151,209 |
| | |
Net Assets | | $ 3,587,807,466 |
Net Assets consist of: | | |
Paid in capital | | $ 3,601,043,779 |
Undistributed net investment income | | 3,017,076 |
Accumulated undistributed net realized gain (loss) on investments | | 6,364,217 |
Net unrealized appreciation (depreciation) on investments | | (22,617,606) |
Net Assets, for 35,001,498 shares outstanding | | $ 3,587,807,466 |
Net Asset Value, offering price and redemption price per share ($3,587,807,466 ÷ 35,001,498 shares) | | $ 102.50 |
Statement of Operations
| Year ended December 31, 2007 |
| | |
Investment Income | | |
Dividends | | $ 223,379 |
Interest | | 140,979,652 |
Income from Fidelity Central Funds | | 30,690,722 |
Total income | | 171,893,753 |
| | |
Expenses | | |
Custodian fees and expenses | $ 93,947 | |
Independent trustees' compensation | 10,717 | |
Total expenses before reductions | 104,664 | |
Expense reductions | (24,983) | 79,681 |
Net investment income | | 171,814,072 |
Realized and Unrealized Gain (Loss) Net realized gain (loss) on: | | |
Investment securities: | | |
Unaffiliated issuers | 16,959,379 | |
Fidelity Central Funds | (8,216,215) | |
Swap agreements | (3,662,659) | |
Total net realized gain (loss) | | 5,080,505 |
Change in net unrealized appreciation (depreciation) on: Investment securities | (10,614,453) | |
Swap agreements | (7,264,109) | |
Total change in net unrealized appreciation (depreciation) | | (17,878,562) |
Net gain (loss) | | (12,798,057) |
Net increase (decrease) in net assets resulting from operations | | $ 159,016,015 |
See accompanying notes which are an integral part of the financial statements.
Not Part of Financial Report
Financial Statements - continued
Statement of Changes in Net Assets
| Year ended
December 31,
2007 | For the period
June 23, 2006 (commencement of operations) to
December 31, 2006 |
Increase (Decrease) in Net Assets | | |
Operations | | |
Net investment income | $ 171,814,072 | $ 75,243,878 |
Net realized gain (loss) | 5,080,505 | (585,352) |
Change in net unrealized appreciation (depreciation) | (17,878,562) | 82,658,962 |
Net increase (decrease) in net assets resulting from operations | 159,016,015 | 157,317,488 |
Distributions to shareholders from net investment income | (167,465,735) | (74,679,073) |
Distributions to shareholders from net realized gain | (2,131,039) | (2,712,938) |
Total distributions | (169,596,774) | (77,392,011) |
Affiliated shares transactions
Proceeds from sales of shares | 846,478,691 | 357,378,602 |
Contributions in-kind | - | 2,367,627,479 |
Reinvestment of distributions | 90,626,029 | - |
Cost of shares redeemed | (133,664,658) | (9,983,395) |
Net increase (decrease) in net assets resulting from share transactions | 803,440,062 | 2,715,022,686 |
Total increase (decrease) in net assets | 792,859,303 | 2,794,948,163 |
| | |
Net Assets | | |
Beginning of period | 2,794,948,163 | - |
End of period (including undistributed net investment income of $3,017,076 and undistributed net investment income of $3,151,535, respectively) | $ 3,587,807,466 | $ 2,794,948,163 |
Other Information Shares | | |
Sold | 8,284,694 | 3,550,542 |
Issued for in-kind contributions | - | 23,676,275 |
Issued in reinvestment of distributions | 888,417 | - |
Redeemed | (1,300,993) | (97,437) |
Net increase (decrease) | 7,872,118 | 27,129,380 |
Financial Highlights
Years ended December 31, | 2007 | 2006 H |
Selected Per-Share Data | | |
Net asset value, beginning of period | $ 103.02 | $ 100.00 |
Income from Investment Operations | | |
Net investment income D | 5.534 | 2.814 |
Net realized and unrealized gain (loss) | (.594) | 3.132 |
Total from investment operations | 4.940 | 5.946 |
Distributions from net investment income | (5.385) | (2.826) |
Distributions from net realized gain | (.075) | (.100) |
Total distributions | (5.460) | (2.926) |
Net asset value, end of period | $ 102.50 | $ 103.02 |
Total Return B, C | 4.94% | 5.95% |
Ratios to Average Net Assets E, I | | |
Expenses before reductions | -% G | -%A, G |
Expenses net of fee waivers, if any | -%G | -%A, G |
Expenses net of all reductions | -%G | -%A, G |
Net investment income | 5.42% | 5.23% |
Supplemental Data | | |
Net assets, end of period (000 omitted) | $ 3,587,807 | $ 2,794,948 |
Portfolio turnover rateF | 137% | 99%A |
A Annualized
B Total returns for periods of less than one year are not annualized.
C Total returns would have been lower had certain expenses not been reduced during the periods shown.
D Calculated based on average shares outstanding during the period.
E Fees and expenses of the underlying Fidelity Central Funds are not included in the Fund's expense ratio. The Fund indirectly bears its proportionate share of the expenses of any underlying Fidelity Central Funds.
F Amount does not include the portfolio activity of any underlying Fidelity Central Funds.
G Amount represents less than .01%.
H For the period June 23, 2006 (commencement of operations) to December 31, 2006.
I Expense ratios reflect operating expenses of the Fund. Expenses before reductions do not reflect amounts reimbursed by the investment adviser or expense offset arrangements and do not represent the amount paid by the Fund during periods when reimbursements or reductions occur. Expense ratios before reductions for start-up periods may not be representative of longer term operating periods. Expenses net of fee waivers reflect expenses after reimbursement by the investment adviser but prior to reductions from expense offset arrangements. Expenses net of all reductions represent the net expenses paid by the Fund.
See accompanying notes which are an integral part of the financial statements.
Not Part of Financial Report
Notes to Financial Statements
For the period ended December 31, 2007
1. Organization.
Fidelity VIP Investment Grade Central Fund (the Fund) is a fund of Fidelity Garrison Street Trust (the Trust) and is authorized to issue an unlimited number of shares. The Trust is registered under the Investment Company Act of 1940, as amended (the 1940 Act), as an open-end management investment company organized as a Massachusetts business trust. Shares of the Fund are only offered to other investment companies and accounts managed by Fidelity Management & Research Company (FMR), or its affiliates.
2. Investments in Fidelity Central Funds.
The Fund may invest in Fidelity Central Funds, which are open-end investment companies available only to other investment companies and accounts managed by FMR and its affiliates. The Fund's Schedule of Investments lists each of the Fidelity Central Funds as an investment of the Fund, but does not include the underlying holdings of each Fidelity Central Fund. As an Investing Fund, the Fund indirectly bears its proportionate share of the expenses of the underlying Fidelity Central Funds.
Based on their investment objective, each Fidelity Central Fund may invest or participate in various investment vehicles or strategies that are similar to those of the Fund. These strategies are consistent with the investment objectives of the Fund and may involve certain economic risks which may cause a decline in value of each of the Fidelity Central Funds and thus a decline in the value of the Fund. The following summarizes the Fund's investment in each Fidelity Central Fund.
Fidelity Central Fund | Investment Manager | Investment Objective | Investment Practices |
Fidelity Ultra-Short Central Fund | Fidelity Investments Money Management, Inc. (FIMM) | Seeks to obtain a high level of current income consistent with preservation of capital by investing in U.S. dollar denominated money market and investment-grade debt securities. | Futures Mortgage Dollar Rolls Repurchase Agreements Restricted Securities Swap Agreements |
The Central Funds may have direct or indirect exposure to securities of issuers that hold mortgage securities, including securities backed by subprime mortgage loans. The value and related income of these securities is sensitive to changes in economic conditions, including delinquencies and/or defaults, and may be adversely affected by shifts in the market's perception of the issuers and changes in interest rates.
A complete list of holdings for each Fidelity Central Fund is available upon request or at the SEC's web site at www.sec.gov. In addition, the financial statements of the Fidelity Central Funds, which are not covered by the Fund's Report of Independent Registered Public Accounting Firm, are available on the SEC's web site or upon request.
On April 26, 2007, the Fund purchased 793,730 shares of Fidelity Ultra-Short Central Fund, an affiliated entity, valued at $78,603,082 by transferring securities of equal value, including accrued interest. This is considered taxable for federal income tax purposes, and the Fund recognized a gain of $79,985.
3. Significant Accounting Policies.
The financial statements have been prepared in conformity with accounting principles generally accepted in the United States of America, which require management to make certain estimates and assumptions at the date of the financial statements. The following summarizes the significant accounting policies of the Fund:
Security Valuation. Investments are valued and net asset value per share is calculated (NAV calculation) as of the close of business of the New York Stock Exchange, normally 4:00 p.m. Eastern time. Wherever possible, the Fund uses independent pricing services approved by the Board of Trustees to value its investments. Debt securities, including restricted securities, for which quotations are readily available, are valued by independent pricing services or by dealers who make markets in such securities. Pricing services consider yield or price of bonds of comparable quality, coupon, maturity and type as well as available dealer supplied prices. Certain of the Fund's securities may be valued by a single source or dealer.
When current market prices or quotations are not readily available or do not accurately reflect fair value, valuations may be determined in accordance with procedures adopted by the Board of Directors. Factors used in the determination of fair value may include current market trading activity, interest rates, credit quality and default rates. The frequency of when fair value pricing is used is unpredictable. The value of securities used for NAV calculation under fair value pricing may differ from published prices for the same securities. Investments in open-end mutual funds, including the Fidelity Central Funds, are valued at their closing net asset value each business day. Short-term securities with remaining maturities of sixty days or less for which quotations are not readily available are valued at amortized cost, which approximates value.
Not Part of Financial Report
Notes to Financial Statements - continued
3. Significant Accounting Policies - continued
Investment Transactions and Income. For financial reporting purposes, the Fund's investment holdings and NAV include trades executed through the end of the last business day of the period. The NAV for processing shareholder transactions includes trades executed through the end of the prior business day. Gains and losses on securities sold are determined on the basis of identified cost. Dividend income is recorded on the ex-dividend date. Interest income and distributions from other Fidelity Central Funds are accrued as earned. Interest income includes coupon interest and amortization of premium and accretion of discount on debt securities. Inflation-indexed bonds are fixed-income securities whose principal value is periodically adjusted to the rate of inflation. Interest is accrued based on the principal value, which is adjusted for inflation. Any increase in the principal amount of an inflation-indexed bond is recorded as interest income, even though principal is not received until maturity.
Expenses. Most expenses of the Trust can be directly attributed to a fund. Expenses which cannot be directly attributed are apportioned among each Fund in the trust. Expense estimates are accrued in the period to which they relate and adjustments are made when actual amounts are known.
Income Tax Information and Distributions to Shareholders. Each year, the Fund intends to qualify as a regulated investment company by distributing substantially all of its taxable income and realized gains under Subchapter M of the Internal Revenue Code and filing its U.S. federal tax return. As a result, no provision for income taxes is required. The Fund adopted the provisions of FASB Interpretation No. 48, Accounting for Uncertainties in Income Taxes (FIN 48), on June 29, 2007. FIN 48 sets forth a minimum threshold for financial statement recognition of the benefit of a tax position taken or expected to be taken in a tax return. The implementation of FIN 48 did not result in any unrecognized tax benefits in the accompanying financial statements. Each of the Fund's federal tax returns for the prior three fiscal years remains subject to examination by the Internal Revenue Service.
Distributions are recorded on the ex-dividend date. Income dividends and capital gain distributions are determined in accordance with income tax regulations, which may differ from generally accepted accounting principles.
Capital accounts within the financial statements are adjusted for permanent book-tax differences. Certain adjustments have been made to the accounts relating to prior periods. Collectively, these adjustments have no impact on net assets or the results of operations. Temporary book-tax differences will reverse in a subsequent period.
Book-tax differences are primarily due to short-term capital gains, swap agreements, market discount, financing transactions, and losses deferred due to wash sales and excise tax regulations.
The tax-basis components of distributable earnings and the federal tax cost as of period end were as follows:
Unrealized appreciation | $ 82,903,336 | |
Unrealized depreciation | (104,439,842) | |
Net unrealized appreciation (depreciation) | (21,536,506) | |
Undistributed ordinary income | 4,924,825 | |
Undistributed long-term capital gain | 3,375,373 | |
| | |
Cost for federal income tax purposes | $ 3,902,445,074 | |
The tax character of distributions paid was as follows:
| December 31, 2007 | December 31, 2006 |
Ordinary Income | $ 169,596,774 | $ 77,392,011 |
New Accounting Pronouncement. In September 2006, Statement of Financial Accounting Standards No. 157, Fair Value Measurements (SFAS 157), was issued and is effective for fiscal years beginning after November 15, 2007. SFAS 157 defines fair value, establishes a framework for measuring fair value and expands disclosures about fair value measurements. Management is currently evaluating the impact the adoption of SFAS 157 will have on the Fund's financial statement disclosures.
Not Part of Financial Report
4. Operating Policies.
Repurchase Agreements. FMR has received an Exemptive Order from the Securities and Exchange Commission (the SEC) which permits the Fund and other affiliated entities of FMR to transfer uninvested cash balances into joint trading accounts which are then invested in repurchase agreements. The Fund may also invest directly with institutions in repurchase agreements. Repurchase agreements are collateralized by government or non-government securities. Upon settlement date, collateral is held in segregated accounts with custodian banks and may be obtained in the event of a default of the counterparty. The Fund monitors, on a daily basis, the value of the collateral to ensure it is at least equal to the principal amount of the repurchase agreement (including accrued interest). In the event of a default by the counterparty, realization of the collateral proceeds could be delayed, during which time the value of the collateral may decline.
Delayed Delivery Transactions and When-Issued Securities. The Fund may purchase or sell securities on a delayed delivery or when-issued basis. Payment and delivery may take place after the customary settlement period for that security. The price of the underlying securities and the date when the securities will be delivered and paid for are fixed at the time the transaction is negotiated. During the time a delayed delivery sell is outstanding, the contract is marked-to-market daily and equivalent deliverable securities are held for the transaction. The value of the securities purchased on a delayed delivery or when-issued basis are identified as such in the Fund's Schedule of Investments. The Fund may receive compensation for interest forgone in the purchase of a delayed delivery or when-issued security. With respect to purchase commitments, the Fund identifies securities as segregated in its records with a value at least equal to the amount of the commitment. Losses may arise due to changes in the value of the underlying securities or if the counterparty does not perform under the contract's terms, or if the issuer does not issue the securities due to political, economic, or other factors.
Restricted Securities. The Fund may invest in securities that are subject to legal or contractual restrictions on resale. These securities generally may be resold in transactions exempt from registration or to the public if the securities are registered. Disposal of these securities may involve time-consuming negotiations and expense, and prompt sale at an acceptable price may be difficult. Information regarding restricted securities is included at the end of the Fund's Schedule of Investments.
Swap Agreements. The Fund may invest in swaps for the purpose of managing its exposure to interest rate, credit or market risk.
Interest rate swaps are agreements to exchange cash flows periodically based on a notional principal amount, for example, the exchange of fixed rate interest payments for floating rate interest payments. The primary risk associated with interest rate swaps is that unfavorable changes in the fluctuation of interest rates could adversely impact a fund.
Credit default swaps involve the exchange of a fixed rate premium for protection against the loss in value of an underlying debt instrument in the event of a defined credit event (such as payment default or bankruptcy). Under the terms of the swap, one party acts as a "guarantor" receiving a periodic payment that is a fixed percentage applied to a notional principal amount. In return the party agrees to purchase the notional amount of the underlying instrument, at par, if a credit event occurs during the term of the swap. The Fund may enter into credit default swaps in which either it or its counterparty act as guarantors. By acting as the guarantor of a swap, a fund assumes the market and credit risk of the underlying instrument including liquidity and loss of value.
Swaps are marked-to-market daily based on dealer-supplied valuations and changes in value are recorded as unrealized appreciation (depreciation). Gains or losses are realized upon early termination of the swap agreement. Collateral, in the form of cash or securities, may be required to be held in segregated accounts with a fund's custodian in compliance with swap contracts. Risks may exceed amounts recognized on the Statement of Assets and Liabilities. These risks include changes in the returns of the underlying instruments, failure of the counterparties to perform under the contracts' terms and the possible lack of liquidity with respect to the swap agreements. Details of swap agreements open at period end are included in the Fund's Schedule of Investments under the caption "Swap Agreements."
Mortgage Dollar Rolls. To earn additional income, the Fund may employ trading strategies which involve the sale and simultaneous agreement to repurchase similar securities ("mortgage dollar rolls") or the purchase and simultaneous agreement to sell similar securities ("reverse mortgage dollar rolls"). The securities traded are mortgage securities and bear the same interest rate but may be collateralized by different pools of mortgages. During the period between the sale and repurchase in a mortgage dollar roll transaction, a fund will not be entitled to receive interest and principal payments on the securities sold but will invest the proceeds of the sale in other securities which may enhance the yield and total return. In addition, the difference between the sale price and the future purchase price, including the associated financing cost, if any, is recorded as an adjustment to investment income. During the period between the purchase and subsequent sale in a reverse mortgage dollar roll transaction a fund is entitled to interest and principal payments on the securities purchased. The price differential between the purchase and sale is recorded as an adjustment to investment income. Losses may arise due to changes in the value of the securities or if the counterparty does not perform under the terms of the agreement. If the counterparty files for bankruptcy or becomes insolvent, a fund's right to repurchase or sell securities may be limited.
Not Part of Financial Report
Notes to Financial Statements - continued
5. Purchases and Sales of Investments.
Purchases and sales of securities (including the Fixed-Income Central Funds), other than short-term securities and U.S. government securities, aggregated $851,816,325 and $562,632,384, respectively.
6. Fees and Other Transactions with Affiliates.
Management Fee. FIMM provides the Fund with investment management services. The Fund does not pay any fees for these services. Pursuant to the Fund's management contract with FIMM, FMR pays FIMM a portion of the management fees it receives from the Investing Funds. In addition, under an expense contract, FMR also pays all other expenses of the Fund, excluding custody fees, the compensation of the independent Trustees, and certain exceptions such as interest expense.
7. Expense Reductions.
FMR has voluntarily agreed to reimburse a portion of the Fund's operating expenses. During the period, this reimbursement reduced the Fund's expenses by $10,717.
In addition, through arrangements with the Fund's custodian, credits realized as a result of uninvested cash balances were used to reduce the Fund's expenses. During the period, these credits reduced the Fund's expenses by $14,266.
8. Other.
The Fund's organizational documents provide former and current trustees and officers with a limited indemnification against liabilities arising in connection with the performance of their duties to the Fund. In the normal course of business, the Fund may also enter into contracts that provide general indemnifications. The Fund's maximum exposure under these arrangements is unknown as this would be dependent on future claims that may be made against the Fund. The risk of material loss from such claims is considered remote.
At the end of the period mutual funds managed by FMR or an FMR affiliate were the owners of record of all of the outstanding shares of the Fund according to the following schedule:
Fund | Ownership % |
VIP Asset Manager Portfolio | 21.5% |
VIP Asset Manager: Growth Portfolio | 1.4% |
VIP Balanced Portfolio | 6.9% |
VIP Investment Grade Bond Portfolio | 70.2% |
9. Credit Risk.
The Fund may have direct or indirect exposure to securities of issuers that hold mortgage securities, including securities backed by subprime mortgage loans. The value and related income of these securities is sensitive to changes in economic conditions, including delinquencies and/or defaults, and may be adversely affected by shifts in the market's perception of the issuers and changes in interest rates.
Not Part of Financial Report
Report of Independent Registered Public Accounting Firm
To the Trustees of Fidelity Garrison Street Trust and Shareholders of Fidelity VIP Investment Grade Central Fund:
We have audited the accompanying statement of assets and liabilities of Fidelity VIP Investment Grade Central Fund (the Fund), a fund of Fidelity Garrison Street Trust, including the schedule of investments, as of December 31, 2007, and the related statement of operations for the year then ended, and the statements of changes in net assets and the financial highlights for the year ended December 31, 2007 and for the period from June 23, 2006 (commencement of operations) to December 31, 2006. These financial statements and financial highlights are the responsibility of the Fund's management. Our responsibility is to express an opinion on these financial statements and financial highlights based on our audits.
We conducted our audits in accordance with standards of the Public Company Accounting Oversight Board (United States). Those standards require that we plan and perform the audit to obtain reasonable assurance about whether the financial statements and financial highlights are free of material misstatement. The Fund is not required to have, nor were we engaged to perform, an audit of its internal control over financial reporting. Our audits included consideration of internal control over financial reporting as a basis for designing audit procedures that are appropriate in the circumstances, but not for the purpose of expressing an opinion on the effectiveness of the Fund's internal control over financial reporting. Accordingly, we express no such opinion. An audit also includes examining, on a test basis, evidence supporting the amounts and disclosures in the financial statements, assessing the accounting principles used and significant estimates made by management, as well as evaluating the overall financial statement presentation. Our procedures included confirmation of securities owned as of December 31, 2007, by correspondence with the custodians and brokers[; where replies were not received from brokers, we performed other auditing procedures]. We believe that our audits provide a reasonable basis for our opinion.
In our opinion, the financial statements and financial highlights referred to above present fairly, in all material respects, the financial position of Fidelity VIP Investment Grade Central Fund as of December 31, 2007, the results of its operations for the year then ended, the changes in its net assets and the financial highlights for the year ended December 31, 2007 and for the period from June 23, 2006 (commencement of operations) to December 31, 2006, in conformity with accounting principles generally accepted in the United States of America.
/s/ Deloitte & Touche LLP
DELOITTE & TOUCHE LLP
Boston, Massachusetts
February 28, 2008
Not Part of Financial Report
Trustees and Officers
The Trustees, Members of the Advisory Board, and executive officers of the trust and fund, as applicable, are listed below. The Board of Trustees governs the fund and is responsible for protecting the interests of shareholders. The Trustees are experienced executives who meet periodically throughout the year to oversee the fund's activities, review contractual arrangements with companies that provide services to the fund, and review the fund's performance. Except for James C. Curvey, each of the Trustees oversees 373 funds advised by FMR or an affiliate. Mr. Curvey oversees 368 funds advised by FMR or an affiliate.
The Trustees hold office without limit in time except that (a) any Trustee may resign; (b) any Trustee may be removed by written instrument, signed by at least two-thirds of the number of Trustees prior to such removal; (c) any Trustee who requests to be retired or who has become incapacitated by illness or injury may be retired by written instrument signed by a majority of the other Trustees; and (d) any Trustee may be removed at any special meeting of shareholders by a two-thirds vote of the outstanding voting securities of the trust. Each Trustee who is not an interested person (as defined in the 1940 Act) (Independent Trustee), shall retire not later than the last day of the calendar year in which his or her 72nd birthday occurs. The Independent Trustees may waive this mandatory retirement age policy with respect to individual Trustees. The executive officers and Advisory Board Members hold office without limit in time, except that any officer and Advisory Board Member may resign or may be removed by a vote of a majority of the Trustees at any regular meeting or any special meeting of the Trustees. Except as indicated, each individual has held the office shown or other offices in the same company for the past five years.
The fund's Statement of Additional Information (SAI) includes more information about the Trustees. To request a free copy, call Fidelity at 1-877-208-0098.
Interested Trustees*:
Correspondence intended for each Trustee who is an interested person may be sent to Fidelity Investments, 82 Devonshire Street, Boston, Massachusetts 02109.
Name, Age; Principal Occupation |
Edward C. Johnson 3d (77) |
| Year of Election or Appointment: 1986 Mr. Johnson is Chairman of the Board of Trustees. Mr. Johnson serves as President (2006-present), Chief Executive Officer, Chairman, and a Director of FMR LLC; Chairman and a Director of FMR; Chairman and a Director of Fidelity Research & Analysis Company (FRAC); Chairman and a Director of Fidelity Investments Money Management, Inc.; and Chairman (2001-present) and a Director of FMR Co., Inc. In addition, Mr. Johnson serves as Chairman and Director of Fidelity International Limited (FIL). Mr. Edward C. Johnson 3d and Mr. Arthur E. Johnson are not related. |
James C. Curvey (72) |
| Year of Election or Appointment: 2007 Mr. Curvey also serves as Trustee (2007-present) or Member of the Advisory Board (2007-present) of other investment companies advised by FMR. Mr. Curvey is a Director of FMR and FMR Co., Inc. (2007-present). Mr. Curvey is also Vice Chairman (2006-present) and Director of FMR LLC. Mr. Curvey joined Fidelity in 1982 and served in numerous senior management positions, including President and Chief Operating Officer of FMR LLC (1997-2000) and President of Fidelity Strategic Investments (2000-2002). In addition, he serves as a member of the Board of Directors of Geerlings & Wade, Inc. (wine distribution). |
* Trustees have been determined to be "Interested Trustees" by virtue of, among other things, their affiliation with the trust or various entities under common control with FMR. FMR Corp. merged with and into FMR LLC on October 1, 2007. Any references to FMR LLC for prior periods are deemed to be references to the prior entity.
Independent Trustees:
Correspondence intended for each Independent Trustee (that is, the Trustees other than the Interested Trustees) may be sent to Fidelity Investments, P.O. Box 55235, Boston, Massachusetts 02205-5235.
Name, Age; Principal Occupation |
Dennis J. Dirks (59) |
| Year of Election or Appointment: 2005 Prior to his retirement in May 2003, Mr. Dirks was Chief Operating Officer and a member of the Board of The Depository Trust & Clearing Corporation (DTCC) (1999-2003). He also served as President, Chief Operating Officer, and Board member of The Depository Trust Company (DTC) (1999-2003) and President and Board member of the National Securities Clearing Corporation (NSCC) (1999-2003). In addition, Mr. Dirks served as Chief Executive Officer and Board member of the Government Securities Clearing Corporation (2001-2003) and Chief Executive Officer and Board member of the Mortgage-Backed Securities Clearing Corporation (2001-2003). Mr. Dirks also serves as a Trustee and a member of the Finance Committee of Manhattan College (2005-present) and a Trustee and a member of the Finance Committee of AHRC of Nassau County (2006-present). |
Albert R. Gamper, Jr. (65) |
| Year of Election or Appointment: 2006 Prior to his retirement in December 2004, Mr. Gamper served as Chairman of the Board of CIT Group Inc. (commercial finance). During his tenure with CIT Group Inc. Mr. Gamper served in numerous senior management positions, including Chairman (1987-1989; 1999-2001; 2002-2004), Chief Executive Officer (1987-2004), and President (1989-2002). He currently serves as a member of the Board of Directors of Public Service Enterprise Group (utilities, 2001-present), Chairman of the Board of Governors, Rutgers University (2004-present), and Chairman of the Board of Saint Barnabas Health Care System. |
George H. Heilmeier (71) |
| Year of Election or Appointment: 2004 Dr. Heilmeier is Chairman Emeritus of Telcordia Technologies (communication software and systems), where prior to his retirement, he served as company Chairman and Chief Executive Officer. He currently serves on the Boards of Directors of The Mitre Corporation (systems engineering and information technology support for the government), and HRL Laboratories (private research and development, 2004-present). He is Chairman of the General Motors Science & Technology Advisory Board and a Life Fellow of the Institute of Electrical and Electronics Engineers (IEEE). Dr. Heilmeier is a member of the Defense Science Board and the National Security Agency Advisory Board. He is also a member of the National Academy of Engineering, the American Academy of Arts and Sciences, and the Board of Overseers of the School of Engineering and Applied Science of the University of Pennsylvania. Previously, Dr. Heilmeier served as a Director of TRW Inc. (automotive, space, defense, and information technology, 1992-2002), Compaq (1994-2002), Automatic Data Processing, Inc. (ADP) (technology-based business outsourcing, 1995-2002), INET Technologies Inc. (telecommunications network surveillance, 2001-2004), and Teletech Holdings (customer management services). He is the recipient of the 2005 Kyoto Prize in Advanced Technology for his invention of the liquid crystal display, and a member of the Consumer Electronics Hall of Fame. |
James H. Keyes (67) |
| Year of Election or Appointment: 2007 Prior to his retirement in 2003, Mr. Keyes was Chairman, President, and Chief Executive Officer of Johnson Controls, Inc. (automotive supplier, 1993-2003). He currently serves as a member of the boards of LSI Logic Corporation (semiconductor technologies), Navistar International Corporation (manufacture and sale of trucks, buses, and diesel engines, 2002-present), and Pitney Bowes, Inc. (integrated mail, messaging, and document management solutions). |
Marie L. Knowles (61) |
| Year of Election or Appointment: 2001 Prior to Ms. Knowles' retirement in June 2000, she served as Executive Vice President and Chief Financial Officer of Atlantic Richfield Company (ARCO) (diversified energy, 1996-2000). From 1993 to 1996, she was a Senior Vice President of ARCO and President of ARCO Transportation Company. She served as a Director of ARCO from 1996 to 1998. She currently serves as a Director of Phelps Dodge Corporation (copper mining and manufacturing) and McKesson Corporation (healthcare service, 2002-present). Ms. Knowles is a Trustee of the Brookings Institution and the Catalina Island Conservancy and also serves as a member of the Advisory Board for the School of Engineering of the University of Southern California. |
Ned C. Lautenbach (63) |
| Year of Election or Appointment: 2000 Mr. Lautenbach is Chairman of the Independent Trustees (2006-present). Mr. Lautenbach has been a partner of Clayton, Dubilier & Rice, Inc. (private equity investment firm) since September 1998. Previously, Mr. Lautenbach was with the International Business Machines Corporation (IBM) from 1968 until his retirement in 1998. Mr. Lautenbach serves as a Director of Sony Corporation (2006-present) and Eaton Corporation (diversified industrial) as well as the Philharmonic Center for the Arts in Naples, Florida. He also is a member of the Board of Trustees of Fairfield University (2005-present), as well as a member of the Council on Foreign Relations. |
Cornelia M. Small (63) |
| Year of Election or Appointment: 2005 Ms. Small is a member (2000-present) and Chairperson (2002-present) of the Investment Committee, and a member (2002-
present) of the Board of Trustees of Smith College. Previously, she served as Chief Investment Officer (1999-2000), Director of Global Equity Investments (1996-1999), and a member of the Board of Directors of Scudder, Stevens & Clark (1990-1997) and Scudder Kemper Investments (1997-1999). In addition, Ms. Small served as Co-Chair (2000-2003) of the Annual Fund for the Fletcher School of Law and Diplomacy. |
William S. Stavropoulos (68) |
| Year of Election or Appointment: 2001 Mr. Stavropoulos is Chairman Emeritus of the Board of Directors of The Dow Chemical Company. Since joining The Dow Chemical Company in 1967, Mr. Stavropoulos served in numerous senior management positions, including President (1993-2000; 2002-2003), CEO (1995-2000; 2002-2004), and Chairman of the Executive Committee (2000-2004). Currently, he is a Director of NCR Corporation (data warehousing and technology solutions), Chemical Financial Corporation, Maersk Inc. (industrial conglomerate, 2002-present), Tyco International, Inc. (multinational manufacturing and services, 2007-present), and a member of the Advisory Board for Metalmark Capital (private equity investment firm, 2005-present). He is a special advisor to Clayton, Dubilier & Rice, Inc., a private equity investment firm. He also serves as a member of the Board of Trustees of the American Enterprise Institute for Public Policy Research. In addition, Mr. Stavropoulos is a member of The Business Council, J.P. Morgan International Council and the University of Notre Dame Advisory Council for the College of Science. |
Kenneth L. Wolfe (68) |
| Year of Election or Appointment: 2005 Mr. Wolfe is Chairman and a Director of Hershey Foods Corporation (2007-present), where prior to his retirement in 2001, he was Chairman and Chief Executive Officer. Mr. Wolfe currently serves as a member of the board of Revlon Inc. (2004-present). Previously, Mr. Wolfe served as a member of the boards of Adelphia Communications Corporation (2003-2006) and Bausch & Lomb, Inc. (1993-2007). |
Advisory Board Members and Executive Officers**:
Correspondence intended for Mr. Mauriello, Mr. Thomas, Mr. Wiley, Mr. Lacy, and Mr. Arthur Johnson may be sent to Fidelity Investments, P.O. Box 55235, Boston, Massachusetts 02205-5235. Correspondence intended for each executive officer and Mr. Lynch may be sent to Fidelity Investments, 82 Devonshire Street, Boston, Massachusetts 02109.
Name, Age; Principal Occupation |
Arthur E. Johnson (60) |
| Year of Election or Appointment: 2008 Member of the Advisory Board of Fidelity Garrison Street Trust. Mr. Johnson serves as Senior Vice President of Corporate Strategic Development of Lockheed Martin Corporation (defense contractor). In addition, Mr. Johnson serves as a member of the Board of Directors of AGL Resources, Inc. (holding company, 2002-present), and IKON Office Solutions, Inc. (document management systems and services). Mr. Arthur E. Johnson and Mr. Edward C. Johnson 3d are not related. |
Alan J. Lacy (54) |
| Year of Election or Appointment: 2008 Member of the Advisory Board of Fidelity Garrison Street Trust. Mr. Lacy serves as Senior Adviser (2007-present) of Oak Hill Capital Partners, L.P. (a private equity firm). Mr. Lacy also served as Vice Chairman and Chief Executive Officer of Sears Holdings Corporation and Sears, Roebuck and Co. (retail, 2005-2006; 2000-2005). In addition, Mr. Lacy serves as a member of the Board of Directors of The Western Union Company (global money transfer, 2006-present) and Bristol-Myers Squibb (global pharmaceuticals, 2007-present). Mr. Lacy is a Trustee of the National Parks Conservation Association and The Field Museum of Natural History. |
Peter S. Lynch (63) |
| Year of Election or Appointment: 2003 Member of the Advisory Board of Fidelity Garrison Street Trust. Mr. Lynch is Vice Chairman and a Director of FMR, and Vice Chairman (2001-present) and a Director of FMR Co., Inc. Previously, Mr. Lynch served as a Trustee of the Fidelity funds (1990-2003). In addition, he serves as a Trustee of Boston College and as the Chairman of the Inner-City Scholarship Fund. |
Joseph Mauriello (63) |
| Year of Election or Appointment: 2007 Member of the Advisory Board of Fidelity Garrison Street Trust. Prior to his retirement in January 2006, Mr. Mauriello served in numerous senior management positions including Deputy Chairman and Chief Operating Officer (2004-2005), and Vice Chairman of Financial Services (2002-2004) of KPMG LLP US (professional services firm, 1965-2005). Mr. Mauriello currently serves as a member of the Board of Directors of XL Capital Ltd. (global insurance and re-insurance company, 2006-present) and of Arcadia Resources Inc. (health care services and products, 2007-present). He also served as a Director of the Hamilton Funds of the Bank of New York (2006-2007). |
David M. Thomas (58) |
| Year of Election or Appointment: 2007 Member of the Advisory Board of Fidelity Garrison Street Trust. Previously, Mr. Thomas served as Executive Chairman (2005-2006) and Chairman and Chief Executive Officer (2000-2005) of IMS Health, Inc. (pharmaceutical and healthcare information solutions). In addition, Mr. Thomas serves as a member of the Board of Directors of Fortune Brands, Inc. (consumer products holding company), and Interpublic Group of Companies, Inc. (marketing communication, 2004-present). |
Michael E. Wiley (57) |
| Year of Election or Appointment: 2007 Member of the Advisory Board of Fidelity Garrison Street Trust. Mr. Wiley also serves as a member of the Board of Trustees of the University of Tulsa (2000-2006; 2007-present). He serves as a Director of Tesoro Corporation (independent oil refiner and marketer, 2005-present), and a Director of Bill Barrett Corporation (exploration and production company, 2005-present). In addition, he also serves as a Director of Post Oak Bank (privately-held bank, 2004-present). Previously, Mr. Wiley served as a Sr. Energy Advisor of Katzenbach Partners, LLC (consulting firm, 2006-2007), as an Advisory Director of Riverstone Holdings (private investment firm), Chairman, President, and CEO of Baker Hughes, Inc. (oilfield services company, 2000-2004), and as Director of Spinnaker Exploration Company (exploration and production company, 2001-2005). |
Kimberley H. Monasterio (44) |
| Year of Election or Appointment: 2007 President and Treasurer of VIP Investment Grade Central Fund. Ms. Monasterio also serves as President and Treasurer of other Fidelity funds (2007-present) and is an employee of FMR (2004-present). Previously, Ms. Monasterio served as Deputy Treasurer of the Fidelity funds (2004-2006). Before joining Fidelity Investments, Ms. Monasterio served as Treasurer (2000-2004) and Chief Financial Officer (2002-2004) of the Franklin Templeton Funds and Senior Vice President of Franklin Templeton Services, LLC (2000-2004). |
Boyce I. Greer (51) |
| Year of Election or Appointment: 2006 Vice President of VIP Investment Grade Central Fund. Mr. Greer also serves as Vice President of certain Asset Allocation Funds (2005-present), Fixed-Income Funds (2006-present), and Money Market Funds (2006-present). Mr. Greer is also a Trustee of other investment companies advised by FMR (2003-present). Mr. Greer is an Executive Vice President of FMR (2005-present) and FMR Co., Inc. (2005-present), and Senior Vice President of Fidelity Investments Money Management, Inc. (2006-present). Previously, Mr. Greer served as Vice President of certain Fidelity Equity Funds (2005-2007), a Director and Managing Director of Strategic Advisers, Inc. (2002-2005), and Executive Vice President (2000-2002) and Money Market Group Leader (1997-2002) of the Fidelity Investments Fixed Income Division. Mr. Greer also served as Vice President of Fidelity's Money Market Funds (1997-2002), Senior Vice President of FMR (1997-2002), and Vice President of FIMM (1998-2002). |
Thomas J. Silvia (46) |
| Year of Election or Appointment: 2005 Vice President of VIP Investment Grade Central Fund. Mr. Silvia also serves as Vice President of Fidelity's Fixed-Income Funds (2005-present) and Senior Vice President and Bond Group Leader of the Fidelity Investments Fixed-Income Division (2005-
present). Previously, Mr. Silvia served as Vice President of certain Balanced Funds (2005-2007), certain Asset Allocation Funds (2005-2007), a Director of Fidelity's Taxable Bond portfolio managers (2002-2004) and a portfolio manager in the Bond Group (1997-2004). |
Eric D. Roiter (59) |
| Year of Election or Appointment: 2006 Secretary of VIP Investment Grade Central Fund. He also serves as Secretary of other Fidelity funds; Vice President, General Counsel, and Secretary of FMR Co., Inc. (2001-present) and FMR; Assistant Secretary of Fidelity Management & Research (U.K.) Inc. (2001-present), Fidelity Research & Analysis Company (2001-present), and Fidelity Investments Money Management, Inc. (2001-present). Mr. Roiter is an Adjunct Member, Faculty of Law, at Boston College Law School (2003-present). Previously, Mr. Roiter served as Vice President and Secretary of Fidelity Distributors Corporation (FDC) (1998-2005). |
John B. McGinty, Jr. (45) |
| Year of Election or Appointment: 2008 Assistant Secretary of VIP Investment Grade Central Fund. Mr. McGinty also serves as Assistant Secretary of other Fidelity funds (2008-present) and is an employee of FMR LLC (2004-present). Mr. McGinty also serves as Senior Vice President, Secretary, and Chief Legal Officer of FDC (2007-present). Before joining Fidelity Investments, Mr. McGinty practiced law at Ropes & Gray, LLP. |
R. Stephen Ganis (41) |
| Year of Election or Appointment: 2006 Anti-Money Laundering (AML) officer of VIP Investment Grade Central Fund. Mr. Ganis also serves as AML officer of other Fidelity funds (2006-present) and FMR LLC (2003-present). Before joining Fidelity Investments, Mr. Ganis practiced law at Goodwin Procter, LLP (2000-2002). |
Joseph B. Hollis (59) |
| Year of Election or Appointment: 2006 Chief Financial Officer of VIP Investment Grade Central Fund. Mr. Hollis also serves as Chief Financial Officer of other Fidelity funds. Mr. Hollis is President of Fidelity Pricing and Cash Management Services (FPCMS) (2005-present). Mr. Hollis also serves as President and Director of Fidelity Service Company, Inc. (2006-present). Previously, Mr. Hollis served as Senior Vice President of Cash Management Services (1999-2002) and Investment Management Operations (2002-2005). |
Kenneth A. Rathgeber (60) |
| Year of Election or Appointment: 2006 Chief Compliance Officer of VIP Investment Grade Central Fund. Mr. Rathgeber also serves as Chief Compliance Officer of other Fidelity funds (2004-present) and Executive Vice President of Risk Oversight for Fidelity Investments (2002-present). He is Chief Compliance Officer of FMR (2005-present), FMR Co., Inc. (2005-present), Fidelity Management & Research (U.K.) Inc. (2005-present), Fidelity Research & Analysis Company (2005-present), Fidelity Investments Money Management, Inc. (2005-
present), and Strategic Advisers, Inc. (2005-present). Previously, Mr. Rathgeber served as Executive Vice President and Chief Operating Officer for Fidelity Investments Institutional Services Company, Inc. (1998-2002). |
Bryan A. Mehrmann (46) |
| Year of Election or Appointment: 2006 Deputy Treasurer of VIP Investment Grade Central Fund. Mr. Mehrmann also serves as Deputy Treasurer of other Fidelity funds (2005-present) and is an employee of FMR. Previously, Mr. Mehrmann served as Vice President of Fidelity Investments Institutional Services Group (FIIS)/Fidelity Investments Institutional Operations Corporation, Inc. (FIIOC) Client Services (1998-2004). |
Kenneth B. Robins (38) |
| Year of Election or Appointment: 2006 Deputy Treasurer of VIP Investment Grade Central Fund. Mr. Robins also serves as Deputy Treasurer of other Fidelity funds (2005-present) and is an employee of FMR (2004-present). Before joining Fidelity Investments, Mr. Robins worked at KPMG LLP, where he was a partner in KPMG's department of professional practice (2002-2004) and a Senior Manager (1999-2000). In addition, Mr. Robins served as Assistant Chief Accountant, United States Securities and Exchange Commission (2000-2002). |
Robert G. Byrnes (41) |
| Year of Election or Appointment: 2006 Assistant Treasurer of VIP Investment Grade Central Fund. Mr. Byrnes also serves as Assistant Treasurer of other Fidelity funds (2005-present) and is an employee of FMR (2005-present). Previously, Mr. Byrnes served as Vice President of FPCMS (2003-2005). Before joining Fidelity Investments, Mr. Byrnes worked at Deutsche Asset Management where he served as Vice President of the Investment Operations Group (2000-2003). |
Peter L. Lydecker (53) |
| Year of Election or Appointment: 2006 Assistant Treasurer of VIP Investment Grade Central Fund. Mr. Lydecker also serves as Assistant Treasurer of other Fidelity funds (2004) and is an employee of FMR. |
Paul M. Murphy (60) |
| Year of Election or Appointment: 2007 Assistant Treasurer of VIP Investment Grade Central Fund. Mr. Murphy also serves as Assistant Treasurer of other Fidelity funds (2007-present) and is an employee of FMR (2007-present). Previously, Mr. Murphy served as Chief Financial Officer of the Fidelity Funds (2005-2006), Vice President and Associate General Counsel of FMR (2007), and Senior Vice President of Fidelity Pricing and Cash Management Services Group (FPCMS) (1994-2007). |
Gary W. Ryan (49) |
| Year of Election or Appointment: 2006 Assistant Treasurer of VIP Investment Grade Central Fund. Mr. Ryan also serves as Assistant Treasurer of other Fidelity funds (2005-present) and is an employee of FMR (2005-present). Previously, Mr. Ryan served as Vice President of Fund Reporting in FPCMS (1999-2005). |
** FMR Corp. merged with and into FMR LLC on October 1, 2007. Any references to FMR LLC for prior periods are deemed to be references to the prior entity.
Not Part of Financial Report
Distributions
The Board of Trustees of VIP Investment Grade Central Fund voted to pay on February 8, 2008, to shareholders of record at the opening of business on February 8, 2008, a distribution of $0.22 per share derived from capital gains realized from sales of portfolio securities.
The fund hereby designates as a capital gain dividend with respect to the taxable year ended December 31, 2007, $3,375,373, or, if subsequently determined to be different, the net capital gain of such year.
A total of 16.18% of the dividends distributed during the fiscal year was derived from interest on U.S. Government securities which is generally exempt from state income tax.
The fund will notify shareholders in January 2008 of amounts for use in preparing 2007 income tax returns.
Not Part of Financial Report
Investment Adviser
Fidelity Management & Research Company
Boston, MA
Investment Sub-Adviser
Fidelity Investments Money Management, Inc.
Fidelity Research & Analysis Company
Fidelity International Investment Advisors
Fidelity International Investment Advisors (U.K.) Limited
General Distributor
Fidelity Distributors Corporation
Boston, MA
Transfer and Service Agents
Fidelity Investments Institutional Operations Co., Inc.
Boston, MA
Fidelity Service Company, Inc.
Boston, MA
Custodian
The Bank of New York
New York, NY
VIPIGB-ANN-0208
1.540025.110
Fidelity® Variable Insurance Products:
Investor Freedom Funds -
Income, 2005, 2010, 2015, 2020, 2025, 2030
Annual Report
December 31, 2007
(2_fidelity_logos) (Registered_Trademark)
Contents
To view a fund's proxy voting guidelines and proxy voting record for the 12-month period ended June 30, visit http://www.fidelity.com (search for "proxy voting guidelines") or visit the Securities and Exchange Commission's (SEC) web site at http://www.sec.gov. You may also call 1-800-544-8544 to request a free copy of the proxy voting guidelines.
Fidelity Variable Insurance Products are separate account options which are purchased through a variable insurance contract.
Standard & Poor's, S&P and S&P 500 are registered service marks of The McGraw-Hill Companies, Inc. and have been licensed for use by Fidelity Distributors Corporation.
Other third party marks appearing herein are the property of their respective owners.
All other marks appearing herein are registered or unregistered trademarks or service marks of FMR LLC or an affiliated company.
This report and the financial statements contained herein are submitted for the general information of the shareholders of the funds. This report is not authorized for distribution to prospective investors in the funds unless preceded or accompanied by an effective prospectus.
A fund files its complete schedule of portfolio holdings with the SEC for the first and third quarters of each fiscal year on Form N-Q. Forms N-Q are available on the SEC's web site at http://www.sec.gov. A fund's Forms N-Q may be reviewed and copied at the SEC's Public Reference Room in Washington, DC. Information regarding the operation of the SEC's Public Reference Room may be obtained by calling 1-800-SEC-0330. For a complete list of a fund's portfolio holdings, view the most recent holdings listing, semiannual report, or annual report on Fidelity's web site at http://www.fidelity.com or http://www.advisor.fidelity.com, as applicable.
NOT FDIC INSURED · MAY LOSE VALUE · NO BANK GUARANTEE
Neither the fund nor Fidelity Distributors Corporation is a bank.
VIP Investor Freedom Portfolios
VIP Investor Freedom Income Portfolio
Performance: The Bottom Line
Average annual total return reflects the change in the value of an investment, assuming reinvestment of the fund's dividend income and capital gains (the profits earned upon the sale of securities that have grown in value, if any) and assuming a constant rate of performance each year. During periods of reimbursement by Fidelity, a fund's total return will be greater than it would be had the reimbursement not occurred. Performance numbers are net of all underlying fund operating expenses, but do not include any insurance charges imposed by your insurance company's separate account. If performance information included the effect of these additional charges, the total returns would have been lower. How a fund did yesterday is no guarantee of how it will do tomorrow.
Average Annual Total Returns
Periods ended December 31, 2007 | | Past 1
year | Life of fund A |
VIP Investor Freedom Income | | 6.08% | 5.94% |
A From August 3, 2005.
$10,000 Over Life of Fund
Let's say hypothetically that $10,000 was invested in VIP Investor Freedom Income Portfolio on August 3, 2005, when the fund started. The chart shows how the value of your investment would have changed, and also shows how the Lehman® Brothers U.S. Aggregate Index performed over the same period.
Annual Report
VIP Investor Freedom 2005 Portfolio
Performance: The Bottom Line
Average annual total return reflects the change in the value of an investment, assuming reinvestment of the fund's dividend income and capital gains (the profits earned upon the sale of securities that have grown in value, if any) and assuming a constant rate of performance each year. During periods of reimbursement by Fidelity, a fund's total return will be greater than it would be had the reimbursement not occurred. Performance numbers are net of all underlying fund operating expenses, but do not include any insurance charges imposed by your insurance company's separate account. If performance information included the effect of these additional charges, the total returns would have been lower. How a fund did yesterday is no guarantee of how it will do tomorrow.
Average Annual Total Returns
Periods ended December 31, 2007 | | Past 1
year | Life of fund A |
VIP Investor Freedom 2005 | | 8.55% | 8.58% |
A From August 3, 2005.
$10,000 Over Life of Fund
Let's say hypothetically that $10,000 was invested in VIP Investor Freedom 2005 Portfolio on August 3, 2005, when the fund started. The chart shows how the value of your investment would have changed, and also shows how the Lehman Brothers U.S. Aggregate Index performed over the same period.
VIP Investor Freedom Portfolios
VIP Investor Freedom 2010 Portfolio
Performance: The Bottom Line
Average annual total return reflects the change in the value of an investment, assuming reinvestment of the fund's dividend income and capital gains (the profits earned upon the sale of securities that have grown in value, if any) and assuming a constant rate of performance each year. During periods of reimbursement by Fidelity, a fund's total return will be greater than it would be had the reimbursement not occurred. Performance numbers are net of all underlying fund operating expenses, but do not include any insurance charges imposed by your insurance company's separate account. If performance information included the effect of these additional charges, the total returns would have been lower. How a fund did yesterday is no guarantee of how it will do tomorrow.
Average Annual Total Returns
Periods ended December 31, 2007 | | Past 1
year | Life of fund A |
VIP Investor Freedom 2010 | | 8.63% | 8.61% |
A From August 3, 2005.
$10,000 Over Life of Fund
Let's say hypothetically that $10,000 was invested in VIP Investor Freedom 2010 Portfolio on August 3, 2005, when the fund started. The chart shows how the value of your investment would have changed, and also shows how the Lehman Brothers U.S. Aggregate Index performed over the same period.
Annual Report
VIP Investor Freedom 2015 Portfolio
Performance: The Bottom Line
Average annual total return reflects the change in the value of an investment, assuming reinvestment of the fund's dividend income and capital gains (the profits earned upon the sale of securities that have grown in value, if any) and assuming a constant rate of performance each year. During periods of reimbursement by Fidelity, a fund's total return will be greater than it would be had the reimbursement not occurred. Performance numbers are net of all underlying fund operating expenses, but do not include any insurance charges imposed by your insurance company's separate account. If performance information included the effect of these additional charges, the total returns would have been lower. How a fund did yesterday is no guarantee of how it will do tomorrow.
Average Annual Total Returns
Periods ended December 31, 2007 | | Past 1
year | Life of fund A |
VIP Investor Freedom 2015 | | 9.26% | 9.71% |
A From August 3, 2005.
$10,000 Over Life of Fund
Let's say hypothetically that $10,000 was invested in VIP Investor Freedom 2015 Portfolio on August 3, 2005, when the fund started. The chart shows how the value of your investment would have changed, and also shows how the Standard & Poor's 500SM Index (S&P 500®) performed over the same period.

VIP Investor Freedom Portfolios
VIP Investor Freedom 2020 Portfolio
Performance: The Bottom Line
Average annual total return reflects the change in the value of an investment, assuming reinvestment of the fund's dividend income and capital gains (the profits earned upon the sale of securities that have grown in value, if any) and assuming a constant rate of performance each year. During periods of reimbursement by Fidelity, a fund's total return will be greater than it would be had the reimbursement not occurred. Performance numbers are net of all underlying fund operating expenses, but do not include any insurance charges imposed by your insurance company's separate account. If performance information included the effect of these additional charges, the total returns would have been lower. How a fund did yesterday is no guarantee of how it will do tomorrow.
Average Annual Total Returns
Periods ended December 31, 2007 | | Past 1
year | Life of fund A |
VIP Investor Freedom 2020 | | 10.20% | 10.66% |
A From August 3, 2005.
$10,000 Over Life of Fund
Let's say hypothetically that $10,000 was invested in VIP Investor Freedom 2020 Portfolio on August 3, 2005, when the fund started. The chart shows how the value of your investment would have changed, and also shows how the S&P 500 performed over the same period.
Annual Report
VIP Investor Freedom 2025 Portfolio
Performance: The Bottom Line
Average annual total return reflects the change in the value of an investment, assuming reinvestment of the fund's dividend income and capital gains (the profits earned upon the sale of securities that have grown in value, if any) and assuming a constant rate of performance each year. During periods of reimbursement by Fidelity, a fund's total return will be greater than it would be had the reimbursement not occurred. Performance numbers are net of all underlying fund operating expenses, but do not include any insurance charges imposed by your insurance company's separate account. If performance information included the effect of these additional charges, the total returns would have been lower. How a fund did yesterday is no guarantee of how it will do tomorrow.
Average Annual Total Returns
Periods ended December 31, 2007 | | Past 1
year | Life of fund A |
VIP Investor Freedom 2025 | | 10.39% | 11.05% |
A From August 3, 2005.
$10,000 Over Life of Fund
Let's say hypothetically that $10,000 was invested in VIP Investor Freedom 2025 Portfolio on August 3, 2005, when the fund started. The chart shows how the value of your investment would have changed, and also shows how the S&P 500 performed over the same period.
VIP Investor Freedom Portfolios
VIP Investor Freedom 2030 Portfolio
Performance: The Bottom Line
Average annual total return reflects the change in the value of an investment, assuming reinvestment of the fund's dividend income and capital gains (the profits earned upon the sale of securities that have grown in value, if any) and assuming a constant rate of performance each year. During periods of reimbursement by Fidelity, a fund's total return will be greater than it would be had the reimbursement not occurred. Performance numbers are net of all underlying fund operating expenses, but do not include any insurance charges imposed by your insurance company's separate account. If performance information included the effect of these additional charges, the total returns would have been lower. How a fund did yesterday is no guarantee of how it will do tomorrow.
Average Annual Total Returns
Periods ended December 31, 2007 | | Past 1
year | Life of fund A |
VIP Investor Freedom 2030 | | 11.28% | 11.91% |
A From August 3, 2005.
$10,000 Over Life of Fund
Let's say hypothetically that $10,000 was invested in VIP Investor Freedom 2030 Portfolio on August 3, 2005, when the fund started. The chart shows how the value of your investment would have changed, and also shows how the S&P 500 performed over the same period.
Annual Report
VIP Investor Freedom Portfolios
Management's Discussion of Fund Performance
Comments from Christopher Sharpe and Jonathan Shelon, Co-Portfolio Managers of VIP Investor Freedom Funds
U.S. equity markets, as measured by the bellwether Dow Jones Industrial AverageSM and the Standard & Poor's 500SM Index, registered their fifth consecutive year of positive returns in 2007, as the Dow rose 8.88% and the S&P 500® index advanced 5.49%. The tech-heavy NASDAQ Composite® Index did even better, increasing 10.55%. However, credit- and recession-related concerns carved deeply into stock prices late in 2007, pushing some major market measures into negative territory for the year overall, particularly smaller-cap and value-oriented benchmarks. Based largely on a weak U.S. dollar that boosted returns for U.S. investors, the Morgan Stanley Capital InternationalSM Europe, Australasia, and Far East (MSCI® EAFE®) Index - a gauge of developed stock markets outside the United States and Canada - beat most domestic equity measures, gaining 11.33%. Several European countries had outstanding performance, including Finland and Germany, while Australia also did very well. However, fallout from the credit crunch and concerns about export growth tempered U.K. stocks, while fears that Japanese financial companies would become embroiled in the U.S. subprime mortgage crisis contributed to a loss of more than 4% for the Japanese portion of the index. The emerging-markets stock asset class soared 39.78% according to the MSCI Emerging Markets index. The U.S. investment-grade bond market climbed 6.97% as measured by the Lehman Brothers® U.S. Aggregate Index, beating the 2.53% gain for the Merrill Lynch® U.S. High Yield Master II Constrained Index. The emerging-markets bond category shook off a sluggish first half of 2007 to finish the year with a respectable gain of 6.28% as measured by the J.P. Morgan Emerging Markets Bond Index (EMBI) Global, while the Citigroup® Non-U.S. Group of 7 Index - representing the debt performance of major global economies, excluding the United States - rose 13.05%.
VIP Investor Freedom Funds all recorded positive results for the year. (For specific portfolio performance results, please refer to the performance section of this report.) On an absolute basis, these returns were consistent with the kind of performance we would expect to see from a series of portfolios with different asset-allocation levels based on age-appropriate risks. On a relative basis versus their individual composite indexes, the Funds also did well, with all of them beating their respective benchmarks for the period. Overall performance was led by the Funds' underlying domestic and international equity asset classes. Both equity classes outperformed their benchmarks - the Dow Jones Wilshire 5000 Composite IndexSM, which rose 5.62%, and the MSCI EAFE, respectively - - thanks mostly to effective stock selection within their underlying funds. The Funds' investments in both short-term and high-yield bonds performed right in line with their respective benchmarks, with returns of 5.11% for the Lehman Brothers 3-Month Treasury Bill Index and 2.53% for the Merrill Lynch U.S. High Yield Master II Constrained Index. Meanwhile, the investment-grade bond class underperformed the 6.97% return of the Lehman Brothers U.S. Aggregate Index, in part because of its exposure to subprime-mortgage-backed securities, which saw their prices fall as the credit crunch worsened during the year.
Note to shareholders: Jonathan Shelon became Co-Portfolio Manager on September 4, 2007, replacing Ren Cheng, who was promoted to Chief Investment Officer of Fidelity's Global Asset Allocation Group.
The views expressed above reflect those of the portfolio manager(s) only through the end of the period as stated on the cover of this report and do not necessarily represent the views of Fidelity or any other person in the Fidelity organization. Any such views are subject to change at any time based upon market or other conditions and Fidelity disclaims any responsibility to update such views. These views may not be relied on as investment advice and, because investment decisions for a Fidelity fund are based on numerous factors, may not be relied on as an indication of trading intent on behalf of any Fidelity fund.
VIP Investor Freedom Portfolios
VIP Investor Freedom Portfolios
Shareholder Expense Example
As a shareholder of a Fund, you incur two types of costs: (1) transaction costs, and (2) ongoing costs, including other Fund expenses. This Example is intended to help you understand your ongoing costs (in dollars) of investing in the Funds and to compare these costs with the ongoing costs of investing in other mutual funds.
The Example is based on an investment of $1,000 invested at the beginning of the period and held for the entire period (July 1, 2007 to December 31, 2007).
Actual Expenses
The first line of the accompanying table for each fund provides information about actual account values and actual expenses. You may use the information in this line, together with the amount you invested, to estimate the expenses that you paid over the period. Simply divide your account value by $1,000.00 (for example, an $8,600 account value divided by $1,000.00 = 8.6), then multiply the result by the number in the first line for a fund under the heading entitled "Expenses Paid During Period" to estimate the expenses you paid on your account during this period. The estimate of expenses does not include any fees or other expenses of any variable annuity or variable life insurance product. If they were, the estimate of expenses you paid during the period would be higher, and your ending account value would be lower. In addition, each Fund, as a shareholder in underlying Fidelity Funds, will indirectly bear its pro rata share of the fees and expenses incurred by the underlying Fidelity Funds. These fees and expenses are not included in each Fund's annualized expense ratio used to calculate the expense estimates in the table below.
Hypothetical Example for Comparison Purposes
The second line of the accompanying table for each fund provides information about hypothetical account values and hypothetical expenses based on a fund's actual expense ratio and an assumed rate of return of 5% per year before expenses, which is not the Fund's actual return. The hypothetical account values and expenses may not be used to estimate the actual ending account balance or expenses you paid for the period. You may use this information to compare the ongoing costs of investing in the Fund and other funds. To do so, compare this 5% hypothetical example with the 5% hypothetical examples that appear in the shareholder reports of the other funds. The estimate of expenses does not include any fees or other expenses of any variable annuity or variable life insurance product. If they were, the estimate of expenses you paid during the period would be higher, and your ending account value would be lower. In addition, each Fund, as a shareholder in underlying Fidelity Funds, will indirectly bear its pro rata share of the fees and expenses incurred by the underlying Fidelity Funds. These fees and expenses are not included in each Fund's annualized expense ratio used to calculate the expense estimates in the table below.
Please note that the expenses shown in the table are meant to highlight your ongoing costs only and do not reflect any transaction costs. Therefore, the second line of the table is useful in comparing ongoing costs only, and will not help you determine the relative total costs of owning different funds.
| Beginning
Account Value
July 1, 2007 | Ending
Account Value
December 31, 2007 | Expenses Paid
During Period*
July 1, 2007
to December 31, 2007 |
VIP Investor Freedom Income | | | |
Actual | $ 1,000.00 | $ 1,025.80 | $ .00 |
HypotheticalA | $ 1,000.00 | $ 1,025.21 | $ .00 |
VIP Investor Freedom 2005 | | | |
Actual | $ 1,000.00 | $ 1,024.20 | $ .00 |
HypotheticalA | $ 1,000.00 | $ 1,025.21 | $ .00 |
VIP Investor Freedom 2010 | | | |
Actual | $ 1,000.00 | $ 1,024.20 | $ .00 |
HypotheticalA | $ 1,000.00 | $ 1,025.21 | $ .00 |
VIP Investor Freedom 2015 | | | |
Actual | $ 1,000.00 | $ 1,023.60 | $ .00 |
HypotheticalA | $ 1,000.00 | $ 1,025.21 | $ .00 |
VIP Investor Freedom 2020 | | | |
Actual | $ 1,000.00 | $ 1,021.50 | $ .00 |
HypotheticalA | $ 1,000.00 | $ 1,025.21 | $ .00 |
VIP Investor Freedom 2025 | | | |
Actual | $ 1,000.00 | $ 1,021.30 | $ .00 |
HypotheticalA | $ 1,000.00 | $ 1,025.21 | $ .00 |
VIP Investor Freedom 2030 | | | |
Actual | $ 1,000.00 | $ 1,018.50 | $ .00 |
HypotheticalA | $ 1,000.00 | $ 1,025.21 | $ .00 |
A 5% return per year before expenses
* Expenses are equal to each Fund's annualized expense ratio of .00%; multiplied by the average account value over the period, multiplied by 184/365 (to reflect the one-half year period). The fees and expenses of the underlying Fidelity Funds in which the Fund invests are not included in the Fund's annualized expense ratio.
Annual Report
VIP Investor Freedom Income Portfolio
Investment Changes
Fund Holdings as of December 31, 2007 |
| % of fund's investments | % of fund's investments 6 months ago |
Domestic Equity Funds | | |
VIP Contrafund Portfolio Investor Class | 3.2 | 3.2 |
VIP Equity-Income Portfolio Investor Class | 3.3 | 3.6 |
VIP Growth & Income Portfolio Investor Class | 3.6 | 3.6 |
VIP Growth Portfolio Investor Class | 3.9 | 3.7 |
VIP Mid Cap Portfolio Investor Class | 1.3 | 1.3 |
VIP Value Portfolio Investor Class | 2.8 | 3.1 |
VIP Value Strategies Portfolio Investor Class | 1.2 | 1.3 |
| 19.3 | 19.8 |
High Yield Fixed-Income Funds | | |
VIP High Income Portfolio Investor Class | 4.9 | 4.9 |
Investment Grade Fixed-Income Funds | | |
VIP Investment Grade Bond Portfolio Investor Class | 35.6 | 34.9 |
Short-Term Funds | | |
VIP Money Market Portfolio Investor Class | 40.2 | 40.4 |
| 100.0 | 100.0 |
Asset Allocation (% of fund's investments) |
Current |
 | Domestic Equity Funds | 19.3% | |
 | Investment Grade Fixed-Income Funds | 35.6% | |
 | High Yield Fixed-Income Funds | 4.9% | |
 | Short-Term Funds | 40.2% | |

Six months ago |
| Domestic Equity Funds | 19.8% | |
| Investment Grade Fixed-Income Funds | 34.9% | |
| High Yield Fixed-Income Funds | 4.9% | |
| Short-Term Funds | 40.4% | |

The six months ago allocation is based on the fund's holdings as of June 30, 2007. The current allocation is based on the fund's holdings as of December 31, 2007. |
VIP Investor Freedom Portfolios
VIP Investor Freedom Income Portfolio
Investments December 31, 2007
Showing Percentage of Total Value of Investment in Securities
Equity Funds - 19.3% |
| Shares | | Value |
Domestic Equity Funds - 19.3% |
VIP Contrafund Portfolio Investor Class | 23,304 | | $ 648,314 |
VIP Equity-Income Portfolio Investor Class | 27,969 | | 667,058 |
VIP Growth & Income Portfolio
Investor Class | 42,880 | | 727,242 |
VIP Growth Portfolio Investor Class | 17,244 | | 775,994 |
VIP Mid Cap Portfolio Investor Class | 7,157 | | 258,149 |
VIP Value Portfolio Investor Class | 43,197 | | 565,446 |
VIP Value Strategies Portfolio
Investor Class | 18,751 | | 234,956 |
TOTAL EQUITY FUNDS (Cost $3,776,826) | 3,877,159 |
Fixed-Income Funds - 40.5% |
| | | |
High Yield Fixed - Income Funds - 4.9% |
VIP High Income Portfolio Investor Class | 165,444 | | 986,049 |
Investment Grade Fixed - Income Funds - 35.6% |
VIP Investment Grade Bond Portfolio Investor Class | 561,715 | | 7,150,631 |
TOTAL FIXED-INCOME FUNDS (Cost $7,995,453) | 8,136,680 |
Short-Term Funds - 40.2% |
| | | |
VIP Money Market Portfolio
Investor Class
(Cost $8,077,439) | 8,077,439 | | 8,077,439 |
TOTAL INVESTMENT IN SECURITIES - 100% (Cost $19,849,718) | $ 20,091,278 |
See accompanying notes which are an integral part of the financial statements.
Annual Report
VIP Investor Freedom Income Portfolio
Financial Statements
Statement of Assets and Liabilities
| December 31, 2007 |
| | |
Assets | | |
Investment in securities, at value
(cost $19,849,718) - See accompanying schedule | | $ 20,091,278 |
Cash | | 41 |
Receivable for investments sold | | 13 |
Receivable for fund shares sold | | 390,807 |
Total assets | | 20,482,139 |
| | |
Liabilities | | |
Payable for investments purchased | $ 391,826 | |
Payable for fund shares redeemed | 22 | |
Total liabilities | | 391,848 |
| | |
Net Assets | | $ 20,090,291 |
Net Assets consist of: | | |
Paid in capital | | $ 19,592,375 |
Accumulated undistributed net realized gain (loss) on investments | | 256,356 |
Net unrealized appreciation (depreciation) on investments | | 241,560 |
Net Assets, for 1,862,356 shares outstanding | | $ 20,090,291 |
Net Asset Value, offering price
and redemption price
per share ($20,090,291 ÷ 1,862,356 shares) | | $ 10.79 |
Statement of Operations
| Year ended December 31, 2007 |
| | |
Investment Income | | |
Income distributions from underlying funds | | $ 601,801 |
Interest | | 16 |
Total income | | 601,817 |
| | |
Expenses | | |
Independent trustees' compensation | $ 51 | |
Total expenses before reductions | 51 | |
Expense reductions | (51) | 0 |
Net investment income (loss) | | 601,817 |
Realized and Unrealized Gain (Loss) Realized gain (loss) on sale of underlying fund shares | (37,931) | |
Capital gain distributions from underlying funds | 300,833 | 262,902 |
Change in net unrealized appreciation (depreciation) on underlying funds | | (10,346) |
Net gain (loss) | | 252,556 |
Net increase (decrease) in net assets resulting from operations | | $ 854,373 |
See accompanying notes which are an integral part of the financial statements.
VIP Investor Freedom Portfolios
Statement of Changes in Net Assets
| Year ended
December 31,
2007 | Year ended
December 31,
2006 |
Increase (Decrease) in Net Assets | | |
Operations | | |
Net investment income (loss) | $ 601,817 | $ 258,208 |
Net realized gain (loss) | 262,902 | 56,826 |
Change in net unrealized appreciation (depreciation) | (10,346) | 232,797 |
Net increase (decrease) in net assets resulting from operations | 854,373 | 547,831 |
Distributions to shareholders from net investment income | (862,051) | (18,224) |
Distributions to shareholders from net realized gain | (60,920) | - |
Total distributions | (922,971) | (18,224) |
Share transactions
Proceeds from sales of shares | 13,765,869 | 10,394,809 |
Reinvestment of distributions | 922,971 | 18,224 |
Cost of shares redeemed | (5,706,843) | (2,701,539) |
Net increase (decrease) in net assets resulting from share transactions | 8,981,997 | 7,711,494 |
Total increase (decrease) in net assets | 8,913,399 | 8,241,101 |
| | |
Net Assets | | |
Beginning of period | 11,176,892 | 2,935,791 |
End of period (including undistributed net investment income of $0 and undistributed net investment income of $257,810, respectively) | $ 20,090,291 | $ 11,176,892 |
Other Information Shares | | |
Sold | 1,264,692 | 1,005,357 |
Issued in reinvestment of distributions | 86,153 | 1,794 |
Redeemed | (525,477) | (259,623) |
Net increase (decrease) | 825,368 | 747,528 |
Financial Highlights
Years ended December 31, | 2007 | 2006 | 2005 G |
Selected Per-Share Data | | | |
Net asset value, beginning of period | $ 10.78 | $ 10.14 | $ 10.00 |
Income from Investment Operations | | | |
Net investment income (loss) E | .42 | .35 | .16 |
Net realized and unrealized gain (loss) | .22 | .34 | (.02) |
Total from investment operations | .64 | .69 | .14 |
Distributions from net investment income | (.58) | (.05) | - |
Distributions from net realized gain | (.06) | - | - |
Total distributions | (.63) I | (.05) | - |
Net asset value, end of period | $ 10.79 | $ 10.78 | $ 10.14 |
Total Return B, C, D | 6.08% | 6.83% | 1.40% |
Ratios to Average Net Assets F, H | | | |
Expenses before reductions | .00% | .00% | .00% A |
Expenses net of fee waivers, if any | .00% | .00% | .00% A |
Expenses net of all reductions | .00% | .00% | .00% A |
Net investment income (loss) | 3.90% | 3.39% | 4.04% A |
Supplemental Data | | | |
Net assets, end of period (000 omitted) | $ 20,090 | $ 11,177 | $ 2,936 |
Portfolio turnover rate | 38% | 40% | 1% |
A Annualized
B Total returns for periods of less than one year are not annualized.
C Total returns do not reflect charges attributable to your insurance company's separate account. Inclusion of these charges would reduce the total returns shown.
D Total returns would have been lower had certain expenses not been reduced during the periods shown.
E Calculated based on average shares outstanding during the period.
F Amounts do not include the activity of the underlying funds.
G For the period August 3, 2005 (commencement of operations) to December 31, 2005.
H Expense ratios reflect operating expenses of the Fund. Expenses before reductions do not reflect amounts reimbursed by the investment adviser or expense offset arrangements and do not represent the amount paid by the Fund during periods when reimbursements or reductions occur. Expense ratios before reductions for start-up periods may not be representative of longer term operating periods. Expenses net of fee waivers reflect expenses after reimbursement by the investment adviser but prior to reductions from expense offset arrangements. Expenses net of all reductions represent the net expenses paid by the Fund but do not include expenses of the investment companies in which the Fund invests.
I Total distributions of $.630 per share is comprised of distributions from net investment income of $.575 and distributions from net realized gain of $.055 per share.
See accompanying notes which are an integral part of the financial statements.
Annual Report
VIP Investor Freedom 2005 Portfolio
Investment Changes
Fund Holdings as of December 31, 2007 |
| % of fund's investments | % of fund's investments 6 months ago |
Domestic Equity Funds | | |
VIP Contrafund Portfolio Investor Class | 6.4 | 6.2 |
VIP Equity-Income Portfolio Investor Class | 6.5 | 7.2 |
VIP Growth & Income Portfolio Investor Class | 7.2 | 7.2 |
VIP Growth Portfolio Investor Class | 7.7 | 7.3 |
VIP Mid Cap Portfolio Investor Class | 2.6 | 2.6 |
VIP Value Portfolio Investor Class | 5.6 | 6.1 |
VIP Value Strategies Portfolio Investor Class | 2.3 | 2.6 |
| 38.3 | 39.2 |
International Equity Funds | | |
VIP Overseas Portfolio Investor Class R | 9.2 | 9.4 |
High Yield Fixed-Income Funds | | |
VIP High Income Portfolio Investor Class | 5.0 | 4.9 |
Investment Grade Fixed-Income Funds | | |
VIP Investment Grade Bond Portfolio Investor Class | 35.4 | 34.6 |
Short-Term Funds | | |
VIP Money Market Portfolio Investor Class | 12.1 | 11.9 |
| 100.0 | 100.0 |
Asset Allocation (% of fund's investments) |
Current |
| Domestic Equity Funds | 38.3% | |
| International Equity Funds | 9.2% | |
 | Investment Grade Fixed-Income Funds | 35.4% | |
 | High Yield Fixed-Income Funds | 5.0% | |
| Short-Term Funds | 12.1% | |

Six months ago |
| Domestic Equity Funds | 39.2% | |
| International Equity Funds | 9.4% | |
| Investment Grade Fixed-Income Funds | 34.6% | |
| High Yield Fixed-Income Funds | 4.9% | |
| Short-Term Funds | 11.9% | |

Expected |
| Domestic Equity Funds | 38.8% | |
| International Equity Funds | 8.8% | |
| Investment Grade Fixed-Income Funds | 33.8% | |
| High Yield Fixed-Income Funds | 5.0% | |
| Short-Term Funds | 13.6% | |

The fund invests according to an asset allocation strategy that becomes increasingly conservative over time. The six months ago allocation is based on the fund's holdings as of June 30, 2007. The current allocation is based on the fund's holdings as of December 31, 2007. The expected allocation represents the fund's anticipated allocation at June 30, 2008. |
VIP Investor Freedom Portfolios
VIP Investor Freedom 2005 Portfolio
Investments December 31, 2007
Showing Percentage of Total Value of Investment in Securities
Equity Funds - 47.5% |
| Shares | | Value |
Domestic Equity Funds - 38.3% |
VIP Contrafund Portfolio Investor Class | 19,776 | | $ 550,178 |
VIP Equity-Income Portfolio Investor Class | 23,523 | | 561,014 |
VIP Growth & Income Portfolio
Investor Class | 36,304 | | 615,711 |
VIP Growth Portfolio Investor Class | 14,691 | | 661,104 |
VIP Mid Cap Portfolio Investor Class | 6,059 | | 218,561 |
VIP Value Portfolio Investor Class | 36,323 | | 475,462 |
VIP Value Strategies Portfolio
Investor Class | 15,729 | | 197,089 |
TOTAL DOMESTIC EQUITY FUNDS | | 3,279,119 |
International Equity Funds - 9.2% |
VIP Overseas Portfolio Investor Class R | 31,266 | | 789,776 |
TOTAL EQUITY FUNDS (Cost $3,880,836) | 4,068,895 |
Fixed-Income Funds - 40.4% |
| | | |
High Yield Fixed - Income Funds - 5.0% |
VIP High Income Portfolio Investor Class | 71,043 | | 423,419 |
Investment Grade Fixed - Income Funds - 35.4% |
VIP Investment Grade Bond Portfolio Investor Class | 238,454 | | 3,035,523 |
TOTAL FIXED-INCOME FUNDS (Cost $3,392,505) | 3,458,942 |
Short-Term Funds - 12.1% |
| | | |
VIP Money Market Portfolio
Investor Class
(Cost $1,040,295) | 1,040,295 | | 1,040,295 |
TOTAL INVESTMENT IN SECURITIES - 100% (Cost $8,313,636) | $ 8,568,132 |
See accompanying notes which are an integral part of the financial statements.
Annual Report
VIP Investor Freedom 2005 Portfolio
Financial Statements
Statement of Assets and Liabilities
| December 31, 2007 |
| | |
Assets | | |
Investment in securities, at value
(cost $8,313,636) - See accompanying schedule | | $ 8,568,132 |
Cash | | 21 |
Receivable for investments sold | | 294,251 |
Total assets | | 8,862,404 |
| | |
Liabilities | | |
Payable for investments purchased | $ 139 | |
Payable for fund shares redeemed | 294,248 | |
Total liabilities | | 294,387 |
| | |
Net Assets | | $ 8,568,017 |
Net Assets consist of: | | |
Paid in capital | | $ 8,014,313 |
Accumulated undistributed net realized gain (loss) on investments | | 299,208 |
Net unrealized appreciation (depreciation) on investments | | 254,496 |
Net Assets, for 743,010 shares outstanding | | $ 8,568,017 |
Net Asset Value, offering price
and redemption price
per share ($8,568,017 ÷ 743,010 shares) | | $ 11.53 |
Statement of Operations
| Year ended December 31, 2007 |
| | |
Investment Income | | |
Income distributions from underlying funds | | $ 209,218 |
| | |
Expenses | | |
Independent trustees' compensation | $ 23 | |
Total expenses before reductions | 23 | |
Expense reductions | (23) | 0 |
Net investment income (loss) | | 209,218 |
Realized and Unrealized Gain (Loss) Realized gain (loss) on sale of underlying fund shares | (433) | |
Capital gain distributions from underlying funds | 303,406 | 302,973 |
Change in net unrealized appreciation (depreciation) on underlying funds | | 1,284 |
Net gain (loss) | | 304,257 |
Net increase (decrease) in net assets resulting from operations | | $ 513,475 |
See accompanying notes which are an integral part of the financial statements.
VIP Investor Freedom Portfolios
Statement of Changes in Net Assets
| Year ended
December 31,
2007 | Year ended
December 31,
2006 |
Increase (Decrease) in Net Assets | | |
Operations | | |
Net investment income (loss) | $ 209,218 | $ 81,848 |
Net realized gain (loss) | 302,973 | 58,403 |
Change in net unrealized appreciation (depreciation) | 1,284 | 213,905 |
Net increase (decrease) in net assets resulting from operations | 513,475 | 354,156 |
Distributions to shareholders from net investment income | (292,539) | (11,222) |
Distributions to shareholders from net realized gain | (57,227) | - |
Total distributions | (349,766) | (11,222) |
Share transactions
Proceeds from sales of shares | 6,860,774 | 3,971,659 |
Reinvestment of distributions | 349,766 | 11,222 |
Cost of shares redeemed | (3,656,735) | (1,494,728) |
Net increase (decrease) in net assets resulting from share transactions | 3,553,805 | 2,488,153 |
Total increase (decrease) in net assets | 3,717,514 | 2,831,087 |
| | |
Net Assets | | |
Beginning of period | 4,850,503 | 2,019,416 |
End of period (including undistributed net investment income of $0 and undistributed net investment income of $80,117, respectively) | $ 8,568,017 | $ 4,850,503 |
Other Information Shares | | |
Sold | 591,396 | 378,785 |
Issued in reinvestment of distributions | 30,834 | 1,090 |
Redeemed | (313,457) | (142,775) |
Net increase (decrease) | 308,773 | 237,100 |
Financial Highlights
Years ended December 31, | 2007 | 2006 | 2005 G |
Selected Per-Share Data | | | |
Net asset value, beginning of period | $ 11.17 | $ 10.24 | $ 10.00 |
Income from Investment Operations | | | |
Net investment income (loss) E | .35 | .26 | .10 |
Net realized and unrealized gain (loss) | .59 | .73 | .14 |
Total from investment operations | .94 | .99 | .24 |
Distributions from net investment income | (.46) | (.06) | - |
Distributions from net realized gain | (.12) | - | - |
Total distributions | (.58) | (.06) | - |
Net asset value, end of period | $ 11.53 | $ 11.17 | $ 10.24 |
Total Return B, C, D | 8.55% | 9.72% | 2.40% |
Ratios to Average Net Assets F, H | | | |
Expenses before reductions | .00% | .00% | .00% A |
Expenses net of fee waivers, if any | .00% | .00% | .00% A |
Expenses net of all reductions | .00% | .00% | .00% A |
Net investment income (loss) | 3.02% | 2.47% | 2.45% A |
Supplemental Data | | | |
Net assets, end of period (000 omitted) | $ 8,568 | $ 4,851 | $ 2,019 |
Portfolio turnover rate | 53% | 55% | 39% |
A Annualized
B Total returns for periods of less than one year are not annualized.
C Total returns do not reflect charges attributable to your insurance company's separate account. Inclusion of these charges would reduce the total returns shown.
D Total returns would have been lower had certain expenses not been reduced during the periods shown.
E Calculated based on average shares outstanding during the period.
F Amounts do not include the activity of the underlying funds.
G For the period August 3, 2005 (commencement of operations) to December 31, 2005.
H Expense ratios reflect operating expenses of the Fund. Expenses before reductions do not reflect amounts reimbursed by the investment adviser or expense offset arrangements and do not represent the amount paid by the Fund during periods when reimbursements or reductions occur. Expense ratios before reductions for start-up periods may not be representative of longer term operating periods. Expenses net of fee waivers reflect expenses after reimbursement by the investment adviser but prior to reductions from expense offset arrangements. Expenses net of all reductions represent the net expenses paid by the Fund but do not include expenses of the investment companies in which the Fund invests.
See accompanying notes which are an integral part of the financial statements.
Annual Report
VIP Investor Freedom 2010 Portfolio
Investment Changes
Fund Holdings as of December 31, 2007 |
| % of fund's investments | % of fund's investments 6 months ago |
Domestic Equity Funds | | |
VIP Contrafund Portfolio Investor Class | 6.6 | 6.4 |
VIP Equity-Income Portfolio Investor Class | 6.7 | 7.3 |
VIP Growth & Income Portfolio Investor Class | 7.3 | 7.3 |
VIP Growth Portfolio Investor Class | 7.8 | 7.5 |
VIP Mid Cap Portfolio Investor Class | 2.6 | 2.6 |
VIP Value Portfolio Investor Class | 5.7 | 6.3 |
VIP Value Strategies Portfolio Investor Class | 2.4 | 2.6 |
| 39.1 | 40.0 |
International Equity Funds | | |
VIP Overseas Portfolio Investor Class R | 9.9 | 10.0 |
High Yield Fixed-Income Funds | | |
VIP High Income Portfolio Investor Class | 5.0 | 5.0 |
Investment Grade Fixed-Income Funds | | |
VIP Investment Grade Bond Portfolio Investor Class | 36.0 | 35.0 |
Short-Term Funds | | |
VIP Money Market Portfolio Investor Class | 10.0 | 10.0 |
| 100.0 | 100.0 |
Asset Allocation (% of fund's investments) |
Current |
| Domestic Equity Funds | 39.1% | |
| International Equity Funds | 9.9% | |
| Investment Grade Fixed-Income Funds | 36.0% | |
| High Yield Fixed-Income Funds | 5.0% | |
| Short-Term Funds | 10.0% | |

Six months ago |
 | Domestic Equity Funds | 40.0% | |
| International Equity Funds | 10.0% | |
| Investment Grade Fixed-Income Funds | 35.0% | |
| High Yield Fixed-Income Funds | 5.0% | |
| Short-Term Funds | 10.0% | |

Expected |
| Domestic Equity Funds | 40.0% | |
| International Equity Funds | 10.0% | |
| Investment Grade Fixed-Income Funds | 35.0% | |
| High Yield Fixed-Income Funds | 5.0% | |
| Short-Term Funds | 10.0% | |

The fund invests according to an asset allocation strategy that becomes increasingly conservative over time. The six months ago allocation is based on the fund's holdings as of June 30, 2007. The current allocation is based on the fund's holdings as of December 31, 2007. The expected allocation represents the fund's anticipated allocation at June 30, 2008. |
VIP Investor Freedom Portfolios
VIP Investor Freedom 2010 Portfolio
Investments December 31, 2007
Showing Percentage of Total Value of Investment in Securities
Equity Funds - 49.0% |
| Shares | | Value |
Domestic Equity Funds - 39.1% |
VIP Contrafund Portfolio Investor Class | 134,701 | | $ 3,747,373 |
VIP Equity-Income Portfolio Investor Class | 161,648 | | 3,855,306 |
VIP Growth & Income Portfolio
Investor Class | 247,645 | | 4,200,053 |
VIP Growth Portfolio Investor Class | 99,648 | | 4,484,156 |
VIP Mid Cap Portfolio Investor Class | 41,365 | | 1,492,047 |
VIP Value Portfolio Investor Class | 249,639 | | 3,267,774 |
VIP Value Strategies Portfolio
Investor Class | 108,248 | | 1,356,347 |
TOTAL DOMESTIC EQUITY FUNDS | | 22,403,056 |
International Equity Funds - 9.9% |
VIP Overseas Portfolio Investor Class R | 223,618 | | 5,648,594 |
TOTAL EQUITY FUNDS (Cost $26,864,603) | 28,051,650 |
Fixed-Income Funds - 41.0% |
| | | |
High Yield Fixed - Income Funds - 5.0% |
VIP High Income Portfolio Investor Class | 477,755 | | 2,847,418 |
Investment Grade Fixed - Income Funds - 36.0% |
VIP Investment Grade Bond Portfolio Investor Class | 1,616,393 | | 20,576,684 |
TOTAL FIXED-INCOME FUNDS (Cost $23,086,801) | 23,424,102 |
Short-Term Funds - 10.0% |
| | | |
VIP Money Market Portfolio
Investor Class
(Cost $5,721,913) | 5,721,913 | | 5,721,913 |
TOTAL INVESTMENT IN SECURITIES - 100% (Cost $55,673,317) | $ 57,197,665 |
See accompanying notes which are an integral part of the financial statements.
Annual Report
VIP Investor Freedom 2010 Portfolio
Financial Statements
Statement of Assets and Liabilities
| December 31, 2007 |
| | |
Assets | | |
Investment in securities, at value
(cost $55,673,317) - See accompanying schedule | | $ 57,197,665 |
Receivable for fund shares sold | | 215,777 |
Total assets | | 57,413,442 |
| | |
Liabilities | | |
Payable for investments purchased | $ 172,007 | |
Payable for fund shares redeemed | 44,562 | |
Total liabilities | | 216,569 |
| | |
Net Assets | | $ 57,196,873 |
Net Assets consist of: | | |
Paid in capital | | $ 53,794,524 |
Undistributed net investment income | | 12,319 |
Accumulated undistributed net realized gain (loss) on investments | | 1,865,682 |
Net unrealized appreciation (depreciation) on investments | | 1,524,348 |
Net Assets, for 4,945,800 shares outstanding | | $ 57,196,873 |
Net Asset Value, offering price
and redemption price
per share ($57,196,873 ÷ 4,945,800 shares) | | $ 11.56 |
Statement of Operations
| Year ended December 31, 2007 |
| | |
Investment Income | | |
Income distributions from underlying funds | | $ 1,276,170 |
| | |
Expenses | | |
Independent trustees' compensation | $ 146 | |
Total expenses before reductions | 146 | |
Expense reductions | (146) | 0 |
Net investment income (loss) | | 1,276,170 |
Realized and Unrealized Gain (Loss) Realized gain (loss) on sale of underlying fund shares | (86,778) | |
Capital gain distributions from underlying funds | 1,952,467 | 1,865,689 |
Change in net unrealized appreciation (depreciation) on underlying funds | | 127,829 |
Net gain (loss) | | 1,993,518 |
Net increase (decrease) in net assets resulting from operations | | $ 3,269,688 |
See accompanying notes which are an integral part of the financial statements.
VIP Investor Freedom Portfolios
Statement of Changes in Net Assets
| Year ended
December 31,
2007 | Year ended
December 31,
2006 |
Increase (Decrease) in Net Assets | | |
Operations | | |
Net investment income (loss) | $ 1,276,170 | $ 517,238 |
Net realized gain (loss) | 1,865,689 | 375,905 |
Change in net unrealized appreciation (depreciation) | 127,829 | 1,261,094 |
Net increase (decrease) in net assets resulting from operations | 3,269,688 | 2,154,237 |
Distributions to shareholders from net investment income | (1,766,359) | (47,558) |
Distributions to shareholders from net realized gain | (384,887) | - |
Total distributions | (2,151,246) | (47,558) |
Share transactions
Proceeds from sales of shares | 27,631,799 | 24,173,995 |
Reinvestment of distributions | 2,151,246 | 47,558 |
Cost of shares redeemed | (5,164,429) | (4,860,534) |
Net increase (decrease) in net assets resulting from share transactions | 24,618,616 | 19,361,019 |
Total increase (decrease) in net assets | 25,737,058 | 21,467,698 |
| | |
Net Assets | | |
Beginning of period | 31,459,815 | 9,992,117 |
End of period (including undistributed net investment income of $12,319 and undistributed net investment income of $511,501, respectively) | $ 57,196,873 | $ 31,459,815 |
Other Information Shares | | |
Sold | 2,396,351 | 2,296,621 |
Issued in reinvestment of distributions | 189,419 | 4,604 |
Redeemed | (451,025) | (464,300) |
Net increase (decrease) | 2,134,745 | 1,836,925 |
Financial Highlights
Years ended December 31, | 2007 | 2006 | 2005 G |
Selected Per-Share Data | | | |
Net asset value, beginning of period | $ 11.19 | $ 10.26 | $ 10.00 |
Income from Investment Operations | | | |
Net investment income (loss) E | .33 | .24 | .13 |
Net realized and unrealized gain (loss) | .62 | .73 | .13 |
Total from investment operations | .95 | .97 | .26 |
Distributions from net investment income | (.44) | (.04) | - |
Distributions from net realized gain | (.14) | - | - |
Total distributions | (.58) | (.04) | - |
Net asset value, end of period | $ 11.56 | $ 11.19 | $ 10.26 |
Total Return B, C, D | 8.63% | 9.49% | 2.60% |
Ratios to Average Net Assets F, H | | | |
Expenses before reductions | .00% | .00% | .00% A |
Expenses net of fee waivers, if any | .00% | .00% | .00% A |
Expenses net of all reductions | .00% | .00% | .00% A |
Net investment income (loss) | 2.90% | 2.29% | 3.14% A |
Supplemental Data | | | |
Net assets, end of period (000 omitted) | $ 57,197 | $ 31,460 | $ 9,992 |
Portfolio turnover rate | 14% | 29% | 0% |
A Annualized
B Total returns for periods of less than one year are not annualized.
C Total returns do not reflect charges attributable to your insurance company's separate account. Inclusion of these charges would reduce the total returns shown.
D Total returns would have been lower had certain expenses not been reduced during the periods shown.
E Calculated based on average shares outstanding during the period.
F Amounts do not include the activity of the underlying funds.
G For the period August 3, 2005 (commencement of operations) to December 31, 2005.
H Expense ratios reflect operating expenses of the Fund. Expenses before reductions do not reflect amounts reimbursed by the investment adviser or expense offset arrangements and do not represent the amount paid by the Fund during periods when reimbursements or reductions occur. Expense ratios before reductions for start-up periods may not be representative of longer term operating periods. Expenses net of fee waivers reflect expenses after reimbursement by the investment adviser but prior to reductions from expense offset arrangements. Expenses net of all reductions represent the net expenses paid by the Fund but do not include expenses of the investment companies in which the Fund invests.
See accompanying notes which are an integral part of the financial statements.
Annual Report
VIP Investor Freedom 2015 Portfolio
Investment Changes
Fund Holdings as of December 31, 2007 |
| % of fund's investments | % of fund's investments 6 months ago |
Domestic Equity Funds | | |
VIP Contrafund Portfolio
Investor Class | 7.4 | 7.2 |
VIP Equity-Income Portfolio Investor Class | 7.6 | 8.2 |
VIP Growth & Income Portfolio Investor Class | 8.2 | 8.3 |
VIP Growth Portfolio Investor Class | 8.8 | 8.5 |
VIP Mid Cap Portfolio
Investor Class | 2.9 | 3.0 |
VIP Value Portfolio Investor Class | 6.4 | 7.1 |
VIP Value Strategies Portfolio Investor Class | 2.7 | 2.9 |
| 44.0 | 45.2 |
International Equity Funds | | |
VIP Overseas Portfolio
Investor Class R | 11.2 | 11.3 |
High Yield Fixed-Income Funds | | |
VIP High Income Portfolio
Investor Class | 5.9 | 6.0 |
Investment Grade Fixed-Income Funds | | |
VIP Investment Grade Bond Portfolio Investor Class | 32.8 | 31.6 |
Short-Term Funds | | |
VIP Money Market Portfolio Investor Class | 6.1 | 5.9 |
| 100.0 | 100.0 |
Asset Allocation (% of fund's investments) |
Current |
| Domestic Equity Funds | 44.0% | |
| International Equity Funds | 11.2% | |
| Investment Grade Fixed-Income Funds | 32.8% | |
| High Yield Fixed-Income Funds | 5.9% | |
| Short-Term Funds | 6.1% | |

Six months ago |
| Domestic Equity Funds | 45.2% | |
| International Equity Funds | 11.3% | |
| Investment Grade Fixed-Income Funds | 31.6% | |
| High Yield Fixed-Income Funds | 6.0% | |
| Short-Term Funds | 5.9% | |

Expected |
| Domestic Equity Funds | 43.3% | |
| International Equity Funds | 10.8% | |
| Investment Grade Fixed-Income Funds | 32.9% | |
| High Yield Fixed-Income Funds | 5.6% | |
| Short-Term Funds | 7.4% | |

The fund invests according to an asset allocation strategy that becomes increasingly conservative over time. The six months ago allocation is based on the fund's holdings as of June 30, 2007. The current allocation is based on the fund's holdings as of December 31, 2007. The expected allocation represents the fund's anticipated allocation at June 30, 2008. |
VIP Investor Freedom Portfolios
VIP Investor Freedom 2015 Portfolio
Investments December 31, 2007
Showing Percentage of Total Value of Investment in Securities
Equity Funds - 55.2% |
| Shares | | Value |
Domestic Equity Funds - 44.0% |
VIP Contrafund Portfolio Investor Class | 162,512 | | $ 4,521,078 |
VIP Equity-Income Portfolio Investor Class | 194,375 | | 4,635,844 |
VIP Growth & Income Portfolio
Investor Class | 298,648 | | 5,065,071 |
VIP Growth Portfolio Investor Class | 120,542 | | 5,424,382 |
VIP Mid Cap Portfolio Investor Class | 49,993 | | 1,803,262 |
VIP Value Portfolio Investor Class | 299,925 | | 3,926,022 |
VIP Value Strategies Portfolio
Investor Class | 130,379 | | 1,633,654 |
TOTAL DOMESTIC EQUITY FUNDS | | 27,009,313 |
International Equity Funds - 11.2% |
VIP Overseas Portfolio Investor Class R | 271,587 | | 6,860,277 |
TOTAL EQUITY FUNDS (Cost $31,918,869) | 33,869,590 |
Fixed-Income Funds - 38.7% |
| | | |
High Yield Fixed - Income Funds - 5.9% |
VIP High Income Portfolio Investor Class | 607,032 | | 3,617,913 |
Investment Grade Fixed - Income Funds - 32.8% |
VIP Investment Grade Bond Portfolio Investor Class | 1,579,717 | | 20,109,798 |
TOTAL FIXED-INCOME FUNDS (Cost $23,391,937) | 23,727,711 |
Short-Term Funds - 6.1% |
| | | |
VIP Money Market Portfolio
Investor Class
(Cost $3,773,324) | 3,773,324 | | 3,773,324 |
TOTAL INVESTMENT IN SECURITIES - 100% (Cost $59,084,130) | $ 61,370,625 |
See accompanying notes which are an integral part of the financial statements.
Annual Report
VIP Investor Freedom 2015 Portfolio
Financial Statements
Statement of Assets and Liabilities
| December 31, 2007 |
| | |
Assets | | |
Investment in securities, at value
(cost $59,084,130) - See accompanying schedule | | $ 61,370,625 |
Cash | | 59 |
Receivable for fund shares sold | | 231,067 |
Total assets | | 61,601,751 |
| | |
Liabilities | | |
Payable for investments purchased | $ 231,451 | |
Payable for fund shares redeemed | 114 | |
Total liabilities | | 231,565 |
| | |
Net Assets | | $ 61,370,186 |
Net Assets consist of: | | |
Paid in capital | | $ 56,505,129 |
Undistributed net investment income | | 40,432 |
Accumulated undistributed net realized gain (loss) on investments | | 2,538,130 |
Net unrealized appreciation (depreciation) on investments | | 2,286,495 |
Net Assets, for 5,173,737 shares outstanding | | $ 61,370,186 |
Net Asset Value, offering price
and redemption price
per share ($61,370,186 ÷ 5,173,737 shares) | | $ 11.86 |
Statement of Operations
| Year ended December 31, 2007 |
| | |
Investment Income | | |
Income distributions from underlying funds | | $ 1,453,553 |
| | |
Expenses | | |
Independent trustees' compensation | $ 172 | |
Total expenses before reductions | 172 | |
Expense reductions | (172) | 0 |
Net investment income (loss) | | 1,453,553 |
Realized and Unrealized Gain (Loss) Realized gain (loss) on sale of underlying fund shares | (23,166) | |
Capital gain distributions from underlying funds | 2,575,705 | 2,552,539 |
Change in net unrealized appreciation (depreciation) on underlying funds | | 311,498 |
Net gain (loss) | | 2,864,037 |
Net increase (decrease) in net assets resulting from operations | | $ 4,317,590 |
See accompanying notes which are an integral part of the financial statements.
VIP Investor Freedom Portfolios
Statement of Changes in Net Assets
| Year ended
December 31,
2007 | Year ended
December 31,
2006 |
Increase (Decrease) in Net Assets | | |
Operations | | |
Net investment income (loss) | $ 1,453,553 | $ 497,927 |
Net realized gain (loss) | 2,552,539 | 587,426 |
Change in net unrealized appreciation (depreciation) | 311,498 | 1,825,450 |
Net increase (decrease) in net assets resulting from operations | 4,317,590 | 2,910,803 |
Distributions to shareholders from net investment income | (1,911,585) | (37,916) |
Distributions to shareholders from net realized gain | (593,638) | - |
Total distributions | (2,505,223) | (37,916) |
Share transactions
Proceeds from sales of shares | 21,801,909 | 31,577,174 |
Reinvestment of distributions | 2,505,223 | 37,916 |
Cost of shares redeemed | (4,587,140) | (1,589,486) |
Net increase (decrease) in net assets resulting from share transactions | 19,719,992 | 30,025,604 |
Total increase (decrease) in net assets | 21,532,359 | 32,898,491 |
| | |
Net Assets | | |
Beginning of period | 39,837,827 | 6,939,336 |
End of period (including undistributed net investment income of $40,432 and undistributed net investment income of $494,279, respectively) | $ 61,370,186 | $ 39,837,827 |
Other Information Shares | | |
Sold | 1,853,399 | 2,966,727 |
Issued in reinvestment of distributions | 215,521 | 3,635 |
Redeemed | (390,384) | (147,393) |
Net increase (decrease) | 1,678,536 | 2,822,969 |
Financial Highlights
Years ended December 31, | 2007 | 2006 | 2005 G |
Selected Per-Share Data | | | |
Net asset value, beginning of period | $ 11.40 | $ 10.32 | $ 10.00 |
Income from Investment Operations | | | |
Net investment income (loss) E | .33 | .20 | .13 |
Net realized and unrealized gain (loss) | .71 | .92 | .19 |
Total from investment operations | 1.04 | 1.12 | .32 |
Distributions from net investment income | (.42) | (.04) | - |
Distributions from net realized gain | (.16) | - | - |
Total distributions | (.58) | (.04) | - |
Net asset value, end of period | $ 11.86 | $ 11.40 | $ 10.32 |
Total Return B, C, D | 9.26% | 10.89% | 3.20% |
Ratios to Average Net Assets F, H | | | |
Expenses before reductions | .00% | .00% | .00% A |
Expenses net of fee waivers, if any | .00% | .00% | .00% A |
Expenses net of all reductions | .00% | .00% | .00% A |
Net investment income (loss) | 2.83% | 1.83% | 3.24% A |
Supplemental Data | | | |
Net assets, end of period (000 omitted) | $ 61,370 | $ 39,838 | $ 6,939 |
Portfolio turnover rate | 14% | 15% | 9% |
A Annualized
B Total returns for periods of less than one year are not annualized.
C Total returns do not reflect charges attributable to your insurance company's separate account. Inclusion of these charges would reduce the total returns shown.
D Total returns would have been lower had certain expenses not been reduced during the periods shown.
E Calculated based on average shares outstanding during the period.
F Amounts do not include the activity of the underlying funds.
G For the period August 3, 2005 (commencement of operations) to December 31, 2005.
H Expense ratios reflect operating expenses of the Fund. Expenses before reductions do not reflect amounts reimbursed by the investment adviser or expense offset arrangements and do not represent the amount paid by the Fund during periods when reimbursements or reductions occur. Expense ratios before reductions for start-up periods may not be representative of longer term operating periods. Expenses net of fee waivers reflect expenses after reimbursement by the investment adviser but prior to reductions from expense offset arrangements. Expenses net of all reductions represent the net expenses paid by the Fund but do not include expenses of the investment companies in which the Fund invests.
See accompanying notes which are an integral part of the financial statements.
Annual Report
VIP Investor Freedom 2020 Portfolio
Investment Changes
Fund Holdings as of December 31, 2007 |
| % of fund's investments | % of fund's investments 6 months ago |
Domestic Equity Funds | | |
VIP Contrafund Portfolio Investor Class | 8.9 | 8.6 |
VIP Equity-Income Portfolio Investor Class | 9.2 | 10.0 |
VIP Growth & Income Portfolio Investor Class | 10.0 | 10.0 |
VIP Growth Portfolio Investor Class | 10.7 | 10.2 |
VIP Mid Cap Portfolio Investor Class | 3.6 | 3.6 |
VIP Value Portfolio Investor Class | 7.8 | 8.5 |
VIP Value Strategies Portfolio Investor Class | 3.2 | 3.6 |
| 53.4 | 54.5 |
International Equity Funds | | |
VIP Overseas Portfolio Investor Class R | 13.6 | 13.6 |
High Yield Fixed-Income Funds | | |
VIP High Income Portfolio Investor Class | 7.4 | 7.4 |
Investment Grade Fixed-Income Funds | | |
VIP Investment Grade Bond Portfolio Investor Class | 25.1 | 24.1 |
Short-Term Funds | | |
VIP Money Market Portfolio Investor Class | 0.5 | 0.4 |
| 100.0 | 100.0 |
Asset Allocation (% of fund's investments) |
Current |
| Domestic Equity Funds | 53.4% | |
| International Equity Funds | 13.6% | |
| Investment Grade Fixed-Income Funds | 25.1% | |
| High Yield Fixed-Income Funds | 7.4% | |
| Short-Term Funds | 0.5% | |

Six months ago |
| Domestic Equity Funds | 54.5% | |
| International Equity Funds | 13.6% | |
| Investment Grade Fixed-Income Funds | 24.1% | |
| High Yield Fixed-Income Funds | 7.4% | |
| Short-Term Funds | 0.4% | |

Expected |
| Domestic Equity Funds | 53.2% | |
| International Equity Funds | 13.3% | |
| Investment Grade Fixed-Income Funds | 25.2% | |
| High Yield Fixed-Income Funds | 7.4% | |
| Short-Term Funds | 0.9% | |

The fund invests according to an asset allocation strategy that becomes increasingly conservative over time. The six months ago allocation is based on the fund's holdings as of June 30, 2007. The current allocation is based on the fund's holdings as of December 31, 2007. The expected allocation represents the fund's anticipated allocation at June 30, 2008. |
VIP Investor Freedom Portfolios
VIP Investor Freedom 2020 Portfolio
Investments December 31, 2007
Showing Percentage of Total Value of Investment in Securities
Equity Funds - 67.0% |
| Shares | | Value |
Domestic Equity Funds - 53.4% |
VIP Contrafund Portfolio Investor Class | 245,693 | | $ 6,835,166 |
VIP Equity-Income Portfolio Investor Class | 293,083 | | 6,990,032 |
VIP Growth & Income Portfolio
Investor Class | 450,937 | | 7,647,889 |
VIP Growth Portfolio Investor Class | 182,211 | | 8,199,511 |
VIP Mid Cap Portfolio Investor Class | 75,344 | | 2,717,672 |
VIP Value Portfolio Investor Class | 452,481 | | 5,922,971 |
VIP Value Strategies Portfolio
Investor Class | 196,104 | | 2,457,186 |
TOTAL DOMESTIC EQUITY FUNDS | | 40,770,427 |
International Equity Funds - 13.6% |
VIP Overseas Portfolio Investor Class R | 411,109 | | 10,384,607 |
TOTAL EQUITY FUNDS (Cost $48,604,820) | 51,155,034 |
Fixed-Income Funds - 32.5% |
| | | |
High Yield Fixed - Income Funds - 7.4% |
VIP High Income Portfolio Investor Class | 953,930 | | 5,685,424 |
Investment Grade Fixed - Income Funds - 25.1% |
VIP Investment Grade Bond Portfolio Investor Class | 1,504,921 | | 19,157,642 |
TOTAL FIXED-INCOME FUNDS (Cost $24,752,028) | 24,843,066 |
Short-Term Funds - 0.5% |
| | | |
VIP Money Market Portfolio
Investor Class
(Cost $370,477) | 370,477 | | 370,477 |
TOTAL INVESTMENT IN SECURITIES - 100% (Cost $73,727,325) | $ 76,368,577 |
See accompanying notes which are an integral part of the financial statements.
Annual Report
VIP Investor Freedom 2020 Portfolio
Financial Statements
Statement of Assets and Liabilities
| December 31, 2007 |
| | |
Assets | | |
Investment in securities, at value
(cost $73,727,325) - See accompanying schedule | | $ 76,368,577 |
Cash | | 26 |
Receivable for investments sold | | 139,275 |
Total assets | | 76,507,878 |
| | |
Liabilities | | |
Payable for investments purchased | $ 49 | |
Payable for fund shares redeemed | 139,277 | |
Total liabilities | | 139,326 |
| | |
Net Assets | | $ 76,368,552 |
Net Assets consist of: | | |
Paid in capital | | $ 69,998,381 |
Undistributed net investment income | | 54,133 |
Accumulated undistributed net realized gain (loss) on investments | | 3,674,786 |
Net unrealized appreciation (depreciation) on investments | | 2,641,252 |
Net Assets, for 6,318,619 shares outstanding | | $ 76,368,552 |
Net Asset Value, offering price
and redemption price
per share ($76,368,552 ÷ 6,318,619 shares) | | $ 12.09 |
Statement of Operations
| Year ended December 31, 2007 |
| | |
Investment Income | | |
Income distributions from underlying funds | | $ 1,658,457 |
| | |
Expenses | | |
Independent trustees' compensation | $ 214 | |
Total expenses before reductions | 214 | |
Expense reductions | (214) | 0 |
Net investment income (loss) | | 1,658,457 |
Realized and Unrealized Gain (Loss) Realized gain (loss) on sale of underlying fund shares | (88,663) | |
Capital gain distributions from underlying funds | 3,763,746 | 3,675,083 |
Change in net unrealized appreciation (depreciation) on underlying funds | | 371,826 |
Net gain (loss) | | 4,046,909 |
Net increase (decrease) in net assets resulting from operations | | $ 5,705,366 |
See accompanying notes which are an integral part of the financial statements.
VIP Investor Freedom Portfolios
Statement of Changes in Net Assets
| Year ended
December 31,
2007 | Year ended
December 31,
2006 |
Increase (Decrease) in Net Assets | | |
Operations | | |
Net investment income (loss) | $ 1,658,457 | $ 611,389 |
Net realized gain (loss) | 3,675,083 | 828,233 |
Change in net unrealized appreciation (depreciation) | 371,826 | 2,045,711 |
Net increase (decrease) in net assets resulting from operations | 5,705,366 | 3,485,333 |
Distributions to shareholders from net investment income | (2,207,958) | (71,710) |
Distributions to shareholders from net realized gain | (824,330) | - |
Total distributions | (3,032,288) | (71,710) |
Share transactions
Proceeds from sales of shares | 28,678,442 | 35,011,966 |
Reinvestment of distributions | 3,032,288 | 71,710 |
Cost of shares redeemed | (5,344,248) | (2,226,832) |
Net increase (decrease) in net assets resulting from share transactions | 26,366,482 | 32,856,844 |
Total increase (decrease) in net assets | 29,039,560 | 36,270,467 |
| | |
Net Assets | | |
Beginning of period | 47,328,992 | 11,058,525 |
End of period (including undistributed net investment income of $54,133 and undistributed net investment income of $599,942, respectively) | $ 76,368,552 | $ 47,328,992 |
Other Information Shares | | |
Sold | 2,401,033 | 3,240,573 |
Issued in reinvestment of distributions | 257,210 | 6,843 |
Redeemed | (443,246) | (210,880) |
Net increase (decrease) | 2,214,997 | 3,036,536 |
Financial Highlights
Years ended December 31, | 2007 | 2006 | 2005 G |
Selected Per-Share Data | | | |
Net asset value, beginning of period | $ 11.53 | $ 10.36 | $ 10.00 |
Income from Investment Operations | | | |
Net investment income (loss) E | .31 | .22 | .17 |
Net realized and unrealized gain (loss) | .84 | 1.00 | .19 |
Total from investment operations | 1.15 | 1.22 | .36 |
Distributions from net investment income | (.40) | (.05) | - |
Distributions from net realized gain | (.19) | - | - |
Total distributions | (.59) | (.05) | - |
Net asset value, end of period | $ 12.09 | $ 11.53 | $ 10.36 |
Total Return B, C, D | 10.20% | 11.82% | 3.60% |
Ratios to Average Net Assets F, H | | | |
Expenses before reductions | .00% | .00% | .00% A |
Expenses net of fee waivers, if any | .00% | .00% | .00% A |
Expenses net of all reductions | .00% | .00% | .00% A |
Net investment income (loss) | 2.59% | 2.04% | 4.07% A |
Supplemental Data | | | |
Net assets, end of period (000 omitted) | $ 76,369 | $ 47,329 | $ 11,059 |
Portfolio turnover rate | 12% | 15% | 2% |
A Annualized
B Total returns for periods of less than one year are not annualized.
C Total returns do not reflect charges attributable to your insurance company's separate account. Inclusion of these charges would reduce the total returns shown.
D Total returns would have been lower had certain expenses not been reduced during the periods shown.
E Calculated based on average shares outstanding during the period.
F Amounts do not include the activity of the underlying funds.
G For the period August 3, 2005 (commencement of operations) to December 31, 2005.
H Expense ratios reflect operating expenses of the Fund. Expenses before reductions do not reflect amounts reimbursed by the investment adviser or expense offset arrangements and do not represent the amount paid by the Fund during periods when reimbursements or reductions occur. Expense ratios before reductions for start-up periods may not be representative of longer term operating periods. Expenses net of fee waivers reflect expenses after reimbursement by the investment adviser but prior to reductions from expense offset arrangements. Expenses net of all reductions represent the net expenses paid by the Fund but do not include expenses of the investment companies in which the Fund invests.
See accompanying notes which are an integral part of the financial statements.
Annual Report
VIP Investor Freedom 2025 Portfolio
Investment Changes
Fund Holdings as of December 31, 2007 |
| % of fund's investments | % of fund's investments 6 months ago |
Domestic Equity Funds | | |
VIP Contrafund Portfolio Investor Class | 9.4 | 9.0 |
VIP Equity-Income Portfolio Investor Class | 9.7 | 10.4 |
VIP Growth & Income Portfolio Investor Class | 10.5 | 10.4 |
VIP Growth Portfolio Investor Class | 11.2 | 10.6 |
VIP Mid Cap Portfolio Investor Class | 3.8 | 3.8 |
VIP Value Portfolio Investor Class | 8.2 | 8.9 |
VIP Value Strategies Portfolio Investor Class | 3.4 | 3.7 |
| 56.2 | 56.8 |
International Equity Funds | | |
VIP Overseas Portfolio Investor Class R | 14.2 | 14.2 |
High Yield Fixed-Income Funds | | |
VIP High Income Portfolio Investor Class | 7.5 | 7.5 |
Investment Grade Fixed-Income Funds | | |
VIP Investment Grade Bond Portfolio Investor Class | 22.1 | 21.5 |
| 100.0 | 100.0 |
Asset Allocation (% of fund's investments) |
Current |
| Domestic Equity Funds | 56.2% | |
| International Equity Funds | 14.2% | |
| Investment Grade Fixed-Income Funds | 22.1% | |
| High Yield Fixed-Income Funds | 7.5% | |

Six months ago |
| Domestic Equity Funds | 56.8% | |
| International Equity Funds | 14.2% | |
| Investment Grade Fixed-Income Funds | 21.5% | |
| High Yield Fixed-Income Funds | 7.5% | |

Expected |
| Domestic Equity Funds | 56.1% | |
| International Equity Funds | 14.1% | |
| Investment Grade Fixed-Income Funds | 22.3% | |
 | High Yield Fixed-Income Funds | 7.5% | |

The fund invests according to an asset allocation strategy that becomes increasingly conservative over time. The six months ago allocation is based on the fund's holdings as of June 30, 2007. The current allocation is based on the fund's holdings as of December 31, 2007. The expected allocation represents the fund's anticipated allocation at June 30, 2008. |
VIP Investor Freedom Portfolios
VIP Investor Freedom 2025 Portfolio
Investments December 31, 2007
Showing Percentage of Total Value of Investment in Securities
Equity Funds - 70.4% |
| Shares | | Value |
Domestic Equity Funds - 56.2% |
VIP Contrafund Portfolio Investor Class | 96,405 | | $ 2,681,996 |
VIP Equity-Income Portfolio Investor Class | 116,109 | | 2,769,188 |
VIP Growth & Income Portfolio
Investor Class | 177,449 | | 3,009,533 |
VIP Growth Portfolio Investor Class | 71,290 | | 3,208,060 |
VIP Mid Cap Portfolio Investor Class | 29,680 | | 1,070,543 |
VIP Value Portfolio Investor Class | 179,345 | | 2,347,621 |
VIP Value Strategies Portfolio
Investor Class | 77,897 | | 976,043 |
TOTAL DOMESTIC EQUITY FUNDS | | 16,062,984 |
International Equity Funds - 14.2% |
VIP Overseas Portfolio Investor Class R | 160,687 | | 4,058,957 |
TOTAL EQUITY FUNDS (Cost $19,392,637) | 20,121,941 |
Fixed-Income Funds - 29.6% |
| | | |
High Yield Fixed - Income Funds - 7.5% |
VIP High Income Portfolio Investor Class | 359,880 | | 2,144,885 |
Investment Grade Fixed - Income Funds - 22.1% |
VIP Investment Grade Bond Portfolio Investor Class | 496,516 | | 6,320,652 |
TOTAL FIXED-INCOME FUNDS (Cost $8,466,657) | 8,465,537 |
TOTAL INVESTMENT IN SECURITIES - 100% (Cost $27,859,294) | $ 28,587,478 |
See accompanying notes which are an integral part of the financial statements.
Annual Report
VIP Investor Freedom 2025 Portfolio
Financial Statements
Statement of Assets and Liabilities
| December 31, 2007 |
| | |
Assets | | |
Investment in securities, at value
(cost $27,859,294) - See accompanying schedule | | $ 28,587,478 |
Cash | | 9 |
Receivable for fund shares sold | | 5,211 |
Total assets | | 28,592,698 |
| | |
Liabilities | | |
Payable for investments purchased | $ 5,163 | |
Payable for fund shares redeemed | 48 | |
Total liabilities | | 5,211 |
| | |
Net Assets | | $ 28,587,487 |
Net Assets consist of: | | |
Paid in capital | | $ 26,528,697 |
Accumulated undistributed net realized gain (loss) on investments | | 1,330,606 |
Net unrealized appreciation (depreciation) on investments | | 728,184 |
Net Assets, for 2,341,655 shares outstanding | | $ 28,587,487 |
Net Asset Value, offering price
and redemption price
per share ($28,587,487 ÷ 2,341,655 shares) | | $ 12.21 |
Statement of Operations
| Year ended December 31, 2007 |
| | |
Investment Income | | |
Income distributions from underlying funds | | $ 563,625 |
| | |
Expenses | | |
Independent trustees' compensation | $ 71 | |
Total expenses before reductions | 71 | |
Expense reductions | (71) | 0 |
Net investment income (loss) | | 563,625 |
Realized and Unrealized Gain (Loss) Realized gain (loss) on sale of underlying fund shares | (27,064) | |
Capital gain distributions from underlying funds | 1,376,480 | 1,349,416 |
Change in net unrealized appreciation (depreciation) on underlying funds | | (38,670) |
Net gain (loss) | | 1,310,746 |
Net increase (decrease) in net assets resulting from operations | | $ 1,874,371 |
See accompanying notes which are an integral part of the financial statements.
VIP Investor Freedom Portfolios
Statement of Changes in Net Assets
| Year ended
December 31,
2007 | Year ended
December 31,
2006 |
Increase (Decrease) in Net Assets | | |
Operations | | |
Net investment income (loss) | $ 563,625 | $ 177,339 |
Net realized gain (loss) | 1,349,416 | 267,312 |
Change in net unrealized appreciation (depreciation) | (38,670) | 708,052 |
Net increase (decrease) in net assets resulting from operations | 1,874,371 | 1,152,703 |
Distributions to shareholders from net investment income | (744,559) | (16,468) |
Distributions to shareholders from net realized gain | (279,578) | - |
Total distributions | (1,024,137) | (16,468) |
Share transactions
Proceeds from sales of shares | 13,502,471 | 11,868,095 |
Reinvestment of distributions | 1,024,137 | 16,468 |
Cost of shares redeemed | (1,419,458) | (814,667) |
Net increase (decrease) in net assets resulting from share transactions | 13,107,150 | 11,069,896 |
Total increase (decrease) in net assets | 13,957,384 | 12,206,131 |
| | |
Net Assets | | |
Beginning of period | 14,630,103 | 2,423,972 |
End of period (including undistributed net investment income of $0 and undistributed net investment income of $174,692, respectively) | $ 28,587,487 | $ 14,630,103 |
Other Information Shares | | |
Sold | 1,114,177 | 1,099,971 |
Issued in reinvestment of distributions | 85,983 | 1,564 |
Redeemed | (117,721) | (75,678) |
Net increase (decrease) | 1,082,439 | 1,025,857 |
Financial Highlights
Years ended December 31, | 2007 | 2006 | 2005 G |
Selected Per-Share Data | | | |
Net asset value, beginning of period | $ 11.62 | $ 10.39 | $ 10.00 |
Income from Investment Operations | | | |
Net investment income (loss) E | .32 | .21 | .14 |
Net realized and unrealized gain (loss) | .86 | 1.06 | .25 |
Total from investment operations | 1.18 | 1.27 | .39 |
Distributions from net investment income | (.38) | (.04) | - |
Distributions from net realized gain | (.21) | - | - |
Total distributions | (.59) | (.04) | - |
Net asset value, end of period | $ 12.21 | $ 11.62 | $ 10.39 |
Total Return B, C, D | 10.39% | 12.26% | 3.90% |
Ratios to Average Net Assets F, H | | | |
Expenses before reductions | .00% | .00% | .00% A |
Expenses net of fee waivers, if any | .00% | .00% | .00% A |
Expenses net of all reductions | .00% | .00% | .00% A |
Net investment income (loss) | 2.62% | 1.95% | 3.47% A |
Supplemental Data | | | |
Net assets, end of period (000 omitted) | $ 28,587 | $ 14,630 | $ 2,424 |
Portfolio turnover rate | 10% | 18% | 2% |
A Annualized
B Total returns for periods of less than one year are not annualized.
C Total returns do not reflect charges attributable to your insurance company's separate account. Inclusion of these charges would reduce the total returns shown.
D Total returns would have been lower had certain expenses not been reduced during the periods shown.
E Calculated based on average shares outstanding during the period.
F Amounts do not include the activity of the underlying funds.
G For the period August 3, 2005 (commencement of operations) to December 31, 2005.
H Expense ratios reflect operating expenses of the Fund. Expenses before reductions do not reflect amounts reimbursed by the investment adviser or expense offset arrangements and do not represent the amount paid by the Fund during periods when reimbursements or reductions occur. Expense ratios before reductions for start-up periods may not be representative of longer term operating periods. Expenses net of fee waivers reflect expenses after reimbursement by the investment adviser but prior to reductions from expense offset arrangements. Expenses net of all reductions represent the net expenses paid by the Fund but do not include expenses of the investment companies in which the Fund invests.
See accompanying notes which are an integral part of the financial statements.
Annual Report
VIP Investor Freedom 2030 Portfolio
Investment Changes
Fund Holdings as of December 31, 2007 |
| % of fund's investments | % of fund's investments 6 months ago |
Domestic Equity Funds | | |
VIP Contrafund Portfolio Investor Class | 10.9 | 10.4 |
VIP Equity-Income Portfolio Investor Class | 11.1 | 12.0 |
VIP Growth & Income Portfolio Investor Class | 12.2 | 12.0 |
VIP Growth Portfolio Investor Class | 13.0 | 12.3 |
VIP Mid Cap Portfolio Investor Class | 4.3 | 4.3 |
VIP Value Portfolio Investor Class | 9.5 | 10.3 |
VIP Value Strategies Portfolio Investor Class | 3.9 | 4.3 |
| 64.9 | 65.6 |
International Equity Funds | | |
VIP Overseas Portfolio Investor Class R | 16.5 | 16.4 |
High Yield Fixed-Income Funds | | |
VIP High Income Portfolio Investor Class | 7.6 | 7.5 |
Investment Grade Fixed-Income Funds | | |
VIP Investment Grade Bond Portfolio Investor Class | 11.0 | 10.5 |
| 100.0 | 100.0 |
Asset Allocation (% of fund's investments) |
Current |
| Domestic Equity Funds | 64.9% | |
| International Equity Funds | 16.5% | |
| Investment Grade Fixed-Income Funds | 11.0% | |
| High Yield Fixed-Income Funds | 7.6% | |

Six months ago |
| Domestic Equity Funds | 65.6% | |
| International Equity Funds | 16.4% | |
| Investment Grade Fixed-Income Funds | 10.5% | |
| High Yield Fixed-Income Funds | 7.5% | |

Expected |
| Domestic Equity Funds | 64.6% | |
| International Equity Funds | 16.2% | |
| Investment Grade Fixed-Income Funds | 11.7% | |
| High Yield Fixed-Income Funds | 7.5% | |

The fund invests according to an asset allocation strategy that becomes increasingly conservative over time. The six months ago allocation is based on the fund's holdings as of June 30, 2007. The current allocation is based on the fund's holdings as of December 31, 2007. The expected allocation represents the fund's anticipated allocation at June 30, 2008. |
VIP Investor Freedom Portfolios
VIP Investor Freedom 2030 Portfolio
Investments December 31, 2007
Showing Percentage of Total Value of Investment in Securities
Equity Funds - 81.4% |
| Shares | | Value |
Domestic Equity Funds - 64.9% |
VIP Contrafund Portfolio Investor Class | 122,489 | | $ 3,407,654 |
VIP Equity-Income Portfolio Investor Class | 146,728 | | 3,499,455 |
VIP Growth & Income Portfolio
Investor Class | 225,141 | | 3,818,389 |
VIP Growth Portfolio Investor Class | 90,718 | | 4,082,313 |
VIP Mid Cap Portfolio Investor Class | 37,605 | | 1,356,415 |
VIP Value Portfolio Investor Class | 226,666 | | 2,967,051 |
VIP Value Strategies Portfolio
Investor Class | 98,366 | | 1,232,520 |
TOTAL DOMESTIC EQUITY FUNDS | | 20,363,797 |
International Equity Funds - 16.5% |
VIP Overseas Portfolio Investor Class R | 204,762 | | 5,172,285 |
TOTAL EQUITY FUNDS (Cost $24,573,951) | 25,536,082 |
Fixed-Income Funds - 18.6% |
| | | |
High Yield Fixed - Income Funds - 7.6% |
VIP High Income Portfolio Investor Class | 396,591 | | 2,363,679 |
Investment Grade Fixed - Income Funds - 11.0% |
VIP Investment Grade Bond Portfolio Investor Class | 271,389 | | 3,454,777 |
TOTAL FIXED-INCOME FUNDS (Cost $5,901,188) | 5,818,456 |
TOTAL INVESTMENT IN SECURITIES - 100% (Cost $30,475,139) | $ 31,354,538 |
See accompanying notes which are an integral part of the financial statements.
Annual Report
VIP Investor Freedom 2030 Portfolios
Financial Statements
Statement of Assets and Liabilities
| December 31, 2007 |
| | |
Assets | | |
Investment in securities, at value
(cost $30,475,139) - See accompanying schedule | | $ 31,354,538 |
Cash | | 47 |
Receivable for investments sold | | 7,963 |
Total assets | | 31,362,548 |
| | |
Liabilities | | |
Payable for investments purchased | $ 31 | |
Payable for fund shares redeemed | 7,963 | |
Total liabilities | | 7,994 |
| | |
Net Assets | | $ 31,354,554 |
Net Assets consist of: | | |
Paid in capital | | $ 28,637,439 |
Undistributed net investment income | | 187,593 |
Accumulated undistributed net realized gain (loss) on investments | | 1,650,123 |
Net unrealized appreciation (depreciation) on investments | | 879,399 |
Net Assets, for 2,512,888 shares outstanding | | $ 31,354,554 |
Net Asset Value, offering price
and redemption price
per share ($31,354,554 ÷ 2,512,888 shares) | | $ 12.48 |
Statement of Operations
| Year ended December 31, 2007 |
| | |
Investment Income | | |
Income distributions from underlying funds | | $ 584,841 |
| | |
Expenses | | |
Independent trustees' compensation | $ 80 | |
Total expenses before reductions | 80 | |
Expense reductions | (80) | 0 |
Net investment income (loss) | | 584,841 |
Realized and Unrealized Gain (Loss) Realized gain (loss) on sale of underlying fund shares | (59,509) | |
Capital gain distributions from underlying funds | 1,716,807 | 1,657,298 |
Change in net unrealized appreciation (depreciation) on underlying funds | | 53,600 |
Net gain (loss) | | 1,710,898 |
Net increase (decrease) in net assets resulting from operations | | $ 2,295,739 |
See accompanying notes which are an integral part of the financial statements.
VIP Investor Freedom Portfolios
Statement of Changes in Net Assets
| Year ended
December 31,
2007 | Year ended
December 31,
2006 |
Increase (Decrease) in Net Assets | | |
Operations | | |
Net investment income (loss) | $ 584,841 | $ 179,772 |
Net realized gain (loss) | 1,657,298 | 325,802 |
Change in net unrealized appreciation (depreciation) | 53,600 | 707,059 |
Net increase (decrease) in net assets resulting from operations | 2,295,739 | 1,212,633 |
Distributions to shareholders from net investment income | (576,568) | (27,477) |
Distributions to shareholders from net realized gain | (332,759) | - |
Total distributions | (909,327) | (27,477) |
Share transactions
Proceeds from sales of shares | 16,624,940 | 11,916,673 |
Reinvestment of distributions | 909,327 | 27,477 |
Cost of shares redeemed | (2,293,642) | (3,100,146) |
Net increase (decrease) in net assets resulting from share transactions | 15,240,625 | 8,844,004 |
Total increase (decrease) in net assets | 16,627,037 | 10,029,160 |
| | |
Net Assets | | |
Beginning of period | 14,727,517 | 4,698,357 |
End of period (including undistributed net investment income of $187,593 and undistributed net investment income of $179,319, respectively) | $ 31,354,554 | $ 14,727,517 |
Other Information Shares | | |
Sold | 1,365,083 | 1,090,895 |
Issued in reinvestment of distributions | 75,740 | 2,602 |
Redeemed | (184,626) | (287,600) |
Net increase (decrease) | 1,256,197 | 805,897 |
Financial Highlights
Years ended December 31, | 2007 | 2006 | 2005 G |
Selected Per-Share Data | | | |
Net asset value, beginning of period | $ 11.72 | $ 10.42 | $ 10.00 |
Income from Investment Operations | | | |
Net investment income (loss) E | .30 | .20 | .15 |
Net realized and unrealized gain (loss) | .99 | 1.16 | .27 |
Total from investment operations | 1.29 | 1.36 | .42 |
Distributions from net investment income | (.29) | (.06) | - |
Distributions from net realized gain | (.24) | - | - |
Total distributions | (.53) | (.06) | - |
Net asset value, end of period | $ 12.48 | $ 11.72 | $ 10.42 |
Total Return B, C, D | 11.28% | 13.12% | 4.20% |
Ratios to Average Net Assets F, H | | | |
Expenses before reductions | .00% | .00% | .00% A |
Expenses net of fee waivers, if any | .00% | .00% | .00% A |
Expenses net of all reductions | .00% | .00% | .00% A |
Net investment income (loss) | 2.41% | 1.84% | 3.69% A |
Supplemental Data | | | |
Net assets, end of period (000 omitted) | $ 31,355 | $ 14,728 | $ 4,698 |
Portfolio turnover rate | 12% | 36% | 1% |
A Annualized
B Total returns for periods of less than one year are not annualized.
C Total returns do not reflect charges attributable to your insurance company's separate account. Inclusion of these charges would reduce the total returns shown.
D Total returns would have been lower had certain expenses not been reduced during the periods shown.
E Calculated based on average shares outstanding during the period.
F Amounts do not include the activity of the underlying funds.
G For the period August 3, 2005 (commencement of operations) to December 31, 2005.
H Expense ratios reflect operating expenses of the Fund. Expenses before reductions do not reflect amounts reimbursed by the investment adviser or expense offset arrangements and do not represent the amount paid by the Fund during periods when reimbursements or reductions occur. Expense ratios before reductions for start-up periods may not be representative of longer term operating periods. Expenses net of fee waivers reflect expenses after reimbursement by the investment adviser but prior to reductions from expense offset arrangements. Expenses net of all reductions represent the net expenses paid by the Fund but do not include expenses of the investment companies in which the Fund invests.
See accompanying notes which are an integral part of the financial statements.
Annual Report
Notes to Financial Statements
For the period ended December 31, 2007
1. Organization.
VIP Investor Freedom Income Portfolio, VIP Investor Freedom 2005 Portfolio, VIP Investor Freedom 2010 Portfolio, VIP Investor Freedom 2015 Portfolio, VIP Investor Freedom 2020 Portfolio, VIP Investor Freedom 2025 Portfolio and VIP Investor Freedom 2030 Portfolio (the Funds) are funds of Variable Insurance Products Fund V (formerly of Variable Insurance Products Fund IV). Effective April 19, 2007, the Board of Trustees approved an Agreement and Plan of Reorganization whereby the Funds reorganized into Variable Insurance Products Fund V effective June 29, 2007 (Trust Reorganization). The Trust Reorganization does not impact the Funds' investment strategies or Fidelity Management & Research Company's (FMR) management of the Funds. The Variable Insurance Products Fund V (the trust) (referred to in this report as Fidelity Variable Insurance Products) is registered under the Investment Company Act of 1940, as amended (the 1940 Act), as an open-end management investment company organized as a Massachusetts business trust. Each Fund is authorized to issue an unlimited number of shares. The Funds invest primarily in a combination of other VIP equity, fixed income, and short-term funds (the Underlying Funds) managed by Fidelity Management & Research Company (FMR). Shares of each Fund may only be purchased by insurance companies for the purpose of funding variable annuity or variable life insurance contracts.
2. Significant Accounting Policies.
The financial statements have been prepared in conformity with accounting principles generally accepted in the United States of America, which require management to make certain estimates and assumptions at the date of the financial statements. The following summarizes the significant accounting policies of the Funds:
Security Valuation. Net asset value per share is calculated as of the close of business of the New York Stock Exchange, normally 4:00 p.m. Eastern time. Investments in the Underlying Funds are valued at their closing net asset value each business day. Short-term securities with remaining maturities of sixty days or less for which quotations are not readily available are valued on the basis of amortized cost, which approximates value.
Investment Transactions and Income. For financial reporting purposes, the Funds' investment holdings and NAV include trades executed through the end of the last business day of the period. The NAV for processing shareholder transactions includes trades executed through the end of the prior business day. Gains and losses on securities sold are determined on the basis of identified cost. Income and capital gain distributions from the Underlying Funds, if any, are recorded on the ex-dividend date. Interest income is accrued as earned. Interest income includes coupon interest and amortization of premium and accretion of discount on debt securities.
Expenses. Most expenses of the trust can be directly attributed to a fund. Expenses which cannot be directly attributed are apportioned among each fund in the trust. Expenses included in the accompanying financial statements reflect the expenses of each Fund and do not include any expenses associated with the Underlying Funds. Expense estimates are accrued in the period to which they relate and adjustments are made when actual amounts are known. All legal and other expenses associated with the Trust Reorganization will be paid by FMR.
Income Tax Information and Distributions to Shareholders. Each year, each Fund intends to qualify as a regulated investment company by distributing substantially all of its taxable income and realized gains under Subchapter M of the Internal Revenue Code and filing its U.S. federal tax return. As a result, no provision for income taxes is required. Each Fund adopted the provisions of FASB Interpretation No. 48, Accounting for Uncertainties in Income Taxes (FIN 48), on June 29, 2007. FIN 48 sets forth a minimum threshold for financial statement recognition of the benefit of a tax position taken or expected to be taken in a tax return. The implementation of FIN 48 did not result in any unrecognized tax benefits in the accompanying financial statements. Each of the Funds' federal tax returns for the prior three fiscal years remains subject to examination by the Internal Revenue Service.
Distributions are recorded on the ex-dividend date. Income and capital gain distributions are determined in accordance with income tax regulations, which may differ from generally accepted accounting principles.
Capital accounts within the financial statements are adjusted for permanent book-tax differences. These adjustments have no impact on net assets or the results of operations. Temporary book-tax differences will reverse in a subsequent period.
Book-tax differences are primarily due to the short-term gain distributions from the Underlying Funds and losses deferred due to wash sales.
VIP Investor Freedom Portfolios
2. Significant Accounting Policies - continued
Income Tax Information and Distributions to Shareholders - continued
The tax-basis components of distributable earnings and the federal tax cost as of period end were as follows for each Fund:
| Cost for Federal
Income Tax Purposes | Unrealized
Appreciation | Unrealized
Depreciation | Net Unrealized
Appreciation/
(Depreciation) |
VIP Investor Freedom Income | $ 19,849,725 | $ 462,459 | $ (220,906) | $ 241,553 |
VIP Investor Freedom 2005 | 8,313,652 | 418,544 | (164,064) | 254,480 |
VIP Investor Freedom 2010 | 55,673,494 | 2,678,809 | (1,154,638) | 1,524,171 |
VIP Investor Freedom 2015 | 59,084,183 | 3,464,378 | (1,177,936) | 2,286,442 |
VIP Investor Freedom 2020 | 73,728,104 | 4,686,488 | (2,046,015) | 2,640,473 |
VIP Investor Freedom 2025 | 27,859,395 | 1,611,635 | (883,552) | 728,083 |
VIP Investor Freedom 2030 | 30,475,611 | 1,958,573 | (1,079,646) | 878,927 |
| Undistributed
Ordinary Income | Undistributed Long-term Capital Gain |
VIP Investor Freedom Income | $ 90,215 | $ 166,146 |
VIP Investor Freedom 2005 | 93,894 | 205,327 |
VIP Investor Freedom 2010 | 537,232 | 1,340,947 |
VIP Investor Freedom 2015 | 751,938 | 1,826,677 |
VIP Investor Freedom 2020 | 1,084,559 | 2,645,141 |
VIP Investor Freedom 2025 | 355,833 | 974,874 |
VIP Investor Freedom 2030 | 640,782 | 1,197,406 |
The tax character of distributions paid was as follows:
December 31, 2007 | Ordinary Income | Long-term
Capital Gains | Total |
VIP Investor Freedom Income | $ 867,589 | $ 55,382 | $ 922,971 |
VIP Investor Freedom 2005 | 297,308 | 52,458 | 349,766 |
VIP Investor Freedom 2010 | 1,809,124 | 342,122 | 2,151,246 |
VIP Investor Freedom 2015 | 1,948,688 | 556,535 | 2,505,223 |
VIP Investor Freedom 2020 | 2,273,037 | 759,251 | 3,032,288 |
VIP Investor Freedom 2025 | 771,186 | 252,951 | 1,024,137 |
VIP Investor Freedom 2030 | 604,298 | 305,029 | 909,327 |
December 31, 2006 | Ordinary Income |
VIP Investor Freedom Income | $ 18,224 |
VIP Investor Freedom 2005 | 11,222 |
VIP Investor Freedom 2010 | 47,558 |
VIP Investor Freedom 2015 | 37,916 |
VIP Investor Freedom 2020 | 71,710 |
VIP Investor Freedom 2025 | 16,468 |
VIP Investor Freedom 2030 | 27,477 |
New Accounting Pronouncement. In September 2006, Statement of Financial Accounting Standards No. 157, Fair Value Measurements (SFAS 157), was issued and is effective for fiscal years beginning after November 15, 2007. SFAS 157 defines fair value, establishes a framework for measuring fair value and expands disclosures about fair value measurements. Management is currently evaluating the impact the adoption of SFAS 157 will have on the Funds' financial statement disclosures.
3. Operating Policies.
Repurchase Agreements. FMR has received an Exemptive Order from the Securities and Exchange Commission (the SEC) which permits certain Funds and other affiliated entities of FMR to transfer uninvested cash balances into joint trading accounts which are then invested in repurchase agreements. Certain Funds may also invest directly with institutions in repurchase agreements. Repurchase agreements are collateralized by government or non-government securities. Upon settlement date, collateral is held in segregated accounts with custodian banks and may be obtained in the event of a default of the counterparty. Each applicable Fund monitors, on a daily basis, the value of the collateral to ensure it is at least equal to the principal amount of the repurchase agreement (including accrued interest). In the event of a default by the counterparty, realization of the collateral proceeds could be delayed, during which time the value of the collateral may decline.
Annual Report
Notes to Financial Statements - continued
4. Purchases and Sales of Investments.
Purchases and redemptions of the Underlying Fund shares are noted in the table below.
| Purchases ($) | Redemptions ($) |
VIP Investor Freedom Income | 14,819,295 | 5,855,376 |
VIP Investor Freedom 2005 | 7,421,387 | 3,704,442 |
VIP Investor Freedom 2010 | 31,924,746 | 6,227,125 |
VIP Investor Freedom 2015 | 28,475,628 | 7,230,576 |
VIP Investor Freedom 2020 | 36,119,559 | 7,363,080 |
VIP Investor Freedom 2025 | 16,280,490 | 2,257,371 |
VIP Investor Freedom 2030 | 19,431,952 | 2,798,975 |
5. Fees and Other Transactions with Affiliates.
Management Fee. Strategic Advisers, Inc. (Strategic Advisers), an affiliate of FMR, provides the Funds with investment management related services. The Funds do not pay any fees for these services.
Other Transactions. Strategic Advisers has entered into an administration agreement with FMR under which FMR provides management and administrative services (other than investment advisory services) necessary for the operation of each Fund. Pursuant to this agreement, FMR pays all expenses of each Fund, excluding the compensation of the independent Trustees and certain other expenses such as interest expense. FMR also contracts with other Fidelity companies to perform the services necessary for the operation of each Fund. The Funds do not pay any fees for these services.
6. Expense Reductions.
FMR voluntarily agreed to reimburse Funds to the extent annual operating expenses exceeded certain levels of average net assets as noted in the table below. Some expenses, for example interest expense, are excluded from this reimbursement.
The following Funds were in reimbursement during the period:
| Expense
Limitations | | Reimbursement
from adviser |
VIP Investor Freedom Income | 0% | | $ 51 |
VIP Investor Freedom 2005 | 0% | | 23 |
VIP Investor Freedom 2010 | 0% | | 146 |
VIP Investor Freedom 2015 | 0% | | 172 |
VIP Investor Freedom 2020 | 0% | | 214 |
VIP Investor Freedom 2025 | 0% | | 71 |
VIP Investor Freedom 2030 | 0% | | 80 |
7. Other.
The Funds' organizational documents provide former and current trustees and officers with a limited indemnification against liabilities arising in connection with the performance of their duties to the Funds. In the normal course of business, the Funds may also enter into contracts that provide general indemnifications. The Funds' maximum exposure under these arrangements is unknown as this would be dependent on future claims that may be made against the Funds. The risk of material loss from such claims is considered remote.
At the end of the period, FMR or its affiliates were owners of record of more than 10% of the outstanding shares of the following funds:
| Affiliated % |
VIP Investor Freedom Income | 100% |
VIP Investor Freedom 2005 | 100% |
VIP Investor Freedom 2010 | 100% |
VIP Investor Freedom 2015 | 100% |
VIP Investor Freedom 2020 | 100% |
VIP Investor Freedom 2025 | 100% |
VIP Investor Freedom 2030 | 100% |
VIP Investor Freedom Portfolios
Report of Independent Registered Public Accounting Firm
To the Trustees of Variable Insurance Products V and the Shareholders of VIP Investor Freedom Income Portfolio, VIP Investor Freedom 2005 Portfolio, VIP Investor Freedom 2010 Portfolio, VIP Investor Freedom 2015 Portfolio, VIP Investor Freedom 2020 Portfolio, VIP Investor Freedom 2025 Portfolio, VIP Investor Freedom 2030 Portfolio:
In our opinion, the accompanying statements of assets and liabilities, including the schedules of investments, and the related statements of operations and of changes in net assets and the financial highlights present fairly, in all material respects, the financial position of VIP Investor Freedom Income Portfolio, VIP Investor Freedom 2005 Portfolio, VIP Investor Freedom 2010 Portfolio, VIP Investor Freedom 2015 Portfolio, VIP Investor Freedom 2020 Portfolio, VIP Investor Freedom 2025 Portfolio and VIP Investor Freedom 2030 Portfolio (the Funds), each a fund of Variable Insurance Products V Trust at December 31, 2007, the results of each of their operations for the year then ended, the changes in each of their net assets for each of the two years in the period then ended and the financial highlights for each of the periods indicated, in conformity with accounting principles generally accepted in the United States of America. These financial statements and financial highlights (hereafter referred to as "financial statements") are the responsibility of the Funds' management. Our responsibility is to express an opinion on these financial statements based on our audits. We conducted our audits of these financial statements in accordance with the standards of the Public Company Accounting Oversight Board (United States). Those standards require that we plan and perform the audit to obtain reasonable assurance about whether the financial statements are free of material misstatement. An audit includes examining, on a test basis, evidence supporting the amounts and disclosures in the financial statements, assessing the accounting principles used and significant estimates made by management, and evaluating the overall financial statement presentation. We believe that our audits, which included confirmation of securities at December 31, 2007 by correspondence with the transfer agent provide a reasonable basis for our opinion.
/s/ PricewaterhouseCoopers LLP
PricewaterhouseCoopers LLP
Boston, Massachusetts
February 28, 2008
Annual Report
Trustees and Officers
The Trustees, Members of the Advisory Board, and executive officers of the trust and funds, as applicable, are listed below. The Board of Trustees governs each fund and is responsible for protecting the interests of shareholders. The Trustees are experienced executives who meet periodically throughout the year to oversee each fund's activities, review contractual arrangements with companies that provide services to each fund, and review each fund's performance. If the interests of a fund and an underlying Fidelity fund were to diverge, a conflict of interest could arise and affect how the Trustees and Members of the Advisory Board fulfill their fiduciary duties to the affected funds. Strategic Advisers has structured the funds to avoid these potential conflicts, although there may be situations where a conflict of interest is unavoidable. In such instances, Strategic Advisers, the Trustees, and Members of the Advisory Board would take reasonable steps to minimize and, if possible, eliminate the conflict. Except for James C. Curvey, each of the Trustees oversees 373 funds advised by FMR or an affiliate. Mr. Curvey oversees 368 funds advised by FMR or an affiliate.
The Trustees hold office without limit in time except that (a) any Trustee may resign; (b) any Trustee may be removed by written instrument, signed by at least two-thirds of the number of Trustees prior to such removal; (c) any Trustee who requests to be retired or who has become incapacitated by illness or injury may be retired by written instrument signed by a majority of the other Trustees; and (d) any Trustee may be removed at any special meeting of shareholders by a two-thirds vote of the outstanding voting securities of the trust. Each Trustee who is not an interested person (as defined in the 1940 Act) (Independent Trustee), shall retire not later than the last day of the calendar year in which his or her 72nd birthday occurs. The Independent Trustees may waive this mandatory retirement age policy with respect to individual Trustees. The executive officers and Advisory Board Members hold office without limit in time, except that any officer and Advisory Board Member may resign or may be removed by a vote of a majority of the Trustees at any regular meeting or any special meeting of the Trustees. Except as indicated, each individual has held the office shown or other offices in the same company for the past five years.
The fund's Statement of Additional Information (SAI) includes more information about the Trustees. To request a free copy, call Fidelity at 1-800-208-0098.
Interested Trustees*:
Correspondence intended for each Trustee who is an interested person may be sent to Fidelity Investments, 82 Devonshire Street, Boston, Massachusetts 02109.
Name, Age; Principal Occupation |
Edward C. Johnson 3d (77) |
| Year of Election or Appointment: 1989 Mr. Johnson is Chairman of the Board of Trustees. Mr. Johnson serves as President (2006-present), Chief Executive Officer, Chairman, and a Director of FMR LLC; Chairman and a Director of FMR; Chairman and a Director of Fidelity Research & Analysis Company (FRAC); Chairman and a Director of Fidelity Investments Money Management, Inc.; and Chairman (2001-present) and a Director of FMR Co., Inc. In addition, Mr. Johnson serves as Chairman and Director of Fidelity International Limited (FIL). Mr. Edward C. Johnson 3d and Mr. Arthur E. Johnson are not related. |
James C. Curvey (72) |
| Year of Election or Appointment: 2007 Mr. Curvey also serves as Trustee (2007-present) or Member of the Advisory Board (2007-present) of other investment companies advised by FMR. Mr. Curvey is a Director of FMR and FMR Co., Inc. (2007-present). Mr. Curvey is also Vice Chairman (2006-present) and Director of FMR LLC. Mr. Curvey joined Fidelity in 1982 and served in numerous senior management positions, including President and Chief Operating Officer of FMR LLC (1997-2000) and President of Fidelity Strategic Investments (2000-2002). In addition, he serves as a member of the Board of Directors of Geerlings & Wade, Inc. (wine distribution). |
* Trustees have been determined to be "Interested Trustees" by virtue of, among other things, their affiliation with the trust or various entities under common control with FMR. FMR Corp. merged with and into FMR LLC on October 1, 2007. Any references to FMR LLC for prior periods are deemed to be references to the prior entity.
Independent Trustees:
Correspondence intended for each Independent Trustee (that is, the Trustees other than the Interested Trustees) may be sent to Fidelity Investments, P.O. Box 55235, Boston, Massachusetts 02205-5235.
Name, Age; Principal Occupation |
Dennis J. Dirks (59) |
| Year of Election or Appointment: 2005 Prior to his retirement in May 2003, Mr. Dirks was Chief Operating Officer and a member of the Board of The Depository Trust & Clearing Corporation (DTCC) (1999-2003). He also served as President, Chief Operating Officer, and Board member of The Depository Trust Company (DTC) (1999-2003) and President and Board member of the National Securities Clearing Corporation (NSCC) (1999-2003). In addition, Mr. Dirks served as Chief Executive Officer and Board member of the Government Securities Clearing Corporation (2001-2003) and Chief Executive Officer and Board member of the Mortgage-Backed Securities Clearing Corporation (2001-2003). Mr. Dirks also serves as a Trustee and a member of the Finance Committee of Manhattan College (2005-present) and a Trustee and a member of the Finance Committee of AHRC of Nassau County (2006-present). |
Albert R. Gamper, Jr. (65) |
| Year of Election or Appointment: 2006 Prior to his retirement in December 2004, Mr. Gamper served as Chairman of the Board of CIT Group Inc. (commercial finance). During his tenure with CIT Group Inc. Mr. Gamper served in numerous senior management positions, including Chairman (1987-1989; 1999-2001; 2002-2004), Chief Executive Officer (1987-2004), and President (1989-2002). He currently serves as a member of the Board of Directors of Public Service Enterprise Group (utilities, 2001-present), Chairman of the Board of Governors, Rutgers University (2004-present), and Chairman of the Board of Saint Barnabas Health Care System. |
George H. Heilmeier (71) |
| Year of Election or Appointment: 2004 Dr. Heilmeier is Chairman Emeritus of Telcordia Technologies (communication software and systems), where prior to his retirement, he served as company Chairman and Chief Executive Officer. He currently serves on the Boards of Directors of The Mitre Corporation (systems engineering and information technology support for the government), and HRL Laboratories (private research and development, 2004-present). He is Chairman of the General Motors Science & Technology Advisory Board and a Life Fellow of the Institute of Electrical and Electronics Engineers (IEEE). Dr. Heilmeier is a member of the Defense Science Board and the National Security Agency Advisory Board. He is also a member of the National Academy of Engineering, the American Academy of Arts and Sciences, and the Board of Overseers of the School of Engineering and Applied Science of the University of Pennsylvania. Previously, Dr. Heilmeier served as a Director of TRW Inc. (automotive, space, defense, and information technology, 1992-2002), Compaq (1994-2002), Automatic Data Processing, Inc. (ADP) (technology-based business outsourcing, 1995-2002), INET Technologies Inc. (telecommunications network surveillance, 2001-2004), and Teletech Holdings (customer management services). He is the recipient of the 2005 Kyoto Prize in Advanced Technology for his invention of the liquid crystal display, and a member of the Consumer Electronics Hall of Fame. |
James H. Keyes (67) |
| Year of Election or Appointment: 2007 Prior to his retirement in 2003, Mr. Keyes was Chairman, President, and Chief Executive Officer of Johnson Controls, Inc. (automotive supplier, 1993-2003). He currently serves as a member of the boards of LSI Logic Corporation (semiconductor technologies), Navistar International Corporation (manufacture and sale of trucks, buses, and diesel engines, 2002-present), and Pitney Bowes, Inc. (integrated mail, messaging, and document management solutions). |
Marie L. Knowles (61) |
| Year of Election or Appointment: 2001 Prior to Ms. Knowles' retirement in June 2000, she served as Executive Vice President and Chief Financial Officer of Atlantic Richfield Company (ARCO) (diversified energy, 1996-2000). From 1993 to 1996, she was a Senior Vice President of ARCO and President of ARCO Transportation Company. She served as a Director of ARCO from 1996 to 1998. She currently serves as a Director of Phelps Dodge Corporation (copper mining and manufacturing) and McKesson Corporation (healthcare service, 2002-present). Ms. Knowles is a Trustee of the Brookings Institution and the Catalina Island Conservancy and also serves as a member of the Advisory Board for the School of Engineering of the University of Southern California. |
Ned C. Lautenbach (63) |
| Year of Election or Appointment: 2000 Mr. Lautenbach is Chairman of the Independent Trustees (2006-present). Mr. Lautenbach has been a partner of Clayton, Dubilier & Rice, Inc. (private equity investment firm) since September 1998. Previously, Mr. Lautenbach was with the International Business Machines Corporation (IBM) from 1968 until his retirement in 1998. Mr. Lautenbach serves as a Director of Sony Corporation (2006-present) and Eaton Corporation (diversified industrial) as well as the Philharmonic Center for the Arts in Naples, Florida. He also is a member of the Board of Trustees of Fairfield University (2005-present), as well as a member of the Council on Foreign Relations. |
Cornelia M. Small (63) |
| Year of Election or Appointment: 2005 Ms. Small is a member (2000-present) and Chairperson (2002-present) of the Investment Committee, and a member (2002-present) of the Board of Trustees of Smith College. Previously, she served as Chief Investment Officer (1999-2000), Director of Global Equity Investments (1996-1999), and a member of the Board of Directors of Scudder, Stevens & Clark (1990-1997) and Scudder Kemper Investments (1997-1999). In addition, Ms. Small served as Co-Chair (2000-2003) of the Annual Fund for the Fletcher School of Law and Diplomacy. |
William S. Stavropoulos (68) |
| Year of Election or Appointment: 2001 Mr. Stavropoulos is Chairman Emeritus of the Board of Directors of The Dow Chemical Company. Since joining The Dow Chemical Company in 1967, Mr. Stavropoulos served in numerous senior management positions, including President (1993-2000; 2002-2003), CEO (1995-2000; 2002-2004), and Chairman of the Executive Committee (2000-2004). Currently, he is a Director of NCR Corporation (data warehousing and technology solutions), Chemical Financial Corporation, Maersk Inc. (industrial conglomerate, 2002-present), Tyco International, Inc. (multinational manufacturing and services, 2007-present), and a member of the Advisory Board for Metalmark Capital (private equity investment firm, 2005-present). He is a special advisor to Clayton, Dubilier & Rice, Inc., a private equity investment firm. He also serves as a member of the Board of Trustees of the American Enterprise Institute for Public Policy Research. In addition, Mr. Stavropoulos is a member of The Business Council, J.P. Morgan International Council and the University of Notre Dame Advisory Council for the College of Science. |
Kenneth L. Wolfe (68) |
| Year of Election or Appointment: 2005 Mr. Wolfe is Chairman and a Director of Hershey Foods Corporation (2007-present), where prior to his retirement in 2001, he was Chairman and Chief Executive Officer. Mr. Wolfe currently serves as a member of the board of Revlon Inc. (2004-present). Previously, Mr. Wolfe served as a member of the boards of Adelphia Communications Corporation (2003-2006) and Bausch & Lomb, Inc. (1993-2007). |
Advisory Board Members and Executive Officers**:
Correspondence intended for Mr. Mauriello, Mr. Thomas, Mr. Wiley, Mr. Lacy, and Mr. Arthur Johnson may be sent to Fidelity Investments, P.O. Box 55235, Boston, Massachusetts 02205-5235. Correspondence intended for each executive officer and Mr. Lynch may be sent to Fidelity Investments, 82 Devonshire Street, Boston, Massachusetts 02109.
Name, Age; Principal Occupation |
Arthur E. Johnson (60) |
| Year of Election or Appointment: 2008 Member of the Advisory Board of Variable Insurance Products Fund V. Mr. Johnson serves as Senior Vice President of Corporate Strategic Development of Lockheed Martin Corporation (defense contractor). In addition, Mr. Johnson serves as a member of the Board of Directors of AGL Resources, Inc. (holding company, 2002-present), and IKON Office Solutions, Inc. (document management systems and services). Mr. Arthur E. Johnson and Mr. Edward C. Johnson 3d are not related. |
Alan J. Lacy (54) |
| Year of Election or Appointment: 2008 Member of the Advisory Board of Variable Insurance Products Fund V. Mr. Lacy serves as Senior Adviser (2007-present) of Oak Hill Capital Partners, L.P. (a private equity firm). Mr. Lacy also served as Vice Chairman and Chief Executive Officer of Sears Holdings Corporation and Sears, Roebuck and Co. (retail, 2005-2006; 2000-2005). In addition, Mr. Lacy serves as a member of the Board of Directors of The Western Union Company (global money transfer, 2006-present) and Bristol-Myers Squibb (global pharmaceuticals, 2007-present). Mr. Lacy is a Trustee of the National Parks Conservation Association and The Field Museum of Natural History. |
Peter S. Lynch (63) |
| Year of Election or Appointment: 2003 Member of the Advisory Board of Variable Insurance Products Fund V. Mr. Lynch is Vice Chairman and a Director of FMR, and Vice Chairman (2001-present) and a Director of FMR Co., Inc. Previously, Mr. Lynch served as a Trustee of the Fidelity funds (1990-2003). In addition, he serves as a Trustee of Boston College and as the Chairman of the Inner-City Scholarship Fund. |
Joseph Mauriello (63) |
| Year of Election or Appointment: 2007 Member of the Advisory Board of Variable Insurance Products Fund V. Prior to his retirement in January 2006, Mr. Mauriello served in numerous senior management positions including Deputy Chairman and Chief Operating Officer (2004-2005), and Vice Chairman of Financial Services (2002-2004) of KPMG LLP US (professional services firm, 1965-2005). Mr. Mauriello currently serves as a member of the Board of Directors of XL Capital Ltd. (global insurance and re-insurance company, 2006-present) and of Arcadia Resources Inc. (health care services and products, 2007-present). He also served as a Director of the Hamilton Funds of the Bank of New York (2006-2007). |
David M. Thomas (58) |
| Year of Election or Appointment: 2007 Member of the Advisory Board of Variable Insurance Products Fund V. Previously, Mr. Thomas served as Executive Chairman (2005-2006) and Chairman and Chief Executive Officer (2000-2005) of IMS Health, Inc. (pharmaceutical and healthcare information solutions). In addition, Mr. Thomas serves as a member of the Board of Directors of Fortune Brands, Inc. (consumer products holding company), and Interpublic Group of Companies, Inc. (marketing communication, 2004-present). |
Michael E. Wiley (57) |
| Year of Election or Appointment: 2007 Member of the Advisory Board of Variable Insurance Products Fund V. Mr. Wiley also serves as a member of the Board of Trustees of the University of Tulsa (2000-2006; 2007-present). He serves as a Director of Tesoro Corporation (independent oil refiner and marketer, 2005-present), and a Director of Bill Barrett Corporation (exploration and production company, 2005-present). In addition, he also serves as a Director of Post Oak Bank (privately-held bank, 2004-present). Previously, Mr. Wiley served as a Sr. Energy Advisor of Katzenbach Partners, LLC (consulting firm, 2006-2007), as an Advisory Director of Riverstone Holdings (private investment firm), Chairman, President, and CEO of Baker Hughes, Inc. (oilfield services company, 2000-2004), and as Director of Spinnaker Exploration Company (exploration and production company, 2001-2005). |
Kimberley H. Monasterio (44) |
| Year of Election or Appointment: 2007 President and Treasurer of VIP Investor Freedom Income, VIP Investor Freedom 2005, VIP Investor Freedom 2010, VIP Investor Freedom 2015, VIP Investor Freedom 2020, VIP Investor Freedom 2025, and VIP Investor Freedom 2030. Ms. Monasterio also serves as President and Treasurer of other Fidelity funds (2007-present) and is an employee of FMR (2004-present). Previously, Ms. Monasterio served as Deputy Treasurer of the Fidelity funds (2004-2006). Before joining Fidelity Investments, Ms. Monasterio served as Treasurer (2000-2004) and Chief Financial Officer (2002-2004) of the Franklin Templeton Funds and Senior Vice President of Franklin Templeton Services, LLC (2000-2004). |
Ren Y. Cheng (50) |
| Year of Election or Appointment: 2007 Vice President of VIP Investor Freedom Income, VIP Investor Freedom 2005, VIP Investor Freedom 2010, VIP Investor Freedom 2015, VIP Investor Freedom 2020, VIP Investor Freedom 2025, and VIP Investor Freedom 2030. Mr. Cheng also serves as Vice President of certain Asset Allocation Funds (2007-present). Mr. Cheng is Chief Investment Officer of the Global Asset Allocation group (2007-present). Mr. Cheng also serves as Vice President of FMR and FMR Co., Inc. Mr. Cheng served as Managing Director of the Global Asset Allocation group (2005-2007). Previously, Mr. Cheng served as a portfolio manager for the Fidelity Freedom Funds. |
Boyce I. Greer (51) |
| Year of Election or Appointment: 2005 Vice President of VIP Investor Freedom Income, VIP Investor Freedom 2005, VIP Investor Freedom 2010, VIP Investor Freedom 2015, VIP Investor Freedom 2020, VIP Investor Freedom 2025, and VIP Investor Freedom 2030. Mr. Greer also serves as Vice President of certain Asset Allocation Funds (2005-present), Fixed-Income Funds (2006-present), and Money Market Funds (2006-present). Mr. Greer is also a Trustee of other investment companies advised by FMR (2003-present). Mr. Greer is an Executive Vice President of FMR (2005-present) and FMR Co., Inc. (2005-present), and Senior Vice President of Fidelity Investments Money Management, Inc. (2006-present). Previously, Mr. Greer served as Vice President of certain Fidelity Equity Funds (2005-2007), a Director and Managing Director of Strategic Advisers, Inc. (2002-2005), and Executive Vice President (2000-2002) and Money Market Group Leader (1997-2002) of the Fidelity Investments Fixed Income Division. Mr. Greer also served as Vice President of Fidelity's Money Market Funds (1997-2002), Senior Vice President of FMR (1997-2002), and Vice President of FIMM (1998-2002). |
Eric D. Roiter (59) |
| Year of Election or Appointment: 2005 Secretary of VIP Investor Freedom Income, VIP Investor Freedom 2005, VIP Investor Freedom 2010, VIP Investor Freedom 2015, VIP Investor Freedom 2020, VIP Investor Freedom 2025, and VIP Investor Freedom 2030. He also serves as Secretary of other Fidelity funds; Vice President, General Counsel, and Secretary of FMR Co., Inc. (2001-present) and FMR; Assistant Secretary of Fidelity Management & Research (U.K.) Inc. (2001-present), Fidelity Research & Analysis Company (2001-present), and Fidelity Investments Money Management, Inc. (2001-present). Mr. Roiter is an Adjunct Member, Faculty of Law, at Boston College Law School (2003-present). Previously, Mr. Roiter served as Vice President and Secretary of Fidelity Distributors Corporation (FDC) (1998-2005). |
John B. McGinty, Jr. (45) |
| Year of Election or Appointment: 2008 Assistant Secretary of VIP Investor Freedom Income, VIP Investor Freedom 2005, VIP Investor Freedom 2010, VIP Investor Freedom 2015, VIP Investor Freedom 2020, VIP Investor Freedom 2025, and VIP Investor Freedom 2030. Mr. McGinty also serves as Assistant Secretary of other Fidelity funds (2008-present) and is an employee of FMR LLC (2004-present). Mr. McGinty also serves as Senior Vice President, Secretary, and Chief Legal Officer of FDC (2007-present). Before joining Fidelity Investments, Mr. McGinty practiced law at Ropes & Gray, LLP. |
R. Stephen Ganis (41) |
| Year of Election or Appointment: 2006 Anti-Money Laundering (AML) officer of VIP Investor Freedom Income, VIP Investor Freedom 2005, VIP Investor Freedom 2010, VIP Investor Freedom 2015, VIP Investor Freedom 2020, VIP Investor Freedom 2025, and VIP Investor Freedom 2030. Mr. Ganis also serves as AML officer of other Fidelity funds (2006-present) and FMR LLC (2003-present). Before joining Fidelity Investments, Mr. Ganis practiced law at Goodwin Procter, LLP (2000-2002). |
Joseph B. Hollis (59) |
| Year of Election or Appointment: 2006 Chief Financial Officer of VIP Investor Freedom Income, VIP Investor Freedom 2005, VIP Investor Freedom 2010, VIP Investor Freedom 2015, VIP Investor Freedom 2020, VIP Investor Freedom 2025, and VIP Investor Freedom 2030. Mr. Hollis also serves as Chief Financial Officer of other Fidelity funds. Mr. Hollis is President of Fidelity Pricing and Cash Management Services (FPCMS) (2005-present). Mr. Hollis also serves as President and Director of Fidelity Service Company, Inc. (2006-present). Previously, Mr. Hollis served as Senior Vice President of Cash Management Services (1999-2002) and Investment Management Operations (2002-2005). |
Kenneth A. Rathgeber (60) |
| Year of Election or Appointment: 2005 Chief Compliance Officer of VIP Investor Freedom Income, VIP Investor Freedom 2005, VIP Investor Freedom 2010, VIP Investor Freedom 2015, VIP Investor Freedom 2020, VIP Investor Freedom 2025, and VIP Investor Freedom 2030. Mr. Rathgeber also serves as Chief Compliance Officer of other Fidelity funds (2004-present) and Executive Vice President of Risk Oversight for Fidelity Investments (2002-present). He is Chief Compliance Officer of FMR (2005-present), FMR Co., Inc. (2005-present), Fidelity Management & Research (U.K.) Inc. (2005-present), Fidelity Research & Analysis Company (2005-present), Fidelity Investments Money Management, Inc. (2005-present), and Strategic Advisers, Inc. (2005-present). Previously, Mr. Rathgeber served as Executive Vice President and Chief Operating Officer for Fidelity Investments Institutional Services Company, Inc. (1998-2002). |
Bryan A. Mehrmann (46) |
| Year of Election or Appointment: 2005 Deputy Treasurer of VIP Investor Freedom Income, VIP Investor Freedom 2005, VIP Investor Freedom 2010, VIP Investor Freedom 2015, VIP Investor Freedom 2020, VIP Investor Freedom 2025, and VIP Investor Freedom 2030. Mr. Mehrmann also serves as Deputy Treasurer of other Fidelity funds (2005-present) and is an employee of FMR. Previously, Mr. Mehrmann served as Vice President of Fidelity Investments Institutional Services Group (FIIS)/Fidelity Investments Institutional Operations Corporation, Inc. (FIIOC) Client Services (1998-2004). |
Kenneth B. Robins (38) |
| Year of Election or Appointment: 2005 Deputy Treasurer of VIP Investor Freedom Income, VIP Investor Freedom 2005, VIP Investor Freedom 2010, VIP Investor Freedom 2015, VIP Investor Freedom 2020, VIP Investor Freedom 2025, and VIP Investor Freedom 2030. Mr. Robins also serves as Deputy Treasurer of other Fidelity funds (2005-present) and is an employee of FMR (2004-present). Before joining Fidelity Investments, Mr. Robins worked at KPMG LLP, where he was a partner in KPMG's department of professional practice (2002-2004) and a Senior Manager (1999-2000). In addition, Mr. Robins served as Assistant Chief Accountant, United States Securities and Exchange Commission (2000-2002). |
Robert G. Byrnes (41) |
| Year of Election or Appointment: 2005 Assistant Treasurer of VIP Investor Freedom Income, VIP Investor Freedom 2005, VIP Investor Freedom 2010, VIP Investor Freedom 2015, VIP Investor Freedom 2020, VIP Investor Freedom 2025, and VIP Investor Freedom 2030. Mr. Byrnes also serves as Assistant Treasurer of other Fidelity funds (2005-present) and is an employee of FMR (2005-present). Previously, Mr. Byrnes served as Vice President of FPCMS (2003-2005). Before joining Fidelity Investments, Mr. Byrnes worked at Deutsche Asset Management where he served as Vice President of the Investment Operations Group (2000-2003). |
Peter L. Lydecker (53) |
| Year of Election or Appointment: 2005 Assistant Treasurer of VIP Investor Freedom Income, VIP Investor Freedom 2005, VIP Investor Freedom 2010, VIP Investor Freedom 2015, VIP Investor Freedom 2020, VIP Investor Freedom 2025, and VIP Investor Freedom 2030. Mr. Lydecker also serves as Assistant Treasurer of other Fidelity funds (2004) and is an employee of FMR. |
Paul M. Murphy (60) |
| Year of Election or Appointment: 2007 Assistant Treasurer of VIP Investor Freedom Income, VIP Investor Freedom 2005, VIP Investor Freedom 2010, VIP Investor Freedom 2015, VIP Investor Freedom 2020, VIP Investor Freedom 2025, and VIP Investor Freedom 2030. Mr. Murphy also serves as Assistant Treasurer of other Fidelity funds (2007-present) and is an employee of FMR (2007-present). Previously, Mr. Murphy served as Chief Financial Officer of the Fidelity Funds (2005-2006), Vice President and Associate General Counsel of FMR (2007), and Senior Vice President of Fidelity Pricing and Cash Management Services Group (FPCMS) (1994-2007). |
Gary W. Ryan (49) |
| Year of Election or Appointment: 2005 Assistant Treasurer of VIP Investor Freedom Income, VIP Investor Freedom 2005, VIP Investor Freedom 2010, VIP Investor Freedom 2015, VIP Investor Freedom 2020, VIP Investor Freedom 2025, and VIP Investor Freedom 2030. Mr. Ryan also serves as Assistant Treasurer of other Fidelity funds (2005-present) and is an employee of FMR (2005-present). Previously, Mr. Ryan served as Vice President of Fund Reporting in FPCMS (1999-2005). |
** FMR Corp. merged with and into FMR LLC on October 1, 2007. Any references to FMR LLC for prior periods are deemed to be references to the prior entity.
Annusl Report
Distributions
The Board of Trustees of each voted to pay to shareholders of record at the opening of business on record date, the following distributions per share derived from capital gains realized from sales of portfolio securities, and dividends derived from net investment income:
| Pay Date | Record Date | Dividends | Capital Gains |
VIP Investor Freedom Income Portfolio | 02/15/08 | 02/15/08 | $0.000 | $0.140 |
VIP Investor Freedom 2005 Portfolio | 02/15/08 | 02/15/08 | $0.000 | $0.425 |
VIP Investor Freedom 2010 Portfolio | 02/15/08 | 02/15/08 | $0.000 | $0.380 |
VIP Investor Freedom 2015 Portfolio | 02/15/08 | 02/15/08 | $0.010 | $0.500 |
VIP Investor Freedom 2020 Portfolio | 02/15/08 | 02/15/08 | $0.010 | $0.585 |
VIP Investor Freedom 2025 Portfolio | 02/15/08 | 02/15/08 | $0.000 | $0.590 |
VIP Investor Freedom 2030 Portfolio | 02/15/08 | 02/15/08 | $0.070 | $0.620 |
The funds hereby designate as capital gain dividend the amounts noted below for the taxable year ended December 31, 2007, or, if subsequently determined to be different, the net capital gain of such year.
Fund |
|
VIP Investor Freedom Income Portfolio | $ 169,402 |
VIP Investor Freedom 2005 Portfolio | $ 206,231 |
VIP Investor Freedom 2010 Portfolio | $ 1,340,947 |
VIP Investor Freedom 2015 Portfolio | $ 1,841,087 |
VIP Investor Freedom 2020 Portfolio | $ 2,645,141 |
VIP Investor Freedom 2025 Portfolio | $ 980,947 |
VIP Investor Freedom 2030 Portfolio | $ 1,201,162 |
A percentage of the dividends distributed during the fiscal year for the following funds qualifies for the dividends-received deduction for corporate shareholders:
VIP Investor Freedom Income Portfolio | |
02/09/07 | 7% |
12/28/07 | 6% |
VIP Investor Freedom 2005 Portfolio | |
02/09/07 | 17% |
12/28/07 | 16% |
VIP Investor Freedom 2010 Portfolio | |
02/09/07 | 18% |
12/28/07 | 17% |
VIP Investor Freedom 2015 Portfolio | |
02/09/07 | 25% |
12/28/07 | 20% |
VIP Investor Freedom 2020 Portfolio | |
02/09/07 | 30% |
12/28/07 | 26% |
VIP Investor Freedom 2025 Portfolio | |
02/09/07 | 32% |
12/28/07 | 27% |
VIP Investor Freedom 2030 Portfolio | |
02/09/07 | 32% |
12/28/07 | 32% |
The fund will notify shareholders in January 2008 of amounts for use in preparing 2007 income tax returns.
VIP Investor Freedom Portfolios
Board Approval of Investment Advisory Contracts and Management Fees
VIP Investor Freedom Funds
Each year, typically in July, the Board of Trustees, including the Independent Trustees (together, the Board), votes on the renewal of the management contract and administration agreement (together, the Advisory Contracts) for each fund. The Board, assisted by the advice of fund counsel and Independent Trustees' counsel, requests and considers a broad range of information throughout the year.
The Board meets regularly each month except August and takes into account throughout the year matters bearing on Advisory Contracts. The Board, acting directly and through its separate committees, considers at each of its meetings factors that are relevant to the annual renewal of each fund's Advisory Contracts, including the services and support provided to each fund and its shareholders. At the time of the renewal, the Board had 12 standing committees, each composed of Independent Trustees with varying backgrounds, to which the Board has assigned specific subject matter responsibilities in order to enhance effective decision-making by the Board. Each committee has adopted a written charter outlining the structure and purposes of the committee. One such committee, the Equity Contract Committee, meets periodically as needed throughout the year to consider matters specifically related to the annual renewal of Advisory Contracts. The committee requests and receives information on, and makes recommendations to the Independent Trustees concerning, the approval and annual review of the Advisory Contracts.
At its July 2007 meeting, the Board of Trustees, including the Independent Trustees, unanimously determined to renew the Advisory Contracts for each fund. In reaching its determination, the Board considered all factors it believed relevant and ultimately reached a determination, with the assistance of fund counsel and Independent Trustees' counsel, that the renewal of the Advisory Contracts and the compensation to be received by Fidelity under the management contracts is consistent with Fidelity's fiduciary duty under applicable law. In reaching its determination, the Board is aware that shareholders in each fund have a broad range of investment choices available to them, including a wide choice among mutual funds offered by competitors to Fidelity, and that each fund's shareholders, with the opportunity to review and weigh the disclosure provided by the fund in its prospectus and other public disclosures, have chosen to invest in that fund, managed by Fidelity.
Nature, Extent, and Quality of Services Provided. The Board considered staffing within the investment adviser, Strategic Advisers, Inc. (Strategic Advisers), and the administrator, FMR, including the backgrounds of the funds' portfolio managers and the funds' investment objectives and disciplines. The Independent Trustees also had discussions with senior management of Fidelity's investment operations and investment groups. The Board considered the structure of the portfolio manager compensation program and whether this structure provides appropriate incentives.
Resources Dedicated to Investment Management and Support Services. The Board reviewed the size, education, and experience of Strategic Advisers' investment staff, their use of technology, and Strategic Advisers' and FMR's approach to recruiting, training, and retaining portfolio managers and other research, advisory, and management personnel. The Board noted that Fidelity's analysts have access to a variety of technological tools that enable them to perform both fundamental and quantitative analysis and to specialize in various disciplines.
Shareholder and Administrative Services. The Board considered (i) the nature, extent, quality, and cost of advisory, administrative, distribution, and shareholder services performed by FMR and its affiliates under the Advisory Contracts and under separate agreements covering transfer agency, pricing and bookkeeping, and securities lending services for each fund; (ii) the nature and extent of FMR's supervision of third party service providers, principally custodians and subcustodians; and (iii) the resources devoted to, and the record of compliance with, each fund's compliance policies and procedures.
The Board noted that the growth of fund assets across the complex allows Fidelity to reinvest in the development of services designed to enhance the value or convenience of the Fidelity funds as investment vehicles. These services include 24-hour access to account information and market information through phone representatives and over the Internet, and investor education materials and asset allocation tools.
Investment in a Large Fund Family. The Board considered the benefits to shareholders of investing in a Fidelity fund, including the benefits of investing in a fund that is part of a large family of funds offering a variety of investment disciplines and providing for a large variety of mutual fund investor services. The Board noted that, since the last Advisory Contract renewals in July 2006, Fidelity has taken a number of actions that benefited particular funds, including (i) dedicating additional resources to investment research and to restructure the investment research teams; (ii) contractually agreeing to reduce the management fee on Fidelity Advisor Floating Rate High Income Fund; (iii) contractually agreeing to reduce the management fees on Fidelity's California, Massachusetts, New Jersey, and New York AMT Tax-Free Money Market Funds, launching new Institutional Classes and Service Classes of these funds, and contractually agreeing to impose expense limitations on these funds; (iv) eliminating the exchange fee on the Fidelity Select Portfolios and reducing the pricing and bookkeeping fee rates for these funds; (v) reducing the maximum transfer agency fee rates on high income funds and certain equity funds; (vi) proposing amended management contracts that, if approved by shareholders, will add a performance adjustment component to the management fees paid by 18 Fidelity Advisor equity funds; (vii) contractually agreeing to reduce fees for Ultra-Short Central Fund and the money market Central Funds; (viii) waiving the Fidelity Advisor funds' contingent deferred sales charge on certain redemptions made through systematic withdrawal programs; and (ix) amending the management contracts for equity and fixed-income funds whose management contracts incorporate a "group fee" structure by adding four new fee "breakpoints" to the group fee rate schedules.
Investment Performance and Compliance. The Board considered whether each fund has operated within its investment objective, as well as its record of compliance with its investment restrictions. It also reviewed each fund's absolute investment performance, as well as each fund's relative investment performance measured against a proprietary custom index. The Board noted that FMR does not believe that a meaningful peer group exists against which to compare any of the funds' performance. Because each fund had been in existence less than three calendar years, for each fund the following chart considered by the Board shows, for the one-year period ended December 31, 2006, the fund's total return and the total return of a proprietary custom index ("benchmark"). For each fund, the proprietary custom index is an index developed by FMR that represents the performance of the fund's asset classes according to their respective weightings, (for each fund other than VIP Investor Freedom Income Portfolio) adjusted on June 30 and December 31 of each calendar year to reflect the fund's increasingly conservative asset allocations.
Annual Report
Board Approval of Investment Advisory Contracts and Management Fees - continued
VIP Investor Freedom 2005 Portfolio
The Board stated that the relative investment performance of the fund was lower than its benchmark for the period shown. The Board stated that it is difficult to evaluate in any comprehensive fashion the performance of the fund, in light of its relatively recent commencement of operations.
VIP Investor Freedom 2010 Portfolio
The Board stated that the relative investment performance of the fund was lower than its benchmark for the period shown. The Board stated that it is difficult to evaluate in any comprehensive fashion the performance of the fund, in light of its relatively recent commencement of operations.
VIP Investor Freedom Portfolios
VIP Investor Freedom 2015 Portfolio
The Board stated that the relative investment performance of the fund was lower than its benchmark for the period shown. The Board stated that it is difficult to evaluate in any comprehensive fashion the performance of the fund, in light of its relatively recent commencement of operations.
VIP Investor Freedom 2020 Portfolio
The Board stated that the relative investment performance of the fund was lower than its benchmark for the period shown. The Board stated that it is difficult to evaluate in any comprehensive fashion the performance of the fund, in light of its relatively recent commencement of operations.
Annual Report
Board Approval of Investment Advisory Contracts and Management Fees - continued
VIP Investor Freedom 2025 Portfolio

The Board stated that the relative investment performance of the fund was lower than its benchmark for the period shown. The Board stated that it is difficult to evaluate in any comprehensive fashion the performance of the fund, in light of its relatively recent commencement of operations.
VIP Investor Freedom 2030 Portfolio
The Board stated that the relative investment performance of the fund was lower than its benchmark for the period shown. The Board stated that it is difficult to evaluate in any comprehensive fashion the performance of the fund, in light of its relatively recent commencement of operations.
VIP Investor Freedom Portfolios
VIP Investor Freedom Income Portfolio
The Board stated that the relative investment performance of the fund was lower than its benchmark for the period shown. The Board stated that it is difficult to evaluate in any comprehensive fashion the performance of the fund, in light of its relatively recent commencement of operations.
The Board considered that FMR has taken steps to refocus and strengthen equity research, equity portfolio management, and compliance.
Based on its review, and giving particular weight to the nature and quality of the resources dedicated by Strategic Advisers and FMR to maintain and improve relative performance, the Board concluded that the nature, extent, and quality of the services provided to each fund will benefit each fund's shareholders, particularly in light of the Board's view that each fund's shareholders benefit from investing in a fund that is part of a large family of funds offering a variety of investment disciplines and services.
Competitiveness of Management Fee and Total Fund Expenses. The Board noted that the funds do not pay Strategic Advisers a management fee for investment advisory services. The Board considered each fund's management fee and total expenses compared to "mapped groups" of competitive funds and classes. Fidelity creates "mapped groups" by combining similar Lipper investment objective categories that have comparable management fee characteristics. Combining Lipper investment objective categories aids the Board's management fee and total expense comparisons by broadening the competitive group used for comparison and by reducing the number of universes to which various Fidelity funds are compared. The Board also considered supplemental information about how each fund's management fee and total expenses ranked relative to groups based on Lipper classifications, which take into account a fund's market capitalization and style.
The Board considered two proprietary management fee comparisons for the 12-month (or shorter) periods shown in the charts below. The group of Lipper funds used by the Board for management fee comparisons is referred to below as the "Total Mapped Group." The Total Mapped Group comparison focuses on a fund's standing relative to the total universe of comparable funds available to investors, in terms of gross management fees before expense reimbursements or caps. "TMG %" represents the percentage of funds in the Total Mapped Group that had management fees that were lower than a fund's. For example, a TMG of 1% means that 99% of the funds in the Total Mapped Group had higher management fees than a fund. The "Asset-Size Peer Group" (ASPG) comparison focuses on a fund's standing relative to non-Fidelity funds similar in size to the fund within the Total Mapped Group. The ASPG represents at least 15% of the funds in the Total Mapped Group with comparable asset size and management fee characteristics, subject to a minimum of 50 funds (or all funds in the Total Mapped Group if fewer than 50). Additional information, such as the ASPG quartile in which a fund's management fee ranked, is also included in the charts and considered by the Board.
Annual Report
Board Approval of Investment Advisory Contracts and Management Fees - continued
VIP Investor Freedom 2005 Portfolio
VIP Investor Freedom 2010 Portfolio
VIP Investor Freedom Portfolios
VIP Investor Freedom 2015 Portfolio
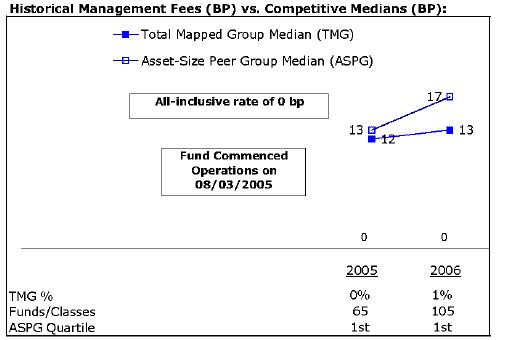
VIP Investor Freedom 2020 Portfolio
Annual Report
Board Approval of Investment Advisory Contracts and Management Fees - continued
VIP Investor Freedom 2025 Portfolio
VIP Investor Freedom 2030 Portfolio
VIP Investor Freedom Portfolios
VIP Investor Freedom Income Portfolio
The Board noted that each fund's management fee ranked below the median of its Total Mapped Group and below the median of its ASPG for 2006.
In its review of each fund's total expenses, the Board noted that each fund invests in Investor Class of the underlying fund to avoid charging fund-paid 12b-1 fees at both fund levels. The Board considered that the funds do not pay transfer agency fees. Instead, Investor Class of each underlying fund bears its pro rata portion of each fund's transfer agency fee according to the percentage of each fund's assets invested in that underlying fund. The Board further noted that FMR pays all other expenses of each fund, with limited exceptions.
The Board noted that each fund's total expenses ranked below its competitive median for 2006.
In its review of total expenses, the Board also considered Fidelity fee structures and other information on clients that FMR and its affiliates service in other competitive markets, such as other mutual funds advised or subadvised by FMR or its affiliates, pension plan clients, and other institutional clients.
Based on its review, the Board concluded that each fund's management fee and total expenses were fair and reasonable in light of the services that the fund and its shareholders receive and the other factors considered.
Costs of the Services and Profitability. The Board considered the level of Fidelity's profits in respect of all the Fidelity funds, as well as the profitability of each underlying fund.
PricewaterhouseCoopers LLP (PwC), independent registered public accounting firm and auditor to Fidelity and certain Fidelity funds, has been engaged annually by the Board as part of the Board's assessment of the results of Fidelity's profitability analysis. PwC's engagement includes the review and assessment of Fidelity's methodologies used in determining the revenues and expenses attributable to Fidelity's mutual fund business, and completion of agreed-upon procedures surrounding the mathematical accuracy of fund profitability and its conformity to allocation methodologies. After considering PwC's reports issued under the engagement and information provided by Fidelity, the Board believes that while other allocation methods may also be reasonable, Fidelity's profitability methodologies are reasonable in all material respects.
The Board has also reviewed Fidelity's non-fund businesses and any fall-out benefits related to the mutual fund business as well as cases where Fidelity's affiliates may benefit from or be related to the funds' business.
The Board concluded that the costs of the services provided by and the profits realized by Fidelity in connection with the operation of each fund were not relevant to the renewal of each fund's Advisory Contracts because the funds do not pay management fees and FMR pays all other expenses of each fund, with limited exceptions.
Economies of Scale. The Board concluded that the realization of economies of scale was not relevant to the renewal of each fund's Advisory Contracts because the funds do not pay management fees and FMR pays all other expenses of each fund, with limited exceptions.
Additional Information Requested by the Board. In order to develop fully the factual basis for consideration of the Fidelity funds' Advisory Contracts, the Board requested and received additional information on several topics, including (i) fund performance trends and actions to be taken by FMR to improve certain funds' overall performance; (ii) Fidelity's portfolio manager compensation structure, including its effects on fund profitability and the extent to which portfolio manager compensation is linked to fund performance; (iii) Fidelity's fee structures; (iv) the funds' sub-advisory arrangements; and (v) accounts managed by Fidelity other than the Fidelity funds.
Annual Report
Board Approval of Investment Advisory Contracts and Management Fees - continued
Based on its evaluation of all of the conclusions noted above, and after considering all material factors, the Board ultimately concluded that the advisory fee structures are fair and reasonable, and that each fund's Advisory Contracts should be renewed.
VIP Investor Freedom Portfolios
Annual Report
VIP Investor Freedom Portfolios
Annual Report
Investment Adviser
Strategic Advisers, Inc.
Boston, MA
General Distributor
Fidelity Distributors Corporation
Boston, MA
Transfer and Service Agents
Fidelity Investments Institutional Operations Company, Inc.
Boston, MA
Fidelity Service Company, Inc.
Boston, MA
Custodian
Mellon Bank, N.A.
Pittsburgh, PA
VIPIFF-ANN-0208
1.814507.102
Fidelity® Variable Insurance Products:
Strategic Income Portfolio
Annual Report
December 31, 2007
(2_fidelity_logos) (Registered_Trademark)
Contents
Performance | <Click Here> | How the fund has done over time. |
Management's Discussion | <Click Here> | The manager's review of fund performance, strategy and outlook. |
Shareholder Expense Example | <Click Here> | An example of shareholder expenses. |
Investment Changes | <Click Here> | A summary of major shifts in the fund's investments over the past six months. |
Investments | <Click Here> | A complete list of the fund's investments with their
market values. |
Financial Statements | <Click Here> | Statements of assets and liabilities, operations, and
changes in net assets, as well as financial highlights. |
Notes | <Click Here> | Notes to the financial statements. |
Report of Independent Registered Public Accounting Firm | <Click Here> | |
Trustees and Officers | <Click Here> | |
Distributions | <Click Here> | |
To view a fund's proxy voting guidelines and proxy voting record for the 12-month period ended June 30, visit http://www.fidelity.com (search for "proxy voting guidelines") or visit the Securities and Exchange Commission's (SEC) web site at http://www.sec.gov. You may also call 1-877-208-0098 to request a free copy of the proxy voting guidelines.
Fidelity Variable Insurance Products are separate account options which are purchased through a variable insurance contract.
Standard & Poor's, S&P and S&P 500 are registered service marks of The McGraw-Hill Companies, Inc. and have been licensed for use by Fidelity Distributors Corporation.
Other third party marks appearing herein are the property of their respective owners.
All other marks appearing herein are registered or unregistered trademarks or service marks of FMR LLC or an affiliated company.
This report and the financial statements contained herein are submitted for the general information of the shareholders of the fund. This report is not authorized for distribution to prospective investors in the fund unless preceded or accompanied by an effective prospectus.
A fund files its complete schedule of portfolio holdings with the SEC for the first and third quarters of each fiscal year on Form N-Q. Forms N-Q are available on the SEC's web site at http://www.sec.gov. A fund's Forms N-Q may be reviewed and copied at the SEC's Public Reference Room in Washington, DC. Information regarding the operation of the SEC's Public Reference Room may be obtained by calling 1-800-SEC-0330. For a complete list of a fund's portfolio holdings, view the most recent holdings listing, semiannual report, or annual report on Fidelity's web site at http://www.fidelity.com or http://www.advisor.fidelity.com, as applicable.
NOT FDIC INSURED · MAY LOSE VALUE · NO BANK GUARANTEE
Neither the fund nor Fidelity Distributors Corporation is a bank.
Annual Report
Performance: The Bottom Line
Average annual total return reflects the change in the value of an investment, assuming reinvestment of the class' dividend income and capital gains (the profits earned upon the sale of securities that have grown in value, if any) and assuming a constant rate of performance each year. During periods of reimbursement by Fidelity, a fund's total return will be greater than it would be had the reimbursement not occurred. Performance numbers are net of all underlying fund operating expenses, but do not include any insurance charges imposed by your insurance company's separate account. If performance information included the effect of these additional charges, the total returns would have been lower. How a fund did yesterday is no guarantee of how it will do tomorrow.
Average Annual Total Returns
Periods ended December 31, 2007 | | Past 1
year | Life of
fund A |
VIP Strategic Income - Initial Class | | 5.59% | 6.24% |
VIP Strategic Income - Service Class B | | 5.51% | 6.12% |
VIP Strategic Income - Service Class 2 C | | 5.45% | 5.97% |
VIP Strategic Income - Investor Class D | | 5.55% | 6.21% |
A From December 23, 2003.
B Performance for Service Class shares reflects an asset-based service fee (12b-1 fee).
C Performance for Service Class 2 shares reflects an asset-based service fee (12b-1 fee).
D The initial offering of Investor Class shares took place on July 21, 2005. Returns prior to July 21, 2005 are those of Initial Class. If Investor Class's transfer agent fee had been reflected, returns prior to July 21, 2005 would have been lower.
$10,000 Over Life of Fund
Let's say hypothetically that $10,000 was invested in VIP Strategic Income Portfolio - Initial Class on December 23, 2003, when the fund started. The chart shows how the value of your investment would have changed, and also shows how the Merrill Lynch U.S. High Yield Master II Constrained Index performed over the same period.
Annual Report
Management's Discussion of Fund Performance
Comments from Derek Young, who became sole Lead Manager of VIP Strategic Income Portfolio on September 4, 2007
It was a year of contrasts in the bond markets. Robust global economic growth during the first half of the year ending December 31, 2007, boosted yields and pushed bond prices lower across the world's four major bond categories. By midyear, however, concerns about a weaker U.S. economy, the subprime-mortgage-related "credit crunch" and the Federal Reserve Board's moves to reduce interest rates sparked a flight to higher-quality fixed-income securities. Against this volatile backdrop, the U.S. government debt market, as represented by the Lehman Brothers® U.S. Government Index, gained 8.66%. The Citigroup® Non-U.S. Group of 7 Index - a gauge of the debt performance of major economies outside the United States - rose 13.05%. Emerging-markets debt results were slightly more muted, as the J.P. Morgan Emerging Markets Bond Index Global rose 6.28%. U.S. high-yield bonds fared worst, with the market's diminishing appetite for risk causing prices to fall, as demonstrated by the anemic 2.53% increase of the Merrill Lynch® U.S. High Yield Master II Constrained Index.
During the past year, the portfolio lagged slightly behind the 6.52% return of the Fidelity Strategic Income Composite Index. (For specific portfolio performance results, please refer to the performance section of this report.) Each of the four debt categories had positive absolute returns, and a defensive strategy of underweighting the higher-risk areas of high-yield and emerging-markets debt helped relative results. However, during a highly volatile period in the bond markets, each of the individual subportfolios underperformed its respective benchmark due to sub-par security selection. In the case of the high-yield allocation, an underweighting helped, although the small portion of high-yield assets that was allocated to the Fidelity® Floating Rate Central Fund - - a group of assets that is better collateralized than high yield but tends to fare less well when interest rates are falling - offset most of the positive effects of that underweighting. On average, the fund maintained more or less neutral weightings in both the U.S. government and developed-markets debt categories, although those weightings were increased as the period progressed in order to impart a greater quality bias to the fund's asset allocation strategy. Favorable currency movements also helped absolute performance.
The views expressed above reflect those of the portfolio manager(s) only through the end of the period as stated on the cover of this report and do not necessarily represent the views of Fidelity or any other person in the Fidelity organization. Any such views are subject to change at any time based upon market or other conditions and Fidelity disclaims any responsibility to update such views. These views may not be relied on as investment advice and, because investment decisions for a Fidelity fund are based on numerous factors, may not be relied on as an indication of trading intent on behalf of any Fidelity fund.
Annual Report
Shareholder Expense Example
As a shareholder of the Fund, you incur two types of costs: (1) transaction costs, and (2) ongoing costs, including management fees, distribution and/or service (12b-1) fees and other Fund expenses. This Example is intended to help you understand your ongoing costs (in dollars) of investing in the Fund and to compare these costs with the ongoing costs of investing in other mutual funds.
The Example is based on an investment of $1,000 invested at the beginning of the period and held for the entire period (July 1, 2007 to December 31, 2007).
Actual Expenses
The first line of the accompanying table for each class of the Fund provides information about actual account values and actual expenses. You may use the information in this line, together with the amount you invested, to estimate the expenses that you paid over the period. Simply divide your account value by $1,000.00 (for example, an $8,600 account value divided by $1,000.00 = 8.6), then multiply the result by the number in the first line for a class of the Fund under the heading entitled "Expenses Paid During Period" to estimate the expenses you paid on your account during this period. The estimate of expenses does not include any fees or other expenses of any variable annuity or variable life insurance product. If they were, the estimate of expenses you paid during the period would be higher, and your ending account value would be lower. In addition, the Fund, as a shareholder in the underlying Fidelity Central Funds, will indirectly bear its pro rata share of the fees and expenses incurred by the underlying Fidelity Central Funds. These fees and expenses are not included in the Fund's annualized expense ratio used to calculate the expense estimate in the table below.
Hypothetical Example for Comparison Purposes
The second line of the accompanying table for each class of the Fund provides information about hypothetical account values and hypothetical expenses based on a Class' actual expense ratio and an assumed rate of return of 5% per year before expenses, which is not the Class' actual return. The hypothetical account values and expenses may not be used to estimate the actual ending account balance or expenses you paid for the period. You may use this information to compare the ongoing costs of investing in the Fund and other funds. To do so, compare this 5% hypothetical example with the 5% hypothetical examples that appear in the shareholder reports of the other funds. The estimate of expenses does not include any fees or other expenses of any variable annuity or variable life insurance product. If they were, the estimate of expenses you paid during the period would be higher, and your ending account value would be lower. In addition, the Fund, as a shareholder in the underlying Fidelity Central Funds, will indirectly bear its pro rata share of the fees and expenses incurred by the underlying Fidelity Central Funds. These fees and expenses are not included in the Fund's annualized expense ratio used to calculate the expense estimate in the table below.
Please note that the expenses shown in the table are meant to highlight your ongoing costs only and do not reflect any transaction costs. Therefore, the second line of the table is useful in comparing ongoing costs only, and will not help you determine the relative total costs of owning different funds.
| Beginning
Account Value
July 1, 2007 | Ending
Account Value
December 31, 2007 | Expenses Paid
During Period*
July 1, 2007 to
December 31, 2007 |
Initial Class | | | |
Actual | $ 1,000.00 | $ 1,037.40 | $ 3.59 |
HypotheticalA | $ 1,000.00 | $ 1,021.68 | $ 3.57 |
Service Class | | | |
Actual | $ 1,000.00 | $ 1,037.60 | $ 4.11 |
HypotheticalA | $ 1,000.00 | $ 1,021.17 | $ 4.08 |
Service Class 2 | | | |
Actual | $ 1,000.00 | $ 1,036.90 | $ 4.88 |
HypotheticalA | $ 1,000.00 | $ 1,020.42 | $ 4.84 |
Investor Class | | | |
Actual | $ 1,000.00 | $ 1,038.00 | $ 4.01** |
HypotheticalA | $ 1,000.00 | $ 1,021.27 | $ 3.97** |
A 5% return per year before expenses
* Expenses are equal to each Class' annualized expense ratio (shown in the table below); multiplied by the average account value over the period, multiplied by 184/365 (to reflect the one-half year period). The fees and expenses of the underlying Fidelity Central Funds in which the Fund invests are not included in the Fund's annualized expense ratio.
| Annualized
Expense Ratio |
Initial Class | .70% |
Service Class | .80% |
Service Class 2 | .95% |
Investor Class | .78%** |
** If changes to transfer agent contracts, effective February 1, 2008 had been in effect during the entire period, the annualized expense ratio would have been .74% and the expenses paid in the actual and hypothetical examples above would have been $3.80 and $3.77, respectively.
Annual Report
Investment Changes
The information in the following tables is based on the combined investments of the Fund and its pro-rata share of its investments in each Fidelity Central Fund.
Top Five Holdings as of December 31, 2007 |
(by issuer, excluding cash equivalents) | % of fund's
net assets | % of fund's net assets
6 months ago |
U.S. Treasury Obligations | 15.9 | 12.1 |
Fannie Mae | 9.9 | 10.8 |
Freddie Mac | 5.8 | 5.5 |
German Federal Republic | 3.3 | 0.2 |
Japan Government | 2.7 | 2.2 |
| 37.6 | |
Top Five Market Sectors as of December 31, 2007 |
| % of fund's
net assets | % of fund's net assets
6 months ago |
Consumer Discretionary | 7.7 | 8.6 |
Financials | 5.5 | 6.0 |
Information Technology | 4.8 | 4.3 |
Telecommunication Services | 4.7 | 5.1 |
Energy | 3.5 | 3.3 |
Quality Diversification (% of fund's net assets) as of December 31, 2007 |
As of December 31, 2007 | As of June 30, 2007 |
 | U.S. Government
and U.S. Government Agency Obligations 34.6% | | | U.S. Government
and U.S. Government Agency Obligations 30.3% | |
 | AAA,AA,A 13.9% | | | AAA,AA,A 13.4% | |
 | BBB 5.2% | | | BBB 4.3% | |
 | BB 14.0% | | | BB 14.8% | |
 | B 17.8% | | | B 16.7% | |
 | CCC,CC,C 5.5% | | | CCC,CC,C 5.9% | |
 | D 0.0% | | | D 0.1% | |
 | Not Rated 1.4% | | | Not Rated 3.8% | |
 | Equities 0.3% | | | Equities 0.5% | |
 | Short-Term
Investments and
Net Other Assets 7.3% | | | Short-Term
Investments and
Net Other Assets 10.2% | |

We have used ratings from Moody's Investors Services, Inc. Where Moody's ratings are not available, we have used S&P ratings. |
Asset Allocation (% of fund's net assets) |
As of December 31, 2007 * | As of June 30, 2007 * * |
| Preferred Securities 0.7% | | | Preferred Securities 0.7% | |
 | Corporate Bonds 29.3% | | | Corporate Bonds 28.1% | |
| U.S. Government
and U.S. Government Agency Obligations 34.6% | | | U.S. Government
and U.S. Government Agency Obligations 30.3% | |
 | Foreign Government & Government Agency Obligations 18.9% | | | Foreign Government & Government Agency Obligations 19.7% | |
| Floating Rate Loans 8.4% | | | Floating Rate Loans 10.2% | |
 | Stocks 0.3% | | | Stocks 0.5% | |
 | Other Investments 0.5% | | | Other Investments 0.3% | |
| Short-Term
Investments and
Net Other Assets 7.3% | | | Short-Term
Investments and
Net Other Assets 10.2% | |
* Foreign investments | 30.3% | | * * Foreign investments | 27.7% | |
* Swaps | 4.1% | | ** Swaps | 1.4% | |

A holdings listing for the Fund, which presents direct holdings as well as the pro rata share of any securities and other investments held indirectly through its investment in underlying non-money market Fidelity Central Funds is available at advisor.fidelity.com.
Annual Report
Investments December 31, 2007
Showing Percentage of Net Assets
Corporate Bonds - 29.0% |
| Principal Amount (d) | | Value |
|
Convertible Bonds - 0.0% |
INFORMATION TECHNOLOGY - 0.0% |
Semiconductors & Semiconductor Equipment - 0.0% |
ON Semiconductor Corp. 0% 4/15/24 | | $ 20,000 | | $ 21,676 |
Nonconvertible Bonds - 29.0% |
CONSUMER DISCRETIONARY - 4.6% |
Auto Components - 0.1% |
Affinia Group, Inc. 9% 11/30/14 | | 170,000 | | 149,600 |
Visteon Corp. 7% 3/10/14 | | 400,000 | | 300,000 |
| | 449,600 |
Automobiles - 0.3% |
DaimlerChrysler NA Holding Corp. 4.375% 3/16/10 | EUR | 100,000 | | 144,107 |
General Motors Corp.: | | | | |
7.125% 7/15/13 | | 330,000 | | 286,275 |
7.2% 1/15/11 | | 345,000 | | 317,400 |
8.375% 7/5/33 | EUR | 50,000 | | 56,582 |
8.375% 7/15/33 | | 530,000 | | 427,975 |
| | 1,232,339 |
Diversified Consumer Services - 0.1% |
Affinion Group, Inc. 11.5% 10/15/15 | | 175,000 | | 171,500 |
Hotels, Restaurants & Leisure - 0.9% |
Cap Cana SA 9.625% 11/3/13 (g) | | 100,000 | | 96,500 |
Carrols Corp. 9% 1/15/13 | | 355,000 | | 322,163 |
Gaylord Entertainment Co.: | | | | |
6.75% 11/15/14 | | 130,000 | | 122,525 |
8% 11/15/13 | | 100,000 | | 99,625 |
Mandalay Resort Group: | | | | |
6.375% 12/15/11 | | 80,000 | | 78,800 |
6.5% 7/31/09 | | 20,000 | | 20,000 |
MGM Mirage, Inc.: | | | | |
6% 10/1/09 | | 40,000 | | 39,600 |
6.625% 7/15/15 | | 235,000 | | 219,725 |
6.75% 9/1/12 | | 45,000 | | 43,875 |
6.75% 4/1/13 | | 50,000 | | 48,250 |
6.875% 4/1/16 | | 75,000 | | 70,500 |
7.5% 6/1/16 | | 110,000 | | 108,350 |
8.5% 9/15/10 | | 50,000 | | 51,750 |
Mohegan Tribal Gaming Authority 6.875% 2/15/15 | | 100,000 | | 94,000 |
OSI Restaurant Partners, Inc. 10% 6/15/15 (g) | | 655,000 | | 494,525 |
Scientific Games Corp. 6.25% 12/15/12 | | 40,000 | | 38,600 |
|
| Principal Amount (d) | | Value |
Shingle Springs Tribal Gaming Authority 9.375% 6/15/15 (g) | | $ 100,000 | | $ 97,000 |
Six Flags, Inc.: | | | | |
8.875% 2/1/10 | | 245,000 | | 198,450 |
9.625% 6/1/14 | | 75,000 | | 55,875 |
9.75% 4/15/13 | | 470,000 | | 359,550 |
Speedway Motorsports, Inc. 6.75% 6/1/13 | | 95,000 | | 93,575 |
Town Sports International Holdings, Inc. 0% 2/1/14 (e) | | 23,000 | | 21,850 |
Universal City Development Partners Ltd./UCDP Finance, Inc. 11.75% 4/1/10 | | 45,000 | | 46,800 |
Vail Resorts, Inc. 6.75% 2/15/14 | | 225,000 | | 221,625 |
Virgin River Casino Corp./RBG LLC/B&BB, Inc.: | | | | |
0% 1/15/13 (e) | | 230,000 | | 154,100 |
9% 1/15/12 | | 30,000 | | 24,000 |
Waterford Gaming LLC/Waterford Gaming Finance Corp. 8.625% 9/15/14 (g) | | 88,000 | | 86,680 |
| | 3,308,293 |
Household Durables - 0.0% |
Urbi, Desarrollos Urbanos, SA de CV 8.5% 4/19/16 (g) | | 115,000 | | 117,300 |
Leisure Equipment & Products - 0.0% |
Riddell Bell Holdings, Inc. 8.375% 10/1/12 | | 40,000 | | 36,500 |
Media - 2.3% |
AMC Entertainment, Inc. 11% 2/1/16 | | 120,000 | | 126,000 |
BSkyB Finance UK Ltd. (Reg. S) 5.75% 10/20/17 | GBP | 75,000 | | 143,615 |
Cablemas SA de CV 9.375% 11/15/15 (Reg. S) | | 300,000 | | 322,500 |
CanWest Media, Inc. 8% 9/15/12 | | 40,000 | | 37,800 |
Charter Communications Holdings I LLC/Charter Communications Holdings I Capital Corp.: | | | | |
11% 10/1/15 | | 865,000 | | 704,975 |
11% 10/1/15 | | 85,000 | | 68,000 |
Charter Communications Holdings II LLC/Charter Communications Holdings II Capital Corp.: | | | | |
Series B, 10.25% 9/15/10 | | 180,000 | | 176,400 |
10.25% 9/15/10 | | 130,000 | | 126,750 |
CSC Holdings, Inc.: | | | | |
6.75% 4/15/12 | | 70,000 | | 67,550 |
7.625% 7/15/18 | | 130,000 | | 119,438 |
7.875% 2/15/18 | | 286,000 | | 263,478 |
EchoStar Communications Corp.: | | | | |
6.375% 10/1/11 | | 45,000 | | 44,663 |
6.625% 10/1/14 | | 790,000 | | 780,125 |
7.125% 2/1/16 | | 270,000 | | 272,700 |
Haights Cross Communications, Inc. 0% 8/15/11 (e) | | 20,000 | | 16,800 |
Corporate Bonds - continued |
| Principal Amount (d) | | Value |
Nonconvertible Bonds - continued |
CONSUMER DISCRETIONARY - continued |
Media - continued |
iesy Repository GmbH 10.375% 2/15/15 (g) | | $ 50,000 | | $ 52,000 |
Lamar Media Corp. 6.625% 8/15/15 (g) | | 770,000 | | 739,200 |
Liberty Media Corp.: | | | | |
5.7% 5/15/13 | | 300,000 | | 275,625 |
8.25% 2/1/30 | | 320,000 | | 307,085 |
8.5% 7/15/29 | | 980,000 | | 959,903 |
MediMedia USA, Inc. 11.375% 11/15/14 (g) | | 50,000 | | 51,500 |
PanAmSat Corp.: | | | | |
9% 8/15/14 | | 285,000 | | 286,425 |
9% 6/15/16 | | 120,000 | | 120,600 |
Rainbow National LLC & RNS Co. Corp.: | | | | |
8.75% 9/1/12 (g) | | 110,000 | | 112,750 |
10.375% 9/1/14 (g) | | 385,000 | | 416,763 |
The Reader's Digest Association, Inc. 9% 2/15/17 (g) | | 160,000 | | 135,200 |
TL Acquisitions, Inc. 10.5% 1/15/15 (g) | | 1,290,000 | | 1,238,400 |
Videotron Ltee 6.875% 1/15/14 | | 125,000 | | 121,563 |
WPP Group plc 6% 4/4/17 | GBP | 75,000 | | 147,427 |
| | 8,235,235 |
Multiline Retail - 0.1% |
The Bon-Ton Department Stores, Inc. 10.25% 3/15/14 | | 445,000 | | 340,425 |
Specialty Retail - 0.6% |
AutoNation, Inc.: | | | | |
7% 4/15/14 | | 255,000 | | 242,250 |
7.2425% 4/15/13 (j) | | 60,000 | | 56,250 |
Burlington Coat Factory Warehouse Corp. 11.125% 4/15/14 | | 260,000 | | 208,650 |
Claire's Stores, Inc.: | | | | |
9.25% 6/1/15 (g) | | 315,000 | | 218,138 |
9.625% 6/1/15 pay-in-kind (g) | | 360,000 | | 230,400 |
Michaels Stores, Inc.: | | | | |
0% 11/1/16 (e) | | 30,000 | | 16,800 |
10% 11/1/14 | | 260,000 | | 249,600 |
11.375% 11/1/16 | | 785,000 | | 730,050 |
| | 1,952,138 |
Textiles, Apparel & Luxury Goods - 0.2% |
Levi Strauss & Co.: | | | | |
8.875% 4/1/16 | | 385,000 | | 373,450 |
9.75% 1/15/15 | | 290,000 | | 289,275 |
| | 662,725 |
TOTAL CONSUMER DISCRETIONARY | | 16,506,055 |
|
| Principal Amount (d) | | Value |
CONSUMER STAPLES - 0.5% |
Beverages - 0.0% |
Cerveceria Nacional Dominicana C por A 16% 3/27/12 (g) | | $ 100,000 | | $ 99,960 |
Food & Staples Retailing - 0.1% |
Rite Aid Corp.: | | | | |
9.375% 12/15/15 | | 170,000 | | 139,825 |
9.5% 6/15/17 | | 250,000 | | 206,875 |
| | 346,700 |
Food Products - 0.2% |
Bertin Ltda. 10.25% 10/5/16 (g) | | 100,000 | | 105,000 |
Gruma SA de CV 7.75% | | 335,000 | | 328,300 |
Hines Nurseries, Inc. 10.25% 10/1/11 | | 120,000 | | 90,900 |
National Beef Packing Co. LLC/National Beef Finance Corp. 10.5% 8/1/11 | | 25,000 | | 23,750 |
Reddy Ice Holdings, Inc. 0% 11/1/12 (e) | | 130,000 | | 120,900 |
Smithfield Foods, Inc. 7.75% 7/1/17 | | 170,000 | | 164,475 |
| | 833,325 |
Household Products - 0.1% |
Central Garden & Pet Co. 9.125% 2/1/13 | | 75,000 | | 65,250 |
Procter & Gamble Co. 4.875% 10/24/11 | EUR | 100,000 | | 145,939 |
| | 211,189 |
Personal Products - 0.0% |
Elizabeth Arden, Inc. 7.75% 1/15/14 | | 40,000 | | 39,200 |
Tobacco - 0.1% |
BAT Holdings BV 4.375% 9/15/14 | EUR | 115,000 | | 156,014 |
TOTAL CONSUMER STAPLES | | 1,686,388 |
ENERGY - 2.9% |
Energy Equipment & Services - 0.2% |
CHC Helicopter Corp. 7.375% 5/1/14 | | 240,000 | | 226,200 |
Complete Production Services, Inc. 8% 12/15/16 | | 130,000 | | 125,450 |
Helix Energy Solutions Group, Inc. 9.5% 1/15/16 (g) | | 240,000 | | 244,200 |
Ocean Rig Norway AS 8.375% 7/1/13 (g) | | 60,000 | | 63,300 |
Seabulk International, Inc. 9.5% 8/15/13 | | 135,000 | | 142,763 |
| | 801,913 |
Oil, Gas & Consumable Fuels - 2.7% |
ANR Pipeline, Inc. 7.375% 2/15/24 | | 115,000 | | 125,876 |
Atlas Pipeline Partners LP 8.125% 12/15/15 | | 70,000 | | 69,300 |
Corporate Bonds - continued |
| Principal Amount (d) | | Value |
Nonconvertible Bonds - continued |
ENERGY - continued |
Oil, Gas & Consumable Fuels - continued |
Berry Petroleum Co. 8.25% 11/1/16 | | $ 150,000 | | $ 153,000 |
Chaparral Energy, Inc.: | | | | |
8.5% 12/1/15 | | 130,000 | | 116,675 |
8.875% 2/1/17 (g) | | 110,000 | | 99,275 |
Chesapeake Energy Corp.: | | | | |
6.5% 8/15/17 | | 460,000 | | 443,900 |
6.875% 11/15/20 | | 390,000 | | 374,400 |
7.5% 9/15/13 | | 40,000 | | 41,000 |
7.5% 6/15/14 | | 35,000 | | 35,700 |
7.625% 7/15/13 | | 430,000 | | 445,050 |
Colorado Interstate Gas Co. 6.8% 11/15/15 | | 260,000 | | 273,650 |
Connacher Oil and Gas Ltd. 10.25% 12/15/15 (g) | | 270,000 | | 269,676 |
Drummond Co., Inc. 7.375% 2/15/16 (g) | | 140,000 | | 129,850 |
ENI SpA 4.75% 11/14/17 | EUR | 300,000 | | 420,495 |
EXCO Resources, Inc. 7.25% 1/15/11 | | 10,000 | | 9,625 |
Gaz Capital SA (Luxembourg): | | | | |
6.58% 10/31/13 | GBP | 50,000 | | 94,823 |
6.605% 2/13/18 | EUR | 50,000 | | 70,261 |
Harvest Operations Corp. 7.875% 10/15/11 | | 50,000 | | 47,000 |
InterNorth, Inc. 9.625% 3/16/06 (c) | | 100,000 | | 18,000 |
Mariner Energy, Inc. 8% 5/15/17 | | 80,000 | | 76,200 |
Massey Energy Co. 6.875% 12/15/13 | | 425,000 | | 401,625 |
OPTI Canada, Inc. 7.875% 12/15/14 (g) | | 310,000 | | 303,428 |
Pan American Energy LLC 7.75% 2/9/12 (g) | | 240,000 | | 236,400 |
Peabody Energy Corp.: | | | | |
7.375% 11/1/16 | | 300,000 | | 306,000 |
7.875% 11/1/26 | | 300,000 | | 304,500 |
Pemex Project Funding Master Trust: | | | | |
5.75% 3/1/18 (g) | | 110,000 | | 109,670 |
6.625% 6/15/35 | | 260,000 | | 271,050 |
6.625% 6/15/35 (g) | | 75,000 | | 78,300 |
Petrohawk Energy Corp. 9.125% 7/15/13 | | 310,000 | | 326,275 |
Petroleos de Venezuela SA: | | | | |
5.25% 4/12/17 | | 825,000 | | 588,638 |
5.375% 4/12/27 | | 905,000 | | 552,050 |
Petrozuata Finance, Inc.: | | | | |
7.63% 4/1/09 (g) | | 378,879 | | 379,826 |
8.22% 4/1/17 (g) | | 425,000 | | 442,000 |
Range Resources Corp. 7.375% 7/15/13 | | 100,000 | | 102,000 |
|
| Principal Amount (d) | | Value |
Ship Finance International Ltd. 8.5% 12/15/13 | | $ 145,000 | | $ 147,175 |
Southern Star Central Corp. 6.75% 3/1/16 | | 90,000 | | 86,850 |
Targa Resources, Inc./Targa Resources Finance Corp. 8.5% 11/1/13 (g) | | 70,000 | | 67,550 |
Tennessee Gas Pipeline Co.: | | | | |
7% 10/15/28 | | 20,000 | | 20,642 |
7.5% 4/1/17 | | 445,000 | | 487,231 |
7.625% 4/1/37 | | 50,000 | | 55,465 |
8.375% 6/15/32 | | 40,000 | | 46,350 |
TNK-BP Finance SA 6.875% 7/18/11 (g) | | 300,000 | | 296,640 |
Venoco, Inc. 8.75% 12/15/11 | | 70,000 | | 69,300 |
W&T Offshore, Inc. 8.25% 6/15/14 (g) | | 310,000 | | 291,400 |
YPF SA 10% 11/2/28 | | 240,000 | | 267,600 |
| | 9,551,721 |
TOTAL ENERGY | | 10,353,634 |
FINANCIALS - 4.9% |
Capital Markets - 0.2% |
Lehman Brothers Holdings, Inc. 5.375% 10/17/12 | EUR | 100,000 | | 138,895 |
Morgan Stanley 4.953% 7/20/12 (j) | EUR | 150,000 | | 207,899 |
Nuveen Investments, Inc. 10.5% 11/15/15 (g) | | 340,000 | | 336,600 |
| | 683,394 |
Commercial Banks - 1.1% |
Alliance & Leicester PLC 4.25% 12/30/08 | GBP | 70,000 | | 134,878 |
Banca Popolare di Bergamo 8.364% (j) | EUR | 125,000 | | 194,166 |
Banca Popolare di Lodi Investor Trust III 6.742% (j) | EUR | 50,000 | | 69,212 |
Bancaja Emisiones SA 4.625% (j) | EUR | 100,000 | | 111,418 |
Banco de Credito Del Peru 7.17% 10/15/22 (g)(j) | PEN | 430,000 | | 144,863 |
City of Kiev 8.75% 8/8/08 (Issued by Dresdner Bank AG for City of Kiev) | | 100,000 | | 100,880 |
Development Bank of Philippines 8.375% (j) | | 300,000 | | 312,000 |
Eksportfinans AS 4.375% 9/20/10 | EUR | 200,000 | | 290,421 |
EXIM of Ukraine 7.75% 9/23/09 (Issued by Dresdner Bank AG for EXIM Ukraine) | | 200,000 | | 202,500 |
Export-Import Bank of India 1.5081% 6/7/12 (j) | JPY | 20,000,000 | | 178,613 |
Intesa Sanpaolo SpA 6.375% 11/12/17 (j) | GBP | 100,000 | | 195,075 |
JPMorgan Chase Bank 4.375% 11/30/21 (j) | EUR | 100,000 | | 126,413 |
Corporate Bonds - continued |
| Principal Amount (d) | | Value |
Nonconvertible Bonds - continued |
FINANCIALS - continued |
Commercial Banks - continued |
Kyivstar GSM: | | | | |
7.75% 4/27/12 (Issued by Dresdner Bank AG for Kyivstar GSM) (g) | | $ 200,000 | | $ 199,500 |
10.375% 8/17/09 (Issued by Dresdner Bank AG for Kyivstar GSM) (g) | | 400,000 | | 420,000 |
Rabobank Nederland 4.125% 4/4/12 | EUR | 500,000 | | 714,457 |
Russian Standard Finance SA 6.825% 9/16/09 | EUR | 50,000 | | 67,174 |
Standard Chartered Bank 5.065% 3/28/18 (j) | EUR | 100,000 | | 139,052 |
Vimpel Communications: | | | | |
8% 2/11/10 (Issued by UBS Luxembourg SA for Vimpel Communications) | | 200,000 | | 202,250 |
10% 6/16/09 (Issued by UBS Luxembourg SA for Vimpel Communications) | | 100,000 | | 103,750 |
| | 3,906,622 |
Consumer Finance - 0.6% |
ACE Cash Express, Inc. 10.25% 10/1/14 (g) | | 80,000 | | 77,000 |
Ford Motor Credit Co. LLC: | | | | |
5.8% 1/12/09 | | 30,000 | | 28,476 |
7.375% 10/28/09 | | 135,000 | | 127,068 |
7.875% 6/15/10 | | 165,000 | | 152,240 |
9.875% 8/10/11 | | 380,000 | | 359,415 |
GE Capital European Funding 4.75% 9/28/12 | EUR | 100,000 | | 143,844 |
General Motors Acceptance Corp.: | | | | |
6.875% 9/15/11 | | 295,000 | | 250,750 |
6.875% 8/28/12 | | 360,000 | | 301,667 |
HSBC Finance Corp. 4.875% 5/30/17 | EUR | 150,000 | | 202,958 |
SLM Corp.: | | | | |
5.098% 6/15/09 (j) | EUR | 50,000 | | 69,686 |
5.148% 12/15/10 (j) | EUR | 100,000 | | 137,424 |
Toyota Motor Credit Corp. 5.25% 12/10/10 | GBP | 200,000 | | 396,647 |
| | 2,247,175 |
Diversified Financial Services - 1.8% |
AB Svensk Exportkredit 4.5% 6/7/10 | EUR | 200,000 | | 291,906 |
BA Covered Bond 4.125% 4/5/12 | EUR | 300,000 | | 425,500 |
Banca Italease SpA 4.803% 2/2/10 (j) | EUR | 200,000 | | 276,326 |
C10-EUR CAPITAL SPV Ltd. 6.277% 5/9/49 (j) | EUR | 65,000 | | 79,996 |
|
| Principal Amount (d) | | Value |
Canada Housing Trust No.1 4.65% 9/15/09 | CAD | 550,000 | | $ 558,924 |
CCO Holdings LLC/CCO Holdings Capital Corp. 8.75% 11/15/13 | | $ 185,000 | | 177,600 |
CEMEX Finance Europe BV 4.75% 3/5/14 | EUR | 50,000 | | 65,059 |
Dexia Municipal Agency 4.5% 11/13/17 | EUR | 600,000 | | 858,915 |
Ex-Im Ukraine 7.65% 9/7/11 (Issued by Credit Suisse London Branch for Ex-Im Ukraine) | | 400,000 | | 403,060 |
GE Capital UK Funding 5.875% 11/1/12 | GBP | 450,000 | | 905,205 |
Getin Finance PLC 6.589% 5/13/09 (j) | EUR | 50,000 | | 69,934 |
Global Cash Access LLC/Global Cash Access Finance Corp. 8.75% 3/15/12 | | 238,000 | | 221,638 |
IFIL Finanziaria di Partecipazioni SpA 5.375% 6/12/17 | EUR | 50,000 | | 68,506 |
KAR Holdings, Inc.: | | | | |
8.75% 5/1/14 (g) | | 120,000 | | 111,300 |
10% 5/1/15 (g) | | 120,000 | | 107,400 |
NCO Group, Inc. 11.875% 11/15/14 | | 160,000 | | 148,800 |
OAO TMK 8.5% 9/29/09 (Issued by TMK Capital SA for OAO TMK) | | 900,000 | | 909,000 |
Pakistan International Sukuk Co. Ltd. 7.5703% 1/27/10 (j) | | 200,000 | | 190,000 |
Red Arrow International Leasing PLC 8.375% 3/31/12 | RUB | 1,660,777 | | 68,298 |
TransCapitalInvest Ltd. (Reg. S) 5.381% 6/27/12 | EUR | 150,000 | | 213,980 |
WaMu Covered Bond Program 4.375% 5/19/14 | EUR | 200,000 | | 276,279 |
| | 6,427,626 |
Insurance - 0.2% |
Eureko BV 5.125% (j) | EUR | 100,000 | | 134,615 |
JPMorgan Bank Luxembourg SA 5% (j) | EUR | 100,000 | | 129,303 |
Muenchener Rueckversicherungs-Gesellschaft AG 5.767% (j) | EUR | 100,000 | | 133,929 |
Old Mutual plc 4.5% 1/18/17 (j) | EUR | 50,000 | | 68,169 |
Resolution PLC 6.5864% (j) | GBP | 80,000 | | 134,400 |
| | 600,416 |
Real Estate Investment Trusts - 0.2% |
BF Saul REIT 7.5% 3/1/14 | | 95,000 | | 89,063 |
Rouse Co. LP/TRC, Inc. 6.75% 5/1/13 (g) | | 330,000 | | 303,600 |
Senior Housing Properties Trust: | | | | |
7.875% 4/15/15 | | 180,000 | | 185,400 |
8.625% 1/15/12 | | 280,000 | | 298,200 |
| | 876,263 |
Corporate Bonds - continued |
| Principal Amount (d) | | Value |
Nonconvertible Bonds - continued |
FINANCIALS - continued |
Real Estate Management & Development - 0.7% |
American Real Estate Partners/American Real Estate Finance Corp.: | | | | |
7.125% 2/15/13 | | $ 170,000 | | $ 158,525 |
8.125% 6/1/12 | | 100,000 | | 97,000 |
Inversiones y Representaciones SA 8.5% 2/2/17 (g) | | 325,000 | | 276,250 |
Realogy Corp.: | | | | |
10.5% 4/15/14 (g) | | 1,340,000 | | 1,018,400 |
11% 4/15/14 pay-in-kind (g) | | 1,020,000 | | 724,200 |
12.375% 4/15/15 (g) | | 115,000 | | 74,750 |
WT Finance (Aust) Pty Ltd./Westfield Europe Finance PLC/WEA Finance 3.625% 6/27/12 | EUR | 75,000 | | 98,791 |
| | 2,447,916 |
Thrifts & Mortgage Finance - 0.1% |
Compagnie de Financement Foncier 4.625% 9/23/17 | EUR | 325,000 | | 469,092 |
TOTAL FINANCIALS | | 17,658,504 |
HEALTH CARE - 1.3% |
Health Care Equipment & Supplies - 0.0% |
Bausch & Lomb, Inc. 9.875% 11/1/15 (g) | | 130,000 | | 131,625 |
Invacare Corp. 9.75% 2/15/15 | | 90,000 | | 91,125 |
| | 222,750 |
Health Care Providers & Services - 1.2% |
Cardinal Health, Inc. 9.5% 4/15/15 pay-in-kind (g) | | 300,000 | | 276,000 |
CRC Health Group, Inc. 10.75% 2/1/16 | | 90,000 | | 92,700 |
DaVita, Inc. 6.625% 3/15/13 | | 40,000 | | 39,600 |
Fresenius Medical Care Capital Trust IV 7.875% 6/15/11 | | 125,000 | | 129,688 |
HCA, Inc.: | | | | |
9.125% 11/15/14 | | 320,000 | | 332,400 |
9.25% 11/15/16 | | 560,000 | | 588,000 |
9.625% 11/15/16 pay-in-kind | | 580,000 | | 614,800 |
IASIS Healthcare LLC/IASIS Capital Corp. 8.75% 6/15/14 | | 90,000 | | 89,100 |
Rural/Metro Corp. 9.875% 3/15/15 | | 80,000 | | 76,400 |
Skilled Healthcare Group, Inc. 11% 1/15/14 | | 78,000 | | 83,460 |
Sun Healthcare Group, Inc. 9.125% 4/15/15 | | 30,000 | | 30,150 |
Team Finance LLC/Health Finance Corp. 11.25% 12/1/13 | | 650,000 | | 676,000 |
|
| Principal Amount (d) | | Value |
Tenet Healthcare Corp.: | | | | |
9.25% 2/1/15 | | $ 390,000 | | $ 362,700 |
9.875% 7/1/14 | | 350,000 | | 334,250 |
U.S. Oncology, Inc. 9% 8/15/12 | | 150,000 | | 147,000 |
Vanguard Health Holding Co. I 0% 10/1/15 (e) | | 40,000 | | 29,600 |
Vanguard Health Holding Co. II LLC 9% 10/1/14 | | 335,000 | | 322,438 |
| | 4,224,286 |
Life Sciences Tools & Services - 0.0% |
Bio-Rad Laboratories, Inc. 7.5% 8/15/13 | | 70,000 | | 70,700 |
Pharmaceuticals - 0.1% |
Elan Finance PLC/Elan Finance Corp. 7.75% 11/15/11 | | 65,000 | | 61,100 |
Leiner Health Products, Inc. 11% 6/1/12 | | 90,000 | | 61,200 |
Schering-Plough Corp. 5.375% 10/1/14 | EUR | 130,000 | | 185,742 |
| | 308,042 |
TOTAL HEALTH CARE | | 4,825,778 |
INDUSTRIALS - 1.9% |
Aerospace & Defense - 0.1% |
Alion Science & Technology Corp. 10.25% 2/1/15 | | 50,000 | | 42,250 |
Hexcel Corp. 6.75% 2/1/15 | | 100,000 | | 96,000 |
Orbimage Holdings, Inc. 14.88% 7/1/12 (j) | | 100,000 | | 108,000 |
| | 246,250 |
Airlines - 0.4% |
Continental Airlines, Inc. 6.903% 4/19/22 | | 50,000 | | 44,250 |
Delta Air Lines, Inc.: | | | | |
7.9% 12/15/09 (a) | | 750,000 | | 33,750 |
10% 8/15/08 (a) | | 70,000 | | 3,150 |
Delta Air Lines, Inc. pass thru trust certificates: | | | | |
6.821% 8/10/22 (g) | | 655,000 | | 660,062 |
8.021% 8/10/22 (g) | | 330,000 | | 322,575 |
Northwest Airlines Corp. 10% 2/1/09 (a) | | 105,000 | | 3,150 |
Northwest Airlines, Inc.: | | | | |
7.875% 3/15/08 (a) | | 90,000 | | 2,250 |
8.875% 6/1/06 (a) | | 80,000 | | 2,400 |
Northwest Airlines, Inc. pass thru trust certificates: | | | | |
7.027% 11/1/19 | | 132,000 | | 126,720 |
8.028% 11/1/17 | | 70,000 | | 67,900 |
| | 1,266,207 |
Corporate Bonds - continued |
| Principal Amount (d) | | Value |
Nonconvertible Bonds - continued |
INDUSTRIALS - continued |
Building Products - 0.1% |
Compagnie de St. Gobain 5.004% 4/11/12 (j) | EUR | 100,000 | | $ 140,946 |
NTK Holdings, Inc. 0% 3/1/14 (e) | | $ 455,000 | | 270,725 |
| | 411,671 |
Commercial Services & Supplies - 0.3% |
ALH Finance LLC/ALH Finance Corp. 8.5% 1/15/13 | | 10,000 | | 9,600 |
Allied Security Escrow Corp. 11.375% 7/15/11 | | 100,000 | | 93,000 |
Allied Waste North America, Inc. 7.125% 5/15/16 | | 295,000 | | 292,788 |
Browning-Ferris Industries, Inc.: | | | | |
7.4% 9/15/35 | | 75,000 | | 69,000 |
9.25% 5/1/21 | | 100,000 | | 100,500 |
FTI Consulting, Inc.: | | | | |
7.625% 6/15/13 | | 50,000 | | 51,000 |
7.75% 10/1/16 | | 80,000 | | 83,400 |
Mac-Gray Corp. 7.625% 8/15/15 | | 40,000 | | 39,600 |
West Corp. 9.5% 10/15/14 | | 475,000 | | 466,688 |
| | 1,205,576 |
Construction & Engineering - 0.1% |
Blount, Inc. 8.875% 8/1/12 | | 50,000 | | 50,125 |
Obrascon Huarte Lain SA 5% 5/18/12 | EUR | 100,000 | | 139,825 |
| | 189,950 |
Electrical Equipment - 0.0% |
Coleman Cable, Inc. 9.875% 10/1/12 | | 60,000 | | 56,400 |
General Cable Corp. 7.125% 4/1/17 | | 40,000 | | 39,300 |
Sensus Metering Systems, Inc. 8.625% 12/15/13 | | 60,000 | | 58,650 |
| | 154,350 |
Industrial Conglomerates - 0.1% |
Hutchison Whampoa Finance 06 Ltd. 4.625% 9/21/16 | EUR | 150,000 | | 200,340 |
Siemens Financieringsmaatschap NV 6.125% 9/14/66 (j) | GBP | 50,000 | | 93,313 |
| | 293,653 |
Machinery - 0.2% |
Chart Industries, Inc. 9.125% 10/15/15 | | 60,000 | | 61,200 |
Invensys PLC 9.875% 3/15/11 (g) | | 4,000 | | 4,220 |
RBS Global, Inc. / Rexnord Corp.: | | | | |
8.875% 9/1/16 | | 50,000 | | 48,000 |
9.5% 8/1/14 | | 350,000 | | 346,500 |
11.75% 8/1/16 | | 300,000 | | 297,750 |
| | 757,670 |
|
| Principal Amount (d) | | Value |
Marine - 0.1% |
Navios Maritime Holdings, Inc. 9.5% 12/15/14 | | $ 230,000 | | $ 236,325 |
Ultrapetrol (Bahamas) Ltd. 9% 11/24/14 | | 80,000 | | 76,000 |
US Shipping Partners LP 13% 8/15/14 | | 170,000 | | 166,600 |
| | 478,925 |
Road & Rail - 0.2% |
Kansas City Southern de Mexico, SA de CV: | | | | |
7.375% 6/1/14 (g) | | 100,000 | | 99,375 |
7.625% 12/1/13 | | 100,000 | | 97,500 |
Kansas City Southern Railway Co.: | | | | |
7.5% 6/15/09 | | 340,000 | | 340,000 |
9.5% 10/1/08 | | 45,000 | | 46,013 |
TFM SA de CV 9.375% 5/1/12 | | 300,000 | | 313,500 |
| | 896,388 |
Trading Companies & Distributors - 0.3% |
Glencore Finance (Europe) SA: | | | | |
5.375% 9/30/11 | EUR | 50,000 | | 72,250 |
6.5% 2/27/19 | GBP | 200,000 | | 382,512 |
Penhall International Corp. 12% 8/1/14 (g) | | 80,000 | | 73,200 |
VWR Funding, Inc. 10.25% 7/15/15 (g) | | 435,000 | | 413,250 |
| | 941,212 |
TOTAL INDUSTRIALS | | 6,841,852 |
INFORMATION TECHNOLOGY - 3.5% |
Communications Equipment - 0.7% |
Hughes Network Systems LLC / HNS Finance Corp. 9.5% 4/15/14 | | 320,000 | | 322,400 |
Lucent Technologies, Inc.: | | | | |
6.45% 3/15/29 | | 820,000 | | 672,400 |
6.5% 1/15/28 | | 415,000 | | 340,300 |
Nortel Networks Corp.: | | | | |
9.4925% 7/15/11 (g)(j) | | 190,000 | | 184,300 |
10.125% 7/15/13 (g) | | 190,000 | | 197,600 |
10.75% 7/15/16 (g) | | 690,000 | | 724,500 |
| | 2,441,500 |
Electronic Equipment & Instruments - 0.3% |
NXP BV 9.5% 10/15/15 | | 580,000 | | 530,700 |
Texas Competitive Electric Holdings Co. LLC Series A 10.25% 11/1/15 (g) | | 565,000 | | 559,350 |
| | 1,090,050 |
IT Services - 0.8% |
Ceridian Corp.: | | | | |
11.25% 11/15/15 (g) | | 300,000 | | 278,625 |
12.25% 11/15/15 pay-in-kind (g) | | 400,000 | | 373,500 |
Corporate Bonds - continued |
| Principal Amount (d) | | Value |
Nonconvertible Bonds - continued |
INFORMATION TECHNOLOGY - continued |
IT Services - continued |
Iron Mountain, Inc.: | | | | |
6.625% 1/1/16 | | $ 480,000 | | $ 457,200 |
7.75% 1/15/15 | | 180,000 | | 181,800 |
8.625% 4/1/13 | | 185,000 | | 187,313 |
8.75% 7/15/18 | | 785,000 | | 826,213 |
SunGard Data Systems, Inc.: | | | | |
9.125% 8/15/13 | | 260,000 | | 263,900 |
10.25% 8/15/15 | | 180,000 | | 184,725 |
| | 2,753,276 |
Office Electronics - 0.4% |
Xerox Capital Trust I 8% 2/1/27 | | 480,000 | | 477,600 |
Xerox Corp.: | | | | |
6.4% 3/15/16 | | 600,000 | | 611,928 |
7.625% 6/15/13 | | 290,000 | | 304,500 |
| | 1,394,028 |
Semiconductors & Semiconductor Equipment - 1.3% |
Amkor Technology, Inc. 9.25% 6/1/16 | | 455,000 | | 457,275 |
ASML Holding NV 5.75% 6/13/17 | EUR | 100,000 | | 129,836 |
Avago Technologies Finance Ltd.: | | | | |
10.125% 12/1/13 | | 695,000 | | 726,275 |
10.6238% 6/1/13 (j) | | 44,000 | | 44,660 |
11.875% 12/1/15 | | 475,000 | | 507,063 |
Freescale Semiconductor, Inc.: | | | | |
8.875% 12/15/14 | | 690,000 | | 615,825 |
9.125% 12/15/14 pay-in-kind | | 1,990,000 | | 1,696,475 |
10.125% 12/15/16 | | 545,000 | | 448,263 |
MagnaChip Semiconductor SA/MagnaChip Semiconductor Finance Co. 8.2406% 12/15/11 (j) | | 40,000 | | 34,800 |
New ASAT Finance Ltd. 9.25% 2/1/11 | | 105,000 | | 80,850 |
Viasystems, Inc. 10.5% 1/15/11 | | 140,000 | | 140,700 |
| | 4,882,022 |
Software - 0.0% |
Open Solutions, Inc. 9.75% 2/1/15 (g) | | 50,000 | | 45,500 |
TOTAL INFORMATION TECHNOLOGY | | 12,606,376 |
MATERIALS - 2.8% |
Chemicals - 0.6% |
America Rock Salt Co. LLC 9.5% 3/15/14 | | 225,000 | | 229,500 |
Bayer AG: | | | | |
4.867% 4/10/10 (j) | EUR | 50,000 | | 72,437 |
5.625% 5/23/18 | GBP | 50,000 | | 95,657 |
Huntsman LLC 11.625% 10/15/10 | | 182,000 | | 192,920 |
|
| Principal Amount (d) | | Value |
JohnsonDiversey Holdings, Inc. 10.67% 5/15/13 | | $ 235,000 | | $ 238,525 |
MacDermid, Inc. 9.5% 4/15/17 (g) | | 40,000 | | 37,200 |
Momentive Performance Materials, Inc.: | | | | |
9.75% 12/1/14 (g) | | 230,000 | | 211,600 |
10.125% 12/1/14 pay-in-kind (g) | | 520,000 | | 473,200 |
11.5% 12/1/16 (g) | | 345,000 | | 296,700 |
SABIC Europe BV 4.5% 11/28/13 | EUR | 50,000 | | 68,436 |
Sterling Chemicals, Inc. 10.25% 4/1/15 (g) | | 90,000 | | 91,350 |
| | 2,007,525 |
Construction Materials - 0.1% |
Imerys 5% 4/18/17 | EUR | 50,000 | | 67,763 |
Lafarge SA 6.625% 11/29/17 | GBP | 100,000 | | 194,479 |
| | 262,242 |
Containers & Packaging - 0.5% |
AEP Industries, Inc. 7.875% 3/15/13 | | 40,000 | | 37,600 |
BWAY Corp. 10% 10/15/10 | | 90,000 | | 89,100 |
Constar International, Inc. 11% 12/1/12 | | 170,000 | | 127,500 |
Crown Cork & Seal, Inc.: | | | | |
7.5% 12/15/96 | | 160,000 | | 128,000 |
8% 4/15/23 | | 235,000 | | 225,600 |
Owens-Brockway Glass Container, Inc.: | | | | |
6.75% 12/1/14 | | 105,000 | | 103,950 |
8.25% 5/15/13 | | 195,000 | | 197,925 |
8.875% 2/15/09 | | 36,000 | | 36,135 |
Rexam PLC 4.375% 3/15/13 (g) | EUR | 100,000 | | 138,274 |
Tekni-Plex, Inc. 10.875% 8/15/12 | | 60,000 | | 65,400 |
Vitro SAB de CV: | | | | |
8.625% 2/1/12 | | 525,000 | | 496,125 |
9.125% 2/1/17 | | 120,000 | | 110,400 |
| | 1,756,009 |
Metals & Mining - 1.6% |
Aleris International, Inc. 9% 12/15/14 | | 150,000 | | 125,250 |
CAP SA 7.375% 9/15/36 (g) | | 100,000 | | 95,000 |
Compass Minerals International, Inc. 0% 6/1/13 (e) | | 360,000 | | 367,200 |
Corporacion Nacional del Cobre (Codelco) 6.15% 10/24/36 (g) | | 225,000 | | 222,223 |
CSN Islands VIII Corp. 9.75% 12/16/13 (g) | | 315,000 | | 353,588 |
Evraz Group SA (Reg. S) 8.25% 11/10/15 | | 200,000 | | 198,760 |
Evraz Securities SA 10.875% 8/3/09 | | 400,000 | | 420,520 |
FMG Finance Property Ltd.: | | | | |
10% 9/1/13 (g) | | 225,000 | | 247,219 |
Corporate Bonds - continued |
| Principal Amount (d) | | Value |
Nonconvertible Bonds - continued |
MATERIALS - continued |
Metals & Mining - continued |
FMG Finance Property Ltd.: - continued | | | | |
10.625% 9/1/16 (g) | | $ 207,000 | | $ 238,050 |
Freeport-McMoRan Copper & Gold, Inc.: | | | | |
6.875% 2/1/14 | | 370,000 | | 378,325 |
8.25% 4/1/15 | | 220,000 | | 233,200 |
8.375% 4/1/17 | | 1,115,000 | | 1,193,050 |
8.3944% 4/1/15 (j) | | 405,000 | | 410,063 |
Gerdau AmeriSteel Corp./GUSAP Partners 10.375% 7/15/11 | | 70,000 | | 73,675 |
Gerdau SA 8.875% (g) | | 125,000 | | 129,375 |
GTL Trade Finance, Inc. 7.25% 10/20/17 (g) | | 135,000 | | 135,000 |
International Steel Group, Inc. 6.5% 4/15/14 | | 445,000 | | 451,675 |
Ispat Inland ULC 9.75% 4/1/14 | | 20,000 | | 21,725 |
PNA Intermediate Holding Corp. 11.8688% 2/15/13 pay-in-kind (g)(j) | | 90,000 | | 81,000 |
RathGibson, Inc. 11.25% 2/15/14 | | 305,000 | | 301,950 |
Ryerson Tull, Inc. 12.6188% 11/1/14 (g)(j) | | 25,000 | | 24,125 |
| | 5,700,973 |
Paper & Forest Products - 0.0% |
Glatfelter 7.125% 5/1/16 | | 40,000 | | 39,600 |
NewPage Corp. 11.1613% 5/1/12 (j) | | 90,000 | | 92,700 |
| | 132,300 |
TOTAL MATERIALS | | 9,859,049 |
TELECOMMUNICATION SERVICES - 4.0% |
Diversified Telecommunication Services - 2.9% |
British Telecommunications PLC 7.75% 12/7/16 | GBP | 60,000 | | 135,064 |
Citizens Communications Co.: | | | | |
7.875% 1/15/27 | | 200,000 | | 189,500 |
9% 8/15/31 | | 500,000 | | 497,500 |
Deutsche Telekom International Finance BV 6.625% 7/11/11 (j) | EUR | 50,000 | | 75,867 |
Embarq Corp.: | | | | |
7.082% 6/1/16 | | 55,000 | | 56,671 |
7.995% 6/1/36 | | 478,000 | | 503,734 |
Indosat Finance Co. BV 7.75% 11/5/10 | | 150,000 | | 150,000 |
Intelsat Ltd.: | | | | |
9.25% 6/15/16 | | 120,000 | | 120,450 |
|
| Principal Amount (d) | | Value |
11.25% 6/15/16 | | $ 535,000 | | $ 546,369 |
Koninklijke KPN NV 5% 11/13/12 | EUR | 100,000 | | 142,198 |
Level 3 Financing, Inc.: | | | | |
8.75% 2/15/17 | | 460,000 | | 396,750 |
12.25% 3/15/13 | | 490,000 | | 494,288 |
Nordic Telephone Co. Holdings ApS 8.875% 5/1/16 (g) | | 285,000 | | 291,413 |
NTL Cable PLC: | | | | |
8.75% 4/15/14 | | 245,000 | | 241,325 |
9.125% 8/15/16 | | 175,000 | | 172,813 |
Qwest Capital Funding, Inc.: | | | | |
7.625% 8/3/21 | | 25,000 | | 22,500 |
7.75% 2/15/31 | | 25,000 | | 22,250 |
Qwest Corp.: | | | | |
7.5% 10/1/14 | | 50,000 | | 50,625 |
7.875% 9/1/11 | | 320,000 | | 330,000 |
8.2406% 6/15/13 (j) | | 350,000 | | 357,000 |
8.875% 3/15/12 | | 1,370,000 | | 1,465,900 |
Telecom Egypt SAE 9.672% 2/4/10 (j) | EGP | 157,040 | | 29,581 |
Telecom Italia SpA 6.375% 6/24/19 | GBP | 50,000 | | 97,874 |
Telefonica Emisiones SAU 5.375% 2/2/26 | GBP | 50,000 | | 90,314 |
U.S. West Capital Funding, Inc.: | | | | |
6.5% 11/15/18 | | 20,000 | | 16,900 |
6.875% 7/15/28 | | 120,000 | | 101,400 |
U.S. West Communications: | | | | |
6.875% 9/15/33 | | 2,615,000 | | 2,412,338 |
7.2% 11/10/26 | | 5,000 | | 4,650 |
7.25% 9/15/25 | | 35,000 | | 33,425 |
7.25% 10/15/35 | | 155,000 | | 145,700 |
7.5% 6/15/23 | | 25,000 | | 23,938 |
Wind Acquisition Finance SA 10.75% 12/1/15 (g) | | 865,000 | | 951,500 |
| | 10,169,837 |
Wireless Telecommunication Services - 1.1% |
American Tower Corp. 7.125% 10/15/12 | | 685,000 | | 708,975 |
Centennial Cellular Operating Co./Centennial Communications Corp. 10.125% 6/15/13 | | 440,000 | | 457,600 |
Centennial Communications Corp./Centennial Cellular Operating Co. LLC/Centennial Puerto Rico Operations Corp. 8.125% 2/1/14 | | 270,000 | | 265,275 |
Digicel Group Ltd. 9.25% 9/1/12 (g) | | 300,000 | | 306,750 |
MetroPCS Wireless, Inc. 9.25% 11/1/14 | | 300,000 | | 282,750 |
Millicom International Cellular SA 10% 12/1/13 | | 695,000 | | 741,913 |
Mobile Telesystems Finance SA: | | | | |
8.375% 10/14/10 (g) | | 215,000 | | 221,730 |
Corporate Bonds - continued |
| Principal Amount (d) | | Value |
Nonconvertible Bonds - continued |
TELECOMMUNICATION SERVICES - continued |
Wireless Telecommunication Services - continued |
Mobile Telesystems Finance SA: - continued | | | | |
9.75% 1/30/08 (Reg. S) | | $ 185,000 | | $ 185,370 |
Pakistan Mobile Communications Ltd. 8.625% 11/13/13 (g) | | 200,000 | | 176,000 |
Telecom Personal SA 9.25% 12/22/10 (g) | | 590,000 | | 598,113 |
| | 3,944,476 |
TOTAL TELECOMMUNICATION SERVICES | | 14,114,313 |
UTILITIES - 2.6% |
Electric Utilities - 1.4% |
Abu Dhabi National Energy Co. Pjsc 4.375% 10/28/13 | EUR | 100,000 | | 137,613 |
AES Gener SA 7.5% 3/25/14 | | 200,000 | | 209,500 |
Chivor SA E.S.P. 9.75% 12/30/14 (g) | | 200,000 | | 215,000 |
Edison Mission Energy: | | | | |
7.5% 6/15/13 | | 490,000 | | 497,350 |
7.75% 6/15/16 | | 275,000 | | 283,250 |
Energy Future Holdings: | | | | |
10.875% 11/1/17 (g) | | 900,000 | | 906,750 |
11.25% 11/1/17 pay-in-kind (g) | | 460,000 | | 463,450 |
Intergen NV 9% 6/30/17 (g) | | 450,000 | | 472,500 |
National Power Corp. 6.875% 11/2/16 (g) | | 300,000 | | 304,500 |
Reliant Energy, Inc.: | | | | |
7.625% 6/15/14 | | 270,000 | | 265,950 |
7.875% 6/15/17 | | 1,220,000 | | 1,201,700 |
| | 4,957,563 |
Gas Utilities - 0.4% |
Intergas Finance BV (Reg. S) 6.375% 5/14/17 | | 500,000 | | 448,750 |
Southern Natural Gas Co.: | | | | |
7.35% 2/15/31 | | 190,000 | | 197,125 |
8% 3/1/32 | | 410,000 | | 453,563 |
Transportadora de Gas del Sur SA 7.875% 5/14/17 (g) | | 460,000 | | 398,475 |
| | 1,497,913 |
Independent Power Producers & Energy Traders - 0.7% |
AES Corp.: | | | | |
7.75% 10/15/15 (g) | | 820,000 | | 840,500 |
8% 10/15/17 (g) | | 790,000 | | 811,725 |
Enron Corp. 7.625% 9/10/04 (c) | | 400,000 | | 75,000 |
NRG Energy, Inc.: | | | | |
7.25% 2/1/14 | | 40,000 | | 39,000 |
|
| Principal Amount (d) | | Value |
7.375% 2/1/16 | | $ 580,000 | | $ 566,950 |
Tenaska Alabama Partners LP 7% 6/30/21 (g) | | 92,430 | | 90,120 |
| | 2,423,295 |
Multi-Utilities - 0.1% |
Aquila, Inc. 14.875% 7/1/12 | | 120,000 | | 150,600 |
Utilicorp United, Inc. 9.95% 2/1/11 (j) | | 3,000 | | 3,240 |
Veolia Environnement 6.125% 10/29/37 | GBP | 50,000 | | 101,215 |
| | 255,055 |
TOTAL UTILITIES | | 9,133,826 |
TOTAL NONCONVERTIBLE BONDS | | 103,585,775 |
TOTAL CORPORATE BONDS (Cost $106,029,131) | 103,607,451 |
U.S. Government and Government Agency Obligations - 20.4% |
|
U.S. Government Agency Obligations - 4.5% |
Fannie Mae: | | | | |
4.125% 5/15/10 | | 2,320,000 | | 2,349,606 |
4.25% 5/15/09 | | 40,000 | | 40,288 |
5.125% 9/2/08 | | 950,000 | | 955,132 |
6.625% 9/15/09 | | 2,745,000 | | 2,881,001 |
Freddie Mac: | | | | |
3.625% 9/15/08 | | 2,582,000 | | 2,570,657 |
4.125% 11/30/09 | | 5,900,000 | | 5,959,614 |
4.75% 11/3/09 | | 1,295,000 | | 1,321,660 |
5.25% 7/18/11 | | 5,000 | | 5,254 |
TOTAL U.S. GOVERNMENT AGENCY OBLIGATIONS | | 16,083,212 |
U.S. Treasury Inflation Protected Obligations - 0.7% |
U.S. Treasury Inflation-Indexed Notes: | | | | |
2% 1/15/14 | | 56,535 | | 58,442 |
2.5% 7/15/16 | | 2,069,020 | | 2,208,201 |
TOTAL U.S. TREASURY INFLATION PROTECTED OBLIGATIONS | | 2,266,643 |
U.S. Treasury Obligations - 15.2% |
U.S. Treasury Bonds: | | | | |
4.75% 2/15/37 | | 250,000 | | 261,641 |
6.125% 8/15/29 | | 5,621,000 | | 6,876,501 |
6.25% 8/15/23 | | 4,200,000 | | 5,028,517 |
stripped principal 0% 11/15/15 | | 390,000 | | 283,559 |
U.S. Treasury Notes: | | | | |
3.125% 11/30/09 (h) | | 9,402,000 | | 9,407,787 |
3.375% 11/30/12 (h) | | 14,268,000 | | 14,217,493 |
U.S. Government and Government Agency Obligations - continued |
| Principal Amount (d) | | Value |
U.S. Treasury Obligations - continued |
U.S. Treasury Notes: - continued | | | | |
3.875% 10/31/12 | | $ 2,000,000 | | $ 2,039,218 |
4.125% 8/31/12 | | 1,000,000 | | 1,029,609 |
4.25% 11/15/17 | | 1,500,000 | | 1,526,133 |
4.5% 11/15/15 | | 6,150,000 | | 6,408,011 |
4.5% 5/15/17 (h) | | 3,895,000 | | 4,036,749 |
4.625% 7/31/12 | | 1,500,000 | | 1,575,000 |
4.75% 8/15/17 | | 1,600,000 | | 1,689,875 |
TOTAL U.S. TREASURY OBLIGATIONS | | 54,380,093 |
TOTAL U.S. GOVERNMENT AND GOVERNMENT AGENCY OBLIGATIONS (Cost $71,440,737) | 72,729,948 |
U.S. Government Agency - Mortgage Securities - 10.9% |
|
Fannie Mae - 7.9% |
3.587% 9/1/33 (j) | | 40,050 | | 40,116 |
3.718% 6/1/33 (j) | | 125,544 | | 126,476 |
3.75% 4/1/34 (j) | | 101,799 | | 101,166 |
3.782% 6/1/33 (j) | | 144,408 | | 144,798 |
3.892% 5/1/33 (j) | | 41,589 | | 41,775 |
3.901% 5/1/34 (j) | | 58,942 | | 58,744 |
3.919% 9/1/33 (j) | | 115,267 | | 115,832 |
3.936% 5/1/34 (j) | | 45,303 | | 45,139 |
3.965% 8/1/33 (j) | | 55,769 | | 56,046 |
3.967% 9/1/33 (j) | | 70,854 | | 71,105 |
4% 9/1/13 to 10/1/20 | | 279,459 | | 270,791 |
4% 3/1/34 (j) | | 118,730 | | 118,739 |
4% 4/1/34 (j) | | 125,440 | | 125,105 |
4.026% 6/1/34 (j) | | 89,075 | | 88,866 |
4.028% 3/1/34 (j) | | 228,321 | | 228,115 |
4.053% 6/1/33 (j) | | 141,412 | | 142,470 |
4.065% 3/1/35 (j) | | 160,869 | | 160,736 |
4.116% 4/1/34 (j) | | 147,023 | | 146,569 |
4.123% 5/1/34 (j) | | 118,683 | | 118,547 |
4.159% 9/1/33 (j) | | 79,086 | | 79,593 |
4.162% 8/1/33 (j) | | 58,627 | | 58,837 |
4.186% 11/1/34 (j) | | 114,678 | | 114,917 |
4.204% 6/1/34 (j) | | 98,177 | | 97,995 |
4.288% 6/1/34 (j) | | 121,969 | | 121,879 |
4.313% 1/1/35 (j) | | 107,345 | | 107,409 |
4.344% 10/1/19 (j) | | 11,748 | | 11,738 |
4.366% 11/1/35 (j) | | 364,067 | | 365,033 |
4.405% 10/1/33 (j) | | 62,397 | | 62,296 |
4.423% 8/1/34 (j) | | 259,080 | | 259,056 |
4.445% 5/1/35 (j) | | 176,603 | | 178,300 |
4.453% 11/1/33 (j) | | 13,218 | | 13,270 |
4.457% 8/1/35 (j) | | 195,661 | | 196,257 |
|
| Principal Amount (d) | | Value |
4.482% 1/1/35 (j) | | $ 70,414 | | $ 70,484 |
4.49% 12/1/34 (j) | | 8,607 | | 8,613 |
4.493% 3/1/35 (j) | | 335,858 | | 336,171 |
4.5% 3/1/18 to 9/1/18 | | 340,812 | | 336,696 |
4.561% 8/1/34 (j) | | 238,151 | | 239,380 |
4.569% 1/1/35 (j) | | 109,629 | | 109,843 |
4.592% 2/1/36 (j) | | 177,104 | | 177,716 |
4.599% 8/1/35 (j) | | 146,940 | | 148,930 |
4.642% 1/1/35 (j) | | 70,557 | | 70,752 |
4.645% 10/1/34 (j) | | 40,510 | | 40,643 |
4.664% 6/1/35 (j) | | 50,761 | | 51,213 |
4.675% 8/1/35 (j) | | 65,334 | | 65,796 |
4.682% 9/1/34 (j) | | 176,959 | | 177,873 |
4.69% 2/1/35 (j) | | 172,120 | | 172,718 |
4.715% 2/1/35 (j) | | 84,428 | | 84,787 |
4.727% 12/1/35 (j) | | 389,603 | | 391,206 |
4.744% 3/1/35 (j) | | 68,611 | | 68,918 |
4.75% 7/1/35 (j) | | 45,933 | | 46,088 |
4.761% 1/1/35 (j) | | 59,750 | | 59,913 |
4.773% 7/1/35 (j) | | 47,984 | | 48,209 |
4.774% 12/1/35 (j) | | 39,906 | | 40,153 |
4.792% 7/1/35 (j) | | 52,036 | | 52,261 |
4.793% 6/1/35 (j) | | 66,999 | | 67,198 |
4.795% 4/1/35 (j) | | 111,722 | | 112,617 |
4.822% 12/1/34 (j) | | 133,674 | | 134,264 |
4.825% 9/1/34 (j) | | 57,647 | | 57,939 |
4.842% 9/1/34 (j) | | 120,218 | | 120,777 |
4.843% 10/1/34 (j) | | 116,509 | | 117,087 |
4.844% 11/1/35 (j) | | 91,662 | | 92,266 |
4.852% 7/1/35 (j) | | 78,030 | | 78,448 |
4.861% 7/1/34 (j) | | 48,736 | | 48,966 |
4.87% 1/1/35 (j) | | 46,793 | | 47,066 |
4.882% 10/1/35 (j) | | 16,967 | | 17,088 |
4.883% 5/1/35 (j) | | 16,555 | | 16,659 |
4.884% 11/1/35 (j) | | 99,356 | | 100,183 |
4.91% 3/1/33 (j) | | 38,494 | | 38,768 |
4.93% 8/1/34 (j) | | 115,452 | | 116,213 |
4.948% 2/1/35 (j) | | 70,998 | | 71,453 |
4.95% 3/1/35 (j) | | 64,143 | | 64,524 |
4.997% 2/1/34 (j) | | 93,497 | | 94,244 |
5% 6/1/14 to 10/1/37 (i) | | 10,827,960 | | 10,607,897 |
5% 1/14/38 (i) | | 1,450,000 | | 1,414,935 |
5.019% 5/1/35 (j) | | 126,589 | | 127,693 |
5.023% 12/1/32 (j) | | 77,785 | | 78,364 |
5.064% 10/1/35 (j) | | 78,293 | | 78,987 |
5.081% 7/1/34 (j) | | 19,611 | | 19,748 |
5.103% 10/1/35 (j) | | 41,943 | | 42,371 |
5.121% 8/1/34 (j) | | 78,025 | | 78,779 |
5.132% 10/1/35 (j) | | 45,859 | | 46,283 |
5.135% 8/1/36 (j) | | 268,522 | | 270,399 |
5.161% 3/1/36 (j) | | 128,712 | | 130,464 |
5.188% 7/1/35 (j) | | 157,938 | | 159,744 |
5.249% 11/1/36 (j) | | 20,969 | | 21,194 |
U.S. Government Agency - Mortgage Securities - continued |
| Principal Amount (d) | | Value |
Fannie Mae - continued |
5.261% 4/1/36 (j) | | $ 54,133 | | $ 55,278 |
5.262% 5/1/35 (j) | | 54,581 | | 55,167 |
5.284% 7/1/35 (j) | | 331,243 | | 334,794 |
5.299% 12/1/36 (j) | | 28,087 | | 28,292 |
5.308% 3/1/36 (j) | | 347,754 | | 352,971 |
5.334% 2/1/36 (j) | | 16,146 | | 16,290 |
5.34% 1/1/36 (j) | | 144,369 | | 145,625 |
5.363% 2/1/36 (j) | | 88,132 | | 88,891 |
5.376% 3/1/37 (j) | | 448,544 | | 454,056 |
5.393% 7/1/35 (j) | | 22,480 | | 22,713 |
5.396% 2/1/37 (j) | | 161,818 | | 163,653 |
5.398% 2/1/37 (j) | | 32,446 | | 32,797 |
5.48% 6/1/47 (j) | | 27,742 | | 28,080 |
5.482% 2/1/37 (j) | | 228,641 | | 231,861 |
5.5% 12/1/13 to 4/1/19 | | 1,378,214 | | 1,403,089 |
5.52% 11/1/36 (j) | | 41,690 | | 42,162 |
5.618% 2/1/36 (j) | | 42,299 | | 42,966 |
5.645% 4/1/37 (j) | | 153,470 | | 155,732 |
5.65% 4/1/36 (j) | | 144,765 | | 147,353 |
5.66% 6/1/36 (j) | | 91,773 | | 93,338 |
5.792% 3/1/36 (j) | | 310,697 | | 316,192 |
5.797% 5/1/36 (j) | | 30,205 | | 30,680 |
5.8% 1/1/36 (j) | | 31,493 | | 32,046 |
5.821% 5/1/36 (j) | | 217,529 | | 221,212 |
5.86% 6/1/35 (j) | | 123,917 | | 126,063 |
5.893% 12/1/36 (j) | | 58,264 | | 59,417 |
5.903% 9/1/36 (j) | | 65,312 | | 66,283 |
5.938% 5/1/36 (j) | | 98,309 | | 100,138 |
5.966% 5/1/36 (j) | | 36,081 | | 36,830 |
6% 5/1/12 to 6/1/30 | | 858,727 | | 878,337 |
6.017% 4/1/36 (j) | | 572,794 | | 584,235 |
6.102% 3/1/37 (j) | | 62,364 | | 63,722 |
6.159% 4/1/36 (j) | | 65,558 | | 66,889 |
6.224% 6/1/36 (j) | | 10,619 | | 10,779 |
6.226% 3/1/37 (j) | | 19,991 | | 20,456 |
6.5% 12/1/08 to 9/1/32 | | 275,690 | | 285,032 |
7.5% 5/1/37 | | 44,273 | | 46,431 |
TOTAL FANNIE MAE | | 27,978,546 |
Freddie Mac - 3.0% |
3.376% 7/1/33 (j) | | 104,480 | | 104,280 |
3.995% 5/1/33 (j) | | 186,367 | | 187,779 |
4% 5/1/19 to 11/1/20 | | 284,822 | | 274,437 |
4.004% 4/1/34 (j) | | 200,386 | | 199,178 |
4.075% 7/1/35 (j) | | 90,068 | | 90,253 |
4.178% 1/1/35 (j) | | 184,055 | | 184,368 |
4.35% 6/1/35 (j) | | 445,001 | | 444,662 |
4.5% 2/1/18 to 8/1/33 | | 346,311 | | 340,458 |
|
| Principal Amount (d) | | Value |
4.584% 6/1/33 (j) | | $ 57,211 | | $ 57,215 |
4.645% 5/1/35 (j) | | 124,227 | | 124,475 |
4.665% 2/1/35 (j) | | 458,346 | | 458,528 |
4.697% 9/1/36 (j) | | 35,939 | | 35,961 |
4.704% 9/1/35 (j) | | 200,923 | | 201,656 |
4.79% 2/1/36 (j) | | 16,902 | | 16,922 |
4.807% 3/1/35 (j) | | 34,561 | | 34,600 |
4.819% 5/1/35 (j) | | 430,904 | | 431,703 |
4.851% 10/1/35 (j) | | 72,912 | | 73,484 |
4.897% 10/1/36 (j) | | 178,343 | | 179,269 |
5% 7/1/18 to 7/1/19 | | 326,633 | | 329,076 |
5.01% 7/1/35 (j) | | 198,743 | | 199,655 |
5.02% 1/1/37 (j) | | 297,946 | | 299,659 |
5.021% 4/1/35 (j) | | 4,703 | | 4,723 |
5.024% 4/1/35 (j) | | 135,873 | | 136,942 |
5.034% 10/1/36 (j) | | 81,473 | | 82,115 |
5.042% 4/1/35 (j) | | 144,745 | | 145,555 |
5.115% 7/1/35 (j) | | 47,702 | | 48,097 |
5.332% 9/1/35 (j) | | 40,095 | | 40,459 |
5.43% 3/1/37 (j) | | 25,541 | | 25,724 |
5.5% 8/1/14 to 6/1/20 | | 946,858 | | 962,634 |
5.501% 1/1/36 (j) | | 42,316 | | 42,790 |
5.542% 4/1/37 (j) | | 38,108 | | 38,517 |
5.585% 3/1/36 (j) | | 240,185 | | 243,016 |
5.648% 8/1/36 (j) | | 251,002 | | 253,899 |
5.758% 10/1/35 (j) | | 16,598 | | 16,813 |
5.763% 5/1/37 (j) | | 280,547 | | 283,846 |
5.773% 1/1/36 (j) | | 24,468 | | 24,746 |
5.786% 3/1/37 (j) | | 132,559 | | 134,109 |
5.794% 4/1/37 (j) | | 128,165 | | 129,714 |
5.822% 5/1/37 (j) | | 27,219 | | 27,573 |
5.829% 5/1/37 (j) | | 41,697 | | 42,186 |
5.839% 5/1/37 (j) | | 164,683 | | 166,840 |
5.839% 6/1/37 (j) | | 100,770 | | 102,146 |
5.871% 7/1/36 (j) | | 770,224 | | 782,650 |
5.95% 4/1/36 (j) | | 328,077 | | 333,253 |
6% 10/1/16 to 2/1/19 | | 415,117 | | 426,608 |
6.015% 6/1/36 (j) | | 44,637 | | 45,305 |
6.033% 1/1/37 (j) | | 124,438 | | 126,521 |
6.141% 2/1/37 (j) | | 34,851 | | 35,352 |
6.154% 12/1/36 (j) | | 302,021 | | 306,232 |
6.19% 7/1/36 (j) | | 172,860 | | 176,167 |
6.226% 5/1/36 (j) | | 35,536 | | 36,190 |
6.271% 6/1/37 (j) | | 26,391 | | 26,787 |
6.362% 7/1/36 (j) | | 46,566 | | 47,464 |
6.417% 6/1/37 (j) | | 9,966 | | 10,167 |
6.496% 9/1/36 (j) | | 226,791 | | 231,344 |
6.5% 12/1/14 to 3/1/36 | | 824,140 | | 852,804 |
U.S. Government Agency - Mortgage Securities - continued |
| Principal Amount (d) | | Value |
Freddie Mac - continued |
6.725% 8/1/37 (j) | | $ 72,540 | | $ 74,116 |
7.581% 4/1/37 (j) | | 10,000 | | 10,250 |
TOTAL FREDDIE MAC | | 10,741,272 |
TOTAL U.S. GOVERNMENT AGENCY - MORTGAGE SECURITIES (Cost $38,126,608) | 38,719,818 |
Asset-Backed Securities - 0.3% |
|
FCC SPARC Series 2005-1 Class B, 5.102% 7/15/11 (j) | EUR | 100,000 | | 143,386 |
Provide Bricks Series 2007-1 Class B, 4.965% 1/30/40 (j) | EUR | 50,000 | | 70,825 |
Red & Black Consumer PLC Series 2006-1 Class C, 4.775% 5/15/21 (j) | EUR | 200,000 | | 291,150 |
Smile Synthetic BV Series 2005 Class C, 5.023% 1/20/15 (j) | EUR | 80,440 | | 112,014 |
South East Water Ltd. Class 2A, 5.5834% 3/29/29 | GBP | 165,000 | | 320,946 |
TOTAL ASSET-BACKED SECURITIES (Cost $949,266) | 938,321 |
Collateralized Mortgage Obligations - 3.3% |
|
Private Sponsor - 0.0% |
Arkle Master Issuer PLC Series 2006-1X Class 2C, 4.93% 2/17/52 (j) | EUR | 50,000 | | 71,642 |
Fosse Master Issuer PLC floater Series 2007-1X Class M3, 5.005% 10/18/54 (j) | EUR | 50,000 | | 69,270 |
Gracechurch Mortgage Financing PLC Series 2007-1X Class 2D2, 4.984% 11/20/56 (j) | EUR | 50,000 | | 68,336 |
TOTAL PRIVATE SPONSOR | | 209,248 |
U.S. Government Agency - 3.3% |
Fannie Mae: | | | | |
floater Series 2007-95 Class A1, 5.115% 8/27/36 (j) | | 738,504 | | 738,266 |
planned amortization class Series 2002-83 Class ME, 5% 12/25/17 | | 450,000 | | 445,302 |
Fannie Mae subordinate REMIC pass-thru certificates: | | | | |
planned amortization class: | | | | |
Series 2001-68 Class QZ, 5.5% 12/25/16 | | 76,796 | | 77,626 |
Series 2002-11: | | | | |
Class QC, 5.5% 3/25/17 | | 195,219 | | 197,662 |
|
| Principal Amount (d) | | Value |
Class UC, 6% 3/25/17 | | $ 136,560 | | $ 139,861 |
Series 2002-18 Class PC, 5.5% 4/25/17 | | 855,000 | | 867,852 |
Series 2002-61 Class PG, 5.5% 10/25/17 | | 270,000 | | 276,158 |
Series 2002-71 Class UC, 5% 11/25/17 | | 430,000 | | 428,564 |
Series 2002-9 Class PC, 6% 3/25/17 | | 12,877 | | 13,160 |
Series 2003-113: | | | | |
Class PD, 4% 2/25/17 | | 260,000 | | 255,571 |
Class PE, 4% 11/25/18 | | 80,000 | | 75,277 |
Series 2003-122 Class OL, 4% 12/25/18 | | 1,000,000 | | 947,126 |
Series 2003-70 Class BJ, 5% 7/25/33 | | 45,000 | | 42,718 |
Series 2003-85 Class GD, 4.5% 9/25/18 | | 60,000 | | 58,830 |
Series 2004-80 Class LD, 4% 1/25/19 | | 100,000 | | 97,718 |
Series 2004-81: | | | | |
Class KC, 4.5% 4/25/17 | | 70,000 | | 69,959 |
Class KD, 4.5% 7/25/18 | | 165,000 | | 163,687 |
Series 2005-52 Class PB, 6.5% 12/25/34 | | 261,342 | | 268,047 |
sequential payer: | | | | |
Series 2003-18 Class EY, 5% 6/25/17 | | 171,337 | | 171,899 |
Series 2004-95 Class AN, 5.5% 1/25/25 | | 119,000 | | 120,427 |
Series 2005-117, Class JN, 4.5% 1/25/36 | | 40,000 | | 35,989 |
Series 2005-47 Class AK, 5% 6/25/20 | | 370,000 | | 365,813 |
Freddie Mac planned amortization class: | | | | |
Series 2101 Class PD, 6% 11/15/28 | | 24,997 | | 25,507 |
Series 2115 Class PE, 6% 1/15/14 | | 8,851 | | 9,050 |
Freddie Mac Multi-class participation certificates guaranteed: | | | | |
floater: | | | | |
Series 2577 Class FW, 5.5275% 1/15/30 (j) | | 349,426 | | 350,270 |
Series 2630 Class FL, 5.5275% 6/15/18 (j) | | 4,163 | | 4,210 |
planned amortization class: | | | | |
Series 2376 Class JE, 5.5% 11/15/16 | | 53,129 | | 54,243 |
Series 2378 Class PE, 5.5% 11/15/16 | | 304,659 | | 309,344 |
Series 2381 Class OG, 5.5% 11/15/16 | | 41,710 | | 42,360 |
Series 2390 Class CH, 5.5% 12/15/16 | | 137,655 | | 139,797 |
Collateralized Mortgage Obligations - continued |
| Principal Amount (d) | | Value |
U.S. Government Agency - continued |
Freddie Mac Multi-class participation certificates guaranteed: - continued | | | | |
Series 2425 Class JH, 6% 3/15/17 | | $ 72,130 | | $ 73,987 |
Series 2628 Class OP, 3.5% 11/15/13 | | 57,430 | | 57,062 |
Series 2695 Class DG, 4% 10/15/18 | | 220,000 | | 208,854 |
Series 2773 Class EG, 4.5% 4/15/19 | | 725,000 | | 707,343 |
Series 2831 Class PB, 5% 7/15/19 | | 200,000 | | 198,535 |
Series 2866 Class XE, 4% 12/15/18 | | 250,000 | | 244,675 |
Series 2996 Class MK, 5.5% 6/15/35 | | 43,029 | | 43,795 |
sequential payer: | | | | |
Series 2303 Class ZV, 6% 4/15/31 | | 69,667 | | 71,332 |
Series 2467 Class NB, 5% 7/15/17 | | 95,000 | | 95,194 |
Series 2569 Class HB, 5% 9/15/16 | | 333,226 | | 333,130 |
Series 2570 Class CU, 4.5% 7/15/17 | | 17,123 | | 17,012 |
Series 2572 Class HK, 4% 2/15/17 | | 24,792 | | 24,378 |
Series 2617 Class GW, 3.5% 6/15/16 | | 21,778 | | 21,571 |
Series 2685 Class ND, 4% 10/15/18 | | 85,000 | | 79,918 |
Series 2773 Class TA, 4% 11/15/17 | | 146,330 | | 143,886 |
Series 2849 Class AL, 5% 5/15/18 | | 75,593 | | 75,742 |
Series 2860 Class CP, 4% 10/15/17 | | 24,292 | | 23,911 |
Series 2930 Class KT, 4.5% 2/15/20 | | 450,000 | | 424,564 |
Series 2937 Class HJ, 5% 10/15/19 | | 83,463 | | 83,685 |
Series 3266 Class D, 5% 1/15/22 | | 900,000 | | 885,848 |
Series 2715 Class NG, 4.5% 12/15/18 | | 1,000,000 | | 969,706 |
Series 2863 Class DB, 4% 9/15/14 | | 12,602 | | 12,270 |
Series 2975 Class NA, 5% 7/15/23 | | 86,234 | | 86,452 |
TOTAL U.S. GOVERNMENT AGENCY | | 11,675,143 |
TOTAL COLLATERALIZED MORTGAGE OBLIGATIONS (Cost $11,703,686) | 11,884,391 |
Commercial Mortgage Securities - 0.1% |
| Principal Amount (d) | | Value |
Canary Wharf Finance II plc Series 3MUK Class C2, 6.8256% 10/22/37 (j) | GBP | 50,000 | | $ 91,077 |
Skyline BV floater Series 2007-1 Class B, 4.903% 7/22/43 (j) | EUR | 100,000 | | 139,956 |
TOTAL COMMERCIAL MORTGAGE SECURITIES (Cost $237,522) | 231,033 |
Foreign Government and Government Agency Obligations - 19.3% |
|
Arab Republic 8.75% 7/18/12 (g) | EGP | 960,000 | | 178,677 |
Argentine Republic: | | | | |
discount (with partial capitalization through 12/31/13) 8.28% 12/31/33 | | $ 243,125 | | 233,400 |
5.389% 8/3/12 (j) | | 1,146,875 | | 1,010,868 |
7% 3/28/11 | | 2,515,000 | | 2,314,149 |
7% 9/12/13 | | 1,695,000 | | 1,449,460 |
Belgian Kingdom 5% 3/28/35 | EUR | 80,000 | | 121,142 |
Brazilian Federative Republic: | | | | |
6% 9/15/13 | | 200,000 | | 199,740 |
7.125% 1/20/37 | | 305,000 | | 346,938 |
8.25% 1/20/34 | | 280,000 | | 353,920 |
8.75% 2/4/25 | | 255,000 | | 326,018 |
10% 1/1/10 | BRL | 154,000 | | 82,415 |
12.25% 3/6/30 | | 495,000 | | 856,350 |
12.5% 1/5/16 | BRL | 250,000 | | 152,528 |
12.75% 1/15/20 | | 235,000 | | 370,713 |
British Columbia Province 5.7% 6/18/29 | CAD | 750,000 | | 870,152 |
Canadian Government: | | | | |
4% 6/1/17 | CAD | 7,300,000 | | 7,352,534 |
5% 6/1/37 | CAD | 850,000 | | 988,637 |
Central Bank of Nigeria promissory note 5.092% 1/5/10 | | 123,261 | | 122,164 |
Chilean Republic 5.5% 1/15/13 | | 175,000 | | 180,093 |
Colombian Republic: | | | | |
7.375% 9/18/37 | | 305,000 | | 339,313 |
11.75% 2/25/20 | | 95,000 | | 141,550 |
Democratic Socialist Republic of Sri Lanka 8.25% 10/24/12 (g) | | 65,000 | | 62,075 |
Dominican Republic: | | | | |
Brady 6.3125% 8/30/09 (j) | | 51,655 | | 51,526 |
Brady 5.7188% 8/30/24 (j) | | 750,000 | | 746,250 |
9.04% 1/23/18 (g) | | 349,753 | | 396,095 |
9.5% 9/27/11 (Reg. S) | | 210,787 | | 222,380 |
Ecuador Republic: | | | | |
10% 8/15/30 (Reg. S) | | 500,000 | | 482,500 |
euro par 5% 2/28/25 | | 76,000 | | 55,982 |
French Republic: | | | | |
4.75% 4/25/35 | EUR | 1,800,000 | | 2,659,757 |
5.5% 4/25/29 | EUR | 330,000 | | 536,023 |
Gabonese Republic 8.2% 12/12/17 (g) | | 530,000 | | 551,200 |
Foreign Government and Government Agency Obligations - continued |
| Principal Amount (d) | | Value |
German Federal Republic: | | | | |
2.25% 4/15/13 | EUR | 4,852,863 | | $ 7,180,383 |
3.25% 7/4/15 | EUR | 110,000 | | 150,218 |
4.25% 7/4/17 | EUR | 1,900,000 | | 2,758,469 |
4.25% 7/4/39 | EUR | 1,120,000 | | 1,540,412 |
4.5% 1/4/13 | EUR | 150,000 | | 222,568 |
Ghana Republic 8.5% 10/4/17 (g) | | $ 335,000 | | 352,588 |
Indonesian Republic: | | | | |
6.625% 2/17/37 (g) | | 525,000 | | 500,063 |
6.75% 3/10/14 (Reg. S) | | 165,000 | | 170,363 |
8.5% 10/12/35 | | 100,000 | | 117,130 |
Irish Republic 4.5% 10/18/18 | EUR | 500,000 | | 729,576 |
Islamic Republic of Pakistan: | | | | |
6.75% 2/19/09 | | 385,000 | | 362,863 |
7.125% 3/31/16 (g) | | 200,000 | | 174,500 |
Italian Republic 6% 5/1/31 | EUR | 60,000 | | 100,410 |
Japan Government: | | | | |
0.5703% 1/15/08 | JPY | 150,000,000 | | 1,344,774 |
0.9% 12/22/08 | JPY | 50,000,000 | | 449,549 |
0.92% 11/20/20 (j) | JPY | 200,000,000 | | 1,728,557 |
0.93% 7/20/20 (j) | JPY | 50,000,000 | | 422,723 |
1.5% 3/20/14 | JPY | 185,000,000 | | 1,697,590 |
2.5% 9/20/37 | JPY | 300,000,000 | | 2,771,466 |
Real Return Bond 1.1% 12/10/16 | JPY | 125,000,000 | | 1,127,315 |
Lebanese Republic: | | | | |
7.125% 3/5/10 | | 40,000 | | 39,000 |
7.875% 5/20/11 (Reg. S) | | 270,000 | | 262,575 |
8.1563% 11/30/09 (g)(j) | | 115,000 | | 113,563 |
8.1563% 11/30/09 (Reg. S) (j) | | 535,000 | | 528,313 |
8.625% 6/20/13 (Reg. S) | | 345,000 | | 339,825 |
Peruvian Republic: | | | | |
6.4375% 3/7/27 (j) | | 70,000 | | 69,125 |
euro Brady past due interest 6.4375% 3/7/17 (j) | | 66,500 | | 66,334 |
Philippine Republic: | | | | |
8.25% 1/15/14 | | 170,000 | | 191,250 |
9.5% 2/2/30 | | 230,000 | | 312,225 |
9.875% 1/15/19 | | 135,000 | | 176,850 |
10.625% 3/16/25 | | 205,000 | | 295,200 |
Republic of Fiji 6.875% 9/13/11 | | 200,000 | | 180,000 |
Republic of Serbia 3.75% 11/1/24 (f)(g) | | 165,000 | | 153,038 |
Russian Federation: | | | | |
7.5% 3/31/30 (Reg. S) | | 3,009,600 | | 3,434,706 |
12.75% 6/24/28 (Reg. S) | | 485,000 | | 888,763 |
South African Republic 6.5% 6/2/14 | | 150,000 | | 159,375 |
|
| Principal Amount (d) | | Value |
Turkish Republic: | | | | |
6.75% 4/3/18 | | $ 330,000 | | $ 338,745 |
6.875% 3/17/36 | | 700,000 | | 687,750 |
7% 9/26/16 | | 200,000 | | 212,500 |
7.375% 2/5/25 | | 415,000 | | 439,900 |
11% 1/14/13 | | 230,000 | | 282,440 |
11.875% 1/15/30 | | 415,000 | | 653,003 |
UK Treasury GILT: | | | | |
4% 9/7/16 | GBP | 50,000 | | 95,796 |
4.25% 12/7/27 | GBP | 650,000 | | 1,255,679 |
4.25% 6/7/32 | GBP | 50,000 | | 97,475 |
4.25% 3/7/36 | GBP | 90,000 | | 176,903 |
4.25% 12/7/46 | GBP | 1,170,000 | | 2,318,571 |
4.5% 12/7/42 | GBP | 400,000 | | 825,735 |
8% 6/7/21 | GBP | 425,000 | | 1,133,200 |
Ukraine Cabinet of Ministers 6.58% 11/21/16 (g) | | 150,000 | | 147,375 |
Ukraine Government 6.75% 11/14/17 (g) | | 360,000 | | 353,700 |
United Mexican States: | | | | |
6.75% 9/27/34 | | 80,000 | | 88,360 |
7.5% 4/8/33 | | 370,000 | | 441,965 |
8.3% 8/15/31 | | 410,000 | | 529,515 |
Uruguay Republic: | | | | |
5% 9/14/18 | UYU | 2,148,478 | | 107,366 |
8% 11/18/22 | | 163,878 | | 183,543 |
Venezuelan Republic: | | | | |
5.375% 8/7/10 | | 240,000 | | 225,600 |
6.18% 4/20/11 (j) | | 480,000 | | 433,440 |
7.65% 4/21/25 | | 145,000 | | 123,975 |
8.5% 10/8/14 | | 390,000 | | 376,350 |
9.25% 9/15/27 | | 975,000 | | 972,563 |
9.375% 1/13/34 | | 225,000 | | 223,875 |
10.75% 9/19/13 | | 610,000 | | 652,700 |
13.625% 8/15/18 | | 396,000 | | 507,870 |
Vietnamese Socialist Republic Brady par 4% 3/12/28 (f) | | 90,000 | | 76,050 |
TOTAL FOREIGN GOVERNMENT AND GOVERNMENT AGENCY OBLIGATIONS (Cost $67,256,954) | 68,828,152 |
Supranational Obligations - 0.0% |
|
Inter-American Development Bank 6.625% 4/17/17 (Cost $92,436) | PEN | 300,000 | | 100,966 |
Common Stocks - 0.2% |
| | Shares | | |
CONSUMER DISCRETIONARY - 0.0% |
Auto Components - 0.0% |
Intermet Corp. (a)(l) | | 6,092 | | 0 |
Remy International, Inc. (a) | | 2,065 | | 65,048 |
| | | | 65,048 |
Common Stocks - continued |
| | Shares | | Value |
CONSUMER DISCRETIONARY - continued |
Hotels, Restaurants & Leisure - 0.0% |
Centerplate, Inc. unit | | 10,000 | | $ 90,200 |
TOTAL CONSUMER DISCRETIONARY | | | 155,248 |
INDUSTRIALS - 0.2% |
Airlines - 0.2% |
Delta Air Lines, Inc. (a) | | 29,356 | | 437,111 |
Northwest Airlines Corp. (a) | | 7,780 | | 112,888 |
| | | 549,999 |
INFORMATION TECHNOLOGY - 0.0% |
Semiconductors & Semiconductor Equipment - 0.0% |
ASAT Holdings Ltd. warrants 2/1/11 (a)(l) | | 27,300 | | 1,260 |
UTILITIES - 0.0% |
Electric Utilities - 0.0% |
Portland General Electric Co. | | 140 | | 3,889 |
TOTAL COMMON STOCKS (Cost $893,011) | | 710,396 |
Preferred Stocks - 0.1% |
| | | |
Convertible Preferred Stocks - 0.0% |
MATERIALS - 0.0% |
Chemicals - 0.0% |
Celanese Corp. 4.25% | | 300 | | 16,287 |
Nonconvertible Preferred Stocks - 0.1% |
CONSUMER DISCRETIONARY - 0.0% |
Media - 0.0% |
Spanish Broadcasting System, Inc. Class B, 10.75% | | 68 | | 68,000 |
TELECOMMUNICATION SERVICES - 0.1% |
Wireless Telecommunication Services - 0.1% |
Rural Cellular Corp. 12.25% pay-in-kind | | 255 | | 318,750 |
TOTAL NONCONVERTIBLE PREFERRED STOCKS | | | 386,750 |
TOTAL PREFERRED STOCKS (Cost $360,931) | | 403,037 |
Floating Rate Loans - 3.8% |
| Principal Amount (d) | | Value |
CONSUMER DISCRETIONARY - 1.3% |
Auto Components - 0.1% |
Dana Corp. term loan 7.98% 4/13/08 (j) | | $ 140,000 | | $ 139,300 |
Lear Corp. term loan 7.6042% 4/25/12 (j) | | 128,830 | | 125,287 |
| | 264,587 |
Automobiles - 0.4% |
AM General LLC: | | | | |
Tranche B, term loan 8.1766% 9/30/13 (j) | | 182,903 | | 178,331 |
8.2425% 9/30/12 (j) | | 6,774 | | 6,605 |
Ford Motor Co. term loan 8% 12/15/13 (j) | | 1,257,300 | | 1,163,003 |
General Motors Corp. term loan 7.615% 11/29/13 (j) | | 59,550 | | 55,828 |
| | 1,403,767 |
Diversified Consumer Services - 0.0% |
Affinion Group Holdings, Inc. term loan 11.6775% 3/1/12 (j) | | 220,000 | | 202,400 |
Hotels, Restaurants & Leisure - 0.0% |
Green Valley Ranch Gaming LLC Tranche 1LN, term loan 6.9923% 2/16/14 (j) | | 19,123 | | 18,023 |
OSI Restaurant Partners, Inc.: | | | | |
term loan 7.125% 6/14/14 (j) | | 35,581 | | 32,868 |
7.1275% 6/14/13 (j) | | 3,008 | | 2,778 |
Six Flags, Inc. Tranche B, term loan 7.2495% 4/30/15 (j) | | 49,750 | | 45,521 |
| | 99,190 |
Media - 0.5% |
Advanstar, Inc. Tranche 2LN, term loan 9.8425% 11/30/14 (j) | | 30,000 | | 27,600 |
Charter Communications Operating LLC Tranche B 1LN, term loan 6.99% 3/6/14 (j) | | 1,346,000 | | 1,256,828 |
CSC Holdings, Inc. Tranche B, term loan 6.8963% 3/31/13 (j) | | 304,575 | | 287,443 |
Discovery Communications, Inc. term loan 6.83% 5/14/14 (j) | | 69,650 | | 67,473 |
| | 1,639,344 |
Multiline Retail - 0.0% |
Neiman Marcus Group, Inc. term loan 6.9392% 4/6/13 (j) | | 98,734 | | 94,785 |
Specialty Retail - 0.2% |
Claire's Stores, Inc. term loan 7.5905% 5/29/14 (j) | | 268,650 | | 227,681 |
Michaels Stores, Inc. term loan 7.6136% 10/31/13 (j) | | 288,543 | | 266,902 |
Floating Rate Loans - continued |
| Principal Amount (d) | | Value |
CONSUMER DISCRETIONARY - continued |
Specialty Retail - continued |
Sally Holdings LLC Tranche B, term loan 7.5194% 11/16/13 (j) | | $ 49,375 | | $ 46,413 |
Toys 'R' US, Inc. term loan 8.225% 12/9/08 (j) | | 290,000 | | 281,300 |
| | 822,296 |
Textiles, Apparel & Luxury Goods - 0.1% |
Hanesbrands, Inc.: | | | | |
term loan 8.815% 3/5/14 (j) | | 90,000 | | 89,663 |
Tranche B 1LN, term loan 6.7789% 9/5/13 (j) | | 188,277 | | 182,864 |
| | 272,527 |
TOTAL CONSUMER DISCRETIONARY | | 4,798,896 |
CONSUMER STAPLES - 0.1% |
Beverages - 0.0% |
Constellation Brands, Inc. Tranche B, term loan 6.5964% 6/5/13 (j) | | 64,000 | | 62,400 |
Food & Staples Retailing - 0.1% |
Rite Aid Corp. Tranche ABL, term loan 6.8002% 6/4/14 (j) | | 160,000 | | 149,200 |
TOTAL CONSUMER STAPLES | | 211,600 |
ENERGY - 0.1% |
Energy Equipment & Services - 0.0% |
Compagnie Generale de Geophysique SA term loan 6.845% 1/12/14 (j) | | 35,600 | | 34,710 |
Helix Energy Solutions Group, Inc. term loan 7.0727% 7/1/13 (j) | | 40,567 | | 39,147 |
| | 73,857 |
Oil, Gas & Consumable Fuels - 0.1% |
Coffeyville Resources LLC: | | | | |
Credit-Linked Deposit 8.5806% 12/28/10 (j) | | 27,568 | | 26,741 |
Tranche D, term loan 8.4811% 12/28/13 (j) | | 89,907 | | 87,210 |
SandRidge Energy, Inc. term loan 8.625% 4/1/15 (j) | | 230,000 | | 229,425 |
Targa Resources, Inc./Targa Resources Finance Corp.: | | | | |
Credit-Linked Deposit 7.3231% 10/31/12 (j) | | 29,032 | | 28,306 |
term loan 6.9198% 10/31/12 (j) | | 51,743 | | 50,449 |
Venoco, Inc. Tranche 2LN, term loan 8.9375% 5/7/14 (j) | | 30,000 | | 29,250 |
| | 451,381 |
TOTAL ENERGY | | 525,238 |
|
| Principal Amount (d) | | Value |
FINANCIALS - 0.2% |
Real Estate Investment Trusts - 0.1% |
Capital Automotive (REIT) Tranche B, term loan 6.98% 12/16/10 (j) | | $ 167,447 | | $ 163,889 |
Real Estate Management & Development - 0.1% |
Realogy Corp.: | | | | |
Tranche B, term loan 8.24% 10/10/13 (j) | | 360,612 | | 315,536 |
8.24% 10/10/13 (j) | | 97,088 | | 84,952 |
| | 400,488 |
TOTAL FINANCIALS | | 564,377 |
HEALTH CARE - 0.3% |
Health Care Equipment & Supplies - 0.0% |
Bausch & Lomb, Inc. term loan: | | | | |
4/26/15 (j)(m) | | 12,000 | | 11,925 |
8.08% 4/26/15 (j) | | 48,000 | | 47,700 |
| | 59,625 |
Health Care Providers & Services - 0.3% |
Community Health Systems, Inc.: | | | | |
term loan 7.3313% 7/25/14 (j) | | 350,611 | | 334,834 |
Tranche DD, term loan 7/25/14 (j)(m) | | 17,633 | | 16,840 |
HCA, Inc. Tranche B, term loan 7.08% 11/17/13 (j) | | 742,500 | | 716,513 |
Health Management Associates, Inc. Tranche B, term loan 6.5802% 2/28/14 (j) | | 59,550 | | 55,456 |
| | 1,123,643 |
TOTAL HEALTH CARE | | 1,183,268 |
INDUSTRIALS - 0.2% |
Aerospace & Defense - 0.0% |
DeCrane Aircraft Holdings, Inc.: | | | | |
Tranche 1LN, term loan 7.9963% 2/21/13 (j) | | 9,412 | | 9,177 |
Tranche 2LN, term loan 12.2438% 2/21/14 (j) | | 20,000 | | 19,500 |
Wesco Aircraft Hardware Corp.: | | | | |
Tranche 1LN, term loan 7.45% 9/29/13 (j) | | 19,450 | | 19,110 |
Tranche 2LN, term loan 10.95% 3/28/14 (j) | | 10,000 | | 9,950 |
| | 57,737 |
Commercial Services & Supplies - 0.1% |
Allied Waste Industries, Inc.: | | | | |
Credit-Linked Deposit 6.6206% 3/28/14 (j) | | 28,213 | | 27,014 |
term loan 6.586% 3/28/14 (j) | | 46,926 | | 44,932 |
ARAMARK Corp.: | | | | |
term loan 6.83% 1/26/14 (j) | | 107,784 | | 102,395 |
Floating Rate Loans - continued |
| Principal Amount (d) | | Value |
INDUSTRIALS - continued |
Commercial Services & Supplies - continued |
ARAMARK Corp.: - continued | | | | |
6.83% 1/26/14 (j) | | $ 7,703 | | $ 7,318 |
Brand Energy & Infrastructure Services, Inc. Tranche 2LN, term loan 11.1% 2/7/15 (j) | | 40,000 | | 36,900 |
| | 218,559 |
Electrical Equipment - 0.0% |
Baldor Electric Co. term loan 6.9634% 1/31/14 (j) | | 23,430 | | 23,020 |
Industrial Conglomerates - 0.0% |
Walter Industries, Inc. term loan 6.8026% 10/3/12 (j) | | 9,712 | | 9,323 |
Machinery - 0.1% |
Chart Industries, Inc. Tranche B, term loan 7.1484% 10/17/12 (j) | | 8,889 | | 8,711 |
Dresser, Inc.: | | | | |
Tranche 2LN, term loan 11.1288% 5/4/15 pay-in-kind (j) | | 230,000 | | 218,500 |
Tranche B 1LN, term loan 7.4463% 5/4/14 (j) | | 39,285 | | 37,615 |
Navistar International Corp.: | | | | |
term loan 8.2338% 1/19/12 (j) | | 124,667 | | 119,057 |
Credit-Linked Deposit 8.2793% 1/19/12 (j) | | 45,333 | | 43,293 |
| | 427,176 |
Trading Companies & Distributors - 0.0% |
Neff Corp. Tranche 2LN, term loan 8.4038% 11/30/14 (j) | | 50,000 | | 40,000 |
VWR Funding, Inc. term loan 7.6981% 6/29/14 (j) | | 90,000 | | 85,275 |
| | 125,275 |
TOTAL INDUSTRIALS | | 861,090 |
INFORMATION TECHNOLOGY - 0.7% |
Electronic Equipment & Instruments - 0.2% |
Flextronics International Ltd.: | | | | |
Tranche B-A, term loan 7.3944% 10/1/14 (j) | | 309,985 | | 301,460 |
Tranche B-A1, term loan 7.455% 10/1/14 (j) | | 89,063 | | 86,613 |
Tranche B-B, term loan 7.455% 10/1/12 (j) | | 399,000 | | 389,524 |
| | 777,597 |
IT Services - 0.2% |
Affiliated Computer Services, Inc. Tranche B2, term loan 7.044% 3/20/13 (j) | | 187,388 | | 182,703 |
SunGard Data Systems, Inc. term loan 6.8975% 2/28/14 (j) | | 536,630 | | 517,847 |
| | 700,550 |
|
| Principal Amount (d) | | Value |
Semiconductors & Semiconductor Equipment - 0.2% |
Freescale Semiconductor, Inc. term loan 6.975% 12/1/13 (j) | | $ 696,217 | | $ 645,741 |
Software - 0.1% |
Kronos, Inc. Tranche 1LN, term loan 7.08% 6/11/14 (j) | | 227,207 | | 212,439 |
Open Solutions, Inc. term loan 7.275% 1/23/14 (j) | | 19,904 | | 18,510 |
| | 230,949 |
TOTAL INFORMATION TECHNOLOGY | | 2,354,837 |
MATERIALS - 0.4% |
Chemicals - 0.0% |
Celanese Holding LLC: | | | | |
Revolving Credit-Linked Deposit 6.975% 4/2/13 (j) | | 12,308 | | 11,862 |
term loan 6.9788% 4/2/14 (j) | | 67,354 | | 64,912 |
Momentive Performance Materials, Inc. Tranche B1, term loan 7.125% 12/4/13 (j) | | 59,400 | | 57,024 |
Solutia, Inc. Tranche B, term loan 8.06% 3/31/08 (j) | | 18,903 | | 18,856 |
| | 152,654 |
Containers & Packaging - 0.1% |
Berry Plastics Holding Corp. Tranche C, term loan 7.16% 4/3/15 (j) | | 267,975 | | 249,217 |
Metals & Mining - 0.1% |
Aleris International, Inc. term loan 7.0032% 12/19/13 (j) | | 148,500 | | 135,506 |
Novelis Corp. term loan 7.2% 7/6/14 (j) | | 268,650 | | 250,516 |
| | 386,022 |
Paper & Forest Products - 0.2% |
Georgia-Pacific Corp. Tranche B1, term loan 6.8657% 12/23/12 (j) | | 560,025 | | 534,124 |
TOTAL MATERIALS | | 1,322,017 |
TELECOMMUNICATION SERVICES - 0.3% |
Diversified Telecommunication Services - 0.3% |
Intelsat Bermuda Ltd. term loan 7.725% 1/12/14 (j) | | 100,000 | | 98,250 |
Level 3 Communications, Inc. term loan 7.4925% 3/13/14 (j) | | 440,000 | | 416,350 |
Paetec Communications, Inc. Tranche B, term loan 7.3219% 2/28/13 (j) | | 19,280 | | 18,895 |
Wind Telecomunicazioni SpA: | | | | |
term loan 12.4488% 12/12/11 pay-in-kind (j) | | 198,733 | | 192,588 |
Tranche 2, term loan 11.3194% 3/21/15 (j) | | 140,000 | | 142,100 |
Floating Rate Loans - continued |
| Principal Amount (d) | | Value |
TELECOMMUNICATION SERVICES - continued |
Diversified Telecommunication Services - continued |
Wind Telecomunicazioni SpA: - continued | | | | |
Tranche B, term loan 7.5694% 9/21/13 (j) | | $ 70,000 | | $ 68,950 |
Tranche C, term loan 8.3194% 9/21/14 (j) | | 70,000 | | 68,950 |
| | 1,006,083 |
Wireless Telecommunication Services - 0.0% |
Leap Wireless International, Inc. Tranche B, term loan 7.83% 6/16/13 (j) | | 39,400 | | 38,858 |
MetroPCS Wireless, Inc. Tranche B, term loan 7.3027% 11/3/13 (j) | | 79,000 | | 75,741 |
| | 114,599 |
TOTAL TELECOMMUNICATION SERVICES | | 1,120,682 |
UTILITIES - 0.2% |
Independent Power Producers & Energy Traders - 0.2% |
Boston Generating LLC Tranche B 1LN, term loan 7.08% 12/20/13 (j) | | 136 | | 128 |
Calpine Corp. Tranche D, term loan 7.08% 3/29/09 (j) | | 416,850 | | 403,302 |
NRG Energy, Inc.: | | | | |
term loan 6.9481% 2/1/13 (j) | | 258,832 | | 245,891 |
6.8481% 2/1/13 (j) | | 119,502 | | 113,527 |
| | 762,848 |
TOTAL FLOATING RATE LOANS (Cost $14,421,308) | 13,704,853 |
Sovereign Loan Participations - 0.1% |
|
Indonesian Republic loan participation: | | | | |
- Citibank: | | | | |
6.25% 3/28/13 (j) | | 36,364 | | 35,636 |
6.25% 12/14/19 (j) | | 71,410 | | 66,590 |
- Credit Suisse First Boston 6.25% 3/28/13 (j) | | 144,607 | | 141,715 |
- Deutsche Bank 1.407% 3/28/13 (j) | JPY | 2,029,270 | | 17,469 |
TOTAL SOVEREIGN LOAN PARTICIPATIONS (Cost $252,471) | 261,410 |
Commercial Paper - 0.8% |
|
Cancara Asset Securitisation Ltd. 4.65% 1/29/08 | EUR | 500,000 | | 727,112 |
DEPFA BANK PLC 4.57% 1/30/08 | EUR | 500,000 | | 727,068 |
|
| Principal Amount (d) | | Value |
Grampian Funding Ltd. 4.65% 1/25/08 | EUR | 500,000 | | $ 726,907 |
HSH Nordbank AG 4.58% 1/30/08 | EUR | 500,000 | | 726,921 |
TOTAL COMMERCIAL PAPER (Cost $2,868,423) | 2,908,008 |
Fixed-Income Funds - 5.2% |
| | Shares | | |
Fidelity Floating Rate Central Fund (k)
(Cost $19,680,777) | | 195,466 | | 18,711,933 |
Preferred Securities - 0.7% |
| | Principal Amount (d) | | |
CONSUMER DISCRETIONARY - 0.4% |
Media - 0.4% |
Globo Comunicacoes e Participacoes SA 9.375% | | $ 800,000 | | 824,878 |
Net Servicos de Comunicacao SA 9.25% (g) | | 400,000 | | 410,319 |
| | | 1,235,197 |
ENERGY - 0.3% |
Oil, Gas & Consumable Fuels - 0.3% |
Pemex Project Funding Master Trust 7.75% | | 1,214,000 | | 1,228,388 |
FINANCIALS - 0.0% |
Diversified Financial Services - 0.0% |
MUFG Capital Finance 2 Ltd. 4.85% (j) | EUR | 50,000 | | 62,932 |
TOTAL PREFERRED SECURITIES (Cost $2,521,916) | | 2,526,517 |
Other - 0.0% |
Delta Air Lines ALPA Claim (a) (Cost $5,668) | | 470,000 | | 22,325 |
Money Market Funds - 11.8% |
| | Shares | | |
Fidelity Cash Central Fund, 4.58% (b)
(Cost $42,125,340) | | 42,125,340 | | 42,125,340 |
TOTAL INVESTMENT PORTFOLIO - 106.0% (Cost $378,966,185) | | | 378,413,899 |
NET OTHER ASSETS - (6.0)% | | | (21,399,022) |
NET ASSETS - 100% | | $ 357,014,877 |
Swap Agreements |
| Expiration Date | | Notional Amount | | Value |
Interest Rate Swaps |
Receive semi-annually a fixed rate equal to 4.807% and pay quarterly a floating rate based on 3-month LIBOR with JPMorgan Chase, Inc. | Sept. 2009 | | $ 2,000,000 | | $ 53,045 |
Receive semi-annually a fixed rate equal to 3.967% and pay quarterly a floating rate based on 3-month LIBOR with Citibank | Dec. 2009 | | 600,000 | | 1,401 |
Receive semi-annually a fixed rate equal to 4.64% and pay quarterly a floating rate based on 3-month LIBOR with Morgan Stanley, Inc. | Oct. 2009 | | 3,700,000 | | 43,250 |
Receive semi-annually a fixed rate equal to 4.681% and pay quarterly a floating rate based on a 3-month LIBOR with JPMorgan Chase, Inc. | Sept. 2009 | | 1,800,000 | | 43,565 |
Receive semi-annually a fixed rate equal to 4.915% and pay quarterly a floating rate based on 3-month LIBOR with Credit Suisse First Boston | August 2009 | | 4,500,000 | | 129,672 |
Receive semi-annually a fixed rate equal to 5.37% and pay quarterly a floating rate based on 3-month LIBOR with Credit Suisse First Boston | July 2009 | | 1,600,000 | | 57,207 |
Currency Abbreviations |
BRL | - | Brazilian real |
CAD | - | Canadian dollar |
EGP | - | Egyptian pound |
EUR | - | European Monetary Unit |
GBP | - | British pound |
JPY | - | Japanese yen |
PEN | - | Peruvian new sol |
RUB | - | Russian ruble |
UYU | - | Uruguay peso |
Legend |
(a) Non-income producing |
(b) Affiliated fund that is available only to investment companies and other accounts managed by Fidelity Investments. The rate quoted is the annualized seven-day yield of the fund at period end. A complete unaudited listing of the fund's holdings as of its most recent quarter end is available upon request. |
(c) Non-income producing - Issuer is in default. |
(d) Principal amount is stated in United States dollars unless otherwise noted. |
(e) Security initially issued in zero coupon form which converts to coupon form at a specified rate and date. The rate shown is the rate at period end. |
(f) Security initially issued at one coupon which converts to a higher coupon at a specified date. The rate shown is the rate at period end. |
(g) Security exempt from registration under Rule 144A of the Securities Act of 1933. These securities may be resold in transactions exempt from registration, normally to qualified institutional buyers. At the end of the period, the value of these securities amounted to $28,655,999 or 8.0% of net assets. |
(h) Security or a portion of the security purchased on a delayed delivery or when-issued basis. |
(i) A portion of the security is subject to a forward commitment to sell. |
(j) The coupon rate shown on floating or adjustable rate securities represents the rate at period end. |
(k) Affiliated fund that is available only to investment companies and other accounts managed by Fidelity Investments. A complete schedule of portfolio holdings for each Fidelity Central Fund is filed with the SEC for the first and third quarters of each fiscal year on Form N-Q and is available upon request or at the SEC's web site at www.sec.gov. A holdings listing for the Fund, which presents direct holdings as well as the pro rata share of securities and other investments held indirectly through its investment in underlying non-money market Fidelity Central Funds, is available at advisor.fidelity.com. In addition, each Fidelity Central Fund's financial statements, which are not covered by the Fund's Report of Independent Registered Public Accounting Firm, are available on the SEC's web site or upon request. |
(l) Restricted securities - Investment in securities not registered under the Securities Act of 1933 (excluding 144A issues). At the end of the period, the value of restricted securities (excluding 144A issues) amounted to $1,260 or 0.0% of net assets. |
Additional information on each holding is as follows: |
Security | Acquisition Date | Acquisition Cost |
ASAT Holdings Ltd. warrants 2/1/11 | 11/15/07 | $ 0 |
Intermet Corp. | 11/09/05 | 115,372 |
(m) Position represents an unfunded loan commitment. At period end, the total principal amount and market value of unfunded commitments totaled $29,633 and $28,765, respectively. The coupon rate will be determined at time of settlement. |
Affiliated Central Funds |
Information regarding fiscal year to date income earned by the Fund from investments in Fidelity Central Funds is as follows: |
Fund | Income earned |
Fidelity Cash Central Fund | $ 1,693,754 |
Fidelity Floating Rate Central Fund | 1,261,953 |
Total | $ 2,955,707 |
|
Additional information regarding the Fund's fiscal year to date purchases and sales, including the ownership percentage, of the non Money Market Central Funds is as follows: |
Fund | Value,
beginning of period | Purchases | Sales Proceeds | Value,
end of
period | % ownership, end of
period |
Fidelity Floating Rate Central Fund | $ 6,927,920 | $ 12,774,734 | $ - | $ 18,711,933 | 0.8% |
Other Information |
Distribution of investments by country of issue, as a percentage of total net assets, is as follows: |
United States of America | 69.7% |
Germany | 3.8% |
Canada | 3.4% |
United Kingdom | 2.9% |
Japan | 2.7% |
Argentina | 2.0% |
Venezuela | 1.6% |
Russia | 1.6% |
France | 1.4% |
Brazil | 1.1% |
Luxembourg | 1.1% |
Others (individually less than 1%) | 8.7% |
| 100.0% |
The information in the above table is based on the combined investments of the fund and its pro-rata share of the investments of Fidelity's fixed-income central funds. |
See accompanying notes which are an integral part of the financial statements.
Annual Report
Financial Statements
Statement of Assets and Liabilities
| December 31, 2007 |
| | |
Assets | | |
Investment in securities, at value - See accompanying schedule: Unaffiliated issuers (cost $317,160,068) | $ 317,576,626 | |
Fidelity Central Funds (cost $61,806,117) | 60,837,273 | |
Total Investments (cost $378,966,185) | | $ 378,413,899 |
Commitment to sell securities on a delayed delivery basis | (10,635,672) | |
Receivable for securities sold on a delayed delivery basis | 10,669,438 | 33,766 |
Receivable for investments sold, regular delivery | | 548,273 |
Foreign currency held at value (cost $7,799) | | 7,800 |
Receivable for fund shares sold | | 425,173 |
Dividends receivable | | 1,860 |
Interest receivable | | 4,457,922 |
Distributions receivable from Fidelity Central Funds | | 260,941 |
Swap agreements, at value | | 328,140 |
Prepaid expenses | | 1,048 |
Other receivables | | 1,458 |
Total assets | | 384,480,280 |
| | |
Liabilities | | |
Payable to custodian bank | $ 8,091 | |
Payable for investments purchased
Regular delivery | 1,555,876 | |
Delayed delivery | 25,613,308 | |
Payable for fund shares redeemed | 691 | |
Accrued management fee | 165,221 | |
Distribution fees payable | 1,282 | |
Other affiliated payables | 45,220 | |
Other payables and accrued expenses | 75,714 | |
Total liabilities | | 27,465,403 |
| | |
Net Assets | | $ 357,014,877 |
Net Assets consist of: | | |
Paid in capital | | $ 354,955,443 |
Undistributed net investment income | | 212,070 |
Accumulated undistributed net realized gain (loss) on investments and foreign currency transactions | | 2,026,179 |
Net unrealized appreciation (depreciation) on investments and assets and liabilities in foreign currencies | | (178,815) |
Net Assets | | $ 357,014,877 |
Statement of Assets and Liabilities - continued
| December 31, 2007 |
| | |
Initial Class:
Net Asset Value, offering price and redemption price per share ($119,524,382 ÷ 11,239,246 shares) | | $ 10.63 |
| | |
Service Class:
Net Asset Value, offering price and redemption price per share ($4,444,508 ÷ 418,914 shares) | | $ 10.61 |
| | |
Service Class 2:
Net Asset Value, offering price and redemption price per share ($4,417,780 ÷ 416,522 shares) | | $ 10.61 |
| | |
Investor Class:
Net Asset Value, offering price and redemption price per share ($228,628,207 ÷ 21,530,245 shares) | | $ 10.62 |
See accompanying notes which are an integral part of the financial statements.
Annual Report
Financial Statements - continued
Statement of Operations
| Year ended December 31, 2007 |
| | |
Investment Income | | |
Dividends | | $ 243,679 |
Interest | | 15,837,175 |
Income from Fidelity Central Funds | | 2,955,707 |
Total income | | 19,036,561 |
| | |
Expenses | | |
Management fee | $ 1,729,962 | |
Transfer agent fees | 337,366 | |
Distribution fees | 15,047 | |
Accounting fees and expenses | 126,840 | |
Custodian fees and expenses | 50,596 | |
Independent trustees' compensation | 1,027 | |
Audit | 63,074 | |
Legal | 2,642 | |
Interest | 2,956 | |
Miscellaneous | 42,341 | |
Total expenses before reductions | 2,371,851 | |
Expense reductions | (4,410) | 2,367,441 |
Net investment income | | 16,669,120 |
Realized and Unrealized Gain (Loss) Net realized gain (loss) on: | | |
Investment securities: | | |
Unaffiliated issuers | 5,286,934 | |
Foreign currency transactions | 162,256 | |
Swap agreements | (27,115) | |
Total net realized gain (loss) | | 5,422,075 |
Change in net unrealized appreciation (depreciation) on: Investment securities | (5,870,492) | |
Assets and liabilities in foreign currencies | 3,298 | |
Swap agreements | 328,140 | |
Delayed delivery commitments | 33,766 | |
Total change in net unrealized appreciation (depreciation) | | (5,505,288) |
Net gain (loss) | | (83,213) |
Net increase (decrease) in net assets resulting from operations | | $ 16,585,907 |
Statement of Changes in Net Assets
| Year ended
December 31, 2007 | Year ended
December 31, 2006 |
Increase (Decrease) in Net Assets | | |
Operations | | |
Net investment income | $ 16,669,120 | $ 10,601,704 |
Net realized gain (loss) | 5,422,075 | 881,056 |
Change in net unrealized appreciation (depreciation) | (5,505,288) | 3,792,585 |
Net increase (decrease) in net assets resulting from operations | 16,585,907 | 15,275,345 |
Distributions to shareholders from net investment income | (16,342,786) | (10,266,586) |
Distributions to shareholders from net realized gain | (4,239,380) | (522,209) |
Total distributions | (20,582,166) | (10,788,795) |
Share transactions - net increase (decrease) | 124,454,523 | 66,412,828 |
Total increase (decrease) in net assets | 120,458,264 | 70,899,378 |
| | |
Net Assets | | |
Beginning of period | 236,556,613 | 165,657,235 |
End of period (including undistributed net investment income of $212,070 and undistributed net investment
income of $434,688, respectively) | $ 357,014,877 | $ 236,556,613 |
See accompanying notes which are an integral part of the financial statements.
Annual Report
Financial Highlights - Initial Class
Years ended December 31, | 2007 | 2006 | 2005 | 2004 | 2003 H |
Selected Per-Share Data | | | | | |
Net asset value, beginning of period | $ 10.70 | $ 10.40 | $ 10.61 | $ 10.00 | $ 10.00 |
Income from Investment Operations | | | | | |
Net investment income E | .600 | .579 | .552 | .510 | .003 |
Net realized and unrealized gain (loss) | (.007) | .239 | (.226) | .355 | (.003) |
Total from investment operations | .593 | .818 | .326 | .865 | - |
Distributions from net investment income | (.523) | (.493) | (.451) | (.245) | - |
Distributions from net realized gain | (.140) | (.025) | (.085) | (.010) | - |
Total distributions | (.663) | (.518) | (.536) | (.255) | - |
Net asset value, end of period | $ 10.63 | $ 10.70 | $ 10.40 | $ 10.61 | $ 10.00 |
Total Return B,C,D | 5.59% | 7.87% | 3.10% | 8.66% | .00% |
Ratios to Average Net Assets F,I | | | | | |
Expenses before reductions | .73% | .74% | .75% | .85% | 10.00% A |
Expenses net of fee waivers, if any | .73% | .74% | .75% | .85% | 1.00% A |
Expenses net of all reductions | .73% | .74% | .75% | .84% | 1.00% A |
Net investment income | 5.49% | 5.40% | 5.19% | 5.02% | 1.36% A |
Supplemental Data | | | | | |
Net assets, end of period (000 omitted) | $ 119,524 | $ 123,870 | $ 135,352 | $ 94,154 | $ 3,001 |
Portfolio turnover rate G | 152% | 83% | 100% | 78% | 0% |
A Annualized
B Total returns for periods of less than one year are not annualized.
C Total returns do not reflect charges attributable to your insurance company's separate account. Inclusion of these charges would reduce the total returns shown.
D Total returns would have been lower had certain expenses not been reduced during the periods shown.
E Calculated based on average shares outstanding during the period.
F Fees and expenses of the underlying Fidelity Central Funds are not included in the Fund's expense ratio. The Fund indirectly bears its proportionate share of the expenses of any underlying Fidelity Central Funds.
G Amount does not include the portfolio activity of any underlying Fidelity Central Funds.
H For the period December 23, 2003 (commencement of operations) to December 31, 2003.
I Expense ratios reflect operating expenses of the class. Expenses before reductions do not reflect amounts reimbursed by the investment adviser or reductions from brokerage service arrangements or other expense offset arrangements and do not represent the amount paid by the class during periods when reimbursements or reductions occur. Expense ratios before reductions for start-up periods may not be representative of longer-term operating periods. Expenses net of fee waivers reflect expenses after reimbursement by the investment adviser but prior to reductions from brokerage service arrangements or other expense offset arrangements. Expenses net of all reductions represent the net expenses paid by the class.
Financial Highlights - Service Class
Years ended December 31, | 2007 | 2006 | 2005 | 2004 | 2003 H |
Selected Per-Share Data | | | | | |
Net asset value, beginning of period | $ 10.68 | $ 10.38 | $ 10.59 | $ 10.00 | $ 10.00 |
Income from Investment Operations | | | | | |
Net investment income E | .588 | .567 | .541 | .485 | .003 |
Net realized and unrealized gain (loss) | (.005) | .241 | (.225) | .355 | (.003) |
Total from investment operations | .583 | .808 | .316 | .840 | - |
Distributions from net investment income | (.513) | (.483) | (.441) | (.240) | - |
Distributions from net realized gain | (.140) | (.025) | (.085) | (.010) | - |
Total distributions | (.653) | (.508) | (.526) | (.250) | - |
Net asset value, end of period | $ 10.61 | $ 10.68 | $ 10.38 | $ 10.59 | $ 10.00 |
Total Return B,C,D | 5.51% | 7.78% | 3.01% | 8.41% | .00% |
Ratios to Average Net Assets F,I | | | | | |
Expenses before reductions | .83% | .84% | .85% | 1.15% | 10.10% A |
Expenses net of fee waivers, if any | .83% | .84% | .85% | 1.10% | 1.10% A |
Expenses net of all reductions | .82% | .84% | .85% | 1.10% | 1.10% A |
Net investment income | 5.39% | 5.30% | 5.09% | 4.77% | 1.26% A |
Supplemental Data | | | | | |
Net assets, end of period (000 omitted) | $ 4,445 | $ 4,211 | $ 3,907 | $ 3,795 | $ 3,501 |
Portfolio turnover rate G | 152% | 83% | 100% | 78% | 0% |
A Annualized
B Total returns for periods of less than one year are not annualized.
C Total returns do not reflect charges attributable to your insurance company's separate account. Inclusion of these charges would reduce the total returns shown.
D Total returns would have been lower had certain expenses not been reduced during the periods shown.
E Calculated based on average shares outstanding during the period.
F Fees and expenses of the underlying Fidelity Central Funds are not included in the Fund's expense ratio. The Fund indirectly bears its proportionate share of the expenses of any underlying Fidelity Central Funds.
G Amount does not include the portfolio activity of any underlying Fidelity Central Funds.
H For the period December 23, 2003 (commencement of operations) to December 31, 2003.
I Expense ratios reflect operating expenses of the class. Expenses before reductions do not reflect amounts reimbursed by the investment adviser or reductions from brokerage service arrangements or other expense offset arrangements and do not represent the amount paid by the class during periods when reimbursements or reductions occur. Expense ratios before reductions for start-up periods may not be representative of longer-term operating periods. Expenses net of fee waivers reflect expenses after reimbursement by the investment adviser but prior to reductions from brokerage service arrangements or other expense offset arrangements. Expenses net of all reductions represent the net expenses paid by the class.
See accompanying notes which are an integral part of the financial statements.
Annual Report
Financial Highlights - Service Class 2
Years ended December 31, | 2007 | 2006 | 2005 | 2004 | 2003 I |
Selected Per-Share Data | | | | | |
Net asset value, beginning of period | $ 10.67 | $ 10.38 | $ 10.59 | $ 10.00 | $ 10.00 |
Income from Investment Operations | | | | | |
Net investment income E | .571 | .551 | .524 | .469 | .003 |
Net realized and unrealized gain (loss) | .005 H | .232 | (.224) | .356 | (.003) |
Total from investment operations | .576 | .783 | .300 | .825 | - |
Distributions from net investment income | (.496) | (.468) | (.425) | (.225) | - |
Distributions from net realized gain | (.140) | (.025) | (.085) | (.010) | - |
Total distributions | (.636) | (.493) | (.510) | (.235) | - |
Net asset value, end of period | $ 10.61 | $ 10.67 | $ 10.38 | $ 10.59 | $ 10.00 |
Total Return B,C,D | 5.45% | 7.54% | 2.86% | 8.26% | .00% |
Ratios to Average Net Assets F,J | | | | | |
Expenses before reductions | .98% | .99% | 1.00% | 1.30% | 10.25% A |
Expenses net of fee waivers, if any | .98% | .99% | 1.00% | 1.25% | 1.25% A |
Expenses net of all reductions | .97% | .99% | 1.00% | 1.25% | 1.25% A |
Net investment income | 5.24% | 5.15% | 4.94% | 4.62% | 1.11% A |
Supplemental Data | | | | | |
Net assets, end of period (000 omitted) | $ 4,418 | $ 4,192 | $ 3,895 | $ 3,789 | $ 3,500 |
Portfolio turnover rate G | 152% | 83% | 100% | 78% | 0% |
A Annualized
B Total returns for periods of less than one year are not annualized.
C Total returns do not reflect charges attributable to your insurance company's separate account. Inclusion of these charges would reduce the total returns shown.
D Total returns would have been lower had certain expenses not been reduced during the periods shown.
E Calculated based on average shares outstanding during the period.
F Fees and expenses of the underlying Fidelity Central Funds are not included in the Fund's expense ratio. The Fund indirectly bears its proportionate share of the expenses of any underlying Fidelity Central Funds.
G Amount does not include the portfolio activity of any underlying Fidelity Central Funds.
H The amount shown for a share outstanding does not correspond with the aggregate net gain (loss) on investments for the period due to the timing of sales and repurchases of shares in relation to fluctuating market values of the investments of the Fund.
I For the period December 23, 2003 (commencement of operations) to December 31, 2003.
J Expense ratios reflect operating expenses of the class. Expenses before reductions do not reflect amounts reimbursed by the investment adviser or reductions from brokerage service arrangements or other expense offset arrangements and do not represent the amount paid by the class during periods when reimbursements or reductions occur. Expense ratios before reductions for start-up periods may not be representative of longer-term operating periods. Expenses net of fee waivers reflect expenses after reimbursement by the investment adviser but prior to reductions from brokerage service arrangements or other expense offset arrangements. Expenses net of all reductions represent the net expenses paid by the class.
Financial Highlights - Investor Class
Years ended December 31, | 2007 | 2006 | 2005 H |
Selected Per-Share Data | | | |
Net asset value, beginning of period | $ 10.69 | $ 10.39 | $ 10.69 |
Income from Investment Operations | | | |
Net investment income E | .591 | .570 | .235 |
Net realized and unrealized gain (loss) | (.003) | .246 | (.065) |
Total from investment operations | .588 | .816 | .170 |
Distributions from net investment income | (.518) | (.491) | (.450) |
Distributions from net realized gain | (.140) | (.025) | (.020) |
Total distributions | (.658) | (.516) | (.470) |
Net asset value, end of period | $ 10.62 | $ 10.69 | $ 10.39 |
Total Return B,C,D | 5.55% | 7.85% | 1.59% |
Ratios to Average Net Assets F,I | | | |
Expenses before reductions | .80% | .82% | .86% A |
Expenses net of fee waivers, if any | .80% | .82% | .85% A |
Expenses net of all reductions | .80% | .82% | .85% A |
Net investment income | 5.41% | 5.32% | 5.09% A |
Supplemental Data | | | |
Net assets, end of period (000 omitted) | $ 228,628 | $ 104,283 | $ 22,502 |
Portfolio turnover rate G | 152% | 83% | 100% |
A Annualized
B Total returns for periods of less than one year are not annualized.
C Total returns do not reflect charges attributable to your insurance company's separate account. Inclusion of these charges would reduce the total returns shown.
D Total returns would have been lower had certain expenses not been reduced during the periods shown.
E Calculated based on average shares outstanding during the period.
F Fees and expenses of the underlying Fidelity Central Funds are not included in the Fund's expense ratio. The Fund indirectly bears its proportionate share of the expenses of any underlying Fidelity Central Funds.
G Amount does not include the portfolio activity of any underlying Fidelity Central Funds.
H For the period July 21, 2005 (commencement of sale of shares) to December 31, 2005.
I Expense ratios reflect operating expenses of the class. Expenses before reductions do not reflect amounts reimbursed by the investment adviser or reductions from brokerage service arrangements or other expense offset arrangements and do not represent the amount paid by the class during periods when reimbursements or reductions occur. Expense ratios before reductions for start-up periods may not be representative of longer-term operating periods. Expenses net of fee waivers reflect expenses after reimbursement by the investment adviser but prior to reductions from brokerage service arrangements or other expense offset arrangements. Expenses net of all reductions represent the net expenses paid by the class.
See accompanying notes which are an integral part of the financial statements.
Annual Report
Notes to Financial Statements
For the period ended December 31, 2007
1. Organization.
VIP Strategic Income Portfolio (the Fund) is a fund of Variable Insurance Products Fund V (the trust) (formerly of Variable Insurance Products IV) and is authorized to issue an unlimited number of shares. Effective, April 19, 2007, the Board of Trustees approved an Agreement and Plan of Reorganization whereby the Fund reorganized into Variable Insurance Products Fund V effective June 29, 2007 (Trust Reorganization). The Trust Reorganization does not impact the Fund's investment strategies or Fidelity Management & Research Company's (FMR) management of the Fund. The trust is registered under the Investment Company Act of 1940, as amended (the 1940 Act), as an open-end management investment company organized as a Massachusetts business trust. Shares of the Fund may only be purchased by insurance companies for the purpose of funding variable annuity or variable life insurance contracts. The Fund offers the following classes of shares: Initial Class shares, Service Class shares, Service Class 2 shares, and Investor Class shares. All classes have equal rights and voting privileges, except for matters affecting a single class. Investment income, realized and unrealized capital gains and losses, the common expenses of the Fund, and certain fund-level expense reductions, if any, are allocated on a pro rata basis to each class based on the relative net assets of each class to the total net assets of the Fund. Each class differs with respect to transfer agent and distribution and service plan fees incurred. Certain expense reductions also differ by class.
2. Investments in Fidelity Central Funds.
The Fund may invest in Fidelity Central Funds, which are open-end investment companies available only to other investment companies and accounts managed by FMR and its affiliates. The Fund's Schedule of Investments lists each of the Fidelity Central Funds as an investment of the Fund, but does not include the underlying holdings of each Fidelity Central Fund. As an Investing Fund, the Fund indirectly bears its proportionate share of the expenses of the underlying Fidelity Central Funds.
Based on their investment objective, each Fidelity Central Fund may invest or participate in various investment vehicles or strategies that are similar to those of the Fund. These strategies are consistent with the investment objectives of the Fund and may involve certain economic risks which may cause a decline in value of each of the Fidelity Central Funds and thus a decline in the value of the Fund. The Money Market Central Funds seek preservation of capital and current income and are managed by Fidelity Investments Money Management, Inc. (FIMM), an affiliate of FMR. The following summarizes the Fund's investment in each Fidelity Central Fund.
Central Fund | | Investment Adviser | | Investment Objective | | Investment Practices |
Fidelity Floating Rate Central Fund | | Fidelity Management and Research Company, Inc. (FMRC) | | Seeks a high level of income by normally investing in floating rate loans and other floating rate securities. | | Loans & Direct Debt Instruments Repurchase Agreements Restricted Securities |
A holdings listing for the Fund, which presents direct holdings as well as the pro rata share of any securities and other investments held indirectly through its investment in underlying non-money market Fidelity Central Funds, is available at advisor.fidelity.com. A complete list of holdings for each Fidelity Central Fund is available upon request or at the SEC's web site at www.sec.gov. In addition, the financial statements of the Fidelity Central Funds, which are not covered by the Fund's Report of Independent Registered Public Accounting Firm, are available on the SEC's web site or upon request.
3. Significant Accounting Policies.
The financial statements have been prepared in conformity with accounting principles generally accepted in the United States of America, which require management to make certain estimates and assumptions at the date of the financial statements. The following summarizes the significant accounting policies of the Fund:
Security Valuation. Investments are valued and net asset value per share is calculated (NAV calculation) as of the close of business of the New York Stock Exchange, normally 4:00 p.m. Eastern time. Wherever possible, the Fund uses independent pricing services approved by the Board of Trustees to value its investments. Debt securities, including restricted securities, for which quotations are readily available, are valued by independent pricing services or by dealers who make markets in such securities. Pricing services consider yield or price of bonds of comparable quality, coupon, maturity and type as well as dealer supplied prices. Equity securities, including restricted securities, for which market quotations are readily available, are valued at the last reported sale price or official closing price as reported by an independent pricing service on the primary market or exchange on which they are traded. In the event there were no sales during the day or closing prices are not available, securities are valued at the last quoted bid price.
Annual Report
Notes to Financial Statements - continued
3. Significant Accounting Policies - continued
Security Valuation - continued
When current market prices or quotations are not readily available or do not accurately reflect fair value, valuations may be determined in accordance with procedures adopted by the Board of Trustees. The frequency of when fair value pricing is used is unpredictable. The value of securities used for NAV calculation under fair value pricing may differ from published prices for the same securities. Investments in open-end mutual funds, including the Fidelity Central Funds, are valued at their closing net asset value each business day. Short-term securities with remaining maturities of sixty days or less for which quotations are not readily available are valued at amortized cost, which approximates value.
Foreign Currency. The Fund uses foreign currency contracts to facilitate transactions in foreign-denominated securities. Losses from these transactions may arise from changes in the value of the foreign currency or if the counterparties do not perform under the contracts' terms.
Foreign-denominated assets, including investment securities, and liabilities are translated into U.S. dollars at the exchange rate at period end. Purchases and sales of investment securities, income and dividends received and expenses denominated in foreign currencies are translated into U.S. dollars at the exchange rate in effect on the transaction date.
The effects of exchange rate fluctuations on investments are included with the net realized and unrealized gain (loss) on investment securities. Other foreign currency transactions resulting in realized and unrealized gain (loss) are disclosed separately.
Investment Transactions and Income. For financial reporting purposes, the Fund's investment holdings and NAV include trades executed through the end of the last business day of the period. The NAV for processing shareholder transactions includes trades executed through the end of the prior business day. Gains and losses on securities sold are determined on the basis of identified cost. Dividend income is recorded on the ex-dividend date, except for certain dividends from foreign securities where the ex-dividend date may have passed, which are recorded as soon as the Fund is informed of the ex-dividend date. Non-cash dividends included in dividend income, if any, are recorded at the fair market value of the securities received. Distributions received on securities that represent a return of capital or capital gain are recorded as a reduction of cost of investments and/or as a realized gain. The Fund estimates the components of distributions received that may be considered return of capital distributions or capital gain distributions. Interest income and distributions from the Fidelity Central Funds are accrued as earned. Interest income includes coupon interest and amortization of premium and accretion of discount on debt securities. Investment income is recorded net of foreign taxes withheld where recovery of such taxes is uncertain. Debt obligations may be placed on non-accrual status and related interest income may be reduced by ceasing current accruals and writing off interest receivables when the collection of all or a portion of interest has become doubtful based on consistently applied procedures. A debt obligation is removed from non-accrual status when the issuer resumes interest payments or when collectibility of interest is reasonably assured.
Expenses. Most expenses of the trust can be directly attributed to a fund. Expenses which cannot be directly attributed are apportioned among each Fund in the trust. Expense estimates are accrued in the period to which they relate and adjustments are made when actual amounts are known. All legal and other expenses associated with the Trust Reorganization will be paid by FMR.
Income Tax Information and Distributions to Shareholders. Each year, the Fund intends to qualify as a regulated investment company by distributing substantially all of its taxable income and realized gains under Subchapter M of the Internal Revenue Code and filing its U.S. federal tax return. As a result, no provision for income taxes is required. The Fund adopted the provisions of FASB Interpretation No. 48, Accounting for Uncertainties in Income Taxes (FIN 48), on June 29, 2007. FIN 48 sets forth a minimum threshold for financial statement recognition of the benefit of a tax position taken or expected to be taken in a tax return. The implementation of FIN 48 did not result in any unrecognized tax benefits in the accompanying financial statements. Each of the Fund's federal tax returns for the prior three fiscal years remains subject to examination by the Internal Revenue Service. Foreign taxes are provided for based on the Fund's understanding of the tax rules and rates that exist in the foreign markets in which it invests.
Distributions are recorded on the ex-dividend date. Income dividends and capital gain distributions are declared separately for each class. Income and capital gain distributions are determined in accordance with income tax regulations, which may differ from generally accepted accounting principles.
Capital accounts within the financial statements are adjusted for permanent book-tax differences. Certain adjustments have been made to the accounts relating to prior periods. Collectively, these adjustments have no impact on net assets or the results of operations. Temporary book-tax differences will reverse in a subsequent period.
Book-tax differences are primarily due to swap agreements, foreign currency transactions, market discount, partnerships (including allocations from Fidelity Central Funds) and losses deferred due to wash sales and excise tax regulations.
Annual Report
3. Significant Accounting Policies - continued
Income Tax Information and Distributions to Shareholders - continued
The tax-basis components of distributable earnings and the federal tax cost as of period end were as follows:
Unrealized appreciation | $ 7,070,437 | |
Unrealized depreciation | (6,751,715) | |
Net unrealized appreciation (depreciation) | 318,722 | |
Undistributed ordinary income | 1,313,011 | |
Undistributed long-term capital gain | 427,710 | |
| | |
Cost for federal income tax purposes | $ 378,095,177 | |
The tax character of distributions paid was as follows:
| December 31, 2007 | December 31, 2006 |
Ordinary Income | $ 20,234,768 | $ 10,475,470 |
Long-term Capital Gains | 347,398 | 313,325 |
Total | $ 20,582,166 | $ 10,788,795 |
New Accounting Pronouncement. In September 2006, Statement of Financial Accounting Standards No. 157, Fair Value Measurements (SFAS 157), was issued and is effective for fiscal years beginning after November 15, 2007. SFAS 157 defines fair value, establishes a framework for measuring fair value and expands disclosures about fair value measurements. Management is currently evaluating the impact the adoption of SFAS 157 will have on the Fund's financial statement disclosures.
4. Operating Policies.
Repurchase Agreements. FMR has received an Exemptive Order from the Securities and Exchange Commission (the SEC) which permits the Fund and other affiliated entities of FMR to transfer uninvested cash balances into joint trading accounts which are then invested in repurchase agreements. The Fund may also invest directly with institutions in repurchase agreements. Repurchase agreements are collateralized by government or non-government securities. Upon settlement date, collateral is held in segregated accounts with custodian banks and may be obtained in the event of a default of the counterparty. The Fund monitors, on a daily basis, the value of the collateral to ensure it is at least equal to the principal amount of the repurchase agreement (including accrued interest). In the event of a default by the counterparty, realization of the collateral proceeds could be delayed, during which time the value of the collateral may decline.
Delayed Delivery Transactions and When-Issued Securities. The Fund may purchase or sell securities on a delayed delivery or when-issued basis. Payment and delivery may take place after the customary settlement period for that security. The price of the underlying securities and the date when the securities will be delivered and paid for are fixed at the time the transaction is negotiated. During the time a delayed delivery sell is outstanding, the contract is marked-to-market daily and equivalent deliverable securities are held for the transaction. The value of the securities purchased on a delayed delivery or when-issued basis are identified as such in the Fund's Schedule of Investments. The value of the securities purchased on a delayed delivery or when-issued basis are identified as such in each applicable Fund's Schedule of Investments. The Fund may receive compensation for interest forgone in the purchase of a delayed delivery or when-issued security. With respect to purchase commitments, the Fund identifies securities as segregated in its records with a value at least equal to the amount of the commitment. The payables and receivables associated with the purchases and sales of delayed delivery securities having the same coupon, settlement date and broker are offset. Delayed delivery or when-issued securities that have been purchased from and sold to different brokers are reflected as both payables and receivables in the Fund's Statement of Assets and Liabilities under the caption "Delayed delivery." Losses may arise due to changes in the value of the underlying securities or if the counterparty does not perform under the contract's terms, or if the issuer does not issue the securities due to political, economic, or other factors.
Restricted Securities. The Fund may invest in securities that are subject to legal or contractual restrictions on resale. These securities generally may be resold in transactions exempt from registration or to the public if the securities are registered. Disposal of these securities may involve time-consuming negotiations and expense, and prompt sale at an acceptable price may be difficult. Information regarding restricted securities is included at the end of the Fund's Schedule of Investments.
Loans and Other Direct Debt Instruments. The Fund may invest in loans and loan participations, trade claims or other receivables. These investments may include standby financing commitments, including revolving credit facilities, that obligate the Fund to supply additional cash to the borrower on demand. Loan participations involve a risk of insolvency of the lending bank or other financial intermediary. The Fund may be contractually obligated to receive approval from the agent bank and/or borrower prior to the sale of these investments.
Swap Agreements. The Fund may invest in swaps for the purpose of managing its exposure to interest rate, credit or market risk.
Interest rate swaps are agreements to exchange cash flows periodically based on a notional principal amount, for example, the exchange of fixed rate interest payments for floating rate interest payments. The primary risk associated with interest rate swaps is that unfavorable changes in the fluctuation of interest rates could adversely impact a fund.
Annual Report
Notes to Financial Statements - continued
4. Operating Policies - continued
Swap Agreements - continued
Swaps are marked-to-market daily based on dealer-supplied valuations and changes in value are recorded as unrealized appreciation (depreciation). Periodic payments received or made by the Fund are recorded in the accompanying Statement of Operations as realized gains or losses, respectively. Gains or losses are realized upon early termination of the swap agreement. Collateral, in the form of cash or securities, may be required to be held in segregated accounts with a fund's custodian in compliance with swap contracts. Risks may exceed amounts recognized on the Statement of Assets and Liabilities. These risks include changes in the returns of the underlying instruments, failure of the counterparties to perform under the contracts' terms and the possible lack of liquidity with respect to the swap agreements. Details of swap agreements open at period end are included in the Fund's Schedule of Investments under the caption "Swap Agreements".
5. Purchases and Sales of Investments.
Purchases and sales of securities (including the Fixed-Income Central Funds), other than short-term securities and U.S. government securities, aggregated $208,100,289 and $145,320,242, respectively.
6. Fees and Other Transactions with Affiliates.
Management Fee. FMR and its affiliates provide the Fund with investment management related services for which the Fund pays a monthly management fee. The management fee is the sum of an individual fund fee rate that is based on an annual rate of .45% of the Fund's average net assets and a group fee rate that averaged .12% during the period. The group fee rate is based upon the average net assets of all the mutual funds advised by FMR. The group fee rate decreases as assets under management increase and increases as assets under management decrease. For the period, the total annual management fee rate was .56% of the Fund's average net assets.
Distribution and Service Plan. In accordance with Rule 12b-1 of the 1940 Act, the Fund has adopted separate 12b-1 Plans for each Service Class of shares. Each Service Class pays Fidelity Distributors Corporation (FDC), an affiliate of FMR, a service fee. For the period, the service fee is based on an annual rate of .10% of Service Class' average net assets and .25% of Service Class 2's average net assets.
For the period, each class paid FDC the following amounts, all of which were re-allowed to insurance companies for the distribution of shares and providing shareholder support services:
Service Class | $ 4,315 | |
Service Class 2 | 10,732 | |
| $ 15,047 | |
Transfer Agent Fees. Fidelity Investments Institutional Operations Company, Inc. (FIIOC), an affiliate of FMR, is the Fund's transfer, dividend disbursing, and shareholder servicing agent. FIIOC receives an asset-based fee with respect to each class. Each class with the exception of Investor Class pays a transfer agent fee, excluding out of pocket expenses, equal to an annual rate of .07% of average net assets. Investor Class pays a monthly asset-based transfer agent fee of .14% of average net assets. The total transfer agent fees paid by each class to FIIOC, including out of pocket expenses, were as follows:
Initial Class | $ 84,510 | |
Service Class | 2,849 | |
Service Class 2 | 2,833 | |
Investor Class | 247,174 | |
| $ 337,366 | |
Effective February 1, 2008, the Board of Trustees approved a decrease to Investor Class' asset-based fee from .14% to .10% of average net assets.
Accounting Fees. Fidelity Service Company, Inc. (FSC), an affiliate of FMR, maintains the Fund's accounting records. The fee is based on the level of average net assets for the month.
7. Committed Line of Credit.
The Fund participates with other funds managed by FMR in a $4.2 billion credit facility (the "line of credit") to be utilized for temporary or emergency purposes to fund shareholder redemptions or for other short-term liquidity purposes. The Fund has agreed to pay commitment fees on its pro rata portion of the line of credit, which amounted to $567 and is reflected in Miscellaneous Expense on the Statement of Operations. During the period, there were no borrowings on this line of credit.
Annual Report
8. Bank Borrowings.
The Fund is permitted to have bank borrowings for temporary or emergency purposes to fund shareholder redemptions. The Fund has established borrowing arrangements with certain banks. The interest rate on the borrowings is the bank's base rate, as revised from time to time. The average daily loan balance during the period for which loans were outstanding amounted to $6,450,000. The weighted average interest rate was 5.50%. The interest expense amounted to $2,956 under the bank borrowing program. At period end, there were no bank borrowings outstanding.
9. Expense Reductions.
Through arrangements with the Fund's custodian, credits realized as a result of uninvested cash balances were used to reduce the Fund's expenses. During the period, these credits reduced the Fund's custody expenses by $4,358.
10. Credit Risk.
The Fund's relatively large investment in countries with limited or developing capital markets may involve greater risks than investments in more developed markets and the prices of such investments may be volatile. The yields of emerging market debt obligations reflect, among other things, perceived credit risk. The consequences of political, social or economic changes in these markets may have disruptive effects on the market prices of the Fund's investments and the income they generate, as well as the Fund's ability to repatriate such amounts.
11. Other.
The Fund's organizational documents provide former and current trustees and officers with a limited indemnification against liabilities arising in connection with the performance of their duties to the Fund. In the normal course of business, the Fund may also enter into contracts that provide general indemnifications. The Fund's maximum exposure under these arrangements is unknown as this would be dependent on future claims that may be made against the Fund. The risk of material loss from such claims is considered remote.
At the end of the period, FMR or its affiliates were the owners of record of 99% of the total outstanding shares of the Fund.
The United States Securities and Exchange Commission ("SEC") is conducting an investigation of FMR (covering the years 2002 to 2004) arising from gifts, gratuities and business entertainment provided by certain brokers to certain individuals who were employed on FMR's domestic equity trading desk during that period. FMR is in discussions with the SEC staff regarding the possible resolution of the matter, but as of period-end no final resolution has been reached.
In December 2006, the Independent Trustees completed their own investigation of the matter with the assistance of independent counsel. The Independent Trustees and FMR agree that, despite the absence of proof that the Fidelity mutual funds experienced diminished execution quality as a result of the improper receipt of gifts and business entertainment, the conduct at issue was serious and is worthy of redress. Accordingly, the Independent Trustees have requested and FMR has agreed to pay $42 million to Fidelity mutual funds, plus interest to be determined at the time that payment is made. A method of allocating this payment among the funds has not yet been determined. The total payment to the Fund is not anticipated to have a material impact on the Fund's net assets. In addition, FMR reimbursed related legal expenses which are recorded in the accompanying Statement of Operations as an expense reduction.
12. Distributions to Shareholders.
Distributions to shareholders of each class were as follows:
Years ended December 31, | 2007 | 2006 |
From net investment income | | |
Initial Class | $ 5,533,184 | $ 5,433,880 |
Service Class | 202,728 | 181,865 |
Service Class 2 | 195,187 | 175,714 |
Investor Class | 10,411,687 | 4,475,127 |
Total | $ 16,342,786 | $ 10,266,586 |
From net realized gain | | |
Initial Class | $ 1,495,459 | $ 275,552 |
Service Class | 55,311 | 9,413 |
Service Class 2 | 55,078 | 9,386 |
Investor Class | 2,633,532 | 227,858 |
Total | $ 4,239,380 | $ 522,209 |
Annual Report
Notes to Financial Statements - continued
13. Share Transactions.
Transactions for each class of shares were as follows:
| Shares | Dollars |
Years ended December 31, | 2007 | 2006 | 2007 | 2006 |
Initial Class | | | | |
Shares sold | 1,666,991 | 1,325,177 | $ 18,233,357 | $ 14,237,932 |
Reinvestment of distributions | 664,643 | 533,592 | 7,028,643 | 5,709,432 |
Shares redeemed | (2,671,377) | (3,298,485) | (29,204,426) | (35,422,894) |
Net increase (decrease) | (339,743) | (1,439,716) | $ (3,942,426) | $ (15,475,530) |
Service Class | | | | |
Reinvestment of distributions | 24,471 | 17,910 | $ 258,039 | $ 191,278 |
Net increase (decrease) | 24,471 | 17,910 | $ 258,039 | $ 191,278 |
Service Class 2 | | | | |
Reinvestment of distributions | 23,734 | 17,331 | $ 250,265 | $ 185,100 |
Net increase (decrease) | 23,734 | 17,331 | $ 250,265 | $ 185,100 |
Investor Class | | | | |
Shares sold | 11,377,853 | 7,406,250 | $ 124,056,046 | $ 79,510,385 |
Reinvestment of distributions | 1,236,181 | 439,942 | 13,045,219 | 4,702,985 |
Shares redeemed | (842,096) | (252,931) | (9,212,620) | (2,701,390) |
Net increase (decrease) | 11,771,938 | 7,593,261 | $ 127,888,645 | $ 81,511,980 |
Annual Report
Report of Independent Registered Public Accounting Firm
To the Trustees of Variable Insurance Products Fund V and the Shareholders of VIP Strategic Income Portfolio:
In our opinion, the accompanying statement of assets and liabilities, including the schedule of investments, and the related statements of operations and of changes in net assets and the financial highlights present fairly, in all material respects, the financial position of VIP Strategic Income Portfolio (a fund of Variable Insurance Products Fund V) at December 31, 2007, the results of its operations for the year then ended, the changes in its net assets for each of the two years in the period then ended and the financial highlights for each of the periods indicated, in conformity with accounting principles generally accepted in the United States of America. These financial statements and financial highlights (hereafter referred to as "financial statements") are the responsibility of the VIP Strategic Income Portfolio's management. Our responsibility is to express an opinion on these financial statements based on our audits. We conducted our audits of these financial statements in accordance with the standards of the Public Company Accounting Oversight Board (United States). Those standards require that we plan and perform the audit to obtain reasonable assurance about whether the financial statements are free of material misstatement. An audit includes examining, on a test basis, evidence supporting the amounts and disclosures in the financial statements, assessing the accounting principles used and significant estimates made by management, and evaluating the overall financial statement presentation. We believe that our audits, which included confirmation of securities at December 31, 2007 by correspondence with the custodian and brokers, provide a reasonable basis for our opinion.
/s/ PricewaterhouseCoopers LLP
PricewaterhouseCoopers LLP
Boston, Massachusetts
February 28, 2008
Annual Report
Trustees and Officers
The Trustees, Members of the Advisory Board, and executive officers of the trust and fund, as applicable, are listed below. The Board of Trustees governs the fund and is responsible for protecting the interests of shareholders. The Trustees are experienced executives who meet periodically throughout the year to oversee the fund's activities, review contractual arrangements with companies that provide services to the fund, and review the fund's performance. Except for James C. Curvey, each of the Trustees oversees 373 funds advised by FMR or an affiliate. Mr. Curvey oversees 368 funds advised by FMR or an affiliate.
The Trustees hold office without limit in time except that (a) any Trustee may resign; (b) any Trustee may be removed by written instrument, signed by at least two-thirds of the number of Trustees prior to such removal; (c) any Trustee who requests to be retired or who has become incapacitated by illness or injury may be retired by written instrument signed by a majority of the other Trustees; and (d) any Trustee may be removed at any special meeting of shareholders by a two-thirds vote of the outstanding voting securities of the trust. Each Trustee who is not an interested person (as defined in the 1940 Act) (Independent Trustee), shall retire not later than the last day of the calendar year in which his or her 72nd birthday occurs. The Independent Trustees may waive this mandatory retirement age policy with respect to individual Trustees. The executive officers and Advisory Board Members hold office without limit in time, except that any officer and Advisory Board Member may resign or may be removed by a vote of a majority of the Trustees at any regular meeting or any special meeting of the Trustees. Except as indicated, each individual has held the office shown or other offices in the same company for the past five years.
The fund's Statement of Additional Information (SAI) includes more information about the Trustees. To request a free copy, call Fidelity at 1-877-208-0098.
Interested Trustees*:
Correspondence intended for each Trustee who is an interested person may be sent to Fidelity Investments, 82 Devonshire Street, Boston, Massachusetts 02109.
Name, Age; Principal Occupation |
Edward C. Johnson 3d (77) |
| Year of Election or Appointment: 1989 Mr. Johnson is Chairman of the Board of Trustees. Mr. Johnson serves as President (2006-present), Chief Executive Officer, Chairman, and a Director of FMR LLC; Chairman and a Director of FMR; Chairman and a Director of Fidelity Research & Analysis Company (FRAC); Chairman and a Director of Fidelity Investments Money Management, Inc.; and Chairman (2001-present) and a Director of FMR Co., Inc. In addition, Mr. Johnson serves as Chairman and Director of Fidelity International Limited (FIL). Mr. Eward C. Johnson 3d and Mr. Arthur E. Johnson are not related. |
James C. Curvey (72) |
| Year of Election or Appointment: 2007 Mr. Curvey also serves as Trustee (2007-present) or Member of the Advisory Board (2007-present) of other investment companies advised by FMR. Mr. Curvey is a Director of FMR and FMR Co., Inc. (2007-present). Mr. Curvey is also Vice Chairman (2006-present) and Director of FMR LLC. Mr. Curvey joined Fidelity in 1982 and served in numerous senior management positions, including President and Chief Operating Officer of FMR LLC (1997-2000) and President of Fidelity Strategic Investments (2000-2002). In addition, he serves as a member of the Board of Directors of Geerlings & Wade, Inc. (wine distribution). |
* Trustees have been determined to be "Interested Trustees" by virtue of, among other things, their affiliation with the trust or various entities under common control with FMR. FMR Corp. merged with and into FMR LLC on October 1, 2007. Any references to FMR LLC for prior periods are deemed to be references to the prior entity.
Independent Trustees:
Correspondence intended for each Independent Trustee (that is, the Trustees other than the Interested Trustees) may be sent to Fidelity Investments, P.O. Box 55235, Boston, Massachusetts 02205-5235.
Name, Age; Principal Occupation |
Dennis J. Dirks (59) |
| Year of Election or Appointment: 2005 Prior to his retirement in May 2003, Mr. Dirks was Chief Operating Officer and a member of the Board of The Depository Trust & Clearing Corporation (DTCC) (1999-2003). He also served as President, Chief Operating Officer, and Board member of The Depository Trust Company (DTC) (1999-2003) and President and Board member of the National Securities Clearing Corporation (NSCC) (1999-2003). In addition, Mr. Dirks served as Chief Executive Officer and Board member of the Government Securities Clearing Corporation (2001-2003) and Chief Executive Officer and Board member of the Mortgage-Backed Securities Clearing Corporation (2001-2003). Mr. Dirks also serves as a Trustee and a member of the Finance Committee of Manhattan College (2005-present) and a Trustee and a member of the Finance Committee of AHRC of Nassau County (2006-present). |
Albert R. Gamper, Jr. (65) |
| Year of Election or Appointment: 2006 Prior to his retirement in December 2004, Mr. Gamper served as Chairman of the Board of CIT Group Inc. (commercial finance). During his tenure with CIT Group Inc. Mr. Gamper served in numerous senior management positions, including Chairman (1987-1989; 1999-2001; 2002-2004), Chief Executive Officer (1987-2004), and President (1989-2002). He currently serves as a member of the Board of Directors of Public Service Enterprise Group (utilities, 2001-present), Chairman of the Board of Governors, Rutgers University (2004-present), and Chairman of the Board of Saint Barnabas Health Care System. |
George H. Heilmeier (71) |
| Year of Election or Appointment: 2004 Dr. Heilmeier is Chairman Emeritus of Telcordia Technologies (communication software and systems), where prior to his retirement, he served as company Chairman and Chief Executive Officer. He currently serves on the Boards of Directors of The Mitre Corporation (systems engineering and information technology support for the government), and HRL Laboratories (private research and development, 2004-present). He is Chairman of the General Motors Science & Technology Advisory Board and a Life Fellow of the Institute of Electrical and Electronics Engineers (IEEE). Dr. Heilmeier is a member of the Defense Science Board and the National Security Agency Advisory Board. He is also a member of the National Academy of Engineering, the American Academy of Arts and Sciences, and the Board of Overseers of the School of Engineering and Applied Science of the University of Pennsylvania. Previously, Dr. Heilmeier served as a Director of TRW Inc. (automotive, space, defense, and information technology, 1992-2002), Compaq (1994-2002), Automatic Data Processing, Inc. (ADP) (technology-based business outsourcing, 1995-2002), INET Technologies Inc. (telecommunications network surveillance, 2001-2004), and Teletech Holdings (customer management services). He is the recipient of the 2005 Kyoto Prize in Advanced Technology for his invention of the liquid crystal display, and a member of the Consumer Electronics Hall of Fame. |
James H. Keyes (67) |
| Year of Election or Appointment: 2007 Prior to his retirement in 2003, Mr. Keyes was Chairman, President, and Chief Executive Officer of Johnson Controls, Inc. (automotive supplier, 1993-2003). He currently serves as a member of the boards of LSI Logic Corporation (semiconductor technologies), Navistar International Corporation (manufacture and sale of trucks, buses, and diesel engines, 2002-present), and Pitney Bowes, Inc. (integrated mail, messaging, and document management solutions). |
Marie L. Knowles (61) |
| Year of Election or Appointment: 2001 Prior to Ms. Knowles' retirement in June 2000, she served as Executive Vice President and Chief Financial Officer of Atlantic Richfield Company (ARCO) (diversified energy, 1996-2000). From 1993 to 1996, she was a Senior Vice President of ARCO and President of ARCO Transportation Company. She served as a Director of ARCO from 1996 to 1998. She currently serves as a Director of Phelps Dodge Corporation (copper mining and manufacturing) and McKesson Corporation (healthcare service, 2002-present). Ms. Knowles is a Trustee of the Brookings Institution and the Catalina Island Conservancy and also serves as a member of the Advisory Board for the School of Engineering of the University of Southern California. |
Ned C. Lautenbach (63) |
| Year of Election or Appointment: 2000 Mr. Lautenbach is Chairman of the Independent Trustees (2006-present). Mr. Lautenbach has been a partner of Clayton, Dubilier & Rice, Inc. (private equity investment firm) since September 1998. Previously, Mr. Lautenbach was with the International Business Machines Corporation (IBM) from 1968 until his retirement in 1998. Mr. Lautenbach serves as a Director of Sony Corporation (2006-present) and Eaton Corporation (diversified industrial) as well as the Philharmonic Center for the Arts in Naples, Florida. He also is a member of the Board of Trustees of Fairfield University (2005-present), as well as a member of the Council on Foreign Relations. |
Cornelia M. Small (63) |
| Year of Election or Appointment: 2005 Ms. Small is a member (2000-present) and Chairperson (2002-present) of the Investment Committee, and a member (2002-present) of the Board of Trustees of Smith College. Previously, she served as Chief Investment Officer (1999-2000), Director of Global Equity Investments (1996-1999), and a member of the Board of Directors of Scudder, Stevens & Clark (1990-1997) and Scudder Kemper Investments (1997-1999). In addition, Ms. Small served as Co-Chair (2000-2003) of the Annual Fund for the Fletcher School of Law and Diplomacy. |
William S. Stavropoulos (68) |
| Year of Election or Appointment: 2001 Mr. Stavropoulos is Chairman Emeritus of the Board of Directors of The Dow Chemical Company. Since joining The Dow Chemical Company in 1967, Mr. Stavropoulos served in numerous senior management positions, including President (1993-2000; 2002-2003), CEO (1995-2000; 2002-2004), and Chairman of the Executive Committee (2000-2004). Currently, he is a Director of NCR Corporation (data warehousing and technology solutions), Chemical Financial Corporation, Maersk Inc. (industrial conglomerate, 2002-present), Tyco International, Inc. (multinational manufacturing and services, 2007-present), and a member of the Advisory Board for Metalmark Capital (private equity investment firm, 2005-present). He is a special advisor to Clayton, Dubilier & Rice, Inc., a private equity investment firm. He also serves as a member of the Board of Trustees of the American Enterprise Institute for Public Policy Research. In addition, Mr. Stavropoulos is a member of The Business Council, J.P. Morgan International Council and the University of Notre Dame Advisory Council for the College of Science. |
Kenneth L. Wolfe (68) |
| Year of Election or Appointment: 2005 Mr. Wolfe is Chairman and a Director of Hershey Foods Corporation (2007-present), where prior to his retirement in 2001, he was Chairman and Chief Executive Officer. Mr. Wolfe currently serves as a member of the board of Revlon Inc. (2004-present). Previously, Mr. Wolfe served as a member of the boards of Adelphia Communications Corporation (2003-2006) and Bausch & Lomb, Inc. (1993-2007). |
Advisory Board Members and Executive Officers**:
Correspondence intended for Mr. Mauriello, Mr. Thomas, Mr. Wiley, Mr. Lacy, and Mr. Arthur Johnson may be sent to Fidelity Investments, P.O. Box 55235, Boston, Massachusetts 02205-5235. Correspondence intended for each executive officer and Mr. Lynch may be sent to Fidelity Investments, 82 Devonshire Street, Boston, Massachusetts 02109.
Name, Age; Principal Occupation |
Arthur E. Johnson (60) |
| Year of Election or Appointment: 2008 Member of the Advisory Board of Fidelity Variable Insurance Products Fund V. Mr. Johnson serves as Senior Vice President of Corporate Strategic Development of Lockheed Martin Corporation (defense contractor). In addition, Mr. Johnson serves as a member of the Board of Directors of AGL Resources, Inc. (holding company, 2002-present), and IKON Office Solutions, Inc. (document management systems and services). Mr. Arthur E. Johnson and Mr. Edward C. Johnson 3d are not related. |
Alan J. Lacy (54) |
| Year of Election or Appointment: 2008 Member of the Advisory Board of Fidelity Variable Insurance Products Fund V. Mr. Lacy serves as Senior Adviser (2007-present) of Oak Hill Capital Partners, L.P. (a private equity firm). Mr. Lacy also served as Vice Chairman and Chief Executive Officer of Sears Holdings Corporation and Sears, Roebuck and Co. (retail, 2005-2006; 2000-2005). In addition, Mr. Lacy serves as a member of the Board of Directors of The Western Union Company (global money transfer, 2006-present) and Bristol-Myers Squibb (global pharmaceuticals, 2007-present). Mr. Lacy is a Trustee of the National Parks Conservation Association and The Field Museum of Natural History. |
Peter S. Lynch (63) |
| Year of Election or Appointment: 2003 Member of the Advisory Board of Fidelity Variable Insurance Products Fund V. Mr. Lynch is Vice Chairman and a Director of FMR, and Vice Chairman (2001-present) and a Director of FMR Co., Inc. Previously, Mr. Lynch served as a Trustee of the Fidelity funds (1990-2003). In addition, he serves as a Trustee of Boston College and as the Chairman of the Inner-City Scholarship Fund. |
Joseph Mauriello (63) |
| Year of Election or Appointment: 2007 Member of the Advisory Board of Fidelity Variable Insurance Products Fund V. Prior to his retirement in January 2006, Mr. Mauriello served in numerous senior management positions including Deputy Chairman and Chief Operating Officer (2004-2005), and Vice Chairman of Financial Services (2002-2004) of KPMG LLP US (professional services firm, 1965-2005). Mr. Mauriello currently serves as a member of the Board of Directors of XL Capital Ltd. (global insurance and re-insurance company, 2006-present) and of Arcadia Resources Inc. (health care services and products, 2007-present). He also served as a Director of the Hamilton Funds of the Bank of New York (2006-2007). |
David M. Thomas (58) |
| Year of Election or Appointment: 2007 Member of the Advisory Board of Fidelity Variable Insurance Products Fund V. Previously, Mr. Thomas served as Executive Chairman (2005-2006) and Chairman and Chief Executive Officer (2000-2005) of IMS Health, Inc. (pharmaceutical and healthcare information solutions). In addition, Mr. Thomas serves as a member of the Board of Directors of Fortune Brands, Inc. (consumer products holding company), and Interpublic Group of Companies, Inc. (marketing communication, 2004-present). |
Michael E. Wiley (57) |
| Year of Election or Appointment: 2007 Member of the Advisory Board of Fidelity Variable Insurance Products Fund V. Mr. Wiley also serves as a member of the Board of Trustees of the University of Tulsa (2000-2006; 2007-present). He serves as a Director of Tesoro Corporation (independent oil refiner and marketer, 2005-present), and a Director of Bill Barrett Corporation (exploration and production company, 2005-present). In addition, he also serves as a Director of Post Oak Bank (privately-held bank, 2004-present). Previously, Mr. Wiley served as a Sr. Energy Advisor of Katzenbach Partners, LLC (consulting firm, 2006-2007), as an Advisory Director of Riverstone Holdings (private investment firm), Chairman, President, and CEO of Baker Hughes, Inc. (oilfield services company, 2000-2004), and as Director of Spinnaker Exploration Company (exploration and production company, 2001-2005). |
Kimberley H. Monasterio (44) |
| Year of Election or Appointment: 2007 President and Treasurer of VIP Strategic Income. Ms. Monasterio also serves as President and Treasurer of other Fidelity funds (2007-present) and is an employee of FMR (2004-present). Previously, Ms. Monasterio served as Deputy Treasurer of the Fidelity funds (2004-2006). Before joining Fidelity Investments, Ms. Monasterio served as Treasurer (2000-2004) and Chief Financial Officer (2002-2004) of the Franklin Templeton Funds and Senior Vice President of Franklin Templeton Services, LLC (2000-2004). |
Ren Y. Cheng (50) |
| Year of Election or Appointment: 2007 Vice President of VIP Strategic Income. Mr. Cheng also serves as Vice President of certain Asset Allocation Funds (2007-present). Mr. Cheng is Chief Investment Officer of the Global Asset Allocation group (2007-present). Mr. Cheng also serves as Vice President of FMR and FMR Co., Inc. Mr. Cheng served as Managing Director of the Global Asset Allocation group (2005-2007). Previously, Mr. Cheng served as a portfolio manager for the Fidelity Freedom Funds. |
Boyce I. Greer (51) |
| Year of Election or Appointment: 2006 Vice President of VIP Strategic Income. Mr. Greer also serves as Vice President of certain Asset Allocation Funds (2005-present), Fixed-Income Funds (2006-present), and Money Market Funds (2006-present). Mr. Greer is also a Trustee of other investment companies advised by FMR (2003-present). Mr. Greer is an Executive Vice President of FMR (2005-present) and FMR Co., Inc. (2005-present), and Senior Vice President of Fidelity Investments Money Management, Inc. (2006-present). Previously, Mr. Greer served as Vice President of certain Fidelity Equity Funds (2005-2007), a Director and Managing Director of Strategic Advisers, Inc. (2002-2005), and Executive Vice President (2000-2002) and Money Market Group Leader (1997-2002) of the Fidelity Investments Fixed Income Division. Mr. Greer also served as Vice President of Fidelity's Money Market Funds (1997-2002), Senior Vice President of FMR (1997-2002), and Vice President of FIMM (1998-2002). |
Eric D. Roiter (59) |
| Year of Election or Appointment: 2003 Secretary of VIP Strategic Income. He also serves as Secretary of other Fidelity funds; Vice President, General Counsel, and Secretary of FMR Co., Inc. (2001-present) and FMR; Assistant Secretary of Fidelity Management & Research (U.K.) Inc. (2001-present), Fidelity Research & Analysis Company (2001-present), and Fidelity Investments Money Management, Inc. (2001-present). Mr. Roiter is an Adjunct Member, Faculty of Law, at Boston College Law School (2003-present). Previously, Mr. Roiter served as Vice President and Secretary of Fidelity Distributors Corporation (FDC) (1998-2005). |
John B. McGinty, Jr. (45) |
| Year of Election or Appointment: 2008 Assistant Secretary of VIP Strategic Income. Mr. McGinty also serves as Assistant Secretary of other Fidelity funds (2008-present) and is an employee of FMR LLC (2004-present). Mr. McGinty also serves as Senior Vice President, Secretary, and Chief Legal Officer of FDC (2007-present). Before joining Fidelity Investments, Mr. McGinty practiced law at Ropes & Gray, LLP. |
R. Stephen Ganis (41) |
| Year of Election or Appointment: 2006 Anti-Money Laundering (AML) officer of VIP Strategic Income. Mr. Ganis also serves as AML officer of other Fidelity funds (2006-present) and FMR LLC (2003-present). Before joining Fidelity Investments, Mr. Ganis practiced law at Goodwin Procter, LLP (2000-2002). |
Joseph B. Hollis (59) |
| Year of Election or Appointment: 2006 Chief Financial Officer of VIP Strategic Income. Mr. Hollis also serves as Chief Financial Officer of other Fidelity funds. Mr. Hollis is President of Fidelity Pricing and Cash Management Services (FPCMS) (2005-present). Mr. Hollis also serves as President and Director of Fidelity Service Company, Inc. (2006-present). Previously, Mr. Hollis served as Senior Vice President of Cash Management Services (1999-2002) and Investment Management Operations (2002-2005). |
Kenneth A. Rathgeber (60) |
| Year of Election or Appointment: 2004 Chief Compliance Officer of VIP Strategic Income. Mr. Rathgeber also serves as Chief Compliance Officer of other Fidelity funds (2004-present) and Executive Vice President of Risk Oversight for Fidelity Investments (2002-present). He is Chief Compliance Officer of FMR (2005-present), FMR Co., Inc. (2005-present), Fidelity Management & Research (U.K.) Inc. (2005-present), Fidelity Research & Analysis Company (2005-present), Fidelity Investments Money Management, Inc. (2005-present), and Strategic Advisers, Inc. (2005-present). Previously, Mr. Rathgeber served as Executive Vice President and Chief Operating Officer for Fidelity Investments Institutional Services Company, Inc. (1998-2002). |
Bryan A. Mehrmann (46) |
| Year of Election or Appointment: 2005 Deputy Treasurer of VIP Strategic Income. Mr. Mehrmann also serves as Deputy Treasurer of other Fidelity funds (2005-present) and is an employee of FMR. Previously, Mr. Mehrmann served as Vice President of Fidelity Investments Institutional Services Group (FIIS)/Fidelity Investments Institutional Operations Corporation, Inc. (FIIOC) Client Services (1998-2004). |
Kenneth B. Robins (38) |
| Year of Election or Appointment: 2005 Deputy Treasurer of VIP Strategic Income. Mr. Robins also serves as Deputy Treasurer of other Fidelity funds (2005-present) and is an employee of FMR (2004-present). Before joining Fidelity Investments, Mr. Robins worked at KPMG LLP, where he was a partner in KPMG's department of professional practice (2002-2004) and a Senior Manager (1999-2000). In addition, Mr. Robins served as Assistant Chief Accountant, United States Securities and Exchange Commission (2000-2002). |
Robert G. Byrnes (41) |
| Year of Election or Appointment: 2005 Assistant Treasurer of VIP Strategic Income. Mr. Byrnes also serves as Assistant Treasurer of other Fidelity funds (2005-present) and is an employee of FMR (2005-present). Previously, Mr. Byrnes served as Vice President of FPCMS (2003-2005). Before joining Fidelity Investments, Mr. Byrnes worked at Deutsche Asset Management where he served as Vice President of the Investment Operations Group (2000-2003). |
Peter L. Lydecker (53) |
| Year of Election or Appointment: 2004 Assistant Treasurer of VIP Strategic Income. Mr. Lydecker also serves as Assistant Treasurer of other Fidelity funds (2004) and is an employee of FMR. |
Paul M. Murphy (60) |
| Year of Election or Appointment: 2007 Assistant Treasurer of VIP Strategic Income. Mr. Murphy also serves as Assistant Treasurer of other Fidelity funds (2007-present) and is an employee of FMR (2007-present). Previously, Mr. Murphy served as Chief Financial Officer of the Fidelity Funds (2005-2006), Vice President and Associate General Counsel of FMR (2007), and Senior Vice President of Fidelity Pricing and Cash Management Services Group (FPCMS) (1994-2007). |
Gary W. Ryan (49) |
| Year of Election or Appointment: 2005 Assistant Treasurer of VIP Strategic Income. Mr. Ryan also serves as Assistant Treasurer of other Fidelity funds (2005-present) and is an employee of FMR (2005-present). Previously, Mr. Ryan served as Vice President of Fund Reporting in FPCMS (1999-2005). |
** FMR Corp. merged with and into FMR LLC on October 1, 2007. Any references to FMR LLC for prior periods are deemed to be references to the prior entity.
Annual Report
Distributions
The Board of Trustees of VIP V Strategic Income Portfolio voted to pay to shareholders of record at the opening of business on record date, the following distributions per share derived from capital gains realized from sales of portfolio securities:
| Pay Date | Record Date | Capital Gains |
Initial Class | 02/15/08 | 02/15/08 | $0.055 |
| | | |
Service Class | 02/15/08 | 02/15/08 | $0.055 |
| | | |
Service Class 2 | 02/15/08 | 02/15/08 | $0.055 |
| | | |
Investor Class | 02/15/08 | 02/15/08 | $0.055 |
| | | |
The fund hereby designates as a capital gain dividend with respect to the taxable year ended December 31, 2007, $497,575 or, if subsequently determined to be different, the net capital gain of such year.
A total of 6.55% of the dividends distributed during the fiscal year was derived from interest on U.S. Government securities which is generally exempt from state income tax.
The fund will notify shareholders in January 2008 of amounts for use in preparing 2007 income tax returns.
Annual Report
Investment Adviser
Fidelity Management & Research Company
Boston, MA
Investment Sub-Advisers
FMR Co., Inc.
Fidelity Research & Analysis Company
Fidelity Investments Money Management, Inc.
Fidelity Investments Japan Limited
Fidelity International Investment Advisors
Fidelity International Investment Advisors (U.K.) Limited
General Distributor
Fidelity Distributors Corporation
Boston, MA
Transfer and Service Agents
Fidelity Investments Institutional Operations Company, Inc.
Boston, MA
Fidelity Service Company, Inc.
Boston, MA
Custodian
Mellon Bank, N.A.
Pittsburgh, PA
VIPSI-ANN-0208
1.796350.105
Item 2. Code of Ethics
As of the end of the period, December 31, 2007, Variable Insurance Products Fund V (the trust) has adopted a code of ethics, as defined in Item 2 of Form N-CSR, that applies to its President and Treasurer and its Chief Financial Officer. A copy of the code of ethics is filed as an exhibit to this Form N-CSR.
Item 3. Audit Committee Financial Expert
The Board of Trustees of the trust has determined that Marie L. Knowles is an audit committee financial expert, as defined in Item 3 of Form N-CSR. Ms. Knowles is independent for purposes of Item 3 of Form N-CSR.
Item 4. Principal Accountant Fees and Services
(a) Audit Fees.
For the fiscal years ended December 31, 2007 and December 31, 2006, the aggregate Audit Fees billed by PricewaterhouseCoopers LLP (PwC) for professional services rendered for the audits of the financial statements, or services that are normally provided in connection with statutory and regulatory filings or engagements for those fiscal years, for FundsManager 20% Portfolio, FundsManager 50% Portfolio, FundsManager 60%, FundsManager 70% Portfolio, FundsManager 85% Portfolio, Investor Freedom 2005 Portfolio, Investor Freedom 2010 Portfolio, Investor Freedom 2015 Portfolio, Investor Freedom 2020 Portfolio, Investor Freedom 2025 Portfolio, Investor Freedom 2030 Portfolio, Investor Freedom Income Portfolio, and Strategic Income Portfolio, (the funds) and for all funds in the Fidelity Group of Funds are shown in the table below.
Fund | 2007A | 2006A,B,C |
FundsManager 20% Portfolio | $23,000 | $22,000 |
FundsManager 50% Portfolio | $24,000 | $22,000 |
FundsManager 60% Portfolio | $20,000 | $0 |
FundsManager 70% Portfolio | $24,000 | $22,000 |
FundsManager 85% Portfolio | $23,000 | $22,000 |
Investor Freedom 2005 Portfolio | $24,000 | $21,000 |
Investor Freedom 2010 Portfolio | $24,000 | $21,000 |
Investor Freedom 2015 Portfolio | $24,000 | $21,000 |
Investor Freedom 2020 Portfolio | $24,000 | $21,000 |
Investor Freedom 2025 Portfolio | $24,000 | $21,000 |
Investor Freedom 2030 Portfolio | $24,000 | $21,000 |
Investor Freedom Income Portfolio | $24,000 | $21,000 |
Strategic Income Portfolio | $53,000 | $46,000 |
All funds in the Fidelity Group of Funds audited by PwC | $14,700,000 | $13,900,000 |
A | Aggregate amounts may reflect rounding. |
B | No Audit Fees were billed by PwC for professional services rendered for the audit of the annual financial statements, or services that are normally provided in connection with statutory and regulatory filings or engagements to FundsManager 60% Portfolio, as the fund did not commence operations until August 22, 2007. |
C | FundsManager 20% Portfolio, FundsManager 50% Portfolio, FundsManager 70% Portfolio, and FundsManager 85% Portfolio commenced operations on April 13, 2006. |
For the fiscal years ended December 31, 2007 and December 31, 2006, the aggregate Audit Fees billed by Deloitte & Touche LLP, the member firms of Deloitte Touche Tohmatsu, and their respective affiliates (collectively, "Deloitte Entities") for professional services rendered for the audits of the financial statements, or services that are normally provided in connection with statutory and regulatory filings or engagements for those fiscal years, for Asset Manager Portfolio, Asset Manager: Growth Portfolio, Freedom 2005 Portfolio, Freedom 2010 Portfolio, Freedom 2015 Portfolio, Freedom 2020 Portfolio, Freedom 2025 Portfolio, Freedom 2030 Portfolio, Freedom Income Portfolio, Freedom Lifetime Income I Portfolio, Freedom Lifetime Income II Portfolio, Freedom Lifetime Income III Portfolio and Investment Grade Bond Portfolio (the funds) and for all funds in the Fidelity Group of Funds are shown in the table below.
Fund | 2007A | 2006A |
Asset Manager Portfolio | $54,000 | $65,000 |
Asset Manager: Growth Portfolio | $52,000 | $59,000 |
Freedom 2005 Portfolio | $18,000 | $17,000 |
Freedom 2010 Portfolio | $18,000 | $17,000 |
Freedom 2015 Portfolio | $18,000 | $17,000 |
Freedom 2020 Portfolio | $18,000 | $17,000 |
Freedom 2025 Portfolio | $18,000 | $17,000 |
Freedom 2030 Portfolio | $18,000 | $17,000 |
Freedom Income Portfolio | $19,000 | $18,000 |
Freedom Lifetime Income I Portfolio | $16,000 | $14,000 |
Freedom Lifetime Income II Portfolio | $16,000 | $14,000 |
Freedom Lifetime Income III Portfolio | $16,000 | $14,000 |
Investment Grade Bond Portfolio | $38,000 | $38,000 |
All funds in the Fidelity Group of Funds audited by Deloitte Entities | $7,500,000 | $6,700,000 |
A | Aggregate amounts may reflect rounding. |
(b) Audit-Related Fees.
In each of the fiscal years ended December 31, 2007 and December 31, 2006, the aggregate Audit-Related Fees billed by PwC for services rendered for assurance and related services to each fund that are reasonably related to the performance of the audit or review of the fund's financial statements, but not reported as Audit Fees, are shown in the table below.
Fund | 2007A | 2006 A,B,C |
FundsManager 20% Portfolio | $0 | $0 |
FundsManager 50% Portfolio | $0 | $0 |
FundsManager 60% Portfolio | $0 | $0 |
FundsManager 70% Portfolio | $0 | $0 |
FundsManager 85% Portfolio | $0 | $0 |
Investor Freedom 2005 Portfolio | $0 | $0 |
Investor Freedom 2010 Portfolio | $0 | $0 |
Investor Freedom 2015 Portfolio | $0 | $0 |
Investor Freedom 2020 Portfolio | $0 | $0 |
Investor Freedom 2025 Portfolio | $0 | $0 |
Investor Freedom 2030 Portfolio | $0 | $0 |
Investor Freedom Income Portfolio | $0 | $0 |
Strategic Income Portfolio | $0 | $0 |
A | Aggregate amounts may reflect rounding. |
B | No Audit-Related Fees were billed by PwC for services rendered for assurance and related services to FundsManager 60% that are reasonably related to the performance of the audit or review of the fund's financial statements, but not reported as Audit Fees, as the fund did not commence operations until August 22, 2007. |
C | FundsManager 20% Portfolio, FundsManager 50% Portfolio, FundsManager 70% Portfolio, and FundsManager 85% Portfolio commenced operations on April 13, 2006. |
In each of the fiscal years ended December 31, 2007 and December 31, 2006, the aggregate Audit-Related Fees billed by Deloitte Entities for services rendered for assurance and related services to each fund that are reasonably related to the performance of the audit or review of the fund's financial statements, but not reported as Audit Fees, are shown in the table below.
Fund | 2007A | 2006 A |
Asset Manager Portfolio | $0 | $0 |
Asset Manager: Growth Portfolio | $0 | $0 |
Freedom 2005 Portfolio | $0 | $0 |
Freedom 2010 Portfolio | $0 | $0 |
Freedom 2015 Portfolio | $0 | $0 |
Freedom 2020 Portfolio | $0 | $0 |
Freedom 2025 Portfolio | $0 | $0 |
Freedom 2030 Portfolio | $0 | $0 |
Freedom Income Portfolio | $0 | $0 |
Freedom Lifetime Income I Portfolio | $0 | $0 |
Freedom Lifetime Income II Portfolio | $0 | $0 |
Freedom Lifetime Income III Portfolio | $0 | $0 |
Investment Grade Bond Portfolio | $0 | $0 |
A | Aggregate amounts may reflect rounding. |
In each of the fiscal years ended December 31, 2007 and December 31, 2006, the aggregate Audit-Related Fees that were billed by PwC and Deloitte Entities that were required to be approved by the Audit Committee for services rendered on behalf of Fidelity Management & Research Company (FMR) and entities controlling, controlled by, or under common control with FMR (not including any sub-adviser whose role is primarily portfolio management and is subcontracted with or overseen by another investment adviser) that provide ongoing services to the funds ("Fund Service Providers") for assurance and related services that relate directly to the operations and financial reporting of each fund that are reasonably related to the performance of the audit or review of the fund's financial statements, but not reported as Audit Fees, are shown in the table below.
Billed By | 2007 A | 2006A |
PwC | $0 | $0 |
Deloitte Entities | $0 | $0 |
A | Aggregate amounts may reflect rounding. |
Fees included in the audit-related category comprise assurance and related services (e.g., due diligence services) that are traditionally performed by the independent registered public accounting firm. These audit-related services include due diligence related to mergers and acquisitions, accounting consultations and audits in connection with acquisitions, internal control reviews, attest services that are not required by statute or regulation and consultation concerning financial accounting and reporting standards.
(c) Tax Fees.
In each of the fiscal years ended December 31, 2007 and December 31, 2006, the aggregate Tax Fees billed by PwC for professional services rendered for tax compliance, tax advice, and tax planning for each fund is shown in the table below.
Fund | 2007A | 2006A,B,C |
FundsManager 20% Portfolio | $1,600 | $1,600 |
FundsManager 50% Portfolio | $1,600 | $1,600 |
FundsManager 60% Portfolio | $1,600 | $0 |
FundsManager 70% Portfolio | $1,600 | $1,600 |
FundsManager 85% Portfolio | $1,600 | $1,600 |
Investor Freedom 2005 Portfolio | $1,700 | $1,500 |
Investor Freedom 2010 Portfolio | $1,700 | $1,500 |
Investor Freedom 2015 Portfolio | $1,700 | $1,500 |
Investor Freedom 2020 Portfolio | $1,700 | $1,500 |
Investor Freedom 2025 Portfolio | $1,700 | $1,500 |
Investor Freedom 2030 Portfolio | $1,700 | $1,500 |
Investor Freedom Income Portfolio | $1,700 | $1,500 |
Strategic Income Portfolio | $2,700 | $2,600 |
A | Aggregate amounts may reflect rounding. |
B | No Tax Fees were billed by PwC for services rendered for tax compliance, tax advice, and tax planning for FundsManager 60% Portfolio, as the fund did not commence operations until August 22, 2007. |
C | FundsManager 20% Portfolio, FundsManager 50% Portfolio, FundsManager 70% Portfolio, and FundsManager 85% Portfolio commenced operations on April 13, 2006. |
In each of the fiscal years ended December 31, 2007 and December 31, 2006, the aggregate Tax Fees billed by Deloitte Entities for professional services rendered for tax compliance, tax advice, and tax planning for each fund is shown in the table below.
Fund | 2007A | 2006A |
Asset Manager Portfolio | $6,200 | $4,600 |
Asset Manager: Growth Portfolio | $4,200 | $4,600 |
Freedom 2005 Portfolio | $4,200 | $1,800 |
Freedom 2010 Portfolio | $4,200 | $1,800 |
Freedom 2015 Portfolio | $4,200 | $1,800 |
Freedom 2020 Portfolio | $4,200 | $1,800 |
Freedom 2025 Portfolio | $4,200 | $1,800 |
Freedom 2030 Portfolio | $4,200 | $1,800 |
Freedom Income Portfolio | $4,200 | $2,000 |
Freedom Lifetime Income I Portfolio | $4,200 | $2,000 |
Freedom Lifetime Income II Portfolio | $4,200 | $2,000 |
Freedom Lifetime Income III Portfolio | $4,200 | $2,000 |
Investment Grade Bond Portfolio | $5,200 | $4,600 |
A | Aggregate amounts may reflect rounding. |
In each of the fiscal years ended December 31, 2007 and December 31, 2006, the aggregate Tax Fees billed by PwC and Deloitte Entities that were required to be approved by the Audit Committee for professional services rendered on behalf of the Fund Service Providers for tax compliance, tax advice, and tax planning that relate directly to the operations and financial reporting of each fund is shown in the table below.
Billed By | 2007A | 2006A |
PwC | $0 | $0 |
Deloitte Entities | $0 | $0 |
A | Aggregate amounts may reflect rounding. |
Fees included in the Tax Fees category comprise all services performed by professional staff in the independent registered public accounting firm's tax division except those services related to the audit. Typically, this category would include fees for tax compliance, tax planning, and tax advice. Tax compliance, tax advice, and tax planning services include preparation of original and amended tax returns, claims for refund and tax payment-planning services, assistance with tax audits and appeals, tax advice related to mergers and acquisitions and requests for rulings or technical advice from taxing authorities.
(d) All Other Fees.
In each of the fiscal years ended December 31, 2007 and December 31, 2006, the aggregate Other Fees billed by PwC for all other non-audit services rendered to the funds is shown in the table below.
Fund | 2007A | 2006A,B,C |
FundsManager 20% Portfolio | $1,200 | $500 |
FundsManager 50% Portfolio | $1,300 | $500 |
FundsManager 60% Portfolio | $200 | $0 |
FundsManager 70% Portfolio | $1,400 | $500 |
FundsManager 85% Portfolio | $1,300 | $500 |
Investor Freedom 2005 Portfolio | $900 | $1,200 |
Investor Freedom 2010 Portfolio | $900 | $1,200 |
Investor Freedom 2015 Portfolio | $900 | $1,200 |
Investor Freedom 2020 Portfolio | $900 | $1,200 |
Investor Freedom 2025 Portfolio | $900 | $1,200 |
Investor Freedom 2030 Portfolio | $900 | $1,200 |
Investor Freedom Income Portfolio | $900 | $1,200 |
Strategic Income Portfolio | $1,400 | $1,300 |
A | Aggregate amounts may reflect rounding. |
B | No Other Fees were billed by PwC for all other non-audit services rendered to FundsManager 60% Portfolio, as the fund did not commence operations until August 22, 2007. |
C | FundsManager 20% Portfolio, FundsManager 50% Portfolio, FundsManager 70% Portfolio, and FundsManager 85% Portfolio commenced operations on April 13, 2006. |
In each of the fiscal years ended December 31, 2007 and December 31, 2006, the aggregate Other Fees billed by Deloitte Entities for all other non-audit services rendered to the funds is shown in the table below.
Fund | 2007A | 2006A |
Asset Manager Portfolio | $0 | $0 |
Asset Manager: Growth Portfolio | $0 | $0 |
Freedom 2005 Portfolio | $0 | $0 |
Freedom 2010 Portfolio | $0 | $0 |
Freedom 2015 Portfolio | $0 | $0 |
Freedom 2020 Portfolio | $0 | $0 |
Freedom 2025 Portfolio | $0 | $0 |
Freedom 2030 Portfolio | $0 | $0 |
Freedom Income Portfolio | $0 | $0 |
Freedom Lifetime Income I Portfolio | $0 | $0 |
Freedom Lifetime Income II Portfolio | $0 | $0 |
Freedom Lifetime Income III Portfolio | $0 | $0 |
Investment Grade Bond Portfolio | $0 | $0 |
A | Aggregate amounts may reflect rounding. |
In each of the fiscal years ended December 31, 2007 and December 31, 2006, the aggregate Other Fees billed by PwC and Deloitte Entities that were required to be approved by the Audit Committee for all other non-audit services rendered on behalf of the Fund Service Providers that relate directly to the operations and financial reporting of each fund is shown in the table below.
Billed By | 2007A | 2006A |
PwC | $215,000 | $125,000 |
Deloitte Entities | $0 | $0B |
A | Aggregate amounts may reflect rounding. |
B | Reflects current period presentation. |
Fees included in the All Other Fees category include services related to internal control reviews, strategy and other consulting, financial information systems design and implementation, consulting on other information systems, and other tax services unrelated to the fund.
(e) (1) | Audit Committee Pre-Approval Policies and Procedures: |
The trust's Audit Committee must pre-approve all audit and non-audit services provided by the independent registered public accounting firm relating to the operations or financial reporting of the funds. Prior to the commencement of any audit or non-audit services to a fund, the Audit Committee reviews the services to determine whether they are appropriate and permissible under applicable law.
The trust's Audit Committee has adopted policies and procedures to, among other purposes, provide a framework for the Committee's consideration of non-audit services by the audit firms that audit the Fidelity funds. The policies and procedures require that any non-audit service provided by a fund audit firm to a Fidelity Fund and any non-audit service provided by a fund auditor to a Fund Service Provider that relates directly to the operations and financial reporting of a Fidelity fund (Covered Service) are subject to approval by the Audit Committee before such service is provided. Non-audit services provided by a fund audit firm for a Fund Service Provider that do not relate directly to the operations and financial reporting of a Fidelity fund (Non-Covered Service) but that are expected to exceed $50,000 are also subject to pre-approval by the Audit Committee.
All Covered Services, as well as Non-Covered Services that are expected to exceed $50,000, must be approved in advance of provision of the service either: (i) by formal resolution of the Audit Committee, or (ii) by oral or written approval of the service by the Chair of the Audit Committee (or if the Chair is unavailable, such other member of the Audit Committee as may be designated by the Chair to act in the Chair's absence). The approval contemplated by (ii) above is permitted where the Treasurer determines that action on such an engagement is necessary before the next meeting of the Audit Committee. Neither pre-approval nor advance notice of Non-Covered Service engagements for which fees are not expected to exceed $50,000 is required; such engagements are to be reported to the Audit Committee monthly.
(e) (2) | Services approved pursuant to paragraph (c)(7)(i)(C) of Rule 2-01 of Regulation S-X: |
Audit-Related Fees:
There were no amounts that were approved by the Audit Committee pursuant to the de minimis exception for the fiscal years ended December 31, 2007 and December 31, 2006 on behalf of each fund.
There were no amounts that were required to be approved by the Audit Committee pursuant to the de minimis exception for the fiscal years ended December 31, 2007 and December 31, 2006 on behalf of the Fund Service Providers that relate directly to the operations and financial reporting of each fund.
Tax Fees:
There were no amounts that were approved by the Audit Committee pursuant to the de minimis exception for the fiscal years ended December 31, 2007 and December 31, 2006 on behalf of each fund.
There were no amounts that were required to be approved by the Audit Committee pursuant to the de minimis exception for the fiscal years ended December 31, 2007 and December 31, 2006 on behalf of the Fund Service Providers that relate directly to the operations and financial reporting of each fund.
All Other Fees:
There were no amounts that were approved by the Audit Committee pursuant to the de minimis exception for the fiscal years ended December 31, 2007 and December 31, 2006 on behalf of each fund.
There were no amounts that were required to be approved by the Audit Committee pursuant to the de minimis exception for the fiscal years ended December 31, 2007 and December 31, 2006 on behalf of the Fund Service Providers that relate directly to the operations and financial reporting of each fund.
(f) Not applicable.
(g) For the fiscal years ended December 31, 2007 and December 31, 2006, the aggregate fees billed by PwC of $1,505,000A and $1,345,000A for non-audit services rendered on behalf of the funds, FMR (not including any sub-adviser whose role is primarily portfolio management and is subcontracted with or overseen by another investment adviser) and Fund Service Providers relating to Covered Services and Non-Covered Services are shown in the table below.
| 2007A | 2006A |
Covered Services | $250,000 | $155,000 |
Non-Covered Services | $1,255,000 | $1,190,000 |
A | Aggregate amounts may reflect rounding. |
For the fiscal years ended December 31, 2007 and December 31, 2006, the aggregate fees billed by Deloitte Entities of $735,000A and $750,000A for non-audit services rendered on behalf of the fund, FMR (not including any sub-adviser whose role is primarily portfolio management and is subcontracted with or overseen by another investment adviser) and Fund Service Providers relating to Covered Services and Non-Covered Services are shown in the table below.
| 2007A | 2006A,B |
Covered Services | $60,000 | $35,000 |
Non-Covered Services | $675,000 | $715,000 |
A | Aggregate amounts may reflect rounding. |
B | Reflects current period presentation. |
(h) The trust's Audit Committee has considered Non-Covered Services that were not pre-approved that were provided by PwC and Deloitte Entities to Fund Service Providers to be compatible with maintaining the independence of PwC and Deloitte Entities in their audit of the funds, taking into account representations from PwC and Deloitte Entities, in accordance with Independence Standards Board Standard No.1, regarding their independence from the funds and their related entities.
Item 5. Audit Committee of Listed Registrants
Not applicable.
Item 6. Schedule of Investments
Not applicable.
Item 7. Disclosure of Proxy Voting Policies and Procedures for Closed-End Management Investment Companies
Not applicable.
Item 8. Portfolio Managers of Closed-End Management Investment Companies
Not applicable.
Item 9. Purchase of Equity Securities by Closed-End Management Investment Company and Affiliated Purchasers
Not applicable.
Item 10. Submission of Matters to a Vote of Security Holders
There were no material changes to the procedures by which shareholders may recommend nominees to the trust's Board of Trustees.
Item 11. Controls and Procedures
(a)(i) The President and Treasurer and the Chief Financial Officer have concluded that the disclosure controls and procedures (as defined in Rule 30a-3(c) under the Investment Company Act) for each Fund provide reasonable assurances that material information relating to such Fund is made known to them by the appropriate persons, based on their evaluation of these controls and procedures as of a date within 90 days of the filing date of this report.
(a)(ii) There was no change in a Fund's internal control over financial reporting (as defined in Rule 30a-3(d) under the Investment Company Act) that occurred during the second fiscal quarter of the period covered by this report that has materially affected, or is reasonably likely to materially affect, a Fund's internal control over financial reporting.
Item 12. Exhibits
(a) | (1) | Code of Ethics pursuant to Item 2 of Form N-CSR is filed and attached hereto as EX-99.CODE ETH. |
(a) | (2) | Certification pursuant to Rule 30a-2(a) under the Investment Company Act of 1940 (17 CFR 270.30a-2(a)) is filed and attached hereto as Exhibit 99.CERT. |
(a) | (3) | Not applicable. |
(b) | | Certification pursuant to Rule 30a-2(b) under the Investment Company Act of 1940 (17 CFR 270.30a-2(b)) is furnished and attached hereto as Exhibit 99.906CERT. |
SIGNATURES
Pursuant to the requirements of the Securities Exchange Act of 1934 and the Investment Company Act of 1940, the registrant has duly caused this report to be signed on its behalf by the undersigned, thereunto duly authorized.
Variable Insurance Products Fund V
By: | /s/Kimberley Monasterio |
| Kimberley Monasterio |
| President and Treasurer |
| |
Date: | March 10, 2008 |
Pursuant to the requirements of the Securities Exchange Act of 1934 and the Investment Company Act of 1940, this report has been signed below by the following persons on behalf of the registrant and in the capacities and on the dates indicated.
By: | /s/Kimberley Monasterio |
| Kimberley Monasterio |
| President and Treasurer |
| |
Date: | March 10, 2008 |
By: | /s/Joseph B. Hollis |
| Joseph B. Hollis |
| Chief Financial Officer |
| |
Date: | March 10, 2008 |