0000823535fmr:C000048783Memberfmr:TH2Member2024-06-30
UNITED STATES
SECURITIES AND EXCHANGE COMMISSION
Washington, D.C. 20549
FORM N-CSR
CERTIFIED SHAREHOLDER REPORT OF REGISTERED
MANAGEMENT INVESTMENT COMPANIES
Investment Company Act file number 811-05361
Variable Insurance Products Fund V
(Exact name of registrant as specified in charter)
245 Summer St., Boston, MA 02210
(Address of principal executive offices) (Zip code)
Margaret Carey, Secretary
245 Summer St.
Boston, Massachusetts 02210
(Name and address of agent for service)
Registrant's telephone number, including area code:
617-563-7000
| |
Date of fiscal year end: | December 31 |
|
|
Date of reporting period: | June 30, 2024 |
Item 1.
Reports to Stockholders
| |
| | SEMI-ANNUAL SHAREHOLDER REPORT | AS OF JUNE 30, 2024 | |
| | VIP Investor Freedom 2010 Portfolio℠ VIP Investor Freedom 2010 Portfolio℠ true |
| | | |
This semi-annual shareholder report contains information about VIP Investor Freedom 2010 Portfolio℠ for the period January 1, 2024 to June 30, 2024. You can find additional information about the Fund at fundresearch.fidelity.com/prospectus/sec. You can also request this information by contacting us at 1-877-208-0098 or by sending an e-mail to funddocuments@fmr.com.
What were your Fund costs for the last six months?(based on hypothetical $10,000 investment)
| | Costs of a $10,000 investment | Costs paid as a percentage of a $10,000 investment | |
| VIP Investor Freedom 2010 Portfolio℠ | $ 0 A | 0.00%B | |
A Amount represents less than $.50
B Amount represents less than 0.005%
Key Fund Statistics (as of June 30, 2024)
KEY FACTS | | |
| Fund Size | $55,964,842 | |
| Number of Holdings | 15 | |
| Portfolio Turnover | 20% | |
What did the Fund invest in?
(as of June 30, 2024)
| Bond Funds | 44.6 |
| International Equity Funds | 16.6 |
| Inflation-Protected Bond Funds | 15.5 |
| Domestic Equity Funds | 12.5 |
| Short-Term Investments and Net Other Assets (Liabilities) | 10.8 |
ASSET ALLOCATION (% of Fund's net assets) |
|
|
TOP HOLDINGS (% of Fund's net assets) | | |
| VIP Investment Grade Bond II Portfolio - Investor Class | 38.1 | |
| Fidelity Inflation-Protected Bond Index Fund | 15.5 | |
| VIP Overseas Portfolio - Investor Class | 10.0 | |
| VIP Emerging Markets Portfolio - Investor Class | 6.6 | |
| VIP Growth Portfolio - Investor Class | 3.6 | |
| Fidelity Long-Term Treasury Bond Index Fund | 2.5 | |
| VIP Growth & Income Portfolio - Investor Class | 2.5 | |
| Fidelity International Bond Index Fund | 2.4 | |
| VIP Contrafund Portfolio - Investor Class | 2.2 | |
| VIP Equity Income Portfolio - Investor Class | 1.8 | |
| | 85.2 | |
| |
| Fidelity, the Fidelity Investments Logo and all other Fidelity trademarks or service marks used herein are trademarks or service marks of FMR LLC. Any third-party marks that are used herein are trademarks or service marks of their respective owners. © 2024 FMR LLC. All rights reserved. |
| | For additional information about the Fund; including its prospectus, financial information, holdings and proxy information, scan the QR code or visit fundresearch.fidelity.com/prospectus/sec 1.9916094.100 1496-TSRS-0824 |
| |
| | SEMI-ANNUAL SHAREHOLDER REPORT | AS OF JUNE 30, 2024 | |
| | VIP Target Volatility Portfolio VIP Target Volatility Portfolio Service Class true |
| | | |
This semi-annual shareholder report contains information about VIP Target Volatility Portfolio for the period January 1, 2024 to June 30, 2024. You can find additional information about the Fund at fundresearch.fidelity.com/prospectus/sec. You can also request this information by contacting us at 1-877-208-0098 or by sending an e-mail to funddocuments@fmr.com.
What were your Fund costs for the last six months?(based on hypothetical $10,000 investment)
| | Costs of a $10,000 investment | Costs paid as a percentage of a $10,000 investment | |
| Service Class | $ 9 | 0.18% | |
Key Fund Statistics (as of June 30, 2024)
KEY FACTS | | |
| Fund Size | $189,335,510 | |
| Number of Holdings | 21 | |
| Portfolio Turnover | 18% | |
What did the Fund invest in?
(as of June 30, 2024)
| Domestic Equity Funds | 46.4 |
| International Equity Funds | 33.4 |
| Bond Funds | 18.9 |
| Other Investments | 0.3 |
| Short-Term Investments and Net Other Assets (Liabilities) | 1.0 |
ASSET ALLOCATION (% of Fund's net assets) |
|
|
TOP HOLDINGS (% of Fund's net assets) | | |
| VIP Stock Selector All Cap Portfolio - Investor Class | 30.9 | |
| Fidelity Total Bond Fund | 16.8 | |
| iShares Core S&P 500 ETF | 10.8 | |
| iShares Core MSCI EAFE ETF | 7.8 | |
| Fidelity Emerging Markets Fund | 7.7 | |
| Fidelity Overseas Fund | 6.5 | |
| Fidelity Enhanced International ETF | 3.9 | |
| Fidelity International Value Fund | 3.7 | |
| Fidelity Contrafund | 2.5 | |
| Fidelity Low-Priced Stock Fund | 2.0 | |
| | 92.6 | |
| |
| Fidelity, the Fidelity Investments Logo and all other Fidelity trademarks or service marks used herein are trademarks or service marks of FMR LLC. Any third-party marks that are used herein are trademarks or service marks of their respective owners. © 2024 FMR LLC. All rights reserved. |
| | For additional information about the Fund; including its prospectus, financial information, holdings and proxy information, scan the QR code or visit fundresearch.fidelity.com/prospectus/sec 1.9916153.100 2520-TSRS-0824 |
| |
| | SEMI-ANNUAL SHAREHOLDER REPORT | AS OF JUNE 30, 2024 | |
| | VIP Investor Freedom 2020 Portfolio℠ VIP Investor Freedom 2020 Portfolio℠ true |
| | | |
This semi-annual shareholder report contains information about VIP Investor Freedom 2020 Portfolio℠ for the period January 1, 2024 to June 30, 2024. You can find additional information about the Fund at fundresearch.fidelity.com/prospectus/sec. You can also request this information by contacting us at 1-877-208-0098 or by sending an e-mail to funddocuments@fmr.com.
What were your Fund costs for the last six months?(based on hypothetical $10,000 investment)
| | Costs of a $10,000 investment | Costs paid as a percentage of a $10,000 investment | |
| VIP Investor Freedom 2020 Portfolio℠ | $ 0 A | 0.00%B | |
A Amount represents less than $.50
B Amount represents less than 0.005%
Key Fund Statistics (as of June 30, 2024)
KEY FACTS | | |
| Fund Size | $181,756,954 | |
| Number of Holdings | 15 | |
| Portfolio Turnover | 22% | |
What did the Fund invest in?
(as of June 30, 2024)
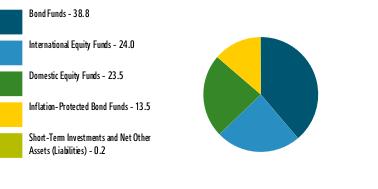
| Bond Funds | 38.8 |
| International Equity Funds | 24.0 |
| Domestic Equity Funds | 23.5 |
| Inflation-Protected Bond Funds | 13.5 |
| Short-Term Investments and Net Other Assets (Liabilities) | 0.2 |
ASSET ALLOCATION (% of Fund's net assets) |
|
|
TOP HOLDINGS (% of Fund's net assets) | | |
| VIP Investment Grade Bond II Portfolio - Investor Class | 31.1 | |
| VIP Overseas Portfolio - Investor Class | 15.2 | |
| Fidelity Inflation-Protected Bond Index Fund | 13.5 | |
| VIP Emerging Markets Portfolio - Investor Class | 8.8 | |
| VIP Growth Portfolio - Investor Class | 6.9 | |
| VIP Growth & Income Portfolio - Investor Class | 4.6 | |
| VIP Contrafund Portfolio - Investor Class | 4.1 | |
| VIP Equity Income Portfolio - Investor Class | 3.4 | |
| Fidelity Long-Term Treasury Bond Index Fund | 3.0 | |
| Fidelity International Bond Index Fund | 3.0 | |
| | 93.6 | |
| |
| Fidelity, the Fidelity Investments Logo and all other Fidelity trademarks or service marks used herein are trademarks or service marks of FMR LLC. Any third-party marks that are used herein are trademarks or service marks of their respective owners. © 2024 FMR LLC. All rights reserved. |
| | For additional information about the Fund; including its prospectus, financial information, holdings and proxy information, scan the QR code or visit fundresearch.fidelity.com/prospectus/sec 1.9916096.100 1498-TSRS-0824 |
| |
| | SEMI-ANNUAL SHAREHOLDER REPORT | AS OF JUNE 30, 2024 | |
| | VIP FundsManager® 20% Portfolio VIP FundsManager® 20% Portfolio Service Class true |
| | | |
This semi-annual shareholder report contains information about VIP FundsManager® 20% Portfolio for the period January 1, 2024 to June 30, 2024. You can find additional information about the Fund at fundresearch.fidelity.com/prospectus/sec. You can also request this information by contacting us at 1-877-208-0098 or by sending an e-mail to funddocuments@fmr.com.
What were your Fund costs for the last six months?(based on hypothetical $10,000 investment)
| | Costs of a $10,000 investment | Costs paid as a percentage of a $10,000 investment | |
| Service Class | $ 5 | 0.10% | |
Key Fund Statistics (as of June 30, 2024)
KEY FACTS | | |
| Fund Size | $706,024,127 | |
| Number of Holdings | 32 | |
| Portfolio Turnover | 17% | |
What did the Fund invest in?
(as of June 30, 2024)
| Bond Funds | 49.7 |
| Domestic Equity Funds | 15.0 |
| International Equity Funds | 8.7 |
| Other Investments | 1.3 |
| Inflation-Protected Bond Funds | 0.7 |
| Short-Term Investments and Net Other Assets (Liabilities) | 24.6 |
ASSET ALLOCATION (% of Fund's net assets) |
|
|
TOP HOLDINGS (% of Fund's net assets) | | |
| VIP Investment Grade Bond II Portfolio - Investor Class | 23.6 | |
| Fidelity Total Bond Fund | 23.5 | |
| VIP Stock Selector All Cap Portfolio - Investor Class | 10.9 | |
| Fidelity Overseas Fund | 2.5 | |
| Fidelity Emerging Markets Fund | 1.9 | |
| Fidelity Floating Rate High Income Fund | 1.3 | |
| iShares Core S&P 500 ETF | 1.3 | |
| Fidelity Hedged Equity Fund | 1.3 | |
| Fidelity Emerging Markets Discovery Fund | 1.1 | |
| Fidelity High Income Fund | 0.8 | |
| | 68.2 | |
| |
| Fidelity, the Fidelity Investments Logo and all other Fidelity trademarks or service marks used herein are trademarks or service marks of FMR LLC. Any third-party marks that are used herein are trademarks or service marks of their respective owners. © 2024 FMR LLC. All rights reserved. |
| | For additional information about the Fund; including its prospectus, financial information, holdings and proxy information, scan the QR code or visit fundresearch.fidelity.com/prospectus/sec 1.9916105.100 1585-TSRS-0824 |
| |
| | SEMI-ANNUAL SHAREHOLDER REPORT | AS OF JUNE 30, 2024 | |
| | VIP Investment Grade Bond Portfolio VIP Investment Grade Bond Portfolio Investor Class true |
| | | |
This semi-annual shareholder report contains information about VIP Investment Grade Bond Portfolio for the period January 1, 2024 to June 30, 2024. You can find additional information about the Fund at fundresearch.fidelity.com/prospectus/sec. You can also request this information by contacting us at 1-877-208-0098 or by sending an e-mail to funddocuments@fmr.com.
What were your Fund costs for the last six months?(based on hypothetical $10,000 investment)
| | Costs of a $10,000 investment | Costs paid as a percentage of a $10,000 investment | |
| Investor Class | $ 21 | 0.42% | |
Key Fund Statistics (as of June 30, 2024)
KEY FACTS | | |
| Fund Size | $4,215,966,857 | |
| Number of Holdings | 2,275 | |
| Portfolio Turnover | 217% | |
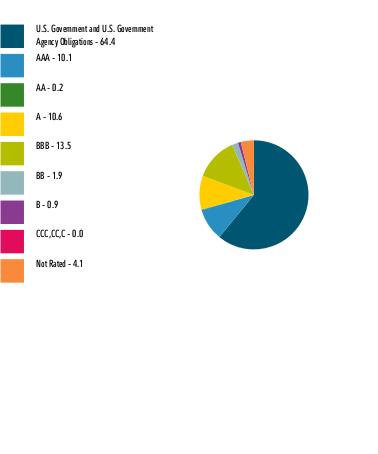
What did the Fund invest in?
(as of June 30, 2024)
| U.S. Government and U.S. Government Agency Obligations | 62.8 |
| AAA | 9.7 |
| AA | 0.4 |
| A | 8.0 |
| BBB | 16.1 |
| BB | 3.6 |
| B | 1.4 |
| CCC,CC,C | 0.0 |
| Not Rated | 3.3 |
QUALITY DIVERSIFICATION (% of Fund's net assets) |
|
| Short-Term Investments and Net Other Assets (Liabilities) - (5.3)%* |
| |
| We have used ratings from Moody's Investors Service, Inc. Where Moody's® ratings are not available, we have used S&P® ratings. All ratings are as of the date indicated and do not reflect subsequent changes. |
| U.S. Treasury Obligations | 42.6 |
| Corporate Bonds | 26.8 |
| U.S. Government Agency - Mortgage Securities | 20.2 |
| Asset-Backed Securities | 8.3 |
| CMOs and Other Mortgage Related Securities | 7.2 |
| Other Investments | 0.2 |
| Foreign Government and Government Agency Obligations | 0.0 |
| Preferred Securities | 0.0 |
| Bank Loan Obligations | 0.0 |
ASSET ALLOCATION (% of Fund's net assets) |
|
| Short-Term Investments and Net Other Assets (Liabilities) - (5.3)% |
|
| United States | 90.9 |
| Grand Cayman (UK Overseas Ter) | 4.6 |
| Mexico | 1.0 |
| United Kingdom | 0.8 |
| Ireland | 0.7 |
| Switzerland | 0.5 |
| Canada | 0.3 |
| France | 0.2 |
| Germany | 0.2 |
| Others | 0.8 |
GEOGRAPHIC DIVERSIFICATION (% of Fund's net assets) |
|
| |
|
TOP HOLDINGS (% of Fund's net assets) | | |
| US Treasury Notes | 30.2 | |
| US Treasury Bonds | 12.4 | |
| Ginnie Mae II Pool | 6.1 | |
| Fannie Mae Mortgage pass-thru certificates | 5.6 | |
| Uniform Mortgage Backed Securities | 5.2 | |
| Freddie Mac Gold Pool | 2.9 | |
| JPMorgan Chase & Co | 1.4 | |
| Bank of America Corp | 1.2 | |
| Morgan Stanley | 1.0 | |
| Petroleos Mexicanos | 1.0 | |
| | 67.0 | |
| |
| Fidelity, the Fidelity Investments Logo and all other Fidelity trademarks or service marks used herein are trademarks or service marks of FMR LLC. Any third-party marks that are used herein are trademarks or service marks of their respective owners. © 2024 FMR LLC. All rights reserved. |
| | For additional information about the Fund; including its prospectus, financial information, holdings and proxy information, scan the QR code or visit fundresearch.fidelity.com/prospectus/sec 1.9915992.100 1460-TSRS-0824 |
| |
| | SEMI-ANNUAL SHAREHOLDER REPORT | AS OF JUNE 30, 2024 | |
| | VIP Freedom 2035 Portfolio℠ VIP Freedom 2035 Portfolio℠ Initial Class true |
| | | |
This semi-annual shareholder report contains information about VIP Freedom 2035 Portfolio℠ for the period January 1, 2024 to June 30, 2024. You can find additional information about the Fund at fundresearch.fidelity.com/prospectus/sec. You can also request this information by contacting us at 1-877-208-0098 or by sending an e-mail to funddocuments@fmr.com.
What were your Fund costs for the last six months?(based on hypothetical $10,000 investment)
| | Costs of a $10,000 investment | Costs paid as a percentage of a $10,000 investment | |
| Initial Class | $ 0 A | 0.00%B | |
AAmount represents less than $.50
BAmount represents less than 0.005%
Key Fund Statistics (as of June 30, 2024)
KEY FACTS | | |
| Fund Size | $329,641,161 | |
| Number of Holdings | 14 | |
| Portfolio Turnover | 38% | |
What did the Fund invest in?
(as of June 30, 2024)
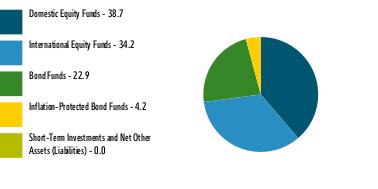
| Domestic Equity Funds | 38.7 |
| International Equity Funds | 34.2 |
| Bond Funds | 22.9 |
| Inflation-Protected Bond Funds | 4.2 |
| Short-Term Investments and Net Other Assets (Liabilities) | 0.0 |
ASSET ALLOCATION (% of Fund's net assets) |
|
|
TOP HOLDINGS (% of Fund's net assets) | | |
| VIP Overseas Portfolio - Initial Class | 22.5 | |
| VIP Investment Grade Bond II Portfolio - Initial Class | 12.3 | |
| VIP Emerging Markets Portfolio - Initial Class | 11.7 | |
| VIP Growth Portfolio - Initial Class | 11.3 | |
| VIP Growth & Income Portfolio - Initial Class | 7.6 | |
| Fidelity Long-Term Treasury Bond Index Fund | 7.0 | |
| VIP Contrafund Portfolio - Initial Class | 6.8 | |
| VIP Equity-Income Portfolio - Initial Class | 5.5 | |
| Fidelity Inflation-Protected Bond Index Fund | 4.2 | |
| VIP Value Portfolio - Initial Class | 3.9 | |
| | 92.8 | |
| |
| Fidelity, the Fidelity Investments Logo and all other Fidelity trademarks or service marks used herein are trademarks or service marks of FMR LLC. Any third-party marks that are used herein are trademarks or service marks of their respective owners. © 2024 FMR LLC. All rights reserved. |
| | For additional information about the Fund; including its prospectus, financial information, holdings and proxy information, scan the QR code or visit fundresearch.fidelity.com/prospectus/sec 1.9916131.100 2159-TSRS-0824 |
| |
| | SEMI-ANNUAL SHAREHOLDER REPORT | AS OF JUNE 30, 2024 | |
| | VIP Freedom 2065 Portfolio℠ VIP Freedom 2065 Portfolio℠ Initial Class true |
| | | |
This semi-annual shareholder report contains information about VIP Freedom 2065 Portfolio℠ for the period January 1, 2024 to June 30, 2024. You can find additional information about the Fund at fundresearch.fidelity.com/prospectus/sec. You can also request this information by contacting us at 1-877-208-0098 or by sending an e-mail to funddocuments@fmr.com.
What were your Fund costs for the last six months?(based on hypothetical $10,000 investment)
| | Costs of a $10,000 investment | Costs paid as a percentage of a $10,000 investment | |
| Initial Class | $ 0 A | 0.00%B | |
AAmount represents less than $.50
BAmount represents less than 0.005%
Key Fund Statistics (as of June 30, 2024)
KEY FACTS | | |
| Fund Size | $6,288,800 | |
| Number of Holdings | 13 | |
| Portfolio Turnover | 71% | |
What did the Fund invest in?
(as of June 30, 2024)
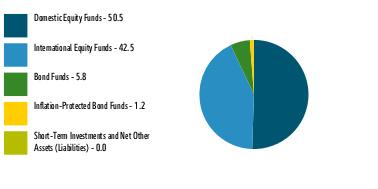
| Domestic Equity Funds | 50.5 |
| International Equity Funds | 42.5 |
| Bond Funds | 5.8 |
| Inflation-Protected Bond Funds | 1.2 |
| Short-Term Investments and Net Other Assets (Liabilities) | 0.0 |
ASSET ALLOCATION (% of Fund's net assets) |
|
|
TOP HOLDINGS (% of Fund's net assets) | | |
| VIP Overseas Portfolio - Initial Class | 28.5 | |
| VIP Growth Portfolio - Initial Class | 14.7 | |
| VIP Emerging Markets Portfolio - Initial Class | 14.0 | |
| VIP Growth & Income Portfolio - Initial Class | 9.9 | |
| VIP Contrafund Portfolio - Initial Class | 8.8 | |
| VIP Equity-Income Portfolio - Initial Class | 7.2 | |
| Fidelity Long-Term Treasury Bond Index Fund | 5.5 | |
| VIP Value Portfolio - Initial Class | 5.1 | |
| VIP Value Strategies Portfolio - Initial Class | 2.5 | |
| VIP Mid Cap Portfolio - Initial Class | 2.3 | |
| | 98.5 | |
| |
| Fidelity, the Fidelity Investments Logo and all other Fidelity trademarks or service marks used herein are trademarks or service marks of FMR LLC. Any third-party marks that are used herein are trademarks or service marks of their respective owners. © 2024 FMR LLC. All rights reserved. |
| | For additional information about the Fund; including its prospectus, financial information, holdings and proxy information, scan the QR code or visit fundresearch.fidelity.com/prospectus/sec 1.9916191.100 3362-TSRS-0824 |
| |
| | SEMI-ANNUAL SHAREHOLDER REPORT | AS OF JUNE 30, 2024 | |
| | VIP FundsManager® 70% Portfolio VIP FundsManager® 70% Portfolio Service Class 2 true |
| | | |
This semi-annual shareholder report contains information about VIP FundsManager® 70% Portfolio for the period January 1, 2024 to June 30, 2024. You can find additional information about the Fund at fundresearch.fidelity.com/prospectus/sec. You can also request this information by contacting us at 1-877-208-0098 or by sending an e-mail to funddocuments@fmr.com.
What were your Fund costs for the last six months?(based on hypothetical $10,000 investment)
| | Costs of a $10,000 investment | Costs paid as a percentage of a $10,000 investment | |
| Service Class 2 | $ 13 | 0.25% | |
Key Fund Statistics (as of June 30, 2024)
KEY FACTS | | |
| Fund Size | $2,203,049,276 | |
| Number of Holdings | 33 | |
| Portfolio Turnover | 25% | |
What did the Fund invest in?
(as of June 30, 2024)
| Domestic Equity Funds | 45.1 |
| International Equity Funds | 27.6 |
| Bond Funds | 22.0 |
| Inflation-Protected Bond Funds | 1.5 |
| Other Investments | 1.3 |
| Short-Term Investments and Net Other Assets (Liabilities) | 2.5 |
ASSET ALLOCATION (% of Fund's net assets) |
|
|
TOP HOLDINGS (% of Fund's net assets) | | |
| VIP Stock Selector All Cap Portfolio - Investor Class | 38.2 | |
| VIP Investment Grade Bond II Portfolio - Investor Class | 10.0 | |
| Fidelity Total Bond Fund | 10.0 | |
| Fidelity Overseas Fund | 8.4 | |
| Fidelity Emerging Markets Fund | 7.7 | |
| Fidelity Contrafund | 2.2 | |
| Fidelity Enhanced International ETF | 2.1 | |
| Fidelity International Discovery Fund | 2.1 | |
| Fidelity Low-Priced Stock Fund | 2.0 | |
| Fidelity International Capital Appreciation Fund | 1.7 | |
| | 84.4 | |
| |
| Fidelity, the Fidelity Investments Logo and all other Fidelity trademarks or service marks used herein are trademarks or service marks of FMR LLC. Any third-party marks that are used herein are trademarks or service marks of their respective owners. © 2024 FMR LLC. All rights reserved. |
| | For additional information about the Fund; including its prospectus, financial information, holdings and proxy information, scan the QR code or visit fundresearch.fidelity.com/prospectus/sec 1.9916112.100 1592-TSRS-0824 |
| |
| | SEMI-ANNUAL SHAREHOLDER REPORT | AS OF JUNE 30, 2024 | |
| | VIP Freedom 2020 Portfolio℠ VIP Freedom 2020 Portfolio℠ Service Class true |
| | | |
This semi-annual shareholder report contains information about VIP Freedom 2020 Portfolio℠ for the period January 1, 2024 to June 30, 2024. You can find additional information about the Fund at fundresearch.fidelity.com/prospectus/sec. You can also request this information by contacting us at 1-877-208-0098 or by sending an e-mail to funddocuments@fmr.com.
What were your Fund costs for the last six months?(based on hypothetical $10,000 investment)
| | Costs of a $10,000 investment | Costs paid as a percentage of a $10,000 investment | |
| Service Class | $ 5 | 0.10% | |
Key Fund Statistics (as of June 30, 2024)
KEY FACTS | | |
| Fund Size | $552,816,930 | |
| Number of Holdings | 15 | |
| Portfolio Turnover | 20% | |
What did the Fund invest in?
(as of June 30, 2024)
| Bond Funds | 38.8 |
| International Equity Funds | 24.0 |
| Domestic Equity Funds | 23.6 |
| Inflation-Protected Bond Funds | 13.5 |
| Short-Term Investments and Net Other Assets (Liabilities) | 0.1 |
ASSET ALLOCATION (% of Fund's net assets) |
|
|
TOP HOLDINGS (% of Fund's net assets) | | |
| VIP Investment Grade Bond II Portfolio - Initial Class | 31.1 | |
| VIP Overseas Portfolio - Initial Class | 15.2 | |
| Fidelity Inflation-Protected Bond Index Fund | 13.5 | |
| VIP Emerging Markets Portfolio - Initial Class | 8.8 | |
| VIP Growth Portfolio - Initial Class | 6.9 | |
| VIP Growth & Income Portfolio - Initial Class | 4.6 | |
| VIP Contrafund Portfolio - Initial Class | 4.1 | |
| VIP Equity-Income Portfolio - Initial Class | 3.4 | |
| Fidelity Long-Term Treasury Bond Index Fund | 3.0 | |
| Fidelity International Bond Index Fund | 3.0 | |
| | 93.6 | |
| |
| Fidelity, the Fidelity Investments Logo and all other Fidelity trademarks or service marks used herein are trademarks or service marks of FMR LLC. Any third-party marks that are used herein are trademarks or service marks of their respective owners. © 2024 FMR LLC. All rights reserved. |
| | For additional information about the Fund; including its prospectus, financial information, holdings and proxy information, scan the QR code or visit fundresearch.fidelity.com/prospectus/sec 1.9916082.100 1430-TSRS-0824 |
| |
| | SEMI-ANNUAL SHAREHOLDER REPORT | AS OF JUNE 30, 2024 | |
| | VIP Asset Manager: Growth Portfolio VIP Asset Manager: Growth Portfolio Investor Class true |
| | | |
This semi-annual shareholder report contains information about VIP Asset Manager: Growth Portfolio for the period January 1, 2024 to June 30, 2024. You can find additional information about the Fund at fundresearch.fidelity.com/prospectus/sec. You can also request this information by contacting us at 1-877-208-0098 or by sending an e-mail to funddocuments@fmr.com.
What were your Fund costs for the last six months?(based on hypothetical $10,000 investment)
| | Costs of a $10,000 investment | Costs paid as a percentage of a $10,000 investment | |
| Investor Class | $ 36 | 0.71% | |
Key Fund Statistics (as of June 30, 2024)
KEY FACTS | | |
| Fund Size | $265,025,578 | |
| Number of Holdings | 23 | |
| Portfolio Turnover | 15% | |
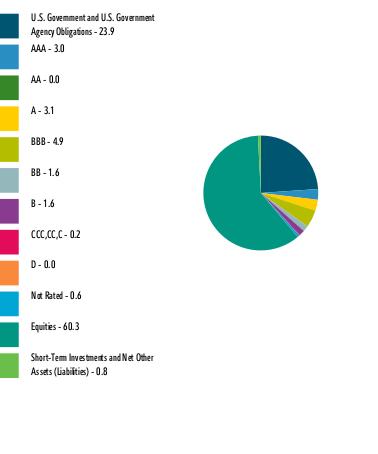
What did the Fund invest in?
(as of June 30, 2024)
| U.S. Government and U.S. Government Agency Obligations | 14.2 |
| AAA | 1.5 |
| AA | 0.0 |
| A | 1.9 |
| BBB | 2.7 |
| BB | 1.1 |
| B | 1.1 |
| CCC,CC,C | 0.2 |
| D | 0.0 |
| Not Rated | 0.5 |
| Equities | 75.3 |
| Short-Term Investments and Net Other Assets (Liabilities) | 1.5 |
QUALITY DIVERSIFICATION (% of Fund's net assets) |
|
| |
| We have used ratings from Moody's Investors Service, Inc. Where Moody's® ratings are not available, we have used S&P® ratings. All ratings are as of the date indicated and do not reflect subsequent changes. |
MARKET SECTORS (% of Fund's net assets) | | |
| Information Technology | 18.0 | |
| Financials | 12.5 | |
| Industrials | 8.7 | |
| Health Care | 8.3 | |
| Consumer Discretionary | 7.8 | |
| Communication Services | 5.3 | |
| Consumer Staples | 3.5 | |
| Energy | 2.9 | |
| Materials | 2.6 | |
| Real Estate | 1.6 | |
| Utilities | 1.4 | |
| |
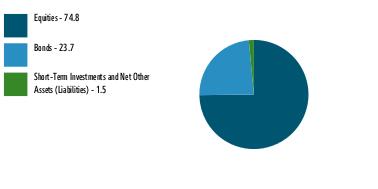
| Equities | 74.8 |
| Bonds | 23.7 |
| Short-Term Investments and Net Other Assets (Liabilities) | 1.5 |
ASSET ALLOCATION (% of Fund's net assets) |
|
|
TOP HOLDINGS (% of Fund's net assets) | | |
| US Treasury Notes | 8.0 | |
| Microsoft Corp | 3.4 | |
| Apple Inc | 2.2 | |
| US Treasury Bonds | 2.0 | |
| Alphabet Inc Class A | 2.0 | |
| Amazon.com Inc | 2.0 | |
| Uniform Mortgage Backed Securities | 2.0 | |
| NVIDIA Corp | 1.9 | |
| Fidelity Hedged Equity ETF | 1.3 | |
| Meta Platforms Inc Class A | 1.2 | |
| | 26.1 | |
| |
| Fidelity, the Fidelity Investments Logo and all other Fidelity trademarks or service marks used herein are trademarks or service marks of FMR LLC. Any third-party marks that are used herein are trademarks or service marks of their respective owners. © 2024 FMR LLC. All rights reserved. |
| | For additional information about the Fund; including its prospectus, financial information, holdings and proxy information, scan the QR code or visit fundresearch.fidelity.com/prospectus/sec 1.9915971.100 1458-TSRS-0824 |
| |
| | SEMI-ANNUAL SHAREHOLDER REPORT | AS OF JUNE 30, 2024 | |
| | VIP Freedom 2065 Portfolio℠ VIP Freedom 2065 Portfolio℠ Service Class 2 true |
| | | |
This semi-annual shareholder report contains information about VIP Freedom 2065 Portfolio℠ for the period January 1, 2024 to June 30, 2024. You can find additional information about the Fund at fundresearch.fidelity.com/prospectus/sec. You can also request this information by contacting us at 1-877-208-0098 or by sending an e-mail to funddocuments@fmr.com.
What were your Fund costs for the last six months?(based on hypothetical $10,000 investment)
| | Costs of a $10,000 investment | Costs paid as a percentage of a $10,000 investment | |
| Service Class 2 | $ 13 | 0.25% | |
Key Fund Statistics (as of June 30, 2024)
KEY FACTS | | |
| Fund Size | $6,288,800 | |
| Number of Holdings | 13 | |
| Portfolio Turnover | 71% | |
What did the Fund invest in?
(as of June 30, 2024)
| Domestic Equity Funds | 50.5 |
| International Equity Funds | 42.5 |
| Bond Funds | 5.8 |
| Inflation-Protected Bond Funds | 1.2 |
| Short-Term Investments and Net Other Assets (Liabilities) | 0.0 |
ASSET ALLOCATION (% of Fund's net assets) |
|
|
TOP HOLDINGS (% of Fund's net assets) | | |
| VIP Overseas Portfolio - Initial Class | 28.5 | |
| VIP Growth Portfolio - Initial Class | 14.7 | |
| VIP Emerging Markets Portfolio - Initial Class | 14.0 | |
| VIP Growth & Income Portfolio - Initial Class | 9.9 | |
| VIP Contrafund Portfolio - Initial Class | 8.8 | |
| VIP Equity-Income Portfolio - Initial Class | 7.2 | |
| Fidelity Long-Term Treasury Bond Index Fund | 5.5 | |
| VIP Value Portfolio - Initial Class | 5.1 | |
| VIP Value Strategies Portfolio - Initial Class | 2.5 | |
| VIP Mid Cap Portfolio - Initial Class | 2.3 | |
| | 98.5 | |
| |
| Fidelity, the Fidelity Investments Logo and all other Fidelity trademarks or service marks used herein are trademarks or service marks of FMR LLC. Any third-party marks that are used herein are trademarks or service marks of their respective owners. © 2024 FMR LLC. All rights reserved. |
| | For additional information about the Fund; including its prospectus, financial information, holdings and proxy information, scan the QR code or visit fundresearch.fidelity.com/prospectus/sec 1.9916193.100 3368-TSRS-0824 |
| |
| | SEMI-ANNUAL SHAREHOLDER REPORT | AS OF JUNE 30, 2024 | |
| | VIP FundsManager® 85% Portfolio VIP FundsManager® 85% Portfolio Service Class 2 true |
| | | |
This semi-annual shareholder report contains information about VIP FundsManager® 85% Portfolio for the period January 1, 2024 to June 30, 2024. You can find additional information about the Fund at fundresearch.fidelity.com/prospectus/sec. You can also request this information by contacting us at 1-877-208-0098 or by sending an e-mail to funddocuments@fmr.com.
What were your Fund costs for the last six months?(based on hypothetical $10,000 investment)
| | Costs of a $10,000 investment | Costs paid as a percentage of a $10,000 investment | |
| Service Class 2 | $ 13 | 0.25% | |
Key Fund Statistics (as of June 30, 2024)
KEY FACTS | | |
| Fund Size | $903,040,010 | |
| Number of Holdings | 36 | |
| Portfolio Turnover | 35% | |
What did the Fund invest in?
(as of June 30, 2024)
| Domestic Equity Funds | 54.1 |
| International Equity Funds | 31.9 |
| Bond Funds | 10.6 |
| Inflation-Protected Bond Funds | 1.5 |
| Other Investments | 1.3 |
| Short-Term Investments and Net Other Assets (Liabilities) | 0.6 |
ASSET ALLOCATION (% of Fund's net assets) |
|
|
TOP HOLDINGS (% of Fund's net assets) | | |
| VIP Stock Selector All Cap Portfolio - Investor Class | 46.3 | |
| Fidelity Overseas Fund | 9.4 | |
| Fidelity Emerging Markets Fund | 9.4 | |
| VIP Investment Grade Bond II Portfolio - Investor Class | 4.8 | |
| Fidelity Total Bond Fund | 4.8 | |
| Fidelity Contrafund | 2.6 | |
| Fidelity Low-Priced Stock Fund | 2.5 | |
| Fidelity International Discovery Fund | 2.4 | |
| Fidelity Enhanced International ETF | 2.3 | |
| Fidelity International Capital Appreciation Fund | 2.0 | |
| | 86.5 | |
| |
| Fidelity, the Fidelity Investments Logo and all other Fidelity trademarks or service marks used herein are trademarks or service marks of FMR LLC. Any third-party marks that are used herein are trademarks or service marks of their respective owners. © 2024 FMR LLC. All rights reserved. |
| | For additional information about the Fund; including its prospectus, financial information, holdings and proxy information, scan the QR code or visit fundresearch.fidelity.com/prospectus/sec 1.9916115.100 1595-TSRS-0824 |
| |
| | SEMI-ANNUAL SHAREHOLDER REPORT | AS OF JUNE 30, 2024 | |
| | VIP FundsManager® 40% Portfolio VIP FundsManager® 40% Portfolio Service Class 2 true |
| | | |
This semi-annual shareholder report contains information about VIP FundsManager® 40% Portfolio for the period January 1, 2024 to June 30, 2024. You can find additional information about the Fund at fundresearch.fidelity.com/prospectus/sec. You can also request this information by contacting us at 1-877-208-0098 or by sending an e-mail to funddocuments@fmr.com.
What were your Fund costs for the last six months?(based on hypothetical $10,000 investment)
| | Costs of a $10,000 investment | Costs paid as a percentage of a $10,000 investment | |
| Service Class 2 | $ 13 | 0.25% | |
Key Fund Statistics (as of June 30, 2024)
KEY FACTS | | |
| Fund Size | $17,899,657 | |
| Number of Holdings | 29 | |
| Portfolio Turnover | 23% | |
What did the Fund invest in?
(as of June 30, 2024)
| Bond Funds | 43.5 |
| Domestic Equity Funds | 28.3 |
| International Equity Funds | 16.3 |
| Inflation-Protected Bond Funds | 0.9 |
| Short-Term Investments and Net Other Assets (Liabilities) | 11.0 |
ASSET ALLOCATION (% of Fund's net assets) |
|
|
TOP HOLDINGS (% of Fund's net assets) | | |
| VIP Stock Selector All Cap Portfolio - Investor Class | 21.9 | |
| VIP Investment Grade Bond II Portfolio - Investor Class | 20.6 | |
| Fidelity Total Bond Fund | 20.5 | |
| Fidelity Overseas Fund | 5.3 | |
| Fidelity Emerging Markets Fund | 4.6 | |
| Fidelity International Discovery Fund | 1.4 | |
| iShares Core S&P 500 ETF | 1.3 | |
| Fidelity Hedged Equity Fund | 1.3 | |
| Fidelity Contrafund | 1.2 | |
| Fidelity Floating Rate High Income Fund | 1.2 | |
| | 79.3 | |
| |
| Fidelity, the Fidelity Investments Logo and all other Fidelity trademarks or service marks used herein are trademarks or service marks of FMR LLC. Any third-party marks that are used herein are trademarks or service marks of their respective owners. © 2024 FMR LLC. All rights reserved. |
| | For additional information about the Fund; including its prospectus, financial information, holdings and proxy information, scan the QR code or visit fundresearch.fidelity.com/prospectus/sec 1.9916218.100 6994-TSRS-0824 |
| |
| | SEMI-ANNUAL SHAREHOLDER REPORT | AS OF JUNE 30, 2024 | |
| | VIP Investor Freedom 2015 Portfolio℠ VIP Investor Freedom 2015 Portfolio℠ true |
| | | |
This semi-annual shareholder report contains information about VIP Investor Freedom 2015 Portfolio℠ for the period January 1, 2024 to June 30, 2024. You can find additional information about the Fund at fundresearch.fidelity.com/prospectus/sec. You can also request this information by contacting us at 1-877-208-0098 or by sending an e-mail to funddocuments@fmr.com.
What were your Fund costs for the last six months?(based on hypothetical $10,000 investment)
| | Costs of a $10,000 investment | Costs paid as a percentage of a $10,000 investment | |
| VIP Investor Freedom 2015 Portfolio℠ | $ 0 A | 0.00%B | |
A Amount represents less than $.50
B Amount represents less than 0.005%
Key Fund Statistics (as of June 30, 2024)
KEY FACTS | | |
| Fund Size | $91,107,646 | |
| Number of Holdings | 15 | |
| Portfolio Turnover | 23% | |
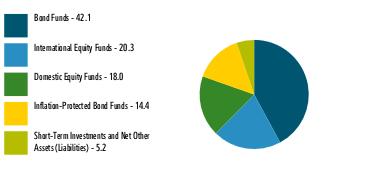
What did the Fund invest in?
(as of June 30, 2024)
| Bond Funds | 42.1 |
| International Equity Funds | 20.3 |
| Domestic Equity Funds | 18.0 |
| Inflation-Protected Bond Funds | 14.4 |
| Short-Term Investments and Net Other Assets (Liabilities) | 5.2 |
ASSET ALLOCATION (% of Fund's net assets) |
|
|
TOP HOLDINGS (% of Fund's net assets) | | |
| VIP Investment Grade Bond II Portfolio - Investor Class | 35.1 | |
| Fidelity Inflation-Protected Bond Index Fund | 14.4 | |
| VIP Overseas Portfolio - Investor Class | 12.6 | |
| VIP Emerging Markets Portfolio - Investor Class | 7.7 | |
| VIP Growth Portfolio - Investor Class | 5.2 | |
| VIP Growth & Income Portfolio - Investor Class | 3.5 | |
| VIP Contrafund Portfolio - Investor Class | 3.2 | |
| Fidelity International Bond Index Fund | 2.7 | |
| VIP Equity Income Portfolio - Investor Class | 2.6 | |
| Fidelity Long-Term Treasury Bond Index Fund | 2.6 | |
| | 89.6 | |
| |
| Fidelity, the Fidelity Investments Logo and all other Fidelity trademarks or service marks used herein are trademarks or service marks of FMR LLC. Any third-party marks that are used herein are trademarks or service marks of their respective owners. © 2024 FMR LLC. All rights reserved. |
| | For additional information about the Fund; including its prospectus, financial information, holdings and proxy information, scan the QR code or visit fundresearch.fidelity.com/prospectus/sec 1.9916095.100 1497-TSRS-0824 |
| |
| | SEMI-ANNUAL SHAREHOLDER REPORT | AS OF JUNE 30, 2024 | |
| | VIP Freedom 2055 Portfolio℠ VIP Freedom 2055 Portfolio℠ Initial Class true |
| | | |
This semi-annual shareholder report contains information about VIP Freedom 2055 Portfolio℠ for the period January 1, 2024 to June 30, 2024. You can find additional information about the Fund at fundresearch.fidelity.com/prospectus/sec. You can also request this information by contacting us at 1-877-208-0098 or by sending an e-mail to funddocuments@fmr.com.
What were your Fund costs for the last six months?(based on hypothetical $10,000 investment)
| | Costs of a $10,000 investment | Costs paid as a percentage of a $10,000 investment | |
| Initial Class | $ 0 A | 0.00%B | |
AAmount represents less than $.50
BAmount represents less than 0.005%
Key Fund Statistics (as of June 30, 2024)
KEY FACTS | | |
| Fund Size | $18,954,876 | |
| Number of Holdings | 13 | |
| Portfolio Turnover | 34% | |
What did the Fund invest in?
(as of June 30, 2024)
| Domestic Equity Funds | 50.5 |
| International Equity Funds | 42.5 |
| Bond Funds | 5.8 |
| Inflation-Protected Bond Funds | 1.2 |
| Short-Term Investments and Net Other Assets (Liabilities) | 0.0 |
ASSET ALLOCATION (% of Fund's net assets) |
|
|
TOP HOLDINGS (% of Fund's net assets) | | |
| VIP Overseas Portfolio - Initial Class | 28.5 | |
| VIP Growth Portfolio - Initial Class | 14.7 | |
| VIP Emerging Markets Portfolio - Initial Class | 14.0 | |
| VIP Growth & Income Portfolio - Initial Class | 9.9 | |
| VIP Contrafund Portfolio - Initial Class | 8.8 | |
| VIP Equity-Income Portfolio - Initial Class | 7.2 | |
| Fidelity Long-Term Treasury Bond Index Fund | 5.5 | |
| VIP Value Portfolio - Initial Class | 5.1 | |
| VIP Value Strategies Portfolio - Initial Class | 2.5 | |
| VIP Mid Cap Portfolio - Initial Class | 2.3 | |
| | 98.5 | |
| |
| Fidelity, the Fidelity Investments Logo and all other Fidelity trademarks or service marks used herein are trademarks or service marks of FMR LLC. Any third-party marks that are used herein are trademarks or service marks of their respective owners. © 2024 FMR LLC. All rights reserved. |
| | For additional information about the Fund; including its prospectus, financial information, holdings and proxy information, scan the QR code or visit fundresearch.fidelity.com/prospectus/sec 1.9916185.100 3360-TSRS-0824 |
| |
| | SEMI-ANNUAL SHAREHOLDER REPORT | AS OF JUNE 30, 2024 | |
| | VIP Asset Manager: Growth Portfolio VIP Asset Manager: Growth Portfolio Service Class 2 true |
| | | |
This semi-annual shareholder report contains information about VIP Asset Manager: Growth Portfolio for the period January 1, 2024 to June 30, 2024. You can find additional information about the Fund at fundresearch.fidelity.com/prospectus/sec. You can also request this information by contacting us at 1-877-208-0098 or by sending an e-mail to funddocuments@fmr.com.
What were your Fund costs for the last six months?(based on hypothetical $10,000 investment)
| | Costs of a $10,000 investment | Costs paid as a percentage of a $10,000 investment | |
| Service Class 2 | $ 46 | 0.90% | |
Key Fund Statistics (as of June 30, 2024)
KEY FACTS | | |
| Fund Size | $265,025,578 | |
| Number of Holdings | 23 | |
| Portfolio Turnover | 15% | |
What did the Fund invest in?
(as of June 30, 2024)
| U.S. Government and U.S. Government Agency Obligations | 14.2 |
| AAA | 1.5 |
| AA | 0.0 |
| A | 1.9 |
| BBB | 2.7 |
| BB | 1.1 |
| B | 1.1 |
| CCC,CC,C | 0.2 |
| D | 0.0 |
| Not Rated | 0.5 |
| Equities | 75.3 |
| Short-Term Investments and Net Other Assets (Liabilities) | 1.5 |
QUALITY DIVERSIFICATION (% of Fund's net assets) |
|
| |
| We have used ratings from Moody's Investors Service, Inc. Where Moody's® ratings are not available, we have used S&P® ratings. All ratings are as of the date indicated and do not reflect subsequent changes. |
MARKET SECTORS (% of Fund's net assets) | | |
| Information Technology | 18.0 | |
| Financials | 12.5 | |
| Industrials | 8.7 | |
| Health Care | 8.3 | |
| Consumer Discretionary | 7.8 | |
| Communication Services | 5.3 | |
| Consumer Staples | 3.5 | |
| Energy | 2.9 | |
| Materials | 2.6 | |
| Real Estate | 1.6 | |
| Utilities | 1.4 | |
| |
| Equities | 74.8 |
| Bonds | 23.7 |
| Short-Term Investments and Net Other Assets (Liabilities) | 1.5 |
ASSET ALLOCATION (% of Fund's net assets) |
|
|
TOP HOLDINGS (% of Fund's net assets) | | |
| US Treasury Notes | 8.0 | |
| Microsoft Corp | 3.4 | |
| Apple Inc | 2.2 | |
| US Treasury Bonds | 2.0 | |
| Alphabet Inc Class A | 2.0 | |
| Amazon.com Inc | 2.0 | |
| Uniform Mortgage Backed Securities | 2.0 | |
| NVIDIA Corp | 1.9 | |
| Fidelity Hedged Equity ETF | 1.3 | |
| Meta Platforms Inc Class A | 1.2 | |
| | 26.1 | |
| |
| Fidelity, the Fidelity Investments Logo and all other Fidelity trademarks or service marks used herein are trademarks or service marks of FMR LLC. Any third-party marks that are used herein are trademarks or service marks of their respective owners. © 2024 FMR LLC. All rights reserved. |
| | For additional information about the Fund; including its prospectus, financial information, holdings and proxy information, scan the QR code or visit fundresearch.fidelity.com/prospectus/sec 1.9915973.100 364-TSRS-0824 |
| |
| | SEMI-ANNUAL SHAREHOLDER REPORT | AS OF JUNE 30, 2024 | |
| | VIP Freedom 2020 Portfolio℠ VIP Freedom 2020 Portfolio℠ Service Class 2 true |
| | | |
This semi-annual shareholder report contains information about VIP Freedom 2020 Portfolio℠ for the period January 1, 2024 to June 30, 2024. You can find additional information about the Fund at fundresearch.fidelity.com/prospectus/sec. You can also request this information by contacting us at 1-877-208-0098 or by sending an e-mail to funddocuments@fmr.com.
What were your Fund costs for the last six months?(based on hypothetical $10,000 investment)
| | Costs of a $10,000 investment | Costs paid as a percentage of a $10,000 investment | |
| Service Class 2 | $ 13 | 0.25% | |
Key Fund Statistics (as of June 30, 2024)
KEY FACTS | | |
| Fund Size | $552,816,930 | |
| Number of Holdings | 15 | |
| Portfolio Turnover | 20% | |
What did the Fund invest in?
(as of June 30, 2024)
| Bond Funds | 38.8 |
| International Equity Funds | 24.0 |
| Domestic Equity Funds | 23.6 |
| Inflation-Protected Bond Funds | 13.5 |
| Short-Term Investments and Net Other Assets (Liabilities) | 0.1 |
ASSET ALLOCATION (% of Fund's net assets) |
|
|
TOP HOLDINGS (% of Fund's net assets) | | |
| VIP Investment Grade Bond II Portfolio - Initial Class | 31.1 | |
| VIP Overseas Portfolio - Initial Class | 15.2 | |
| Fidelity Inflation-Protected Bond Index Fund | 13.5 | |
| VIP Emerging Markets Portfolio - Initial Class | 8.8 | |
| VIP Growth Portfolio - Initial Class | 6.9 | |
| VIP Growth & Income Portfolio - Initial Class | 4.6 | |
| VIP Contrafund Portfolio - Initial Class | 4.1 | |
| VIP Equity-Income Portfolio - Initial Class | 3.4 | |
| Fidelity Long-Term Treasury Bond Index Fund | 3.0 | |
| Fidelity International Bond Index Fund | 3.0 | |
| | 93.6 | |
| |
| Fidelity, the Fidelity Investments Logo and all other Fidelity trademarks or service marks used herein are trademarks or service marks of FMR LLC. Any third-party marks that are used herein are trademarks or service marks of their respective owners. © 2024 FMR LLC. All rights reserved. |
| | For additional information about the Fund; including its prospectus, financial information, holdings and proxy information, scan the QR code or visit fundresearch.fidelity.com/prospectus/sec 1.9916083.100 1431-TSRS-0824 |
| |
| | SEMI-ANNUAL SHAREHOLDER REPORT | AS OF JUNE 30, 2024 | |
| | VIP Asset Manager: Growth Portfolio VIP Asset Manager: Growth Portfolio Initial Class true |
| | | |
This semi-annual shareholder report contains information about VIP Asset Manager: Growth Portfolio for the period January 1, 2024 to June 30, 2024. You can find additional information about the Fund at fundresearch.fidelity.com/prospectus/sec. You can also request this information by contacting us at 1-877-208-0098 or by sending an e-mail to funddocuments@fmr.com.
What were your Fund costs for the last six months?(based on hypothetical $10,000 investment)
| | Costs of a $10,000 investment | Costs paid as a percentage of a $10,000 investment | |
| Initial Class | $ 32 | 0.62% | |
Key Fund Statistics (as of June 30, 2024)
KEY FACTS | | |
| Fund Size | $265,025,578 | |
| Number of Holdings | 23 | |
| Portfolio Turnover | 15% | |
What did the Fund invest in?
(as of June 30, 2024)
| U.S. Government and U.S. Government Agency Obligations | 14.2 |
| AAA | 1.5 |
| AA | 0.0 |
| A | 1.9 |
| BBB | 2.7 |
| BB | 1.1 |
| B | 1.1 |
| CCC,CC,C | 0.2 |
| D | 0.0 |
| Not Rated | 0.5 |
| Equities | 75.3 |
| Short-Term Investments and Net Other Assets (Liabilities) | 1.5 |
QUALITY DIVERSIFICATION (% of Fund's net assets) |
|
| |
| We have used ratings from Moody's Investors Service, Inc. Where Moody's® ratings are not available, we have used S&P® ratings. All ratings are as of the date indicated and do not reflect subsequent changes. |
MARKET SECTORS (% of Fund's net assets) | | |
| Information Technology | 18.0 | |
| Financials | 12.5 | |
| Industrials | 8.7 | |
| Health Care | 8.3 | |
| Consumer Discretionary | 7.8 | |
| Communication Services | 5.3 | |
| Consumer Staples | 3.5 | |
| Energy | 2.9 | |
| Materials | 2.6 | |
| Real Estate | 1.6 | |
| Utilities | 1.4 | |
| |
| Equities | 74.8 |
| Bonds | 23.7 |
| Short-Term Investments and Net Other Assets (Liabilities) | 1.5 |
ASSET ALLOCATION (% of Fund's net assets) |
|
|
TOP HOLDINGS (% of Fund's net assets) | | |
| US Treasury Notes | 8.0 | |
| Microsoft Corp | 3.4 | |
| Apple Inc | 2.2 | |
| US Treasury Bonds | 2.0 | |
| Alphabet Inc Class A | 2.0 | |
| Amazon.com Inc | 2.0 | |
| Uniform Mortgage Backed Securities | 2.0 | |
| NVIDIA Corp | 1.9 | |
| Fidelity Hedged Equity ETF | 1.3 | |
| Meta Platforms Inc Class A | 1.2 | |
| | 26.1 | |
| |
| Fidelity, the Fidelity Investments Logo and all other Fidelity trademarks or service marks used herein are trademarks or service marks of FMR LLC. Any third-party marks that are used herein are trademarks or service marks of their respective owners. © 2024 FMR LLC. All rights reserved. |
| | For additional information about the Fund; including its prospectus, financial information, holdings and proxy information, scan the QR code or visit fundresearch.fidelity.com/prospectus/sec 1.9915972.100 159-TSRS-0824 |
| |
| | SEMI-ANNUAL SHAREHOLDER REPORT | AS OF JUNE 30, 2024 | |
| | VIP Freedom 2045 Portfolio℠ VIP Freedom 2045 Portfolio℠ Initial Class true |
| | | |
This semi-annual shareholder report contains information about VIP Freedom 2045 Portfolio℠ for the period January 1, 2024 to June 30, 2024. You can find additional information about the Fund at fundresearch.fidelity.com/prospectus/sec. You can also request this information by contacting us at 1-877-208-0098 or by sending an e-mail to funddocuments@fmr.com.
What were your Fund costs for the last six months?(based on hypothetical $10,000 investment)
| | Costs of a $10,000 investment | Costs paid as a percentage of a $10,000 investment | |
| Initial Class | $ 0 A | 0.00%B | |
AAmount represents less than $.50
BAmount represents less than 0.005%
Key Fund Statistics (as of June 30, 2024)
KEY FACTS | | |
| Fund Size | $176,616,442 | |
| Number of Holdings | 13 | |
| Portfolio Turnover | 28% | |
What did the Fund invest in?
(as of June 30, 2024)
| Domestic Equity Funds | 50.5 |
| International Equity Funds | 42.5 |
| Bond Funds | 5.8 |
| Inflation-Protected Bond Funds | 1.2 |
| Short-Term Investments and Net Other Assets (Liabilities) | 0.0 |
ASSET ALLOCATION (% of Fund's net assets) |
|
|
TOP HOLDINGS (% of Fund's net assets) | | |
| VIP Overseas Portfolio - Initial Class | 28.5 | |
| VIP Growth Portfolio - Initial Class | 14.7 | |
| VIP Emerging Markets Portfolio - Initial Class | 14.0 | |
| VIP Growth & Income Portfolio - Initial Class | 9.9 | |
| VIP Contrafund Portfolio - Initial Class | 8.8 | |
| VIP Equity-Income Portfolio - Initial Class | 7.2 | |
| Fidelity Long-Term Treasury Bond Index Fund | 5.5 | |
| VIP Value Portfolio - Initial Class | 5.1 | |
| VIP Value Strategies Portfolio - Initial Class | 2.5 | |
| VIP Mid Cap Portfolio - Initial Class | 2.3 | |
| | 98.5 | |
| |
| Fidelity, the Fidelity Investments Logo and all other Fidelity trademarks or service marks used herein are trademarks or service marks of FMR LLC. Any third-party marks that are used herein are trademarks or service marks of their respective owners. © 2024 FMR LLC. All rights reserved. |
| | For additional information about the Fund; including its prospectus, financial information, holdings and proxy information, scan the QR code or visit fundresearch.fidelity.com/prospectus/sec 1.9916137.100 2165-TSRS-0824 |
| |
| | SEMI-ANNUAL SHAREHOLDER REPORT | AS OF JUNE 30, 2024 | |
| | VIP Freedom 2025 Portfolio℠ VIP Freedom 2025 Portfolio℠ Service Class 2 true |
| | | |
This semi-annual shareholder report contains information about VIP Freedom 2025 Portfolio℠ for the period January 1, 2024 to June 30, 2024. You can find additional information about the Fund at fundresearch.fidelity.com/prospectus/sec. You can also request this information by contacting us at 1-877-208-0098 or by sending an e-mail to funddocuments@fmr.com.
What were your Fund costs for the last six months?(based on hypothetical $10,000 investment)
| | Costs of a $10,000 investment | Costs paid as a percentage of a $10,000 investment | |
| Service Class 2 | $ 13 | 0.25% | |
Key Fund Statistics (as of June 30, 2024)
KEY FACTS | | |
| Fund Size | $376,247,344 | |
| Number of Holdings | 14 | |
| Portfolio Turnover | 28% | |
What did the Fund invest in?
(as of June 30, 2024)
| Bond Funds | 32.0 |
| Domestic Equity Funds | 28.4 |
| International Equity Funds | 27.3 |
| Inflation-Protected Bond Funds | 12.3 |
| Short-Term Investments and Net Other Assets (Liabilities) | 0.0 |
ASSET ALLOCATION (% of Fund's net assets) |
|
|
TOP HOLDINGS (% of Fund's net assets) | | |
| VIP Investment Grade Bond II Portfolio - Initial Class | 21.2 | |
| VIP Overseas Portfolio - Initial Class | 17.6 | |
| Fidelity Inflation-Protected Bond Index Fund | 12.3 | |
| VIP Emerging Markets Portfolio - Initial Class | 9.7 | |
| VIP Growth Portfolio - Initial Class | 8.3 | |
| Fidelity Long-Term Treasury Bond Index Fund | 6.2 | |
| VIP Growth & Income Portfolio - Initial Class | 5.6 | |
| VIP Contrafund Portfolio - Initial Class | 5.0 | |
| VIP Equity-Income Portfolio - Initial Class | 4.1 | |
| Fidelity International Bond Index Fund | 2.9 | |
| | 92.9 | |
| |
| Fidelity, the Fidelity Investments Logo and all other Fidelity trademarks or service marks used herein are trademarks or service marks of FMR LLC. Any third-party marks that are used herein are trademarks or service marks of their respective owners. © 2024 FMR LLC. All rights reserved. |
| | For additional information about the Fund; including its prospectus, financial information, holdings and proxy information, scan the QR code or visit fundresearch.fidelity.com/prospectus/sec 1.9916086.100 1434-TSRS-0824 |
| |
| | SEMI-ANNUAL SHAREHOLDER REPORT | AS OF JUNE 30, 2024 | |
| | VIP FundsManager® 50% Portfolio VIP FundsManager® 50% Portfolio Service Class 2 true |
| | | |
This semi-annual shareholder report contains information about VIP FundsManager® 50% Portfolio for the period January 1, 2024 to June 30, 2024. You can find additional information about the Fund at fundresearch.fidelity.com/prospectus/sec. You can also request this information by contacting us at 1-877-208-0098 or by sending an e-mail to funddocuments@fmr.com.
What were your Fund costs for the last six months?(based on hypothetical $10,000 investment)
| | Costs of a $10,000 investment | Costs paid as a percentage of a $10,000 investment | |
| Service Class 2 | $ 13 | 0.25% | |
Key Fund Statistics (as of June 30, 2024)
KEY FACTS | | |
| Fund Size | $4,160,329,251 | |
| Number of Holdings | 35 | |
| Portfolio Turnover | 14% | |
What did the Fund invest in?
(as of June 30, 2024)
| Bond Funds | 37.8 |
| Domestic Equity Funds | 33.1 |
| International Equity Funds | 22.6 |
| Other Investments | 1.3 |
| Inflation-Protected Bond Funds | 1.0 |
| Short-Term Investments and Net Other Assets (Liabilities) | 4.2 |
ASSET ALLOCATION (% of Fund's net assets) |
|
|
TOP HOLDINGS (% of Fund's net assets) | | |
| VIP Stock Selector All Cap Portfolio - Investor Class | 27.3 | |
| VIP Investment Grade Bond II Portfolio - Investor Class | 17.6 | |
| Fidelity Total Bond Fund | 17.6 | |
| Fidelity Overseas Fund | 6.5 | |
| Fidelity Emerging Markets Fund | 5.8 | |
| Fidelity Enhanced International ETF | 2.0 | |
| Fidelity International Discovery Fund | 1.6 | |
| Fidelity Contrafund | 1.5 | |
| Fidelity Low-Priced Stock Fund | 1.4 | |
| Fidelity International Capital Appreciation Fund | 1.3 | |
| | 82.6 | |
| |
| Fidelity, the Fidelity Investments Logo and all other Fidelity trademarks or service marks used herein are trademarks or service marks of FMR LLC. Any third-party marks that are used herein are trademarks or service marks of their respective owners. © 2024 FMR LLC. All rights reserved. |
| | For additional information about the Fund; including its prospectus, financial information, holdings and proxy information, scan the QR code or visit fundresearch.fidelity.com/prospectus/sec 1.9916109.100 1589-TSRS-0824 |
| |
| | SEMI-ANNUAL SHAREHOLDER REPORT | AS OF JUNE 30, 2024 | |
| | VIP Investor Freedom 2040 Portfolio℠ VIP Investor Freedom 2040 Portfolio℠ true |
| | | |
This semi-annual shareholder report contains information about VIP Investor Freedom 2040 Portfolio℠ for the period January 1, 2024 to June 30, 2024. You can find additional information about the Fund at fundresearch.fidelity.com/prospectus/sec. You can also request this information by contacting us at 1-877-208-0098 or by sending an e-mail to funddocuments@fmr.com.
What were your Fund costs for the last six months?(based on hypothetical $10,000 investment)
| | Costs of a $10,000 investment | Costs paid as a percentage of a $10,000 investment | |
| VIP Investor Freedom 2040 Portfolio℠ | $ 0 A | 0.00%B | |
A Amount represents less than $.50
B Amount represents less than 0.005%
Key Fund Statistics (as of June 30, 2024)
KEY FACTS | | |
| Fund Size | $10,346,682 | |
| Number of Holdings | 14 | |
| Portfolio Turnover | 25% | |
What did the Fund invest in?
(as of June 30, 2024)
| Domestic Equity Funds | 47.4 |
| International Equity Funds | 40.0 |
| Bond Funds | 10.5 |
| Inflation-Protected Bond Funds | 2.1 |
| Short-Term Investments and Net Other Assets (Liabilities) | 0.0 |
ASSET ALLOCATION (% of Fund's net assets) |
|
|
TOP HOLDINGS (% of Fund's net assets) | | |
| VIP Overseas Portfolio - Investor Class | 26.7 | |
| VIP Growth Portfolio - Investor Class | 13.9 | |
| VIP Emerging Markets Portfolio - Investor Class | 13.3 | |
| VIP Growth & Income Portfolio - Investor Class | 9.3 | |
| VIP Contrafund Portfolio - Investor Class | 8.3 | |
| VIP Equity Income Portfolio - Investor Class | 6.7 | |
| Fidelity Long-Term Treasury Bond Index Fund | 6.6 | |
| VIP Value Portfolio - Investor Class | 4.7 | |
| VIP Investment Grade Bond II Portfolio - Investor Class | 2.6 | |
| VIP Value Strategies Portfolio - Investor Class | 2.4 | |
| | 94.5 | |
| |
| Fidelity, the Fidelity Investments Logo and all other Fidelity trademarks or service marks used herein are trademarks or service marks of FMR LLC. Any third-party marks that are used herein are trademarks or service marks of their respective owners. © 2024 FMR LLC. All rights reserved. |
| | For additional information about the Fund; including its prospectus, financial information, holdings and proxy information, scan the QR code or visit fundresearch.fidelity.com/prospectus/sec 1.9916207.100 6575-TSRS-0824 |
| |
| | SEMI-ANNUAL SHAREHOLDER REPORT | AS OF JUNE 30, 2024 | |
| | VIP FundsManager® 70% Portfolio VIP FundsManager® 70% Portfolio Service Class true |
| | | |
This semi-annual shareholder report contains information about VIP FundsManager® 70% Portfolio for the period January 1, 2024 to June 30, 2024. You can find additional information about the Fund at fundresearch.fidelity.com/prospectus/sec. You can also request this information by contacting us at 1-877-208-0098 or by sending an e-mail to funddocuments@fmr.com.
What were your Fund costs for the last six months?(based on hypothetical $10,000 investment)
| | Costs of a $10,000 investment | Costs paid as a percentage of a $10,000 investment | |
| Service Class | $ 5 | 0.10% | |
Key Fund Statistics (as of June 30, 2024)
KEY FACTS | | |
| Fund Size | $2,203,049,276 | |
| Number of Holdings | 33 | |
| Portfolio Turnover | 25% | |
What did the Fund invest in?
(as of June 30, 2024)
| Domestic Equity Funds | 45.1 |
| International Equity Funds | 27.6 |
| Bond Funds | 22.0 |
| Inflation-Protected Bond Funds | 1.5 |
| Other Investments | 1.3 |
| Short-Term Investments and Net Other Assets (Liabilities) | 2.5 |
ASSET ALLOCATION (% of Fund's net assets) |
|
|
TOP HOLDINGS (% of Fund's net assets) | | |
| VIP Stock Selector All Cap Portfolio - Investor Class | 38.2 | |
| VIP Investment Grade Bond II Portfolio - Investor Class | 10.0 | |
| Fidelity Total Bond Fund | 10.0 | |
| Fidelity Overseas Fund | 8.4 | |
| Fidelity Emerging Markets Fund | 7.7 | |
| Fidelity Contrafund | 2.2 | |
| Fidelity Enhanced International ETF | 2.1 | |
| Fidelity International Discovery Fund | 2.1 | |
| Fidelity Low-Priced Stock Fund | 2.0 | |
| Fidelity International Capital Appreciation Fund | 1.7 | |
| | 84.4 | |
| |
| Fidelity, the Fidelity Investments Logo and all other Fidelity trademarks or service marks used herein are trademarks or service marks of FMR LLC. Any third-party marks that are used herein are trademarks or service marks of their respective owners. © 2024 FMR LLC. All rights reserved. |
| | For additional information about the Fund; including its prospectus, financial information, holdings and proxy information, scan the QR code or visit fundresearch.fidelity.com/prospectus/sec 1.9916111.100 1591-TSRS-0824 |
| |
| | SEMI-ANNUAL SHAREHOLDER REPORT | AS OF JUNE 30, 2024 | |
| | VIP Freedom 2025 Portfolio℠ VIP Freedom 2025 Portfolio℠ Initial Class true |
| | | |
This semi-annual shareholder report contains information about VIP Freedom 2025 Portfolio℠ for the period January 1, 2024 to June 30, 2024. You can find additional information about the Fund at fundresearch.fidelity.com/prospectus/sec. You can also request this information by contacting us at 1-877-208-0098 or by sending an e-mail to funddocuments@fmr.com.
What were your Fund costs for the last six months?(based on hypothetical $10,000 investment)
| | Costs of a $10,000 investment | Costs paid as a percentage of a $10,000 investment | |
| Initial Class | $ 0 A | 0.00%B | |
AAmount represents less than $.50
BAmount represents less than 0.005%
Key Fund Statistics (as of June 30, 2024)
KEY FACTS | | |
| Fund Size | $376,247,344 | |
| Number of Holdings | 14 | |
| Portfolio Turnover | 28% | |
What did the Fund invest in?
(as of June 30, 2024)
| Bond Funds | 32.0 |
| Domestic Equity Funds | 28.4 |
| International Equity Funds | 27.3 |
| Inflation-Protected Bond Funds | 12.3 |
| Short-Term Investments and Net Other Assets (Liabilities) | 0.0 |
ASSET ALLOCATION (% of Fund's net assets) |
|
|
TOP HOLDINGS (% of Fund's net assets) | | |
| VIP Investment Grade Bond II Portfolio - Initial Class | 21.2 | |
| VIP Overseas Portfolio - Initial Class | 17.6 | |
| Fidelity Inflation-Protected Bond Index Fund | 12.3 | |
| VIP Emerging Markets Portfolio - Initial Class | 9.7 | |
| VIP Growth Portfolio - Initial Class | 8.3 | |
| Fidelity Long-Term Treasury Bond Index Fund | 6.2 | |
| VIP Growth & Income Portfolio - Initial Class | 5.6 | |
| VIP Contrafund Portfolio - Initial Class | 5.0 | |
| VIP Equity-Income Portfolio - Initial Class | 4.1 | |
| Fidelity International Bond Index Fund | 2.9 | |
| | 92.9 | |
| |
| Fidelity, the Fidelity Investments Logo and all other Fidelity trademarks or service marks used herein are trademarks or service marks of FMR LLC. Any third-party marks that are used herein are trademarks or service marks of their respective owners. © 2024 FMR LLC. All rights reserved. |
| | For additional information about the Fund; including its prospectus, financial information, holdings and proxy information, scan the QR code or visit fundresearch.fidelity.com/prospectus/sec 1.9916084.100 1432-TSRS-0824 |
| |
| | SEMI-ANNUAL SHAREHOLDER REPORT | AS OF JUNE 30, 2024 | |
| | VIP FundsManager® 85% Portfolio VIP FundsManager® 85% Portfolio Service Class true |
| | | |
This semi-annual shareholder report contains information about VIP FundsManager® 85% Portfolio for the period January 1, 2024 to June 30, 2024. You can find additional information about the Fund at fundresearch.fidelity.com/prospectus/sec. You can also request this information by contacting us at 1-877-208-0098 or by sending an e-mail to funddocuments@fmr.com.
What were your Fund costs for the last six months?(based on hypothetical $10,000 investment)
| | Costs of a $10,000 investment | Costs paid as a percentage of a $10,000 investment | |
| Service Class | $ 5 | 0.10% | |
Key Fund Statistics (as of June 30, 2024)
KEY FACTS | | |
| Fund Size | $903,040,010 | |
| Number of Holdings | 36 | |
| Portfolio Turnover | 35% | |
What did the Fund invest in?
(as of June 30, 2024)
| Domestic Equity Funds | 54.1 |
| International Equity Funds | 31.9 |
| Bond Funds | 10.6 |
| Inflation-Protected Bond Funds | 1.5 |
| Other Investments | 1.3 |
| Short-Term Investments and Net Other Assets (Liabilities) | 0.6 |
ASSET ALLOCATION (% of Fund's net assets) |
|
|
TOP HOLDINGS (% of Fund's net assets) | | |
| VIP Stock Selector All Cap Portfolio - Investor Class | 46.3 | |
| Fidelity Overseas Fund | 9.4 | |
| Fidelity Emerging Markets Fund | 9.4 | |
| VIP Investment Grade Bond II Portfolio - Investor Class | 4.8 | |
| Fidelity Total Bond Fund | 4.8 | |
| Fidelity Contrafund | 2.6 | |
| Fidelity Low-Priced Stock Fund | 2.5 | |
| Fidelity International Discovery Fund | 2.4 | |
| Fidelity Enhanced International ETF | 2.3 | |
| Fidelity International Capital Appreciation Fund | 2.0 | |
| | 86.5 | |
| |
| Fidelity, the Fidelity Investments Logo and all other Fidelity trademarks or service marks used herein are trademarks or service marks of FMR LLC. Any third-party marks that are used herein are trademarks or service marks of their respective owners. © 2024 FMR LLC. All rights reserved. |
| | For additional information about the Fund; including its prospectus, financial information, holdings and proxy information, scan the QR code or visit fundresearch.fidelity.com/prospectus/sec 1.9916114.100 1594-TSRS-0824 |
| |
| | SEMI-ANNUAL SHAREHOLDER REPORT | AS OF JUNE 30, 2024 | |
| | VIP Freedom 2040 Portfolio℠ VIP Freedom 2040 Portfolio℠ Initial Class true |
| | | |
This semi-annual shareholder report contains information about VIP Freedom 2040 Portfolio℠ for the period January 1, 2024 to June 30, 2024. You can find additional information about the Fund at fundresearch.fidelity.com/prospectus/sec. You can also request this information by contacting us at 1-877-208-0098 or by sending an e-mail to funddocuments@fmr.com.
What were your Fund costs for the last six months?(based on hypothetical $10,000 investment)
| | Costs of a $10,000 investment | Costs paid as a percentage of a $10,000 investment | |
| Initial Class | $ 0 A | 0.00%B | |
AAmount represents less than $.50
BAmount represents less than 0.005%
Key Fund Statistics (as of June 30, 2024)
KEY FACTS | | |
| Fund Size | $320,584,994 | |
| Number of Holdings | 14 | |
| Portfolio Turnover | 34% | |
What did the Fund invest in?
(as of June 30, 2024)
| Domestic Equity Funds | 47.3 |
| International Equity Funds | 40.1 |
| Bond Funds | 10.5 |
| Inflation-Protected Bond Funds | 2.1 |
| Short-Term Investments and Net Other Assets (Liabilities) | 0.0 |
ASSET ALLOCATION (% of Fund's net assets) |
|
|
TOP HOLDINGS (% of Fund's net assets) | | |
| VIP Overseas Portfolio - Initial Class | 26.7 | |
| VIP Growth Portfolio - Initial Class | 13.8 | |
| VIP Emerging Markets Portfolio - Initial Class | 13.4 | |
| VIP Growth & Income Portfolio - Initial Class | 9.3 | |
| VIP Contrafund Portfolio - Initial Class | 8.3 | |
| VIP Equity-Income Portfolio - Initial Class | 6.7 | |
| Fidelity Long-Term Treasury Bond Index Fund | 6.6 | |
| VIP Value Portfolio - Initial Class | 4.7 | |
| VIP Investment Grade Bond II Portfolio - Initial Class | 2.6 | |
| VIP Value Strategies Portfolio - Initial Class | 2.4 | |
| | 94.5 | |
| |
| Fidelity, the Fidelity Investments Logo and all other Fidelity trademarks or service marks used herein are trademarks or service marks of FMR LLC. Any third-party marks that are used herein are trademarks or service marks of their respective owners. © 2024 FMR LLC. All rights reserved. |
| | For additional information about the Fund; including its prospectus, financial information, holdings and proxy information, scan the QR code or visit fundresearch.fidelity.com/prospectus/sec 1.9916134.100 2162-TSRS-0824 |
| |
| | SEMI-ANNUAL SHAREHOLDER REPORT | AS OF JUNE 30, 2024 | |
| | VIP Investor Freedom 2045 Portfolio℠ VIP Investor Freedom 2045 Portfolio℠ true |
| | | |
This semi-annual shareholder report contains information about VIP Investor Freedom 2045 Portfolio℠ for the period January 1, 2024 to June 30, 2024. You can find additional information about the Fund at fundresearch.fidelity.com/prospectus/sec. You can also request this information by contacting us at 1-877-208-0098 or by sending an e-mail to funddocuments@fmr.com.
What were your Fund costs for the last six months?(based on hypothetical $10,000 investment)
| | Costs of a $10,000 investment | Costs paid as a percentage of a $10,000 investment | |
| VIP Investor Freedom 2045 Portfolio℠ | $ 0 A | 0.00%B | |
A Amount represents less than $.50
B Amount represents less than 0.005%
Key Fund Statistics (as of June 30, 2024)
KEY FACTS | | |
| Fund Size | $4,048,339 | |
| Number of Holdings | 13 | |
| Portfolio Turnover | 23% | |
What did the Fund invest in?
(as of June 30, 2024)
| Domestic Equity Funds | 50.5 |
| International Equity Funds | 42.5 |
| Bond Funds | 5.8 |
| Inflation-Protected Bond Funds | 1.2 |
| Short-Term Investments and Net Other Assets (Liabilities) | 0.0 |
ASSET ALLOCATION (% of Fund's net assets) |
|
|
TOP HOLDINGS (% of Fund's net assets) | | |
| VIP Overseas Portfolio - Investor Class | 28.5 | |
| VIP Growth Portfolio - Investor Class | 14.7 | |
| VIP Emerging Markets Portfolio - Investor Class | 14.0 | |
| VIP Growth & Income Portfolio - Investor Class | 9.9 | |
| VIP Contrafund Portfolio - Investor Class | 8.8 | |
| VIP Equity Income Portfolio - Investor Class | 7.2 | |
| Fidelity Long-Term Treasury Bond Index Fund | 5.5 | |
| VIP Value Portfolio - Investor Class | 5.1 | |
| VIP Value Strategies Portfolio - Investor Class | 2.5 | |
| VIP Mid Cap Portfolio - Investor Class | 2.3 | |
| | 98.5 | |
| |
| Fidelity, the Fidelity Investments Logo and all other Fidelity trademarks or service marks used herein are trademarks or service marks of FMR LLC. Any third-party marks that are used herein are trademarks or service marks of their respective owners. © 2024 FMR LLC. All rights reserved. |
| | For additional information about the Fund; including its prospectus, financial information, holdings and proxy information, scan the QR code or visit fundresearch.fidelity.com/prospectus/sec 1.9916208.100 6576-TSRS-0824 |
| |
| | SEMI-ANNUAL SHAREHOLDER REPORT | AS OF JUNE 30, 2024 | |
| | VIP Freedom 2060 Portfolio℠ VIP Freedom 2060 Portfolio℠ Service Class true |
| | | |
This semi-annual shareholder report contains information about VIP Freedom 2060 Portfolio℠ for the period January 1, 2024 to June 30, 2024. You can find additional information about the Fund at fundresearch.fidelity.com/prospectus/sec. You can also request this information by contacting us at 1-877-208-0098 or by sending an e-mail to funddocuments@fmr.com.
What were your Fund costs for the last six months?(based on hypothetical $10,000 investment)
| | Costs of a $10,000 investment | Costs paid as a percentage of a $10,000 investment | |
| Service Class | $ 5 | 0.09% | |
Key Fund Statistics (as of June 30, 2024)
KEY FACTS | | |
| Fund Size | $22,731,798 | |
| Number of Holdings | 14 | |
| Portfolio Turnover | 61% | |
What did the Fund invest in?
(as of June 30, 2024)
| Domestic Equity Funds | 50.5 |
| International Equity Funds | 42.5 |
| Bond Funds | 5.8 |
| Inflation-Protected Bond Funds | 1.2 |
| Short-Term Investments and Net Other Assets (Liabilities) | 0.0 |
ASSET ALLOCATION (% of Fund's net assets) |
|
|
TOP HOLDINGS (% of Fund's net assets) | | |
| VIP Overseas Portfolio - Initial Class | 28.5 | |
| VIP Growth Portfolio - Initial Class | 14.7 | |
| VIP Emerging Markets Portfolio - Initial Class | 14.0 | |
| VIP Growth & Income Portfolio - Initial Class | 9.9 | |
| VIP Contrafund Portfolio - Initial Class | 8.8 | |
| VIP Equity-Income Portfolio - Initial Class | 7.2 | |
| Fidelity Long-Term Treasury Bond Index Fund | 5.5 | |
| VIP Value Portfolio - Initial Class | 5.1 | |
| VIP Value Strategies Portfolio - Initial Class | 2.5 | |
| VIP Mid Cap Portfolio - Initial Class | 2.3 | |
| | 98.5 | |
| |
| Fidelity, the Fidelity Investments Logo and all other Fidelity trademarks or service marks used herein are trademarks or service marks of FMR LLC. Any third-party marks that are used herein are trademarks or service marks of their respective owners. © 2024 FMR LLC. All rights reserved. |
| | For additional information about the Fund; including its prospectus, financial information, holdings and proxy information, scan the QR code or visit fundresearch.fidelity.com/prospectus/sec 1.9916189.100 3365-TSRS-0824 |
| |
| | SEMI-ANNUAL SHAREHOLDER REPORT | AS OF JUNE 30, 2024 | |
| | VIP FundsManager® 50% Portfolio VIP FundsManager® 50% Portfolio Investor Class true |
| | | |
This semi-annual shareholder report contains information about VIP FundsManager® 50% Portfolio for the period January 1, 2024 to June 30, 2024. You can find additional information about the Fund at fundresearch.fidelity.com/prospectus/sec. You can also request this information by contacting us at 1-877-208-0098 or by sending an e-mail to funddocuments@fmr.com.
What were your Fund costs for the last six months?(based on hypothetical $10,000 investment)
| | Costs of a $10,000 investment | Costs paid as a percentage of a $10,000 investment | |
| Investor Class | $ 5 | 0.10% | |
Key Fund Statistics (as of June 30, 2024)
KEY FACTS | | |
| Fund Size | $4,160,329,251 | |
| Number of Holdings | 35 | |
| Portfolio Turnover | 14% | |
What did the Fund invest in?
(as of June 30, 2024)
| Bond Funds | 37.8 |
| Domestic Equity Funds | 33.1 |
| International Equity Funds | 22.6 |
| Other Investments | 1.3 |
| Inflation-Protected Bond Funds | 1.0 |
| Short-Term Investments and Net Other Assets (Liabilities) | 4.2 |
ASSET ALLOCATION (% of Fund's net assets) |
|
|
TOP HOLDINGS (% of Fund's net assets) | | |
| VIP Stock Selector All Cap Portfolio - Investor Class | 27.3 | |
| VIP Investment Grade Bond II Portfolio - Investor Class | 17.6 | |
| Fidelity Total Bond Fund | 17.6 | |
| Fidelity Overseas Fund | 6.5 | |
| Fidelity Emerging Markets Fund | 5.8 | |
| Fidelity Enhanced International ETF | 2.0 | |
| Fidelity International Discovery Fund | 1.6 | |
| Fidelity Contrafund | 1.5 | |
| Fidelity Low-Priced Stock Fund | 1.4 | |
| Fidelity International Capital Appreciation Fund | 1.3 | |
| | 82.6 | |
| |
| Fidelity, the Fidelity Investments Logo and all other Fidelity trademarks or service marks used herein are trademarks or service marks of FMR LLC. Any third-party marks that are used herein are trademarks or service marks of their respective owners. © 2024 FMR LLC. All rights reserved. |
| | For additional information about the Fund; including its prospectus, financial information, holdings and proxy information, scan the QR code or visit fundresearch.fidelity.com/prospectus/sec 1.9916107.100 1587-TSRS-0824 |
| |
| | SEMI-ANNUAL SHAREHOLDER REPORT | AS OF JUNE 30, 2024 | |
| | VIP Freedom 2025 Portfolio℠ VIP Freedom 2025 Portfolio℠ Service Class true |
| | | |
This semi-annual shareholder report contains information about VIP Freedom 2025 Portfolio℠ for the period January 1, 2024 to June 30, 2024. You can find additional information about the Fund at fundresearch.fidelity.com/prospectus/sec. You can also request this information by contacting us at 1-877-208-0098 or by sending an e-mail to funddocuments@fmr.com.
What were your Fund costs for the last six months?(based on hypothetical $10,000 investment)
| | Costs of a $10,000 investment | Costs paid as a percentage of a $10,000 investment | |
| Service Class | $ 5 | 0.10% | |
Key Fund Statistics (as of June 30, 2024)
KEY FACTS | | |
| Fund Size | $376,247,344 | |
| Number of Holdings | 14 | |
| Portfolio Turnover | 28% | |
What did the Fund invest in?
(as of June 30, 2024)
| Bond Funds | 32.0 |
| Domestic Equity Funds | 28.4 |
| International Equity Funds | 27.3 |
| Inflation-Protected Bond Funds | 12.3 |
| Short-Term Investments and Net Other Assets (Liabilities) | 0.0 |
ASSET ALLOCATION (% of Fund's net assets) |
|
|
TOP HOLDINGS (% of Fund's net assets) | | |
| VIP Investment Grade Bond II Portfolio - Initial Class | 21.2 | |
| VIP Overseas Portfolio - Initial Class | 17.6 | |
| Fidelity Inflation-Protected Bond Index Fund | 12.3 | |
| VIP Emerging Markets Portfolio - Initial Class | 9.7 | |
| VIP Growth Portfolio - Initial Class | 8.3 | |
| Fidelity Long-Term Treasury Bond Index Fund | 6.2 | |
| VIP Growth & Income Portfolio - Initial Class | 5.6 | |
| VIP Contrafund Portfolio - Initial Class | 5.0 | |
| VIP Equity-Income Portfolio - Initial Class | 4.1 | |
| Fidelity International Bond Index Fund | 2.9 | |
| | 92.9 | |
| |
| Fidelity, the Fidelity Investments Logo and all other Fidelity trademarks or service marks used herein are trademarks or service marks of FMR LLC. Any third-party marks that are used herein are trademarks or service marks of their respective owners. © 2024 FMR LLC. All rights reserved. |
| | For additional information about the Fund; including its prospectus, financial information, holdings and proxy information, scan the QR code or visit fundresearch.fidelity.com/prospectus/sec 1.9916085.100 1433-TSRS-0824 |
| |
| | SEMI-ANNUAL SHAREHOLDER REPORT | AS OF JUNE 30, 2024 | |
| | VIP Freedom 2040 Portfolio℠ VIP Freedom 2040 Portfolio℠ Service Class true |
| | | |
This semi-annual shareholder report contains information about VIP Freedom 2040 Portfolio℠ for the period January 1, 2024 to June 30, 2024. You can find additional information about the Fund at fundresearch.fidelity.com/prospectus/sec. You can also request this information by contacting us at 1-877-208-0098 or by sending an e-mail to funddocuments@fmr.com.
What were your Fund costs for the last six months?(based on hypothetical $10,000 investment)
| | Costs of a $10,000 investment | Costs paid as a percentage of a $10,000 investment | |
| Service Class | $ 5 | 0.10% | |
Key Fund Statistics (as of June 30, 2024)
KEY FACTS | | |
| Fund Size | $320,584,994 | |
| Number of Holdings | 14 | |
| Portfolio Turnover | 34% | |
What did the Fund invest in?
(as of June 30, 2024)
| Domestic Equity Funds | 47.3 |
| International Equity Funds | 40.1 |
| Bond Funds | 10.5 |
| Inflation-Protected Bond Funds | 2.1 |
| Short-Term Investments and Net Other Assets (Liabilities) | 0.0 |
ASSET ALLOCATION (% of Fund's net assets) |
|
|
TOP HOLDINGS (% of Fund's net assets) | | |
| VIP Overseas Portfolio - Initial Class | 26.7 | |
| VIP Growth Portfolio - Initial Class | 13.8 | |
| VIP Emerging Markets Portfolio - Initial Class | 13.4 | |
| VIP Growth & Income Portfolio - Initial Class | 9.3 | |
| VIP Contrafund Portfolio - Initial Class | 8.3 | |
| VIP Equity-Income Portfolio - Initial Class | 6.7 | |
| Fidelity Long-Term Treasury Bond Index Fund | 6.6 | |
| VIP Value Portfolio - Initial Class | 4.7 | |
| VIP Investment Grade Bond II Portfolio - Initial Class | 2.6 | |
| VIP Value Strategies Portfolio - Initial Class | 2.4 | |
| | 94.5 | |
| |
| Fidelity, the Fidelity Investments Logo and all other Fidelity trademarks or service marks used herein are trademarks or service marks of FMR LLC. Any third-party marks that are used herein are trademarks or service marks of their respective owners. © 2024 FMR LLC. All rights reserved. |
| | For additional information about the Fund; including its prospectus, financial information, holdings and proxy information, scan the QR code or visit fundresearch.fidelity.com/prospectus/sec 1.9916135.100 2163-TSRS-0824 |
| |
| | SEMI-ANNUAL SHAREHOLDER REPORT | AS OF JUNE 30, 2024 | |
| | VIP Freedom 2050 Portfolio℠ VIP Freedom 2050 Portfolio℠ Initial Class true |
| | | |
This semi-annual shareholder report contains information about VIP Freedom 2050 Portfolio℠ for the period January 1, 2024 to June 30, 2024. You can find additional information about the Fund at fundresearch.fidelity.com/prospectus/sec. You can also request this information by contacting us at 1-877-208-0098 or by sending an e-mail to funddocuments@fmr.com.
What were your Fund costs for the last six months?(based on hypothetical $10,000 investment)
| | Costs of a $10,000 investment | Costs paid as a percentage of a $10,000 investment | |
| Initial Class | $ 0 A | 0.00%B | |
AAmount represents less than $.50
BAmount represents less than 0.005%
Key Fund Statistics (as of June 30, 2024)
KEY FACTS | | |
| Fund Size | $157,004,633 | |
| Number of Holdings | 13 | |
| Portfolio Turnover | 30% | |
What did the Fund invest in?
(as of June 30, 2024)
| Domestic Equity Funds | 50.5 |
| International Equity Funds | 42.5 |
| Bond Funds | 5.8 |
| Inflation-Protected Bond Funds | 1.2 |
| Short-Term Investments and Net Other Assets (Liabilities) | 0.0 |
ASSET ALLOCATION (% of Fund's net assets) |
|
|
TOP HOLDINGS (% of Fund's net assets) | | |
| VIP Overseas Portfolio - Initial Class | 28.5 | |
| VIP Growth Portfolio - Initial Class | 14.7 | |
| VIP Emerging Markets Portfolio - Initial Class | 14.0 | |
| VIP Growth & Income Portfolio - Initial Class | 9.9 | |
| VIP Contrafund Portfolio - Initial Class | 8.8 | |
| VIP Equity-Income Portfolio - Initial Class | 7.2 | |
| Fidelity Long-Term Treasury Bond Index Fund | 5.5 | |
| VIP Value Portfolio - Initial Class | 5.1 | |
| VIP Value Strategies Portfolio - Initial Class | 2.5 | |
| VIP Mid Cap Portfolio - Initial Class | 2.3 | |
| | 98.5 | |
| |
| Fidelity, the Fidelity Investments Logo and all other Fidelity trademarks or service marks used herein are trademarks or service marks of FMR LLC. Any third-party marks that are used herein are trademarks or service marks of their respective owners. © 2024 FMR LLC. All rights reserved. |
| | For additional information about the Fund; including its prospectus, financial information, holdings and proxy information, scan the QR code or visit fundresearch.fidelity.com/prospectus/sec 1.9916140.100 2168-TSRS-0824 |
| |
| | SEMI-ANNUAL SHAREHOLDER REPORT | AS OF JUNE 30, 2024 | |
| | VIP Freedom Lifetime Income® II Portfolio VIP Freedom Lifetime Income® II Portfolio true |
| | | |
This semi-annual shareholder report contains information about VIP Freedom Lifetime Income® II Portfolio for the period January 1, 2024 to June 30, 2024. You can find additional information about the Fund at fundresearch.fidelity.com/prospectus/sec. You can also request this information by contacting us at 1-877-208-0098 or by sending an e-mail to funddocuments@fmr.com.
What were your Fund costs for the last six months?(based on hypothetical $10,000 investment)
| | Costs of a $10,000 investment | Costs paid as a percentage of a $10,000 investment | |
| VIP Freedom Lifetime Income® II Portfolio | $ 0 A | 0.00%B | |
A Amount represents less than $.50
B Amount represents less than 0.005%
Key Fund Statistics (as of June 30, 2024)
KEY FACTS | | |
| Fund Size | $25,997,122 | |
| Number of Holdings | 15 | |
| Portfolio Turnover | 19% | |
What did the Fund invest in?
(as of June 30, 2024)
| Bond Funds | 43.9 |
| International Equity Funds | 17.5 |
| Inflation-Protected Bond Funds | 15.0 |
| Domestic Equity Funds | 13.9 |
| Short-Term Investments and Net Other Assets (Liabilities) | 9.7 |
ASSET ALLOCATION (% of Fund's net assets) |
|
|
TOP HOLDINGS (% of Fund's net assets) | | |
| VIP Investment Grade Bond II Portfolio - Investor Class | 37.3 | |
| Fidelity Inflation-Protected Bond Index Fund | 15.0 | |
| VIP Overseas Portfolio - Investor Class | 10.6 | |
| VIP Emerging Markets Portfolio - Investor Class | 6.9 | |
| VIP Growth Portfolio - Investor Class | 4.1 | |
| VIP Growth & Income Portfolio - Investor Class | 2.7 | |
| Fidelity Long-Term Treasury Bond Index Fund | 2.5 | |
| Fidelity International Bond Index Fund | 2.4 | |
| VIP Contrafund Portfolio - Investor Class | 2.4 | |
| VIP Equity Income Portfolio - Investor Class | 2.0 | |
| | 85.9 | |
| |
| Fidelity, the Fidelity Investments Logo and all other Fidelity trademarks or service marks used herein are trademarks or service marks of FMR LLC. Any third-party marks that are used herein are trademarks or service marks of their respective owners. © 2024 FMR LLC. All rights reserved. |
| | For additional information about the Fund; including its prospectus, financial information, holdings and proxy information, scan the QR code or visit fundresearch.fidelity.com/prospectus/sec 1.9916091.100 1493-TSRS-0824 |
| |
| | SEMI-ANNUAL SHAREHOLDER REPORT | AS OF JUNE 30, 2024 | |
| | VIP FundsManager® 20% Portfolio VIP FundsManager® 20% Portfolio Investor Class true |
| | | |
This semi-annual shareholder report contains information about VIP FundsManager® 20% Portfolio for the period January 1, 2024 to June 30, 2024. You can find additional information about the Fund at fundresearch.fidelity.com/prospectus/sec. You can also request this information by contacting us at 1-877-208-0098 or by sending an e-mail to funddocuments@fmr.com.
What were your Fund costs for the last six months?(based on hypothetical $10,000 investment)
| | Costs of a $10,000 investment | Costs paid as a percentage of a $10,000 investment | |
| Investor Class | $ 5 | 0.10% | |
Key Fund Statistics (as of June 30, 2024)
KEY FACTS | | |
| Fund Size | $706,024,127 | |
| Number of Holdings | 32 | |
| Portfolio Turnover | 17% | |
What did the Fund invest in?
(as of June 30, 2024)
| Bond Funds | 49.7 |
| Domestic Equity Funds | 15.0 |
| International Equity Funds | 8.7 |
| Other Investments | 1.3 |
| Inflation-Protected Bond Funds | 0.7 |
| Short-Term Investments and Net Other Assets (Liabilities) | 24.6 |
ASSET ALLOCATION (% of Fund's net assets) |
|
|
TOP HOLDINGS (% of Fund's net assets) | | |
| VIP Investment Grade Bond II Portfolio - Investor Class | 23.6 | |
| Fidelity Total Bond Fund | 23.5 | |
| VIP Stock Selector All Cap Portfolio - Investor Class | 10.9 | |
| Fidelity Overseas Fund | 2.5 | |
| Fidelity Emerging Markets Fund | 1.9 | |
| Fidelity Floating Rate High Income Fund | 1.3 | |
| iShares Core S&P 500 ETF | 1.3 | |
| Fidelity Hedged Equity Fund | 1.3 | |
| Fidelity Emerging Markets Discovery Fund | 1.1 | |
| Fidelity High Income Fund | 0.8 | |
| | 68.2 | |
| |
| Fidelity, the Fidelity Investments Logo and all other Fidelity trademarks or service marks used herein are trademarks or service marks of FMR LLC. Any third-party marks that are used herein are trademarks or service marks of their respective owners. © 2024 FMR LLC. All rights reserved. |
| | For additional information about the Fund; including its prospectus, financial information, holdings and proxy information, scan the QR code or visit fundresearch.fidelity.com/prospectus/sec 1.9916104.100 1584-TSRS-0824 |
| |
| | SEMI-ANNUAL SHAREHOLDER REPORT | AS OF JUNE 30, 2024 | |
| | VIP Target Volatility Portfolio VIP Target Volatility Portfolio Service Class 2 true |
| | | |
This semi-annual shareholder report contains information about VIP Target Volatility Portfolio for the period January 1, 2024 to June 30, 2024. You can find additional information about the Fund at fundresearch.fidelity.com/prospectus/sec. You can also request this information by contacting us at 1-877-208-0098 or by sending an e-mail to funddocuments@fmr.com.
What were your Fund costs for the last six months?(based on hypothetical $10,000 investment)
| | Costs of a $10,000 investment | Costs paid as a percentage of a $10,000 investment | |
| Service Class 2 | $ 17 | 0.33% | |
Key Fund Statistics (as of June 30, 2024)
KEY FACTS | | |
| Fund Size | $189,335,510 | |
| Number of Holdings | 21 | |
| Portfolio Turnover | 18% | |
What did the Fund invest in?
(as of June 30, 2024)
| Domestic Equity Funds | 46.4 |
| International Equity Funds | 33.4 |
| Bond Funds | 18.9 |
| Other Investments | 0.3 |
| Short-Term Investments and Net Other Assets (Liabilities) | 1.0 |
ASSET ALLOCATION (% of Fund's net assets) |
|
|
TOP HOLDINGS (% of Fund's net assets) | | |
| VIP Stock Selector All Cap Portfolio - Investor Class | 30.9 | |
| Fidelity Total Bond Fund | 16.8 | |
| iShares Core S&P 500 ETF | 10.8 | |
| iShares Core MSCI EAFE ETF | 7.8 | |
| Fidelity Emerging Markets Fund | 7.7 | |
| Fidelity Overseas Fund | 6.5 | |
| Fidelity Enhanced International ETF | 3.9 | |
| Fidelity International Value Fund | 3.7 | |
| Fidelity Contrafund | 2.5 | |
| Fidelity Low-Priced Stock Fund | 2.0 | |
| | 92.6 | |
| |
| Fidelity, the Fidelity Investments Logo and all other Fidelity trademarks or service marks used herein are trademarks or service marks of FMR LLC. Any third-party marks that are used herein are trademarks or service marks of their respective owners. © 2024 FMR LLC. All rights reserved. |
| | For additional information about the Fund; including its prospectus, financial information, holdings and proxy information, scan the QR code or visit fundresearch.fidelity.com/prospectus/sec 1.9916154.100 2521-TSRS-0824 |
| |
| | SEMI-ANNUAL SHAREHOLDER REPORT | AS OF JUNE 30, 2024 | |
| | VIP Freedom 2015 Portfolio℠ VIP Freedom 2015 Portfolio℠ Service Class true |
| | | |
This semi-annual shareholder report contains information about VIP Freedom 2015 Portfolio℠ for the period January 1, 2024 to June 30, 2024. You can find additional information about the Fund at fundresearch.fidelity.com/prospectus/sec. You can also request this information by contacting us at 1-877-208-0098 or by sending an e-mail to funddocuments@fmr.com.
What were your Fund costs for the last six months?(based on hypothetical $10,000 investment)
| | Costs of a $10,000 investment | Costs paid as a percentage of a $10,000 investment | |
| Service Class | $ 5 | 0.10% | |
Key Fund Statistics (as of June 30, 2024)
KEY FACTS | | |
| Fund Size | $58,678,683 | |
| Number of Holdings | 15 | |
| Portfolio Turnover | 30% | |
What did the Fund invest in?
(as of June 30, 2024)
| Bond Funds | 42.1 |
| International Equity Funds | 20.3 |
| Domestic Equity Funds | 18.0 |
| Inflation-Protected Bond Funds | 14.4 |
| Short-Term Investments and Net Other Assets (Liabilities) | 5.2 |
ASSET ALLOCATION (% of Fund's net assets) |
|
|
TOP HOLDINGS (% of Fund's net assets) | | |
| VIP Investment Grade Bond II Portfolio - Initial Class | 35.1 | |
| Fidelity Inflation-Protected Bond Index Fund | 14.4 | |
| VIP Overseas Portfolio - Initial Class | 12.6 | |
| VIP Emerging Markets Portfolio - Initial Class | 7.7 | |
| VIP Growth Portfolio - Initial Class | 5.2 | |
| VIP Growth & Income Portfolio - Initial Class | 3.5 | |
| VIP Contrafund Portfolio - Initial Class | 3.2 | |
| Fidelity International Bond Index Fund | 2.7 | |
| VIP Equity-Income Portfolio - Initial Class | 2.6 | |
| Fidelity Long-Term Treasury Bond Index Fund | 2.6 | |
| | 89.6 | |
| |
| Fidelity, the Fidelity Investments Logo and all other Fidelity trademarks or service marks used herein are trademarks or service marks of FMR LLC. Any third-party marks that are used herein are trademarks or service marks of their respective owners. © 2024 FMR LLC. All rights reserved. |
| | For additional information about the Fund; including its prospectus, financial information, holdings and proxy information, scan the QR code or visit fundresearch.fidelity.com/prospectus/sec 1.9916079.100 1427-TSRS-0824 |
| |
| | SEMI-ANNUAL SHAREHOLDER REPORT | AS OF JUNE 30, 2024 | |
| | VIP Bond Index Portfolio VIP Bond Index Portfolio Service Class true |
| | | |
This semi-annual shareholder report contains information about VIP Bond Index Portfolio for the period January 1, 2024 to June 30, 2024. You can find additional information about the Fund at fundresearch.fidelity.com/prospectus/sec. You can also request this information by contacting us at 1-877-208-0098 or by sending an e-mail to funddocuments@fmr.com.
What were your Fund costs for the last six months?(based on hypothetical $10,000 investment)
| | Costs of a $10,000 investment | Costs paid as a percentage of a $10,000 investment | |
| Service Class | $ 12 | 0.24% | |
Key Fund Statistics (as of June 30, 2024)
KEY FACTS | | |
| Fund Size | $821,883,192 | |
| Number of Holdings | 2,765 | |
| Portfolio Turnover | 57% | |
What did the Fund invest in?
(as of June 30, 2024)
| U.S. Government and U.S. Government Agency Obligations | 67.6 |
| AAA | 2.9 |
| AA | 1.8 |
| A | 14.3 |
| BBB | 12.5 |
| BB | 0.4 |
| Not Rated | 0.8 |
QUALITY DIVERSIFICATION (% of Fund's net assets) |
|
| Short-Term Investments and Net Other Assets (Liabilities) - (0.3)%* |
| |
| We have used ratings from Moody's Investors Service, Inc. Where Moody's® ratings are not available, we have used S&P® ratings. All ratings are as of the date indicated and do not reflect subsequent changes. |
| U.S. Treasury Obligations | 41.2 |
| Corporate Bonds | 28.6 |
| U.S. Government Agency - Mortgage Securities | 25.5 |
| Foreign Government and Government Agency Obligations | 1.7 |
| CMOs and Other Mortgage Related Securities | 1.4 |
| U.S. Government Agency Obligations | 0.9 |
| Municipal Securities | 0.4 |
| Asset-Backed Securities | 0.3 |
| Other Investments | 0.3 |
ASSET ALLOCATION (% of Fund's net assets) |
|
| Short-Term Investments and Net Other Assets (Liabilities) - (0.3)% |
|
| United States | 92.4 |
| United Kingdom | 1.4 |
| Canada | 1.2 |
| Multi-national | 1.0 |
| Japan | 1.0 |
| Mexico | 0.5 |
| Germany | 0.4 |
| Switzerland | 0.2 |
| Australia | 0.2 |
| Others | 1.7 |
GEOGRAPHIC DIVERSIFICATION (% of Fund's net assets) |
|
| |
|
TOP HOLDINGS (% of Fund's net assets) | | |
| US Treasury Notes | 32.6 | |
| Fannie Mae Mortgage pass-thru certificates | 10.2 | |
| US Treasury Bonds | 8.6 | |
| Freddie Mac Gold Pool | 8.5 | |
| Ginnie Mae II Pool | 5.1 | |
| Freddie Mac Multifamily Structured Pass Through Certificates | 1.0 | |
| Bank of America Corp | 0.8 | |
| Ginnie Mae I Pool | 0.7 | |
| JPMorgan Chase & Co | 0.7 | |
| Wells Fargo & Co | 0.5 | |
| | 68.7 | |
| |
| Fidelity, the Fidelity Investments Logo and all other Fidelity trademarks or service marks used herein are trademarks or service marks of FMR LLC. Any third-party marks that are used herein are trademarks or service marks of their respective owners. © 2024 FMR LLC. All rights reserved. |
| | For additional information about the Fund; including its prospectus, financial information, holdings and proxy information, scan the QR code or visit fundresearch.fidelity.com/prospectus/sec 1.9916181.100 1019-TSRS-0824 |
| |
| | SEMI-ANNUAL SHAREHOLDER REPORT | AS OF JUNE 30, 2024 | |
| | VIP Investor Freedom 2035 Portfolio℠ VIP Investor Freedom 2035 Portfolio℠ true |
| | | |
This semi-annual shareholder report contains information about VIP Investor Freedom 2035 Portfolio℠ for the period January 1, 2024 to June 30, 2024. You can find additional information about the Fund at fundresearch.fidelity.com/prospectus/sec. You can also request this information by contacting us at 1-877-208-0098 or by sending an e-mail to funddocuments@fmr.com.
What were your Fund costs for the last six months?(based on hypothetical $10,000 investment)
| | Costs of a $10,000 investment | Costs paid as a percentage of a $10,000 investment | |
| VIP Investor Freedom 2035 Portfolio℠ | $ 0 A | 0.00%B | |
A Amount represents less than $.50
B Amount represents less than 0.005%
Key Fund Statistics (as of June 30, 2024)
KEY FACTS | | |
| Fund Size | $13,400,607 | |
| Number of Holdings | 14 | |
| Portfolio Turnover | 24% | |
What did the Fund invest in?
(as of June 30, 2024)
| Domestic Equity Funds | 38.7 |
| International Equity Funds | 34.2 |
| Bond Funds | 22.9 |
| Inflation-Protected Bond Funds | 4.2 |
| Short-Term Investments and Net Other Assets (Liabilities) | 0.0 |
ASSET ALLOCATION (% of Fund's net assets) |
|
|
TOP HOLDINGS (% of Fund's net assets) | | |
| VIP Overseas Portfolio - Investor Class | 22.5 | |
| VIP Investment Grade Bond II Portfolio - Investor Class | 12.3 | |
| VIP Emerging Markets Portfolio - Investor Class | 11.7 | |
| VIP Growth Portfolio - Investor Class | 11.3 | |
| VIP Growth & Income Portfolio - Investor Class | 7.6 | |
| Fidelity Long-Term Treasury Bond Index Fund | 7.0 | |
| VIP Contrafund Portfolio - Investor Class | 6.8 | |
| VIP Equity Income Portfolio - Investor Class | 5.5 | |
| Fidelity Inflation-Protected Bond Index Fund | 4.2 | |
| VIP Value Portfolio - Investor Class | 3.9 | |
| | 92.8 | |
| |
| Fidelity, the Fidelity Investments Logo and all other Fidelity trademarks or service marks used herein are trademarks or service marks of FMR LLC. Any third-party marks that are used herein are trademarks or service marks of their respective owners. © 2024 FMR LLC. All rights reserved. |
| | For additional information about the Fund; including its prospectus, financial information, holdings and proxy information, scan the QR code or visit fundresearch.fidelity.com/prospectus/sec 1.9916206.100 6574-TSRS-0824 |
| |
| | SEMI-ANNUAL SHAREHOLDER REPORT | AS OF JUNE 30, 2024 | |
| | VIP FundsManager® 40% Portfolio VIP FundsManager® 40% Portfolio Investor Class true |
| | | |
This semi-annual shareholder report contains information about VIP FundsManager® 40% Portfolio for the period January 1, 2024 to June 30, 2024. You can find additional information about the Fund at fundresearch.fidelity.com/prospectus/sec. You can also request this information by contacting us at 1-877-208-0098 or by sending an e-mail to funddocuments@fmr.com.
What were your Fund costs for the last six months?(based on hypothetical $10,000 investment)
| | Costs of a $10,000 investment | Costs paid as a percentage of a $10,000 investment | |
| Investor Class | $ 5 | 0.10% | |
Key Fund Statistics (as of June 30, 2024)
KEY FACTS | | |
| Fund Size | $17,899,657 | |
| Number of Holdings | 29 | |
| Portfolio Turnover | 23% | |
What did the Fund invest in?
(as of June 30, 2024)
| Bond Funds | 43.5 |
| Domestic Equity Funds | 28.3 |
| International Equity Funds | 16.3 |
| Inflation-Protected Bond Funds | 0.9 |
| Short-Term Investments and Net Other Assets (Liabilities) | 11.0 |
ASSET ALLOCATION (% of Fund's net assets) |
|
|
TOP HOLDINGS (% of Fund's net assets) | | |
| VIP Stock Selector All Cap Portfolio - Investor Class | 21.9 | |
| VIP Investment Grade Bond II Portfolio - Investor Class | 20.6 | |
| Fidelity Total Bond Fund | 20.5 | |
| Fidelity Overseas Fund | 5.3 | |
| Fidelity Emerging Markets Fund | 4.6 | |
| Fidelity International Discovery Fund | 1.4 | |
| iShares Core S&P 500 ETF | 1.3 | |
| Fidelity Hedged Equity Fund | 1.3 | |
| Fidelity Contrafund | 1.2 | |
| Fidelity Floating Rate High Income Fund | 1.2 | |
| | 79.3 | |
| |
| Fidelity, the Fidelity Investments Logo and all other Fidelity trademarks or service marks used herein are trademarks or service marks of FMR LLC. Any third-party marks that are used herein are trademarks or service marks of their respective owners. © 2024 FMR LLC. All rights reserved. |
| | For additional information about the Fund; including its prospectus, financial information, holdings and proxy information, scan the QR code or visit fundresearch.fidelity.com/prospectus/sec 1.9916213.100 6992-TSRS-0824 |
| |
| | SEMI-ANNUAL SHAREHOLDER REPORT | AS OF JUNE 30, 2024 | |
| | VIP Freedom 2035 Portfolio℠ VIP Freedom 2035 Portfolio℠ Service Class true |
| | | |
This semi-annual shareholder report contains information about VIP Freedom 2035 Portfolio℠ for the period January 1, 2024 to June 30, 2024. You can find additional information about the Fund at fundresearch.fidelity.com/prospectus/sec. You can also request this information by contacting us at 1-877-208-0098 or by sending an e-mail to funddocuments@fmr.com.
What were your Fund costs for the last six months?(based on hypothetical $10,000 investment)
| | Costs of a $10,000 investment | Costs paid as a percentage of a $10,000 investment | |
| Service Class | $ 5 | 0.10% | |
Key Fund Statistics (as of June 30, 2024)
KEY FACTS | | |
| Fund Size | $329,641,161 | |
| Number of Holdings | 14 | |
| Portfolio Turnover | 38% | |
What did the Fund invest in?
(as of June 30, 2024)
| Domestic Equity Funds | 38.7 |
| International Equity Funds | 34.2 |
| Bond Funds | 22.9 |
| Inflation-Protected Bond Funds | 4.2 |
| Short-Term Investments and Net Other Assets (Liabilities) | 0.0 |
ASSET ALLOCATION (% of Fund's net assets) |
|
|
TOP HOLDINGS (% of Fund's net assets) | | |
| VIP Overseas Portfolio - Initial Class | 22.5 | |
| VIP Investment Grade Bond II Portfolio - Initial Class | 12.3 | |
| VIP Emerging Markets Portfolio - Initial Class | 11.7 | |
| VIP Growth Portfolio - Initial Class | 11.3 | |
| VIP Growth & Income Portfolio - Initial Class | 7.6 | |
| Fidelity Long-Term Treasury Bond Index Fund | 7.0 | |
| VIP Contrafund Portfolio - Initial Class | 6.8 | |
| VIP Equity-Income Portfolio - Initial Class | 5.5 | |
| Fidelity Inflation-Protected Bond Index Fund | 4.2 | |
| VIP Value Portfolio - Initial Class | 3.9 | |
| | 92.8 | |
| |
| Fidelity, the Fidelity Investments Logo and all other Fidelity trademarks or service marks used herein are trademarks or service marks of FMR LLC. Any third-party marks that are used herein are trademarks or service marks of their respective owners. © 2024 FMR LLC. All rights reserved. |
| | For additional information about the Fund; including its prospectus, financial information, holdings and proxy information, scan the QR code or visit fundresearch.fidelity.com/prospectus/sec 1.9916132.100 2160-TSRS-0824 |
| |
| | SEMI-ANNUAL SHAREHOLDER REPORT | AS OF JUNE 30, 2024 | |
| | VIP Government Money Market Portfolio VIP Government Money Market Portfolio Service Class true |
| | | |
This semi-annual shareholder report contains information about VIP Government Money Market Portfolio for the period January 1, 2024 to June 30, 2024. You can find additional information about the Fund at fundresearch.fidelity.com/prospectus/sec. You can also request this information by contacting us at 1-877-208-0098 or by sending an e-mail to funddocuments@fmr.com.
What were your Fund costs for the last six months?(based on hypothetical $10,000 investment)
| | Costs of a $10,000 investment | Costs paid as a percentage of a $10,000 investment | |
| Service Class | $ 19 | 0.38% | |
Key Fund Statistics (as of June 30, 2024)
KEY FACTS | | |
| Fund Size | $8,626,160,570 | |
| Number of Holdings | 456 | |
What did the Fund invest in?
(as of June 30, 2024)
EFFECTIVE MATURITY DIVERSIFICATION (% of Fund's net assets) |
| Days |
| 1-7 | 67.7 | |
| 8-30 | 8.1 | |
| 31-60 | 7.4 | |
| 61-90 | 5.2 | |
| 91-180 | 8.2 | |
| >180 | 3.2 | |
| |
| Repurchase Agreements | 50.8 |
| U.S. Treasury Obligations | 26.6 |
| U.S. Government Agency - Debt | 22.4 |
| Net Other Assets (Liabilities) | 0.2 |
ASSET ALLOCATION (% of Fund's net assets) |
|
|
| Fidelity, the Fidelity Investments Logo and all other Fidelity trademarks or service marks used herein are trademarks or service marks of FMR LLC. Any third-party marks that are used herein are trademarks or service marks of their respective owners. © 2024 FMR LLC. All rights reserved. |
| | For additional information about the Fund; including its prospectus, financial information, holdings and proxy information, scan the QR code or visit fundresearch.fidelity.com/prospectus/sec 1.9915928.100 713-TSRS-0824 |
| |
| | SEMI-ANNUAL SHAREHOLDER REPORT | AS OF JUNE 30, 2024 | |
| | VIP Investor Freedom 2025 Portfolio℠ VIP Investor Freedom 2025 Portfolio℠ true |
| | | |
This semi-annual shareholder report contains information about VIP Investor Freedom 2025 Portfolio℠ for the period January 1, 2024 to June 30, 2024. You can find additional information about the Fund at fundresearch.fidelity.com/prospectus/sec. You can also request this information by contacting us at 1-877-208-0098 or by sending an e-mail to funddocuments@fmr.com.
What were your Fund costs for the last six months?(based on hypothetical $10,000 investment)
| | Costs of a $10,000 investment | Costs paid as a percentage of a $10,000 investment | |
| VIP Investor Freedom 2025 Portfolio℠ | $ 0 A | 0.00%B | |
A Amount represents less than $.50
B Amount represents less than 0.005%
Key Fund Statistics (as of June 30, 2024)
KEY FACTS | | |
| Fund Size | $215,863,243 | |
| Number of Holdings | 15 | |
| Portfolio Turnover | 21% | |
What did the Fund invest in?
(as of June 30, 2024)
| Bond Funds | 32.0 |
| Domestic Equity Funds | 28.4 |
| International Equity Funds | 27.3 |
| Inflation-Protected Bond Funds | 12.3 |
| Short-Term Investments and Net Other Assets (Liabilities) | 0.0 |
ASSET ALLOCATION (% of Fund's net assets) |
|
|
TOP HOLDINGS (% of Fund's net assets) | | |
| VIP Investment Grade Bond II Portfolio - Investor Class | 21.2 | |
| VIP Overseas Portfolio - Investor Class | 17.6 | |
| Fidelity Inflation-Protected Bond Index Fund | 12.3 | |
| VIP Emerging Markets Portfolio - Investor Class | 9.7 | |
| VIP Growth Portfolio - Investor Class | 8.3 | |
| Fidelity Long-Term Treasury Bond Index Fund | 6.2 | |
| VIP Growth & Income Portfolio - Investor Class | 5.6 | |
| VIP Contrafund Portfolio - Investor Class | 5.0 | |
| VIP Equity Income Portfolio - Investor Class | 4.1 | |
| Fidelity International Bond Index Fund | 2.9 | |
| | 92.9 | |
| |
| Fidelity, the Fidelity Investments Logo and all other Fidelity trademarks or service marks used herein are trademarks or service marks of FMR LLC. Any third-party marks that are used herein are trademarks or service marks of their respective owners. © 2024 FMR LLC. All rights reserved. |
| | For additional information about the Fund; including its prospectus, financial information, holdings and proxy information, scan the QR code or visit fundresearch.fidelity.com/prospectus/sec 1.9916097.100 1499-TSRS-0824 |
| |
| | SEMI-ANNUAL SHAREHOLDER REPORT | AS OF JUNE 30, 2024 | |
| | VIP Asset Manager Portfolio VIP Asset Manager Portfolio Service Class true |
| | | |
This semi-annual shareholder report contains information about VIP Asset Manager Portfolio for the period January 1, 2024 to June 30, 2024. You can find additional information about the Fund at fundresearch.fidelity.com/prospectus/sec. You can also request this information by contacting us at 1-877-208-0098 or by sending an e-mail to funddocuments@fmr.com.
What were your Fund costs for the last six months?(based on hypothetical $10,000 investment)
| | Costs of a $10,000 investment | Costs paid as a percentage of a $10,000 investment | |
| Service Class | $ 32 | 0.63% | |
Key Fund Statistics (as of June 30, 2024)
KEY FACTS | | |
| Fund Size | $930,114,262 | |
| Number of Holdings | 25 | |
| Portfolio Turnover | 11% | |
What did the Fund invest in?
(as of June 30, 2024)
| U.S. Government and U.S. Government Agency Obligations | 23.9 |
| AAA | 3.0 |
| AA | 0.0 |
| A | 3.1 |
| BBB | 4.9 |
| BB | 1.6 |
| B | 1.6 |
| CCC,CC,C | 0.2 |
| D | 0.0 |
| Not Rated | 0.6 |
| Equities | 60.3 |
| Short-Term Investments and Net Other Assets (Liabilities) | 0.8 |
QUALITY DIVERSIFICATION (% of Fund's net assets) |
|
| |
| We have used ratings from Moody's Investors Service, Inc. Where Moody's® ratings are not available, we have used S&P® ratings. All ratings are as of the date indicated and do not reflect subsequent changes. |
MARKET SECTORS (% of Fund's net assets) | | |
| Information Technology | 14.0 | |
| Financials | 9.9 | |
| Industrials | 6.9 | |
| Health Care | 6.8 | |
| Consumer Discretionary | 6.0 | |
| Communication Services | 4.0 | |
| Consumer Staples | 2.8 | |
| Energy | 2.4 | |
| Materials | 2.3 | |
| Real Estate | 1.3 | |
| Utilities | 1.1 | |
| |
| Equities | 59.8 |
| Bonds | 39.4 |
| Short-Term Investments and Net Other Assets (Liabilities) | 0.8 |
ASSET ALLOCATION (% of Fund's net assets) |
|
|
TOP HOLDINGS (% of Fund's net assets) | | |
| US Treasury Notes | 12.6 | |
| US Treasury Bonds | 3.7 | |
| Uniform Mortgage Backed Securities | 3.5 | |
| Microsoft Corp | 2.7 | |
| Ginnie Mae II Pool | 2.3 | |
| Apple Inc | 1.7 | |
| Alphabet Inc Class A | 1.5 | |
| Amazon.com Inc | 1.5 | |
| Freddie Mac Gold Pool | 1.1 | |
| Fannie Mae Mortgage pass-thru certificates | 0.5 | |
| | 31.1 | |
| |
| Fidelity, the Fidelity Investments Logo and all other Fidelity trademarks or service marks used herein are trademarks or service marks of FMR LLC. Any third-party marks that are used herein are trademarks or service marks of their respective owners. © 2024 FMR LLC. All rights reserved. |
| | For additional information about the Fund; including its prospectus, financial information, holdings and proxy information, scan the QR code or visit fundresearch.fidelity.com/prospectus/sec 1.9915999.100 467-TSRS-0824 |
| |
| | SEMI-ANNUAL SHAREHOLDER REPORT | AS OF JUNE 30, 2024 | |
| | VIP FundsManager® 40% Portfolio VIP FundsManager® 40% Portfolio Service Class true |
| | | |
This semi-annual shareholder report contains information about VIP FundsManager® 40% Portfolio for the period January 1, 2024 to June 30, 2024. You can find additional information about the Fund at fundresearch.fidelity.com/prospectus/sec. You can also request this information by contacting us at 1-877-208-0098 or by sending an e-mail to funddocuments@fmr.com.
What were your Fund costs for the last six months?(based on hypothetical $10,000 investment)
| | Costs of a $10,000 investment | Costs paid as a percentage of a $10,000 investment | |
| Service Class | $ 5 | 0.10% | |
Key Fund Statistics (as of June 30, 2024)
KEY FACTS | | |
| Fund Size | $17,899,657 | |
| Number of Holdings | 29 | |
| Portfolio Turnover | 23% | |
What did the Fund invest in?
(as of June 30, 2024)
| Bond Funds | 43.5 |
| Domestic Equity Funds | 28.3 |
| International Equity Funds | 16.3 |
| Inflation-Protected Bond Funds | 0.9 |
| Short-Term Investments and Net Other Assets (Liabilities) | 11.0 |
ASSET ALLOCATION (% of Fund's net assets) |
|
|
TOP HOLDINGS (% of Fund's net assets) | | |
| VIP Stock Selector All Cap Portfolio - Investor Class | 21.9 | |
| VIP Investment Grade Bond II Portfolio - Investor Class | 20.6 | |
| Fidelity Total Bond Fund | 20.5 | |
| Fidelity Overseas Fund | 5.3 | |
| Fidelity Emerging Markets Fund | 4.6 | |
| Fidelity International Discovery Fund | 1.4 | |
| iShares Core S&P 500 ETF | 1.3 | |
| Fidelity Hedged Equity Fund | 1.3 | |
| Fidelity Contrafund | 1.2 | |
| Fidelity Floating Rate High Income Fund | 1.2 | |
| | 79.3 | |
| |
| Fidelity, the Fidelity Investments Logo and all other Fidelity trademarks or service marks used herein are trademarks or service marks of FMR LLC. Any third-party marks that are used herein are trademarks or service marks of their respective owners. © 2024 FMR LLC. All rights reserved. |
| | For additional information about the Fund; including its prospectus, financial information, holdings and proxy information, scan the QR code or visit fundresearch.fidelity.com/prospectus/sec 1.9916217.100 6993-TSRS-0824 |
| |
| | SEMI-ANNUAL SHAREHOLDER REPORT | AS OF JUNE 30, 2024 | |
| | VIP FundsManager® 60% Portfolio VIP FundsManager® 60% Portfolio Investor Class true |
| | | |
This semi-annual shareholder report contains information about VIP FundsManager® 60% Portfolio for the period January 1, 2024 to June 30, 2024. You can find additional information about the Fund at fundresearch.fidelity.com/prospectus/sec. You can also request this information by contacting us at 1-877-208-0098 or by sending an e-mail to funddocuments@fmr.com.
What were your Fund costs for the last six months?(based on hypothetical $10,000 investment)
| | Costs of a $10,000 investment | Costs paid as a percentage of a $10,000 investment | |
| Investor Class | $ 5 | 0.10% | |
Key Fund Statistics (as of June 30, 2024)
KEY FACTS | | |
| Fund Size | $6,660,120,093 | |
| Number of Holdings | 33 | |
| Portfolio Turnover | 24% | |
What did the Fund invest in?
(as of June 30, 2024)
| Domestic Equity Funds | 39.1 |
| Bond Funds | 32.4 |
| International Equity Funds | 23.9 |
| Inflation-Protected Bond Funds | 1.5 |
| Other Investments | 1.2 |
| Short-Term Investments and Net Other Assets (Liabilities) | 1.9 |
ASSET ALLOCATION (% of Fund's net assets) |
|
|
TOP HOLDINGS (% of Fund's net assets) | | |
| VIP Stock Selector All Cap Portfolio - Investor Class | 32.8 | |
| VIP Investment Grade Bond II Portfolio - Investor Class | 15.1 | |
| Fidelity Total Bond Fund | 15.1 | |
| Fidelity Overseas Fund | 7.1 | |
| Fidelity Emerging Markets Fund | 6.7 | |
| Fidelity Contrafund | 1.8 | |
| Fidelity Enhanced International ETF | 1.8 | |
| Fidelity International Discovery Fund | 1.8 | |
| Fidelity Low-Priced Stock Fund | 1.7 | |
| Fidelity Inflation-Protected Bond Index Fund | 1.5 | |
| | 85.4 | |
| |
| Fidelity, the Fidelity Investments Logo and all other Fidelity trademarks or service marks used herein are trademarks or service marks of FMR LLC. Any third-party marks that are used herein are trademarks or service marks of their respective owners. © 2024 FMR LLC. All rights reserved. |
| | For additional information about the Fund; including its prospectus, financial information, holdings and proxy information, scan the QR code or visit fundresearch.fidelity.com/prospectus/sec 1.9916124.100 1880-TSRS-0824 |
| |
| | SEMI-ANNUAL SHAREHOLDER REPORT | AS OF JUNE 30, 2024 | |
| | VIP Strategic Income Portfolio VIP Strategic Income Portfolio Initial Class true |
| | | |
This semi-annual shareholder report contains information about VIP Strategic Income Portfolio for the period January 1, 2024 to June 30, 2024. You can find additional information about the Fund at fundresearch.fidelity.com/prospectus/sec. You can also request this information by contacting us at 1-877-208-0098 or by sending an e-mail to funddocuments@fmr.com.
What were your Fund costs for the last six months?(based on hypothetical $10,000 investment)
| | Costs of a $10,000 investment | Costs paid as a percentage of a $10,000 investment | |
| Initial Class | $ 33 | 0.65% | |
Key Fund Statistics (as of June 30, 2024)
KEY FACTS | | |
| Fund Size | $1,441,795,230 | |
| Number of Holdings | 1,537 | |
| Portfolio Turnover | 87% | |
What did the Fund invest in?
(as of June 30, 2024)
| U.S. Government and U.S. Government Agency Obligations | 24.4 |
| AAA | 0.4 |
| AA | 1.1 |
| A | 2.8 |
| BBB | 9.7 |
| BB | 15.1 |
| B | 19.2 |
| CCC,CC,C | 4.4 |
| D | 0.0 |
| Not Rated | 9.7 |
| Equities | 7.0 |
| Short-Term Investments and Net Other Assets (Liabilities) | 6.2 |
QUALITY DIVERSIFICATION (% of Fund's net assets) |
|
| |
| We have used ratings from Moody's Investors Service, Inc. Where Moody's® ratings are not available, we have used S&P® ratings. All ratings are as of the date indicated and do not reflect subsequent changes. |
| High-Yield Debt | 40.8 |
| U.S. Government & Investment Grade-Debt | 30.2 |
| Emerging-Markets Debt | 15.5 |
| Foreign Developed-Markets Debt | 7.9 |
| Floating-Rate debt | 5.5 |
| Short-Term Investments and Net Other Assets (Liabilities) | 0.1 |
ASSET ALLOCATION (% of Fund's net assets) |
|
|
| United States | 74.5 |
| Germany | 4.0 |
| United Kingdom | 2.2 |
| Mexico | 1.3 |
| France | 1.2 |
| Brazil | 1.2 |
| Canada | 1.1 |
| Saudi Arabia | 0.9 |
| Turkey | 0.8 |
| Others | 12.8 |
GEOGRAPHIC DIVERSIFICATION (% of Fund's net assets) |
|
| |
|
TOP HOLDINGS (% of Fund's net assets) | | |
| US Treasury Notes | 16.9 | |
| US Treasury Bonds | 6.3 | |
| Freddie Mac Multifamily Structured Pass Through Certificates | 2.9 | |
| German Federal Republic | 2.8 | |
| TransDigm Inc | 1.3 | |
| Energy Transfer LP | 1.0 | |
| Freddie Mac Gold Pool | 0.8 | |
| Fannie Mae Mortgage pass-thru certificates | 0.7 | |
| Fannie Mae Guaranteed REMICS | 0.7 | |
| Uber Technologies Inc | 0.7 | |
| | 34.1 | |
| |
| Fidelity, the Fidelity Investments Logo and all other Fidelity trademarks or service marks used herein are trademarks or service marks of FMR LLC. Any third-party marks that are used herein are trademarks or service marks of their respective owners. © 2024 FMR LLC. All rights reserved. |
| | For additional information about the Fund; including its prospectus, financial information, holdings and proxy information, scan the QR code or visit fundresearch.fidelity.com/prospectus/sec 1.9916056.100 1326-TSRS-0824 |
| |
| | SEMI-ANNUAL SHAREHOLDER REPORT | AS OF JUNE 30, 2024 | |
| | VIP Asset Manager Portfolio VIP Asset Manager Portfolio Service Class 2 true |
| | | |
This semi-annual shareholder report contains information about VIP Asset Manager Portfolio for the period January 1, 2024 to June 30, 2024. You can find additional information about the Fund at fundresearch.fidelity.com/prospectus/sec. You can also request this information by contacting us at 1-877-208-0098 or by sending an e-mail to funddocuments@fmr.com.
What were your Fund costs for the last six months?(based on hypothetical $10,000 investment)
| | Costs of a $10,000 investment | Costs paid as a percentage of a $10,000 investment | |
| Service Class 2 | $ 40 | 0.78% | |
Key Fund Statistics (as of June 30, 2024)
KEY FACTS | | |
| Fund Size | $930,114,262 | |
| Number of Holdings | 25 | |
| Portfolio Turnover | 11% | |
What did the Fund invest in?
(as of June 30, 2024)
| U.S. Government and U.S. Government Agency Obligations | 23.9 |
| AAA | 3.0 |
| AA | 0.0 |
| A | 3.1 |
| BBB | 4.9 |
| BB | 1.6 |
| B | 1.6 |
| CCC,CC,C | 0.2 |
| D | 0.0 |
| Not Rated | 0.6 |
| Equities | 60.3 |
| Short-Term Investments and Net Other Assets (Liabilities) | 0.8 |
QUALITY DIVERSIFICATION (% of Fund's net assets) |
|
| |
| We have used ratings from Moody's Investors Service, Inc. Where Moody's® ratings are not available, we have used S&P® ratings. All ratings are as of the date indicated and do not reflect subsequent changes. |
MARKET SECTORS (% of Fund's net assets) | | |
| Information Technology | 14.0 | |
| Financials | 9.9 | |
| Industrials | 6.9 | |
| Health Care | 6.8 | |
| Consumer Discretionary | 6.0 | |
| Communication Services | 4.0 | |
| Consumer Staples | 2.8 | |
| Energy | 2.4 | |
| Materials | 2.3 | |
| Real Estate | 1.3 | |
| Utilities | 1.1 | |
| |
| Equities | 59.8 |
| Bonds | 39.4 |
| Short-Term Investments and Net Other Assets (Liabilities) | 0.8 |
ASSET ALLOCATION (% of Fund's net assets) |
|
|
TOP HOLDINGS (% of Fund's net assets) | | |
| US Treasury Notes | 12.6 | |
| US Treasury Bonds | 3.7 | |
| Uniform Mortgage Backed Securities | 3.5 | |
| Microsoft Corp | 2.7 | |
| Ginnie Mae II Pool | 2.3 | |
| Apple Inc | 1.7 | |
| Alphabet Inc Class A | 1.5 | |
| Amazon.com Inc | 1.5 | |
| Freddie Mac Gold Pool | 1.1 | |
| Fannie Mae Mortgage pass-thru certificates | 0.5 | |
| | 31.1 | |
| |
| Fidelity, the Fidelity Investments Logo and all other Fidelity trademarks or service marks used herein are trademarks or service marks of FMR LLC. Any third-party marks that are used herein are trademarks or service marks of their respective owners. © 2024 FMR LLC. All rights reserved. |
| | For additional information about the Fund; including its prospectus, financial information, holdings and proxy information, scan the QR code or visit fundresearch.fidelity.com/prospectus/sec 1.9915998.100 363-TSRS-0824 |
| |
| | SEMI-ANNUAL SHAREHOLDER REPORT | AS OF JUNE 30, 2024 | |
| | VIP Investment Grade Bond II Portfolio VIP Investment Grade Bond II Portfolio Investor Class true |
| | | |
This semi-annual shareholder report contains information about VIP Investment Grade Bond II Portfolio for the period January 1, 2024 to June 30, 2024. You can find additional information about the Fund at fundresearch.fidelity.com/prospectus/sec. You can also request this information by contacting us at 1-877-208-0098 or by sending an e-mail to funddocuments@fmr.com.
What were your Fund costs for the last six months?(based on hypothetical $10,000 investment)
| | Costs of a $10,000 investment | Costs paid as a percentage of a $10,000 investment | |
| Investor Class | $ 21 | 0.42% | |
Key Fund Statistics (as of June 30, 2024)
KEY FACTS | | |
| Fund Size | $3,215,681,705 | |
| Number of Holdings | 5,595 | |
| Portfolio Turnover | 211% | |
What did the Fund invest in?
(as of June 30, 2024)
| U.S. Government and U.S. Government Agency Obligations | 64.4 |
| AAA | 10.1 |
| AA | 0.2 |
| A | 10.6 |
| BBB | 13.5 |
| BB | 1.9 |
| B | 0.9 |
| CCC,CC,C | 0.0 |
| Not Rated | 4.1 |
QUALITY DIVERSIFICATION (% of Fund's net assets) |
|
| Short-Term Investments and Net Other Assets (Liabilities) - (5.7)%* |
| |
| We have used ratings from Moody's Investors Service, Inc. Where Moody's® ratings are not available, we have used S&P® ratings. All ratings are as of the date indicated and do not reflect subsequent changes. |
| U.S. Treasury Obligations | 43.9 |
| Corporate Bonds | 26.0 |
| U.S. Government Agency - Mortgage Securities | 20.5 |
| Asset-Backed Securities | 7.8 |
| CMOs and Other Mortgage Related Securities | 7.2 |
| Foreign Government and Government Agency Obligations | 0.2 |
| Other Investments | 0.1 |
| Municipal Securities | 0.0 |
| Preferred Securities | 0.0 |
| Bank Loan Obligations | 0.0 |
ASSET ALLOCATION (% of Fund's net assets) |
|
| Short-Term Investments and Net Other Assets (Liabilities) - (5.7)% |
|
| United States | 90.4 |
| Grand Cayman (UK Overseas Ter) | 4.3 |
| Mexico | 0.9 |
| United Kingdom | 0.8 |
| Multi-national | 0.7 |
| Ireland | 0.6 |
| Canada | 0.4 |
| Switzerland | 0.4 |
| Belgium | 0.3 |
| Others | 1.2 |
GEOGRAPHIC DIVERSIFICATION (% of Fund's net assets) |
|
| |
|
TOP HOLDINGS (% of Fund's net assets) | | |
| US Treasury Notes | 32.2 | |
| US Treasury Bonds | 11.7 | |
| Uniform Mortgage Backed Securities | 6.1 | |
| Fannie Mae Mortgage pass-thru certificates | 5.9 | |
| Ginnie Mae II Pool | 5.3 | |
| Freddie Mac Gold Pool | 2.8 | |
| JPMorgan Chase & Co | 1.5 | |
| Bank of America Corp | 1.5 | |
| Morgan Stanley | 1.2 | |
| Freddie Mac Multifamily Structured Pass Through Certificates | 1.2 | |
| | 69.4 | |
| |
| Fidelity, the Fidelity Investments Logo and all other Fidelity trademarks or service marks used herein are trademarks or service marks of FMR LLC. Any third-party marks that are used herein are trademarks or service marks of their respective owners. © 2024 FMR LLC. All rights reserved. |
| | For additional information about the Fund; including its prospectus, financial information, holdings and proxy information, scan the QR code or visit fundresearch.fidelity.com/prospectus/sec 1.9916205.100 6572-TSRS-0824 |
| |
| | SEMI-ANNUAL SHAREHOLDER REPORT | AS OF JUNE 30, 2024 | |
| | VIP FundsManager® 30% Portfolio VIP FundsManager® 30% Portfolio Service Class true |
| | | |
This semi-annual shareholder report contains information about VIP FundsManager® 30% Portfolio for the period January 1, 2024 to June 30, 2024. You can find additional information about the Fund at fundresearch.fidelity.com/prospectus/sec. You can also request this information by contacting us at 1-877-208-0098 or by sending an e-mail to funddocuments@fmr.com.
What were your Fund costs for the last six months?(based on hypothetical $10,000 investment)
| | Costs of a $10,000 investment | Costs paid as a percentage of a $10,000 investment | |
| Service Class | $ 5 | 0.10% | |
Key Fund Statistics (as of June 30, 2024)
KEY FACTS | | |
| Fund Size | $11,338,553 | |
| Number of Holdings | 29 | |
| Portfolio Turnover | 25% | |
What did the Fund invest in?
(as of June 30, 2024)
| Bond Funds | 48.5 |
| Domestic Equity Funds | 22.2 |
| International Equity Funds | 12.3 |
| Inflation-Protected Bond Funds | 0.9 |
| Short-Term Investments and Net Other Assets (Liabilities) | 16.1 |
ASSET ALLOCATION (% of Fund's net assets) |
|
|
TOP HOLDINGS (% of Fund's net assets) | | |
| VIP Investment Grade Bond II Portfolio - Investor Class | 23.0 | |
| Fidelity Total Bond Fund | 23.0 | |
| VIP Stock Selector All Cap Portfolio - Investor Class | 16.5 | |
| Fidelity Overseas Fund | 3.9 | |
| Fidelity Emerging Markets Fund | 3.5 | |
| Fidelity Hedged Equity Fund | 1.2 | |
| iShares Core S&P 500 ETF | 1.2 | |
| Fidelity Floating Rate High Income Fund | 1.2 | |
| Fidelity International Discovery Fund | 1.0 | |
| Fidelity Inflation-Protected Bond Index Fund | 0.9 | |
| | 75.4 | |
| |
| Fidelity, the Fidelity Investments Logo and all other Fidelity trademarks or service marks used herein are trademarks or service marks of FMR LLC. Any third-party marks that are used herein are trademarks or service marks of their respective owners. © 2024 FMR LLC. All rights reserved. |
| | For additional information about the Fund; including its prospectus, financial information, holdings and proxy information, scan the QR code or visit fundresearch.fidelity.com/prospectus/sec 1.9916212.100 6991-TSRS-0824 |
| |
| | SEMI-ANNUAL SHAREHOLDER REPORT | AS OF JUNE 30, 2024 | |
| | VIP Asset Manager: Growth Portfolio VIP Asset Manager: Growth Portfolio Service Class true |
| | | |
This semi-annual shareholder report contains information about VIP Asset Manager: Growth Portfolio for the period January 1, 2024 to June 30, 2024. You can find additional information about the Fund at fundresearch.fidelity.com/prospectus/sec. You can also request this information by contacting us at 1-877-208-0098 or by sending an e-mail to funddocuments@fmr.com.
What were your Fund costs for the last six months?(based on hypothetical $10,000 investment)
| | Costs of a $10,000 investment | Costs paid as a percentage of a $10,000 investment | |
| Service Class | $ 37 | 0.73% | |
Key Fund Statistics (as of June 30, 2024)
KEY FACTS | | |
| Fund Size | $265,025,578 | |
| Number of Holdings | 23 | |
| Portfolio Turnover | 15% | |
What did the Fund invest in?
(as of June 30, 2024)
| U.S. Government and U.S. Government Agency Obligations | 14.2 |
| AAA | 1.5 |
| AA | 0.0 |
| A | 1.9 |
| BBB | 2.7 |
| BB | 1.1 |
| B | 1.1 |
| CCC,CC,C | 0.2 |
| D | 0.0 |
| Not Rated | 0.5 |
| Equities | 75.3 |
| Short-Term Investments and Net Other Assets (Liabilities) | 1.5 |
QUALITY DIVERSIFICATION (% of Fund's net assets) |
|
| |
| We have used ratings from Moody's Investors Service, Inc. Where Moody's® ratings are not available, we have used S&P® ratings. All ratings are as of the date indicated and do not reflect subsequent changes. |
MARKET SECTORS (% of Fund's net assets) | | |
| Information Technology | 18.0 | |
| Financials | 12.5 | |
| Industrials | 8.7 | |
| Health Care | 8.3 | |
| Consumer Discretionary | 7.8 | |
| Communication Services | 5.3 | |
| Consumer Staples | 3.5 | |
| Energy | 2.9 | |
| Materials | 2.6 | |
| Real Estate | 1.6 | |
| Utilities | 1.4 | |
| |
| Equities | 74.8 |
| Bonds | 23.7 |
| Short-Term Investments and Net Other Assets (Liabilities) | 1.5 |
ASSET ALLOCATION (% of Fund's net assets) |
|
|
TOP HOLDINGS (% of Fund's net assets) | | |
| US Treasury Notes | 8.0 | |
| Microsoft Corp | 3.4 | |
| Apple Inc | 2.2 | |
| US Treasury Bonds | 2.0 | |
| Alphabet Inc Class A | 2.0 | |
| Amazon.com Inc | 2.0 | |
| Uniform Mortgage Backed Securities | 2.0 | |
| NVIDIA Corp | 1.9 | |
| Fidelity Hedged Equity ETF | 1.3 | |
| Meta Platforms Inc Class A | 1.2 | |
| | 26.1 | |
| |
| Fidelity, the Fidelity Investments Logo and all other Fidelity trademarks or service marks used herein are trademarks or service marks of FMR LLC. Any third-party marks that are used herein are trademarks or service marks of their respective owners. © 2024 FMR LLC. All rights reserved. |
| | For additional information about the Fund; including its prospectus, financial information, holdings and proxy information, scan the QR code or visit fundresearch.fidelity.com/prospectus/sec 1.9915974.100 468-TSRS-0824 |
| |
| | SEMI-ANNUAL SHAREHOLDER REPORT | AS OF JUNE 30, 2024 | |
| | VIP Investment Grade Bond Portfolio VIP Investment Grade Bond Portfolio Initial Class true |
| | | |
This semi-annual shareholder report contains information about VIP Investment Grade Bond Portfolio for the period January 1, 2024 to June 30, 2024. You can find additional information about the Fund at fundresearch.fidelity.com/prospectus/sec. You can also request this information by contacting us at 1-877-208-0098 or by sending an e-mail to funddocuments@fmr.com.
What were your Fund costs for the last six months?(based on hypothetical $10,000 investment)
| | Costs of a $10,000 investment | Costs paid as a percentage of a $10,000 investment | |
| Initial Class | $ 19 | 0.39% | |
Key Fund Statistics (as of June 30, 2024)
KEY FACTS | | |
| Fund Size | $4,215,966,857 | |
| Number of Holdings | 2,275 | |
| Portfolio Turnover | 217% | |
What did the Fund invest in?
(as of June 30, 2024)
| U.S. Government and U.S. Government Agency Obligations | 62.8 |
| AAA | 9.7 |
| AA | 0.4 |
| A | 8.0 |
| BBB | 16.1 |
| BB | 3.6 |
| B | 1.4 |
| CCC,CC,C | 0.0 |
| Not Rated | 3.3 |
QUALITY DIVERSIFICATION (% of Fund's net assets) |
|
| Short-Term Investments and Net Other Assets (Liabilities) - (5.3)%* |
| |
| We have used ratings from Moody's Investors Service, Inc. Where Moody's® ratings are not available, we have used S&P® ratings. All ratings are as of the date indicated and do not reflect subsequent changes. |
| U.S. Treasury Obligations | 42.6 |
| Corporate Bonds | 26.8 |
| U.S. Government Agency - Mortgage Securities | 20.2 |
| Asset-Backed Securities | 8.3 |
| CMOs and Other Mortgage Related Securities | 7.2 |
| Other Investments | 0.2 |
| Foreign Government and Government Agency Obligations | 0.0 |
| Preferred Securities | 0.0 |
| Bank Loan Obligations | 0.0 |
ASSET ALLOCATION (% of Fund's net assets) |
|
| Short-Term Investments and Net Other Assets (Liabilities) - (5.3)% |
|
| United States | 90.9 |
| Grand Cayman (UK Overseas Ter) | 4.6 |
| Mexico | 1.0 |
| United Kingdom | 0.8 |
| Ireland | 0.7 |
| Switzerland | 0.5 |
| Canada | 0.3 |
| France | 0.2 |
| Germany | 0.2 |
| Others | 0.8 |
GEOGRAPHIC DIVERSIFICATION (% of Fund's net assets) |
|
| |
|
TOP HOLDINGS (% of Fund's net assets) | | |
| US Treasury Notes | 30.2 | |
| US Treasury Bonds | 12.4 | |
| Ginnie Mae II Pool | 6.1 | |
| Fannie Mae Mortgage pass-thru certificates | 5.6 | |
| Uniform Mortgage Backed Securities | 5.2 | |
| Freddie Mac Gold Pool | 2.9 | |
| JPMorgan Chase & Co | 1.4 | |
| Bank of America Corp | 1.2 | |
| Morgan Stanley | 1.0 | |
| Petroleos Mexicanos | 1.0 | |
| | 67.0 | |
| |
| Fidelity, the Fidelity Investments Logo and all other Fidelity trademarks or service marks used herein are trademarks or service marks of FMR LLC. Any third-party marks that are used herein are trademarks or service marks of their respective owners. © 2024 FMR LLC. All rights reserved. |
| | For additional information about the Fund; including its prospectus, financial information, holdings and proxy information, scan the QR code or visit fundresearch.fidelity.com/prospectus/sec 1.9915993.100 155-TSRS-0824 |
| |
| | SEMI-ANNUAL SHAREHOLDER REPORT | AS OF JUNE 30, 2024 | |
| | VIP Freedom Lifetime Income® I Portfolio VIP Freedom Lifetime Income® I Portfolio true |
| | | |
This semi-annual shareholder report contains information about VIP Freedom Lifetime Income® I Portfolio for the period January 1, 2024 to June 30, 2024. You can find additional information about the Fund at fundresearch.fidelity.com/prospectus/sec. You can also request this information by contacting us at 1-877-208-0098 or by sending an e-mail to funddocuments@fmr.com.
What were your Fund costs for the last six months?(based on hypothetical $10,000 investment)
| | Costs of a $10,000 investment | Costs paid as a percentage of a $10,000 investment | |
| VIP Freedom Lifetime Income® I Portfolio | $ 0 A | 0.00%B | |
A Amount represents less than $.50
B Amount represents less than 0.005%
Key Fund Statistics (as of June 30, 2024)
KEY FACTS | | |
| Fund Size | $8,734,289 | |
| Number of Holdings | 15 | |
| Portfolio Turnover | 19% | |
What did the Fund invest in?
(as of June 30, 2024)
| Bond Funds | 46.5 |
| Inflation-Protected Bond Funds | 16.4 |
| International Equity Funds | 13.6 |
| Domestic Equity Funds | 8.0 |
| Short-Term Investments and Net Other Assets (Liabilities) | 15.5 |
ASSET ALLOCATION (% of Fund's net assets) |
|
|
TOP HOLDINGS (% of Fund's net assets) | | |
| VIP Investment Grade Bond II Portfolio - Investor Class | 40.4 | |
| Fidelity Inflation-Protected Bond Index Fund | 16.4 | |
| VIP Overseas Portfolio - Investor Class | 7.9 | |
| VIP Emerging Markets Portfolio - Investor Class | 5.7 | |
| VIP Growth Portfolio - Investor Class | 2.3 | |
| Fidelity Long-Term Treasury Bond Index Fund | 2.2 | |
| Fidelity International Bond Index Fund | 2.2 | |
| VIP High Income Portfolio - Investor Class | 1.7 | |
| VIP Growth & Income Portfolio - Investor Class | 1.6 | |
| VIP Contrafund Portfolio - Investor Class | 1.4 | |
| | 81.8 | |
| |
| Fidelity, the Fidelity Investments Logo and all other Fidelity trademarks or service marks used herein are trademarks or service marks of FMR LLC. Any third-party marks that are used herein are trademarks or service marks of their respective owners. © 2024 FMR LLC. All rights reserved. |
| | For additional information about the Fund; including its prospectus, financial information, holdings and proxy information, scan the QR code or visit fundresearch.fidelity.com/prospectus/sec 1.9916090.100 1492-TSRS-0824 |
| |
| | SEMI-ANNUAL SHAREHOLDER REPORT | AS OF JUNE 30, 2024 | |
| | VIP FundsManager® 60% Portfolio VIP FundsManager® 60% Portfolio Service Class true |
| | | |
This semi-annual shareholder report contains information about VIP FundsManager® 60% Portfolio for the period January 1, 2024 to June 30, 2024. You can find additional information about the Fund at fundresearch.fidelity.com/prospectus/sec. You can also request this information by contacting us at 1-877-208-0098 or by sending an e-mail to funddocuments@fmr.com.
What were your Fund costs for the last six months?(based on hypothetical $10,000 investment)
| | Costs of a $10,000 investment | Costs paid as a percentage of a $10,000 investment | |
| Service Class | $ 5 | 0.10% | |
Key Fund Statistics (as of June 30, 2024)
KEY FACTS | | |
| Fund Size | $6,660,120,093 | |
| Number of Holdings | 33 | |
| Portfolio Turnover | 24% | |
What did the Fund invest in?
(as of June 30, 2024)
| Domestic Equity Funds | 39.1 |
| Bond Funds | 32.4 |
| International Equity Funds | 23.9 |
| Inflation-Protected Bond Funds | 1.5 |
| Other Investments | 1.2 |
| Short-Term Investments and Net Other Assets (Liabilities) | 1.9 |
ASSET ALLOCATION (% of Fund's net assets) |
|
|
TOP HOLDINGS (% of Fund's net assets) | | |
| VIP Stock Selector All Cap Portfolio - Investor Class | 32.8 | |
| VIP Investment Grade Bond II Portfolio - Investor Class | 15.1 | |
| Fidelity Total Bond Fund | 15.1 | |
| Fidelity Overseas Fund | 7.1 | |
| Fidelity Emerging Markets Fund | 6.7 | |
| Fidelity Contrafund | 1.8 | |
| Fidelity Enhanced International ETF | 1.8 | |
| Fidelity International Discovery Fund | 1.8 | |
| Fidelity Low-Priced Stock Fund | 1.7 | |
| Fidelity Inflation-Protected Bond Index Fund | 1.5 | |
| | 85.4 | |
| |
| Fidelity, the Fidelity Investments Logo and all other Fidelity trademarks or service marks used herein are trademarks or service marks of FMR LLC. Any third-party marks that are used herein are trademarks or service marks of their respective owners. © 2024 FMR LLC. All rights reserved. |
| | For additional information about the Fund; including its prospectus, financial information, holdings and proxy information, scan the QR code or visit fundresearch.fidelity.com/prospectus/sec 1.9916125.100 1881-TSRS-0824 |
| |
| | SEMI-ANNUAL SHAREHOLDER REPORT | AS OF JUNE 30, 2024 | |
| | VIP Freedom 2010 Portfolio℠ VIP Freedom 2010 Portfolio℠ Initial Class true |
| | | |
This semi-annual shareholder report contains information about VIP Freedom 2010 Portfolio℠ for the period January 1, 2024 to June 30, 2024. You can find additional information about the Fund at fundresearch.fidelity.com/prospectus/sec. You can also request this information by contacting us at 1-877-208-0098 or by sending an e-mail to funddocuments@fmr.com.
What were your Fund costs for the last six months?(based on hypothetical $10,000 investment)
| | Costs of a $10,000 investment | Costs paid as a percentage of a $10,000 investment | |
| Initial Class | $ 0 A | 0.00%B | |
AAmount represents less than $.50
BAmount represents less than 0.005%
Key Fund Statistics (as of June 30, 2024)
KEY FACTS | | |
| Fund Size | $263,092,184 | |
| Number of Holdings | 15 | |
| Portfolio Turnover | 23% | |
What did the Fund invest in?
(as of June 30, 2024)
| Bond Funds | 44.6 |
| International Equity Funds | 16.6 |
| Inflation-Protected Bond Funds | 15.5 |
| Domestic Equity Funds | 12.5 |
| Short-Term Investments and Net Other Assets (Liabilities) | 10.8 |
ASSET ALLOCATION (% of Fund's net assets) |
|
|
TOP HOLDINGS (% of Fund's net assets) | | |
| VIP Investment Grade Bond II Portfolio - Initial Class | 38.1 | |
| Fidelity Inflation-Protected Bond Index Fund | 15.5 | |
| VIP Overseas Portfolio - Initial Class | 10.0 | |
| VIP Emerging Markets Portfolio - Initial Class | 6.6 | |
| VIP Growth Portfolio - Initial Class | 3.6 | |
| Fidelity Long-Term Treasury Bond Index Fund | 2.5 | |
| VIP Growth & Income Portfolio - Initial Class | 2.5 | |
| Fidelity International Bond Index Fund | 2.4 | |
| VIP Contrafund Portfolio - Initial Class | 2.2 | |
| VIP Equity-Income Portfolio - Initial Class | 1.8 | |
| | 85.2 | |
| |
| Fidelity, the Fidelity Investments Logo and all other Fidelity trademarks or service marks used herein are trademarks or service marks of FMR LLC. Any third-party marks that are used herein are trademarks or service marks of their respective owners. © 2024 FMR LLC. All rights reserved. |
| | For additional information about the Fund; including its prospectus, financial information, holdings and proxy information, scan the QR code or visit fundresearch.fidelity.com/prospectus/sec 1.9916075.100 1423-TSRS-0824 |
| |
| | SEMI-ANNUAL SHAREHOLDER REPORT | AS OF JUNE 30, 2024 | |
| | VIP Freedom 2045 Portfolio℠ VIP Freedom 2045 Portfolio℠ Service Class true |
| | | |
This semi-annual shareholder report contains information about VIP Freedom 2045 Portfolio℠ for the period January 1, 2024 to June 30, 2024. You can find additional information about the Fund at fundresearch.fidelity.com/prospectus/sec. You can also request this information by contacting us at 1-877-208-0098 or by sending an e-mail to funddocuments@fmr.com.
What were your Fund costs for the last six months?(based on hypothetical $10,000 investment)
| | Costs of a $10,000 investment | Costs paid as a percentage of a $10,000 investment | |
| Service Class | $ 5 | 0.10% | |
Key Fund Statistics (as of June 30, 2024)
KEY FACTS | | |
| Fund Size | $176,616,442 | |
| Number of Holdings | 13 | |
| Portfolio Turnover | 28% | |
What did the Fund invest in?
(as of June 30, 2024)
| Domestic Equity Funds | 50.5 |
| International Equity Funds | 42.5 |
| Bond Funds | 5.8 |
| Inflation-Protected Bond Funds | 1.2 |
| Short-Term Investments and Net Other Assets (Liabilities) | 0.0 |
ASSET ALLOCATION (% of Fund's net assets) |
|
|
TOP HOLDINGS (% of Fund's net assets) | | |
| VIP Overseas Portfolio - Initial Class | 28.5 | |
| VIP Growth Portfolio - Initial Class | 14.7 | |
| VIP Emerging Markets Portfolio - Initial Class | 14.0 | |
| VIP Growth & Income Portfolio - Initial Class | 9.9 | |
| VIP Contrafund Portfolio - Initial Class | 8.8 | |
| VIP Equity-Income Portfolio - Initial Class | 7.2 | |
| Fidelity Long-Term Treasury Bond Index Fund | 5.5 | |
| VIP Value Portfolio - Initial Class | 5.1 | |
| VIP Value Strategies Portfolio - Initial Class | 2.5 | |
| VIP Mid Cap Portfolio - Initial Class | 2.3 | |
| | 98.5 | |
| |
| Fidelity, the Fidelity Investments Logo and all other Fidelity trademarks or service marks used herein are trademarks or service marks of FMR LLC. Any third-party marks that are used herein are trademarks or service marks of their respective owners. © 2024 FMR LLC. All rights reserved. |
| | For additional information about the Fund; including its prospectus, financial information, holdings and proxy information, scan the QR code or visit fundresearch.fidelity.com/prospectus/sec 1.9916138.100 2166-TSRS-0824 |
| |
| | SEMI-ANNUAL SHAREHOLDER REPORT | AS OF JUNE 30, 2024 | |
| | VIP Strategic Income Portfolio VIP Strategic Income Portfolio Investor Class true |
| | | |
This semi-annual shareholder report contains information about VIP Strategic Income Portfolio for the period January 1, 2024 to June 30, 2024. You can find additional information about the Fund at fundresearch.fidelity.com/prospectus/sec. You can also request this information by contacting us at 1-877-208-0098 or by sending an e-mail to funddocuments@fmr.com.
What were your Fund costs for the last six months?(based on hypothetical $10,000 investment)
| | Costs of a $10,000 investment | Costs paid as a percentage of a $10,000 investment | |
| Investor Class | $ 34 | 0.68% | |
Key Fund Statistics (as of June 30, 2024)
KEY FACTS | | |
| Fund Size | $1,441,795,230 | |
| Number of Holdings | 1,537 | |
| Portfolio Turnover | 87% | |
What did the Fund invest in?
(as of June 30, 2024)
| U.S. Government and U.S. Government Agency Obligations | 24.4 |
| AAA | 0.4 |
| AA | 1.1 |
| A | 2.8 |
| BBB | 9.7 |
| BB | 15.1 |
| B | 19.2 |
| CCC,CC,C | 4.4 |
| D | 0.0 |
| Not Rated | 9.7 |
| Equities | 7.0 |
| Short-Term Investments and Net Other Assets (Liabilities) | 6.2 |
QUALITY DIVERSIFICATION (% of Fund's net assets) |
|
| |
| We have used ratings from Moody's Investors Service, Inc. Where Moody's® ratings are not available, we have used S&P® ratings. All ratings are as of the date indicated and do not reflect subsequent changes. |
| High-Yield Debt | 40.8 |
| U.S. Government & Investment Grade-Debt | 30.2 |
| Emerging-Markets Debt | 15.5 |
| Foreign Developed-Markets Debt | 7.9 |
| Floating-Rate debt | 5.5 |
| Short-Term Investments and Net Other Assets (Liabilities) | 0.1 |
ASSET ALLOCATION (% of Fund's net assets) |
|
|
| United States | 74.5 |
| Germany | 4.0 |
| United Kingdom | 2.2 |
| Mexico | 1.3 |
| France | 1.2 |
| Brazil | 1.2 |
| Canada | 1.1 |
| Saudi Arabia | 0.9 |
| Turkey | 0.8 |
| Others | 12.8 |
GEOGRAPHIC DIVERSIFICATION (% of Fund's net assets) |
|
| |
|
TOP HOLDINGS (% of Fund's net assets) | | |
| US Treasury Notes | 16.9 | |
| US Treasury Bonds | 6.3 | |
| Freddie Mac Multifamily Structured Pass Through Certificates | 2.9 | |
| German Federal Republic | 2.8 | |
| TransDigm Inc | 1.3 | |
| Energy Transfer LP | 1.0 | |
| Freddie Mac Gold Pool | 0.8 | |
| Fannie Mae Mortgage pass-thru certificates | 0.7 | |
| Fannie Mae Guaranteed REMICS | 0.7 | |
| Uber Technologies Inc | 0.7 | |
| | 34.1 | |
| |
| Fidelity, the Fidelity Investments Logo and all other Fidelity trademarks or service marks used herein are trademarks or service marks of FMR LLC. Any third-party marks that are used herein are trademarks or service marks of their respective owners. © 2024 FMR LLC. All rights reserved. |
| | For additional information about the Fund; including its prospectus, financial information, holdings and proxy information, scan the QR code or visit fundresearch.fidelity.com/prospectus/sec 1.9916059.100 1470-TSRS-0824 |
| |
| | SEMI-ANNUAL SHAREHOLDER REPORT | AS OF JUNE 30, 2024 | |
| | VIP Freedom 2015 Portfolio℠ VIP Freedom 2015 Portfolio℠ Service Class 2 true |
| | | |
This semi-annual shareholder report contains information about VIP Freedom 2015 Portfolio℠ for the period January 1, 2024 to June 30, 2024. You can find additional information about the Fund at fundresearch.fidelity.com/prospectus/sec. You can also request this information by contacting us at 1-877-208-0098 or by sending an e-mail to funddocuments@fmr.com.
What were your Fund costs for the last six months?(based on hypothetical $10,000 investment)
| | Costs of a $10,000 investment | Costs paid as a percentage of a $10,000 investment | |
| Service Class 2 | $ 13 | 0.25% | |
Key Fund Statistics (as of June 30, 2024)
KEY FACTS | | |
| Fund Size | $58,678,683 | |
| Number of Holdings | 15 | |
| Portfolio Turnover | 30% | |
What did the Fund invest in?
(as of June 30, 2024)
| Bond Funds | 42.1 |
| International Equity Funds | 20.3 |
| Domestic Equity Funds | 18.0 |
| Inflation-Protected Bond Funds | 14.4 |
| Short-Term Investments and Net Other Assets (Liabilities) | 5.2 |
ASSET ALLOCATION (% of Fund's net assets) |
|
|
TOP HOLDINGS (% of Fund's net assets) | | |
| VIP Investment Grade Bond II Portfolio - Initial Class | 35.1 | |
| Fidelity Inflation-Protected Bond Index Fund | 14.4 | |
| VIP Overseas Portfolio - Initial Class | 12.6 | |
| VIP Emerging Markets Portfolio - Initial Class | 7.7 | |
| VIP Growth Portfolio - Initial Class | 5.2 | |
| VIP Growth & Income Portfolio - Initial Class | 3.5 | |
| VIP Contrafund Portfolio - Initial Class | 3.2 | |
| Fidelity International Bond Index Fund | 2.7 | |
| VIP Equity-Income Portfolio - Initial Class | 2.6 | |
| Fidelity Long-Term Treasury Bond Index Fund | 2.6 | |
| | 89.6 | |
| |
| Fidelity, the Fidelity Investments Logo and all other Fidelity trademarks or service marks used herein are trademarks or service marks of FMR LLC. Any third-party marks that are used herein are trademarks or service marks of their respective owners. © 2024 FMR LLC. All rights reserved. |
| | For additional information about the Fund; including its prospectus, financial information, holdings and proxy information, scan the QR code or visit fundresearch.fidelity.com/prospectus/sec 1.9916080.100 1428-TSRS-0824 |
| |
| | SEMI-ANNUAL SHAREHOLDER REPORT | AS OF JUNE 30, 2024 | |
| | VIP Freedom Lifetime Income® III Portfolio VIP Freedom Lifetime Income® III Portfolio true |
| | | |
This semi-annual shareholder report contains information about VIP Freedom Lifetime Income® III Portfolio for the period January 1, 2024 to June 30, 2024. You can find additional information about the Fund at fundresearch.fidelity.com/prospectus/sec. You can also request this information by contacting us at 1-877-208-0098 or by sending an e-mail to funddocuments@fmr.com.
What were your Fund costs for the last six months?(based on hypothetical $10,000 investment)
| | Costs of a $10,000 investment | Costs paid as a percentage of a $10,000 investment | |
| VIP Freedom Lifetime Income® III Portfolio | $ 0 A | 0.00%B | |
A Amount represents less than $.50
B Amount represents less than 0.005%
Key Fund Statistics (as of June 30, 2024)
KEY FACTS | | |
| Fund Size | $29,235,772 | |
| Number of Holdings | 15 | |
| Portfolio Turnover | 19% | |
What did the Fund invest in?
(as of June 30, 2024)
| Bond Funds | 37.3 |
| Domestic Equity Funds | 24.9 |
| International Equity Funds | 24.9 |
| Inflation-Protected Bond Funds | 12.7 |
| Short-Term Investments and Net Other Assets (Liabilities) | 0.2 |
ASSET ALLOCATION (% of Fund's net assets) |
|
|
TOP HOLDINGS (% of Fund's net assets) | | |
| VIP Investment Grade Bond II Portfolio - Investor Class | 28.4 | |
| VIP Overseas Portfolio - Investor Class | 15.9 | |
| Fidelity Inflation-Protected Bond Index Fund | 12.7 | |
| VIP Emerging Markets Portfolio - Investor Class | 9.0 | |
| VIP Growth Portfolio - Investor Class | 7.3 | |
| VIP Growth & Income Portfolio - Investor Class | 4.9 | |
| VIP Contrafund Portfolio - Investor Class | 4.4 | |
| Fidelity Long-Term Treasury Bond Index Fund | 4.3 | |
| VIP Equity Income Portfolio - Investor Class | 3.6 | |
| Fidelity International Bond Index Fund | 2.9 | |
| | 93.4 | |
| |
| Fidelity, the Fidelity Investments Logo and all other Fidelity trademarks or service marks used herein are trademarks or service marks of FMR LLC. Any third-party marks that are used herein are trademarks or service marks of their respective owners. © 2024 FMR LLC. All rights reserved. |
| | For additional information about the Fund; including its prospectus, financial information, holdings and proxy information, scan the QR code or visit fundresearch.fidelity.com/prospectus/sec 1.9916092.100 1494-TSRS-0824 |
| |
| | SEMI-ANNUAL SHAREHOLDER REPORT | AS OF JUNE 30, 2024 | |
| | VIP Government Money Market Portfolio VIP Government Money Market Portfolio Investor Class true |
| | | |
This semi-annual shareholder report contains information about VIP Government Money Market Portfolio for the period January 1, 2024 to June 30, 2024. You can find additional information about the Fund at fundresearch.fidelity.com/prospectus/sec. You can also request this information by contacting us at 1-877-208-0098 or by sending an e-mail to funddocuments@fmr.com.
What were your Fund costs for the last six months?(based on hypothetical $10,000 investment)
| | Costs of a $10,000 investment | Costs paid as a percentage of a $10,000 investment | |
| Investor Class | $ 15 | 0.30% | |
Key Fund Statistics (as of June 30, 2024)
KEY FACTS | | |
| Fund Size | $8,626,160,570 | |
| Number of Holdings | 456 | |
What did the Fund invest in?
(as of June 30, 2024)
EFFECTIVE MATURITY DIVERSIFICATION (% of Fund's net assets) |
| Days |
| 1-7 | 67.7 | |
| 8-30 | 8.1 | |
| 31-60 | 7.4 | |
| 61-90 | 5.2 | |
| 91-180 | 8.2 | |
| >180 | 3.2 | |
| |
| Repurchase Agreements | 50.8 |
| U.S. Treasury Obligations | 26.6 |
| U.S. Government Agency - Debt | 22.4 |
| Net Other Assets (Liabilities) | 0.2 |
ASSET ALLOCATION (% of Fund's net assets) |
|
|
| Fidelity, the Fidelity Investments Logo and all other Fidelity trademarks or service marks used herein are trademarks or service marks of FMR LLC. Any third-party marks that are used herein are trademarks or service marks of their respective owners. © 2024 FMR LLC. All rights reserved. |
| | For additional information about the Fund; including its prospectus, financial information, holdings and proxy information, scan the QR code or visit fundresearch.fidelity.com/prospectus/sec 1.9915925.100 1455-TSRS-0824 |
| |
| | SEMI-ANNUAL SHAREHOLDER REPORT | AS OF JUNE 30, 2024 | |
| | VIP Strategic Income Portfolio VIP Strategic Income Portfolio Service Class 2 true |
| | | |
This semi-annual shareholder report contains information about VIP Strategic Income Portfolio for the period January 1, 2024 to June 30, 2024. You can find additional information about the Fund at fundresearch.fidelity.com/prospectus/sec. You can also request this information by contacting us at 1-877-208-0098 or by sending an e-mail to funddocuments@fmr.com.
What were your Fund costs for the last six months?(based on hypothetical $10,000 investment)
| | Costs of a $10,000 investment | Costs paid as a percentage of a $10,000 investment | |
| Service Class 2 | $ 46 | 0.90% | |
Key Fund Statistics (as of June 30, 2024)
KEY FACTS | | |
| Fund Size | $1,441,795,230 | |
| Number of Holdings | 1,537 | |
| Portfolio Turnover | 87% | |
What did the Fund invest in?
(as of June 30, 2024)
| U.S. Government and U.S. Government Agency Obligations | 24.4 |
| AAA | 0.4 |
| AA | 1.1 |
| A | 2.8 |
| BBB | 9.7 |
| BB | 15.1 |
| B | 19.2 |
| CCC,CC,C | 4.4 |
| D | 0.0 |
| Not Rated | 9.7 |
| Equities | 7.0 |
| Short-Term Investments and Net Other Assets (Liabilities) | 6.2 |
QUALITY DIVERSIFICATION (% of Fund's net assets) |
|
| |
| We have used ratings from Moody's Investors Service, Inc. Where Moody's® ratings are not available, we have used S&P® ratings. All ratings are as of the date indicated and do not reflect subsequent changes. |
| High-Yield Debt | 40.8 |
| U.S. Government & Investment Grade-Debt | 30.2 |
| Emerging-Markets Debt | 15.5 |
| Foreign Developed-Markets Debt | 7.9 |
| Floating-Rate debt | 5.5 |
| Short-Term Investments and Net Other Assets (Liabilities) | 0.1 |
ASSET ALLOCATION (% of Fund's net assets) |
|
|
| United States | 74.5 |
| Germany | 4.0 |
| United Kingdom | 2.2 |
| Mexico | 1.3 |
| France | 1.2 |
| Brazil | 1.2 |
| Canada | 1.1 |
| Saudi Arabia | 0.9 |
| Turkey | 0.8 |
| Others | 12.8 |
GEOGRAPHIC DIVERSIFICATION (% of Fund's net assets) |
|
| |
|
TOP HOLDINGS (% of Fund's net assets) | | |
| US Treasury Notes | 16.9 | |
| US Treasury Bonds | 6.3 | |
| Freddie Mac Multifamily Structured Pass Through Certificates | 2.9 | |
| German Federal Republic | 2.8 | |
| TransDigm Inc | 1.3 | |
| Energy Transfer LP | 1.0 | |
| Freddie Mac Gold Pool | 0.8 | |
| Fannie Mae Mortgage pass-thru certificates | 0.7 | |
| Fannie Mae Guaranteed REMICS | 0.7 | |
| Uber Technologies Inc | 0.7 | |
| | 34.1 | |
| |
| Fidelity, the Fidelity Investments Logo and all other Fidelity trademarks or service marks used herein are trademarks or service marks of FMR LLC. Any third-party marks that are used herein are trademarks or service marks of their respective owners. © 2024 FMR LLC. All rights reserved. |
| | For additional information about the Fund; including its prospectus, financial information, holdings and proxy information, scan the QR code or visit fundresearch.fidelity.com/prospectus/sec 1.9916058.100 1328-TSRS-0824 |
| |
| | SEMI-ANNUAL SHAREHOLDER REPORT | AS OF JUNE 30, 2024 | |
| | VIP Freedom Income Portfolio℠ VIP Freedom Income Portfolio℠ Service Class 2 true |
| | | |
This semi-annual shareholder report contains information about VIP Freedom Income Portfolio℠ for the period January 1, 2024 to June 30, 2024. You can find additional information about the Fund at fundresearch.fidelity.com/prospectus/sec. You can also request this information by contacting us at 1-877-208-0098 or by sending an e-mail to funddocuments@fmr.com.
What were your Fund costs for the last six months?(based on hypothetical $10,000 investment)
| | Costs of a $10,000 investment | Costs paid as a percentage of a $10,000 investment | |
| Service Class 2 | $ 13 | 0.25% | |
Key Fund Statistics (as of June 30, 2024)
KEY FACTS | | |
| Fund Size | $78,673,299 | |
| Number of Holdings | 15 | |
| Portfolio Turnover | 45% | |
What did the Fund invest in?
(as of June 30, 2024)
| Bond Funds | 46.5 |
| Inflation-Protected Bond Funds | 16.4 |
| International Equity Funds | 13.6 |
| Domestic Equity Funds | 8.0 |
| Short-Term Investments and Net Other Assets (Liabilities) | 15.5 |
ASSET ALLOCATION (% of Fund's net assets) |
|
|
TOP HOLDINGS (% of Fund's net assets) | | |
| VIP Investment Grade Bond II Portfolio - Initial Class | 40.4 | |
| Fidelity Inflation-Protected Bond Index Fund | 16.4 | |
| VIP Overseas Portfolio - Initial Class | 7.9 | |
| VIP Emerging Markets Portfolio - Initial Class | 5.7 | |
| VIP Growth Portfolio - Initial Class | 2.3 | |
| Fidelity Long-Term Treasury Bond Index Fund | 2.2 | |
| Fidelity International Bond Index Fund | 2.2 | |
| VIP High Income Portfolio - Initial Class | 1.7 | |
| VIP Growth & Income Portfolio - Initial Class | 1.6 | |
| VIP Contrafund Portfolio - Initial Class | 1.4 | |
| | 81.8 | |
| |
| Fidelity, the Fidelity Investments Logo and all other Fidelity trademarks or service marks used herein are trademarks or service marks of FMR LLC. Any third-party marks that are used herein are trademarks or service marks of their respective owners. © 2024 FMR LLC. All rights reserved. |
| | For additional information about the Fund; including its prospectus, financial information, holdings and proxy information, scan the QR code or visit fundresearch.fidelity.com/prospectus/sec 1.9916071.100 1419-TSRS-0824 |
| |
| | SEMI-ANNUAL SHAREHOLDER REPORT | AS OF JUNE 30, 2024 | |
| | VIP FundsManager® 30% Portfolio VIP FundsManager® 30% Portfolio Service Class 2 true |
| | | |
This semi-annual shareholder report contains information about VIP FundsManager® 30% Portfolio for the period January 1, 2024 to June 30, 2024. You can find additional information about the Fund at fundresearch.fidelity.com/prospectus/sec. You can also request this information by contacting us at 1-877-208-0098 or by sending an e-mail to funddocuments@fmr.com.
What were your Fund costs for the last six months?(based on hypothetical $10,000 investment)
| | Costs of a $10,000 investment | Costs paid as a percentage of a $10,000 investment | |
| Service Class 2 | $ 13 | 0.25% | |
Key Fund Statistics (as of June 30, 2024)
KEY FACTS | | |
| Fund Size | $11,338,553 | |
| Number of Holdings | 29 | |
| Portfolio Turnover | 25% | |
What did the Fund invest in?
(as of June 30, 2024)
| Bond Funds | 48.5 |
| Domestic Equity Funds | 22.2 |
| International Equity Funds | 12.3 |
| Inflation-Protected Bond Funds | 0.9 |
| Short-Term Investments and Net Other Assets (Liabilities) | 16.1 |
ASSET ALLOCATION (% of Fund's net assets) |
|
|
TOP HOLDINGS (% of Fund's net assets) | | |
| VIP Investment Grade Bond II Portfolio - Investor Class | 23.0 | |
| Fidelity Total Bond Fund | 23.0 | |
| VIP Stock Selector All Cap Portfolio - Investor Class | 16.5 | |
| Fidelity Overseas Fund | 3.9 | |
| Fidelity Emerging Markets Fund | 3.5 | |
| Fidelity Hedged Equity Fund | 1.2 | |
| iShares Core S&P 500 ETF | 1.2 | |
| Fidelity Floating Rate High Income Fund | 1.2 | |
| Fidelity International Discovery Fund | 1.0 | |
| Fidelity Inflation-Protected Bond Index Fund | 0.9 | |
| | 75.4 | |
| |
| Fidelity, the Fidelity Investments Logo and all other Fidelity trademarks or service marks used herein are trademarks or service marks of FMR LLC. Any third-party marks that are used herein are trademarks or service marks of their respective owners. © 2024 FMR LLC. All rights reserved. |
| | For additional information about the Fund; including its prospectus, financial information, holdings and proxy information, scan the QR code or visit fundresearch.fidelity.com/prospectus/sec 1.9916211.100 6988-TSRS-0824 |
| |
| | SEMI-ANNUAL SHAREHOLDER REPORT | AS OF JUNE 30, 2024 | |
| | VIP Freedom 2035 Portfolio℠ VIP Freedom 2035 Portfolio℠ Service Class 2 true |
| | | |
This semi-annual shareholder report contains information about VIP Freedom 2035 Portfolio℠ for the period January 1, 2024 to June 30, 2024. You can find additional information about the Fund at fundresearch.fidelity.com/prospectus/sec. You can also request this information by contacting us at 1-877-208-0098 or by sending an e-mail to funddocuments@fmr.com.
What were your Fund costs for the last six months?(based on hypothetical $10,000 investment)
| | Costs of a $10,000 investment | Costs paid as a percentage of a $10,000 investment | |
| Service Class 2 | $ 13 | 0.25% | |
Key Fund Statistics (as of June 30, 2024)
KEY FACTS | | |
| Fund Size | $329,641,161 | |
| Number of Holdings | 14 | |
| Portfolio Turnover | 38% | |
What did the Fund invest in?
(as of June 30, 2024)
| Domestic Equity Funds | 38.7 |
| International Equity Funds | 34.2 |
| Bond Funds | 22.9 |
| Inflation-Protected Bond Funds | 4.2 |
| Short-Term Investments and Net Other Assets (Liabilities) | 0.0 |
ASSET ALLOCATION (% of Fund's net assets) |
|
|
TOP HOLDINGS (% of Fund's net assets) | | |
| VIP Overseas Portfolio - Initial Class | 22.5 | |
| VIP Investment Grade Bond II Portfolio - Initial Class | 12.3 | |
| VIP Emerging Markets Portfolio - Initial Class | 11.7 | |
| VIP Growth Portfolio - Initial Class | 11.3 | |
| VIP Growth & Income Portfolio - Initial Class | 7.6 | |
| Fidelity Long-Term Treasury Bond Index Fund | 7.0 | |
| VIP Contrafund Portfolio - Initial Class | 6.8 | |
| VIP Equity-Income Portfolio - Initial Class | 5.5 | |
| Fidelity Inflation-Protected Bond Index Fund | 4.2 | |
| VIP Value Portfolio - Initial Class | 3.9 | |
| | 92.8 | |
| |
| Fidelity, the Fidelity Investments Logo and all other Fidelity trademarks or service marks used herein are trademarks or service marks of FMR LLC. Any third-party marks that are used herein are trademarks or service marks of their respective owners. © 2024 FMR LLC. All rights reserved. |
| | For additional information about the Fund; including its prospectus, financial information, holdings and proxy information, scan the QR code or visit fundresearch.fidelity.com/prospectus/sec 1.9916133.100 2161-TSRS-0824 |
| |
| | SEMI-ANNUAL SHAREHOLDER REPORT | AS OF JUNE 30, 2024 | |
| | VIP Freedom 2030 Portfolio℠ VIP Freedom 2030 Portfolio℠ Initial Class true |
| | | |
This semi-annual shareholder report contains information about VIP Freedom 2030 Portfolio℠ for the period January 1, 2024 to June 30, 2024. You can find additional information about the Fund at fundresearch.fidelity.com/prospectus/sec. You can also request this information by contacting us at 1-877-208-0098 or by sending an e-mail to funddocuments@fmr.com.
What were your Fund costs for the last six months?(based on hypothetical $10,000 investment)
| | Costs of a $10,000 investment | Costs paid as a percentage of a $10,000 investment | |
| Initial Class | $ 0 A | 0.00%B | |
AAmount represents less than $.50
BAmount represents less than 0.005%
Key Fund Statistics (as of June 30, 2024)
KEY FACTS | | |
| Fund Size | $739,905,870 | |
| Number of Holdings | 14 | |
| Portfolio Turnover | 31% | |
What did the Fund invest in?
(as of June 30, 2024)
| Domestic Equity Funds | 32.4 |
| International Equity Funds | 29.9 |
| Bond Funds | 29.1 |
| Inflation-Protected Bond Funds | 8.6 |
| Short-Term Investments and Net Other Assets (Liabilities) | 0.0 |
ASSET ALLOCATION (% of Fund's net assets) |
|
|
TOP HOLDINGS (% of Fund's net assets) | | |
| VIP Overseas Portfolio - Initial Class | 19.5 | |
| VIP Investment Grade Bond II Portfolio - Initial Class | 18.4 | |
| VIP Emerging Markets Portfolio - Initial Class | 10.4 | |
| VIP Growth Portfolio - Initial Class | 9.4 | |
| Fidelity Inflation-Protected Bond Index Fund | 8.6 | |
| Fidelity Long-Term Treasury Bond Index Fund | 6.6 | |
| VIP Growth & Income Portfolio - Initial Class | 6.4 | |
| VIP Contrafund Portfolio - Initial Class | 5.7 | |
| VIP Equity-Income Portfolio - Initial Class | 4.6 | |
| VIP Value Portfolio - Initial Class | 3.2 | |
| | 92.8 | |
| |
| Fidelity, the Fidelity Investments Logo and all other Fidelity trademarks or service marks used herein are trademarks or service marks of FMR LLC. Any third-party marks that are used herein are trademarks or service marks of their respective owners. © 2024 FMR LLC. All rights reserved. |
| | For additional information about the Fund; including its prospectus, financial information, holdings and proxy information, scan the QR code or visit fundresearch.fidelity.com/prospectus/sec 1.9916087.100 1435-TSRS-0824 |
| |
| | SEMI-ANNUAL SHAREHOLDER REPORT | AS OF JUNE 30, 2024 | |
| | VIP Asset Manager Portfolio VIP Asset Manager Portfolio Investor Class true |
| | | |
This semi-annual shareholder report contains information about VIP Asset Manager Portfolio for the period January 1, 2024 to June 30, 2024. You can find additional information about the Fund at fundresearch.fidelity.com/prospectus/sec. You can also request this information by contacting us at 1-877-208-0098 or by sending an e-mail to funddocuments@fmr.com.
What were your Fund costs for the last six months?(based on hypothetical $10,000 investment)
| | Costs of a $10,000 investment | Costs paid as a percentage of a $10,000 investment | |
| Investor Class | $ 31 | 0.61% | |
Key Fund Statistics (as of June 30, 2024)
KEY FACTS | | |
| Fund Size | $930,114,262 | |
| Number of Holdings | 25 | |
| Portfolio Turnover | 11% | |
What did the Fund invest in?
(as of June 30, 2024)
| U.S. Government and U.S. Government Agency Obligations | 23.9 |
| AAA | 3.0 |
| AA | 0.0 |
| A | 3.1 |
| BBB | 4.9 |
| BB | 1.6 |
| B | 1.6 |
| CCC,CC,C | 0.2 |
| D | 0.0 |
| Not Rated | 0.6 |
| Equities | 60.3 |
| Short-Term Investments and Net Other Assets (Liabilities) | 0.8 |
QUALITY DIVERSIFICATION (% of Fund's net assets) |
|
| |
| We have used ratings from Moody's Investors Service, Inc. Where Moody's® ratings are not available, we have used S&P® ratings. All ratings are as of the date indicated and do not reflect subsequent changes. |
MARKET SECTORS (% of Fund's net assets) | | |
| Information Technology | 14.0 | |
| Financials | 9.9 | |
| Industrials | 6.9 | |
| Health Care | 6.8 | |
| Consumer Discretionary | 6.0 | |
| Communication Services | 4.0 | |
| Consumer Staples | 2.8 | |
| Energy | 2.4 | |
| Materials | 2.3 | |
| Real Estate | 1.3 | |
| Utilities | 1.1 | |
| |
| Equities | 59.8 |
| Bonds | 39.4 |
| Short-Term Investments and Net Other Assets (Liabilities) | 0.8 |
ASSET ALLOCATION (% of Fund's net assets) |
|
|
TOP HOLDINGS (% of Fund's net assets) | | |
| US Treasury Notes | 12.6 | |
| US Treasury Bonds | 3.7 | |
| Uniform Mortgage Backed Securities | 3.5 | |
| Microsoft Corp | 2.7 | |
| Ginnie Mae II Pool | 2.3 | |
| Apple Inc | 1.7 | |
| Alphabet Inc Class A | 1.5 | |
| Amazon.com Inc | 1.5 | |
| Freddie Mac Gold Pool | 1.1 | |
| Fannie Mae Mortgage pass-thru certificates | 0.5 | |
| | 31.1 | |
| |
| Fidelity, the Fidelity Investments Logo and all other Fidelity trademarks or service marks used herein are trademarks or service marks of FMR LLC. Any third-party marks that are used herein are trademarks or service marks of their respective owners. © 2024 FMR LLC. All rights reserved. |
| | For additional information about the Fund; including its prospectus, financial information, holdings and proxy information, scan the QR code or visit fundresearch.fidelity.com/prospectus/sec 1.9915996.100 1457-TSRS-0824 |
| |
| | SEMI-ANNUAL SHAREHOLDER REPORT | AS OF JUNE 30, 2024 | |
| | VIP Government Money Market Portfolio VIP Government Money Market Portfolio Service Class 2 true |
| | | |
This semi-annual shareholder report contains information about VIP Government Money Market Portfolio for the period January 1, 2024 to June 30, 2024. You can find additional information about the Fund at fundresearch.fidelity.com/prospectus/sec. You can also request this information by contacting us at 1-877-208-0098 or by sending an e-mail to funddocuments@fmr.com.
What were your Fund costs for the last six months?(based on hypothetical $10,000 investment)
| | Costs of a $10,000 investment | Costs paid as a percentage of a $10,000 investment | |
| Service Class 2 | $ 27 | 0.53% | |
Key Fund Statistics (as of June 30, 2024)
KEY FACTS | | |
| Fund Size | $8,626,160,570 | |
| Number of Holdings | 456 | |
What did the Fund invest in?
(as of June 30, 2024)
EFFECTIVE MATURITY DIVERSIFICATION (% of Fund's net assets) |
| Days |
| 1-7 | 67.7 | |
| 8-30 | 8.1 | |
| 31-60 | 7.4 | |
| 61-90 | 5.2 | |
| 91-180 | 8.2 | |
| >180 | 3.2 | |
| |
| Repurchase Agreements | 50.8 |
| U.S. Treasury Obligations | 26.6 |
| U.S. Government Agency - Debt | 22.4 |
| Net Other Assets (Liabilities) | 0.2 |
ASSET ALLOCATION (% of Fund's net assets) |
|
|
| Fidelity, the Fidelity Investments Logo and all other Fidelity trademarks or service marks used herein are trademarks or service marks of FMR LLC. Any third-party marks that are used herein are trademarks or service marks of their respective owners. © 2024 FMR LLC. All rights reserved. |
| | For additional information about the Fund; including its prospectus, financial information, holdings and proxy information, scan the QR code or visit fundresearch.fidelity.com/prospectus/sec 1.9915927.100 359-TSRS-0824 |
| |
| | SEMI-ANNUAL SHAREHOLDER REPORT | AS OF JUNE 30, 2024 | |
| | VIP Investor Freedom 2050 Portfolio℠ VIP Investor Freedom 2050 Portfolio℠ true |
| | | |
This semi-annual shareholder report contains information about VIP Investor Freedom 2050 Portfolio℠ for the period January 1, 2024 to June 30, 2024. You can find additional information about the Fund at fundresearch.fidelity.com/prospectus/sec. You can also request this information by contacting us at 1-877-208-0098 or by sending an e-mail to funddocuments@fmr.com.
What were your Fund costs for the last six months?(based on hypothetical $10,000 investment)
| | Costs of a $10,000 investment | Costs paid as a percentage of a $10,000 investment | |
| VIP Investor Freedom 2050 Portfolio℠ | $ 0 A | 0.00%B | |
A Amount represents less than $.50
B Amount represents less than 0.005%
Key Fund Statistics (as of June 30, 2024)
KEY FACTS | | |
| Fund Size | $5,069,187 | |
| Number of Holdings | 13 | |
| Portfolio Turnover | 42% | |
What did the Fund invest in?
(as of June 30, 2024)
| Domestic Equity Funds | 50.5 |
| International Equity Funds | 42.5 |
| Bond Funds | 5.8 |
| Inflation-Protected Bond Funds | 1.2 |
| Short-Term Investments and Net Other Assets (Liabilities) | 0.0 |
ASSET ALLOCATION (% of Fund's net assets) |
|
|
TOP HOLDINGS (% of Fund's net assets) | | |
| VIP Overseas Portfolio - Investor Class | 28.5 | |
| VIP Growth Portfolio - Investor Class | 14.7 | |
| VIP Emerging Markets Portfolio - Investor Class | 14.0 | |
| VIP Growth & Income Portfolio - Investor Class | 9.9 | |
| VIP Contrafund Portfolio - Investor Class | 8.8 | |
| VIP Equity Income Portfolio - Investor Class | 7.2 | |
| Fidelity Long-Term Treasury Bond Index Fund | 5.5 | |
| VIP Value Portfolio - Investor Class | 5.1 | |
| VIP Value Strategies Portfolio - Investor Class | 2.5 | |
| VIP Mid Cap Portfolio - Investor Class | 2.3 | |
| | 98.5 | |
| |
| Fidelity, the Fidelity Investments Logo and all other Fidelity trademarks or service marks used herein are trademarks or service marks of FMR LLC. Any third-party marks that are used herein are trademarks or service marks of their respective owners. © 2024 FMR LLC. All rights reserved. |
| | For additional information about the Fund; including its prospectus, financial information, holdings and proxy information, scan the QR code or visit fundresearch.fidelity.com/prospectus/sec 1.9916209.100 6577-TSRS-0824 |
| |
| | SEMI-ANNUAL SHAREHOLDER REPORT | AS OF JUNE 30, 2024 | |
| | VIP Bond Index Portfolio VIP Bond Index Portfolio Initial Class true |
| | | |
This semi-annual shareholder report contains information about VIP Bond Index Portfolio for the period January 1, 2024 to June 30, 2024. You can find additional information about the Fund at fundresearch.fidelity.com/prospectus/sec. You can also request this information by contacting us at 1-877-208-0098 or by sending an e-mail to funddocuments@fmr.com.
What were your Fund costs for the last six months?(based on hypothetical $10,000 investment)
| | Costs of a $10,000 investment | Costs paid as a percentage of a $10,000 investment | |
| Initial Class | $ 7 | 0.14% | |
Key Fund Statistics (as of June 30, 2024)
KEY FACTS | | |
| Fund Size | $821,883,192 | |
| Number of Holdings | 2,765 | |
| Portfolio Turnover | 57% | |
What did the Fund invest in?
(as of June 30, 2024)
| U.S. Government and U.S. Government Agency Obligations | 67.6 |
| AAA | 2.9 |
| AA | 1.8 |
| A | 14.3 |
| BBB | 12.5 |
| BB | 0.4 |
| Not Rated | 0.8 |
QUALITY DIVERSIFICATION (% of Fund's net assets) |
|
| Short-Term Investments and Net Other Assets (Liabilities) - (0.3)%* |
| |
| We have used ratings from Moody's Investors Service, Inc. Where Moody's® ratings are not available, we have used S&P® ratings. All ratings are as of the date indicated and do not reflect subsequent changes. |
| U.S. Treasury Obligations | 41.2 |
| Corporate Bonds | 28.6 |
| U.S. Government Agency - Mortgage Securities | 25.5 |
| Foreign Government and Government Agency Obligations | 1.7 |
| CMOs and Other Mortgage Related Securities | 1.4 |
| U.S. Government Agency Obligations | 0.9 |
| Municipal Securities | 0.4 |
| Asset-Backed Securities | 0.3 |
| Other Investments | 0.3 |
ASSET ALLOCATION (% of Fund's net assets) |
|
| Short-Term Investments and Net Other Assets (Liabilities) - (0.3)% |
|
| United States | 92.4 |
| United Kingdom | 1.4 |
| Canada | 1.2 |
| Multi-national | 1.0 |
| Japan | 1.0 |
| Mexico | 0.5 |
| Germany | 0.4 |
| Switzerland | 0.2 |
| Australia | 0.2 |
| Others | 1.7 |
GEOGRAPHIC DIVERSIFICATION (% of Fund's net assets) |
|
| |
|
TOP HOLDINGS (% of Fund's net assets) | | |
| US Treasury Notes | 32.6 | |
| Fannie Mae Mortgage pass-thru certificates | 10.2 | |
| US Treasury Bonds | 8.6 | |
| Freddie Mac Gold Pool | 8.5 | |
| Ginnie Mae II Pool | 5.1 | |
| Freddie Mac Multifamily Structured Pass Through Certificates | 1.0 | |
| Bank of America Corp | 0.8 | |
| Ginnie Mae I Pool | 0.7 | |
| JPMorgan Chase & Co | 0.7 | |
| Wells Fargo & Co | 0.5 | |
| | 68.7 | |
| |
| Fidelity, the Fidelity Investments Logo and all other Fidelity trademarks or service marks used herein are trademarks or service marks of FMR LLC. Any third-party marks that are used herein are trademarks or service marks of their respective owners. © 2024 FMR LLC. All rights reserved. |
| | For additional information about the Fund; including its prospectus, financial information, holdings and proxy information, scan the QR code or visit fundresearch.fidelity.com/prospectus/sec 1.9916182.100 3078-TSRS-0824 |
| |
| | SEMI-ANNUAL SHAREHOLDER REPORT | AS OF JUNE 30, 2024 | |
| | VIP Freedom 2040 Portfolio℠ VIP Freedom 2040 Portfolio℠ Service Class 2 true |
| | | |
This semi-annual shareholder report contains information about VIP Freedom 2040 Portfolio℠ for the period January 1, 2024 to June 30, 2024. You can find additional information about the Fund at fundresearch.fidelity.com/prospectus/sec. You can also request this information by contacting us at 1-877-208-0098 or by sending an e-mail to funddocuments@fmr.com.
What were your Fund costs for the last six months?(based on hypothetical $10,000 investment)
| | Costs of a $10,000 investment | Costs paid as a percentage of a $10,000 investment | |
| Service Class 2 | $ 13 | 0.25% | |
Key Fund Statistics (as of June 30, 2024)
KEY FACTS | | |
| Fund Size | $320,584,994 | |
| Number of Holdings | 14 | |
| Portfolio Turnover | 34% | |
What did the Fund invest in?
(as of June 30, 2024)
| Domestic Equity Funds | 47.3 |
| International Equity Funds | 40.1 |
| Bond Funds | 10.5 |
| Inflation-Protected Bond Funds | 2.1 |
| Short-Term Investments and Net Other Assets (Liabilities) | 0.0 |
ASSET ALLOCATION (% of Fund's net assets) |
|
|
TOP HOLDINGS (% of Fund's net assets) | | |
| VIP Overseas Portfolio - Initial Class | 26.7 | |
| VIP Growth Portfolio - Initial Class | 13.8 | |
| VIP Emerging Markets Portfolio - Initial Class | 13.4 | |
| VIP Growth & Income Portfolio - Initial Class | 9.3 | |
| VIP Contrafund Portfolio - Initial Class | 8.3 | |
| VIP Equity-Income Portfolio - Initial Class | 6.7 | |
| Fidelity Long-Term Treasury Bond Index Fund | 6.6 | |
| VIP Value Portfolio - Initial Class | 4.7 | |
| VIP Investment Grade Bond II Portfolio - Initial Class | 2.6 | |
| VIP Value Strategies Portfolio - Initial Class | 2.4 | |
| | 94.5 | |
| |
| Fidelity, the Fidelity Investments Logo and all other Fidelity trademarks or service marks used herein are trademarks or service marks of FMR LLC. Any third-party marks that are used herein are trademarks or service marks of their respective owners. © 2024 FMR LLC. All rights reserved. |
| | For additional information about the Fund; including its prospectus, financial information, holdings and proxy information, scan the QR code or visit fundresearch.fidelity.com/prospectus/sec 1.9916136.100 2164-TSRS-0824 |
| |
| | SEMI-ANNUAL SHAREHOLDER REPORT | AS OF JUNE 30, 2024 | |
| | VIP Freedom Income Portfolio℠ VIP Freedom Income Portfolio℠ Initial Class true |
| | | |
This semi-annual shareholder report contains information about VIP Freedom Income Portfolio℠ for the period January 1, 2024 to June 30, 2024. You can find additional information about the Fund at fundresearch.fidelity.com/prospectus/sec. You can also request this information by contacting us at 1-877-208-0098 or by sending an e-mail to funddocuments@fmr.com.
What were your Fund costs for the last six months?(based on hypothetical $10,000 investment)
| | Costs of a $10,000 investment | Costs paid as a percentage of a $10,000 investment | |
| Initial Class | $ 0 A | 0.00%B | |
AAmount represents less than $.50
BAmount represents less than 0.005%
Key Fund Statistics (as of June 30, 2024)
KEY FACTS | | |
| Fund Size | $78,673,299 | |
| Number of Holdings | 15 | |
| Portfolio Turnover | 45% | |
What did the Fund invest in?
(as of June 30, 2024)
| Bond Funds | 46.5 |
| Inflation-Protected Bond Funds | 16.4 |
| International Equity Funds | 13.6 |
| Domestic Equity Funds | 8.0 |
| Short-Term Investments and Net Other Assets (Liabilities) | 15.5 |
ASSET ALLOCATION (% of Fund's net assets) |
|
|
TOP HOLDINGS (% of Fund's net assets) | | |
| VIP Investment Grade Bond II Portfolio - Initial Class | 40.4 | |
| Fidelity Inflation-Protected Bond Index Fund | 16.4 | |
| VIP Overseas Portfolio - Initial Class | 7.9 | |
| VIP Emerging Markets Portfolio - Initial Class | 5.7 | |
| VIP Growth Portfolio - Initial Class | 2.3 | |
| Fidelity Long-Term Treasury Bond Index Fund | 2.2 | |
| Fidelity International Bond Index Fund | 2.2 | |
| VIP High Income Portfolio - Initial Class | 1.7 | |
| VIP Growth & Income Portfolio - Initial Class | 1.6 | |
| VIP Contrafund Portfolio - Initial Class | 1.4 | |
| | 81.8 | |
| |
| Fidelity, the Fidelity Investments Logo and all other Fidelity trademarks or service marks used herein are trademarks or service marks of FMR LLC. Any third-party marks that are used herein are trademarks or service marks of their respective owners. © 2024 FMR LLC. All rights reserved. |
| | For additional information about the Fund; including its prospectus, financial information, holdings and proxy information, scan the QR code or visit fundresearch.fidelity.com/prospectus/sec 1.9916069.100 1417-TSRS-0824 |
| |
| | SEMI-ANNUAL SHAREHOLDER REPORT | AS OF JUNE 30, 2024 | |
| | VIP Freedom 2045 Portfolio℠ VIP Freedom 2045 Portfolio℠ Service Class 2 true |
| | | |
This semi-annual shareholder report contains information about VIP Freedom 2045 Portfolio℠ for the period January 1, 2024 to June 30, 2024. You can find additional information about the Fund at fundresearch.fidelity.com/prospectus/sec. You can also request this information by contacting us at 1-877-208-0098 or by sending an e-mail to funddocuments@fmr.com.
What were your Fund costs for the last six months?(based on hypothetical $10,000 investment)
| | Costs of a $10,000 investment | Costs paid as a percentage of a $10,000 investment | |
| Service Class 2 | $ 13 | 0.25% | |
Key Fund Statistics (as of June 30, 2024)
KEY FACTS | | |
| Fund Size | $176,616,442 | |
| Number of Holdings | 13 | |
| Portfolio Turnover | 28% | |
What did the Fund invest in?
(as of June 30, 2024)
| Domestic Equity Funds | 50.5 |
| International Equity Funds | 42.5 |
| Bond Funds | 5.8 |
| Inflation-Protected Bond Funds | 1.2 |
| Short-Term Investments and Net Other Assets (Liabilities) | 0.0 |
ASSET ALLOCATION (% of Fund's net assets) |
|
|
TOP HOLDINGS (% of Fund's net assets) | | |
| VIP Overseas Portfolio - Initial Class | 28.5 | |
| VIP Growth Portfolio - Initial Class | 14.7 | |
| VIP Emerging Markets Portfolio - Initial Class | 14.0 | |
| VIP Growth & Income Portfolio - Initial Class | 9.9 | |
| VIP Contrafund Portfolio - Initial Class | 8.8 | |
| VIP Equity-Income Portfolio - Initial Class | 7.2 | |
| Fidelity Long-Term Treasury Bond Index Fund | 5.5 | |
| VIP Value Portfolio - Initial Class | 5.1 | |
| VIP Value Strategies Portfolio - Initial Class | 2.5 | |
| VIP Mid Cap Portfolio - Initial Class | 2.3 | |
| | 98.5 | |
| |
| Fidelity, the Fidelity Investments Logo and all other Fidelity trademarks or service marks used herein are trademarks or service marks of FMR LLC. Any third-party marks that are used herein are trademarks or service marks of their respective owners. © 2024 FMR LLC. All rights reserved. |
| | For additional information about the Fund; including its prospectus, financial information, holdings and proxy information, scan the QR code or visit fundresearch.fidelity.com/prospectus/sec 1.9916139.100 2167-TSRS-0824 |
| |
| | SEMI-ANNUAL SHAREHOLDER REPORT | AS OF JUNE 30, 2024 | |
| | VIP FundsManager® 30% Portfolio VIP FundsManager® 30% Portfolio Investor Class true |
| | | |
This semi-annual shareholder report contains information about VIP FundsManager® 30% Portfolio for the period January 1, 2024 to June 30, 2024. You can find additional information about the Fund at fundresearch.fidelity.com/prospectus/sec. You can also request this information by contacting us at 1-877-208-0098 or by sending an e-mail to funddocuments@fmr.com.
What were your Fund costs for the last six months?(based on hypothetical $10,000 investment)
| | Costs of a $10,000 investment | Costs paid as a percentage of a $10,000 investment | |
| Investor Class | $ 5 | 0.10% | |
Key Fund Statistics (as of June 30, 2024)
KEY FACTS | | |
| Fund Size | $11,338,553 | |
| Number of Holdings | 29 | |
| Portfolio Turnover | 25% | |
What did the Fund invest in?
(as of June 30, 2024)
| Bond Funds | 48.5 |
| Domestic Equity Funds | 22.2 |
| International Equity Funds | 12.3 |
| Inflation-Protected Bond Funds | 0.9 |
| Short-Term Investments and Net Other Assets (Liabilities) | 16.1 |
ASSET ALLOCATION (% of Fund's net assets) |
|
|
TOP HOLDINGS (% of Fund's net assets) | | |
| VIP Investment Grade Bond II Portfolio - Investor Class | 23.0 | |
| Fidelity Total Bond Fund | 23.0 | |
| VIP Stock Selector All Cap Portfolio - Investor Class | 16.5 | |
| Fidelity Overseas Fund | 3.9 | |
| Fidelity Emerging Markets Fund | 3.5 | |
| Fidelity Hedged Equity Fund | 1.2 | |
| iShares Core S&P 500 ETF | 1.2 | |
| Fidelity Floating Rate High Income Fund | 1.2 | |
| Fidelity International Discovery Fund | 1.0 | |
| Fidelity Inflation-Protected Bond Index Fund | 0.9 | |
| | 75.4 | |
| |
| Fidelity, the Fidelity Investments Logo and all other Fidelity trademarks or service marks used herein are trademarks or service marks of FMR LLC. Any third-party marks that are used herein are trademarks or service marks of their respective owners. © 2024 FMR LLC. All rights reserved. |
| | For additional information about the Fund; including its prospectus, financial information, holdings and proxy information, scan the QR code or visit fundresearch.fidelity.com/prospectus/sec 1.9916210.100 6986-TSRS-0824 |
| |
| | SEMI-ANNUAL SHAREHOLDER REPORT | AS OF JUNE 30, 2024 | |
| | VIP Investment Grade Bond Portfolio VIP Investment Grade Bond Portfolio Service Class 2 true |
| | | |
This semi-annual shareholder report contains information about VIP Investment Grade Bond Portfolio for the period January 1, 2024 to June 30, 2024. You can find additional information about the Fund at fundresearch.fidelity.com/prospectus/sec. You can also request this information by contacting us at 1-877-208-0098 or by sending an e-mail to funddocuments@fmr.com.
What were your Fund costs for the last six months?(based on hypothetical $10,000 investment)
| | Costs of a $10,000 investment | Costs paid as a percentage of a $10,000 investment | |
| Service Class 2 | $ 32 | 0.64% | |
Key Fund Statistics (as of June 30, 2024)
KEY FACTS | | |
| Fund Size | $4,215,966,857 | |
| Number of Holdings | 2,275 | |
| Portfolio Turnover | 217% | |
What did the Fund invest in?
(as of June 30, 2024)
| U.S. Government and U.S. Government Agency Obligations | 62.8 |
| AAA | 9.7 |
| AA | 0.4 |
| A | 8.0 |
| BBB | 16.1 |
| BB | 3.6 |
| B | 1.4 |
| CCC,CC,C | 0.0 |
| Not Rated | 3.3 |
QUALITY DIVERSIFICATION (% of Fund's net assets) |
|
| Short-Term Investments and Net Other Assets (Liabilities) - (5.3)%* |
| |
| We have used ratings from Moody's Investors Service, Inc. Where Moody's® ratings are not available, we have used S&P® ratings. All ratings are as of the date indicated and do not reflect subsequent changes. |
| U.S. Treasury Obligations | 42.6 |
| Corporate Bonds | 26.8 |
| U.S. Government Agency - Mortgage Securities | 20.2 |
| Asset-Backed Securities | 8.3 |
| CMOs and Other Mortgage Related Securities | 7.2 |
| Other Investments | 0.2 |
| Foreign Government and Government Agency Obligations | 0.0 |
| Preferred Securities | 0.0 |
| Bank Loan Obligations | 0.0 |
ASSET ALLOCATION (% of Fund's net assets) |
|
| Short-Term Investments and Net Other Assets (Liabilities) - (5.3)% |
|
| United States | 90.9 |
| Grand Cayman (UK Overseas Ter) | 4.6 |
| Mexico | 1.0 |
| United Kingdom | 0.8 |
| Ireland | 0.7 |
| Switzerland | 0.5 |
| Canada | 0.3 |
| France | 0.2 |
| Germany | 0.2 |
| Others | 0.8 |
GEOGRAPHIC DIVERSIFICATION (% of Fund's net assets) |
|
| |
|
TOP HOLDINGS (% of Fund's net assets) | | |
| US Treasury Notes | 30.2 | |
| US Treasury Bonds | 12.4 | |
| Ginnie Mae II Pool | 6.1 | |
| Fannie Mae Mortgage pass-thru certificates | 5.6 | |
| Uniform Mortgage Backed Securities | 5.2 | |
| Freddie Mac Gold Pool | 2.9 | |
| JPMorgan Chase & Co | 1.4 | |
| Bank of America Corp | 1.2 | |
| Morgan Stanley | 1.0 | |
| Petroleos Mexicanos | 1.0 | |
| | 67.0 | |
| |
| Fidelity, the Fidelity Investments Logo and all other Fidelity trademarks or service marks used herein are trademarks or service marks of FMR LLC. Any third-party marks that are used herein are trademarks or service marks of their respective owners. © 2024 FMR LLC. All rights reserved. |
| | For additional information about the Fund; including its prospectus, financial information, holdings and proxy information, scan the QR code or visit fundresearch.fidelity.com/prospectus/sec 1.9915994.100 367-TSRS-0824 |
| |
| | SEMI-ANNUAL SHAREHOLDER REPORT | AS OF JUNE 30, 2024 | |
| | VIP FundsManager® 85% Portfolio VIP FundsManager® 85% Portfolio Investor Class true |
| | | |
This semi-annual shareholder report contains information about VIP FundsManager® 85% Portfolio for the period January 1, 2024 to June 30, 2024. You can find additional information about the Fund at fundresearch.fidelity.com/prospectus/sec. You can also request this information by contacting us at 1-877-208-0098 or by sending an e-mail to funddocuments@fmr.com.
What were your Fund costs for the last six months?(based on hypothetical $10,000 investment)
| | Costs of a $10,000 investment | Costs paid as a percentage of a $10,000 investment | |
| Investor Class | $ 5 | 0.10% | |
Key Fund Statistics (as of June 30, 2024)
KEY FACTS | | |
| Fund Size | $903,040,010 | |
| Number of Holdings | 36 | |
| Portfolio Turnover | 35% | |
What did the Fund invest in?
(as of June 30, 2024)
| Domestic Equity Funds | 54.1 |
| International Equity Funds | 31.9 |
| Bond Funds | 10.6 |
| Inflation-Protected Bond Funds | 1.5 |
| Other Investments | 1.3 |
| Short-Term Investments and Net Other Assets (Liabilities) | 0.6 |
ASSET ALLOCATION (% of Fund's net assets) |
|
|
TOP HOLDINGS (% of Fund's net assets) | | |
| VIP Stock Selector All Cap Portfolio - Investor Class | 46.3 | |
| Fidelity Overseas Fund | 9.4 | |
| Fidelity Emerging Markets Fund | 9.4 | |
| VIP Investment Grade Bond II Portfolio - Investor Class | 4.8 | |
| Fidelity Total Bond Fund | 4.8 | |
| Fidelity Contrafund | 2.6 | |
| Fidelity Low-Priced Stock Fund | 2.5 | |
| Fidelity International Discovery Fund | 2.4 | |
| Fidelity Enhanced International ETF | 2.3 | |
| Fidelity International Capital Appreciation Fund | 2.0 | |
| | 86.5 | |
| |
| Fidelity, the Fidelity Investments Logo and all other Fidelity trademarks or service marks used herein are trademarks or service marks of FMR LLC. Any third-party marks that are used herein are trademarks or service marks of their respective owners. © 2024 FMR LLC. All rights reserved. |
| | For additional information about the Fund; including its prospectus, financial information, holdings and proxy information, scan the QR code or visit fundresearch.fidelity.com/prospectus/sec 1.9916113.100 1593-TSRS-0824 |
| |
| | SEMI-ANNUAL SHAREHOLDER REPORT | AS OF JUNE 30, 2024 | |
| | VIP Government Money Market Portfolio VIP Government Money Market Portfolio Initial Class true |
| | | |
This semi-annual shareholder report contains information about VIP Government Money Market Portfolio for the period January 1, 2024 to June 30, 2024. You can find additional information about the Fund at fundresearch.fidelity.com/prospectus/sec. You can also request this information by contacting us at 1-877-208-0098 or by sending an e-mail to funddocuments@fmr.com.
What were your Fund costs for the last six months?(based on hypothetical $10,000 investment)
| | Costs of a $10,000 investment | Costs paid as a percentage of a $10,000 investment | |
| Initial Class | $ 14 | 0.27% | |
Key Fund Statistics (as of June 30, 2024)
KEY FACTS | | |
| Fund Size | $8,626,160,570 | |
| Number of Holdings | 456 | |
What did the Fund invest in?
(as of June 30, 2024)
EFFECTIVE MATURITY DIVERSIFICATION (% of Fund's net assets) |
| Days |
| 1-7 | 67.7 | |
| 8-30 | 8.1 | |
| 31-60 | 7.4 | |
| 61-90 | 5.2 | |
| 91-180 | 8.2 | |
| >180 | 3.2 | |
| |
| Repurchase Agreements | 50.8 |
| U.S. Treasury Obligations | 26.6 |
| U.S. Government Agency - Debt | 22.4 |
| Net Other Assets (Liabilities) | 0.2 |
ASSET ALLOCATION (% of Fund's net assets) |
|
|
| Fidelity, the Fidelity Investments Logo and all other Fidelity trademarks or service marks used herein are trademarks or service marks of FMR LLC. Any third-party marks that are used herein are trademarks or service marks of their respective owners. © 2024 FMR LLC. All rights reserved. |
| | For additional information about the Fund; including its prospectus, financial information, holdings and proxy information, scan the QR code or visit fundresearch.fidelity.com/prospectus/sec 1.9915926.100 153-TSRS-0824 |
| |
| | SEMI-ANNUAL SHAREHOLDER REPORT | AS OF JUNE 30, 2024 | |
| | VIP Investment Grade Bond II Portfolio VIP Investment Grade Bond II Portfolio Initial Class true |
| | | |
This semi-annual shareholder report contains information about VIP Investment Grade Bond II Portfolio for the period January 1, 2024 to June 30, 2024. You can find additional information about the Fund at fundresearch.fidelity.com/prospectus/sec. You can also request this information by contacting us at 1-877-208-0098 or by sending an e-mail to funddocuments@fmr.com.
What were your Fund costs for the last six months?(based on hypothetical $10,000 investment)
| | Costs of a $10,000 investment | Costs paid as a percentage of a $10,000 investment | |
| Initial Class | $ 20 | 0.40% | |
Key Fund Statistics (as of June 30, 2024)
KEY FACTS | | |
| Fund Size | $3,215,681,705 | |
| Number of Holdings | 5,595 | |
| Portfolio Turnover | 211% | |
What did the Fund invest in?
(as of June 30, 2024)
| U.S. Government and U.S. Government Agency Obligations | 64.4 |
| AAA | 10.1 |
| AA | 0.2 |
| A | 10.6 |
| BBB | 13.5 |
| BB | 1.9 |
| B | 0.9 |
| CCC,CC,C | 0.0 |
| Not Rated | 4.1 |
QUALITY DIVERSIFICATION (% of Fund's net assets) |
|
| Short-Term Investments and Net Other Assets (Liabilities) - (5.7)%* |
| |
| We have used ratings from Moody's Investors Service, Inc. Where Moody's® ratings are not available, we have used S&P® ratings. All ratings are as of the date indicated and do not reflect subsequent changes. |
| U.S. Treasury Obligations | 43.9 |
| Corporate Bonds | 26.0 |
| U.S. Government Agency - Mortgage Securities | 20.5 |
| Asset-Backed Securities | 7.8 |
| CMOs and Other Mortgage Related Securities | 7.2 |
| Foreign Government and Government Agency Obligations | 0.2 |
| Other Investments | 0.1 |
| Municipal Securities | 0.0 |
| Preferred Securities | 0.0 |
| Bank Loan Obligations | 0.0 |
ASSET ALLOCATION (% of Fund's net assets) |
|
| Short-Term Investments and Net Other Assets (Liabilities) - (5.7)% |
|
| United States | 90.4 |
| Grand Cayman (UK Overseas Ter) | 4.3 |
| Mexico | 0.9 |
| United Kingdom | 0.8 |
| Multi-national | 0.7 |
| Ireland | 0.6 |
| Canada | 0.4 |
| Switzerland | 0.4 |
| Belgium | 0.3 |
| Others | 1.2 |
GEOGRAPHIC DIVERSIFICATION (% of Fund's net assets) |
|
| |
|
TOP HOLDINGS (% of Fund's net assets) | | |
| US Treasury Notes | 32.2 | |
| US Treasury Bonds | 11.7 | |
| Uniform Mortgage Backed Securities | 6.1 | |
| Fannie Mae Mortgage pass-thru certificates | 5.9 | |
| Ginnie Mae II Pool | 5.3 | |
| Freddie Mac Gold Pool | 2.8 | |
| JPMorgan Chase & Co | 1.5 | |
| Bank of America Corp | 1.5 | |
| Morgan Stanley | 1.2 | |
| Freddie Mac Multifamily Structured Pass Through Certificates | 1.2 | |
| | 69.4 | |
| |
| Fidelity, the Fidelity Investments Logo and all other Fidelity trademarks or service marks used herein are trademarks or service marks of FMR LLC. Any third-party marks that are used herein are trademarks or service marks of their respective owners. © 2024 FMR LLC. All rights reserved. |
| | For additional information about the Fund; including its prospectus, financial information, holdings and proxy information, scan the QR code or visit fundresearch.fidelity.com/prospectus/sec 1.9916204.100 6571-TSRS-0824 |
| |
| | SEMI-ANNUAL SHAREHOLDER REPORT | AS OF JUNE 30, 2024 | |
| | VIP FundsManager® 20% Portfolio VIP FundsManager® 20% Portfolio Service Class 2 true |
| | | |
This semi-annual shareholder report contains information about VIP FundsManager® 20% Portfolio for the period January 1, 2024 to June 30, 2024. You can find additional information about the Fund at fundresearch.fidelity.com/prospectus/sec. You can also request this information by contacting us at 1-877-208-0098 or by sending an e-mail to funddocuments@fmr.com.
What were your Fund costs for the last six months?(based on hypothetical $10,000 investment)
| | Costs of a $10,000 investment | Costs paid as a percentage of a $10,000 investment | |
| Service Class 2 | $ 13 | 0.25% | |
Key Fund Statistics (as of June 30, 2024)
KEY FACTS | | |
| Fund Size | $706,024,127 | |
| Number of Holdings | 32 | |
| Portfolio Turnover | 17% | |
What did the Fund invest in?
(as of June 30, 2024)
| Bond Funds | 49.7 |
| Domestic Equity Funds | 15.0 |
| International Equity Funds | 8.7 |
| Other Investments | 1.3 |
| Inflation-Protected Bond Funds | 0.7 |
| Short-Term Investments and Net Other Assets (Liabilities) | 24.6 |
ASSET ALLOCATION (% of Fund's net assets) |
|
|
TOP HOLDINGS (% of Fund's net assets) | | |
| VIP Investment Grade Bond II Portfolio - Investor Class | 23.6 | |
| Fidelity Total Bond Fund | 23.5 | |
| VIP Stock Selector All Cap Portfolio - Investor Class | 10.9 | |
| Fidelity Overseas Fund | 2.5 | |
| Fidelity Emerging Markets Fund | 1.9 | |
| Fidelity Floating Rate High Income Fund | 1.3 | |
| iShares Core S&P 500 ETF | 1.3 | |
| Fidelity Hedged Equity Fund | 1.3 | |
| Fidelity Emerging Markets Discovery Fund | 1.1 | |
| Fidelity High Income Fund | 0.8 | |
| | 68.2 | |
| |
| Fidelity, the Fidelity Investments Logo and all other Fidelity trademarks or service marks used herein are trademarks or service marks of FMR LLC. Any third-party marks that are used herein are trademarks or service marks of their respective owners. © 2024 FMR LLC. All rights reserved. |
| | For additional information about the Fund; including its prospectus, financial information, holdings and proxy information, scan the QR code or visit fundresearch.fidelity.com/prospectus/sec 1.9916106.100 1586-TSRS-0824 |
| |
| | SEMI-ANNUAL SHAREHOLDER REPORT | AS OF JUNE 30, 2024 | |
| | VIP Strategic Income Portfolio VIP Strategic Income Portfolio Service Class true |
| | | |
This semi-annual shareholder report contains information about VIP Strategic Income Portfolio for the period January 1, 2024 to June 30, 2024. You can find additional information about the Fund at fundresearch.fidelity.com/prospectus/sec. You can also request this information by contacting us at 1-877-208-0098 or by sending an e-mail to funddocuments@fmr.com.
What were your Fund costs for the last six months?(based on hypothetical $10,000 investment)
| | Costs of a $10,000 investment | Costs paid as a percentage of a $10,000 investment | |
| Service Class | $ 38 | 0.76% | |
Key Fund Statistics (as of June 30, 2024)
KEY FACTS | | |
| Fund Size | $1,441,795,230 | |
| Number of Holdings | 1,537 | |
| Portfolio Turnover | 87% | |
What did the Fund invest in?
(as of June 30, 2024)
| U.S. Government and U.S. Government Agency Obligations | 24.4 |
| AAA | 0.4 |
| AA | 1.1 |
| A | 2.8 |
| BBB | 9.7 |
| BB | 15.1 |
| B | 19.2 |
| CCC,CC,C | 4.4 |
| D | 0.0 |
| Not Rated | 9.7 |
| Equities | 7.0 |
| Short-Term Investments and Net Other Assets (Liabilities) | 6.2 |
QUALITY DIVERSIFICATION (% of Fund's net assets) |
|
| |
| We have used ratings from Moody's Investors Service, Inc. Where Moody's® ratings are not available, we have used S&P® ratings. All ratings are as of the date indicated and do not reflect subsequent changes. |
| High-Yield Debt | 40.8 |
| U.S. Government & Investment Grade-Debt | 30.2 |
| Emerging-Markets Debt | 15.5 |
| Foreign Developed-Markets Debt | 7.9 |
| Floating-Rate debt | 5.5 |
| Short-Term Investments and Net Other Assets (Liabilities) | 0.1 |
ASSET ALLOCATION (% of Fund's net assets) |
|
|
| United States | 74.5 |
| Germany | 4.0 |
| United Kingdom | 2.2 |
| Mexico | 1.3 |
| France | 1.2 |
| Brazil | 1.2 |
| Canada | 1.1 |
| Saudi Arabia | 0.9 |
| Turkey | 0.8 |
| Others | 12.8 |
GEOGRAPHIC DIVERSIFICATION (% of Fund's net assets) |
|
| |
|
TOP HOLDINGS (% of Fund's net assets) | | |
| US Treasury Notes | 16.9 | |
| US Treasury Bonds | 6.3 | |
| Freddie Mac Multifamily Structured Pass Through Certificates | 2.9 | |
| German Federal Republic | 2.8 | |
| TransDigm Inc | 1.3 | |
| Energy Transfer LP | 1.0 | |
| Freddie Mac Gold Pool | 0.8 | |
| Fannie Mae Mortgage pass-thru certificates | 0.7 | |
| Fannie Mae Guaranteed REMICS | 0.7 | |
| Uber Technologies Inc | 0.7 | |
| | 34.1 | |
| |
| Fidelity, the Fidelity Investments Logo and all other Fidelity trademarks or service marks used herein are trademarks or service marks of FMR LLC. Any third-party marks that are used herein are trademarks or service marks of their respective owners. © 2024 FMR LLC. All rights reserved. |
| | For additional information about the Fund; including its prospectus, financial information, holdings and proxy information, scan the QR code or visit fundresearch.fidelity.com/prospectus/sec 1.9916057.100 1327-TSRS-0824 |
| |
| | SEMI-ANNUAL SHAREHOLDER REPORT | AS OF JUNE 30, 2024 | |
| | VIP Freedom 2060 Portfolio℠ VIP Freedom 2060 Portfolio℠ Service Class 2 true |
| | | |
This semi-annual shareholder report contains information about VIP Freedom 2060 Portfolio℠ for the period January 1, 2024 to June 30, 2024. You can find additional information about the Fund at fundresearch.fidelity.com/prospectus/sec. You can also request this information by contacting us at 1-877-208-0098 or by sending an e-mail to funddocuments@fmr.com.
What were your Fund costs for the last six months?(based on hypothetical $10,000 investment)
| | Costs of a $10,000 investment | Costs paid as a percentage of a $10,000 investment | |
| Service Class 2 | $ 13 | 0.24% | |
Key Fund Statistics (as of June 30, 2024)
KEY FACTS | | |
| Fund Size | $22,731,798 | |
| Number of Holdings | 14 | |
| Portfolio Turnover | 61% | |
What did the Fund invest in?
(as of June 30, 2024)
| Domestic Equity Funds | 50.5 |
| International Equity Funds | 42.5 |
| Bond Funds | 5.8 |
| Inflation-Protected Bond Funds | 1.2 |
| Short-Term Investments and Net Other Assets (Liabilities) | 0.0 |
ASSET ALLOCATION (% of Fund's net assets) |
|
|
TOP HOLDINGS (% of Fund's net assets) | | |
| VIP Overseas Portfolio - Initial Class | 28.5 | |
| VIP Growth Portfolio - Initial Class | 14.7 | |
| VIP Emerging Markets Portfolio - Initial Class | 14.0 | |
| VIP Growth & Income Portfolio - Initial Class | 9.9 | |
| VIP Contrafund Portfolio - Initial Class | 8.8 | |
| VIP Equity-Income Portfolio - Initial Class | 7.2 | |
| Fidelity Long-Term Treasury Bond Index Fund | 5.5 | |
| VIP Value Portfolio - Initial Class | 5.1 | |
| VIP Value Strategies Portfolio - Initial Class | 2.5 | |
| VIP Mid Cap Portfolio - Initial Class | 2.3 | |
| | 98.5 | |
| |
| Fidelity, the Fidelity Investments Logo and all other Fidelity trademarks or service marks used herein are trademarks or service marks of FMR LLC. Any third-party marks that are used herein are trademarks or service marks of their respective owners. © 2024 FMR LLC. All rights reserved. |
| | For additional information about the Fund; including its prospectus, financial information, holdings and proxy information, scan the QR code or visit fundresearch.fidelity.com/prospectus/sec 1.9916190.100 3366-TSRS-0824 |
| |
| | SEMI-ANNUAL SHAREHOLDER REPORT | AS OF JUNE 30, 2024 | |
| | VIP Asset Manager Portfolio VIP Asset Manager Portfolio Initial Class true |
| | | |
This semi-annual shareholder report contains information about VIP Asset Manager Portfolio for the period January 1, 2024 to June 30, 2024. You can find additional information about the Fund at fundresearch.fidelity.com/prospectus/sec. You can also request this information by contacting us at 1-877-208-0098 or by sending an e-mail to funddocuments@fmr.com.
What were your Fund costs for the last six months?(based on hypothetical $10,000 investment)
| | Costs of a $10,000 investment | Costs paid as a percentage of a $10,000 investment | |
| Initial Class | $ 27 | 0.53% | |
Key Fund Statistics (as of June 30, 2024)
KEY FACTS | | |
| Fund Size | $930,114,262 | |
| Number of Holdings | 25 | |
| Portfolio Turnover | 11% | |
What did the Fund invest in?
(as of June 30, 2024)
| U.S. Government and U.S. Government Agency Obligations | 23.9 |
| AAA | 3.0 |
| AA | 0.0 |
| A | 3.1 |
| BBB | 4.9 |
| BB | 1.6 |
| B | 1.6 |
| CCC,CC,C | 0.2 |
| D | 0.0 |
| Not Rated | 0.6 |
| Equities | 60.3 |
| Short-Term Investments and Net Other Assets (Liabilities) | 0.8 |
QUALITY DIVERSIFICATION (% of Fund's net assets) |
|
| |
| We have used ratings from Moody's Investors Service, Inc. Where Moody's® ratings are not available, we have used S&P® ratings. All ratings are as of the date indicated and do not reflect subsequent changes. |
MARKET SECTORS (% of Fund's net assets) | | |
| Information Technology | 14.0 | |
| Financials | 9.9 | |
| Industrials | 6.9 | |
| Health Care | 6.8 | |
| Consumer Discretionary | 6.0 | |
| Communication Services | 4.0 | |
| Consumer Staples | 2.8 | |
| Energy | 2.4 | |
| Materials | 2.3 | |
| Real Estate | 1.3 | |
| Utilities | 1.1 | |
| |
| Equities | 59.8 |
| Bonds | 39.4 |
| Short-Term Investments and Net Other Assets (Liabilities) | 0.8 |
ASSET ALLOCATION (% of Fund's net assets) |
|
|
TOP HOLDINGS (% of Fund's net assets) | | |
| US Treasury Notes | 12.6 | |
| US Treasury Bonds | 3.7 | |
| Uniform Mortgage Backed Securities | 3.5 | |
| Microsoft Corp | 2.7 | |
| Ginnie Mae II Pool | 2.3 | |
| Apple Inc | 1.7 | |
| Alphabet Inc Class A | 1.5 | |
| Amazon.com Inc | 1.5 | |
| Freddie Mac Gold Pool | 1.1 | |
| Fannie Mae Mortgage pass-thru certificates | 0.5 | |
| | 31.1 | |
| |
| Fidelity, the Fidelity Investments Logo and all other Fidelity trademarks or service marks used herein are trademarks or service marks of FMR LLC. Any third-party marks that are used herein are trademarks or service marks of their respective owners. © 2024 FMR LLC. All rights reserved. |
| | For additional information about the Fund; including its prospectus, financial information, holdings and proxy information, scan the QR code or visit fundresearch.fidelity.com/prospectus/sec 1.9915997.100 156-TSRS-0824 |
| |
| | SEMI-ANNUAL SHAREHOLDER REPORT | AS OF JUNE 30, 2024 | |
| | VIP Freedom Income Portfolio℠ VIP Freedom Income Portfolio℠ Service Class true |
| | | |
This semi-annual shareholder report contains information about VIP Freedom Income Portfolio℠ for the period January 1, 2024 to June 30, 2024. You can find additional information about the Fund at fundresearch.fidelity.com/prospectus/sec. You can also request this information by contacting us at 1-877-208-0098 or by sending an e-mail to funddocuments@fmr.com.
What were your Fund costs for the last six months?(based on hypothetical $10,000 investment)
| | Costs of a $10,000 investment | Costs paid as a percentage of a $10,000 investment | |
| Service Class | $ 5 | 0.10% | |
Key Fund Statistics (as of June 30, 2024)
KEY FACTS | | |
| Fund Size | $78,673,299 | |
| Number of Holdings | 15 | |
| Portfolio Turnover | 45% | |
What did the Fund invest in?
(as of June 30, 2024)
| Bond Funds | 46.5 |
| Inflation-Protected Bond Funds | 16.4 |
| International Equity Funds | 13.6 |
| Domestic Equity Funds | 8.0 |
| Short-Term Investments and Net Other Assets (Liabilities) | 15.5 |
ASSET ALLOCATION (% of Fund's net assets) |
|
|
TOP HOLDINGS (% of Fund's net assets) | | |
| VIP Investment Grade Bond II Portfolio - Initial Class | 40.4 | |
| Fidelity Inflation-Protected Bond Index Fund | 16.4 | |
| VIP Overseas Portfolio - Initial Class | 7.9 | |
| VIP Emerging Markets Portfolio - Initial Class | 5.7 | |
| VIP Growth Portfolio - Initial Class | 2.3 | |
| Fidelity Long-Term Treasury Bond Index Fund | 2.2 | |
| Fidelity International Bond Index Fund | 2.2 | |
| VIP High Income Portfolio - Initial Class | 1.7 | |
| VIP Growth & Income Portfolio - Initial Class | 1.6 | |
| VIP Contrafund Portfolio - Initial Class | 1.4 | |
| | 81.8 | |
| |
| Fidelity, the Fidelity Investments Logo and all other Fidelity trademarks or service marks used herein are trademarks or service marks of FMR LLC. Any third-party marks that are used herein are trademarks or service marks of their respective owners. © 2024 FMR LLC. All rights reserved. |
| | For additional information about the Fund; including its prospectus, financial information, holdings and proxy information, scan the QR code or visit fundresearch.fidelity.com/prospectus/sec 1.9916070.100 1418-TSRS-0824 |
| |
| | SEMI-ANNUAL SHAREHOLDER REPORT | AS OF JUNE 30, 2024 | |
| | VIP Investor Freedom 2030 Portfolio℠ VIP Investor Freedom 2030 Portfolio℠ true |
| | | |
This semi-annual shareholder report contains information about VIP Investor Freedom 2030 Portfolio℠ for the period January 1, 2024 to June 30, 2024. You can find additional information about the Fund at fundresearch.fidelity.com/prospectus/sec. You can also request this information by contacting us at 1-877-208-0098 or by sending an e-mail to funddocuments@fmr.com.
What were your Fund costs for the last six months?(based on hypothetical $10,000 investment)
| | Costs of a $10,000 investment | Costs paid as a percentage of a $10,000 investment | |
| VIP Investor Freedom 2030 Portfolio℠ | $ 0 A | 0.00%B | |
A Amount represents less than $.50
B Amount represents less than 0.005%
Key Fund Statistics (as of June 30, 2024)
KEY FACTS | | |
| Fund Size | $368,344,389 | |
| Number of Holdings | 14 | |
| Portfolio Turnover | 24% | |
What did the Fund invest in?
(as of June 30, 2024)
| Domestic Equity Funds | 32.4 |
| International Equity Funds | 29.9 |
| Bond Funds | 29.1 |
| Inflation-Protected Bond Funds | 8.6 |
| Short-Term Investments and Net Other Assets (Liabilities) | 0.0 |
ASSET ALLOCATION (% of Fund's net assets) |
|
|
TOP HOLDINGS (% of Fund's net assets) | | |
| VIP Overseas Portfolio - Investor Class | 19.5 | |
| VIP Investment Grade Bond II Portfolio - Investor Class | 18.4 | |
| VIP Emerging Markets Portfolio - Investor Class | 10.4 | |
| VIP Growth Portfolio - Investor Class | 9.4 | |
| Fidelity Inflation-Protected Bond Index Fund | 8.6 | |
| Fidelity Long-Term Treasury Bond Index Fund | 6.6 | |
| VIP Growth & Income Portfolio - Investor Class | 6.4 | |
| VIP Contrafund Portfolio - Investor Class | 5.7 | |
| VIP Equity Income Portfolio - Investor Class | 4.6 | |
| VIP Value Portfolio - Investor Class | 3.2 | |
| | 92.8 | |
| |
| Fidelity, the Fidelity Investments Logo and all other Fidelity trademarks or service marks used herein are trademarks or service marks of FMR LLC. Any third-party marks that are used herein are trademarks or service marks of their respective owners. © 2024 FMR LLC. All rights reserved. |
| | For additional information about the Fund; including its prospectus, financial information, holdings and proxy information, scan the QR code or visit fundresearch.fidelity.com/prospectus/sec 1.9916098.100 1501-TSRS-0824 |
| |
| | SEMI-ANNUAL SHAREHOLDER REPORT | AS OF JUNE 30, 2024 | |
| | VIP Freedom 2010 Portfolio℠ VIP Freedom 2010 Portfolio℠ Service Class true |
| | | |
This semi-annual shareholder report contains information about VIP Freedom 2010 Portfolio℠ for the period January 1, 2024 to June 30, 2024. You can find additional information about the Fund at fundresearch.fidelity.com/prospectus/sec. You can also request this information by contacting us at 1-877-208-0098 or by sending an e-mail to funddocuments@fmr.com.
What were your Fund costs for the last six months?(based on hypothetical $10,000 investment)
| | Costs of a $10,000 investment | Costs paid as a percentage of a $10,000 investment | |
| Service Class | $ 5 | 0.10% | |
Key Fund Statistics (as of June 30, 2024)
KEY FACTS | | |
| Fund Size | $263,092,184 | |
| Number of Holdings | 15 | |
| Portfolio Turnover | 23% | |
What did the Fund invest in?
(as of June 30, 2024)
| Bond Funds | 44.6 |
| International Equity Funds | 16.6 |
| Inflation-Protected Bond Funds | 15.5 |
| Domestic Equity Funds | 12.5 |
| Short-Term Investments and Net Other Assets (Liabilities) | 10.8 |
ASSET ALLOCATION (% of Fund's net assets) |
|
|
TOP HOLDINGS (% of Fund's net assets) | | |
| VIP Investment Grade Bond II Portfolio - Initial Class | 38.1 | |
| Fidelity Inflation-Protected Bond Index Fund | 15.5 | |
| VIP Overseas Portfolio - Initial Class | 10.0 | |
| VIP Emerging Markets Portfolio - Initial Class | 6.6 | |
| VIP Growth Portfolio - Initial Class | 3.6 | |
| Fidelity Long-Term Treasury Bond Index Fund | 2.5 | |
| VIP Growth & Income Portfolio - Initial Class | 2.5 | |
| Fidelity International Bond Index Fund | 2.4 | |
| VIP Contrafund Portfolio - Initial Class | 2.2 | |
| VIP Equity-Income Portfolio - Initial Class | 1.8 | |
| | 85.2 | |
| |
| Fidelity, the Fidelity Investments Logo and all other Fidelity trademarks or service marks used herein are trademarks or service marks of FMR LLC. Any third-party marks that are used herein are trademarks or service marks of their respective owners. © 2024 FMR LLC. All rights reserved. |
| | For additional information about the Fund; including its prospectus, financial information, holdings and proxy information, scan the QR code or visit fundresearch.fidelity.com/prospectus/sec 1.9916076.100 1424-TSRS-0824 |
| |
| | SEMI-ANNUAL SHAREHOLDER REPORT | AS OF JUNE 30, 2024 | |
| | VIP FundsManager® 70% Portfolio VIP FundsManager® 70% Portfolio Investor Class true |
| | | |
This semi-annual shareholder report contains information about VIP FundsManager® 70% Portfolio for the period January 1, 2024 to June 30, 2024. You can find additional information about the Fund at fundresearch.fidelity.com/prospectus/sec. You can also request this information by contacting us at 1-877-208-0098 or by sending an e-mail to funddocuments@fmr.com.
What were your Fund costs for the last six months?(based on hypothetical $10,000 investment)
| | Costs of a $10,000 investment | Costs paid as a percentage of a $10,000 investment | |
| Investor Class | $ 5 | 0.10% | |
Key Fund Statistics (as of June 30, 2024)
KEY FACTS | | |
| Fund Size | $2,203,049,276 | |
| Number of Holdings | 33 | |
| Portfolio Turnover | 25% | |
What did the Fund invest in?
(as of June 30, 2024)
| Domestic Equity Funds | 45.1 |
| International Equity Funds | 27.6 |
| Bond Funds | 22.0 |
| Inflation-Protected Bond Funds | 1.5 |
| Other Investments | 1.3 |
| Short-Term Investments and Net Other Assets (Liabilities) | 2.5 |
ASSET ALLOCATION (% of Fund's net assets) |
|
|
TOP HOLDINGS (% of Fund's net assets) | | |
| VIP Stock Selector All Cap Portfolio - Investor Class | 38.2 | |
| VIP Investment Grade Bond II Portfolio - Investor Class | 10.0 | |
| Fidelity Total Bond Fund | 10.0 | |
| Fidelity Overseas Fund | 8.4 | |
| Fidelity Emerging Markets Fund | 7.7 | |
| Fidelity Contrafund | 2.2 | |
| Fidelity Enhanced International ETF | 2.1 | |
| Fidelity International Discovery Fund | 2.1 | |
| Fidelity Low-Priced Stock Fund | 2.0 | |
| Fidelity International Capital Appreciation Fund | 1.7 | |
| | 84.4 | |
| |
| Fidelity, the Fidelity Investments Logo and all other Fidelity trademarks or service marks used herein are trademarks or service marks of FMR LLC. Any third-party marks that are used herein are trademarks or service marks of their respective owners. © 2024 FMR LLC. All rights reserved. |
| | For additional information about the Fund; including its prospectus, financial information, holdings and proxy information, scan the QR code or visit fundresearch.fidelity.com/prospectus/sec 1.9916110.100 1590-TSRS-0824 |
| |
| | SEMI-ANNUAL SHAREHOLDER REPORT | AS OF JUNE 30, 2024 | |
| | VIP Freedom 2030 Portfolio℠ VIP Freedom 2030 Portfolio℠ Service Class true |
| | | |
This semi-annual shareholder report contains information about VIP Freedom 2030 Portfolio℠ for the period January 1, 2024 to June 30, 2024. You can find additional information about the Fund at fundresearch.fidelity.com/prospectus/sec. You can also request this information by contacting us at 1-877-208-0098 or by sending an e-mail to funddocuments@fmr.com.
What were your Fund costs for the last six months?(based on hypothetical $10,000 investment)
| | Costs of a $10,000 investment | Costs paid as a percentage of a $10,000 investment | |
| Service Class | $ 5 | 0.10% | |
Key Fund Statistics (as of June 30, 2024)
KEY FACTS | | |
| Fund Size | $739,905,870 | |
| Number of Holdings | 14 | |
| Portfolio Turnover | 31% | |
What did the Fund invest in?
(as of June 30, 2024)
| Domestic Equity Funds | 32.4 |
| International Equity Funds | 29.9 |
| Bond Funds | 29.1 |
| Inflation-Protected Bond Funds | 8.6 |
| Short-Term Investments and Net Other Assets (Liabilities) | 0.0 |
ASSET ALLOCATION (% of Fund's net assets) |
|
|
TOP HOLDINGS (% of Fund's net assets) | | |
| VIP Overseas Portfolio - Initial Class | 19.5 | |
| VIP Investment Grade Bond II Portfolio - Initial Class | 18.4 | |
| VIP Emerging Markets Portfolio - Initial Class | 10.4 | |
| VIP Growth Portfolio - Initial Class | 9.4 | |
| Fidelity Inflation-Protected Bond Index Fund | 8.6 | |
| Fidelity Long-Term Treasury Bond Index Fund | 6.6 | |
| VIP Growth & Income Portfolio - Initial Class | 6.4 | |
| VIP Contrafund Portfolio - Initial Class | 5.7 | |
| VIP Equity-Income Portfolio - Initial Class | 4.6 | |
| VIP Value Portfolio - Initial Class | 3.2 | |
| | 92.8 | |
| |
| Fidelity, the Fidelity Investments Logo and all other Fidelity trademarks or service marks used herein are trademarks or service marks of FMR LLC. Any third-party marks that are used herein are trademarks or service marks of their respective owners. © 2024 FMR LLC. All rights reserved. |
| | For additional information about the Fund; including its prospectus, financial information, holdings and proxy information, scan the QR code or visit fundresearch.fidelity.com/prospectus/sec 1.9916088.100 1436-TSRS-0824 |
| |
| | SEMI-ANNUAL SHAREHOLDER REPORT | AS OF JUNE 30, 2024 | |
| | VIP Freedom 2065 Portfolio℠ VIP Freedom 2065 Portfolio℠ Service Class true |
| | | |
This semi-annual shareholder report contains information about VIP Freedom 2065 Portfolio℠ for the period January 1, 2024 to June 30, 2024. You can find additional information about the Fund at fundresearch.fidelity.com/prospectus/sec. You can also request this information by contacting us at 1-877-208-0098 or by sending an e-mail to funddocuments@fmr.com.
What were your Fund costs for the last six months?(based on hypothetical $10,000 investment)
| | Costs of a $10,000 investment | Costs paid as a percentage of a $10,000 investment | |
| Service Class | $ 5 | 0.10% | |
Key Fund Statistics (as of June 30, 2024)
KEY FACTS | | |
| Fund Size | $6,288,800 | |
| Number of Holdings | 13 | |
| Portfolio Turnover | 71% | |
What did the Fund invest in?
(as of June 30, 2024)
| Domestic Equity Funds | 50.5 |
| International Equity Funds | 42.5 |
| Bond Funds | 5.8 |
| Inflation-Protected Bond Funds | 1.2 |
| Short-Term Investments and Net Other Assets (Liabilities) | 0.0 |
ASSET ALLOCATION (% of Fund's net assets) |
|
|
TOP HOLDINGS (% of Fund's net assets) | | |
| VIP Overseas Portfolio - Initial Class | 28.5 | |
| VIP Growth Portfolio - Initial Class | 14.7 | |
| VIP Emerging Markets Portfolio - Initial Class | 14.0 | |
| VIP Growth & Income Portfolio - Initial Class | 9.9 | |
| VIP Contrafund Portfolio - Initial Class | 8.8 | |
| VIP Equity-Income Portfolio - Initial Class | 7.2 | |
| Fidelity Long-Term Treasury Bond Index Fund | 5.5 | |
| VIP Value Portfolio - Initial Class | 5.1 | |
| VIP Value Strategies Portfolio - Initial Class | 2.5 | |
| VIP Mid Cap Portfolio - Initial Class | 2.3 | |
| | 98.5 | |
| |
| Fidelity, the Fidelity Investments Logo and all other Fidelity trademarks or service marks used herein are trademarks or service marks of FMR LLC. Any third-party marks that are used herein are trademarks or service marks of their respective owners. © 2024 FMR LLC. All rights reserved. |
| | For additional information about the Fund; including its prospectus, financial information, holdings and proxy information, scan the QR code or visit fundresearch.fidelity.com/prospectus/sec 1.9916192.100 3367-TSRS-0824 |
| |
| | SEMI-ANNUAL SHAREHOLDER REPORT | AS OF JUNE 30, 2024 | |
| | VIP Freedom 2015 Portfolio℠ VIP Freedom 2015 Portfolio℠ Initial Class true |
| | | |
This semi-annual shareholder report contains information about VIP Freedom 2015 Portfolio℠ for the period January 1, 2024 to June 30, 2024. You can find additional information about the Fund at fundresearch.fidelity.com/prospectus/sec. You can also request this information by contacting us at 1-877-208-0098 or by sending an e-mail to funddocuments@fmr.com.
What were your Fund costs for the last six months?(based on hypothetical $10,000 investment)
| | Costs of a $10,000 investment | Costs paid as a percentage of a $10,000 investment | |
| Initial Class | $ 0 A | 0.00%B | |
AAmount represents less than $.50
BAmount represents less than 0.005%
Key Fund Statistics (as of June 30, 2024)
KEY FACTS | | |
| Fund Size | $58,678,683 | |
| Number of Holdings | 15 | |
| Portfolio Turnover | 30% | |
What did the Fund invest in?
(as of June 30, 2024)
| Bond Funds | 42.1 |
| International Equity Funds | 20.3 |
| Domestic Equity Funds | 18.0 |
| Inflation-Protected Bond Funds | 14.4 |
| Short-Term Investments and Net Other Assets (Liabilities) | 5.2 |
ASSET ALLOCATION (% of Fund's net assets) |
|
|
TOP HOLDINGS (% of Fund's net assets) | | |
| VIP Investment Grade Bond II Portfolio - Initial Class | 35.1 | |
| Fidelity Inflation-Protected Bond Index Fund | 14.4 | |
| VIP Overseas Portfolio - Initial Class | 12.6 | |
| VIP Emerging Markets Portfolio - Initial Class | 7.7 | |
| VIP Growth Portfolio - Initial Class | 5.2 | |
| VIP Growth & Income Portfolio - Initial Class | 3.5 | |
| VIP Contrafund Portfolio - Initial Class | 3.2 | |
| Fidelity International Bond Index Fund | 2.7 | |
| VIP Equity-Income Portfolio - Initial Class | 2.6 | |
| Fidelity Long-Term Treasury Bond Index Fund | 2.6 | |
| | 89.6 | |
| |
| Fidelity, the Fidelity Investments Logo and all other Fidelity trademarks or service marks used herein are trademarks or service marks of FMR LLC. Any third-party marks that are used herein are trademarks or service marks of their respective owners. © 2024 FMR LLC. All rights reserved. |
| | For additional information about the Fund; including its prospectus, financial information, holdings and proxy information, scan the QR code or visit fundresearch.fidelity.com/prospectus/sec 1.9916078.100 1426-TSRS-0824 |
| |
| | SEMI-ANNUAL SHAREHOLDER REPORT | AS OF JUNE 30, 2024 | |
| | VIP Investor Freedom Income Portfolio℠ VIP Investor Freedom Income Portfolio℠ true |
| | | |
This semi-annual shareholder report contains information about VIP Investor Freedom Income Portfolio℠ for the period January 1, 2024 to June 30, 2024. You can find additional information about the Fund at fundresearch.fidelity.com/prospectus/sec. You can also request this information by contacting us at 1-877-208-0098 or by sending an e-mail to funddocuments@fmr.com.
What were your Fund costs for the last six months?(based on hypothetical $10,000 investment)
| | Costs of a $10,000 investment | Costs paid as a percentage of a $10,000 investment | |
| VIP Investor Freedom Income Portfolio℠ | $ 0 A | 0.00%B | |
A Amount represents less than $.50
B Amount represents less than 0.005%
Key Fund Statistics (as of June 30, 2024)
KEY FACTS | | |
| Fund Size | $76,699,744 | |
| Number of Holdings | 15 | |
| Portfolio Turnover | 22% | |
What did the Fund invest in?
(as of June 30, 2024)
| Bond Funds | 46.6 |
| Inflation-Protected Bond Funds | 16.4 |
| International Equity Funds | 13.6 |
| Domestic Equity Funds | 8.0 |
| Short-Term Investments and Net Other Assets (Liabilities) | 15.4 |
ASSET ALLOCATION (% of Fund's net assets) |
|
|
TOP HOLDINGS (% of Fund's net assets) | | |
| VIP Investment Grade Bond II Portfolio - Investor Class | 40.5 | |
| Fidelity Inflation-Protected Bond Index Fund | 16.4 | |
| VIP Overseas Portfolio - Investor Class | 7.9 | |
| VIP Emerging Markets Portfolio - Investor Class | 5.7 | |
| VIP Growth Portfolio - Investor Class | 2.3 | |
| Fidelity Long-Term Treasury Bond Index Fund | 2.2 | |
| Fidelity International Bond Index Fund | 2.2 | |
| VIP High Income Portfolio - Investor Class | 1.7 | |
| VIP Growth & Income Portfolio - Investor Class | 1.6 | |
| VIP Contrafund Portfolio - Investor Class | 1.4 | |
| | 81.9 | |
| |
| Fidelity, the Fidelity Investments Logo and all other Fidelity trademarks or service marks used herein are trademarks or service marks of FMR LLC. Any third-party marks that are used herein are trademarks or service marks of their respective owners. © 2024 FMR LLC. All rights reserved. |
| | For additional information about the Fund; including its prospectus, financial information, holdings and proxy information, scan the QR code or visit fundresearch.fidelity.com/prospectus/sec 1.9916099.100 1502-TSRS-0824 |
| |
| | SEMI-ANNUAL SHAREHOLDER REPORT | AS OF JUNE 30, 2024 | |
| | VIP Freedom 2010 Portfolio℠ VIP Freedom 2010 Portfolio℠ Service Class 2 true |
| | | |
This semi-annual shareholder report contains information about VIP Freedom 2010 Portfolio℠ for the period January 1, 2024 to June 30, 2024. You can find additional information about the Fund at fundresearch.fidelity.com/prospectus/sec. You can also request this information by contacting us at 1-877-208-0098 or by sending an e-mail to funddocuments@fmr.com.
What were your Fund costs for the last six months?(based on hypothetical $10,000 investment)
| | Costs of a $10,000 investment | Costs paid as a percentage of a $10,000 investment | |
| Service Class 2 | $ 13 | 0.25% | |
Key Fund Statistics (as of June 30, 2024)
KEY FACTS | | |
| Fund Size | $263,092,184 | |
| Number of Holdings | 15 | |
| Portfolio Turnover | 23% | |
What did the Fund invest in?
(as of June 30, 2024)
| Bond Funds | 44.6 |
| International Equity Funds | 16.6 |
| Inflation-Protected Bond Funds | 15.5 |
| Domestic Equity Funds | 12.5 |
| Short-Term Investments and Net Other Assets (Liabilities) | 10.8 |
ASSET ALLOCATION (% of Fund's net assets) |
|
|
TOP HOLDINGS (% of Fund's net assets) | | |
| VIP Investment Grade Bond II Portfolio - Initial Class | 38.1 | |
| Fidelity Inflation-Protected Bond Index Fund | 15.5 | |
| VIP Overseas Portfolio - Initial Class | 10.0 | |
| VIP Emerging Markets Portfolio - Initial Class | 6.6 | |
| VIP Growth Portfolio - Initial Class | 3.6 | |
| Fidelity Long-Term Treasury Bond Index Fund | 2.5 | |
| VIP Growth & Income Portfolio - Initial Class | 2.5 | |
| Fidelity International Bond Index Fund | 2.4 | |
| VIP Contrafund Portfolio - Initial Class | 2.2 | |
| VIP Equity-Income Portfolio - Initial Class | 1.8 | |
| | 85.2 | |
| |
| Fidelity, the Fidelity Investments Logo and all other Fidelity trademarks or service marks used herein are trademarks or service marks of FMR LLC. Any third-party marks that are used herein are trademarks or service marks of their respective owners. © 2024 FMR LLC. All rights reserved. |
| | For additional information about the Fund; including its prospectus, financial information, holdings and proxy information, scan the QR code or visit fundresearch.fidelity.com/prospectus/sec 1.9916077.100 1425-TSRS-0824 |
| |
| | SEMI-ANNUAL SHAREHOLDER REPORT | AS OF JUNE 30, 2024 | |
| | VIP FundsManager® 60% Portfolio VIP FundsManager® 60% Portfolio Service Class 2 true |
| | | |
This semi-annual shareholder report contains information about VIP FundsManager® 60% Portfolio for the period January 1, 2024 to June 30, 2024. You can find additional information about the Fund at fundresearch.fidelity.com/prospectus/sec. You can also request this information by contacting us at 1-877-208-0098 or by sending an e-mail to funddocuments@fmr.com.
What were your Fund costs for the last six months?(based on hypothetical $10,000 investment)
| | Costs of a $10,000 investment | Costs paid as a percentage of a $10,000 investment | |
| Service Class 2 | $ 13 | 0.25% | |
Key Fund Statistics (as of June 30, 2024)
KEY FACTS | | |
| Fund Size | $6,660,120,093 | |
| Number of Holdings | 33 | |
| Portfolio Turnover | 24% | |
What did the Fund invest in?
(as of June 30, 2024)
| Domestic Equity Funds | 39.1 |
| Bond Funds | 32.4 |
| International Equity Funds | 23.9 |
| Inflation-Protected Bond Funds | 1.5 |
| Other Investments | 1.2 |
| Short-Term Investments and Net Other Assets (Liabilities) | 1.9 |
ASSET ALLOCATION (% of Fund's net assets) |
|
|
TOP HOLDINGS (% of Fund's net assets) | | |
| VIP Stock Selector All Cap Portfolio - Investor Class | 32.8 | |
| VIP Investment Grade Bond II Portfolio - Investor Class | 15.1 | |
| Fidelity Total Bond Fund | 15.1 | |
| Fidelity Overseas Fund | 7.1 | |
| Fidelity Emerging Markets Fund | 6.7 | |
| Fidelity Contrafund | 1.8 | |
| Fidelity Enhanced International ETF | 1.8 | |
| Fidelity International Discovery Fund | 1.8 | |
| Fidelity Low-Priced Stock Fund | 1.7 | |
| Fidelity Inflation-Protected Bond Index Fund | 1.5 | |
| | 85.4 | |
| |
| Fidelity, the Fidelity Investments Logo and all other Fidelity trademarks or service marks used herein are trademarks or service marks of FMR LLC. Any third-party marks that are used herein are trademarks or service marks of their respective owners. © 2024 FMR LLC. All rights reserved. |
| | For additional information about the Fund; including its prospectus, financial information, holdings and proxy information, scan the QR code or visit fundresearch.fidelity.com/prospectus/sec 1.9916126.100 1882-TSRS-0824 |
| |
| | SEMI-ANNUAL SHAREHOLDER REPORT | AS OF JUNE 30, 2024 | |
| | VIP Freedom 2050 Portfolio℠ VIP Freedom 2050 Portfolio℠ Service Class 2 true |
| | | |
This semi-annual shareholder report contains information about VIP Freedom 2050 Portfolio℠ for the period January 1, 2024 to June 30, 2024. You can find additional information about the Fund at fundresearch.fidelity.com/prospectus/sec. You can also request this information by contacting us at 1-877-208-0098 or by sending an e-mail to funddocuments@fmr.com.
What were your Fund costs for the last six months?(based on hypothetical $10,000 investment)
| | Costs of a $10,000 investment | Costs paid as a percentage of a $10,000 investment | |
| Service Class 2 | $ 13 | 0.25% | |
Key Fund Statistics (as of June 30, 2024)
KEY FACTS | | |
| Fund Size | $157,004,633 | |
| Number of Holdings | 13 | |
| Portfolio Turnover | 30% | |
What did the Fund invest in?
(as of June 30, 2024)
| Domestic Equity Funds | 50.5 |
| International Equity Funds | 42.5 |
| Bond Funds | 5.8 |
| Inflation-Protected Bond Funds | 1.2 |
| Short-Term Investments and Net Other Assets (Liabilities) | 0.0 |
ASSET ALLOCATION (% of Fund's net assets) |
|
|
TOP HOLDINGS (% of Fund's net assets) | | |
| VIP Overseas Portfolio - Initial Class | 28.5 | |
| VIP Growth Portfolio - Initial Class | 14.7 | |
| VIP Emerging Markets Portfolio - Initial Class | 14.0 | |
| VIP Growth & Income Portfolio - Initial Class | 9.9 | |
| VIP Contrafund Portfolio - Initial Class | 8.8 | |
| VIP Equity-Income Portfolio - Initial Class | 7.2 | |
| Fidelity Long-Term Treasury Bond Index Fund | 5.5 | |
| VIP Value Portfolio - Initial Class | 5.1 | |
| VIP Value Strategies Portfolio - Initial Class | 2.5 | |
| VIP Mid Cap Portfolio - Initial Class | 2.3 | |
| | 98.5 | |
| |
| Fidelity, the Fidelity Investments Logo and all other Fidelity trademarks or service marks used herein are trademarks or service marks of FMR LLC. Any third-party marks that are used herein are trademarks or service marks of their respective owners. © 2024 FMR LLC. All rights reserved. |
| | For additional information about the Fund; including its prospectus, financial information, holdings and proxy information, scan the QR code or visit fundresearch.fidelity.com/prospectus/sec 1.9916142.100 2170-TSRS-0824 |
| |
| | SEMI-ANNUAL SHAREHOLDER REPORT | AS OF JUNE 30, 2024 | |
| | VIP Freedom 2055 Portfolio℠ VIP Freedom 2055 Portfolio℠ Service Class 2 true |
| | | |
This semi-annual shareholder report contains information about VIP Freedom 2055 Portfolio℠ for the period January 1, 2024 to June 30, 2024. You can find additional information about the Fund at fundresearch.fidelity.com/prospectus/sec. You can also request this information by contacting us at 1-877-208-0098 or by sending an e-mail to funddocuments@fmr.com.
What were your Fund costs for the last six months?(based on hypothetical $10,000 investment)
| | Costs of a $10,000 investment | Costs paid as a percentage of a $10,000 investment | |
| Service Class 2 | $ 13 | 0.24% | |
Key Fund Statistics (as of June 30, 2024)
KEY FACTS | | |
| Fund Size | $18,954,876 | |
| Number of Holdings | 13 | |
| Portfolio Turnover | 34% | |
What did the Fund invest in?
(as of June 30, 2024)
| Domestic Equity Funds | 50.5 |
| International Equity Funds | 42.5 |
| Bond Funds | 5.8 |
| Inflation-Protected Bond Funds | 1.2 |
| Short-Term Investments and Net Other Assets (Liabilities) | 0.0 |
ASSET ALLOCATION (% of Fund's net assets) |
|
|
TOP HOLDINGS (% of Fund's net assets) | | |
| VIP Overseas Portfolio - Initial Class | 28.5 | |
| VIP Growth Portfolio - Initial Class | 14.7 | |
| VIP Emerging Markets Portfolio - Initial Class | 14.0 | |
| VIP Growth & Income Portfolio - Initial Class | 9.9 | |
| VIP Contrafund Portfolio - Initial Class | 8.8 | |
| VIP Equity-Income Portfolio - Initial Class | 7.2 | |
| Fidelity Long-Term Treasury Bond Index Fund | 5.5 | |
| VIP Value Portfolio - Initial Class | 5.1 | |
| VIP Value Strategies Portfolio - Initial Class | 2.5 | |
| VIP Mid Cap Portfolio - Initial Class | 2.3 | |
| | 98.5 | |
| |
| Fidelity, the Fidelity Investments Logo and all other Fidelity trademarks or service marks used herein are trademarks or service marks of FMR LLC. Any third-party marks that are used herein are trademarks or service marks of their respective owners. © 2024 FMR LLC. All rights reserved. |
| | For additional information about the Fund; including its prospectus, financial information, holdings and proxy information, scan the QR code or visit fundresearch.fidelity.com/prospectus/sec 1.9916187.100 3364-TSRS-0824 |
| |
| | SEMI-ANNUAL SHAREHOLDER REPORT | AS OF JUNE 30, 2024 | |
| | VIP Freedom 2030 Portfolio℠ VIP Freedom 2030 Portfolio℠ Service Class 2 true |
| | | |
This semi-annual shareholder report contains information about VIP Freedom 2030 Portfolio℠ for the period January 1, 2024 to June 30, 2024. You can find additional information about the Fund at fundresearch.fidelity.com/prospectus/sec. You can also request this information by contacting us at 1-877-208-0098 or by sending an e-mail to funddocuments@fmr.com.
What were your Fund costs for the last six months?(based on hypothetical $10,000 investment)
| | Costs of a $10,000 investment | Costs paid as a percentage of a $10,000 investment | |
| Service Class 2 | $ 13 | 0.25% | |
Key Fund Statistics (as of June 30, 2024)
KEY FACTS | | |
| Fund Size | $739,905,870 | |
| Number of Holdings | 14 | |
| Portfolio Turnover | 31% | |
What did the Fund invest in?
(as of June 30, 2024)
| Domestic Equity Funds | 32.4 |
| International Equity Funds | 29.9 |
| Bond Funds | 29.1 |
| Inflation-Protected Bond Funds | 8.6 |
| Short-Term Investments and Net Other Assets (Liabilities) | 0.0 |
ASSET ALLOCATION (% of Fund's net assets) |
|
|
TOP HOLDINGS (% of Fund's net assets) | | |
| VIP Overseas Portfolio - Initial Class | 19.5 | |
| VIP Investment Grade Bond II Portfolio - Initial Class | 18.4 | |
| VIP Emerging Markets Portfolio - Initial Class | 10.4 | |
| VIP Growth Portfolio - Initial Class | 9.4 | |
| Fidelity Inflation-Protected Bond Index Fund | 8.6 | |
| Fidelity Long-Term Treasury Bond Index Fund | 6.6 | |
| VIP Growth & Income Portfolio - Initial Class | 6.4 | |
| VIP Contrafund Portfolio - Initial Class | 5.7 | |
| VIP Equity-Income Portfolio - Initial Class | 4.6 | |
| VIP Value Portfolio - Initial Class | 3.2 | |
| | 92.8 | |
| |
| Fidelity, the Fidelity Investments Logo and all other Fidelity trademarks or service marks used herein are trademarks or service marks of FMR LLC. Any third-party marks that are used herein are trademarks or service marks of their respective owners. © 2024 FMR LLC. All rights reserved. |
| | For additional information about the Fund; including its prospectus, financial information, holdings and proxy information, scan the QR code or visit fundresearch.fidelity.com/prospectus/sec 1.9916089.100 1437-TSRS-0824 |
| |
| | SEMI-ANNUAL SHAREHOLDER REPORT | AS OF JUNE 30, 2024 | |
| | VIP Bond Index Portfolio VIP Bond Index Portfolio Service Class 2 true |
| | | |
This semi-annual shareholder report contains information about VIP Bond Index Portfolio for the period January 1, 2024 to June 30, 2024. You can find additional information about the Fund at fundresearch.fidelity.com/prospectus/sec. You can also request this information by contacting us at 1-877-208-0098 or by sending an e-mail to funddocuments@fmr.com.
What were your Fund costs for the last six months?(based on hypothetical $10,000 investment)
| | Costs of a $10,000 investment | Costs paid as a percentage of a $10,000 investment | |
| Service Class 2 | $ 19 | 0.39% | |
Key Fund Statistics (as of June 30, 2024)
KEY FACTS | | |
| Fund Size | $821,883,192 | |
| Number of Holdings | 2,765 | |
| Portfolio Turnover | 57% | |
What did the Fund invest in?
(as of June 30, 2024)
| U.S. Government and U.S. Government Agency Obligations | 67.6 |
| AAA | 2.9 |
| AA | 1.8 |
| A | 14.3 |
| BBB | 12.5 |
| BB | 0.4 |
| Not Rated | 0.8 |
QUALITY DIVERSIFICATION (% of Fund's net assets) |
|
| Short-Term Investments and Net Other Assets (Liabilities) - (0.3)%* |
| |
| We have used ratings from Moody's Investors Service, Inc. Where Moody's® ratings are not available, we have used S&P® ratings. All ratings are as of the date indicated and do not reflect subsequent changes. |
| U.S. Treasury Obligations | 41.2 |
| Corporate Bonds | 28.6 |
| U.S. Government Agency - Mortgage Securities | 25.5 |
| Foreign Government and Government Agency Obligations | 1.7 |
| CMOs and Other Mortgage Related Securities | 1.4 |
| U.S. Government Agency Obligations | 0.9 |
| Municipal Securities | 0.4 |
| Asset-Backed Securities | 0.3 |
| Other Investments | 0.3 |
ASSET ALLOCATION (% of Fund's net assets) |
|
| Short-Term Investments and Net Other Assets (Liabilities) - (0.3)% |
|
| United States | 92.4 |
| United Kingdom | 1.4 |
| Canada | 1.2 |
| Multi-national | 1.0 |
| Japan | 1.0 |
| Mexico | 0.5 |
| Germany | 0.4 |
| Switzerland | 0.2 |
| Australia | 0.2 |
| Others | 1.7 |
GEOGRAPHIC DIVERSIFICATION (% of Fund's net assets) |
|
| |
|
TOP HOLDINGS (% of Fund's net assets) | | |
| US Treasury Notes | 32.6 | |
| Fannie Mae Mortgage pass-thru certificates | 10.2 | |
| US Treasury Bonds | 8.6 | |
| Freddie Mac Gold Pool | 8.5 | |
| Ginnie Mae II Pool | 5.1 | |
| Freddie Mac Multifamily Structured Pass Through Certificates | 1.0 | |
| Bank of America Corp | 0.8 | |
| Ginnie Mae I Pool | 0.7 | |
| JPMorgan Chase & Co | 0.7 | |
| Wells Fargo & Co | 0.5 | |
| | 68.7 | |
| |
| Fidelity, the Fidelity Investments Logo and all other Fidelity trademarks or service marks used herein are trademarks or service marks of FMR LLC. Any third-party marks that are used herein are trademarks or service marks of their respective owners. © 2024 FMR LLC. All rights reserved. |
| | For additional information about the Fund; including its prospectus, financial information, holdings and proxy information, scan the QR code or visit fundresearch.fidelity.com/prospectus/sec 1.9916183.100 3079-TSRS-0824 |
| |
| | SEMI-ANNUAL SHAREHOLDER REPORT | AS OF JUNE 30, 2024 | |
| | VIP Freedom 2020 Portfolio℠ VIP Freedom 2020 Portfolio℠ Initial Class true |
| | | |
This semi-annual shareholder report contains information about VIP Freedom 2020 Portfolio℠ for the period January 1, 2024 to June 30, 2024. You can find additional information about the Fund at fundresearch.fidelity.com/prospectus/sec. You can also request this information by contacting us at 1-877-208-0098 or by sending an e-mail to funddocuments@fmr.com.
What were your Fund costs for the last six months?(based on hypothetical $10,000 investment)
| | Costs of a $10,000 investment | Costs paid as a percentage of a $10,000 investment | |
| Initial Class | $ 0 A | 0.00%B | |
AAmount represents less than $.50
BAmount represents less than 0.005%
Key Fund Statistics (as of June 30, 2024)
KEY FACTS | | |
| Fund Size | $552,816,930 | |
| Number of Holdings | 15 | |
| Portfolio Turnover | 20% | |
What did the Fund invest in?
(as of June 30, 2024)
| Bond Funds | 38.8 |
| International Equity Funds | 24.0 |
| Domestic Equity Funds | 23.6 |
| Inflation-Protected Bond Funds | 13.5 |
| Short-Term Investments and Net Other Assets (Liabilities) | 0.1 |
ASSET ALLOCATION (% of Fund's net assets) |
|
|
TOP HOLDINGS (% of Fund's net assets) | | |
| VIP Investment Grade Bond II Portfolio - Initial Class | 31.1 | |
| VIP Overseas Portfolio - Initial Class | 15.2 | |
| Fidelity Inflation-Protected Bond Index Fund | 13.5 | |
| VIP Emerging Markets Portfolio - Initial Class | 8.8 | |
| VIP Growth Portfolio - Initial Class | 6.9 | |
| VIP Growth & Income Portfolio - Initial Class | 4.6 | |
| VIP Contrafund Portfolio - Initial Class | 4.1 | |
| VIP Equity-Income Portfolio - Initial Class | 3.4 | |
| Fidelity Long-Term Treasury Bond Index Fund | 3.0 | |
| Fidelity International Bond Index Fund | 3.0 | |
| | 93.6 | |
| |
| Fidelity, the Fidelity Investments Logo and all other Fidelity trademarks or service marks used herein are trademarks or service marks of FMR LLC. Any third-party marks that are used herein are trademarks or service marks of their respective owners. © 2024 FMR LLC. All rights reserved. |
| | For additional information about the Fund; including its prospectus, financial information, holdings and proxy information, scan the QR code or visit fundresearch.fidelity.com/prospectus/sec 1.9916081.100 1429-TSRS-0824 |
| |
| | SEMI-ANNUAL SHAREHOLDER REPORT | AS OF JUNE 30, 2024 | |
| | VIP Freedom 2060 Portfolio℠ VIP Freedom 2060 Portfolio℠ Initial Class true |
| | | |
This semi-annual shareholder report contains information about VIP Freedom 2060 Portfolio℠ for the period January 1, 2024 to June 30, 2024. You can find additional information about the Fund at fundresearch.fidelity.com/prospectus/sec. You can also request this information by contacting us at 1-877-208-0098 or by sending an e-mail to funddocuments@fmr.com.
What were your Fund costs for the last six months?(based on hypothetical $10,000 investment)
| | Costs of a $10,000 investment | Costs paid as a percentage of a $10,000 investment | |
| Initial Class | $ 0 A | 0.00%B | |
AAmount represents less than $.50
BAmount represents less than 0.005%
Key Fund Statistics (as of June 30, 2024)
KEY FACTS | | |
| Fund Size | $22,731,798 | |
| Number of Holdings | 14 | |
| Portfolio Turnover | 61% | |
What did the Fund invest in?
(as of June 30, 2024)
| Domestic Equity Funds | 50.5 |
| International Equity Funds | 42.5 |
| Bond Funds | 5.8 |
| Inflation-Protected Bond Funds | 1.2 |
| Short-Term Investments and Net Other Assets (Liabilities) | 0.0 |
ASSET ALLOCATION (% of Fund's net assets) |
|
|
TOP HOLDINGS (% of Fund's net assets) | | |
| VIP Overseas Portfolio - Initial Class | 28.5 | |
| VIP Growth Portfolio - Initial Class | 14.7 | |
| VIP Emerging Markets Portfolio - Initial Class | 14.0 | |
| VIP Growth & Income Portfolio - Initial Class | 9.9 | |
| VIP Contrafund Portfolio - Initial Class | 8.8 | |
| VIP Equity-Income Portfolio - Initial Class | 7.2 | |
| Fidelity Long-Term Treasury Bond Index Fund | 5.5 | |
| VIP Value Portfolio - Initial Class | 5.1 | |
| VIP Value Strategies Portfolio - Initial Class | 2.5 | |
| VIP Mid Cap Portfolio - Initial Class | 2.3 | |
| | 98.5 | |
| |
| Fidelity, the Fidelity Investments Logo and all other Fidelity trademarks or service marks used herein are trademarks or service marks of FMR LLC. Any third-party marks that are used herein are trademarks or service marks of their respective owners. © 2024 FMR LLC. All rights reserved. |
| | For additional information about the Fund; including its prospectus, financial information, holdings and proxy information, scan the QR code or visit fundresearch.fidelity.com/prospectus/sec 1.9916188.100 3361-TSRS-0824 |
| |
| | SEMI-ANNUAL SHAREHOLDER REPORT | AS OF JUNE 30, 2024 | |
| | VIP Investment Grade Bond Portfolio VIP Investment Grade Bond Portfolio Service Class true |
| | | |
This semi-annual shareholder report contains information about VIP Investment Grade Bond Portfolio for the period January 1, 2024 to June 30, 2024. You can find additional information about the Fund at fundresearch.fidelity.com/prospectus/sec. You can also request this information by contacting us at 1-877-208-0098 or by sending an e-mail to funddocuments@fmr.com.
What were your Fund costs for the last six months?(based on hypothetical $10,000 investment)
| | Costs of a $10,000 investment | Costs paid as a percentage of a $10,000 investment | |
| Service Class | $ 24 | 0.49% | |
Key Fund Statistics (as of June 30, 2024)
KEY FACTS | | |
| Fund Size | $4,215,966,857 | |
| Number of Holdings | 2,275 | |
| Portfolio Turnover | 217% | |
What did the Fund invest in?
(as of June 30, 2024)
| U.S. Government and U.S. Government Agency Obligations | 62.8 |
| AAA | 9.7 |
| AA | 0.4 |
| A | 8.0 |
| BBB | 16.1 |
| BB | 3.6 |
| B | 1.4 |
| CCC,CC,C | 0.0 |
| Not Rated | 3.3 |
QUALITY DIVERSIFICATION (% of Fund's net assets) |
|
| Short-Term Investments and Net Other Assets (Liabilities) - (5.3)%* |
| |
| We have used ratings from Moody's Investors Service, Inc. Where Moody's® ratings are not available, we have used S&P® ratings. All ratings are as of the date indicated and do not reflect subsequent changes. |
| U.S. Treasury Obligations | 42.6 |
| Corporate Bonds | 26.8 |
| U.S. Government Agency - Mortgage Securities | 20.2 |
| Asset-Backed Securities | 8.3 |
| CMOs and Other Mortgage Related Securities | 7.2 |
| Other Investments | 0.2 |
| Foreign Government and Government Agency Obligations | 0.0 |
| Preferred Securities | 0.0 |
| Bank Loan Obligations | 0.0 |
ASSET ALLOCATION (% of Fund's net assets) |
|
| Short-Term Investments and Net Other Assets (Liabilities) - (5.3)% |
|
| United States | 90.9 |
| Grand Cayman (UK Overseas Ter) | 4.6 |
| Mexico | 1.0 |
| United Kingdom | 0.8 |
| Ireland | 0.7 |
| Switzerland | 0.5 |
| Canada | 0.3 |
| France | 0.2 |
| Germany | 0.2 |
| Others | 0.8 |
GEOGRAPHIC DIVERSIFICATION (% of Fund's net assets) |
|
| |
|
TOP HOLDINGS (% of Fund's net assets) | | |
| US Treasury Notes | 30.2 | |
| US Treasury Bonds | 12.4 | |
| Ginnie Mae II Pool | 6.1 | |
| Fannie Mae Mortgage pass-thru certificates | 5.6 | |
| Uniform Mortgage Backed Securities | 5.2 | |
| Freddie Mac Gold Pool | 2.9 | |
| JPMorgan Chase & Co | 1.4 | |
| Bank of America Corp | 1.2 | |
| Morgan Stanley | 1.0 | |
| Petroleos Mexicanos | 1.0 | |
| | 67.0 | |
| |
| Fidelity, the Fidelity Investments Logo and all other Fidelity trademarks or service marks used herein are trademarks or service marks of FMR LLC. Any third-party marks that are used herein are trademarks or service marks of their respective owners. © 2024 FMR LLC. All rights reserved. |
| | For additional information about the Fund; including its prospectus, financial information, holdings and proxy information, scan the QR code or visit fundresearch.fidelity.com/prospectus/sec 1.9915995.100 827-TSRS-0824 |
| |
| | SEMI-ANNUAL SHAREHOLDER REPORT | AS OF JUNE 30, 2024 | |
| | VIP FundsManager® 50% Portfolio VIP FundsManager® 50% Portfolio Service Class true |
| | | |
This semi-annual shareholder report contains information about VIP FundsManager® 50% Portfolio for the period January 1, 2024 to June 30, 2024. You can find additional information about the Fund at fundresearch.fidelity.com/prospectus/sec. You can also request this information by contacting us at 1-877-208-0098 or by sending an e-mail to funddocuments@fmr.com.
What were your Fund costs for the last six months?(based on hypothetical $10,000 investment)
| | Costs of a $10,000 investment | Costs paid as a percentage of a $10,000 investment | |
| Service Class | $ 5 | 0.10% | |
Key Fund Statistics (as of June 30, 2024)
KEY FACTS | | |
| Fund Size | $4,160,329,251 | |
| Number of Holdings | 35 | |
| Portfolio Turnover | 14% | |
What did the Fund invest in?
(as of June 30, 2024)
| Bond Funds | 37.8 |
| Domestic Equity Funds | 33.1 |
| International Equity Funds | 22.6 |
| Other Investments | 1.3 |
| Inflation-Protected Bond Funds | 1.0 |
| Short-Term Investments and Net Other Assets (Liabilities) | 4.2 |
ASSET ALLOCATION (% of Fund's net assets) |
|
|
TOP HOLDINGS (% of Fund's net assets) | | |
| VIP Stock Selector All Cap Portfolio - Investor Class | 27.3 | |
| VIP Investment Grade Bond II Portfolio - Investor Class | 17.6 | |
| Fidelity Total Bond Fund | 17.6 | |
| Fidelity Overseas Fund | 6.5 | |
| Fidelity Emerging Markets Fund | 5.8 | |
| Fidelity Enhanced International ETF | 2.0 | |
| Fidelity International Discovery Fund | 1.6 | |
| Fidelity Contrafund | 1.5 | |
| Fidelity Low-Priced Stock Fund | 1.4 | |
| Fidelity International Capital Appreciation Fund | 1.3 | |
| | 82.6 | |
| |
| Fidelity, the Fidelity Investments Logo and all other Fidelity trademarks or service marks used herein are trademarks or service marks of FMR LLC. Any third-party marks that are used herein are trademarks or service marks of their respective owners. © 2024 FMR LLC. All rights reserved. |
| | For additional information about the Fund; including its prospectus, financial information, holdings and proxy information, scan the QR code or visit fundresearch.fidelity.com/prospectus/sec 1.9916108.100 1588-TSRS-0824 |
| |
| | SEMI-ANNUAL SHAREHOLDER REPORT | AS OF JUNE 30, 2024 | |
| | VIP Freedom 2050 Portfolio℠ VIP Freedom 2050 Portfolio℠ Service Class true |
| | | |
This semi-annual shareholder report contains information about VIP Freedom 2050 Portfolio℠ for the period January 1, 2024 to June 30, 2024. You can find additional information about the Fund at fundresearch.fidelity.com/prospectus/sec. You can also request this information by contacting us at 1-877-208-0098 or by sending an e-mail to funddocuments@fmr.com.
What were your Fund costs for the last six months?(based on hypothetical $10,000 investment)
| | Costs of a $10,000 investment | Costs paid as a percentage of a $10,000 investment | |
| Service Class | $ 5 | 0.10% | |
Key Fund Statistics (as of June 30, 2024)
KEY FACTS | | |
| Fund Size | $157,004,633 | |
| Number of Holdings | 13 | |
| Portfolio Turnover | 30% | |
What did the Fund invest in?
(as of June 30, 2024)
| Domestic Equity Funds | 50.5 |
| International Equity Funds | 42.5 |
| Bond Funds | 5.8 |
| Inflation-Protected Bond Funds | 1.2 |
| Short-Term Investments and Net Other Assets (Liabilities) | 0.0 |
ASSET ALLOCATION (% of Fund's net assets) |
|
|
TOP HOLDINGS (% of Fund's net assets) | | |
| VIP Overseas Portfolio - Initial Class | 28.5 | |
| VIP Growth Portfolio - Initial Class | 14.7 | |
| VIP Emerging Markets Portfolio - Initial Class | 14.0 | |
| VIP Growth & Income Portfolio - Initial Class | 9.9 | |
| VIP Contrafund Portfolio - Initial Class | 8.8 | |
| VIP Equity-Income Portfolio - Initial Class | 7.2 | |
| Fidelity Long-Term Treasury Bond Index Fund | 5.5 | |
| VIP Value Portfolio - Initial Class | 5.1 | |
| VIP Value Strategies Portfolio - Initial Class | 2.5 | |
| VIP Mid Cap Portfolio - Initial Class | 2.3 | |
| | 98.5 | |
| |
| Fidelity, the Fidelity Investments Logo and all other Fidelity trademarks or service marks used herein are trademarks or service marks of FMR LLC. Any third-party marks that are used herein are trademarks or service marks of their respective owners. © 2024 FMR LLC. All rights reserved. |
| | For additional information about the Fund; including its prospectus, financial information, holdings and proxy information, scan the QR code or visit fundresearch.fidelity.com/prospectus/sec 1.9916141.100 2169-TSRS-0824 |
| |
| | SEMI-ANNUAL SHAREHOLDER REPORT | AS OF JUNE 30, 2024 | |
| | VIP Freedom 2055 Portfolio℠ VIP Freedom 2055 Portfolio℠ Service Class true |
| | | |
This semi-annual shareholder report contains information about VIP Freedom 2055 Portfolio℠ for the period January 1, 2024 to June 30, 2024. You can find additional information about the Fund at fundresearch.fidelity.com/prospectus/sec. You can also request this information by contacting us at 1-877-208-0098 or by sending an e-mail to funddocuments@fmr.com.
What were your Fund costs for the last six months?(based on hypothetical $10,000 investment)
| | Costs of a $10,000 investment | Costs paid as a percentage of a $10,000 investment | |
| Service Class | $ 5 | 0.09% | |
Key Fund Statistics (as of June 30, 2024)
KEY FACTS | | |
| Fund Size | $18,954,876 | |
| Number of Holdings | 13 | |
| Portfolio Turnover | 34% | |
What did the Fund invest in?
(as of June 30, 2024)
| Domestic Equity Funds | 50.5 |
| International Equity Funds | 42.5 |
| Bond Funds | 5.8 |
| Inflation-Protected Bond Funds | 1.2 |
| Short-Term Investments and Net Other Assets (Liabilities) | 0.0 |
ASSET ALLOCATION (% of Fund's net assets) |
|
|
TOP HOLDINGS (% of Fund's net assets) | | |
| VIP Overseas Portfolio - Initial Class | 28.5 | |
| VIP Growth Portfolio - Initial Class | 14.7 | |
| VIP Emerging Markets Portfolio - Initial Class | 14.0 | |
| VIP Growth & Income Portfolio - Initial Class | 9.9 | |
| VIP Contrafund Portfolio - Initial Class | 8.8 | |
| VIP Equity-Income Portfolio - Initial Class | 7.2 | |
| Fidelity Long-Term Treasury Bond Index Fund | 5.5 | |
| VIP Value Portfolio - Initial Class | 5.1 | |
| VIP Value Strategies Portfolio - Initial Class | 2.5 | |
| VIP Mid Cap Portfolio - Initial Class | 2.3 | |
| | 98.5 | |
| |
| Fidelity, the Fidelity Investments Logo and all other Fidelity trademarks or service marks used herein are trademarks or service marks of FMR LLC. Any third-party marks that are used herein are trademarks or service marks of their respective owners. © 2024 FMR LLC. All rights reserved. |
| | For additional information about the Fund; including its prospectus, financial information, holdings and proxy information, scan the QR code or visit fundresearch.fidelity.com/prospectus/sec 1.9916186.100 3363-TSRS-0824 |
Item 2.
Code of Ethics
Not applicable.
Item 3.
Audit Committee Financial Expert
Not applicable.
Item 4.
Principal Accountant Fees and Services
Not applicable.
Item 5.
Audit Committee of Listed Registrants
Not applicable.
Item 6.
Investments
(a)
Not applicable.
(b)
Not applicable
Item 7.
Financial Statements and Financial Highlights for Open-End Management Investment Companies
Fidelity® Variable Insurance Products:
VIP FundsManager® 20% Portfolio
VIP FundsManager® 30% Portfolio
VIP FundsManager® 40% Portfolio
VIP FundsManager® 50% Portfolio
VIP FundsManager® 60% Portfolio
VIP FundsManager® 70% Portfolio
VIP FundsManager® 85% Portfolio
Semi-Annual Report
June 30, 2024
Contents
To view a fund's proxy voting guidelines and proxy voting record for the 12-month period ended June 30, visit http://www.fidelity.com/proxyvotingresults or visit the Securities and Exchange Commission's (SEC) web site at http://www.sec.gov.
You may also call 1-877-208-0098 to request a free copy of the proxy voting guidelines.
Fidelity® Variable Insurance Products are separate account options which are purchased through a variable insurance contract.
Standard & Poor's, S&P and S&P 500 are registered service marks of The McGraw-Hill Companies, Inc. and have been licensed for use by Fidelity Distributors Corporation.
Other third-party marks appearing herein are the property of their respective owners.
All other marks appearing herein are registered or unregistered trademarks or service marks of FMR LLC or an affiliated company. © 2024 FMR LLC. All rights reserved.
This report and the financial statements contained herein are submitted for the general information of the shareholders of the Funds. This report is not authorized for distribution to prospective investors in the Funds unless preceded or accompanied by an effective prospectus.
A fund files its complete schedule of portfolio holdings with the SEC for the first and third quarters of each fiscal year on Form N-PORT. Forms N-PORT are available on the SEC's web site at http://www.sec.gov. A fund's Forms N-PORT may be reviewed and copied at the SEC's Public Reference Room in Washington, DC. Information regarding the operation of the SEC's Public Reference Room may be obtained by calling 1-800-SEC-0330.
For a complete list of a fund's portfolio holdings, view the most recent holdings listing, semiannual report, or annual report on Fidelity's web site at http://www.fidelity.com, http://www.institutional.fidelity.com, or http://www.401k.com, as applicable.
NOT FDIC INSURED •MAY LOSE VALUE •NO BANK GUARANTEE
Neither the Funds nor Fidelity Distributors Corporation is a bank.
Item 7: Financial Statements and Financial Highlights for Open-End Management Investment Companies (Semi-Annual Report)
VIP FundsManager® 20% Portfolio
Schedule of Investments June 30, 2024 (Unaudited)
Showing Percentage of Net Assets
| Equity Funds - 25.0% |
| | | Shares | Value ($) |
| Fidelity Canada Fund (a) | | 19,607 | 1,307,384 |
| Fidelity Commodity Strategy Fund (a) | | 36,432 | 3,461,017 |
| Fidelity Contrafund (a) | | 215,634 | 4,355,802 |
| Fidelity Emerging Markets Discovery Fund (a) | | 466,556 | 7,800,822 |
| Fidelity Emerging Markets Fund (a) | | 343,212 | 13,622,072 |
| Fidelity Enhanced International ETF (a) | | 184,916 | 5,240,519 |
| Fidelity Enhanced Mid Cap ETF (a) | | 60,030 | 1,767,884 |
| Fidelity Enhanced Small Cap ETF (a) | | 85,865 | 2,498,242 |
| Fidelity Hedged Equity Fund (a) | | 738,862 | 9,161,895 |
| Fidelity Infrastructure Fund (a) | | 58,448 | 739,371 |
| Fidelity International Capital Appreciation Fund (a) | | 124,838 | 3,580,368 |
| Fidelity International Discovery Fund (a) | | 83,266 | 4,156,659 |
| Fidelity International Small Cap Fund (a) | | 54,999 | 1,773,709 |
| Fidelity International Small Cap Opportunities Fund (a) | | 138,603 | 2,758,209 |
| Fidelity International Value Fund (a) | | 283,624 | 2,992,231 |
| Fidelity Low-Priced Stock Fund (a) | | 87,409 | 4,091,602 |
| Fidelity Overseas Fund (a) | | 264,100 | 17,198,170 |
| Fidelity Real Estate Investment Portfolio (a) | | 93,322 | 3,486,495 |
| iShares Core S&P 500 ETF | | 16,765 | 9,174,311 |
| VIP Stock Selector All Cap Portfolio Investor Class (a) | | 6,777,901 | 76,996,953 |
| TOTAL EQUITY FUNDS (Cost $148,556,809) | | | 176,163,715 |
| | | | |
| Fixed-Income Funds - 50.4% |
| | | Shares | Value ($) |
| Fidelity Floating Rate High Income Fund (a) | | 1,002,639 | 9,284,440 |
| Fidelity High Income Fund (a) | | 694,626 | 5,341,674 |
| Fidelity Inflation-Protected Bond Index Fund (a) | | 581,415 | 5,296,689 |
| Fidelity Long-Term Treasury Bond Index Fund (a) | | 375,843 | 3,566,746 |
| Fidelity Total Bond Fund (a) | | 17,680,508 | 166,196,776 |
| VIP Investment Grade Bond II Portfolio Investor Class (a) | | 17,645,195 | 166,217,741 |
| TOTAL FIXED-INCOME FUNDS (Cost $369,127,749) | | | 355,904,066 |
| | | | |
| Money Market Funds - 24.6% |
| | | Shares | Value ($) |
| Fidelity Cash Central Fund 5.38% (b) | | 34,262,626 | 34,269,478 |
| Fidelity Investments Money Market Government Portfolio Institutional Class 5.25% (a)(c) | | 139,229,100 | 139,229,100 |
| TOTAL MONEY MARKET FUNDS (Cost $173,498,578) | | | 173,498,578 |
| | | | |
| U.S. Treasury Obligations - 0.0% |
| | | Principal Amount (d) | Value ($) |
U.S. Treasury Bills, yield at date of purchase 5.33% 7/25/24 (e) (Cost $358,737) | | 360,000 | 358,744 |
| | | | |
| TOTAL INVESTMENT IN SECURITIES - 100.0% (Cost $691,541,873) | 705,925,103 |
NET OTHER ASSETS (LIABILITIES) - 0.0% | 99,024 |
| NET ASSETS - 100.0% | 706,024,127 |
| | |
| Futures Contracts |
| | Number of contracts | Expiration Date | Notional Amount ($) | Value ($) | Unrealized Appreciation/ (Depreciation) ($) |
| Sold | | | | | |
| | | | | | |
| Equity Index Contracts | | | | | |
| ICE MSCI EAFE Index Contracts (United States) | 4 | Sep 2024 | 468,640 | (2,975) | (2,975) |
| ICE MSCI Emerging Markets Index Contracts (United States) | 46 | Sep 2024 | 2,502,860 | (6,621) | (6,621) |
| | | | | | |
| TOTAL FUTURES CONTRACTS | | | | | (9,596) |
| The notional amount of futures sold as a percentage of Net Assets is 0.5% |
For the period, the average monthly notional amount at value for futures contracts in the aggregate was $16,953,971.
Security Type Abbreviations
Legend
| (b) | Affiliated fund that is generally available only to investment companies and other accounts managed by Fidelity Investments. The rate quoted is the annualized seven-day yield of the fund at period end. A complete unaudited listing of the fund's holdings as of its most recent quarter end is available upon request. In addition, each Fidelity Central Fund's financial statements are available on the SEC's website or upon request. |
| (c) | The rate quoted is the annualized seven-day yield of the fund at period end. |
| (d) | Amount is stated in United States dollars unless otherwise noted. |
| (e) | Security or a portion of the security was pledged to cover margin requirements for futures contracts. At period end, the value of securities pledged amounted to $99,651. |
Affiliated Central Funds
Fiscal year to date information regarding the Fund's investments in Fidelity Central Funds, including the ownership percentage, is presented below.
| Affiliate | Value, beginning of period ($) | Purchases ($) | Sales Proceeds ($) | Dividend Income ($) | Realized Gain (loss) ($) | Change in Unrealized appreciation (depreciation) ($) | Value, end of period ($) | % ownership, end of period |
| Fidelity Cash Central Fund 5.38% | 24,884,346 | 21,045,329 | 11,660,203 | 786,782 | 6 | - | 34,269,478 | 0.1% |
| Total | 24,884,346 | 21,045,329 | 11,660,203 | 786,782 | 6 | - | 34,269,478 | |
| | | | | | | | | |
Amounts in the dividend income column in the above table include any capital gain distributions from underlying funds, which are presented in the corresponding line item in the Statement of Operations, if applicable.
Amounts included in the purchases and sales proceeds columns may include in-kind transactions, if applicable.
Affiliated Underlying Funds
Fiscal year to date information regarding the Fund's investments in affiliated Underlying Funds is presented below. Exchanges between classes of the same affiliated Underlying Funds may occur. If an Underlying Funds changes its name, the name presented below is the name in effect at period end.
| Affiliate | Value, beginning of period ($) | Purchases ($) | Sales Proceeds ($) | Dividend Income ($) | Realized Gain (loss) ($) | Change in Unrealized appreciation (depreciation) ($) | Value, end of period ($) |
| Fidelity Canada Fund | 1,461,838 | 15,423 | 216,915 | - | 11,280 | 35,758 | 1,307,384 |
| Fidelity Commodity Strategy Fund | 1,975,189 | 1,575,212 | 185,090 | - | (25,120) | 120,826 | 3,461,017 |
| Fidelity Contrafund | 1,502,791 | 2,509,844 | 144,192 | 1,203 | 18,059 | 469,300 | 4,355,802 |
| Fidelity Emerging Markets Discovery Fund | 7,788,655 | 9,873 | 132,119 | - | 2,543 | 131,870 | 7,800,822 |
| Fidelity Emerging Markets Fund | 13,333,819 | 89,283 | 1,191,762 | - | 153,770 | 1,236,962 | 13,622,072 |
| Fidelity Enhanced International ETF | 4,900,274 | - | - | 94,492 | - | 340,245 | 5,240,519 |
| Fidelity Enhanced Large Cap Value ETF | 684,004 | - | 736,258 | 6,649 | 204,429 | (152,175) | - |
| Fidelity Enhanced Mid Cap ETF | - | 1,805,925 | - | 4,622 | - | (38,041) | 1,767,884 |
| Fidelity Enhanced Small Cap ETF | - | 2,510,873 | - | 4,551 | - | (12,631) | 2,498,242 |
| Fidelity Equity-Income Fund | 2,439,882 | 18,201 | 2,643,438 | 8,584 | 660,485 | (475,130) | - |
| Fidelity Floating Rate High Income Fund | 9,516,426 | 436,075 | 628,142 | 387,806 | (3,493) | (36,426) | 9,284,440 |
| Fidelity Hedged Equity Fund | 9,407,664 | 2,543 | 1,305,597 | 2,543 | 253,341 | 803,944 | 9,161,895 |
| Fidelity High Income Fund | 3,775,562 | 1,932,040 | 400,918 | 146,197 | 259 | 34,731 | 5,341,674 |
| Fidelity Inflation-Protected Bond Index Fund | 8,969,720 | 70,118 | 3,760,056 | 14,531 | (255,518) | 272,425 | 5,296,689 |
| Fidelity Infrastructure Fund | 759,224 | 5,926 | 52,568 | 1,867 | 426 | 26,363 | 739,371 |
| Fidelity International Capital Appreciation Fund | 3,614,793 | 24,493 | 343,861 | - | 66,400 | 218,543 | 3,580,368 |
| Fidelity International Discovery Fund | 4,086,066 | 32,178 | 450,205 | - | (4,319) | 492,939 | 4,156,659 |
| Fidelity International Small Cap Fund | 1,886,543 | 12,674 | 176,636 | - | 19,514 | 31,614 | 1,773,709 |
| Fidelity International Small Cap Opportunities Fund | 2,751,296 | 16,762 | - | - | - | (9,849) | 2,758,209 |
| Fidelity International Value Fund | 2,994,051 | 16,762 | 234,368 | - | 22,915 | 192,871 | 2,992,231 |
| Fidelity Investments Money Market Government Portfolio Institutional Class 5.25% | 135,697,223 | 18,282,045 | 14,750,168 | 3,456,612 | - | - | 139,229,100 |
| Fidelity Long-Term Treasury Bond Index Fund | 4,455,102 | 330,872 | 972,753 | 64,383 | (51,634) | (194,841) | 3,566,746 |
| Fidelity Low-Priced Stock Fund | 2,697,945 | 1,547,376 | 283,437 | - | 4,858 | 124,860 | 4,091,602 |
| Fidelity Overseas Fund | 17,434,856 | 121,294 | 1,700,206 | - | 254,541 | 1,087,685 | 17,198,170 |
| Fidelity Real Estate Investment Portfolio | 3,857,144 | 35,825 | 288,028 | 13,305 | (23,685) | (94,761) | 3,486,495 |
| Fidelity Total Bond Fund | 179,493,756 | 5,440,090 | 15,180,928 | 3,701,851 | (644,128) | (2,912,014) | 166,196,776 |
| Fidelity U.S. Low Volatility Equity Fund | 7,244,007 | 2,872 | 7,399,884 | - | 963,359 | (810,354) | - |
| Fidelity Value Discovery Fund | 1,194,898 | 5,333 | 1,264,307 | - | 338,997 | (274,921) | - |
| VIP Investment Grade Bond II Portfolio Investor Class | 177,997,412 | 3,416,995 | 14,340,465 | 111,854 | (833,557) | (22,644) | 166,217,741 |
| VIP Stock Selector All Cap Portfolio Investor Class | 101,760,217 | 615,746 | 35,224,320 | - | 3,206,109 | 6,639,201 | 76,996,953 |
| | 713,680,357 | 40,882,653 | 104,006,621 | 8,021,050 | 4,339,831 | 7,226,350 | 662,122,570 |
Amounts in the dividend income column in the above table include any capital gain distributions from underlying funds, which are presented in the corresponding line item in the Statement of Operations, if applicable.
Amounts included in the purchases and sales proceeds columns may include in-kind transactions, if applicable.
Investment Valuation
The following is a summary of the inputs used, as of June 30, 2024, involving the Fund's assets and liabilities carried at fair value. The inputs or methodology used for valuing securities may not be an indication of the risk associated with investing in those securities. For more information on valuation inputs, and their aggregation into the levels used below, please refer to the Investment Valuation section in the accompanying Notes to Financial Statements.
| Valuation Inputs at Reporting Date: |
| Description | Total ($) | Level 1 ($) | Level 2 ($) | Level 3 ($) |
Investments in Securities: | | | | |
|
| Equity Funds | 176,163,715 | 176,163,715 | - | - |
|
| Fixed-Income Funds | 355,904,066 | 355,904,066 | - | - |
|
| Money Market Funds | 173,498,578 | 173,498,578 | - | - |
|
| Other Short-Term Investments and Net Other Assets | 358,744 | - | 358,744 | - |
| Total Investments in Securities: | 705,925,103 | 705,566,359 | 358,744 | - |
Derivative Instruments: Liabilities | | | | |
Futures Contracts | (9,596) | (9,596) | - | - |
| Total Liabilities | (9,596) | (9,596) | - | - |
| Total Derivative Instruments: | (9,596) | (9,596) | - | - |
Value of Derivative Instruments
The following table is a summary of the Fund's value of derivative instruments by primary risk exposure as of June 30, 2024. For additional information on derivative instruments, please refer to the Derivative Instruments section in the accompanying Notes to Financial Statements.
Primary Risk Exposure / Derivative Type | Value |
| Asset ($) | Liability ($) |
| Equity Risk | | |
Futures Contracts (a) | 0 | (9,596) |
| Total Equity Risk | 0 | (9,596) |
| Total Value of Derivatives | 0 | (9,596) |
(a)Reflects gross cumulative appreciation (depreciation) on futures contracts as presented in the Schedule of Investments. In the Statement of Assets and Liabilities, the period end daily variation margin is included in receivable or payable for daily variation margin on futures contracts, and the net cumulative appreciation (depreciation) is included in Total accumulated earnings (loss).
VIP FundsManager® 20% Portfolio
Financial Statements (Unaudited)
| Statement of Assets and Liabilities |
| | | | June 30, 2024 (Unaudited) |
| | | | | |
| Assets | | | | |
| Investment in securities, at value - See accompanying schedule: | | | | |
Unaffiliated issuers (cost $9,134,041) | $ | 9,533,055 | | |
Fidelity Central Funds (cost $34,269,478) | | 34,269,478 | | |
Other affiliated issuers (cost $648,138,354) | | 662,122,570 | | |
| | | | | |
| | | | | |
| Total Investment in Securities (cost $691,541,873) | | | $ | 705,925,103 |
| Cash | | | | 15,209 |
| Receivable for investments sold | | | | 191,405 |
| Receivable for fund shares sold | | | | 6,124 |
| Distributions receivable from Fidelity Central Funds | | | | 149,540 |
Total assets | | | | 706,287,381 |
| Liabilities | | | | |
| Payable for investments purchased | $ | 2,099 | | |
| Payable for fund shares redeemed | | 195,333 | | |
| Accrued management fee | | 59,110 | | |
| Distribution and service plan fees payable | | 1,472 | | |
| Payable for daily variation margin on futures contracts | | 5,240 | | |
| Total liabilities | | | | 263,254 |
| Net Assets | | | $ | 706,024,127 |
| Net Assets consist of: | | | | |
| Paid in capital | | | $ | 717,746,381 |
| Total accumulated earnings (loss) | | | | (11,722,254) |
| Net Assets | | | $ | 706,024,127 |
| | | | | |
| Net Asset Value and Maximum Offering Price | | | | |
| Service Class : | | | | |
Net Asset Value, offering price and redemption price per share ($60,840 ÷ 5,663 shares) | | | $ | 10.74 |
| Service Class 2 : | | | | |
Net Asset Value, offering price and redemption price per share ($11,738,873 ÷ 1,097,366 shares) | | | $ | 10.70 |
| Investor Class : | | | | |
Net Asset Value, offering price and redemption price per share ($694,224,414 ÷ 64,670,170 shares) | | | $ | 10.73 |
| Statement of Operations |
| | | | Six months ended June 30, 2024 (Unaudited) |
| Investment Income | | | | |
| Dividends: | | | | |
| Unaffiliated issuers | | | $ | 27,155 |
| Affiliated issuers | | | | 8,011,633 |
| Interest | | | | 26,222 |
| Income from Fidelity Central Funds | | | | 786,782 |
| Total income | | | | 8,851,792 |
| Expenses | | | | |
| Management fee | $ | 538,880 | | |
| Distribution and service plan fees | | 14,747 | | |
| Independent trustees' fees and expenses | | 973 | | |
| Total expenses before reductions | | 554,600 | | |
| Expense reductions | | (185,869) | | |
| Total expenses after reductions | | | | 368,731 |
| Net Investment income (loss) | | | | 8,483,061 |
| Realized and Unrealized Gain (Loss) | | | | |
| Net realized gain (loss) on: | | | | |
| Investment Securities: | | | | |
| Unaffiliated issuers | | (14,702) | | |
| Fidelity Central Funds | | 6 | | |
| Other affiliated issuers | | 4,339,831 | | |
| Foreign currency transactions | | 54 | | |
| Futures contracts | | (2,236,514) | | |
| Capital gain distributions from underlying funds: | | | | |
| Affiliated issuers | | 9,417 | | |
| Total net realized gain (loss) | | | | 2,098,092 |
| Change in net unrealized appreciation (depreciation) on: | | | | |
| Investment Securities: | | | | |
| Unaffiliated issuers | | 398,802 | | |
| Affiliated issuers | | 7,226,350 | | |
| Futures contracts | | 799,913 | | |
| Total change in net unrealized appreciation (depreciation) | | | | 8,425,065 |
| Net gain (loss) | | | | 10,523,157 |
| Net increase (decrease) in net assets resulting from operations | | | $ | 19,006,218 |
| Statement of Changes in Net Assets |
| |
| | Six months ended June 30, 2024 (Unaudited) | | Year ended December 31, 2023 |
| Increase (Decrease) in Net Assets | | | | |
| Operations | | | | |
| Net investment income (loss) | $ | 8,483,061 | $ | 26,133,887 |
| Net realized gain (loss) | | 2,098,092 | | (15,499,603) |
| Change in net unrealized appreciation (depreciation) | | 8,425,065 | | 49,379,650 |
| Net increase (decrease) in net assets resulting from operations | | 19,006,218 | | 60,013,934 |
| Distributions to shareholders | | (765,116) | | (27,487,975) |
| | | | | |
| Share transactions - net increase (decrease) | | (51,965,746) | | (105,051,134) |
| Total increase (decrease) in net assets | | (33,724,644) | | (72,525,175) |
| | | | | |
| Net Assets | | | | |
| Beginning of period | | 739,748,771 | | 812,273,946 |
| End of period | $ | 706,024,127 | $ | 739,748,771 |
| | | | | |
| | | | | |
Financial Highlights
VIP FundsManager® 20% Portfolio Service Class |
| |
| | Six months ended (Unaudited) June 30, 2024 | | Years ended December 31, 2023 | | 2022 | | 2021 | | 2020 | | 2019 |
Selected Per-Share Data | | | | | | | | | | | | |
| Net asset value, beginning of period | $ | 10.47 | $ | 10.05 | $ | 12.18 | $ | 11.89 | $ | 11.19 | $ | 10.75 |
| Income from Investment Operations | | | | | | | | | | | | |
Net investment income (loss) A,B | | .12 | | .35 | | .24 | | .14 | | .13 | | .22 |
| Net realized and unrealized gain (loss) | | .16 | | .47 | | (1.35) | | .30 | | .77 | | .86 |
| Total from investment operations | | .28 | | .82 | | (1.11) | | .44 | | .90 | | 1.08 |
| Distributions from net investment income | | (.01) | | (.40) | | (.25) | | (.13) | | (.13) | | (.21) |
| Distributions from net realized gain | | - | | - | | (.77) | | (.03) | | (.07) | | (.43) |
| Total distributions | | (.01) | | (.40) | | (1.02) | | (.15) C | | (.20) | | (.64) |
| Net asset value, end of period | $ | 10.74 | $ | 10.47 | $ | 10.05 | $ | 12.18 | $ | 11.89 | $ | 11.19 |
Total Return D,E,F | | | | 8.15% | | (9.59)% | | 3.74% | | 8.11% | | 10.39% |
Ratios to Average Net Assets B,G,H | | | | | | | | | | | | |
| Expenses before reductions | | .25% I | | .25% | | .30% | | .35% | | .35% | | .35% |
| Expenses net of fee waivers, if any | | | | .10% | | .15% | | .20% | | .20% | | .20% |
| Expenses net of all reductions | | .10% I | | .10% | | .15% | | .20% | | .20% | | .20% |
| Net investment income (loss) | | 2.36% I | | 3.37% | | 2.24% | | 1.12% | | 1.17% | | 2.01% |
| Supplemental Data | | | | | | | | | | | | |
| Net assets, end of period (000 omitted) | $ | 61 | $ | 59 | $ | 54 | $ | 63 | $ | 61 | $ | 57 |
Portfolio turnover rate J | | | | 14% | | 70% K | | 45% K | | 32% K | | 33% |
ACalculated based on average shares outstanding during the period.
BNet investment income (loss) is affected by the timing of the declaration of dividends by any underlying mutual funds or exchange-traded funds (ETFs). Net investment income (loss) of any mutual funds or ETFs is not included in the Fund's net investment income (loss) ratio.
CTotal distributions per share do not sum due to rounding.
DTotal returns for periods of less than one year are not annualized.
ETotal returns do not reflect charges attributable to your insurance company's separate account. Inclusion of these charges would reduce the total returns shown.
FTotal returns would have been lower if certain expenses had not been reduced during the applicable periods shown.
GFees and expenses of any underlying mutual funds or exchange-traded funds (ETFs) are not included in the Fund's expense ratio. The Fund indirectly bears its proportionate share of these expenses. For additional expense information related to investments in Fidelity Central Funds, please refer to the "Investments in Fidelity Central Funds" note found in the Notes to Financial Statements section of the most recent Annual or Semi-Annual report.
HExpense ratios reflect operating expenses of the class. Expenses before reductions do not reflect amounts reimbursed, waived, or reduced through arrangements with the investment adviser, brokerage services, or other offset arrangements, if applicable, and do not represent the amount paid by the class during periods when reimbursements, waivers or reductions occur.
IAnnualized.
JAmount does not include the portfolio activity of any underlying mutual funds or exchange-traded funds (ETFs).
KPortfolio turnover rate excludes securities received or delivered in-kind.
VIP FundsManager® 20% Portfolio Service Class 2 |
| |
| | Six months ended (Unaudited) June 30, 2024 | | Years ended December 31, 2023 | | 2022 | | 2021 | | 2020 | | 2019 |
Selected Per-Share Data | | | | | | | | | | | | |
| Net asset value, beginning of period | $ | 10.43 | $ | 10.02 | $ | 12.14 | $ | 11.86 | $ | 11.16 | $ | 10.72 |
| Income from Investment Operations | | | | | | | | | | | | |
Net investment income (loss) A,B | | .12 | | .33 | | .22 | | .12 | | .12 | | .20 |
| Net realized and unrealized gain (loss) | | .16 | | .46 | | (1.34) | | .30 | | .77 | | .87 |
| Total from investment operations | | .28 | | .79 | | (1.12) | | .42 | | .89 | | 1.07 |
| Distributions from net investment income | | (.01) | | (.38) | | (.23) | | (.11) | | (.11) | | (.20) |
| Distributions from net realized gain | | - | | - | | (.77) | | (.03) | | (.07) | | (.43) |
| Total distributions | | (.01) | | (.38) | | (1.00) | | (.14) | | (.19) C | | (.63) |
| Net asset value, end of period | $ | 10.70 | $ | 10.43 | $ | 10.02 | $ | 12.14 | $ | 11.86 | $ | 11.16 |
Total Return D,E,F | | | | 7.91% | | (9.67)% | | 3.52% | | 7.97% | | 10.26% |
Ratios to Average Net Assets B,G,H | | | | | | | | | | | | |
| Expenses before reductions | | .40% I | | .40% | | .44% | | .50% | | .50% | | .50% |
| Expenses net of fee waivers, if any | | | | .25% | | .29% | | .35% | | .35% | | .35% |
| Expenses net of all reductions | | .25% I | | .25% | | .29% | | .35% | | .35% | | .35% |
| Net investment income (loss) | | 2.21% I | | 3.22% | | 2.09% | | .97% | | 1.02% | | 1.86% |
| Supplemental Data | | | | | | | | | | | | |
| Net assets, end of period (000 omitted) | $ | 11,739 | $ | 11,585 | $ | 11,376 | $ | 10,257 | $ | 9,323 | $ | 8,978 |
Portfolio turnover rate J | | | | 14% | | 70% K | | 45% K | | 32% K | | 33% |
ACalculated based on average shares outstanding during the period.
BNet investment income (loss) is affected by the timing of the declaration of dividends by any underlying mutual funds or exchange-traded funds (ETFs). Net investment income (loss) of any mutual funds or ETFs is not included in the Fund's net investment income (loss) ratio.
CTotal distributions per share do not sum due to rounding.
DTotal returns for periods of less than one year are not annualized.
ETotal returns do not reflect charges attributable to your insurance company's separate account. Inclusion of these charges would reduce the total returns shown.
FTotal returns would have been lower if certain expenses had not been reduced during the applicable periods shown.
GFees and expenses of any underlying mutual funds or exchange-traded funds (ETFs) are not included in the Fund's expense ratio. The Fund indirectly bears its proportionate share of these expenses. For additional expense information related to investments in Fidelity Central Funds, please refer to the "Investments in Fidelity Central Funds" note found in the Notes to Financial Statements section of the most recent Annual or Semi-Annual report.
HExpense ratios reflect operating expenses of the class. Expenses before reductions do not reflect amounts reimbursed, waived, or reduced through arrangements with the investment adviser, brokerage services, or other offset arrangements, if applicable, and do not represent the amount paid by the class during periods when reimbursements, waivers or reductions occur.
IAnnualized.
JAmount does not include the portfolio activity of any underlying mutual funds or exchange-traded funds (ETFs).
KPortfolio turnover rate excludes securities received or delivered in-kind.
VIP FundsManager® 20% Portfolio Investor Class |
| |
| | Six months ended (Unaudited) June 30, 2024 | | Years ended December 31, 2023 | | 2022 | | 2021 | | 2020 | | 2019 |
Selected Per-Share Data | | | | | | | | | | | | |
| Net asset value, beginning of period | $ | 10.46 | $ | 10.04 | $ | 12.17 | $ | 11.89 | $ | 11.18 | $ | 10.74 |
| Income from Investment Operations | | | | | | | | | | | | |
Net investment income (loss) A,B | | .12 | | .35 | | .24 | | .14 | | .13 | | .22 |
| Net realized and unrealized gain (loss) | | .16 | | .47 | | (1.35) | | .29 | | .78 | | .86 |
| Total from investment operations | | .28 | | .82 | | (1.11) | | .43 | | .91 | | 1.08 |
| Distributions from net investment income | | (.01) | | (.40) | | (.25) | | (.13) | | (.13) | | (.21) |
| Distributions from net realized gain | | - | | - | | (.77) | | (.03) | | (.07) | | (.43) |
| Total distributions | | (.01) | | (.40) | | (1.02) | | (.15) C | | (.20) | | (.64) |
| Net asset value, end of period | $ | 10.73 | $ | 10.46 | $ | 10.04 | $ | 12.17 | $ | 11.89 | $ | 11.18 |
Total Return D,E,F | | | | 8.15% | | (9.60)% | | 3.65% | | 8.21% | | 10.40% |
Ratios to Average Net Assets B,G,H | | | | | | | | | | | | |
| Expenses before reductions | | .15% I | | .15% | | .19% | | .25% | | .25% | | .25% |
| Expenses net of fee waivers, if any | | | | .10% | | .14% | | .20% | | .20% | | .20% |
| Expenses net of all reductions | | .10% I | | .10% | | .14% | | .20% | | .20% | | .20% |
| Net investment income (loss) | | 2.36% I | | 3.37% | | 2.24% | | 1.12% | | 1.17% | | 2.01% |
| Supplemental Data | | | | | | | | | | | | |
| Net assets, end of period (000 omitted) | $ | 694,224 | $ | 728,105 | $ | 800,844 | $ | 986,076 | $ | 925,096 | $ | 812,070 |
Portfolio turnover rate J | | | | 14% | | 70% K | | 45% K | | 32% K | | 33% |
ACalculated based on average shares outstanding during the period.
BNet investment income (loss) is affected by the timing of the declaration of dividends by any underlying mutual funds or exchange-traded funds (ETFs). Net investment income (loss) of any mutual funds or ETFs is not included in the Fund's net investment income (loss) ratio.
CTotal distributions per share do not sum due to rounding.
DTotal returns for periods of less than one year are not annualized.
ETotal returns do not reflect charges attributable to your insurance company's separate account. Inclusion of these charges would reduce the total returns shown.
FTotal returns would have been lower if certain expenses had not been reduced during the applicable periods shown.
GFees and expenses of any underlying mutual funds or exchange-traded funds (ETFs) are not included in the Fund's expense ratio. The Fund indirectly bears its proportionate share of these expenses. For additional expense information related to investments in Fidelity Central Funds, please refer to the "Investments in Fidelity Central Funds" note found in the Notes to Financial Statements section of the most recent Annual or Semi-Annual report.
HExpense ratios reflect operating expenses of the class. Expenses before reductions do not reflect amounts reimbursed, waived, or reduced through arrangements with the investment adviser, brokerage services, or other offset arrangements, if applicable, and do not represent the amount paid by the class during periods when reimbursements, waivers or reductions occur.
IAnnualized.
JAmount does not include the portfolio activity of any underlying mutual funds or exchange-traded funds (ETFs).
KPortfolio turnover rate excludes securities received or delivered in-kind.
VIP FundsManager® 30% Portfolio
Schedule of Investments June 30, 2024 (Unaudited)
Showing Percentage of Net Assets
| Equity Funds - 34.5% |
| | | Shares | Value ($) |
| Fidelity Canada Fund (a) | | 796 | 53,050 |
| Fidelity Commodity Strategy Fund (a) | | 582 | 55,291 |
| Fidelity Contrafund (a) | | 5,232 | 105,687 |
| Fidelity Emerging Markets Discovery Fund (a) | | 2,507 | 41,919 |
| Fidelity Emerging Markets Fund (a) | | 10,021 | 397,719 |
| Fidelity Enhanced International ETF (a) | | 1,792 | 50,785 |
| Fidelity Enhanced Mid Cap ETF (a) | | 737 | 21,705 |
| Fidelity Enhanced Small Cap ETF (a) | | 1,055 | 30,695 |
| Fidelity Hedged Equity Fund (a) | | 11,689 | 144,946 |
| Fidelity Infrastructure Fund (a) | | 1,052 | 13,303 |
| Fidelity International Capital Appreciation Fund (a) | | 3,129 | 89,729 |
| Fidelity International Discovery Fund (a) | | 2,376 | 118,624 |
| Fidelity International Small Cap Fund (a) | | 1,365 | 44,022 |
| Fidelity International Small Cap Opportunities Fund (a) | | 2,893 | 57,571 |
| Fidelity International Value Fund (a) | | 5,599 | 59,071 |
| Fidelity Japan Smaller Companies Fund (a) | | 1,800 | 28,348 |
| Fidelity Low-Priced Stock Fund (a) | | 2,135 | 99,957 |
| Fidelity Overseas Fund (a) | | 6,733 | 438,445 |
| Fidelity Real Estate Investment Portfolio (a) | | 1,508 | 56,323 |
| iShares Core S&P 500 ETF | | 248 | 135,713 |
| VIP Stock Selector All Cap Portfolio Investor Class (a) | | 164,626 | 1,870,148 |
| TOTAL EQUITY FUNDS (Cost $3,522,153) | | | 3,913,051 |
| | | | |
| Fixed-Income Funds - 49.4% |
| | | Shares | Value ($) |
| Fidelity Floating Rate High Income Fund (a) | | 14,286 | 132,288 |
| Fidelity High Income Fund (a) | | 11,063 | 85,072 |
| Fidelity Inflation-Protected Bond Index Fund (a) | | 12,387 | 112,846 |
| Fidelity Long-Term Treasury Bond Index Fund (a) | | 5,994 | 56,881 |
| Fidelity Total Bond Fund (a) | | 277,688 | 2,610,264 |
| VIP Investment Grade Bond II Portfolio Investor Class (a) | | 277,107 | 2,610,345 |
| TOTAL FIXED-INCOME FUNDS (Cost $5,564,404) | | | 5,607,696 |
| | | | |
| Money Market Funds - 16.0% |
| | | Shares | Value ($) |
| Fidelity Cash Central Fund 5.38% (b) | | 316,804 | 316,867 |
| Fidelity Investments Money Market Government Portfolio Institutional Class 5.25% (a)(c) | | 1,493,230 | 1,493,230 |
| TOTAL MONEY MARKET FUNDS (Cost $1,810,102) | | | 1,810,097 |
| | | | |
| TOTAL INVESTMENT IN SECURITIES - 99.9% (Cost $10,896,659) | 11,330,844 |
NET OTHER ASSETS (LIABILITIES) - 0.1% | 7,709 |
| NET ASSETS - 100.0% | 11,338,553 |
| | |
Security Type Abbreviations
Legend
| (b) | Affiliated fund that is generally available only to investment companies and other accounts managed by Fidelity Investments. The rate quoted is the annualized seven-day yield of the fund at period end. A complete unaudited listing of the fund's holdings as of its most recent quarter end is available upon request. In addition, each Fidelity Central Fund's financial statements are available on the SEC's website or upon request. |
| (c) | The rate quoted is the annualized seven-day yield of the fund at period end. |
Affiliated Central Funds
Fiscal year to date information regarding the Fund's investments in Fidelity Central Funds, including the ownership percentage, is presented below.
| Affiliate | Value, beginning of period ($) | Purchases ($) | Sales Proceeds ($) | Dividend Income ($) | Realized Gain (loss) ($) | Change in Unrealized appreciation (depreciation) ($) | Value, end of period ($) | % ownership, end of period |
| Fidelity Cash Central Fund 5.38% | 116,577 | 346,263 | 145,968 | 6,262 | - | (5) | 316,867 | 0.0% |
| Total | 116,577 | 346,263 | 145,968 | 6,262 | - | (5) | 316,867 | |
| | | | | | | | | |
Amounts in the dividend income column in the above table include any capital gain distributions from underlying funds, which are presented in the corresponding line item in the Statement of Operations, if applicable.
Amounts included in the purchases and sales proceeds columns may include in-kind transactions, if applicable.
Affiliated Underlying Funds
Fiscal year to date information regarding the Fund's investments in affiliated Underlying Funds is presented below. Exchanges between classes of the same affiliated Underlying Funds may occur. If an Underlying Funds changes its name, the name presented below is the name in effect at period end.
| Affiliate | Value, beginning of period ($) | Purchases ($) | Sales Proceeds ($) | Dividend Income ($) | Realized Gain (loss) ($) | Change in Unrealized appreciation (depreciation) ($) | Value, end of period ($) |
| Fidelity Canada Fund | 28,857 | 27,708 | 4,625 | - | 7 | 1,103 | 53,050 |
| Fidelity Commodity Strategy Fund | 14,255 | 42,885 | 2,874 | - | (5) | 1,030 | 55,291 |
| Fidelity Contrafund | 18,309 | 82,168 | 3,512 | 16 | 37 | 8,685 | 105,687 |
| Fidelity Emerging Markets Discovery Fund | 19,869 | 23,614 | 2,460 | - | 5 | 891 | 41,919 |
| Fidelity Emerging Markets Fund | 174,641 | 212,705 | 22,187 | - | 627 | 31,933 | 397,719 |
| Fidelity Enhanced International ETF | 49,847 | - | 2,386 | 918 | 156 | 3,168 | 50,785 |
| Fidelity Enhanced Large Cap Value ETF | 20,621 | 654 | 22,854 | 202 | 2,776 | (1,197) | - |
| Fidelity Enhanced Mid Cap ETF | - | 22,172 | - | 57 | - | (467) | 21,705 |
| Fidelity Enhanced Small Cap ETF | - | 30,850 | - | 56 | - | (155) | 30,695 |
| Fidelity Equity-Income Fund | 45,419 | 22,800 | 72,511 | 205 | 6,105 | (1,813) | - |
| Fidelity Floating Rate High Income Fund | 77,140 | 61,770 | 6,020 | 4,398 | (10) | (592) | 132,288 |
| Fidelity Hedged Equity Fund | 77,811 | 67,465 | 12,469 | 26 | 63 | 12,076 | 144,946 |
| Fidelity High Income Fund | 31,212 | 57,772 | 4,457 | 1,833 | (3) | 548 | 85,072 |
| Fidelity Inflation-Protected Bond Index Fund | 89,094 | 76,567 | 53,997 | 200 | (879) | 2,061 | 112,846 |
| Fidelity Infrastructure Fund | 7,649 | 5,932 | 832 | 26 | 16 | 538 | 13,303 |
| Fidelity International Capital Appreciation Fund | 48,390 | 44,229 | 7,588 | - | 6 | 4,692 | 89,729 |
| Fidelity International Discovery Fund | 60,950 | 57,912 | 9,836 | - | 172 | 9,426 | 118,624 |
| Fidelity International Small Cap Fund | 24,068 | 22,843 | 3,844 | - | 36 | 919 | 44,022 |
| Fidelity International Small Cap Opportunities Fund | 33,126 | 30,024 | 5,121 | - | 8 | (466) | 57,571 |
| Fidelity International Value Fund | 31,159 | 30,024 | 5,054 | - | 48 | 2,894 | 59,071 |
| Fidelity Investments Money Market Government Portfolio Institutional Class 5.25% | 823,275 | 749,875 | 79,920 | 30,648 | - | - | 1,493,230 |
| Fidelity Japan Smaller Companies Fund | 15,522 | 13,488 | 1,489 | - | (27) | 854 | 28,348 |
| Fidelity Long-Term Treasury Bond Index Fund | 54,522 | 32,196 | 27,339 | 815 | 310 | (2,808) | 56,881 |
| Fidelity Low-Priced Stock Fund | 56,431 | 55,456 | 16,548 | - | 730 | 3,888 | 99,957 |
| Fidelity Overseas Fund | 233,785 | 218,387 | 37,129 | - | 235 | 23,167 | 438,445 |
| Fidelity Real Estate Investment Portfolio | 32,574 | 27,185 | 2,979 | 209 | 2 | (459) | 56,323 |
| Fidelity Total Bond Fund | 1,464,648 | 1,329,774 | 157,318 | 44,550 | (2,130) | (24,710) | 2,610,264 |
| Fidelity U.S. Low Volatility Equity Fund | 61,462 | 4,673 | 67,818 | - | 3,836 | (2,153) | - |
| Fidelity Value Discovery Fund | 24,438 | 12,435 | 38,560 | - | 2,266 | (579) | - |
| VIP Investment Grade Bond II Portfolio Investor Class | 1,459,945 | 1,291,527 | 148,278 | 1,030 | (752) | 7,903 | 2,610,345 |
| VIP Stock Selector All Cap Portfolio Investor Class | 978,885 | 990,122 | 239,499 | - | 1,278 | 139,362 | 1,870,148 |
| | 6,057,904 | 5,645,212 | 1,059,504 | 85,189 | 14,913 | 219,739 | 10,878,264 |
Amounts in the dividend income column in the above table include any capital gain distributions from underlying funds, which are presented in the corresponding line item in the Statement of Operations, if applicable.
Amounts included in the purchases and sales proceeds columns may include in-kind transactions, if applicable.
Investment Valuation
The following is a summary of the inputs used, as of June 30, 2024, involving the Fund's assets and liabilities carried at fair value. The inputs or methodology used for valuing securities may not be an indication of the risk associated with investing in those securities. For more information on valuation inputs, and their aggregation into the levels used below, please refer to the Investment Valuation section in the accompanying Notes to Financial Statements.
| Valuation Inputs at Reporting Date: |
| Description | Total ($) | Level 1 ($) | Level 2 ($) | Level 3 ($) |
Investments in Securities: | | | | |
|
| Equity Funds | 3,913,051 | 3,913,051 | - | - |
|
| Fixed-Income Funds | 5,607,696 | 5,607,696 | - | - |
|
| Money Market Funds | 1,810,097 | 1,810,097 | - | - |
| Total Investments in Securities: | 11,330,844 | 11,330,844 | - | - |
VIP FundsManager® 30% Portfolio
Financial Statements (Unaudited)
| Statement of Assets and Liabilities |
| | | | June 30, 2024 (Unaudited) |
| | | | | |
| Assets | | | | |
| Investment in securities, at value - See accompanying schedule: | | | | |
Unaffiliated issuers (cost $129,304) | $ | 135,713 | | |
Fidelity Central Funds (cost $316,872) | | 316,867 | | |
Other affiliated issuers (cost $10,450,483) | | 10,878,264 | | |
| | | | | |
| | | | | |
| Total Investment in Securities (cost $10,896,659) | | | $ | 11,330,844 |
| Cash | | | | 7,105 |
| Receivable for fund shares sold | | | | 5,928 |
| Distributions receivable from Fidelity Central Funds | | | | 1,379 |
Total assets | | | | 11,345,256 |
| Liabilities | | | | |
| Payable for investments purchased | $ | 5,728 | | |
| Payable for fund shares redeemed | | 2 | | |
| Accrued management fee | | 929 | | |
| Distribution and service plan fees payable | | 44 | | |
| Total liabilities | | | | 6,703 |
| Net Assets | | | $ | 11,338,553 |
| Net Assets consist of: | | | | |
| Paid in capital | | | $ | 10,824,444 |
| Total accumulated earnings (loss) | | | | 514,109 |
| Net Assets | | | $ | 11,338,553 |
| | | | | |
| Net Asset Value and Maximum Offering Price | | | | |
| Service Class : | | | | |
Net Asset Value, offering price and redemption price per share ($353,686 ÷ 33,300 shares) | | | $ | 10.62 |
| Service Class 2 : | | | | |
Net Asset Value, offering price and redemption price per share ($353,410 ÷ 33,300 shares) | | | $ | 10.61 |
| Investor Class : | | | | |
Net Asset Value, offering price and redemption price per share ($10,631,457 ÷ 1,001,134 shares) | | | $ | 10.62 |
| Statement of Operations |
| | | | Six months ended June 30, 2024 (Unaudited) |
| Investment Income | | | | |
| Dividends: | | | | |
| Unaffiliated issuers | | | $ | 400 |
| Affiliated issuers | | | | 84,973 |
| Income from Fidelity Central Funds | | | | 6,262 |
| Total income | | | | 91,635 |
| Expenses | | | | |
| Management fee | $ | 6,627 | | |
| Distribution and service plan fees | | 606 | | |
| Independent trustees' fees and expenses | | 10 | | |
| Miscellaneous | | 11 | | |
| Total expenses before reductions | | 7,254 | | |
| Expense reductions | | (2,623) | | |
| Total expenses after reductions | | | | 4,631 |
| Net Investment income (loss) | | | | 87,004 |
| Realized and Unrealized Gain (Loss) | | | | |
| Net realized gain (loss) on: | | | | |
| Investment Securities: | | | | |
| Affiliated issuers | | 14,913 | | |
| Capital gain distributions from underlying funds: | | | | |
| Affiliated issuers | | 216 | | |
| Total net realized gain (loss) | | | | 15,129 |
| Change in net unrealized appreciation (depreciation) on: | | | | |
| Investment Securities: | | | | |
| Unaffiliated issuers | | 6,409 | | |
| Fidelity Central Funds | | (5) | | |
| Other affiliated issuers | | 219,739 | | |
| Total change in net unrealized appreciation (depreciation) | | | | 226,143 |
| Net gain (loss) | | | | 241,272 |
| Net increase (decrease) in net assets resulting from operations | | | $ | 328,276 |
| Statement of Changes in Net Assets |
| |
| | Six months ended June 30, 2024 (Unaudited) | | For the period April 13, 2023 (commencement of operations) through December 31, 2023 |
| Increase (Decrease) in Net Assets | | | | |
| Operations | | | | |
| Net investment income (loss) | $ | 87,004 | $ | 123,789 |
| Net realized gain (loss) | | 15,129 | | (15,573) |
| Change in net unrealized appreciation (depreciation) | | 226,143 | | 208,042 |
| Net increase (decrease) in net assets resulting from operations | | 328,276 | | 316,258 |
| Distributions to shareholders | | (5,990) | | (124,436) |
| | | | | |
| Share transactions - net increase (decrease) | | 4,809,651 | | 6,014,794 |
| Total increase (decrease) in net assets | | 5,131,937 | | 6,206,616 |
| | | | | |
| Net Assets | | | | |
| Beginning of period | | 6,206,616 | | - |
| End of period | $ | 11,338,553 | $ | 6,206,616 |
| | | | | |
| | | | | |
Financial Highlights
VIP FundsManager® 30% Portfolio Service Class |
| |
| | Six months ended (Unaudited) June 30, 2024 | | Years ended December 31, 2023 A |
Selected Per-Share Data | | | | |
| Net asset value, beginning of period | $ | 10.27 | $ | 10.00 |
| Income from Investment Operations | | | | |
Net investment income (loss) B,C | | .10 | | .36 |
| Net realized and unrealized gain (loss) | | .26 | | .12 |
| Total from investment operations | | .36 | | .48 |
| Distributions from net investment income | | - | | (.21) |
| Distributions from net realized gain | | (.01) | | - |
| Total distributions | | (.01) | | (.21) |
| Net asset value, end of period | $ | 10.62 | $ | 10.27 |
Total Return D,E,F | | | | 4.80% |
Ratios to Average Net Assets C,G,H | | | | |
| Expenses before reductions | | .25% I,J | | .25% J |
| Expenses net of fee waivers, if any | | | | .10% J |
| Expenses net of all reductions | | .10% I,J | | .09% J |
| Net investment income (loss) | | 1.97% I,J | | 5.05% J |
| Supplemental Data | | | | |
| Net assets, end of period (000 omitted) | $ | 354 | $ | 342 |
Portfolio turnover rate K | | | | 29% J |
AFor the period April 13, 2023 (commencement of operations) through December 31, 2023.
BCalculated based on average shares outstanding during the period.
CNet investment income (loss) is affected by the timing of the declaration of dividends by any underlying mutual funds or exchange-traded funds (ETFs). Net investment income (loss) of any mutual funds or ETFs is not included in the Fund's net investment income (loss) ratio.
DTotal returns for periods of less than one year are not annualized.
ETotal returns do not reflect charges attributable to your insurance company's separate account. Inclusion of these charges would reduce the total returns shown.
FTotal returns would have been lower if certain expenses had not been reduced during the applicable periods shown.
GFees and expenses of any underlying mutual funds or exchange-traded funds (ETFs) are not included in the Fund's expense ratio. The Fund indirectly bears its proportionate share of these expenses. For additional expense information related to investments in Fidelity Central Funds, please refer to the "Investments in Fidelity Central Funds" note found in the Notes to Financial Statements section of the most recent Annual or Semi-Annual report.
HExpense ratios reflect operating expenses of the class. Expenses before reductions do not reflect amounts reimbursed, waived, or reduced through arrangements with the investment adviser, brokerage services, or other offset arrangements, if applicable, and do not represent the amount paid by the class during periods when reimbursements, waivers or reductions occur.
IProxy expenses are not annualized.
JAnnualized.
KAmount does not include the portfolio activity of any underlying mutual funds or exchange-traded funds (ETFs).
VIP FundsManager® 30% Portfolio Service Class 2 |
| |
| | Six months ended (Unaudited) June 30, 2024 | | Years ended December 31, 2023 A |
Selected Per-Share Data | | | | |
| Net asset value, beginning of period | $ | 10.27 | $ | 10.00 |
| Income from Investment Operations | | | | |
Net investment income (loss) B,C | | .09 | | .35 |
| Net realized and unrealized gain (loss) | | .26 | | .12 |
| Total from investment operations | | .35 | | .47 |
| Distributions from net investment income | | - | | (.20) |
| Distributions from net realized gain | | (.01) | | - |
| Total distributions | | (.01) | | (.20) |
| Net asset value, end of period | $ | 10.61 | $ | 10.27 |
Total Return D,E,F | | | | 4.69% |
Ratios to Average Net Assets C,G,H | | | | |
| Expenses before reductions | | .40% I,J | | .40% I |
| Expenses net of fee waivers, if any | | | | .25% I |
| Expenses net of all reductions | | .25% I,J | | .24% I |
| Net investment income (loss) | | 1.82% I,J | | 4.90% I |
| Supplemental Data | | | | |
| Net assets, end of period (000 omitted) | $ | 353 | $ | 342 |
Portfolio turnover rate K | | | | 29% I |
AFor the period April 13, 2023 (commencement of operations) through December 31, 2023.
BCalculated based on average shares outstanding during the period.
CNet investment income (loss) is affected by the timing of the declaration of dividends by any underlying mutual funds or exchange-traded funds (ETFs). Net investment income (loss) of any mutual funds or ETFs is not included in the Fund's net investment income (loss) ratio.
DTotal returns for periods of less than one year are not annualized.
ETotal returns do not reflect charges attributable to your insurance company's separate account. Inclusion of these charges would reduce the total returns shown.
FTotal returns would have been lower if certain expenses had not been reduced during the applicable periods shown.
GFees and expenses of any underlying mutual funds or exchange-traded funds (ETFs) are not included in the Fund's expense ratio. The Fund indirectly bears its proportionate share of these expenses. For additional expense information related to investments in Fidelity Central Funds, please refer to the "Investments in Fidelity Central Funds" note found in the Notes to Financial Statements section of the most recent Annual or Semi-Annual report.
HExpense ratios reflect operating expenses of the class. Expenses before reductions do not reflect amounts reimbursed, waived, or reduced through arrangements with the investment adviser, brokerage services, or other offset arrangements, if applicable, and do not represent the amount paid by the class during periods when reimbursements, waivers or reductions occur.
IAnnualized.
JProxy expenses are not annualized.
KAmount does not include the portfolio activity of any underlying mutual funds or exchange-traded funds (ETFs).
VIP FundsManager® 30% Portfolio Investor Class |
| |
| | Six months ended (Unaudited) June 30, 2024 | | Years ended December 31, 2023 A |
Selected Per-Share Data | | | | |
| Net asset value, beginning of period | $ | 10.27 | $ | 10.00 |
| Income from Investment Operations | | | | |
Net investment income (loss) B,C | | .10 | | .36 |
| Net realized and unrealized gain (loss) | | .26 | | .12 |
| Total from investment operations | | .36 | | .48 |
| Distributions from net investment income | | - | | (.21) |
| Distributions from net realized gain | | (.01) | | - |
| Total distributions | | (.01) | | (.21) |
| Net asset value, end of period | $ | 10.62 | $ | 10.27 |
Total Return D,E,F | | | | 4.80% |
Ratios to Average Net Assets C,G,H | | | | |
| Expenses before reductions | | .15% I,J | | .15% I |
| Expenses net of fee waivers, if any | | | | .10% I |
| Expenses net of all reductions | | .10% I,J | | .09% I |
| Net investment income (loss) | | 1.97% I,J | | 5.05% I |
| Supplemental Data | | | | |
| Net assets, end of period (000 omitted) | $ | 10,631 | $ | 5,523 |
Portfolio turnover rate K | | | | 29% I |
AFor the period April 13, 2023 (commencement of operations) through December 31, 2023.
BCalculated based on average shares outstanding during the period.
CNet investment income (loss) is affected by the timing of the declaration of dividends by any underlying mutual funds or exchange-traded funds (ETFs). Net investment income (loss) of any mutual funds or ETFs is not included in the Fund's net investment income (loss) ratio.
DTotal returns for periods of less than one year are not annualized.
ETotal returns do not reflect charges attributable to your insurance company's separate account. Inclusion of these charges would reduce the total returns shown.
FTotal returns would have been lower if certain expenses had not been reduced during the applicable periods shown.
GFees and expenses of any underlying mutual funds or exchange-traded funds (ETFs) are not included in the Fund's expense ratio. The Fund indirectly bears its proportionate share of these expenses. For additional expense information related to investments in Fidelity Central Funds, please refer to the "Investments in Fidelity Central Funds" note found in the Notes to Financial Statements section of the most recent Annual or Semi-Annual report.
HExpense ratios reflect operating expenses of the class. Expenses before reductions do not reflect amounts reimbursed, waived, or reduced through arrangements with the investment adviser, brokerage services, or other offset arrangements, if applicable, and do not represent the amount paid by the class during periods when reimbursements, waivers or reductions occur.
IAnnualized.
JProxy expenses are not annualized.
KAmount does not include the portfolio activity of any underlying mutual funds or exchange-traded funds (ETFs).
VIP FundsManager® 40% Portfolio
Schedule of Investments June 30, 2024 (Unaudited)
Showing Percentage of Net Assets
| Equity Funds - 44.6% |
| | | Shares | Value ($) |
| Fidelity Canada Fund (a) | | 1,695 | 112,991 |
| Fidelity Commodity Strategy Fund (a) | | 914 | 86,872 |
| Fidelity Contrafund (a) | | 10,911 | 220,396 |
| Fidelity Emerging Markets Discovery Fund (a) | | 5,094 | 85,176 |
| Fidelity Emerging Markets Fund (a) | | 20,548 | 815,566 |
| Fidelity Enhanced International ETF (a) | | 3,670 | 104,008 |
| Fidelity Enhanced Mid Cap ETF (a) | | 1,340 | 39,463 |
| Fidelity Enhanced Small Cap ETF (a) | | 1,916 | 55,746 |
| Fidelity Hedged Equity Fund (a) | | 18,431 | 228,549 |
| Fidelity Infrastructure Fund (a) | | 1,456 | 18,421 |
| Fidelity International Capital Appreciation Fund (a) | | 6,701 | 192,196 |
| Fidelity International Discovery Fund (a) | | 5,121 | 255,646 |
| Fidelity International Small Cap Fund (a) | | 2,899 | 93,500 |
| Fidelity International Small Cap Opportunities Fund (a) | | 6,176 | 122,907 |
| Fidelity International Value Fund (a) | | 11,971 | 126,298 |
| Fidelity Japan Smaller Companies Fund (a) | | 2,856 | 44,985 |
| Fidelity Low-Priced Stock Fund (a) | | 4,477 | 209,550 |
| Fidelity Overseas Fund (a) | | 14,438 | 940,228 |
| Fidelity Real Estate Investment Portfolio (a) | | 2,339 | 87,370 |
| iShares Core S&P 500 ETF | | 418 | 228,742 |
| VIP Stock Selector All Cap Portfolio Investor Class (a) | | 344,376 | 3,912,113 |
| TOTAL EQUITY FUNDS (Cost $7,022,995) | | | 7,980,723 |
| | | | |
| Fixed-Income Funds - 44.5% |
| | | Shares | Value ($) |
| Fidelity Floating Rate High Income Fund (a) | | 23,124 | 214,127 |
| Fidelity High Income Fund (a) | | 17,355 | 133,460 |
| Fidelity Inflation-Protected Bond Index Fund (a) | | 19,495 | 177,600 |
| Fidelity Long-Term Treasury Bond Index Fund (a) | | 9,446 | 89,644 |
| Fidelity Total Bond Fund (a) | | 390,686 | 3,672,446 |
| VIP Investment Grade Bond II Portfolio Investor Class (a) | | 389,891 | 3,672,770 |
| TOTAL FIXED-INCOME FUNDS (Cost $7,896,028) | | | 7,960,047 |
| | | | |
| Money Market Funds - 10.7% |
| | | Shares | Value ($) |
| Fidelity Cash Central Fund 5.38% (b) | | 445,312 | 445,401 |
| Fidelity Investments Money Market Government Portfolio Institutional Class 5.25% (a)(c) | | 1,480,412 | 1,480,412 |
| TOTAL MONEY MARKET FUNDS (Cost $1,925,813) | | | 1,925,813 |
| | | | |
| TOTAL INVESTMENT IN SECURITIES - 99.8% (Cost $16,844,836) | 17,866,583 |
NET OTHER ASSETS (LIABILITIES) - 0.2% | 33,074 |
| NET ASSETS - 100.0% | 17,899,657 |
| | |
Security Type Abbreviations
Legend
| (b) | Affiliated fund that is generally available only to investment companies and other accounts managed by Fidelity Investments. The rate quoted is the annualized seven-day yield of the fund at period end. A complete unaudited listing of the fund's holdings as of its most recent quarter end is available upon request. In addition, each Fidelity Central Fund's financial statements are available on the SEC's website or upon request. |
| (c) | The rate quoted is the annualized seven-day yield of the fund at period end. |
Affiliated Central Funds
Fiscal year to date information regarding the Fund's investments in Fidelity Central Funds, including the ownership percentage, is presented below.
| Affiliate | Value, beginning of period ($) | Purchases ($) | Sales Proceeds ($) | Dividend Income ($) | Realized Gain (loss) ($) | Change in Unrealized appreciation (depreciation) ($) | Value, end of period ($) | % ownership, end of period |
| Fidelity Cash Central Fund 5.38% | 361,973 | 579,249 | 495,821 | 11,827 | - | - | 445,401 | 0.0% |
| Total | 361,973 | 579,249 | 495,821 | 11,827 | - | - | 445,401 | |
| | | | | | | | | |
Amounts in the dividend income column in the above table include any capital gain distributions from underlying funds, which are presented in the corresponding line item in the Statement of Operations, if applicable.
Amounts included in the purchases and sales proceeds columns may include in-kind transactions, if applicable.
Affiliated Underlying Funds
Fiscal year to date information regarding the Fund's investments in affiliated Underlying Funds is presented below. Exchanges between classes of the same affiliated Underlying Funds may occur. If an Underlying Funds changes its name, the name presented below is the name in effect at period end.
| Affiliate | Value, beginning of period ($) | Purchases ($) | Sales Proceeds ($) | Dividend Income ($) | Realized Gain (loss) ($) | Change in Unrealized appreciation (depreciation) ($) | Value, end of period ($) |
| Fidelity Canada Fund | 92,774 | 26,490 | 9,536 | - | (8) | 3,271 | 112,991 |
| Fidelity Commodity Strategy Fund | 34,179 | 54,610 | 3,742 | - | (74) | 1,899 | 86,872 |
| Fidelity Contrafund | 67,494 | 144,829 | 15,679 | 58 | 642 | 23,110 | 220,396 |
| Fidelity Emerging Markets Discovery Fund | 61,146 | 26,248 | 3,763 | - | (35) | 1,580 | 85,176 |
| Fidelity Emerging Markets Fund | 538,540 | 237,345 | 33,684 | - | (8) | 73,373 | 815,566 |
| Fidelity Enhanced International ETF | 101,972 | - | 4,846 | 1,886 | 286 | 6,596 | 104,008 |
| Fidelity Enhanced Large Cap Value ETF | 50,532 | 1,418 | 55,668 | 452 | 6,612 | (2,894) | - |
| Fidelity Enhanced Mid Cap ETF | - | 40,312 | - | 103 | - | (849) | 39,463 |
| Fidelity Enhanced Small Cap ETF | - | 56,028 | - | 102 | - | (282) | 55,746 |
| Fidelity Equity-Income Fund | 171,765 | 29,652 | 215,287 | 611 | 20,250 | (6,380) | - |
| Fidelity Floating Rate High Income Fund | 173,552 | 50,691 | 9,171 | 8,084 | (20) | (925) | 214,127 |
| Fidelity Hedged Equity Fund | 176,581 | 48,536 | 19,427 | 51 | 46 | 22,813 | 228,549 |
| Fidelity High Income Fund | 70,573 | 68,700 | 6,601 | 3,257 | (14) | 802 | 133,460 |
| Fidelity Inflation-Protected Bond Index Fund | 197,736 | 49,691 | 71,012 | 364 | (1,603) | 2,788 | 177,600 |
| Fidelity Infrastructure Fund | 15,849 | 4,673 | 2,742 | 41 | (19) | 660 | 18,421 |
| Fidelity International Capital Appreciation Fund | 152,413 | 42,177 | 15,650 | - | 93 | 13,163 | 192,196 |
| Fidelity International Discovery Fund | 194,653 | 55,229 | 20,411 | - | 291 | 25,884 | 255,646 |
| Fidelity International Small Cap Fund | 77,370 | 21,705 | 7,881 | - | 9 | 2,297 | 93,500 |
| Fidelity International Small Cap Opportunities Fund | 105,280 | 28,707 | 10,524 | - | (40) | (516) | 122,907 |
| Fidelity International Value Fund | 100,119 | 28,707 | 10,416 | - | 53 | 7,835 | 126,298 |
| Fidelity Investments Money Market Government Portfolio Institutional Class 5.25% | 1,184,335 | 370,337 | 74,260 | 35,004 | - | - | 1,480,412 |
| Fidelity Japan Smaller Companies Fund | 35,527 | 9,884 | 2,211 | - | (34) | 1,819 | 44,985 |
| Fidelity Long-Term Treasury Bond Index Fund | 102,252 | 28,910 | 36,316 | 1,473 | 750 | (5,952) | 89,644 |
| Fidelity Low-Priced Stock Fund | 212,603 | 68,620 | 87,025 | - | 631 | 14,721 | 209,550 |
| Fidelity Overseas Fund | 744,759 | 208,148 | 76,771 | - | 557 | 63,535 | 940,228 |
| Fidelity Real Estate Investment Portfolio | 73,537 | 20,100 | 4,421 | 332 | (255) | (1,591) | 87,370 |
| Fidelity Total Bond Fund | 2,970,224 | 944,492 | 181,585 | 71,847 | (2,798) | (57,887) | 3,672,446 |
| Fidelity U.S. Low Volatility Equity Fund | 139,787 | 5,912 | 149,517 | - | 8,081 | (4,263) | - |
| Fidelity Value Discovery Fund | 93,104 | 15,939 | 114,395 | - | 7,688 | (2,336) | - |
| VIP Investment Grade Bond II Portfolio Investor Class | 2,963,153 | 898,557 | 181,585 | 2,033 | (2,709) | (4,646) | 3,672,770 |
| VIP Stock Selector All Cap Portfolio Investor Class | 2,858,677 | 982,339 | 271,129 | - | 1,281 | 340,945 | 3,912,113 |
| | 13,760,486 | 4,568,986 | 1,695,255 | 125,698 | 39,653 | 518,570 | 17,192,440 |
Amounts in the dividend income column in the above table include any capital gain distributions from underlying funds, which are presented in the corresponding line item in the Statement of Operations, if applicable.
Amounts included in the purchases and sales proceeds columns may include in-kind transactions, if applicable.
Investment Valuation
The following is a summary of the inputs used, as of June 30, 2024, involving the Fund's assets and liabilities carried at fair value. The inputs or methodology used for valuing securities may not be an indication of the risk associated with investing in those securities. For more information on valuation inputs, and their aggregation into the levels used below, please refer to the Investment Valuation section in the accompanying Notes to Financial Statements.
| Valuation Inputs at Reporting Date: |
| Description | Total ($) | Level 1 ($) | Level 2 ($) | Level 3 ($) |
Investments in Securities: | | | | |
|
| Equity Funds | 7,980,723 | 7,980,723 | - | - |
|
| Fixed-Income Funds | 7,960,047 | 7,960,047 | - | - |
|
| Money Market Funds | 1,925,813 | 1,925,813 | - | - |
| Total Investments in Securities: | 17,866,583 | 17,866,583 | - | - |
VIP FundsManager® 40% Portfolio
Financial Statements (Unaudited)
| Statement of Assets and Liabilities |
| | | | June 30, 2024 (Unaudited) |
| | | | | |
| Assets | | | | |
| Investment in securities, at value - See accompanying schedule: | | | | |
Unaffiliated issuers (cost $217,531) | $ | 228,742 | | |
Fidelity Central Funds (cost $445,401) | | 445,401 | | |
Other affiliated issuers (cost $16,181,904) | | 17,192,440 | | |
| | | | | |
| | | | | |
| Total Investment in Securities (cost $16,844,836) | | | $ | 17,866,583 |
| Cash | | | | 32,512 |
| Receivable for fund shares sold | | | | 3,894 |
| Distributions receivable from Fidelity Central Funds | | | | 1,969 |
Total assets | | | | 17,904,958 |
| Liabilities | | | | |
| Payable for investments purchased | $ | 3,762 | | |
| Payable for fund shares redeemed | | 6 | | |
| Accrued management fee | | 1,488 | | |
| Distribution and service plan fees payable | | 45 | | |
| Total liabilities | | | | 5,301 |
| Net Assets | | | $ | 17,899,657 |
| Net Assets consist of: | | | | |
| Paid in capital | | | $ | 16,730,863 |
| Total accumulated earnings (loss) | | | | 1,168,794 |
| Net Assets | | | $ | 17,899,657 |
| | | | | |
| Net Asset Value and Maximum Offering Price | | | | |
| Service Class : | | | | |
Net Asset Value, offering price and redemption price per share ($361,406 ÷ 33,300 shares) | | | $ | 10.85 |
| Service Class 2 : | | | | |
Net Asset Value, offering price and redemption price per share ($361,121 ÷ 33,300 shares) | | | $ | 10.84 |
| Investor Class : | | | | |
Net Asset Value, offering price and redemption price per share ($17,177,130 ÷ 1,583,057 shares) | | | $ | 10.85 |
| Statement of Operations |
| | | | Six months ended June 30, 2024 (Unaudited) |
| Investment Income | | | | |
| Dividends: | | | | |
| Unaffiliated issuers | | | $ | 674 |
| Affiliated issuers | | | | 125,047 |
| Income from Fidelity Central Funds | | | | 11,827 |
| Total income | | | | 137,548 |
| Expenses | | | | |
| Management fee | $ | 12,074 | | |
| Distribution and service plan fees | | 617 | | |
| Independent trustees' fees and expenses | | 20 | | |
| Miscellaneous | | 13 | | |
| Total expenses before reductions | | 12,724 | | |
| Expense reductions | | (4,452) | | |
| Total expenses after reductions | | | | 8,272 |
| Net Investment income (loss) | | | | 129,276 |
| Realized and Unrealized Gain (Loss) | | | | |
| Net realized gain (loss) on: | | | | |
| Investment Securities: | | | | |
| Unaffiliated issuers | | 181 | | |
| Affiliated issuers | | 39,653 | | |
| Capital gain distributions from underlying funds: | | | | |
| Affiliated issuers | | 651 | | |
| Total net realized gain (loss) | | | | 40,485 |
| Change in net unrealized appreciation (depreciation) on: | | | | |
| Investment Securities: | | | | |
| Unaffiliated issuers | | 11,211 | | |
| Affiliated issuers | | 518,570 | | |
| Total change in net unrealized appreciation (depreciation) | | | | 529,781 |
| Net gain (loss) | | | | 570,266 |
| Net increase (decrease) in net assets resulting from operations | | | $ | 699,542 |
| Statement of Changes in Net Assets |
| |
| | Six months ended June 30, 2024 (Unaudited) | | For the period April 13, 2023 (commencement of operations) through December 31, 2023 |
| Increase (Decrease) in Net Assets | | | | |
| Operations | | | | |
| Net investment income (loss) | $ | 129,276 | $ | 197,508 |
| Net realized gain (loss) | | 40,485 | | 438 |
| Change in net unrealized appreciation (depreciation) | | 529,781 | | 491,966 |
| Net increase (decrease) in net assets resulting from operations | | 699,542 | | 689,912 |
| Distributions to shareholders | | (18,870) | | (201,791) |
| | | | | |
| Share transactions - net increase (decrease) | | 3,096,049 | | 13,634,815 |
| Total increase (decrease) in net assets | | 3,776,721 | | 14,122,936 |
| | | | | |
| Net Assets | | | | |
| Beginning of period | | 14,122,936 | | - |
| End of period | $ | 17,899,657 | $ | 14,122,936 |
| | | | | |
| | | | | |
Financial Highlights
VIP FundsManager® 40% Portfolio Service Class |
| |
| | Six months ended (Unaudited) June 30, 2024 | | Years ended December 31, 2023 A |
Selected Per-Share Data | | | | |
| Net asset value, beginning of period | $ | 10.41 | $ | 10.00 |
| Income from Investment Operations | | | | |
Net investment income (loss) B,C | | .09 | | .39 |
| Net realized and unrealized gain (loss) | | .36 | | .17 |
| Total from investment operations | | .45 | | .56 |
| Distributions from net investment income | | - D | | (.15) |
| Distributions from net realized gain | | (.01) | | - D |
| Total distributions | | (.01) | | (.15) |
| Net asset value, end of period | $ | 10.85 | $ | 10.41 |
Total Return E,F,G | | | | 5.61% |
Ratios to Average Net Assets C,H,I | | | | |
| Expenses before reductions | | .25% J,K | | .25% J |
| Expenses net of fee waivers, if any | | | | .10% J |
| Expenses net of all reductions | | .10% J,K | | .10% J |
| Net investment income (loss) | | 1.61% J,K | | 5.41% J |
| Supplemental Data | | | | |
| Net assets, end of period (000 omitted) | $ | 361 | $ | 347 |
Portfolio turnover rate L | | | | 26% J |
AFor the period April 13, 2023 (commencement of operations) through December 31, 2023.
BCalculated based on average shares outstanding during the period.
CNet investment income (loss) is affected by the timing of the declaration of dividends by any underlying mutual funds or exchange-traded funds (ETFs). Net investment income (loss) of any mutual funds or ETFs is not included in the Fund's net investment income (loss) ratio.
DAmount represents less than $.005 per share.
ETotal returns for periods of less than one year are not annualized.
FTotal returns do not reflect charges attributable to your insurance company's separate account. Inclusion of these charges would reduce the total returns shown.
GTotal returns would have been lower if certain expenses had not been reduced during the applicable periods shown.
HFees and expenses of any underlying mutual funds or exchange-traded funds (ETFs) are not included in the Fund's expense ratio. The Fund indirectly bears its proportionate share of these expenses. For additional expense information related to investments in Fidelity Central Funds, please refer to the "Investments in Fidelity Central Funds" note found in the Notes to Financial Statements section of the most recent Annual or Semi-Annual report.
IExpense ratios reflect operating expenses of the class. Expenses before reductions do not reflect amounts reimbursed, waived, or reduced through arrangements with the investment adviser, brokerage services, or other offset arrangements, if applicable, and do not represent the amount paid by the class during periods when reimbursements, waivers or reductions occur.
JAnnualized.
KProxy expenses are not annualized.
LAmount does not include the portfolio activity of any underlying mutual funds or exchange-traded funds (ETFs).
VIP FundsManager® 40% Portfolio Service Class 2 |
| |
| | Six months ended (Unaudited) June 30, 2024 | | Years ended December 31, 2023 A |
Selected Per-Share Data | | | | |
| Net asset value, beginning of period | $ | 10.41 | $ | 10.00 |
| Income from Investment Operations | | | | |
Net investment income (loss) B,C | | .08 | | .38 |
| Net realized and unrealized gain (loss) | | .36 | | .17 |
| Total from investment operations | | .44 | | .55 |
| Distributions from net investment income | | - D | | (.14) |
| Distributions from net realized gain | | (.01) | | - D |
| Total distributions | | (.01) | | (.14) |
| Net asset value, end of period | $ | 10.84 | $ | 10.41 |
Total Return E,F,G | | | | 5.50% |
Ratios to Average Net Assets C,H,I | | | | |
| Expenses before reductions | | .40% J,K | | .40% J |
| Expenses net of fee waivers, if any | | | | .25% J |
| Expenses net of all reductions | | .25% J,K | | .25% J |
| Net investment income (loss) | | 1.46% J,K | | 5.26% J |
| Supplemental Data | | | | |
| Net assets, end of period (000 omitted) | $ | 361 | $ | 347 |
Portfolio turnover rate L | | | | 26% J |
AFor the period April 13, 2023 (commencement of operations) through December 31, 2023.
BCalculated based on average shares outstanding during the period.
CNet investment income (loss) is affected by the timing of the declaration of dividends by any underlying mutual funds or exchange-traded funds (ETFs). Net investment income (loss) of any mutual funds or ETFs is not included in the Fund's net investment income (loss) ratio.
DAmount represents less than $.005 per share.
ETotal returns for periods of less than one year are not annualized.
FTotal returns do not reflect charges attributable to your insurance company's separate account. Inclusion of these charges would reduce the total returns shown.
GTotal returns would have been lower if certain expenses had not been reduced during the applicable periods shown.
HFees and expenses of any underlying mutual funds or exchange-traded funds (ETFs) are not included in the Fund's expense ratio. The Fund indirectly bears its proportionate share of these expenses. For additional expense information related to investments in Fidelity Central Funds, please refer to the "Investments in Fidelity Central Funds" note found in the Notes to Financial Statements section of the most recent Annual or Semi-Annual report.
IExpense ratios reflect operating expenses of the class. Expenses before reductions do not reflect amounts reimbursed, waived, or reduced through arrangements with the investment adviser, brokerage services, or other offset arrangements, if applicable, and do not represent the amount paid by the class during periods when reimbursements, waivers or reductions occur.
JAnnualized.
KProxy expenses are not annualized.
LAmount does not include the portfolio activity of any underlying mutual funds or exchange-traded funds (ETFs).
VIP FundsManager® 40% Portfolio Investor Class |
| |
| | Six months ended (Unaudited) June 30, 2024 | | Years ended December 31, 2023 A |
Selected Per-Share Data | | | | |
| Net asset value, beginning of period | $ | 10.41 | $ | 10.00 |
| Income from Investment Operations | | | | |
Net investment income (loss) B,C | | .09 | | .39 |
| Net realized and unrealized gain (loss) | | .36 | | .17 |
| Total from investment operations | | .45 | | .56 |
| Distributions from net investment income | | - D | | (.15) |
| Distributions from net realized gain | | (.01) | | - D |
| Total distributions | | (.01) | | (.15) |
| Net asset value, end of period | $ | 10.85 | $ | 10.41 |
Total Return E,F,G | | | | 5.61% |
Ratios to Average Net Assets C,H,I | | | | |
| Expenses before reductions | | .15% J,K | | .15% J |
| Expenses net of fee waivers, if any | | | | .10% J |
| Expenses net of all reductions | | .10% J,K | | .10% J |
| Net investment income (loss) | | 1.61% J,K | | 5.41% J |
| Supplemental Data | | | | |
| Net assets, end of period (000 omitted) | $ | 17,177 | $ | 13,430 |
Portfolio turnover rate L | | | | 26% J |
AFor the period April 13, 2023 (commencement of operations) through December 31, 2023.
BCalculated based on average shares outstanding during the period.
CNet investment income (loss) is affected by the timing of the declaration of dividends by any underlying mutual funds or exchange-traded funds (ETFs). Net investment income (loss) of any mutual funds or ETFs is not included in the Fund's net investment income (loss) ratio.
DAmount represents less than $.005 per share.
ETotal returns for periods of less than one year are not annualized.
FTotal returns do not reflect charges attributable to your insurance company's separate account. Inclusion of these charges would reduce the total returns shown.
GTotal returns would have been lower if certain expenses had not been reduced during the applicable periods shown.
HFees and expenses of any underlying mutual funds or exchange-traded funds (ETFs) are not included in the Fund's expense ratio. The Fund indirectly bears its proportionate share of these expenses. For additional expense information related to investments in Fidelity Central Funds, please refer to the "Investments in Fidelity Central Funds" note found in the Notes to Financial Statements section of the most recent Annual or Semi-Annual report.
IExpense ratios reflect operating expenses of the class. Expenses before reductions do not reflect amounts reimbursed, waived, or reduced through arrangements with the investment adviser, brokerage services, or other offset arrangements, if applicable, and do not represent the amount paid by the class during periods when reimbursements, waivers or reductions occur.
JAnnualized.
KProxy expenses are not annualized.
LAmount does not include the portfolio activity of any underlying mutual funds or exchange-traded funds (ETFs).
VIP FundsManager® 50% Portfolio
Schedule of Investments June 30, 2024 (Unaudited)
Showing Percentage of Net Assets
| Equity Funds - 57.0% |
| | | Shares | Value ($) |
| Fidelity Canada Fund (a) | | 369,454 | 24,635,181 |
| Fidelity Commodity Strategy Fund (a) | | 128,207 | 12,179,645 |
| Fidelity Contrafund (a) | | 3,162,998 | 63,892,567 |
| Fidelity Emerging Markets Discovery Fund (a) | | 2,733,865 | 45,710,220 |
| Fidelity Emerging Markets Fund (a) | | 6,045,444 | 239,943,683 |
| Fidelity Enhanced International ETF (a) | | 2,951,662 | 83,650,101 |
| Fidelity Enhanced Mid Cap ETF (a) | | 355,959 | 10,482,993 |
| Fidelity Enhanced Small Cap ETF (a) | | 509,150 | 14,813,719 |
| Fidelity Global Commodity Stock Fund (a) | | 323,835 | 6,220,874 |
| Fidelity Hedged Equity Fund (a) | | 4,338,694 | 53,799,806 |
| Fidelity Infrastructure Fund (a) | | 304,017 | 3,845,817 |
| Fidelity International Capital Appreciation Fund (a) | | 1,948,988 | 55,896,985 |
| Fidelity International Discovery Fund (a) | | 1,296,149 | 64,703,737 |
| Fidelity International Small Cap Fund (a) | | 865,313 | 27,906,337 |
| Fidelity International Small Cap Opportunities Fund (a) | | 2,109,290 | 41,974,871 |
| Fidelity International Value Fund (a) | | 4,475,968 | 47,221,465 |
| Fidelity Japan Smaller Companies Fund (a) | | 2,206,056 | 34,745,378 |
| Fidelity Low-Priced Stock Fund (a) | | 1,287,684 | 60,276,505 |
| Fidelity Overseas Fund (a) | | 4,134,099 | 269,212,510 |
| Fidelity Real Estate Investment Portfolio (a) | | 518,931 | 19,387,250 |
| iShares Core S&P 500 ETF | | 98,446 | 53,872,605 |
| VIP Stock Selector All Cap Portfolio Investor Class (a) | | 99,947,846 | 1,135,407,532 |
| TOTAL EQUITY FUNDS (Cost $1,951,725,680) | | | 2,369,779,781 |
| | | | |
| Fixed-Income Funds - 38.8% |
| | | Shares | Value ($) |
| Fidelity Floating Rate High Income Fund (a) | | 5,731,938 | 53,077,744 |
| Fidelity High Income Fund (a) | | 4,004,238 | 30,792,591 |
| Fidelity Inflation-Protected Bond Index Fund (a) | | 4,517,314 | 41,152,732 |
| Fidelity Long-Term Treasury Bond Index Fund (a) | | 2,205,662 | 20,931,730 |
| Fidelity New Markets Income Fund (a) | | 172,967 | 2,165,547 |
| Fidelity Total Bond Fund (a) | | 77,908,861 | 732,343,298 |
| VIP Investment Grade Bond II Portfolio Investor Class (a) | | 77,751,864 | 732,422,560 |
| TOTAL FIXED-INCOME FUNDS (Cost $1,666,791,654) | | | 1,612,886,202 |
| | | | |
| Money Market Funds - 4.1% |
| | | Shares | Value ($) |
Fidelity Cash Central Fund 5.38% (b) (Cost $171,437,086) | | 171,402,806 | 171,437,086 |
| | | | |
| U.S. Treasury Obligations - 0.1% |
| | | Principal Amount (c) | Value ($) |
U.S. Treasury Bills, yield at date of purchase 5.32% to 5.33% 7/25/24 to 8/1/24 (d) (Cost $5,998,099) | | 6,020,000 | 5,998,185 |
| | | | |
| TOTAL INVESTMENT IN SECURITIES - 100.0% (Cost $3,795,952,519) | 4,160,101,254 |
NET OTHER ASSETS (LIABILITIES) - 0.0% | 227,997 |
| NET ASSETS - 100.0% | 4,160,329,251 |
| | |
| Futures Contracts |
| | Number of contracts | Expiration Date | Notional Amount ($) | Value ($) | Unrealized Appreciation/ (Depreciation) ($) |
| Sold | | | | | |
| | | | | | |
| Equity Index Contracts | | | | | |
| ICE MSCI EAFE Index Contracts (United States) | 578 | Sep 2024 | 67,718,480 | (429,928) | (429,928) |
| ICE MSCI Emerging Markets Index Contracts (United States) | 523 | Sep 2024 | 28,456,430 | (76,382) | (76,382) |
| | | | | | |
| TOTAL FUTURES CONTRACTS | | | | | (506,310) |
| The notional amount of futures sold as a percentage of Net Assets is 2.3% |
For the period, the average monthly notional amount at value for futures contracts in the aggregate was $187,344,240.
Security Type Abbreviations
Legend
| (b) | Affiliated fund that is generally available only to investment companies and other accounts managed by Fidelity Investments. The rate quoted is the annualized seven-day yield of the fund at period end. A complete unaudited listing of the fund's holdings as of its most recent quarter end is available upon request. In addition, each Fidelity Central Fund's financial statements are available on the SEC's website or upon request. |
| (c) | Amount is stated in United States dollars unless otherwise noted. |
| (d) | Security or a portion of the security was pledged to cover margin requirements for futures contracts. At period end, the value of securities pledged amounted to $2,869,143. |
Affiliated Central Funds
Fiscal year to date information regarding the Fund's investments in Fidelity Central Funds, including the ownership percentage, is presented below.
| Affiliate | Value, beginning of period ($) | Purchases ($) | Sales Proceeds ($) | Dividend Income ($) | Realized Gain (loss) ($) | Change in Unrealized appreciation (depreciation) ($) | Value, end of period ($) | % ownership, end of period |
| Fidelity Cash Central Fund 5.38% | 44,968,450 | 264,922,923 | 138,454,396 | 2,253,734 | 110 | (1) | 171,437,086 | 0.3% |
| Total | 44,968,450 | 264,922,923 | 138,454,396 | 2,253,734 | 110 | (1) | 171,437,086 | |
| | | | | | | | | |
Amounts in the dividend income column in the above table include any capital gain distributions from underlying funds, which are presented in the corresponding line item in the Statement of Operations, if applicable.
Amounts included in the purchases and sales proceeds columns may include in-kind transactions, if applicable.
Affiliated Underlying Funds
Fiscal year to date information regarding the Fund's investments in affiliated Underlying Funds is presented below. Exchanges between classes of the same affiliated Underlying Funds may occur. If an Underlying Funds changes its name, the name presented below is the name in effect at period end.
| Affiliate | Value, beginning of period ($) | Purchases ($) | Sales Proceeds ($) | Dividend Income ($) | Realized Gain (loss) ($) | Change in Unrealized appreciation (depreciation) ($) | Value, end of period ($) |
| Fidelity Canada Fund | 27,692,105 | 67,006 | 4,016,522 | - | 40,012 | 852,580 | 24,635,181 |
| Fidelity Commodity Strategy Fund | 12,941,471 | 24,597 | 1,365,791 | - | (369,665) | 949,033 | 12,179,645 |
| Fidelity Contrafund | 13,207,708 | 48,760,620 | 3,344,829 | 10,175 | 742,058 | 4,527,010 | 63,892,567 |
| Fidelity Emerging Markets Discovery Fund | 47,220,532 | 41,228 | 2,322,893 | - | 137,789 | 633,564 | 45,710,220 |
| Fidelity Emerging Markets Fund | 236,045,565 | 370,629 | 20,925,200 | - | 1,241,176 | 23,211,513 | 239,943,683 |
| Fidelity Enhanced International ETF | 78,219,043 | - | - | 1,508,299 | - | 5,431,058 | 83,650,101 |
| Fidelity Enhanced Large Cap Value ETF | 22,919,966 | - | 24,670,905 | 222,797 | 7,020,127 | (5,269,188) | - |
| Fidelity Enhanced Mid Cap ETF | - | 10,708,564 | - | 27,409 | - | (225,571) | 10,482,993 |
| Fidelity Enhanced Small Cap ETF | - | 14,888,615 | - | 26,985 | - | (74,896) | 14,813,719 |
| Fidelity Equity-Income Fund | 41,261,275 | 222,657 | 44,513,449 | 138,955 | 10,905,346 | (7,875,829) | - |
| Fidelity Floating Rate High Income Fund | 55,502,687 | 2,322,010 | 4,518,998 | 2,236,476 | (38,714) | (189,241) | 53,077,744 |
| Fidelity Global Commodity Stock Fund | 6,466,383 | 12,672 | 703,590 | - | 282,336 | 163,073 | 6,220,874 |
| Fidelity Hedged Equity Fund | 54,975,688 | 14,857 | 7,377,817 | 14,858 | 1,430,090 | 4,756,988 | 53,799,806 |
| Fidelity High Income Fund | 21,961,088 | 11,556,926 | 2,929,059 | 848,933 | 2,976 | 200,660 | 30,792,591 |
| Fidelity Inflation-Protected Bond Index Fund | 72,138,790 | 218,442 | 31,338,074 | 106,850 | (2,289,945) | 2,423,519 | 41,152,732 |
| Fidelity Infrastructure Fund | 4,146,102 | 17,513 | 457,729 | 9,926 | 4,979 | 134,952 | 3,845,817 |
| Fidelity International Capital Appreciation Fund | 57,661,205 | 106,522 | 6,391,575 | - | 1,613,537 | 2,907,296 | 55,896,985 |
| Fidelity International Discovery Fund | 65,215,973 | 139,845 | 8,379,052 | - | 48,148 | 7,678,823 | 64,703,737 |
| Fidelity International Small Cap Fund | 30,326,894 | 54,935 | 3,286,536 | - | 652,614 | 158,430 | 27,906,337 |
| Fidelity International Small Cap Opportunities Fund | 42,049,904 | 72,450 | - | - | - | (147,483) | 41,974,871 |
| Fidelity International Value Fund | 48,065,402 | 72,450 | 4,355,913 | - | 451,618 | 2,987,908 | 47,221,465 |
| Fidelity Japan Smaller Companies Fund | 33,245,260 | - | - | - | - | 1,500,118 | 34,745,378 |
| Fidelity Long-Term Treasury Bond Index Fund | 43,599,007 | 572,622 | 20,827,628 | 520,587 | (1,656,031) | (756,240) | 20,931,730 |
| Fidelity Low-Priced Stock Fund | 63,561,353 | 968,992 | 8,016,573 | - | 404,623 | 3,358,110 | 60,276,505 |
| Fidelity New Markets Income Fund | 10,153,254 | 202,738 | 8,231,524 | 195,486 | (1,407,954) | 1,449,033 | 2,165,547 |
| Fidelity Overseas Fund | 278,927,160 | 527,177 | 31,571,364 | - | 8,514,086 | 12,815,451 | 269,212,510 |
| Fidelity Real Estate Investment Portfolio | 22,028,627 | 111,416 | 2,069,426 | 74,103 | (179,808) | (503,559) | 19,387,250 |
| Fidelity Total Bond Fund | 776,763,038 | 58,656,199 | 87,794,466 | 16,096,756 | (2,283,174) | (12,998,299) | 732,343,298 |
| Fidelity U.S. Low Volatility Equity Fund | 42,070,487 | 11,929 | 42,940,404 | - | 6,018,319 | (5,160,331) | - |
| Fidelity Value Discovery Fund | 24,469,106 | 46,155 | 25,786,957 | - | 8,190,312 | (6,918,616) | - |
| VIP Investment Grade Bond II Portfolio Investor Class | 770,369,855 | 53,387,988 | 87,794,163 | 490,009 | (3,123,875) | (417,245) | 732,422,560 |
| VIP Stock Selector All Cap Portfolio Investor Class | 1,294,325,367 | 2,076,431 | 289,827,541 | - | 25,699,523 | 103,133,752 | 1,135,407,532 |
| | 4,297,530,295 | 206,234,185 | 775,757,978 | 22,528,604 | 62,050,503 | 138,736,373 | 3,928,793,378 |
Amounts in the dividend income column in the above table include any capital gain distributions from underlying funds, which are presented in the corresponding line item in the Statement of Operations, if applicable.
Amounts included in the purchases and sales proceeds columns may include in-kind transactions, if applicable.
Investment Valuation
The following is a summary of the inputs used, as of June 30, 2024, involving the Fund's assets and liabilities carried at fair value. The inputs or methodology used for valuing securities may not be an indication of the risk associated with investing in those securities. For more information on valuation inputs, and their aggregation into the levels used below, please refer to the Investment Valuation section in the accompanying Notes to Financial Statements.
| Valuation Inputs at Reporting Date: |
| Description | Total ($) | Level 1 ($) | Level 2 ($) | Level 3 ($) |
Investments in Securities: | | | | |
|
| Equity Funds | 2,369,779,781 | 2,369,779,781 | - | - |
|
| Fixed-Income Funds | 1,612,886,202 | 1,612,886,202 | - | - |
|
| Money Market Funds | 171,437,086 | 171,437,086 | - | - |
|
| Other Short-Term Investments and Net Other Assets | 5,998,185 | - | 5,998,185 | - |
| Total Investments in Securities: | 4,160,101,254 | 4,154,103,069 | 5,998,185 | - |
Derivative Instruments: Liabilities | | | | |
Futures Contracts | (506,310) | (506,310) | - | - |
| Total Liabilities | (506,310) | (506,310) | - | - |
| Total Derivative Instruments: | (506,310) | (506,310) | - | - |
Value of Derivative Instruments
The following table is a summary of the Fund's value of derivative instruments by primary risk exposure as of June 30, 2024. For additional information on derivative instruments, please refer to the Derivative Instruments section in the accompanying Notes to Financial Statements.
Primary Risk Exposure / Derivative Type | Value |
| Asset ($) | Liability ($) |
| Equity Risk | | |
Futures Contracts (a) | 0 | (506,310) |
| Total Equity Risk | 0 | (506,310) |
| Total Value of Derivatives | 0 | (506,310) |
(a)Reflects gross cumulative appreciation (depreciation) on futures contracts as presented in the Schedule of Investments. In the Statement of Assets and Liabilities, the period end daily variation margin is included in receivable or payable for daily variation margin on futures contracts, and the net cumulative appreciation (depreciation) is included in Total accumulated earnings (loss).
VIP FundsManager® 50% Portfolio
Financial Statements (Unaudited)
| Statement of Assets and Liabilities |
| | | | June 30, 2024 (Unaudited) |
| | | | | |
| Assets | | | | |
| Investment in securities, at value - See accompanying schedule: | | | | |
Unaffiliated issuers (cost $57,527,689) | $ | 59,870,790 | | |
Fidelity Central Funds (cost $171,437,086) | | 171,437,086 | | |
Other affiliated issuers (cost $3,566,987,744) | | 3,928,793,378 | | |
| | | | | |
| | | | | |
| Total Investment in Securities (cost $3,795,952,519) | | | $ | 4,160,101,254 |
| Receivable for investments sold | | | | 1,727,590 |
| Receivable for fund shares sold | | | | 1,514 |
| Distributions receivable from Fidelity Central Funds | | | | 730,925 |
Total assets | | | | 4,162,561,283 |
| Liabilities | | | | |
| Payable for investments purchased | $ | 244 | | |
| Payable for fund shares redeemed | | 1,728,954 | | |
| Accrued management fee | | 348,047 | | |
| Distribution and service plan fees payable | | 10,007 | | |
| Payable for daily variation margin on futures contracts | | 144,780 | | |
| Total liabilities | | | | 2,232,032 |
| Net Assets | | | $ | 4,160,329,251 |
| Net Assets consist of: | | | | |
| Paid in capital | | | $ | 3,906,443,866 |
| Total accumulated earnings (loss) | | | | 253,885,385 |
| Net Assets | | | $ | 4,160,329,251 |
| | | | | |
| Net Asset Value and Maximum Offering Price | | | | |
| Service Class : | | | | |
Net Asset Value, offering price and redemption price per share ($55,859 ÷ 4,673 shares) | | | $ | 11.95 |
| Service Class 2 : | | | | |
Net Asset Value, offering price and redemption price per share ($79,557,006 ÷ 6,695,937 shares) | | | $ | 11.88 |
| Investor Class : | | | | |
Net Asset Value, offering price and redemption price per share ($4,080,716,386 ÷ 341,554,255 shares) | | | $ | 11.95 |
| Statement of Operations |
| | | | Six months ended June 30, 2024 (Unaudited) |
| Investment Income | | | | |
| Dividends: | | | | |
| Unaffiliated issuers | | | $ | 160,069 |
| Affiliated issuers | | | | 22,382,605 |
| Interest | | | | 230,700 |
| Income from Fidelity Central Funds | | | | 2,253,734 |
| Total income | | | | 25,027,108 |
| Expenses | | | | |
| Management fee | $ | 3,175,353 | | |
| Distribution and service plan fees | | 98,359 | | |
| Independent trustees' fees and expenses | | 5,724 | | |
| Total expenses before reductions | | 3,279,436 | | |
| Expense reductions | | (1,099,718) | | |
| Total expenses after reductions | | | | 2,179,718 |
| Net Investment income (loss) | | | | 22,847,390 |
| Realized and Unrealized Gain (Loss) | | | | |
| Net realized gain (loss) on: | | | | |
| Investment Securities: | | | | |
| Unaffiliated issuers | | (85,338) | | |
| Fidelity Central Funds | | 110 | | |
| Other affiliated issuers | | 62,050,503 | | |
| Foreign currency transactions | | 320 | | |
| Futures contracts | | (20,841,134) | | |
| Capital gain distributions from underlying funds: | | | | |
| Affiliated issuers | | 145,999 | | |
| Total net realized gain (loss) | | | | 41,270,460 |
| Change in net unrealized appreciation (depreciation) on: | | | | |
| Investment Securities: | | | | |
| Unaffiliated issuers | | 2,341,487 | | |
| Fidelity Central Funds | | (1) | | |
| Other affiliated issuers | | 138,736,373 | | |
| Futures contracts | | 7,610,758 | | |
| Total change in net unrealized appreciation (depreciation) | | | | 148,688,617 |
| Net gain (loss) | | | | 189,959,077 |
| Net increase (decrease) in net assets resulting from operations | | | $ | 212,806,467 |
| Statement of Changes in Net Assets |
| |
| | Six months ended June 30, 2024 (Unaudited) | | Year ended December 31, 2023 |
| Increase (Decrease) in Net Assets | | | | |
| Operations | | | | |
| Net investment income (loss) | $ | 22,847,390 | $ | 99,332,774 |
| Net realized gain (loss) | | 41,270,460 | | (59,183,170) |
| Change in net unrealized appreciation (depreciation) | | 148,688,617 | | 492,084,095 |
| Net increase (decrease) in net assets resulting from operations | | 212,806,467 | | 532,233,699 |
| Distributions to shareholders | | (2,627,149) | | (108,450,832) |
| | | | | |
| Share transactions - net increase (decrease) | | (401,606,880) | | (567,547,837) |
| Total increase (decrease) in net assets | | (191,427,562) | | (143,764,970) |
| | | | | |
| Net Assets | | | | |
| Beginning of period | | 4,351,756,813 | | 4,495,521,783 |
| End of period | $ | 4,160,329,251 | $ | 4,351,756,813 |
| | | | | |
| | | | | |
Financial Highlights
VIP FundsManager® 50% Portfolio Service Class |
| |
| | Six months ended (Unaudited) June 30, 2024 | | Years ended December 31, 2023 | | 2022 | | 2021 | | 2020 | | 2019 |
Selected Per-Share Data | | | | | | | | | | | | |
| Net asset value, beginning of period | $ | 11.37 | $ | 10.33 | $ | 14.51 | $ | 13.57 | $ | 12.28 | $ | 11.68 |
| Income from Investment Operations | | | | | | | | | | | | |
Net investment income (loss) A,B | | .06 | | .25 | | .21 | | .15 | | .14 | | .20 |
| Net realized and unrealized gain (loss) | | .53 | | 1.08 | | (2.00) | | 1.19 | | 1.55 | | 1.76 |
| Total from investment operations | | .59 | | 1.33 | | (1.79) | | 1.34 | | 1.69 | | 1.96 |
| Distributions from net investment income | | (.01) | | (.29) | | (.23) | | (.16) | | (.14) | | (.20) |
| Distributions from net realized gain | | - | | - | | (2.16) | | (.24) | | (.26) | | (1.15) |
| Total distributions | | (.01) | | (.29) | | (2.39) | | (.40) | | (.40) | | (1.36) C |
| Net asset value, end of period | $ | 11.95 | $ | 11.37 | $ | 10.33 | $ | 14.51 | $ | 13.57 | $ | 12.28 |
Total Return D,E,F | | | | 12.85% | | (13.91)% | | 10.01% | | 14.06% | | 17.89% |
Ratios to Average Net Assets B,G,H | | | | | | | | | | | | |
| Expenses before reductions | | .25% I | | .25% | | .30% | | .35% | | .35% | | .35% |
| Expenses net of fee waivers, if any | | | | .10% | | .15% | | .20% | | .20% | | .20% |
| Expenses net of all reductions | | .10% I | | .10% | | .15% | | .20% | | .20% | | .20% |
| Net investment income (loss) | | 1.08% I | | 2.26% | | 1.86% | | 1.10% | | 1.12% | | 1.68% |
| Supplemental Data | | | | | | | | | | | | |
| Net assets, end of period (000 omitted) | $ | 56 | $ | 53 | $ | 49 | $ | 69 | $ | 64 | $ | 58 |
Portfolio turnover rate J | | | | 14% | | 51% K | | 51% K | | 24% K | | 25% |
ACalculated based on average shares outstanding during the period.
BNet investment income (loss) is affected by the timing of the declaration of dividends by any underlying mutual funds or exchange-traded funds (ETFs). Net investment income (loss) of any mutual funds or ETFs is not included in the Fund's net investment income (loss) ratio.
CTotal distributions per share do not sum due to rounding.
DTotal returns for periods of less than one year are not annualized.
ETotal returns do not reflect charges attributable to your insurance company's separate account. Inclusion of these charges would reduce the total returns shown.
FTotal returns would have been lower if certain expenses had not been reduced during the applicable periods shown.
GFees and expenses of any underlying mutual funds or exchange-traded funds (ETFs) are not included in the Fund's expense ratio. The Fund indirectly bears its proportionate share of these expenses. For additional expense information related to investments in Fidelity Central Funds, please refer to the "Investments in Fidelity Central Funds" note found in the Notes to Financial Statements section of the most recent Annual or Semi-Annual report.
HExpense ratios reflect operating expenses of the class. Expenses before reductions do not reflect amounts reimbursed, waived, or reduced through arrangements with the investment adviser, brokerage services, or other offset arrangements, if applicable, and do not represent the amount paid by the class during periods when reimbursements, waivers or reductions occur.
IAnnualized.
JAmount does not include the portfolio activity of any underlying mutual funds or exchange-traded funds (ETFs).
KPortfolio turnover rate excludes securities received or delivered in-kind.
VIP FundsManager® 50% Portfolio Service Class 2 |
| |
| | Six months ended (Unaudited) June 30, 2024 | | Years ended December 31, 2023 | | 2022 | | 2021 | | 2020 | | 2019 |
Selected Per-Share Data | | | | | | | | | | | | |
| Net asset value, beginning of period | $ | 11.31 | $ | 10.28 | $ | 14.45 | $ | 13.51 | $ | 12.23 | $ | 11.64 |
| Income from Investment Operations | | | | | | | | | | | | |
Net investment income (loss) A,B | | .05 | | .23 | | .19 | | .13 | | .12 | | .18 |
| Net realized and unrealized gain (loss) | | .53 | | 1.07 | | (1.99) | | 1.18 | | 1.55 | | 1.75 |
| Total from investment operations | | .58 | | 1.30 | | (1.80) | | 1.31 | | 1.67 | | 1.93 |
| Distributions from net investment income | | (.01) | | (.27) | | (.21) | | (.14) | | (.13) | | (.19) |
| Distributions from net realized gain | | - | | - | | (2.16) | | (.24) | | (.26) | | (1.15) |
| Total distributions | | (.01) | | (.27) | | (2.37) | | (.37) C | | (.39) | | (1.34) |
| Net asset value, end of period | $ | 11.88 | $ | 11.31 | $ | 10.28 | $ | 14.45 | $ | 13.51 | $ | 12.23 |
Total Return D,E,F | | | | 12.65% | | (14.04)% | | 9.88% | | 13.89% | | 17.69% |
Ratios to Average Net Assets B,G,H | | | | | | | | | | | | |
| Expenses before reductions | | .40% I | | .40% | | .45% | | .50% | | .50% | | .50% |
| Expenses net of fee waivers, if any | | | | .25% | | .30% | | .35% | | .35% | | .35% |
| Expenses net of all reductions | | .25% I | | .25% | | .30% | | .35% | | .35% | | .35% |
| Net investment income (loss) | | .93% I | | 2.11% | | 1.71% | | .95% | | .97% | | 1.53% |
| Supplemental Data | | | | | | | | | | | | |
| Net assets, end of period (000 omitted) | $ | 79,557 | $ | 77,398 | $ | 75,580 | $ | 94,708 | $ | 114,211 | $ | 103,031 |
Portfolio turnover rate J | | | | 14% | | 51% K | | 51% K | | 24% K | | 25% |
ACalculated based on average shares outstanding during the period.
BNet investment income (loss) is affected by the timing of the declaration of dividends by any underlying mutual funds or exchange-traded funds (ETFs). Net investment income (loss) of any mutual funds or ETFs is not included in the Fund's net investment income (loss) ratio.
CTotal distributions per share do not sum due to rounding.
DTotal returns for periods of less than one year are not annualized.
ETotal returns do not reflect charges attributable to your insurance company's separate account. Inclusion of these charges would reduce the total returns shown.
FTotal returns would have been lower if certain expenses had not been reduced during the applicable periods shown.
GFees and expenses of any underlying mutual funds or exchange-traded funds (ETFs) are not included in the Fund's expense ratio. The Fund indirectly bears its proportionate share of these expenses. For additional expense information related to investments in Fidelity Central Funds, please refer to the "Investments in Fidelity Central Funds" note found in the Notes to Financial Statements section of the most recent Annual or Semi-Annual report.
HExpense ratios reflect operating expenses of the class. Expenses before reductions do not reflect amounts reimbursed, waived, or reduced through arrangements with the investment adviser, brokerage services, or other offset arrangements, if applicable, and do not represent the amount paid by the class during periods when reimbursements, waivers or reductions occur.
IAnnualized.
JAmount does not include the portfolio activity of any underlying mutual funds or exchange-traded funds (ETFs).
KPortfolio turnover rate excludes securities received or delivered in-kind.
VIP FundsManager® 50% Portfolio Investor Class |
| |
| | Six months ended (Unaudited) June 30, 2024 | | Years ended December 31, 2023 | | 2022 | | 2021 | | 2020 | | 2019 |
Selected Per-Share Data | | | | | | | | | | | | |
| Net asset value, beginning of period | $ | 11.37 | $ | 10.32 | $ | 14.50 | $ | 13.56 | $ | 12.28 | $ | 11.68 |
| Income from Investment Operations | | | | | | | | | | | | |
Net investment income (loss) A,B | | .06 | | .25 | | .21 | | .15 | | .14 | | .20 |
| Net realized and unrealized gain (loss) | | .53 | | 1.09 | | (2.00) | | 1.19 | | 1.54 | | 1.76 |
| Total from investment operations | | .59 | | 1.34 | | (1.79) | | 1.34 | | 1.68 | | 1.96 |
| Distributions from net investment income | | (.01) | | (.29) | | (.23) | | (.16) | | (.14) | | (.20) |
| Distributions from net realized gain | | - | | - | | (2.16) | | (.24) | | (.26) | | (1.15) |
| Total distributions | | (.01) | | (.29) | | (2.39) | | (.40) | | (.40) | | (1.36) C |
| Net asset value, end of period | $ | 11.95 | $ | 11.37 | $ | 10.32 | $ | 14.50 | $ | 13.56 | $ | 12.28 |
Total Return D,E,F | | | | 12.96% | | (13.94)% | | 10.02% | | 13.98% | | 17.89% |
Ratios to Average Net Assets B,G,H | | | | | | | | | | | | |
| Expenses before reductions | | .15% I | | .15% | | .20% | | .25% | | .25% | | .25% |
| Expenses net of fee waivers, if any | | | | .10% | | .15% | | .20% | | .20% | | .20% |
| Expenses net of all reductions | | .10% I | | .10% | | .15% | | .20% | | .20% | | .20% |
| Net investment income (loss) | | 1.08% I | | 2.26% | | 1.86% | | 1.10% | | 1.12% | | 1.68% |
| Supplemental Data | | | | | | | | | | | | |
| Net assets, end of period (000 omitted) | $ | 4,080,716 | $ | 4,274,306 | $ | 4,419,893 | $ | 5,887,190 | $ | 5,731,732 | $ | 5,630,795 |
Portfolio turnover rate J | | | | 14% | | 51% K | | 51% K | | 24% K | | 25% |
ACalculated based on average shares outstanding during the period.
BNet investment income (loss) is affected by the timing of the declaration of dividends by any underlying mutual funds or exchange-traded funds (ETFs). Net investment income (loss) of any mutual funds or ETFs is not included in the Fund's net investment income (loss) ratio.
CTotal distributions per share do not sum due to rounding.
DTotal returns for periods of less than one year are not annualized.
ETotal returns do not reflect charges attributable to your insurance company's separate account. Inclusion of these charges would reduce the total returns shown.
FTotal returns would have been lower if certain expenses had not been reduced during the applicable periods shown.
GFees and expenses of any underlying mutual funds or exchange-traded funds (ETFs) are not included in the Fund's expense ratio. The Fund indirectly bears its proportionate share of these expenses. For additional expense information related to investments in Fidelity Central Funds, please refer to the "Investments in Fidelity Central Funds" note found in the Notes to Financial Statements section of the most recent Annual or Semi-Annual report.
HExpense ratios reflect operating expenses of the class. Expenses before reductions do not reflect amounts reimbursed, waived, or reduced through arrangements with the investment adviser, brokerage services, or other offset arrangements, if applicable, and do not represent the amount paid by the class during periods when reimbursements, waivers or reductions occur.
IAnnualized.
JAmount does not include the portfolio activity of any underlying mutual funds or exchange-traded funds (ETFs).
KPortfolio turnover rate excludes securities received or delivered in-kind.
VIP FundsManager® 60% Portfolio
Schedule of Investments June 30, 2024 (Unaudited)
Showing Percentage of Net Assets
| Equity Funds - 64.2% |
| | | Shares | Value ($) |
| Fidelity Canada Fund (a) | | 728,134 | 48,551,958 |
| Fidelity Commodity Strategy Fund (a) | | 198,531 | 18,860,455 |
| Fidelity Contrafund (a) | | 6,085,109 | 122,919,200 |
| Fidelity Emerging Markets Discovery Fund (a) | | 3,161,459 | 52,859,592 |
| Fidelity Emerging Markets Fund (a) | | 11,276,871 | 447,578,996 |
| Fidelity Enhanced International ETF (a) | | 4,327,505 | 122,641,492 |
| Fidelity Enhanced Mid Cap ETF (a) | | 552,043 | 16,257,666 |
| Fidelity Enhanced Small Cap ETF (a) | | 789,622 | 22,974,052 |
| Fidelity Global Commodity Stock Fund (a) | | 562,449 | 10,804,654 |
| Fidelity Hedged Equity Fund (a) | | 6,878,336 | 85,291,368 |
| Fidelity Infrastructure Fund (a) | | 471,062 | 5,958,937 |
| Fidelity International Capital Appreciation Fund (a) | | 3,338,195 | 95,739,420 |
| Fidelity International Discovery Fund (a) | | 2,336,697 | 116,647,927 |
| Fidelity International Small Cap Fund (a) | | 1,555,039 | 50,150,019 |
| Fidelity International Small Cap Opportunities Fund (a) | | 3,109,867 | 61,886,358 |
| Fidelity International Value Fund (a) | | 7,215,671 | 76,125,325 |
| Fidelity Japan Smaller Companies Fund (a) | | 2,997,853 | 47,216,186 |
| Fidelity Low-Priced Stock Fund (a) | | 2,483,055 | 116,231,794 |
| Fidelity Overseas Fund (a) | | 7,146,824 | 465,401,158 |
| Fidelity Real Estate Investment Portfolio (a) | | 821,700 | 30,698,727 |
| iShares Core S&P 500 ETF | | 156,203 | 85,478,968 |
| VIP Stock Selector All Cap Portfolio Investor Class (a) | | 191,859,972 | 2,179,529,286 |
| TOTAL EQUITY FUNDS (Cost $3,548,038,916) | | | 4,279,803,538 |
| | | | |
| Fixed-Income Funds - 33.9% |
| | | Shares | Value ($) |
| Fidelity Floating Rate High Income Fund (a) | | 7,135,139 | 66,071,386 |
| Fidelity High Income Fund (a) | | 6,358,730 | 48,898,636 |
| Fidelity Inflation-Protected Bond Index Fund (a) | | 10,796,290 | 98,354,204 |
| Fidelity Long-Term Treasury Bond Index Fund (a) | | 3,516,730 | 33,373,768 |
| Fidelity New Markets Income Fund (a) | | 273,197 | 3,420,423 |
| Fidelity Total Bond Fund (a) | | 106,668,335 | 1,002,682,346 |
| VIP Investment Grade Bond II Portfolio Investor Class (a) | | 106,451,873 | 1,002,776,642 |
| TOTAL FIXED-INCOME FUNDS (Cost $2,326,061,984) | | | 2,255,577,405 |
| | | | |
| Money Market Funds - 1.9% |
| | | Shares | Value ($) |
Fidelity Cash Central Fund 5.38% (b) (Cost $123,967,917) | | 123,943,128 | 123,967,917 |
| | | | |
| U.S. Treasury Obligations - 0.0% |
| | | Principal Amount (c) | Value ($) |
U.S. Treasury Bills, yield at date of purchase 5.32% 8/1/24 (d) (Cost $796,385) | | 800,000 | 796,382 |
| | | | |
| TOTAL INVESTMENT IN SECURITIES - 100.0% (Cost $5,998,865,202) | 6,660,145,242 |
NET OTHER ASSETS (LIABILITIES) - 0.0% | (25,149) |
| NET ASSETS - 100.0% | 6,660,120,093 |
| | |
| Futures Contracts |
| | Number of contracts | Expiration Date | Notional Amount ($) | Value ($) | Unrealized Appreciation/ (Depreciation) ($) |
| Purchased | | | | | |
| | | | | | |
| Equity Index Contracts | | | | | |
| ICE MSCI EAFE Index Contracts (United States) | 235 | Sep 2024 | 27,532,600 | 147,550 | 147,550 |
| | | | | | |
| Sold | | | | | |
| | | | | | |
| Equity Index Contracts | | | | | |
| ICE MSCI Emerging Markets Index Contracts (United States) | 232 | Sep 2024 | 12,623,120 | (33,758) | (33,758) |
| | | | | | |
| TOTAL FUTURES CONTRACTS | | | | | 113,792 |
| The notional amount of futures purchased as a percentage of Net Assets is 0.4% |
| The notional amount of futures sold as a percentage of Net Assets is 0.2% |
Security Type Abbreviations
Legend
| (b) | Affiliated fund that is generally available only to investment companies and other accounts managed by Fidelity Investments. The rate quoted is the annualized seven-day yield of the fund at period end. A complete unaudited listing of the fund's holdings as of its most recent quarter end is available upon request. In addition, each Fidelity Central Fund's financial statements are available on the SEC's website or upon request. |
| (c) | Amount is stated in United States dollars unless otherwise noted. |
| (d) | Security or a portion of the security was pledged to cover margin requirements for futures contracts. At period end, the value of securities pledged amounted to $597,286. |
Affiliated Central Funds
Fiscal year to date information regarding the Fund's investments in Fidelity Central Funds, including the ownership percentage, is presented below.
| Affiliate | Value, beginning of period ($) | Purchases ($) | Sales Proceeds ($) | Dividend Income ($) | Realized Gain (loss) ($) | Change in Unrealized appreciation (depreciation) ($) | Value, end of period ($) | % ownership, end of period |
| Fidelity Cash Central Fund 5.38% | 70,860,946 | 272,841,300 | 219,734,342 | 2,970,614 | 13 | - | 123,967,917 | 0.2% |
| Total | 70,860,946 | 272,841,300 | 219,734,342 | 2,970,614 | 13 | - | 123,967,917 | |
| | | | | | | | | |
Amounts in the dividend income column in the above table include any capital gain distributions from underlying funds, which are presented in the corresponding line item in the Statement of Operations, if applicable.
Amounts included in the purchases and sales proceeds columns may include in-kind transactions, if applicable.
Affiliated Underlying Funds
Fiscal year to date information regarding the Fund's investments in affiliated Underlying Funds is presented below. Exchanges between classes of the same affiliated Underlying Funds may occur. If an Underlying Funds changes its name, the name presented below is the name in effect at period end.
| Affiliate | Value, beginning of period ($) | Purchases ($) | Sales Proceeds ($) | Dividend Income ($) | Realized Gain (loss) ($) | Change in Unrealized appreciation (depreciation) ($) | Value, end of period ($) |
| Fidelity Canada Fund | 48,951,193 | 1,728,319 | 3,770,348 | - | 4,815 | 1,637,979 | 48,551,958 |
| Fidelity Commodity Strategy Fund | 18,532,277 | 525,033 | 1,063,023 | - | (204,646) | 1,070,814 | 18,860,455 |
| Fidelity Contrafund | 65,614,917 | 42,509,982 | 3,629,904 | 52,740 | 202,227 | 18,221,978 | 122,919,200 |
| Fidelity Emerging Markets Discovery Fund | 53,057,223 | 1,073,490 | 2,184,582 | - | 112,908 | 800,553 | 52,859,592 |
| Fidelity Emerging Markets Fund | 412,943,178 | 9,642,453 | 19,629,321 | - | 680,316 | 43,942,370 | 447,578,996 |
| Fidelity Enhanced International ETF | 114,678,883 | - | - | 2,211,355 | - | 7,962,609 | 122,641,492 |
| Fidelity Enhanced Large Cap Value ETF | 55,696,110 | - | 59,950,938 | 541,404 | 15,678,232 | (11,423,404) | - |
| Fidelity Enhanced Mid Cap ETF | - | 16,607,496 | - | 42,507 | - | (349,830) | 16,257,666 |
| Fidelity Enhanced Small Cap ETF | - | 23,090,205 | - | 41,850 | - | (116,153) | 22,974,052 |
| Fidelity Equity-Income Fund | 132,961,011 | 2,497,885 | 145,695,235 | 474,787 | 30,951,817 | (20,715,478) | - |
| Fidelity Floating Rate High Income Fund | 64,998,244 | 4,044,466 | 2,686,728 | 2,708,145 | 3,585 | (288,181) | 66,071,386 |
| Fidelity Global Commodity Stock Fund | 10,317,289 | 270,471 | 547,618 | - | 57,414 | 707,098 | 10,804,654 |
| Fidelity Hedged Equity Fund | 80,398,853 | 21,729 | 4,396,095 | 21,729 | 811,802 | 8,455,079 | 85,291,368 |
| Fidelity High Income Fund | 32,325,105 | 18,539,848 | 2,283,355 | 1,306,580 | 4,554 | 312,484 | 48,898,636 |
| Fidelity Inflation-Protected Bond Index Fund | 121,283,345 | 3,178,445 | 26,716,223 | 200,863 | (1,790,625) | 2,399,262 | 98,354,204 |
| Fidelity Infrastructure Fund | 5,928,055 | 200,082 | 388,509 | 14,892 | 4,564 | 214,745 | 5,958,937 |
| Fidelity International Capital Appreciation Fund | 91,622,204 | 2,753,140 | 6,003,952 | - | 605,649 | 6,762,379 | 95,739,420 |
| Fidelity International Discovery Fund | 107,661,865 | 3,607,459 | 7,864,587 | - | (304,678) | 13,547,868 | 116,647,927 |
| Fidelity International Small Cap Fund | 50,410,321 | 1,420,234 | 3,093,878 | - | 150,333 | 1,263,009 | 50,150,019 |
| Fidelity International Small Cap Opportunities Fund | 60,236,982 | 1,874,732 | - | - | - | (225,356) | 61,886,358 |
| Fidelity International Value Fund | 72,956,733 | 1,874,733 | 4,078,962 | - | 242,159 | 5,130,662 | 76,125,325 |
| Fidelity Japan Smaller Companies Fund | 45,177,646 | - | - | - | - | 2,038,540 | 47,216,186 |
| Fidelity Long-Term Treasury Bond Index Fund | 73,850,609 | 1,796,900 | 38,458,073 | 824,038 | (2,792,208) | (1,023,460) | 33,373,768 |
| Fidelity Low-Priced Stock Fund | 148,840,987 | 4,358,685 | 47,051,290 | - | 141,116 | 9,942,296 | 116,231,794 |
| Fidelity New Markets Income Fund | 15,895,249 | 495,611 | 13,038,507 | 308,561 | (2,190,085) | 2,258,155 | 3,420,423 |
| Fidelity Overseas Fund | 446,263,974 | 13,598,190 | 29,655,211 | - | 2,188,379 | 33,005,826 | 465,401,158 |
| Fidelity Real Estate Investment Portfolio | 32,364,428 | 912,130 | 1,610,656 | 116,610 | (57,252) | (909,923) | 30,698,727 |
| Fidelity Total Bond Fund | 978,836,650 | 95,227,688 | 52,082,240 | 21,114,586 | 9,647 | (19,309,399) | 1,002,682,346 |
| Fidelity U.S. Low Volatility Equity Fund | 62,736,299 | 151,445 | 64,209,801 | - | 8,968,487 | (7,646,430) | - |
| Fidelity Value Discovery Fund | 63,921,110 | 1,113,705 | 68,520,772 | - | 17,043,659 | (13,557,702) | - |
| VIP Investment Grade Bond II Portfolio Investor Class | 971,144,091 | 87,537,605 | 52,082,153 | 626,265 | 125,221 | (3,948,122) | 1,002,776,642 |
| VIP Stock Selector All Cap Portfolio Investor Class | 1,915,137,612 | 163,211,292 | 105,270,573 | - | 2,241,739 | 204,209,216 | 2,179,529,286 |
| | 6,354,742,443 | 503,863,453 | 765,962,534 | 30,606,912 | 72,889,129 | 284,369,484 | 6,449,901,975 |
Amounts in the dividend income column in the above table include any capital gain distributions from underlying funds, which are presented in the corresponding line item in the Statement of Operations, if applicable.
Amounts included in the purchases and sales proceeds columns may include in-kind transactions, if applicable.
Investment Valuation
The following is a summary of the inputs used, as of June 30, 2024, involving the Fund's assets and liabilities carried at fair value. The inputs or methodology used for valuing securities may not be an indication of the risk associated with investing in those securities. For more information on valuation inputs, and their aggregation into the levels used below, please refer to the Investment Valuation section in the accompanying Notes to Financial Statements.
| Valuation Inputs at Reporting Date: |
| Description | Total ($) | Level 1 ($) | Level 2 ($) | Level 3 ($) |
Investments in Securities: | | | | |
|
| Equity Funds | 4,279,803,538 | 4,279,803,538 | - | - |
|
| Fixed-Income Funds | 2,255,577,405 | 2,255,577,405 | - | - |
|
| Money Market Funds | 123,967,917 | 123,967,917 | - | - |
|
| Other Short-Term Investments and Net Other Assets | 796,382 | - | 796,382 | - |
| Total Investments in Securities: | 6,660,145,242 | 6,659,348,860 | 796,382 | - |
Derivative Instruments: Assets | | | | |
Futures Contracts | 147,550 | 147,550 | - | - |
| Total Assets | 147,550 | 147,550 | - | - |
| Liabilities | | | | |
Futures Contracts | (33,758) | (33,758) | - | - |
| Total Liabilities | (33,758) | (33,758) | - | - |
| Total Derivative Instruments: | 113,792 | 113,792 | - | - |
Value of Derivative Instruments
The following table is a summary of the Fund's value of derivative instruments by primary risk exposure as of June 30, 2024. For additional information on derivative instruments, please refer to the Derivative Instruments section in the accompanying Notes to Financial Statements.
Primary Risk Exposure / Derivative Type | Value |
| Asset ($) | Liability ($) |
| Equity Risk | | |
Futures Contracts (a) | 147,550 | (33,758) |
| Total Equity Risk | 147,550 | (33,758) |
| Total Value of Derivatives | 147,550 | (33,758) |
(a)Reflects gross cumulative appreciation (depreciation) on futures contracts as presented in the Schedule of Investments. In the Statement of Assets and Liabilities, the period end daily variation margin is included in receivable or payable for daily variation margin on futures contracts, and the net cumulative appreciation (depreciation) is included in Total accumulated earnings (loss).
VIP FundsManager® 60% Portfolio
Financial Statements (Unaudited)
| Statement of Assets and Liabilities |
| | | | June 30, 2024 (Unaudited) |
| | | | | |
| Assets | | | | |
| Investment in securities, at value - See accompanying schedule: | | | | |
Unaffiliated issuers (cost $82,054,623) | $ | 86,275,350 | | |
Fidelity Central Funds (cost $123,967,917) | | 123,967,917 | | |
Other affiliated issuers (cost $5,792,842,662) | | 6,449,901,975 | | |
| | | | | |
| | | | | |
| Total Investment in Securities (cost $5,998,865,202) | | | $ | 6,660,145,242 |
| Cash | | | | 43,031 |
| Receivable for investments sold | | | | 3,094,049 |
| Receivable for fund shares sold | | | | 855,383 |
| Distributions receivable from Fidelity Central Funds | | | | 545,887 |
| Receivable for daily variation margin on futures contracts | | | | 14,400 |
Total assets | | | | 6,664,697,992 |
| Liabilities | | | | |
| Payable for investments purchased | $ | 146 | | |
| Payable for fund shares redeemed | | 3,949,424 | | |
| Accrued management fee | | 554,769 | | |
| Distribution and service plan fees payable | | 73,560 | | |
| Total liabilities | | | | 4,577,899 |
| Net Assets | | | $ | 6,660,120,093 |
| Net Assets consist of: | | | | |
| Paid in capital | | | $ | 6,036,589,383 |
| Total accumulated earnings (loss) | | | | 623,530,710 |
| Net Assets | | | $ | 6,660,120,093 |
| | | | | |
| Net Asset Value and Maximum Offering Price | | | | |
| Service Class : | | | | |
Net Asset Value, offering price and redemption price per share ($108,876,440 ÷ 10,583,055 shares) | | | $ | 10.29 |
| Service Class 2 : | | | | |
Net Asset Value, offering price and redemption price per share ($587,167,197 ÷ 57,339,871 shares) | | | $ | 10.24 |
| Investor Class : | | | | |
Net Asset Value, offering price and redemption price per share ($5,964,076,456 ÷ 579,726,182 shares) | | | $ | 10.29 |
| Statement of Operations |
| | | | Six months ended June 30, 2024 (Unaudited) |
| Investment Income | | | | |
| Dividends: | | | | |
| Unaffiliated issuers | | | $ | 253,911 |
| Affiliated issuers | | | | 30,095,612 |
| Interest | | | | 93,918 |
| Income from Fidelity Central Funds | | | | 2,970,614 |
| Total income | | | | 33,414,055 |
| Expenses | | | | |
| Management fee | $ | 4,900,185 | | |
| Distribution and service plan fees | | 780,310 | | |
| Independent trustees' fees and expenses | | 8,693 | | |
| Total expenses before reductions | | 5,689,188 | | |
| Expense reductions | | (1,978,870) | | |
| Total expenses after reductions | | | | 3,710,318 |
| Net Investment income (loss) | | | | 29,703,737 |
| Realized and Unrealized Gain (Loss) | | | | |
| Net realized gain (loss) on: | | | | |
| Investment Securities: | | | | |
| Unaffiliated issuers | | 318,408 | | |
| Fidelity Central Funds | | 13 | | |
| Other affiliated issuers | | 72,889,129 | | |
| Foreign currency transactions | | 467 | | |
| Futures contracts | | (4,740,609) | | |
| Capital gain distributions from underlying funds: | | | | |
| Affiliated issuers | | 511,300 | | |
| Total net realized gain (loss) | | | | 68,978,708 |
| Change in net unrealized appreciation (depreciation) on: | | | | |
| Investment Securities: | | | | |
| Unaffiliated issuers | | 4,219,798 | | |
| Affiliated issuers | | 284,369,484 | | |
| Futures contracts | | 1,370,962 | | |
| Total change in net unrealized appreciation (depreciation) | | | | 289,960,244 |
| Net gain (loss) | | | | 358,938,952 |
| Net increase (decrease) in net assets resulting from operations | | | $ | 388,642,689 |
| Statement of Changes in Net Assets |
| |
| | Six months ended June 30, 2024 (Unaudited) | | Year ended December 31, 2023 |
| Increase (Decrease) in Net Assets | | | | |
| Operations | | | | |
| Net investment income (loss) | $ | 29,703,737 | $ | 130,906,624 |
| Net realized gain (loss) | | 68,978,708 | | (33,423,554) |
| Change in net unrealized appreciation (depreciation) | | 289,960,244 | | 706,352,348 |
| Net increase (decrease) in net assets resulting from operations | | 388,642,689 | | 803,835,418 |
| Distributions to shareholders | | (3,298,797) | | (142,216,963) |
| | | | | |
| Share transactions - net increase (decrease) | | (156,049,422) | | 72,699,093 |
| Total increase (decrease) in net assets | | 229,294,470 | | 734,317,548 |
| | | | | |
| Net Assets | | | | |
| Beginning of period | | 6,430,825,623 | | 5,696,508,075 |
| End of period | $ | 6,660,120,093 | $ | 6,430,825,623 |
| | | | | |
| | | | | |
Financial Highlights
VIP FundsManager® 60% Portfolio Service Class |
| |
| | Six months ended (Unaudited) June 30, 2024 | | Years ended December 31, 2023 | | 2022 | | 2021 | | 2020 | | 2019 |
Selected Per-Share Data | | | | | | | | | | | | |
| Net asset value, beginning of period | $ | 9.70 | $ | 8.69 | $ | 12.40 | $ | 11.35 | $ | 10.20 | $ | 10.22 |
| Income from Investment Operations | | | | | | | | | | | | |
Net investment income (loss) A,B | | .05 | | .20 | | .16 | | .13 | | .11 | | .16 |
| Net realized and unrealized gain (loss) | | .55 | | 1.03 | | (1.82) | | 1.25 | | 1.40 | | 1.71 |
| Total from investment operations | | .60 | | 1.23 | | (1.66) | | 1.38 | | 1.51 | | 1.87 |
| Distributions from net investment income | | (.01) | | (.22) | | (.17) | | (.14) | | (.11) | | (.15) |
| Distributions from net realized gain | | - | | - | | (1.88) | | (.20) | | (.25) | | (1.74) |
| Total distributions | | (.01) | | (.22) | | (2.05) | | (.33) C | | (.36) | | (1.89) |
| Net asset value, end of period | $ | 10.29 | $ | 9.70 | $ | 8.69 | $ | 12.40 | $ | 11.35 | $ | 10.20 |
Total Return D,E,F | | | | 14.17% | | (15.06)% | | 12.34% | | 15.12% | | 20.49% |
Ratios to Average Net Assets B,G,H | | | | | | | | | | | | |
| Expenses before reductions | | .25% I | | .25% | | .29% | | .35% | | .35% | | .35% |
| Expenses net of fee waivers, if any | | | | .10% | | .14% | | .20% | | .20% | | .20% |
| Expenses net of all reductions | | .10% I | | .10% | | .14% | | .20% | | .20% | | .20% |
| Net investment income (loss) | | .92% I | | 2.18% | | 1.73% | | 1.08% | | 1.06% | | 1.61% |
| Supplemental Data | | | | | | | | | | | | |
| Net assets, end of period (000 omitted) | $ | 108,876 | $ | 96,947 | $ | 68,120 | $ | 58,353 | $ | 28,621 | $ | 9,951 |
Portfolio turnover rate J | | | | 18% | | 43% K | | 54% K | | 22% K | | 33% |
ACalculated based on average shares outstanding during the period.
BNet investment income (loss) is affected by the timing of the declaration of dividends by any underlying mutual funds or exchange-traded funds (ETFs). Net investment income (loss) of any mutual funds or ETFs is not included in the Fund's net investment income (loss) ratio.
CTotal distributions per share do not sum due to rounding.
DTotal returns for periods of less than one year are not annualized.
ETotal returns do not reflect charges attributable to your insurance company's separate account. Inclusion of these charges would reduce the total returns shown.
FTotal returns would have been lower if certain expenses had not been reduced during the applicable periods shown.
GFees and expenses of any underlying mutual funds or exchange-traded funds (ETFs) are not included in the Fund's expense ratio. The Fund indirectly bears its proportionate share of these expenses. For additional expense information related to investments in Fidelity Central Funds, please refer to the "Investments in Fidelity Central Funds" note found in the Notes to Financial Statements section of the most recent Annual or Semi-Annual report.
HExpense ratios reflect operating expenses of the class. Expenses before reductions do not reflect amounts reimbursed, waived, or reduced through arrangements with the investment adviser, brokerage services, or other offset arrangements, if applicable, and do not represent the amount paid by the class during periods when reimbursements, waivers or reductions occur.
IAnnualized.
JAmount does not include the portfolio activity of any underlying mutual funds or exchange-traded funds (ETFs).
KPortfolio turnover rate excludes securities received or delivered in-kind.
VIP FundsManager® 60% Portfolio Service Class 2 |
| |
| | Six months ended (Unaudited) June 30, 2024 | | Years ended December 31, 2023 | | 2022 | | 2021 | | 2020 | | 2019 |
Selected Per-Share Data | | | | | | | | | | | | |
| Net asset value, beginning of period | $ | 9.66 | $ | 8.65 | $ | 12.36 | $ | 11.31 | $ | 10.17 | $ | 10.20 |
| Income from Investment Operations | | | | | | | | | | | | |
Net investment income (loss) A,B | | .04 | | .19 | | .15 | | .11 | | .09 | | .14 |
| Net realized and unrealized gain (loss) | | .55 | | 1.03 | | (1.82) | | 1.25 | | 1.39 | | 1.71 |
| Total from investment operations | | .59 | | 1.22 | | (1.67) | | 1.36 | | 1.48 | | 1.85 |
| Distributions from net investment income | | (.01) | | (.21) | | (.16) | | (.12) | | (.09) | | (.14) |
| Distributions from net realized gain | | - | | - | | (1.88) | | (.20) | | (.25) | | (1.74) |
| Total distributions | | (.01) | | (.21) | | (2.04) | | (.31) C | | (.34) | | (1.88) |
| Net asset value, end of period | $ | 10.24 | $ | 9.66 | $ | 8.65 | $ | 12.36 | $ | 11.31 | $ | 10.17 |
Total Return D,E,F | | | | 14.08% | | (15.25)% | | 12.21% | | 14.92% | | 20.25% |
Ratios to Average Net Assets B,G,H | | | | | | | | | | | | |
| Expenses before reductions | | .40% I | | .40% | | .45% | | .50% | | .50% | | .50% |
| Expenses net of fee waivers, if any | | | | .25% | | .29% | | .35% | | .35% | | .35% |
| Expenses net of all reductions | | .25% I | | .25% | | .29% | | .35% | | .35% | | .35% |
| Net investment income (loss) | | .77% I | | 2.03% | | 1.58% | | .93% | | .91% | | 1.46% |
| Supplemental Data | | | | | | | | | | | | |
| Net assets, end of period (000 omitted) | $ | 587,167 | $ | 582,339 | $ | 534,692 | $ | 640,658 | $ | 656,402 | $ | 594,140 |
Portfolio turnover rate J | | | | 18% | | 43% K | | 54% K | | 22% K | | 33% |
ACalculated based on average shares outstanding during the period.
BNet investment income (loss) is affected by the timing of the declaration of dividends by any underlying mutual funds or exchange-traded funds (ETFs). Net investment income (loss) of any mutual funds or ETFs is not included in the Fund's net investment income (loss) ratio.
CTotal distributions per share do not sum due to rounding.
DTotal returns for periods of less than one year are not annualized.
ETotal returns do not reflect charges attributable to your insurance company's separate account. Inclusion of these charges would reduce the total returns shown.
FTotal returns would have been lower if certain expenses had not been reduced during the applicable periods shown.
GFees and expenses of any underlying mutual funds or exchange-traded funds (ETFs) are not included in the Fund's expense ratio. The Fund indirectly bears its proportionate share of these expenses. For additional expense information related to investments in Fidelity Central Funds, please refer to the "Investments in Fidelity Central Funds" note found in the Notes to Financial Statements section of the most recent Annual or Semi-Annual report.
HExpense ratios reflect operating expenses of the class. Expenses before reductions do not reflect amounts reimbursed, waived, or reduced through arrangements with the investment adviser, brokerage services, or other offset arrangements, if applicable, and do not represent the amount paid by the class during periods when reimbursements, waivers or reductions occur.
IAnnualized.
JAmount does not include the portfolio activity of any underlying mutual funds or exchange-traded funds (ETFs).
KPortfolio turnover rate excludes securities received or delivered in-kind.
VIP FundsManager® 60% Portfolio Investor Class |
| |
| | Six months ended (Unaudited) June 30, 2024 | | Years ended December 31, 2023 | | 2022 | | 2021 | | 2020 | | 2019 |
Selected Per-Share Data | | | | | | | | | | | | |
| Net asset value, beginning of period | $ | 9.70 | $ | 8.69 | $ | 12.40 | $ | 11.35 | $ | 10.20 | $ | 10.22 |
| Income from Investment Operations | | | | | | | | | | | | |
Net investment income (loss) A,B | | .05 | | .20 | | .16 | | .13 | | .11 | | .16 |
| Net realized and unrealized gain (loss) | | .55 | | 1.03 | | (1.82) | | 1.25 | | 1.40 | | 1.71 |
| Total from investment operations | | .60 | | 1.23 | | (1.66) | | 1.38 | | 1.51 | | 1.87 |
| Distributions from net investment income | | (.01) | | (.22) | | (.17) | | (.14) | | (.11) | | (.15) |
| Distributions from net realized gain | | - | | - | | (1.88) | | (.20) | | (.25) | | (1.74) |
| Total distributions | | (.01) | | (.22) | | (2.05) | | (.33) C | | (.36) | | (1.89) |
| Net asset value, end of period | $ | 10.29 | $ | 9.70 | $ | 8.69 | $ | 12.40 | $ | 11.35 | $ | 10.20 |
Total Return D,E,F | | | | 14.17% | | (15.06)% | | 12.34% | | 15.12% | | 20.49% |
Ratios to Average Net Assets B,G,H | | | | | | | | | | | | |
| Expenses before reductions | | .15% I | | .15% | | .19% | | .25% | | .25% | | .25% |
| Expenses net of fee waivers, if any | | | | .10% | | .14% | | .20% | | .20% | | .20% |
| Expenses net of all reductions | | .10% I | | .10% | | .14% | | .20% | | .20% | | .20% |
| Net investment income (loss) | | .92% I | | 2.18% | | 1.73% | | 1.08% | | 1.06% | | 1.61% |
| Supplemental Data | | | | | | | | | | | | |
| Net assets, end of period (000 omitted) | $ | 5,964,076 | $ | 5,751,540 | $ | 5,093,696 | $ | 6,493,070 | $ | 5,919,107 | $ | 5,375,333 |
Portfolio turnover rate J | | | | 18% | | 43% K | | 54% K | | 22% K | | 33% |
ACalculated based on average shares outstanding during the period.
BNet investment income (loss) is affected by the timing of the declaration of dividends by any underlying mutual funds or exchange-traded funds (ETFs). Net investment income (loss) of any mutual funds or ETFs is not included in the Fund's net investment income (loss) ratio.
CTotal distributions per share do not sum due to rounding.
DTotal returns for periods of less than one year are not annualized.
ETotal returns do not reflect charges attributable to your insurance company's separate account. Inclusion of these charges would reduce the total returns shown.
FTotal returns would have been lower if certain expenses had not been reduced during the applicable periods shown.
GFees and expenses of any underlying mutual funds or exchange-traded funds (ETFs) are not included in the Fund's expense ratio. The Fund indirectly bears its proportionate share of these expenses. For additional expense information related to investments in Fidelity Central Funds, please refer to the "Investments in Fidelity Central Funds" note found in the Notes to Financial Statements section of the most recent Annual or Semi-Annual report.
HExpense ratios reflect operating expenses of the class. Expenses before reductions do not reflect amounts reimbursed, waived, or reduced through arrangements with the investment adviser, brokerage services, or other offset arrangements, if applicable, and do not represent the amount paid by the class during periods when reimbursements, waivers or reductions occur.
IAnnualized.
JAmount does not include the portfolio activity of any underlying mutual funds or exchange-traded funds (ETFs).
KPortfolio turnover rate excludes securities received or delivered in-kind.
VIP FundsManager® 70% Portfolio
Schedule of Investments June 30, 2024 (Unaudited)
Showing Percentage of Net Assets
| Equity Funds - 74.0% |
| | | Shares | Value ($) |
| Fidelity Canada Fund (a) | | 277,368 | 18,494,895 |
| Fidelity Commodity Strategy Fund (a) | | 78,110 | 7,420,487 |
| Fidelity Contrafund (a) | | 2,346,199 | 47,393,222 |
| Fidelity Emerging Markets Discovery Fund (a) | | 1,050,707 | 17,567,829 |
| Fidelity Emerging Markets Fund (a) | | 4,259,819 | 169,072,228 |
| Fidelity Enhanced International ETF (a) | | 1,664,318 | 47,166,772 |
| Fidelity Enhanced Mid Cap ETF (a) | | 179,139 | 5,275,644 |
| Fidelity Enhanced Small Cap ETF (a) | | 256,234 | 7,455,128 |
| Fidelity Global Commodity Stock Fund (a) | | 105,554 | 2,027,695 |
| Fidelity Hedged Equity Fund (a) | | 2,263,299 | 28,064,907 |
| Fidelity Infrastructure Fund (a) | | 153,513 | 1,941,942 |
| Fidelity International Capital Appreciation Fund (a) | | 1,324,148 | 37,976,570 |
| Fidelity International Discovery Fund (a) | | 923,263 | 46,089,305 |
| Fidelity International Small Cap Fund (a) | | 609,929 | 19,670,225 |
| Fidelity International Small Cap Opportunities Fund (a) | | 1,052,570 | 20,946,139 |
| Fidelity International Value Fund (a) | | 2,828,949 | 29,845,411 |
| Fidelity Japan Smaller Companies Fund (a) | | 992,433 | 15,630,813 |
| Fidelity Low-Priced Stock Fund (a) | | 957,535 | 44,822,200 |
| Fidelity Overseas Fund (a) | | 2,831,894 | 184,412,935 |
| Fidelity Real Estate Investment Portfolio (a) | | 266,812 | 9,968,095 |
| iShares Core S&P 500 ETF | | 51,407 | 28,131,453 |
| VIP Stock Selector All Cap Portfolio Investor Class (a) | | 74,010,920 | 840,764,045 |
| TOTAL EQUITY FUNDS (Cost $1,374,635,279) | | | 1,630,137,940 |
| | | | |
| Fixed-Income Funds - 23.5% |
| | | Shares | Value ($) |
| Fidelity Floating Rate High Income Fund (a) | | 1,737,796 | 16,091,988 |
| Fidelity High Income Fund (a) | | 2,085,424 | 16,036,911 |
| Fidelity Inflation-Protected Bond Index Fund (a) | | 3,562,595 | 32,455,245 |
| Fidelity Long-Term Treasury Bond Index Fund (a) | | 1,160,020 | 11,008,593 |
| Fidelity New Markets Income Fund (a) | | 89,630 | 1,122,168 |
| Fidelity Total Bond Fund (a) | | 23,440,628 | 220,341,908 |
| VIP Investment Grade Bond II Portfolio Investor Class (a) | | 23,392,966 | 220,361,736 |
| TOTAL FIXED-INCOME FUNDS (Cost $530,425,020) | | | 517,418,549 |
| | | | |
| Money Market Funds - 2.5% |
| | | Shares | Value ($) |
Fidelity Cash Central Fund 5.38% (b) (Cost $55,046,136) | | 55,035,129 | 55,046,136 |
| | | | |
| U.S. Treasury Obligations - 0.0% |
| | | Principal Amount (c) | Value ($) |
U.S. Treasury Bills, yield at date of purchase 5.31% to 5.32% 8/1/24 to 8/15/24 (d) (Cost $348,379) | | 350,000 | 348,377 |
| | | | |
| TOTAL INVESTMENT IN SECURITIES - 100.0% (Cost $1,960,454,814) | 2,202,951,002 |
NET OTHER ASSETS (LIABILITIES) - 0.0% | 98,274 |
| NET ASSETS - 100.0% | 2,203,049,276 |
| | |
| Futures Contracts |
| | Number of contracts | Expiration Date | Notional Amount ($) | Value ($) | Unrealized Appreciation/ (Depreciation) ($) |
| Purchased | | | | | |
| | | | | | |
| Equity Index Contracts | | | | | |
| ICE MSCI EAFE Index Contracts (United States) | 85 | Sep 2024 | 9,958,600 | 53,548 | 53,548 |
| | | | | | |
| The notional amount of futures purchased as a percentage of Net Assets is 0.5% |
Security Type Abbreviations
Legend
| (b) | Affiliated fund that is generally available only to investment companies and other accounts managed by Fidelity Investments. The rate quoted is the annualized seven-day yield of the fund at period end. A complete unaudited listing of the fund's holdings as of its most recent quarter end is available upon request. In addition, each Fidelity Central Fund's financial statements are available on the SEC's website or upon request. |
| (c) | Amount is stated in United States dollars unless otherwise noted. |
| (d) | Security or a portion of the security was pledged to cover margin requirements for futures contracts. At period end, the value of securities pledged amounted to $348,377. |
Affiliated Central Funds
Fiscal year to date information regarding the Fund's investments in Fidelity Central Funds, including the ownership percentage, is presented below.
| Affiliate | Value, beginning of period ($) | Purchases ($) | Sales Proceeds ($) | Dividend Income ($) | Realized Gain (loss) ($) | Change in Unrealized appreciation (depreciation) ($) | Value, end of period ($) | % ownership, end of period |
| Fidelity Cash Central Fund 5.38% | 25,719,081 | 91,346,331 | 62,019,276 | 1,161,264 | - | - | 55,046,136 | 0.1% |
| Total | 25,719,081 | 91,346,331 | 62,019,276 | 1,161,264 | - | - | 55,046,136 | |
| | | | | | | | | |
Amounts in the dividend income column in the above table include any capital gain distributions from underlying funds, which are presented in the corresponding line item in the Statement of Operations, if applicable.
Amounts included in the purchases and sales proceeds columns may include in-kind transactions, if applicable.
Affiliated Underlying Funds
Fiscal year to date information regarding the Fund's investments in affiliated Underlying Funds is presented below. Exchanges between classes of the same affiliated Underlying Funds may occur. If an Underlying Funds changes its name, the name presented below is the name in effect at period end.
| Affiliate | Value, beginning of period ($) | Purchases ($) | Sales Proceeds ($) | Dividend Income ($) | Realized Gain (loss) ($) | Change in Unrealized appreciation (depreciation) ($) | Value, end of period ($) |
| Fidelity Canada Fund | 18,190,478 | 694,122 | 1,000,140 | - | (5,919) | 616,354 | 18,494,895 |
| Fidelity Commodity Strategy Fund | 7,148,072 | 180,023 | 240,675 | - | (42,388) | 375,455 | 7,420,487 |
| Fidelity Contrafund | 26,403,063 | 14,601,155 | 951,672 | 21,297 | 49,803 | 7,290,873 | 47,393,222 |
| Fidelity Emerging Markets Discovery Fund | 17,405,241 | 433,508 | 570,950 | - | 1,687 | 298,343 | 17,567,829 |
| Fidelity Emerging Markets Fund | 153,104,055 | 4,406,928 | 5,137,952 | - | 123,799 | 16,575,398 | 169,072,228 |
| Fidelity Enhanced International ETF | 44,104,427 | - | - | 850,467 | - | 3,062,345 | 47,166,772 |
| Fidelity Enhanced Large Cap Value ETF | 26,746,144 | - | 28,789,379 | 259,990 | 7,127,309 | (5,084,074) | - |
| Fidelity Enhanced Mid Cap ETF | - | 5,389,164 | - | 13,794 | - | (113,520) | 5,275,644 |
| Fidelity Enhanced Small Cap ETF | - | 7,492,820 | - | 13,580 | - | (37,692) | 7,455,128 |
| Fidelity Equity-Income Fund | 45,778,814 | 760,735 | 50,066,203 | 162,985 | 10,369,058 | (6,842,404) | - |
| Fidelity Floating Rate High Income Fund | 15,644,981 | 1,063,050 | 546,999 | 653,855 | 1,958 | (71,002) | 16,091,988 |
| Fidelity Global Commodity Stock Fund | 1,919,924 | 92,739 | 123,984 | - | 8,436 | 130,580 | 2,027,695 |
| Fidelity Hedged Equity Fund | 25,857,327 | 6,989 | 800,725 | 6,988 | 138,364 | 2,862,952 | 28,064,907 |
| Fidelity High Income Fund | 10,382,945 | 6,056,529 | 505,942 | 423,306 | 2,622 | 100,757 | 16,036,911 |
| Fidelity Inflation-Protected Bond Index Fund | 38,885,960 | 1,036,326 | 7,674,670 | 64,291 | (602,777) | 810,406 | 32,455,245 |
| Fidelity Infrastructure Fund | 1,891,412 | 73,242 | 92,732 | 4,733 | (35) | 70,055 | 1,941,942 |
| Fidelity International Capital Appreciation Fund | 35,573,485 | 1,107,763 | 1,591,576 | - | 18,945 | 2,867,953 | 37,976,570 |
| Fidelity International Discovery Fund | 41,572,529 | 1,451,558 | 2,083,068 | - | (89,294) | 5,237,580 | 46,089,305 |
| Fidelity International Small Cap Fund | 19,376,827 | 570,906 | 819,477 | - | 4,315 | 537,654 | 19,670,225 |
| Fidelity International Small Cap Opportunities Fund | 20,266,795 | 754,129 | - | - | - | (74,785) | 20,946,139 |
| Fidelity International Value Fund | 28,101,130 | 754,129 | 1,080,730 | - | 40,625 | 2,030,257 | 29,845,411 |
| Fidelity Japan Smaller Companies Fund | 14,955,959 | - | - | - | - | 674,854 | 15,630,813 |
| Fidelity Long-Term Treasury Bond Index Fund | 23,670,343 | 611,402 | 12,045,770 | 266,832 | (1,089,272) | (138,110) | 11,008,593 |
| Fidelity Low-Priced Stock Fund | 54,932,364 | 1,750,538 | 15,553,014 | - | (495,946) | 4,188,258 | 44,822,200 |
| Fidelity New Markets Income Fund | 5,363,159 | 158,801 | 4,422,719 | 103,900 | 302,033 | (279,106) | 1,122,168 |
| Fidelity Overseas Fund | 173,051,933 | 5,472,329 | 7,857,724 | - | 241,834 | 13,504,563 | 184,412,935 |
| Fidelity Real Estate Investment Portfolio | 10,324,914 | 310,560 | 364,666 | 37,791 | (15,492) | (287,221) | 9,968,095 |
| Fidelity Total Bond Fund | 211,869,923 | 20,845,958 | 8,187,495 | 4,603,512 | (27,548) | (4,158,930) | 220,341,908 |
| Fidelity U.S. Low Volatility Equity Fund | 20,227,098 | 70,231 | 20,729,275 | - | 2,896,040 | (2,464,094) | - |
| Fidelity Value Discovery Fund | 22,335,424 | 329,260 | 23,882,196 | - | 6,167,877 | (4,950,365) | - |
| VIP Investment Grade Bond II Portfolio Investor Class | 210,213,338 | 19,147,777 | 8,187,409 | 136,962 | (145,803) | (666,167) | 220,361,736 |
| VIP Stock Selector All Cap Portfolio Investor Class | 719,984,357 | 69,614,550 | 27,076,283 | - | 767,387 | 77,474,034 | 840,764,045 |
| | 2,045,282,421 | 165,237,221 | 230,383,425 | 7,624,283 | 25,747,618 | 113,541,201 | 2,119,425,036 |
Amounts in the dividend income column in the above table include any capital gain distributions from underlying funds, which are presented in the corresponding line item in the Statement of Operations, if applicable.
Amounts included in the purchases and sales proceeds columns may include in-kind transactions, if applicable.
Investment Valuation
The following is a summary of the inputs used, as of June 30, 2024, involving the Fund's assets and liabilities carried at fair value. The inputs or methodology used for valuing securities may not be an indication of the risk associated with investing in those securities. For more information on valuation inputs, and their aggregation into the levels used below, please refer to the Investment Valuation section in the accompanying Notes to Financial Statements.
| Valuation Inputs at Reporting Date: |
| Description | Total ($) | Level 1 ($) | Level 2 ($) | Level 3 ($) |
Investments in Securities: | | | | |
|
| Equity Funds | 1,630,137,940 | 1,630,137,940 | - | - |
|
| Fixed-Income Funds | 517,418,549 | 517,418,549 | - | - |
|
| Money Market Funds | 55,046,136 | 55,046,136 | - | - |
|
| Other Short-Term Investments and Net Other Assets | 348,377 | - | 348,377 | - |
| Total Investments in Securities: | 2,202,951,002 | 2,202,602,625 | 348,377 | - |
Derivative Instruments: Assets | | | | |
Futures Contracts | 53,548 | 53,548 | - | - |
| Total Assets | 53,548 | 53,548 | - | - |
| Total Derivative Instruments: | 53,548 | 53,548 | - | - |
Value of Derivative Instruments
The following table is a summary of the Fund's value of derivative instruments by primary risk exposure as of June 30, 2024. For additional information on derivative instruments, please refer to the Derivative Instruments section in the accompanying Notes to Financial Statements.
Primary Risk Exposure / Derivative Type | Value |
| Asset ($) | Liability ($) |
| Equity Risk | | |
Futures Contracts (a) | 53,548 | 0 |
| Total Equity Risk | 53,548 | 0 |
| Total Value of Derivatives | 53,548 | 0 |
(a)Reflects gross cumulative appreciation (depreciation) on futures contracts as presented in the Schedule of Investments. In the Statement of Assets and Liabilities, the period end daily variation margin is included in receivable or payable for daily variation margin on futures contracts, and the net cumulative appreciation (depreciation) is included in Total accumulated earnings (loss).
VIP FundsManager® 70% Portfolio
Financial Statements (Unaudited)
| Statement of Assets and Liabilities |
| | | | June 30, 2024 (Unaudited) |
| | | | | |
| Assets | | | | |
| Investment in securities, at value - See accompanying schedule: | | | | |
Unaffiliated issuers (cost $27,090,774) | $ | 28,479,830 | | |
Fidelity Central Funds (cost $55,046,136) | | 55,046,136 | | |
Other affiliated issuers (cost $1,878,317,904) | | 2,119,425,036 | | |
| | | | | |
| | | | | |
| Total Investment in Securities (cost $1,960,454,814) | | | $ | 2,202,951,002 |
| Cash | | | | 35,043 |
| Receivable for investments sold | | | | 1,659,334 |
| Receivable for fund shares sold | | | | 4,250 |
| Distributions receivable from Fidelity Central Funds | | | | 241,616 |
| Receivable for daily variation margin on futures contracts | | | | 13,600 |
Total assets | | | | 2,204,904,845 |
| Liabilities | | | | |
| Payable for investments purchased | $ | 79 | | |
| Payable for fund shares redeemed | | 1,663,559 | | |
| Accrued management fee | | 183,101 | | |
| Distribution and service plan fees payable | | 8,830 | | |
| Total liabilities | | | | 1,855,569 |
| Net Assets | | | $ | 2,203,049,276 |
| Net Assets consist of: | | | | |
| Paid in capital | | | $ | 1,963,125,481 |
| Total accumulated earnings (loss) | | | | 239,923,795 |
| Net Assets | | | $ | 2,203,049,276 |
| | | | | |
| Net Asset Value and Maximum Offering Price | | | | |
| Service Class : | | | | |
Net Asset Value, offering price and redemption price per share ($70,668 ÷ 5,414 shares) | | | $ | 13.05 |
| Service Class 2 : | | | | |
Net Asset Value, offering price and redemption price per share ($70,582,831 ÷ 5,447,310 shares) | | | $ | 12.96 |
| Investor Class : | | | | |
Net Asset Value, offering price and redemption price per share ($2,132,395,777 ÷ 163,432,221 shares) | | | $ | 13.05 |
| Statement of Operations |
| | | | Six months ended June 30, 2024 (Unaudited) |
| Investment Income | | | | |
| Dividends: | | | | |
| Unaffiliated issuers | | | $ | 83,458 |
| Affiliated issuers | | | | 7,446,553 |
| Interest | | | | 34,607 |
| Income from Fidelity Central Funds | | | | 1,161,264 |
| Total income | | | | 8,725,882 |
| Expenses | | | | |
| Management fee | $ | 1,596,753 | | |
| Distribution and service plan fees | | 87,210 | | |
| Independent trustees' fees and expenses | | 2,819 | | |
| Total expenses before reductions | | 1,686,782 | | |
| Expense reductions | | (568,096) | | |
| Total expenses after reductions | | | | 1,118,686 |
| Net Investment income (loss) | | | | 7,607,196 |
| Realized and Unrealized Gain (Loss) | | | | |
| Net realized gain (loss) on: | | | | |
| Investment Securities: | | | | |
| Unaffiliated issuers | | 145,503 | | |
| Affiliated issuers | | 25,747,618 | | |
| Foreign currency transactions | | 150 | | |
| Futures contracts | | (1,781,986) | | |
| Capital gain distributions from underlying funds: | | | | |
| Affiliated issuers | | 177,730 | | |
| Total net realized gain (loss) | | | | 24,289,015 |
| Change in net unrealized appreciation (depreciation) on: | | | | |
| Investment Securities: | | | | |
| Unaffiliated issuers | | 1,388,713 | | |
| Affiliated issuers | | 113,541,201 | | |
| Futures contracts | | 537,470 | | |
| Total change in net unrealized appreciation (depreciation) | | | | 115,467,384 |
| Net gain (loss) | | | | 139,756,399 |
| Net increase (decrease) in net assets resulting from operations | | | $ | 147,363,595 |
| Statement of Changes in Net Assets |
| |
| | Six months ended June 30, 2024 (Unaudited) | | Year ended December 31, 2023 |
| Increase (Decrease) in Net Assets | | | | |
| Operations | | | | |
| Net investment income (loss) | $ | 7,607,196 | $ | 36,163,060 |
| Net realized gain (loss) | | 24,289,015 | | (10,886,233) |
| Change in net unrealized appreciation (depreciation) | | 115,467,384 | | 261,094,283 |
| Net increase (decrease) in net assets resulting from operations | | 147,363,595 | | 286,371,110 |
| Distributions to shareholders | | (1,019,317) | | (39,485,458) |
| | | | | |
| Share transactions - net increase (decrease) | | (16,255,683) | | (21,696,786) |
| Total increase (decrease) in net assets | | 130,088,595 | | 225,188,866 |
| | | | | |
| Net Assets | | | | |
| Beginning of period | | 2,072,960,681 | | 1,847,771,815 |
| End of period | $ | 2,203,049,276 | $ | 2,072,960,681 |
| | | | | |
| | | | | |
Financial Highlights
VIP FundsManager® 70% Portfolio Service Class |
| |
| | Six months ended (Unaudited) June 30, 2024 | | Years ended December 31, 2023 | | 2022 | | 2021 | | 2020 | | 2019 |
Selected Per-Share Data | | | | | | | | | | | | |
| Net asset value, beginning of period | $ | 12.19 | $ | 10.74 | $ | 15.55 | $ | 13.90 | $ | 12.37 | $ | 11.71 |
| Income from Investment Operations | | | | | | | | | | | | |
Net investment income (loss) A,B | | .05 | | .21 | | .18 | | .15 | | .12 | | .17 |
| Net realized and unrealized gain (loss) | | .82 | | 1.48 | | (2.33) | | 1.86 | | 1.82 | | 2.26 |
| Total from investment operations | | .87 | | 1.69 | | (2.15) | | 2.01 | | 1.94 | | 2.43 |
| Distributions from net investment income | | (.01) | | (.24) | | (.19) | | (.16) | | (.12) | | (.16) |
| Distributions from net realized gain | | - | | - | | (2.47) | | (.20) | | (.30) | | (1.61) |
| Total distributions | | (.01) | | (.24) | | (2.66) | | (.36) | | (.41) C | | (1.77) |
| Net asset value, end of period | $ | 13.05 | $ | 12.19 | $ | 10.74 | $ | 15.55 | $ | 13.90 | $ | 12.37 |
Total Return D,E,F | | | | 15.72% | | (15.65)% | | 14.60% | | 16.10% | | 22.65% |
Ratios to Average Net Assets B,G,H | | | | | | | | | | | | |
| Expenses before reductions | | .25% I | | .25% | | .29% | | .35% | | .35% | | .35% |
| Expenses net of fee waivers, if any | | | | .10% | | .14% | | .20% | | .20% | | .20% |
| Expenses net of all reductions | | .10% I | | .10% | | .14% | | .20% | | .20% | | .20% |
| Net investment income (loss) | | .72% I | | 1.87% | | 1.58% | | .99% | | .95% | | 1.47% |
| Supplemental Data | | | | | | | | | | | | |
| Net assets, end of period (000 omitted) | $ | 71 | $ | 66 | $ | 58 | $ | 84 | $ | 75 | $ | 67 |
Portfolio turnover rate J | | | | 15% | | 33% K | | 60% K | | 24% K | | 39% |
ACalculated based on average shares outstanding during the period.
BNet investment income (loss) is affected by the timing of the declaration of dividends by any underlying mutual funds or exchange-traded funds (ETFs). Net investment income (loss) of any mutual funds or ETFs is not included in the Fund's net investment income (loss) ratio.
CTotal distributions per share do not sum due to rounding.
DTotal returns for periods of less than one year are not annualized.
ETotal returns do not reflect charges attributable to your insurance company's separate account. Inclusion of these charges would reduce the total returns shown.
FTotal returns would have been lower if certain expenses had not been reduced during the applicable periods shown.
GFees and expenses of any underlying mutual funds or exchange-traded funds (ETFs) are not included in the Fund's expense ratio. The Fund indirectly bears its proportionate share of these expenses. For additional expense information related to investments in Fidelity Central Funds, please refer to the "Investments in Fidelity Central Funds" note found in the Notes to Financial Statements section of the most recent Annual or Semi-Annual report.
HExpense ratios reflect operating expenses of the class. Expenses before reductions do not reflect amounts reimbursed, waived, or reduced through arrangements with the investment adviser, brokerage services, or other offset arrangements, if applicable, and do not represent the amount paid by the class during periods when reimbursements, waivers or reductions occur.
IAnnualized.
JAmount does not include the portfolio activity of any underlying mutual funds or exchange-traded funds (ETFs).
KPortfolio turnover rate excludes securities received or delivered in-kind.
VIP FundsManager® 70% Portfolio Service Class 2 |
| |
| | Six months ended (Unaudited) June 30, 2024 | | Years ended December 31, 2023 | | 2022 | | 2021 | | 2020 | | 2019 |
Selected Per-Share Data | | | | | | | | | | | | |
| Net asset value, beginning of period | $ | 12.11 | $ | 10.67 | $ | 15.47 | $ | 13.83 | $ | 12.31 | $ | 11.67 |
| Income from Investment Operations | | | | | | | | | | | | |
Net investment income (loss) A,B | | .04 | | .20 | | .16 | | .12 | | .10 | | .15 |
| Net realized and unrealized gain (loss) | | .82 | | 1.46 | | (2.31) | | 1.85 | | 1.82 | | 2.25 |
| Total from investment operations | | .86 | | 1.66 | | (2.15) | | 1.97 | | 1.92 | | 2.40 |
| Distributions from net investment income | | (.01) | | (.22) | | (.17) | | (.13) | | (.10) | | (.15) |
| Distributions from net realized gain | | - | | - | | (2.47) | | (.20) | | (.30) | | (1.61) |
| Total distributions | | (.01) | | (.22) | | (2.65) C | | (.33) | | (.40) | | (1.76) |
| Net asset value, end of period | $ | 12.96 | $ | 12.11 | $ | 10.67 | $ | 15.47 | $ | 13.83 | $ | 12.31 |
Total Return D,E,F | | | | 15.57% | | (15.79)% | | 14.44% | | 15.94% | | 22.39% |
Ratios to Average Net Assets B,G,H | | | | | | | | | | | | |
| Expenses before reductions | | .40% I | | .40% | | .44% | | .50% | | .50% | | .50% |
| Expenses net of fee waivers, if any | | | | .25% | | .29% | | .35% | | .35% | | .35% |
| Expenses net of all reductions | | .25% I | | .25% | | .29% | | .35% | | .35% | | .35% |
| Net investment income (loss) | | .57% I | | 1.72% | | 1.43% | | .84% | | .80% | | 1.32% |
| Supplemental Data | | | | | | | | | | | | |
| Net assets, end of period (000 omitted) | $ | 70,583 | $ | 68,638 | $ | 61,541 | $ | 74,699 | $ | 66,433 | $ | 57,129 |
Portfolio turnover rate J | | | | 15% | | 33% K | | 60% K | | 24% K | | 39% |
ACalculated based on average shares outstanding during the period.
BNet investment income (loss) is affected by the timing of the declaration of dividends by any underlying mutual funds or exchange-traded funds (ETFs). Net investment income (loss) of any mutual funds or ETFs is not included in the Fund's net investment income (loss) ratio.
CTotal distributions per share do not sum due to rounding.
DTotal returns for periods of less than one year are not annualized.
ETotal returns do not reflect charges attributable to your insurance company's separate account. Inclusion of these charges would reduce the total returns shown.
FTotal returns would have been lower if certain expenses had not been reduced during the applicable periods shown.
GFees and expenses of any underlying mutual funds or exchange-traded funds (ETFs) are not included in the Fund's expense ratio. The Fund indirectly bears its proportionate share of these expenses. For additional expense information related to investments in Fidelity Central Funds, please refer to the "Investments in Fidelity Central Funds" note found in the Notes to Financial Statements section of the most recent Annual or Semi-Annual report.
HExpense ratios reflect operating expenses of the class. Expenses before reductions do not reflect amounts reimbursed, waived, or reduced through arrangements with the investment adviser, brokerage services, or other offset arrangements, if applicable, and do not represent the amount paid by the class during periods when reimbursements, waivers or reductions occur.
IAnnualized.
JAmount does not include the portfolio activity of any underlying mutual funds or exchange-traded funds (ETFs).
KPortfolio turnover rate excludes securities received or delivered in-kind.
VIP FundsManager® 70% Portfolio Investor Class |
| |
| | Six months ended (Unaudited) June 30, 2024 | | Years ended December 31, 2023 | | 2022 | | 2021 | | 2020 | | 2019 |
Selected Per-Share Data | | | | | | | | | | | | |
| Net asset value, beginning of period | $ | 12.18 | $ | 10.73 | $ | 15.54 | $ | 13.90 | $ | 12.37 | $ | 11.71 |
| Income from Investment Operations | | | | | | | | | | | | |
Net investment income (loss) A,B | | .05 | | .21 | | .18 | | .15 | | .12 | | .17 |
| Net realized and unrealized gain (loss) | | .83 | | 1.48 | | (2.33) | | 1.85 | | 1.82 | | 2.26 |
| Total from investment operations | | .88 | | 1.69 | | (2.15) | | 2.00 | | 1.94 | | 2.43 |
| Distributions from net investment income | | (.01) | | (.24) | | (.19) | | (.16) | | (.12) | | (.16) |
| Distributions from net realized gain | | - | | - | | (2.47) | | (.20) | | (.30) | | (1.61) |
| Total distributions | | (.01) | | (.24) | | (2.66) | | (.36) | | (.41) C | | (1.77) |
| Net asset value, end of period | $ | 13.05 | $ | 12.18 | $ | 10.73 | $ | 15.54 | $ | 13.90 | $ | 12.37 |
Total Return D,E,F | | | | 15.73% | | (15.67)% | | 14.52% | | 16.10% | | 22.66% |
Ratios to Average Net Assets B,G,H | | | | | | | | | | | | |
| Expenses before reductions | | .15% I | | .15% | | .19% | | .25% | | .25% | | .25% |
| Expenses net of fee waivers, if any | | | | .10% | | .14% | | .20% | | .20% | | .20% |
| Expenses net of all reductions | | .10% I | | .10% | | .14% | | .20% | | .20% | | .20% |
| Net investment income (loss) | | .72% I | | 1.87% | | 1.58% | | .99% | | .95% | | 1.47% |
| Supplemental Data | | | | | | | | | | | | |
| Net assets, end of period (000 omitted) | $ | 2,132,396 | $ | 2,004,256 | $ | 1,786,172 | $ | 2,136,227 | $ | 1,769,102 | $ | 1,605,820 |
Portfolio turnover rate J | | | | 15% | | 33% K | | 60% K | | 24% K | | 39% |
ACalculated based on average shares outstanding during the period.
BNet investment income (loss) is affected by the timing of the declaration of dividends by any underlying mutual funds or exchange-traded funds (ETFs). Net investment income (loss) of any mutual funds or ETFs is not included in the Fund's net investment income (loss) ratio.
CTotal distributions per share do not sum due to rounding.
DTotal returns for periods of less than one year are not annualized.
ETotal returns do not reflect charges attributable to your insurance company's separate account. Inclusion of these charges would reduce the total returns shown.
FTotal returns would have been lower if certain expenses had not been reduced during the applicable periods shown.
GFees and expenses of any underlying mutual funds or exchange-traded funds (ETFs) are not included in the Fund's expense ratio. The Fund indirectly bears its proportionate share of these expenses. For additional expense information related to investments in Fidelity Central Funds, please refer to the "Investments in Fidelity Central Funds" note found in the Notes to Financial Statements section of the most recent Annual or Semi-Annual report.
HExpense ratios reflect operating expenses of the class. Expenses before reductions do not reflect amounts reimbursed, waived, or reduced through arrangements with the investment adviser, brokerage services, or other offset arrangements, if applicable, and do not represent the amount paid by the class during periods when reimbursements, waivers or reductions occur.
IAnnualized.
JAmount does not include the portfolio activity of any underlying mutual funds or exchange-traded funds (ETFs).
KPortfolio turnover rate excludes securities received or delivered in-kind.
VIP FundsManager® 85% Portfolio
Schedule of Investments June 30, 2024 (Unaudited)
Showing Percentage of Net Assets
| Equity Funds - 87.3% |
| | | Shares | Value ($) |
| Fidelity Canada Fund (a) | | 129,508 | 8,635,626 |
| Fidelity Commodity Strategy Fund (a) | | 26,856 | 2,551,329 |
| Fidelity Contrafund (a) | | 1,166,049 | 23,554,180 |
| Fidelity Emerging Markets Discovery Fund (a) | | 361,129 | 6,038,075 |
| Fidelity Emerging Markets Fund (a) | | 2,129,596 | 84,523,667 |
| Fidelity Enhanced International ETF (a) | | 737,507 | 20,900,948 |
| Fidelity Enhanced Mid Cap ETF (a) | | 72,113 | 2,123,728 |
| Fidelity Enhanced Small Cap ETF (a) | | 103,148 | 3,001,091 |
| Fidelity Global Commodity Stock Fund (a) | | 102,756 | 1,973,936 |
| Fidelity Hedged Equity Fund (a) | | 921,875 | 11,431,250 |
| Fidelity Infrastructure Fund (a) | | 62,518 | 790,856 |
| Fidelity International Capital Appreciation Fund (a) | | 628,040 | 18,012,199 |
| Fidelity International Discovery Fund (a) | | 439,227 | 21,926,208 |
| Fidelity International Small Cap Fund (a) | | 287,639 | 9,276,348 |
| Fidelity International Small Cap Opportunities Fund (a) | | 532,657 | 10,599,880 |
| Fidelity International Value Fund (a) | | 1,315,834 | 13,882,046 |
| Fidelity Japan Fund (a) | | 113,259 | 1,907,277 |
| Fidelity Japan Smaller Companies Fund (a) | | 453,748 | 7,146,525 |
| Fidelity Low-Priced Stock Fund (a) | | 476,903 | 22,323,850 |
| Fidelity Overseas Fund (a) | | 1,300,297 | 84,675,322 |
| Fidelity Real Estate Investment Portfolio (a) | | 107,542 | 4,017,761 |
| iShares Core S&P 500 ETF | | 20,944 | 11,461,185 |
| VIP Stock Selector All Cap Portfolio Investor Class (a) | | 36,779,537 | 417,815,536 |
| TOTAL EQUITY FUNDS (Cost $676,542,296) | | | 788,568,823 |
| | | | |
| Fixed-Income Funds - 12.1% |
| | | Shares | Value ($) |
| Fidelity Floating Rate High Income Fund (a) | | 226,936 | 2,101,425 |
| Fidelity High Income Fund (a) | | 282,418 | 2,171,797 |
| Fidelity Inflation-Protected Bond Index Fund (a) | | 1,453,871 | 13,244,762 |
| Fidelity Long-Term Treasury Bond Index Fund (a) | | 473,214 | 4,490,800 |
| Fidelity New Markets Income Fund (a) | | 36,261 | 453,983 |
| Fidelity Total Bond Fund (a) | | 4,619,593 | 43,424,172 |
| VIP Investment Grade Bond II Portfolio Investor Class (a) | | 4,610,144 | 43,427,560 |
| TOTAL FIXED-INCOME FUNDS (Cost $110,691,417) | | | 109,314,499 |
| | | | |
| Money Market Funds - 0.4% |
| | | Shares | Value ($) |
Fidelity Cash Central Fund 5.38% (b) (Cost $3,817,464) | | 3,816,701 | 3,817,464 |
| | | | |
| U.S. Treasury Obligations - 0.2% |
| | | Principal Amount (c) | Value ($) |
U.S. Treasury Bills, yield at date of purchase 5.28% to 5.31% 7/5/24 to 8/8/24 (d) (Cost $1,358,563) | | 1,360,000 | 1,358,553 |
| | | | |
| TOTAL INVESTMENT IN SECURITIES - 100.0% (Cost $792,409,740) | 903,059,339 |
NET OTHER ASSETS (LIABILITIES) - 0.0% | (19,329) |
| NET ASSETS - 100.0% | 903,040,010 |
| | |
| Futures Contracts |
| | Number of contracts | Expiration Date | Notional Amount ($) | Value ($) | Unrealized Appreciation/ (Depreciation) ($) |
| Purchased | | | | | |
| | | | | | |
| Equity Index Contracts | | | | | |
| ICE MSCI EAFE Index Contracts (United States) | 150 | Sep 2024 | 17,574,000 | 94,002 | 94,002 |
| ICE MSCI Emerging Markets Index Contracts (United States) | 24 | Sep 2024 | 1,305,840 | 2,925 | 2,925 |
| | | | | | |
| TOTAL FUTURES CONTRACTS | | | | | 96,927 |
| The notional amount of futures purchased as a percentage of Net Assets is 2.0% |
Security Type Abbreviations
Legend
| (b) | Affiliated fund that is generally available only to investment companies and other accounts managed by Fidelity Investments. The rate quoted is the annualized seven-day yield of the fund at period end. A complete unaudited listing of the fund's holdings as of its most recent quarter end is available upon request. In addition, each Fidelity Central Fund's financial statements are available on the SEC's website or upon request. |
| (c) | Amount is stated in United States dollars unless otherwise noted. |
| (d) | Security or a portion of the security was pledged to cover margin requirements for futures contracts. At period end, the value of securities pledged amounted to $628,981. |
Affiliated Central Funds
Fiscal year to date information regarding the Fund's investments in Fidelity Central Funds, including the ownership percentage, is presented below.
| Affiliate | Value, beginning of period ($) | Purchases ($) | Sales Proceeds ($) | Dividend Income ($) | Realized Gain (loss) ($) | Change in Unrealized appreciation (depreciation) ($) | Value, end of period ($) | % ownership, end of period |
| Fidelity Cash Central Fund 5.38% | 6,688,473 | 68,244,263 | 71,115,260 | 641,935 | (12) | - | 3,817,464 | 0.0% |
| Total | 6,688,473 | 68,244,263 | 71,115,260 | 641,935 | (12) | - | 3,817,464 | |
| | | | | | | | | |
Amounts in the dividend income column in the above table include any capital gain distributions from underlying funds, which are presented in the corresponding line item in the Statement of Operations, if applicable.
Amounts included in the purchases and sales proceeds columns may include in-kind transactions, if applicable.
Affiliated Underlying Funds
Fiscal year to date information regarding the Fund's investments in affiliated Underlying Funds is presented below. Exchanges between classes of the same affiliated Underlying Funds may occur. If an Underlying Funds changes its name, the name presented below is the name in effect at period end.
| Affiliate | Value, beginning of period ($) | Purchases ($) | Sales Proceeds ($) | Dividend Income ($) | Realized Gain (loss) ($) | Change in Unrealized appreciation (depreciation) ($) | Value, end of period ($) |
| Fidelity Canada Fund | 7,915,360 | 896,009 | 442,608 | - | 1,749 | 265,116 | 8,635,626 |
| Fidelity Commodity Strategy Fund | 2,363,650 | 150,305 | 74,941 | - | 809 | 111,506 | 2,551,329 |
| Fidelity Contrafund | 11,357,603 | 9,311,578 | 424,730 | 9,151 | 6,526 | 3,303,203 | 23,554,180 |
| Fidelity Emerging Markets Discovery Fund | 5,635,512 | 550,542 | 251,188 | - | 2,635 | 100,574 | 6,038,075 |
| Fidelity Emerging Markets Fund | 73,626,545 | 4,949,603 | 2,261,733 | - | 71,627 | 8,137,625 | 84,523,667 |
| Fidelity Enhanced International ETF | 19,543,936 | - | - | 376,866 | - | 1,357,012 | 20,900,948 |
| Fidelity Enhanced Large Cap Value ETF | 15,548,164 | - | 16,735,945 | 151,139 | 3,577,117 | (2,389,336) | - |
| Fidelity Enhanced Mid Cap ETF | - | 2,169,426 | - | 5,553 | - | (45,698) | 2,123,728 |
| Fidelity Enhanced Small Cap ETF | - | 3,016,264 | - | 5,467 | - | (15,173) | 3,001,091 |
| Fidelity Equity-Income Fund | 23,295,038 | 1,101,750 | 26,209,477 | 84,711 | 5,024,994 | (3,212,305) | - |
| Fidelity Floating Rate High Income Fund | 2,018,095 | 117,400 | 25,009 | 85,122 | 23 | (9,084) | 2,101,425 |
| Fidelity Global Commodity Stock Fund | 3,149,967 | 146,609 | 1,378,829 | - | 406,186 | (349,997) | 1,973,936 |
| Fidelity Hedged Equity Fund | 9,971,753 | 281,946 | - | 2,695 | - | 1,177,551 | 11,431,250 |
| Fidelity High Income Fund | - | 2,206,427 | 48,433 | 48,836 | (84) | 13,887 | 2,171,797 |
| Fidelity Inflation-Protected Bond Index Fund | 14,904,513 | 1,119,584 | 2,869,865 | 25,333 | (311,836) | 402,366 | 13,244,762 |
| Fidelity Infrastructure Fund | 720,315 | 75,892 | 33,896 | 1,875 | (188) | 28,733 | 790,856 |
| Fidelity International Capital Appreciation Fund | 15,982,839 | 1,427,323 | 704,519 | - | 8,150 | 1,298,406 | 18,012,199 |
| Fidelity International Discovery Fund | 18,630,495 | 1,870,713 | 922,774 | - | 20,486 | 2,327,288 | 21,926,208 |
| Fidelity International Small Cap Fund | 8,656,697 | 734,949 | 363,294 | - | 2,546 | 245,450 | 9,276,348 |
| Fidelity International Small Cap Opportunities Fund | 9,671,322 | 971,118 | - | - | - | (42,560) | 10,599,880 |
| Fidelity International Value Fund | 12,459,531 | 971,118 | 479,573 | - | 87 | 930,883 | 13,882,046 |
| Fidelity Japan Fund | 1,820,067 | - | - | - | - | 87,210 | 1,907,277 |
| Fidelity Japan Smaller Companies Fund | 6,837,976 | - | - | - | - | 308,549 | 7,146,525 |
| Fidelity Long-Term Treasury Bond Index Fund | 10,199,317 | 452,169 | 5,660,974 | 108,438 | (568,129) | 68,417 | 4,490,800 |
| Fidelity Low-Priced Stock Fund | 29,032,604 | 2,462,356 | 11,211,693 | - | (627,603) | 2,668,186 | 22,323,850 |
| Fidelity New Markets Income Fund | 2,059,321 | 133,278 | 1,747,613 | 40,481 | 47,320 | (38,323) | 453,983 |
| Fidelity Overseas Fund | 75,065,263 | 7,053,162 | 3,481,400 | - | 35,920 | 6,002,377 | 84,675,322 |
| Fidelity Real Estate Investment Portfolio | 3,959,349 | 304,059 | 132,395 | 15,178 | (636) | (112,616) | 4,017,761 |
| Fidelity Total Bond Fund | 41,847,328 | 5,693,974 | 3,325,267 | 896,314 | (95,264) | (696,599) | 43,424,172 |
| Fidelity U.S. Low Volatility Equity Fund | 7,807,593 | 37,919 | 8,010,867 | - | 1,114,944 | (949,589) | - |
| Fidelity Value Discovery Fund | 14,701,329 | 560,555 | 16,073,494 | - | 4,042,840 | (3,231,230) | - |
| VIP Investment Grade Bond II Portfolio Investor Class | 41,702,201 | 5,020,725 | 3,164,676 | 25,506 | (83,569) | (47,121) | 43,427,560 |
| VIP Stock Selector All Cap Portfolio Investor Class | 303,814,232 | 90,847,894 | 11,688,366 | - | 114,646 | 34,727,130 | 417,815,536 |
| | 794,297,915 | 144,634,647 | 117,723,559 | 1,882,665 | 12,791,296 | 52,421,838 | 886,422,137 |
Amounts in the dividend income column in the above table include any capital gain distributions from underlying funds, which are presented in the corresponding line item in the Statement of Operations, if applicable.
Amounts included in the purchases and sales proceeds columns may include in-kind transactions, if applicable.
Investment Valuation
The following is a summary of the inputs used, as of June 30, 2024, involving the Fund's assets and liabilities carried at fair value. The inputs or methodology used for valuing securities may not be an indication of the risk associated with investing in those securities. For more information on valuation inputs, and their aggregation into the levels used below, please refer to the Investment Valuation section in the accompanying Notes to Financial Statements.
| Valuation Inputs at Reporting Date: |
| Description | Total ($) | Level 1 ($) | Level 2 ($) | Level 3 ($) |
Investments in Securities: | | | | |
|
| Equity Funds | 788,568,823 | 788,568,823 | - | - |
|
| Fixed-Income Funds | 109,314,499 | 109,314,499 | - | - |
|
| Money Market Funds | 3,817,464 | 3,817,464 | - | - |
|
| Other Short-Term Investments and Net Other Assets | 1,358,553 | - | 1,358,553 | - |
| Total Investments in Securities: | 903,059,339 | 901,700,786 | 1,358,553 | - |
Derivative Instruments: Assets | | | | |
Futures Contracts | 96,927 | 96,927 | - | - |
| Total Assets | 96,927 | 96,927 | - | - |
| Total Derivative Instruments: | 96,927 | 96,927 | - | - |
Value of Derivative Instruments
The following table is a summary of the Fund's value of derivative instruments by primary risk exposure as of June 30, 2024. For additional information on derivative instruments, please refer to the Derivative Instruments section in the accompanying Notes to Financial Statements.
Primary Risk Exposure / Derivative Type | Value |
| Asset ($) | Liability ($) |
| Equity Risk | | |
Futures Contracts (a) | 96,927 | 0 |
| Total Equity Risk | 96,927 | 0 |
| Total Value of Derivatives | 96,927 | 0 |
(a)Reflects gross cumulative appreciation (depreciation) on futures contracts as presented in the Schedule of Investments. In the Statement of Assets and Liabilities, the period end daily variation margin is included in receivable or payable for daily variation margin on futures contracts, and the net cumulative appreciation (depreciation) is included in Total accumulated earnings (loss).
VIP FundsManager® 85% Portfolio
Financial Statements (Unaudited)
| Statement of Assets and Liabilities |
| | | | June 30, 2024 (Unaudited) |
| | | | | |
| Assets | | | | |
| Investment in securities, at value - See accompanying schedule: | | | | |
Unaffiliated issuers (cost $12,253,825) | $ | 12,819,738 | | |
Fidelity Central Funds (cost $3,817,464) | | 3,817,464 | | |
Other affiliated issuers (cost $776,338,451) | | 886,422,137 | | |
| | | | | |
| | | | | |
| Total Investment in Securities (cost $792,409,740) | | | $ | 903,059,339 |
| Cash | | | | 8,700 |
| Receivable for investments sold | | | | 49,241 |
| Receivable for fund shares sold | | | | 498,140 |
| Distributions receivable from Fidelity Central Funds | | | | 27,530 |
| Receivable for daily variation margin on futures contracts | | | | 26,400 |
Total assets | | | | 903,669,350 |
| Liabilities | | | | |
| Payable for investments purchased | $ | 488,809 | | |
| Payable for fund shares redeemed | | 58,560 | | |
| Accrued management fee | | 74,789 | | |
| Distribution and service plan fees payable | | 7,182 | | |
| Total liabilities | | | | 629,340 |
| Net Assets | | | $ | 903,040,010 |
| Net Assets consist of: | | | | |
| Paid in capital | | | $ | 790,259,714 |
| Total accumulated earnings (loss) | | | | 112,780,296 |
| Net Assets | | | $ | 903,040,010 |
| | | | | |
| Net Asset Value and Maximum Offering Price | | | | |
| Service Class : | | | | |
Net Asset Value, offering price and redemption price per share ($113,871 ÷ 8,584 shares) | | | $ | 13.27 |
| Service Class 2 : | | | | |
Net Asset Value, offering price and redemption price per share ($57,405,098 ÷ 4,393,876 shares) | | | $ | 13.06 |
| Investor Class : | | | | |
Net Asset Value, offering price and redemption price per share ($845,521,041 ÷ 64,040,237 shares) | | | $ | 13.20 |
| Statement of Operations |
| | | | Six months ended June 30, 2024 (Unaudited) |
| Investment Income | | | | |
| Dividends: | | | | |
| Unaffiliated issuers | | | $ | 33,903 |
| Affiliated issuers | | | | 1,791,619 |
| Interest | | | | 45,188 |
| Income from Fidelity Central Funds | | | | 641,935 |
| Total income | | | | 2,512,645 |
| Expenses | | | | |
| Management fee | $ | 637,211 | | |
| Distribution and service plan fees | | 69,806 | | |
| Independent trustees' fees and expenses | | 1,112 | | |
| Total expenses before reductions | | 708,129 | | |
| Expense reductions | | (240,730) | | |
| Total expenses after reductions | | | | 467,399 |
| Net Investment income (loss) | | | | 2,045,246 |
| Realized and Unrealized Gain (Loss) | | | | |
| Net realized gain (loss) on: | | | | |
| Investment Securities: | | | | |
| Unaffiliated issuers | | 37,877 | | |
| Fidelity Central Funds | | (12) | | |
| Other affiliated issuers | | 12,791,296 | | |
| Foreign currency transactions | | 58 | | |
| Futures contracts | | 2,067,311 | | |
| Capital gain distributions from underlying funds: | | | | |
| Affiliated issuers | | 91,046 | | |
| Total net realized gain (loss) | | | | 14,987,576 |
| Change in net unrealized appreciation (depreciation) on: | | | | |
| Investment Securities: | | | | |
| Unaffiliated issuers | | 565,670 | | |
| Affiliated issuers | | 52,421,838 | | |
| Futures contracts | | (807,941) | | |
| Total change in net unrealized appreciation (depreciation) | | | | 52,179,567 |
| Net gain (loss) | | | | 67,167,143 |
| Net increase (decrease) in net assets resulting from operations | | | $ | 69,212,389 |
| Statement of Changes in Net Assets |
| |
| | Six months ended June 30, 2024 (Unaudited) | | Year ended December 31, 2023 |
| Increase (Decrease) in Net Assets | | | | |
| Operations | | | | |
| Net investment income (loss) | $ | 2,045,246 | $ | 10,788,033 |
| Net realized gain (loss) | | 14,987,576 | | (2,632,268) |
| Change in net unrealized appreciation (depreciation) | | 52,179,567 | | 112,771,154 |
| Net increase (decrease) in net assets resulting from operations | | 69,212,389 | | 120,926,919 |
| Distributions to shareholders | | (328,662) | | (11,901,106) |
| | | | | |
| Share transactions - net increase (decrease) | | 32,083,426 | | 8,282,094 |
| Total increase (decrease) in net assets | | 100,967,153 | | 117,307,907 |
| | | | | |
| Net Assets | | | | |
| Beginning of period | | 802,072,857 | | 684,764,950 |
| End of period | $ | 903,040,010 | $ | 802,072,857 |
| | | | | |
| | | | | |
Financial Highlights
VIP FundsManager® 85% Portfolio Service Class |
| |
| | Six months ended (Unaudited) June 30, 2024 | | Years ended December 31, 2023 | | 2022 | | 2021 | | 2020 | | 2019 |
Selected Per-Share Data | | | | | | | | | | | | |
| Net asset value, beginning of period | $ | 12.23 | $ | 10.55 | $ | 15.82 | $ | 13.88 | $ | 12.25 | $ | 11.65 |
| Income from Investment Operations | | | | | | | | | | | | |
Net investment income (loss) A,B | | .03 | | .17 | | .12 | | .12 | | .09 | | .15 |
| Net realized and unrealized gain (loss) | | 1.02 | | 1.69 | | (2.46) | | 2.34 | | 2.04 | | 2.58 |
| Total from investment operations | | 1.05 | | 1.86 | | (2.34) | | 2.46 | | 2.13 | | 2.73 |
| Distributions from net investment income | | (.01) | | (.18) | | (.13) | | (.15) | | (.10) | | (.14) |
| Distributions from net realized gain | | - | | - | | (2.80) | | (.37) | | (.39) | | (1.99) |
| Total distributions | | (.01) | | (.18) | | (2.93) | | (.52) | | (.50) C | | (2.13) |
| Net asset value, end of period | $ | 13.27 | $ | 12.23 | $ | 10.55 | $ | 15.82 | $ | 13.88 | $ | 12.25 |
Total Return D,E,F | | | | 17.69% | | (17.01)% | | 18.02% | | 17.93% | | 26.05% |
Ratios to Average Net Assets B,G,H | | | | | | | | | | | | |
| Expenses before reductions | | .25% I | | .25% | | .29% | | .25% | | .25% | | .25% |
| Expenses net of fee waivers, if any | | | | .10% | | .14% | | .20% | | .20% | | .20% |
| Expenses net of all reductions | | .10% I | | .10% | | .14% | | .20% | | .20% | | .20% |
| Net investment income (loss) | | .49% I | | 1.48% | | 1.18% | | .78% | | .82% | | 1.26% |
| Supplemental Data | | | | | | | | | | | | |
| Net assets, end of period (000 omitted) | $ | 114 | $ | 111 | $ | 100 | $ | - | $ | - | $ | - |
Portfolio turnover rate J | | | | 19% | | 28% K | | 68% K | | 37% K | | 38% |
ACalculated based on average shares outstanding during the period.
BNet investment income (loss) is affected by the timing of the declaration of dividends by any underlying mutual funds or exchange-traded funds (ETFs). Net investment income (loss) of any mutual funds or ETFs is not included in the Fund's net investment income (loss) ratio.
CTotal distributions per share do not sum due to rounding.
DTotal returns for periods of less than one year are not annualized.
ETotal returns do not reflect charges attributable to your insurance company's separate account. Inclusion of these charges would reduce the total returns shown.
FTotal returns would have been lower if certain expenses had not been reduced during the applicable periods shown.
GFees and expenses of any underlying mutual funds or exchange-traded funds (ETFs) are not included in the Fund's expense ratio. The Fund indirectly bears its proportionate share of these expenses. For additional expense information related to investments in Fidelity Central Funds, please refer to the "Investments in Fidelity Central Funds" note found in the Notes to Financial Statements section of the most recent Annual or Semi-Annual report.
HExpense ratios reflect operating expenses of the class. Expenses before reductions do not reflect amounts reimbursed, waived, or reduced through arrangements with the investment adviser, brokerage services, or other offset arrangements, if applicable, and do not represent the amount paid by the class during periods when reimbursements, waivers or reductions occur.
IAnnualized.
JAmount does not include the portfolio activity of any underlying mutual funds or exchange-traded funds (ETFs).
KPortfolio turnover rate excludes securities received or delivered in-kind.
VIP FundsManager® 85% Portfolio Service Class 2 |
| |
| | Six months ended (Unaudited) June 30, 2024 | | Years ended December 31, 2023 | | 2022 | | 2021 | | 2020 | | 2019 |
Selected Per-Share Data | | | | | | | | | | | | |
| Net asset value, beginning of period | $ | 12.05 | $ | 10.40 | $ | 15.65 | $ | 13.76 | $ | 12.20 | $ | 11.59 |
| Income from Investment Operations | | | | | | | | | | | | |
Net investment income (loss) A,B | | .02 | | .15 | | .11 | | .10 | | .08 | | .13 |
| Net realized and unrealized gain (loss) | | 1.00 | | 1.67 | | (2.45) | | 2.29 | | 1.96 | | 2.60 |
| Total from investment operations | | 1.02 | | 1.82 | | (2.34) | | 2.39 | | 2.04 | | 2.73 |
| Distributions from net investment income | | (.01) | | (.17) | | (.11) | | (.13) | | (.09) | | (.13) |
| Distributions from net realized gain | | - | | - | | (2.80) | | (.37) | | (.39) | | (1.99) |
| Total distributions | | (.01) | | (.17) | | (2.91) | | (.50) | | (.48) | | (2.12) |
| Net asset value, end of period | $ | 13.06 | $ | 12.05 | $ | 10.40 | $ | 15.65 | $ | 13.76 | $ | 12.20 |
Total Return C,D,E | | | | 17.48% | | (17.19)% | | 17.64% | | 17.27% | | 26.14% |
Ratios to Average Net Assets B,F,G | | | | | | | | | | | | |
| Expenses before reductions | | .40% H | | .40% | | .44% | | .50% | | .50% | | .50% |
| Expenses net of fee waivers, if any | | | | .25% | | .29% | | .35% | | .35% | | .35% |
| Expenses net of all reductions | | .25% H | | .25% | | .29% | | .35% | | .35% | | .35% |
| Net investment income (loss) | | .34% H | | 1.33% | | 1.03% | | .68% | | .68% | | 1.16% |
| Supplemental Data | | | | | | | | | | | | |
| Net assets, end of period (000 omitted) | $ | 57,405 | $ | 53,871 | $ | 48,826 | $ | 58,047 | $ | 48,373 | $ | 40,928 |
Portfolio turnover rate I | | | | 19% | | 28% J | | 68% J | | 37% J | | 38% |
ACalculated based on average shares outstanding during the period.
BNet investment income (loss) is affected by the timing of the declaration of dividends by any underlying mutual funds or exchange-traded funds (ETFs). Net investment income (loss) of any mutual funds or ETFs is not included in the Fund's net investment income (loss) ratio.
CTotal returns for periods of less than one year are not annualized.
DTotal returns do not reflect charges attributable to your insurance company's separate account. Inclusion of these charges would reduce the total returns shown.
ETotal returns would have been lower if certain expenses had not been reduced during the applicable periods shown.
FFees and expenses of any underlying mutual funds or exchange-traded funds (ETFs) are not included in the Fund's expense ratio. The Fund indirectly bears its proportionate share of these expenses. For additional expense information related to investments in Fidelity Central Funds, please refer to the "Investments in Fidelity Central Funds" note found in the Notes to Financial Statements section of the most recent Annual or Semi-Annual report.
GExpense ratios reflect operating expenses of the class. Expenses before reductions do not reflect amounts reimbursed, waived, or reduced through arrangements with the investment adviser, brokerage services, or other offset arrangements, if applicable, and do not represent the amount paid by the class during periods when reimbursements, waivers or reductions occur.
HAnnualized.
IAmount does not include the portfolio activity of any underlying mutual funds or exchange-traded funds (ETFs).
JPortfolio turnover rate excludes securities received or delivered in-kind.
VIP FundsManager® 85% Portfolio Investor Class |
| |
| | Six months ended (Unaudited) June 30, 2024 | | Years ended December 31, 2023 | | 2022 | | 2021 | | 2020 | | 2019 |
Selected Per-Share Data | | | | | | | | | | | | |
| Net asset value, beginning of period | $ | 12.17 | $ | 10.50 | $ | 15.77 | $ | 13.86 | $ | 12.28 | $ | 11.66 |
| Income from Investment Operations | | | | | | | | | | | | |
Net investment income (loss) A,B | | .03 | | .17 | | .13 | | .12 | | .10 | | .15 |
| Net realized and unrealized gain (loss) | | 1.01 | | 1.68 | | (2.47) | | 2.31 | | 1.98 | | 2.60 |
| Total from investment operations | | 1.04 | | 1.85 | | (2.34) | | 2.43 | | 2.08 | | 2.75 |
| Distributions from net investment income | | (.01) | | (.18) | | (.13) | | (.15) | | (.10) | | (.14) |
| Distributions from net realized gain | | - | | - | | (2.80) | | (.37) | | (.39) | | (1.99) |
| Total distributions | | (.01) | | (.18) | | (2.93) | | (.52) | | (.50) C | | (2.13) |
| Net asset value, end of period | $ | 13.20 | $ | 12.17 | $ | 10.50 | $ | 15.77 | $ | 13.86 | $ | 12.28 |
Total Return D,E,F | | | | 17.68% | | (17.07)% | | 17.83% | | 17.46% | | 26.21% |
Ratios to Average Net Assets B,G,H | | | | | | | | | | | | |
| Expenses before reductions | | .15% I | | .15% | | .19% | | .25% | | .25% | | .25% |
| Expenses net of fee waivers, if any | | | | .10% | | .14% | | .20% | | .20% | | .20% |
| Expenses net of all reductions | | .10% I | | .10% | | .14% | | .20% | | .20% | | .20% |
| Net investment income (loss) | | .49% I | | 1.48% | | 1.18% | | .83% | | .83% | | 1.31% |
| Supplemental Data | | | | | | | | | | | | |
| Net assets, end of period (000 omitted) | $ | 845,521 | $ | 748,091 | $ | 635,839 | $ | 755,243 | $ | 615,808 | $ | 548,925 |
Portfolio turnover rate J | | | | 19% | | 28% K | | 68% K | | 37% K | | 38% |
ACalculated based on average shares outstanding during the period.
BNet investment income (loss) is affected by the timing of the declaration of dividends by any underlying mutual funds or exchange-traded funds (ETFs). Net investment income (loss) of any mutual funds or ETFs is not included in the Fund's net investment income (loss) ratio.
CTotal distributions per share do not sum due to rounding.
DTotal returns for periods of less than one year are not annualized.
ETotal returns do not reflect charges attributable to your insurance company's separate account. Inclusion of these charges would reduce the total returns shown.
FTotal returns would have been lower if certain expenses had not been reduced during the applicable periods shown.
GFees and expenses of any underlying mutual funds or exchange-traded funds (ETFs) are not included in the Fund's expense ratio. The Fund indirectly bears its proportionate share of these expenses. For additional expense information related to investments in Fidelity Central Funds, please refer to the "Investments in Fidelity Central Funds" note found in the Notes to Financial Statements section of the most recent Annual or Semi-Annual report.
HExpense ratios reflect operating expenses of the class. Expenses before reductions do not reflect amounts reimbursed, waived, or reduced through arrangements with the investment adviser, brokerage services, or other offset arrangements, if applicable, and do not represent the amount paid by the class during periods when reimbursements, waivers or reductions occur.
IAnnualized.
JAmount does not include the portfolio activity of any underlying mutual funds or exchange-traded funds (ETFs).
KPortfolio turnover rate excludes securities received or delivered in-kind.
Notes to Financial Statements
(Unaudited)For the period ended June 30, 2024
1. Organization.
VIP FundsManager 20% Portfolio, VIP FundsManager 30% Portfolio, VIP FundsManager 40% Portfolio, VIP FundsManager 50% Portfolio, VIP FundsManager 60% Portfolio, VIP FundsManager 70% Portfolio, and VIP FundsManager 85% Portfolio (the Funds) are funds of Variable Insurance Products Fund V (the Trust). The Trust is registered under the Investment Company Act of 1940, as amended (the 1940 Act), as an open-end management investment company organized as a Massachusetts business trust. Each Fund is authorized to issue an unlimited number of shares. Shares of each Fund may only be purchased by insurance companies for the purpose of funding variable annuity or variable life insurance contracts. Each Fund offers three classes of shares: Service Class, Service Class 2 and Investor Class. All classes have equal rights and voting privileges, except for matters affecting a single class.
2. Investments in Fidelity Central Funds.
Funds may invest in Fidelity Central Funds, which are open-end investment companies generally available only to other investment companies and accounts managed by the investment adviser and its affiliates. The Schedule of Investments lists any Fidelity Central Funds held as an investment as of period end, but does not include the underlying holdings of each Fidelity Central Fund. An investing fund indirectly bears its proportionate share of the expenses of the underlying Fidelity Central Funds.
Based on its investment objective, each Fidelity Central Fund may invest or participate in various investment vehicles or strategies that are similar to those of the investing fund. These strategies are consistent with the investment objectives of the investing fund and may involve certain economic risks which may cause a decline in value of each of the Fidelity Central Funds and thus a decline in the value of the investing fund.
| Fidelity Central Fund | Investment Manager | Investment Objective | Investment Practices | Expense RatioA |
| Fidelity Money Market Central Funds | Fidelity Management & Research Company LLC (FMR) | Each fund seeks to obtain a high level of current income consistent with the preservation of capital and liquidity. | Short-term Investments | Less than .005% |
A Expenses expressed as a percentage of average net assets and are as of each underlying Central Fund's most recent annual or semi-annual shareholder report.
A complete unaudited list of holdings for each Fidelity Central Fund is available upon request or at the Securities and Exchange Commission website at www.sec.gov. In addition, the financial statements of the Fidelity Central Funds which contain the significant accounting policies (including investment valuation policies) of those funds, and are not covered by the Report of Independent Registered Public Accounting Firm, are available on the Securities and Exchange Commission website or upon request.
3. Significant Accounting Policies.
Each Fund is an investment company and applies the accounting and reporting guidance of the Financial Accounting Standards Board (FASB) Accounting Standards Codification Topic 946 Financial Services - Investment Companies. The financial statements have been prepared in conformity with accounting principles generally accepted in the United States of America (GAAP), which require management to make certain estimates and assumptions at the date of the financial statements. Actual results could differ from those estimates. Subsequent events, if any, through the date that the financial statements were issued have been evaluated in the preparation of the financial statements. Each Fund's Schedule of Investments lists any underlying mutual funds or exchange-traded funds (ETFs) but does not include the underlying holdings of these funds. The following summarizes the significant accounting policies of each Fund:
Investment Valuation. Investments are valued as of 4:00 p.m. Eastern time on the last calendar day of the period. Each Fund uses a third party pricing service approved by the Board of Trustees (the Board) to value its investments. The Board of Trustees (the Board) has designated each Fund's investment adviser as the valuation designee responsible for the fair valuation function and performing fair value determinations as needed. The investment adviser has established a Fair Value Committee (the Committee) to carry out the day-to-day fair valuation responsibilities and has adopted policies and procedures to govern the fair valuation process and the activities of the Committee. In accordance with these fair valuation policies and procedures, which have been approved by the Board, each Fund attempts to obtain prices from one or more third party pricing services or brokers to value its investments. When current market prices, quotations or currency exchange rates are not readily available or reliable, investments will be fair valued in good faith by the Committee, in accordance with the policies and procedures. Factors used in determining fair value vary by investment type and may include market or investment specific events, transaction data, estimated cash flows, and market observations of comparable investments. The frequency that the fair valuation procedures are used cannot be predicted and they may be utilized to a significant extent. The Committee manages each Fund's fair valuation practices and maintains the fair valuation policies and procedures. Each Fund's investment adviser reports to the Board information regarding the fair valuation process and related material matters. Each Fund categorizes the inputs to valuation techniques used to value its investments into a disclosure hierarchy consisting of three levels as shown below:
Level 1 - unadjusted quoted prices in active markets for identical investments
Level 2 - other significant observable inputs (including quoted prices for similar investments, interest rates, prepayment speeds, etc.)
Level 3 - unobservable inputs (including the Fund's own assumptions based on the best information available)
Valuation techniques used to value each Fund's investments by major category are as follows:
Investments in open-end mutual funds are valued at their closing net asset value (NAV) each business day and are categorized as Level 1 in the hierarchy.
Debt securities, including restricted securities, are valued based on evaluated prices received from third party pricing services or from brokers who make markets in such securities. U.S. government and government agency obligations are valued by pricing services who utilize matrix pricing which considers yield or price of bonds of comparable quality, coupon, maturity and type or by broker-supplied prices. When independent prices are unavailable or unreliable, debt securities may be valued utilizing pricing methodologies which consider similar factors that would be used by third party pricing services. Debt securities are generally categorized as Level 2 in the hierarchy but may be Level 3 depending on the circumstances.
Exchange-Traded Funds (ETFs) are valued at their last sale price or official closing price as reported by a third party pricing service on the primary market or exchange on which they are traded and are categorized as Level 1 in the hierarchy. In the event there were no sales during the day but the exchange reports a closing bid level, ETFs are valued at the closing bid and would be categorized as Level 1 in the hierarchy. In the event there was no closing bid, ETFs may be valued by another method that the Board believes reflects fair value in accordance with the Board's fair value pricing policies and may be categorized as Level 2 in the hierarchy.
Futures contracts are valued at the settlement price established each day by the board of trade or exchange on which they are traded and are categorized as Level 1 in the hierarchy.
Changes in valuation techniques may result in transfers in or out of an assigned level within the disclosure hierarchy. The aggregate value of investments by input level as of June 30, 2024 is included at the end of each Fund's Schedule of Investments.
Foreign Currency. Certain Funds may use foreign currency contracts to facilitate transactions in foreign-denominated securities. Gains and losses from these transactions may arise from changes in the value of the foreign currency or if the counterparties do not perform under the contracts' terms.
Foreign-denominated assets, including investment securities, and liabilities are translated into U.S. dollars at the exchange rates at period end. Purchases and sales of investment securities, income and dividends received, and expenses denominated in foreign currencies are translated into U.S. dollars at the exchange rate in effect on the transaction date.
The effects of exchange rate fluctuations on investments are included with the net realized and unrealized gain (loss) on investment securities. Other foreign currency transactions resulting in realized and unrealized gain (loss) are disclosed separately.
Investment Transactions and Income. For financial reporting purposes, the Funds' investment holdings and NAV include trades executed through the end of the last business day of the period. The NAV per share for processing shareholder transactions is calculated as of the close of business of the New York Stock Exchange (NYSE), normally 4:00 p.m. Eastern time and includes trades executed through the end of the prior business day. Gains and losses on securities sold are determined on the basis of identified cost. Income and capital gain distributions from any underlying mutual funds or exchange-traded funds (ETFs) are recorded on the ex-dividend date. Interest income is accrued as earned. Interest income includes coupon interest and amortization of premium and accretion of discount on debt securities as applicable.
Class Allocations and Expenses. Investment income, realized and unrealized capital gains and losses, common expenses of a fund, and certain fund-level expense reductions, if any, are allocated daily on a pro-rata basis to each class based on the relative net assets of each class to the total net assets of a fund. Each class differs with respect to transfer agent and distribution and service plan fees incurred, as applicable. Certain expense reductions may also differ by class, if applicable. For the reporting period, the allocated portion of income and expenses to each class as a percent of its average net assets may vary due to the timing of recording these transactions in relation to fluctuating net assets of the classes. Expenses directly attributable to a fund are charged to that fund. Expenses attributable to more than one fund are allocated among the respective funds on the basis of relative net assets or other appropriate methods. Expenses included in the accompanying financial statements reflect the expenses of that fund and do not include any expenses associated with any underlying mutual funds or exchange-traded funds (ETFs). Although not included in a fund's expenses, a fund indirectly bears its proportionate share of these expenses through the net asset value of each underlying mutual fund or exchange-traded fund (ETF). Expense estimates are accrued in the period to which they relate and adjustments are made when actual amounts are known.
Income Tax Information and Distributions to Shareholders. Each year, each Fund intends to qualify as a regulated investment company under Subchapter M of the Internal Revenue Code, including distributing substantially all of its taxable income and realized gains. As a result, no provision for U.S. Federal income taxes is required. Each Fund files a U.S. federal tax return, in addition to state and local tax returns as required. Each Fund's federal income tax returns are subject to examination by the Internal Revenue Service (IRS) for a period of three fiscal years after they are filed. State and local tax returns may be subject to examination for an additional fiscal year depending on the jurisdiction. Foreign taxes are provided for based on each Fund's understanding of the tax rules and rates that exist in the foreign markets in which it invests.
Distributions are declared and recorded on the ex-dividend date. Income and capital gain distributions are declared separately for each class. Income and capital gain distributions are determined in accordance with income tax regulations, which may differ from GAAP.
Capital accounts within the financial statements are adjusted for permanent book-tax differences. These adjustments have no impact on net assets or the results of operations. Capital accounts are not adjusted for temporary book-tax differences which will reverse in a subsequent period.
Book-tax differences are primarily due to the short-term gain distributions from the underlying mutual funds or exchange-traded funds (ETFs), futures contracts, capital loss carryforwards and losses deferred due to wash sales.
As of period end, the cost and unrealized appreciation (depreciation) in securities, and derivatives if applicable, for federal income tax purposes were as follows for each Fund:
| | Tax cost ($) | Gross unrealized appreciation ($) | Gross unrealized depreciation ($) | Net unrealized appreciation (depreciation)($) |
| VIP FundsManager 20% Portfolio | 692,913,385 | 28,212,506 | (15,210,384) | 13,002,122 |
| VIP FundsManager 30% Portfolio | 10,917,372 | 440,494 | (27,022) | 413,472 |
| VIP FundsManager 40% Portfolio | 16,866,009 | 1,035,805 | (35,231) | 1,000,574 |
| VIP FundsManager 50% Portfolio | 3,806,943,749 | 423,635,420 | (70,984,225) | 352,651,195 |
| VIP FundsManager 60% Portfolio | 6,010,679,000 | 738,575,415 | (88,995,381) | 649,580,034 |
| VIP FundsManager 70% Portfolio | 1,963,419,881 | 259,707,979 | (20,123,310) | 239,584,669 |
| VIP FundsManager 85% Portfolio | 795,784,241 | 112,455,824 | (5,083,799) | 107,372,025 |
Capital loss carryforwards are only available to offset future capital gains of the Funds to the extent provided by regulations and may be limited. The capital loss carryforward information presented below, including any applicable limitation, is estimated as of prior fiscal period end and is subject to adjustment.
| | Short-term ($) | Long-term ($) | Total capital loss carryforward ($) |
| VIP FundsManager 20% Portfolio | (10,873,516) | (25,169,012) | (36,042,528) |
| VIP FundsManager 50% Portfolio | (66,046,714) | (104,626,748) | (170,673,462) |
| VIP FundsManager 60% Portfolio | (114,643,499) | (6,871,760) | (121,515,259) |
| VIP FundsManager 70% Portfolio | (28,230,539) | (2,532,177) | (30,762,716) |
| VIP FundsManager 85% Portfolio | (9,864,159) | (-) | (9,864,159) |
4. Derivative Instruments.
Risk Exposures and the Use of Derivative Instruments. Each Fund's investment objectives allow for various types of derivative instruments, including futures contracts. Derivatives are investments whose value is primarily derived from underlying assets, indices or reference rates and may be transacted on an exchange or over-the-counter (OTC). Derivatives may involve a future commitment to buy or sell a specified asset based on specified terms, to exchange future cash flows at periodic intervals based on a notional principal amount, or for one party to make one or more payments upon the occurrence of specified events in exchange for periodic payments from the other party.
Derivatives were used to increase returns and to manage exposure to certain risks as defined below. The success of any strategy involving derivatives depends on analysis of numerous economic factors, and if the strategies for investment do not work as intended, the objectives may not be achieved.
Derivatives were used to increase or decrease exposure to the following risk(s):
| | |
| Equity Risk | Equity risk relates to the fluctuations in the value of financial instruments as a result of changes in market prices (other than those arising from interest rate risk or foreign exchange risk), whether caused by factors specific to an individual investment, its issuer, or all factors affecting all instruments traded in a market or market segment. |
Funds are also exposed to additional risks from investing in derivatives, such as liquidity risk and counterparty credit risk. Liquidity risk is the risk that a fund will be unable to close out the derivative in the open market in a timely manner. Counterparty credit risk is the risk that the counterparty will not be able to fulfill its obligation to a fund. Counterparty credit risk related to exchange-traded contracts may be mitigated by the protection provided by the exchange on which they trade.
Investing in derivatives may involve greater risks than investing in the underlying assets directly and, to varying degrees, may involve risk of loss in excess of any initial investment and collateral received and amounts recognized in the Statement of Assets and Liabilities. In addition, there may be the risk that the change in value of the derivative contract does not correspond to the change in value of the underlying instrument.
Futures Contracts. A futures contract is an agreement between two parties to buy or sell a specified underlying instrument for a fixed price at a specified future date. Futures contracts were used to manage exposure to the stock market.
Upon entering into a futures contract, a fund is required to deposit either cash or securities (initial margin) with a clearing broker in an amount equal to a certain percentage of the face value of the contract. Futures contracts are marked-to-market daily and subsequent daily payments are made or received by a fund depending on the daily fluctuations in the value of the futures contracts and are recorded as unrealized appreciation or (depreciation). This receivable and/or payable, if any, is included in daily variation margin on futures contracts in the Statement of Assets and Liabilities. Realized gain or (loss) is recorded upon the expiration or closing of a futures contract. The net realized gain (loss) and change in net unrealized appreciation (depreciation) on futures contracts during the period is presented in the Statement of Operations.
Any open futures contracts at period end are presented in the Schedule of Investments under the caption "Futures Contracts". The notional amount at value reflects each contract's exposure to the underlying instrument or index at period end, and is representative of volume of activity during the period unless an average notional amount is presented. Any securities deposited to meet initial margin requirements are identified in the Schedule of Investments. Any cash deposited to meet initial margin requirements is presented as segregated cash with brokers for derivative instruments in the Statement of Assets and Liabilities.
5. Purchases and Sales of Investments.
Purchases and sales of securities, other than short-term securities and in-kind transactions, as applicable, are noted in the table below.
| | Purchases ($) | Sales ($) |
| VIP FundsManager 20% Portfolio | 40,882,653 | 104,006,621 |
| VIP FundsManager 30% Portfolio | 5,645,212 | 1,059,504 |
| VIP FundsManager 40% Portfolio | 4,568,986 | 1,695,255 |
| VIP FundsManager 50% Portfolio | 206,234,185 | 775,757,978 |
| VIP FundsManager 60% Portfolio | 503,863,453 | 765,962,534 |
| VIP FundsManager 70% Portfolio | 165,237,221 | 230,383,425 |
| VIP FundsManager 85% Portfolio | 144,634,647 | 117,723,559 |
6. Fees and Other Transactions with Affiliates.
Management Fee. Fidelity Management & Research Company LLC (the investment adviser) provides the Funds with investment management related services. For these services each Fund pays a monthly management fee to the investment adviser. The management fee is based on an annual rate of .15% of each fund's average net assets. Under the management contract, the investment adviser pays all other fund-level operating expenses, except the compensation of the independent Trustees and certain other expenses such as interest expense. The management fee is reduced by an amount equal to the fees and expenses paid by the Funds to the independent Trustees.
During the period, the investment adviser waived a portion of its management fee as described in the Expense Reductions note.
Distribution and Service Plan Fees. In accordance with Rule 12b-1 of the 1940 Act, the Funds have adopted separate 12b-1 Plans for each Service Class of shares. Each Service Class pays Fidelity Distributors Company LLC (FDC), an affiliate of the investment adviser, a service fee. For the period, the service fee is based on an annual rate of .10% of Service Class' average net assets and .25% of Service Class 2's average net assets.
For the period, total fees, all of which were reallowed to insurance companies for the distribution of shares and providing shareholder support services were as follows:
| | Service Class ($) | Service Class 2 ($) | Total ($) |
| VIP FundsManager 20% Portfolio | 30 | 14,717 | 14,747 |
| VIP FundsManager 30% Portfolio | 173 | 433 | 606 |
| VIP FundsManager 40% Portfolio | 176 | 441 | 617 |
| VIP FundsManager 50% Portfolio | 27 | 98,332 | 98,359 |
| VIP FundsManager 60% Portfolio | 50,756 | 729,554 | 780,310 |
| VIP FundsManager 70% Portfolio | 34 | 87,176 | 87,210 |
| VIP FundsManager 85% Portfolio | 56 | 69,750 | 69,806 |
Interfund Trades. Funds may purchase from or sell securities to other Fidelity Funds under procedures adopted by the Board. The procedures have been designed to ensure these interfund trades are executed in accordance with Rule 17a-7 of the 1940 Act. Any interfund trades are included within the respective purchases and sales amounts shown in the Purchases and Sales of Investments note. Interfund trades during the period are noted in the table below. During the period, there were no interfund trades.
| | Purchases ($) | Sales ($) | Realized Gain (Loss)($) |
| VIP FundsManager 20% Portfolio | 8,775,304 | 20,837 | 22 |
| VIP FundsManager 30% Portfolio | 28,789 | - | - |
| VIP FundsManager 40% Portfolio | - | 52,343 | 153 |
| VIP FundsManager 50% Portfolio | 51,529,590 | 143,688 | 148 |
| VIP FundsManager 60% Portfolio | - | 40,121,231 | 112,458 |
| VIP FundsManager 70% Portfolio | - | 14,884,874 | 41,574 |
| VIP FundsManager 85% Portfolio | - | 5,571,441 | 14,811 |
Reallocation of Underlying Fund Investments. During the period, the investment adviser reallocated investments of the Funds. This involved taxable redemptions of each Fund's interest in Fidelity U.S. Low Volatility Equity Fund ("Underlying Fund") for investments. Net realized gain (loss) on the redemptions of the Underlying Fund in connection with the reallocation is included in the accompanying Statements of Operations as "Net realized gain (loss) on Affiliated issuers."
Details of these transactions with the net realized gain (loss) for the Funds are presented in the accompanying table:
| | Value of Investments and Cash reallocated ($) | Net realized gain (loss) on redemptions of Underlying Fund ($) |
| VIP FundsManager 20% Portfolio | 7,324,821 | 953,928 |
| VIP FundsManager 50% Portfolio | 42,189,458 | 5,917,244 |
| VIP FundsManager 60% Portfolio | 63,616,477 | 8,938,799 |
| VIP FundsManager 70% Portfolio | 20,635,443 | 2,889,874 |
| VIP FundsManager 85% Portfolio | 7,972,170 | 1,111,792 |
7. Expense Reductions.
The investment adviser contractually agreed to waive each Fund's management fee in an amount equal to .05% of each Fund's average net assets until April 30, 2025. During the period, each Fund's management fees were reduced by the following amounts:
| | Management Fee Waiver ($) |
| VIP FundsManager 20% Portfolio | 179,952 |
| VIP FundsManager 30% Portfolio | 2,210 |
| VIP FundsManager 40% Portfolio | 4,024 |
| VIP FundsManager 50% Portfolio | 1,060,358 |
| VIP FundsManager 60% Portfolio | 1,636,292 |
| VIP FundsManager 70% Portfolio | 533,191 |
| VIP FundsManager 85% Portfolio | 212,774 |
In addition, FMR has contractually agreed to reimburse 0.10% of class-level expenses for each Fund's Service Class and Service Class 2. During the period, this reimbursement reduced each Fund's Service Class and Service Class 2's expenses by the following amounts:
| | Reimbursement ($) |
| VIP FundsManager 20% Portfolio | |
| Service Class | 30 |
| Service Class 2 | 5,887 |
| VIP FundsManager 30% Portfolio | |
| Service Class | 173 |
| Service Class 2 | 173 |
| VIP FundsManager 40% Portfolio | |
| Service Class | 176 |
| Service Class 2 | 176 |
| VIP FundsManager 50% Portfolio | |
| Service Class | 27 |
| Service Class 2 | 39,333 |
| VIP FundsManager 60% Portfolio | |
| Service Class | 50,756 |
| Service Class 2 | 291,822 |
| VIP FundsManager 70% Portfolio | |
| Service Class | 34 |
| Service Class 2 | 34,871 |
| VIP FundsManager 85% Portfolio | |
| Service Class | 56 |
| Service Class 2 | 27,900 |
Through arrangements with each applicable Fund's custodian, credits realized as a result of certain uninvested cash balances were used to reduce each applicable Fund's or class' expenses. All of the applicable expense reductions are noted in the table below.
| | Custodian credits ($) |
| VIP FundsManager 30% Portfolio | 67 |
| VIP FundsManager 40% Portfolio | 76 |
8. Distributions to Shareholders.
Distributions to shareholders of each class were as follows:
| | Six months ended June 30, 2024 | Year ended December 31, 2023 |
| VIP FundsManager 20% Portfolio | | |
| Distributions to shareholders | | |
| Service Class | $62 | $2,225 |
| Service Class 2 | 12,239 | 411,354 |
| Investor Class | 752,815 | 27,074,396 |
Total | $765,116 | $27,487,975 |
| VIP FundsManager 30% Portfolio | | |
| Distributions to shareholders | | |
| Service Class | $300 | $6,993 |
| Service Class 2 | 300 | 6,627 |
| Investor Class | 5,390 | 110,816 |
Total | $5,990 | $124,436 |
| VIP FundsManager 40% Portfolio | | |
| Distributions to shareholders | | |
| Service Class | $433 | $5,028 |
| Service Class 2 | 433 | 4,662 |
| Investor Class | 18,004 | 192,101 |
Total | $18,870 | $201,791 |
| VIP FundsManager 50% Portfolio | | |
| Distributions to shareholders | | |
| Service Class | $33 | $1,338 |
| Service Class 2 | 47,881 | 1,817,121 |
| Investor Class | 2,579,235 | 106,632,373 |
Total | $2,627,149 | $108,450,832 |
| VIP FundsManager 60% Portfolio | | |
| Distributions to shareholders | | |
| Service Class | $49,725 | $2,118,631 |
| Service Class 2 | 297,776 | 12,240,216 |
| Investor Class | 2,951,296 | 127,858,116 |
Total | $3,298,797 | $142,216,963 |
| VIP FundsManager 70% Portfolio | | |
| Distributions to shareholders | | |
| Service Class | $32 | $1,277 |
| Service Class 2 | 33,914 | 1,226,654 |
| Investor Class | 985,371 | 38,257,527 |
Total | $1,019,317 | $39,485,458 |
| VIP FundsManager 85% Portfolio | | |
| Distributions to shareholders | | |
| Service Class | $45 | $1,658 |
| Service Class 2 | 22,267 | 739,759 |
| Investor Class | 306,350 | 11,159,689 |
Total | $328,662 | $11,901,106 |
9. Share Transactions.
Transactions for each class of shares were as follows and may contain in-kind transactions:
| | Shares | Shares | Dollars | Dollars |
| | Six months ended June 30, 2024 | Year ended December 31, 2023 | Six months ended June 30, 2024 | Year ended December 31, 2023 |
| VIP FundsManager 20% Portfolio | | | | |
| Service Class | | | | |
| Shares sold | 352 | 712 | $3,679 | $7,372 |
| Reinvestment of distributions | 1 | 23 | 7 | 240 |
| Shares redeemed | (314) | (522) | (3,313) | (5,385) |
| Net increase (decrease) | 39 | 213 | $373 | $2,227 |
| Service Class 2 | | | | |
| Shares sold | 102,053 | 151,146 | $1,071,336 | $1,554,620 |
| Reinvestment of distributions | 1,172 | 39,418 | 12,239 | 411,354 |
| Shares redeemed | (116,025) | (216,261) | (1,223,860) | (2,240,355) |
| Net increase (decrease) | (12,800) | (25,697) | $(140,285) | $(274,381) |
| Investor Class | | | | |
| Shares sold | 503,036 | 1,103,803 | $5,310,474 | $11,382,293 |
| Reinvestment of distributions | 71,902 | 2,587,222 | 752,815 | 27,074,396 |
| Shares redeemed | (5,489,422) | (13,861,772) | (57,889,123) | (143,235,669) |
| Net increase (decrease) | (4,914,484) | (10,170,747) | $(51,825,834) | $(104,778,980) |
| VIP FundsManager 30% Portfolio | | | | |
| Service Class | | | | |
| Shares sold | - | 33,300 | $ - | $333,000 |
| Net increase (decrease) | - | 33,300 | $- | $333,000 |
| Service Class 2 | | | | |
| Shares sold | - | 33,300 | $ - | $333,000 |
| Net increase (decrease) | - | 33,300 | $- | $333,000 |
| Investor Class | | | | |
| Shares sold | 519,251 | 566,712 | $5,396,998 | $5,625,882 |
| Reinvestment of distributions | 494 | 10,088 | 5,090 | 103,802 |
| Shares redeemed | (56,392) | (39,019) | (592,437) | (380,890) |
| Net increase (decrease) | 463,353 | 537,781 | $4,809,651 | $5,348,794 |
| VIP FundsManager 40% Portfolio | | | | |
| Service Class | | | | |
| Shares sold | - | 33,300 | $ - | $333,000 |
| Net increase (decrease) | - | 33,300 | $- | $333,000 |
| Service Class 2 | | | | |
| Shares sold | - | 33,300 | $ - | $333,000 |
| Net increase (decrease) | - | 33,300 | $- | $333,000 |
| Investor Class | | | | |
| Shares sold | 373,653 | 1,313,289 | $3,955,554 | $13,203,311 |
| Reinvestment of distributions | 1,677 | 17,935 | 17,570 | 187,057 |
| Shares redeemed | (82,382) | (41,115) | (877,075) | (421,553) |
| Net increase (decrease) | 292,948 | 1,290,109 | $3,096,049 | $12,968,815 |
| VIP FundsManager 50% Portfolio | | | | |
| Service Class | | | | |
| Shares sold | 14 | 80 | $157 | $870 |
| Reinvestment of distributions | - | - | - | 2 |
| Shares redeemed | (14) | (154) | (157) | (1,683) |
| Net increase (decrease) | - | (74) | $- | $(811) |
| Service Class 2 | | | | |
| Shares sold | 402,567 | 508,472 | $4,637,375 | $5,493,861 |
| Reinvestment of distributions | 4,189 | 161,277 | 47,881 | 1,817,121 |
| Shares redeemed | (551,409) | (1,183,544) | (6,381,164) | (12,765,469) |
| Net increase (decrease) | (144,653) | (513,795) | $(1,695,908) | $(5,454,487) |
| Investor Class | | | | |
| Shares sold | 847,764 | 1,973,837 | $9,770,050 | $21,448,148 |
| Reinvestment of distributions | 224,477 | 9,421,207 | 2,579,235 | 106,632,373 |
| Shares redeemed | (35,483,306) | (63,521,430) | (412,260,257) | (690,173,060) |
| Net increase (decrease) | (34,411,065) | (52,126,386) | $(399,910,972) | $(562,092,539) |
| VIP FundsManager 60% Portfolio | | | | |
| Service Class | | | | |
| Shares sold | 1,329,936 | 3,237,282 | $13,300,406 | $29,895,512 |
| Reinvestment of distributions | 5,056 | 219,119 | 49,701 | 2,117,582 |
| Shares redeemed | (747,341) | (1,302,569) | (7,413,174) | (12,065,112) |
| Net increase (decrease) | 587,651 | 2,153,832 | $5,936,933 | $19,947,982 |
| Service Class 2 | | | | |
| Shares sold | 865,623 | 3,424,085 | $8,626,514 | $31,360,733 |
| Reinvestment of distributions | 30,416 | 1,273,863 | 297,776 | 12,240,216 |
| Shares redeemed | (3,830,909) | (6,203,615) | (38,027,332) | (56,845,626) |
| Net increase (decrease) | (2,934,870) | (1,505,667) | $(29,103,042) | $(13,244,677) |
| Investor Class | | | | |
| Shares sold | 27,758,802 | 62,951,717 | $276,746,929 | $577,922,893 |
| Reinvestment of distributions | 300,234 | 13,243,928 | 2,951,296 | 127,858,116 |
| Shares redeemed | (41,332,580) | (69,556,604) | (412,581,538) | (639,785,221) |
| Net increase (decrease) | (13,273,544) | 6,639,041 | $(132,883,313) | $65,995,788 |
| VIP FundsManager 70% Portfolio | | | | |
| Service Class | | | | |
| Shares sold | 135 | 290 | $1,653 | $3,307 |
| Reinvestment of distributions | - | 1 | - | 16 |
| Shares redeemed | (132) | (290) | (1,651) | (3,305) |
| Net increase (decrease) | 3 | 1 | $2 | $18 |
| Service Class 2 | | | | |
| Shares sold | 120,778 | 293,434 | $1,512,511 | $3,342,027 |
| Reinvestment of distributions | 2,753 | 102,062 | 33,914 | 1,226,654 |
| Shares redeemed | (345,178) | (495,196) | (4,336,064) | (5,621,284) |
| Net increase (decrease) | (221,647) | (99,700) | $(2,789,639) | $(1,052,603) |
| Investor Class | | | | |
| Shares sold | 4,590,105 | 5,488,147 | $57,927,516 | $62,399,529 |
| Reinvestment of distributions | 79,465 | 3,160,203 | 985,371 | 38,257,527 |
| Shares redeemed | (5,752,069) | (10,570,255) | (72,378,933) | (121,301,257) |
| Net increase (decrease) | (1,082,499) | (1,921,905) | $(13,466,046) | $(20,644,201) |
| VIP FundsManager 85% Portfolio | | | | |
| Service Class | | | | |
| Shares sold | 101 | 1,156 | $1,278 | $12,667 |
| Reinvestment of distributions | 4 | 137 | 45 | 1,658 |
| Shares redeemed | (609) | (1,684) | (7,714) | (18,741) |
| Net increase (decrease) | (504) | (391) | $(6,391) | $(4,416) |
| Service Class 2 | | | | |
| Shares sold | 167,461 | 604,456 | $2,097,384 | $6,768,233 |
| Reinvestment of distributions | 1,807 | 62,010 | 22,267 | 739,759 |
| Shares redeemed | (244,991) | (892,306) | (3,074,794) | (9,967,296) |
| Net increase (decrease) | (75,723) | (225,840) | $(955,143) | $(2,459,304) |
| Investor Class | | | | |
| Shares sold | 4,519,124 | 4,659,068 | $57,544,561 | $52,385,474 |
| Reinvestment of distributions | 24,626 | 924,934 | 306,350 | 11,159,689 |
| Shares redeemed | (1,968,039) | (4,681,238) | (24,805,951) | (52,799,349) |
| Net increase (decrease) | 2,575,711 | 902,764 | $33,044,960 | $10,745,814 |
10. Other.
A fund's organizational documents provide former and current trustees and officers with a limited indemnification against liabilities arising in connection with the performance of their duties to the fund. In the normal course of business, a fund may also enter into contracts that provide general indemnifications. A fund's maximum exposure under these arrangements is unknown as this would be dependent on future claims that may be made against a fund. The risk of material loss from such claims is considered remote.
Funds do not invest in underlying mutual funds for the purpose of exercising management or control; however, investments by funds within their principal investment strategies may represent a significant portion of the underlying mutual fund's net assets. At the end of the period, certain Funds were the owners of record of 10% or more of the total outstanding shares of the following underlying mutual funds as shown below.
| Fund | VIP FundsManager 50% Portfolio | VIP FundsManager 60% Portfolio | VIP FundsManager 70% Portfolio |
| Fidelity Commodity Strategy Fund | 25% | 39% | 15% |
| Fidelity Hedged Equity Fund | 22% | 36% | 12% |
| Fidelity Infrastructure Fund | - | 14% | - |
| Fidelity Japan Smaller Companies Fund | - | 11% | - |
| VIP Investment Grade Bond Portfolio II | 23% | 31% | - |
| VIP Stock Selector All Cap Portfolio | 24% | 46% | 18% |
The Funds, in aggregate, were the owners of record of more than 20% of the total outstanding shares of the following underlying mutual funds.
| Fund | % of shares held |
| Fidelity Commodity Strategy Fund | 92% |
| Fidelity Hedged Equity Fund | 78% |
| Fidelity Infrastructure Fund | 32% |
| Fidelity Japan Smaller Companies Fund | 25% |
| VIP Investment Grade Bond Portfolio II | 68% |
| VIP Stock Selector All Cap Portfolio | 99% |
In addition, at the end of the period the investment adviser or its affiliates were owners of record of more than 10% and certain otherwise unaffiliated shareholders each were owners of record of more than 10%, respectively, of the outstanding shares of the following Funds:
| | Affiliated % | Number ofUnaffiliated Shareholders | Unaffiliated Shareholders % |
| | | | |
| VIP FundsManager 20% Portfolio | 98% | - | - |
| VIP FundsManager 30% Portfolio | 100% | - | - |
| VIP FundsManager 40% Portfolio | 100% | - | - |
| VIP FundsManager 50% Portfolio | 44% | - | - |
| VIP FundsManager 60% Portfolio | 33% | 2 | 27% |
| VIP FundsManager 70% Portfolio | 97% | - | - |
| VIP FundsManager 85% Portfolio | 94% | - | - |
11. Risk and Uncertainties.
Many factors affect a fund's performance. Developments that disrupt global economies and financial markets, such as pandemics, epidemics, outbreaks of infectious diseases, war, terrorism, and environmental disasters, may significantly affect a fund's investment performance. The effects of these developments to a fund will be impacted by the types of securities in which a fund invests, the financial condition, industry, economic sector, and geographic location of an issuer, and a fund's level of investment in the securities of that issuer. Significant concentrations in security types, issuers, industries, sectors, and geographic locations may magnify the factors that affect a fund's performance.
Item 8: Changes in and Disagreements with Accountants for Open-End Management Investment Companies
Note: This is not applicable for any fund included in this document.
Item 9: Proxy Disclosures for Open-End Management Investment Companies
Note: This is not applicable for any fund included in this document.
Item 10: Remuneration Paid to Directors, Officers, and others of Open-End Management Investment Companies
Note: This information is disclosed as part of the financial statements for each Fund as part of Item 7: Financial Statements and Financial Highlights for Open-End Management Investment companies.
Item 11: Statement Regarding Basis for Approval of Investment Advisory Contract
Note: This is not applicable for any fund included in this document.
1.833444.118
VIPFM-SANN-0824
Fidelity® Variable Insurance Products:
VIP Freedom Income Portfolio℠
VIP Freedom 2010 Portfolio℠
VIP Freedom 2015 Portfolio℠
VIP Freedom 2020 Portfolio℠
VIP Freedom 2025 Portfolio℠
VIP Freedom 2030 Portfolio℠
VIP Freedom 2035 Portfolio℠
VIP Freedom 2040 Portfolio℠
VIP Freedom 2045 Portfolio℠
VIP Freedom 2050 Portfolio℠
VIP Freedom 2055 Portfolio℠
VIP Freedom 2060 Portfolio℠
VIP Freedom 2065 Portfolio℠
Semi-Annual Report
June 30, 2024
Contents
To view a fund's proxy voting guidelines and proxy voting record for the 12-month period ended June 30, visit http://www.fidelity.com/proxyvotingresults or visit the Securities and Exchange Commission's (SEC) web site at http://www.sec.gov.
You may also call 1-877-208-0098 to request a free copy of the proxy voting guidelines.
Fidelity® Variable Insurance Products are separate account options which are purchased through a variable insurance contract.
Standard & Poor's, S&P and S&P 500 are registered service marks of The McGraw-Hill Companies, Inc. and have been licensed for use by Fidelity Distributors Corporation.
Other third-party marks appearing herein are the property of their respective owners.
All other marks appearing herein are registered or unregistered trademarks or service marks of FMR LLC or an affiliated company. © 2024 FMR LLC. All rights reserved.
This report and the financial statements contained herein are submitted for the general information of the shareholders of the Funds. This report is not authorized for distribution to prospective investors in the Funds unless preceded or accompanied by an effective prospectus.
A fund files its complete schedule of portfolio holdings with the SEC for the first and third quarters of each fiscal year on Form N-PORT. Forms N-PORT are available on the SEC's web site at http://www.sec.gov. A fund's Forms N-PORT may be reviewed and copied at the SEC's Public Reference Room in Washington, DC. Information regarding the operation of the SEC's Public Reference Room may be obtained by calling 1-800-SEC-0330.
For a complete list of a fund's portfolio holdings, view the most recent holdings listing, semiannual report, or annual report on Fidelity's web site at http://www.fidelity.com, http://www.institutional.fidelity.com, or http://www.401k.com, as applicable.
NOT FDIC INSURED •MAY LOSE VALUE •NO BANK GUARANTEE
Neither the Funds nor Fidelity Distributors Corporation is a bank.
Item 7: Financial Statements and Financial Highlights for Open-End Management Investment Companies (Semi-Annual Report)
VIP Freedom Income Portfolio℠
Schedule of Investments June 30, 2024 (Unaudited)
Showing Percentage of Net Assets
| Domestic Equity Funds - 8.0% |
| | | Shares | Value ($) |
| VIP Contrafund Portfolio Initial Class (a) | | 18,289 | 1,108,112 |
| VIP Equity-Income Portfolio Initial Class (a) | | 33,456 | 903,991 |
| VIP Growth & Income Portfolio Initial Class (a) | | 40,530 | 1,243,859 |
| VIP Growth Portfolio Initial Class (a) | | 16,261 | 1,842,656 |
| VIP Mid Cap Portfolio Initial Class (a) | | 7,259 | 285,287 |
| VIP Value Portfolio Initial Class (a) | | 32,570 | 633,152 |
| VIP Value Strategies Portfolio Initial Class (a) | | 18,767 | 314,902 |
| TOTAL DOMESTIC EQUITY FUNDS (Cost $3,783,075) | | | 6,331,959 |
| | | | |
| International Equity Funds - 13.6% |
| | | Shares | Value ($) |
| VIP Emerging Markets Portfolio Initial Class (a) | | 391,706 | 4,547,701 |
| VIP Overseas Portfolio Initial Class (a) | | 222,657 | 6,180,962 |
| TOTAL INTERNATIONAL EQUITY FUNDS (Cost $7,797,300) | | | 10,728,663 |
| | | | |
| Bond Funds - 62.9% |
| | | Shares | Value ($) |
| Fidelity Inflation-Protected Bond Index Fund (a) | | 1,416,384 | 12,903,255 |
| Fidelity International Bond Index Fund (a) | | 187,298 | 1,711,905 |
| Fidelity Long-Term Treasury Bond Index Fund (a) | | 185,219 | 1,757,725 |
| VIP High Income Portfolio Initial Class (a) | | 274,616 | 1,301,679 |
| VIP Investment Grade Bond II Portfolio - Initial Class (a) | | 3,374,613 | 31,788,854 |
| TOTAL BOND FUNDS (Cost $52,381,252) | | | 49,463,418 |
| | | | |
| Short-Term Funds - 15.5% |
| | | Shares | Value ($) |
VIP Government Money Market Portfolio Initial Class 5.1% (a)(b) (Cost $12,155,353) | | 12,155,353 | 12,155,353 |
| | | | |
| TOTAL INVESTMENT IN SECURITIES - 100.0% (Cost $76,116,980) | 78,679,393 |
NET OTHER ASSETS (LIABILITIES) - 0.0% | (6,094) |
| NET ASSETS - 100.0% | 78,673,299 |
| | |
Legend
| (b) | The rate quoted is the annualized seven-day yield of the fund at period end. |
Affiliated Underlying Funds
Fiscal year to date information regarding the Fund's investments in affiliated Underlying Funds is presented below. Exchanges between classes of the same affiliated Underlying Funds may occur. If an Underlying Funds changes its name, the name presented below is the name in effect at period end.
| Affiliate | Value, beginning of period ($) | Purchases ($) | Sales Proceeds ($) | Dividend Income ($) | Realized Gain (loss) ($) | Change in Unrealized appreciation (depreciation) ($) | Value, end of period ($) |
| Fidelity Inflation-Protected Bond Index Fund | 11,952,508 | 1,780,061 | 2,389,345 | 19,196 | (42,361) | 144,974 | 12,903,255 |
| Fidelity International Bond Index Fund | 1,775,787 | 284,252 | 531,658 | 16,619 | (18,327) | 9,149 | 1,711,905 |
| Fidelity Long-Term Treasury Bond Index Fund | 2,332,824 | 343,881 | 991,848 | 32,629 | (139,086) | 7,796 | 1,757,725 |
| VIP Contrafund Portfolio Initial Class | 716,844 | 373,890 | 313,760 | 3,579 | 14,286 | 188,981 | 1,108,112 |
| VIP Emerging Markets Portfolio Initial Class | 3,485,948 | 1,095,608 | 872,580 | 2,974 | 13,573 | 327,507 | 4,547,701 |
| VIP Equity-Income Portfolio Initial Class | 581,292 | 368,109 | 214,855 | 3,644 | 6,399 | 61,243 | 903,991 |
| VIP Government Money Market Portfolio Initial Class 5.1% | 12,731,894 | 2,691,114 | 4,653,108 | 287,567 | - | - | 12,155,353 |
| VIP Growth & Income Portfolio Initial Class | 799,053 | 482,870 | 315,769 | 6,705 | 9,147 | 127,825 | 1,243,859 |
| VIP Growth Portfolio Initial Class | 1,187,146 | 635,272 | 489,599 | 21,508 | 17,359 | 281,106 | 1,842,656 |
| VIP High Income Portfolio Initial Class | 1,152,783 | 169,377 | 202,249 | 486 | 1,563 | 33,550 | 1,301,679 |
| VIP Investment Grade Bond II Portfolio - Initial Class | 27,259,612 | 5,777,833 | 4,786,042 | 17,301 | 8,800 | (80,146) | 31,788,854 |
| VIP Mid Cap Portfolio Initial Class | 181,931 | 117,454 | 64,691 | 3,729 | 2,251 | 16,850 | 285,287 |
| VIP Overseas Portfolio Initial Class | 5,044,303 | 1,189,328 | 1,109,408 | 18,892 | 37,279 | 328,574 | 6,180,962 |
| VIP Value Portfolio Initial Class | 405,418 | 286,055 | 141,807 | 9,845 | 3,820 | 9,455 | 633,152 |
| VIP Value Strategies Portfolio Initial Class | 200,620 | 144,726 | 71,051 | 3,164 | 2,194 | 3,833 | 314,902 |
| | 69,807,963 | 15,739,830 | 17,147,770 | 447,838 | (83,103) | 1,460,697 | 78,679,393 |
Amounts in the dividend income column in the above table include any capital gain distributions from underlying funds, which are presented in the corresponding line item in the Statement of Operations, if applicable.
Amounts included in the purchases and sales proceeds columns may include in-kind transactions, if applicable.
Investment Valuation
The following is a summary of the inputs used, as of June 30, 2024, involving the Fund's assets and liabilities carried at fair value. The inputs or methodology used for valuing securities may not be an indication of the risk associated with investing in those securities. For more information on valuation inputs, and their aggregation into the levels used below, please refer to the Investment Valuation section in the accompanying Notes to Financial Statements.
| Valuation Inputs at Reporting Date: |
| Description | Total ($) | Level 1 ($) | Level 2 ($) | Level 3 ($) |
Investments in Securities: | | | | |
|
| Domestic Equity Funds | 6,331,959 | 6,331,959 | - | - |
|
| International Equity Funds | 10,728,663 | 10,728,663 | - | - |
|
| Bond Funds | 49,463,418 | 49,463,418 | - | - |
|
| Short-Term Funds | 12,155,353 | 12,155,353 | - | - |
| Total Investments in Securities: | 78,679,393 | 78,679,393 | - | - |
VIP Freedom Income Portfolio℠
Financial Statements (Unaudited)
| Statement of Assets and Liabilities |
| | | | June 30, 2024 (Unaudited) |
| | | | | |
| Assets | | | | |
| Investment in securities, at value - See accompanying schedule: | | | | |
Affiliated issuers (cost $76,116,980) | $ | 78,679,393 | | |
| | | | | |
| | | | | |
| Total Investment in Securities (cost $76,116,980) | | | $ | 78,679,393 |
| Cash | | | | 13 |
| Receivable for investments sold | | | | 316,006 |
| Receivable for fund shares sold | | | | 59,909 |
Total assets | | | | 79,055,321 |
| Liabilities | | | | |
| Payable for investments purchased | $ | 234,790 | | |
| Payable for fund shares redeemed | | 141,183 | | |
| Distribution and service plan fees payable | | 6,049 | | |
| Total liabilities | | | | 382,022 |
| Net Assets | | | $ | 78,673,299 |
| Net Assets consist of: | | | | |
| Paid in capital | | | $ | 78,106,501 |
| Total accumulated earnings (loss) | | | | 566,798 |
| Net Assets | | | $ | 78,673,299 |
| | | | | |
| Net Asset Value and Maximum Offering Price | | | | |
| Initial Class : | | | | |
Net Asset Value, offering price and redemption price per share ($26,671,763 ÷ 2,386,349 shares) | | | $ | 11.18 |
| Service Class : | | | | |
Net Asset Value, offering price and redemption price per share ($38,160,036 ÷ 3,420,138 shares) | | | $ | 11.16 |
| Service Class 2 : | | | | |
Net Asset Value, offering price and redemption price per share ($13,841,500 ÷ 1,245,469 shares) | | | $ | 11.11 |
| Statement of Operations |
| | | | Six months ended June 30, 2024 (Unaudited) |
| Investment Income | | | | |
| Dividends: | | | | |
| Affiliated issuers | | | $ | 388,888 |
| Expenses | | | | |
| Distribution and service plan fees | $ | 34,136 | | |
| Independent trustees' fees and expenses | | 96 | | |
| Total expenses | | | | 34,232 |
| Net Investment income (loss) | | | | 354,656 |
| Realized and Unrealized Gain (Loss) | | | | |
| Net realized gain (loss) on: | | | | |
| Investment Securities: | | | | |
| Affiliated issuers | | (83,103) | | |
| Capital gain distributions from underlying funds: | | | | |
| Affiliated issuers | | 58,950 | | |
| Total net realized gain (loss) | | | | (24,153) |
| Change in net unrealized appreciation (depreciation) on: | | | | |
| Investment Securities: | | | | |
| Affiliated issuers | | 1,460,697 | | |
| Total change in net unrealized appreciation (depreciation) | | | | 1,460,697 |
| Net gain (loss) | | | | 1,436,544 |
| Net increase (decrease) in net assets resulting from operations | | | $ | 1,791,200 |
| Statement of Changes in Net Assets |
| |
| | Six months ended June 30, 2024 (Unaudited) | | Year ended December 31, 2023 |
| Increase (Decrease) in Net Assets | | | | |
| Operations | | | | |
| Net investment income (loss) | $ | 354,656 | $ | 2,347,521 |
| Net realized gain (loss) | | (24,153) | | (72,462) |
| Change in net unrealized appreciation (depreciation) | | 1,460,697 | | 2,839,039 |
| Net increase (decrease) in net assets resulting from operations | | 1,791,200 | | 5,114,098 |
| Distributions to shareholders | | (466,732) | | (2,815,603) |
| | | | | |
| Share transactions - net increase (decrease) | | 7,543,214 | | 3,699,301 |
| Total increase (decrease) in net assets | | 8,867,682 | | 5,997,796 |
| | | | | |
| Net Assets | | | | |
| Beginning of period | | 69,805,617 | | 63,807,821 |
| End of period | $ | 78,673,299 | $ | 69,805,617 |
| | | | | |
| | | | | |
Financial Highlights
VIP Freedom Income Portfolio℠ Initial Class |
| |
| | Six months ended (Unaudited) June 30, 2024 | | Years ended December 31, 2023 | | 2022 | | 2021 | | 2020 | | 2019 |
Selected Per-Share Data | | | | | | | | | | | | |
| Net asset value, beginning of period | $ | 10.97 | $ | 10.61 | $ | 12.76 | $ | 12.74 | $ | 11.89 | $ | 11.08 |
| Income from Investment Operations | | | | | | | | | | | | |
Net investment income (loss) A,B | | .06 | | .41 | | .30 | | .24 | | .17 | | .27 |
| Net realized and unrealized gain (loss) | | .22 | | .42 | | (1.79) | | .18 | | 1.06 | | 1.03 |
| Total from investment operations | | .28 | | .83 | | (1.49) | | .42 | | 1.23 | | 1.30 |
| Distributions from net investment income | | (.07) | | (.47) | | (.26) | | (.13) | | (.16) | | (.25) |
| Distributions from net realized gain | | - | | - | | (.40) | | (.27) | | (.22) | | (.25) |
| Total distributions | | (.07) | | (.47) | | (.66) | | (.40) | | (.38) | | (.49) C |
| Net asset value, end of period | $ | 11.18 | $ | 10.97 | $ | 10.61 | $ | 12.76 | $ | 12.74 | $ | 11.89 |
Total Return D,E,F | | | | 7.91% | | (12.05)% | | 3.35% | | 10.47% | | 11.94% |
Ratios to Average Net Assets B,G,H | | | | | | | | | | | | |
Expenses before reductions I | | -% J | | -% | | -% | | -% | | -% | | -% |
Expenses net of fee waivers, if any I | | | | -% | | -% | | -% | | -% | | -% |
Expenses net of all reductions I | | -% J | | -% | | -% | | -% | | -% | | -% |
| Net investment income (loss) | | 1.11% J | | 3.75% | | 2.71% | | 1.85% | | 1.40% | | 2.31% |
| Supplemental Data | | | | | | | | | | | | |
| Net assets, end of period (000 omitted) | $ | 26,672 | $ | 22,698 | $ | 15,085 | $ | 17,011 | $ | 16,854 | $ | 14,870 |
Portfolio turnover rate K | | | | 40% | | 91% | | 52% | | 66% | | 40% |
ACalculated based on average shares outstanding during the period.
BNet investment income (loss) is affected by the timing of the declaration of dividends by any underlying mutual funds or exchange-traded funds (ETFs). Net investment income (loss) of any mutual funds or ETFs is not included in the Fund's net investment income (loss) ratio.
CTotal distributions per share do not sum due to rounding.
DTotal returns for periods of less than one year are not annualized.
ETotal returns do not reflect charges attributable to your insurance company's separate account. Inclusion of these charges would reduce the total returns shown.
FTotal returns would have been lower if certain expenses had not been reduced during the applicable periods shown.
GFees and expenses of any underlying mutual funds or exchange-traded funds (ETFs) are not included in the Fund's expense ratio. The Fund indirectly bears its proportionate share of these expenses.
HExpense ratios reflect operating expenses of the class. Expenses before reductions do not reflect amounts reimbursed, waived, or reduced through arrangements with the investment adviser, brokerage services, or other offset arrangements, if applicable, and do not represent the amount paid by the class during periods when reimbursements, waivers or reductions occur.
IAmount represents less than .005%.
JAnnualized.
KAmount does not include the portfolio activity of any underlying mutual funds or exchange-traded funds (ETFs).
LThe portfolio turnover rate does not include the assets acquired in the merger.
VIP Freedom Income Portfolio℠ Service Class |
| |
| | Six months ended (Unaudited) June 30, 2024 | | Years ended December 31, 2023 | | 2022 | | 2021 | | 2020 | | 2019 |
Selected Per-Share Data | | | | | | | | | | | | |
| Net asset value, beginning of period | $ | 10.96 | $ | 10.60 | $ | 12.74 | $ | 12.73 | $ | 11.88 | $ | 11.07 |
| Income from Investment Operations | | | | | | | | | | | | |
Net investment income (loss) A,B | | .06 | | .39 | | .29 | | .22 | | .16 | | .26 |
| Net realized and unrealized gain (loss) | | .21 | | .43 | | (1.77) | | .18 | | 1.06 | | 1.03 |
| Total from investment operations | | .27 | | .82 | | (1.48) | | .40 | | 1.22 | | 1.29 |
| Distributions from net investment income | | (.07) | | (.46) | | (.25) | | (.12) | | (.15) | | (.24) |
| Distributions from net realized gain | | - | | - | | (.40) | | (.27) | | (.22) | | (.25) |
| Total distributions | | (.07) | | (.46) | | (.66) C | | (.39) | | (.37) | | (.48) C |
| Net asset value, end of period | $ | 11.16 | $ | 10.96 | $ | 10.60 | $ | 12.74 | $ | 12.73 | $ | 11.88 |
Total Return D,E,F | | | | 7.81% | | (12.06)% | | 3.17% | | 10.38% | | 11.87% |
Ratios to Average Net Assets B,G,H | | | | | | | | | | | | |
| Expenses before reductions | | .10% I | | .10% | | .10% | | .10% | | .10% | | .10% |
| Expenses net of fee waivers, if any | | | | .10% | | .10% | | .10% | | .10% | | .10% |
| Expenses net of all reductions | | .10% I | | .10% | | .10% | | .10% | | .10% | | .10% |
| Net investment income (loss) | | 1.01% I | | 3.65% | | 2.61% | | 1.75% | | 1.30% | | 2.21% |
| Supplemental Data | | | | | | | | | | | | |
| Net assets, end of period (000 omitted) | $ | 38,160 | $ | 32,753 | $ | 31,739 | $ | 32,637 | $ | 32,810 | $ | 24,831 |
Portfolio turnover rate J | | | | 40% | | 91% | | 52% | | 66% | | 40% |
ACalculated based on average shares outstanding during the period.
BNet investment income (loss) is affected by the timing of the declaration of dividends by any underlying mutual funds or exchange-traded funds (ETFs). Net investment income (loss) of any mutual funds or ETFs is not included in the Fund's net investment income (loss) ratio.
CTotal distributions per share do not sum due to rounding.
DTotal returns for periods of less than one year are not annualized.
ETotal returns do not reflect charges attributable to your insurance company's separate account. Inclusion of these charges would reduce the total returns shown.
FTotal returns would have been lower if certain expenses had not been reduced during the applicable periods shown.
GFees and expenses of any underlying mutual funds or exchange-traded funds (ETFs) are not included in the Fund's expense ratio. The Fund indirectly bears its proportionate share of these expenses.
HExpense ratios reflect operating expenses of the class. Expenses before reductions do not reflect amounts reimbursed, waived, or reduced through arrangements with the investment adviser, brokerage services, or other offset arrangements, if applicable, and do not represent the amount paid by the class during periods when reimbursements, waivers or reductions occur.
IAnnualized.
JAmount does not include the portfolio activity of any underlying mutual funds or exchange-traded funds (ETFs).
KThe portfolio turnover rate does not include the assets acquired in the merger.
VIP Freedom Income Portfolio℠ Service Class 2 |
| |
| | Six months ended (Unaudited) June 30, 2024 | | Years ended December 31, 2023 | | 2022 | | 2021 | | 2020 | | 2019 |
Selected Per-Share Data | | | | | | | | | | | | |
| Net asset value, beginning of period | $ | 10.92 | $ | 10.56 | $ | 12.69 | $ | 12.68 | $ | 11.83 | $ | 11.03 |
| Income from Investment Operations | | | | | | | | | | | | |
Net investment income (loss) A,B | | .05 | | .38 | | .27 | | .20 | | .14 | | .24 |
| Net realized and unrealized gain (loss) | | .21 | | .42 | | (1.77) | | .18 | | 1.06 | | 1.02 |
| Total from investment operations | | .26 | | .80 | | (1.50) | | .38 | | 1.20 | | 1.26 |
| Distributions from net investment income | | (.07) | | (.44) | | (.22) | | (.10) | | (.13) | | (.22) |
| Distributions from net realized gain | | - | | - | | (.40) | | (.27) | | (.22) | | (.25) |
| Total distributions | | (.07) | | (.44) | | (.63) C | | (.37) | | (.35) | | (.46) C |
| Net asset value, end of period | $ | 11.11 | $ | 10.92 | $ | 10.56 | $ | 12.69 | $ | 12.68 | $ | 11.83 |
Total Return D,E,F | | | | 7.65% | | (12.26)% | | 3.03% | | 10.29% | | 11.63% |
Ratios to Average Net Assets B,G,H | | | | | | | | | | | | |
| Expenses before reductions | | .25% I | | .25% | | .25% | | .25% | | .25% | | .25% |
| Expenses net of fee waivers, if any | | | | .25% | | .25% | | .25% | | .25% | | .25% |
| Expenses net of all reductions | | .25% I | | .25% | | .25% | | .25% | | .25% | | .25% |
| Net investment income (loss) | | .86% I | | 3.50% | | 2.46% | | 1.60% | | 1.15% | | 2.06% |
| Supplemental Data | | | | | | | | | | | | |
| Net assets, end of period (000 omitted) | $ | 13,842 | $ | 14,354 | $ | 16,984 | $ | 28,521 | $ | 27,518 | $ | 18,333 |
Portfolio turnover rate J | | | | 40% | | 91% | | 52% | | 66% | | 40% |
ACalculated based on average shares outstanding during the period.
BNet investment income (loss) is affected by the timing of the declaration of dividends by any underlying mutual funds or exchange-traded funds (ETFs). Net investment income (loss) of any mutual funds or ETFs is not included in the Fund's net investment income (loss) ratio.
CTotal distributions per share do not sum due to rounding.
DTotal returns for periods of less than one year are not annualized.
ETotal returns do not reflect charges attributable to your insurance company's separate account. Inclusion of these charges would reduce the total returns shown.
FTotal returns would have been lower if certain expenses had not been reduced during the applicable periods shown.
GFees and expenses of any underlying mutual funds or exchange-traded funds (ETFs) are not included in the Fund's expense ratio. The Fund indirectly bears its proportionate share of these expenses.
HExpense ratios reflect operating expenses of the class. Expenses before reductions do not reflect amounts reimbursed, waived, or reduced through arrangements with the investment adviser, brokerage services, or other offset arrangements, if applicable, and do not represent the amount paid by the class during periods when reimbursements, waivers or reductions occur.
IAnnualized.
JAmount does not include the portfolio activity of any underlying mutual funds or exchange-traded funds (ETFs).
KThe portfolio turnover rate does not include the assets acquired in the merger.
VIP Freedom 2010 Portfolio℠
Schedule of Investments June 30, 2024 (Unaudited)
Showing Percentage of Net Assets
| Domestic Equity Funds - 12.5% |
| | | Shares | Value ($) |
| VIP Contrafund Portfolio Initial Class (a) | | 95,069 | 5,760,227 |
| VIP Equity-Income Portfolio Initial Class (a) | | 173,923 | 4,699,394 |
| VIP Growth & Income Portfolio Initial Class (a) | | 210,694 | 6,466,212 |
| VIP Growth Portfolio Initial Class (a) | | 84,528 | 9,578,700 |
| VIP Mid Cap Portfolio Initial Class (a) | | 37,737 | 1,483,065 |
| VIP Value Portfolio Initial Class (a) | | 169,311 | 3,291,399 |
| VIP Value Strategies Portfolio Initial Class (a) | | 97,559 | 1,637,041 |
| TOTAL DOMESTIC EQUITY FUNDS (Cost $21,539,125) | | | 32,916,038 |
| | | | |
| International Equity Funds - 16.6% |
| | | Shares | Value ($) |
| VIP Emerging Markets Portfolio Initial Class (a) | | 1,506,648 | 17,492,186 |
| VIP Overseas Portfolio Initial Class (a) | | 945,698 | 26,252,589 |
| TOTAL INTERNATIONAL EQUITY FUNDS (Cost $34,162,655) | | | 43,744,775 |
| | | | |
| Bond Funds - 60.1% |
| | | Shares | Value ($) |
| Fidelity Inflation-Protected Bond Index Fund (a) | | 4,469,553 | 40,717,629 |
| Fidelity International Bond Index Fund (a) | | 692,950 | 6,333,565 |
| Fidelity Long-Term Treasury Bond Index Fund (a) | | 688,216 | 6,531,165 |
| VIP High Income Portfolio Initial Class (a) | | 918,634 | 4,354,326 |
| VIP Investment Grade Bond II Portfolio - Initial Class (a) | | 10,639,500 | 100,224,094 |
| TOTAL BOND FUNDS (Cost $168,543,153) | | | 158,160,779 |
| | | | |
| Short-Term Funds - 10.8% |
| | | Shares | Value ($) |
VIP Government Money Market Portfolio Initial Class 5.1% (a)(b) (Cost $28,320,008) | | 28,320,008 | 28,320,008 |
| | | | |
| TOTAL INVESTMENT IN SECURITIES - 100.0% (Cost $252,564,941) | 263,141,600 |
NET OTHER ASSETS (LIABILITIES) - 0.0% | (49,416) |
| NET ASSETS - 100.0% | 263,092,184 |
| | |
Legend
| (b) | The rate quoted is the annualized seven-day yield of the fund at period end. |
Affiliated Underlying Funds
Fiscal year to date information regarding the Fund's investments in affiliated Underlying Funds is presented below. Exchanges between classes of the same affiliated Underlying Funds may occur. If an Underlying Funds changes its name, the name presented below is the name in effect at period end.
| Affiliate | Value, beginning of period ($) | Purchases ($) | Sales Proceeds ($) | Dividend Income ($) | Realized Gain (loss) ($) | Change in Unrealized appreciation (depreciation) ($) | Value, end of period ($) |
| Fidelity Inflation-Protected Bond Index Fund | 43,902,853 | 2,081,636 | 5,571,773 | 69,746 | (333,024) | 637,937 | 40,717,629 |
| Fidelity International Bond Index Fund | 7,652,075 | 394,155 | 1,665,248 | 71,792 | (15,363) | (32,054) | 6,333,565 |
| Fidelity Long-Term Treasury Bond Index Fund | 9,827,697 | 576,419 | 3,308,039 | 136,335 | (627,261) | 62,349 | 6,531,165 |
| VIP Contrafund Portfolio Initial Class | 5,203,651 | 727,645 | 1,450,129 | 22,413 | 183,898 | 1,095,162 | 5,760,227 |
| VIP Emerging Markets Portfolio Initial Class | 16,176,839 | 2,612,785 | 2,789,717 | 13,764 | 19,531 | 1,472,748 | 17,492,186 |
| VIP Equity-Income Portfolio Initial Class | 4,219,682 | 1,026,409 | 963,578 | 24,613 | 32,189 | 384,692 | 4,699,394 |
| VIP Government Money Market Portfolio Initial Class 5.1% | 35,491,219 | 5,401,565 | 12,572,776 | 760,179 | - | - | 28,320,008 |
| VIP Growth & Income Portfolio Initial Class | 5,800,472 | 1,241,119 | 1,415,027 | 41,201 | 86,677 | 752,971 | 6,466,212 |
| VIP Growth Portfolio Initial Class | 8,617,574 | 1,335,753 | 2,254,646 | 137,504 | 237,376 | 1,642,643 | 9,578,700 |
| VIP High Income Portfolio Initial Class | 4,507,789 | 177,611 | 462,276 | 1,911 | (8,840) | 140,042 | 4,354,326 |
| VIP Investment Grade Bond II Portfolio - Initial Class | 99,453,184 | 11,430,150 | 10,277,074 | 61,566 | (434,704) | 52,538 | 100,224,094 |
| VIP Mid Cap Portfolio Initial Class | 1,320,626 | 318,433 | 275,656 | 25,197 | 16,659 | 103,003 | 1,483,065 |
| VIP Overseas Portfolio Initial Class | 26,309,096 | 2,405,583 | 4,354,840 | 98,671 | 301,693 | 1,591,057 | 26,252,589 |
| VIP Value Portfolio Initial Class | 2,942,935 | 864,064 | 596,403 | 66,426 | 31,455 | 49,348 | 3,291,399 |
| VIP Value Strategies Portfolio Initial Class | 1,456,302 | 436,661 | 292,943 | 21,277 | 15,374 | 21,647 | 1,637,041 |
| | 272,881,994 | 31,029,988 | 48,250,125 | 1,552,595 | (494,340) | 7,974,083 | 263,141,600 |
Amounts in the dividend income column in the above table include any capital gain distributions from underlying funds, which are presented in the corresponding line item in the Statement of Operations, if applicable.
Amounts included in the purchases and sales proceeds columns may include in-kind transactions, if applicable.
Investment Valuation
The following is a summary of the inputs used, as of June 30, 2024, involving the Fund's assets and liabilities carried at fair value. The inputs or methodology used for valuing securities may not be an indication of the risk associated with investing in those securities. For more information on valuation inputs, and their aggregation into the levels used below, please refer to the Investment Valuation section in the accompanying Notes to Financial Statements.
| Valuation Inputs at Reporting Date: |
| Description | Total ($) | Level 1 ($) | Level 2 ($) | Level 3 ($) |
Investments in Securities: | | | | |
|
| Domestic Equity Funds | 32,916,038 | 32,916,038 | - | - |
|
| International Equity Funds | 43,744,775 | 43,744,775 | - | - |
|
| Bond Funds | 158,160,779 | 158,160,779 | - | - |
|
| Short-Term Funds | 28,320,008 | 28,320,008 | - | - |
| Total Investments in Securities: | 263,141,600 | 263,141,600 | - | - |
VIP Freedom 2010 Portfolio℠
Financial Statements (Unaudited)
| Statement of Assets and Liabilities |
| | | | June 30, 2024 (Unaudited) |
| | | | | |
| Assets | | | | |
| Investment in securities, at value - See accompanying schedule: | | | | |
Affiliated issuers (cost $252,564,941) | $ | 263,141,600 | | |
| | | | | |
| | | | | |
| Total Investment in Securities (cost $252,564,941) | | | $ | 263,141,600 |
| Cash | | | | 28 |
| Receivable for investments sold | | | | 1,141,047 |
| Receivable for fund shares sold | | | | 4,402 |
Total assets | | | | 264,287,077 |
| Liabilities | | | | |
| Payable for investments purchased | $ | 948,344 | | |
| Payable for fund shares redeemed | | 197,125 | | |
| Distribution and service plan fees payable | | 49,424 | | |
| Total liabilities | | | | 1,194,893 |
| Net Assets | | | $ | 263,092,184 |
| Net Assets consist of: | | | | |
| Paid in capital | | | $ | 255,858,621 |
| Total accumulated earnings (loss) | | | | 7,233,563 |
| Net Assets | | | $ | 263,092,184 |
| | | | | |
| Net Asset Value and Maximum Offering Price | | | | |
| Initial Class : | | | | |
Net Asset Value, offering price and redemption price per share ($16,197,508 ÷ 1,390,647 shares) | | | $ | 11.65 |
| Service Class : | | | | |
Net Asset Value, offering price and redemption price per share ($18,788,693 ÷ 1,616,641 shares) | | | $ | 11.62 |
| Service Class 2 : | | | | |
Net Asset Value, offering price and redemption price per share ($228,105,983 ÷ 19,791,373 shares) | | | $ | 11.53 |
| Statement of Operations |
| | | | Six months ended June 30, 2024 (Unaudited) |
| Investment Income | | | | |
| Dividends: | | | | |
| Affiliated issuers | | | $ | 1,178,984 |
| Expenses | | | | |
| Distribution and service plan fees | $ | 297,743 | | |
| Independent trustees' fees and expenses | | 359 | | |
| Total expenses | | | | 298,102 |
| Net Investment income (loss) | | | | 880,882 |
| Realized and Unrealized Gain (Loss) | | | | |
| Net realized gain (loss) on: | | | | |
| Investment Securities: | | | | |
| Affiliated issuers | | (494,340) | | |
| Capital gain distributions from underlying funds: | | | | |
| Affiliated issuers | | 373,611 | | |
| Total net realized gain (loss) | | | | (120,729) |
| Change in net unrealized appreciation (depreciation) on: | | | | |
| Investment Securities: | | | | |
| Affiliated issuers | | 7,974,083 | | |
| Total change in net unrealized appreciation (depreciation) | | | | 7,974,083 |
| Net gain (loss) | | | | 7,853,354 |
| Net increase (decrease) in net assets resulting from operations | | | $ | 8,734,236 |
| Statement of Changes in Net Assets |
| |
| | Six months ended June 30, 2024 (Unaudited) | | Year ended December 31, 2023 |
| Increase (Decrease) in Net Assets | | | | |
| Operations | | | | |
| Net investment income (loss) | $ | 880,882 | $ | 8,116,821 |
| Net realized gain (loss) | | (120,729) | | (48,144) |
| Change in net unrealized appreciation (depreciation) | | 7,974,083 | | 16,466,483 |
| Net increase (decrease) in net assets resulting from operations | | 8,734,236 | | 24,535,160 |
| Distributions to shareholders | | (1,685,070) | | (29,955,899) |
| | | | | |
| Share transactions - net increase (decrease) | | (16,798,699) | | (6,836,301) |
| Total increase (decrease) in net assets | | (9,749,533) | | (12,257,040) |
| | | | | |
| Net Assets | | | | |
| Beginning of period | | 272,841,717 | | 285,098,757 |
| End of period | $ | 263,092,184 | $ | 272,841,717 |
| | | | | |
| | | | | |
Financial Highlights
VIP Freedom 2010 Portfolio℠ Initial Class |
| |
| | Six months ended (Unaudited) June 30, 2024 | | Years ended December 31, 2023 | | 2022 | | 2021 | | 2020 | | 2019 |
Selected Per-Share Data | | | | | | | | | | | | |
| Net asset value, beginning of period | $ | 11.33 | $ | 11.55 | $ | 14.45 | $ | 14.28 | $ | 13.42 | $ | 12.32 |
| Income from Investment Operations | | | | | | | | | | | | |
Net investment income (loss) A,B | | .05 | | .34 | | .30 | | .26 | | .18 | | .28 |
| Net realized and unrealized gain (loss) | | .34 | | .70 | | (2.16) | | .56 | | 1.44 | | 1.65 |
| Total from investment operations | | .39 | | 1.04 | | (1.86) | | .82 | | 1.62 | | 1.93 |
| Distributions from net investment income | | (.07) | | (.46) | | (.27) | | (.15) | | (.18) | | (.28) |
| Distributions from net realized gain | | - | | (.80) | | (.77) | | (.50) | | (.58) | | (.55) |
| Total distributions | | (.07) | | (1.26) | | (1.04) | | (.65) | | (.76) | | (.83) |
| Net asset value, end of period | $ | 11.65 | $ | 11.33 | $ | 11.55 | $ | 14.45 | $ | 14.28 | $ | 13.42 |
Total Return C,D,E | | | | 9.48% | | (13.53)% | | 5.89% | | 12.49% | | 16.09% |
Ratios to Average Net Assets B,F,G | | | | | | | | | | | | |
Expenses before reductions H | | -% I | | -% | | -% | | -% | | -% | | -% |
Expenses net of fee waivers, if any H | | | | -% | | -% | | -% | | -% | | -% |
Expenses net of all reductions H | | -% I | | -% | | -% | | -% | | -% | | -% |
| Net investment income (loss) | | .89% I | | 3.10% | | 2.47% | | 1.82% | | 1.34% | | 2.15% |
| Supplemental Data | | | | | | | | | | | | |
| Net assets, end of period (000 omitted) | $ | 16,198 | $ | 17,668 | $ | 12,298 | $ | 16,685 | $ | 19,195 | $ | 17,895 |
Portfolio turnover rate J | | | | 21% | | 231% | | 29% | | 40% | | 28% |
ACalculated based on average shares outstanding during the period.
BNet investment income (loss) is affected by the timing of the declaration of dividends by any underlying mutual funds or exchange-traded funds (ETFs). Net investment income (loss) of any mutual funds or ETFs is not included in the Fund's net investment income (loss) ratio.
CTotal returns for periods of less than one year are not annualized.
DTotal returns do not reflect charges attributable to your insurance company's separate account. Inclusion of these charges would reduce the total returns shown.
ETotal returns would have been lower if certain expenses had not been reduced during the applicable periods shown.
FFees and expenses of any underlying mutual funds or exchange-traded funds (ETFs) are not included in the Fund's expense ratio. The Fund indirectly bears its proportionate share of these expenses.
GExpense ratios reflect operating expenses of the class. Expenses before reductions do not reflect amounts reimbursed, waived, or reduced through arrangements with the investment adviser, brokerage services, or other offset arrangements, if applicable, and do not represent the amount paid by the class during periods when reimbursements, waivers or reductions occur.
HAmount represents less than .005%.
IAnnualized.
JAmount does not include the portfolio activity of any underlying mutual funds or exchange-traded funds (ETFs).
VIP Freedom 2010 Portfolio℠ Service Class |
| |
| | Six months ended (Unaudited) June 30, 2024 | | Years ended December 31, 2023 | | 2022 | | 2021 | | 2020 | | 2019 |
Selected Per-Share Data | | | | | | | | | | | | |
| Net asset value, beginning of period | $ | 11.31 | $ | 11.54 | $ | 14.43 | $ | 14.26 | $ | 13.40 | $ | 12.30 |
| Income from Investment Operations | | | | | | | | | | | | |
Net investment income (loss) A,B | | .04 | | .33 | | .29 | | .25 | | .16 | | .27 |
| Net realized and unrealized gain (loss) | | .34 | | .68 | | (2.15) | | .56 | | 1.44 | | 1.64 |
| Total from investment operations | | .38 | | 1.01 | | (1.86) | | .81 | | 1.60 | | 1.91 |
| Distributions from net investment income | | (.07) | | (.44) | | (.26) | | (.14) | | (.16) | | (.27) |
| Distributions from net realized gain | | - | | (.80) | | (.77) | | (.50) | | (.58) | | (.55) |
| Total distributions | | (.07) | | (1.24) | | (1.03) | | (.64) | | (.74) | | (.81) C |
| Net asset value, end of period | $ | 11.62 | $ | 11.31 | $ | 11.54 | $ | 14.43 | $ | 14.26 | $ | 13.40 |
Total Return D,E,F | | | | 9.28% | | (13.57)% | | 5.79% | | 12.39% | | 16.00% |
Ratios to Average Net Assets B,G,H | | | | | | | | | | | | |
| Expenses before reductions | | .10% I | | .10% | | .10% | | .10% | | .10% | | .10% |
| Expenses net of fee waivers, if any | | | | .10% | | .10% | | .10% | | .10% | | .10% |
| Expenses net of all reductions | | .10% I | | .10% | | .10% | | .10% | | .10% | | .10% |
| Net investment income (loss) | | .79% I | | 3.00% | | 2.37% | | 1.72% | | 1.24% | | 2.05% |
| Supplemental Data | | | | | | | | | | | | |
| Net assets, end of period (000 omitted) | $ | 18,789 | $ | 19,596 | $ | 21,518 | $ | 27,360 | $ | 26,484 | $ | 26,232 |
Portfolio turnover rate J | | | | 21% | | 231% | | 29% | | 40% | | 28% |
ACalculated based on average shares outstanding during the period.
BNet investment income (loss) is affected by the timing of the declaration of dividends by any underlying mutual funds or exchange-traded funds (ETFs). Net investment income (loss) of any mutual funds or ETFs is not included in the Fund's net investment income (loss) ratio.
CTotal distributions per share do not sum due to rounding.
DTotal returns for periods of less than one year are not annualized.
ETotal returns do not reflect charges attributable to your insurance company's separate account. Inclusion of these charges would reduce the total returns shown.
FTotal returns would have been lower if certain expenses had not been reduced during the applicable periods shown.
GFees and expenses of any underlying mutual funds or exchange-traded funds (ETFs) are not included in the Fund's expense ratio. The Fund indirectly bears its proportionate share of these expenses.
HExpense ratios reflect operating expenses of the class. Expenses before reductions do not reflect amounts reimbursed, waived, or reduced through arrangements with the investment adviser, brokerage services, or other offset arrangements, if applicable, and do not represent the amount paid by the class during periods when reimbursements, waivers or reductions occur.
IAnnualized.
JAmount does not include the portfolio activity of any underlying mutual funds or exchange-traded funds (ETFs).
VIP Freedom 2010 Portfolio℠ Service Class 2 |
| |
| | Six months ended (Unaudited) June 30, 2024 | | Years ended December 31, 2023 | | 2022 | | 2021 | | 2020 | | 2019 |
Selected Per-Share Data | | | | | | | | | | | | |
| Net asset value, beginning of period | $ | 11.23 | $ | 11.46 | $ | 14.33 | $ | 14.17 | $ | 13.32 | $ | 12.24 |
| Income from Investment Operations | | | | | | | | | | | | |
Net investment income (loss) A,B | | .04 | | .31 | | .27 | | .22 | | .14 | | .24 |
| Net realized and unrealized gain (loss) | | .33 | | .69 | | (2.13) | | .56 | | 1.43 | | 1.63 |
| Total from investment operations | | .37 | | 1.00 | | (1.86) | | .78 | | 1.57 | | 1.87 |
| Distributions from net investment income | | (.07) | | (.43) | | (.24) | | (.12) | | (.14) | | (.25) |
| Distributions from net realized gain | | - | | (.80) | | (.77) | | (.50) | | (.58) | | (.55) |
| Total distributions | | (.07) | | (1.23) | | (1.01) | | (.62) | | (.72) | | (.79) C |
| Net asset value, end of period | $ | 11.53 | $ | 11.23 | $ | 11.46 | $ | 14.33 | $ | 14.17 | $ | 13.32 |
Total Return D,E,F | | | | 9.18% | | (13.66)% | | 5.60% | | 12.24% | | 15.75% |
Ratios to Average Net Assets B,G,H | | | | | | | | | | | | |
| Expenses before reductions | | .25% I | | .25% | | .25% | | .25% | | .25% | | .25% |
| Expenses net of fee waivers, if any | | | | .25% | | .25% | | .25% | | .25% | | .25% |
| Expenses net of all reductions | | .25% I | | .25% | | .25% | | .25% | | .25% | | .25% |
| Net investment income (loss) | | .64% I | | 2.85% | | 2.22% | | 1.57% | | 1.09% | | 1.90% |
| Supplemental Data | | | | | | | | | | | | |
| Net assets, end of period (000 omitted) | $ | 228,106 | $ | 235,579 | $ | 251,283 | $ | 327,526 | $ | 317,773 | $ | 280,783 |
Portfolio turnover rate J | | | | 21% | | 231% | | 29% | | 40% | | 28% |
ACalculated based on average shares outstanding during the period.
BNet investment income (loss) is affected by the timing of the declaration of dividends by any underlying mutual funds or exchange-traded funds (ETFs). Net investment income (loss) of any mutual funds or ETFs is not included in the Fund's net investment income (loss) ratio.
CTotal distributions per share do not sum due to rounding.
DTotal returns for periods of less than one year are not annualized.
ETotal returns do not reflect charges attributable to your insurance company's separate account. Inclusion of these charges would reduce the total returns shown.
FTotal returns would have been lower if certain expenses had not been reduced during the applicable periods shown.
GFees and expenses of any underlying mutual funds or exchange-traded funds (ETFs) are not included in the Fund's expense ratio. The Fund indirectly bears its proportionate share of these expenses.
HExpense ratios reflect operating expenses of the class. Expenses before reductions do not reflect amounts reimbursed, waived, or reduced through arrangements with the investment adviser, brokerage services, or other offset arrangements, if applicable, and do not represent the amount paid by the class during periods when reimbursements, waivers or reductions occur.
IAnnualized.
JAmount does not include the portfolio activity of any underlying mutual funds or exchange-traded funds (ETFs).
VIP Freedom 2015 Portfolio℠
Schedule of Investments June 30, 2024 (Unaudited)
Showing Percentage of Net Assets
| Domestic Equity Funds - 18.0% |
| | | Shares | Value ($) |
| VIP Contrafund Portfolio Initial Class (a) | | 30,547 | 1,850,869 |
| VIP Equity-Income Portfolio Initial Class (a) | | 55,883 | 1,509,949 |
| VIP Growth & Income Portfolio Initial Class (a) | | 67,697 | 2,077,634 |
| VIP Growth Portfolio Initial Class (a) | | 27,160 | 3,077,773 |
| VIP Mid Cap Portfolio Initial Class (a) | | 12,125 | 476,516 |
| VIP Value Portfolio Initial Class (a) | | 54,401 | 1,057,552 |
| VIP Value Strategies Portfolio Initial Class (a) | | 31,346 | 525,986 |
| TOTAL DOMESTIC EQUITY FUNDS (Cost $2,877,918) | | | 10,576,279 |
| | | | |
| International Equity Funds - 20.3% |
| | | Shares | Value ($) |
| VIP Emerging Markets Portfolio Initial Class (a) | | 390,053 | 4,528,513 |
| VIP Overseas Portfolio Initial Class (a) | | 266,124 | 7,387,596 |
| TOTAL INTERNATIONAL EQUITY FUNDS (Cost $6,563,257) | | | 11,916,109 |
| | | | |
| Bond Funds - 56.4% |
| | | Shares | Value ($) |
| Fidelity Inflation-Protected Bond Index Fund (a) | | 926,164 | 8,437,358 |
| Fidelity International Bond Index Fund (a) | | 172,608 | 1,577,635 |
| Fidelity Long-Term Treasury Bond Index Fund (a) | | 158,400 | 1,503,215 |
| VIP High Income Portfolio Initial Class (a) | | 204,915 | 971,298 |
| VIP Investment Grade Bond II Portfolio - Initial Class (a) | | 2,189,328 | 20,623,472 |
| TOTAL BOND FUNDS (Cost $34,803,154) | | | 33,112,978 |
| | | | |
| Short-Term Funds - 5.3% |
| | | Shares | Value ($) |
VIP Government Money Market Portfolio Initial Class 5.1% (a)(b) (Cost $3,078,830) | | 3,078,830 | 3,078,830 |
| | | | |
| TOTAL INVESTMENT IN SECURITIES - 100.0% (Cost $47,323,159) | 58,684,196 |
NET OTHER ASSETS (LIABILITIES) - 0.0% | (5,513) |
| NET ASSETS - 100.0% | 58,678,683 |
| | |
Legend
| (b) | The rate quoted is the annualized seven-day yield of the fund at period end. |
Affiliated Underlying Funds
Fiscal year to date information regarding the Fund's investments in affiliated Underlying Funds is presented below. Exchanges between classes of the same affiliated Underlying Funds may occur. If an Underlying Funds changes its name, the name presented below is the name in effect at period end.
| Affiliate | Value, beginning of period ($) | Purchases ($) | Sales Proceeds ($) | Dividend Income ($) | Realized Gain (loss) ($) | Change in Unrealized appreciation (depreciation) ($) | Value, end of period ($) |
| Fidelity Inflation-Protected Bond Index Fund | 9,341,789 | 819,680 | 1,785,097 | 14,709 | (120,850) | 181,836 | 8,437,358 |
| Fidelity International Bond Index Fund | 1,915,549 | 178,488 | 504,382 | 17,834 | (26,066) | 14,046 | 1,577,635 |
| Fidelity Long-Term Treasury Bond Index Fund | 2,300,409 | 219,100 | 885,369 | 31,477 | (206,039) | 75,114 | 1,503,215 |
| VIP Contrafund Portfolio Initial Class | 1,791,452 | 200,867 | 557,620 | 7,251 | 236,479 | 179,691 | 1,850,869 |
| VIP Emerging Markets Portfolio Initial Class | 4,338,412 | 795,882 | 996,658 | 3,654 | 88,023 | 302,854 | 4,528,513 |
| VIP Equity-Income Portfolio Initial Class | 1,452,686 | 298,234 | 374,210 | 8,134 | 36,736 | 96,503 | 1,509,949 |
| VIP Government Money Market Portfolio Initial Class 5.1% | 4,679,020 | 1,088,354 | 2,688,544 | 88,167 | - | - | 3,078,830 |
| VIP Growth & Income Portfolio Initial Class | 1,996,900 | 326,211 | 515,768 | 13,409 | 96,776 | 173,515 | 2,077,634 |
| VIP Growth Portfolio Initial Class | 2,966,784 | 356,622 | 858,471 | 44,480 | 198,083 | 414,755 | 3,077,773 |
| VIP High Income Portfolio Initial Class | 1,029,515 | 81,530 | 168,846 | 431 | (1,989) | 31,088 | 971,298 |
| VIP Investment Grade Bond II Portfolio - Initial Class | 20,864,630 | 3,387,265 | 3,539,642 | 12,721 | (135,611) | 46,830 | 20,623,472 |
| VIP Mid Cap Portfolio Initial Class | 454,667 | 97,930 | 114,575 | 8,410 | 14,130 | 24,364 | 476,516 |
| VIP Overseas Portfolio Initial Class | 7,655,851 | 846,502 | 1,649,881 | 28,352 | 340,453 | 194,671 | 7,387,596 |
| VIP Value Portfolio Initial Class | 1,013,180 | 259,331 | 239,417 | 21,934 | 21,974 | 2,484 | 1,057,552 |
| VIP Value Strategies Portfolio Initial Class | 501,376 | 136,025 | 122,385 | 7,019 | 12,171 | (1,201) | 525,986 |
| | 62,302,220 | 9,092,021 | 15,000,865 | 307,982 | 554,270 | 1,736,550 | 58,684,196 |
Amounts in the dividend income column in the above table include any capital gain distributions from underlying funds, which are presented in the corresponding line item in the Statement of Operations, if applicable.
Amounts included in the purchases and sales proceeds columns may include in-kind transactions, if applicable.
Investment Valuation
The following is a summary of the inputs used, as of June 30, 2024, involving the Fund's assets and liabilities carried at fair value. The inputs or methodology used for valuing securities may not be an indication of the risk associated with investing in those securities. For more information on valuation inputs, and their aggregation into the levels used below, please refer to the Investment Valuation section in the accompanying Notes to Financial Statements.
| Valuation Inputs at Reporting Date: |
| Description | Total ($) | Level 1 ($) | Level 2 ($) | Level 3 ($) |
Investments in Securities: | | | | |
|
| Domestic Equity Funds | 10,576,279 | 10,576,279 | - | - |
|
| International Equity Funds | 11,916,109 | 11,916,109 | - | - |
|
| Bond Funds | 33,112,978 | 33,112,978 | - | - |
|
| Short-Term Funds | 3,078,830 | 3,078,830 | - | - |
| Total Investments in Securities: | 58,684,196 | 58,684,196 | - | - |
VIP Freedom 2015 Portfolio℠
Financial Statements (Unaudited)
| Statement of Assets and Liabilities |
| | | | June 30, 2024 (Unaudited) |
| | | | | |
| Assets | | | | |
| Investment in securities, at value - See accompanying schedule: | | | | |
Affiliated issuers (cost $47,323,159) | $ | 58,684,196 | | |
| | | | | |
| | | | | |
| Total Investment in Securities (cost $47,323,159) | | | $ | 58,684,196 |
| Cash | | | | 205 |
| Receivable for investments sold | | | | 291,090 |
| Receivable for fund shares sold | | | | 9,931 |
Total assets | | | | 58,985,422 |
| Liabilities | | | | |
| Payable for investments purchased | $ | 274,791 | | |
| Payable for fund shares redeemed | | 26,222 | | |
| Distribution and service plan fees payable | | 5,726 | | |
| Total liabilities | | | | 306,739 |
| Net Assets | | | $ | 58,678,683 |
| Net Assets consist of: | | | | |
| Paid in capital | | | $ | 46,935,059 |
| Total accumulated earnings (loss) | | | | 11,743,624 |
| Net Assets | | | $ | 58,678,683 |
| | | | | |
| Net Asset Value and Maximum Offering Price | | | | |
| Initial Class : | | | | |
Net Asset Value, offering price and redemption price per share ($23,709,619 ÷ 2,041,510 shares) | | | $ | 11.61 |
| Service Class : | | | | |
Net Asset Value, offering price and redemption price per share ($12,502,505 ÷ 1,080,075 shares) | | | $ | 11.58 |
| Service Class 2 : | | | | |
Net Asset Value, offering price and redemption price per share ($22,466,559 ÷ 1,950,661 shares) | | | $ | 11.52 |
| Statement of Operations |
| | | | Six months ended June 30, 2024 (Unaudited) |
| Investment Income | | | | |
| Dividends: | | | | |
| Affiliated issuers | | | $ | 187,385 |
| Expenses | | | | |
| Distribution and service plan fees | $ | 35,217 | | |
| Independent trustees' fees and expenses | | 81 | | |
| Total expenses | | | | 35,298 |
| Net Investment income (loss) | | | | 152,087 |
| Realized and Unrealized Gain (Loss) | | | | |
| Net realized gain (loss) on: | | | | |
| Investment Securities: | | | | |
| Affiliated issuers | | 554,270 | | |
| Capital gain distributions from underlying funds: | | | | |
| Affiliated issuers | | 120,597 | | |
| Total net realized gain (loss) | | | | 674,867 |
| Change in net unrealized appreciation (depreciation) on: | | | | |
| Investment Securities: | | | | |
| Affiliated issuers | | 1,736,550 | | |
| Total change in net unrealized appreciation (depreciation) | | | | 1,736,550 |
| Net gain (loss) | | | | 2,411,417 |
| Net increase (decrease) in net assets resulting from operations | | | $ | 2,563,504 |
| Statement of Changes in Net Assets |
| |
| | Six months ended June 30, 2024 (Unaudited) | | Year ended December 31, 2023 |
| Increase (Decrease) in Net Assets | | | | |
| Operations | | | | |
| Net investment income (loss) | $ | 152,087 | $ | 1,707,988 |
| Net realized gain (loss) | | 674,867 | | 1,664,907 |
| Change in net unrealized appreciation (depreciation) | | 1,736,550 | | 2,980,827 |
| Net increase (decrease) in net assets resulting from operations | | 2,563,504 | | 6,353,722 |
| Distributions to shareholders | | (1,956,987) | | (3,369,075) |
| | | | | |
| Share transactions - net increase (decrease) | | (4,225,440) | | (3,755,098) |
| Total increase (decrease) in net assets | | (3,618,923) | | (770,451) |
| | | | | |
| Net Assets | | | | |
| Beginning of period | | 62,297,606 | | 63,068,057 |
| End of period | $ | 58,678,683 | $ | 62,297,606 |
| | | | | |
| | | | | |
Financial Highlights
VIP Freedom 2015 Portfolio℠ Initial Class |
| |
| | Six months ended (Unaudited) June 30, 2024 | | Years ended December 31, 2023 | | 2022 | | 2021 | | 2020 | | 2019 |
Selected Per-Share Data | | | | | | | | | | | | |
| Net asset value, beginning of period | $ | 11.49 | $ | 10.95 | $ | 14.42 | $ | 14.12 | $ | 13.20 | $ | 12.26 |
| Income from Investment Operations | | | | | | | | | | | | |
Net investment income (loss) A,B | | .04 | | .32 | | .27 | | .25 | | .17 | | .28 |
| Net realized and unrealized gain (loss) | | .45 | | .85 | | (2.21) | | .81 | | 1.57 | | 1.86 |
| Total from investment operations | | .49 | | 1.17 | | (1.94) | | 1.06 | | 1.74 | | 2.14 |
| Distributions from net investment income | | (.07) | | (.41) | | (.26) | | (.16) | | (.17) | | (.27) |
| Distributions from net realized gain | | (.31) | | (.22) | | (1.26) | | (.60) | | (.65) | | (.94) |
| Total distributions | | (.37) C | | (.63) | | (1.53) C | | (.76) | | (.82) | | (1.20) C |
| Net asset value, end of period | $ | 11.61 | $ | 11.49 | $ | 10.95 | $ | 14.42 | $ | 14.12 | $ | 13.20 |
Total Return D,E,F | | | | 10.95% | | (14.60)% | | 7.69% | | 13.76% | | 18.35% |
Ratios to Average Net Assets B,G,H | | | | | | | | | | | | |
Expenses before reductions I | | -% J | | -% | | -% | | -% | | -% | | -% |
Expenses net of fee waivers, if any I | | | | -% | | -% | | -% | | -% | | -% |
Expenses net of all reductions I | | -% J | | -% | | -% | | -% | | -% | | -% |
| Net investment income (loss) | | .63% J | | 2.90% | | 2.26% | | 1.75% | | 1.33% | | 2.22% |
| Supplemental Data | | | | | | | | | | | | |
| Net assets, end of period (000 omitted) | $ | 23,710 | $ | 24,978 | $ | 21,474 | $ | 33,325 | $ | 35,010 | $ | 32,215 |
Portfolio turnover rate K | | | | 32% | | 73% | | 43% | | 58% | | 39% |
ACalculated based on average shares outstanding during the period.
BNet investment income (loss) is affected by the timing of the declaration of dividends by any underlying mutual funds or exchange-traded funds (ETFs). Net investment income (loss) of any mutual funds or ETFs is not included in the Fund's net investment income (loss) ratio.
CTotal distributions per share do not sum due to rounding.
DTotal returns for periods of less than one year are not annualized.
ETotal returns do not reflect charges attributable to your insurance company's separate account. Inclusion of these charges would reduce the total returns shown.
FTotal returns would have been lower if certain expenses had not been reduced during the applicable periods shown.
GFees and expenses of any underlying mutual funds or exchange-traded funds (ETFs) are not included in the Fund's expense ratio. The Fund indirectly bears its proportionate share of these expenses.
HExpense ratios reflect operating expenses of the class. Expenses before reductions do not reflect amounts reimbursed, waived, or reduced through arrangements with the investment adviser, brokerage services, or other offset arrangements, if applicable, and do not represent the amount paid by the class during periods when reimbursements, waivers or reductions occur.
IAmount represents less than .005%.
JAnnualized.
KAmount does not include the portfolio activity of any underlying mutual funds or exchange-traded funds (ETFs).
VIP Freedom 2015 Portfolio℠ Service Class |
| |
| | Six months ended (Unaudited) June 30, 2024 | | Years ended December 31, 2023 | | 2022 | | 2021 | | 2020 | | 2019 |
Selected Per-Share Data | | | | | | | | | | | | |
| Net asset value, beginning of period | $ | 11.46 | $ | 10.92 | $ | 14.38 | $ | 14.08 | $ | 13.17 | $ | 12.24 |
| Income from Investment Operations | | | | | | | | | | | | |
Net investment income (loss) A,B | | .03 | | .31 | | .25 | | .24 | | .16 | | .27 |
| Net realized and unrealized gain (loss) | | .46 | | .85 | | (2.20) | | .80 | | 1.56 | | 1.85 |
| Total from investment operations | | .49 | | 1.16 | | (1.95) | | 1.04 | | 1.72 | | 2.12 |
| Distributions from net investment income | | (.07) | | (.40) | | (.25) | | (.14) | | (.16) | | (.26) |
| Distributions from net realized gain | | (.31) | | (.22) | | (1.26) | | (.60) | | (.65) | | (.94) |
| Total distributions | | (.37) C | | (.62) | | (1.51) | | (.74) | | (.81) | | (1.19) C |
| Net asset value, end of period | $ | 11.58 | $ | 11.46 | $ | 10.92 | $ | 14.38 | $ | 14.08 | $ | 13.17 |
Total Return D,E,F | | | | 10.86% | | (14.66)% | | 7.59% | | 13.62% | | 18.21% |
Ratios to Average Net Assets B,G,H | | | | | | | | | | | | |
| Expenses before reductions | | .10% I | | .10% | | .10% | | .10% | | .10% | | .10% |
| Expenses net of fee waivers, if any | | | | .10% | | .10% | | .10% | | .10% | | .10% |
| Expenses net of all reductions | | .10% I | | .10% | | .10% | | .10% | | .10% | | .10% |
| Net investment income (loss) | | .53% I | | 2.80% | | 2.16% | | 1.65% | | 1.23% | | 2.12% |
| Supplemental Data | | | | | | | | | | | | |
| Net assets, end of period (000 omitted) | $ | 12,503 | $ | 12,904 | $ | 16,217 | $ | 20,808 | $ | 27,209 | $ | 22,763 |
Portfolio turnover rate J | | | | 32% | | 73% | | 43% | | 58% | | 39% |
ACalculated based on average shares outstanding during the period.
BNet investment income (loss) is affected by the timing of the declaration of dividends by any underlying mutual funds or exchange-traded funds (ETFs). Net investment income (loss) of any mutual funds or ETFs is not included in the Fund's net investment income (loss) ratio.
CTotal distributions per share do not sum due to rounding.
DTotal returns for periods of less than one year are not annualized.
ETotal returns do not reflect charges attributable to your insurance company's separate account. Inclusion of these charges would reduce the total returns shown.
FTotal returns would have been lower if certain expenses had not been reduced during the applicable periods shown.
GFees and expenses of any underlying mutual funds or exchange-traded funds (ETFs) are not included in the Fund's expense ratio. The Fund indirectly bears its proportionate share of these expenses.
HExpense ratios reflect operating expenses of the class. Expenses before reductions do not reflect amounts reimbursed, waived, or reduced through arrangements with the investment adviser, brokerage services, or other offset arrangements, if applicable, and do not represent the amount paid by the class during periods when reimbursements, waivers or reductions occur.
IAnnualized.
JAmount does not include the portfolio activity of any underlying mutual funds or exchange-traded funds (ETFs).
VIP Freedom 2015 Portfolio℠ Service Class 2 |
| |
| | Six months ended (Unaudited) June 30, 2024 | | Years ended December 31, 2023 | | 2022 | | 2021 | | 2020 | | 2019 |
Selected Per-Share Data | | | | | | | | | | | | |
| Net asset value, beginning of period | $ | 11.41 | $ | 10.88 | $ | 14.33 | $ | 14.04 | $ | 13.12 | $ | 12.20 |
| Income from Investment Operations | | | | | | | | | | | | |
Net investment income (loss) A,B | | .02 | | .29 | | .23 | | .21 | | .14 | | .25 |
| Net realized and unrealized gain (loss) | | .46 | | .84 | | (2.19) | | .80 | | 1.57 | | 1.84 |
| Total from investment operations | | .48 | | 1.13 | | (1.96) | | 1.01 | | 1.71 | | 2.09 |
| Distributions from net investment income | | (.07) | | (.38) | | (.23) | | (.12) | | (.14) | | (.23) |
| Distributions from net realized gain | | (.31) | | (.22) | | (1.26) | | (.60) | | (.65) | | (.94) |
| Total distributions | | (.37) C | | (.60) | | (1.49) | | (.72) | | (.79) | | (1.17) |
| Net asset value, end of period | $ | 11.52 | $ | 11.41 | $ | 10.88 | $ | 14.33 | $ | 14.04 | $ | 13.12 |
Total Return D,E,F | | | | 10.64% | | (14.79)% | | 7.39% | | 13.56% | | 17.97% |
Ratios to Average Net Assets B,G,H | | | | | | | | | | | | |
| Expenses before reductions | | .25% I | | .25% | | .25% | | .25% | | .25% | | .25% |
| Expenses net of fee waivers, if any | | | | .25% | | .25% | | .25% | | .25% | | .25% |
| Expenses net of all reductions | | .25% I | | .25% | | .25% | | .25% | | .25% | | .25% |
| Net investment income (loss) | | .38% I | | 2.65% | | 2.01% | | 1.50% | | 1.08% | | 1.97% |
| Supplemental Data | | | | | | | | | | | | |
| Net assets, end of period (000 omitted) | $ | 22,467 | $ | 24,415 | $ | 25,377 | $ | 37,143 | $ | 36,840 | $ | 38,963 |
Portfolio turnover rate J | | | | 32% | | 73% | | 43% | | 58% | | 39% |
ACalculated based on average shares outstanding during the period.
BNet investment income (loss) is affected by the timing of the declaration of dividends by any underlying mutual funds or exchange-traded funds (ETFs). Net investment income (loss) of any mutual funds or ETFs is not included in the Fund's net investment income (loss) ratio.
CTotal distributions per share do not sum due to rounding.
DTotal returns for periods of less than one year are not annualized.
ETotal returns do not reflect charges attributable to your insurance company's separate account. Inclusion of these charges would reduce the total returns shown.
FTotal returns would have been lower if certain expenses had not been reduced during the applicable periods shown.
GFees and expenses of any underlying mutual funds or exchange-traded funds (ETFs) are not included in the Fund's expense ratio. The Fund indirectly bears its proportionate share of these expenses.
HExpense ratios reflect operating expenses of the class. Expenses before reductions do not reflect amounts reimbursed, waived, or reduced through arrangements with the investment adviser, brokerage services, or other offset arrangements, if applicable, and do not represent the amount paid by the class during periods when reimbursements, waivers or reductions occur.
IAnnualized.
JAmount does not include the portfolio activity of any underlying mutual funds or exchange-traded funds (ETFs).
VIP Freedom 2020 Portfolio℠
Schedule of Investments June 30, 2024 (Unaudited)
Showing Percentage of Net Assets
| Domestic Equity Funds - 23.5% |
| | | Shares | Value ($) |
| VIP Contrafund Portfolio Initial Class (a) | | 376,061 | 22,785,519 |
| VIP Equity-Income Portfolio Initial Class (a) | | 687,953 | 18,588,498 |
| VIP Growth & Income Portfolio Initial Class (a) | | 833,400 | 25,577,035 |
| VIP Growth Portfolio Initial Class (a) | | 334,359 | 37,889,542 |
| VIP Mid Cap Portfolio Initial Class (a) | | 149,267 | 5,866,198 |
| VIP Value Portfolio Initial Class (a) | | 669,713 | 13,019,213 |
| VIP Value Strategies Portfolio Initial Class (a) | | 385,888 | 6,475,194 |
| TOTAL DOMESTIC EQUITY FUNDS (Cost $44,980,477) | | | 130,201,199 |
| | | | |
| International Equity Funds - 24.0% |
| | | Shares | Value ($) |
| VIP Emerging Markets Portfolio Initial Class (a) | | 4,179,557 | 48,524,659 |
| VIP Overseas Portfolio Initial Class (a) | | 3,029,722 | 84,105,092 |
| TOTAL INTERNATIONAL EQUITY FUNDS (Cost $78,575,139) | | | 132,629,751 |
| | | | |
| Bond Funds - 52.3% |
| | | Shares | Value ($) |
| Fidelity Inflation-Protected Bond Index Fund (a) | | 8,193,707 | 74,644,671 |
| Fidelity International Bond Index Fund (a) | | 1,814,737 | 16,586,694 |
| Fidelity Long-Term Treasury Bond Index Fund (a) | | 1,757,970 | 16,683,136 |
| VIP High Income Portfolio Initial Class (a) | | 1,931,053 | 9,153,190 |
| VIP Investment Grade Bond II Portfolio - Initial Class (a) | | 18,253,126 | 171,944,448 |
| TOTAL BOND FUNDS (Cost $305,947,709) | | | 289,012,139 |
| | | | |
| Short-Term Funds - 0.2% |
| | | Shares | Value ($) |
VIP Government Money Market Portfolio Initial Class 5.1% (a)(b) (Cost $1,057,699) | | 1,057,699 | 1,057,699 |
| | | | |
| TOTAL INVESTMENT IN SECURITIES - 100.0% (Cost $430,561,024) | 552,900,788 |
NET OTHER ASSETS (LIABILITIES) - 0.0% | (83,858) |
| NET ASSETS - 100.0% | 552,816,930 |
| | |
Legend
| (b) | The rate quoted is the annualized seven-day yield of the fund at period end. |
Affiliated Central Funds
Fiscal year to date information regarding the Fund's investments in Fidelity Central Funds, including the ownership percentage, is presented below.
| Affiliate | Value, beginning of period ($) | Purchases ($) | Sales Proceeds ($) | Dividend Income ($) | Realized Gain (loss) ($) | Change in Unrealized appreciation (depreciation) ($) | Value, end of period ($) | % ownership, end of period |
| Fidelity Cash Central Fund 5.38% | - | 438,267 | 438,267 | 65 | - | - | - | 0.0% |
| Total | - | 438,267 | 438,267 | 65 | - | - | - | |
| | | | | | | | | |
Amounts in the dividend income column in the above table include any capital gain distributions from underlying funds, which are presented in the corresponding line item in the Statement of Operations, if applicable.
Amounts included in the purchases and sales proceeds columns may include in-kind transactions, if applicable.
Affiliated Underlying Funds
Fiscal year to date information regarding the Fund's investments in affiliated Underlying Funds is presented below. Exchanges between classes of the same affiliated Underlying Funds may occur. If an Underlying Funds changes its name, the name presented below is the name in effect at period end.
| Affiliate | Value, beginning of period ($) | Purchases ($) | Sales Proceeds ($) | Dividend Income ($) | Realized Gain (loss) ($) | Change in Unrealized appreciation (depreciation) ($) | Value, end of period ($) |
| Fidelity Inflation-Protected Bond Index Fund | 80,294,782 | 4,717,916 | 10,933,141 | 128,201 | (460,477) | 1,025,591 | 74,644,671 |
| Fidelity International Bond Index Fund | 19,369,102 | 1,200,630 | 3,863,087 | 181,449 | 2,847 | (122,798) | 16,586,694 |
| Fidelity Long-Term Treasury Bond Index Fund | 21,724,310 | 5,120,092 | 8,905,258 | 331,538 | (799,449) | (456,559) | 16,683,136 |
| VIP Contrafund Portfolio Initial Class | 22,203,724 | 1,188,668 | 5,744,935 | 87,704 | 2,528,091 | 2,609,971 | 22,785,519 |
| VIP Emerging Markets Portfolio Initial Class | 46,179,241 | 6,196,732 | 8,031,502 | 38,935 | 557,763 | 3,622,425 | 48,524,659 |
| VIP Equity-Income Portfolio Initial Class | 18,004,849 | 2,421,531 | 3,457,234 | 99,409 | 182,168 | 1,437,184 | 18,588,498 |
| VIP Government Money Market Portfolio Initial Class 5.1% | 11,551,535 | 3,287,762 | 13,781,598 | 107,619 | - | - | 1,057,699 |
| VIP Growth & Income Portfolio Initial Class | 24,749,954 | 2,366,475 | 4,850,242 | 162,711 | 1,044,611 | 2,266,237 | 25,577,035 |
| VIP Growth Portfolio Initial Class | 36,771,285 | 2,117,508 | 8,586,214 | 538,012 | 1,700,449 | 5,886,514 | 37,889,542 |
| VIP High Income Portfolio Initial Class | 9,542,272 | 434,928 | 1,098,710 | 3,998 | (12,167) | 286,867 | 9,153,190 |
| VIP Investment Grade Bond II Portfolio - Initial Class | 176,191,286 | 17,993,570 | 21,488,867 | 107,350 | (545,627) | (205,914) | 171,944,448 |
| VIP Mid Cap Portfolio Initial Class | 5,635,427 | 834,753 | 1,074,554 | 103,400 | 121,452 | 349,120 | 5,866,198 |
| VIP Overseas Portfolio Initial Class | 86,285,319 | 5,654,157 | 13,964,490 | 320,507 | 2,616,193 | 3,513,913 | 84,105,092 |
| VIP Value Portfolio Initial Class | 12,557,849 | 2,346,485 | 2,170,694 | 267,883 | 169,606 | 115,967 | 13,019,213 |
| VIP Value Strategies Portfolio Initial Class | 6,214,377 | 1,269,882 | 1,137,961 | 86,277 | 93,854 | 35,042 | 6,475,194 |
| | 577,275,312 | 57,151,089 | 109,088,487 | 2,564,993 | 7,199,314 | 20,363,560 | 552,900,788 |
Amounts in the dividend income column in the above table include any capital gain distributions from underlying funds, which are presented in the corresponding line item in the Statement of Operations, if applicable.
Amounts included in the purchases and sales proceeds columns may include in-kind transactions, if applicable.
Investment Valuation
The following is a summary of the inputs used, as of June 30, 2024, involving the Fund's assets and liabilities carried at fair value. The inputs or methodology used for valuing securities may not be an indication of the risk associated with investing in those securities. For more information on valuation inputs, and their aggregation into the levels used below, please refer to the Investment Valuation section in the accompanying Notes to Financial Statements.
| Valuation Inputs at Reporting Date: |
| Description | Total ($) | Level 1 ($) | Level 2 ($) | Level 3 ($) |
Investments in Securities: | | | | |
|
| Domestic Equity Funds | 130,201,199 | 130,201,199 | - | - |
|
| International Equity Funds | 132,629,751 | 132,629,751 | - | - |
|
| Bond Funds | 289,012,139 | 289,012,139 | - | - |
|
| Short-Term Funds | 1,057,699 | 1,057,699 | - | - |
| Total Investments in Securities: | 552,900,788 | 552,900,788 | - | - |
VIP Freedom 2020 Portfolio℠
Financial Statements (Unaudited)
| Statement of Assets and Liabilities |
| | | | June 30, 2024 (Unaudited) |
| | | | | |
| Assets | | | | |
| Investment in securities, at value - See accompanying schedule: | | | | |
Affiliated issuers (cost $430,561,024) | $ | 552,900,788 | | |
| | | | | |
| | | | | |
| Total Investment in Securities (cost $430,561,024) | | | $ | 552,900,788 |
| Cash | | | | 140 |
| Receivable for investments sold | | | | 3,793,667 |
| Receivable for fund shares sold | | | | 34,249 |
Total assets | | | | 556,728,844 |
| Liabilities | | | | |
| Payable for investments purchased | $ | 2,802,836 | | |
| Payable for fund shares redeemed | | 1,025,033 | | |
| Distribution and service plan fees payable | | 84,045 | | |
| Total liabilities | | | | 3,911,914 |
| Net Assets | | | $ | 552,816,930 |
| Net Assets consist of: | | | | |
| Paid in capital | | | $ | 427,321,812 |
| Total accumulated earnings (loss) | | | | 125,495,118 |
| Net Assets | | | $ | 552,816,930 |
| | | | | |
| Net Asset Value and Maximum Offering Price | | | | |
| Initial Class : | | | | |
Net Asset Value, offering price and redemption price per share ($83,804,381 ÷ 6,547,498 shares) | | | $ | 12.80 |
| Service Class : | | | | |
Net Asset Value, offering price and redemption price per share ($115,457,302 ÷ 9,064,235 shares) | | | $ | 12.74 |
| Service Class 2 : | | | | |
Net Asset Value, offering price and redemption price per share ($353,555,247 ÷ 27,901,325 shares) | | | $ | 12.67 |
| Statement of Operations |
| | | | Six months ended June 30, 2024 (Unaudited) |
| Investment Income | | | | |
| Dividends: | | | | |
| Affiliated issuers | | | $ | 1,107,670 |
| Income from Fidelity Central Funds | | | | 65 |
| Total income | | | | 1,107,735 |
| Expenses | | | | |
| Distribution and service plan fees | $ | 507,424 | | |
| Independent trustees' fees and expenses | | 756 | | |
| Total expenses | | | | 508,180 |
| Net Investment income (loss) | | | | 599,555 |
| Realized and Unrealized Gain (Loss) | | | | |
| Net realized gain (loss) on: | | | | |
| Investment Securities: | | | | |
| Affiliated issuers | | 7,199,314 | | |
| Capital gain distributions from underlying funds: | | | | |
| Affiliated issuers | | 1,457,323 | | |
| Total net realized gain (loss) | | | | 8,656,637 |
| Change in net unrealized appreciation (depreciation) on: | | | | |
| Investment Securities: | | | | |
| Affiliated issuers | | 20,363,560 | | |
| Total change in net unrealized appreciation (depreciation) | | | | 20,363,560 |
| Net gain (loss) | | | | 29,020,197 |
| Net increase (decrease) in net assets resulting from operations | | | $ | 29,619,752 |
| Statement of Changes in Net Assets |
| |
| | Six months ended June 30, 2024 (Unaudited) | | Year ended December 31, 2023 |
| Increase (Decrease) in Net Assets | | | | |
| Operations | | | | |
| Net investment income (loss) | $ | 599,555 | $ | 13,510,865 |
| Net realized gain (loss) | | 8,656,637 | | 16,128,265 |
| Change in net unrealized appreciation (depreciation) | | 20,363,560 | | 35,813,659 |
| Net increase (decrease) in net assets resulting from operations | | 29,619,752 | | 65,452,789 |
| Distributions to shareholders | | (16,788,514) | | (21,127,196) |
| | | | | |
| Share transactions - net increase (decrease) | | (37,207,310) | | (32,060,845) |
| Total increase (decrease) in net assets | | (24,376,072) | | 12,264,748 |
| | | | | |
| Net Assets | | | | |
| Beginning of period | | 577,193,002 | | 564,928,254 |
| End of period | $ | 552,816,930 | $ | 577,193,002 |
| | | | | |
| | | | | |
Financial Highlights
VIP Freedom 2020 Portfolio℠ Initial Class |
| |
| | Six months ended (Unaudited) June 30, 2024 | | Years ended December 31, 2023 | | 2022 | | 2021 | | 2020 | | 2019 |
Selected Per-Share Data | | | | | | | | | | | | |
| Net asset value, beginning of period | $ | 12.50 | $ | 11.56 | $ | 15.42 | $ | 15.03 | $ | 14.01 | $ | 12.58 |
| Income from Investment Operations | | | | | | | | | | | | |
Net investment income (loss) A,B | | .02 | | .31 | | .28 | | .27 | | .17 | | .28 |
| Net realized and unrealized gain (loss) | | .66 | | 1.10 | | (2.51) | | 1.11 | | 1.84 | | 2.16 |
| Total from investment operations | | .68 | | 1.41 | | (2.23) | | 1.38 | | 2.01 | | 2.44 |
| Distributions from net investment income | | (.07) | | (.39) | | (.27) | | (.17) | | (.18) | | (.28) |
| Distributions from net realized gain | | (.31) | | (.08) | | (1.36) | | (.81) | | (.80) | | (.73) |
| Total distributions | | (.38) | | (.47) | | (1.63) | | (.99) C | | (.99) C | | (1.01) |
| Net asset value, end of period | $ | 12.80 | $ | 12.50 | $ | 11.56 | $ | 15.42 | $ | 15.03 | $ | 14.01 |
Total Return D,E,F | | | | 12.40% | | (15.69)% | | 9.47% | | 15.06% | | 20.13% |
Ratios to Average Net Assets B,G,H | | | | | | | | | | | | |
Expenses before reductions I | | -% J | | -% | | -% | | -% | | -% | | -% |
Expenses net of fee waivers, if any I | | | | -% | | -% | | -% | | -% | | -% |
Expenses net of all reductions I | | -% J | | -% | | -% | | -% | | -% | | -% |
| Net investment income (loss) | | .39% J | | 2.60% | | 2.26% | | 1.77% | | 1.27% | | 2.08% |
| Supplemental Data | | | | | | | | | | | | |
| Net assets, end of period (000 omitted) | $ | 83,804 | $ | 85,393 | $ | 63,227 | $ | 82,875 | $ | 80,503 | $ | 74,801 |
Portfolio turnover rate K | | | | 27% | | 121% | | 34% | | 40% | | 31% |
ACalculated based on average shares outstanding during the period.
BNet investment income (loss) is affected by the timing of the declaration of dividends by any underlying mutual funds or exchange-traded funds (ETFs). Net investment income (loss) of any mutual funds or ETFs is not included in the Fund's net investment income (loss) ratio.
CTotal distributions per share do not sum due to rounding.
DTotal returns for periods of less than one year are not annualized.
ETotal returns do not reflect charges attributable to your insurance company's separate account. Inclusion of these charges would reduce the total returns shown.
FTotal returns would have been lower if certain expenses had not been reduced during the applicable periods shown.
GFees and expenses of any underlying mutual funds or exchange-traded funds (ETFs) are not included in the Fund's expense ratio. The Fund indirectly bears its proportionate share of these expenses. For additional expense information related to investments in Fidelity Central Funds, please refer to the "Investments in Fidelity Central Funds" note found in the Notes to Financial Statements section of the most recent Annual or Semi-Annual report.
HExpense ratios reflect operating expenses of the class. Expenses before reductions do not reflect amounts reimbursed, waived, or reduced through arrangements with the investment adviser, brokerage services, or other offset arrangements, if applicable, and do not represent the amount paid by the class during periods when reimbursements, waivers or reductions occur.
IAmount represents less than .005%.
JAnnualized.
KAmount does not include the portfolio activity of any underlying mutual funds or exchange-traded funds (ETFs).
VIP Freedom 2020 Portfolio℠ Service Class |
| |
| | Six months ended (Unaudited) June 30, 2024 | | Years ended December 31, 2023 | | 2022 | | 2021 | | 2020 | | 2019 |
Selected Per-Share Data | | | | | | | | | | | | |
| Net asset value, beginning of period | $ | 12.45 | $ | 11.51 | $ | 15.37 | $ | 14.97 | $ | 13.96 | $ | 12.54 |
| Income from Investment Operations | | | | | | | | | | | | |
Net investment income (loss) A,B | | .02 | | .30 | | .27 | | .25 | | .16 | | .26 |
| Net realized and unrealized gain (loss) | | .65 | | 1.10 | | (2.52) | | 1.12 | | 1.82 | | 2.16 |
| Total from investment operations | | .67 | | 1.40 | | (2.25) | | 1.37 | | 1.98 | | 2.42 |
| Distributions from net investment income | | (.07) | | (.38) | | (.26) | | (.16) | | (.17) | | (.27) |
| Distributions from net realized gain | | (.31) | | (.08) | | (1.36) | | (.81) | | (.80) | | (.73) |
| Total distributions | | (.38) | | (.46) | | (1.61) C | | (.97) | | (.97) | | (1.00) |
| Net asset value, end of period | $ | 12.74 | $ | 12.45 | $ | 11.51 | $ | 15.37 | $ | 14.97 | $ | 13.96 |
Total Return D,E,F | | | | 12.34% | | (15.83)% | | 9.47% | | 14.92% | | 20.01% |
Ratios to Average Net Assets B,G,H | | | | | | | | | | | | |
| Expenses before reductions | | .10% I | | .10% | | .10% | | .10% | | .10% | | .10% |
| Expenses net of fee waivers, if any | | | | .10% | | .10% | | .10% | | .10% | | .10% |
| Expenses net of all reductions | | .10% I | | .10% | | .10% | | .10% | | .10% | | .10% |
| Net investment income (loss) | | .29% I | | 2.50% | | 2.16% | | 1.67% | | 1.17% | | 1.98% |
| Supplemental Data | | | | | | | | | | | | |
| Net assets, end of period (000 omitted) | $ | 115,457 | $ | 125,938 | $ | 129,176 | $ | 167,097 | $ | 178,229 | $ | 171,842 |
Portfolio turnover rate J | | | | 27% | | 121% | | 34% | | 40% | | 31% |
ACalculated based on average shares outstanding during the period.
BNet investment income (loss) is affected by the timing of the declaration of dividends by any underlying mutual funds or exchange-traded funds (ETFs). Net investment income (loss) of any mutual funds or ETFs is not included in the Fund's net investment income (loss) ratio.
CTotal distributions per share do not sum due to rounding.
DTotal returns for periods of less than one year are not annualized.
ETotal returns do not reflect charges attributable to your insurance company's separate account. Inclusion of these charges would reduce the total returns shown.
FTotal returns would have been lower if certain expenses had not been reduced during the applicable periods shown.
GFees and expenses of any underlying mutual funds or exchange-traded funds (ETFs) are not included in the Fund's expense ratio. The Fund indirectly bears its proportionate share of these expenses. For additional expense information related to investments in Fidelity Central Funds, please refer to the "Investments in Fidelity Central Funds" note found in the Notes to Financial Statements section of the most recent Annual or Semi-Annual report.
HExpense ratios reflect operating expenses of the class. Expenses before reductions do not reflect amounts reimbursed, waived, or reduced through arrangements with the investment adviser, brokerage services, or other offset arrangements, if applicable, and do not represent the amount paid by the class during periods when reimbursements, waivers or reductions occur.
IAnnualized.
JAmount does not include the portfolio activity of any underlying mutual funds or exchange-traded funds (ETFs).
VIP Freedom 2020 Portfolio℠ Service Class 2 |
| |
| | Six months ended (Unaudited) June 30, 2024 | | Years ended December 31, 2023 | | 2022 | | 2021 | | 2020 | | 2019 |
Selected Per-Share Data | | | | | | | | | | | | |
| Net asset value, beginning of period | $ | 12.40 | $ | 11.46 | $ | 15.31 | $ | 14.92 | $ | 13.92 | $ | 12.50 |
| Income from Investment Operations | | | | | | | | | | | | |
Net investment income (loss) A,B | | .01 | | .28 | | .25 | | .23 | | .14 | | .24 |
| Net realized and unrealized gain (loss) | | .64 | | 1.10 | | (2.51) | | 1.11 | | 1.81 | | 2.16 |
| Total from investment operations | | .65 | | 1.38 | | (2.26) | | 1.34 | | 1.95 | | 2.40 |
| Distributions from net investment income | | (.07) | | (.36) | | (.24) | | (.13) | | (.14) | | (.25) |
| Distributions from net realized gain | | (.31) | | (.08) | | (1.36) | | (.81) | | (.80) | | (.73) |
| Total distributions | | (.38) | | (.44) | | (1.59) C | | (.95) C | | (.95) C | | (.98) |
| Net asset value, end of period | $ | 12.67 | $ | 12.40 | $ | 11.46 | $ | 15.31 | $ | 14.92 | $ | 13.92 |
Total Return D,E,F | | | | 12.22% | | (15.97)% | | 9.26% | | 14.72% | | 19.88% |
Ratios to Average Net Assets B,G,H | | | | | | | | | | | | |
| Expenses before reductions | | .25% I | | .25% | | .25% | | .25% | | .25% | | .25% |
| Expenses net of fee waivers, if any | | | | .25% | | .25% | | .25% | | .25% | | .25% |
| Expenses net of all reductions | | .25% I | | .25% | | .25% | | .25% | | .25% | | .25% |
| Net investment income (loss) | | .14% I | | 2.35% | | 2.01% | | 1.51% | | 1.02% | | 1.83% |
| Supplemental Data | | | | | | | | | | | | |
| Net assets, end of period (000 omitted) | $ | 353,555 | $ | 365,862 | $ | 372,526 | $ | 508,713 | $ | 522,637 | $ | 506,978 |
Portfolio turnover rate J | | | | 27% | | 121% | | 34% | | 40% | | 31% |
ACalculated based on average shares outstanding during the period.
BNet investment income (loss) is affected by the timing of the declaration of dividends by any underlying mutual funds or exchange-traded funds (ETFs). Net investment income (loss) of any mutual funds or ETFs is not included in the Fund's net investment income (loss) ratio.
CTotal distributions per share do not sum due to rounding.
DTotal returns for periods of less than one year are not annualized.
ETotal returns do not reflect charges attributable to your insurance company's separate account. Inclusion of these charges would reduce the total returns shown.
FTotal returns would have been lower if certain expenses had not been reduced during the applicable periods shown.
GFees and expenses of any underlying mutual funds or exchange-traded funds (ETFs) are not included in the Fund's expense ratio. The Fund indirectly bears its proportionate share of these expenses. For additional expense information related to investments in Fidelity Central Funds, please refer to the "Investments in Fidelity Central Funds" note found in the Notes to Financial Statements section of the most recent Annual or Semi-Annual report.
HExpense ratios reflect operating expenses of the class. Expenses before reductions do not reflect amounts reimbursed, waived, or reduced through arrangements with the investment adviser, brokerage services, or other offset arrangements, if applicable, and do not represent the amount paid by the class during periods when reimbursements, waivers or reductions occur.
IAnnualized.
JAmount does not include the portfolio activity of any underlying mutual funds or exchange-traded funds (ETFs).
VIP Freedom 2025 Portfolio℠
Schedule of Investments June 30, 2024 (Unaudited)
Showing Percentage of Net Assets
| Domestic Equity Funds - 28.4% |
| | | Shares | Value ($) |
| VIP Contrafund Portfolio Initial Class (a) | | 308,793 | 18,709,783 |
| VIP Equity-Income Portfolio Initial Class (a) | | 564,873 | 15,262,869 |
| VIP Growth & Income Portfolio Initial Class (a) | | 684,298 | 21,001,112 |
| VIP Growth Portfolio Initial Class (a) | | 274,547 | 31,111,663 |
| VIP Mid Cap Portfolio Initial Class (a) | | 122,562 | 4,816,698 |
| VIP Value Portfolio Initial Class (a) | | 549,897 | 10,690,002 |
| VIP Value Strategies Portfolio Initial Class (a) | | 316,847 | 5,316,688 |
| TOTAL DOMESTIC EQUITY FUNDS (Cost $57,376,381) | | | 106,908,815 |
| | | | |
| International Equity Funds - 27.3% |
| | | Shares | Value ($) |
| VIP Emerging Markets Portfolio Initial Class (a) | | 3,138,536 | 36,438,408 |
| VIP Overseas Portfolio Initial Class (a) | | 2,387,450 | 66,275,624 |
| TOTAL INTERNATIONAL EQUITY FUNDS (Cost $78,001,579) | | | 102,714,032 |
| | | | |
| Bond Funds - 44.3% |
| | | Shares | Value ($) |
| Fidelity Inflation-Protected Bond Index Fund (a) | | 5,097,573 | 46,438,887 |
| Fidelity International Bond Index Fund (a) | | 1,197,939 | 10,949,164 |
| Fidelity Long-Term Treasury Bond Index Fund (a) | | 2,452,139 | 23,270,799 |
| VIP High Income Portfolio Initial Class (a) | | 1,314,264 | 6,229,613 |
| VIP Investment Grade Bond II Portfolio - Initial Class (a) | | 8,468,182 | 79,770,276 |
| TOTAL BOND FUNDS (Cost $178,262,876) | | | 166,658,739 |
| | | | |
| TOTAL INVESTMENT IN SECURITIES - 100.0% (Cost $313,640,836) | 376,281,586 |
NET OTHER ASSETS (LIABILITIES) - 0.0% | (34,242) |
| NET ASSETS - 100.0% | 376,247,344 |
| | |
Legend
Affiliated Underlying Funds
Fiscal year to date information regarding the Fund's investments in affiliated Underlying Funds is presented below. Exchanges between classes of the same affiliated Underlying Funds may occur. If an Underlying Funds changes its name, the name presented below is the name in effect at period end.
| Affiliate | Value, beginning of period ($) | Purchases ($) | Sales Proceeds ($) | Dividend Income ($) | Realized Gain (loss) ($) | Change in Unrealized appreciation (depreciation) ($) | Value, end of period ($) |
| Fidelity Inflation-Protected Bond Index Fund | 45,960,157 | 6,319,839 | 6,201,144 | 76,604 | (162,527) | 522,562 | 46,438,887 |
| Fidelity International Bond Index Fund | 13,026,169 | 1,515,457 | 3,516,522 | 118,727 | (129,940) | 54,000 | 10,949,164 |
| Fidelity Long-Term Treasury Bond Index Fund | 21,236,859 | 9,945,440 | 6,566,891 | 401,868 | (863,908) | (480,701) | 23,270,799 |
| VIP Contrafund Portfolio Initial Class | 17,851,037 | 1,340,497 | 4,589,693 | 68,830 | 655,140 | 3,452,802 | 18,709,783 |
| VIP Emerging Markets Portfolio Initial Class | 34,002,026 | 5,662,070 | 6,288,305 | 28,061 | 113,331 | 2,949,286 | 36,438,408 |
| VIP Equity-Income Portfolio Initial Class | 14,475,187 | 2,099,811 | 2,591,517 | 77,796 | 74,688 | 1,204,700 | 15,262,869 |
| VIP Government Money Market Portfolio Initial Class 5.1% | - | 747,745 | 747,745 | 3,210 | - | - | - |
| VIP Growth & Income Portfolio Initial Class | 19,898,021 | 2,195,756 | 3,726,120 | 128,467 | 169,294 | 2,464,161 | 21,001,112 |
| VIP Growth Portfolio Initial Class | 29,563,106 | 2,326,756 | 6,855,435 | 422,229 | 834,240 | 5,242,996 | 31,111,663 |
| VIP High Income Portfolio Initial Class | 6,341,779 | 559,993 | 855,013 | 2,600 | (7,070) | 189,924 | 6,229,613 |
| VIP Investment Grade Bond II Portfolio - Initial Class | 95,810,293 | 9,287,849 | 24,806,115 | 55,110 | (878,337) | 356,586 | 79,770,276 |
| VIP Mid Cap Portfolio Initial Class | 4,530,824 | 798,096 | 882,093 | 81,117 | 51,460 | 318,411 | 4,816,698 |
| VIP Overseas Portfolio Initial Class | 65,800,781 | 7,196,628 | 11,369,162 | 239,607 | 169,101 | 4,478,276 | 66,275,624 |
| VIP Value Portfolio Initial Class | 10,096,260 | 2,060,097 | 1,679,543 | 209,594 | 45,533 | 167,655 | 10,690,002 |
| VIP Value Strategies Portfolio Initial Class | 4,996,294 | 1,160,294 | 933,681 | 67,666 | 30,456 | 63,325 | 5,316,688 |
| | 383,588,793 | 53,216,328 | 81,608,979 | 1,981,486 | 101,461 | 20,983,983 | 376,281,586 |
Amounts in the dividend income column in the above table include any capital gain distributions from underlying funds, which are presented in the corresponding line item in the Statement of Operations, if applicable.
Amounts included in the purchases and sales proceeds columns may include in-kind transactions, if applicable.
Investment Valuation
The following is a summary of the inputs used, as of June 30, 2024, involving the Fund's assets and liabilities carried at fair value. The inputs or methodology used for valuing securities may not be an indication of the risk associated with investing in those securities. For more information on valuation inputs, and their aggregation into the levels used below, please refer to the Investment Valuation section in the accompanying Notes to Financial Statements.
| Valuation Inputs at Reporting Date: |
| Description | Total ($) | Level 1 ($) | Level 2 ($) | Level 3 ($) |
Investments in Securities: | | | | |
|
| Domestic Equity Funds | 106,908,815 | 106,908,815 | - | - |
|
| International Equity Funds | 102,714,032 | 102,714,032 | - | - |
|
| Bond Funds | 166,658,739 | 166,658,739 | - | - |
| Total Investments in Securities: | 376,281,586 | 376,281,586 | - | - |
VIP Freedom 2025 Portfolio℠
Financial Statements (Unaudited)
| Statement of Assets and Liabilities |
| | | | June 30, 2024 (Unaudited) |
| | | | | |
| Assets | | | | |
| Investment in securities, at value - See accompanying schedule: | | | | |
Affiliated issuers (cost $313,640,836) | $ | 376,281,586 | | |
| | | | | |
| | | | | |
| Total Investment in Securities (cost $313,640,836) | | | $ | 376,281,586 |
| Cash | | | | 3,461 |
| Receivable for investments sold | | | | 2,559,841 |
| Receivable for fund shares sold | | | | 341,798 |
Total assets | | | | 379,186,686 |
| Liabilities | | | | |
| Payable for investments purchased | $ | 2,624,817 | | |
| Payable for fund shares redeemed | | 276,889 | | |
| Distribution and service plan fees payable | | 37,636 | | |
| Total liabilities | | | | 2,939,342 |
| Net Assets | | | $ | 376,247,344 |
| Net Assets consist of: | | | | |
| Paid in capital | | | $ | 318,115,249 |
| Total accumulated earnings (loss) | | | | 58,132,095 |
| Net Assets | | | $ | 376,247,344 |
| | | | | |
| Net Asset Value and Maximum Offering Price | | | | |
| Initial Class : | | | | |
Net Asset Value, offering price and redemption price per share ($93,381,402 ÷ 5,813,749 shares) | | | $ | 16.06 |
| Service Class : | | | | |
Net Asset Value, offering price and redemption price per share ($171,545,736 ÷ 10,724,173 shares) | | | $ | 16.00 |
| Service Class 2 : | | | | |
Net Asset Value, offering price and redemption price per share ($111,320,206 ÷ 7,010,547 shares) | | | $ | 15.88 |
| Statement of Operations |
| | | | Six months ended June 30, 2024 (Unaudited) |
| Investment Income | | | | |
| Dividends: | | | | |
| Affiliated issuers | | | $ | 842,489 |
| Expenses | | | | |
| Distribution and service plan fees | $ | 222,584 | | |
| Independent trustees' fees and expenses | | 501 | | |
| Total expenses | | | | 223,085 |
| Net Investment income (loss) | | | | 619,404 |
| Realized and Unrealized Gain (Loss) | | | | |
| Net realized gain (loss) on: | | | | |
| Investment Securities: | | | | |
| Affiliated issuers | | 101,461 | | |
| Capital gain distributions from underlying funds: | | | | |
| Affiliated issuers | | 1,138,997 | | |
| Total net realized gain (loss) | | | | 1,240,458 |
| Change in net unrealized appreciation (depreciation) on: | | | | |
| Investment Securities: | | | | |
| Affiliated issuers | | 20,983,983 | | |
| Total change in net unrealized appreciation (depreciation) | | | | 20,983,983 |
| Net gain (loss) | | | | 22,224,441 |
| Net increase (decrease) in net assets resulting from operations | | | $ | 22,843,845 |
| Statement of Changes in Net Assets |
| |
| | Six months ended June 30, 2024 (Unaudited) | | Year ended December 31, 2023 |
| Increase (Decrease) in Net Assets | | | | |
| Operations | | | | |
| Net investment income (loss) | $ | 619,404 | $ | 8,168,556 |
| Net realized gain (loss) | | 1,240,458 | | 1,913,349 |
| Change in net unrealized appreciation (depreciation) | | 20,983,983 | | 34,621,437 |
| Net increase (decrease) in net assets resulting from operations | | 22,843,845 | | 44,703,342 |
| Distributions to shareholders | | (1,710,265) | | (9,580,605) |
| | | | | |
| Share transactions - net increase (decrease) | | (28,441,506) | | 24,596,927 |
| Total increase (decrease) in net assets | | (7,307,926) | | 59,719,664 |
| | | | | |
| Net Assets | | | | |
| Beginning of period | | 383,555,270 | | 323,835,606 |
| End of period | $ | 376,247,344 | $ | 383,555,270 |
| | | | | |
| | | | | |
Financial Highlights
VIP Freedom 2025 Portfolio℠ Initial Class |
| |
| | Six months ended (Unaudited) June 30, 2024 | | Years ended December 31, 2023 | | 2022 | | 2021 | | 2020 | | 2019 |
Selected Per-Share Data | | | | | | | | | | | | |
| Net asset value, beginning of period | $ | 15.17 | $ | 13.73 | $ | 17.82 | $ | 16.84 | $ | 15.34 | $ | 13.21 |
| Income from Investment Operations | | | | | | | | | | | | |
Net investment income (loss) A,B | | .04 | | .37 | | .32 | | .32 | | .20 | | .30 |
| Net realized and unrealized gain (loss) | | .92 | | 1.49 | | (3.10) | | 1.47 | | 2.16 | | 2.53 |
| Total from investment operations | | .96 | | 1.86 | | (2.78) | | 1.79 | | 2.36 | | 2.83 |
| Distributions from net investment income | | (.07) | | (.42) | | (.31) | | (.19) | | (.19) | | (.30) |
| Distributions from net realized gain | | - | | - | | (1.00) | | (.62) | | (.67) | | (.41) |
| Total distributions | | (.07) | | (.42) | | (1.31) | | (.81) | | (.86) | | (.70) C |
| Net asset value, end of period | $ | 16.06 | $ | 15.17 | $ | 13.73 | $ | 17.82 | $ | 16.84 | $ | 15.34 |
Total Return D,E,F | | | | 13.62% | | (16.43)% | | 10.83% | | 15.95% | | 21.86% |
Ratios to Average Net Assets B,G,H | | | | | | | | | | | | |
Expenses before reductions I | | -% J | | -% | | -% | | -% | | -% | | -% |
Expenses net of fee waivers, if any I | | | | -% | | -% | | -% | | -% | | -% |
Expenses net of all reductions I | | -% J | | -% | | -% | | -% | | -% | | -% |
| Net investment income (loss) | | .45% J | | 2.53% | | 2.19% | | 1.82% | | 1.33% | | 2.04% |
| Supplemental Data | | | | | | | | | | | | |
| Net assets, end of period (000 omitted) | $ | 93,381 | $ | 92,164 | $ | 45,943 | $ | 59,715 | $ | 55,624 | $ | 47,253 |
Portfolio turnover rate K | | | | 34% | | 73% | | 32% | | 61% | | 51% |
ACalculated based on average shares outstanding during the period.
BNet investment income (loss) is affected by the timing of the declaration of dividends by any underlying mutual funds or exchange-traded funds (ETFs). Net investment income (loss) of any mutual funds or ETFs is not included in the Fund's net investment income (loss) ratio.
CTotal distributions per share do not sum due to rounding.
DTotal returns for periods of less than one year are not annualized.
ETotal returns do not reflect charges attributable to your insurance company's separate account. Inclusion of these charges would reduce the total returns shown.
FTotal returns would have been lower if certain expenses had not been reduced during the applicable periods shown.
GFees and expenses of any underlying mutual funds or exchange-traded funds (ETFs) are not included in the Fund's expense ratio. The Fund indirectly bears its proportionate share of these expenses.
HExpense ratios reflect operating expenses of the class. Expenses before reductions do not reflect amounts reimbursed, waived, or reduced through arrangements with the investment adviser, brokerage services, or other offset arrangements, if applicable, and do not represent the amount paid by the class during periods when reimbursements, waivers or reductions occur.
IAmount represents less than .005%.
JAnnualized.
KAmount does not include the portfolio activity of any underlying mutual funds or exchange-traded funds (ETFs).
VIP Freedom 2025 Portfolio℠ Service Class |
| |
| | Six months ended (Unaudited) June 30, 2024 | | Years ended December 31, 2023 | | 2022 | | 2021 | | 2020 | | 2019 |
Selected Per-Share Data | | | | | | | | | | | | |
| Net asset value, beginning of period | $ | 15.11 | $ | 13.68 | $ | 17.76 | $ | 16.79 | $ | 15.30 | $ | 13.18 |
| Income from Investment Operations | | | | | | | | | | | | |
Net investment income (loss) A,B | | .03 | | .35 | | .30 | | .30 | | .18 | | .28 |
| Net realized and unrealized gain (loss) | | .93 | | 1.48 | | (3.08) | | 1.46 | | 2.15 | | 2.53 |
| Total from investment operations | | .96 | | 1.83 | | (2.78) | | 1.76 | | 2.33 | | 2.81 |
| Distributions from net investment income | | (.07) | | (.40) | | (.29) | | (.17) | | (.18) | | (.28) |
| Distributions from net realized gain | | - | | - | | (1.00) | | (.62) | | (.67) | | (.41) |
| Total distributions | | (.07) | | (.40) | | (1.30) C | | (.79) | | (.84) C | | (.69) |
| Net asset value, end of period | $ | 16.00 | $ | 15.11 | $ | 13.68 | $ | 17.76 | $ | 16.79 | $ | 15.30 |
Total Return D,E,F | | | | 13.48% | | (16.51)% | | 10.71% | | 15.83% | | 21.70% |
Ratios to Average Net Assets B,G,H | | | | | | | | | | | | |
| Expenses before reductions | | .10% I | | .10% | | .10% | | .10% | | .10% | | .10% |
| Expenses net of fee waivers, if any | | | | .10% | | .10% | | .10% | | .10% | | .10% |
| Expenses net of all reductions | | .10% I | | .10% | | .10% | | .10% | | .10% | | .10% |
| Net investment income (loss) | | .35% I | | 2.43% | | 2.09% | | 1.72% | | 1.23% | | 1.94% |
| Supplemental Data | | | | | | | | | | | | |
| Net assets, end of period (000 omitted) | $ | 171,546 | $ | 183,294 | $ | 174,000 | $ | 199,248 | $ | 147,904 | $ | 96,430 |
Portfolio turnover rate J | | | | 34% | | 73% | | 32% | | 61% | | 51% |
ACalculated based on average shares outstanding during the period.
BNet investment income (loss) is affected by the timing of the declaration of dividends by any underlying mutual funds or exchange-traded funds (ETFs). Net investment income (loss) of any mutual funds or ETFs is not included in the Fund's net investment income (loss) ratio.
CTotal distributions per share do not sum due to rounding.
DTotal returns for periods of less than one year are not annualized.
ETotal returns do not reflect charges attributable to your insurance company's separate account. Inclusion of these charges would reduce the total returns shown.
FTotal returns would have been lower if certain expenses had not been reduced during the applicable periods shown.
GFees and expenses of any underlying mutual funds or exchange-traded funds (ETFs) are not included in the Fund's expense ratio. The Fund indirectly bears its proportionate share of these expenses.
HExpense ratios reflect operating expenses of the class. Expenses before reductions do not reflect amounts reimbursed, waived, or reduced through arrangements with the investment adviser, brokerage services, or other offset arrangements, if applicable, and do not represent the amount paid by the class during periods when reimbursements, waivers or reductions occur.
IAnnualized.
JAmount does not include the portfolio activity of any underlying mutual funds or exchange-traded funds (ETFs).
VIP Freedom 2025 Portfolio℠ Service Class 2 |
| |
| | Six months ended (Unaudited) June 30, 2024 | | Years ended December 31, 2023 | | 2022 | | 2021 | | 2020 | | 2019 |
Selected Per-Share Data | | | | | | | | | | | | |
| Net asset value, beginning of period | $ | 15.01 | $ | 13.59 | $ | 17.65 | $ | 16.69 | $ | 15.21 | $ | 13.11 |
| Income from Investment Operations | | | | | | | | | | | | |
Net investment income (loss) A,B | | .02 | | .33 | | .28 | | .27 | | .16 | | .26 |
| Net realized and unrealized gain (loss) | | .92 | | 1.47 | | (3.07) | | 1.46 | | 2.14 | | 2.51 |
| Total from investment operations | | .94 | | 1.80 | | (2.79) | | 1.73 | | 2.30 | | 2.77 |
| Distributions from net investment income | | (.07) | | (.38) | | (.27) | | (.15) | | (.15) | | (.26) |
| Distributions from net realized gain | | - | | - | | (1.00) | | (.62) | | (.67) | | (.41) |
| Total distributions | | (.07) | | (.38) | | (1.27) | | (.77) | | (.82) | | (.67) |
| Net asset value, end of period | $ | 15.88 | $ | 15.01 | $ | 13.59 | $ | 17.65 | $ | 16.69 | $ | 15.21 |
Total Return C,D,E | | | | 13.32% | | (16.64)% | | 10.55% | | 15.68% | | 21.51% |
Ratios to Average Net Assets B,F,G | | | | | | | | | | | | |
| Expenses before reductions | | .25% H | | .25% | | .25% | | .25% | | .25% | | .25% |
| Expenses net of fee waivers, if any | | | | .25% | | .25% | | .25% | | .25% | | .25% |
| Expenses net of all reductions | | .25% H | | .25% | | .25% | | .25% | | .25% | | .25% |
| Net investment income (loss) | | .20% H | | 2.28% | | 1.94% | | 1.57% | | 1.08% | | 1.79% |
| Supplemental Data | | | | | | | | | | | | |
| Net assets, end of period (000 omitted) | $ | 111,320 | $ | 108,097 | $ | 103,892 | $ | 130,746 | $ | 112,114 | $ | 97,802 |
Portfolio turnover rate I | | | | 34% | | 73% | | 32% | | 61% | | 51% |
ACalculated based on average shares outstanding during the period.
BNet investment income (loss) is affected by the timing of the declaration of dividends by any underlying mutual funds or exchange-traded funds (ETFs). Net investment income (loss) of any mutual funds or ETFs is not included in the Fund's net investment income (loss) ratio.
CTotal returns for periods of less than one year are not annualized.
DTotal returns do not reflect charges attributable to your insurance company's separate account. Inclusion of these charges would reduce the total returns shown.
ETotal returns would have been lower if certain expenses had not been reduced during the applicable periods shown.
FFees and expenses of any underlying mutual funds or exchange-traded funds (ETFs) are not included in the Fund's expense ratio. The Fund indirectly bears its proportionate share of these expenses.
GExpense ratios reflect operating expenses of the class. Expenses before reductions do not reflect amounts reimbursed, waived, or reduced through arrangements with the investment adviser, brokerage services, or other offset arrangements, if applicable, and do not represent the amount paid by the class during periods when reimbursements, waivers or reductions occur.
HAnnualized.
IAmount does not include the portfolio activity of any underlying mutual funds or exchange-traded funds (ETFs).
VIP Freedom 2030 Portfolio℠
Schedule of Investments June 30, 2024 (Unaudited)
Showing Percentage of Net Assets
| Domestic Equity Funds - 32.4% |
| | | Shares | Value ($) |
| VIP Contrafund Portfolio Initial Class (a) | | 691,473 | 41,896,378 |
| VIP Equity-Income Portfolio Initial Class (a) | | 1,264,904 | 34,177,714 |
| VIP Growth & Income Portfolio Initial Class (a) | | 1,532,331 | 47,027,249 |
| VIP Growth Portfolio Initial Class (a) | | 614,787 | 69,667,672 |
| VIP Mid Cap Portfolio Initial Class (a) | | 274,451 | 10,785,908 |
| VIP Value Portfolio Initial Class (a) | | 1,231,371 | 23,937,850 |
| VIP Value Strategies Portfolio Initial Class (a) | | 709,506 | 11,905,510 |
| TOTAL DOMESTIC EQUITY FUNDS (Cost $131,228,505) | | | 239,398,281 |
| | | | |
| International Equity Funds - 29.9% |
| | | Shares | Value ($) |
| VIP Emerging Markets Portfolio Initial Class (a) | | 6,659,743 | 77,319,611 |
| VIP Overseas Portfolio Initial Class (a) | | 5,193,204 | 144,163,355 |
| TOTAL INTERNATIONAL EQUITY FUNDS (Cost $170,065,671) | | | 221,482,966 |
| | | | |
| Bond Funds - 37.7% |
| | | Shares | Value ($) |
| Fidelity Inflation-Protected Bond Index Fund (a) | | 7,034,639 | 64,085,563 |
| Fidelity International Bond Index Fund (a) | | 1,941,360 | 17,744,028 |
| Fidelity Long-Term Treasury Bond Index Fund (a) | | 5,145,967 | 48,835,225 |
| VIP High Income Portfolio Initial Class (a) | | 2,584,401 | 12,250,061 |
| VIP Investment Grade Bond II Portfolio - Initial Class (a) | | 14,456,778 | 136,182,851 |
| TOTAL BOND FUNDS (Cost $297,004,861) | | | 279,097,728 |
| | | | |
| TOTAL INVESTMENT IN SECURITIES - 100.0% (Cost $598,299,037) | 739,978,975 |
NET OTHER ASSETS (LIABILITIES) - 0.0% | (73,105) |
| NET ASSETS - 100.0% | 739,905,870 |
| | |
Legend
Affiliated Underlying Funds
Fiscal year to date information regarding the Fund's investments in affiliated Underlying Funds is presented below. Exchanges between classes of the same affiliated Underlying Funds may occur. If an Underlying Funds changes its name, the name presented below is the name in effect at period end.
| Affiliate | Value, beginning of period ($) | Purchases ($) | Sales Proceeds ($) | Dividend Income ($) | Realized Gain (loss) ($) | Change in Unrealized appreciation (depreciation) ($) | Value, end of period ($) |
| Fidelity Inflation-Protected Bond Index Fund | 58,286,708 | 10,386,916 | 5,110,342 | 101,236 | (187,013) | 709,294 | 64,085,563 |
| Fidelity International Bond Index Fund | 20,292,078 | 2,767,547 | 5,205,569 | 188,938 | (141,371) | 31,343 | 17,744,028 |
| Fidelity Long-Term Treasury Bond Index Fund | 41,790,891 | 20,182,669 | 10,466,423 | 820,270 | (1,376,583) | (1,295,329) | 48,835,225 |
| VIP Contrafund Portfolio Initial Class | 37,570,860 | 3,297,053 | 7,858,531 | 147,325 | 962,054 | 7,924,942 | 41,896,378 |
| VIP Emerging Markets Portfolio Initial Class | 67,536,911 | 12,129,367 | 8,820,113 | 57,200 | 320,120 | 6,153,326 | 77,319,611 |
| VIP Equity-Income Portfolio Initial Class | 30,465,655 | 4,860,284 | 3,912,956 | 167,309 | 90,625 | 2,674,106 | 34,177,714 |
| VIP Government Money Market Portfolio Initial Class 5.1% | - | 1,441,040 | 1,441,040 | 6,231 | - | - | - |
| VIP Growth & Income Portfolio Initial Class | 41,879,004 | 5,242,019 | 5,801,858 | 275,120 | 130,960 | 5,577,124 | 47,027,249 |
| VIP Growth Portfolio Initial Class | 62,221,215 | 5,733,607 | 11,445,075 | 903,736 | 1,080,479 | 12,077,446 | 69,667,672 |
| VIP High Income Portfolio Initial Class | 11,622,459 | 1,252,707 | 976,636 | 4,890 | (9,493) | 361,024 | 12,250,061 |
| VIP Investment Grade Bond II Portfolio - Initial Class | 156,120,087 | 17,623,489 | 36,762,751 | 91,362 | (1,468,274) | 670,300 | 136,182,851 |
| VIP Mid Cap Portfolio Initial Class | 9,536,049 | 1,805,643 | 1,349,511 | 174,728 | 76,147 | 717,580 | 10,785,908 |
| VIP Overseas Portfolio Initial Class | 133,904,853 | 16,463,816 | 15,985,567 | 500,587 | 643,326 | 9,136,927 | 144,163,355 |
| VIP Value Portfolio Initial Class | 21,249,584 | 4,793,503 | 2,553,191 | 450,698 | 50,890 | 397,064 | 23,937,850 |
| VIP Value Strategies Portfolio Initial Class | 10,515,711 | 2,594,439 | 1,400,348 | 145,786 | 36,610 | 159,098 | 11,905,510 |
| | 702,992,065 | 110,574,099 | 119,089,911 | 4,035,416 | 208,477 | 45,294,245 | 739,978,975 |
Amounts in the dividend income column in the above table include any capital gain distributions from underlying funds, which are presented in the corresponding line item in the Statement of Operations, if applicable.
Amounts included in the purchases and sales proceeds columns may include in-kind transactions, if applicable.
Investment Valuation
The following is a summary of the inputs used, as of June 30, 2024, involving the Fund's assets and liabilities carried at fair value. The inputs or methodology used for valuing securities may not be an indication of the risk associated with investing in those securities. For more information on valuation inputs, and their aggregation into the levels used below, please refer to the Investment Valuation section in the accompanying Notes to Financial Statements.
| Valuation Inputs at Reporting Date: |
| Description | Total ($) | Level 1 ($) | Level 2 ($) | Level 3 ($) |
Investments in Securities: | | | | |
|
| Domestic Equity Funds | 239,398,281 | 239,398,281 | - | - |
|
| International Equity Funds | 221,482,965 | 221,482,965 | - | - |
|
| Bond Funds | 279,097,729 | 279,097,729 | - | - |
| Total Investments in Securities: | 739,978,975 | 739,978,975 | - | - |
VIP Freedom 2030 Portfolio℠
Financial Statements (Unaudited)
| Statement of Assets and Liabilities |
| | | | June 30, 2024 (Unaudited) |
| | | | | |
| Assets | | | | |
| Investment in securities, at value - See accompanying schedule: | | | | |
Affiliated issuers (cost $598,299,037) | $ | 739,978,975 | | |
| | | | | |
| | | | | |
| Total Investment in Securities (cost $598,299,037) | | | $ | 739,978,975 |
| Cash | | | | 2,826 |
| Receivable for investments sold | | | | 5,325,487 |
| Receivable for fund shares sold | | | | 294,814 |
Total assets | | | | 745,602,102 |
| Liabilities | | | | |
| Payable for investments purchased | $ | 5,004,991 | | |
| Payable for fund shares redeemed | | 615,449 | | |
| Distribution and service plan fees payable | | 75,792 | | |
| Total liabilities | | | | 5,696,232 |
| Net Assets | | | $ | 739,905,870 |
| Net Assets consist of: | | | | |
| Paid in capital | | | $ | 606,533,849 |
| Total accumulated earnings (loss) | | | | 133,372,021 |
| Net Assets | | | $ | 739,905,870 |
| | | | | |
| Net Asset Value and Maximum Offering Price | | | | |
| Initial Class : | | | | |
Net Asset Value, offering price and redemption price per share ($181,918,843 ÷ 11,083,007 shares) | | | $ | 16.41 |
| Service Class : | | | | |
Net Asset Value, offering price and redemption price per share ($323,140,072 ÷ 19,758,662 shares) | | | $ | 16.35 |
| Service Class 2 : | | | | |
Net Asset Value, offering price and redemption price per share ($234,846,955 ÷ 14,434,872 shares) | | | $ | 16.27 |
| Statement of Operations |
| | | | Six months ended June 30, 2024 (Unaudited) |
| Investment Income | | | | |
| Dividends: | | | | |
| Affiliated issuers | | | $ | 1,597,083 |
| Expenses | | | | |
| Distribution and service plan fees | $ | 440,470 | | |
| Independent trustees' fees and expenses | | 945 | | |
| Total expenses | | | | 441,415 |
| Net Investment income (loss) | | | | 1,155,668 |
| Realized and Unrealized Gain (Loss) | | | | |
| Net realized gain (loss) on: | | | | |
| Investment Securities: | | | | |
| Affiliated issuers | | 208,477 | | |
| Capital gain distributions from underlying funds: | | | | |
| Affiliated issuers | | 2,438,333 | | |
| Total net realized gain (loss) | | | | 2,646,810 |
| Change in net unrealized appreciation (depreciation) on: | | | | |
| Investment Securities: | | | | |
| Affiliated issuers | | 45,294,245 | | |
| Total change in net unrealized appreciation (depreciation) | | | | 45,294,245 |
| Net gain (loss) | | | | 47,941,055 |
| Net increase (decrease) in net assets resulting from operations | | | $ | 49,096,723 |
| Statement of Changes in Net Assets |
| |
| | Six months ended June 30, 2024 (Unaudited) | | Year ended December 31, 2023 |
| Increase (Decrease) in Net Assets | | | | |
| Operations | | | | |
| Net investment income (loss) | $ | 1,155,668 | $ | 13,839,719 |
| Net realized gain (loss) | | 2,646,810 | | 9,900,140 |
| Change in net unrealized appreciation (depreciation) | | 45,294,245 | | 63,539,585 |
| Net increase (decrease) in net assets resulting from operations | | 49,096,723 | | 87,279,444 |
| Distributions to shareholders | | (2,274,291) | | (15,442,922) |
| | | | | |
| Share transactions - net increase (decrease) | | (9,840,107) | | 44,480,083 |
| Total increase (decrease) in net assets | | 36,982,325 | | 116,316,605 |
| | | | | |
| Net Assets | | | | |
| Beginning of period | | 702,923,545 | | 586,606,940 |
| End of period | $ | 739,905,870 | $ | 702,923,545 |
| | | | | |
| | | | | |
Financial Highlights
VIP Freedom 2030 Portfolio℠ Initial Class |
| |
| | Six months ended (Unaudited) June 30, 2024 | | Years ended December 31, 2023 | | 2022 | | 2021 | | 2020 | | 2019 |
Selected Per-Share Data | | | | | | | | | | | | |
| Net asset value, beginning of period | $ | 15.36 | $ | 13.72 | $ | 17.93 | $ | 16.83 | $ | 15.28 | $ | 12.98 |
| Income from Investment Operations | | | | | | | | | | | | |
Net investment income (loss) A,B | | .04 | | .34 | | .29 | | .31 | | .19 | | .30 |
| Net realized and unrealized gain (loss) | | 1.06 | | 1.67 | | (3.16) | | 1.72 | | 2.28 | | 2.80 |
| Total from investment operations | | 1.10 | | 2.01 | | (2.87) | | 2.03 | | 2.47 | | 3.10 |
| Distributions from net investment income | | (.05) | | (.37) | | (.29) | | (.19) | | (.19) | | (.29) |
| Distributions from net realized gain | | - | | - | | (1.05) | | (.74) | | (.74) | | (.51) |
| Total distributions | | (.05) | | (.37) | | (1.34) | | (.93) | | (.92) C | | (.80) |
| Net asset value, end of period | $ | 16.41 | $ | 15.36 | $ | 13.72 | $ | 17.93 | $ | 16.83 | $ | 15.28 |
Total Return D,E,F | | | | 14.70% | | (16.87)% | | 12.37% | | 16.89% | | 24.43% |
Ratios to Average Net Assets B,G,H | | | | | | | | | | | | |
Expenses before reductions I | | -% J | | -% | | -% | | -% | | -% | | -% |
Expenses net of fee waivers, if any I | | | | -% | | -% | | -% | | -% | | -% |
Expenses net of all reductions I | | -% J | | -% | | -% | | -% | | -% | | -% |
| Net investment income (loss) | | .45% J | | 2.33% | | 1.96% | | 1.77% | | 1.31% | | 2.09% |
| Supplemental Data | | | | | | | | | | | | |
| Net assets, end of period (000 omitted) | $ | 181,919 | $ | 162,784 | $ | 116,986 | $ | 138,193 | $ | 113,727 | $ | 93,564 |
Portfolio turnover rate K | | | | 26% | | 76% | | 28% | | 46% | | 30% |
ACalculated based on average shares outstanding during the period.
BNet investment income (loss) is affected by the timing of the declaration of dividends by any underlying mutual funds or exchange-traded funds (ETFs). Net investment income (loss) of any mutual funds or ETFs is not included in the Fund's net investment income (loss) ratio.
CTotal distributions per share do not sum due to rounding.
DTotal returns for periods of less than one year are not annualized.
ETotal returns do not reflect charges attributable to your insurance company's separate account. Inclusion of these charges would reduce the total returns shown.
FTotal returns would have been lower if certain expenses had not been reduced during the applicable periods shown.
GFees and expenses of any underlying mutual funds or exchange-traded funds (ETFs) are not included in the Fund's expense ratio. The Fund indirectly bears its proportionate share of these expenses.
HExpense ratios reflect operating expenses of the class. Expenses before reductions do not reflect amounts reimbursed, waived, or reduced through arrangements with the investment adviser, brokerage services, or other offset arrangements, if applicable, and do not represent the amount paid by the class during periods when reimbursements, waivers or reductions occur.
IAmount represents less than .005%.
JAnnualized.
KAmount does not include the portfolio activity of any underlying mutual funds or exchange-traded funds (ETFs).
VIP Freedom 2030 Portfolio℠ Service Class |
| |
| | Six months ended (Unaudited) June 30, 2024 | | Years ended December 31, 2023 | | 2022 | | 2021 | | 2020 | | 2019 |
Selected Per-Share Data | | | | | | | | | | | | |
| Net asset value, beginning of period | $ | 15.31 | $ | 13.68 | $ | 17.88 | $ | 16.79 | $ | 15.25 | $ | 12.95 |
| Income from Investment Operations | | | | | | | | | | | | |
Net investment income (loss) A,B | | .03 | | .32 | | .27 | | .29 | | .18 | | .29 |
| Net realized and unrealized gain (loss) | | 1.06 | | 1.66 | | (3.14) | | 1.72 | | 2.27 | | 2.79 |
| Total from investment operations | | 1.09 | | 1.98 | | (2.87) | | 2.01 | | 2.45 | | 3.08 |
| Distributions from net investment income | | (.05) | | (.35) | | (.28) | | (.18) | | (.17) | | (.28) |
| Distributions from net realized gain | | - | | - | | (1.05) | | (.74) | | (.74) | | (.51) |
| Total distributions | | (.05) | | (.35) | | (1.33) | | (.92) | | (.91) | | (.78) C |
| Net asset value, end of period | $ | 16.35 | $ | 15.31 | $ | 13.68 | $ | 17.88 | $ | 16.79 | $ | 15.25 |
Total Return D,E,F | | | | 14.56% | | (16.94)% | | 12.24% | | 16.76% | | 24.37% |
Ratios to Average Net Assets B,G,H | | | | | | | | | | | | |
| Expenses before reductions | | .10% I | | .10% | | .10% | | .10% | | .10% | | .10% |
| Expenses net of fee waivers, if any | | | | .10% | | .10% | | .10% | | .10% | | .10% |
| Expenses net of all reductions | | .10% I | | .10% | | .10% | | .10% | | .10% | | .10% |
| Net investment income (loss) | | .35% I | | 2.23% | | 1.86% | | 1.67% | | 1.21% | | 1.99% |
| Supplemental Data | | | | | | | | | | | | |
| Net assets, end of period (000 omitted) | $ | 323,140 | $ | 319,543 | $ | 271,187 | $ | 294,595 | $ | 225,149 | $ | 168,105 |
Portfolio turnover rate J | | | | 26% | | 76% | | 28% | | 46% | | 30% |
ACalculated based on average shares outstanding during the period.
BNet investment income (loss) is affected by the timing of the declaration of dividends by any underlying mutual funds or exchange-traded funds (ETFs). Net investment income (loss) of any mutual funds or ETFs is not included in the Fund's net investment income (loss) ratio.
CTotal distributions per share do not sum due to rounding.
DTotal returns for periods of less than one year are not annualized.
ETotal returns do not reflect charges attributable to your insurance company's separate account. Inclusion of these charges would reduce the total returns shown.
FTotal returns would have been lower if certain expenses had not been reduced during the applicable periods shown.
GFees and expenses of any underlying mutual funds or exchange-traded funds (ETFs) are not included in the Fund's expense ratio. The Fund indirectly bears its proportionate share of these expenses.
HExpense ratios reflect operating expenses of the class. Expenses before reductions do not reflect amounts reimbursed, waived, or reduced through arrangements with the investment adviser, brokerage services, or other offset arrangements, if applicable, and do not represent the amount paid by the class during periods when reimbursements, waivers or reductions occur.
IAnnualized.
JAmount does not include the portfolio activity of any underlying mutual funds or exchange-traded funds (ETFs).
VIP Freedom 2030 Portfolio℠ Service Class 2 |
| |
| | Six months ended (Unaudited) June 30, 2024 | | Years ended December 31, 2023 | | 2022 | | 2021 | | 2020 | | 2019 |
Selected Per-Share Data | | | | | | | | | | | | |
| Net asset value, beginning of period | $ | 15.25 | $ | 13.62 | $ | 17.81 | $ | 16.73 | $ | 15.19 | $ | 12.91 |
| Income from Investment Operations | | | | | | | | | | | | |
Net investment income (loss) A,B | | .02 | | .30 | | .25 | | .27 | | .16 | | .26 |
| Net realized and unrealized gain (loss) | | 1.05 | | 1.66 | | (3.14) | | 1.70 | | 2.26 | | 2.78 |
| Total from investment operations | | 1.07 | | 1.96 | | (2.89) | | 1.97 | | 2.42 | | 3.04 |
| Distributions from net investment income | | (.05) | | (.33) | | (.26) | | (.15) | | (.15) | | (.26) |
| Distributions from net realized gain | | - | | - | | (1.05) | | (.74) | | (.74) | | (.51) |
| Total distributions | | (.05) | | (.33) | | (1.30) C | | (.89) | | (.88) C | | (.76) C |
| Net asset value, end of period | $ | 16.27 | $ | 15.25 | $ | 13.62 | $ | 17.81 | $ | 16.73 | $ | 15.19 |
Total Return D,E,F | | | | 14.46% | | (17.09)% | | 12.07% | | 16.64% | | 24.11% |
Ratios to Average Net Assets B,G,H | | | | | | | | | | | | |
| Expenses before reductions | | .25% I | | .25% | | .25% | | .25% | | .25% | | .25% |
| Expenses net of fee waivers, if any | | | | .25% | | .25% | | .25% | | .25% | | .25% |
| Expenses net of all reductions | | .25% I | | .25% | | .25% | | .25% | | .25% | | .25% |
| Net investment income (loss) | | .20% I | | 2.08% | | 1.71% | | 1.52% | | 1.06% | | 1.84% |
| Supplemental Data | | | | | | | | | | | | |
| Net assets, end of period (000 omitted) | $ | 234,847 | $ | 220,596 | $ | 198,433 | $ | 243,043 | $ | 193,997 | $ | 173,271 |
Portfolio turnover rate J | | | | 26% | | 76% | | 28% | | 46% | | 30% |
ACalculated based on average shares outstanding during the period.
BNet investment income (loss) is affected by the timing of the declaration of dividends by any underlying mutual funds or exchange-traded funds (ETFs). Net investment income (loss) of any mutual funds or ETFs is not included in the Fund's net investment income (loss) ratio.
CTotal distributions per share do not sum due to rounding.
DTotal returns for periods of less than one year are not annualized.
ETotal returns do not reflect charges attributable to your insurance company's separate account. Inclusion of these charges would reduce the total returns shown.
FTotal returns would have been lower if certain expenses had not been reduced during the applicable periods shown.
GFees and expenses of any underlying mutual funds or exchange-traded funds (ETFs) are not included in the Fund's expense ratio. The Fund indirectly bears its proportionate share of these expenses.
HExpense ratios reflect operating expenses of the class. Expenses before reductions do not reflect amounts reimbursed, waived, or reduced through arrangements with the investment adviser, brokerage services, or other offset arrangements, if applicable, and do not represent the amount paid by the class during periods when reimbursements, waivers or reductions occur.
IAnnualized.
JAmount does not include the portfolio activity of any underlying mutual funds or exchange-traded funds (ETFs).
VIP Freedom 2035 Portfolio℠
Schedule of Investments June 30, 2024 (Unaudited)
Showing Percentage of Net Assets
| Domestic Equity Funds - 38.7% |
| | | Shares | Value ($) |
| VIP Contrafund Portfolio Initial Class (a) | | 368,582 | 22,332,359 |
| VIP Equity-Income Portfolio Initial Class (a) | | 674,241 | 18,217,996 |
| VIP Growth & Income Portfolio Initial Class (a) | | 816,794 | 25,067,398 |
| VIP Growth Portfolio Initial Class (a) | | 327,728 | 37,138,111 |
| VIP Mid Cap Portfolio Initial Class (a) | | 146,293 | 5,749,319 |
| VIP Value Portfolio Initial Class (a) | | 656,360 | 12,759,631 |
| VIP Value Strategies Portfolio Initial Class (a) | | 378,203 | 6,346,251 |
| TOTAL DOMESTIC EQUITY FUNDS (Cost $88,634,780) | | | 127,611,065 |
| | | | |
| International Equity Funds - 34.2% |
| | | Shares | Value ($) |
| VIP Emerging Markets Portfolio Initial Class (a) | | 3,315,515 | 38,493,134 |
| VIP Overseas Portfolio Initial Class (a) | | 2,671,898 | 74,171,879 |
| TOTAL INTERNATIONAL EQUITY FUNDS (Cost $96,168,339) | | | 112,665,013 |
| | | | |
| Bond Funds - 27.1% |
| | | Shares | Value ($) |
| Fidelity Inflation-Protected Bond Index Fund (a) | | 1,545,132 | 14,076,157 |
| Fidelity International Bond Index Fund (a) | | 680,231 | 6,217,312 |
| Fidelity Long-Term Treasury Bond Index Fund (a) | | 2,436,630 | 23,123,621 |
| VIP High Income Portfolio Initial Class (a) | | 1,151,196 | 5,456,667 |
| VIP Investment Grade Bond II Portfolio - Initial Class (a) | | 4,302,697 | 40,531,406 |
| TOTAL BOND FUNDS (Cost $94,144,417) | | | 89,405,163 |
| | | | |
| TOTAL INVESTMENT IN SECURITIES - 100.0% (Cost $278,947,536) | 329,681,241 |
NET OTHER ASSETS (LIABILITIES) - 0.0% | (40,080) |
| NET ASSETS - 100.0% | 329,641,161 |
| | |
Legend
Affiliated Underlying Funds
Fiscal year to date information regarding the Fund's investments in affiliated Underlying Funds is presented below. Exchanges between classes of the same affiliated Underlying Funds may occur. If an Underlying Funds changes its name, the name presented below is the name in effect at period end.
| Affiliate | Value, beginning of period ($) | Purchases ($) | Sales Proceeds ($) | Dividend Income ($) | Realized Gain (loss) ($) | Change in Unrealized appreciation (depreciation) ($) | Value, end of period ($) |
| Fidelity Inflation-Protected Bond Index Fund | 11,336,840 | 3,975,740 | 1,357,743 | 20,643 | (78,712) | 200,032 | 14,076,157 |
| Fidelity International Bond Index Fund | 7,204,463 | 1,311,790 | 2,261,973 | 66,060 | (92,766) | 55,798 | 6,217,312 |
| Fidelity Long-Term Treasury Bond Index Fund | 19,284,316 | 9,964,544 | 4,906,487 | 380,939 | (368,609) | (850,143) | 23,123,621 |
| VIP Contrafund Portfolio Initial Class | 19,888,473 | 2,434,613 | 4,669,249 | 76,823 | 298,964 | 4,379,558 | 22,332,359 |
| VIP Emerging Markets Portfolio Initial Class | 33,040,517 | 7,177,118 | 4,909,646 | 27,805 | 107,770 | 3,077,375 | 38,493,134 |
| VIP Equity-Income Portfolio Initial Class | 16,127,207 | 3,091,471 | 2,447,865 | 87,369 | 47,979 | 1,399,204 | 18,217,996 |
| VIP Government Money Market Portfolio Initial Class 5.1% | - | 637,673 | 637,673 | 2,754 | - | - | - |
| VIP Growth & Income Portfolio Initial Class | 22,168,948 | 3,482,668 | 3,578,969 | 143,199 | 49,315 | 2,945,436 | 25,067,398 |
| VIP Growth Portfolio Initial Class | 32,937,468 | 4,241,452 | 6,968,657 | 472,854 | 429,042 | 6,498,806 | 37,138,111 |
| VIP High Income Portfolio Initial Class | 5,010,573 | 825,772 | 533,290 | 2,096 | (13,757) | 167,369 | 5,456,667 |
| VIP Investment Grade Bond II Portfolio - Initial Class | 46,396,638 | 9,381,644 | 15,010,005 | 26,579 | (632,768) | 395,897 | 40,531,406 |
| VIP Mid Cap Portfolio Initial Class | 5,048,090 | 1,066,975 | 778,689 | 91,402 | 11,885 | 401,058 | 5,749,319 |
| VIP Overseas Portfolio Initial Class | 67,809,730 | 10,278,545 | 8,878,949 | 251,699 | 68,050 | 4,894,503 | 74,171,879 |
| VIP Value Portfolio Initial Class | 11,248,764 | 2,782,549 | 1,495,113 | 235,321 | 23,321 | 200,110 | 12,759,631 |
| VIP Value Strategies Portfolio Initial Class | 5,566,689 | 1,494,235 | 809,944 | 76,264 | 18,385 | 76,886 | 6,346,251 |
| | 303,068,716 | 62,146,789 | 59,244,252 | 1,961,807 | (131,901) | 23,841,889 | 329,681,241 |
Amounts in the dividend income column in the above table include any capital gain distributions from underlying funds, which are presented in the corresponding line item in the Statement of Operations, if applicable.
Amounts included in the purchases and sales proceeds columns may include in-kind transactions, if applicable.
Investment Valuation
The following is a summary of the inputs used, as of June 30, 2024, involving the Fund's assets and liabilities carried at fair value. The inputs or methodology used for valuing securities may not be an indication of the risk associated with investing in those securities. For more information on valuation inputs, and their aggregation into the levels used below, please refer to the Investment Valuation section in the accompanying Notes to Financial Statements.
| Valuation Inputs at Reporting Date: |
| Description | Total ($) | Level 1 ($) | Level 2 ($) | Level 3 ($) |
Investments in Securities: | | | | |
|
| Domestic Equity Funds | 127,611,065 | 127,611,065 | - | - |
|
| International Equity Funds | 112,665,014 | 112,665,014 | - | - |
|
| Bond Funds | 89,405,162 | 89,405,162 | - | - |
| Total Investments in Securities: | 329,681,241 | 329,681,241 | - | - |
VIP Freedom 2035 Portfolio℠
Financial Statements (Unaudited)
| Statement of Assets and Liabilities |
| | | | June 30, 2024 (Unaudited) |
| | | | | |
| Assets | | | | |
| Investment in securities, at value - See accompanying schedule: | | | | |
Affiliated issuers (cost $278,947,536) | $ | 329,681,241 | | |
| | | | | |
| | | | | |
| Total Investment in Securities (cost $278,947,536) | | | $ | 329,681,241 |
| Cash | | | | 10 |
| Receivable for investments sold | | | | 2,577,955 |
| Receivable for fund shares sold | | | | 430,051 |
Total assets | | | | 332,689,257 |
| Liabilities | | | | |
| Payable for investments purchased | $ | 2,892,546 | | |
| Payable for fund shares redeemed | | 115,508 | | |
| Distribution and service plan fees payable | | 40,042 | | |
| Total liabilities | | | | 3,048,096 |
| Net Assets | | | $ | 329,641,161 |
| Net Assets consist of: | | | | |
| Paid in capital | | | $ | 282,085,460 |
| Total accumulated earnings (loss) | | | | 47,555,701 |
| Net Assets | | | $ | 329,641,161 |
| | | | | |
| Net Asset Value and Maximum Offering Price | | | | |
| Initial Class : | | | | |
Net Asset Value, offering price and redemption price per share ($47,263,560 ÷ 1,696,472 shares) | | | $ | 27.86 |
| Service Class : | | | | |
Net Asset Value, offering price and redemption price per share ($149,722,963 ÷ 5,394,862 shares) | | | $ | 27.75 |
| Service Class 2 : | | | | |
Net Asset Value, offering price and redemption price per share ($132,654,638 ÷ 4,816,715 shares) | | | $ | 27.54 |
| Statement of Operations |
| | | | Six months ended June 30, 2024 (Unaudited) |
| Investment Income | | | | |
| Dividends: | | | | |
| Affiliated issuers | | | $ | 691,578 |
| Expenses | | | | |
| Distribution and service plan fees | $ | 230,550 | | |
| Independent trustees' fees and expenses | | 409 | | |
| Total expenses | | | | 230,959 |
| Net Investment income (loss) | | | | 460,619 |
| Realized and Unrealized Gain (Loss) | | | | |
| Net realized gain (loss) on: | | | | |
| Investment Securities: | | | | |
| Affiliated issuers | | (131,901) | | |
| Capital gain distributions from underlying funds: | | | | |
| Affiliated issuers | | 1,270,229 | | |
| Total net realized gain (loss) | | | | 1,138,328 |
| Change in net unrealized appreciation (depreciation) on: | | | | |
| Investment Securities: | | | | |
| Affiliated issuers | | 23,841,889 | | |
| Total change in net unrealized appreciation (depreciation) | | | | 23,841,889 |
| Net gain (loss) | | | | 24,980,217 |
| Net increase (decrease) in net assets resulting from operations | | | $ | 25,440,836 |
| Statement of Changes in Net Assets |
| |
| | Six months ended June 30, 2024 (Unaudited) | | Year ended December 31, 2023 |
| Increase (Decrease) in Net Assets | | | | |
| Operations | | | | |
| Net investment income (loss) | $ | 460,619 | $ | 4,927,105 |
| Net realized gain (loss) | | 1,138,328 | | 3,653,251 |
| Change in net unrealized appreciation (depreciation) | | 23,841,889 | | 31,369,275 |
| Net increase (decrease) in net assets resulting from operations | | 25,440,836 | | 39,949,631 |
| Distributions to shareholders | | (3,969,390) | | (5,500,228) |
| | | | | |
| Share transactions - net increase (decrease) | | 5,137,279 | | 52,953,517 |
| Total increase (decrease) in net assets | | 26,608,725 | | 87,402,920 |
| | | | | |
| Net Assets | | | | |
| Beginning of period | | 303,032,436 | | 215,629,516 |
| End of period | $ | 329,641,161 | $ | 303,032,436 |
| | | | | |
| | | | | |
Financial Highlights
VIP Freedom 2035 Portfolio℠ Initial Class |
| |
| | Six months ended (Unaudited) June 30, 2024 | | Years ended December 31, 2023 | | 2022 | | 2021 | | 2020 | | 2019 |
Selected Per-Share Data | | | | | | | | | | | | |
| Net asset value, beginning of period | $ | 25.99 | $ | 22.71 | $ | 30.05 | $ | 27.34 | $ | 24.35 | $ | 20.07 |
| Income from Investment Operations | | | | | | | | | | | | |
Net investment income (loss) A,B | | .06 | | .51 | | .40 | | .45 | | .28 | | .48 |
| Net realized and unrealized gain (loss) | | 2.16 | | 3.30 | | (5.43) | | 3.69 | | 4.01 | | 4.92 |
| Total from investment operations | | 2.22 | | 3.81 | | (5.03) | | 4.14 | | 4.29 | | 5.40 |
| Distributions from net investment income | | (.04) | | (.48) | | (.42) | | (.30) | | (.27) | | (.41) |
| Distributions from net realized gain | | (.31) | | (.05) | | (1.89) | | (1.13) | | (1.04) | | (.71) |
| Total distributions | | (.35) | | (.53) | | (2.31) | | (1.43) | | (1.30) C | | (1.12) |
| Net asset value, end of period | $ | 27.86 | $ | 25.99 | $ | 22.71 | $ | 30.05 | $ | 27.34 | $ | 24.35 |
Total Return D,E,F | | | | 16.85% | | (17.69)% | | 15.46% | | 18.28% | | 27.49% |
Ratios to Average Net Assets B,G,H | | | | | | | | | | | | |
Expenses before reductions I | | -% J | | -% | | -% | | -% | | -% | | -% |
Expenses net of fee waivers, if any I | | | | -% | | -% | | -% | | -% | | -% |
Expenses net of all reductions I | | -% J | | -% | | -% | | -% | | -% | | -% |
| Net investment income (loss) | | .44% J | | 2.10% | | 1.68% | | 1.53% | | 1.20% | | 2.13% |
| Supplemental Data | | | | | | | | | | | | |
| Net assets, end of period (000 omitted) | $ | 47,264 | $ | 39,129 | $ | 18,619 | $ | 17,426 | $ | 17,852 | $ | 12,846 |
Portfolio turnover rate K | | | | 26% | | 49% | | 34% | | 55% | | 29% |
ACalculated based on average shares outstanding during the period.
BNet investment income (loss) is affected by the timing of the declaration of dividends by any underlying mutual funds or exchange-traded funds (ETFs). Net investment income (loss) of any mutual funds or ETFs is not included in the Fund's net investment income (loss) ratio.
CTotal distributions per share do not sum due to rounding.
DTotal returns for periods of less than one year are not annualized.
ETotal returns do not reflect charges attributable to your insurance company's separate account. Inclusion of these charges would reduce the total returns shown.
FTotal returns would have been lower if certain expenses had not been reduced during the applicable periods shown.
GFees and expenses of any underlying mutual funds or exchange-traded funds (ETFs) are not included in the Fund's expense ratio. The Fund indirectly bears its proportionate share of these expenses.
HExpense ratios reflect operating expenses of the class. Expenses before reductions do not reflect amounts reimbursed, waived, or reduced through arrangements with the investment adviser, brokerage services, or other offset arrangements, if applicable, and do not represent the amount paid by the class during periods when reimbursements, waivers or reductions occur.
IAmount represents less than .005%.
JAnnualized.
KAmount does not include the portfolio activity of any underlying mutual funds or exchange-traded funds (ETFs).
VIP Freedom 2035 Portfolio℠ Service Class |
| |
| | Six months ended (Unaudited) June 30, 2024 | | Years ended December 31, 2023 | | 2022 | | 2021 | | 2020 | | 2019 |
Selected Per-Share Data | | | | | | | | | | | | |
| Net asset value, beginning of period | $ | 25.90 | $ | 22.64 | $ | 29.96 | $ | 27.27 | $ | 24.30 | $ | 20.04 |
| Income from Investment Operations | | | | | | | | | | | | |
Net investment income (loss) A,B | | .05 | | .49 | | .38 | | .42 | | .26 | | .46 |
| Net realized and unrealized gain (loss) | | 2.15 | | 3.28 | | (5.42) | | 3.67 | | 3.99 | | 4.90 |
| Total from investment operations | | 2.20 | | 3.77 | | (5.04) | | 4.09 | | 4.25 | | 5.36 |
| Distributions from net investment income | | (.04) | | (.46) | | (.40) | | (.27) | | (.25) | | (.39) |
| Distributions from net realized gain | | (.31) | | (.05) | | (1.89) | | (1.13) | | (1.04) | | (.71) |
| Total distributions | | (.35) | | (.51) | | (2.28) C | | (1.40) | | (1.28) C | | (1.10) |
| Net asset value, end of period | $ | 27.75 | $ | 25.90 | $ | 22.64 | $ | 29.96 | $ | 27.27 | $ | 24.30 |
Total Return D,E,F | | | | 16.71% | | (17.75)% | | 15.32% | | 18.15% | | 27.33% |
Ratios to Average Net Assets B,G,H | | | | | | | | | | | | |
| Expenses before reductions | | .10% I | | .10% | | .10% | | .10% | | .10% | | .10% |
| Expenses net of fee waivers, if any | | | | .10% | | .10% | | .10% | | .10% | | .10% |
| Expenses net of all reductions | | .10% I | | .10% | | .10% | | .10% | | .10% | | .10% |
| Net investment income (loss) | | .34% I | | 2.00% | | 1.58% | | 1.43% | | 1.10% | | 2.03% |
| Supplemental Data | | | | | | | | | | | | |
| Net assets, end of period (000 omitted) | $ | 149,723 | $ | 141,514 | $ | 98,376 | $ | 82,275 | $ | 51,598 | $ | 30,573 |
Portfolio turnover rate J | | | | 26% | | 49% | | 34% | | 55% | | 29% |
ACalculated based on average shares outstanding during the period.
BNet investment income (loss) is affected by the timing of the declaration of dividends by any underlying mutual funds or exchange-traded funds (ETFs). Net investment income (loss) of any mutual funds or ETFs is not included in the Fund's net investment income (loss) ratio.
CTotal distributions per share do not sum due to rounding.
DTotal returns for periods of less than one year are not annualized.
ETotal returns do not reflect charges attributable to your insurance company's separate account. Inclusion of these charges would reduce the total returns shown.
FTotal returns would have been lower if certain expenses had not been reduced during the applicable periods shown.
GFees and expenses of any underlying mutual funds or exchange-traded funds (ETFs) are not included in the Fund's expense ratio. The Fund indirectly bears its proportionate share of these expenses.
HExpense ratios reflect operating expenses of the class. Expenses before reductions do not reflect amounts reimbursed, waived, or reduced through arrangements with the investment adviser, brokerage services, or other offset arrangements, if applicable, and do not represent the amount paid by the class during periods when reimbursements, waivers or reductions occur.
IAnnualized.
JAmount does not include the portfolio activity of any underlying mutual funds or exchange-traded funds (ETFs).
VIP Freedom 2035 Portfolio℠ Service Class 2 |
| |
| | Six months ended (Unaudited) June 30, 2024 | | Years ended December 31, 2023 | | 2022 | | 2021 | | 2020 | | 2019 |
Selected Per-Share Data | | | | | | | | | | | | |
| Net asset value, beginning of period | $ | 25.72 | $ | 22.49 | $ | 29.78 | $ | 27.11 | $ | 24.17 | $ | 19.94 |
| Income from Investment Operations | | | | | | | | | | | | |
Net investment income (loss) A,B | | .03 | | .45 | | .34 | | .37 | | .22 | | .42 |
| Net realized and unrealized gain (loss) | | 2.14 | | 3.25 | | (5.38) | | 3.66 | | 3.97 | | 4.88 |
| Total from investment operations | | 2.17 | | 3.70 | | (5.04) | | 4.03 | | 4.19 | | 5.30 |
| Distributions from net investment income | | (.04) | | (.42) | | (.36) | | (.23) | | (.21) | | (.36) |
| Distributions from net realized gain | | (.31) | | (.05) | | (1.89) | | (1.13) | | (1.04) | | (.71) |
| Total distributions | | (.35) | | (.47) | | (2.25) | | (1.36) | | (1.25) | | (1.07) |
| Net asset value, end of period | $ | 27.54 | $ | 25.72 | $ | 22.49 | $ | 29.78 | $ | 27.11 | $ | 24.17 |
Total Return C,D,E | | | | 16.53% | | (17.89)% | | 15.18% | | 17.96% | | 27.13% |
Ratios to Average Net Assets B,F,G | | | | | | | | | | | | |
| Expenses before reductions | | .25% H | | .25% | | .25% | | .25% | | .25% | | .25% |
| Expenses net of fee waivers, if any | | | | .25% | | .25% | | .25% | | .25% | | .25% |
| Expenses net of all reductions | | .25% H | | .25% | | .25% | | .25% | | .25% | | .25% |
| Net investment income (loss) | | .19% H | | 1.85% | | 1.43% | | 1.28% | | .95% | | 1.88% |
| Supplemental Data | | | | | | | | | | | | |
| Net assets, end of period (000 omitted) | $ | 132,655 | $ | 122,389 | $ | 98,634 | $ | 113,228 | $ | 87,124 | $ | 71,380 |
Portfolio turnover rate I | | | | 26% | | 49% | | 34% | | 55% | | 29% |
ACalculated based on average shares outstanding during the period.
BNet investment income (loss) is affected by the timing of the declaration of dividends by any underlying mutual funds or exchange-traded funds (ETFs). Net investment income (loss) of any mutual funds or ETFs is not included in the Fund's net investment income (loss) ratio.
CTotal returns for periods of less than one year are not annualized.
DTotal returns do not reflect charges attributable to your insurance company's separate account. Inclusion of these charges would reduce the total returns shown.
ETotal returns would have been lower if certain expenses had not been reduced during the applicable periods shown.
FFees and expenses of any underlying mutual funds or exchange-traded funds (ETFs) are not included in the Fund's expense ratio. The Fund indirectly bears its proportionate share of these expenses.
GExpense ratios reflect operating expenses of the class. Expenses before reductions do not reflect amounts reimbursed, waived, or reduced through arrangements with the investment adviser, brokerage services, or other offset arrangements, if applicable, and do not represent the amount paid by the class during periods when reimbursements, waivers or reductions occur.
HAnnualized.
IAmount does not include the portfolio activity of any underlying mutual funds or exchange-traded funds (ETFs).
VIP Freedom 2040 Portfolio℠
Schedule of Investments June 30, 2024 (Unaudited)
Showing Percentage of Net Assets
| Domestic Equity Funds - 47.3% |
| | | Shares | Value ($) |
| VIP Contrafund Portfolio Initial Class (a) | | 437,679 | 26,518,949 |
| VIP Equity-Income Portfolio Initial Class (a) | | 800,631 | 21,633,051 |
| VIP Growth & Income Portfolio Initial Class (a) | | 969,905 | 29,766,381 |
| VIP Growth Portfolio Initial Class (a) | | 389,167 | 44,100,376 |
| VIP Mid Cap Portfolio Initial Class (a) | | 173,716 | 6,827,040 |
| VIP Value Portfolio Initial Class (a) | | 779,398 | 15,151,506 |
| VIP Value Strategies Portfolio Initial Class (a) | | 449,098 | 7,535,868 |
| TOTAL DOMESTIC EQUITY FUNDS (Cost $104,821,322) | | | 151,533,171 |
| | | | |
| International Equity Funds - 40.0% |
| | | Shares | Value ($) |
| VIP Emerging Markets Portfolio Initial Class (a) | | 3,695,986 | 42,910,395 |
| VIP Overseas Portfolio Initial Class (a) | | 3,080,113 | 85,503,923 |
| TOTAL INTERNATIONAL EQUITY FUNDS (Cost $109,493,917) | | | 128,414,318 |
| | | | |
| Bond Funds - 12.7% |
| | | Shares | Value ($) |
| Fidelity Inflation-Protected Bond Index Fund (a) | | 752,757 | 6,857,616 |
| Fidelity International Bond Index Fund (a) | | 376,376 | 3,440,079 |
| Fidelity Long-Term Treasury Bond Index Fund (a) | | 2,235,169 | 21,211,755 |
| VIP High Income Portfolio Initial Class (a) | | 183,134 | 868,057 |
| VIP Investment Grade Bond II Portfolio - Initial Class (a) | | 879,556 | 8,285,418 |
| TOTAL BOND FUNDS (Cost $43,940,145) | | | 40,662,925 |
| | | | |
| TOTAL INVESTMENT IN SECURITIES - 100.0% (Cost $258,255,384) | 320,610,414 |
NET OTHER ASSETS (LIABILITIES) - 0.0% | (25,420) |
| NET ASSETS - 100.0% | 320,584,994 |
| | |
Legend
Affiliated Underlying Funds
Fiscal year to date information regarding the Fund's investments in affiliated Underlying Funds is presented below. Exchanges between classes of the same affiliated Underlying Funds may occur. If an Underlying Funds changes its name, the name presented below is the name in effect at period end.
| Affiliate | Value, beginning of period ($) | Purchases ($) | Sales Proceeds ($) | Dividend Income ($) | Realized Gain (loss) ($) | Change in Unrealized appreciation (depreciation) ($) | Value, end of period ($) |
| Fidelity Inflation-Protected Bond Index Fund | 6,013,100 | 1,379,046 | 591,591 | 10,786 | (3,985) | 61,046 | 6,857,616 |
| Fidelity International Bond Index Fund | 3,956,871 | 1,303,333 | 1,804,584 | 36,334 | (78,710) | 63,169 | 3,440,079 |
| Fidelity Long-Term Treasury Bond Index Fund | 17,177,919 | 9,222,536 | 4,074,967 | 346,376 | (310,262) | (803,471) | 21,211,755 |
| VIP Contrafund Portfolio Initial Class | 22,520,261 | 2,915,679 | 4,343,388 | 88,249 | 225,006 | 5,201,391 | 26,518,949 |
| VIP Emerging Markets Portfolio Initial Class | 34,971,639 | 8,840,610 | 4,464,844 | 30,077 | 134,760 | 3,428,230 | 42,910,395 |
| VIP Equity-Income Portfolio Initial Class | 18,261,110 | 3,795,244 | 2,095,861 | 100,844 | 38,484 | 1,634,074 | 21,633,051 |
| VIP Government Money Market Portfolio Initial Class 5.1% | - | 611,610 | 611,610 | 2,636 | - | - | - |
| VIP Growth & Income Portfolio Initial Class | 25,102,332 | 4,168,684 | 2,979,807 | 164,830 | 29,101 | 3,446,071 | 29,766,381 |
| VIP Growth Portfolio Initial Class | 37,296,237 | 5,301,003 | 6,535,790 | 546,082 | 238,947 | 7,799,979 | 44,100,376 |
| VIP High Income Portfolio Initial Class | 760,059 | 159,814 | 75,839 | 325 | 234 | 23,789 | 868,057 |
| VIP Investment Grade Bond II Portfolio - Initial Class | 16,097,687 | 4,486,517 | 12,151,395 | 8,230 | (278,652) | 131,261 | 8,285,418 |
| VIP Mid Cap Portfolio Initial Class | 5,716,239 | 1,281,584 | 644,293 | 105,628 | 17,236 | 456,274 | 6,827,040 |
| VIP Overseas Portfolio Initial Class | 74,035,341 | 14,461,910 | 8,528,993 | 281,106 | 173,898 | 5,361,767 | 85,503,923 |
| VIP Value Portfolio Initial Class | 12,737,446 | 3,432,092 | 1,267,343 | 271,607 | 9,206 | 240,105 | 15,151,506 |
| VIP Value Strategies Portfolio Initial Class | 6,303,467 | 1,781,878 | 653,984 | 88,121 | 13,834 | 90,673 | 7,535,868 |
| | 280,949,708 | 63,141,540 | 50,824,289 | 2,081,231 | 209,097 | 27,134,358 | 320,610,414 |
Amounts in the dividend income column in the above table include any capital gain distributions from underlying funds, which are presented in the corresponding line item in the Statement of Operations, if applicable.
Amounts included in the purchases and sales proceeds columns may include in-kind transactions, if applicable.
Investment Valuation
The following is a summary of the inputs used, as of June 30, 2024, involving the Fund's assets and liabilities carried at fair value. The inputs or methodology used for valuing securities may not be an indication of the risk associated with investing in those securities. For more information on valuation inputs, and their aggregation into the levels used below, please refer to the Investment Valuation section in the accompanying Notes to Financial Statements.
| Valuation Inputs at Reporting Date: |
| Description | Total ($) | Level 1 ($) | Level 2 ($) | Level 3 ($) |
Investments in Securities: | | | | |
|
| Domestic Equity Funds | 151,533,171 | 151,533,171 | - | - |
|
| International Equity Funds | 128,414,318 | 128,414,318 | - | - |
|
| Bond Funds | 40,662,925 | 40,662,925 | - | - |
| Total Investments in Securities: | 320,610,414 | 320,610,414 | - | - |
VIP Freedom 2040 Portfolio℠
Financial Statements (Unaudited)
| Statement of Assets and Liabilities |
| | | | June 30, 2024 (Unaudited) |
| | | | | |
| Assets | | | | |
| Investment in securities, at value - See accompanying schedule: | | | | |
Affiliated issuers (cost $258,255,384) | $ | 320,610,414 | | |
| | | | | |
| | | | | |
| Total Investment in Securities (cost $258,255,384) | | | $ | 320,610,414 |
| Cash | | | | 1,282 |
| Receivable for investments sold | | | | 2,714,388 |
| Receivable for fund shares sold | | | | 270,527 |
Total assets | | | | 323,596,611 |
| Liabilities | | | | |
| Payable for investments purchased | $ | 2,840,264 | | |
| Payable for fund shares redeemed | | 144,702 | | |
| Distribution and service plan fees payable | | 26,651 | | |
| Total liabilities | | | | 3,011,617 |
| Net Assets | | | $ | 320,584,994 |
| Net Assets consist of: | | | | |
| Paid in capital | | | $ | 261,381,450 |
| Total accumulated earnings (loss) | | | | 59,203,544 |
| Net Assets | | | $ | 320,584,994 |
| | | | | |
| Net Asset Value and Maximum Offering Price | | | | |
| Initial Class : | | | | |
Net Asset Value, offering price and redemption price per share ($79,059,586 ÷ 2,915,025 shares) | | | $ | 27.12 |
| Service Class : | | | | |
Net Asset Value, offering price and redemption price per share ($189,100,845 ÷ 6,995,672 shares) | | | $ | 27.03 |
| Service Class 2 : | | | | |
Net Asset Value, offering price and redemption price per share ($52,424,563 ÷ 1,951,678 shares) | | | $ | 26.86 |
| Statement of Operations |
| | | | Six months ended June 30, 2024 (Unaudited) |
| Investment Income | | | | |
| Dividends: | | | | |
| Affiliated issuers | | | $ | 618,989 |
| Expenses | | | | |
| Distribution and service plan fees | $ | 149,968 | | |
| Independent trustees' fees and expenses | | 389 | | |
| Total expenses | | | | 150,357 |
| Net Investment income (loss) | | | | 468,632 |
| Realized and Unrealized Gain (Loss) | | | | |
| Net realized gain (loss) on: | | | | |
| Investment Securities: | | | | |
| Affiliated issuers | | 209,097 | | |
| Capital gain distributions from underlying funds: | | | | |
| Affiliated issuers | | 1,462,242 | | |
| Total net realized gain (loss) | | | | 1,671,339 |
| Change in net unrealized appreciation (depreciation) on: | | | | |
| Investment Securities: | | | | |
| Affiliated issuers | | 27,134,358 | | |
| Total change in net unrealized appreciation (depreciation) | | | | 27,134,358 |
| Net gain (loss) | | | | 28,805,697 |
| Net increase (decrease) in net assets resulting from operations | | | $ | 29,274,329 |
| Statement of Changes in Net Assets |
| |
| | Six months ended June 30, 2024 (Unaudited) | | Year ended December 31, 2023 |
| Increase (Decrease) in Net Assets | | | | |
| Operations | | | | |
| Net investment income (loss) | $ | 468,632 | $ | 3,728,100 |
| Net realized gain (loss) | | 1,671,339 | | 4,204,597 |
| Change in net unrealized appreciation (depreciation) | | 27,134,358 | | 34,145,294 |
| Net increase (decrease) in net assets resulting from operations | | 29,274,329 | | 42,077,991 |
| Distributions to shareholders | | (4,208,320) | | (6,990,227) |
| | | | | |
| Share transactions - net increase (decrease) | | 14,590,963 | | 43,995,084 |
| Total increase (decrease) in net assets | | 39,656,972 | | 79,082,848 |
| | | | | |
| Net Assets | | | | |
| Beginning of period | | 280,928,022 | | 201,845,174 |
| End of period | $ | 320,584,994 | $ | 280,928,022 |
| | | | | |
| | | | | |
Financial Highlights
VIP Freedom 2040 Portfolio℠ Initial Class |
| |
| | Six months ended (Unaudited) June 30, 2024 | | Years ended December 31, 2023 | | 2022 | | 2021 | | 2020 | | 2019 |
Selected Per-Share Data | | | | | | | | | | | | |
| Net asset value, beginning of period | $ | 24.91 | $ | 21.58 | $ | 29.04 | $ | 25.96 | $ | 23.08 | $ | 18.94 |
| Income from Investment Operations | | | | | | | | | | | | |
Net investment income (loss) A,B | | .05 | | .38 | | .34 | | .41 | | .24 | | .40 |
| Net realized and unrealized gain (loss) | | 2.54 | | 3.65 | | (5.31) | | 4.11 | | 4.02 | | 4.88 |
| Total from investment operations | | 2.59 | | 4.03 | | (4.97) | | 4.52 | | 4.26 | | 5.28 |
| Distributions from net investment income | | (.02) | | (.37) | | (.39) | | (.26) | | (.23) | | (.39) |
| Distributions from net realized gain | | (.35) | | (.32) | | (2.10) | | (1.18) | | (1.16) | | (.75) |
| Total distributions | | (.38) C | | (.70) | | (2.49) | | (1.44) | | (1.38) C | | (1.14) |
| Net asset value, end of period | $ | 27.12 | $ | 24.91 | $ | 21.58 | $ | 29.04 | $ | 25.96 | $ | 23.08 |
Total Return D,E,F | | | | 18.87% | | (18.22)% | | 17.83% | | 19.28% | | 28.52% |
Ratios to Average Net Assets B,G,H | | | | | | | | | | | | |
Expenses before reductions I | | -% J | | -% | | -% | | -% | | -% | | -% |
Expenses net of fee waivers, if any I | | | | -% | | -% | | -% | | -% | | -% |
Expenses net of all reductions I | | -% J | | -% | | -% | | -% | | -% | | -% |
| Net investment income (loss) | | .41% J | | 1.64% | | 1.49% | | 1.45% | | 1.07% | | 1.86% |
| Supplemental Data | | | | | | | | | | | | |
| Net assets, end of period (000 omitted) | $ | 79,060 | $ | 66,167 | $ | 41,856 | $ | 45,822 | $ | 34,365 | $ | 27,284 |
Portfolio turnover rate K | | | | 28% | | 39% | | 32% | | 49% | | 36% |
ACalculated based on average shares outstanding during the period.
BNet investment income (loss) is affected by the timing of the declaration of dividends by any underlying mutual funds or exchange-traded funds (ETFs). Net investment income (loss) of any mutual funds or ETFs is not included in the Fund's net investment income (loss) ratio.
CTotal distributions per share do not sum due to rounding.
DTotal returns for periods of less than one year are not annualized.
ETotal returns do not reflect charges attributable to your insurance company's separate account. Inclusion of these charges would reduce the total returns shown.
FTotal returns would have been lower if certain expenses had not been reduced during the applicable periods shown.
GFees and expenses of any underlying mutual funds or exchange-traded funds (ETFs) are not included in the Fund's expense ratio. The Fund indirectly bears its proportionate share of these expenses.
HExpense ratios reflect operating expenses of the class. Expenses before reductions do not reflect amounts reimbursed, waived, or reduced through arrangements with the investment adviser, brokerage services, or other offset arrangements, if applicable, and do not represent the amount paid by the class during periods when reimbursements, waivers or reductions occur.
IAmount represents less than .005%.
JAnnualized.
KAmount does not include the portfolio activity of any underlying mutual funds or exchange-traded funds (ETFs).
VIP Freedom 2040 Portfolio℠ Service Class |
| |
| | Six months ended (Unaudited) June 30, 2024 | | Years ended December 31, 2023 | | 2022 | | 2021 | | 2020 | | 2019 |
Selected Per-Share Data | | | | | | | | | | | | |
| Net asset value, beginning of period | $ | 24.85 | $ | 21.52 | $ | 28.97 | $ | 25.91 | $ | 23.04 | $ | 18.91 |
| Income from Investment Operations | | | | | | | | | | | | |
Net investment income (loss) A,B | | .04 | | .36 | | .32 | | .38 | | .21 | | .37 |
| Net realized and unrealized gain (loss) | | 2.52 | | 3.64 | | (5.30) | | 4.10 | | 4.02 | | 4.88 |
| Total from investment operations | | 2.56 | | 4.00 | | (4.98) | | 4.48 | | 4.23 | | 5.25 |
| Distributions from net investment income | | (.02) | | (.35) | | (.37) | | (.24) | | (.21) | | (.37) |
| Distributions from net realized gain | | (.35) | | (.32) | | (2.10) | | (1.18) | | (1.16) | | (.75) |
| Total distributions | | (.38) C | | (.67) | | (2.47) | | (1.42) | | (1.36) C | | (1.12) |
| Net asset value, end of period | $ | 27.03 | $ | 24.85 | $ | 21.52 | $ | 28.97 | $ | 25.91 | $ | 23.04 |
Total Return D,E,F | | | | 18.82% | | (18.30)% | | 17.68% | | 19.16% | | 28.39% |
Ratios to Average Net Assets B,G,H | | | | | | | | | | | | |
| Expenses before reductions | | .10% I | | .10% | | .10% | | .10% | | .10% | | .10% |
| Expenses net of fee waivers, if any | | | | .10% | | .10% | | .10% | | .10% | | .10% |
| Expenses net of all reductions | | .10% I | | .10% | | .10% | | .10% | | .10% | | .10% |
| Net investment income (loss) | | .31% I | | 1.54% | | 1.39% | | 1.35% | | .97% | | 1.76% |
| Supplemental Data | | | | | | | | | | | | |
| Net assets, end of period (000 omitted) | $ | 189,101 | $ | 169,888 | $ | 124,508 | $ | 119,062 | $ | 85,197 | $ | 63,170 |
Portfolio turnover rate J | | | | 28% | | 39% | | 32% | | 49% | | 36% |
ACalculated based on average shares outstanding during the period.
BNet investment income (loss) is affected by the timing of the declaration of dividends by any underlying mutual funds or exchange-traded funds (ETFs). Net investment income (loss) of any mutual funds or ETFs is not included in the Fund's net investment income (loss) ratio.
CTotal distributions per share do not sum due to rounding.
DTotal returns for periods of less than one year are not annualized.
ETotal returns do not reflect charges attributable to your insurance company's separate account. Inclusion of these charges would reduce the total returns shown.
FTotal returns would have been lower if certain expenses had not been reduced during the applicable periods shown.
GFees and expenses of any underlying mutual funds or exchange-traded funds (ETFs) are not included in the Fund's expense ratio. The Fund indirectly bears its proportionate share of these expenses.
HExpense ratios reflect operating expenses of the class. Expenses before reductions do not reflect amounts reimbursed, waived, or reduced through arrangements with the investment adviser, brokerage services, or other offset arrangements, if applicable, and do not represent the amount paid by the class during periods when reimbursements, waivers or reductions occur.
IAnnualized.
JAmount does not include the portfolio activity of any underlying mutual funds or exchange-traded funds (ETFs).
VIP Freedom 2040 Portfolio℠ Service Class 2 |
| |
| | Six months ended (Unaudited) June 30, 2024 | | Years ended December 31, 2023 | | 2022 | | 2021 | | 2020 | | 2019 |
Selected Per-Share Data | | | | | | | | | | | | |
| Net asset value, beginning of period | $ | 24.71 | $ | 21.41 | $ | 28.83 | $ | 25.80 | $ | 22.95 | $ | 18.84 |
| Income from Investment Operations | | | | | | | | | | | | |
Net investment income (loss) A,B | | .02 | | .32 | | .28 | | .33 | | .18 | | .34 |
| Net realized and unrealized gain (loss) | | 2.51 | | 3.62 | | (5.26) | | 4.08 | | 4.00 | | 4.86 |
| Total from investment operations | | 2.53 | | 3.94 | | (4.98) | | 4.41 | | 4.18 | | 5.20 |
| Distributions from net investment income | | (.02) | | (.32) | | (.33) | | (.20) | | (.17) | | (.34) |
| Distributions from net realized gain | | (.35) | | (.32) | | (2.10) | | (1.18) | | (1.15) | | (.75) |
| Total distributions | | (.38) C | | (.64) | | (2.44) C | | (1.38) | | (1.33) C | | (1.09) |
| Net asset value, end of period | $ | 26.86 | $ | 24.71 | $ | 21.41 | $ | 28.83 | $ | 25.80 | $ | 22.95 |
Total Return D,E,F | | | | 18.61% | | (18.41)% | | 17.50% | | 18.99% | | 28.23% |
Ratios to Average Net Assets B,G,H | | | | | | | | | | | | |
| Expenses before reductions | | .25% I | | .25% | | .25% | | .25% | | .25% | | .25% |
| Expenses net of fee waivers, if any | | | | .25% | | .25% | | .25% | | .25% | | .25% |
| Expenses net of all reductions | | .25% I | | .25% | | .25% | | .25% | | .25% | | .25% |
| Net investment income (loss) | | .16% I | | 1.39% | | 1.24% | | 1.20% | | .82% | | 1.61% |
| Supplemental Data | | | | | | | | | | | | |
| Net assets, end of period (000 omitted) | $ | 52,425 | $ | 44,872 | $ | 35,481 | $ | 41,525 | $ | 30,980 | $ | 23,721 |
Portfolio turnover rate J | | | | 28% | | 39% | | 32% | | 49% | | 36% |
ACalculated based on average shares outstanding during the period.
BNet investment income (loss) is affected by the timing of the declaration of dividends by any underlying mutual funds or exchange-traded funds (ETFs). Net investment income (loss) of any mutual funds or ETFs is not included in the Fund's net investment income (loss) ratio.
CTotal distributions per share do not sum due to rounding.
DTotal returns for periods of less than one year are not annualized.
ETotal returns do not reflect charges attributable to your insurance company's separate account. Inclusion of these charges would reduce the total returns shown.
FTotal returns would have been lower if certain expenses had not been reduced during the applicable periods shown.
GFees and expenses of any underlying mutual funds or exchange-traded funds (ETFs) are not included in the Fund's expense ratio. The Fund indirectly bears its proportionate share of these expenses.
HExpense ratios reflect operating expenses of the class. Expenses before reductions do not reflect amounts reimbursed, waived, or reduced through arrangements with the investment adviser, brokerage services, or other offset arrangements, if applicable, and do not represent the amount paid by the class during periods when reimbursements, waivers or reductions occur.
IAnnualized.
JAmount does not include the portfolio activity of any underlying mutual funds or exchange-traded funds (ETFs).
VIP Freedom 2045 Portfolio℠
Schedule of Investments June 30, 2024 (Unaudited)
Showing Percentage of Net Assets
| Domestic Equity Funds - 50.5% |
| | | Shares | Value ($) |
| VIP Contrafund Portfolio Initial Class (a) | | 257,780 | 15,618,876 |
| VIP Equity-Income Portfolio Initial Class (a) | | 471,537 | 12,740,942 |
| VIP Growth & Income Portfolio Initial Class (a) | | 571,231 | 17,531,085 |
| VIP Growth Portfolio Initial Class (a) | | 229,206 | 25,973,633 |
| VIP Mid Cap Portfolio Initial Class (a) | | 102,311 | 4,020,829 |
| VIP Value Portfolio Initial Class (a) | | 459,033 | 8,923,597 |
| VIP Value Strategies Portfolio Initial Class (a) | | 264,498 | 4,438,275 |
| TOTAL DOMESTIC EQUITY FUNDS (Cost $64,495,510) | | | 89,247,237 |
| | | | |
| International Equity Funds - 42.5% |
| | | Shares | Value ($) |
| VIP Emerging Markets Portfolio Initial Class (a) | | 2,130,891 | 24,739,645 |
| VIP Overseas Portfolio Initial Class (a) | | 1,814,341 | 50,366,102 |
| TOTAL INTERNATIONAL EQUITY FUNDS (Cost $64,725,162) | | | 75,105,747 |
| | | | |
| Bond Funds - 7.0% |
| | | Shares | Value ($) |
| Fidelity Inflation-Protected Bond Index Fund (a) | | 226,705 | 2,065,280 |
| Fidelity International Bond Index Fund (a) | | 3,875 | 35,420 |
| Fidelity Long-Term Treasury Bond Index Fund (a) | | 1,023,201 | 9,710,178 |
| VIP High Income Portfolio Initial Class (a) | | 100,880 | 478,170 |
| TOTAL BOND FUNDS (Cost $13,881,913) | | | 12,289,048 |
| | | | |
| TOTAL INVESTMENT IN SECURITIES - 100.0% (Cost $143,102,585) | 176,642,032 |
NET OTHER ASSETS (LIABILITIES) - 0.0% | (25,590) |
| NET ASSETS - 100.0% | 176,616,442 |
| | |
Legend
Affiliated Underlying Funds
Fiscal year to date information regarding the Fund's investments in affiliated Underlying Funds is presented below. Exchanges between classes of the same affiliated Underlying Funds may occur. If an Underlying Funds changes its name, the name presented below is the name in effect at period end.
| Affiliate | Value, beginning of period ($) | Purchases ($) | Sales Proceeds ($) | Dividend Income ($) | Realized Gain (loss) ($) | Change in Unrealized appreciation (depreciation) ($) | Value, end of period ($) |
| Fidelity Inflation-Protected Bond Index Fund | 3,290,282 | 490,203 | 1,731,033 | 3,766 | (185,388) | 201,216 | 2,065,280 |
| Fidelity International Bond Index Fund | 844,505 | 114,514 | 921,347 | 5,571 | (23,938) | 21,686 | 35,420 |
| Fidelity Long-Term Treasury Bond Index Fund | 9,398,932 | 3,508,006 | 2,573,573 | 170,457 | (175,336) | (447,851) | 9,710,178 |
| VIP Contrafund Portfolio Initial Class | 13,090,234 | 1,531,231 | 2,189,152 | 51,873 | 156,293 | 3,030,270 | 15,618,876 |
| VIP Emerging Markets Portfolio Initial Class | 19,954,035 | 4,820,164 | 2,124,010 | 17,414 | 62,363 | 2,027,093 | 24,739,645 |
| VIP Equity-Income Portfolio Initial Class | 10,614,544 | 2,180,703 | 1,038,374 | 59,886 | 25,588 | 958,481 | 12,740,942 |
| VIP Government Money Market Portfolio Initial Class 5.1% | - | 338,548 | 338,548 | 1,460 | - | - | - |
| VIP Growth & Income Portfolio Initial Class | 14,591,079 | 2,293,908 | 1,398,747 | 97,012 | 18,212 | 2,026,633 | 17,531,085 |
| VIP Growth Portfolio Initial Class | 21,678,993 | 2,964,882 | 3,386,760 | 318,193 | 202,330 | 4,514,188 | 25,973,633 |
| VIP High Income Portfolio Initial Class | 415,899 | 78,948 | 29,978 | 180 | 62 | 13,239 | 478,170 |
| VIP Investment Grade Bond II Portfolio - Initial Class | 2,843,761 | 122,281 | 2,932,053 | 566 | (27,379) | (6,610) | - |
| VIP Mid Cap Portfolio Initial Class | 3,322,636 | 710,645 | 292,212 | 62,286 | 5,913 | 273,847 | 4,020,829 |
| VIP Overseas Portfolio Initial Class | 42,622,148 | 8,160,536 | 3,653,642 | 164,282 | 102,478 | 3,134,582 | 50,366,102 |
| VIP Value Portfolio Initial Class | 7,403,843 | 1,923,599 | 553,772 | 161,795 | 10,597 | 139,330 | 8,923,597 |
| VIP Value Strategies Portfolio Initial Class | 3,664,004 | 1,009,970 | 299,246 | 52,017 | 9,249 | 54,298 | 4,438,275 |
| | 153,734,895 | 30,248,138 | 23,462,447 | 1,166,758 | 181,044 | 15,940,402 | 176,642,032 |
Amounts in the dividend income column in the above table include any capital gain distributions from underlying funds, which are presented in the corresponding line item in the Statement of Operations, if applicable.
Amounts included in the purchases and sales proceeds columns may include in-kind transactions, if applicable.
Investment Valuation
The following is a summary of the inputs used, as of June 30, 2024, involving the Fund's assets and liabilities carried at fair value. The inputs or methodology used for valuing securities may not be an indication of the risk associated with investing in those securities. For more information on valuation inputs, and their aggregation into the levels used below, please refer to the Investment Valuation section in the accompanying Notes to Financial Statements.
| Valuation Inputs at Reporting Date: |
| Description | Total ($) | Level 1 ($) | Level 2 ($) | Level 3 ($) |
Investments in Securities: | | | | |
|
| Domestic Equity Funds | 89,247,237 | 89,247,237 | - | - |
|
| International Equity Funds | 75,105,747 | 75,105,747 | - | - |
|
| Bond Funds | 12,289,048 | 12,289,048 | - | - |
| Total Investments in Securities: | 176,642,032 | 176,642,032 | - | - |
VIP Freedom 2045 Portfolio℠
Financial Statements (Unaudited)
| Statement of Assets and Liabilities |
| | | | June 30, 2024 (Unaudited) |
| | | | | |
| Assets | | | | |
| Investment in securities, at value - See accompanying schedule: | | | | |
Affiliated issuers (cost $143,102,585) | $ | 176,642,032 | | |
| | | | | |
| | | | | |
| Total Investment in Securities (cost $143,102,585) | | | $ | 176,642,032 |
| Cash | | | | 900 |
| Receivable for investments sold | | | | 1,421,748 |
| Receivable for fund shares sold | | | | 169,163 |
Total assets | | | | 178,233,843 |
| Liabilities | | | | |
| Payable for investments purchased | $ | 1,505,520 | | |
| Payable for fund shares redeemed | | 85,423 | | |
| Distribution and service plan fees payable | | 26,458 | | |
| Total liabilities | | | | 1,617,401 |
| Net Assets | | | $ | 176,616,442 |
| Net Assets consist of: | | | | |
| Paid in capital | | | $ | 145,167,014 |
| Total accumulated earnings (loss) | | | | 31,449,428 |
| Net Assets | | | $ | 176,616,442 |
| | | | | |
| Net Asset Value and Maximum Offering Price | | | | |
| Initial Class : | | | | |
Net Asset Value, offering price and redemption price per share ($21,667,140 ÷ 785,644 shares) | | | $ | 27.58 |
| Service Class : | | | | |
Net Asset Value, offering price and redemption price per share ($45,784,329 ÷ 1,666,446 shares) | | | $ | 27.47 |
| Service Class 2 : | | | | |
Net Asset Value, offering price and redemption price per share ($109,164,973 ÷ 4,000,679 shares) | | | $ | 27.29 |
| Statement of Operations |
| | | | Six months ended June 30, 2024 (Unaudited) |
| Investment Income | | | | |
| Dividends: | | | | |
| Affiliated issuers | | | $ | 307,113 |
| Expenses | | | | |
| Distribution and service plan fees | $ | 149,985 | | |
| Independent trustees' fees and expenses | | 214 | | |
| Total expenses | | | | 150,199 |
| Net Investment income (loss) | | | | 156,914 |
| Realized and Unrealized Gain (Loss) | | | | |
| Net realized gain (loss) on: | | | | |
| Investment Securities: | | | | |
| Affiliated issuers | | 181,044 | | |
| Capital gain distributions from underlying funds: | | | | |
| Affiliated issuers | | 859,645 | | |
| Total net realized gain (loss) | | | | 1,040,689 |
| Change in net unrealized appreciation (depreciation) on: | | | | |
| Investment Securities: | | | | |
| Affiliated issuers | | 15,940,402 | | |
| Total change in net unrealized appreciation (depreciation) | | | | 15,940,402 |
| Net gain (loss) | | | | 16,981,091 |
| Net increase (decrease) in net assets resulting from operations | | | $ | 17,138,005 |
| Statement of Changes in Net Assets |
| |
| | Six months ended June 30, 2024 (Unaudited) | | Year ended December 31, 2023 |
| Increase (Decrease) in Net Assets | | | | |
| Operations | | | | |
| Net investment income (loss) | $ | 156,914 | $ | 1,735,494 |
| Net realized gain (loss) | | 1,040,689 | | 2,560,863 |
| Change in net unrealized appreciation (depreciation) | | 15,940,402 | | 18,054,403 |
| Net increase (decrease) in net assets resulting from operations | | 17,138,005 | | 22,350,760 |
| Distributions to shareholders | | (2,511,340) | | (3,608,373) |
| | | | | |
| Share transactions - net increase (decrease) | | 8,276,398 | | 30,569,201 |
| Total increase (decrease) in net assets | | 22,903,063 | | 49,311,588 |
| | | | | |
| Net Assets | | | | |
| Beginning of period | | 153,713,379 | | 104,401,791 |
| End of period | $ | 176,616,442 | $ | 153,713,379 |
| | | | | |
| | | | | |
Financial Highlights
VIP Freedom 2045 Portfolio℠ Initial Class |
| |
| | Six months ended (Unaudited) June 30, 2024 | | Years ended December 31, 2023 | | 2022 | | 2021 | | 2020 | | 2019 |
Selected Per-Share Data | | | | | | | | | | | | |
| Net asset value, beginning of period | $ | 25.21 | $ | 21.76 | $ | 29.30 | $ | 26.09 | $ | 23.08 | $ | 18.91 |
| Income from Investment Operations | | | | | | | | | | | | |
Net investment income (loss) A,B | | .05 | | .37 | | .34 | | .40 | | .25 | | .43 |
| Net realized and unrealized gain (loss) | | 2.73 | | 3.80 | | (5.35) | | 4.16 | | 4.03 | | 4.85 |
| Total from investment operations | | 2.78 | | 4.17 | | (5.01) | | 4.56 | | 4.28 | | 5.28 |
| Distributions from net investment income | | (.02) | | (.35) | | (.38) | | (.27) | | (.22) | | (.37) |
| Distributions from net realized gain | | (.39) | | (.37) | | (2.15) | | (1.08) | | (1.05) | | (.74) |
| Total distributions | | (.41) | | (.72) | | (2.53) | | (1.35) | | (1.27) | | (1.11) |
| Net asset value, end of period | $ | 27.58 | $ | 25.21 | $ | 21.76 | $ | 29.30 | $ | 26.09 | $ | 23.08 |
Total Return C,D,E | | | | 19.41% | | (18.21)% | | 17.83% | | 19.27% | | 28.57% |
Ratios to Average Net Assets B,F,G | | | | | | | | | | | | |
Expenses before reductions H | | -% I | | -% | | -% | | -% | | -% | | -% |
Expenses net of fee waivers, if any H | | | | -% | | -% | | -% | | -% | | -% |
Expenses net of all reductions H | | -% I | | -% | | -% | | -% | | -% | | -% |
| Net investment income (loss) | | .37% I | | 1.59% | | 1.50% | | 1.42% | | 1.12% | | 2.01% |
| Supplemental Data | | | | | | | | | | | | |
| Net assets, end of period (000 omitted) | $ | 21,667 | $ | 17,029 | $ | 7,366 | $ | 6,866 | $ | 5,282 | $ | 3,686 |
Portfolio turnover rate J | | | | 24% | | 39% | | 29% | | 38% | | 25% |
ACalculated based on average shares outstanding during the period.
BNet investment income (loss) is affected by the timing of the declaration of dividends by any underlying mutual funds or exchange-traded funds (ETFs). Net investment income (loss) of any mutual funds or ETFs is not included in the Fund's net investment income (loss) ratio.
CTotal returns for periods of less than one year are not annualized.
DTotal returns do not reflect charges attributable to your insurance company's separate account. Inclusion of these charges would reduce the total returns shown.
ETotal returns would have been lower if certain expenses had not been reduced during the applicable periods shown.
FFees and expenses of any underlying mutual funds or exchange-traded funds (ETFs) are not included in the Fund's expense ratio. The Fund indirectly bears its proportionate share of these expenses.
GExpense ratios reflect operating expenses of the class. Expenses before reductions do not reflect amounts reimbursed, waived, or reduced through arrangements with the investment adviser, brokerage services, or other offset arrangements, if applicable, and do not represent the amount paid by the class during periods when reimbursements, waivers or reductions occur.
HAmount represents less than .005%.
IAnnualized.
JAmount does not include the portfolio activity of any underlying mutual funds or exchange-traded funds (ETFs).
VIP Freedom 2045 Portfolio℠ Service Class |
| |
| | Six months ended (Unaudited) June 30, 2024 | | Years ended December 31, 2023 | | 2022 | | 2021 | | 2020 | | 2019 |
Selected Per-Share Data | | | | | | | | | | | | |
| Net asset value, beginning of period | $ | 25.13 | $ | 21.69 | $ | 29.22 | $ | 26.03 | $ | 23.03 | $ | 18.88 |
| Income from Investment Operations | | | | | | | | | | | | |
Net investment income (loss) A,B | | .04 | | .35 | | .32 | | .37 | | .23 | | .41 |
| Net realized and unrealized gain (loss) | | 2.71 | | 3.79 | | (5.34) | | 4.14 | | 4.02 | | 4.83 |
| Total from investment operations | | 2.75 | | 4.14 | | (5.02) | | 4.51 | | 4.25 | | 5.24 |
| Distributions from net investment income | | (.02) | | (.33) | | (.36) | | (.24) | | (.21) | | (.35) |
| Distributions from net realized gain | | (.39) | | (.37) | | (2.15) | | (1.08) | | (1.05) | | (.74) |
| Total distributions | | (.41) | | (.70) | | (2.51) | | (1.32) | | (1.25) C | | (1.09) |
| Net asset value, end of period | $ | 27.47 | $ | 25.13 | $ | 21.69 | $ | 29.22 | $ | 26.03 | $ | 23.03 |
Total Return D,E,F | | | | 19.33% | | (18.30)% | | 17.69% | | 19.18% | | 28.40% |
Ratios to Average Net Assets B,G,H | | | | | | | | | | | | |
| Expenses before reductions | | .10% I | | .10% | | .10% | | .10% | | .10% | | .10% |
| Expenses net of fee waivers, if any | | | | .10% | | .10% | | .10% | | .10% | | .10% |
| Expenses net of all reductions | | .10% I | | .10% | | .10% | | .10% | | .10% | | .10% |
| Net investment income (loss) | | .27% I | | 1.49% | | 1.40% | | 1.32% | | 1.02% | | 1.91% |
| Supplemental Data | | | | | | | | | | | | |
| Net assets, end of period (000 omitted) | $ | 45,784 | $ | 41,877 | $ | 23,628 | $ | 22,218 | $ | 13,322 | $ | 7,345 |
Portfolio turnover rate J | | | | 24% | | 39% | | 29% | | 38% | | 25% |
ACalculated based on average shares outstanding during the period.
BNet investment income (loss) is affected by the timing of the declaration of dividends by any underlying mutual funds or exchange-traded funds (ETFs). Net investment income (loss) of any mutual funds or ETFs is not included in the Fund's net investment income (loss) ratio.
CTotal distributions per share do not sum due to rounding.
DTotal returns for periods of less than one year are not annualized.
ETotal returns do not reflect charges attributable to your insurance company's separate account. Inclusion of these charges would reduce the total returns shown.
FTotal returns would have been lower if certain expenses had not been reduced during the applicable periods shown.
GFees and expenses of any underlying mutual funds or exchange-traded funds (ETFs) are not included in the Fund's expense ratio. The Fund indirectly bears its proportionate share of these expenses.
HExpense ratios reflect operating expenses of the class. Expenses before reductions do not reflect amounts reimbursed, waived, or reduced through arrangements with the investment adviser, brokerage services, or other offset arrangements, if applicable, and do not represent the amount paid by the class during periods when reimbursements, waivers or reductions occur.
IAnnualized.
JAmount does not include the portfolio activity of any underlying mutual funds or exchange-traded funds (ETFs).
VIP Freedom 2045 Portfolio℠ Service Class 2 |
| |
| | Six months ended (Unaudited) June 30, 2024 | | Years ended December 31, 2023 | | 2022 | | 2021 | | 2020 | | 2019 |
Selected Per-Share Data | | | | | | | | | | | | |
| Net asset value, beginning of period | $ | 24.98 | $ | 21.57 | $ | 29.07 | $ | 25.90 | $ | 22.93 | $ | 18.80 |
| Income from Investment Operations | | | | | | | | | | | | |
Net investment income (loss) A,B | | .02 | | .31 | | .28 | | .33 | | .19 | | .37 |
| Net realized and unrealized gain (loss) | | 2.70 | | 3.76 | | (5.30) | | 4.12 | | 4.00 | | 4.82 |
| Total from investment operations | | 2.72 | | 4.07 | | (5.02) | | 4.45 | | 4.19 | | 5.19 |
| Distributions from net investment income | | (.02) | | (.30) | | (.33) | | (.20) | | (.17) | | (.33) |
| Distributions from net realized gain | | (.39) | | (.37) | | (2.15) | | (1.08) | | (1.05) | | (.74) |
| Total distributions | | (.41) | | (.66) | | (2.48) | | (1.28) | | (1.22) | | (1.06) C |
| Net asset value, end of period | $ | 27.29 | $ | 24.98 | $ | 21.57 | $ | 29.07 | $ | 25.90 | $ | 22.93 |
Total Return D,E,F | | | | 19.13% | | (18.42)% | | 17.53% | | 18.97% | | 28.25% |
Ratios to Average Net Assets B,G,H | | | | | | | | | | | | |
| Expenses before reductions | | .25% I | | .25% | | .25% | | .25% | | .25% | | .25% |
| Expenses net of fee waivers, if any | | | | .25% | | .25% | | .25% | | .25% | | .25% |
| Expenses net of all reductions | | .25% I | | .25% | | .25% | | .25% | | .25% | | .25% |
| Net investment income (loss) | | .12% I | | 1.34% | | 1.25% | | 1.17% | | .87% | | 1.76% |
| Supplemental Data | | | | | | | | | | | | |
| Net assets, end of period (000 omitted) | $ | 109,165 | $ | 94,807 | $ | 73,408 | $ | 78,396 | $ | 63,126 | $ | 45,871 |
Portfolio turnover rate J | | | | 24% | | 39% | | 29% | | 38% | | 25% |
ACalculated based on average shares outstanding during the period.
BNet investment income (loss) is affected by the timing of the declaration of dividends by any underlying mutual funds or exchange-traded funds (ETFs). Net investment income (loss) of any mutual funds or ETFs is not included in the Fund's net investment income (loss) ratio.
CTotal distributions per share do not sum due to rounding.
DTotal returns for periods of less than one year are not annualized.
ETotal returns do not reflect charges attributable to your insurance company's separate account. Inclusion of these charges would reduce the total returns shown.
FTotal returns would have been lower if certain expenses had not been reduced during the applicable periods shown.
GFees and expenses of any underlying mutual funds or exchange-traded funds (ETFs) are not included in the Fund's expense ratio. The Fund indirectly bears its proportionate share of these expenses.
HExpense ratios reflect operating expenses of the class. Expenses before reductions do not reflect amounts reimbursed, waived, or reduced through arrangements with the investment adviser, brokerage services, or other offset arrangements, if applicable, and do not represent the amount paid by the class during periods when reimbursements, waivers or reductions occur.
IAnnualized.
JAmount does not include the portfolio activity of any underlying mutual funds or exchange-traded funds (ETFs).
VIP Freedom 2050 Portfolio℠
Schedule of Investments June 30, 2024 (Unaudited)
Showing Percentage of Net Assets
| Domestic Equity Funds - 50.5% |
| | | Shares | Value ($) |
| VIP Contrafund Portfolio Initial Class (a) | | 229,149 | 13,884,137 |
| VIP Equity-Income Portfolio Initial Class (a) | | 419,167 | 11,325,905 |
| VIP Growth & Income Portfolio Initial Class (a) | | 507,789 | 15,584,051 |
| VIP Growth Portfolio Initial Class (a) | | 203,749 | 23,088,876 |
| VIP Mid Cap Portfolio Initial Class (a) | | 90,948 | 3,574,269 |
| VIP Value Portfolio Initial Class (a) | | 408,052 | 7,932,525 |
| VIP Value Strategies Portfolio Initial Class (a) | | 235,123 | 3,945,359 |
| TOTAL DOMESTIC EQUITY FUNDS (Cost $57,409,560) | | | 79,335,122 |
| | | | |
| International Equity Funds - 42.5% |
| | | Shares | Value ($) |
| VIP Emerging Markets Portfolio Initial Class (a) | | 1,894,237 | 21,992,087 |
| VIP Overseas Portfolio Initial Class (a) | | 1,612,833 | 44,772,252 |
| TOTAL INTERNATIONAL EQUITY FUNDS (Cost $57,981,175) | | | 66,764,339 |
| | | | |
| Bond Funds - 7.0% |
| | | Shares | Value ($) |
| Fidelity Inflation-Protected Bond Index Fund (a) | | 201,526 | 1,835,902 |
| Fidelity International Bond Index Fund (a) | | 3,445 | 31,486 |
| Fidelity Long-Term Treasury Bond Index Fund (a) | | 909,553 | 8,631,660 |
| VIP High Income Portfolio Initial Class (a) | | 89,676 | 425,063 |
| TOTAL BOND FUNDS (Cost $12,341,404) | | | 10,924,111 |
| | | | |
| TOTAL INVESTMENT IN SECURITIES - 100.0% (Cost $127,732,139) | 157,023,572 |
NET OTHER ASSETS (LIABILITIES) - 0.0% | (18,939) |
| NET ASSETS - 100.0% | 157,004,633 |
| | |
Legend
Affiliated Underlying Funds
Fiscal year to date information regarding the Fund's investments in affiliated Underlying Funds is presented below. Exchanges between classes of the same affiliated Underlying Funds may occur. If an Underlying Funds changes its name, the name presented below is the name in effect at period end.
| Affiliate | Value, beginning of period ($) | Purchases ($) | Sales Proceeds ($) | Dividend Income ($) | Realized Gain (loss) ($) | Change in Unrealized appreciation (depreciation) ($) | Value, end of period ($) |
| Fidelity Inflation-Protected Bond Index Fund | 2,917,638 | 451,065 | 1,547,077 | 3,341 | (171,844) | 186,120 | 1,835,902 |
| Fidelity International Bond Index Fund | 748,858 | 104,860 | 820,272 | 4,947 | (21,252) | 19,292 | 31,486 |
| Fidelity Long-Term Treasury Bond Index Fund | 8,334,937 | 3,163,339 | 2,313,599 | 151,618 | (151,132) | (401,885) | 8,631,660 |
| VIP Contrafund Portfolio Initial Class | 11,607,631 | 1,558,654 | 2,114,213 | 46,145 | 135,015 | 2,697,050 | 13,884,137 |
| VIP Emerging Markets Portfolio Initial Class | 17,693,952 | 4,378,892 | 1,933,850 | 15,468 | 48,377 | 1,804,716 | 21,992,087 |
| VIP Equity-Income Portfolio Initial Class | 9,412,299 | 2,018,065 | 979,886 | 53,197 | 23,095 | 852,332 | 11,325,905 |
| VIP Government Money Market Portfolio Initial Class 5.1% | - | 302,237 | 302,237 | 1,296 | - | - | - |
| VIP Growth & Income Portfolio Initial Class | 12,938,462 | 2,186,735 | 1,358,896 | 86,299 | 19,014 | 1,798,736 | 15,584,051 |
| VIP Growth Portfolio Initial Class | 19,223,689 | 2,962,561 | 3,287,859 | 283,055 | 167,010 | 4,023,475 | 23,088,876 |
| VIP High Income Portfolio Initial Class | 368,791 | 72,849 | 28,397 | 160 | 51 | 11,769 | 425,063 |
| VIP Investment Grade Bond II Portfolio - Initial Class | 2,521,673 | 109,009 | 2,600,297 | 504 | (24,139) | (6,246) | - |
| VIP Mid Cap Portfolio Initial Class | 2,946,366 | 689,091 | 310,249 | 55,325 | 7,761 | 241,300 | 3,574,269 |
| VIP Overseas Portfolio Initial Class | 37,794,234 | 7,551,654 | 3,454,120 | 145,928 | 74,635 | 2,805,849 | 44,772,252 |
| VIP Value Portfolio Initial Class | 6,565,327 | 1,815,942 | 582,508 | 143,725 | 8,204 | 125,560 | 7,932,525 |
| VIP Value Strategies Portfolio Initial Class | 3,249,042 | 952,005 | 312,737 | 46,210 | 6,797 | 50,252 | 3,945,359 |
| | 136,322,899 | 28,316,958 | 21,946,197 | 1,037,218 | 121,592 | 14,208,320 | 157,023,572 |
Amounts in the dividend income column in the above table include any capital gain distributions from underlying funds, which are presented in the corresponding line item in the Statement of Operations, if applicable.
Amounts included in the purchases and sales proceeds columns may include in-kind transactions, if applicable.
Investment Valuation
The following is a summary of the inputs used, as of June 30, 2024, involving the Fund's assets and liabilities carried at fair value. The inputs or methodology used for valuing securities may not be an indication of the risk associated with investing in those securities. For more information on valuation inputs, and their aggregation into the levels used below, please refer to the Investment Valuation section in the accompanying Notes to Financial Statements.
| Valuation Inputs at Reporting Date: |
| Description | Total ($) | Level 1 ($) | Level 2 ($) | Level 3 ($) |
Investments in Securities: | | | | |
|
| Domestic Equity Funds | 79,335,122 | 79,335,122 | - | - |
|
| International Equity Funds | 66,764,339 | 66,764,339 | - | - |
|
| Bond Funds | 10,924,111 | 10,924,111 | - | - |
| Total Investments in Securities: | 157,023,572 | 157,023,572 | - | - |
VIP Freedom 2050 Portfolio℠
Financial Statements (Unaudited)
| Statement of Assets and Liabilities |
| | | | June 30, 2024 (Unaudited) |
| | | | | |
| Assets | | | | |
| Investment in securities, at value - See accompanying schedule: | | | | |
Affiliated issuers (cost $127,732,139) | $ | 157,023,572 | | |
| | | | | |
| | | | | |
| Total Investment in Securities (cost $127,732,139) | | | $ | 157,023,572 |
| Cash | | | | 616 |
| Receivable for investments sold | | | | 1,379,759 |
| Receivable for fund shares sold | | | | 153,697 |
Total assets | | | | 158,557,644 |
| Liabilities | | | | |
| Payable for investments purchased | $ | 1,340,271 | | |
| Payable for fund shares redeemed | | 193,218 | | |
| Distribution and service plan fees payable | | 19,522 | | |
| Total liabilities | | | | 1,553,011 |
| Net Assets | | | $ | 157,004,633 |
| Net Assets consist of: | | | | |
| Paid in capital | | | $ | 129,816,694 |
| Total accumulated earnings (loss) | | | | 27,187,939 |
| Net Assets | | | $ | 157,004,633 |
| | | | | |
| Net Asset Value and Maximum Offering Price | | | | |
| Initial Class : | | | | |
Net Asset Value, offering price and redemption price per share ($31,482,725 ÷ 1,265,422 shares) | | | $ | 24.88 |
| Service Class : | | | | |
Net Asset Value, offering price and redemption price per share ($52,473,540 ÷ 2,117,553 shares) | | | $ | 24.78 |
| Service Class 2 : | | | | |
Net Asset Value, offering price and redemption price per share ($73,048,368 ÷ 2,965,064 shares) | | | $ | 24.64 |
| Statement of Operations |
| | | | Six months ended June 30, 2024 (Unaudited) |
| Investment Income | | | | |
| Dividends: | | | | |
| Affiliated issuers | | | $ | 273,008 |
| Expenses | | | | |
| Distribution and service plan fees | $ | 110,696 | | |
| Independent trustees' fees and expenses | | 191 | | |
| Total expenses | | | | 110,887 |
| Net Investment income (loss) | | | | 162,121 |
| Realized and Unrealized Gain (Loss) | | | | |
| Net realized gain (loss) on: | | | | |
| Investment Securities: | | | | |
| Affiliated issuers | | 121,592 | | |
| Capital gain distributions from underlying funds: | | | | |
| Affiliated issuers | | 764,210 | | |
| Total net realized gain (loss) | | | | 885,802 |
| Change in net unrealized appreciation (depreciation) on: | | | | |
| Investment Securities: | | | | |
| Affiliated issuers | | 14,208,320 | | |
| Total change in net unrealized appreciation (depreciation) | | | | 14,208,320 |
| Net gain (loss) | | | | 15,094,122 |
| Net increase (decrease) in net assets resulting from operations | | | $ | 15,256,243 |
| Statement of Changes in Net Assets |
| |
| | Six months ended June 30, 2024 (Unaudited) | | Year ended December 31, 2023 |
| Increase (Decrease) in Net Assets | | | | |
| Operations | | | | |
| Net investment income (loss) | $ | 162,121 | $ | 1,610,051 |
| Net realized gain (loss) | | 885,802 | | 2,210,842 |
| Change in net unrealized appreciation (depreciation) | | 14,208,320 | | 16,693,640 |
| Net increase (decrease) in net assets resulting from operations | | 15,256,243 | | 20,514,533 |
| Distributions to shareholders | | (2,373,866) | | (3,285,601) |
| | | | | |
| Share transactions - net increase (decrease) | | 7,815,444 | | 23,658,219 |
| Total increase (decrease) in net assets | | 20,697,821 | | 40,887,151 |
| | | | | |
| Net Assets | | | | |
| Beginning of period | | 136,306,812 | | 95,419,661 |
| End of period | $ | 157,004,633 | $ | 136,306,812 |
| | | | | |
| | | | | |
Financial Highlights
VIP Freedom 2050 Portfolio℠ Initial Class |
| |
| | Six months ended (Unaudited) June 30, 2024 | | Years ended December 31, 2023 | | 2022 | | 2021 | | 2020 | | 2019 |
Selected Per-Share Data | | | | | | | | | | | | |
| Net asset value, beginning of period | $ | 22.77 | $ | 19.64 | $ | 26.36 | $ | 23.45 | $ | 20.68 | $ | 16.88 |
| Income from Investment Operations | | | | | | | | | | | | |
Net investment income (loss) A,B | | .04 | | .33 | | .31 | | .38 | | .22 | | .37 |
| Net realized and unrealized gain (loss) | | 2.47 | | 3.44 | | (4.83) | | 3.72 | | 3.63 | | 4.36 |
| Total from investment operations | | 2.51 | | 3.77 | | (4.52) | | 4.10 | | 3.85 | | 4.73 |
| Distributions from net investment income | | (.02) | | (.32) | | (.35) | | (.24) | | (.20) | | (.34) |
| Distributions from net realized gain | | (.38) | | (.32) | | (1.85) | | (.95) | | (.88) | | (.59) |
| Total distributions | | (.40) | | (.64) | | (2.20) | | (1.19) | | (1.08) | | (.93) |
| Net asset value, end of period | $ | 24.88 | $ | 22.77 | $ | 19.64 | $ | 26.36 | $ | 23.45 | $ | 20.68 |
Total Return C,D,E | | | | 19.45% | | (18.22)% | | 17.83% | | 19.28% | | 28.51% |
Ratios to Average Net Assets B,F,G | | | | | | | | | | | | |
Expenses before reductions H | | -% I | | -% | | -% | | -% | | -% | | -% |
Expenses net of fee waivers, if any H | | | | -% | | -% | | -% | | -% | | -% |
Expenses net of all reductions H | | -% I | | -% | | -% | | -% | | -% | | -% |
| Net investment income (loss) | | .37% I | | 1.57% | | 1.50% | | 1.48% | | 1.08% | | 1.96% |
| Supplemental Data | | | | | | | | | | | | |
| Net assets, end of period (000 omitted) | $ | 31,483 | $ | 27,394 | $ | 17,775 | $ | 19,102 | $ | 13,644 | $ | 10,317 |
Portfolio turnover rate J | | | | 24% | | 38% | | 30% | | 43% | | 30% |
ACalculated based on average shares outstanding during the period.
BNet investment income (loss) is affected by the timing of the declaration of dividends by any underlying mutual funds or exchange-traded funds (ETFs). Net investment income (loss) of any mutual funds or ETFs is not included in the Fund's net investment income (loss) ratio.
CTotal returns for periods of less than one year are not annualized.
DTotal returns do not reflect charges attributable to your insurance company's separate account. Inclusion of these charges would reduce the total returns shown.
ETotal returns would have been lower if certain expenses had not been reduced during the applicable periods shown.
FFees and expenses of any underlying mutual funds or exchange-traded funds (ETFs) are not included in the Fund's expense ratio. The Fund indirectly bears its proportionate share of these expenses.
GExpense ratios reflect operating expenses of the class. Expenses before reductions do not reflect amounts reimbursed, waived, or reduced through arrangements with the investment adviser, brokerage services, or other offset arrangements, if applicable, and do not represent the amount paid by the class during periods when reimbursements, waivers or reductions occur.
HAmount represents less than .005%.
IAnnualized.
JAmount does not include the portfolio activity of any underlying mutual funds or exchange-traded funds (ETFs).
VIP Freedom 2050 Portfolio℠ Service Class |
| |
| | Six months ended (Unaudited) June 30, 2024 | | Years ended December 31, 2023 | | 2022 | | 2021 | | 2020 | | 2019 |
Selected Per-Share Data | | | | | | | | | | | | |
| Net asset value, beginning of period | $ | 22.69 | $ | 19.58 | $ | 26.29 | $ | 23.39 | $ | 20.63 | $ | 16.84 |
| Income from Investment Operations | | | | | | | | | | | | |
Net investment income (loss) A,B | | .03 | | .31 | | .29 | | .35 | | .20 | | .35 |
| Net realized and unrealized gain (loss) | | 2.46 | | 3.42 | | (4.82) | | 3.72 | | 3.62 | | 4.35 |
| Total from investment operations | | 2.49 | | 3.73 | | (4.53) | | 4.07 | | 3.82 | | 4.70 |
| Distributions from net investment income | | (.02) | | (.30) | | (.33) | | (.22) | | (.18) | | (.32) |
| Distributions from net realized gain | | (.38) | | (.32) | | (1.85) | | (.95) | | (.88) | | (.59) |
| Total distributions | | (.40) | | (.62) | | (2.18) | | (1.17) | | (1.06) | | (.91) |
| Net asset value, end of period | $ | 24.78 | $ | 22.69 | $ | 19.58 | $ | 26.29 | $ | 23.39 | $ | 20.63 |
Total Return C,D,E | | | | 19.30% | | (18.31)% | | 17.73% | | 19.17% | | 28.39% |
Ratios to Average Net Assets B,F,G | | | | | | | | | | | | |
| Expenses before reductions | | .10% H | | .10% | | .10% | | .10% | | .10% | | .10% |
| Expenses net of fee waivers, if any | | | | .10% | | .10% | | .10% | | .10% | | .10% |
| Expenses net of all reductions | | .10% H | | .10% | | .10% | | .10% | | .10% | | .10% |
| Net investment income (loss) | | .27% H | | 1.47% | | 1.40% | | 1.38% | | .98% | | 1.86% |
| Supplemental Data | | | | | | | | | | | | |
| Net assets, end of period (000 omitted) | $ | 52,474 | $ | 44,557 | $ | 31,042 | $ | 30,244 | $ | 21,593 | $ | 14,242 |
Portfolio turnover rate I | | | | 24% | | 38% | | 30% | | 43% | | 30% |
ACalculated based on average shares outstanding during the period.
BNet investment income (loss) is affected by the timing of the declaration of dividends by any underlying mutual funds or exchange-traded funds (ETFs). Net investment income (loss) of any mutual funds or ETFs is not included in the Fund's net investment income (loss) ratio.
CTotal returns for periods of less than one year are not annualized.
DTotal returns do not reflect charges attributable to your insurance company's separate account. Inclusion of these charges would reduce the total returns shown.
ETotal returns would have been lower if certain expenses had not been reduced during the applicable periods shown.
FFees and expenses of any underlying mutual funds or exchange-traded funds (ETFs) are not included in the Fund's expense ratio. The Fund indirectly bears its proportionate share of these expenses.
GExpense ratios reflect operating expenses of the class. Expenses before reductions do not reflect amounts reimbursed, waived, or reduced through arrangements with the investment adviser, brokerage services, or other offset arrangements, if applicable, and do not represent the amount paid by the class during periods when reimbursements, waivers or reductions occur.
HAnnualized.
IAmount does not include the portfolio activity of any underlying mutual funds or exchange-traded funds (ETFs).
VIP Freedom 2050 Portfolio℠ Service Class 2 |
| |
| | Six months ended (Unaudited) June 30, 2024 | | Years ended December 31, 2023 | | 2022 | | 2021 | | 2020 | | 2019 |
Selected Per-Share Data | | | | | | | | | | | | |
| Net asset value, beginning of period | $ | 22.58 | $ | 19.48 | $ | 26.18 | $ | 23.31 | $ | 20.57 | $ | 16.80 |
| Income from Investment Operations | | | | | | | | | | | | |
Net investment income (loss) A,B | | .01 | | .28 | | .26 | | .31 | | .17 | | .32 |
| Net realized and unrealized gain (loss) | | 2.45 | | 3.41 | | (4.81) | | 3.69 | | 3.60 | | 4.34 |
| Total from investment operations | | 2.46 | | 3.69 | | (4.55) | | 4.00 | | 3.77 | | 4.66 |
| Distributions from net investment income | | (.02) | | (.27) | | (.30) | | (.18) | | (.15) | | (.30) |
| Distributions from net realized gain | | (.38) | | (.32) | | (1.85) | | (.95) | | (.88) | | (.59) |
| Total distributions | | (.40) | | (.59) | | (2.15) | | (1.13) | | (1.03) | | (.89) |
| Net asset value, end of period | $ | 24.64 | $ | 22.58 | $ | 19.48 | $ | 26.18 | $ | 23.31 | $ | 20.57 |
Total Return C,D,E | | | | 19.19% | | (18.47)% | | 17.51% | | 18.99% | | 28.22% |
Ratios to Average Net Assets B,F,G | | | | | | | | | | | | |
| Expenses before reductions | | .25% H | | .25% | | .25% | | .25% | | .25% | | .25% |
| Expenses net of fee waivers, if any | | | | .25% | | .25% | | .25% | | .25% | | .25% |
| Expenses net of all reductions | | .25% H | | .25% | | .25% | | .25% | | .25% | | .25% |
| Net investment income (loss) | | .12% H | | 1.32% | | 1.25% | | 1.23% | | .83% | | 1.71% |
| Supplemental Data | | | | | | | | | | | | |
| Net assets, end of period (000 omitted) | $ | 73,048 | $ | 64,355 | $ | 46,602 | $ | 47,661 | $ | 33,256 | $ | 20,551 |
Portfolio turnover rate I | | | | 24% | | 38% | | 30% | | 43% | | 30% |
ACalculated based on average shares outstanding during the period.
BNet investment income (loss) is affected by the timing of the declaration of dividends by any underlying mutual funds or exchange-traded funds (ETFs). Net investment income (loss) of any mutual funds or ETFs is not included in the Fund's net investment income (loss) ratio.
CTotal returns for periods of less than one year are not annualized.
DTotal returns do not reflect charges attributable to your insurance company's separate account. Inclusion of these charges would reduce the total returns shown.
ETotal returns would have been lower if certain expenses had not been reduced during the applicable periods shown.
FFees and expenses of any underlying mutual funds or exchange-traded funds (ETFs) are not included in the Fund's expense ratio. The Fund indirectly bears its proportionate share of these expenses.
GExpense ratios reflect operating expenses of the class. Expenses before reductions do not reflect amounts reimbursed, waived, or reduced through arrangements with the investment adviser, brokerage services, or other offset arrangements, if applicable, and do not represent the amount paid by the class during periods when reimbursements, waivers or reductions occur.
HAnnualized.
IAmount does not include the portfolio activity of any underlying mutual funds or exchange-traded funds (ETFs).
VIP Freedom 2055 Portfolio℠
Schedule of Investments June 30, 2024 (Unaudited)
Showing Percentage of Net Assets
| Domestic Equity Funds - 50.5% |
| | | Shares | Value ($) |
| VIP Contrafund Portfolio Initial Class (a) | | 27,665 | 1,676,224 |
| VIP Equity-Income Portfolio Initial Class (a) | | 50,605 | 1,367,360 |
| VIP Growth & Income Portfolio Initial Class (a) | | 61,305 | 1,881,440 |
| VIP Growth Portfolio Initial Class (a) | | 24,598 | 2,787,488 |
| VIP Mid Cap Portfolio Initial Class (a) | | 10,980 | 431,516 |
| VIP Value Portfolio Initial Class (a) | | 49,263 | 957,682 |
| VIP Value Strategies Portfolio Initial Class (a) | | 28,386 | 476,318 |
| TOTAL DOMESTIC EQUITY FUNDS (Cost $7,781,380) | | | 9,578,028 |
| | | | |
| International Equity Funds - 42.5% |
| | | Shares | Value ($) |
| VIP Emerging Markets Portfolio Initial Class (a) | | 228,688 | 2,655,072 |
| VIP Overseas Portfolio Initial Class (a) | | 194,715 | 5,405,290 |
| TOTAL INTERNATIONAL EQUITY FUNDS (Cost $7,313,883) | | | 8,060,362 |
| | | | |
| Bond Funds - 7.0% |
| | | Shares | Value ($) |
| Fidelity Inflation-Protected Bond Index Fund (a) | | 24,330 | 221,646 |
| Fidelity International Bond Index Fund (a) | | 416 | 3,801 |
| Fidelity Long-Term Treasury Bond Index Fund (a) | | 109,803 | 1,042,030 |
| VIP High Income Portfolio Initial Class (a) | | 10,826 | 51,317 |
| TOTAL BOND FUNDS (Cost $1,403,542) | | | 1,318,794 |
| | | | |
| TOTAL INVESTMENT IN SECURITIES - 100.0% (Cost $16,498,805) | 18,957,184 |
NET OTHER ASSETS (LIABILITIES) - 0.0% | (2,308) |
| NET ASSETS - 100.0% | 18,954,876 |
| | |
Legend
Affiliated Underlying Funds
Fiscal year to date information regarding the Fund's investments in affiliated Underlying Funds is presented below. Exchanges between classes of the same affiliated Underlying Funds may occur. If an Underlying Funds changes its name, the name presented below is the name in effect at period end.
| Affiliate | Value, beginning of period ($) | Purchases ($) | Sales Proceeds ($) | Dividend Income ($) | Realized Gain (loss) ($) | Change in Unrealized appreciation (depreciation) ($) | Value, end of period ($) |
| Fidelity Inflation-Protected Bond Index Fund | 296,475 | 96,094 | 172,922 | 357 | (17,283) | 19,282 | 221,646 |
| Fidelity International Bond Index Fund | 76,096 | 17,363 | 89,507 | 515 | (211) | 60 | 3,801 |
| Fidelity Long-Term Treasury Bond Index Fund | 846,916 | 526,227 | 275,856 | 16,634 | (12,897) | (42,360) | 1,042,030 |
| VIP Contrafund Portfolio Initial Class | 1,179,505 | 431,738 | 244,462 | 4,879 | 14,411 | 295,032 | 1,676,224 |
| VIP Emerging Markets Portfolio Initial Class | 1,797,982 | 910,617 | 263,624 | 1,610 | 11,525 | 198,572 | 2,655,072 |
| VIP Equity-Income Portfolio Initial Class | 956,429 | 452,546 | 136,983 | 5,536 | 2,865 | 92,503 | 1,367,360 |
| VIP Government Money Market Portfolio Initial Class 5.1% | - | 33,842 | 33,842 | 143 | - | - | - |
| VIP Growth & Income Portfolio Initial Class | 1,314,738 | 556,108 | 188,997 | 9,124 | 1,097 | 198,494 | 1,881,440 |
| VIP Growth Portfolio Initial Class | 1,953,406 | 756,418 | 382,077 | 29,926 | 13,091 | 446,650 | 2,787,488 |
| VIP High Income Portfolio Initial Class | 37,475 | 16,663 | 4,157 | 17 | 53 | 1,283 | 51,317 |
| VIP Investment Grade Bond II Portfolio - Initial Class | 256,242 | 23,846 | 277,023 | 53 | (2,014) | (1,051) | - |
| VIP Mid Cap Portfolio Initial Class | 299,393 | 143,948 | 38,699 | 5,759 | 235 | 26,639 | 431,516 |
| VIP Overseas Portfolio Initial Class | 3,840,476 | 1,738,843 | 487,216 | 15,187 | 31,051 | 282,136 | 5,405,290 |
| VIP Value Portfolio Initial Class | 667,133 | 354,346 | 77,873 | 14,958 | 752 | 13,324 | 957,682 |
| VIP Value Strategies Portfolio Initial Class | 330,150 | 181,403 | 40,991 | 4,809 | 639 | 5,117 | 476,318 |
| | 13,852,416 | 6,240,002 | 2,714,229 | 109,507 | 43,314 | 1,535,681 | 18,957,184 |
Amounts in the dividend income column in the above table include any capital gain distributions from underlying funds, which are presented in the corresponding line item in the Statement of Operations, if applicable.
Amounts included in the purchases and sales proceeds columns may include in-kind transactions, if applicable.
Investment Valuation
The following is a summary of the inputs used, as of June 30, 2024, involving the Fund's assets and liabilities carried at fair value. The inputs or methodology used for valuing securities may not be an indication of the risk associated with investing in those securities. For more information on valuation inputs, and their aggregation into the levels used below, please refer to the Investment Valuation section in the accompanying Notes to Financial Statements.
| Valuation Inputs at Reporting Date: |
| Description | Total ($) | Level 1 ($) | Level 2 ($) | Level 3 ($) |
Investments in Securities: | | | | |
|
| Domestic Equity Funds | 9,578,028 | 9,578,028 | - | - |
|
| International Equity Funds | 8,060,362 | 8,060,362 | - | - |
|
| Bond Funds | 1,318,794 | 1,318,794 | - | - |
| Total Investments in Securities: | 18,957,184 | 18,957,184 | - | - |
VIP Freedom 2055 Portfolio℠
Financial Statements (Unaudited)
| Statement of Assets and Liabilities |
| | | | June 30, 2024 (Unaudited) |
| | | | | |
| Assets | | | | |
| Investment in securities, at value - See accompanying schedule: | | | | |
Affiliated issuers (cost $16,498,805) | $ | 18,957,184 | | |
| | | | | |
| | | | | |
| Total Investment in Securities (cost $16,498,805) | | | $ | 18,957,184 |
| Cash | | | | 16 |
| Receivable for investments sold | | | | 159,732 |
| Receivable for fund shares sold | | | | 19,533 |
Total assets | | | | 19,136,465 |
| Liabilities | | | | |
| Payable for investments purchased | $ | 158,122 | | |
| Payable for fund shares redeemed | | 21,147 | | |
| Accrued management fee | | 45 | | |
| Distribution and service plan fees payable | | 2,275 | | |
| Total liabilities | | | | 181,589 |
| Net Assets | | | $ | 18,954,876 |
| Net Assets consist of: | | | | |
| Paid in capital | | | $ | 16,660,922 |
| Total accumulated earnings (loss) | | | | 2,293,954 |
| Net Assets | | | $ | 18,954,876 |
| | | | | |
| Net Asset Value and Maximum Offering Price | | | | |
| Initial Class : | | | | |
Net Asset Value, offering price and redemption price per share ($4,866,423 ÷ 348,709 shares) | | | $ | 13.96 |
| Service Class : | | | | |
Net Asset Value, offering price and redemption price per share ($5,232,174 ÷ 375,479 shares) | | | $ | 13.93 |
| Service Class 2 : | | | | |
Net Asset Value, offering price and redemption price per share ($8,856,279 ÷ 637,695 shares) | | | $ | 13.89 |
| Statement of Operations |
| | | | Six months ended June 30, 2024 (Unaudited) |
| Investment Income | | | | |
| Dividends: | | | | |
| Affiliated issuers | | | $ | 29,295 |
| Expenses | | | | |
| Distribution and service plan fees | $ | 12,432 | | |
| Independent trustees' fees and expenses | | 20 | | |
| Proxy | | 2,749 | | |
| Total expenses before reductions | | 15,201 | | |
| Expense reductions | | (2,508) | | |
| Total expenses after reductions | | | | 12,693 |
| Net Investment income (loss) | | | | 16,602 |
| Realized and Unrealized Gain (Loss) | | | | |
| Net realized gain (loss) on: | | | | |
| Investment Securities: | | | | |
| Affiliated issuers | | 43,314 | | |
| Capital gain distributions from underlying funds: | | | | |
| Affiliated issuers | | 80,212 | | |
| Total net realized gain (loss) | | | | 123,526 |
| Change in net unrealized appreciation (depreciation) on: | | | | |
| Investment Securities: | | | | |
| Affiliated issuers | | 1,535,681 | | |
| Total change in net unrealized appreciation (depreciation) | | | | 1,535,681 |
| Net gain (loss) | | | | 1,659,207 |
| Net increase (decrease) in net assets resulting from operations | | | $ | 1,675,809 |
| Statement of Changes in Net Assets |
| |
| | Six months ended June 30, 2024 (Unaudited) | | Year ended December 31, 2023 |
| Increase (Decrease) in Net Assets | | | | |
| Operations | | | | |
| Net investment income (loss) | $ | 16,602 | $ | 158,680 |
| Net realized gain (loss) | | 123,526 | | 251,529 |
| Change in net unrealized appreciation (depreciation) | | 1,535,681 | | 1,451,746 |
| Net increase (decrease) in net assets resulting from operations | | 1,675,809 | | 1,861,955 |
| Distributions to shareholders | | (213,973) | | (264,888) |
| | | | | |
| Share transactions - net increase (decrease) | | 3,642,361 | | 5,542,714 |
| Total increase (decrease) in net assets | | 5,104,197 | | 7,139,781 |
| | | | | |
| Net Assets | | | | |
| Beginning of period | | 13,850,679 | | 6,710,898 |
| End of period | $ | 18,954,876 | $ | 13,850,679 |
| | | | | |
| | | | | |
Financial Highlights
VIP Freedom 2055 Portfolio℠ Initial Class |
| |
| | Six months ended (Unaudited) June 30, 2024 | | Years ended December 31, 2023 | | 2022 | | 2021 | | 2020 | | 2019 A |
Selected Per-Share Data | | | | | | | | | | | | |
| Net asset value, beginning of period | $ | 12.74 | $ | 10.94 | $ | 14.28 | $ | 12.67 | $ | 10.98 | $ | 10.00 |
| Income from Investment Operations | | | | | | | | | | | | |
Net investment income (loss) B,C | | .02 | | .21 | | .18 | | .23 | | .12 | | .16 |
| Net realized and unrealized gain (loss) | | 1.39 | | 1.91 | | (2.69) | | 2.02 | | 1.99 | | 1.02 |
| Total from investment operations | | 1.41 | | 2.12 | | (2.51) | | 2.25 | | 2.11 | | 1.18 |
| Distributions from net investment income | | - | | (.17) | | (.16) | | (.17) | | (.10) | | (.15) |
| Distributions from net realized gain | | (.19) | | (.15) | | (.67) | | (.46) | | (.32) | | (.06) |
| Total distributions | | (.19) | | (.32) | | (.83) | | (.64) D | | (.42) | | (.20) D |
| Net asset value, end of period | $ | 13.96 | $ | 12.74 | $ | 10.94 | $ | 14.28 | $ | 12.67 | $ | 10.98 |
Total Return E,F,G | | | | 19.48% | | (18.26)% | | 17.79% | | 19.28% | | 11.85% |
Ratios to Average Net Assets C,H,I | | | | | | | | | | | | |
| Expenses before reductions | | .02% J,K | | -% L | | -% L | | -% L | | -% L | | -% J,L |
Expenses net of fee waivers, if any L | | | | -% | | -% | | -% | | -% | | -% J |
Expenses net of all reductions L | | -% J,K | | -% | | -% | | -% | | -% | | -% J |
| Net investment income (loss) | | .38% J,K | | 1.80% | | 1.57% | | 1.64% | | 1.09% | | 2.12% J |
| Supplemental Data | | | | | | | | | | | | |
| Net assets, end of period (000 omitted) | $ | 4,866 | $ | 2,508 | $ | 746 | $ | 501 | $ | 423 | $ | 366 |
Portfolio turnover rate M | | | | 30% | | 58% | | 35% | | 64% | | 24% J |
AFor the period April 11, 2019 (commencement of operations) through December 31, 2019.
BCalculated based on average shares outstanding during the period.
CNet investment income (loss) is affected by the timing of the declaration of dividends by any underlying mutual funds or exchange-traded funds (ETFs). Net investment income (loss) of any mutual funds or ETFs is not included in the Fund's net investment income (loss) ratio.
DTotal distributions per share do not sum due to rounding.
ETotal returns for periods of less than one year are not annualized.
FTotal returns do not reflect charges attributable to your insurance company's separate account. Inclusion of these charges would reduce the total returns shown.
GTotal returns would have been lower if certain expenses had not been reduced during the applicable periods shown.
HFees and expenses of any underlying mutual funds or exchange-traded funds (ETFs) are not included in the Fund's expense ratio. The Fund indirectly bears its proportionate share of these expenses.
IExpense ratios reflect operating expenses of the class. Expenses before reductions do not reflect amounts reimbursed, waived, or reduced through arrangements with the investment adviser, brokerage services, or other offset arrangements, if applicable, and do not represent the amount paid by the class during periods when reimbursements, waivers or reductions occur.
JAnnualized.
KProxy expenses are not annualized.
LAmount represents less than .005%.
MAmount does not include the portfolio activity of any underlying mutual funds or exchange-traded funds (ETFs).
VIP Freedom 2055 Portfolio℠ Service Class |
| |
| | Six months ended (Unaudited) June 30, 2024 | | Years ended December 31, 2023 | | 2022 | | 2021 | | 2020 | | 2019 A |
Selected Per-Share Data | | | | | | | | | | | | |
| Net asset value, beginning of period | $ | 12.73 | $ | 10.93 | $ | 14.27 | $ | 12.66 | $ | 10.98 | $ | 10.00 |
| Income from Investment Operations | | | | | | | | | | | | |
Net investment income (loss) B,C | | .02 | | .20 | | .17 | | .22 | | .11 | | .15 |
| Net realized and unrealized gain (loss) | | 1.37 | | 1.91 | | (2.69) | | 2.02 | | 1.99 | | 1.03 |
| Total from investment operations | | 1.39 | | 2.11 | | (2.52) | | 2.24 | | 2.10 | | 1.18 |
| Distributions from net investment income | | - | | (.16) | | (.14) | | (.16) | | (.09) | | (.14) |
| Distributions from net realized gain | | (.19) | | (.15) | | (.67) | | (.46) | | (.32) | | (.06) |
| Total distributions | | (.19) | | (.31) | | (.82) D | | (.63) D | | (.42) D | | (.20) |
| Net asset value, end of period | $ | 13.93 | $ | 12.73 | $ | 10.93 | $ | 14.27 | $ | 12.66 | $ | 10.98 |
Total Return E,F,G | | | | 19.40% | | (18.36)% | | 17.72% | | 19.11% | | 11.78% |
Ratios to Average Net Assets C,H,I | | | | | | | | | | | | |
| Expenses before reductions | | .12% J,K | | .10% | | .10% | | .10% | | .10% | | .10% J |
| Expenses net of fee waivers, if any | | | | .10% | | .10% | | .10% | | .10% | | .10% J |
| Expenses net of all reductions | | .09% J,K | | .10% | | .10% | | .10% | | .10% | | .10% J |
| Net investment income (loss) | | .28% J,K | | 1.70% | | 1.47% | | 1.54% | | .99% | | 2.02% J |
| Supplemental Data | | | | | | | | | | | | |
| Net assets, end of period (000 omitted) | $ | 5,232 | $ | 4,647 | $ | 2,306 | $ | 2,549 | $ | 814 | $ | 399 |
Portfolio turnover rate L | | | | 30% | | 58% | | 35% | | 64% | | 24% J |
AFor the period April 11, 2019 (commencement of operations) through December 31, 2019.
BCalculated based on average shares outstanding during the period.
CNet investment income (loss) is affected by the timing of the declaration of dividends by any underlying mutual funds or exchange-traded funds (ETFs). Net investment income (loss) of any mutual funds or ETFs is not included in the Fund's net investment income (loss) ratio.
DTotal distributions per share do not sum due to rounding.
ETotal returns for periods of less than one year are not annualized.
FTotal returns do not reflect charges attributable to your insurance company's separate account. Inclusion of these charges would reduce the total returns shown.
GTotal returns would have been lower if certain expenses had not been reduced during the applicable periods shown.
HFees and expenses of any underlying mutual funds or exchange-traded funds (ETFs) are not included in the Fund's expense ratio. The Fund indirectly bears its proportionate share of these expenses.
IExpense ratios reflect operating expenses of the class. Expenses before reductions do not reflect amounts reimbursed, waived, or reduced through arrangements with the investment adviser, brokerage services, or other offset arrangements, if applicable, and do not represent the amount paid by the class during periods when reimbursements, waivers or reductions occur.
JAnnualized.
KProxy expenses are not annualized.
LAmount does not include the portfolio activity of any underlying mutual funds or exchange-traded funds (ETFs).
VIP Freedom 2055 Portfolio℠ Service Class 2 |
| |
| | Six months ended (Unaudited) June 30, 2024 | | Years ended December 31, 2023 | | 2022 | | 2021 | | 2020 | | 2019 A |
Selected Per-Share Data | | | | | | | | | | | | |
| Net asset value, beginning of period | $ | 12.69 | $ | 10.91 | $ | 14.25 | $ | 12.65 | $ | 10.97 | $ | 10.00 |
| Income from Investment Operations | | | | | | | | | | | | |
Net investment income (loss) B,C | | .01 | | .18 | | .15 | | .20 | | .09 | | .14 |
| Net realized and unrealized gain (loss) | | 1.38 | | 1.89 | | (2.68) | | 2.01 | | 1.99 | | 1.02 |
| Total from investment operations | | 1.39 | | 2.07 | | (2.53) | | 2.21 | | 2.08 | | 1.16 |
| Distributions from net investment income | | - | | (.14) | | (.13) | | (.15) | | (.08) | | (.13) |
| Distributions from net realized gain | | (.19) | | (.15) | | (.67) | | (.46) | | (.32) | | (.06) |
| Total distributions | | (.19) | | (.29) | | (.81) D | | (.61) | | (.40) | | (.19) |
| Net asset value, end of period | $ | 13.89 | $ | 12.69 | $ | 10.91 | $ | 14.25 | $ | 12.65 | $ | 10.97 |
Total Return E,F,G | | | | 19.12% | | (18.46)% | | 17.52% | | 19.01% | | 11.60% |
Ratios to Average Net Assets C,H,I | | | | | | | | | | | | |
| Expenses before reductions | | .27% J,K | | .25% | | .25% | | .25% | | .25% | | .25% J |
| Expenses net of fee waivers, if any | | | | .25% | | .25% | | .25% | | .25% | | .25% J |
| Expenses net of all reductions | | .24% J,K | | .25% | | .25% | | .25% | | .25% | | .25% J |
| Net investment income (loss) | | .13% J,K | | 1.55% | | 1.32% | | 1.39% | | .84% | | 1.87% J |
| Supplemental Data | | | | | | | | | | | | |
| Net assets, end of period (000 omitted) | $ | 8,856 | $ | 6,696 | $ | 3,659 | $ | 2,663 | $ | 1,180 | $ | 590 |
Portfolio turnover rate L | | | | 30% | | 58% | | 35% | | 64% | | 24% J |
AFor the period April 11, 2019 (commencement of operations) through December 31, 2019.
BCalculated based on average shares outstanding during the period.
CNet investment income (loss) is affected by the timing of the declaration of dividends by any underlying mutual funds or exchange-traded funds (ETFs). Net investment income (loss) of any mutual funds or ETFs is not included in the Fund's net investment income (loss) ratio.
DTotal distributions per share do not sum due to rounding.
ETotal returns for periods of less than one year are not annualized.
FTotal returns do not reflect charges attributable to your insurance company's separate account. Inclusion of these charges would reduce the total returns shown.
GTotal returns would have been lower if certain expenses had not been reduced during the applicable periods shown.
HFees and expenses of any underlying mutual funds or exchange-traded funds (ETFs) are not included in the Fund's expense ratio. The Fund indirectly bears its proportionate share of these expenses.
IExpense ratios reflect operating expenses of the class. Expenses before reductions do not reflect amounts reimbursed, waived, or reduced through arrangements with the investment adviser, brokerage services, or other offset arrangements, if applicable, and do not represent the amount paid by the class during periods when reimbursements, waivers or reductions occur.
JAnnualized.
KProxy expenses are not annualized.
LAmount does not include the portfolio activity of any underlying mutual funds or exchange-traded funds (ETFs).
VIP Freedom 2060 Portfolio℠
Schedule of Investments June 30, 2024 (Unaudited)
Showing Percentage of Net Assets
| Domestic Equity Funds - 50.5% |
| | | Shares | Value ($) |
| VIP Contrafund Portfolio Initial Class (a) | | 33,178 | 2,010,235 |
| VIP Equity-Income Portfolio Initial Class (a) | | 60,688 | 1,639,803 |
| VIP Growth & Income Portfolio Initial Class (a) | | 73,519 | 2,256,308 |
| VIP Growth Portfolio Initial Class (a) | | 29,500 | 3,342,919 |
| VIP Mid Cap Portfolio Initial Class (a) | | 13,168 | 517,494 |
| VIP Value Portfolio Initial Class (a) | | 59,079 | 1,148,495 |
| VIP Value Strategies Portfolio Initial Class (a) | | 34,042 | 571,219 |
| TOTAL DOMESTIC EQUITY FUNDS (Cost $8,934,619) | | | 11,486,473 |
| | | | |
| International Equity Funds - 42.5% |
| | | Shares | Value ($) |
| VIP Emerging Markets Portfolio Initial Class (a) | | 274,251 | 3,184,053 |
| VIP Overseas Portfolio Initial Class (a) | | 233,513 | 6,482,306 |
| TOTAL INTERNATIONAL EQUITY FUNDS (Cost $8,583,929) | | | 9,666,359 |
| | | | |
| Bond Funds - 7.0% |
| | | Shares | Value ($) |
| Fidelity Inflation-Protected Bond Index Fund (a) | | 29,178 | 265,810 |
| Fidelity International Bond Index Fund (a) | | 499 | 4,559 |
| Fidelity Long-Term Treasury Bond Index Fund (a) | | 131,688 | 1,249,716 |
| VIP High Income Portfolio Initial Class (a) | | 12,984 | 61,542 |
| TOTAL BOND FUNDS (Cost $1,701,265) | | | 1,581,627 |
| | | | |
| TOTAL INVESTMENT IN SECURITIES - 100.0% (Cost $19,219,813) | 22,734,459 |
NET OTHER ASSETS (LIABILITIES) - 0.0% | (2,661) |
| NET ASSETS - 100.0% | 22,731,798 |
| | |
Legend
Affiliated Underlying Funds
Fiscal year to date information regarding the Fund's investments in affiliated Underlying Funds is presented below. Exchanges between classes of the same affiliated Underlying Funds may occur. If an Underlying Funds changes its name, the name presented below is the name in effect at period end.
| Affiliate | Value, beginning of period ($) | Purchases ($) | Sales Proceeds ($) | Dividend Income ($) | Realized Gain (loss) ($) | Change in Unrealized appreciation (depreciation) ($) | Value, end of period ($) |
| Fidelity Inflation-Protected Bond Index Fund | 444,604 | 104,113 | 284,964 | 466 | (23,592) | 25,649 | 265,810 |
| Fidelity International Bond Index Fund | 114,115 | 20,184 | 129,403 | 678 | (1,185) | 848 | 4,559 |
| Fidelity Long-Term Treasury Bond Index Fund | 1,270,104 | 576,655 | 519,837 | 21,099 | (61,961) | (15,245) | 1,249,716 |
| VIP Contrafund Portfolio Initial Class | 1,768,828 | 433,422 | 589,511 | 6,264 | 18,323 | 379,173 | 2,010,235 |
| VIP Emerging Markets Portfolio Initial Class | 2,696,297 | 951,812 | 702,984 | 2,122 | (37,725) | 276,653 | 3,184,053 |
| VIP Equity-Income Portfolio Initial Class | 1,434,294 | 432,314 | 346,177 | 7,295 | (118) | 119,490 | 1,639,803 |
| VIP Government Money Market Portfolio Initial Class 5.1% | - | 41,193 | 41,193 | 176 | - | - | - |
| VIP Growth & Income Portfolio Initial Class | 1,971,628 | 524,141 | 490,078 | 11,715 | 6,229 | 244,388 | 2,256,308 |
| VIP Growth Portfolio Initial Class | 2,929,397 | 722,808 | 900,774 | 38,424 | 23,341 | 568,147 | 3,342,919 |
| VIP High Income Portfolio Initial Class | 56,198 | 17,428 | 13,717 | 22 | (223) | 1,856 | 61,542 |
| VIP Investment Grade Bond II Portfolio - Initial Class | 384,265 | 29,565 | 409,738 | 68 | (3,131) | (961) | - |
| VIP Mid Cap Portfolio Initial Class | 448,980 | 154,772 | 120,068 | 7,595 | (2,506) | 36,316 | 517,494 |
| VIP Overseas Portfolio Initial Class | 5,759,288 | 1,729,854 | 1,403,213 | 20,020 | 6,652 | 389,725 | 6,482,306 |
| VIP Value Portfolio Initial Class | 1,000,456 | 368,585 | 236,188 | 19,708 | 1,871 | 13,771 | 1,148,495 |
| VIP Value Strategies Portfolio Initial Class | 495,105 | 198,322 | 128,227 | 6,333 | 1,246 | 4,773 | 571,219 |
| | 20,773,559 | 6,305,168 | 6,316,072 | 141,985 | (72,779) | 2,044,583 | 22,734,459 |
Amounts in the dividend income column in the above table include any capital gain distributions from underlying funds, which are presented in the corresponding line item in the Statement of Operations, if applicable.
Amounts included in the purchases and sales proceeds columns may include in-kind transactions, if applicable.
Investment Valuation
The following is a summary of the inputs used, as of June 30, 2024, involving the Fund's assets and liabilities carried at fair value. The inputs or methodology used for valuing securities may not be an indication of the risk associated with investing in those securities. For more information on valuation inputs, and their aggregation into the levels used below, please refer to the Investment Valuation section in the accompanying Notes to Financial Statements.
| Valuation Inputs at Reporting Date: |
| Description | Total ($) | Level 1 ($) | Level 2 ($) | Level 3 ($) |
Investments in Securities: | | | | |
|
| Domestic Equity Funds | 11,486,473 | 11,486,473 | - | - |
|
| International Equity Funds | 9,666,359 | 9,666,359 | - | - |
|
| Bond Funds | 1,581,627 | 1,581,627 | - | - |
| Total Investments in Securities: | 22,734,459 | 22,734,459 | - | - |
VIP Freedom 2060 Portfolio℠
Financial Statements (Unaudited)
| Statement of Assets and Liabilities |
| | | | June 30, 2024 (Unaudited) |
| | | | | |
| Assets | | | | |
| Investment in securities, at value - See accompanying schedule: | | | | |
Affiliated issuers (cost $19,219,813) | $ | 22,734,459 | | |
| | | | | |
| | | | | |
| Total Investment in Securities (cost $19,219,813) | | | $ | 22,734,459 |
| Receivable for investments sold | | | | 170,816 |
| Receivable for fund shares sold | | | | 47,651 |
Total assets | | | | 22,952,926 |
| Liabilities | | | | |
| Payable for investments purchased | $ | 217,795 | | |
| Payable for fund shares redeemed | | 673 | | |
| Accrued management fee | | 59 | | |
| Distribution and service plan fees payable | | 2,601 | | |
| Total liabilities | | | | 221,128 |
| Net Assets | | | $ | 22,731,798 |
| Net Assets consist of: | | | | |
| Paid in capital | | | $ | 19,535,066 |
| Total accumulated earnings (loss) | | | | 3,196,732 |
| Net Assets | | | $ | 22,731,798 |
| | | | | |
| Net Asset Value and Maximum Offering Price | | | | |
| Initial Class : | | | | |
Net Asset Value, offering price and redemption price per share ($2,877,987 ÷ 209,153 shares) | | | $ | 13.76 |
| Service Class : | | | | |
Net Asset Value, offering price and redemption price per share ($11,987,149 ÷ 872,591 shares) | | | $ | 13.74 |
| Service Class 2 : | | | | |
Net Asset Value, offering price and redemption price per share ($7,866,662 ÷ 574,551 shares) | | | $ | 13.69 |
| Statement of Operations |
| | | | Six months ended June 30, 2024 (Unaudited) |
| Investment Income | | | | |
| Dividends: | | | | |
| Affiliated issuers | | | $ | 37,749 |
| Expenses | | | | |
| Distribution and service plan fees | $ | 14,286 | | |
| Independent trustees' fees and expenses | | 27 | | |
| Proxy | | 2,719 | | |
| Total expenses before reductions | | 17,032 | | |
| Expense reductions | | (2,412) | | |
| Total expenses after reductions | | | | 14,620 |
| Net Investment income (loss) | | | | 23,129 |
| Realized and Unrealized Gain (Loss) | | | | |
| Net realized gain (loss) on: | | | | |
| Investment Securities: | | | | |
| Affiliated issuers | | (72,779) | | |
| Capital gain distributions from underlying funds: | | | | |
| Affiliated issuers | | 104,236 | | |
| Total net realized gain (loss) | | | | 31,457 |
| Change in net unrealized appreciation (depreciation) on: | | | | |
| Investment Securities: | | | | |
| Affiliated issuers | | 2,044,583 | | |
| Total change in net unrealized appreciation (depreciation) | | | | 2,044,583 |
| Net gain (loss) | | | | 2,076,040 |
| Net increase (decrease) in net assets resulting from operations | | | $ | 2,099,169 |
| Statement of Changes in Net Assets |
| |
| | Six months ended June 30, 2024 (Unaudited) | | Year ended December 31, 2023 |
| Increase (Decrease) in Net Assets | | | | |
| Operations | | | | |
| Net investment income (loss) | $ | 23,129 | $ | 246,362 |
| Net realized gain (loss) | | 31,457 | | 363,812 |
| Change in net unrealized appreciation (depreciation) | | 2,044,583 | | 2,240,585 |
| Net increase (decrease) in net assets resulting from operations | | 2,099,169 | | 2,850,759 |
| Distributions to shareholders | | (323,407) | | (422,332) |
| | | | | |
| Share transactions - net increase (decrease) | | 184,753 | | 6,446,479 |
| Total increase (decrease) in net assets | | 1,960,515 | | 8,874,906 |
| | | | | |
| Net Assets | | | | |
| Beginning of period | | 20,771,283 | | 11,896,377 |
| End of period | $ | 22,731,798 | $ | 20,771,283 |
| | | | | |
| | | | | |
Financial Highlights
VIP Freedom 2060 Portfolio℠ Initial Class |
| |
| | Six months ended (Unaudited) June 30, 2024 | | Years ended December 31, 2023 | | 2022 | | 2021 | | 2020 | | 2019 A |
Selected Per-Share Data | | | | | | | | | | | | |
| Net asset value, beginning of period | $ | 12.59 | $ | 10.82 | $ | 14.18 | $ | 12.65 | $ | 10.99 | $ | 10.00 |
| Income from Investment Operations | | | | | | | | | | | | |
Net investment income (loss) B,C | | .02 | | .20 | | .19 | | .21 | | .13 | | .16 |
| Net realized and unrealized gain (loss) | | 1.37 | | 1.88 | | (2.67) | | 2.04 | | 1.99 | | 1.02 |
| Total from investment operations | | 1.39 | | 2.08 | | (2.48) | | 2.25 | | 2.12 | | 1.18 |
| Distributions from net investment income | | - | | (.17) | | (.16) | | (.18) | | (.11) | | (.15) |
| Distributions from net realized gain | | (.22) | | (.15) | | (.72) | | (.54) | | (.35) | | (.05) |
| Total distributions | | (.22) | | (.31) | | (.88) | | (.72) | | (.46) | | (.19) D |
| Net asset value, end of period | $ | 13.76 | $ | 12.59 | $ | 10.82 | $ | 14.18 | $ | 12.65 | $ | 10.99 |
Total Return E,F,G | | | | 19.39% | | (18.19)% | | 17.79% | | 19.30% | | 11.86% |
Ratios to Average Net Assets C,H,I | | | | | | | | | | | | |
| Expenses before reductions | | .01% J,K | | -% L | | -% L | | -% L | | -% L | | -% J,L |
Expenses net of fee waivers, if any L | | | | -% | | -% | | -% | | -% | | -% J |
Expenses net of all reductions L | | -% J,K | | -% | | -% | | -% | | -% | | -% J |
| Net investment income (loss) | | .38% J,K | | 1.70% | | 1.69% | | 1.51% | | 1.18% | | 2.18% J |
| Supplemental Data | | | | | | | | | | | | |
| Net assets, end of period (000 omitted) | $ | 2,878 | $ | 1,690 | $ | 471 | $ | 523 | $ | 422 | $ | 366 |
Portfolio turnover rate M | | | | 25% | | 45% | | 60% | | 68% | | 23% J |
AFor the period April 11, 2019 (commencement of operations) through December 31, 2019.
BCalculated based on average shares outstanding during the period.
CNet investment income (loss) is affected by the timing of the declaration of dividends by any underlying mutual funds or exchange-traded funds (ETFs). Net investment income (loss) of any mutual funds or ETFs is not included in the Fund's net investment income (loss) ratio.
DTotal distributions per share do not sum due to rounding.
ETotal returns for periods of less than one year are not annualized.
FTotal returns do not reflect charges attributable to your insurance company's separate account. Inclusion of these charges would reduce the total returns shown.
GTotal returns would have been lower if certain expenses had not been reduced during the applicable periods shown.
HFees and expenses of any underlying mutual funds or exchange-traded funds (ETFs) are not included in the Fund's expense ratio. The Fund indirectly bears its proportionate share of these expenses.
IExpense ratios reflect operating expenses of the class. Expenses before reductions do not reflect amounts reimbursed, waived, or reduced through arrangements with the investment adviser, brokerage services, or other offset arrangements, if applicable, and do not represent the amount paid by the class during periods when reimbursements, waivers or reductions occur.
JAnnualized.
KProxy expenses are not annualized.
LAmount represents less than .005%.
MAmount does not include the portfolio activity of any underlying mutual funds or exchange-traded funds (ETFs).
VIP Freedom 2060 Portfolio℠ Service Class |
| |
| | Six months ended (Unaudited) June 30, 2024 | | Years ended December 31, 2023 | | 2022 | | 2021 | | 2020 | | 2019 A |
Selected Per-Share Data | | | | | | | | | | | | |
| Net asset value, beginning of period | $ | 12.58 | $ | 10.81 | $ | 14.17 | $ | 12.65 | $ | 10.99 | $ | 10.00 |
| Income from Investment Operations | | | | | | | | | | | | |
Net investment income (loss) B,C | | .02 | | .19 | | .18 | | .20 | | .12 | | .15 |
| Net realized and unrealized gain (loss) | | 1.36 | | 1.88 | | (2.67) | | 2.03 | | 1.99 | | 1.03 |
| Total from investment operations | | 1.38 | | 2.07 | | (2.49) | | 2.23 | | 2.11 | | 1.18 |
| Distributions from net investment income | | - | | (.16) | | (.15) | | (.17) | | (.10) | | (.14) |
| Distributions from net realized gain | | (.22) | | (.15) | | (.72) | | (.54) | | (.35) | | (.05) |
| Total distributions | | (.22) | | (.30) D | | (.87) | | (.71) | | (.45) | | (.19) |
| Net asset value, end of period | $ | 13.74 | $ | 12.58 | $ | 10.81 | $ | 14.17 | $ | 12.65 | $ | 10.99 |
Total Return E,F,G | | | | 19.30% | | (18.27)% | | 17.62% | | 19.22% | | 11.80% |
Ratios to Average Net Assets C,H,I | | | | | | | | | | | | |
| Expenses before reductions | | .11% J,K | | .10% | | .10% | | .10% | | .10% | | .10% J |
| Expenses net of fee waivers, if any | | | | .10% | | .10% | | .10% | | .10% | | .10% J |
| Expenses net of all reductions | | .09% J,K | | .10% | | .10% | | .10% | | .10% | | .10% J |
| Net investment income (loss) | | .28% J,K | | 1.60% | | 1.59% | | 1.41% | | 1.08% | | 2.08% J |
| Supplemental Data | | | | | | | | | | | | |
| Net assets, end of period (000 omitted) | $ | 11,987 | $ | 13,329 | $ | 8,331 | $ | 6,124 | $ | 3,530 | $ | 445 |
Portfolio turnover rate L | | | | 25% | | 45% | | 60% | | 68% | | 23% J |
AFor the period April 11, 2019 (commencement of operations) through December 31, 2019.
BCalculated based on average shares outstanding during the period.
CNet investment income (loss) is affected by the timing of the declaration of dividends by any underlying mutual funds or exchange-traded funds (ETFs). Net investment income (loss) of any mutual funds or ETFs is not included in the Fund's net investment income (loss) ratio.
DTotal distributions per share do not sum due to rounding.
ETotal returns for periods of less than one year are not annualized.
FTotal returns do not reflect charges attributable to your insurance company's separate account. Inclusion of these charges would reduce the total returns shown.
GTotal returns would have been lower if certain expenses had not been reduced during the applicable periods shown.
HFees and expenses of any underlying mutual funds or exchange-traded funds (ETFs) are not included in the Fund's expense ratio. The Fund indirectly bears its proportionate share of these expenses.
IExpense ratios reflect operating expenses of the class. Expenses before reductions do not reflect amounts reimbursed, waived, or reduced through arrangements with the investment adviser, brokerage services, or other offset arrangements, if applicable, and do not represent the amount paid by the class during periods when reimbursements, waivers or reductions occur.
JAnnualized.
KProxy expenses are not annualized.
LAmount does not include the portfolio activity of any underlying mutual funds or exchange-traded funds (ETFs).
VIP Freedom 2060 Portfolio℠ Service Class 2 |
| |
| | Six months ended (Unaudited) June 30, 2024 | | Years ended December 31, 2023 | | 2022 | | 2021 | | 2020 | | 2019 A |
Selected Per-Share Data | | | | | | | | | | | | |
| Net asset value, beginning of period | $ | 12.55 | $ | 10.79 | $ | 14.15 | $ | 12.63 | $ | 10.98 | $ | 10.00 |
| Income from Investment Operations | | | | | | | | | | | | |
Net investment income (loss) B,C | | .01 | | .17 | | .16 | | .18 | | .10 | | .14 |
| Net realized and unrealized gain (loss) | | 1.35 | | 1.88 | | (2.66) | | 2.03 | | 1.99 | | 1.02 |
| Total from investment operations | | 1.36 | | 2.05 | | (2.50) | | 2.21 | | 2.09 | | 1.16 |
| Distributions from net investment income | | - | | (.14) | | (.14) | | (.15) | | (.09) | | (.13) |
| Distributions from net realized gain | | (.22) | | (.15) | | (.72) | | (.54) | | (.35) | | (.05) |
| Total distributions | | (.22) | | (.29) | | (.86) | | (.69) | | (.44) | | (.18) |
| Net asset value, end of period | $ | 13.69 | $ | 12.55 | $ | 10.79 | $ | 14.15 | $ | 12.63 | $ | 10.98 |
Total Return D,E,F | | | | 19.12% | | (18.38)% | | 17.52% | | 19.04% | | 11.61% |
Ratios to Average Net Assets C,G,H | | | | | | | | | | | | |
| Expenses before reductions | | .26% I,J | | .25% | | .25% | | .25% | | .25% | | .25% I |
| Expenses net of fee waivers, if any | | | | .25% | | .25% | | .25% | | .25% | | .25% I |
| Expenses net of all reductions | | .24% I,J | | .25% | | .25% | | .25% | | .25% | | .25% I |
| Net investment income (loss) | | .13% I,J | | 1.45% | | 1.44% | | 1.26% | | .93% | | 1.93% I |
| Supplemental Data | | | | | | | | | | | | |
| Net assets, end of period (000 omitted) | $ | 7,867 | $ | 5,752 | $ | 3,094 | $ | 2,254 | $ | 1,161 | $ | 475 |
Portfolio turnover rate K | | | | 25% | | 45% | | 60% | | 68% | | 23% I |
AFor the period April 11, 2019 (commencement of operations) through December 31, 2019.
BCalculated based on average shares outstanding during the period.
CNet investment income (loss) is affected by the timing of the declaration of dividends by any underlying mutual funds or exchange-traded funds (ETFs). Net investment income (loss) of any mutual funds or ETFs is not included in the Fund's net investment income (loss) ratio.
DTotal returns for periods of less than one year are not annualized.
ETotal returns do not reflect charges attributable to your insurance company's separate account. Inclusion of these charges would reduce the total returns shown.
FTotal returns would have been lower if certain expenses had not been reduced during the applicable periods shown.
GFees and expenses of any underlying mutual funds or exchange-traded funds (ETFs) are not included in the Fund's expense ratio. The Fund indirectly bears its proportionate share of these expenses.
HExpense ratios reflect operating expenses of the class. Expenses before reductions do not reflect amounts reimbursed, waived, or reduced through arrangements with the investment adviser, brokerage services, or other offset arrangements, if applicable, and do not represent the amount paid by the class during periods when reimbursements, waivers or reductions occur.
IAnnualized.
JProxy expenses are not annualized.
KAmount does not include the portfolio activity of any underlying mutual funds or exchange-traded funds (ETFs).
VIP Freedom 2065 Portfolio℠
Schedule of Investments June 30, 2024 (Unaudited)
Showing Percentage of Net Assets
| Domestic Equity Funds - 50.5% |
| | | Shares | Value ($) |
| VIP Contrafund Portfolio Initial Class (a) | | 9,179 | 556,159 |
| VIP Equity-Income Portfolio Initial Class (a) | | 16,789 | 453,643 |
| VIP Growth & Income Portfolio Initial Class (a) | | 20,339 | 624,195 |
| VIP Growth Portfolio Initial Class (a) | | 8,161 | 924,809 |
| VIP Mid Cap Portfolio Initial Class (a) | | 3,643 | 143,163 |
| VIP Value Portfolio Initial Class (a) | | 16,344 | 317,725 |
| VIP Value Strategies Portfolio Initial Class (a) | | 9,418 | 158,028 |
| TOTAL DOMESTIC EQUITY FUNDS (Cost $2,745,924) | | | 3,177,722 |
| | | | |
| International Equity Funds - 42.5% |
| | | Shares | Value ($) |
| VIP Emerging Markets Portfolio Initial Class (a) | | 75,871 | 880,867 |
| VIP Overseas Portfolio Initial Class (a) | | 64,599 | 1,793,259 |
| TOTAL INTERNATIONAL EQUITY FUNDS (Cost $2,506,192) | | | 2,674,126 |
| | | | |
| Bond Funds - 7.0% |
| | | Shares | Value ($) |
| Fidelity Inflation-Protected Bond Index Fund (a) | | 8,072 | 73,534 |
| Fidelity International Bond Index Fund (a) | | 138 | 1,261 |
| Fidelity Long-Term Treasury Bond Index Fund (a) | | 36,401 | 345,447 |
| VIP High Income Portfolio Initial Class (a) | | 3,592 | 17,025 |
| TOTAL BOND FUNDS (Cost $456,826) | | | 437,267 |
| | | | |
| TOTAL INVESTMENT IN SECURITIES - 100.0% (Cost $5,708,942) | 6,289,115 |
NET OTHER ASSETS (LIABILITIES) - 0.0% | (315) |
| NET ASSETS - 100.0% | 6,288,800 |
| | |
Legend
Affiliated Underlying Funds
Fiscal year to date information regarding the Fund's investments in affiliated Underlying Funds is presented below. Exchanges between classes of the same affiliated Underlying Funds may occur. If an Underlying Funds changes its name, the name presented below is the name in effect at period end.
| Affiliate | Value, beginning of period ($) | Purchases ($) | Sales Proceeds ($) | Dividend Income ($) | Realized Gain (loss) ($) | Change in Unrealized appreciation (depreciation) ($) | Value, end of period ($) |
| Fidelity Inflation-Protected Bond Index Fund | 72,290 | 51,140 | 50,194 | 84 | (3,126) | 3,424 | 73,534 |
| Fidelity International Bond Index Fund | 18,554 | 3,923 | 21,173 | 124 | (373) | 330 | 1,261 |
| Fidelity Long-Term Treasury Bond Index Fund | 206,494 | 263,142 | 107,713 | 3,835 | (15,106) | (1,370) | 345,447 |
| VIP Contrafund Portfolio Initial Class | 287,608 | 325,662 | 126,760 | 1,173 | 12,592 | 57,057 | 556,159 |
| VIP Emerging Markets Portfolio Initial Class | 438,412 | 558,199 | 166,850 | 388 | 10,727 | 40,379 | 880,867 |
| VIP Equity-Income Portfolio Initial Class | 233,214 | 285,261 | 86,932 | 1,334 | 6,060 | 16,040 | 453,643 |
| VIP Government Money Market Portfolio Initial Class 5.1% | - | 7,794 | 7,794 | 33 | - | - | - |
| VIP Growth & Income Portfolio Initial Class | 320,583 | 377,055 | 120,206 | 2,194 | 10,826 | 35,937 | 624,195 |
| VIP Growth Portfolio Initial Class | 476,316 | 548,667 | 204,998 | 7,195 | 19,495 | 85,329 | 924,809 |
| VIP High Income Portfolio Initial Class | 9,138 | 10,748 | 3,159 | 4 | (63) | 361 | 17,025 |
| VIP Investment Grade Bond II Portfolio - Initial Class | 62,480 | 5,641 | 67,387 | 13 | (353) | (381) | - |
| VIP Mid Cap Portfolio Initial Class | 73,005 | 90,441 | 26,850 | 1,388 | 2,134 | 4,433 | 143,163 |
| VIP Overseas Portfolio Initial Class | 936,443 | 1,128,174 | 337,625 | 3,660 | 28,879 | 37,388 | 1,793,259 |
| VIP Value Portfolio Initial Class | 162,674 | 209,233 | 58,091 | 3,604 | 4,279 | (370) | 317,725 |
| VIP Value Strategies Portfolio Initial Class | 80,505 | 105,115 | 29,372 | 1,156 | 2,369 | (589) | 158,028 |
| | 3,377,716 | 3,970,195 | 1,415,104 | 26,185 | 78,340 | 277,968 | 6,289,115 |
Amounts in the dividend income column in the above table include any capital gain distributions from underlying funds, which are presented in the corresponding line item in the Statement of Operations, if applicable.
Amounts included in the purchases and sales proceeds columns may include in-kind transactions, if applicable.
Investment Valuation
The following is a summary of the inputs used, as of June 30, 2024, involving the Fund's assets and liabilities carried at fair value. The inputs or methodology used for valuing securities may not be an indication of the risk associated with investing in those securities. For more information on valuation inputs, and their aggregation into the levels used below, please refer to the Investment Valuation section in the accompanying Notes to Financial Statements.
| Valuation Inputs at Reporting Date: |
| Description | Total ($) | Level 1 ($) | Level 2 ($) | Level 3 ($) |
Investments in Securities: | | | | |
|
| Domestic Equity Funds | 3,177,722 | 3,177,722 | - | - |
|
| International Equity Funds | 2,674,126 | 2,674,126 | - | - |
|
| Bond Funds | 437,267 | 437,267 | - | - |
| Total Investments in Securities: | 6,289,115 | 6,289,115 | - | - |
VIP Freedom 2065 Portfolio℠
Financial Statements (Unaudited)
| Statement of Assets and Liabilities |
| | | | June 30, 2024 (Unaudited) |
| | | | | |
| Assets | | | | |
| Investment in securities, at value - See accompanying schedule: | | | | |
Affiliated issuers (cost $5,708,942) | $ | 6,289,115 | | |
| | | | | |
| | | | | |
| Total Investment in Securities (cost $5,708,942) | | | $ | 6,289,115 |
| Cash | | | | 11 |
| Receivable for investments sold | | | | 36,738 |
| Receivable for fund shares sold | | | | 2,183 |
Total assets | | | | 6,328,047 |
| Liabilities | | | | |
| Payable for investments purchased | $ | 38,595 | | |
| Payable for fund shares redeemed | | 327 | | |
| Accrued management fee | | 7 | | |
| Distribution and service plan fees payable | | 318 | | |
| Total liabilities | | | | 39,247 |
| Net Assets | | | $ | 6,288,800 |
| Net Assets consist of: | | | | |
| Paid in capital | | | $ | 5,772,172 |
| Total accumulated earnings (loss) | | | | 516,628 |
| Net Assets | | | $ | 6,288,800 |
| | | | | |
| Net Asset Value and Maximum Offering Price | | | | |
| Initial Class : | | | | |
Net Asset Value, offering price and redemption price per share ($1,999,478 ÷ 146,444 shares) | | | $ | 13.65 |
| Service Class : | | | | |
Net Asset Value, offering price and redemption price per share ($3,423,612 ÷ 251,169 shares) | | | $ | 13.63 |
| Service Class 2 : | | | | |
Net Asset Value, offering price and redemption price per share ($865,710 ÷ 63,585 shares) | | | $ | 13.62 |
| Statement of Operations |
| | | | Six months ended June 30, 2024 (Unaudited) |
| Investment Income | | | | |
| Dividends: | | | | |
| Affiliated issuers | | | $ | 6,880 |
| Expenses | | | | |
| Distribution and service plan fees | $ | 1,934 | | |
| Independent trustees' fees and expenses | | 5 | | |
| Proxy | | 185 | | |
| Total expenses before reductions | | 2,124 | | |
| Expense reductions | | (130) | | |
| Total expenses after reductions | | | | 1,994 |
| Net Investment income (loss) | | | | 4,886 |
| Realized and Unrealized Gain (Loss) | | | | |
| Net realized gain (loss) on: | | | | |
| Investment Securities: | | | | |
| Affiliated issuers | | 78,340 | | |
| Capital gain distributions from underlying funds: | | | | |
| Affiliated issuers | | 19,305 | | |
| Total net realized gain (loss) | | | | 97,645 |
| Change in net unrealized appreciation (depreciation) on: | | | | |
| Investment Securities: | | | | |
| Affiliated issuers | | 277,968 | | |
| Total change in net unrealized appreciation (depreciation) | | | | 277,968 |
| Net gain (loss) | | | | 375,613 |
| Net increase (decrease) in net assets resulting from operations | | | $ | 380,499 |
| Statement of Changes in Net Assets |
| |
| | Six months ended June 30, 2024 (Unaudited) | | Year ended December 31, 2023 |
| Increase (Decrease) in Net Assets | | | | |
| Operations | | | | |
| Net investment income (loss) | $ | 4,886 | $ | 40,663 |
| Net realized gain (loss) | | 97,645 | | (30,154) |
| Change in net unrealized appreciation (depreciation) | | 277,968 | | 455,960 |
| Net increase (decrease) in net assets resulting from operations | | 380,499 | | 466,469 |
| Distributions to shareholders | | (34,623) | | (70,234) |
| | | | | |
| Share transactions - net increase (decrease) | | 2,565,480 | | 728,596 |
| Total increase (decrease) in net assets | | 2,911,356 | | 1,124,831 |
| | | | | |
| Net Assets | | | | |
| Beginning of period | | 3,377,444 | | 2,252,613 |
| End of period | $ | 6,288,800 | $ | 3,377,444 |
| | | | | |
| | | | | |
Financial Highlights
VIP Freedom 2065 Portfolio℠ Initial Class |
| |
| | Six months ended (Unaudited) June 30, 2024 | | Years ended December 31, 2023 | | 2022 | | 2021 | | 2020 | | 2019 A |
Selected Per-Share Data | | | | | | | | | | | | |
| Net asset value, beginning of period | $ | 12.40 | $ | 10.65 | $ | 13.92 | $ | 12.47 | $ | 10.96 | $ | 10.00 |
| Income from Investment Operations | | | | | | | | | | | | |
Net investment income (loss) B,C | | .02 | | .20 | | .17 | | .25 | | .12 | | .15 |
| Net realized and unrealized gain (loss) | | 1.35 | | 1.85 | | (2.61) | | 1.96 | | 1.99 | | 1.03 |
| Total from investment operations | | 1.37 | | 2.05 | | (2.44) | | 2.21 | | 2.11 | | 1.18 |
| Distributions from net investment income | | - | | (.17) | | (.15) | | (.18) | | (.11) | | (.15) |
| Distributions from net realized gain | | (.12) | | (.13) | | (.67) | | (.58) | | (.49) | | (.07) |
| Total distributions | | (.12) | | (.30) | | (.83) D | | (.76) | | (.60) | | (.22) |
| Net asset value, end of period | $ | 13.65 | $ | 12.40 | $ | 10.65 | $ | 13.92 | $ | 12.47 | $ | 10.96 |
Total Return E,F,G | | | | 19.35% | | (18.22)% | | 17.81% | | 19.35% | | 11.79% |
Ratios to Average Net Assets C,H,I | | | | | | | | | | | | |
| Expenses before reductions | | .01% J,K | | -% L | | -% L | | -% L | | -% L | | -% K,L |
Expenses net of fee waivers, if any L | | | | -% | | -% | | -% | | -% | | -% K |
Expenses net of all reductions L | | -% J,K | | -% | | -% | | -% | | -% | | -% K |
| Net investment income (loss) | | .37% J,K | | 1.70% | | 1.50% | | 1.82% | | 1.07% | | 2.01% K |
| Supplemental Data | | | | | | | | | | | | |
| Net assets, end of period (000 omitted) | $ | 1,999 | $ | 844 | $ | 537 | $ | 482 | $ | 416 | $ | 365 |
Portfolio turnover rate M | | | | 74% | | 48% | | 24% | | 34% | | 24% K |
AFor the period April 11, 2019 (commencement of operations) through December 31, 2019.
BCalculated based on average shares outstanding during the period.
CNet investment income (loss) is affected by the timing of the declaration of dividends by any underlying mutual funds or exchange-traded funds (ETFs). Net investment income (loss) of any mutual funds or ETFs is not included in the Fund's net investment income (loss) ratio.
DTotal distributions per share do not sum due to rounding.
ETotal returns for periods of less than one year are not annualized.
FTotal returns do not reflect charges attributable to your insurance company's separate account. Inclusion of these charges would reduce the total returns shown.
GTotal returns would have been lower if certain expenses had not been reduced during the applicable periods shown.
HFees and expenses of any underlying mutual funds or exchange-traded funds (ETFs) are not included in the Fund's expense ratio. The Fund indirectly bears its proportionate share of these expenses.
IExpense ratios reflect operating expenses of the class. Expenses before reductions do not reflect amounts reimbursed, waived, or reduced through arrangements with the investment adviser, brokerage services, or other offset arrangements, if applicable, and do not represent the amount paid by the class during periods when reimbursements, waivers or reductions occur.
JProxy expenses are not annualized.
KAnnualized.
LAmount represents less than .005%.
MAmount does not include the portfolio activity of any underlying mutual funds or exchange-traded funds (ETFs).
VIP Freedom 2065 Portfolio℠ Service Class |
| |
| | Six months ended (Unaudited) June 30, 2024 | | Years ended December 31, 2023 | | 2022 | | 2021 | | 2020 | | 2019 A |
Selected Per-Share Data | | | | | | | | | | | | |
| Net asset value, beginning of period | $ | 12.39 | $ | 10.64 | $ | 13.91 | $ | 12.46 | $ | 10.96 | $ | 10.00 |
| Income from Investment Operations | | | | | | | | | | | | |
Net investment income (loss) B,C | | .02 | | .18 | | .16 | | .24 | | .11 | | .14 |
| Net realized and unrealized gain (loss) | | 1.34 | | 1.86 | | (2.61) | | 1.97 | | 1.98 | | 1.03 |
| Total from investment operations | | 1.36 | | 2.04 | | (2.45) | | 2.21 | | 2.09 | | 1.17 |
| Distributions from net investment income | | - | | (.16) | | (.14) | | (.17) | | (.10) | | (.14) |
| Distributions from net realized gain | | (.12) | | (.13) | | (.67) | | (.58) | | (.49) | | (.07) |
| Total distributions | | (.12) | | (.29) | | (.82) D | | (.76) D | | (.59) | | (.21) |
| Net asset value, end of period | $ | 13.63 | $ | 12.39 | $ | 10.64 | $ | 13.91 | $ | 12.46 | $ | 10.96 |
Total Return E,F,G | | | | 19.29% | | (18.32)% | | 17.77% | | 19.16% | | 11.72% |
Ratios to Average Net Assets C,H,I | | | | | | | | | | | | |
| Expenses before reductions | | .10% J,K | | .10% | | .10% | | .10% | | .10% | | .10% J |
| Expenses net of fee waivers, if any | | | | .10% | | .10% | | .10% | | .10% | | .10% J |
| Expenses net of all reductions | | .10% J,K | | .10% | | .10% | | .10% | | .10% | | .10% J |
| Net investment income (loss) | | .27% J,K | | 1.60% | | 1.40% | | 1.72% | | .97% | | 1.91% J |
| Supplemental Data | | | | | | | | | | | | |
| Net assets, end of period (000 omitted) | $ | 3,424 | $ | 1,816 | $ | 1,181 | $ | 1,224 | $ | 416 | $ | 365 |
Portfolio turnover rate L | | | | 74% | | 48% | | 24% | | 34% | | 24% J |
AFor the period April 11, 2019 (commencement of operations) through December 31, 2019.
BCalculated based on average shares outstanding during the period.
CNet investment income (loss) is affected by the timing of the declaration of dividends by any underlying mutual funds or exchange-traded funds (ETFs). Net investment income (loss) of any mutual funds or ETFs is not included in the Fund's net investment income (loss) ratio.
DTotal distributions per share do not sum due to rounding.
ETotal returns for periods of less than one year are not annualized.
FTotal returns do not reflect charges attributable to your insurance company's separate account. Inclusion of these charges would reduce the total returns shown.
GTotal returns would have been lower if certain expenses had not been reduced during the applicable periods shown.
HExpense ratios reflect operating expenses of the class. Expenses before reductions do not reflect amounts reimbursed, waived, or reduced through arrangements with the investment adviser, brokerage services, or other offset arrangements, if applicable, and do not represent the amount paid by the class during periods when reimbursements, waivers or reductions occur.
IFees and expenses of any underlying mutual funds or exchange-traded funds (ETFs) are not included in the Fund's expense ratio. The Fund indirectly bears its proportionate share of these expenses.
JAnnualized.
KProxy expenses are not annualized.
LAmount does not include the portfolio activity of any underlying mutual funds or exchange-traded funds (ETFs).
VIP Freedom 2065 Portfolio℠ Service Class 2 |
| |
| | Six months ended (Unaudited) June 30, 2024 | | Years ended December 31, 2023 | | 2022 | | 2021 | | 2020 | | 2019 A |
Selected Per-Share Data | | | | | | | | | | | | |
| Net asset value, beginning of period | $ | 12.38 | $ | 10.63 | $ | 13.90 | $ | 12.46 | $ | 10.96 | $ | 10.00 |
| Income from Investment Operations | | | | | | | | | | | | |
Net investment income (loss) B,C | | .01 | | .17 | | .14 | | .22 | | .09 | | .13 |
| Net realized and unrealized gain (loss) | | 1.35 | | 1.85 | | (2.61) | | 1.95 | | 1.99 | | 1.03 |
| Total from investment operations | | 1.36 | | 2.02 | | (2.47) | | 2.17 | | 2.08 | | 1.16 |
| Distributions from net investment income | | - | | (.14) | | (.13) | | (.15) | | (.09) | | (.13) |
| Distributions from net realized gain | | (.12) | | (.13) | | (.67) | | (.58) | | (.49) | | (.07) |
| Total distributions | | (.12) | | (.27) | | (.80) | | (.73) | | (.58) | | (.20) |
| Net asset value, end of period | $ | 13.62 | $ | 12.38 | $ | 10.63 | $ | 13.90 | $ | 12.46 | $ | 10.96 |
Total Return D,E,F | | | | 19.12% | | (18.44)% | | 17.47% | | 19.03% | | 11.61% |
Ratios to Average Net Assets C,G,H | | | | | | | | | | | | |
| Expenses before reductions | | .26% I,J | | .25% | | .25% | | .25% | | .25% | | .25% I |
| Expenses net of fee waivers, if any | | | | .25% | | .25% | | .25% | | .25% | | .25% I |
| Expenses net of all reductions | | .25% I,J | | .25% | | .25% | | .25% | | .25% | | .25% I |
| Net investment income (loss) | | .12% I,J | | 1.45% | | 1.25% | | 1.57% | | .82% | | 1.76% I |
| Supplemental Data | | | | | | | | | | | | |
| Net assets, end of period (000 omitted) | $ | 866 | $ | 718 | $ | 534 | $ | 559 | $ | 459 | $ | 365 |
Portfolio turnover rate K | | | | 74% | | 48% | | 24% | | 34% | | 24% I |
AFor the period April 11, 2019 (commencement of operations) through December 31, 2019.
BCalculated based on average shares outstanding during the period.
CNet investment income (loss) is affected by the timing of the declaration of dividends by any underlying mutual funds or exchange-traded funds (ETFs). Net investment income (loss) of any mutual funds or ETFs is not included in the Fund's net investment income (loss) ratio.
DTotal returns for periods of less than one year are not annualized.
ETotal returns do not reflect charges attributable to your insurance company's separate account. Inclusion of these charges would reduce the total returns shown.
FTotal returns would have been lower if certain expenses had not been reduced during the applicable periods shown.
GFees and expenses of any underlying mutual funds or exchange-traded funds (ETFs) are not included in the Fund's expense ratio. The Fund indirectly bears its proportionate share of these expenses.
HExpense ratios reflect operating expenses of the class. Expenses before reductions do not reflect amounts reimbursed, waived, or reduced through arrangements with the investment adviser, brokerage services, or other offset arrangements, if applicable, and do not represent the amount paid by the class during periods when reimbursements, waivers or reductions occur.
IAnnualized.
JProxy expenses are not annualized.
KAmount does not include the portfolio activity of any underlying mutual funds or exchange-traded funds (ETFs).
Notes to Financial Statements
(Unaudited)For the period ended June 30, 2024
1. Organization.
VIP Freedom Income Portfolio, VIP Freedom 2010 Portfolio, VIP Freedom 2015 Portfolio, VIP Freedom 2020 Portfolio, VIP Freedom 2025 Portfolio, VIP Freedom 2030 Portfolio, VIP Freedom 2035 Portfolio, VIP Freedom 2040 Portfolio, VIP Freedom 2045 Portfolio, VIP Freedom 2050 Portfolio, VIP Freedom 2055 Portfolio, VIP Freedom 2060 Portfolio, VIP Freedom 2065 Portfolio and VIP Freedom 2070 Portfolio (the Funds) are funds of Variable Insurance Products Fund V (the Trust). The Trust is registered under the Investment Company Act of 1940, as amended (the 1940 Act), as an open-end management investment company organized as a Massachusetts business trust. Each Fund is authorized to issue an unlimited number of shares. Shares of each Fund may only be purchased by insurance companies for the purpose of funding variable annuity or variable life insurance contracts. Each Fund offers three classes of shares: Initial Class, Service Class and Service Class 2. All classes have equal rights and voting privileges, except for matters affecting a single class.
2. Investments in Fidelity Central Funds.
Funds may invest in Fidelity Central Funds, which are open-end investment companies generally available only to other investment companies and accounts managed by the investment adviser and its affiliates. The Schedule of Investments lists any Fidelity Central Funds held as an investment as of period end, but does not include the underlying holdings of each Fidelity Central Fund. An investing fund indirectly bears its proportionate share of the expenses of the underlying Fidelity Central Funds.
Based on its investment objective, each Fidelity Central Fund may invest or participate in various investment vehicles or strategies that are similar to those of the investing fund. These strategies are consistent with the investment objectives of the investing fund and may involve certain economic risks which may cause a decline in value of each of the Fidelity Central Funds and thus a decline in the value of the investing fund.
| Fidelity Central Fund | Investment Manager | Investment Objective | Investment Practices | Expense RatioA |
| Fidelity Money Market Central Funds | Fidelity Management & Research Company LLC (FMR) | Each fund seeks to obtain a high level of current income consistent with the preservation of capital and liquidity. | Short-term Investments | Less than .005% |
A Expenses expressed as a percentage of average net assets and are as of each underlying Central Fund's most recent annual or semi-annual shareholder report.
A complete unaudited list of holdings for each Fidelity Central Fund is available upon request or at the Securities and Exchange Commission website at www.sec.gov. In addition, the financial statements of the Fidelity Central Funds which contain the significant accounting policies (including investment valuation policies) of those funds, and are not covered by the Report of Independent Registered Public Accounting Firm, are available on the Securities and Exchange Commission website or upon request.
3. Significant Accounting Policies.
Each Fund is an investment company and applies the accounting and reporting guidance of the Financial Accounting Standards Board (FASB) Accounting Standards Codification Topic 946 Financial Services - Investment Companies. The financial statements have been prepared in conformity with accounting principles generally accepted in the United States of America (GAAP), which require management to make certain estimates and assumptions at the date of the financial statements. Actual results could differ from those estimates. Subsequent events, if any, through the date that the financial statements were issued have been evaluated in the preparation of the financial statements. Each Fund's Schedule of Investments lists any underlying mutual funds or exchange-traded funds (ETFs) but does not include the underlying holdings of these funds. The following summarizes the significant accounting policies of each Fund:
Investment Valuation. Investments are valued as of 4:00 p.m. Eastern time on the last calendar day of the period. Each Fund categorizes the inputs to valuation techniques used to value its investments into a disclosure hierarchy consisting of three levels as shown below:
Level 1 - unadjusted quoted prices in active markets for identical investments
Level 2 - other significant observable inputs (including quoted prices for similar investments, interest rates, prepayment speeds, etc.)
Level 3 - unobservable inputs (including the Fund's own assumptions based on the best information available)
Valuation techniques used to value each Fund's investments by major category are as follows:
Investments in open-end mutual funds are valued at their closing net asset value (NAV) each business day and are categorized as Level 1 in the hierarchy. The aggregate value of investments by input level as of June 30, 2024 is included at the end of each Fund's Schedule of Investments.
Investment Transactions and Income. For financial reporting purposes, the Funds' investment holdings and NAV include trades executed through the end of the last business day of the period. The NAV per share for processing shareholder transactions is calculated as of the close of business of the New York Stock Exchange (NYSE), normally 4:00 p.m. Eastern time and includes trades executed through the end of the prior business day. Gains and losses on securities sold are determined on the basis of identified cost. Income and capital gain distributions from any underlying mutual funds or exchange-traded funds (ETFs) are recorded on the ex-dividend date.
Class Allocations and Expenses. Investment income, realized and unrealized capital gains and losses, common expenses of a fund, and certain fund-level expense reductions, if any, are allocated daily on a pro-rata basis to each class based on the relative net assets of each class to the total net assets of a fund. Each class differs with respect to transfer agent and distribution and service plan fees incurred, as applicable. Certain expense reductions may also differ by class, if applicable. For the reporting period, the allocated portion of income and expenses to each class as a percent of its average net assets may vary due to the timing of recording these transactions in relation to fluctuating net assets of the classes. Expenses directly attributable to a fund are charged to that fund. Expenses attributable to more than one fund are allocated among the respective funds on the basis of relative net assets or other appropriate methods. Expenses included in the accompanying financial statements reflect the expenses of that fund and do not include any expenses associated with any underlying mutual funds or exchange-traded funds (ETFs). Although not included in a fund's expenses, a fund indirectly bears its proportionate share of these expenses through the net asset value of each underlying mutual fund or exchange-traded fund (ETF). Expense estimates are accrued in the period to which they relate and adjustments are made when actual amounts are known.
Income Tax Information and Distributions to Shareholders. Each year, each Fund intends to qualify as a regulated investment company under Subchapter M of the Internal Revenue Code, including distributing substantially all of its taxable income and realized gains. As a result, no provision for U.S. Federal income taxes is required. Each Fund files a U.S. federal tax return, in addition to state and local tax returns as required. Each Fund's federal income tax returns are subject to examination by the Internal Revenue Service (IRS) for a period of three fiscal years after they are filed. State and local tax returns may be subject to examination for an additional fiscal year depending on the jurisdiction.
Distributions are declared and recorded on the ex-dividend date. Income and capital gain distributions are declared separately for each class. Income and capital gain distributions are determined in accordance with income tax regulations, which may differ from GAAP.
Capital accounts within the financial statements are adjusted for permanent book-tax differences. These adjustments have no impact on net assets or the results of operations. Capital accounts are not adjusted for temporary book-tax differences which will reverse in a subsequent period.
Book-tax differences are primarily due to the short-term gain distributions from the underlying mutual funds or exchange-traded funds (ETFs), capital loss carryforwards and losses deferred due to wash sales.
As of period end, the cost and unrealized appreciation (depreciation) in securities, and derivatives if applicable, for federal income tax purposes were as follows for each Fund:
| | Tax cost ($) | Gross unrealized appreciation ($) | Gross unrealized depreciation ($) | Net unrealized appreciation (depreciation)($) |
| VIP Freedom Income Portfolio | 76,406,649 | 5,538,587 | (3,265,843) | 2,272,744 |
| VIP Freedom 2010 Portfolio | 254,852,356 | 20,837,560 | (12,548,316) | 8,289,244 |
| VIP Freedom 2015 Portfolio | 47,754,220 | 13,117,797 | (2,187,821) | 10,929,976 |
| VIP Freedom 2020 Portfolio | 434,651,223 | 139,526,061 | (21,276,496) | 118,249,565 |
| VIP Freedom 2025 Portfolio | 315,591,051 | 74,278,283 | (13,587,748) | 60,690,535 |
| VIP Freedom 2030 Portfolio | 606,344,469 | 156,755,583 | (23,121,077) | 133,634,506 |
| VIP Freedom 2035 Portfolio | 283,472,111 | 54,506,331 | (8,297,201) | 46,209,130 |
| VIP Freedom 2040 Portfolio | 262,986,835 | 64,333,619 | (6,710,040) | 57,623,579 |
| VIP Freedom 2045 Portfolio | 145,740,998 | 33,968,345 | (3,067,311) | 30,901,034 |
| VIP Freedom 2050 Portfolio | 130,276,696 | 29,758,502 | (3,011,626) | 26,746,876 |
| VIP Freedom 2055 Portfolio | 16,734,560 | 2,520,237 | (297,613) | 2,222,624 |
| VIP Freedom 2060 Portfolio | 19,562,532 | 3,550,406 | (378,479) | 3,171,927 |
| VIP Freedom 2065 Portfolio | 5,797,127 | 600,464 | (108,476) | 491,988 |
Capital loss carryforwards are only available to offset future capital gains of the Funds to the extent provided by regulations and may be limited. The capital loss carryforward information presented below, including any applicable limitation, is estimated as of prior fiscal period end and is subject to adjustment.
| | Short-term ($) | Long-term ($) | Total capital loss carryforward ($) |
| VIP Freedom Income Portfolio | (80,474) | (1,746,010) | (1,826,484) |
| VIP Freedom 2010 Portfolio | (198,495) | (1,001,223) | (1,199,718) |
| VIP Freedom 2025 Portfolio | (1,494,089) | (2,189,057) | (3,683,146) |
| VIP Freedom 2030 Portfolio | (1,795,043) | - | (1,795,043) |
Due to large subscriptions in a prior period, VIP Freedom 2060 Portfolio is subject to an annual limit on its use of some of its unrealized capital losses to offset capital gains in future periods. If those capital losses are realized and the limitation prevents the Fund from using any of those capital losses in a future period, those capital losses will be available to offset capital gains in subsequent periods.
4. Purchases and Sales of Investments.
Purchases and sales of securities, other than short-term securities, securities acquired in the merger and in-kind transactions, as applicable, are noted in the table below.
| | Purchases ($) | Sales ($) |
| VIP Freedom Income Portfolio | 15,739,830 | 17,147,770 |
| VIP Freedom 2010 Portfolio | 31,029,988 | 48,250,125 |
| VIP Freedom 2015 Portfolio | 9,092,021 | 15,000,865 |
| VIP Freedom 2020 Portfolio | 57,151,089 | 109,088,487 |
| VIP Freedom 2025 Portfolio | 53,216,328 | 81,608,979 |
| VIP Freedom 2030 Portfolio | 110,574,099 | 119,089,911 |
| VIP Freedom 2035 Portfolio | 62,146,789 | 59,244,252 |
| VIP Freedom 2040 Portfolio | 63,141,540 | 50,824,289 |
| VIP Freedom 2045 Portfolio | 30,248,138 | 23,462,447 |
| VIP Freedom 2050 Portfolio | 28,316,958 | 21,946,197 |
| VIP Freedom 2055 Portfolio | 6,240,002 | 2,714,229 |
| VIP Freedom 2060 Portfolio | 6,305,168 | 6,316,072 |
| VIP Freedom 2065 Portfolio | 3,970,195 | 1,415,104 |
5. Fees and Other Transactions with Affiliates.
Management Fee. Fidelity Management & Research Company LLC (the investment adviser), provides the Funds with investment management related services. The Funds do not pay any fees for these services.
Distribution and Service Plan Fees. In accordance with Rule 12b-1 of the 1940 Act, the Funds have adopted separate 12b-1 Plans for each Service Class of shares. Each Service Class pays Fidelity Distributors Company LLC (FDC), an affiliate of the investment adviser, a service fee. For the period, the service fee is based on an annual rate of .10% of Service Class' average net assets and .25% of Service Class 2's average net assets.
For the period, total fees, all of which were reallowed to insurance companies for the distribution of shares and providing shareholder support services were as follows:
| | Service Class ($) | Service Class 2 ($) | Total ($) |
VIP Freedom Income Portfolio | 17,200 | 16,936 | 34,136 |
VIP Freedom 2010 Portfolio | 9,322 | 288,421 | 297,743 |
VIP Freedom 2015 Portfolio | 6,420 | 28,797 | 35,217 |
VIP Freedom 2020 Portfolio | 58,695 | 448,729 | 507,424 |
VIP Freedom 2025 Portfolio | 86,070 | 136,514 | 222,584 |
VIP Freedom 2030 Portfolio | 157,666 | 282,804 | 440,470 |
VIP Freedom 2035 Portfolio | 70,987 | 159,563 | 230,550 |
VIP Freedom 2040 Portfolio | 88,534 | 61,434 | 149,968 |
VIP Freedom 2045 Portfolio | 21,713 | 128,272 | 149,985 |
VIP Freedom 2050 Portfolio | 23,927 | 86,769 | 110,696 |
VIP Freedom 2055 Portfolio | 2,413 | 10,019 | 12,432 |
VIP Freedom 2060 Portfolio | 5,779 | 8,507 | 14,286 |
VIP Freedom 2065 Portfolio | 912 | 1,022 | 1,934 |
Interfund Trades. Funds may purchase from or sell securities to other Fidelity Funds under procedures adopted by the Board. The procedures have been designed to ensure these interfund trades are executed in accordance with Rule 17a-7 of the 1940 Act. Any interfund trades are included within the respective purchases and sales amounts shown in the Purchases and Sales of Investments note. During the period, there were no interfund trades.
6. Expense Reductions.
The investment adviser contractually agreed to reimburse certain Funds to the extent proxy and shareholder meeting expenses exceeded .003% of class-level average net assets on an annual basis. This reimbursement will remain in place through April 30, 2026. During the period this reimbursement reduced each applicable Fund's expenses as follows:
The following classes of each applicable Fund were in reimbursement during the period:
| | Reimbursement ($) |
| | |
| VIP Freedom 2055 Portfolio | |
| Initial Class | 462 |
| Service Class | 767 |
| Service Class 2 | 1,279 |
| VIP Freedom 2060 Portfolio | |
| Initial Class | 221 |
| Service Class | 1,371 |
| Service Class 2 | 820 |
| VIP Freedom 2065 Portfolio | |
| Initial Class | 30 |
| Service Class | 72 |
| Service Class 2 | 28 |
7. Distributions to Shareholders.
Distributions to shareholders of each class were as follows:
| | Six months ended June 30, 2024 | Year ended December 31, 2023 |
| VIP Freedom Income Portfolio | | |
| Distributions to shareholders | | |
| Initial Class | $145,615 | $854,766 |
| Service Class | 230,416 | 1,360,128 |
| Service Class 2 | 90,701 | 600,709 |
Total | $466,732 | $2,815,603 |
| VIP Freedom 2010 Portfolio | | |
| Distributions to shareholders | | |
| Initial Class | $108,023 | $1,437,928 |
| Service Class | 119,087 | 2,267,100 |
| Service Class 2 | 1,457,960 | 26,250,871 |
Total | $1,685,070 | $29,955,899 |
| VIP Freedom 2015 Portfolio | | |
| Distributions to shareholders | | |
| Initial Class | $772,114 | $ 1,279,047 |
| Service Class | 431,443 | 752,489 |
| Service Class 2 | 753,430 | 1,337,539 |
Total | $1,956,987 | $3,369,075 |
| VIP Freedom 2020 Portfolio | | |
| Distributions to shareholders | | |
| Initial Class | $2,469,329 | $2,856,614 |
| Service Class | 3,481,920 | 4,765,965 |
| Service Class 2 | 10,837,265 | 13,504,617 |
Total | $16,788,514 | $21,127,196 |
| VIP Freedom 2025 Portfolio | | |
| Distributions to shareholders | | |
| Initial Class | $426,422 | $2,114,386 |
| Service Class | 779,588 | 4,741,865 |
| Service Class 2 | 504,255 | 2,724,354 |
Total | $1,710,265 | $9,580,605 |
| VIP Freedom 2030 Portfolio | | |
| Distributions to shareholders | | |
| Initial Class | $546,173 | $3,630,083 |
| Service Class | 997,557 | 7,108,355 |
| Service Class 2 | 730,561 | 4,704,484 |
Total | $2,274,291 | $15,442,922 |
| VIP Freedom 2035 Portfolio | | |
| Distributions to shareholders | | |
| Initial Class | $511,703 | $708,529 |
| Service Class | 1,800,581 | 2,626,198 |
| Service Class 2 | 1,657,106 | 2,165,501 |
Total | $3,969,390 | $5,500,228 |
| VIP Freedom 2040 Portfolio | | |
| Distributions to shareholders | | |
| Initial Class | $1,021,384 | $1,579,926 |
| Service Class | 2,488,344 | 4,340,621 |
| Service Class 2 | 698,592 | 1,069,680 |
Total | $4,208,320 | $6,990,227 |
| VIP Freedom 2045 Portfolio | | |
| Distributions to shareholders | | |
| Initial Class | $285,073 | $350,222 |
| Service Class | 649,031 | 910,150 |
| Service Class 2 | 1,577,236 | 2,348,001 |
Total | $2,511,340 | $3,608,373 |
| VIP Freedom 2050 Portfolio | | |
| Distributions to shareholders | | |
| Initial Class | $476,881 | $665,385 |
| Service Class | 766,695 | 1,091,054 |
| Service Class 2 | 1,130,290 | 1,529,162 |
Total | $2,373,866 | $3,285,601 |
| VIP Freedom 2055 Portfolio | | |
| Distributions to shareholders | | |
| Initial Class | $39,376 | $44,198 |
| Service Class | 66,514 | 91,852 |
| Service Class 2 | 108,083 | 128,838 |
Total | $213,973 | $264,888 |
| VIP Freedom 2060 Portfolio | | |
| Distributions to shareholders | | |
| Initial Class | $29,377 | $29,565 |
| Service Class | 187,355 | 283,010 |
| Service Class 2 | 106,675 | 109,757 |
Total | $323,407 | $422,332 |
| VIP Freedom 2065 Portfolio | | |
| Distributions to shareholders | | |
| Initial Class | $8,585 | $17,938 |
| Service Class | 18,422 | 37,711 |
| Service Class 2 | 7,616 | 14,585 |
Total | $34,623 | $70,234 |
8. Share Transactions.
Transactions for each class of shares were as follows and may contain in-kind transactions:
| | Shares | Shares | Dollars | Dollars |
| | Six months ended June 30, 2024 | Year ended December 31, 2023 | Six months ended June 30, 2024 | Year ended December 31, 2023 |
| VIP Freedom Income Portfolio | | | | |
| Initial Class | | | | |
| Shares sold | 148,399 | 886,488 | $1,647,086 | $9,500,247 |
| Issued in exchange for the shares of the Target Fund(s) | 446,775 | - | 4,968,120 | - |
| Reinvestment of distributions | 13,408 | 78,642 | 145,615 | 854,766 |
| Shares redeemed | (291,046) | (317,657) | (3,209,993) | (3,428,227) |
| Net increase (decrease) | 317,536 | 647,473 | $3,550,828 | $6,926,786 |
| Service Class | | | | |
| Shares sold | 774,000 | 949,188 | $8,495,201 | $10,255,725 |
| Issued in exchange for the shares of the Target Fund(s) | 329,353 | - | 3,655,826 | - |
| Reinvestment of distributions | 21,256 | 125,425 | 230,416 | 1,360,128 |
| Shares redeemed | (693,667) | (1,079,667) | (7,642,599) | (11,651,339) |
| Net increase (decrease) | 430,942 | (5,054) | $4,738,844 | $(35,486) |
| Service Class 2 | | | | |
| Shares sold | 113,437 | 223,607 | $1,242,276 | $2,411,512 |
| Issued in exchange for the shares of the Target Fund(s) | 25,230 | - | 279,044 | - |
| Reinvestment of distributions | 8,391 | 55,623 | 90,701 | 600,709 |
| Shares redeemed | (215,863) | (572,650) | (2,358,479) | (6,204,220) |
| Net increase (decrease) | (68,805) | (293,420) | $(746,458) | $(3,191,999) |
| VIP Freedom 2010 Portfolio | | | | |
| Initial Class | | | | |
| Shares sold | 93,794 | 734,753 | $1,065,807 | $8,007,539 |
| Reinvestment of distributions | 9,593 | 130,011 | 108,023 | 1,437,927 |
| Shares redeemed | (272,154) | (369,613) | (3,102,712) | (4,138,846) |
| Net increase (decrease) | (168,767) | 495,151 | $(1,928,882) | $5,306,620 |
| Service Class | | | | |
| Shares sold | 145,238 | 189,086 | $1,665,128 | $2,114,536 |
| Reinvestment of distributions | 10,595 | 205,902 | 119,087 | 2,267,100 |
| Shares redeemed | (271,669) | (527,785) | (3,095,100) | (5,863,420) |
| Net increase (decrease) | (115,836) | (132,797) | $(1,310,885) | $(1,481,784) |
| Service Class 2 | | | | |
| Shares sold | 424,671 | 295,703 | $4,781,720 | $3,261,363 |
| Reinvestment of distributions | 130,642 | 2,401,781 | 1,457,960 | 26,250,870 |
| Shares redeemed | (1,749,467) | (3,641,109) | (19,798,612) | (40,173,370) |
| Net increase (decrease) | (1,194,154) | (943,625) | $(13,558,932) | $(10,661,137) |
| VIP Freedom 2015 Portfolio | | | | |
| Initial Class | | | | |
| Shares sold | 13,373 | 452,129 | $152,232 | $5,016,230 |
| Reinvestment of distributions | 69,124 | 114,442 | 772,114 | 1,279,047 |
| Shares redeemed | (215,412) | (353,327) | (2,462,797) | (3,935,296) |
| Net increase (decrease) | (132,915) | 213,244 | $(1,538,451) | $2,359,981 |
| Service Class | | | | |
| Shares sold | 334,566 | 353,166 | $3,826,680 | $3,916,473 |
| Reinvestment of distributions | 38,729 | 67,691 | 431,443 | 752,489 |
| Shares redeemed | (419,609) | (779,524) | (4,774,289) | (8,677,182) |
| Net increase (decrease) | (46,314) | (358,667) | $(516,166) | $(4,008,220) |
| Service Class 2 | | | | |
| Shares sold | 59,614 | 213,981 | $674,736 | $2,362,103 |
| Reinvestment of distributions | 67,938 | 120,772 | 753,430 | 1,337,539 |
| Shares redeemed | (316,846) | (527,715) | (3,598,989) | (5,806,501) |
| Net increase (decrease) | (189,294) | (192,962) | $(2,170,823) | $(2,106,859) |
| VIP Freedom 2020 Portfolio | | | | |
| Initial Class | | | | |
| Shares sold | 506,586 | 2,685,710 | $6,288,769 | $32,137,000 |
| Reinvestment of distributions | 201,743 | 234,952 | 2,469,329 | 2,856,614 |
| Shares redeemed | (991,124) | (1,561,179) | (12,414,545) | (18,657,328) |
| Net increase (decrease) | (282,795) | 1,359,483 | $(3,656,447) | $16,336,286 |
| Service Class | | | | |
| Shares sold | 521,918 | 1,884,596 | $6,501,299 | $22,521,084 |
| Reinvestment of distributions | 285,637 | 395,261 | 3,481,920 | 4,765,965 |
| Shares redeemed | (1,859,118) | (3,386,893) | (23,212,665) | (40,288,918) |
| Net increase (decrease) | (1,051,563) | (1,107,036) | $(13,229,446) | $(13,001,869) |
| Service Class 2 | | | | |
| Shares sold | 288,235 | 830,980 | $3,565,522 | $9,817,447 |
| Reinvestment of distributions | 893,427 | 1,125,932 | 10,837,265 | 13,504,617 |
| Shares redeemed | (2,794,688) | (4,942,858) | (34,724,204) | (58,717,326) |
| Net increase (decrease) | (1,613,026) | (2,985,946) | $(20,321,417) | $(35,395,262) |
| VIP Freedom 2025 Portfolio | | | | |
| Initial Class | | | | |
| Shares sold | 345,887 | 3,499,750 | $5,358,502 | $49,982,607 |
| Reinvestment of distributions | 27,889 | 142,515 | 426,422 | 2,114,386 |
| Shares redeemed | (636,393) | (912,435) | (9,872,707) | (13,203,863) |
| Net increase (decrease) | (262,617) | 2,729,830 | $(4,087,783) | $38,893,130 |
| Service Class | | | | |
| Shares sold | 1,176,320 | 3,171,969 | $18,174,012 | $45,705,083 |
| Reinvestment of distributions | 51,154 | 323,005 | 779,588 | 4,741,865 |
| Shares redeemed | (2,631,515) | (4,085,365) | (40,380,438) | (58,562,251) |
| Net increase (decrease) | (1,404,041) | (590,391) | $(21,426,838) | $(8,115,303) |
| Service Class 2 | | | | |
| Shares sold | 457,980 | 1,001,951 | $7,022,095 | $14,332,648 |
| Reinvestment of distributions | 33,328 | 187,141 | 504,255 | 2,724,354 |
| Shares redeemed | (680,499) | (1,632,301) | (10,453,235) | (23,237,902) |
| Net increase (decrease) | (189,191) | (443,209) | $(2,926,885) | $(6,180,900) |
| VIP Freedom 2030 Portfolio | | | | |
| Initial Class | | | | |
| Shares sold | 1,264,393 | 3,313,084 | $19,986,294 | $48,202,389 |
| Reinvestment of distributions | 35,079 | 242,309 | 546,173 | 3,630,083 |
| Shares redeemed | (813,177) | (1,485,965) | (12,826,622) | (21,556,364) |
| Net increase (decrease) | 486,295 | 2,069,428 | $7,705,845 | $30,276,108 |
| Service Class | | | | |
| Shares sold | 2,074,060 | 4,868,737 | $32,811,189 | $70,472,748 |
| Reinvestment of distributions | 64,276 | 476,840 | 997,557 | 7,108,355 |
| Shares redeemed | (3,246,413) | (4,306,355) | (50,938,608) | (62,005,332) |
| Net increase (decrease) | (1,108,077) | 1,039,222 | $(17,129,862) | $15,575,771 |
| Service Class 2 | | | | |
| Shares sold | 899,157 | 1,952,431 | $14,221,950 | $28,097,338 |
| Reinvestment of distributions | 47,286 | 317,545 | 730,561 | 4,704,484 |
| Shares redeemed | (980,996) | (2,370,936) | (15,368,601) | (34,173,618) |
| Net increase (decrease) | (34,553) | (100,960) | $(416,090) | $(1,371,796) |
| VIP Freedom 2035 Portfolio | | | | |
| Initial Class | | | | |
| Shares sold | 317,110 | 816,666 | $8,513,157 | $19,944,052 |
| Reinvestment of distributions | 19,493 | 27,913 | 511,703 | 708,529 |
| Shares redeemed | (145,898) | (158,552) | (3,807,510) | (3,859,274) |
| Net increase (decrease) | 190,705 | 686,027 | $5,217,350 | $16,793,307 |
| Service Class | | | | |
| Shares sold | 861,560 | 2,222,007 | $23,063,632 | $53,711,627 |
| Reinvestment of distributions | 68,830 | 104,263 | 1,800,581 | 2,626,198 |
| Shares redeemed | (999,281) | (1,207,278) | (26,465,482) | (29,346,996) |
| Net increase (decrease) | (68,891) | 1,118,992 | $(1,601,269) | $26,990,829 |
| Service Class 2 | | | | |
| Shares sold | 375,527 | 897,849 | $9,989,475 | $21,652,655 |
| Reinvestment of distributions | 63,808 | 86,722 | 1,657,106 | 2,165,501 |
| Shares redeemed | (380,413) | (611,604) | (10,125,383) | (14,648,775) |
| Net increase (decrease) | 58,922 | 372,967 | $1,521,198 | $9,169,381 |
| VIP Freedom 2040 Portfolio | | | | |
| Initial Class | | | | |
| Shares sold | 447,128 | 952,651 | $11,601,689 | $21,971,331 |
| Reinvestment of distributions | 40,307 | 66,913 | 1,021,384 | 1,579,926 |
| Shares redeemed | (228,178) | (303,653) | (5,899,929) | (7,025,473) |
| Net increase (decrease) | 259,257 | 715,911 | $6,723,144 | $16,525,784 |
| Service Class | | | | |
| Shares sold | 962,653 | 2,441,836 | $25,136,485 | $55,811,760 |
| Reinvestment of distributions | 98,509 | 185,312 | 2,488,344 | 4,340,621 |
| Shares redeemed | (903,386) | (1,575,002) | (23,216,712) | (36,358,908) |
| Net increase (decrease) | 157,776 | 1,052,146 | $4,408,117 | $23,793,473 |
| Service Class 2 | | | | |
| Shares sold | 228,646 | 498,289 | $5,849,508 | $11,391,766 |
| Reinvestment of distributions | 27,810 | 45,991 | 698,592 | 1,069,680 |
| Shares redeemed | (120,770) | (385,578) | (3,088,398) | (8,785,619) |
| Net increase (decrease) | 135,686 | 158,702 | $3,459,702 | $3,675,827 |
| VIP Freedom 2045 Portfolio | | | | |
| Initial Class | | | | |
| Shares sold | 132,657 | 372,832 | $3,508,648 | $8,687,583 |
| Reinvestment of distributions | 11,097 | 14,637 | 285,073 | 350,222 |
| Shares redeemed | (33,537) | (50,633) | (872,053) | (1,198,675) |
| Net increase (decrease) | 110,217 | 336,836 | $2,921,668 | $7,839,130 |
| Service Class | | | | |
| Shares sold | 286,737 | 938,836 | $7,556,353 | $22,105,547 |
| Reinvestment of distributions | 25,353 | 38,486 | 649,031 | 910,150 |
| Shares redeemed | (312,056) | (400,189) | (8,153,656) | (9,402,638) |
| Net increase (decrease) | 34 | 577,133 | $51,728 | $13,613,059 |
| Service Class 2 | | | | |
| Shares sold | 367,343 | 778,851 | $9,561,666 | $18,072,834 |
| Reinvestment of distributions | 61,998 | 100,565 | 1,577,236 | 2,348,001 |
| Shares redeemed | (224,022) | (487,903) | (5,835,900) | (11,303,823) |
| Net increase (decrease) | 205,319 | 391,513 | $5,303,002 | $9,117,012 |
| VIP Freedom 2050 Portfolio | | | | |
| Initial Class | | | | |
| Shares sold | 191,051 | 453,481 | $4,523,671 | $9,533,620 |
| Reinvestment of distributions | 20,573 | 31,041 | 476,881 | 665,385 |
| Shares redeemed | (149,425) | (186,416) | (3,533,499) | (3,994,297) |
| Net increase (decrease) | 62,199 | 298,106 | $1,467,053 | $6,204,708 |
| Service Class | | | | |
| Shares sold | 356,135 | 748,931 | $8,521,910 | $15,721,134 |
| Reinvestment of distributions | 33,205 | 51,197 | 766,695 | 1,091,054 |
| Shares redeemed | (235,555) | (422,051) | (5,570,996) | (8,865,929) |
| Net increase (decrease) | 153,785 | 378,077 | $3,717,609 | $7,946,259 |
| Service Class 2 | | | | |
| Shares sold | 310,736 | 733,870 | $7,278,736 | $15,313,791 |
| Reinvestment of distributions | 49,207 | 72,336 | 1,130,290 | 1,529,162 |
| Shares redeemed | (245,383) | (347,415) | (5,778,244) | (7,335,701) |
| Net increase (decrease) | 114,560 | 458,791 | $2,630,782 | $9,507,252 |
| VIP Freedom 2055 Portfolio | | | | |
| Initial Class | | | | |
| Shares sold | 165,742 | 133,801 | $2,254,464 | $1,573,006 |
| Reinvestment of distributions | 2,544 | 2,679 | 33,076 | 33,697 |
| Shares redeemed | (16,452) | (7,740) | (221,087) | (91,744) |
| Net increase (decrease) | 151,834 | 128,740 | $2,066,453 | $1,514,959 |
| Service Class | | | | |
| Shares sold | 70,884 | 306,462 | $941,697 | $3,595,314 |
| Reinvestment of distributions | 5,120 | 7,422 | 66,514 | 91,423 |
| Shares redeemed | (65,628) | (159,707) | (868,916) | (1,892,017) |
| Net increase (decrease) | 10,376 | 154,177 | $139,295 | $1,794,720 |
| Service Class 2 | | | | |
| Shares sold | 141,288 | 230,903 | $1,869,763 | $2,693,859 |
| Reinvestment of distributions | 8,138 | 10,187 | 105,382 | 124,679 |
| Shares redeemed | (39,211) | (48,955) | (538,532) | (585,503) |
| Net increase (decrease) | 110,215 | 192,135 | $1,436,613 | $2,233,035 |
| VIP Freedom 2060 Portfolio | | | | |
| Initial Class | | | | |
| Shares sold | 94,201 | 101,848 | $1,260,671 | $1,179,175 |
| Reinvestment of distributions | 1,719 | 1,532 | 22,043 | 19,165 |
| Shares redeemed | (21,002) | (12,705) | (272,442) | (152,588) |
| Net increase (decrease) | 74,918 | 90,675 | $1,010,272 | $1,045,752 |
| Service Class | | | | |
| Shares sold | 177,863 | 504,231 | $2,335,342 | $5,910,169 |
| Reinvestment of distributions | 14,637 | 23,370 | 187,355 | 283,010 |
| Shares redeemed | (379,536) | (238,840) | (4,870,500) | (2,796,794) |
| Net increase (decrease) | (187,036) | 288,761 | $(2,347,803) | $3,396,385 |
| Service Class 2 | | | | |
| Shares sold | 118,537 | 192,925 | $1,557,146 | $2,253,542 |
| Reinvestment of distributions | 8,053 | 8,654 | 102,843 | 104,740 |
| Shares redeemed | (10,441) | (30,061) | (137,705) | (353,940) |
| Net increase (decrease) | 116,149 | 171,518 | $1,522,284 | $2,004,342 |
| VIP Freedom 2065 Portfolio | | | | |
| Initial Class | | | | |
| Shares sold | 88,213 | 36,388 | $1,187,121 | $412,181 |
| Reinvestment of distributions | 350 | 670 | 4,452 | 8,071 |
| Shares redeemed | (10,154) | (19,507) | (135,748) | (223,232) |
| Net increase (decrease) | 78,409 | 17,551 | $1,055,825 | $197,020 |
| Service Class | | | | |
| Shares sold | 177,491 | 154,287 | $2,408,267 | $1,772,357 |
| Reinvestment of distributions | 1,230 | 2,618 | 15,619 | 31,223 |
| Shares redeemed | (74,109) | (121,377) | (984,788) | (1,359,869) |
| Net increase (decrease) | 104,612 | 35,528 | $1,439,098 | $443,711 |
| Service Class 2 | | | | |
| Shares sold | 8,038 | 8,876 | $103,552 | $100,961 |
| Reinvestment of distributions | 274 | 475 | 3,482 | 5,652 |
| Shares redeemed | (2,678) | (1,620) | (36,477) | (18,748) |
| Net increase (decrease) | 5,634 | 7,731 | $70,557 | $87,865 |
9. Other.
A fund's organizational documents provide former and current trustees and officers with a limited indemnification against liabilities arising in connection with the performance of their duties to the fund. In the normal course of business, a fund may also enter into contracts that provide general indemnifications. A fund's maximum exposure under these arrangements is unknown as this would be dependent on future claims that may be made against a fund. The risk of material loss from such claims is considered remote.
Funds do not invest in underlying mutual funds for the purpose of exercising management or control; however, investments by funds within their principal investment strategies may represent a significant portion of the underlying mutual fund's net assets. At the end of the period, certain Funds were the owners of record of 10% or more of the total outstanding shares of the following underlying mutual funds as shown below.
| Fund | Affiliated % | Number of Unaffiliated Shareholders | Unaffiliated Shareholders % |
| VIP Freedom Income Portfolio | 18% | 3 | 49% |
| VIP Freedom 2010 Portfolio | - | 1 | 84% |
| VIP Freedom 2015 Portfolio | 26% | 2 | 27% |
| VIP Freedom 2020 Portfolio | - | 1 | 66% |
| VIP Freedom 2025 Portfolio | - | 3 | 49% |
| VIP Freedom 2030 Portfolio | - | 1 | 40% |
| VIP Freedom 2035 Portfolio | - | 5 | 76% |
| VIP Freedom 2040 Portfolio | - | 3 | 63% |
| VIP Freedom 2045 Portfolio | - | 4 | 67% |
| VIP Freedom 2050 Portfolio | - | 4 | 74% |
| VIP Freedom 2055 Portfolio | - | 2 | 56% |
| VIP Freedom 2060 Portfolio | - | 2 | 78% |
| VIP Freedom 2065 Portfolio | 19% | 2 | 61% |
The Funds, in aggregate, were the owners of record of more than 20% of the total outstanding shares of the following underlying mutual funds.
| Fund | % of shares held |
| VIP Emerging Markets Portfolio | 30% |
| VIP Overseas Portfolio | 31% |
10. Risk and Uncertainties.
Many factors affect a fund's performance. Developments that disrupt global economies and financial markets, such as pandemics, epidemics, outbreaks of infectious diseases, war, terrorism, and environmental disasters, may significantly affect a fund's investment performance. The effects of these developments to a fund will be impacted by the types of securities in which a fund invests, the financial condition, industry, economic sector, and geographic location of an issuer, and a fund's level of investment in the securities of that issuer. Significant concentrations in security types, issuers, industries, sectors, and geographic locations may magnify the factors that affect a fund's performance.
11. Merger Information.
On June 7, 2024, VIP Freedom Income Portfolio acquired all of the assets and assumed all of the liabilities of VIP Freedom 2005 Portfolio ("Target Fund") pursuant to an Agreement and Plan of Reorganization (Agreements) approved by the Board of Trustees ("The Board"). The securities held by the Target Fund were the primary assets acquired by the VIP Freedom Income Portfolio. The acquisition was accomplished by an exchange of each class of VIP Freedom Income Portfolio for corresponding shares then outstanding of the Target Fund at its respective net asset value on the acquisition date. The reorganization provides shareholders of the Target Fund access to a larger portfolio with a similar investment objective and lower projected expenses. For financial reporting purposes, the assets and liabilities of the Target Fund and shares issued by VIP Freedom Income Portfolio were recorded at fair value; however, the cost basis of the investments received from the Target Fund were carried forward and will be utilized for purposes of VIP Freedom Income Portfolio's ongoing reporting of realized and unrealized gains and losses to more closely align subsequent reporting of realized gains with amounts distributable to shareholders for tax purposes. The reorganization qualified as a tax-free reorganization for federal income tax purposes with no gain or loss recognized to the funds or their shareholders.
| Target Fund and Share Class | Investments $ | Unrealized appreciation (depreciation) $ | Net Assets $ | Shares Exchanged | Shares Exchanged Ratio |
| VIP Freedom 2005 Portfolio | 8,901,778 | 394,296 | | | |
Initial Class | | | 4,968,120 | 446,775 | 1.0339208633 |
Service Class | | | 3,655,826 | 329,353 | 1.0437297297 |
Service Class 2 | | | 279,044 | 25,230 | 1.0365009042 |
| Surviving Fund | | | | Net Assets $ | Total net assets after the acquisition $ |
| VIP Freedom Income Portfolio | | | | 69,407,816 | 78,310,806 |
Pro forma results of operations of the combined entity for the entire period ended June 30, 2024, as though the acquisition had occurred as of the beginning of the year (rather than on the actual acquisition date), are as follows:
| Net investment income (loss) | $406,306 |
| Total net realized gain (loss) | (68,250) |
| Total change in net unrealized appreciation (depreciation) | 1,630,629 |
| Net increase (decrease) in net assets resulting from operations | $1,968,685 |
Because the combined investment portfolios have been managed as a single portfolio since the acquisition was completed, it is not practicable to separate the amounts of revenue and earnings of the acquired funds that have been included in the VIP Freedom Income Portfolio accompanying Statement of Operations since June 7, 2024.
Item 8: Changes in and Disagreements with Accountants for Open-End Management Investment Companies
Note: This is not applicable for any fund included in this document.
Item 9: Proxy Disclosures for Open-End Management Investment Companies
Note: This is not applicable for any fund included in this document.
Item 10: Remuneration Paid to Directors, Officers, and others of Open-End Management Investment Companies
Note: This information is disclosed as part of the financial statements for each Fund as part of Item 7: Financial Statements and Financial Highlights for Open-End Management Investment companies.
Item 11: Statement Regarding Basis for Approval of Investment Advisory Contract
Note: This is not applicable for any fund included in this document.
1.819548.120
VIPFF2K-SANN-0824
Fidelity® Variable Insurance Products:
VIP Investment Grade Bond Portfolio
Semi-Annual Report
June 30, 2024
Contents
To view a fund's proxy voting guidelines and proxy voting record for the 12-month period ended June 30, visit http://www.fidelity.com/proxyvotingresults or visit the Securities and Exchange Commission's (SEC) web site at http://www.sec.gov.
You may also call 1-877-208-0098 to request a free copy of the proxy voting guidelines.
Fidelity® Variable Insurance Products are separate account options which are purchased through a variable insurance contract.
Standard & Poor's, S&P and S&P 500 are registered service marks of The McGraw-Hill Companies, Inc. and have been licensed for use by Fidelity Distributors Corporation.
Other third-party marks appearing herein are the property of their respective owners.
All other marks appearing herein are registered or unregistered trademarks or service marks of FMR LLC or an affiliated company. © 2024 FMR LLC. All rights reserved.
This report and the financial statements contained herein are submitted for the general information of the shareholders of the Fund. This report is not authorized for distribution to prospective investors in the Fund unless preceded or accompanied by an effective prospectus.
A fund files its complete schedule of portfolio holdings with the SEC for the first and third quarters of each fiscal year on Form N-PORT. Forms N-PORT are available on the SEC's web site at http://www.sec.gov. A fund's Forms N-PORT may be reviewed and copied at the SEC's Public Reference Room in Washington, DC. Information regarding the operation of the SEC's Public Reference Room may be obtained by calling 1-800-SEC-0330.
For a complete list of a fund's portfolio holdings, view the most recent holdings listing, semiannual report, or annual report on Fidelity's web site at http://www.fidelity.com, http://www.institutional.fidelity.com, or http://www.401k.com, as applicable.
NOT FDIC INSURED •MAY LOSE VALUE •NO BANK GUARANTEE
Neither the Fund nor Fidelity Distributors Corporation is a bank.
Item 7: Financial Statements and Financial Highlights for Open-End Management Investment Companies (Semi-Annual Report)
VIP Investment Grade Bond Portfolio
Schedule of Investments June 30, 2024 (Unaudited)
Showing Percentage of Net Assets
| Nonconvertible Bonds - 25.1% |
| | | Principal Amount (a) | Value ($) |
| COMMUNICATION SERVICES - 2.0% | | | |
| Diversified Telecommunication Services - 0.6% | | | |
| AT&T, Inc.: | | | |
| 2.55% 12/1/33 | | 8,483,000 | 6,745,232 |
| 3.8% 12/1/57 | | 8,657,000 | 6,048,091 |
| 4.3% 2/15/30 | | 1,940,000 | 1,858,592 |
| 4.75% 5/15/46 | | 10,884,000 | 9,413,277 |
| Verizon Communications, Inc. 2.55% 3/21/31 | | 3,143,000 | 2,670,318 |
| | | | 26,735,510 |
| Media - 1.2% | | | |
| Charter Communications Operating LLC/Charter Communications Operating Capital Corp.: | | | |
| 4.4% 4/1/33 | | 1,435,000 | 1,265,014 |
| 4.908% 7/23/25 | | 505,000 | 500,095 |
| 5.05% 3/30/29 | | 1,180,000 | 1,134,797 |
| 5.25% 4/1/53 | | 1,091,000 | 855,914 |
| 5.375% 5/1/47 | | 10,656,000 | 8,513,150 |
| 5.5% 4/1/63 | | 1,435,000 | 1,111,976 |
| 6.1% 6/1/29 | | 2,703,000 | 2,711,840 |
| 6.484% 10/23/45 | | 1,557,000 | 1,422,133 |
| 6.55% 6/1/34 | | 1,474,000 | 1,474,490 |
| Discovery Communications LLC 3.625% 5/15/30 | | 1,973,000 | 1,736,133 |
| Fox Corp.: | | | |
| 5.476% 1/25/39 | | 1,027,000 | 979,134 |
| 5.576% 1/25/49 | | 682,000 | 626,162 |
| Time Warner Cable LLC: | | | |
| 4.5% 9/15/42 | | 525,000 | 384,248 |
| 5.5% 9/1/41 | | 965,000 | 803,638 |
| 5.875% 11/15/40 | | 852,000 | 739,253 |
| 6.55% 5/1/37 | | 11,472,000 | 10,864,034 |
| 7.3% 7/1/38 | | 2,146,000 | 2,171,671 |
| Warnermedia Holdings, Inc.: | | | |
| 3.638% 3/15/25 | | 1,270,000 | 1,250,307 |
| 3.755% 3/15/27 | | 2,484,000 | 2,358,360 |
| 4.054% 3/15/29 | | 861,000 | 795,127 |
| 4.279% 3/15/32 | | 3,451,000 | 3,012,128 |
| 5.05% 3/15/42 | | 1,789,000 | 1,455,188 |
| 5.141% 3/15/52 | | 5,047,000 | 3,929,636 |
| | | | 50,094,428 |
| Wireless Telecommunication Services - 0.2% | | | |
| T-Mobile U.S.A., Inc.: | | | |
| 3.75% 4/15/27 | | 3,463,000 | 3,328,498 |
| 3.875% 4/15/30 | | 5,007,000 | 4,680,677 |
| | | | 8,009,175 |
TOTAL COMMUNICATION SERVICES | | | 84,839,113 |
| CONSUMER DISCRETIONARY - 0.3% | | | |
| Specialty Retail - 0.3% | | | |
| AutoNation, Inc. 4.75% 6/1/30 | | 434,000 | 414,764 |
| AutoZone, Inc.: | | | |
| 3.625% 4/15/25 | | 649,000 | 639,084 |
| 4% 4/15/30 | | 3,015,000 | 2,835,054 |
| Lowe's Companies, Inc.: | | | |
| 3.35% 4/1/27 | | 384,000 | 366,368 |
| 3.75% 4/1/32 | | 1,183,000 | 1,074,047 |
| 4.45% 4/1/62 | | 4,962,000 | 3,857,558 |
| 4.5% 4/15/30 | | 2,166,000 | 2,101,952 |
| O'Reilly Automotive, Inc. 4.2% 4/1/30 | | 668,000 | 635,786 |
| | | | 11,924,613 |
| CONSUMER STAPLES - 0.7% | | | |
| Beverages - 0.2% | | | |
| Molson Coors Beverage Co. 5% 5/1/42 | | 7,433,000 | 6,798,756 |
| Food Products - 0.0% | | | |
| General Mills, Inc. 2.875% 4/15/30 | | 408,000 | 361,892 |
| Tobacco - 0.5% | | | |
| Altria Group, Inc.: | | | |
| 4.25% 8/9/42 | | 3,140,000 | 2,498,413 |
| 4.5% 5/2/43 | | 2,104,000 | 1,722,307 |
| 4.8% 2/14/29 | | 575,000 | 565,524 |
| 5.95% 2/14/49 | | 753,000 | 738,308 |
| BAT Capital Corp. 6.421% 8/2/33 | | 1,907,000 | 1,993,815 |
| Imperial Brands Finance PLC: | | | |
| 4.25% 7/21/25 (b) | | 8,792,000 | 8,658,317 |
| 6.125% 7/27/27 (b) | | 1,890,000 | 1,922,797 |
| Reynolds American, Inc.: | | | |
| 4.45% 6/12/25 | | 824,000 | 814,348 |
| 5.7% 8/15/35 | | 689,000 | 672,785 |
| 6.15% 9/15/43 | | 2,271,000 | 2,185,865 |
| 7.25% 6/15/37 | | 1,681,000 | 1,816,667 |
| | | | 23,589,146 |
TOTAL CONSUMER STAPLES | | | 30,749,794 |
| ENERGY - 3.0% | | | |
| Energy Equipment & Services - 0.0% | | | |
| Halliburton Co. 4.85% 11/15/35 | | 1,223,000 | 1,163,261 |
| Oil, Gas & Consumable Fuels - 3.0% | | | |
| Canadian Natural Resources Ltd. 5.85% 2/1/35 | | 1,417,000 | 1,405,583 |
| Columbia Pipeline Group, Inc. 4.5% 6/1/25 | | 758,000 | 748,688 |
| Columbia Pipelines Operating Co. LLC: | | | |
| 5.927% 8/15/30 (b) | | 547,000 | 558,736 |
| 6.036% 11/15/33 (b) | | 1,473,000 | 1,505,284 |
| 6.497% 8/15/43 (b) | | 440,000 | 458,251 |
| 6.544% 11/15/53 (b) | | 793,000 | 835,576 |
| 6.714% 8/15/63 (b) | | 475,000 | 502,537 |
| DCP Midstream Operating LP: | | | |
| 5.6% 4/1/44 | | 697,000 | 667,487 |
| 6.45% 11/3/36 (b) | | 1,406,000 | 1,479,708 |
| Enbridge, Inc. 4.25% 12/1/26 | | 1,006,000 | 982,142 |
| Energy Transfer LP: | | | |
| 3.75% 5/15/30 | | 1,314,000 | 1,208,755 |
| 4.95% 6/15/28 | | 2,298,000 | 2,267,638 |
| 5% 5/15/50 | | 3,733,000 | 3,168,629 |
| 5.25% 4/15/29 | | 1,165,000 | 1,160,389 |
| 5.4% 10/1/47 | | 766,000 | 685,254 |
| 5.8% 6/15/38 | | 1,282,000 | 1,254,835 |
| 6% 6/15/48 | | 834,000 | 803,622 |
| 6.25% 4/15/49 | | 800,000 | 795,829 |
| Hess Corp.: | | | |
| 4.3% 4/1/27 | | 2,776,000 | 2,706,702 |
| 5.6% 2/15/41 | | 7,441,000 | 7,416,847 |
| 7.125% 3/15/33 | | 569,000 | 638,675 |
| 7.3% 8/15/31 | | 762,000 | 849,401 |
| 7.875% 10/1/29 | | 2,490,000 | 2,784,755 |
| Kinder Morgan Energy Partners LP 6.55% 9/15/40 | | 261,000 | 268,743 |
| Kinder Morgan, Inc. 5.55% 6/1/45 | | 1,383,000 | 1,289,968 |
| MPLX LP: | | | |
| 4.8% 2/15/29 | | 640,000 | 627,321 |
| 4.875% 12/1/24 | | 1,553,000 | 1,546,351 |
| 4.95% 9/1/32 | | 3,480,000 | 3,329,694 |
| 5.5% 2/15/49 | | 1,917,000 | 1,768,355 |
| Occidental Petroleum Corp.: | | | |
| 5.55% 3/15/26 | | 3,587,000 | 3,580,207 |
| 6.2% 3/15/40 | | 965,000 | 966,881 |
| 6.45% 9/15/36 | | 2,612,000 | 2,728,242 |
| 6.6% 3/15/46 | | 3,240,000 | 3,380,075 |
| 7.5% 5/1/31 | | 4,360,000 | 4,810,087 |
| Petroleos Mexicanos: | | | |
| 4.5% 1/23/26 | | 3,020,000 | 2,869,944 |
| 5.95% 1/28/31 | | 3,652,000 | 2,935,295 |
| 6.35% 2/12/48 | | 7,493,000 | 4,752,810 |
| 6.49% 1/23/27 | | 2,174,000 | 2,084,649 |
| 6.5% 3/13/27 | | 2,742,000 | 2,611,481 |
| 6.5% 1/23/29 | | 3,157,000 | 2,849,193 |
| 6.7% 2/16/32 | | 7,536,000 | 6,305,145 |
| 6.75% 9/21/47 | | 6,872,000 | 4,527,755 |
| 6.84% 1/23/30 | | 4,227,000 | 3,717,224 |
| 6.95% 1/28/60 | | 4,473,000 | 2,937,643 |
| 7.69% 1/23/50 | | 9,202,000 | 6,632,618 |
| Plains All American Pipeline LP/PAA Finance Corp. 3.55% 12/15/29 | | 751,000 | 685,745 |
| Sabine Pass Liquefaction LLC 4.5% 5/15/30 | | 4,528,000 | 4,343,852 |
| The Williams Companies, Inc.: | | | |
| 3.5% 11/15/30 | | 4,829,000 | 4,377,037 |
| 3.9% 1/15/25 | | 690,000 | 683,441 |
| 4.65% 8/15/32 | | 3,633,000 | 3,450,776 |
| 5.3% 8/15/52 | | 824,000 | 762,226 |
| Transcontinental Gas Pipe Line Co. LLC 3.25% 5/15/30 | | 577,000 | 520,635 |
| Western Midstream Operating LP: | | | |
| 3.95% 6/1/25 | | 493,000 | 483,692 |
| 4.5% 3/1/28 | | 1,136,000 | 1,095,457 |
| 4.65% 7/1/26 | | 5,141,000 | 5,041,085 |
| 4.75% 8/15/28 | | 656,000 | 641,152 |
| | | | 123,490,102 |
TOTAL ENERGY | | | 124,653,363 |
| FINANCIALS - 12.1% | | | |
| Banks - 4.9% | | | |
| Bank of America Corp.: | | | |
| 2.299% 7/21/32 (c) | | 8,618,000 | 7,054,923 |
| 3.419% 12/20/28 (c) | | 10,766,000 | 10,123,525 |
| 4.2% 8/26/24 | | 11,341,000 | 11,312,388 |
| 4.25% 10/22/26 | | 2,419,000 | 2,358,958 |
| 4.45% 3/3/26 | | 861,000 | 846,693 |
| 5.015% 7/22/33 (c) | | 18,422,000 | 18,006,052 |
| Barclays PLC: | | | |
| 5.088% 6/20/30 (c) | | 4,171,000 | 3,987,681 |
| 5.2% 5/12/26 | | 3,533,000 | 3,492,441 |
| 5.829% 5/9/27 (c) | | 1,900,000 | 1,902,786 |
| 6.224% 5/9/34 (c) | | 1,900,000 | 1,946,798 |
| BNP Paribas SA 2.219% 6/9/26 (b)(c) | | 4,281,000 | 4,138,341 |
| Citigroup, Inc.: | | | |
| 3.875% 3/26/25 | | 5,393,000 | 5,318,730 |
| 4.3% 11/20/26 | | 983,000 | 958,865 |
| 4.412% 3/31/31 (c) | | 6,030,000 | 5,747,014 |
| 4.45% 9/29/27 | | 9,708,000 | 9,462,716 |
| 4.6% 3/9/26 | | 1,246,000 | 1,225,980 |
| 4.91% 5/24/33 (c) | | 5,644,000 | 5,419,709 |
| 5.5% 9/13/25 | | 3,136,000 | 3,132,545 |
| Citizens Financial Group, Inc. 2.638% 9/30/32 | | 2,757,000 | 2,115,063 |
| Commonwealth Bank of Australia 3.61% 9/12/34 (b)(c) | | 1,485,000 | 1,337,617 |
| Cooperatieve Rabobank UA 4.375% 8/4/25 | | 4,230,000 | 4,163,450 |
| HSBC Holdings PLC 4.95% 3/31/30 | | 988,000 | 971,091 |
| Intesa Sanpaolo SpA 5.71% 1/15/26 (b) | | 7,296,000 | 7,226,640 |
| JPMorgan Chase & Co.: | | | |
| 2.956% 5/13/31 (c) | | 2,452,000 | 2,148,980 |
| 3.875% 9/10/24 | | 24,838,000 | 24,740,950 |
| 4.493% 3/24/31 (c) | | 7,267,000 | 6,999,776 |
| 4.586% 4/26/33 (c) | | 15,530,000 | 14,814,628 |
| 4.912% 7/25/33 (c) | | 4,507,000 | 4,377,365 |
| NatWest Group PLC 3.073% 5/22/28 (c) | | 2,640,000 | 2,470,344 |
| Santander Holdings U.S.A., Inc. 2.49% 1/6/28 (c) | | 3,241,000 | 2,986,748 |
| Societe Generale 1.488% 12/14/26 (b)(c) | | 5,527,000 | 5,166,911 |
| Wells Fargo & Co.: | | | |
| 2.406% 10/30/25 (c) | | 2,590,000 | 2,560,576 |
| 3.526% 3/24/28 (c) | | 5,273,000 | 5,029,638 |
| 4.478% 4/4/31 (c) | | 8,118,000 | 7,772,130 |
| 5.013% 4/4/51 (c) | | 9,125,000 | 8,312,118 |
| 5.499% 1/23/35 (c) | | 2,849,000 | 2,839,009 |
| Westpac Banking Corp. 4.11% 7/24/34 (c) | | 2,107,000 | 1,946,826 |
| | | | 204,416,005 |
| Capital Markets - 3.4% | | | |
| Affiliated Managers Group, Inc. 3.5% 8/1/25 | | 1,059,000 | 1,035,697 |
| Ares Capital Corp. 3.875% 1/15/26 | | 7,074,000 | 6,830,158 |
| Athene Global Funding: | | | |
| 5.339% 1/15/27 (b) | | 5,719,000 | 5,717,567 |
| 5.583% 1/9/29 (b) | | 2,875,000 | 2,886,630 |
| Blackstone Private Credit Fund: | | | |
| 4.7% 3/24/25 | | 9,007,000 | 8,917,459 |
| 7.05% 9/29/25 | | 4,363,000 | 4,405,028 |
| Deutsche Bank AG 4.5% 4/1/25 | | 6,790,000 | 6,707,290 |
| Goldman Sachs Group, Inc.: | | | |
| 2.383% 7/21/32 (c) | | 5,355,000 | 4,397,691 |
| 3.102% 2/24/33 (c) | | 2,100,000 | 1,793,531 |
| 3.691% 6/5/28 (c) | | 23,641,000 | 22,615,497 |
| 3.8% 3/15/30 | | 8,794,000 | 8,221,788 |
| 4.25% 10/21/25 | | 1,288,000 | 1,265,429 |
| 6.75% 10/1/37 | | 1,275,000 | 1,375,507 |
| Moody's Corp. 3.75% 3/24/25 | | 2,881,000 | 2,841,941 |
| Morgan Stanley: | | | |
| 3.125% 7/27/26 | | 12,469,000 | 11,920,848 |
| 3.622% 4/1/31 (c) | | 5,698,000 | 5,228,567 |
| 3.625% 1/20/27 | | 6,245,000 | 6,021,092 |
| 4.431% 1/23/30 (c) | | 2,495,000 | 2,413,636 |
| 4.889% 7/20/33 (c) | | 9,357,000 | 9,020,237 |
| 5% 11/24/25 | | 8,309,000 | 8,251,657 |
| Peachtree Corners Funding Trust 3.976% 2/15/25 (b) | | 2,838,000 | 2,796,853 |
| UBS Group AG: | | | |
| 1.494% 8/10/27 (b)(c) | | 3,309,000 | 3,035,868 |
| 2.593% 9/11/25 (b)(c) | | 6,006,000 | 5,966,087 |
| 3.869% 1/12/29 (b)(c) | | 2,282,000 | 2,154,000 |
| 4.125% 9/24/25 (b) | | 2,986,000 | 2,927,808 |
| 4.194% 4/1/31 (b)(c) | | 5,461,000 | 5,097,979 |
| 4.55% 4/17/26 | | 1,462,000 | 1,436,669 |
| | | | 145,282,514 |
| Consumer Finance - 2.0% | | | |
| AerCap Ireland Capital Ltd./AerCap Global Aviation Trust: | | | |
| 1.65% 10/29/24 | | 1,641,000 | 1,618,767 |
| 2.45% 10/29/26 | | 2,289,000 | 2,135,256 |
| 3% 10/29/28 | | 2,397,000 | 2,178,323 |
| 3.3% 1/30/32 | | 2,564,000 | 2,203,031 |
| 3.5% 1/15/25 | | 4,712,000 | 4,652,924 |
| 4.45% 4/3/26 | | 1,774,000 | 1,741,282 |
| 6.45% 4/15/27 | | 7,503,000 | 7,674,235 |
| 6.5% 7/15/25 | | 2,058,000 | 2,073,738 |
| Ally Financial, Inc.: | | | |
| 5.125% 9/30/24 | | 1,214,000 | 1,210,906 |
| 5.8% 5/1/25 | | 2,973,000 | 2,970,173 |
| 7.1% 11/15/27 | | 4,120,000 | 4,292,721 |
| 8% 11/1/31 | | 1,535,000 | 1,694,007 |
| Capital One Financial Corp.: | | | |
| 2.636% 3/3/26 (c) | | 2,766,000 | 2,706,773 |
| 3.273% 3/1/30 (c) | | 3,538,000 | 3,193,569 |
| 3.65% 5/11/27 | | 7,652,000 | 7,317,327 |
| 3.8% 1/31/28 | | 4,006,000 | 3,808,354 |
| 4.985% 7/24/26 (c) | | 3,566,000 | 3,534,998 |
| 5.247% 7/26/30 (c) | | 4,600,000 | 4,519,132 |
| Discover Financial Services: | | | |
| 4.1% 2/9/27 | | 1,620,000 | 1,557,455 |
| 4.5% 1/30/26 | | 2,660,000 | 2,607,079 |
| 6.7% 11/29/32 | | 867,000 | 904,709 |
| Ford Motor Credit Co. LLC 4.063% 11/1/24 | | 9,996,000 | 9,935,753 |
| Synchrony Financial: | | | |
| 3.95% 12/1/27 | | 4,360,000 | 4,071,640 |
| 4.25% 8/15/24 | | 3,797,000 | 3,787,854 |
| 5.15% 3/19/29 | | 3,799,000 | 3,647,816 |
| | | | 86,037,822 |
| Financial Services - 0.9% | | | |
| Corebridge Financial, Inc.: | | | |
| 3.5% 4/4/25 | | 1,148,000 | 1,128,893 |
| 3.65% 4/5/27 | | 3,963,000 | 3,792,301 |
| 3.85% 4/5/29 | | 1,606,000 | 1,505,204 |
| 3.9% 4/5/32 | | 1,912,000 | 1,711,425 |
| 4.35% 4/5/42 | | 435,000 | 357,668 |
| 4.4% 4/5/52 | | 1,286,000 | 1,011,051 |
| Corebridge Global Funding 5.9% 9/19/28 (b) | | 2,307,000 | 2,355,303 |
| Equitable Holdings, Inc.: | | | |
| 4.35% 4/20/28 | | 2,412,000 | 2,331,583 |
| 4.572% 2/15/29 (b) | | 832,000 | 799,804 |
| Jackson Financial, Inc.: | | | |
| 3.125% 11/23/31 | | 436,000 | 365,420 |
| 5.17% 6/8/27 | | 1,735,000 | 1,729,521 |
| 5.67% 6/8/32 | | 1,866,000 | 1,878,247 |
| Jbs U.S.A. Holding Lux/ Jbs U.S.A. F: | | | |
| 2.5% 1/15/27 | | 5,004,000 | 4,655,961 |
| 3% 5/15/32 | | 4,479,000 | 3,687,217 |
| 3.625% 1/15/32 | | 1,723,000 | 1,487,428 |
| 5.125% 2/1/28 | | 1,885,000 | 1,863,308 |
| 5.5% 1/15/30 | | 717,000 | 706,073 |
| 5.75% 4/1/33 | | 2,818,000 | 2,811,269 |
| Pine Street Trust II 5.568% 2/15/49 (b) | | 3,236,000 | 2,969,051 |
| | | | 37,146,727 |
| Insurance - 0.9% | | | |
| AIA Group Ltd. 3.375% 4/7/30 (b) | | 4,177,000 | 3,803,539 |
| Five Corners Funding Trust II 2.85% 5/15/30 (b) | | 6,263,000 | 5,514,406 |
| Liberty Mutual Group, Inc. 4.569% 2/1/29 (b) | | 2,324,000 | 2,265,614 |
| Marsh & McLennan Companies, Inc. 4.375% 3/15/29 | | 2,258,000 | 2,205,949 |
| Massachusetts Mutual Life Insurance Co. 3.729% 10/15/70 (b) | | 3,298,000 | 2,227,546 |
| MetLife, Inc. 5.375% 7/15/33 | | 6,529,000 | 6,581,693 |
| Pacific LifeCorp 5.125% 1/30/43 (b) | | 2,981,000 | 2,756,321 |
| Swiss Re Finance Luxembourg SA 5% 4/2/49 (b)(c) | | 600,000 | 577,500 |
| TIAA Asset Management Finance LLC 4.125% 11/1/24 (b) | | 1,006,000 | 999,711 |
| Unum Group: | | | |
| 3.875% 11/5/25 | | 2,759,000 | 2,686,591 |
| 4% 6/15/29 | | 2,503,000 | 2,358,819 |
| 5.75% 8/15/42 | | 4,132,000 | 3,973,043 |
| | | | 35,950,732 |
TOTAL FINANCIALS | | | 508,833,800 |
| HEALTH CARE - 1.5% | | | |
| Biotechnology - 0.3% | | | |
| Amgen, Inc.: | | | |
| 5.15% 3/2/28 | | 2,052,000 | 2,051,699 |
| 5.25% 3/2/30 | | 1,874,000 | 1,887,747 |
| 5.25% 3/2/33 | | 2,115,000 | 2,108,836 |
| 5.6% 3/2/43 | | 2,009,000 | 1,979,923 |
| 5.65% 3/2/53 | | 999,000 | 983,858 |
| 5.75% 3/2/63 | | 1,820,000 | 1,782,203 |
| | | | 10,794,266 |
| Health Care Providers & Services - 0.9% | | | |
| Centene Corp.: | | | |
| 2.45% 7/15/28 | | 5,569,000 | 4,944,324 |
| 2.625% 8/1/31 | | 2,597,000 | 2,132,702 |
| 3.375% 2/15/30 | | 2,896,000 | 2,570,529 |
| 4.25% 12/15/27 | | 3,262,000 | 3,114,513 |
| 4.625% 12/15/29 | | 5,066,000 | 4,791,550 |
| Cigna Group 4.8% 8/15/38 | | 2,144,000 | 1,970,003 |
| CVS Health Corp.: | | | |
| 3% 8/15/26 | | 355,000 | 338,282 |
| 3.625% 4/1/27 | | 1,019,000 | 977,457 |
| 4.78% 3/25/38 | | 3,388,000 | 3,024,862 |
| 5% 1/30/29 | | 1,590,000 | 1,573,690 |
| 5.25% 1/30/31 | | 652,000 | 644,601 |
| HCA Holdings, Inc.: | | | |
| 3.5% 9/1/30 | | 2,160,000 | 1,948,399 |
| 3.625% 3/15/32 | | 487,000 | 428,980 |
| 5.625% 9/1/28 | | 2,246,000 | 2,267,623 |
| 5.875% 2/1/29 | | 2,447,000 | 2,491,288 |
| Humana, Inc. 3.7% 3/23/29 | | 1,508,000 | 1,414,131 |
| Sabra Health Care LP 3.2% 12/1/31 | | 5,311,000 | 4,414,843 |
| Toledo Hospital 5.325% 11/15/28 | | 1,197,000 | 1,143,135 |
| | | | 40,190,912 |
| Pharmaceuticals - 0.3% | | | |
| Bayer U.S. Finance II LLC 4.25% 12/15/25 (b) | | 2,477,000 | 2,423,195 |
| Elanco Animal Health, Inc. 6.65% 8/28/28 (c) | | 757,000 | 767,347 |
| Mylan NV 4.55% 4/15/28 | | 2,271,000 | 2,187,710 |
| Utah Acquisition Sub, Inc. 3.95% 6/15/26 | | 1,447,000 | 1,403,000 |
| Viatris, Inc.: | | | |
| 1.65% 6/22/25 | | 558,000 | 536,282 |
| 2.7% 6/22/30 | | 2,837,000 | 2,407,900 |
| 3.85% 6/22/40 | | 484,000 | 353,417 |
| 4% 6/22/50 | | 1,400,000 | 942,169 |
| | | | 11,021,020 |
TOTAL HEALTH CARE | | | 62,006,198 |
| INDUSTRIALS - 0.7% | | | |
| Aerospace & Defense - 0.4% | | | |
| BAE Systems PLC 3.4% 4/15/30 (b) | | 1,287,000 | 1,165,606 |
| The Boeing Co.: | | | |
| 5.04% 5/1/27 | | 1,681,000 | 1,643,962 |
| 5.15% 5/1/30 | | 1,681,000 | 1,614,241 |
| 5.705% 5/1/40 | | 1,703,000 | 1,570,106 |
| 5.805% 5/1/50 | | 1,703,000 | 1,534,744 |
| 5.93% 5/1/60 | | 1,680,000 | 1,502,006 |
| 6.259% 5/1/27 (b) | | 888,000 | 894,003 |
| 6.298% 5/1/29 (b) | | 1,138,000 | 1,154,001 |
| 6.388% 5/1/31 (b) | | 862,000 | 877,565 |
| 6.528% 5/1/34 (b) | | 923,000 | 945,059 |
| 6.858% 5/1/54 (b) | | 1,389,000 | 1,425,353 |
| 7.008% 5/1/64 (b) | | 1,311,000 | 1,342,294 |
| | | | 15,668,940 |
| Building Products - 0.0% | | | |
| Carrier Global Corp.: | | | |
| 5.9% 3/15/34 | | 440,000 | 459,214 |
| 6.2% 3/15/54 | | 456,000 | 488,213 |
| | | | 947,427 |
| Professional Services - 0.0% | | | |
| Thomson Reuters Corp. 3.85% 9/29/24 | | 587,000 | 583,800 |
| Trading Companies & Distributors - 0.1% | | | |
| Air Lease Corp.: | | | |
| 3.375% 7/1/25 | | 3,659,000 | 3,575,376 |
| 4.25% 9/15/24 | | 2,024,000 | 2,017,159 |
| | | | 5,592,535 |
| Transportation Infrastructure - 0.2% | | | |
| Avolon Holdings Funding Ltd.: | | | |
| 4.25% 4/15/26 (b) | | 897,000 | 871,246 |
| 4.375% 5/1/26 (b) | | 2,653,000 | 2,580,671 |
| 6.375% 5/4/28 (b) | | 3,488,000 | 3,542,112 |
| | | | 6,994,029 |
TOTAL INDUSTRIALS | | | 29,786,731 |
| INFORMATION TECHNOLOGY - 0.7% | | | |
| Electronic Equipment, Instruments & Components - 0.1% | | | |
| Dell International LLC/EMC Corp.: | | | |
| 5.85% 7/15/25 | | 735,000 | 736,781 |
| 6.02% 6/15/26 | | 634,000 | 640,633 |
| 6.1% 7/15/27 | | 1,349,000 | 1,383,348 |
| 6.2% 7/15/30 | | 1,167,000 | 1,225,110 |
| | | | 3,985,872 |
| Semiconductors & Semiconductor Equipment - 0.4% | | | |
| Broadcom, Inc.: | | | |
| 1.95% 2/15/28 (b) | | 944,000 | 845,030 |
| 2.45% 2/15/31 (b) | | 8,034,000 | 6,765,517 |
| 2.6% 2/15/33 (b) | | 8,034,000 | 6,510,799 |
| 3.5% 2/15/41 (b) | | 6,488,000 | 4,973,390 |
| | | | 19,094,736 |
| Software - 0.2% | | | |
| Oracle Corp.: | | | |
| 2.3% 3/25/28 | | 5,824,000 | 5,265,502 |
| 3.6% 4/1/40 | | 3,327,000 | 2,557,184 |
| | | | 7,822,686 |
TOTAL INFORMATION TECHNOLOGY | | | 30,903,294 |
| MATERIALS - 0.1% | | | |
| Chemicals - 0.1% | | | |
| Celanese U.S. Holdings LLC: | | | |
| 6.35% 11/15/28 | | 1,918,000 | 1,970,708 |
| 6.55% 11/15/30 | | 1,944,000 | 2,031,467 |
| 6.7% 11/15/33 | | 1,136,000 | 1,193,765 |
| | | | 5,195,940 |
| REAL ESTATE - 3.0% | | | |
| Equity Real Estate Investment Trusts (REITs) - 2.6% | | | |
| Alexandria Real Estate Equities, Inc. 4.9% 12/15/30 | | 2,366,000 | 2,315,571 |
| American Homes 4 Rent LP: | | | |
| 2.375% 7/15/31 | | 427,000 | 346,930 |
| 3.625% 4/15/32 | | 1,758,000 | 1,536,998 |
| 5.5% 7/15/34 | | 4,187,000 | 4,113,896 |
| Boston Properties, Inc.: | | | |
| 3.25% 1/30/31 | | 2,203,000 | 1,862,024 |
| 4.5% 12/1/28 | | 2,209,000 | 2,083,793 |
| 6.75% 12/1/27 | | 2,669,000 | 2,737,917 |
| Brixmor Operating Partnership LP: | | | |
| 4.05% 7/1/30 | | 2,875,000 | 2,668,066 |
| 4.125% 6/15/26 | | 2,638,000 | 2,568,369 |
| 4.125% 5/15/29 | | 2,868,000 | 2,706,988 |
| Corporate Office Properties LP: | | | |
| 2% 1/15/29 | | 328,000 | 278,110 |
| 2.25% 3/15/26 | | 945,000 | 892,198 |
| 2.75% 4/15/31 | | 914,000 | 755,686 |
| Healthcare Realty Holdings LP: | | | |
| 3.1% 2/15/30 | | 745,000 | 651,456 |
| 3.5% 8/1/26 | | 775,000 | 742,414 |
| Healthpeak OP, LLC: | | | |
| 3.25% 7/15/26 | | 325,000 | 311,262 |
| 3.5% 7/15/29 | | 373,000 | 344,557 |
| Hudson Pacific Properties LP 4.65% 4/1/29 | | 4,395,000 | 3,384,745 |
| Invitation Homes Operating Partnership LP 4.15% 4/15/32 | | 2,644,000 | 2,412,054 |
| Kite Realty Group Trust: | | | |
| 4% 3/15/25 | | 3,537,000 | 3,483,713 |
| 4.75% 9/15/30 | | 5,514,000 | 5,266,737 |
| LXP Industrial Trust (REIT) 2.7% 9/15/30 | | 1,037,000 | 874,918 |
| Omega Healthcare Investors, Inc.: | | | |
| 3.25% 4/15/33 | | 3,556,000 | 2,874,424 |
| 3.375% 2/1/31 | | 1,901,000 | 1,623,604 |
| 3.625% 10/1/29 | | 3,357,000 | 2,996,998 |
| 4.5% 1/15/25 | | 1,520,000 | 1,507,796 |
| 4.5% 4/1/27 | | 9,194,000 | 8,900,872 |
| 4.75% 1/15/28 | | 3,623,000 | 3,505,603 |
| 5.25% 1/15/26 | | 3,228,000 | 3,196,760 |
| Phillips Edison Grocery Center Operating Partnership I LP 5.75% 7/15/34 | | 654,000 | 645,853 |
| Piedmont Operating Partnership LP 2.75% 4/1/32 | | 834,000 | 611,676 |
| Realty Income Corp.: | | | |
| 2.2% 6/15/28 | | 453,000 | 405,303 |
| 2.85% 12/15/32 | | 556,000 | 458,224 |
| 3.25% 1/15/31 | | 579,000 | 512,180 |
| 3.4% 1/15/28 | | 904,000 | 852,095 |
| Simon Property Group LP 2.45% 9/13/29 | | 924,000 | 811,782 |
| SITE Centers Corp.: | | | |
| 3.625% 2/1/25 | | 1,284,000 | 1,266,953 |
| 4.25% 2/1/26 | | 1,677,000 | 1,658,454 |
| Store Capital LLC: | | | |
| 2.75% 11/18/30 | | 4,952,000 | 4,103,062 |
| 4.625% 3/15/29 | | 1,018,000 | 961,443 |
| Sun Communities Operating LP: | | | |
| 2.3% 11/1/28 | | 948,000 | 833,345 |
| 2.7% 7/15/31 | | 2,448,000 | 2,021,881 |
| Ventas Realty LP: | | | |
| 3% 1/15/30 | | 4,331,000 | 3,823,624 |
| 4% 3/1/28 | | 1,273,000 | 1,214,225 |
| 4.125% 1/15/26 | | 884,000 | 863,744 |
| 4.375% 2/1/45 | | 433,000 | 340,025 |
| 4.75% 11/15/30 | | 5,686,000 | 5,457,303 |
| VICI Properties LP: | | | |
| 4.375% 5/15/25 | | 446,000 | 440,078 |
| 4.75% 2/15/28 | | 3,531,000 | 3,448,891 |
| 4.95% 2/15/30 | | 4,599,000 | 4,436,840 |
| 5.125% 5/15/32 | | 1,205,000 | 1,148,046 |
| 5.75% 4/1/34 | | 503,000 | 498,286 |
| Vornado Realty LP 2.15% 6/1/26 | | 1,069,000 | 985,915 |
| WP Carey, Inc.: | | | |
| 2.4% 2/1/31 | | 2,157,000 | 1,789,309 |
| 3.85% 7/15/29 | | 724,000 | 675,982 |
| 4% 2/1/25 | | 3,043,000 | 3,006,523 |
| | | | 110,215,501 |
| Real Estate Management & Development - 0.4% | | | |
| Brandywine Operating Partnership LP: | | | |
| 3.95% 11/15/27 | | 2,619,000 | 2,373,001 |
| 4.55% 10/1/29 | | 3,316,000 | 2,886,171 |
| 8.05% 3/15/28 | | 3,596,000 | 3,730,433 |
| CBRE Group, Inc. 2.5% 4/1/31 | | 3,160,000 | 2,625,041 |
| Tanger Properties LP: | | | |
| 2.75% 9/1/31 | | 2,490,000 | 2,028,587 |
| 3.125% 9/1/26 | | 3,468,000 | 3,269,322 |
| | | | 16,912,555 |
TOTAL REAL ESTATE | | | 127,128,056 |
| UTILITIES - 1.0% | | | |
| Electric Utilities - 0.5% | | | |
| Alabama Power Co. 3.05% 3/15/32 | | 3,742,000 | 3,235,728 |
| Cleco Corporate Holdings LLC: | | | |
| 3.375% 9/15/29 | | 1,957,000 | 1,713,509 |
| 3.743% 5/1/26 | | 7,482,000 | 7,212,685 |
| Duke Energy Corp. 2.45% 6/1/30 | | 1,580,000 | 1,356,641 |
| Duquesne Light Holdings, Inc.: | | | |
| 2.532% 10/1/30 (b) | | 750,000 | 630,954 |
| 2.775% 1/7/32 (b) | | 2,595,000 | 2,106,277 |
| Entergy Corp. 2.8% 6/15/30 | | 1,621,000 | 1,415,799 |
| Exelon Corp.: | | | |
| 2.75% 3/15/27 | | 829,000 | 776,966 |
| 3.35% 3/15/32 | | 1,006,000 | 881,988 |
| 4.05% 4/15/30 | | 988,000 | 927,144 |
| | | | 20,257,691 |
| Gas Utilities - 0.0% | | | |
| Nakilat, Inc. 6.067% 12/31/33 (b) | | 822,627 | 852,447 |
| Independent Power and Renewable Electricity Producers - 0.2% | | | |
| Emera U.S. Finance LP 3.55% 6/15/26 | | 1,074,000 | 1,029,942 |
| The AES Corp.: | | | |
| 2.45% 1/15/31 | | 1,088,000 | 895,762 |
| 3.3% 7/15/25 (b) | | 4,877,000 | 4,754,492 |
| 3.95% 7/15/30 (b) | | 4,253,000 | 3,888,657 |
| | | | 10,568,853 |
| Multi-Utilities - 0.3% | | | |
| Consolidated Edison Co. of New York, Inc. 3.35% 4/1/30 | | 449,000 | 412,221 |
| NiSource, Inc.: | | | |
| 2.95% 9/1/29 | | 4,856,000 | 4,364,512 |
| 3.6% 5/1/30 | | 2,477,000 | 2,273,057 |
| Puget Energy, Inc.: | | | |
| 4.1% 6/15/30 | | 1,909,000 | 1,756,333 |
| 4.224% 3/15/32 | | 3,417,000 | 3,062,734 |
| WEC Energy Group, Inc. CME Term SOFR 3 Month Index + 2.110% 7.6965% 5/15/67 (c)(d) | | 810,000 | 800,728 |
| | | | 12,669,585 |
TOTAL UTILITIES | | | 44,348,576 |
| TOTAL NONCONVERTIBLE BONDS (Cost $1,183,754,047) | | | 1,060,369,478 |
| | | | |
| U.S. Treasury Obligations - 42.6% |
| | | Principal Amount (a) | Value ($) |
| U.S. Treasury Bonds: | | | |
| 1.125% 5/15/40 | | 22,865,200 | 14,070,136 |
| 1.75% 8/15/41 | | 80,591,100 | 53,253,088 |
| 1.875% 11/15/51 | | 50,329,100 | 29,214,470 |
| 2% 11/15/41 | | 13,511,200 | 9,282,089 |
| 2% 8/15/51 | | 104,090,400 | 62,527,428 |
| 2.25% 2/15/52 | | 38,732,200 | 24,673,622 |
| 3% 2/15/47 | | 55,093,200 | 42,223,773 |
| 3.375% 8/15/42 | | 58,000,000 | 48,987,344 |
| 3.625% 5/15/53 | | 4,500,000 | 3,829,395 |
| 4.125% 8/15/53 | | 133,426,000 | 124,247,751 |
| 4.25% 2/15/54 | | 95,700,000 | 91,124,344 |
| 4.625% 5/15/54 | | 18,670,000 | 18,929,630 |
| U.S. Treasury Notes: | | | |
| 1.125% 8/31/28 | | 70,526,300 | 61,790,405 |
| 1.25% 5/31/28 | | 155,752,000 | 138,083,883 |
| 1.25% 9/30/28 | | 15,938,200 | 14,005,693 |
| 1.75% 1/31/29 | | 27,595,700 | 24,605,447 |
| 2.625% 7/31/29 | | 37,400,000 | 34,462,055 |
| 2.875% 5/15/32 | | 88,237,000 | 79,499,469 |
| 3.375% 5/15/33 | | 211,100,000 | 195,638,571 |
| 3.5% 2/15/33 | | 144,500,000 | 135,434,882 |
| 3.75% 5/31/30 | | 37,700,000 | 36,508,621 |
| 3.75% 6/30/30 | | 7,000,000 | 6,775,781 |
| 3.875% 8/15/33 | | 42,294,000 | 40,688,150 |
| 4% 1/15/27 | | 3,800,000 | 3,744,781 |
| 4% 6/30/28 | | 25,000,000 | 24,620,117 |
| 4% 1/31/31 | | 110,400,000 | 108,179,062 |
| 4% 2/15/34 | | 64,400,000 | 62,508,250 |
| 4.125% 2/15/27 | | 13,710,000 | 13,552,549 |
| 4.125% 7/31/28 | | 25,000,000 | 24,735,352 |
| 4.125% 8/31/30 | | 71,100,000 | 70,194,586 |
| 4.125% 11/15/32 | | 18,600,000 | 18,286,852 |
| 4.25% 3/15/27 | | 13,760,000 | 13,649,813 |
| 4.25% 2/28/31 | | 20,000 | 19,882 |
| 4.375% 11/30/30 | | 65,000,000 | 65,053,320 |
| 4.375% 5/15/34 | | 1,270,000 | 1,270,397 |
| 4.5% 4/15/27 | | 1,470,000 | 1,467,818 |
| 4.5% 5/31/29 | | 2,040,000 | 2,053,866 |
| 4.5% 11/15/33 | | 45,000,000 | 45,414,844 |
| 4.625% 6/15/27 | | 4,260,000 | 4,272,314 |
| 4.625% 4/30/31 | | 43,300,000 | 43,996,859 |
| 4.625% 5/31/31 | | 1,640,000 | 1,666,650 |
| TOTAL U.S. TREASURY OBLIGATIONS (Cost $2,006,263,519) | | | 1,794,543,339 |
| | | | |
| U.S. Government Agency - Mortgage Securities - 27.7% |
| | | Principal Amount (a) | Value ($) |
| Fannie Mae - 6.9% | | | |
| Refinitiv USD IBOR Consumer Cash Fallbacks Term 1Y + 1.310% 6.438% 5/1/34 (c)(d) | | 11,640 | 11,694 |
| Refinitiv USD IBOR Consumer Cash Fallbacks Term 1Y + 1.420% 5.572% 9/1/33 (c)(d) | | 29,771 | 29,918 |
| Refinitiv USD IBOR Consumer Cash Fallbacks Term 1Y + 1.480% 5.73% 7/1/34 (c)(d) | | 1,437 | 1,460 |
| Refinitiv USD IBOR Consumer Cash Fallbacks Term 1Y + 1.550% 5.803% 6/1/36 (c)(d) | | 3,596 | 3,667 |
| Refinitiv USD IBOR Consumer Cash Fallbacks Term 1Y + 1.550% 7.174% 10/1/33 (c)(d) | | 1,406 | 1,419 |
| Refinitiv USD IBOR Consumer Cash Fallbacks Term 1Y + 1.560% 7.359% 7/1/35 (c)(d) | | 1,968 | 1,990 |
| Refinitiv USD IBOR Consumer Cash Fallbacks Term 1Y + 1.640% 6.274% 11/1/36 (c)(d) | | 33,223 | 33,843 |
| Refinitiv USD IBOR Consumer Cash Fallbacks Term 1Y + 1.700% 7.16% 6/1/42 (c)(d) | | 21,000 | 21,464 |
| Refinitiv USD IBOR Consumer Cash Fallbacks Term 1Y + 1.730% 7.393% 5/1/36 (c)(d) | | 20,098 | 20,513 |
| Refinitiv USD IBOR Consumer Cash Fallbacks Term 1Y + 1.750% 6.325% 7/1/35 (c)(d) | | 2,319 | 2,363 |
| Refinitiv USD IBOR Consumer Cash Fallbacks Term 1Y + 1.780% 6.163% 2/1/36 (c)(d) | | 11,254 | 11,485 |
| Refinitiv USD IBOR Consumer Cash Fallbacks Term 1Y + 1.800% 6.05% 7/1/41 (c)(d) | | 6,350 | 6,516 |
| Refinitiv USD IBOR Consumer Cash Fallbacks Term 1Y + 1.810% 6.068% 9/1/41 (c)(d) | | 9,384 | 9,654 |
| Refinitiv USD IBOR Consumer Cash Fallbacks Term 1Y + 1.810% 6.145% 7/1/41 (c)(d) | | 12,615 | 12,965 |
| Refinitiv USD IBOR Consumer Cash Fallbacks Term 1Y + 1.820% 6.195% 12/1/35 (c)(d) | | 11,697 | 11,970 |
| Refinitiv USD IBOR Consumer Cash Fallbacks Term 1Y + 1.830% 6.08% 10/1/41 (c)(d) | | 8,161 | 8,251 |
| Refinitiv USD IBOR Consumer Cash Fallbacks Term 1Y + 1.950% 6.385% 9/1/36 (c)(d) | | 21,107 | 21,679 |
| Refinitiv USD IBOR Consumer Cash Fallbacks Term 1Y + 1.950% 7.515% 7/1/37 (c)(d) | | 8,027 | 8,258 |
| U.S. TREASURY 1 YEAR INDEX + 1.940% 5.87% 10/1/33 (c)(d) | | 30,034 | 30,340 |
| U.S. TREASURY 1 YEAR INDEX + 2.200% 6.583% 3/1/35 (c)(d) | | 2,623 | 2,649 |
| U.S. TREASURY 1 YEAR INDEX + 2.220% 6.392% 8/1/36 (c)(d) | | 35,475 | 35,899 |
| U.S. TREASURY 1 YEAR INDEX + 2.280% 6.402% 10/1/33 (c)(d) | | 4,146 | 4,200 |
| U.S. TREASURY 1 YEAR INDEX + 2.420% 6.851% 5/1/35 (c)(d) | | 4,476 | 4,539 |
| 1.5% 11/1/35 to 9/1/51 | | 19,441,355 | 15,816,655 |
| 2% 2/1/28 to 3/1/52 | | 64,551,772 | 53,060,934 |
| 2.5% 11/1/29 to 5/1/53 | | 74,569,906 | 63,090,634 |
| 3% 2/1/31 to 5/1/52 (e) | | 50,512,378 | 44,310,081 |
| 3.5% 9/1/35 to 9/1/52 | | 38,890,654 | 35,062,347 |
| 4% 7/1/39 to 4/1/52 | | 19,833,821 | 18,586,766 |
| 4.5% to 4.5% 5/1/25 to 4/1/53 | | 12,526,279 | 12,042,120 |
| 5% 9/1/25 to 12/1/52 | | 7,266,449 | 7,110,073 |
| 5.5% 10/1/52 to 4/1/54 | | 14,536,439 | 14,381,123 |
| 6% 10/1/34 to 6/1/54 | | 19,468,822 | 19,622,896 |
| 6.5% 7/1/32 to 6/1/54 | | 8,037,311 | 8,241,071 |
| 7% to 7% 8/1/25 to 8/1/32 | | 22,980 | 23,604 |
| 7.5% to 7.5% 9/1/25 to 11/1/31 | | 35,994 | 37,015 |
| 8% 1/1/30 | | 189 | 194 |
| 8.5% 3/1/25 | | 7 | 7 |
TOTAL FANNIE MAE | | | 291,682,256 |
| Freddie Mac - 4.5% | | | |
| Refinitiv USD IBOR Consumer Cash Fallbacks Term 1Y + 1.370% 5.625% 3/1/36 (c)(d) | | 18,069 | 18,260 |
| Refinitiv USD IBOR Consumer Cash Fallbacks Term 1Y + 1.650% 7.299% 4/1/35 (c)(d) | | 18,212 | 18,373 |
| Refinitiv USD IBOR Consumer Cash Fallbacks Term 1Y + 1.880% 6.13% 9/1/41 (c)(d) | | 12,806 | 13,133 |
| Refinitiv USD IBOR Consumer Cash Fallbacks Term 1Y + 1.880% 7.255% 4/1/41 (c)(d) | | 3,014 | 3,078 |
| Refinitiv USD IBOR Consumer Cash Fallbacks Term 1Y + 1.910% 6.16% 6/1/41 (c)(d) | | 9,447 | 9,719 |
| Refinitiv USD IBOR Consumer Cash Fallbacks Term 1Y + 1.910% 7.213% 5/1/41 (c)(d) | | 27,445 | 28,048 |
| Refinitiv USD IBOR Consumer Cash Fallbacks Term 1Y + 1.910% 7.336% 6/1/41 (c)(d) | | 25,798 | 26,436 |
| Refinitiv USD IBOR Consumer Cash Fallbacks Term 1Y + 1.910% 7.562% 5/1/41 (c)(d) | | 29,715 | 30,441 |
| Refinitiv USD IBOR Consumer Cash Fallbacks Term 1Y + 2.030% 6.158% 3/1/33 (c)(d) | | 274 | 278 |
| Refinitiv USD IBOR Consumer Cash Fallbacks Term 1Y + 2.160% 6.41% 11/1/35 (c)(d) | | 1,301 | 1,332 |
| Refinitiv USD IBOR Consumer Cash Fallbacks Term 1Y + 3.000% 8.626% 10/1/35 (c)(d) | | 1,276 | 1,312 |
| U.S. TREASURY 1 YEAR INDEX + 2.240% 6.371% 1/1/35 (c)(d) | | 2,018 | 2,033 |
| 1.5% 7/1/35 to 4/1/51 | | 20,840,391 | 16,220,077 |
| 2% 5/1/35 to 4/1/52 | | 51,000,644 | 42,208,325 |
| 2.5% 1/1/30 to 1/1/52 | | 38,947,498 | 33,483,491 |
| 3% 12/1/30 to 5/1/52 | | 18,513,827 | 16,149,225 |
| 3.5% 3/1/32 to 3/1/52 (f) | | 28,767,234 | 26,460,210 |
| 4% 5/1/37 to 10/1/52 | | 11,680,819 | 11,026,924 |
| 4.5% 7/1/25 to 10/1/48 | | 6,724,176 | 6,508,112 |
| 5% 1/1/40 to 8/1/53 | | 11,881,361 | 11,596,247 |
| 5.5% 10/1/52 to 3/1/54 | | 14,479,130 | 14,374,655 |
| 6% 4/1/32 to 4/1/54 | | 6,314,606 | 6,374,565 |
| 6.5% 9/1/53 to 1/1/54 | | 5,680,281 | 5,861,962 |
| 7.5% 8/1/26 to 11/1/31 | | 4,980 | 5,185 |
| 8% 4/1/27 to 5/1/27 | | 381 | 385 |
| 8.5% 5/1/27 to 1/1/28 | | 519 | 528 |
TOTAL FREDDIE MAC | | | 190,422,334 |
| Ginnie Mae - 7.1% | | | |
| 3% 12/20/42 to 4/20/47 | | 3,413,537 | 3,035,513 |
| 3.5% 12/20/40 to 1/20/50 | | 2,342,571 | 2,139,795 |
| 4% 2/15/40 to 4/20/48 | | 9,506,506 | 8,969,168 |
| 4.5% 5/15/39 to 5/20/41 | | 2,050,942 | 1,996,071 |
| 5% 3/15/39 to 5/20/54 | | 12,927,129 | 12,611,628 |
| 6.5% 4/15/35 to 11/15/35 | | 25,563 | 26,310 |
| 7% 1/15/28 to 7/15/32 | | 119,983 | 122,257 |
| 7.5% to 7.5% 11/15/25 to 10/15/28 | | 16,922 | 17,156 |
| 8% 3/15/30 to 9/15/30 | | 3,339 | 3,462 |
| 2% 10/20/50 to 1/20/52 | | 24,218,192 | 19,618,461 |
| 2% 7/1/54 (g) | | 14,550,000 | 11,781,662 |
| 2% 7/1/54 (g) | | 18,050,000 | 14,615,738 |
| 2% 7/1/54 (g) | | 5,800,000 | 4,696,470 |
| 2% 7/1/54 (g) | | 1,800,000 | 1,457,525 |
| 2% 7/1/54 (g) | | 9,475,000 | 7,672,251 |
| 2% 8/1/54 (g) | | 3,650,000 | 2,958,246 |
| 2% 8/1/54 (g) | | 21,750,000 | 17,627,905 |
| 2.5% 8/20/51 to 1/20/52 | | 16,366,702 | 13,580,535 |
| 2.5% 7/1/54 (g) | | 13,400,000 | 11,269,258 |
| 2.5% 7/1/54 (g) | | 13,350,000 | 11,227,208 |
| 3% 7/1/54 (g) | | 10,450,000 | 9,112,259 |
| 3% 7/1/54 (g) | | 10,275,000 | 8,959,661 |
| 3% 7/1/54 (g) | | 4,450,000 | 3,880,340 |
| 3% 7/1/54 (g) | | 5,375,000 | 4,686,927 |
| 3% 8/1/54 (g) | | 15,650,000 | 13,652,702 |
| 3% 8/1/54 (g) | | 2,600,000 | 2,268,180 |
| 3.5% 7/1/54 (g) | | 9,500,000 | 8,538,435 |
| 3.5% 7/1/54 (g) | | 10,750,000 | 9,661,913 |
| 3.5% 8/1/54 (g) | | 14,375,000 | 12,926,177 |
| 4% 7/1/54 (g) | | 5,200,000 | 4,805,505 |
| 4% 8/1/54 (g) | | 5,200,000 | 4,817,842 |
| 4.5% 7/1/54 (g) | | 10,800,000 | 10,266,166 |
| 5% 7/1/54 (g) | | 5,300,000 | 5,160,306 |
| 5% 7/1/54 (g) | | 5,300,000 | 5,160,306 |
| 5.5% 7/1/54 (g) | | 3,200,000 | 3,174,879 |
| 5.5% 7/1/54 (g) | | 2,900,000 | 2,877,234 |
| 5.5% 7/1/54 (g) | | 4,000,000 | 3,968,599 |
| 5.5% 7/1/54 (g) | | 3,700,000 | 3,670,954 |
| 5.5% 8/1/54 (g) | | 4,000,000 | 3,966,724 |
| 5.5% 8/1/54 (g) | | 2,850,000 | 2,826,291 |
| 6% 7/1/54 (g) | | 3,550,000 | 3,565,255 |
| 6% 7/1/54 (g) | | 2,875,000 | 2,887,354 |
| 6% 7/1/54 (g) | | 2,300,000 | 2,309,883 |
| 6% 7/1/54 (g) | | 6,400,000 | 6,427,501 |
| 6% 7/1/54 (g) | | 475,000 | 477,041 |
| 6% 8/1/54 (g) | | 6,100,000 | 6,122,162 |
| 6% 8/1/54 (g) | | 4,600,000 | 4,616,712 |
| 6% 8/1/54 (g) | | 2,450,000 | 2,458,901 |
TOTAL GINNIE MAE | | | 298,672,828 |
| Uniform Mortgage Backed Securities - 9.2% | | | |
| 2% 7/1/39 (g) | | 1,800,000 | 1,582,171 |
| 2% 8/1/39 (g) | | 1,800,000 | 1,583,718 |
| 2% 7/1/54 (g) | | 51,100,000 | 39,965,790 |
| 2% 7/1/54 (g) | | 16,950,000 | 13,256,754 |
| 2% 7/1/54 (g) | | 14,700,000 | 11,497,008 |
| 2% 7/1/54 (g) | | 10,900,000 | 8,524,992 |
| 2% 7/1/54 (g) | | 7,725,000 | 6,041,795 |
| 2% 7/1/54 (g) | | 4,850,000 | 3,793,231 |
| 2% 7/1/54 (g) | | 14,250,000 | 11,145,059 |
| 2% 7/1/54 (g) | | 6,000,000 | 4,692,656 |
| 2% 7/1/54 (g) | | 1,800,000 | 1,407,797 |
| 2% 7/1/54 (g) | | 3,000,000 | 2,346,328 |
| 2% 7/1/54 (g) | | 12,900,000 | 10,089,211 |
| 2% 7/1/54 (g) | | 7,375,000 | 5,768,057 |
| 2% 7/1/54 (g) | | 2,200,000 | 1,720,641 |
| 2% 8/1/54 (g) | | 67,900,000 | 53,158,272 |
| 2% 8/1/54 (g) | | 17,100,000 | 13,387,429 |
| 2% 8/1/54 (g) | | 5,900,000 | 4,619,055 |
| 2% 8/1/54 (g) | | 5,925,000 | 4,638,627 |
| 2.5% 7/1/54 (g) | | 26,300,000 | 21,479,704 |
| 2.5% 7/1/54 (g) | | 4,675,000 | 3,818,160 |
| 2.5% 7/1/54 (g) | | 4,650,000 | 3,797,742 |
| 2.5% 7/1/54 (g) | | 3,950,000 | 3,226,039 |
| 2.5% 7/1/54 (g) | | 1,750,000 | 1,429,258 |
| 2.5% 7/1/54 (g) | | 400,000 | 326,688 |
| 2.5% 7/1/54 (g) | | 3,800,000 | 3,103,531 |
| 2.5% 7/1/54 (g) | | 1,700,000 | 1,388,422 |
| 2.5% 7/1/54 (g) | | 2,225,000 | 1,817,199 |
| 2.5% 7/1/54 (g) | | 975,000 | 796,301 |
| 2.5% 7/1/54 (g) | | 800,000 | 653,375 |
| 2.5% 7/1/54 (g) | | 800,000 | 653,375 |
| 2.5% 8/1/54 (g) | | 26,100,000 | 21,335,729 |
| 2.5% 8/1/54 (g) | | 950,000 | 776,588 |
| 2.5% 8/1/54 (g) | | 500,000 | 408,730 |
| 3% 7/1/54 (g) | | 10,050,000 | 8,551,927 |
| 3% 7/1/54 (g) | | 6,500,000 | 5,531,097 |
| 3% 7/1/54 (g) | | 5,050,000 | 4,297,237 |
| 3% 7/1/54 (g) | | 1,800,000 | 1,531,688 |
| 3% 8/1/54 (g) | | 8,900,000 | 7,578,911 |
| 3% 8/1/54 (g) | | 4,750,000 | 4,044,924 |
| 3.5% 7/1/54 (g) | | 2,850,000 | 2,522,471 |
| 3.5% 7/1/54 (g) | | 700,000 | 619,554 |
| 3.5% 7/1/54 (g) | | 700,000 | 619,554 |
| 3.5% 7/1/54 (g) | | 800,000 | 708,062 |
| 3.5% 7/1/54 (g) | | 800,000 | 708,062 |
| 3.5% 7/1/54 (g) | | 700,000 | 619,554 |
| 3.5% 7/1/54 (g) | | 700,000 | 619,554 |
| 3.5% 7/1/54 (g) | | 1,075,000 | 951,458 |
| 4% 7/1/54 (g) | | 1,500,000 | 1,372,266 |
| 4% 7/1/54 (g) | | 1,000,000 | 914,844 |
| 4% 7/1/54 (g) | | 1,150,000 | 1,052,070 |
| 4% 8/1/54 (g) | | 1,150,000 | 1,052,609 |
| 5.5% 7/1/54 (g) | | 2,200,000 | 2,169,836 |
| 5.5% 7/1/54 (g) | | 6,000,000 | 5,917,734 |
| 5.5% 7/1/54 (g) | | 4,700,000 | 4,635,558 |
| 5.5% 7/1/54 (g) | | 2,700,000 | 2,662,980 |
| 6% 7/1/54 (g) | | 16,950,000 | 16,997,682 |
| 6% 7/1/54 (g) | | 5,900,000 | 5,916,597 |
| 6% 7/1/54 (g) | | 9,075,000 | 9,100,529 |
| 6% 7/1/54 (g) | | 7,800,000 | 7,821,942 |
| 6% 7/1/54 (g) | | 3,900,000 | 3,910,971 |
| 6% 8/1/54 (g) | | 19,300,000 | 19,352,031 |
| 6.5% 7/1/54 (g) | | 2,600,000 | 2,646,108 |
TOTAL UNIFORM MORTGAGE BACKED SECURITIES | | | 388,657,242 |
| TOTAL U.S. GOVERNMENT AGENCY - MORTGAGE SECURITIES (Cost $1,221,413,344) | | | 1,169,434,660 |
| | | | |
| Asset-Backed Securities - 8.2% |
| | | Principal Amount (a) | Value ($) |
| Aaset 2024-1 U.S. Ltd. / Aaset 20 Series 2024-1A: | | | |
| Class A1, 6.261% 5/16/49 (b) | | 2,330,000 | 2,331,864 |
| Class A2, 6.261% 5/16/49 (b) | | 2,130,000 | 2,132,769 |
| AASET Trust: | | | |
| Series 2018-1A Class A, 3.844% 1/16/38 (b) | | 1,244,430 | 892,246 |
| Series 2019-1 Class A, 3.844% 5/15/39 (b) | | 293,352 | 277,226 |
| Series 2019-2: | | | |
Class A, 3.376% 10/16/39 (b) | | 1,992,040 | 1,892,474 |
Class B, 4.458% 10/16/39 (b) | | 713,637 | 371,098 |
| Series 2021-1A Class A, 2.95% 11/16/41 (b) | | 2,558,638 | 2,358,117 |
| Series 2021-2A Class A, 2.798% 1/15/47 (b) | | 5,219,220 | 4,667,071 |
| Affirm Asset Securitization Trust: | | | |
| Series 2023-X1 Class A, 7.11% 11/15/28 (b) | | 517,627 | 519,280 |
| Series 2024-A Class 1A, 5.61% 2/15/29 (b) | | 600,000 | 599,073 |
| Series 2024-X1 Class A, 6.27% 5/15/29 (b) | | 1,386,410 | 1,388,098 |
| Aimco Series 2024-10A Class ARR, CME Term SOFR 3 Month Index + 1.410% 6.7414% 7/22/37 (b)(c)(d) | | 1,752,000 | 1,752,897 |
| Aimco Clo 21 Ltd. / Aimco Clo 2 Series 2024-21A Class A1, CME Term SOFR 3 Month Index + 1.500% 6.8251% 4/18/37 (b)(c)(d) | | 2,499,000 | 2,499,582 |
| Aimco Clo 22 Ltd. / Aimco Clo 2 Series 2024-22A Class A, CME Term SOFR 3 Month Index + 1.500% 6.8266% 4/19/37 (b)(c)(d) | | 800,000 | 801,598 |
| AIMCO CLO Ltd. Series 2021-11A Class AR, CME Term SOFR 3 Month Index + 1.390% 6.7087% 10/17/34 (b)(c)(d) | | 2,370,709 | 2,372,684 |
| AIMCO CLO Ltd. / AIMCO CLO LLC Series 2021-14A Class A, CME Term SOFR 3 Month Index + 1.250% 6.5762% 4/20/34 (b)(c)(d) | | 5,797,905 | 5,800,178 |
| Allegro CLO XV, Ltd. / Allegro CLO VX LLC Series 2022-1A Class A, CME Term SOFR 3 Month Index + 1.500% 6.8246% 7/20/35 (b)(c)(d) | | 3,019,149 | 3,023,255 |
| Allegro CLO, Ltd. Series 2021-1A Class A, CME Term SOFR 3 Month Index + 1.400% 6.7262% 7/20/34 (b)(c)(d) | | 2,835,654 | 2,838,189 |
| Ally Auto Receivables Trust Series 2024-1 Class A3, 5.08% 12/15/28 | | 1,889,000 | 1,884,345 |
| American Express Credit Account Master Trust Series 2023-1 Class A, 4.87% 5/15/28 | | 3,780,000 | 3,763,194 |
| Apollo Aviation Securitization Equity Trust Series 2020-1A: | | | |
| Class A, 3.351% 1/16/40 (b) | | 659,010 | 606,271 |
| Class B, 4.335% 1/16/40 (b) | | 268,430 | 162,666 |
| Ares CLO Series 2024-54A Class AR, CME Term SOFR 3 Month Index + 1.270% 6.5986% 10/15/32 (b)(c)(d) | | 3,701,000 | 3,702,295 |
| Ares LIX CLO Ltd. Series 2021-59A Class A, CME Term SOFR 3 Month Index + 1.290% 6.6152% 4/25/34 (b)(c)(d) | | 1,923,930 | 1,925,267 |
| Ares Ln Funding V Ltd. Series 2024-ALF5A Class A1, CME Term SOFR 3 Month Index + 1.500% 6.8235% 7/25/37 (b)(c)(d) | | 3,329,000 | 3,329,915 |
| Ares LV CLO Ltd. Series 2021-55A Class A1R, CME Term SOFR 3 Month Index + 1.390% 6.7202% 7/15/34 (b)(c)(d) | | 3,574,230 | 3,580,710 |
| Ares LVIII CLO LLC Series 2022-58A Class AR, CME Term SOFR 3 Month Index + 1.330% 6.6586% 1/15/35 (b)(c)(d) | | 4,768,241 | 4,770,310 |
| Ares XLI CLO Ltd. / Ares XLI CLO LLC Series 2021-41A Class AR2, CME Term SOFR 3 Month Index + 1.330% 6.6602% 4/15/34 (b)(c)(d) | | 4,022,144 | 4,022,144 |
| Babson CLO Ltd. Series 2021-1A Class AR, CME Term SOFR 3 Month Index + 1.410% 6.7402% 10/15/36 (b)(c)(d) | | 2,392,281 | 2,394,044 |
| Barings CLO Ltd.: | | | |
| Series 2021-1A Class A, CME Term SOFR 3 Month Index + 1.280% 6.6052% 4/25/34 (b)(c)(d) | | 4,224,812 | 4,225,965 |
| Series 2021-4A Class A, CME Term SOFR 3 Month Index + 1.480% 6.8062% 1/20/32 (b)(c)(d) | | 3,560,253 | 3,564,550 |
| Beechwood Park CLO Ltd. Series 2022-1A Class A1R, CME Term SOFR 3 Month Index + 1.300% 6.6171% 1/17/35 (b)(c)(d) | | 4,846,852 | 4,834,861 |
| BETHP Series 2021-1A Class A, CME Term SOFR 3 Month Index + 1.390% 6.7202% 1/15/35 (b)(c)(d) | | 3,615,104 | 3,619,496 |
| Blackbird Capital Aircraft: | | | |
| Series 2016-1A Class A, 4.213% 12/16/41 (b) | | 2,261,615 | 2,239,384 |
| Series 2021-1A Class A, 2.443% 7/15/46 (b) | | 3,809,169 | 3,407,797 |
| Bofa Auto Trust 2024-1 Series 2024-1A Class A3, 5.35% 11/15/28 (b) | | 730,000 | 732,174 |
| Bristol Park CLO, Ltd. Series 2020-1A Class AR, CME Term SOFR 3 Month Index + 1.250% 6.5802% 4/15/29 (b)(c)(d) | | 2,001,637 | 2,002,816 |
| Capital One Multi-Asset Execution Trust Series 2023-A1 Class A, 4.42% 5/15/28 | | 300,000 | 295,957 |
| Carlyle U.S. CLO Ltd. Series 2024-11A Class A1R, CME Term SOFR 3 Month Index + 1.410% 0% 7/25/37 (b)(c)(d) | | 3,967,000 | 3,967,000 |
| CarMax Auto Owner Trust Series 2023 2 Class A2A, 5.5% 6/15/26 | | 996,260 | 995,778 |
| Carmax Auto Owner Trust Series 2024-2 Class A3, 5.5% 1/16/29 | | 1,374,000 | 1,381,385 |
| Carmax Auto Owner Trust 2023-4 Series 2023-4 Class A3, 6% 7/17/28 | | 1,737,000 | 1,757,793 |
| Castlelake Aircraft Securitization Trust Series 2019-1A: | | | |
| Class A, 3.967% 4/15/39 (b) | | 2,026,222 | 1,824,117 |
| Class B, 5.095% 4/15/39 (b) | | 1,232,658 | 837,605 |
| Castlelake Aircraft Structured Trust: | | | |
| Series 2018-1 Class A, 4.125% 6/15/43 (b) | | 638,008 | 594,970 |
| Series 2021-1A Class A, 3.474% 1/15/46 (b) | | 487,715 | 458,763 |
| Cedar Funding Ltd.: | | | |
| Series 2021-10A Class AR, CME Term SOFR 3 Month Index + 1.360% 6.6862% 10/20/32 (b)(c)(d) | | 2,890,154 | 2,892,377 |
| Series 2021-12A Class A1R, CME Term SOFR 3 Month Index + 1.390% 6.7152% 10/25/34 (b)(c)(d) | | 2,218,566 | 2,221,867 |
| Series 2022-15A Class A, CME Term SOFR 3 Month Index + 1.320% 6.6446% 4/20/35 (b)(c)(d) | | 4,498,016 | 4,501,452 |
| CEDF Series 2021-6A Class ARR, CME Term SOFR 3 Month Index + 1.310% 6.6362% 4/20/34 (b)(c)(d) | | 3,494,185 | 3,494,783 |
| CFMT LLC Series 2023 HB12 Class A, 4.25% 4/25/33 (b) | | 858,448 | 841,958 |
| Chase Auto Owner Trust Series 2024-1A Class A3, 5.13% 5/25/29 (b) | | 1,776,000 | 1,774,808 |
| Chesapeake Funding II LLC: | | | |
| Series 2023-2A Class A1, 6.16% 10/15/35 (b) | | 992,187 | 997,995 |
| Series 2024-1A Class A1, 5.52% 5/15/36 (b) | | 1,356,482 | 1,355,893 |
| Citizens Auto Receivables Trust Series 2024-2 Class A3, 5.33% 8/15/28 (b) | | 900,000 | 899,756 |
| CNH Equipment Trust Series 2023 A Class A2, 5.34% 9/15/26 | | 496,841 | 496,184 |
| Columbia Cent CLO 29 Ltd./Columbia Cent CLO 29 Corp. Series 2021-29A Class AR, CME Term SOFR 3 Month Index + 1.430% 6.7562% 10/20/34 (b)(c)(d) | | 3,598,073 | 3,604,010 |
| Columbia Cent CLO 31 Ltd. Series 2021-31A Class A1, CME Term SOFR 3 Month Index + 1.460% 6.7862% 4/20/34 (b)(c)(d) | | 3,860,350 | 3,864,647 |
| Columbia Cent CLO Ltd. / Columbia Cent CLO Corp. Series 2021-30A Class A1, CME Term SOFR 3 Month Index + 1.570% 6.8962% 1/20/34 (b)(c)(d) | | 5,052,517 | 5,056,220 |
| DB Master Finance LLC Series 2017-1A Class A2II, 4.03% 11/20/47 (b) | | 3,208,125 | 3,046,249 |
| Discover Card Execution Note Trust Series 2023 A1 Class A, 4.31% 3/15/28 | | 1,800,000 | 1,772,874 |
| Dllaa 2023-1A Series 2023-1A: | | | |
| Class A2, 5.93% 7/20/26 (b) | | 444,730 | 445,323 |
| Class A3, 5.64% 2/22/28 (b) | | 770,000 | 774,142 |
| DLLAD: | | | |
| Series 2023-1A Class A3, 4.79% 1/20/28 (b) | | 700,000 | 692,972 |
| Series 2024-1A Class A3, 5.3% 7/20/29 (b) | | 598,000 | 600,113 |
| Dryden 98 CLO Ltd. Series 2022-98A Class A, CME Term SOFR 3 Month Index + 1.300% 6.6246% 4/20/35 (b)(c)(d) | | 2,526,193 | 2,530,035 |
| Dryden CLO, Ltd.: | | | |
| Series 2021-76A Class A1R, CME Term SOFR 3 Month Index + 1.410% 6.7362% 10/20/34 (b)(c)(d) | | 2,388,876 | 2,390,560 |
| Series 2024-83A Class AR, CME Term SOFR 3 Month Index + 1.530% 6.8642% 4/18/37 (b)(c)(d) | | 3,244,000 | 3,248,542 |
| Dryden Senior Loan Fund: | | | |
| Series 2021-85A Class AR, CME Term SOFR 3 Month Index + 1.410% 6.7402% 10/15/35 (b)(c)(d) | | 3,177,977 | 3,181,362 |
| Series 2021-90A Class A1A, CME Term SOFR 3 Month Index + 1.390% 6.7174% 2/20/35 (b)(c)(d) | | 1,889,869 | 1,890,793 |
| Series 2024-85A Class A1R2, CME Term SOFR 3 Month Index + 1.380% 0% 7/15/37 (b)(c)(d) | | 3,148,000 | 3,148,000 |
| Eaton Vance CLO, Ltd.: | | | |
| Series 2021-2A Class AR, CME Term SOFR 3 Month Index + 1.410% 6.7402% 1/15/35 (b)(c)(d) | | 4,330,149 | 4,336,445 |
| Series 2024-1A Class AR2, CME Term SOFR 3 Month Index + 1.510% 6.8399% 7/15/37 (b)(c)(d) | | 3,140,000 | 3,138,000 |
| Eaton Vance CLO, Ltd. / Eaton Vance CLO LLC Series 2021-1A Class A13R, CME Term SOFR 3 Month Index + 1.510% 6.8402% 1/15/34 (b)(c)(d) | | 1,005,251 | 1,006,470 |
| Enterprise Fleet Financing Series 2024-2: | | | |
| Class A2, 5.74% 12/20/26 (b) | | 1,100,000 | 1,102,914 |
| Class A3, 5.61% 4/20/28 (b) | | 1,100,000 | 1,108,966 |
| Enterprise Fleet Financing 2023-3 L Series 2023-3 Class A2, 6.4% 3/20/30 (b) | | 2,771,000 | 2,802,235 |
| Flatiron CLO Ltd. Series 2021-1A: | | | |
| Class A1, CME Term SOFR 3 Month Index + 1.370% 6.6982% 7/19/34 (b)(c)(d) | | 2,577,919 | 2,582,990 |
| Class AR, 3 month U.S. LIBOR + 1.080% 6.6683% 11/16/34 (b)(c)(d) | | 3,690,041 | 3,690,041 |
| Flatiron CLO Ltd. / Flatiron CLO LLC Series 2024-1A Class AR, CME Term SOFR 3 Month Index + 1.380% 6.6613% 5/20/36 (b)(c)(d) | | 1,600,000 | 1,602,450 |
| Ford Credit Floorplan Master Owner Trust: | | | |
| Series 2023-1 Class A1, 4.92% 5/15/28 (b) | | 2,100,000 | 2,085,921 |
| Series 2024-1 Class A1, 5.29% 4/15/29 (b) | | 2,300,000 | 2,308,729 |
| GM Financial Automobile Leasing Trust Series 2023-2 Class A2A, 5.44% 10/20/25 | | 411,716 | 411,532 |
| Gm Financial Consumer Automobile Re Series 2023-3 Class A3, 5.45% 6/16/28 | | 1,600,000 | 1,605,067 |
| GM Financial Consumer Automobile Receivables Series 2023 2 Class A3, 4.47% 2/16/28 | | 2,310,000 | 2,284,509 |
| Gm Financial Leasing Trust 202 Series 2023-3 Class A3, 5.38% 11/20/26 | | 786,000 | 785,432 |
| Gm Financial Revolving Receiva Series 2024-1 Class A, 4.98% 12/11/36 (b) | | 1,771,000 | 1,764,804 |
| Honda Auto Receivables 2023-3 Series 2023-3 Class A3, 5.41% 2/18/28 | | 800,000 | 802,043 |
| Horizon Aircraft Finance I Ltd. Series 2018-1 Class A, 4.458% 12/15/38 (b) | | 1,120,247 | 1,018,963 |
| Horizon Aircraft Finance Ltd. Series 2019-1 Class A, 3.721% 7/15/39 (b) | | 981,327 | 897,294 |
| HPEFS Equipment Trust Series 2024-2A Class A3, 5.36% 10/20/31 (b) | | 700,000 | 699,608 |
| Hyundai Auto Lease Securitizat Series 2024-B Class A3, 5.41% 5/17/27 (b) | | 2,400,000 | 2,405,228 |
| Hyundai Auto Receivables Trust Series 2024-A Class A3, 4.99% 2/15/29 | | 1,978,000 | 1,970,766 |
| Invesco CLO Ltd. Series 2021-3A Class A, CME Term SOFR 3 Month Index + 1.390% 6.7162% 10/22/34 (b)(c)(d) | | 2,531,935 | 2,535,267 |
| Invesco U.S. Clo 2024-1 Ltd. Series 2024-1RA Class AR, CME Term SOFR 3 Month Index + 1.550% 6.8694% 4/15/37 (b)(c)(d) | | 2,010,000 | 2,020,782 |
| Invesco U.S. CLO Ltd. Series 2024-3A Class A, CME Term SOFR 3 Month Index + 1.510% 6.8292% 7/20/37 (b)(c)(d) | | 2,568,000 | 2,567,640 |
| KKR CLO Ltd. Series 2022-41A Class A1, CME Term SOFR 3 Month Index + 1.330% 6.6586% 4/15/35 (b)(c)(d) | | 5,870,431 | 5,871,582 |
| Kubota Credit Owner Trust Series 2024-2A Class A3, 5.26% 11/15/28 (b) | | 1,300,000 | 1,299,184 |
| Madison Park Funding Series 2024-19A Class AR3, CME Term SOFR 3 Month Index + 1.600% 6.9246% 1/22/37 (b)(c)(d) | | 1,852,000 | 1,865,040 |
| Madison Park Funding L Ltd. / Madison Park Funding L LLC Series 2021-50A Class A, CME Term SOFR 3 Month Index + 1.400% 6.7282% 4/19/34 (b)(c)(d) | | 4,047,691 | 4,054,564 |
| Madison Park Funding LII Ltd. / Madison Park Funding LII LLC Series 2021-52A Class A, CME Term SOFR 3 Month Index + 1.360% 6.6862% 1/22/35 (b)(c)(d) | | 4,115,814 | 4,115,999 |
| Madison Park Funding XLV Ltd./Madison Park Funding XLV LLC Series 2021-45A Class AR, CME Term SOFR 3 Month Index + 1.380% 6.7102% 7/15/34 (b)(c)(d) | | 2,572,810 | 2,574,354 |
| Madison Park Funding XXXII, Ltd. / Madison Park Funding XXXII LLC Series 2021-32A Class A2R, CME Term SOFR 3 Month Index + 1.460% 6.7862% 1/22/31 (b)(c)(d) | | 1,296,427 | 1,293,410 |
| Magnetite CLO Ltd. Series 2021-27A Class AR, CME Term SOFR 3 Month Index + 1.400% 6.7262% 10/20/34 (b)(c)(d) | | 1,041,994 | 1,042,515 |
| Magnetite IX, Ltd. / Magnetite IX LLC Series 2021-30A Class A, CME Term SOFR 3 Month Index + 1.390% 6.7152% 10/25/34 (b)(c)(d) | | 4,363,331 | 4,365,652 |
| Magnetite XXI Ltd. Series 2021-21A Class AR, CME Term SOFR 3 Month Index + 1.280% 6.6062% 4/20/34 (b)(c)(d) | | 3,374,400 | 3,376,148 |
| Magnetite XXIX, Ltd. / Magnetite XXIX LLC Series 2021-29A Class A, CME Term SOFR 3 Month Index + 1.250% 6.5802% 1/15/34 (b)(c)(d) | | 3,383,415 | 3,385,698 |
| Marlette Funding Trust 2024-1 Series 2024-1A Class A, 5.95% 7/17/34 (b) | | 729,000 | 729,240 |
| Mercedes-Benz Auto Lease Trust Series 2024-A Class A3, 5.32% 1/18/28 | | 2,000,000 | 2,005,785 |
| Merchants Fleet Funding LLC: | | | |
| Series 2023-1A Class A, 7.21% 5/20/36 (b) | | 1,357,133 | 1,369,255 |
| Series 2024-1A Class A, 5.82% 4/20/37 (b) | | 1,600,000 | 1,602,288 |
| Milos CLO, Ltd. Series 2020-1A Class AR, CME Term SOFR 3 Month Index + 1.330% 6.6562% 10/20/30 (b)(c)(d) | | 2,678,327 | 2,680,336 |
| Neuberger Berman Loan Advisers Series 2024-25A Class AR2, CME Term SOFR 3 Month Index + 1.400% 6.723% 7/18/38 (b)(c)(d) | | 2,994,000 | 2,994,000 |
| Oak Hill Credit Partners Series 2024-18A Class A1, 6.7917% 4/20/37 (b)(c) | | 800,000 | 805,392 |
| Park Place Securities, Inc. Series 2005-WCH1 Class M4, CME Term SOFR 1 Month Index + 1.350% 6.7047% 1/25/36 (c)(d) | | 36,135 | 35,648 |
| Peace Park CLO, Ltd. Series 2021-1A Class A, CME Term SOFR 3 Month Index + 1.390% 6.7162% 10/20/34 (b)(c)(d) | | 1,408,460 | 1,409,630 |
| PK ALIFT Loan Funding 3 LP Series 2024-1 Class A1, 5.842% 9/15/39 (b) | | 706,000 | 706,141 |
| Planet Fitness Master Issuer LLC: | | | |
| Series 2019-1A Class A2, 3.858% 12/5/49 (b) | | 2,627,205 | 2,399,871 |
| Series 2022-1A: | | | |
Class A2I, 3.251% 12/5/51 (b) | | 2,881,670 | 2,704,736 |
Class A2II, 4.008% 12/5/51 (b) | | 2,574,735 | 2,261,462 |
| Project Silver Series 2019-1 Class A, 3.967% 7/15/44 (b) | | 1,994,149 | 1,807,357 |
| Prpm 2023-Rcf2 LLC Series 2023-RCF2 Class A1, 4% 11/25/53 (b) | | 804,298 | 767,708 |
| Rockland Park CLO Ltd. Series 2021-1A Class A, CME Term SOFR 3 Month Index + 1.380% 6.7062% 4/20/34 (b)(c)(d) | | 4,820,896 | 4,825,813 |
| RR Ltd. Series 2022-7A Class A1AB, CME Term SOFR 3 Month Index + 1.340% 6.6686% 1/15/37 (b)(c)(d) | | 4,874,693 | 4,877,101 |
| Sapphire Aviation Finance Series 2020-1A: | | | |
| Class A, 3.228% 3/15/40 (b) | | 2,130,630 | 1,955,151 |
| Class B, 4.335% 3/15/40 (b) | | 411,408 | 321,992 |
| SBA Tower Trust: | | | |
| Series 2019, 2.836% 1/15/50 (b) | | 3,520,000 | 3,458,175 |
| 1.884% 7/15/50 (b) | | 1,356,000 | 1,275,237 |
| 2.328% 7/15/52 (b) | | 1,037,000 | 931,020 |
| Sbna Auto Lease Trust Series 2024-B Class A3, 5.56% 11/22/27 (b) | | 1,600,000 | 1,604,062 |
| Sfs Auto Receivables Securitization Trust Series 2024-2A Class A3, 5.33% 11/20/29 (b) | | 1,090,000 | 1,092,916 |
| Subway Funding LLC Issuer Series 2024-1A: | | | |
| Class A23, 6.505% 7/30/54 (b) | | 2,734,000 | 2,786,469 |
| Class A2I, 6.028% 7/30/54 (b) | | 5,244,000 | 5,290,262 |
| Class A2II, 6.268% 7/30/54 (b) | | 3,117,000 | 3,158,974 |
| SYMP Series 2022-32A Class A1, CME Term SOFR 3 Month Index + 1.320% 6.6464% 4/23/35 (b)(c)(d) | | 5,044,198 | 5,053,298 |
| Symphony Clo 43 Ltd. Series 2024-43A Class A1, CME Term SOFR 3 Month Index + 1.520% 6.8465% 4/15/37 (b)(c)(d) | | 2,544,000 | 2,556,997 |
| Symphony CLO XXI, Ltd. Series 2021-21A Class AR, CME Term SOFR 3 Month Index + 1.320% 6.6502% 7/15/32 (b)(c)(d) | | 580,272 | 580,669 |
| Symphony CLO XXV Ltd. / Symphony CLO XXV LLC Series 2021-25A Class A, CME Term SOFR 3 Month Index + 1.240% 6.5682% 4/19/34 (b)(c)(d) | | 4,282,717 | 4,287,115 |
| Symphony CLO XXVI Ltd. / Symphony CLO XXVI LLC Series 2021-26A Class AR, CME Term SOFR 3 Month Index + 1.340% 6.6662% 4/20/33 (b)(c)(d) | | 3,959,716 | 3,963,224 |
| Terwin Mortgage Trust Series 2003-4HE Class A1, CME Term SOFR 1 Month Index + 0.970% 6.3197% 9/25/34 (c)(d) | | 3,837 | 3,862 |
| Tesla Series 2024-A Class A2A, 5.37% 6/22/26 (b) | | 799,000 | 797,333 |
| Tesla Auto Lease Trust 23-A Series 2023-A Class A3, 5.89% 6/22/26 (b) | | 1,700,000 | 1,703,635 |
| Thunderbolt Aircraft Lease Ltd. Series 2018-A Class A, 4.147% 9/15/38 (b)(c) | | 2,418,155 | 2,187,730 |
| Thunderbolt III Aircraft Lease Ltd. Series 2019-1 Class A, 3.671% 11/15/39 (b) | | 2,989,799 | 2,616,164 |
| Toyota Lease Owner Trust: | | | |
| Series 2023 A Class A3, 4.93% 4/20/26 (b) | | 1,864,000 | 1,856,084 |
| Series 2024-A Class A3, 5.25% 4/20/27 (b) | | 1,900,000 | 1,899,735 |
| Upstart Securitization Trust Series 2022-1 Class A, 3.12% 3/20/32 (b) | | 160,333 | 159,579 |
| Volkswagen Auto Lease Trust 2024- Series 2024-A Class A3, 5.21% 6/21/27 | | 1,220,000 | 1,218,663 |
| Voya Clo Ltd. Series 2024-1A Class A1, CME Term SOFR 3 Month Index + 1.520% 6.8461% 4/15/37 (b)(c)(d) | | 2,428,000 | 2,429,423 |
| Voya CLO Ltd./Voya CLO LLC: | | | |
| Series 2021-2A Class A1R, CME Term SOFR 3 Month Index + 1.420% 6.7482% 7/19/34 (b)(c)(d) | | 2,363,896 | 2,364,988 |
| Series 2021-3A Class AR, CME Term SOFR 3 Month Index + 1.410% 6.7362% 10/20/34 (b)(c)(d) | | 4,837,926 | 4,839,353 |
| Voya CLO, Ltd. Series 2021-1A Class AR, CME Term SOFR 3 Month Index + 1.410% 6.7393% 7/16/34 (b)(c)(d) | | 2,387,172 | 2,391,350 |
| Wheels Fleet Lease Funding 1 L: | | | |
| Series 2023-2A Class A, 6.46% 8/18/38 (b) | | 4,300,000 | 4,334,081 |
| Series 2024-1A Class A1, 5.49% 2/18/39 (b) | | 1,500,000 | 1,500,254 |
| Willis Engine Structured Trust Vi Series 2023-A Class A, 8% 10/15/48 (b) | | 1,429,324 | 1,509,838 |
| World Omni Auto Receivables Trust: | | | |
| Series 2023 B Class A3, 4.66% 5/15/28 | | 1,974,000 | 1,954,286 |
| Series 2023-C Class A3, 5.15% 11/15/28 | | 965,000 | 961,729 |
| TOTAL ASSET-BACKED SECURITIES (Cost $351,109,278) | | | 346,925,839 |
| | | | |
| Collateralized Mortgage Obligations - 1.5% |
| | | Principal Amount (a) | Value ($) |
| Private Sponsor - 0.6% | | | |
| Binom Securitization Trust 202 Series 2022-RPL1 Class A1, 3% 2/25/61 (b) | | 2,547,795 | 2,305,331 |
| BRAVO Residential Funding Trust sequential payer Series 2022-RPL1 Class A1, 2.75% 9/25/61 (b) | | 4,127,347 | 3,681,952 |
| Bravo Residential Funding Trust sequential payer Series 2023-RPL1 Class A1, 5% 5/25/63 (b) | | 1,937,869 | 1,900,727 |
| CFMT Series 2022-HB10 Class A, 3.25% 11/25/35 (b) | | 2,956,312 | 2,905,956 |
| Cfmt LLC floater sequential payer Series 2024-HB13 Class A, 3% 5/25/34 (b)(c) | | 1,148,968 | 1,100,514 |
| CFMT LLC sequential payer Series 2022-HB8 Class A, 3.75% 4/25/25 (b) | | 2,042,075 | 2,012,669 |
| Finance of America HECM Buyout sequential payer Series 2022-HB1 Class A, 2.6948% 2/25/32 (b)(c) | | 1,792,994 | 1,753,162 |
| Gs Mtg-Backed Securities Trust 2024-Rpl Series 2024-RPL2 Class A1, 3.75% 7/25/61 (b) | | 485,194 | 460,843 |
| NYMT Loan Trust sequential payer Series 2021-CP1 Class A1, 2.0424% 7/25/61 (b) | | 1,368,923 | 1,235,937 |
| Nymt Loan Trust 2024-Cp1 sequential payer Series 2024-CP1 Class A1, 3.75% 2/25/68 (b) | | 675,641 | 618,239 |
| Ocwen Ln Investment Trust 2023-Hb1 Series 2023-HB1 Class A, 3% 6/25/36 (b) | | 304,263 | 293,530 |
| Ocwen Loan Invest Trust Series 2024-HB1 Class A, 3% 2/25/37 (b) | | 254,426 | 243,218 |
| Prmi Securitization Trust 2024-Cm floater Series 2024-CMG1 Class A1, U.S. 30-Day Avg. Secured Overnight Fin. Rate (SOFR) Index + 1.300% 6.7858% 7/25/54 (b)(c)(d) | | 1,100,000 | 1,096,377 |
| Prpm 2024-Rcf3 LLC Series 2024-RCF3 Class A1, 4% 5/25/54 (b) | | 1,230,370 | 1,176,315 |
| Prpm 2024-Rpl2 LLC Series 2024-RPL2 Class A1, 3.5% 5/25/54 (b)(c) | | 1,286,215 | 1,217,400 |
| RMF Buyout Issuance Trust sequential payer Series 2022-HB1 Class A, 4.272% 4/25/32 (b) | | 44,329 | 44,134 |
| Sequoia Mortgage Trust floater Series 2004-6 Class A3B, CME Term SOFR 6 Month Index + 1.300% 6.5772% 7/20/34 (c)(d) | | 896 | 816 |
| Towd Point Mortgage Trust sequential payer Series 2022-K147 Class A2, 3.75% 7/25/62 (b) | | 1,334,002 | 1,233,008 |
TOTAL PRIVATE SPONSOR | | | 23,280,128 |
| U.S. Government Agency - 0.9% | | | |
| Fannie Mae: | | | |
| planned amortization class: | | | |
Series 1999-57 Class PH, 6.5% 12/25/29 | | 23,934 | 23,969 |
Series 2017-32 Class PA, 2.7% 5/25/47 | | 5,379,654 | 4,750,597 |
Series 2017-37 Class AB, 2.55% 9/25/46 | | 1,062,502 | 942,947 |
Series 2021-45 Class DA, 3% 7/25/51 | | 663,526 | 577,330 |
Series 2021-69 Class JK, 1.5% 10/25/51 | | 375,864 | 305,708 |
Series 2022-2 Class TH, 2.5% 2/25/52 | | 232,739 | 206,781 |
| sequential payer: | | | |
Series 2020-101 Class BA, 1.5% 9/25/45 | | 618,024 | 524,018 |
Series 2020-43 Class MA, 2% 1/25/45 | | 694,056 | 622,100 |
Series 2020-49 Class JA, 2% 8/25/44 | | 90,668 | 81,838 |
Series 2020-51 Class BA, 2% 6/25/46 | | 911,868 | 777,014 |
Series 2020-80 Class BA, 1.5% 3/25/45 | | 883,593 | 753,110 |
Series 2021-68 Class A, 2% 7/25/49 | | 190,978 | 148,427 |
Series 2021-85 Class L, 2.5% 8/25/48 | | 104,180 | 89,645 |
Series 2021-95: | | | |
Class 0, 2.5% 9/25/48 | | 785,281 | 677,677 |
Class BA, 2.5% 6/25/49 | | 1,192,602 | 1,025,645 |
Series 2021-96: | | | |
Class AH, 2.5% 3/25/49 | | 1,793,486 | 1,561,831 |
Class HA, 2.5% 2/25/50 | | 167,295 | 143,732 |
Series 2022-1 Class KA, 3% 5/25/48 | | 393,858 | 351,735 |
Series 2022-11 Class B, 3% 6/25/49 | | 455,411 | 410,264 |
Series 2022-13: | | | |
Class HA, 3% 8/25/46 | | 358,984 | 327,729 |
Class JA, 3% 5/25/48 | | 410,245 | 370,889 |
Series 2022-25 Class AB, 4% 9/25/47 | | 574,732 | 549,095 |
Series 2022-3: | | | |
Class D, 2% 2/25/48 | | 1,156,889 | 1,008,183 |
Class N, 2% 10/25/47 | | 3,191,518 | 2,738,180 |
Series 2022-30 Class E, 4.5% 7/25/48 | | 1,124,832 | 1,084,248 |
Series 2022-4 Class B, 2.5% 5/25/49 | | 122,111 | 105,208 |
Series 2022-42 Class BA, 4% 6/25/50 | | 1,181,877 | 1,117,585 |
Series 2022-49 Class TC, 4% 12/25/48 | | 361,223 | 341,601 |
Series 2022-5: | | | |
Class 0, 2.5% 6/25/48 | | 466,442 | 407,214 |
Class BA, 2.5% 12/25/49 | | 480,168 | 405,443 |
Class DA, 2.25% 11/25/47 | | 1,368,786 | 1,195,253 |
Series 2022-7: | | | |
Class A, 3% 5/25/48 | | 561,249 | 501,234 |
Class E, 2.5% 11/25/47 | | 1,148,010 | 1,015,270 |
| Series 2020-45 Class JL, 3% 7/25/40 | | 38,271 | 34,102 |
| Series 2021-21 Class HG, 2% 11/25/47 | | 462,673 | 400,362 |
| Series 2021-59 Class H, 2% 6/25/48 | | 107,599 | 85,963 |
| Series 2021-66: | | | |
Class DA, 2% 1/25/48 | | 115,245 | 92,550 |
Class DM, 2% 1/25/48 | | 122,473 | 98,354 |
| Freddie Mac: | | | |
| planned amortization class: | | | |
Series 2021-5141 Class JM, 1.5% 4/25/51 | | 276,333 | 225,214 |
Series 2021-5148: | | | |
Class AD, 1.5% 10/25/51 | | 373,187 | 304,012 |
Class PC, 1.5% 10/25/51 | | 368,987 | 297,380 |
| sequential payer: | | | |
Series 2020-4993 Class LA, 2% 8/25/44 | | 660,259 | 596,359 |
Series 2020-5000 Class MA, 2% 6/25/44 | | 2,888,950 | 2,594,332 |
Series 2020-5018: | | | |
Class LC, 3% 10/25/40 | | 258,229 | 230,651 |
Class LY, 3% 10/25/40 | | 196,357 | 175,344 |
Series 2021-5169 Class TP, 2.5% 6/25/49 | | 349,934 | 300,599 |
Series 2021-5175 Class CB, 2.5% 4/25/50 | | 603,914 | 517,638 |
Series 2021-5180 Class KA, 2.5% 10/25/47 | | 120,010 | 105,692 |
Series 2022-5189: | | | |
Class DA, 2.5% 5/25/49 | | 289,826 | 246,126 |
Class TP, 2.5% 5/25/49 | | 269,525 | 232,623 |
Series 2022-5190: | | | |
Class BA, 2.5% 11/25/47 | | 291,105 | 256,102 |
Class CA, 2.5% 5/25/49 | | 225,632 | 194,708 |
Series 2022-5191 Class CA, 2.5% 4/25/50 | | 141,314 | 120,366 |
Series 2022-5197: | | | |
Class A, 2.5% 6/25/49 | | 225,633 | 194,708 |
Class DA, 2.5% 11/25/47 | | 221,000 | 194,670 |
Series 2022-5198 Class BA, 2.5% 11/25/47 | | 1,043,343 | 921,892 |
Series 2022-5202 Class LB, 2.5% 10/25/47 | | 236,688 | 206,661 |
| Series 2020-5041 Class LB, 3% 11/25/40 | | 440,106 | 393,378 |
| Series 2021-5083 Class VA, 1% 8/15/38 | | 1,142,203 | 1,065,390 |
| Series 2021-5176 Class AG, 2% 1/25/47 | | 452,465 | 385,276 |
| Series 2021-5182 Class A, 2.5% 10/25/48 | | 785,531 | 677,184 |
| Series 2022-5210 Class AB, 3% 1/25/42 | | 653,037 | 593,575 |
| Series 2022-5236 Class P, 5% 4/25/48 | | 423,072 | 416,571 |
| Series 2022-5266 Class CD, 4.5% 10/25/44 | | 1,111,481 | 1,080,712 |
| Freddie Mac Multi-family Structured pass-thru certificates: | | | |
| planned amortization class Series 2021-5165 Class PC, 1.5% 11/25/51 | | 473,228 | 386,326 |
| sequential payer: | | | |
Series 2021-5159: | | | |
Class EA, 2.5% 8/25/48 | | 344,687 | 296,839 |
Class GC, 2% 11/25/47 | | 96,164 | 82,832 |
Series 2021-5164 Class M, 2.5% 7/25/48 | | 351,316 | 302,702 |
| Ginnie Mae guaranteed REMIC pass-thru certificates Series 2007-35 Class SC, 39.510% x CME Term SOFR 1 Month Index 7.5401% 6/16/37 (c)(d)(h) | | 5,352 | 5,806 |
TOTAL U.S. GOVERNMENT AGENCY | | | 39,454,499 |
| TOTAL COLLATERALIZED MORTGAGE OBLIGATIONS (Cost $63,612,856) | | | 62,734,627 |
| | | | |
| Commercial Mortgage Securities - 5.8% |
| | | Principal Amount (a) | Value ($) |
| BAMLL Commercial Mortgage Securities Trust: | | | |
| floater Series 2022-DKLX: | | | |
Class A, CME Term SOFR 1 Month Index + 1.150% 6.479% 1/15/39 (b)(c)(d) | | 2,741,961 | 2,715,398 |
Class B, CME Term SOFR 1 Month Index + 1.550% 6.879% 1/15/39 (b)(c)(d) | | 618,000 | 609,309 |
Class C, CME Term SOFR 1 Month Index + 2.150% 7.479% 1/15/39 (b)(c)(d) | | 437,000 | 429,899 |
| sequential payer Series 2019-BPR Class ANM, 3.112% 11/5/32 (b) | | 2,189,000 | 2,005,671 |
| Series 2019-BPR: | | | |
Class BNM, 3.465% 11/5/32 (b) | | 491,000 | 422,874 |
Class CNM, 3.8425% 11/5/32 (b)(c) | | 248,000 | 178,250 |
| BANK: | | | |
| sequential payer: | | | |
Series 2018-BN10: | | | |
| Class A4, 3.428% 2/15/61 | | 1,345,197 | 1,270,808 |
| Class A5, 3.688% 2/15/61 | | 218,564 | 206,288 |
| Class ASB, 3.641% 2/15/61 | | 363,484 | 352,540 |
Series 2018-BN14 Class A4, 4.231% 9/15/60 | | 1,000,000 | 956,483 |
Series 2019-BN19 Class ASB, 3.071% 8/15/61 | | 840,000 | 793,851 |
Series 2019-BN21 Class A5, 2.851% 10/17/52 | | 373,546 | 327,588 |
Series 2019-BN23 Class ASB, 2.846% 12/15/52 | | 200,000 | 187,313 |
Series 2020-BN26 Class ASB, 2.313% 3/15/63 | | 1,400,000 | 1,285,462 |
Series 2021-BN35 Class ASB, 2.067% 6/15/64 | | 700,000 | 612,679 |
Series 2023-5YR1 Class A3, 6.26% 4/15/56 | | 1,200,000 | 1,228,804 |
| Series 2021-BN33 Class XA, 1.1643% 5/15/64 (c)(i) | | 13,397,138 | 653,409 |
| BANK Trust sequential payer Series 2017-BNK5 Class ASB, 3.179% 6/15/60 | | 1,141,756 | 1,103,520 |
| Bank5 2023-5Yr3 sequential payer Series 2023-5YR3 Class A3, 6.724% 9/15/56 | | 800,000 | 836,594 |
| BBCMS Mortgage Trust sequential payer Series 2023-C21 Class A3, 6.5063% 9/15/56 (c) | | 1,817,000 | 1,912,402 |
| Benchmark 2023-V3 Mtg Trust sequential payer Series 2023-V3 Class A3, 6.3629% 7/15/56 | | 600,000 | 619,378 |
| Benchmark Mortgage Trust: | | | |
| sequential payer: | | | |
Series 2018-B4 Class A5, 4.121% 7/15/51 | | 778,315 | 741,247 |
Series 2019-B10 Class A4, 3.717% 3/15/62 | | 721,545 | 671,657 |
Series 2021-B28 Class ASB, 1.9804% 8/15/54 | | 1,850,000 | 1,608,243 |
| Series 2018-B8 Class A5, 4.2317% 1/15/52 | | 5,335,798 | 5,011,465 |
| Series 2021-B27 Class XA, 1.3721% 7/15/54 (c)(i) | | 2,766,030 | 157,581 |
| BLP Commercial Mortgage Trust sequential payer Series 2024-IND2 Class A, CME Term SOFR 1 Month Index + 1.340% 6.671% 3/15/41 (b)(c)(d) | | 1,699,000 | 1,686,258 |
| BMO Mortgage Trust sequential payer: | | | |
| Series 2022-C3 Class ASB, 5.5033% 9/15/54 (c) | | 700,000 | 709,534 |
| Series 2023-5C1 Class A3, 6.534% 8/15/56 | | 400,000 | 414,454 |
| BMP floater Series 2024-MF23: | | | |
| Class A, CME Term SOFR 1 Month Index + 1.370% 6.7008% 6/15/41 (b)(c)(d) | | 2,329,000 | 2,312,988 |
| Class B, CME Term SOFR 1 Month Index + 1.640% 6.9704% 6/15/41 (b)(c)(d) | | 1,150,000 | 1,142,821 |
| Class C, CME Term SOFR 1 Month Index + 1.840% 7.1701% 6/15/41 (b)(c)(d) | | 813,000 | 806,899 |
| BPR Trust floater Series 2022-OANA: | | | |
| Class A, CME Term SOFR 1 Month Index + 1.890% 7.2268% 4/15/37 (b)(c)(d) | | 8,749,555 | 8,749,553 |
| Class B, CME Term SOFR 1 Month Index + 2.440% 7.7758% 4/15/37 (b)(c)(d) | | 2,324,753 | 2,324,752 |
| BX Commercial Mortgage Trust: | | | |
| floater: | | | |
Series 2019-IMC: | | | |
| Class B, CME Term SOFR 1 Month Index + 1.340% 6.6753% 4/15/34 (b)(c)(d) | | 1,864,321 | 1,829,396 |
| Class C, CME Term SOFR 1 Month Index + 1.640% 6.9753% 4/15/34 (b)(c)(d) | | 1,232,474 | 1,201,690 |
| Class D, CME Term SOFR 1 Month Index + 1.940% 7.2753% 4/15/34 (b)(c)(d) | | 1,293,785 | 1,258,237 |
Series 2021-BXMF Class A, CME Term SOFR 1 Month Index + 0.750% 6.0794% 10/15/26 (b)(c)(d) | | 1,025,885 | 1,012,429 |
Series 2021-LBA Class AJV, CME Term SOFR 1 Month Index + 0.910% 6.2435% 2/15/36 (b)(c)(d) | | 300,000 | 296,156 |
Series 2021-PAC: | | | |
| Class A, CME Term SOFR 1 Month Index + 0.800% 6.1326% 10/15/36 (b)(c)(d) | | 5,017,787 | 4,953,718 |
| Class B, CME Term SOFR 1 Month Index + 1.010% 6.3423% 10/15/36 (b)(c)(d) | | 733,467 | 721,132 |
| Class C, CME Term SOFR 1 Month Index + 1.210% 6.5421% 10/15/36 (b)(c)(d) | | 981,551 | 962,904 |
| Class D, CME Term SOFR 1 Month Index + 1.410% 6.7418% 10/15/36 (b)(c)(d) | | 952,598 | 927,381 |
| Class E, CME Term SOFR 1 Month Index + 2.060% 7.391% 10/15/36 (b)(c)(d) | | 3,312,521 | 3,229,987 |
Series 2021-VINO Class A, CME Term SOFR 1 Month Index + 0.760% 6.0958% 5/15/38 (b)(c)(d) | | 324,428 | 320,372 |
Series 2022-IND Class A, CME Term SOFR 1 Month Index + 1.490% 6.8198% 4/15/37 (b)(c)(d) | | 3,499,984 | 3,490,166 |
Series 2022-LP2: | | | |
| Class A, CME Term SOFR 1 Month Index + 1.010% 6.3417% 2/15/39 (b)(c)(d) | | 4,452,209 | 4,402,141 |
| Class B, CME Term SOFR 1 Month Index + 1.310% 6.6411% 2/15/39 (b)(c)(d) | | 1,586,375 | 1,565,561 |
| Class C, CME Term SOFR 1 Month Index + 1.560% 6.8905% 2/15/39 (b)(c)(d) | | 1,586,375 | 1,564,570 |
| Class D, CME Term SOFR 1 Month Index + 1.960% 7.2896% 2/15/39 (b)(c)(d) | | 1,586,375 | 1,562,588 |
Series 2023-XL3: | | | |
| Class A, CME Term SOFR 1 Month Index + 1.760% 7.0903% 12/9/40 (b)(c)(d) | | 2,584,000 | 2,585,609 |
| Class B, CME Term SOFR 1 Month Index + 2.190% 7.5197% 12/9/40 (b)(c)(d) | | 571,000 | 571,890 |
| Class C, CME Term SOFR 1 Month Index + 2.640% 7.969% 12/9/40 (b)(c)(d) | | 309,000 | 309,481 |
| floater sequential payer: | | | |
Series 2019-IMC Class A, CME Term SOFR 1 Month Index + 1.040% 6.3753% 4/15/34 (b)(c)(d) | | 2,544,198 | 2,515,601 |
Series 2024-XL5 Class A, CME Term SOFR 1 Month Index + 1.390% 6.7205% 3/15/41 (b)(c)(d) | | 9,005,805 | 8,955,148 |
| Series 2019-OC11 Class XA, 0.8735% 12/9/41 (b)(c)(i) | | 61,700,000 | 2,159,068 |
| BX Commercial Mortgage Trust 2024-Xl4: | | | |
| floater: | | | |
Series 2024-XL4 Class B, CME Term SOFR 1 Month Index + 1.790% 7.1083% 2/15/39 (b)(c)(d) | | 491,494 | 488,115 |
Series 2024-XL5: | | | |
| Class B, CME Term SOFR 1 Month Index + 1.690% 7.0201% 3/15/41 (b)(c)(d) | | 1,538,208 | 1,528,136 |
| Class C, CME Term SOFR 1 Month Index + 1.940% 7.2697% 3/15/41 (b)(c)(d) | | 2,042,633 | 2,024,799 |
| floater sequential payer Series 2024-XL4 Class A, CME Term SOFR 1 Month Index + 1.440% 6.7709% 2/15/39 (b)(c)(d) | | 3,922,099 | 3,908,617 |
| BX Commercial Mtg Trust floater Series 2024-MDHS Class A, 6.9913% 5/15/41 (b)(c) | | 5,325,000 | 5,311,679 |
| BX Trust floater: | | | |
| Series 2022-GPA Class A, CME Term SOFR 1 Month Index + 2.160% 7.4938% 8/15/39 (b)(c)(d) | | 2,269,453 | 2,270,157 |
| Series 2022-IND: | | | |
Class B, CME Term SOFR 1 Month Index + 1.940% 7.2688% 4/15/37 (b)(c)(d) | | 1,784,269 | 1,776,463 |
Class C, CME Term SOFR 1 Month Index + 2.290% 7.6188% 4/15/37 (b)(c)(d) | | 402,841 | 401,456 |
Class D, CME Term SOFR 1 Month Index + 2.830% 8.1678% 4/15/37 (b)(c)(d) | | 337,319 | 336,159 |
| Series 2024-CNYN: | | | |
Class A, CME Term SOFR 1 Month Index + 1.440% 6.7707% 4/15/29 (b)(c)(d) | | 5,976,367 | 5,980,043 |
Class B, CME Term SOFR 1 Month Index + 1.690% 7.0204% 4/15/29 (b)(c)(d) | | 952,841 | 946,882 |
Class C, CME Term SOFR 1 Month Index + 1.940% 7.27% 4/15/29 (b)(c)(d) | | 790,887 | 786,931 |
| CAMB Commercial Mortgage Trust floater Series 2019-LIFE Class A, CME Term SOFR 1 Month Index + 1.360% 6.696% 12/15/37 (b)(c)(d) | | 300,000 | 300,325 |
| CF Hippolyta Issuer LLC sequential payer Series 2021-1A Class A1, 1.53% 3/15/61 (b) | | 5,401,623 | 4,947,619 |
| Citigroup Commercial Mortgage Trust sequential payer: | | | |
| Series 2016-C1 Class A4, 3.209% 5/10/49 | | 400,000 | 382,512 |
| Series 2018-B2 Class A4, 4.009% 3/10/51 | | 500,000 | 474,390 |
| Series 2020-GC46 Class AAB, 2.614% 2/15/53 | | 700,000 | 649,358 |
| COMM Mortgage Trust sequential payer Series 2015 LC19 Class A3, 2.922% 2/10/48 | | 1,355,363 | 1,346,594 |
| COMM Trust sequential payer Series 2017-COR2 Class ASB, 3.317% 9/10/50 | | 448,900 | 433,970 |
| Computershare Corporate Trust Series 2018-C48 Class A5, 4.302% 1/15/52 | | 2,174,228 | 2,079,815 |
| Credit Suisse Mortgage Trust sequential payer Series 2020-NET Class A, 2.2569% 8/15/37 (b) | | 986,403 | 933,003 |
| DTP Commercial Mortgage Trust 2023-Ste2 sequential payer Series 2023-STE2 Class A, 6.038% 1/15/41 (b)(c) | | 775,000 | 775,765 |
| ELP Commercial Mortgage Trust floater Series 2021-ELP: | | | |
| Class A, CME Term SOFR 1 Month Index + 0.810% 6.1445% 11/15/38 (b)(c)(d) | | 6,763,069 | 6,682,802 |
| Class B, CME Term SOFR 1 Month Index + 1.230% 6.5637% 11/15/38 (b)(c)(d) | | 898,954 | 887,754 |
| Extended Stay America Trust floater Series 2021-ESH: | | | |
| Class A, CME Term SOFR 1 Month Index + 1.190% 6.5235% 7/15/38 (b)(c)(d) | | 1,528,726 | 1,522,993 |
| Class B, CME Term SOFR 1 Month Index + 1.490% 6.8235% 7/15/38 (b)(c)(d) | | 1,160,161 | 1,155,465 |
| Class C, CME Term SOFR 1 Month Index + 1.810% 7.1435% 7/15/38 (b)(c)(d) | | 856,050 | 853,918 |
| Class D, CME Term SOFR 1 Month Index + 2.360% 7.6935% 7/15/38 (b)(c)(d) | | 1,723,902 | 1,722,827 |
| Freddie Mac: | | | |
| sequential payer: | | | |
Series 2015-K049 Class A2, 3.01% 7/25/25 | | 321,614 | 314,005 |
Series 2016-K054 Class A2, 2.745% 1/25/26 | | 1,736,961 | 1,675,448 |
Series 2016-K055 Class A2, 2.673% 3/25/26 | | 3,500,000 | 3,362,224 |
Series 2023-K751 Class A2, 4.412% 3/25/30 | | 500,000 | 490,696 |
Series 2024-K517 Class A2, 5.355% 1/25/29 | | 4,100,000 | 4,177,431 |
Series K058 Class A2, 2.653% 8/25/26 | | 2,700,000 | 2,571,613 |
| Series K047 Class A2, 3.329% 5/25/25 | | 2,814,231 | 2,763,313 |
| GS Mortgage Securities Trust: | | | |
| floater: | | | |
Series 2018-3PCK Class A, CME Term SOFR 1 Month Index + 2.060% 7.3935% 9/15/31 (b)(c)(d) | | 1,126,211 | 1,120,978 |
Series 2021-IP: | | | |
| Class A, CME Term SOFR 1 Month Index + 1.060% 6.3935% 10/15/36 (b)(c)(d) | | 3,667,747 | 3,621,900 |
| Class B, CME Term SOFR 1 Month Index + 1.260% 6.5935% 10/15/36 (b)(c)(d) | | 544,915 | 532,314 |
| Class C, CME Term SOFR 1 Month Index + 1.660% 6.9935% 10/15/36 (b)(c)(d) | | 449,243 | 433,800 |
| sequential payer: | | | |
Series 2015-GC34 Class A3, 3.244% 10/10/48 | | 178,110 | 173,200 |
Series 2017-GS6 Class A2, 3.164% 5/10/50 | | 285,776 | 267,672 |
Series 2017-GS8 Class AAB, 3.313% 11/10/50 | | 886,332 | 860,352 |
Series 2018-GS10: | | | |
| Class A4, 3.89% 7/10/51 | | 600,000 | 568,548 |
| Class A5, 4.155% 7/10/51 | | 300,000 | 282,878 |
| Class AAB, 4.106% 7/10/51 | | 158,343 | 154,791 |
| Intown Mortgage Trust floater sequential payer Series 2022-STAY Class A, CME Term SOFR 1 Month Index + 2.480% 7.8176% 8/15/39 (b)(c)(d) | | 6,086,000 | 6,097,374 |
| J.P. Morgan Chase Commercial Mortgage Securities Trust floater Series 2012-NLP Class A, CME Term SOFR 1 Month Index + 0.590% 5.9253% 4/15/37 (b)(c)(d) | | 1,439,036 | 1,372,508 |
| JPMBB Commercial Mortgage Securities Trust sequential payer Series 2015-C33 Class A3, 3.5043% 12/15/48 | | 338,448 | 330,264 |
| JPMCC Commercial Mortgage Securities Trust Series 2016-JP4 Class ASB, 3.4743% 12/15/49 | | 1,807,632 | 1,762,277 |
| JPMorgan Chase Commercial Mortgage Securities Trust Series 2018-WPT: | | | |
| Class AFX, 4.2475% 7/5/33 (b) | | 277,000 | 256,278 |
| Class CFX, 4.9498% 7/5/33 (b) | | 505,398 | 404,324 |
| Class DFX, 5.3503% 7/5/33 (b) | | 715,868 | 536,909 |
| Life Financial Services Trust floater Series 2022-BMR2: | | | |
| Class A1, CME Term SOFR 1 Month Index + 1.290% 6.6241% 5/15/39 (b)(c)(d) | | 5,702,564 | 5,600,987 |
| Class B, CME Term SOFR 1 Month Index + 1.790% 7.1228% 5/15/39 (b)(c)(d) | | 4,064,838 | 3,958,162 |
| Class C, CME Term SOFR 1 Month Index + 2.090% 7.422% 5/15/39 (b)(c)(d) | | 2,311,651 | 2,243,762 |
| Class D, CME Term SOFR 1 Month Index + 2.540% 7.8708% 5/15/39 (b)(c)(d) | | 2,054,528 | 1,953,969 |
| LIFE Mortgage Trust floater Series 2021-BMR: | | | |
| Class A, CME Term SOFR 1 Month Index + 0.810% 6.1435% 3/15/38 (b)(c)(d) | | 3,052,860 | 2,997,591 |
| Class B, CME Term SOFR 1 Month Index + 0.990% 6.3235% 3/15/38 (b)(c)(d) | | 982,134 | 958,835 |
| Class C, CME Term SOFR 1 Month Index + 1.210% 6.5435% 3/15/38 (b)(c)(d) | | 617,740 | 601,543 |
| Class D, CME Term SOFR 1 Month Index + 1.510% 6.8435% 3/15/38 (b)(c)(d) | | 859,367 | 834,688 |
| Class E, CME Term SOFR 1 Month Index + 1.860% 7.1935% 3/15/38 (b)(c)(d) | | 751,109 | 722,037 |
| Morgan Stanley Capital I Trust: | | | |
| sequential payer: | | | |
Series 2017-HR2 Class A3, 3.33% 12/15/50 | | 495,385 | 463,140 |
Series 2019-MEAD Class A, 3.17% 11/10/36 (b) | | 4,757,881 | 4,535,631 |
| Series 2018-H4 Class A4, 4.31% 12/15/51 | | 4,407,809 | 4,217,720 |
| Series 2019-MEAD: | | | |
Class B, 3.283% 11/10/36 (b)(c) | | 687,483 | 648,495 |
Class C, 3.283% 11/10/36 (b)(c) | | 659,666 | 612,360 |
| Natixis Commercial Mortgage Securities Trust sequential payer Series 2020-2PAC Class A, 2.966% 12/15/38 (b) | | 2,402,749 | 2,201,227 |
| Open Trust 2023-Air sequential payer Series 2023-AIR: | | | |
| Class A, CME Term SOFR 1 Month Index + 3.080% 8.4179% 10/15/28 (b)(c)(d) | | 2,099,154 | 2,122,770 |
| Class B, CME Term SOFR 1 Month Index + 3.830% 9.1548% 10/15/28 (b)(c)(d) | | 1,264,910 | 1,268,072 |
| OPG Trust floater Series 2021-PORT Class A, CME Term SOFR 1 Month Index + 0.590% 5.9275% 10/15/36 (b)(c)(d) | | 5,959,792 | 5,859,283 |
| Providence Place Group Ltd. Partnership Series 2000-C1 Class A2, 7.75% 7/20/28 (b) | | 1,473,436 | 1,492,301 |
| SPGN Mortgage Trust floater Series 2022-TFLM: | | | |
| Class B, CME Term SOFR 1 Month Index + 2.000% 7.3288% 2/15/39 (b)(c)(d) | | 1,190,000 | 1,167,531 |
| Class C, CME Term SOFR 1 Month Index + 2.650% 7.9788% 2/15/39 (b)(c)(d) | | 619,000 | 601,492 |
| SREIT Trust floater: | | | |
| Series 2021-FLWR Class A, CME Term SOFR 1 Month Index + 0.690% 6.02% 7/15/36 (b)(c)(d) | | 1,392,068 | 1,373,812 |
| Series 2021-MFP: | | | |
Class A, CME Term SOFR 1 Month Index + 0.840% 6.1741% 11/15/38 (b)(c)(d) | | 6,766,211 | 6,702,813 |
Class B, CME Term SOFR 1 Month Index + 1.190% 6.5231% 11/15/38 (b)(c)(d) | | 2,984,257 | 2,939,518 |
Class C, CME Term SOFR 1 Month Index + 1.440% 6.7723% 11/15/38 (b)(c)(d) | | 1,556,296 | 1,532,965 |
Class D, CME Term SOFR 1 Month Index + 1.690% 7.0215% 11/15/38 (b)(c)(d) | | 1,022,864 | 1,007,529 |
| UBS Commercial Mortgage Trust sequential payer Series 2018-C9 Class A4, 4.117% 3/15/51 | | 300,000 | 280,417 |
| VLS Commercial Mortgage Trust: | | | |
| sequential payer Series 2020-LAB Class A, 2.13% 10/10/42 (b) | | 3,269,943 | 2,621,613 |
| Series 2020-LAB Class B, 2.453% 10/10/42 (b) | | 256,512 | 204,754 |
| Wells Fargo Commercial Mortgage Trust: | | | |
| floater Series 2021-FCMT Class A, CME Term SOFR 1 Month Index + 1.310% 6.6435% 5/15/31 (b)(c)(d) | | 2,496,000 | 2,432,302 |
| sequential payer: | | | |
Series 2015-C26 Class A4, 3.166% 2/15/48 | | 1,900,655 | 1,873,129 |
Series 2016-LC25 Class A3, 3.374% 12/15/59 | | 1,260,731 | 1,209,639 |
| Wells Fargo Commercial Mtg Trust 2020-C sequential payer Series 2020-C55 Class ASB, 2.651% 2/15/53 | | 500,000 | 464,587 |
| TOTAL COMMERCIAL MORTGAGE SECURITIES (Cost $250,096,782) | | | 244,185,515 |
| | | | |
| Foreign Government and Government Agency Obligations - 0.1% |
| | | Principal Amount (a) | Value ($) |
| Kingdom of Saudi Arabia: | | | |
| 3.25% 10/22/30 (b) | | 1,788,000 | 1,608,641 |
| 4.5% 4/22/60 (b) | | 1,363,000 | 1,104,882 |
| TOTAL FOREIGN GOVERNMENT AND GOVERNMENT AGENCY OBLIGATIONS (Cost $3,473,815) | | | 2,713,523 |
| | | | |
| Bank Notes - 0.2% |
| | | Principal Amount (a) | Value ($) |
| Discover Bank ICE IBA - USD SOFR SPREAD-ADJ + 1.730% 5.974% 8/9/28 (c)(d) | | 1,567,000 | 1,565,024 |
| KeyBank NA 6.95% 2/1/28 | | 800,000 | 821,835 |
| Regions Bank 6.45% 6/26/37 | | 4,383,000 | 4,468,973 |
| TOTAL BANK NOTES (Cost $8,446,062) | | | 6,855,832 |
| | | | |
| Fixed-Income Funds - 1.7% |
| | | Shares | Value ($) |
Fidelity Specialized High Income Central Fund (j) (Cost $77,719,180) | | 844,431 | 72,874,434 |
| | | | |
| Money Market Funds - 1.4% |
| | | Shares | Value ($) |
Fidelity Cash Central Fund 5.38% (k) (Cost $58,432,453) | | 58,421,128 | 58,432,813 |
| | | | |
| Purchased Swaptions - 0.1% |
| | Expiration Date | Notional Amount (a) | Value ($) |
| Put Options - 0.1% | | | | |
| Option on an interest rate swap with Bank of America N.A. to pay annually a fixed rate of 3.94% and receive annually a floating rate based on the U.S. Secured Overnight Fin. Rate (SOFR) Index, expiring May 2034. | 5/10/29 | | 7,000,000 | 269,094 |
| Option on an interest rate swap with Bank of America N.A. to pay annually a fixed rate of 4.05% and receive annually a floating rate based on the U.S. Secured Overnight Fin. Rate (SOFR) Index, expiring April 2034. | 4/23/29 | | 3,700,000 | 136,306 |
| Option on an interest rate swap with Citibank N.A. to pay annually a fixed rate of 3.755% and receive annually a floating rate based on the U.S. Secured Overnight Fin. Rate (SOFR) Index, expiring March 2034. | 3/19/29 | | 2,500,000 | 103,043 |
| Option on an interest rate swap with Goldman Sachs Bank U.S.A. to pay annually a fixed rate of 3.3525% and receive annually a floating rate based on the U.S. Secured Overnight Fin. Rate (SOFR) Index, expiring February 2035. | 2/03/25 | | 2,800,000 | 145,875 |
| Option on an interest rate swap with Goldman Sachs Bank U.S.A. to pay annually a fixed rate of 3.865% and receive annually a floating rate based on the U.S. Secured Overnight Fin. Rate (SOFR) Index, expiring May 2035. | 5/15/25 | | 2,400,000 | 74,782 |
| Option on an interest rate swap with JPMorgan Chase Bank N.A. to pay annually a fixed rate of 3.8225% and receive annually a floating rate based on the U.S. Secured Overnight Fin. Rate (SOFR) Index, expiring February 2035. | 2/24/25 | | 11,900,000 | 351,144 |
| Option on an interest rate swap with JPMorgan Chase Bank N.A. to pay annually a fixed rate of 3.92625% and receive annually a floating rate based on the U.S. Secured Overnight Fin. Rate (SOFR) Index, expiring May 2034. | 5/14/29 | | 5,200,000 | 201,068 |
| | | | | |
| TOTAL PUT OPTIONS | | | | 1,281,312 |
| Call Options - 0.0% | | | | |
| Option on an interest rate swap with Bank of America N.A. to receive annually a fixed rate of 3.94% and pay annually a floating rate based on the U.S. Secured Overnight Fin. Rate (SOFR) Index, expiring May 2034. | 5/10/29 | | 7,000,000 | 304,107 |
| Option on an interest rate swap with Bank of America N.A. to receive annually a fixed rate of 4.05% and pay annually a floating rate based on the U.S. Secured Overnight Fin. Rate (SOFR) Index, expiring April 2034. | 4/23/29 | | 3,700,000 | 170,396 |
| Option on an interest rate swap with Citibank N.A. to receive annually a fixed rate of 3.755% and pay annually a floating rate based on the U.S. Secured Overnight Fin. Rate (SOFR) Index, expiring March 2034. | 3/19/29 | | 2,500,000 | 98,848 |
| Option on an interest rate swap with Goldman Sachs Bank U.S.A. to receive annually a fixed rate of 3.3525% and pay annually a floating rate based on the U.S. Secured Overnight Fin. Rate (SOFR) Index, expiring February 2035. | 2/03/25 | | 2,800,000 | 33,223 |
| Option on an interest rate swap with Goldman Sachs Bank U.S.A. to receive annually a fixed rate of 3.865% and pay annually a floating rate based on the U.S. Secured Overnight Fin. Rate (SOFR) Index, expiring May 2035. | 5/15/25 | | 2,400,000 | 81,848 |
| Option on an interest rate swap with JPMorgan Chase Bank N.A. to receive annually a fixed rate of 3.8225% and pay annually a floating rate based on the U.S. Secured Overnight Fin. Rate (SOFR) Index, expiring February 2035. | 2/24/25 | | 11,900,000 | 325,801 |
| Option on an interest rate swap with JPMorgan Chase Bank N.A. to receive annually a fixed rate of 3.92625% and pay annually a floating rate based on the U.S. Secured Overnight Fin. Rate (SOFR) Index, expiring May 2034. | 5/14/29 | | 5,200,000 | 224,357 |
| | | | | |
| TOTAL CALL OPTIONS | | | | 1,238,580 |
TOTAL PURCHASED SWAPTIONS (Cost $2,718,366) | | | | 2,519,892 |
| TOTAL INVESTMENT IN SECURITIES - 114.4% (Cost $5,227,039,702) | 4,821,589,952 |
NET OTHER ASSETS (LIABILITIES) - (14.4)% | (605,623,095) |
| NET ASSETS - 100.0% | 4,215,966,857 |
| | |
| TBA Sale Commitments |
| | Principal Amount (a) | Value ($) |
| Ginnie Mae | | |
| 2% 7/1/54 | (3,650,000) | (2,955,543) |
| 2% 7/1/54 | (21,750,000) | (17,611,762) |
| 2% 7/1/54 | (850,000) | (688,276) |
| 3% 7/1/54 | (15,650,000) | (13,646,589) |
| 3% 7/1/54 | (2,600,000) | (2,267,165) |
| 3% 7/1/54 | (5,375,000) | (4,686,927) |
| 3.5% 7/1/54 | (14,375,000) | (12,920,000) |
| 4% 7/1/54 | (5,200,000) | (4,805,505) |
| 5% 7/1/54 | (5,300,000) | (5,160,306) |
| 5% 7/1/54 | (5,300,000) | (5,160,306) |
| 5.5% 7/1/54 | (4,000,000) | (3,968,599) |
| 5.5% 7/1/54 | (4,000,000) | (3,968,599) |
| 5.5% 7/1/54 | (2,850,000) | (2,827,627) |
| 6% 7/1/54 | (6,100,000) | (6,126,212) |
| 6% 7/1/54 | (4,600,000) | (4,619,767) |
| 6% 7/1/54 | (2,450,000) | (2,460,528) |
| | | |
| TOTAL GINNIE MAE | | (93,873,711) |
| | | |
| Uniform Mortgage Backed Securities | | |
| 2% 7/1/39 | (1,800,000) | (1,582,171) |
| 2% 7/1/54 | (1,500,000) | (1,173,164) |
| 2% 7/1/54 | (1,500,000) | (1,173,164) |
| 2% 7/1/54 | (1,800,000) | (1,407,797) |
| 2% 7/1/54 | (1,800,000) | (1,407,797) |
| 2% 7/1/54 | (67,900,000) | (53,105,228) |
| 2% 7/1/54 | (3,000,000) | (2,346,328) |
| 2% 7/1/54 | (6,000,000) | (4,692,656) |
| 2% 7/1/54 | (6,000,000) | (4,692,656) |
| 2% 7/1/54 | (1,800,000) | (1,407,797) |
| 2% 7/1/54 | (3,000,000) | (2,346,328) |
| 2% 7/1/54 | (17,100,000) | (13,374,071) |
| 2% 7/1/54 | (5,900,000) | (4,614,445) |
| 2% 7/1/54 | (5,925,000) | (4,633,998) |
| 2% 7/1/54 | (3,000,000) | (2,346,328) |
| 2% 7/1/54 | (5,600,000) | (4,379,813) |
| 2% 7/1/54 | (12,900,000) | (10,089,211) |
| 2% 7/1/54 | (7,375,000) | (5,768,057) |
| 2% 7/1/54 | (2,200,000) | (1,720,641) |
| 2.5% 7/1/54 | (26,100,000) | (21,316,361) |
| 2.5% 7/1/54 | (4,000,000) | (3,266,875) |
| 2.5% 7/1/54 | (3,200,000) | (2,613,500) |
| 2.5% 7/1/54 | (400,000) | (326,688) |
| 2.5% 7/1/54 | (400,000) | (326,688) |
| 2.5% 7/1/54 | (3,800,000) | (3,103,531) |
| 2.5% 7/1/54 | (1,700,000) | (1,388,422) |
| 2.5% 7/1/54 | (800,000) | (653,375) |
| 2.5% 7/1/54 | (2,900,000) | (2,368,485) |
| 2.5% 7/1/54 | (1,500,000) | (1,225,078) |
| 2.5% 7/1/54 | (2,225,000) | (1,817,199) |
| 2.5% 7/1/54 | (975,000) | (796,301) |
| 2.5% 7/1/54 | (800,000) | (653,375) |
| 2.5% 7/1/54 | (950,000) | (775,883) |
| 2.5% 7/1/54 | (500,000) | (408,359) |
| 3% 7/1/54 | (8,900,000) | (7,573,348) |
| 3% 7/1/54 | (1,600,000) | (1,361,501) |
| 3% 7/1/54 | (2,100,000) | (1,786,970) |
| 3% 7/1/54 | (4,750,000) | (4,041,956) |
| 3% 7/1/54 | (3,000,000) | (2,552,814) |
| 3.5% 7/1/54 | (3,600,000) | (3,186,279) |
| 3.5% 7/1/54 | (700,000) | (619,554) |
| 3.5% 7/1/54 | (1,500,000) | (1,327,616) |
| 3.5% 7/1/54 | (800,000) | (708,062) |
| 3.5% 7/1/54 | (700,000) | (619,554) |
| 3.5% 7/1/54 | (1,700,000) | (1,504,632) |
| 3.5% 8/1/54 | (1,075,000) | (951,626) |
| 4% 7/1/54 | (1,150,000) | (1,052,070) |
| 4% 7/1/54 | (1,150,000) | (1,052,070) |
| 5.5% 7/1/54 | (3,100,000) | (3,057,496) |
| 5.5% 7/1/54 | (3,300,000) | (3,254,754) |
| 6% 7/1/54 | (1,500,000) | (1,504,220) |
| 6% 7/1/54 | (2,500,000) | (2,507,033) |
| 6% 7/1/54 | (19,300,000) | (19,354,293) |
| 6.5% 7/1/54 | (1,000,000) | (1,017,734) |
| | | |
| TOTAL UNIFORM MORTGAGE BACKED SECURITIES | | (222,335,352) |
| | | |
TOTAL TBA SALE COMMITMENTS (Proceeds $318,228,082) | | (316,209,063) |
| Futures Contracts |
| | Number of contracts | Expiration Date | Notional Amount ($) | Value ($) | Unrealized Appreciation/ (Depreciation) ($) |
| Purchased | | | | | |
| | | | | | |
| Treasury Contracts | | | | | |
| CBOT Ultra Long Term U.S. Treasury Bond Contracts (United States) | 3 | Sep 2024 | 376,031 | 2,435 | 2,435 |
| | | | | | |
| Sold | | | | | |
| | | | | | |
| Treasury Contracts | | | | | |
| CBOT 10-Year U.S. Treasury Note Contracts (United States) | 245 | Sep 2024 | 26,946,172 | (95,733) | (95,733) |
| CBOT 2-Year U.S. Treasury Note Contracts (United States) | 85 | Sep 2024 | 17,358,594 | (15,334) | (15,334) |
| CBOT 5-Year U.S. Treasury Note Contracts (United States) | 37 | Sep 2024 | 3,943,391 | (17,118) | (17,118) |
| CBOT Long Term U.S. Treasury Bond Contracts (United States) | 92 | Sep 2024 | 10,884,750 | (82,116) | (82,116) |
| | | | | | |
| TOTAL SOLD | | | | | (210,301) |
| | | | | | |
| TOTAL FUTURES CONTRACTS | | | | | (207,866) |
| The notional amount of futures purchased as a percentage of Net Assets is 0.0% |
| The notional amount of futures sold as a percentage of Net Assets is 1.4% |
For the period, the average monthly notional amount at value for futures contracts in the aggregate was $69,457,721.
| Credit Default Swaps |
| Underlying Reference | Rating(1) | Maturity Date | Clearinghouse / Counterparty | Fixed Payment Received/ (Paid) | Payment Frequency | Notional Amount(2)(3) | Value ($)(1) | Upfront Premium Received/ (Paid) ($) | Unrealized Appreciation/ (Depreciation) ($) |
| Buy Protection | | | | | | | | | | |
| CMBX N.A. AAA Index Series 13 | | Dec 2072 | Citigroup Global Markets Ltd. | (0.5%) | Monthly | | 530,000 | 4,560 | (4,743) | (183) |
| CMBX N.A. AAA Index Series 13 | | Dec 2072 | Citigroup Global Markets Ltd. | (0.5%) | Monthly | | 1,110,000 | 9,550 | (11,900) | (2,350) |
| CMBX N.A. AAA Index Series 13 | | Dec 2072 | Morgan Stanley Capital Services LLC | (0.5%) | Monthly | | 2,150,000 | 18,497 | (34,328) | (15,831) |
| CMBX N.A. BBB- Index Series 16 | | Apr 2065 | Citigroup Global Markets Ltd. | (3%) | Monthly | | 490,000 | 85,848 | (128,698) | (42,850) |
| CMBX N.A. BBB- Index Series 16 | | Apr 2065 | Citigroup Global Markets Ltd. | (3%) | Monthly | | 230,000 | 40,296 | (53,008) | (12,712) |
| CMBX N.A. BBB- Index Series 16 | | Apr 2065 | Citigroup Global Markets Ltd. | (3%) | Monthly | | 340,000 | 59,568 | (75,764) | (16,196) |
| CMBX N.A. BBB- Index Series 16 | | Apr 2065 | Citigroup Global Markets Ltd. | (3%) | Monthly | | 500,000 | 87,600 | (137,233) | (49,633) |
| CMBX N.A. BBB- Index Series 16 | | Apr 2065 | JPMorgan Securities LLC | (3%) | Monthly | | 130,000 | 22,776 | (39,287) | (16,511) |
| CMBX N.A. BBB- Index Series 16 | | Apr 2065 | Morgan Stanley Capital Services LLC | (3%) | Monthly | | 530,000 | 92,856 | (133,837) | (40,981) |
| CMBX N.A. BBB- Index Series 16 | | Apr 2065 | Morgan Stanley Capital Services LLC | (3%) | Monthly | | 250,000 | 43,800 | (66,840) | (23,040) |
| CMBX N.A. BBB- Index Series 16 | | Apr 2065 | Morgan Stanley Capital Services LLC | (3%) | Monthly | | 250,000 | 43,800 | (71,673) | (27,873) |
| CMBX N.A. BBB- Index Series 16 | | Apr 2065 | Morgan Stanley Capital Services LLC | (3%) | Monthly | | 460,000 | 80,592 | (114,102) | (33,510) |
| CMBX N.A. BBB- Index Series 16 | | Apr 2065 | Morgan Stanley Capital Services LLC | (3%) | Monthly | | 120,000 | 21,024 | (28,334) | (7,310) |
| CMBX N.A. BBB- Index Series 16 | | Apr 2065 | Morgan Stanley Capital Services LLC | (3%) | Monthly | | 210,000 | 36,792 | (48,254) | (11,462) |
| CMBX N.A. BBB- Index Series 16 | | Apr 2065 | Morgan Stanley Capital Services LLC | (3%) | Monthly | | 300,000 | 52,560 | (50,465) | 2,095 |
| CMBX N.A. BBB- Index Series 17 | | Dec 2056 | Citigroup Global Markets Ltd. | (3%) | Monthly | | 200,000 | 27,917 | (32,516) | (4,599) |
| CMBX N.A. BBB- Index Series 17 | | Dec 2056 | JPMorgan Securities LLC | (3%) | Monthly | | 600,000 | 83,751 | (79,413) | 4,338 |
| CMBX N.A. BBB- Index Series 17 | | Dec 2056 | Morgan Stanley Capital Services LLC | (3%) | Monthly | | 300,000 | 41,875 | (41,998) | (123) |
| CMBX N.A. BBB- Index Series 17 | | Dec 2056 | Morgan Stanley Capital Services LLC | (3%) | Monthly | | 400,000 | 55,834 | (57,395) | (1,561) |
| | | | | | | | | | | |
| TOTAL BUY PROTECTION | | | | | | | | 909,496 | (1,209,788) | (300,292) |
| Sell Protection | | | | | | | | | | |
| CMBX N.A. AAA Index Series 13 | NR | Dec 2072 | Morgan Stanley Capital Services LLC | 0.5% | Monthly | | 630,000 | (5,420) | 14,253 | 8,833 |
| CMBX N.A. AAA Index Series 13 | NR | Dec 2072 | Morgan Stanley Capital Services LLC | 0.5% | Monthly | | 3,160,000 | (27,186) | 73,521 | 46,335 |
| CMBX N.A. AAA Index Series 15 | NR | Nov 2064 | Citigroup Global Markets Ltd. | 0.5% | Monthly | | 1,900,000 | (30,920) | 26,005 | (4,915) |
| CMBX N.A. AAA Index Series 15 | NR | Nov 2064 | Citigroup Global Markets Ltd. | 0.5% | Monthly | | 1,000,000 | (16,274) | 15,321 | (953) |
| CMBX N.A. AAA Index Series 15 | NR | Nov 2064 | Morgan Stanley Capital Services LLC | 0.5% | Monthly | | 3,900,000 | (68,660) | 61,313 | (7,347) |
| CMBX N.A. AAA Index Series 16 | NR | Apr 2065 | Citigroup Global Markets Ltd. | 0.5% | Monthly | | 1,400,000 | (28,687) | 28,102 | (585) |
| CMBX N.A. AAA Index Series 16 | NR | Apr 2065 | Citigroup Global Markets Ltd. | 0.5% | Monthly | | 4,200,000 | (86,060) | 84,918 | (1,142) |
| CMBX N.A. AAA Index Series 17 | NR | Dec 2056 | Citigroup Global Markets Ltd. | 0.5% | Monthly | | 1,300,000 | (33,552) | 32,622 | (930) |
| CMBX N.A. AAA Index Series 17 | NR | Dec 2056 | Citigroup Global Markets Ltd. | 0.5% | Monthly | | 4,200,000 | (108,397) | 106,067 | (2,330) |
| | | | | | | | | | | |
| TOTAL SELL PROTECTION | | | | | | | | (405,156) | 442,122 | 36,966 |
| TOTAL CREDIT DEFAULT SWAPS | | | | | | | | 504,340 | (767,666) | (263,326) |
(1)Ratings are presented for credit default swaps in which the Fund has sold protection on the underlying referenced debt. Ratings for an underlying index represent a weighted average of the ratings of all securities included in the index. The credit rating or value can be measures of the current payment/performance risk. Ratings are from Moody's Investors Service, Inc. Where Moody's® ratings are not available, S&P® ratings are disclosed and are indicated as such. All ratings are as of the report date and do not reflect subsequent changes.
(2)The notional amount of each credit default swap where the Fund has sold protection approximates the maximum potential amount of future payments that the Fund could be required to make if a credit event were to occur.
(3)Notional amount is stated in U.S. Dollars unless otherwise noted.
| Interest Rate Swaps |
| Payment Received | Payment Frequency | Payment Paid | Payment Frequency | Clearinghouse / Counterparty(1) | Maturity Date | Notional Amount(2) | Value ($) | Upfront Premium Received/ (Paid) ($)(3) | Unrealized Appreciation/ (Depreciation) ($) |
U.S. Secured Overnight Fin. Rate (SOFR) Index(4) | Annual | 3.75% | Annual | LCH | Sep 2026 | | 38,650,000 | 71,918 | 0 | 71,918 |
U.S. Secured Overnight Fin. Rate (SOFR) Index(4) | Annual | 3.5% | Annual | LCH | Sep 2027 | | 8,630,000 | 24,592 | 0 | 24,592 |
U.S. Secured Overnight Fin. Rate (SOFR) Index(4) | Annual | 3.5% | Annual | LCH | Sep 2029 | | 8,893,000 | 55,359 | 0 | 55,359 |
U.S. Secured Overnight Fin. Rate (SOFR) Index(4) | Annual | 3.5% | Annual | LCH | Sep 2031 | | 31,950,000 | 290,039 | 0 | 290,039 |
| 3.75% | Annual | U.S. Secured Overnight Fin. Rate (SOFR) Index(4) | Annual | LCH | Sep 2034 | | 6,388,000 | (79,915) | 0 | (79,915) |
U.S. Secured Overnight Fin. Rate (SOFR) Index(4) | Annual | 3.75% | Annual | LCH | Sep 2044 | | 6,425,000 | 135,003 | 0 | 135,003 |
| 3.5% | Annual | U.S. Secured Overnight Fin. Rate (SOFR) Index(4) | Annual | LCH | Sep 2054 | | 504,000 | (14,945) | 0 | (14,945) |
| TOTAL INTEREST RATE SWAPS | | | | | | | | 482,051 | 0 | 482,051 |
(1)Swaps with LCH Clearnet Group (LCH) are centrally cleared swaps.
(2)Notional amount is stated in U.S. Dollars unless otherwise noted.
(3)Any premiums for centrally cleared swaps are recorded periodically throughout the term of the swap to variation margin and included in unrealized appreciation (depreciation).
(4)Represents floating rate.
For the period, the average monthly notional amount at value for swaps in the aggregate was $17,846,667.
Legend
| (a) | Amount is stated in United States dollars unless otherwise noted. |
| (b) | Security exempt from registration under Rule 144A of the Securities Act of 1933. These securities may be resold in transactions exempt from registration, normally to qualified institutional buyers. At the end of the period, the value of these securities amounted to $672,617,044 or 16.0% of net assets. |
| (c) | Coupon rates for floating and adjustable rate securities reflect the rates in effect at period end. |
| (d) | Coupon is indexed to a floating interest rate which may be multiplied by a specified factor and/or subject to caps or floors. |
| (e) | Security or a portion of the security was pledged to cover margin requirements for futures contracts. At period end, the value of securities pledged amounted to $1,093,421. |
| (f) | Security or a portion of the security was pledged to cover margin requirements for centrally cleared swaps. At period end, the value of securities pledged amounted to $2,565,901. |
| (g) | Security or a portion of the security purchased on a delayed delivery or when-issued basis. |
| (h) | Coupon is inversely indexed to a floating interest rate multiplied by a specified factor. The price may be considerably more volatile than the price of a comparable fixed rate security. |
| (i) | Interest Only (IO) security represents the right to receive only monthly interest payments on an underlying pool of mortgages or assets. Principal shown is the outstanding par amount of the pool as of the end of the period. |
| (j) | Affiliated fund that is generally available only to investment companies and other accounts managed by Fidelity Investments. A complete unaudited schedule of portfolio holdings for each Fidelity Central Fund is filed with the SEC for the first and third quarters of each fiscal year on Form N-PORT and is available upon request or at the SEC's website at www.sec.gov. An unaudited holdings listing for the Fund, which presents direct holdings as well as the pro-rata share of securities and other investments held indirectly through its investment in underlying non-money market Fidelity Central Funds, is available at fidelity.com and/or institutional.fidelity.com, as applicable. In addition, each Fidelity Central Fund's financial statements are available on the SEC's website or upon request. |
| (k) | Affiliated fund that is generally available only to investment companies and other accounts managed by Fidelity Investments. The rate quoted is the annualized seven-day yield of the fund at period end. A complete unaudited listing of the fund's holdings as of its most recent quarter end is available upon request. In addition, each Fidelity Central Fund's financial statements are available on the SEC's website or upon request. |
Affiliated Central Funds
Fiscal year to date information regarding the Fund's investments in Fidelity Central Funds, including the ownership percentage, is presented below.
| Affiliate | Value, beginning of period ($) | Purchases ($) | Sales Proceeds ($) | Dividend Income ($) | Realized Gain (loss) ($) | Change in Unrealized appreciation (depreciation) ($) | Value, end of period ($) | % ownership, end of period |
| Fidelity Cash Central Fund 5.38% | 75,335,255 | 505,451,512 | 522,354,579 | 2,448,314 | 625 | - | 58,432,813 | 0.1% |
| Fidelity Securities Lending Cash Central Fund 5.38% | - | 142,348,829 | 142,348,829 | 8,448 | - | - | - | 0.0% |
| Fidelity Specialized High Income Central Fund | 71,071,422 | 2,008,051 | - | 2,008,223 | - | (205,039) | 72,874,434 | 31.2% |
| Total | 146,406,677 | 649,808,392 | 664,703,408 | 4,464,985 | 625 | (205,039) | 131,307,247 | |
| | | | | | | | | |
Amounts in the dividend income column in the above table include any capital gain distributions from underlying funds, which are presented in the corresponding line item in the Statement of Operations, if applicable.
Amounts in the dividend income column for Fidelity Securities Lending Cash Central Fund represents the income earned on investing cash collateral, less rebates paid to borrowers and any lending agent fees associated with the loan, plus any premium payments received for lending certain types of securities.
Amounts included in the purchases and sales proceeds columns may include in-kind transactions, if applicable.
Investment Valuation
The following is a summary of the inputs used, as of June 30, 2024, involving the Fund's assets and liabilities carried at fair value. The inputs or methodology used for valuing securities may not be an indication of the risk associated with investing in those securities. For more information on valuation inputs, and their aggregation into the levels used below, please refer to the Investment Valuation section in the accompanying Notes to Financial Statements.
| Valuation Inputs at Reporting Date: |
| Description | Total ($) | Level 1 ($) | Level 2 ($) | Level 3 ($) |
Investments in Securities: | | | | |
|
| Corporate Bonds | 1,060,369,478 | - | 1,060,369,478 | - |
|
| U.S. Government and Government Agency Obligations | 1,794,543,339 | - | 1,794,543,339 | - |
|
| U.S. Government Agency - Mortgage Securities | 1,169,434,660 | - | 1,169,434,660 | - |
|
| Asset-Backed Securities | 346,925,839 | - | 346,925,839 | - |
|
| Collateralized Mortgage Obligations | 62,734,627 | - | 62,734,627 | - |
|
| Commercial Mortgage Securities | 244,185,515 | - | 244,185,515 | - |
|
| Foreign Government and Government Agency Obligations | 2,713,523 | - | 2,713,523 | - |
|
| Bank Notes | 6,855,832 | - | 6,855,832 | - |
|
| Fixed-Income Funds | 72,874,434 | 72,874,434 | - | - |
|
| Money Market Funds | 58,432,813 | 58,432,813 | - | - |
|
| Purchased Swaptions | 2,519,892 | - | 2,519,892 | - |
| Total Investments in Securities: | 4,821,589,952 | 131,307,247 | 4,690,282,705 | - |
Derivative Instruments: Assets | | | | |
Futures Contracts | 2,435 | 2,435 | - | - |
Swaps | 1,486,407 | - | 1,486,407 | - |
| Total Assets | 1,488,842 | 2,435 | 1,486,407 | - |
| Liabilities | | | | |
Futures Contracts | (210,301) | (210,301) | - | - |
Swaps | (500,016) | - | (500,016) | - |
| Total Liabilities | (710,317) | (210,301) | (500,016) | - |
| Total Derivative Instruments: | 778,525 | (207,866) | 986,391 | - |
Other Financial Instruments: | | | | |
TBA Sale Commitments | (316,209,063) | - | (316,209,063) | - |
| Total Other Financial Instruments: | (316,209,063) | - | (316,209,063) | - |
Value of Derivative Instruments
The following table is a summary of the Fund's value of derivative instruments by primary risk exposure as of June 30, 2024. For additional information on derivative instruments, please refer to the Derivative Instruments section in the accompanying Notes to Financial Statements.
Primary Risk Exposure / Derivative Type | Value |
| Asset ($) | Liability ($) |
| Credit Risk | | |
Swaps (a) | 909,496 | (405,156) |
| Total Credit Risk | 909,496 | (405,156) |
| Interest Rate Risk | | |
Futures Contracts (b) | 2,435 | (210,301) |
Purchased Swaptions (c) | 2,519,892 | 0 |
Swaps (d) | 576,911 | (94,860) |
| Total Interest Rate Risk | 3,099,238 | (305,161) |
| Total Value of Derivatives | 4,008,734 | (710,317) |
(a)For bi-lateral over-the-counter (OTC) swaps, reflects gross value which is presented in the Statement of Assets and Liabilities in the bi-lateral OTC swaps, at value line-items.
(b)Reflects gross cumulative appreciation (depreciation) on futures contracts as presented in the Schedule of Investments. In the Statement of Assets and Liabilities, the period end daily variation margin is included in receivable or payable for daily variation margin on futures contracts, and the net cumulative appreciation (depreciation) is included in Total accumulated earnings (loss).
(c)Gross value is presented in the Statement of Assets and Liabilities in the Investments in Securities at value line-item.
(d)For centrally cleared swaps, reflects gross cumulative appreciation (depreciation) as presented in the Schedule of Investments. In the Statement of Assets and Liabilities, the period end daily variation margin for centrally cleared swaps is included in receivable or payable for daily variation margin on centrally cleared swaps, and the net cumulative appreciation (depreciation) for centrally cleared swaps is included in Total accumulated earnings (loss).
Financial Statements (Unaudited)
| Statement of Assets and Liabilities |
| | | | June 30, 2024 (Unaudited) |
| | | | | |
| Assets | | | | |
| Investment in securities, at value - See accompanying schedule: | | | | |
Unaffiliated issuers (cost $5,090,888,069) | $ | 4,690,282,705 | | |
Fidelity Central Funds (cost $136,151,633) | | 131,307,247 | | |
| | | | | |
| | | | | |
| Total Investment in Securities (cost $5,227,039,702) | | | $ | 4,821,589,952 |
| Cash | | | | 1,112,947 |
| Receivable for investments sold | | | | 3,189,180 |
| Receivable for TBA sale commitments | | | | 318,228,082 |
| Receivable for swaps | | | | 61,313 |
| Receivable for fund shares sold | | | | 1,700,228 |
| Interest receivable | | | | 37,480,443 |
| Distributions receivable from Fidelity Central Funds | | | | 257,385 |
| Receivable for daily variation margin on futures contracts | | | | 133,153 |
| Receivable for daily variation margin on centrally cleared swaps | | | | 152,125 |
| Bi-lateral OTC swaps, at value | | | | 909,496 |
Total assets | | | | 5,184,814,304 |
| Liabilities | | | | |
| Payable for investments purchased | | | | |
Regular delivery | $ | 23,595,883 | | |
Delayed delivery | | 625,386,004 | | |
| TBA sale commitments, at value | | 316,209,063 | | |
| Payable for fund shares redeemed | | 1,301,284 | | |
| Bi-lateral OTC swaps, at value | | 405,156 | | |
| Accrued management fee | | 1,324,158 | | |
| Distribution and service plan fees payable | | 502,924 | | |
| Other payables and accrued expenses | | 122,975 | | |
| Total liabilities | | | | 968,847,447 |
| Net Assets | | | $ | 4,215,966,857 |
| Net Assets consist of: | | | | |
| Paid in capital | | | $ | 4,795,617,794 |
| Total accumulated earnings (loss) | | | | (579,650,937) |
| Net Assets | | | $ | 4,215,966,857 |
| | | | | |
| Net Asset Value and Maximum Offering Price | | | | |
| Initial Class : | | | | |
Net Asset Value, offering price and redemption price per share ($578,871,441 ÷ 52,197,307 shares) | | | $ | 11.09 |
| Service Class : | | | | |
Net Asset Value, offering price and redemption price per share ($805,504,573 ÷ 73,753,585 shares) | | | $ | 10.92 |
| Service Class 2 : | | | | |
Net Asset Value, offering price and redemption price per share ($2,092,808,978 ÷ 195,120,876 shares) | | | $ | 10.73 |
| Investor Class : | | | | |
Net Asset Value, offering price and redemption price per share ($738,781,865 ÷ 66,982,762 shares) | | | $ | 11.03 |
| Statement of Operations |
| | | | Six months ended June 30, 2024 (Unaudited) |
| Investment Income | | | | |
| Interest | | | $ | 78,197,079 |
| Income from Fidelity Central Funds (including $8,448 from security lending) | | | | 4,464,985 |
| Total income | | | | 82,662,064 |
| Expenses | | | | |
| Management fee | $ | 7,160,512 | | |
| Transfer agent fees | | 495,652 | | |
| Distribution and service plan fees | | 2,918,416 | | |
| Accounting fees | | 190,528 | | |
| Custodian fees and expenses | | 74,336 | | |
| Independent trustees' fees and expenses | | 5,445 | | |
| Registration fees | | 36,293 | | |
| Audit | | 23,384 | | |
| Legal | | 3,049 | | |
| Miscellaneous | | 145,037 | | |
| Total expenses before reductions | | 11,052,652 | | |
| Expense reductions | | (96,617) | | |
| Total expenses after reductions | | | | 10,956,035 |
| Net Investment income (loss) | | | | 71,706,029 |
| Realized and Unrealized Gain (Loss) | | | | |
| Net realized gain (loss) on: | | | | |
| Investment Securities: | | | | |
| Unaffiliated issuers | | (20,852,804) | | |
| Fidelity Central Funds | | 625 | | |
| Futures contracts | | (690,800) | | |
| Swaps | | 1,025,356 | | |
| Written options | | 25,125 | | |
| Total net realized gain (loss) | | | | (20,492,498) |
| Change in net unrealized appreciation (depreciation) on: | | | | |
| Investment Securities: | | | | |
| Unaffiliated issuers | | (64,850,698) | | |
| Fidelity Central Funds | | (205,039) | | |
| Futures contracts | | 705,913 | | |
| Swaps | | 1,575,912 | | |
| Written options | | (4,065) | | |
| TBA Sale commitments | | 3,718,012 | | |
| Total change in net unrealized appreciation (depreciation) | | | | (59,059,965) |
| Net gain (loss) | | | | (79,552,463) |
| Net increase (decrease) in net assets resulting from operations | | | $ | (7,846,434) |
| Statement of Changes in Net Assets |
| |
| | Six months ended June 30, 2024 (Unaudited) | | Year ended December 31, 2023 |
| Increase (Decrease) in Net Assets | | | | |
| Operations | | | | |
| Net investment income (loss) | $ | 71,706,029 | $ | 122,023,322 |
| Net realized gain (loss) | | (20,492,498) | | (130,976,357) |
| Change in net unrealized appreciation (depreciation) | | (59,059,965) | | 234,939,061 |
| Net increase (decrease) in net assets resulting from operations | | (7,846,434) | | 225,986,026 |
| Distributions to shareholders | | (22,730,993) | | (99,999,165) |
| | | | | |
| Share transactions - net increase (decrease) | | 173,532,830 | | 271,659,229 |
| Total increase (decrease) in net assets | | 142,955,403 | | 397,646,090 |
| | | | | |
| Net Assets | | | | |
| Beginning of period | | 4,073,011,454 | | 3,675,365,364 |
| End of period | $ | 4,215,966,857 | $ | 4,073,011,454 |
| | | | | |
| | | | | |
Financial Highlights
VIP Investment Grade Bond Portfolio Initial Class |
| |
| | Six months ended (Unaudited) June 30, 2024 | | Years ended December 31, 2023 | | 2022 | | 2021 | | 2020 | | 2019 |
Selected Per-Share Data | | | | | | | | | | | | |
| Net asset value, beginning of period | $ | 11.17 | $ | 10.80 | $ | 13.35 | $ | 14.09 | $ | 13.17 | $ | 12.34 |
| Income from Investment Operations | | | | | | | | | | | | |
Net investment income (loss) A,B | | .201 | | .364 | | .245 | | .228 | | .328 | | .382 |
| Net realized and unrealized gain (loss) | | (.217) | | .296 | | (1.903) | | (.313) | | .903 | | .806 |
| Total from investment operations | | (.016) | | .660 | | (1.658) | | (.085) | | 1.231 | | 1.188 |
| Distributions from net investment income | | (.064) | | (.290) | | (.264) | | (.282) | | (.306) | | (.358) |
| Distributions from net realized gain | | - | | - | | (.628) | | (.373) | | (.005) | | - |
| Total distributions | | (.064) | | (.290) | | (.892) | | (.655) | | (.311) | | (.358) |
| Net asset value, end of period | $ | 11.09 | $ | 11.17 | $ | 10.80 | $ | 13.35 | $ | 14.09 | $ | 13.17 |
Total Return C,D,E | | | | 6.20% | | (12.96)% | | (.61)% | | 9.39% | | 9.67% |
Ratios to Average Net Assets B,F,G | | | | | | | | | | | | |
| Expenses before reductions | | .39% H | | .41% | | .40% | | .39% | | .39% | | .40% |
| Expenses net of fee waivers, if any | | | | .40% | | .40% | | .39% | | .39% | | .40% |
| Expenses net of all reductions | | .39% H | | .40% | | .40% | | .39% | | .39% | | .40% |
| Net investment income (loss) | | 3.67% H | | 3.31% | | 2.08% | | 1.66% | | 2.38% | | 2.93% |
| Supplemental Data | | | | | | | | | | | | |
| Net assets, end of period (000 omitted) | $ | 578,871 | $ | 569,512 | $ | 533,204 | $ | 1,347,145 | $ | 1,322,750 | $ | 1,146,767 |
Portfolio turnover rate I | | | | 188% | | 183% J | | 125% | | 11% | | 5% |
ACalculated based on average shares outstanding during the period.
BNet investment income (loss) is affected by the timing of the declaration of dividends by any underlying mutual funds or exchange-traded funds (ETFs). Net investment income (loss) of any mutual funds or ETFs is not included in the Fund's net investment income (loss) ratio.
CTotal returns for periods of less than one year are not annualized.
DTotal returns do not reflect charges attributable to your insurance company's separate account. Inclusion of these charges would reduce the total returns shown.
ETotal returns would have been lower if certain expenses had not been reduced during the applicable periods shown.
FFees and expenses of any underlying mutual funds or exchange-traded funds (ETFs) are not included in the Fund's expense ratio. The Fund indirectly bears its proportionate share of these expenses. For additional expense information related to investments in Fidelity Central Funds, please refer to the "Investments in Fidelity Central Funds" note found in the Notes to Financial Statements section of the most recent Annual or Semi-Annual report.
GExpense ratios reflect operating expenses of the class. Expenses before reductions do not reflect amounts reimbursed, waived, or reduced through arrangements with the investment adviser, brokerage services, or other offset arrangements, if applicable, and do not represent the amount paid by the class during periods when reimbursements, waivers or reductions occur.
HAnnualized.
IAmount does not include the portfolio activity of any underlying mutual funds or exchange-traded funds (ETFs).
JPortfolio turnover rate excludes securities received or delivered in-kind.
VIP Investment Grade Bond Portfolio Service Class |
| |
| | Six months ended (Unaudited) June 30, 2024 | | Years ended December 31, 2023 | | 2022 | | 2021 | | 2020 | | 2019 |
Selected Per-Share Data | | | | | | | | | | | | |
| Net asset value, beginning of period | $ | 11.01 | $ | 10.65 | $ | 13.18 | $ | 13.93 | $ | 13.02 | $ | 12.20 |
| Income from Investment Operations | | | | | | | | | | | | |
Net investment income (loss) A,B | | .192 | | .347 | | .226 | | .212 | | .310 | | .364 |
| Net realized and unrealized gain (loss) | | (.220) | | .295 | | (1.870) | | (.322) | | .899 | | .800 |
| Total from investment operations | | (.028) | | .642 | | (1.644) | | (.110) | | 1.209 | | 1.164 |
| Distributions from net investment income | | (.062) | | (.282) | | (.258) | | (.267) | | (.294) | | (.344) |
| Distributions from net realized gain | | - | | - | | (.628) | | (.373) | | (.005) | | - |
| Total distributions | | (.062) | | (.282) | | (.886) | | (.640) | | (.299) | | (.344) |
| Net asset value, end of period | $ | 10.92 | $ | 11.01 | $ | 10.65 | $ | 13.18 | $ | 13.93 | $ | 13.02 |
Total Return C,D,E | | | | 6.12% | | (13.03)% | | (.79)% | | 9.33% | | 9.58% |
Ratios to Average Net Assets B,F,G | | | | | | | | | | | | |
| Expenses before reductions | | .49% H | | .51% | | .50% | | .49% | | .49% | | .50% |
| Expenses net of fee waivers, if any | | | | .50% | | .50% | | .49% | | .49% | | .50% |
| Expenses net of all reductions | | .49% H | | .50% | | .50% | | .49% | | .49% | | .50% |
| Net investment income (loss) | | 3.56% H | | 3.21% | | 1.98% | | 1.56% | | 2.28% | | 2.83% |
| Supplemental Data | | | | | | | | | | | | |
| Net assets, end of period (000 omitted) | $ | 805,505 | $ | 765,619 | $ | 669,290 | $ | 732,762 | $ | 692,787 | $ | 582,182 |
Portfolio turnover rate I | | | | 188% | | 183% J | | 125% | | 11% | | 5% |
ACalculated based on average shares outstanding during the period.
BNet investment income (loss) is affected by the timing of the declaration of dividends by any underlying mutual funds or exchange-traded funds (ETFs). Net investment income (loss) of any mutual funds or ETFs is not included in the Fund's net investment income (loss) ratio.
CTotal returns for periods of less than one year are not annualized.
DTotal returns do not reflect charges attributable to your insurance company's separate account. Inclusion of these charges would reduce the total returns shown.
ETotal returns would have been lower if certain expenses had not been reduced during the applicable periods shown.
FFees and expenses of any underlying mutual funds or exchange-traded funds (ETFs) are not included in the Fund's expense ratio. The Fund indirectly bears its proportionate share of these expenses. For additional expense information related to investments in Fidelity Central Funds, please refer to the "Investments in Fidelity Central Funds" note found in the Notes to Financial Statements section of the most recent Annual or Semi-Annual report.
GExpense ratios reflect operating expenses of the class. Expenses before reductions do not reflect amounts reimbursed, waived, or reduced through arrangements with the investment adviser, brokerage services, or other offset arrangements, if applicable, and do not represent the amount paid by the class during periods when reimbursements, waivers or reductions occur.
HAnnualized.
IAmount does not include the portfolio activity of any underlying mutual funds or exchange-traded funds (ETFs).
JPortfolio turnover rate excludes securities received or delivered in-kind.
VIP Investment Grade Bond Portfolio Service Class 2 |
| |
| | Six months ended (Unaudited) June 30, 2024 | | Years ended December 31, 2023 | | 2022 | | 2021 | | 2020 | | 2019 |
Selected Per-Share Data | | | | | | | | | | | | |
| Net asset value, beginning of period | $ | 10.82 | $ | 10.47 | $ | 12.98 | $ | 13.72 | $ | 12.83 | $ | 12.03 |
| Income from Investment Operations | | | | | | | | | | | | |
Net investment income (loss) A,B | | .181 | | .325 | | .206 | | .188 | | .285 | | .340 |
| Net realized and unrealized gain (loss) | | (.212) | | .294 | | (1.848) | | (.310) | | .885 | | .787 |
| Total from investment operations | | (.031) | | .619 | | (1.642) | | (.122) | | 1.170 | | 1.127 |
| Distributions from net investment income | | (.059) | | (.269) | | (.240) | | (.245) | | (.275) | | (.327) |
| Distributions from net realized gain | | - | | - | | (.628) | | (.373) | | (.005) | | - |
| Total distributions | | (.059) | | (.269) | | (.868) | | (.618) | | (.280) | | (.327) |
| Net asset value, end of period | $ | 10.73 | $ | 10.82 | $ | 10.47 | $ | 12.98 | $ | 13.72 | $ | 12.83 |
Total Return C,D,E | | | | 6.00% | | (13.21)% | | (.90)% | | 9.16% | | 9.40% |
Ratios to Average Net Assets B,F,G | | | | | | | | | | | | |
| Expenses before reductions | | .64% H | | .66% | | .65% | | .64% | | .64% | | .65% |
| Expenses net of fee waivers, if any | | | | .65% | | .65% | | .64% | | .64% | | .65% |
| Expenses net of all reductions | | .64% H | | .65% | | .65% | | .64% | | .64% | | .65% |
| Net investment income (loss) | | 3.41% H | | 3.06% | | 1.83% | | 1.41% | | 2.13% | | 2.68% |
| Supplemental Data | | | | | | | | | | | | |
| Net assets, end of period (000 omitted) | $ | 2,092,809 | $ | 1,999,157 | $ | 1,747,984 | $ | 2,135,986 | $ | 1,935,645 | $ | 1,698,902 |
Portfolio turnover rate I | | | | 188% | | 183% J | | 125% | | 11% | | 5% |
ACalculated based on average shares outstanding during the period.
BNet investment income (loss) is affected by the timing of the declaration of dividends by any underlying mutual funds or exchange-traded funds (ETFs). Net investment income (loss) of any mutual funds or ETFs is not included in the Fund's net investment income (loss) ratio.
CTotal returns for periods of less than one year are not annualized.
DTotal returns do not reflect charges attributable to your insurance company's separate account. Inclusion of these charges would reduce the total returns shown.
ETotal returns would have been lower if certain expenses had not been reduced during the applicable periods shown.
FFees and expenses of any underlying mutual funds or exchange-traded funds (ETFs) are not included in the Fund's expense ratio. The Fund indirectly bears its proportionate share of these expenses. For additional expense information related to investments in Fidelity Central Funds, please refer to the "Investments in Fidelity Central Funds" note found in the Notes to Financial Statements section of the most recent Annual or Semi-Annual report.
GExpense ratios reflect operating expenses of the class. Expenses before reductions do not reflect amounts reimbursed, waived, or reduced through arrangements with the investment adviser, brokerage services, or other offset arrangements, if applicable, and do not represent the amount paid by the class during periods when reimbursements, waivers or reductions occur.
HAnnualized.
IAmount does not include the portfolio activity of any underlying mutual funds or exchange-traded funds (ETFs).
JPortfolio turnover rate excludes securities received or delivered in-kind.
VIP Investment Grade Bond Portfolio Investor Class |
| |
| | Six months ended (Unaudited) June 30, 2024 | | Years ended December 31, 2023 | | 2022 | | 2021 | | 2020 | | 2019 |
Selected Per-Share Data | | | | | | | | | | | | |
| Net asset value, beginning of period | $ | 11.11 | $ | 10.75 | $ | 13.29 | $ | 14.03 | $ | 13.12 | $ | 12.29 |
| Income from Investment Operations | | | | | | | | | | | | |
Net investment income (loss) A,B | | .197 | | .358 | | .238 | | .223 | | .322 | | .376 |
| Net realized and unrealized gain (loss) | | (.214) | | .289 | | (1.888) | | (.313) | | .896 | | .808 |
| Total from investment operations | | (.017) | | .647 | | (1.650) | | (.090) | | 1.218 | | 1.184 |
| Distributions from net investment income | | (.063) | | (.287) | | (.262) | | (.277) | | (.303) | | (.354) |
| Distributions from net realized gain | | - | | - | | (.628) | | (.373) | | (.005) | | - |
| Total distributions | | (.063) | | (.287) | | (.890) | | (.650) | | (.308) | | (.354) |
| Net asset value, end of period | $ | 11.03 | $ | 11.11 | $ | 10.75 | $ | 13.29 | $ | 14.03 | $ | 13.12 |
Total Return C,D,E | | | | 6.11% | | (12.96)% | | (.64)% | | 9.33% | | 9.67% |
Ratios to Average Net Assets B,F,G | | | | | | | | | | | | |
| Expenses before reductions | | .43% H | | .44% | | .43% | | .42% | | .43% | | .43% |
| Expenses net of fee waivers, if any | | | | .44% | | .43% | | .42% | | .43% | | .43% |
| Expenses net of all reductions | | .42% H | | .44% | | .43% | | .42% | | .43% | | .43% |
| Net investment income (loss) | | 3.63% H | | 3.27% | | 2.05% | | 1.63% | | 2.34% | | 2.90% |
| Supplemental Data | | | | | | | | | | | | |
| Net assets, end of period (000 omitted) | $ | 738,782 | $ | 738,723 | $ | 724,888 | $ | 1,354,894 | $ | 1,438,829 | $ | 1,157,666 |
Portfolio turnover rate I | | | | 188% | | 183% J | | 125% | | 11% | | 5% |
ACalculated based on average shares outstanding during the period.
BNet investment income (loss) is affected by the timing of the declaration of dividends by any underlying mutual funds or exchange-traded funds (ETFs). Net investment income (loss) of any mutual funds or ETFs is not included in the Fund's net investment income (loss) ratio.
CTotal returns for periods of less than one year are not annualized.
DTotal returns do not reflect charges attributable to your insurance company's separate account. Inclusion of these charges would reduce the total returns shown.
ETotal returns would have been lower if certain expenses had not been reduced during the applicable periods shown.
FFees and expenses of any underlying mutual funds or exchange-traded funds (ETFs) are not included in the Fund's expense ratio. The Fund indirectly bears its proportionate share of these expenses. For additional expense information related to investments in Fidelity Central Funds, please refer to the "Investments in Fidelity Central Funds" note found in the Notes to Financial Statements section of the most recent Annual or Semi-Annual report.
GExpense ratios reflect operating expenses of the class. Expenses before reductions do not reflect amounts reimbursed, waived, or reduced through arrangements with the investment adviser, brokerage services, or other offset arrangements, if applicable, and do not represent the amount paid by the class during periods when reimbursements, waivers or reductions occur.
HAnnualized.
IAmount does not include the portfolio activity of any underlying mutual funds or exchange-traded funds (ETFs).
JPortfolio turnover rate excludes securities received or delivered in-kind.
Notes to Financial Statements
(Unaudited)For the period ended June 30, 2024
1. Organization.
VIP Investment Grade Bond Portfolio (the Fund) is a fund of Variable Insurance Products Fund V (the Trust) and is authorized to issue an unlimited number of shares. The Trust is registered under the Investment Company Act of 1940, as amended (the 1940 Act), as an open-end management investment company organized as a Massachusetts business trust. Shares of the Fund may only be purchased by insurance companies for the purpose of funding variable annuity or variable life insurance contracts. The Fund offers the following classes of shares: Initial Class shares, Service Class shares, Service Class 2 shares and Investor Class shares. All classes have equal rights and voting privileges, except for matters affecting a single class.
2. Investments in Fidelity Central Funds.
Funds may invest in Fidelity Central Funds, which are open-end investment companies generally available only to other investment companies and accounts managed by the investment adviser and its affiliates. The Schedule of Investments lists any Fidelity Central Funds held as an investment as of period end, but does not include the underlying holdings of each Fidelity Central Fund. An investing fund indirectly bears its proportionate share of the expenses of the underlying Fidelity Central Funds.
Based on its investment objective, each Fidelity Central Fund may invest or participate in various investment vehicles or strategies that are similar to those of the investing fund. These strategies are consistent with the investment objectives of the investing fund and may involve certain economic risks which may cause a decline in value of each of the Fidelity Central Funds and thus a decline in the value of the investing fund.
| Fidelity Central Fund | Investment Manager | Investment Objective | Investment Practices | Expense RatioA |
| Fidelity Specialized High Income Central Fund | Fidelity Management & Research Company LLC (FMR) | Seeks a high level of current income by normally investing in income-producing debt securities, with an emphasis on lower-quality debt securities. | Loans & Direct Debt Instruments Restricted Securities | Less than .005% |
| Fidelity Money Market Central Funds | Fidelity Management & Research Company LLC (FMR) | Each fund seeks to obtain a high level of current income consistent with the preservation of capital and liquidity. | Short-term Investments | Less than .005% |
A Expenses expressed as a percentage of average net assets and are as of each underlying Central Fund's most recent annual or semi-annual shareholder report.
An unaudited holdings listing for the investing fund, which presents direct holdings as well as the pro-rata share of any securities and other investments held indirectly through its investment in underlying non-money market Fidelity Central Funds, is available at fidelity.com and/or institutional.fidelity.com, as applicable. A complete unaudited list of holdings for each Fidelity Central Fund is available upon request or at the Securities and Exchange Commission website at www.sec.gov. In addition, the financial statements of the Fidelity Central Funds which contain the significant accounting policies (including investment valuation policies) of those funds, and are not covered by the Report of Independent Registered Public Accounting Firm, are available on the Securities and Exchange Commission website or upon request.
3. Significant Accounting Policies.
The Fund is an investment company and applies the accounting and reporting guidance of the Financial Accounting Standards Board (FASB) Accounting Standards Codification Topic 946 Financial Services - Investment Companies. The financial statements have been prepared in conformity with accounting principles generally accepted in the United States of America (GAAP), which require management to make certain estimates and assumptions at the date of the financial statements. Actual results could differ from those estimates. Subsequent events, if any, through the date that the financial statements were issued have been evaluated in the preparation of the financial statements. The Fund's Schedule of Investments lists any underlying mutual funds or exchange-traded funds (ETFs) but does not include the underlying holdings of these funds. The following summarizes the significant accounting policies of the Fund:
Investment Valuation. Investments are valued as of 4:00 p.m. Eastern time on the last calendar day of the period. The Board of Trustees (the Board) has designated the Fund's investment adviser as the valuation designee responsible for the fair valuation function and performing fair value determinations as needed. The investment adviser has established a Fair Value Committee (the Committee) to carry out the day-to-day fair valuation responsibilities and has adopted policies and procedures to govern the fair valuation process and the activities of the Committee. In accordance with these fair valuation policies and procedures, which have been approved by the Board, the Fund attempts to obtain prices from one or more third party pricing services or brokers to value its investments. When current market prices, quotations or currency exchange rates are not readily available or reliable, investments will be fair valued in good faith by the Committee, in accordance with the policies and procedures. Factors used in determining fair value vary by investment type and may include market or investment specific events, transaction data, estimated cash flows, and market observations of comparable investments. The frequency that the fair valuation procedures are used cannot be predicted and they may be utilized to a significant extent. The Committee manages the Fund's fair valuation practices and maintains the fair valuation policies and procedures. The Fund's investment adviser reports to the Board information regarding the fair valuation process and related material matters.
The Fund categorizes the inputs to valuation techniques used to value its investments into a disclosure hierarchy consisting of three levels as shown below:
Level 1 - unadjusted quoted prices in active markets for identical investments
Level 2 - other significant observable inputs (including quoted prices for similar investments, interest rates, prepayment speeds, etc.)
Level 3 - unobservable inputs (including the Fund's own assumptions based on the best information available)
Valuation techniques used to value the Fund's investments by major category are as follows:
Debt securities, including restricted securities, are valued based on evaluated prices received from third party pricing services or from brokers who make markets in such securities. Corporate bonds, bank notes, foreign government and government agency obligations and U.S. government and government agency obligations are valued by pricing services who utilize matrix pricing which considers yield or price of bonds of comparable quality, coupon, maturity and type or by broker-supplied prices. Asset backed securities, collateralized mortgage obligations, commercial mortgage securities and U.S. government agency mortgage securities are valued by pricing services who utilize matrix pricing which considers prepayment speed assumptions, attributes of the collateral, yield or price of bonds of comparable quality, coupon, maturity and type or by broker-supplied prices. Brokers which make markets in asset backed securities, collateralized mortgage obligations and commercial mortgage securities may also consider such factors as the structure of the issue, cash flow assumptions, the value of underlying assets as well as any guarantees. Swaps are marked-to-market daily based on valuations from third party pricing services, registered derivatives clearing organizations (clearinghouses) or broker-supplied valuations. These pricing sources may utilize inputs such as interest rate curves, credit spread curves, default possibilities and recovery rates. When independent prices are unavailable or unreliable, debt securities and swaps may be valued utilizing pricing methodologies which consider similar factors that would be used by third party pricing services. Debt securities and swaps are generally categorized as Level 2 in the hierarchy but may be Level 3 depending on the circumstances.
Futures contracts are valued at the settlement price established each day by the board of trade or exchange on which they are traded and are categorized as Level 1 in the hierarchy. Options traded over-the-counter are valued using service or broker-supplied valuations and are categorized as Level 2 in the hierarchy. Investments in open-end mutual funds, including the Fidelity Central Funds, are valued at their closing net asset value (NAV) each business day and are categorized as Level 1 in the hierarchy.
Changes in valuation techniques may result in transfers in or out of an assigned level within the disclosure hierarchy. The aggregate value of investments by input level as of June 30, 2024 is included at the end of the Fund's Schedule of Investments.
Investment Transactions and Income. For financial reporting purposes, the Fund's investment holdings and NAV include trades executed through the end of the last business day of the period. The NAV per share for processing shareholder transactions is calculated as of the close of business of the New York Stock Exchange (NYSE), normally 4:00 p.m. Eastern time and includes trades executed through the end of the prior business day. Gains and losses on securities sold are determined on the basis of identified cost. Income and capital gain distributions from Fidelity Central Funds, if any, are recorded on the ex-dividend date. Interest income is accrued as earned and includes coupon interest and amortization of premium and accretion of discount on debt securities as applicable. Debt obligations may be placed on non-accrual status and related interest income may be reduced by ceasing current accruals and writing off interest receivables when the collection of all or a portion of interest has become doubtful based on consistently applied procedures. A debt obligation is removed from non-accrual status when the issuer resumes interest payments or when collectability of interest is reasonably assured.
Class Allocations and Expenses. Investment income, realized and unrealized capital gains and losses, common expenses of a fund, and certain fund-level expense reductions, if any, are allocated daily on a pro-rata basis to each class based on the relative net assets of each class to the total net assets of a fund. Each class differs with respect to transfer agent and distribution and service plan fees incurred, as applicable. Certain expense reductions may also differ by class, if applicable. For the reporting period, the allocated portion of income and expenses to each class as a percent of its average net assets may vary due to the timing of recording these transactions in relation to fluctuating net assets of the classes. Expenses directly attributable to a fund are charged to that fund. Expenses attributable to more than one fund are allocated among the respective funds on the basis of relative net assets or other appropriate methods. Expenses included in the accompanying financial statements reflect the expenses of that fund and do not include any expenses associated with any underlying mutual funds or exchange-traded funds (ETFs). Although not included in a fund's expenses, a fund indirectly bears its proportionate share of these expenses through the net asset value of each underlying mutual fund or exchange-traded fund (ETF). Expense estimates are accrued in the period to which they relate and adjustments are made when actual amounts are known.
Income Tax Information and Distributions to Shareholders. Each year, the Fund intends to qualify as a regulated investment company under Subchapter M of the Internal Revenue Code, including distributing substantially all of its taxable income and realized gains. As a result, no provision for U.S. Federal income taxes is required. The Fund files a U.S. federal tax return, in addition to state and local tax returns as required. The Fund's federal income tax returns are subject to examination by the Internal Revenue Service (IRS) for a period of three fiscal years after they are filed. State and local tax returns may be subject to examination for an additional fiscal year depending on the jurisdiction.
Distributions are declared and recorded on the ex-dividend date. Income and capital gain distributions are declared separately for each class. Income and capital gain distributions are determined in accordance with income tax regulations, which may differ from GAAP.
Capital accounts within the financial statements are adjusted for permanent book-tax differences. These adjustments have no impact on net assets or the results of operations. Capital accounts are not adjusted for temporary book-tax differences which will reverse in a subsequent period.
Book-tax differences are primarily due to futures contracts, swap agreements, capital loss carryforwards and losses deferred due to wash sales and futures transactions.
As of period end, the cost and unrealized appreciation (depreciation) in securities, and derivatives if applicable, for federal income tax purposes were as follows:
| Gross unrealized appreciation | $13,803,283 |
| Gross unrealized depreciation | (417,629,352) |
| Net unrealized appreciation (depreciation) | $(403,826,069) |
| Tax cost | $5,227,445,899 |
Capital loss carryforwards are only available to offset future capital gains of the Fund to the extent provided by regulations and may be limited. The capital loss carryforward information presented below, including any applicable limitation, is estimated as of prior fiscal period end and is subject to adjustment.
Short-term | $(115,059,370) |
Long-term | (109,446,528) |
| Total capital loss carryforward | $(224,505,898) |
Delayed Delivery Transactions and When-Issued Securities. During the period, certain Funds transacted in securities on a delayed delivery or when-issued basis. Payment and delivery may take place after the customary settlement period for that security. The price of the underlying securities and the date when the securities will be delivered and paid for are fixed at the time the transaction is negotiated. Securities purchased on a delayed delivery or when-issued basis are identified as such in the Schedule of Investments. Compensation for interest forgone in the purchase of a delayed delivery or when-issued debt security may be received. With respect to purchase commitments, each applicable Fund identifies securities as segregated in its records with a value at least equal to the amount of the commitment. Payables and receivables associated with the purchases and sales of delayed delivery securities having the same coupon, settlement date and broker are offset. Delayed delivery or when-issued securities that have been purchased from and sold to different brokers are reflected as both payables and receivables in the Statement of Assets and Liabilities under the caption "Delayed delivery", as applicable. Losses may arise due to changes in the value of the underlying securities or if the counterparty does not perform under the contract's terms, or if the issuer does not issue the securities due to political, economic, or other factors.
To-Be-Announced (TBA) Securities and Mortgage Dollar Rolls. TBA securities involve buying or selling mortgage-backed securities (MBS) on a forward commitment basis. A TBA transaction typically does not designate the actual security to be delivered and only includes an approximate principal amount; however delivered securities must meet specified terms defined by industry guidelines, including issuer, rate and current principal amount outstanding on underlying mortgage pools. Funds may enter into a TBA transaction with the intent to take possession of or deliver the underlying MBS, or a fund may elect to extend the settlement by entering into either a mortgage or reverse mortgage dollar roll. Mortgage dollar rolls are transactions where a fund sells TBA securities and simultaneously agrees to repurchase MBS on a later date at a lower price and with the same counterparty. Reverse mortgage dollar rolls involve the purchase and simultaneous agreement to sell TBA securities on a later date at a lower price. Transactions in mortgage dollar rolls and reverse mortgage dollar rolls are accounted for as purchases and sales and may result in an increase to a fund's portfolio turnover rate.
Purchases and sales of TBA securities involve risks similar to those discussed above for delayed delivery and when-issued securities. Also, if the counterparty in a mortgage dollar roll or a reverse mortgage dollar roll transaction files for bankruptcy or becomes insolvent, a fund's right to repurchase or sell securities may be limited. Additionally, when a fund sells TBA securities without already owning or having the right to obtain the deliverable securities (an uncovered forward commitment to sell), it incurs a risk of loss because it could have to purchase the securities at a price that is higher than the price at which it sold them. A fund may be unable to purchase the deliverable securities if the corresponding market is illiquid.
TBA securities subject to a forward commitment to sell at period end are included at the end of the Schedule of Investments under the caption "TBA Sale Commitments." The value of these commitments and proceeds to be received at contractual settlement date are reflected in the Statement of Assets and Liabilities as "TBA sale commitments, at value" and "Receivable for TBA sale commitments," respectively. If the TBA sale commitment is closed through the acquisition of an offsetting TBA purchase commitment, a fund realizes a gain or loss. If a fund delivers securities under the commitment, a fund realizes a gain or loss from the sale of the securities based upon the price established at the date the commitment was entered into.
Restricted Securities (including Private Placements). Funds may invest in securities that are subject to legal or contractual restrictions on resale. These securities generally may be resold in transactions exempt from registration or to the public if the securities are registered. Disposal of these securities may involve time-consuming negotiations and expense, and prompt sale at an acceptable price may be difficult. Information regarding restricted securities held at period end is included at the end of the Schedule of Investments, if applicable.
4. Derivative Instruments.
Risk Exposures and the Use of Derivative Instruments. The Fund's investment objectives allow for various types of derivative instruments, including futures contracts, swaps and options. Derivatives are investments whose value is primarily derived from underlying assets, indices or reference rates and may be transacted on an exchange or over-the-counter (OTC). Derivatives may involve a future commitment to buy or sell a specified asset based on specified terms, to exchange future cash flows at periodic intervals based on a notional principal amount, or for one party to make one or more payments upon the occurrence of specified events in exchange for periodic payments from the other party.
Derivatives were used to increase returns, to gain exposure to certain types of assets and to manage exposure to certain risks as defined below. The success of any strategy involving derivatives depends on analysis of numerous economic factors, and if the strategies for investment do not work as intended, the objectives may not be achieved.
Derivatives were used to increase or decrease exposure to the following risk(s):
| | |
| Credit Risk | Credit risk relates to the ability of the issuer of a financial instrument to make further principal or interest payments on an obligation or commitment that it has to a fund. |
| Interest Rate Risk | Interest rate risk relates to the fluctuations in the value of interest-bearing securities due to changes in the prevailing levels of market interest rates. |
Funds are also exposed to additional risks from investing in derivatives, such as liquidity risk and counterparty credit risk. Liquidity risk is the risk that a fund will be unable to close out the derivative in the open market in a timely manner. Counterparty credit risk is the risk that the counterparty will not be able to fulfill its obligation to a fund. Derivative counterparty credit risk is managed through formal evaluation of the creditworthiness of all potential counterparties. On certain OTC derivatives such as options and bi-lateral swaps, a fund attempts to reduce its exposure to counterparty credit risk by entering into an International Swaps and Derivatives Association, Inc. (ISDA) Master Agreement with each of its counterparties. The ISDA Master Agreement gives a fund the right to terminate all transactions traded under such agreement upon the deterioration in the credit quality of the counterparty beyond specified levels. The ISDA Master Agreement gives each party the right, upon an event of default by the other party or a termination of the agreement, to close out all transactions traded under such agreement and to net amounts owed under each transaction to one net payable by one party to the other. To mitigate counterparty credit risk on bi-lateral OTC derivatives, a fund receives collateral in the form of cash or securities once net unrealized appreciation on outstanding derivative contracts under an ISDA Master Agreement exceeds certain applicable thresholds, subject to certain minimum transfer provisions. The collateral received is held in segregated accounts with the custodian bank in accordance with the collateral agreements entered into between a fund, the counterparty and the custodian bank. A fund could experience delays and costs in gaining access to the collateral even though it is held by the custodian bank. The maximum risk of loss to a fund from counterparty credit risk related to bi-lateral OTC derivatives is generally the aggregate unrealized appreciation and unpaid counterparty payments in excess of any collateral pledged by the counterparty to a fund. For OTC written options with upfront premiums received, a fund is obligated to perform and therefore does not have counterparty risk. For OTC written options with premiums to be received at a future date, the maximum risk of loss from counterparty credit risk is the amount of the premium in excess of any collateral pledged by the counterparty. A fund may be required to pledge collateral for the benefit of the counterparties on bi-lateral OTC derivatives in an amount not less than each counterparty's unrealized appreciation on outstanding derivative contracts, subject to certain minimum transfer provisions, and any such pledged collateral is identified in the Schedule of Investments. Exchange-traded contracts are not covered by the ISDA Master Agreement; however counterparty credit risk related to these contracts may be mitigated by the protection provided by the exchange on which they trade. Counterparty credit risk related to centrally cleared swaps may be mitigated by the protection provided by the clearinghouse.
Investing in derivatives may involve greater risks than investing in the underlying assets directly and, to varying degrees, may involve risk of loss in excess of any initial investment and collateral received and amounts recognized in the Statement of Assets and Liabilities. In addition, there may be the risk that the change in value of the derivative contract does not correspond to the change in value of the underlying instrument.
Net Realized Gain (Loss) and Change in Net Unrealized Appreciation (Depreciation) on Derivatives. The table below, which reflects the impacts of derivatives on the financial performance, summarizes the net realized gain (loss) and change in net unrealized appreciation (depreciation) for derivatives during the period as presented in the Statement of Operations.
| Primary Risk Exposure / Derivative Type | Net Realized Gain (Loss)($) | Change in Net Unrealized Appreciation (Depreciation)($) |
| VIP Investment Grade Bond Portfolio | | |
| Credit Risk | | |
| Swaps | (4,909) | (117,790) |
| Total Credit Risk | (4,909) | (117,790) |
| Interest Rate Risk | | |
| Futures Contracts | (690,800) | 705,913 |
| Purchased Options | (12,697) | (180,194) |
| Written Options | 25,125 | (4,065) |
| Swaps | 1,030,265 | 1,693,702 |
| Total Interest Rate Risk | 351,893 | 2,215,356 |
| Totals | 346,984 | 2,097,566 |
If there are any open positions at period end, a summary of the value of derivatives by primary risk exposure is included at the end of the Schedule of Investments.
Futures Contracts. A futures contract is an agreement between two parties to buy or sell a specified underlying instrument for a fixed price at a specified future date. Futures contracts were used to manage exposure to the bond market and fluctuations in interest rates.
Upon entering into a futures contract, a fund is required to deposit either cash or securities (initial margin) with a clearing broker in an amount equal to a certain percentage of the face value of the contract. Futures contracts are marked-to-market daily and subsequent daily payments are made or received by a fund depending on the daily fluctuations in the value of the futures contracts and are recorded as unrealized appreciation or (depreciation). This receivable and/or payable, if any, is included in daily variation margin on futures contracts in the Statement of Assets and Liabilities. Realized gain or (loss) is recorded upon the expiration or closing of a futures contract. The net realized gain (loss) and change in net unrealized appreciation (depreciation) on futures contracts during the period is presented in the Statement of Operations.
Any open futures contracts at period end are presented in the Schedule of Investments under the caption "Futures Contracts". The notional amount at value reflects each contract's exposure to the underlying instrument or index at period end, and is representative of volume of activity during the period unless an average notional amount is presented. Any securities deposited to meet initial margin requirements are identified in the Schedule of Investments. Any cash deposited to meet initial margin requirements is presented as segregated cash with brokers for derivative instruments in the Statement of Assets and Liabilities.
Options. Options give the purchaser the right, but not the obligation, to buy (call) or sell (put) an underlying security or financial instrument at an agreed exercise or strike price between or on certain dates. Options obligate the seller (writer) to buy (put) or sell (call) an underlying instrument at the exercise or strike price or cash settle an underlying derivative instrument if the holder exercises the option on or before the expiration date. OTC options, such as swaptions, which are options where the underlying instrument is a swap, were used to manage exposure to fluctuations in interest rates.
Upon entering into an options contract, a fund will pay or receive a premium. Premiums paid on purchased options are reflected as cost of investments and premiums received on written options are reflected as a liability on the Statement of Assets and Liabilities. Certain options may be purchased or written with premiums to be paid or received on a future date. Options are valued daily and any unrealized appreciation (depreciation) is reflected in total accumulated earnings (loss) in the Statement of Assets and Liabilities. When an option is exercised, the cost or proceeds of the underlying instrument purchased or sold is adjusted by the amount of the premium. When an option is closed, a gain or loss is realized depending on whether the proceeds or amount paid for the closing sale transaction is greater or less than the premium received or paid. When an option expires, gains and losses are realized to the extent of premiums received and paid, respectively. The net realized and unrealized gains (losses) on purchased options are included in the Statement of Operations in net realized gain (loss) and change in net unrealized appreciation (depreciation) on investment securities. The net realized gain (loss) and change in net unrealized appreciation (depreciation) on written options are presented in the Statement of Operations.
Any open options at period end are presented in the Schedule of Investments under the captions "Purchased Options," "Purchased Swaptions," "Written Options" and "Written Swaptions," as applicable, and are representative of volume of activity during the period unless an average notional amount is presented.
Writing puts and buying calls tend to increase exposure to the underlying instrument while buying puts and writing calls tend to decrease exposure to the underlying instrument. For purchased options, risk of loss is limited to the premium paid, and for written options, risk of loss is the change in value in excess of the premium received.
Swaps. A swap is a contract between two parties to exchange future cash flows at periodic intervals based on a notional principal amount. A bi-lateral OTC swap is a transaction between a fund and a dealer counterparty where cash flows are exchanged between the two parties for the life of the swap. A centrally cleared swap is a transaction executed between a fund and a dealer counterparty, then cleared by a futures commission merchant (FCM) through a clearinghouse. Once cleared, the clearinghouse serves as a central counterparty, with whom a fund exchanges cash flows for the life of the transaction, similar to transactions in futures contracts.
Bi-lateral OTC swaps are marked-to-market daily and changes in value are reflected in the Statement of Assets and Liabilities in the bi-lateral OTC swaps at value line items. Any upfront premiums paid or received upon entering a bi-lateral OTC swap to compensate for differences between stated terms of the swap and prevailing market conditions (e.g. credit spreads, interest rates or other factors) are recorded in total accumulated earnings (loss) in the Statement of Assets and Liabilities and amortized to realized gain or (loss) ratably over the term of the swap. Any unamortized upfront premiums are presented in the Schedule of Investments.
Centrally cleared swaps require a fund to deposit either cash or securities (initial margin) with the FCM, at the instruction of and for the benefit of the clearinghouse. Any securities deposited to meet initial margin requirements are identified in the Schedule of Investments. Any cash deposited to meet initial margin requirements is presented in segregated cash with brokers for derivative instruments in the Statement of Assets and Liabilities. Centrally cleared swaps are marked-to-market daily and subsequent payments (variation margin) are made or received depending on the daily fluctuations in the value of the swaps and are recorded as unrealized appreciation or (depreciation). These daily payments, if any, are included in receivable or payable for daily variation margin on centrally cleared swaps in the Statement of Assets and Liabilities. Any premiums for centrally cleared swaps are recorded periodically throughout the term of the swap to variation margin and included in total accumulated earnings (loss) in the Statement of Assets and Liabilities. Any premiums are recognized as realized gain (loss) upon termination or maturity of the swap.
For both bi-lateral and centrally cleared swaps, payments are exchanged at specified intervals, accrued daily commencing with the effective date of the contract and recorded as realized gain or (loss). Some swaps may be terminated prior to the effective date and realize a gain or loss upon termination. The net realized gain (loss) and change in net unrealized appreciation (depreciation) on swaps during the period is presented in the Statement of Operations.
Any open swaps at period end are included in the Schedule of Investments under the caption "Swaps", and are representative of volume of activity during the period unless an average notional amount is presented.
Credit Default Swaps. Credit default swaps enable a fund to buy or sell protection against specified credit events on a single-name issuer or a traded credit index. Under the terms of a credit default swap the buyer of protection (buyer) receives credit protection in exchange for making periodic payments to the seller of protection (seller) based on a fixed percentage applied to a notional principal amount. In return for these payments, the seller will be required to make a payment upon the occurrence of one or more specified credit events. A fund enters into credit default swaps as a seller to gain credit exposure to an issuer and/or as a buyer to obtain a measure of protection against defaults of an issuer. Periodic payments are made over the life of the contract by the buyer provided that no credit event occurs.
For credit default swaps on most corporate and sovereign issuers, credit events include bankruptcy, failure to pay or repudiation/moratorium. For credit default swaps on corporate or sovereign issuers, the obligation that may be put to the seller is not limited to the specific reference obligation described in the Schedule of Investments. For credit default swaps on asset-backed securities, a credit event may be triggered by events such as failure to pay principal, maturity extension, rating downgrade or write-down. For credit default swaps on asset-backed securities, the reference obligation described represents the security that may be put to the seller. For credit default swaps on a traded credit index, a specified credit event may affect all or individual underlying securities included in the index.
As a seller, if an underlying credit event occurs, a fund will pay a net settlement amount of cash equal to the notional amount of the swap less the recovery value of the reference obligation or underlying securities comprising an index. Only in the event of the industry's inability to value the underlying asset will a fund be required to take delivery of the reference obligation or underlying securities comprising an index and pay an amount equal to the notional amount of the swap.
As a buyer, if an underlying credit event occurs, a fund will receive a net settlement amount of cash equal to the notional amount of the swap less the recovery value of the reference obligation or underlying securities comprising an index. Only in the event of the industry's inability to value the underlying asset will a fund be required to deliver the reference obligation or underlying securities comprising an index in exchange for payment of an amount equal to the notional amount of the swap.
Typically, the value of each credit default swap and credit rating disclosed for each reference obligation in the Schedule of Investments, where a fund is the seller, can be used as measures of the current payment/performance risk of the swap. As the value of the swap changes as a positive or negative percentage of the total notional amount, the payment/performance risk may decrease or increase, respectively. In addition to these measures, the investment adviser monitors a variety of factors including cash flow assumptions, market activity and market sentiment as part of its ongoing process of assessing payment/performance risk.
Interest Rate Swaps. Interest rate swaps are agreements between counterparties to exchange cash flows, one based on a fixed rate, and the other on a floating rate. A fund enters into interest rate swaps to manage its exposure to interest rate changes. Changes in interest rates can have an effect on both the value of bond holdings as well as the amount of interest income earned. In general, the value of bonds can fall when interest rates rise and can rise when interest rates fall.
5. Purchases and Sales of Investments.
Purchases and sales of securities, other than short-term securities, U.S. government securities and in-kind transactions, as applicable, are noted in the table below.
| | Purchases ($) | Sales ($) |
| VIP Investment Grade Bond Portfolio | 2,745,290,335 | 2,777,611,942 |
6. Fees and Other Transactions with Affiliates.
Management Fee. Fidelity Management & Research Company LLC (the investment adviser) and its affiliates provide the Fund with investment management related services for which the Fund pays a monthly management fee.
Effective March 1, 2024, the Fund's management contract was amended to incorporate administrative services previously covered under separate services agreements (Transfer Agent and Accounting agreements). The amended contract incorporates a management fee rate that may vary by class. The investment adviser or an affiliate pays certain expenses of managing and operating the Fund out of each class's management fee. Each class of the Fund pays a management fee to the investment adviser. The management fee is calculated and paid to the investment adviser every month. When determining a class's management fee, a mandate rate is calculated based on the monthly average net assets of a group of funds advised by FMR within a designated asset class. A discount rate is subtracted from the mandate rate once the Fund's monthly average net assets reach a certain level. The mandate rate and discount rate may vary by class. The annual management fee rate for a class of shares of the Fund is the lesser of (1) the class's mandate rate reduced by the class's discount rate (if applicable) or (2) the amount set forth in the following table.
| | Maximum Management Fee Rate % |
| Initial Class | .37 |
| Service Class | .37 |
| Service Class 2 | .37 |
| Investor Class | .41 |
One-twelfth of the management fee rate for a class is applied to the average net assets of the class for the month, giving a dollar amount which is the management fee for the class for that month. A different management fee rate may be applicable to each class of the Fund. The difference between classes is the result of separate arrangements for class-level services and/or waivers of certain expenses. It is not the result of any difference in advisory or custodial fees or other expenses related to the management of the Fund's assets, which do not vary by class. For the portion of the reporting period on or after March 1, 2024, the total annualized management fee rates were as follows:
| | Total Management Fee Rate % |
| Initial Class | .37 |
| Service Class | .37 |
| Service Class 2 | .37 |
| Investor Class | .41 |
Prior to March 1, 2024, the management fee was the sum of an individual fund fee rate that was based on an annual rate of .20% of the Fund's average net assets and an annualized group fee rate that averaged .10% during the period. The group fee rate was based upon the monthly average net assets of a group of registered investment companies with which the investment adviser has management contracts. The group fee rate decreased as assets under management increased and increased as assets under management decreased. For the portion of the reporting period prior to March 1, 2024, the total annualized management fee rate was .30%.
Effective March 1, 2024, the Fund's sub-advisory agreements with FMR Investment Management (UK) Limited, Fidelity Management & Research (Hong Kong) Limited, and Fidelity Management & Research (Japan) Limited were amended to provide that the investment adviser pays each sub-adviser monthly fees equal to 110% of the sub-adviser's costs for providing sub-advisory services.
Distribution and Service Plan Fees. In accordance with Rule 12b-1 of the 1940 Act, the Fund has adopted separate 12b-1 Plans for each Service Class of shares. Each Service Class pays Fidelity Distributors Company LLC (FDC), an affiliate of the investment adviser, a service fee. For the period, the service fee is based on an annual rate of .10% of Service Class' average net assets and .25% of Service Class 2's average net assets.
For the period, total fees, all of which were re-allowed to insurance companies for the distribution of shares and providing shareholder support services, were as follows:
| Service Class | $381,761 |
| Service Class 2 | 2,536,655 |
| | $2,918,416 |
Transfer Agent Fees. Fidelity Investments Institutional Operations Company LLC (FIIOC), an affiliate of the investment adviser, is the Fund's transfer, dividend disbursing, and shareholder servicing agent. Effective March 1, 2024, the Fund's management contract was amended to incorporate transfer agent services and associated fees previously covered under a separate services agreement.
During the period January 1, 2024 through February 29, 2024, the transfer agent fees for each class were a fixed annual rate of class-level average net assets as follows:
| | Amount ($) | % of Class-Level Average Net Assets |
| Initial Class | 63,499 | .0680 |
| Service Class | 84,498 | .0680 |
| Service Class 2 | 224,480 | .0680 |
| Investor Class | 123,175 | .1020 |
| | 495,652 | |
Accounting Fees. Fidelity Service Company, Inc. (FSC), an affiliate of the investment adviser, maintains the Fund's accounting records. Effective March 1, 2024, the Fund's management contract was amended to incorporate accounting services and associated fees previously covered under a separate services agreement.
During the period January 1, 2024 through February 29, 2024, the accounting fees were a fixed annual rate of average net assets as follows:
| | % of Average Net Assets |
| VIP Investment Grade Bond Portfolio | .0285 |
Interfund Trades. Funds may purchase from or sell securities to other Fidelity Funds under procedures adopted by the Board. The procedures have been designed to ensure these interfund trades are executed in accordance with Rule 17a-7 of the 1940 Act. Any interfund trades are included within the respective purchases and sales amounts shown in the Purchases and Sales of Investments note. During the period, there were no interfund trades.
7. Committed Line of Credit.
Certain Funds participate with other funds managed by the investment adviser or an affiliate in a $4.25 billion credit facility (the "line of credit") to be utilized for temporary or emergency purposes to fund shareholder redemptions or for other short-term liquidity purposes. The participating funds have agreed to pay commitment fees on their pro-rata portion of the line of credit, which are reflected in Miscellaneous expenses on the Statement of Operations, and are listed below. During the period, there were no borrowings on this line of credit.
| | Amount ($) |
| VIP Investment Grade Bond Portfolio | 3,735 |
8. Security Lending.
Funds lend portfolio securities from time to time in order to earn additional income. Lending agents are used, including National Financial Services (NFS), an affiliate of the investment adviser. Pursuant to a securities lending agreement, NFS will receive a fee, which is capped at 9.9% of a fund's daily lending revenue, for its services as lending agent. A fund may lend securities to certain qualified borrowers, including NFS. On the settlement date of the loan, a fund receives collateral (in the form of U.S. Treasury obligations, letters of credit and/or cash) against the loaned securities and maintains collateral in an amount not less than 100% of the market value of the loaned securities during the period of the loan. The market value of the loaned securities is determined at the close of business of a fund and any additional required collateral is delivered to a fund on the next business day. A fund or borrower may terminate the loan at any time, and if the borrower defaults on its obligation to return the securities loaned because of insolvency or other reasons, a fund may apply collateral received from the borrower against the obligation. A fund may experience delays and costs in recovering the securities loaned. Any cash collateral received is invested in the Fidelity Securities Lending Cash Central Fund. Any loaned securities are identified as such in the Schedule of Investments, and the value of loaned securities and cash collateral at period end, as applicable, are presented in the Statement of Assets and Liabilities. Security lending income represents the income earned on investing cash collateral, less rebates paid to borrowers and any lending agent fees associated with the loan, plus any premium payments received for lending certain types of securities. Security lending income is presented in the Statement of Operations as a component of income from Fidelity Central Funds. Affiliated security lending activity, if any, was as follows:
| | Total Security Lending Fees Paid to NFS ($) | Security Lending Income From Securities Loaned to NFS ($) | Value of Securities Loaned to NFS at Period End ($) |
| VIP Investment Grade Bond Portfolio | 918 | - | - |
9. Expense Reductions.
Through arrangements with the Fund's custodian, credits realized as a result of certain uninvested cash balances were used to reduce the Fund's expenses. During the period, custodian credits reduced the Fund's expenses by $1,438.
In addition, during the period the investment adviser or an affiliate reimbursed and/or waived a portion of fund-level operating expenses in the amount of $95,179.
10. Distributions to Shareholders.
Distributions to shareholders of each class were as follows:
| | Six months ended June 30, 2024 | Year ended December 31, 2023 |
| VIP Investment Grade Bond Portfolio | | |
| Distributions to shareholders | | |
| Initial Class | $3,282,120 | $14,499,097 |
| Service Class | 4,249,165 | 18,667,844 |
| Service Class 2 | 11,028,299 | 48,369,306 |
| Investor Class | 4,171,409 | 18,462,918 |
Total | $22,730,993 | $99,999,165 |
11. Share Transactions.
Transactions for each class of shares were as follows and may contain in-kind transactions:
| | Shares | Shares | Dollars | Dollars |
| | Six months ended June 30, 2024 | Year ended December 31, 2023 | Six months ended June 30, 2024 | Year ended December 31, 2023 |
| VIP Investment Grade Bond Portfolio | | | | |
| Initial Class | | | | |
| Shares sold | 6,107,044 | 7,882,154 | $67,220,743 | $86,980,935 |
| Reinvestment of distributions | 300,560 | 1,342,509 | 3,282,120 | 14,499,097 |
| Shares redeemed | (5,176,794) | (7,611,227) | (57,011,779) | (83,522,769) |
| Net increase (decrease) | 1,230,810 | 1,613,436 | $13,491,084 | $17,957,263 |
| Service Class | | | | |
| Shares sold | 10,863,813 | 18,583,199 | $117,530,161 | $201,692,921 |
| Reinvestment of distributions | 394,904 | 1,754,497 | 4,249,165 | 18,667,844 |
| Shares redeemed | (7,050,855) | (13,630,347) | (76,511,201) | (147,970,863) |
| Net increase (decrease) | 4,207,862 | 6,707,349 | $45,268,125 | $72,389,902 |
| Service Class 2 | | | | |
| Shares sold | 18,698,121 | 29,566,892 | $198,657,404 | $316,900,413 |
| Reinvestment of distributions | 1,043,358 | 4,624,217 | 11,028,299 | 48,369,306 |
| Shares redeemed | (9,428,666) | (16,273,521) | (100,383,981) | (173,410,540) |
| Net increase (decrease) | 10,312,813 | 17,917,588 | $109,301,722 | $191,859,179 |
| Investor Class | | | | |
| Shares sold | 3,273,421 | 5,031,435 | $35,644,110 | $55,201,298 |
| Reinvestment of distributions | 384,108 | 1,719,080 | 4,171,409 | 18,462,918 |
| Shares redeemed | (3,139,548) | (7,727,669) | (34,343,620) | (84,211,331) |
| Net increase (decrease) | 517,981 | (977,154) | $5,471,899 | $(10,547,115) |
12. Other.
A fund's organizational documents provide former and current trustees and officers with a limited indemnification against liabilities arising in connection with the performance of their duties to the fund. In the normal course of business, a fund may also enter into contracts that provide general indemnifications. A fund's maximum exposure under these arrangements is unknown as this would be dependent on future claims that may be made against a fund. The risk of material loss from such claims is considered remote.
At the end of the period, the investment adviser or its affiliates were owners of record of more than 10% and certain otherwise unaffiliated shareholders were owners of record of more than 10% of the outstanding shares as follows:
| Fund | Affiliated % | Number ofUnaffiliated Shareholders | Unaffiliated Shareholders % |
| VIP Investment Grade Bond Portfolio | 20% | 1 | 42% |
13. Risk and Uncertainties.
Many factors affect a fund's performance. Developments that disrupt global economies and financial markets, such as pandemics, epidemics, outbreaks of infectious diseases, war, terrorism, and environmental disasters, may significantly affect a fund's investment performance. The effects of these developments to a fund will be impacted by the types of securities in which a fund invests, the financial condition, industry, economic sector, and geographic location of an issuer, and a fund's level of investment in the securities of that issuer. Significant concentrations in security types, issuers, industries, sectors, and geographic locations may magnify the factors that affect a fund's performance.
Item 8: Changes in and Disagreements with Accountants for Open-End Management Investment Companies
Note: This is not applicable for any fund included in this document.
Item 9: Proxy Disclosures for Open-End Management Investment Companies
Note: This is not applicable for any fund included in this document.
Item 10: Remuneration Paid to Directors, Officers, and others of Open-End Management Investment Companies
Note: This information is disclosed as part of the financial statements for each Fund as part of Item 7: Financial Statements and Financial Highlights for Open-End Management Investment companies.
Item 11: Statement Regarding Basis for Approval of Investment Advisory Contract
Board Approval of Investment Advisory Contracts
VIP Investment Grade Bond Portfolio
At its January 2024 meeting, the Board of Trustees, including the Independent Trustees (together, the Board), approved an amended and restated management contract with Fidelity Management & Research Company LLC (FMR) (the Management Contract), and amended and restated sub-advisory agreements (the Sub-Advisory Contracts, and together with the Management Contract, the Advisory Contracts) for the fund, including the fund's sub-advisory agreements with FMR Investment Management (UK) Limited (FMR UK), Fidelity Management & Research (Hong Kong) Limited (FMR H.K.), and Fidelity Management & Research (Japan) Limited (FMR Japan). The Advisory Contracts will be effective March 1, 2024. The Board will consider the annual renewal of the fund's Advisory Contracts in September 2024, following its review of additional materials provided by FMR.
Management Contract. The Board approved the Management Contract, which implements a new fee structure combining the management fee, transfer agent fee (TA Fee), and pricing and bookkeeping fee (P&B Fee) of the fund and each class into a single class-level fee based on tiered schedules and subject to a maximum class-level rate (the Unified Fee). In exchange for the Unified Fee, the fund will receive investment advisory, management, administrative, transfer agent, pricing and bookkeeping services under a single agreement - the Management Contract.
In its consideration of the Management Contract over several meetings, the Board received, reviewed and discussed a comprehensive set of analyses regarding the Unified Fee including (i) the legal framework, (ii) design goals for the Unified Fee, (iii) calculation methodology for the Unified Fee and illustrative examples, (iv) annual and cumulative projected impacts under various scenarios, both in the aggregate and at the fund/class level, (v) explanations of schedules, rate levers and maximum rates and (vi) shareholder benefits and projected savings.
The Board considered that the maximum Unified Fee for each class of the fund would be no higher than the sum of (i) the lowest contractual management fee under the fund's existing management contract, which is the individual fund fee, if any, plus the lowest contractual marginal group fee rate and (ii) the TA and P&B Fee rates, which are fixed fee rates since December 1, 2023 (together, the "Unified Fee Cap"). The Board noted that, as a result of this Unified Fee Cap, the Unified Fee would be no greater than the fees previously authorized to be charged for the same services. The Board noted that certain expenses such as third-party expenses, Rule 12b-1 fees, and certain other miscellaneous expenses would be outside the scope of the Unified Fee and the calculation of such fees would not change as a result of the Unified Fee. The Board considered that, under the Management Contract, a different management fee rate will be applicable to each class of the fund. The Board noted that Fidelity has represented that the difference in expenses between classes is based on differences in class-specific expenses and not due to any difference in advisory or third-party custodial fees or other expenses related to the management of the fund's assets.
The Board considered that implementation of the Unified Fee, which includes the Unified Fee Cap, would cause all funds subject to a Unified Fee, including the fund, to experience an immediate reduction on contractual fee rates for services provided under the current management contracts. The Board considered that some funds would not experience lower fees as a result of existing fee caps. The Board further considered that, in addition to the contractual fee savings, the Unified Fee offers funds and their shareholders greater protection from future rate increases for services previously offered under separate agreements that are now covered by the Management Contract because such rate increases would require shareholder, as well as Board, approval.
Sub-Advisory Contracts. In connection with the Unified Fee changes, the Board considered the Sub-Advisory Contracts, which changed the arrangements for fees paid by FMR to the sub-advisers under the agreements. The Board noted that the agreements with FMR UK, FMR H.K., and FMR Japan were amended to provide that FMR will compensate each sub-adviser at a fee equal to 110% of the sub-adviser's costs incurred in providing services under the agreement. The Board considered that, under the Sub-Advisory Contracts, FMR, and not the fund, will continue to pay the sub-advisory fees to each applicable sub-adviser.
The Board considered that the approval of the fund's Advisory Contracts will not result in any changes in the investment process or strategies employed in the management of the fund's assets or the day-to-day management of the fund or the persons primarily responsible for such management. Further, the Board considered that the Management Contract would not change the obligations and services of FMR and its affiliates on behalf of the fund, and, in particular, there would be no change in the nature and level of advisory, management, administration, transfer agent, and pricing and bookkeeping services provided to the fund by FMR and its affiliates.
In connection with its consideration of future renewals of the fund's Advisory Contracts, the Board will consider: (i) the nature, extent and quality of services provided to the funds, including shareholder and administrative services and investment performance; (ii) the competitiveness of the management fee and total expenses for the fund; (iii) the costs of the services and profitability, including the revenues earned and the expenses incurred in conducting the business of developing, marketing, distributing, managing, administering, and servicing the fund and its shareholders, to the extent applicable; and (iv) whether there have been economies of scale in respect of the Fidelity funds, whether the Fidelity funds (including the fund) have appropriately benefited from any such economies of scale, and whether there is the potential for realization of any further economies.
Based on its evaluation of all of the conclusions noted above, and after considering all factors it believed relevant, the Board concluded that the fund's management fee structure is fair and reasonable, and that the fund's Advisory Contracts should be approved.
1.705629.126
VIPIGB-SANN-0824
Fidelity® Variable Insurance Products:
VIP Government Money Market Portfolio
Semi-Annual Report
June 30, 2024
Contents
To view a fund's proxy voting guidelines and proxy voting record for the 12-month period ended June 30, visit http://www.fidelity.com/proxyvotingresults or visit the Securities and Exchange Commission's (SEC) web site at http://www.sec.gov.
You may also call 1-877-208-0098 to request a free copy of the proxy voting guidelines.
Fidelity® Variable Insurance Products are separate account options which are purchased through a variable insurance contract.
Standard & Poor's, S&P and S&P 500 are registered service marks of The McGraw-Hill Companies, Inc. and have been licensed for use by Fidelity Distributors Corporation.
Other third-party marks appearing herein are the property of their respective owners.
All other marks appearing herein are registered or unregistered trademarks or service marks of FMR LLC or an affiliated company. © 2024 FMR LLC. All rights reserved.
This report and the financial statements contained herein are submitted for the general information of the shareholders of the Fund. This report is not authorized for distribution to prospective investors in the Fund unless preceded or accompanied by an effective prospectus.
A fund files its complete schedule of portfolio holdings with the SEC for the first and third quarters of each fiscal year on Form N-PORT. Forms N-PORT are available on the SEC's web site at http://www.sec.gov. A fund's Forms N-PORT may be reviewed and copied at the SEC's Public Reference Room in Washington, DC. Information regarding the operation of the SEC's Public Reference Room may be obtained by calling 1-800-SEC-0330.
For a complete list of a fund's portfolio holdings, view the most recent holdings listing, semiannual report, or annual report on Fidelity's web site at http://www.fidelity.com, http://www.institutional.fidelity.com, or http://www.401k.com, as applicable.
NOT FDIC INSURED •MAY LOSE VALUE •NO BANK GUARANTEE
Neither the Fund nor Fidelity Distributors Corporation is a bank.
Item 7: Financial Statements and Financial Highlights for Open-End Management Investment Companies (Semi-Annual Report)
VIP Government Money Market Portfolio
Schedule of Investments June 30, 2024 (Unaudited)
Showing Percentage of Net Assets
| U.S. Treasury Debt - 26.6% |
| | | Yield (%)(a) | Principal Amount (b) | Value ($) |
| U.S. Treasury Inflation Protected Obligations - 0.9% | | | | |
| U.S. Treasury Notes | | | | |
| 7/15/24 | | 5.33 to 5.33 | 79,230,000 | 79,176,773 |
| | | | | |
| U.S. Treasury Obligations - 25.7% | | | | |
| U.S. Treasury Bills | | | | |
| 7/2/24 to 12/5/24 | | 5.11 to 5.34 | 2,087,600,000 | 2,068,506,902 |
| U.S. Treasury Notes | | | | |
| 7/31/24 to 5/15/25 (c) | | 4.88 to 5.45 | 146,000,000 | 144,331,533 |
TOTAL U.S. TREASURY OBLIGATIONS | | | | 2,212,838,435 |
| TOTAL U.S. TREASURY DEBT (Cost $2,292,015,208) | | | | 2,292,015,208 |
| | | | | |
| U.S. Government Agency Debt - 22.4% |
| | | Yield (%)(a) | Principal Amount (b) | Value ($) |
| Federal Agencies - 22.4% | | | | |
| Fannie Mae | | | | |
| 6/18/26 (c)(d) | | 5.44 | 14,000,000 | 14,000,000 |
| Federal Farm Credit Bank | | | | |
| 5/5/26 (c)(d) | | 0.00 | 3,000,000 | 2,999,736 |
| 7/18/24 to 6/24/26 (c) | | 5.02 to 5.54 | 331,542,000 | 331,551,702 |
| Federal Home Loan Bank | | | | |
| 7/10/24 to 6/26/26 (c) | | 4.79 to 5.53 | 1,586,720,000 | 1,585,285,341 |
| | | | | |
| TOTAL U.S. GOVERNMENT AGENCY DEBT (Cost $1,933,836,779) | | | | 1,933,836,779 |
| | | | | |
| U.S. Government Agency Repurchase Agreement - 17.5% |
| | | Maturity Amount ($) | Value ($) |
| In a joint trading account at 5.33% dated 6/28/24 due 7/1/24 (Collateralized by U.S. Government Obligations) # | | 635,555,041 | 635,273,000 |
| With: | | | |
| ABN AMRO Bank NV at 5.34%, dated 6/28/24 due 7/1/24 (Collateralized by U.S. Government Obligations valued at $13,265,934, 1.38% - 6.00%, 3/31/26 - 2/1/54) | | 13,005,785 | 13,000,000 |
| Bank of America NA at 5.39%, dated 5/6/24 due 9/3/24 (Collateralized by U.S. Government Obligations valued at $5,142,761, 3.50%, 10/1/46) | | 5,089,833 | 5,000,000 |
| BMO Capital Markets Corp. at 5.34%, dated 6/25/24 due 7/2/24 (Collateralized by U.S. Government Obligations valued at $2,061,850, 1.90% - 6.43%, 10/25/31 - 2/20/54) | | 2,002,077 | 2,000,000 |
| BMO Harris Bank NA at 5.34%, dated: | | | |
6/3/24 due 7/5/24 ((Collateralized by U.S. Government Obligations valued at $6,145,419, 4.00% - 5.00%, 5/20/41 - 7/20/51) | | 6,056,070 | 6,000,000 |
6/13/24 due 7/5/24 (Collateralized by U.S. Government Obligations valued at $4,090,894, 3.50% - 4.00%, 11/20/41 - 9/20/46) | | 4,020,173 | 4,000,000 |
6/20/24 due 7/5/24 (Collateralized by U.S. Government Obligations valued at $9,285,126, 6.33%, 12/20/52) | | 9,042,720 | 9,000,000 |
6/25/24 due 7/2/24 (Collateralized by U.S. Government Obligations valued at $9,278,251, 6.33%, 12/20/52) | | 9,009,345 | 9,000,000 |
| BNP Paribas, SA at 5.35%, dated: | | | |
6/25/24 due 7/2/24 (Collateralized by U.S. Government Obligations valued at $21,478,474, 0.00% - 6.50%, 4/30/25 - 5/1/54) | | 21,021,846 | 21,000,000 |
6/26/24 due 7/3/24 (Collateralized by U.S. Government Obligations valued at $9,221,259, 0.00% - 7.50%, 4/30/25 - 6/1/54) | | 9,009,363 | 9,000,000 |
| BNY Mellon Capital Markets Corp. at 5.35%, dated 6/13/24 due 8/1/24 (Collateralized by U.S. Government Obligations valued at $15,340,945, 0.00% - 7.00%, 7/18/24 - 6/1/54) | | 15,109,229 | 15,000,000 |
| BofA Securities, Inc. at: | | | |
5.35%, dated 4/2/24 due 7/2/24 (Collateralized by U.S. Government Obligations valued at $38,244,774, 2.50% - 4.50%, 12/1/36 - 7/1/52) | | 37,500,374 | 37,000,000 |
5.39%, dated: | | | |
| 4/18/24 due 7/18/24 (Collateralized by U.S. Government Obligations valued at $16,500,070, 3.50% - 6.00%, 9/20/43 - 7/1/54) (c)(d)(e) | | 16,217,996 | 16,000,000 |
| 4/25/24 due 7/25/24 (Collateralized by U.S. Government Obligations valued at $5,150,961, 4.50%, 11/1/52) (c)(d)(e) | | 5,068,124 | 5,000,000 |
| 4/26/24 due 7/26/24 (Collateralized by U.S. Government Obligations valued at $5,150,202, 3.50% - 6.50%, 12/15/25 - 6/1/54) (c)(d)(e) | | 5,068,124 | 5,000,000 |
| 4/30/24 due 7/30/24 (Collateralized by U.S. Government Obligations valued at $21,618,082, 0.00% - 6.00%, 6/1/26 - 11/1/52) (c)(d)(e) | | 21,286,119 | 21,000,000 |
| 5/2/24 due 8/2/24 (Collateralized by U.S. Government Obligations valued at $13,378,660, 2.00% - 7.00%, 3/1/32 - 4/20/54) (c)(d)(e) | | 13,179,068 | 13,000,000 |
5.4%, dated: | | | |
| 6/4/24 due 9/4/24 (Collateralized by U.S. Government Obligations valued at $3,072,360, 1.50% - 7.32%, 9/1/27 - 4/1/53) (c)(d)(e) | | 3,041,400 | 3,000,000 |
| 6/6/24 due 9/6/24 (Collateralized by U.S. Government Obligations valued at $11,261,951, 1.50% - 6.00%, 9/15/25 - 6/20/64) (c)(d)(e) | | 11,151,800 | 11,000,000 |
| CIBC Bank U.S.A. at: | | | |
5.34%, dated: | | | |
| 6/13/24 due 7/5/24 (Collateralized by U.S. Government Obligations valued at $12,272,781, 2.00% - 6.50%, 2/28/26 - 4/1/54) | | 12,056,960 | 12,000,000 |
| 6/20/24 due 7/5/24 (Collateralized by U.S. Government Obligations valued at $7,151,641, 2.00% - 7.00%, 4/30/31 - 6/1/54) | | 7,033,196 | 7,000,000 |
5.38%, dated 6/20/24 due 7/22/24 (Collateralized by U.S. Government Obligations valued at $1,021,677, 2.00% - 7.00%, 10/1/29 - 5/1/54) | | 1,004,782 | 1,000,000 |
| Citibank NA at 5.35%, dated 6/27/24 due 7/3/24 (Collateralized by U.S. Government Obligations valued at $13,267,883, 0.00% - 7.13%, 1/15/25 - 12/15/65) | | 13,011,592 | 13,000,000 |
| Citigroup Global Capital Markets, Inc. at: | | | |
5.34%, dated 6/5/24 due 7/5/24 (Collateralized by U.S. Government Obligations valued at $12,287,281, 4.88% - 7.00%, 10/31/28 - 4/20/53) | | 12,058,740 | 12,000,000 |
5.35%, dated 6/27/24 due 7/3/24 (Collateralized by U.S. Government Obligations valued at $19,391,551, 3.00% - 4.88%, 10/31/28 - 5/20/52) | | 19,016,942 | 19,000,000 |
5.38%, dated: | | | |
| 6/4/24 due 8/5/24 (Collateralized by U.S. Government Obligations valued at $27,651,183, 4.88% - 7.50%, 10/31/28 - 4/20/53) | | 27,250,170 | 27,000,000 |
| 6/11/24 due 8/12/24 (Collateralized by U.S. Government Obligations valued at $21,484,108, 4.88% - 7.50%, 10/31/28 - 4/20/53) | | 21,194,577 | 21,000,000 |
| 6/21/24 due 8/22/24 (Collateralized by U.S. Treasury Obligations valued at $30,645,750, 4.25%, 3/15/27) | | 30,277,967 | 30,000,000 |
| Ficc Mississippi Gc Repo (GOV) at 5.33%, dated 6/28/24 due 7/1/24 (Collateralized by U.S. Government Obligations valued at $9,184,078, 2.00% - 6.00%, 9/1/26 - 10/1/39) | | 9,003,998 | 9,000,000 |
| FICC State Street GC (Gov. Repo) at 5.35%, dated 6/28/24 due 7/1/24 (Collateralized by U.S. Government Obligations valued at $26,735,824, 2.00% - 7.00%, 11/1/33 - 6/1/54) | | 26,011,592 | 26,000,000 |
| Goldman Sachs & Co. at: | | | |
5.33%, dated: | | | |
| 6/24/24 due 7/1/24 (Collateralized by U.S. Government Obligations valued at $43,905,457, 2.00% - 7.50%, 7/1/29 - 12/1/53) | | 43,044,565 | 43,000,000 |
| 6/27/24 due 7/3/24 (Collateralized by U.S. Government Obligations valued at $65,318,661, 2.00% - 6.50%, 9/1/27 - 10/1/53) | | 64,056,853 | 64,000,000 |
| 6/28/24 due 7/5/24 (Collateralized by U.S. Government Obligations valued at $52,043,106, 3.50% - 6.50%, 8/1/38 - 3/20/54) | | 51,052,856 | 51,000,000 |
5.34%, dated 6/25/24 due 7/2/24 (Collateralized by U.S. Government Obligations valued at $61,254,469, 2.00% - 6.50%, 9/15/25 - 12/15/63) | | 60,062,300 | 60,000,000 |
| ING Financial Markets LLC at 5.37%, dated: | | | |
6/13/24 due 8/1/24 (Collateralized by U.S. Government Obligations valued at $19,432,036, 3.50% - 4.50%, 12/20/51 - 7/20/52) | | 19,138,874 | 19,000,000 |
6/14/24 due 8/2/24 (Collateralized by U.S. Government Obligations valued at $8,180,693, 4.50%, 7/20/52) | | 8,058,473 | 8,000,000 |
6/17/24 due 8/5/24 (Collateralized by U.S. Government Obligations valued at $5,110,651, 4.50%, 7/20/52) | | 5,036,546 | 5,000,000 |
| Mitsubishi UFJ Securities (U.S.A.), Inc. at 5.38%, dated 6/13/24 due 9/4/24 (Collateralized by U.S. Government Obligations valued at $35,796,034, 2.50% - 5.00%, 12/1/25 - 5/1/53) | | 35,434,136 | 35,000,000 |
| MUFG Securities (Canada), Ltd. at 5.38%, dated 6/13/24 due 9/4/24 (Collateralized by U.S. Government Obligations valued at $8,182,042, 0.13% - 6.50%, 8/26/24 - 6/1/54) | | 8,099,231 | 8,000,000 |
| RBC Dominion Securities at 5.35%, dated 6/25/24 due 7/2/24 (Collateralized by U.S. Treasury Obligations valued at $9,212,842, 0.00% - 7.00%, 2/28/26 - 5/20/54) | | 9,009,363 | 9,000,000 |
| RBC Financial Group at 5.34%, dated: | | | |
5/31/24 due 7/5/24 (Collateralized by U.S. Government Obligations valued at $41,017,424, 0.00% - 6.63%, 7/2/24 - 7/25/54) | | 40,361,933 | 40,000,000 |
6/13/24 due 7/5/24 (Collateralized by U.S. Government Obligations valued at $42,171,451, 0.88% - 7.50%, 6/30/25 - 6/1/54) | | 41,291,920 | 41,000,000 |
| SMBC Nikko Securities America, Inc. at 5.33%, dated 6/28/24 due 7/1/24 (Collateralized by U.S. Government Obligations valued at $9,184,083, 2.50% - 6.50%, 8/15/27 - 7/1/54) | | 9,003,998 | 9,000,000 |
| TD Securities (U.S.A.) at 5.33%, dated 6/28/24 due 7/1/24 (Collateralized by U.S. Government Obligations valued at $17,347,702, 5.50%, 4/20/53) | | 17,007,551 | 17,000,000 |
| Wells Fargo Securities, LLC at: | | | |
5.38%, dated 5/21/24 due 8/19/24 (Collateralized by U.S. Government Obligations valued at $21,551,245, 3.00% - 5.00%, 4/1/38 - 6/1/57) | | 21,282,450 | 21,000,000 |
5.39%, dated: | | | |
| 5/28/24 due 8/26/24 (Collateralized by U.S. Government Obligations valued at $11,277,116, 6.50%, 6/1/54) | | 11,148,225 | 11,000,000 |
| 6/11/24 due 9/19/24 (Collateralized by U.S. Government Obligations valued at $11,253,598, 5.00%, 5/1/39) | | 11,164,694 | 11,000,000 |
| 6/12/24 due 9/19/24 (Collateralized by U.S. Government Obligations valued at $11,251,918, 5.00% - 6.50%, 11/1/52 - 9/1/53) | | 11,163,048 | 11,000,000 |
| 6/13/24 due 9/19/24 (Collateralized by U.S. Government Obligations valued at $11,250,238, 5.50%, 6/1/54) | | 11,161,401 | 11,000,000 |
| 6/21/24 due 9/19/24 (Collateralized by U.S. Government Obligations valued at $17,365,962, 2.50% - 6.50%, 8/1/38 - 5/1/54) | | 17,229,075 | 17,000,000 |
| TOTAL U.S. GOVERNMENT AGENCY REPURCHASE AGREEMENT (Cost $1,507,273,000) | | | 1,507,273,000 |
| | | | |
| U.S. Treasury Repurchase Agreement - 33.3% |
| | | Maturity Amount ($) | Value ($) |
| With: | | | |
| ABN AMRO Bank NV at 5.32%, dated 6/28/24 due 7/1/24 (Collateralized by U.S. Treasury Obligations valued at $12,235,296, 0.38% - 4.50%, 8/15/25 - 5/31/29) | | 12,005,320 | 12,000,000 |
| Barclays Bank PLC at: | | | |
5.32%, dated 6/28/24 due 7/1/24 (Collateralized by U.S. Treasury Obligations valued at $19,388,625, 4.75%, 11/15/43) | | 19,008,423 | 19,000,000 |
5.33%, dated 6/13/24 due 7/5/24 (Collateralized by U.S. Treasury Obligations valued at $26,590,693, 4.75%, 11/15/43) | | 26,188,623 | 26,000,000 |
| BMO Capital Markets Corp. at 5.33%, dated 6/27/24 due 7/3/24 (Collateralized by U.S. Treasury Obligations valued at $4,082,766, 0.00% - 5.00%, 8/27/24 - 11/15/53) | | 4,003,553 | 4,000,000 |
| BMO Harris Bank NA at 5.33%, dated 6/13/24 due 7/5/24 (Collateralized by U.S. Treasury Obligations valued at $4,090,934, 2.88%, 5/15/32) | | 4,020,136 | 4,000,000 |
| BNP Paribas, SA at: | | | |
5.33%, dated 6/24/24 due 7/1/24 (Collateralized by U.S. Treasury Obligations valued at $27,568,561, 1.88% - 5.47%, 7/31/24 - 11/15/49) | | 27,027,983 | 27,000,000 |
5.34%, dated: | | | |
| 6/25/24 due 7/2/24 (Collateralized by U.S. Treasury Obligations valued at $55,150,030, 0.63% - 5.47%, 7/31/24 - 2/15/53) | | 54,056,070 | 54,000,000 |
| 6/28/24 due 7/5/24 (Collateralized by U.S. Treasury Obligations valued at $23,470,455, 0.75% - 4.75%, 4/30/26 - 5/15/50) | | 23,023,882 | 23,000,000 |
5.37%, dated: | | | |
| 6/14/24 due 7/5/24 (Collateralized by U.S. Treasury Obligations valued at $124,900,540, 0.00% - 7.50%, 7/11/24 - 5/15/54) (c)(d)(e) | | 123,710,644 | 122,000,000 |
| 6/17/24 due 7/5/24 (Collateralized by U.S. Treasury Obligations valued at $19,420,581, 0.50% - 7.63%, 7/31/24 - 5/15/53) (c)(d)(e) | | 19,260,743 | 19,000,000 |
5.39%, dated 5/3/24 due 9/3/24 (Collateralized by U.S. Treasury Obligations valued at $5,144,885, 1.88% - 5.48%, 7/31/24 - 2/15/49) (c)(d)(e) | | 5,092,079 | 5,000,000 |
| BofA Securities, Inc. at: | | | |
5.32%, dated 4/1/24 due 7/1/24 (Collateralized by U.S. Treasury Obligations valued at $3,101,162, 0.88% - 1.13%, 6/30/26 - 2/29/28) | | 3,040,343 | 3,000,000 |
5.33%, dated 4/2/24 due 7/2/24 (Collateralized by U.S. Treasury Obligations valued at $6,201,557, 2.50% - 6.38%, 1/31/25 - 10/31/28) | | 6,080,838 | 6,000,000 |
5.37%, dated 4/25/24 due 7/25/24 (Collateralized by U.S. Treasury Obligations valued at $9,271,415, 4.38%, 12/15/26) (c)(d)(e) | | 9,122,168 | 9,000,000 |
| CIBC Bank U.S.A. at: | | | |
5.32%, dated: | | | |
| 6/3/24 due 7/3/24 (Collateralized by U.S. Treasury Obligations valued at $7,171,157, 0.38% - 5.00%, 7/31/24 - 8/15/53) | | 7,031,033 | 7,000,000 |
| 6/28/24 due 7/1/24 (Collateralized by U.S. Treasury Obligations valued at $2,040,995, 1.25% - 4.13%, 2/28/25 - 8/15/53) | | 2,000,887 | 2,000,000 |
5.33%, dated: | | | |
| 6/6/24 due 7/5/24 (Collateralized by U.S. Treasury Obligations valued at $5,119,247, 1.13% - 4.38%, 11/15/27 - 8/15/53) | | 5,023,689 | 5,000,000 |
| 6/13/24 due 7/5/24 (Collateralized by U.S. Treasury Obligations valued at $6,136,314, 1.13% - 4.38%, 12/15/26 - 8/15/33) | | 6,043,528 | 6,000,000 |
| Credit AG at 5.32%, dated 6/14/24 due 7/5/24 (Collateralized by U.S. Treasury Obligations valued at $7,157,960, 4.25%, 12/31/25) | | 7,032,068 | 7,000,000 |
| Federal Reserve Bank of New York at 5.3%, dated 6/28/24 due 7/1/24 (Collateralized by U.S. Treasury Obligations valued at $1,297,572,910, 1.63% - 2.75%, 5/15/25 - 5/15/31) | | 1,297,572,842 | 1,297,000,000 |
| FICC ACAFB Repo Program at 5.33%, dated 6/28/24 due 7/1/24 (Collateralized by U.S. Treasury Obligations valued at $74,663,942, 4.63%, 6/15/27) | | 73,032,424 | 73,000,000 |
| Ficc Citi Gc Repo (GOV) at 5.33%, dated 6/28/24 due 7/1/24 (Collateralized by U.S. Treasury Obligations valued at $8,163,642, 0.00% - 6.75%, 7/2/24 - 11/15/49) | | 8,003,553 | 8,000,000 |
| Ficc Nomura Gc Repo (GOV) at 5.33%, dated 6/28/24 due 7/1/24 (Collateralized by U.S. Treasury Obligations valued at $70,411,340, 0.00% - 4.38%, 7/31/24 - 12/15/26) | | 69,030,648 | 69,000,000 |
| Fixed Income Clearing Corp. - BNP at 5.32%, dated 6/28/24 due 7/1/24 (Collateralized by U.S. Treasury Obligations valued at $82,656,628, 0.50% - 5.55%, 7/31/24 - 5/15/54) | | 81,035,910 | 81,000,000 |
| Fixed Income Clearing Corp. - BNYM at 5.32%, dated 6/28/24 due 7/1/24 (Collateralized by U.S. Treasury Obligations valued at $292,740,056, 1.13% - 4.38%, 1/15/26 - 8/15/33) | | 287,127,237 | 287,000,000 |
| Fixed Income Clearing Corp. - SSB at: | | | |
5.32%, dated 6/28/24 due 7/1/24 (Collateralized by U.S. Treasury Obligations valued at $212,184,822, 4.63%, 6/15/27) | | 208,092,213 | 208,000,000 |
5.35%, dated 6/28/24 due 7/1/24 (Collateralized by U.S. Treasury Obligations valued at $39,799,002, 3.88%, 8/15/33) | | 39,017,388 | 39,000,000 |
| Goldman Sachs & Co. at 5.32%, dated 6/28/24 due 7/1/24 (Collateralized by U.S. Treasury Obligations valued at $13,265,887, 2.25%, 2/15/27) | | 13,005,763 | 13,000,000 |
| HSBC Securities, Inc. at 5.35%, dated 6/25/24 due 7/2/24 (Collateralized by U.S. Treasury Obligations valued at $15,313,651, 0.00% - 2.50%, 7/25/24 - 3/31/27) | | 15,015,604 | 15,000,000 |
| ING Financial Markets LLC at: | | | |
5.33%, dated 6/28/24 due 7/5/24 (Collateralized by U.S. Treasury Obligations valued at $2,060,728, 0.00% - 4.50%, 10/3/24 - 8/15/51) | | 2,002,073 | 2,000,000 |
5.35%, dated: | | | |
| 6/25/24 due 7/2/24 (Collateralized by U.S. Treasury Obligations valued at $3,062,735, 0.00% - 5.25%, 10/3/24 - 11/15/49) | | 3,003,121 | 3,000,000 |
| 6/27/24 due 7/3/24 (Collateralized by U.S. Treasury Obligations valued at $1,020,612, 0.00% - 4.50%, 9/12/24 - 11/15/52) | | 1,000,892 | 1,000,000 |
| J.P. Morgan Securities, LLC at 5.36%, dated 6/28/24 due 7/5/24 (Collateralized by U.S. Treasury Obligations valued at $135,720,613, 0.88% - 4.63%, 10/31/24 - 11/15/30) (c)(d)(e) | | 133,613,869 | 133,000,000 |
| Lloyds Bank Corp. Markets PLC at 5.34%, dated 6/25/24 due 7/2/24 (Collateralized by U.S. Treasury Obligations valued at $10,210,367, 3.88% - 4.63%, 9/15/26 - 12/31/27) | | 10,010,383 | 10,000,000 |
| Lloyds Bank PLC at 5.39%, dated: | | | |
5/20/24 due 8/20/24 (Collateralized by U.S. Treasury Obligations valued at $3,110,849, 2.25% - 4.13%, 2/15/27 - 7/31/28) | | 3,041,323 | 3,000,000 |
5/28/24 due 8/28/24 (Collateralized by U.S. Treasury Obligations valued at $6,160,745, 3.50%, 2/15/33) | | 6,082,647 | 6,000,000 |
6/20/24 due 9/20/24 (Collateralized by U.S. Treasury Obligations valued at $7,151,684, 2.25% - 3.25%, 2/15/27 - 6/30/27) | | 7,096,421 | 7,000,000 |
| Mitsubishi UFJ Securities (U.S.A.), Inc. at 5.36%, dated 6/13/24 due 9/4/24 (Collateralized by U.S. Treasury Obligations valued at $7,159,158, 4.50%, 5/31/29) | | 7,086,504 | 7,000,000 |
| Mizuho Bank, Ltd. at 5.32%, dated 6/28/24 due 7/1/24 (Collateralized by U.S. Treasury Obligations valued at $19,467,851, 1.63%, 5/15/31) | | 19,008,423 | 19,000,000 |
| MUFG Securities (Canada), Ltd. at: | | | |
5.34%, dated 6/13/24 due 7/5/24 (Collateralized by U.S. Treasury Obligations valued at $4,091,066, 0.50% - 4.63%, 9/30/25 - 11/15/52) | | 4,029,073 | 4,000,000 |
5.36%, dated 6/13/24 due 9/4/24 (Collateralized by U.S. Treasury Obligations valued at $7,168,670, 1.38% - 4.75%, 2/28/26 - 8/15/52) | | 7,086,504 | 7,000,000 |
| MUFG Securities EMEA PLC at: | | | |
5.32%, dated 6/13/24 due 7/5/24 (Collateralized by U.S. Treasury Obligations valued at $22,483,845, 3.00% - 4.63%, 7/31/24 - 9/30/28) | | 22,071,524 | 22,000,000 |
5.33%, dated: | | | |
| 6/13/24 due 7/5/24 (Collateralized by U.S. Treasury Obligations valued at $22,483,683, 2.38% - 4.63%, 9/30/28 - 2/15/42) | | 22,091,202 | 22,000,000 |
| 6/28/24 due 7/1/24 (Collateralized by U.S. Treasury Obligations valued at $7,144,819, 0.00% - 4.63%, 8/29/24 - 11/15/44) | | 7,003,109 | 7,000,000 |
| Natixis SA at: | | | |
5.32%, dated 6/28/24 due 7/1/24 (Collateralized by U.S. Treasury Obligations valued at $8,163,776, 0.38% - 4.63%, 2/15/25 - 11/15/50) | | 8,003,547 | 8,000,000 |
5.34%, dated 6/10/24 due 7/5/24 (Collateralized by U.S. Treasury Obligations valued at $19,440,392, 0.63% - 5.00%, 10/31/24 - 5/15/53) | | 19,140,917 | 19,000,000 |
| NatWest Markets Securities, Inc. at: | | | |
5.32%, dated 6/28/24 due 7/1/24 (Collateralized by U.S. Treasury Obligations valued at $4,081,881, 7.50%, 11/15/24) | | 4,001,773 | 4,000,000 |
5.35%, dated 6/25/24 due 7/2/24 (Collateralized by U.S. Treasury Obligations valued at $13,306,520, 1.13% - 6.00%, 2/15/26 - 2/15/53) | | 13,013,524 | 13,000,000 |
| Norinchukin Bank at: | | | |
5.34%, dated 6/28/24 due 7/1/24 (Collateralized by U.S. Treasury Obligations valued at $2,040,319, 1.25%, 5/15/31 - 8/15/31) | | 2,000,890 | 2,000,000 |
5.35%, dated 6/25/24 due 7/2/24 (Collateralized by U.S. Treasury Obligations valued at $7,143,192, 3.38%, 5/15/33) | | 7,007,282 | 7,000,000 |
| RBC Dominion Securities at 5.33%, dated 6/13/24 due 7/5/24 (Collateralized by U.S. Treasury Obligations valued at $29,661,438, 0.00% - 5.00%, 8/1/24 - 5/15/54) | | 29,210,387 | 29,000,000 |
| SMBC Nikko Securities America, Inc. at 5.32%, dated 6/28/24 due 7/1/24 (Collateralized by U.S. Treasury Obligations valued at $55,105,492, 0.00% - 6.38%, 10/3/24 - 2/15/47) | | 54,023,940 | 54,000,000 |
| Societe Generale at: | | | |
5.33%, dated 6/24/24 due 7/1/24 (Collateralized by U.S. Treasury Obligations valued at $4,084,252, 2.25%, 5/15/41) | | 4,004,146 | 4,000,000 |
5.35%, dated 6/27/24 due 7/3/24 (Collateralized by U.S. Treasury Obligations valued at $19,514,832, 1.38% - 3.75%, 5/31/30 - 8/15/50) | | 19,016,942 | 19,000,000 |
| TD Securities (U.S.A.) at 5.32%, dated 6/28/24 due 7/1/24 (Collateralized by U.S. Treasury Obligations valued at $11,225,011, 4.13%, 6/15/26 - 11/15/32) | | 11,004,877 | 11,000,000 |
| TOTAL U.S. TREASURY REPURCHASE AGREEMENT (Cost $2,873,000,000) | | | 2,873,000,000 |
| | | | |
| TOTAL INVESTMENT IN SECURITIES - 99.8% (Cost $8,606,124,987) | 8,606,124,987 |
NET OTHER ASSETS (LIABILITIES) - 0.2% | 20,035,583 |
| NET ASSETS - 100.0% | 8,626,160,570 |
| | |
The date shown for securities represents the date when principal payments must be paid, taking into account any call options exercised by the issuer and any permissible maturity shortening features other than interest rate resets.
Legend
| (a) | Yield represents either the annualized yield at the date of purchase, or the stated coupon rate, or, for floating and adjustable rate securities, the rate at period end. |
| (b) | Amount is stated in United States dollars unless otherwise noted. |
| (c) | Coupon rates for floating and adjustable rate securities reflect the rates in effect at period end. |
| (d) | Coupon is indexed to a floating interest rate which may be multiplied by a specified factor and/or subject to caps or floors. |
| (e) | The maturity amount is based on the rate at period end. |
Investment Valuation
All investments are categorized as Level 2 under the Fair Value Hierarchy. The inputs or methodology used for valuing securities may not be an indication of the risk associated with investing in these securities. For more information on valuation inputs, refer to the Investment Valuation section in the accompanying Notes to Financial Statements.
| Other Information |
| # Additional information on each counterparty to the repurchase agreement is as follows: |
| Repurchase Agreement / Counterparty | Value ($) | |
| $635,273,000 due 7/01/24 at 5.33% | | |
| BNY Mellon Capital Markets LLC | 10,641,000 | |
| Bank of America, N.A. | 30,799,000 | |
| Bank of Nova Scotia | 9,082,000 | |
| BofA Securities, Inc. | 540,000 | |
| Citigroup Global Markets, Inc. | 42,578,000 | |
| Credit Agricole CIB New York Branch | 13,445,000 | |
| HSBC Securities (USA), Inc. | 15,203,000 | |
| ING Financial Markets LLC | 8,988,000 | |
| JP Morgan Securities LLC | 118,385,000 | |
| Mitsubishi UFJ Securities Holdings Ltd | 23,955,000 | |
| Mizuho Securities USA, Inc. | 31,095,000 | |
| Nomura Securities International | 10,832,000 | |
| RBC Dominion Securities, Inc. | 76,207,000 | |
| Royal Bank of Canada | 6,708,000 | |
| Societe Generale | 11,583,000 | |
| Sumitomo Mitsui Banking Corp. | 147,151,000 | |
| Sumitomo Mitsui Banking Corp. NY | 27,758,000 | |
| Wells Fargo Bank National Asso | 7,714,000 | |
| Wells Fargo Securities LLC | 42,609,000 | |
| | 635,273,000 | |
Financial Statements (Unaudited)
| Statement of Assets and Liabilities |
| | | | June 30, 2024 (Unaudited) |
| | | | | |
| Assets | | | | |
Investment in securities, at value (including repurchase agreements of $4,380,273,000) - See accompanying schedule Unaffiliated issuers (cost $8,606,124,987): | | | $ | 8,606,124,987 |
| Cash | | | | 40,959,636 |
| Receivable for fund shares sold | | | | 68,660,397 |
| Interest receivable | | | | 19,389,866 |
Total assets | | | | 8,735,134,886 |
| Liabilities | | | | |
| Payable for investments purchased | $ | 89,481,247 | | |
| Payable for fund shares redeemed | | 14,849,101 | | |
| Distributions payable | | 2,385,932 | | |
| Accrued management fee | | 1,920,472 | | |
| Distribution and service plan fees payable | | 266,703 | | |
| Other payables and accrued expenses | | 70,861 | | |
| Total liabilities | | | | 108,974,316 |
| Net Assets | | | $ | 8,626,160,570 |
| Net Assets consist of: | | | | |
| Paid in capital | | | $ | 8,625,872,095 |
| Total accumulated earnings (loss) | | | | 288,475 |
| Net Assets | | | $ | 8,626,160,570 |
| | | | | |
| Net Asset Value and Maximum Offering Price | | | | |
| Initial Class : | | | | |
Net Asset Value, offering price and redemption price per share ($2,594,330,158 ÷ 2,594,528,681 shares) | | | $ | 1.00 |
| Service Class : | | | | |
Net Asset Value, offering price and redemption price per share ($2,466,934,940 ÷ 2,467,017,106 shares) | | | $ | 1.00 |
| Service Class 2 : | | | | |
Net Asset Value, offering price and redemption price per share ($377,072,439 ÷ 377,055,675 shares) | | | $ | 1.00 |
| Investor Class : | | | | |
Net Asset Value, offering price and redemption price per share ($3,187,823,033 ÷ 3,187,082,190 shares) | | | $ | 1.00 |
| Statement of Operations |
| | | | Six months ended June 30, 2024 (Unaudited) |
| Investment Income | | | | |
| Interest | | | $ | 217,764,127 |
| Expenses | | | | |
| Management fee | $ | 10,391,264 | | |
| Transfer agent fees | | 1,046,436 | | |
| Distribution and service plan fees | | 1,479,649 | | |
| Accounting fees and expenses | | 113,049 | | |
| Custodian fees and expenses | | 38,561 | | |
| Independent trustees' fees and expenses | | 10,942 | | |
| Registration fees | | 102,280 | | |
| Audit | | 25,241 | | |
| Legal | | 5,892 | | |
| Miscellaneous | | 11,386 | | |
| Total expenses before reductions | | 13,224,700 | | |
| Expense reductions | | (197,615) | | |
| Total expenses after reductions | | | | 13,027,085 |
| Net Investment income (loss) | | | | 204,737,042 |
| Realized and Unrealized Gain (Loss) | | | | |
| Net realized gain (loss) on: | | | | |
| Investment Securities: | | | | |
| Unaffiliated issuers | | 13,115 | | |
| Total net realized gain (loss) | | | | 13,115 |
| Net increase in net assets resulting from operations | | | $ | 204,750,157 |
| Statement of Changes in Net Assets |
| |
| | Six months ended June 30, 2024 (Unaudited) | | Year ended December 31, 2023 |
| Increase (Decrease) in Net Assets | | | | |
| Operations | | | | |
| Net investment income (loss) | $ | 204,737,042 | $ | 342,328,322 |
| Net realized gain (loss) | | 13,115 | | (28,379) |
Net increase in net assets resulting from operations | | 204,750,157 | | 342,299,943 |
| Distributions to shareholders | | (204,743,252) | | (342,294,738) |
| | | | | |
| Share transactions - net increase (decrease) | | 405,962,985 | | 1,383,362,442 |
| Total increase (decrease) in net assets | | 405,969,890 | | 1,383,367,647 |
| | | | | |
| Net Assets | | | | |
| Beginning of period | | 8,220,190,680 | | 6,836,823,033 |
| End of period | $ | 8,626,160,570 | $ | 8,220,190,680 |
| | | | | |
| | | | | |
Financial Highlights
VIP Government Money Market Portfolio Initial Class |
| |
| | Six months ended (Unaudited) June 30, 2024 | | Years ended December 31, 2023 | | 2022 | | 2021 | | 2020 | | 2019 |
Selected Per-Share Data | | | | | | | | | | | | |
| Net asset value, beginning of period | $ | 1.00 | $ | 1.00 | $ | 1.00 | $ | 1.00 | $ | 1.00 | $ | 1.00 |
| Income from Investment Operations | | | | | | | | | | | | |
Net investment income (loss) A | | .025 | | .048 | | .014 | | - B | | .003 | | .020 |
Net realized and unrealized gain (loss) B | | - | | - | | - | | - | | - | | - |
| Total from investment operations | | .025 | | .048 | | .014 | | - B | | .003 | | .020 |
| Distributions from net investment income | | (.025) | | (.048) | | (.014) | | - B | | (.003) | | (.020) |
| Total distributions | | (.025) | | (.048) | | (.014) | | - B | | (.003) | | (.020) |
| Net asset value, end of period | $ | 1.00 | $ | 1.00 | $ | 1.00 | $ | 1.00 | $ | 1.00 | $ | 1.00 |
Total Return C,D,E | | | | 4.89% | | 1.44% | | .01% | | .32% | | 2.02% |
Ratios to Average Net Assets A,F,G | | | | | | | | | | | | |
| Expenses before reductions | | .28% H | | .29% | | .24% | | .23% | | .24% | | .26% |
| Expenses net of fee waivers, if any | | | | .29% | | .22% | | .08% | | .20% | | .26% |
| Expenses net of all reductions | | .27% H | | .29% | | .22% | | .08% | | .20% | | .26% |
| Net investment income (loss) | | 5.12% H | | 4.83% | | 1.52% | | .01% | | .29% | | 1.99% |
| Supplemental Data | | | | | | | | | | | | |
| Net assets, end of period (000 omitted) | $ | 2,594,330 | $ | 2,594,542 | $ | 2,210,498 | $ | 1,477,559 | $ | 2,255,440 | $ | 2,182,100 |
ANet investment income (loss) is affected by the timing of the declaration of dividends by any underlying mutual funds or exchange-traded funds (ETFs). Net investment income (loss) of any mutual funds or ETFs is not included in the Fund's net investment income (loss) ratio.
BAmount represents less than $.0005 per share.
CTotal returns for periods of less than one year are not annualized.
DTotal returns do not reflect charges attributable to your insurance company's separate account. Inclusion of these charges would reduce the total returns shown.
ETotal returns would have been lower if certain expenses had not been reduced during the applicable periods shown.
FFees and expenses of any underlying mutual funds or exchange-traded funds (ETFs) are not included in the Fund's expense ratio. The Fund indirectly bears its proportionate share of these expenses.
GExpense ratios reflect operating expenses of the class. Expenses before reductions do not reflect amounts reimbursed, waived, or reduced through arrangements with the investment adviser, brokerage services, or other offset arrangements, if applicable, and do not represent the amount paid by the class during periods when reimbursements, waivers or reductions occur.
HAnnualized.
VIP Government Money Market Portfolio Service Class |
| |
| | Six months ended (Unaudited) June 30, 2024 | | Years ended December 31, 2023 | | 2022 | | 2021 | | 2020 | | 2019 |
Selected Per-Share Data | | | | | | | | | | | | |
| Net asset value, beginning of period | $ | 1.00 | $ | 1.00 | $ | 1.00 | $ | 1.00 | $ | 1.00 | $ | 1.00 |
| Income from Investment Operations | | | | | | | | | | | | |
Net investment income (loss) A | | .025 | | .047 | | .013 | | - B | | .003 | | .019 |
| Net realized and unrealized gain (loss) | | - B | | - B | | .001 | | - B | | - B | | - B |
| Total from investment operations | | .025 | | .047 | | .014 | | - B | | .003 | | .019 |
| Distributions from net investment income | | (.025) | | (.047) | | (.014) | | - B | | (.003) | | (.019) |
| Total distributions | | (.025) | | (.047) | | (.014) | | - B | | (.003) | | (.019) |
| Net asset value, end of period | $ | 1.00 | $ | 1.00 | $ | 1.00 | $ | 1.00 | $ | 1.00 | $ | 1.00 |
Total Return C,D,E | | | | 4.79% | | 1.36% | | .01% | | .28% | | 1.92% |
Ratios to Average Net Assets A,F,G | | | | | | | | | | | | |
| Expenses before reductions | | .38% H | | .39% | | .34% | | .33% | | .34% | | .36% |
| Expenses net of fee waivers, if any | | | | .39% | | .30% | | .08% | | .23% | | .36% |
| Expenses net of all reductions | | .38% H | | .39% | | .29% | | .08% | | .23% | | .36% |
| Net investment income (loss) | | 5.02% H | | 4.73% | | 1.44% | | .01% | | .26% | | 1.89% |
| Supplemental Data | | | | | | | | | | | | |
| Net assets, end of period (000 omitted) | $ | 2,466,935 | $ | 2,289,476 | $ | 1,796,084 | $ | 1,447,279 | $ | 1,641,207 | $ | 1,179,143 |
ANet investment income (loss) is affected by the timing of the declaration of dividends by any underlying mutual funds or exchange-traded funds (ETFs). Net investment income (loss) of any mutual funds or ETFs is not included in the Fund's net investment income (loss) ratio.
BAmount represents less than $.0005 per share.
CTotal returns for periods of less than one year are not annualized.
DTotal returns do not reflect charges attributable to your insurance company's separate account. Inclusion of these charges would reduce the total returns shown.
ETotal returns would have been lower if certain expenses had not been reduced during the applicable periods shown.
FFees and expenses of any underlying mutual funds or exchange-traded funds (ETFs) are not included in the Fund's expense ratio. The Fund indirectly bears its proportionate share of these expenses.
GExpense ratios reflect operating expenses of the class. Expenses before reductions do not reflect amounts reimbursed, waived, or reduced through arrangements with the investment adviser, brokerage services, or other offset arrangements, if applicable, and do not represent the amount paid by the class during periods when reimbursements, waivers or reductions occur.
HAnnualized.
VIP Government Money Market Portfolio Service Class 2 |
| |
| | Six months ended (Unaudited) June 30, 2024 | | Years ended December 31, 2023 | | 2022 | | 2021 | | 2020 | | 2019 |
Selected Per-Share Data | | | | | | | | | | | | |
| Net asset value, beginning of period | $ | 1.00 | $ | 1.00 | $ | 1.00 | $ | 1.00 | $ | 1.00 | $ | 1.00 |
| Income from Investment Operations | | | | | | | | | | | | |
Net investment income (loss) A | | .024 | | .045 | | .013 | | - B | | .002 | | .017 |
Net realized and unrealized gain (loss) B | | - | | - | | - | | - | | - | | - |
| Total from investment operations | | .024 | | .045 | | .013 | | - B | | .002 | | .017 |
| Distributions from net investment income | | (.024) | | (.045) | | (.013) | | - B | | (.002) | | (.017) |
| Total distributions | | (.024) | | (.045) | | (.013) | | - B | | (.002) | | (.017) |
| Net asset value, end of period | $ | 1.00 | $ | 1.00 | $ | 1.00 | $ | 1.00 | $ | 1.00 | $ | 1.00 |
Total Return C,D,E | | | | 4.63% | | 1.26% | | .01% | | .24% | | 1.76% |
Ratios to Average Net Assets A,F,G | | | | | | | | | | | | |
| Expenses before reductions | | .53% H | | .54% | | .49% | | .48% | | .49% | | .51% |
| Expenses net of fee waivers, if any | | | | .54% | | .40% | | .08% | | .28% | | .51% |
| Expenses net of all reductions | | .53% H | | .54% | | .40% | | .08% | | .28% | | .51% |
| Net investment income (loss) | | 4.87% H | | 4.58% | | 1.34% | | .01% | | .21% | | 1.74% |
| Supplemental Data | | | | | | | | | | | | |
| Net assets, end of period (000 omitted) | $ | 377,072 | $ | 319,430 | $ | 238,428 | $ | 203,035 | $ | 221,428 | $ | 220,990 |
ANet investment income (loss) is affected by the timing of the declaration of dividends by any underlying mutual funds or exchange-traded funds (ETFs). Net investment income (loss) of any mutual funds or ETFs is not included in the Fund's net investment income (loss) ratio.
BAmount represents less than $.0005 per share.
CTotal returns for periods of less than one year are not annualized.
DTotal returns do not reflect charges attributable to your insurance company's separate account. Inclusion of these charges would reduce the total returns shown.
ETotal returns would have been lower if certain expenses had not been reduced during the applicable periods shown.
FFees and expenses of any underlying mutual funds or exchange-traded funds (ETFs) are not included in the Fund's expense ratio. The Fund indirectly bears its proportionate share of these expenses.
GExpense ratios reflect operating expenses of the class. Expenses before reductions do not reflect amounts reimbursed, waived, or reduced through arrangements with the investment adviser, brokerage services, or other offset arrangements, if applicable, and do not represent the amount paid by the class during periods when reimbursements, waivers or reductions occur.
HAnnualized.
VIP Government Money Market Portfolio Investor Class |
| |
| | Six months ended (Unaudited) June 30, 2024 | | Years ended December 31, 2023 | | 2022 | | 2021 | | 2020 | | 2019 |
Selected Per-Share Data | | | | | | | | | | | | |
| Net asset value, beginning of period | $ | 1.00 | $ | 1.00 | $ | 1.00 | $ | 1.00 | $ | 1.00 | $ | 1.00 |
| Income from Investment Operations | | | | | | | | | | | | |
Net investment income (loss) A | | .025 | | .048 | | .014 | | - B | | .003 | | .020 |
Net realized and unrealized gain (loss) B | | - | | - | | - | | - | | - | | - |
| Total from investment operations | | .025 | | .048 | | .014 | | - B | | .003 | | .020 |
| Distributions from net investment income | | (.025) | | (.048) | | (.014) | | - B | | (.003) | | (.020) |
| Total distributions | | (.025) | | (.048) | | (.014) | | - B | | (.003) | | (.020) |
| Net asset value, end of period | $ | 1.00 | $ | 1.00 | $ | 1.00 | $ | 1.00 | $ | 1.00 | $ | 1.00 |
Total Return C,D,E | | | | 4.87% | | 1.42% | | .01% | | .31% | | 1.99% |
Ratios to Average Net Assets A,F,G | | | | | | | | | | | | |
| Expenses before reductions | | .31% H | | .32% | | .27% | | .25% | | .26% | | .28% |
| Expenses net of fee waivers, if any | | | | .31% | | .24% | | .08% | | .21% | | .28% |
| Expenses net of all reductions | | .30% H | | .31% | | .24% | | .08% | | .21% | | .28% |
| Net investment income (loss) | | 5.09% H | | 4.81% | | 1.50% | | .01% | | .28% | | 1.97% |
| Supplemental Data | | | | | | | | | | | | |
| Net assets, end of period (000 omitted) | $ | 3,187,823 | $ | 3,016,743 | $ | 2,591,813 | $ | 1,970,069 | $ | 2,094,839 | $ | 1,939,981 |
ANet investment income (loss) is affected by the timing of the declaration of dividends by any underlying mutual funds or exchange-traded funds (ETFs). Net investment income (loss) of any mutual funds or ETFs is not included in the Fund's net investment income (loss) ratio.
BAmount represents less than $.0005 per share.
CTotal returns for periods of less than one year are not annualized.
DTotal returns do not reflect charges attributable to your insurance company's separate account. Inclusion of these charges would reduce the total returns shown.
ETotal returns would have been lower if certain expenses had not been reduced during the applicable periods shown.
FFees and expenses of any underlying mutual funds or exchange-traded funds (ETFs) are not included in the Fund's expense ratio. The Fund indirectly bears its proportionate share of these expenses.
GExpense ratios reflect operating expenses of the class. Expenses before reductions do not reflect amounts reimbursed, waived, or reduced through arrangements with the investment adviser, brokerage services, or other offset arrangements, if applicable, and do not represent the amount paid by the class during periods when reimbursements, waivers or reductions occur.
HAnnualized.
Notes to Financial Statements
(Unaudited)For the period ended June 30, 2024
1. Organization.
VIP Government Money Market Portfolio (the Fund) is a fund of Variable Insurance Products Fund V (the Trust) and is authorized to issue an unlimited number of shares. The Trust is registered under the Investment Company Act of 1940, as amended (the 1940 Act), as an open-end management investment company organized as a Massachusetts business trust. Shares of the Fund may only be purchased by insurance companies for the purpose of funding variable annuity or variable life insurance contracts. The Fund offers the following classes of shares: Initial Class shares, Service Class shares, Service Class 2 shares and Investor Class shares. All classes have equal rights and voting privileges, except for matters affecting a single class.
2. Significant Accounting Policies.
The Fund is an investment company and applies the accounting and reporting guidance of the Financial Accounting Standards Board (FASB) Accounting Standards Codification Topic 946 Financial Services - Investment Companies. The financial statements have been prepared in conformity with accounting principles generally accepted in the United States of America (GAAP), which require management to make certain estimates and assumptions at the date of the financial statements. Actual results could differ from those estimates. Subsequent events, if any, through the date that the financial statements were issued have been evaluated in the preparation of the financial statements. The Fund's Schedule of Investments lists any underlying mutual funds or exchange-traded funds (ETFs) but does not include the underlying holdings of these funds. The following summarizes the significant accounting policies of the Fund:
Investment Valuation. The Fund categorizes the inputs to valuation techniques used to value its investments into a disclosure hierarchy consisting of three levels as shown below:
Level 1 - unadjusted quoted prices in active markets for identical investments
Level 2 - other significant observable inputs (including quoted prices for similar investments, interest rates, prepayment speeds, etc.)
Level 3 - unobservable inputs (including the Fund's own assumptions based on the best information available)
As permitted by compliance with certain conditions under Rule 2a-7 of the 1940 Act, securities are valued at amortized cost, which approximates fair value. The amortized cost of an instrument is determined by valuing it at its original cost and thereafter amortizing any discount or premium from its face value at a constant rate until maturity. Securities held by a money market fund are generally high quality and liquid; however, they are reflected as Level 2 because the inputs used to determine fair value are not quoted prices in an active market.
Investment Transactions and Income. Gains and losses on securities sold are determined on the basis of identified cost and include proceeds received from litigation. Interest income is accrued as earned and includes coupon interest and amortization of premium and accretion of discount on debt securities as applicable. The principal amount on inflation-indexed securities is periodically adjusted to the rate of inflation and interest is accrued based on the principal amount. The adjustments to principal due to inflation are reflected as increases or decreases to Interest in the accompanying Statement of Operations.
Class Allocations and Expenses. Investment income, realized and unrealized capital gains and losses, common expenses of a fund, and certain fund-level expense reductions, if any, are allocated daily on a pro-rata basis to each class based on the relative net assets of each class to the total net assets of a fund. Each class differs with respect to transfer agent and distribution and service plan fees incurred, as applicable. Certain expense reductions may also differ by class, if applicable. For the reporting period, the allocated portion of income and expenses to each class as a percent of its average net assets may vary due to the timing of recording these transactions in relation to fluctuating net assets of the classes. Expenses directly attributable to a fund are charged to that fund. Expenses attributable to more than one fund are allocated among the respective funds on the basis of relative net assets or other appropriate methods. Expenses included in the accompanying financial statements reflect the expenses of that fund and do not include any expenses associated with any underlying mutual funds or exchange-traded funds (ETFs). Although not included in a fund's expenses, a fund indirectly bears its proportionate share of these expenses through the net asset value of each underlying mutual fund or exchange-traded fund (ETF). Expense estimates are accrued in the period to which they relate and adjustments are made when actual amounts are known.
Income Tax Information and Distributions to Shareholders. Each year, the Fund intends to qualify as a regulated investment company under Subchapter M of the Internal Revenue Code, including distributing substantially all of its taxable income and realized gains. As a result, no provision for U.S. Federal income taxes is required. The Fund files a U.S. federal tax return, in addition to state and local tax returns as required. The Fund's federal income tax returns are subject to examination by the Internal Revenue Service (IRS) for a period of three fiscal years after they are filed. State and local tax returns may be subject to examination for an additional fiscal year depending on the jurisdiction.
Distributions are declared and recorded daily and paid monthly from net investment income. Distributions from realized gains, if any, are declared and recorded on the ex-dividend date. Income and capital gain distributions are declared separately for each class. Income and capital gain distributions are determined in accordance with income tax regulations, which may differ from GAAP.
Capital accounts within the financial statements are adjusted for permanent book-tax differences. These adjustments have no impact on net assets or the results of operations. Capital accounts are not adjusted for temporary book-tax differences which will reverse in a subsequent period.
Book-tax differences are primarily due to capital loss carryforwards and losses deferred due to wash sales.
As of period end, the cost and unrealized appreciation (depreciation) in securities for federal income tax purposes were as follows:
| Gross unrealized appreciation | $- |
| Gross unrealized depreciation | - |
| Net unrealized appreciation (depreciation) | $- |
| Tax cost | $8,606,124,987 |
Capital loss carryforwards are only available to offset future capital gains of the Fund to the extent provided by regulations and may be limited. The capital loss carryforward information presented below, including any applicable limitation, is estimated as of prior fiscal period end and is subject to adjustment.
Long-term | $(28,100) |
| Total capital loss carryforward | $(28,100) |
Repurchase Agreements. Pursuant to an Exemptive Order issued by the Securities and Exchange Commission, funds and other registered investment companies having management contracts with Fidelity Management and Research Company LLC, or its affiliates are permitted to transfer uninvested cash balances into joint trading accounts which are then invested in repurchase agreements. Funds may also invest directly with institutions in repurchase agreements. Repurchase agreements may be collateralized by cash or government securities. Upon settlement date, collateral is held in segregated accounts with custodian banks and may be obtained in the event of a default of the counterparty. The collateral balance is monitored on a daily basis to ensure it is at least equal to the principal amount of the repurchase agreement (including accrued interest). In the event of a default by the counterparty, realization of the collateral proceeds could be delayed, during which time the value of the collateral may decline.
New Rule Issuance. In July 2023, the Securities and Exchange Commission issued a Final Rule relative to Money Market Reform. Among other things, the Final Rule includes amendments for: (1) Removal of redemption gates except for liquidations; (2) Required liquidity fees for institutional prime and institutional tax-exempt money market funds; (3) Discretionary liquidity fees for non-government money market funds; (4) Higher liquidity requirements; and (5) Changes to reporting requirements for Form N-MFP and Form N-CR. The Final Rule imposes different implementation dates for the amendments through October 2, 2024. Management has evaluated the amendments and does not expect them to have a material impact to the Fund's financial statements and related disclosures.
3. Fees and Other Transactions with Affiliates.
Management Fee. Fidelity Management & Research Company LLC (the investment adviser) and its affiliates provide the Fund with investment management related services for which the Fund pays a monthly management fee.
Effective March 1, 2024, the Fund's management contract was amended to incorporate administrative services previously covered under separate services agreements (Transfer Agent and Accounting agreements). The amended contract incorporates a management fee rate that may vary by class. The investment adviser or an affiliate pays certain expenses of managing and operating the Fund out of each class's management fee. Each class of the Fund pays a management fee to the investment adviser. The management fee is calculated and paid to the investment adviser every month. The management fee is determined by calculating a basic fee and then adding an income-related fee. When determining a class's management fee, a mandate rate is calculated based on the monthly average net assets of a group of funds advised by FMR within a designated asset class. A discount rate is subtracted from the mandate rate once the Fund's monthly average net assets reach a certain level. The mandate rate and discount rate may vary by class. The annual management fee rate for a class of shares of the Fund is the lesser of (1) the class's mandate rate reduced by the class's discount rate (if applicable) or (2) the amount set forth in the following table.
| | Maximum Management Fee Rate % |
| Initial Class | .15 |
| Service Class | .15 |
| Service Class 2 | .15 |
| Investor Class | .18 |
One-twelfth of the management fee rate for a class is applied to the average net assets of the class for the month, giving a dollar amount which is the management fee for the class for that month. The income-related fee varies depending on the level of the Fund's monthly gross income from an annualized rate of .05% (at a fund annualized gross yield of 0%) to .27% (at a fund annualized gross yield of 15%) of the Fund's average net assets throughout the month. The income-related fee is proportionately added to a class's basic fee. A different management fee rate may be applicable to each class of the Fund. The difference between classes is the result of separate arrangements for class-level services and/or waivers of certain expenses. It is not the result of any difference in advisory or custodial fees or other expenses related to the management of the Fund's assets, which do not vary by class. For the portion of the reporting period on or after March 1, 2024, the total annualized income-related fee and management fee rates were as follows:
| | Income-Related Fee $ | Income-Related Fee Rate % | Total Management Fee Rate % |
| VIP Government Money Market Portfolio | 3,121,352 | .12 | |
| Initial Class | | | .27 |
| Service Class | | | .27 |
| Service Class 2 | | | .27 |
| Investor Class | | | .30 |
Prior to March 1, 2024, the management fee was calculated on the basis of a group fee rate plus a total income-based component. The annualized group fee rate averaged .10% during the period. The group fee rate was based upon the monthly average net assets of a group of registered investment companies with which the investment adviser has management contracts. The group fee rate decreased as assets under management increased and increased as assets under management decreased. The total income-based component was comprised of an income-based fee and an asset-based fee and was calculated according to a graduated schedule providing for different rates based on the Fund's gross annualized yield. The rate increased as the Fund's gross yield increased. Prior to March 1, 2024, the income-based portion of this fee was $1,634,311 or an annualized rate of .12% of the Fund's average net assets. For the portion of the reporting period prior to March 1, 2024, the total annualized management fee rate was .22%.
Effective March 1, 2024, the Fund's sub-advisory agreements with FMR Investment Management (UK) Limited, Fidelity Management & Research (Hong Kong) Limited, and Fidelity Management & Research (Japan) Limited were amended to provide that the investment adviser pays each sub-adviser monthly fees equal to 110% of the sub-adviser's costs for providing sub-advisory services.
Distribution and Service Plan Fees. In accordance with Rule 12b-1 of the 1940 Act, the Fund has adopted separate 12b-1 Plans for each Service Class of shares. Each Service Class pays Fidelity Distributors Company LLC (FDC), an affiliate of the investment adviser, a service fee. For the period, the service fee is based on an annual rate of .10% of Service Class' average net assets and .25% of Service Class 2's average net assets.
For the period, total fees, all of which were re-allowed to insurance companies for the distribution of shares and providing shareholder support services, were as follows:
| Service Class | $1,060,893 |
| Service Class 2 | 418,756 |
| | $1,479,649 |
Transfer Agent Fees. Fidelity Investments Institutional Operations Company LLC (FIIOC), an affiliate of the investment adviser, is the Fund's transfer, dividend disbursing, and shareholder servicing agent. Effective March 1, 2024, the Fund's management contract was amended to incorporate transfer agent services and associated fees previously covered under a separate services agreement.
During the period January 1, 2024 through February 29, 2024, the transfer agent fees for each of class were a fixed annual rate of class-level average net assets as follows:
| | Amount ($) | % of Class-Level Average Net Assets |
| Initial Class | 305,591 | .0680 |
| Service Class | 243,455 | .0680 |
| Service Class 2 | 36,423 | .0680 |
| Investor Class | 460,967 | .0920 |
| | 1,046,436 | |
Accounting Fees. Fidelity Service Company, Inc. (FSC), an affiliate of the investment adviser, maintains the Fund's accounting records. Effective March 1, 2024, the Fund's management contract was amended to incorporate accounting services and associated fees previously covered under a separate services agreement.
During the period January 1, 2024 through February 29, 2024, the accounting fees were a fixed annual rate of average net assets as follows:
| | % of Average Net Assets |
| VIP Government Money Market Portfolio | .0083 |
Interfund Trades. Funds may purchase from or sell securities to other Fidelity Funds under procedures adopted by the Board. The procedures have been designed to ensure these interfund trades are executed in accordance with Rule 17a-7 of the 1940 Act. During the period, there were no interfund trades.
4. Expense Reductions.
During the period the investment adviser or an affiliate reimbursed and/or waived a portion of fund-level operating expenses in the amount of $197,615.
5. Distributions to Shareholders.
Distributions to shareholders of each class were as follows:
| | Six months ended June 30, 2024 | Year ended December 31, 2023 |
| VIP Government Money Market Portfolio | | |
| Distributions to shareholders | | |
| Initial Class | $65,682,079 | $102,114,967 |
| Service Class | 52,944,511 | 93,288,370 |
| Service Class 2 | 8,096,905 | 12,727,490 |
| Investor Class | 78,019,757 | 134,163,911 |
Total | $204,743,252 | $342,294,738 |
6. Share Transactions.
Transactions for each class of shares at a $1.00 per share were as follows and may contain in-kind transactions:
| | Shares | Shares | Dollars | Dollars |
| | Six months ended June 30, 2024 | Year ended December 31, 2023 | Six months ended June 30, 2024 | Year ended December 31, 2023 |
| VIP Government Money Market Portfolio | | | | |
| Initial Class | | | | |
| Shares sold | 1,235,257,044 | 2,678,433,367 | $1,235,257,044 | $2,678,433,368 |
| Reinvestment of distributions | 65,680,711 | 101,451,920 | 65,680,711 | 101,451,920 |
| Shares redeemed | (1,301,132,111) | (2,395,779,271) | (1,301,132,111) | (2,395,779,271) |
| Net increase (decrease) | (194,356) | 384,106,016 | $(194,356) | $384,106,017 |
| Service Class | | | | |
| Shares sold | 1,326,276,528 | 1,936,736,029 | $1,326,276,528 | $1,936,736,029 |
| Reinvestment of distributions | 52,896,862 | 92,851,034 | 52,896,862 | 92,851,034 |
| Shares redeemed | (1,201,700,357) | (1,536,162,855) | (1,201,700,357) | (1,536,162,855) |
| Net increase (decrease) | 177,473,033 | 493,424,208 | $177,473,033 | $493,424,208 |
| Service Class 2 | | | | |
| Shares sold | 254,973,302 | 324,195,319 | $254,973,302 | $324,195,319 |
| Reinvestment of distributions | 8,082,716 | 12,647,436 | 8,082,716 | 12,647,436 |
| Shares redeemed | (205,415,561) | (255,857,046) | (205,415,561) | (255,857,046) |
| Net increase (decrease) | 57,640,457 | 80,985,709 | $57,640,457 | $80,985,709 |
| Investor Class | | | | |
| Shares sold | 341,702,927 | 799,423,897 | $341,702,927 | $799,423,897 |
| Reinvestment of distributions | 77,972,037 | 133,600,121 | 77,972,037 | 133,600,121 |
| Shares redeemed | (248,631,114) | (508,177,510) | (248,631,113) | (508,177,510) |
| Net increase (decrease) | 171,043,850 | 424,846,508 | $171,043,851 | $424,846,508 |
7. Other.
A fund's organizational documents provide former and current trustees and officers with a limited indemnification against liabilities arising in connection with the performance of their duties to the fund. In the normal course of business, a fund may also enter into contracts that provide general indemnifications. A fund's maximum exposure under these arrangements is unknown as this would be dependent on future claims that may be made against a fund. The risk of material loss from such claims is considered remote.
At the end of the period, the investment adviser or its affiliates were owners of record of more than 10% and certain otherwise unaffiliated shareholders were owners of record of more than 10% of the outstanding shares as follows:
| Fund | Affiliated % | Number ofUnaffiliated Shareholders | Unaffiliated Shareholders % |
| VIP Real Estate Portfolio | 40 | 1 | 13 |
8. Risk and Uncertainties.
Many factors affect a fund's performance. Developments that disrupt global economies and financial markets, such as pandemics, epidemics, outbreaks of infectious diseases, war, terrorism, and environmental disasters, may significantly affect a fund's investment performance. The effects of these developments to a fund will be impacted by the types of securities in which a fund invests, the financial condition, industry, economic sector, and geographic location of an issuer, and a fund's level of investment in the securities of that issuer. Significant concentrations in security types, issuers, industries, sectors, and geographic locations may magnify the factors that affect a fund's performance.
Item 8: Changes in and Disagreements with Accountants for Open-End Management Investment Companies
Note: This is not applicable for any fund included in this document.
Item 9: Proxy Disclosures for Open-End Management Investment Companies
Note: This is not applicable for any fund included in this document.
Item 10: Remuneration Paid to Directors, Officers, and others of Open-End Management Investment Companies
Note: This information is disclosed as part of the financial statements for each Fund as part of Item 7: Financial Statements and Financial Highlights for Open-End Management Investment companies.
Item 11: Statement Regarding Basis for Approval of Investment Advisory Contract
Board Approval of Investment Advisory Contracts
VIP Government Money Market Portfolio
At its January 2024 meeting, the Board of Trustees, including the Independent Trustees (together, the Board), approved an amended and restated management contract with Fidelity Management & Research Company LLC (FMR) (the Management Contract), and amended and restated sub-advisory agreements (the Sub-Advisory Contracts, and together with the Management Contract, the Advisory Contracts) for the fund, including the fund's sub-advisory agreements with FMR Investment Management (UK) Limited (FMR UK), Fidelity Management & Research (Hong Kong) Limited (FMR H.K.), and Fidelity Management & Research (Japan) Limited (FMR Japan). The Advisory Contracts will be effective March 1, 2024. The Board will consider the annual renewal of the fund's Advisory Contracts in September 2024, following its review of additional materials provided by FMR.
Management Contract. The Board approved the Management Contract, which implements a new fee structure combining the management fee, transfer agent fee (TA Fee), and pricing and bookkeeping fee (P&B Fee) of the fund and each class into a single class-level fee based on tiered schedules and subject to a maximum class-level rate (the Unified Fee). In exchange for the Unified Fee, the fund will receive investment advisory, management, administrative, transfer agent, pricing and bookkeeping services under a single agreement - the Management Contract.
In its consideration of the Management Contract over several meetings, the Board received, reviewed and discussed a comprehensive set of analyses regarding the Unified Fee including (i) the legal framework, (ii) design goals for the Unified Fee, (iii) calculation methodology for the Unified Fee and illustrative examples, (iv) annual and cumulative projected impacts under various scenarios, both in the aggregate and at the fund/class level, (v) explanations of schedules, rate levers and maximum rates and (vi) shareholder benefits and projected savings.
The Board considered that the maximum Unified Fee for each class of the fund would be no higher than the sum of (i) the lowest contractual management fee under the fund's existing management contract, which is the individual fund fee, if any, plus the lowest contractual marginal group fee rate and (ii) the TA and P&B Fee rates, which are fixed fee rates since December 1, 2023 (together, the "Unified Fee Cap"). The Board noted that, as a result of this Unified Fee Cap, the Unified Fee would be no greater than the fees previously authorized to be charged for the same services. The Board noted that certain expenses such as income-based fees, third-party expenses, Rule 12b-1 fees, and certain other miscellaneous expenses would be outside the scope of the Unified Fee and the calculation of such fees would not change as a result of the Unified Fee. The Board considered that, under the Management Contract, a different management fee rate will be applicable to each class of the fund. The Board noted that Fidelity has represented that the difference in expenses between classes is based on differences in class-specific expenses and not due to any difference in advisory or third-party custodial fees or other expenses related to the management of the fund's assets.
The Board considered that implementation of the Unified Fee, which includes the Unified Fee Cap, would cause all funds subject to a Unified Fee, including the fund, to experience an immediate reduction on contractual fee rates for services provided under the current management contracts. The Board considered that some funds would not experience lower fees as a result of existing fee caps. The Board further considered that, in addition to the contractual fee savings, the Unified Fee offers funds and their shareholders greater protection from future rate increases for services previously offered under separate agreements that are now covered by the Management Contract because such rate increases would require shareholder, as well as Board, approval.
Sub-Advisory Contracts. In connection with the Unified Fee changes, the Board considered the Sub-Advisory Contracts, which changed the arrangements for fees paid by FMR to the sub-advisers under the agreements. The Board noted that the agreements with FMR UK, FMR H.K., and FMR Japan were amended to provide that FMR will compensate each sub-adviser at a fee equal to 110% of the sub-adviser's costs incurred in providing services under the agreement. The Board considered that, under the Sub-Advisory Contracts, FMR, and not the fund, will continue to pay the sub-advisory fees to each applicable sub-adviser.
The Board considered that the approval of the fund's Advisory Contracts will not result in any changes in the investment process or strategies employed in the management of the fund's assets or the day-to-day management of the fund or the persons primarily responsible for such management. Further, the Board considered that the Management Contract would not change the obligations and services of FMR and its affiliates on behalf of the fund, and, in particular, there would be no change in the nature and level of advisory, management, administration, transfer agent, and pricing and bookkeeping services provided to the fund by FMR and its affiliates.
In connection with its consideration of future renewals of the fund's Advisory Contracts, the Board will consider: (i) the nature, extent and quality of services provided to the funds, including shareholder and administrative services and investment performance; (ii) the competitiveness of the management fee and total expenses for the fund; (iii) the costs of the services and profitability, including the revenues earned and the expenses incurred in conducting the business of developing, marketing, distributing, managing, administering, and servicing the fund and its shareholders, to the extent applicable; and (iv) whether there have been economies of scale in respect of the Fidelity funds, whether the Fidelity funds (including the fund) have appropriately benefited from any such economies of scale, and whether there is the potential for realization of any further economies.
Based on its evaluation of all of the conclusions noted above, and after considering all factors it believed relevant, the Board concluded that the fund's management fee structure is fair and reasonable, and that the fund's Advisory Contracts should be approved.
1.705628.126
VIPMM-SANN-0824
Fidelity® Variable Insurance Products:
VIP Asset Manager: Growth Portfolio
Semi-Annual Report
June 30, 2024
Contents
To view a fund's proxy voting guidelines and proxy voting record for the 12-month period ended June 30, visit http://www.fidelity.com/proxyvotingresults or visit the Securities and Exchange Commission's (SEC) web site at http://www.sec.gov.
You may also call 1-877-208-0098 to request a free copy of the proxy voting guidelines.
Fidelity® Variable Insurance Products are separate account options which are purchased through a variable insurance contract.
Standard & Poor's, S&P and S&P 500 are registered service marks of The McGraw-Hill Companies, Inc. and have been licensed for use by Fidelity Distributors Corporation.
Other third-party marks appearing herein are the property of their respective owners.
All other marks appearing herein are registered or unregistered trademarks or service marks of FMR LLC or an affiliated company. © 2024 FMR LLC. All rights reserved.
This report and the financial statements contained herein are submitted for the general information of the shareholders of the Fund. This report is not authorized for distribution to prospective investors in the Fund unless preceded or accompanied by an effective prospectus.
A fund files its complete schedule of portfolio holdings with the SEC for the first and third quarters of each fiscal year on Form N-PORT. Forms N-PORT are available on the SEC's web site at http://www.sec.gov. A fund's Forms N-PORT may be reviewed and copied at the SEC's Public Reference Room in Washington, DC. Information regarding the operation of the SEC's Public Reference Room may be obtained by calling 1-800-SEC-0330.
For a complete list of a fund's portfolio holdings, view the most recent holdings listing, semiannual report, or annual report on Fidelity's web site at http://www.fidelity.com, http://www.institutional.fidelity.com, or http://www.401k.com, as applicable.
NOT FDIC INSURED •MAY LOSE VALUE •NO BANK GUARANTEE
Neither the Fund nor Fidelity Distributors Corporation is a bank.
Item 7: Financial Statements and Financial Highlights for Open-End Management Investment Companies (Semi-Annual Report)
VIP Asset Manager: Growth Portfolio
Schedule of Investments June 30, 2024 (Unaudited)
Showing Percentage of Net Assets
| U.S. Treasury Obligations - 0.1% |
| | | Principal Amount (a) | Value ($) |
U.S. Treasury Bills, yield at date of purchase 5.3% to 5.33% 7/25/24 to 9/19/24 (b) (Cost $247,825) | | 250,000 | 247,830 |
| | | | |
| Fixed-Income Funds - 23.4% |
| | | Shares | Value ($) |
| Fidelity Emerging Markets Debt Local Currency Central Fund (c) | | 22,002 | 1,895,285 |
| Fidelity Floating Rate Central Fund (c) | | 20,303 | 1,989,054 |
| Fidelity High Income Central Fund (c) | | 18,503 | 1,931,891 |
| Fidelity Inflation-Protected Bond Index Central Fund (c) | | 43,695 | 3,906,317 |
| Fidelity International Credit Central Fund (c) | | 8,131 | 656,376 |
| iShares 20+ Year Treasury Bond ETF | | 14,200 | 1,303,276 |
| Fidelity VIP Investment Grade Central Fund (c) | | 548,916 | 50,247,792 |
| TOTAL FIXED-INCOME FUNDS (Cost $65,805,058) | | | 61,929,991 |
| | | | |
| Money Market Funds - 0.9% |
| | | Shares | Value ($) |
| Fidelity Cash Central Fund 5.38% (d) | | 2,102,665 | 2,103,086 |
| Fidelity Securities Lending Cash Central Fund 5.38% (d)(e) | | 268,098 | 268,125 |
| TOTAL MONEY MARKET FUNDS (Cost $2,371,211) | | | 2,371,211 |
| | | | |
| Equity Funds - 75.8% |
| | | Shares | Value ($) |
| Domestic Equity Funds - 47.7% | | | |
| Fidelity Commodity Strategy Central Fund (c) | | 12,052 | 1,119,498 |
| Fidelity Hedged Equity ETF (f) | | 130,021 | 3,363,734 |
| Fidelity Real Estate Equity Central Fund (c) | | 8,217 | 1,042,212 |
| Fidelity U.S. Equity Central Fund (c) | | 883,603 | 120,806,148 |
TOTAL DOMESTIC EQUITY FUNDS | | | 126,331,592 |
| International Equity Funds - 27.6% | | | |
| Fidelity Emerging Markets Equity Central Fund (c) | | 104,227 | 22,764,204 |
| Fidelity International Equity Central Fund (c) | | 478,914 | 50,305,162 |
TOTAL INTERNATIONAL EQUITY FUNDS | | | 73,069,366 |
| Mid-Cap Blend Funds - 0.2% | | | |
| Fidelity Enhanced Mid Cap ETF (f) | | 21,185 | 623,898 |
| Small Blend Funds - 0.3% | | | |
| iShares Russell 2000 ETF (g) | | 4,502 | 913,411 |
| TOTAL EQUITY FUNDS (Cost $128,174,822) | | | 200,938,267 |
| | | | |
| TOTAL INVESTMENT IN SECURITIES - 100.2% (Cost $196,598,916) | 265,487,299 |
NET OTHER ASSETS (LIABILITIES) - (0.2)% | (461,721) |
| NET ASSETS - 100.0% | 265,025,578 |
| | |
| Futures Contracts |
| | Number of contracts | Expiration Date | Notional Amount ($) | Value ($) | Unrealized Appreciation/ (Depreciation) ($) |
| Purchased | | | | | |
| | | | | | |
| Equity Index Contracts | | | | | |
| ICE MSCI EAFE Index Contracts (United States) | 13 | Sep 2024 | 1,523,080 | 8,180 | 8,180 |
| | | | | | |
| Sold | | | | | |
| | | | | | |
| Equity Index Contracts | | | | | |
| CME E-mini S&P 500 Index Contracts (United States) | 17 | Sep 2024 | 4,693,275 | (15,063) | (15,063) |
| ICE MSCI Emerging Markets Index Contracts (United States) | 13 | Sep 2024 | 707,330 | (1,845) | (1,845) |
| | | | | | |
| TOTAL SOLD | | | | | (16,908) |
| | | | | | |
| TOTAL FUTURES CONTRACTS | | | | | (8,728) |
| The notional amount of futures purchased as a percentage of Net Assets is 0.6% |
| The notional amount of futures sold as a percentage of Net Assets is 2.1% |
Security Type Abbreviations
Legend
| (a) | Amount is stated in United States dollars unless otherwise noted. |
| (b) | Security or a portion of the security was pledged to cover margin requirements for futures contracts. At period end, the value of securities pledged amounted to $247,830. |
| (c) | Affiliated fund that is generally available only to investment companies and other accounts managed by Fidelity Investments. A complete unaudited schedule of portfolio holdings for each Fidelity Central Fund is filed with the SEC for the first and third quarters of each fiscal year on Form N-PORT and is available upon request or at the SEC's website at www.sec.gov. An unaudited holdings listing for the Fund, which presents direct holdings as well as the pro-rata share of securities and other investments held indirectly through its investment in underlying non-money market Fidelity Central Funds, other than the Commodity Strategy Central Fund, is available at fidelity.com and/or institutional.fidelity.com, as applicable. In addition, each Fidelity Central Fund's financial statements are available on the SEC's website or upon request. |
| (d) | Affiliated fund that is generally available only to investment companies and other accounts managed by Fidelity Investments. The rate quoted is the annualized seven-day yield of the fund at period end. A complete unaudited listing of the fund's holdings as of its most recent quarter end is available upon request. In addition, each Fidelity Central Fund's financial statements are available on the SEC's website or upon request. |
| (e) | Investment made with cash collateral received from securities on loan. |
| (g) | Security or a portion of the security is on loan at period end. |
Affiliated Central Funds
Fiscal year to date information regarding the Fund's investments in Fidelity Central Funds, including the ownership percentage, is presented below.
| Affiliate | Value, beginning of period ($) | Purchases ($) | Sales Proceeds ($) | Dividend Income ($) | Realized Gain (loss) ($) | Change in Unrealized appreciation (depreciation) ($) | Value, end of period ($) | % ownership, end of period |
| Fidelity Cash Central Fund 5.38% | 1,090,775 | 8,676,096 | 7,663,785 | 50,145 | - | - | 2,103,086 | 0.0% |
| Fidelity Commodity Strategy Central Fund | 1,053,339 | 64,405 | 52,136 | - | (533) | 54,423 | 1,119,498 | 0.5% |
| Fidelity Emerging Markets Debt Central Fund | 570,487 | 86,204 | 656,987 | 11,413 | (111,709) | 112,005 | - | 0.0% |
| Fidelity Emerging Markets Debt Local Currency Central Fund | 1,910,336 | 79,339 | - | 26,176 | - | (94,390) | 1,895,285 | 0.7% |
| Fidelity Emerging Markets Equity Central Fund | 20,812,093 | 1,136,846 | 825,937 | 114,157 | 8,535 | 1,632,667 | 22,764,204 | 0.9% |
| Fidelity Floating Rate Central Fund | 1,891,798 | 186,860 | 78,206 | 90,263 | 97 | (11,495) | 1,989,054 | 0.1% |
| Fidelity Hedged Equity Central Fund | 3,091,142 | 931 | 3,372,197 | 932 | 518,821 | (238,697) | - | 0.0% |
| Fidelity High Income Central Fund | 1,227,069 | 778,649 | 74,165 | 59,541 | 304 | 34 | 1,931,891 | 0.1% |
| Fidelity Inflation-Protected Bond Index Central Fund | 4,671,445 | 499,983 | 1,316,443 | 9,415 | (143,433) | 194,765 | 3,906,317 | 0.9% |
| Fidelity International Credit Central Fund | 1,232,917 | 67,193 | 655,419 | 16,290 | (118,256) | 129,941 | 656,376 | 0.7% |
| Fidelity International Equity Central Fund | 45,759,132 | 3,264,526 | 2,062,992 | 711,633 | 16,857 | 3,327,639 | 50,305,162 | 0.9% |
| Fidelity Real Estate Equity Central Fund | 1,034,416 | 71,900 | 52,137 | 7,495 | 490 | (12,457) | 1,042,212 | 0.1% |
| Fidelity Securities Lending Cash Central Fund 5.38% | - | 13,540,914 | 13,272,789 | 2,395 | - | - | 268,125 | 0.0% |
| Fidelity U.S. Equity Central Fund | 107,766,233 | 6,344,717 | 4,661,225 | 579,472 | 37,279 | 11,319,144 | 120,806,148 | 0.6% |
| Fidelity VIP Investment Grade Central Fund | 48,538,720 | 5,077,619 | 2,263,943 | 1,012,337 | (60,965) | (1,043,639) | 50,247,792 | 1.7% |
| Total | 240,649,902 | 39,876,182 | 37,008,361 | 2,691,664 | 147,487 | 15,369,940 | 259,035,150 | |
| | | | | | | | | |
Amounts in the dividend income column in the above table include any capital gain distributions from underlying funds, which are presented in the corresponding line item in the Statement of Operations, if applicable.
Amounts in the dividend income column for Fidelity Securities Lending Cash Central Fund represents the income earned on investing cash collateral, less rebates paid to borrowers and any lending agent fees associated with the loan, plus any premium payments received for lending certain types of securities.
Amounts included in the purchases and sales proceeds columns may include in-kind transactions, if applicable.
Affiliated Underlying Funds
Fiscal year to date information regarding the Fund's investments in affiliated Underlying Funds is presented below. Exchanges between classes of the same affiliated Underlying Funds may occur. If an Underlying Funds changes its name, the name presented below is the name in effect at period end.
| Affiliate | Value, beginning of period ($) | Purchases ($) | Sales Proceeds ($) | Dividend Income ($) | Realized Gain (loss) ($) | Change in Unrealized appreciation (depreciation) ($) | Value, end of period ($) |
| Fidelity Enhanced Mid Cap ETF | - | 637,323 | - | 1,631 | - | (13,425) | 623,898 |
| Fidelity Hedged Equity ETF | - | 3,364,544 | 83,534 | 3,901 | (632) | 83,356 | 3,363,734 |
| Fidelity Low Volatility Factor ETF | 2,432,488 | - | 2,475,742 | - | 83,840 | (40,586) | - |
| | 2,432,488 | 4,001,867 | 2,559,276 | 5,532 | 83,208 | 29,345 | 3,987,632 |
Amounts in the dividend income column in the above table include any capital gain distributions from underlying funds, which are presented in the corresponding line item in the Statement of Operations, if applicable.
Amounts included in the purchases and sales proceeds columns may include in-kind transactions, if applicable.
Investment Valuation
The following is a summary of the inputs used, as of June 30, 2024, involving the Fund's assets and liabilities carried at fair value. The inputs or methodology used for valuing securities may not be an indication of the risk associated with investing in those securities. For more information on valuation inputs, and their aggregation into the levels used below, please refer to the Investment Valuation section in the accompanying Notes to Financial Statements.
| Valuation Inputs at Reporting Date: |
| Description | Total ($) | Level 1 ($) | Level 2 ($) | Level 3 ($) |
Investments in Securities: | | | | |
|
| U.S. Government and Government Agency Obligations | 247,830 | - | 247,830 | - |
|
| Fixed-Income Funds | 61,929,991 | 61,929,991 | - | - |
|
| Money Market Funds | 2,371,211 | 2,371,211 | - | - |
|
| Equity Funds | 200,938,267 | 200,938,267 | - | - |
| Total Investments in Securities: | 265,487,299 | 265,239,469 | 247,830 | - |
Derivative Instruments: Assets | | | | |
Futures Contracts | 8,180 | 8,180 | - | - |
| Total Assets | 8,180 | 8,180 | - | - |
| Liabilities | | | | |
Futures Contracts | (16,908) | (16,908) | - | - |
| Total Liabilities | (16,908) | (16,908) | - | - |
| Total Derivative Instruments: | (8,728) | (8,728) | - | - |
Value of Derivative Instruments
The following table is a summary of the Fund's value of derivative instruments by primary risk exposure as of June 30, 2024. For additional information on derivative instruments, please refer to the Derivative Instruments section in the accompanying Notes to Financial Statements.
Primary Risk Exposure / Derivative Type | Value |
| Asset ($) | Liability ($) |
| Equity Risk | | |
Futures Contracts (a) | 8,180 | (16,908) |
| Total Equity Risk | 8,180 | (16,908) |
| Total Value of Derivatives | 8,180 | (16,908) |
(a)Reflects gross cumulative appreciation (depreciation) on futures contracts as presented in the Schedule of Investments. In the Statement of Assets and Liabilities, the period end daily variation margin is included in receivable or payable for daily variation margin on futures contracts, and the net cumulative appreciation (depreciation) is included in Total accumulated earnings (loss).
Financial Statements (Unaudited)
| Statement of Assets and Liabilities |
| | | | June 30, 2024 (Unaudited) |
| | | | | |
| Assets | | | | |
| Investment in securities, at value (including securities loaned of $263,757) - See accompanying schedule: | | | | |
Unaffiliated issuers (cost $2,564,749) | $ | 2,464,517 | | |
Fidelity Central Funds (cost $190,116,466) | | 259,035,150 | | |
Other affiliated issuers (cost $3,917,701) | | 3,987,632 | | |
| | | | | |
| | | | | |
| Total Investment in Securities (cost $196,598,916) | | | $ | 265,487,299 |
| Receivable for investments sold | | | | 12,827 |
| Receivable for fund shares sold | | | | 130,236 |
| Distributions receivable from Fidelity Central Funds | | | | 10,257 |
Total assets | | | | 265,640,619 |
| Liabilities | | | | |
| Payable for investments purchased | $ | 115,827 | | |
| Payable for fund shares redeemed | | 24,625 | | |
| Accrued management fee | | 138,547 | | |
| Distribution and service plan fees payable | | 4,942 | | |
| Payable for daily variation margin on futures contracts | | 34,827 | | |
| Other payables and accrued expenses | | 28,148 | | |
| Collateral on securities loaned | | 268,125 | | |
| Total liabilities | | | | 615,041 |
| Net Assets | | | $ | 265,025,578 |
| Net Assets consist of: | | | | |
| Paid in capital | | | $ | 194,333,969 |
| Total accumulated earnings (loss) | | | | 70,691,609 |
| Net Assets | | | $ | 265,025,578 |
| | | | | |
| Net Asset Value and Maximum Offering Price | | | | |
| Initial Class : | | | | |
Net Asset Value, offering price and redemption price per share ($89,657,430 ÷ 3,956,819 shares) | | | $ | 22.66 |
| Service Class : | | | | |
Net Asset Value, offering price and redemption price per share ($3,805,947 ÷ 169,799 shares) | | | $ | 22.41 |
| Service Class 2 : | | | | |
Net Asset Value, offering price and redemption price per share ($23,109,443 ÷ 1,041,837 shares) | | | $ | 22.18 |
| Investor Class : | | | | |
Net Asset Value, offering price and redemption price per share ($148,452,758 ÷ 6,606,728 shares) | | | $ | 22.47 |
| Statement of Operations |
| | | | Six months ended June 30, 2024 (Unaudited) |
| Investment Income | | | | |
| Dividends (including $5,532 earned from affiliated issuers) | | | $ | 32,118 |
| Interest | | | | 7,759 |
| Income from Fidelity Central Funds (including $2,395 from security lending) | | | | 2,691,664 |
| Total income | | | | 2,731,541 |
| Expenses | | | | |
| Management fee | $ | 760,881 | | |
| Transfer agent fees | | 43,654 | | |
| Distribution and service plan fees | | 24,929 | | |
| Accounting fees | | 19,457 | | |
| Custodian fees and expenses | | 8,270 | | |
| Independent trustees' fees and expenses | | 336 | | |
| Audit | | 28,258 | | |
| Legal | | 894 | | |
| Miscellaneous | | 5,359 | | |
| Total expenses before reductions | | 892,038 | | |
| Expense reductions | | (13,899) | | |
| Total expenses after reductions | | | | 878,139 |
| Net Investment income (loss) | | | | 1,853,402 |
| Realized and Unrealized Gain (Loss) | | | | |
| Net realized gain (loss) on: | | | | |
| Investment Securities: | | | | |
| Unaffiliated issuers | | (29,096) | | |
| Fidelity Central Funds | | 147,487 | | |
| Other affiliated issuers | | 83,208 | | |
| Futures contracts | | (539,835) | | |
| Total net realized gain (loss) | | | | (338,236) |
| Change in net unrealized appreciation (depreciation) on: | | | | |
| Investment Securities: | | | | |
| Unaffiliated issuers | | (42,680) | | |
| Fidelity Central Funds | | 15,369,940 | | |
| Other affiliated issuers | | 29,345 | | |
| Futures contracts | | 95,068 | | |
| Total change in net unrealized appreciation (depreciation) | | | | 15,451,673 |
| Net gain (loss) | | | | 15,113,437 |
| Net increase (decrease) in net assets resulting from operations | | | $ | 16,966,839 |
| Statement of Changes in Net Assets |
| |
| | Six months ended June 30, 2024 (Unaudited) | | Year ended December 31, 2023 |
| Increase (Decrease) in Net Assets | | | | |
| Operations | | | | |
| Net investment income (loss) | $ | 1,853,402 | $ | 4,099,740 |
| Net realized gain (loss) | | (338,236) | | 2,543,594 |
| Change in net unrealized appreciation (depreciation) | | 15,451,673 | | 28,430,492 |
| Net increase (decrease) in net assets resulting from operations | | 16,966,839 | | 35,073,826 |
| Distributions to shareholders | | (2,581,098) | | (4,166,216) |
| | | | | |
| Share transactions - net increase (decrease) | | 5,823,928 | | (5,267,979) |
| Total increase (decrease) in net assets | | 20,209,669 | | 25,639,631 |
| | | | | |
| Net Assets | | | | |
| Beginning of period | | 244,815,909 | | 219,176,278 |
| End of period | $ | 265,025,578 | $ | 244,815,909 |
| | | | | |
| | | | | |
Financial Highlights
VIP Asset Manager: Growth Portfolio Initial Class |
| |
| | Six months ended (Unaudited) June 30, 2024 | | Years ended December 31, 2023 | | 2022 | | 2021 | | 2020 | | 2019 |
Selected Per-Share Data | | | | | | | | | | | | |
| Net asset value, beginning of period | $ | 21.41 | $ | 18.72 | $ | 24.38 | $ | 22.00 | $ | 19.20 | $ | 16.76 |
| Income from Investment Operations | | | | | | | | | | | | |
Net investment income (loss) A,B | | .17 | | .37 | | .38 | | .35 | | .21 | | .28 |
| Net realized and unrealized gain (loss) | | 1.30 | | 2.69 | | (4.33) | | 2.71 | | 3.09 | | 3.42 |
| Total from investment operations | | 1.47 | | 3.06 | | (3.95) | | 3.06 | | 3.30 | | 3.70 |
| Distributions from net investment income | | (.01) | | (.37) | | (.37) | | (.34) | | (.22) | | (.29) |
| Distributions from net realized gain | | (.21) | | - | | (1.34) | | (.34) | | (.27) | | (.97) |
| Total distributions | | (.22) | | (.37) | | (1.71) | | (.68) | | (.50) C | | (1.26) |
| Net asset value, end of period | $ | 22.66 | $ | 21.41 | $ | 18.72 | $ | 24.38 | $ | 22.00 | $ | 19.20 |
Total Return D,E,F | | | | 16.37% | | (16.88)% | | 13.96% | | 17.27% | | 22.83% |
Ratios to Average Net Assets B,G,H | | | | | | | | | | | | |
| Expenses before reductions | | .63% I | | .67% | | .67% | | .67% | | .67% | | .68% |
| Expenses net of fee waivers, if any | | | | .66% | | .67% | | .66% | | .67% | | .68% |
| Expenses net of all reductions | | .62% I | | .66% | | .67% | | .66% | | .67% | | .68% |
| Net investment income (loss) | | 1.52% I | | 1.84% | | 1.88% | | 1.46% | | 1.12% | | 1.58% |
| Supplemental Data | | | | | | | | | | | | |
| Net assets, end of period (000 omitted) | $ | 89,657 | $ | 88,440 | $ | 85,620 | $ | 111,781 | $ | 106,148 | $ | 99,971 |
Portfolio turnover rate J | | | | 25% | | 26% | | 25% | | 23% | | 35% |
ACalculated based on average shares outstanding during the period.
BNet investment income (loss) is affected by the timing of the declaration of dividends by any underlying mutual funds or exchange-traded funds (ETFs). Net investment income (loss) of any mutual funds or ETFs is not included in the Fund's net investment income (loss) ratio.
CTotal distributions per share do not sum due to rounding.
DTotal returns for periods of less than one year are not annualized.
ETotal returns do not reflect charges attributable to your insurance company's separate account. Inclusion of these charges would reduce the total returns shown.
FTotal returns would have been lower if certain expenses had not been reduced during the applicable periods shown.
GFees and expenses of any underlying mutual funds or exchange-traded funds (ETFs) are not included in the Fund's expense ratio. The Fund indirectly bears its proportionate share of these expenses. For additional expense information related to investments in Fidelity Central Funds, please refer to the "Investments in Fidelity Central Funds" note found in the Notes to Financial Statements section of the most recent Annual or Semi-Annual report.
HExpense ratios reflect operating expenses of the class. Expenses before reductions do not reflect amounts reimbursed, waived, or reduced through arrangements with the investment adviser, brokerage services, or other offset arrangements, if applicable, and do not represent the amount paid by the class during periods when reimbursements, waivers or reductions occur.
IAnnualized.
JAmount does not include the portfolio activity of any underlying mutual funds or exchange-traded funds (ETFs).
VIP Asset Manager: Growth Portfolio Service Class |
| |
| | Six months ended (Unaudited) June 30, 2024 | | Years ended December 31, 2023 | | 2022 | | 2021 | | 2020 | | 2019 |
Selected Per-Share Data | | | | | | | | | | | | |
| Net asset value, beginning of period | $ | 21.19 | $ | 18.54 | $ | 24.16 | $ | 21.80 | $ | 19.04 | $ | 16.63 |
| Income from Investment Operations | | | | | | | | | | | | |
Net investment income (loss) A,B | | .15 | | .35 | | .35 | | .32 | | .19 | | .26 |
| Net realized and unrealized gain (loss) | | 1.29 | | 2.65 | | (4.28) | | 2.70 | | 3.05 | | 3.39 |
| Total from investment operations | | 1.44 | | 3.00 | | (3.93) | | 3.02 | | 3.24 | | 3.65 |
| Distributions from net investment income | | (.01) | | (.35) | | (.35) | | (.32) | | (.20) | | (.27) |
| Distributions from net realized gain | | (.21) | | - | | (1.34) | | (.34) | | (.27) | | (.97) |
| Total distributions | | (.22) | | (.35) | | (1.69) | | (.66) | | (.48) C | | (1.24) |
| Net asset value, end of period | $ | 22.41 | $ | 21.19 | $ | 18.54 | $ | 24.16 | $ | 21.80 | $ | 19.04 |
Total Return D,E,F | | | | 16.21% | | (16.95)% | | 13.89% | | 17.09% | | 22.72% |
Ratios to Average Net Assets B,G,H | | | | | | | | | | | | |
| Expenses before reductions | | .74% I | | .77% | | .77% | | .77% | | .77% | | .78% |
| Expenses net of fee waivers, if any | | | | .76% | | .77% | | .76% | | .77% | | .78% |
| Expenses net of all reductions | | .73% I | | .76% | | .77% | | .76% | | .77% | | .78% |
| Net investment income (loss) | | 1.42% I | | 1.74% | | 1.78% | | 1.36% | | 1.02% | | 1.48% |
| Supplemental Data | | | | | | | | | | | | |
| Net assets, end of period (000 omitted) | $ | 3,806 | $ | 3,618 | $ | 2,883 | $ | 3,609 | $ | 3,363 | $ | 3,009 |
Portfolio turnover rate J | | | | 25% | | 26% | | 25% | | 23% | | 35% |
ACalculated based on average shares outstanding during the period.
BNet investment income (loss) is affected by the timing of the declaration of dividends by any underlying mutual funds or exchange-traded funds (ETFs). Net investment income (loss) of any mutual funds or ETFs is not included in the Fund's net investment income (loss) ratio.
CTotal distributions per share do not sum due to rounding.
DTotal returns for periods of less than one year are not annualized.
ETotal returns do not reflect charges attributable to your insurance company's separate account. Inclusion of these charges would reduce the total returns shown.
FTotal returns would have been lower if certain expenses had not been reduced during the applicable periods shown.
GFees and expenses of any underlying mutual funds or exchange-traded funds (ETFs) are not included in the Fund's expense ratio. The Fund indirectly bears its proportionate share of these expenses. For additional expense information related to investments in Fidelity Central Funds, please refer to the "Investments in Fidelity Central Funds" note found in the Notes to Financial Statements section of the most recent Annual or Semi-Annual report.
HExpense ratios reflect operating expenses of the class. Expenses before reductions do not reflect amounts reimbursed, waived, or reduced through arrangements with the investment adviser, brokerage services, or other offset arrangements, if applicable, and do not represent the amount paid by the class during periods when reimbursements, waivers or reductions occur.
IAnnualized.
JAmount does not include the portfolio activity of any underlying mutual funds or exchange-traded funds (ETFs).
VIP Asset Manager: Growth Portfolio Service Class 2 |
| |
| | Six months ended (Unaudited) June 30, 2024 | | Years ended December 31, 2023 | | 2022 | | 2021 | | 2020 | | 2019 |
Selected Per-Share Data | | | | | | | | | | | | |
| Net asset value, beginning of period | $ | 20.99 | $ | 18.39 | $ | 23.98 | $ | 21.65 | $ | 18.91 | $ | 16.53 |
| Income from Investment Operations | | | | | | | | | | | | |
Net investment income (loss) A,B | | .13 | | .31 | | .32 | | .28 | | .16 | | .24 |
| Net realized and unrealized gain (loss) | | 1.28 | | 2.64 | | (4.24) | | 2.67 | | 3.03 | | 3.36 |
| Total from investment operations | | 1.41 | | 2.95 | | (3.92) | | 2.95 | | 3.19 | | 3.60 |
| Distributions from net investment income | | (.01) | | (.35) | | (.33) | | (.29) | | (.17) | | (.24) |
| Distributions from net realized gain | | (.21) | | - | | (1.34) | | (.34) | | (.27) | | (.97) |
| Total distributions | | (.22) | | (.35) | | (1.67) | | (.62) C | | (.45) C | | (1.22) C |
| Net asset value, end of period | $ | 22.18 | $ | 20.99 | $ | 18.39 | $ | 23.98 | $ | 21.65 | $ | 18.91 |
Total Return D,E,F | | | | 16.05% | | (17.05)% | | 13.69% | | 16.95% | | 22.49% |
Ratios to Average Net Assets B,G,H | | | | | | | | | | | | |
| Expenses before reductions | | .91% I | | .92% | | .92% | | .92% | | .92% | | .93% |
| Expenses net of fee waivers, if any | | | | .91% | | .92% | | .91% | | .92% | | .93% |
| Expenses net of all reductions | | .90% I | | .91% | | .92% | | .91% | | .92% | | .93% |
| Net investment income (loss) | | 1.25% I | | 1.59% | | 1.63% | | 1.21% | | .87% | | 1.33% |
| Supplemental Data | | | | | | | | | | | | |
| Net assets, end of period (000 omitted) | $ | 23,109 | $ | 14,839 | $ | 4,015 | $ | 3,948 | $ | 3,359 | $ | 3,199 |
Portfolio turnover rate J | | | | 25% | | 26% | | 25% | | 23% | | 35% |
ACalculated based on average shares outstanding during the period.
BNet investment income (loss) is affected by the timing of the declaration of dividends by any underlying mutual funds or exchange-traded funds (ETFs). Net investment income (loss) of any mutual funds or ETFs is not included in the Fund's net investment income (loss) ratio.
CTotal distributions per share do not sum due to rounding.
DTotal returns for periods of less than one year are not annualized.
ETotal returns do not reflect charges attributable to your insurance company's separate account. Inclusion of these charges would reduce the total returns shown.
FTotal returns would have been lower if certain expenses had not been reduced during the applicable periods shown.
GFees and expenses of any underlying mutual funds or exchange-traded funds (ETFs) are not included in the Fund's expense ratio. The Fund indirectly bears its proportionate share of these expenses. For additional expense information related to investments in Fidelity Central Funds, please refer to the "Investments in Fidelity Central Funds" note found in the Notes to Financial Statements section of the most recent Annual or Semi-Annual report.
HExpense ratios reflect operating expenses of the class. Expenses before reductions do not reflect amounts reimbursed, waived, or reduced through arrangements with the investment adviser, brokerage services, or other offset arrangements, if applicable, and do not represent the amount paid by the class during periods when reimbursements, waivers or reductions occur.
IAnnualized.
JAmount does not include the portfolio activity of any underlying mutual funds or exchange-traded funds (ETFs).
VIP Asset Manager: Growth Portfolio Investor Class |
| |
| | Six months ended (Unaudited) June 30, 2024 | | Years ended December 31, 2023 | | 2022 | | 2021 | | 2020 | | 2019 |
Selected Per-Share Data | | | | | | | | | | | | |
| Net asset value, beginning of period | $ | 21.24 | $ | 18.58 | $ | 24.21 | $ | 21.85 | $ | 19.07 | $ | 16.66 |
| Income from Investment Operations | | | | | | | | | | | | |
Net investment income (loss) A,B | | .16 | | .35 | | .36 | | .33 | | .20 | | .27 |
| Net realized and unrealized gain (loss) | | 1.29 | | 2.67 | | (4.29) | | 2.69 | | 3.06 | | 3.39 |
| Total from investment operations | | 1.45 | | 3.02 | | (3.93) | | 3.02 | | 3.26 | | 3.66 |
| Distributions from net investment income | | (.01) | | (.36) | | (.36) | | (.33) | | (.21) | | (.28) |
| Distributions from net realized gain | | (.21) | | - | | (1.34) | | (.34) | | (.27) | | (.97) |
| Total distributions | | (.22) | | (.36) | | (1.70) | | (.66) C | | (.48) | | (1.25) |
| Net asset value, end of period | $ | 22.47 | $ | 21.24 | $ | 18.58 | $ | 24.21 | $ | 21.85 | $ | 19.07 |
Total Return D,E,F | | | | 16.25% | | (16.93)% | | 13.89% | | 17.19% | | 22.70% |
Ratios to Average Net Assets B,G,H | | | | | | | | | | | | |
| Expenses before reductions | | .72% I | | .75% | | .75% | | .74% | | .75% | | .76% |
| Expenses net of fee waivers, if any | | | | .74% | | .74% | | .74% | | .75% | | .76% |
| Expenses net of all reductions | | .70% I | | .74% | | .74% | | .74% | | .75% | | .76% |
| Net investment income (loss) | | 1.44% I | | 1.76% | | 1.80% | | 1.38% | | 1.04% | | 1.50% |
| Supplemental Data | | | | | | | | | | | | |
| Net assets, end of period (000 omitted) | $ | 148,453 | $ | 137,920 | $ | 126,658 | $ | 154,034 | $ | 132,407 | $ | 121,229 |
Portfolio turnover rate J | | | | 25% | | 26% | | 25% | | 23% | | 35% |
ACalculated based on average shares outstanding during the period.
BNet investment income (loss) is affected by the timing of the declaration of dividends by any underlying mutual funds or exchange-traded funds (ETFs). Net investment income (loss) of any mutual funds or ETFs is not included in the Fund's net investment income (loss) ratio.
CTotal distributions per share do not sum due to rounding.
DTotal returns for periods of less than one year are not annualized.
ETotal returns do not reflect charges attributable to your insurance company's separate account. Inclusion of these charges would reduce the total returns shown.
FTotal returns would have been lower if certain expenses had not been reduced during the applicable periods shown.
GFees and expenses of any underlying mutual funds or exchange-traded funds (ETFs) are not included in the Fund's expense ratio. The Fund indirectly bears its proportionate share of these expenses. For additional expense information related to investments in Fidelity Central Funds, please refer to the "Investments in Fidelity Central Funds" note found in the Notes to Financial Statements section of the most recent Annual or Semi-Annual report.
HExpense ratios reflect operating expenses of the class. Expenses before reductions do not reflect amounts reimbursed, waived, or reduced through arrangements with the investment adviser, brokerage services, or other offset arrangements, if applicable, and do not represent the amount paid by the class during periods when reimbursements, waivers or reductions occur.
IAnnualized.
JAmount does not include the portfolio activity of any underlying mutual funds or exchange-traded funds (ETFs).
Notes to Financial Statements
(Unaudited)For the period ended June 30, 2024
1. Organization.
VIP Asset Manager: Growth Portfolio (the Fund) is a fund of Variable Insurance Products Fund V (the Trust) and is authorized to issue an unlimited number of shares. The Trust is registered under the Investment Company Act of 1940, as amended (the 1940 Act), as an open-end management investment company organized as a Massachusetts business trust. Shares of the Fund may only be purchased by insurance companies for the purpose of funding variable annuity or variable life insurance contracts. The Fund offers the following classes of shares: Initial Class shares, Service Class shares, Service Class 2 shares and Investor Class shares. All classes have equal rights and voting privileges, except for matters affecting a single class.
2. Investments in Fidelity Central Funds.
Funds may invest in Fidelity Central Funds, which are open-end investment companies generally available only to other investment companies and accounts managed by the investment adviser and its affiliates. The Schedule of Investments lists any Fidelity Central Funds held as an investment as of period end, but does not include the underlying holdings of each Fidelity Central Fund. An investing fund indirectly bears its proportionate share of the expenses of the underlying Fidelity Central Funds.
Based on its investment objective, each Fidelity Central Fund may invest or participate in various investment vehicles or strategies that are similar to those of the investing fund. These strategies are consistent with the investment objectives of the investing fund and may involve certain economic risks which may cause a decline in value of each of the Fidelity Central Funds and thus a decline in the value of the investing fund.
| Fidelity Central Fund | Investment Manager | Investment Objective | Investment Practices | Expense RatioA |
| Fidelity Commodity Strategy Central Fund | Geode Capital Management, LLC (Geode) | Seeks to provide investment returns that correspond to the performance of the commodities market. | Investment in commodity-related investments through a wholly-owned subsidiary organized under the laws of the Cayman Islands Futures | .01% |
| Fidelity Emerging Markets Debt Central Fund | Fidelity Management & Research Company LLC (FMR) | Seeks high total return by normally investing in debt securities of issuers in emerging markets and other debt investments that are tied economically to emerging markets. | Foreign Securities Restricted Securities Futures Delayed Delivery & When Issued Securities | .02% |
| Fidelity Emerging Markets Equity Central Fund | Fidelity Management & Research Company LLC (FMR) | Seeks capital appreciation by investing primarily in equity securities of issuers in emerging markets. | Foreign Securities Futures | .02% |
| Fidelity International Equity Central Fund | Fidelity Management & Research Company LLC (FMR) | Seeks capital appreciation by investing primarily in non-U.S. based common stocks, including securities of issuers located in emerging markets. | Foreign Securities | .01% |
| Fidelity Floating Rate Central Fund | Fidelity Management & Research Company LLC (FMR) | Seeks a high level of income by normally investing in floating rate loans and other floating rate securities. | Restricted Securities Loans & Direct Debt Instruments | .01% |
| Fidelity High Income Central Fund | Fidelity Management & Research Company LLC (FMR) | Seeks a high level of income and may also seek capital appreciation by investing primarily in debt securities, preferred stocks, and convertible securities, with an emphasis on lower-quality debt securities. | Loans & Direct Debt Instruments Restricted Securities Delayed Delivery & When Issued Securities | Less than .005% |
| Fidelity Inflation-Protected Bond Index Central Fund | Fidelity Management & Research Company LLC (FMR) | Seeks to provide investment results that correspond to the performance of the inflation-protected United States Treasury market, and may invest in derivatives. | | Less than .005% |
| Fidelity VIP Investment Grade Central Fund | Fidelity Management & Research Company LLC (FMR) | Seeks a high level of current income by normally investing in investment-grade debt securities and repurchase agreements. | Delayed Delivery & When Issued Securities Restricted Securities | Less than .005% |
| Fidelity Real Estate Equity Central Fund | Fidelity Management & Research Company LLC (FMR) | Seeks above-average income and long-term capital growth by investing primarily in equity securities of issuers in the real estate industry. | | Less than .005% |
| Fidelity International Credit Central Fund | Fidelity Management & Research Company LLC (FMR) | Seeks a high level of current income by normally investing in debt securities of foreign issuers, including debt securities of issuers located in emerging markets. Foreign currency exposure is hedged utilizing foreign currency contracts. | Foreign Securities Forward Foreign Currency Contracts Futures Restricted Securities Swaps Delayed Delivery & When Issued Securities | .01% |
| Fidelity U.S. Equity Central Fund | Fidelity Management & Research Company LLC (FMR) | Seeks capital appreciation by investing primarily in common stocks, allocated across different market sectors. | Foreign Securities Restricted Securities Futures | Less than .005% |
| Fidelity Emerging Markets Debt Local Currency Central Fund | Fidelity Management & Research Company LLC (FMR) | Seeks high total return by normally investing in debt securities of issuers in emerging markets and other debt investments that are tied economically to emerging markets and denominated in the local currency of the issuer. | Foreign Securities Restricted Securities | .02% |
| Fidelity Money Market Central Funds | Fidelity Management & Research Company LLC (FMR) | Each fund seeks to obtain a high level of current income consistent with the preservation of capital and liquidity. | Short-term Investments | Less than .005% |
A Expenses expressed as a percentage of average net assets and are as of each underlying Central Fund's most recent annual or semi-annual shareholder report.
An unaudited holdings listing for the investing fund, which presents direct holdings as well as the pro-rata share of any securities and other investments held indirectly through its investment in underlying non-money market Fidelity Central Funds, is available at fidelity.com and/or institutional.fidelity.com, as applicable. A complete unaudited list of holdings for each Fidelity Central Fund is available upon request or at the Securities and Exchange Commission website at www.sec.gov. In addition, the financial statements of the Fidelity Central Funds which contain the significant accounting policies (including investment valuation policies) of those funds, and are not covered by the Report of Independent Registered Public Accounting Firm, are available on the Securities and Exchange Commission website or upon request.
3. Significant Accounting Policies.
The Fund is an investment company and applies the accounting and reporting guidance of the Financial Accounting Standards Board (FASB) Accounting Standards Codification Topic 946 Financial Services - Investment Companies. The financial statements have been prepared in conformity with accounting principles generally accepted in the United States of America (GAAP), which require management to make certain estimates and assumptions at the date of the financial statements. Actual results could differ from those estimates. Subsequent events, if any, through the date that the financial statements were issued have been evaluated in the preparation of the financial statements. The Fund's Schedule of Investments lists any underlying mutual funds or exchange-traded funds (ETFs) but does not include the underlying holdings of these funds. The following summarizes the significant accounting policies of the Fund:
Investment Valuation. Investments are valued as of 4:00 p.m. Eastern time on the last calendar day of the period. The Board of Trustees (the Board) has designated the Fund's investment adviser as the valuation designee responsible for the fair valuation function and performing fair value determinations as needed. The investment adviser has established a Fair Value Committee (the Committee) to carry out the day-to-day fair valuation responsibilities and has adopted policies and procedures to govern the fair valuation process and the activities of the Committee. In accordance with these fair valuation policies and procedures, which have been approved by the Board, the Fund attempts to obtain prices from one or more third party pricing services or brokers to value its investments. When current market prices, quotations or currency exchange rates are not readily available or reliable, investments will be fair valued in good faith by the Committee, in accordance with the policies and procedures. Factors used in determining fair value vary by investment type and may include market or investment specific events, transaction data, estimated cash flows, and market observations of comparable investments. The frequency that the fair valuation procedures are used cannot be predicted and they may be utilized to a significant extent. The Committee manages the Fund's fair valuation practices and maintains the fair valuation policies and procedures. The Fund's investment adviser reports to the Board information regarding the fair valuation process and related material matters.
The Fund categorizes the inputs to valuation techniques used to value its investments into a disclosure hierarchy consisting of three levels as shown below:
Level 1 - unadjusted quoted prices in active markets for identical investments
Level 2 - other significant observable inputs (including quoted prices for similar investments, interest rates, prepayment speeds, etc.)
Level 3 - unobservable inputs (including the Fund's own assumptions based on the best information available)
Valuation techniques used to value the Fund's investments by major category are as follows:
Debt securities, including restricted securities, are valued based on evaluated prices received from third party pricing services or from brokers who make markets in such securities. U.S. government and government agency obligations are valued by pricing services who utilize matrix pricing which considers yield or price of bonds of comparable quality, coupon, maturity and type or by broker-supplied prices. When independent prices are unavailable or unreliable, debt securities may be valued utilizing pricing methodologies which consider similar factors that would be used by third party pricing services. Debt securities are generally categorized as Level 2 in the hierarchy but may be Level 3 depending on the circumstances.
Exchange-Traded Funds (ETFs) are valued at their last sale price or official closing price as reported by a third party pricing service on the primary market or exchange on which they are traded and are categorized as Level 1 in the hierarchy. In the event there were no sales during the day but the exchange reports a closing bid level, ETFs are valued at the closing bid and would be categorized as Level 1 in the hierarchy. In the event there was no closing bid, ETFs may be valued by another method that the Board believes reflects fair value in accordance with the Board's fair value pricing policies and may be categorized as Level 2 in the hierarchy.
Futures contracts are valued at the settlement price established each day by the board of trade or exchange on which they are traded and are categorized as Level 1 in the hierarchy. Investments in open-end mutual funds, including the Fidelity Central Funds, are valued at their closing net asset value (NAV) each business day and are categorized as Level 1 in the hierarchy.
Changes in valuation techniques may result in transfers in or out of an assigned level within the disclosure hierarchy. The aggregate value of investments by input level as of June 30, 2024 is included at the end of the Fund's Schedule of Investments.
Investment Transactions and Income. For financial reporting purposes, the Fund's investment holdings and NAV include trades executed through the end of the last business day of the period. The NAV per share for processing shareholder transactions is calculated as of the close of business of the New York Stock Exchange (NYSE), normally 4:00 p.m. Eastern time and includes trades executed through the end of the prior business day. Gains and losses on securities sold are determined on the basis of identified cost and include proceeds received from litigation. Commissions paid to certain brokers with whom the investment adviser, or its affiliates, places trades on behalf of a fund include an amount in addition to trade execution, which may be rebated back to a fund. Any such rebates are included in net realized gain (loss) on investments in the Statement of Operations. Dividend income is recorded on the ex-dividend date, except for certain dividends from foreign securities where the ex-dividend date may have passed, which are recorded as soon as the Fund is informed of the ex-dividend date. Non-cash dividends included in dividend income, if any, are recorded at the fair market value of the securities received. Income and capital gain distributions from Fidelity Central Funds, if any, are recorded on the ex-dividend date. Interest income is accrued as earned and includes coupon interest and amortization of premium and accretion of discount on debt securities as applicable.
Class Allocations and Expenses. Investment income, realized and unrealized capital gains and losses, common expenses of a fund, and certain fund-level expense reductions, if any, are allocated daily on a pro-rata basis to each class based on the relative net assets of each class to the total net assets of a fund. Each class differs with respect to transfer agent and distribution and service plan fees incurred, as applicable. Certain expense reductions may also differ by class, if applicable. For the reporting period, the allocated portion of income and expenses to each class as a percent of its average net assets may vary due to the timing of recording these transactions in relation to fluctuating net assets of the classes. Expenses directly attributable to a fund are charged to that fund. Expenses attributable to more than one fund are allocated among the respective funds on the basis of relative net assets or other appropriate methods. Expenses included in the accompanying financial statements reflect the expenses of that fund and do not include any expenses associated with any underlying mutual funds or exchange-traded funds (ETFs). Although not included in a fund's expenses, a fund indirectly bears its proportionate share of these expenses through the net asset value of each underlying mutual fund or exchange-traded fund (ETF). Expense estimates are accrued in the period to which they relate and adjustments are made when actual amounts are known.
Income Tax Information and Distributions to Shareholders. Each year, the Fund intends to qualify as a regulated investment company under Subchapter M of the Internal Revenue Code, including distributing substantially all of its taxable income and realized gains. As a result, no provision for U.S. Federal income taxes is required. The Fund files a U.S. federal tax return, in addition to state and local tax returns as required. The Fund's federal income tax returns are subject to examination by the Internal Revenue Service (IRS) for a period of three fiscal years after they are filed. State and local tax returns may be subject to examination for an additional fiscal year depending on the jurisdiction.
Distributions are declared and recorded on the ex-dividend date. Income and capital gain distributions are declared separately for each class. Income and capital gain distributions are determined in accordance with income tax regulations, which may differ from GAAP.
Capital accounts within the financial statements are adjusted for permanent book-tax differences. These adjustments have no impact on net assets or the results of operations. Capital accounts are not adjusted for temporary book-tax differences which will reverse in a subsequent period.
Book-tax differences are primarily due to futures contracts, foreign currency transactions, capital loss carryforwards and losses deferred due to wash sales.
As of period end, the cost and unrealized appreciation (depreciation) in securities, and derivatives if applicable, for federal income tax purposes were as follows:
| Gross unrealized appreciation | $74,290,738 |
| Gross unrealized depreciation | (4,765,353) |
| Net unrealized appreciation (depreciation) | $69,525,385 |
| Tax cost | $195,953,186 |
4. Derivative Instruments.
Risk Exposures and the Use of Derivative Instruments. The Fund's investment objectives allow for various types of derivative instruments, including futures contracts. Derivatives are investments whose value is primarily derived from underlying assets, indices or reference rates and may be transacted on an exchange or over-the-counter (OTC). Derivatives may involve a future commitment to buy or sell a specified asset based on specified terms, to exchange future cash flows at periodic intervals based on a notional principal amount, or for one party to make one or more payments upon the occurrence of specified events in exchange for periodic payments from the other party.
Derivatives were used to increase returns and to manage exposure to certain risks as defined below. The success of any strategy involving derivatives depends on analysis of numerous economic factors, and if the strategies for investment do not work as intended, the objectives may not be achieved.
Derivatives were used to increase or decrease exposure to the following risk(s):
| | |
| Equity Risk | Equity risk relates to the fluctuations in the value of financial instruments as a result of changes in market prices (other than those arising from interest rate risk or foreign exchange risk), whether caused by factors specific to an individual investment, its issuer, or all factors affecting all instruments traded in a market or market segment. |
Funds are also exposed to additional risks from investing in derivatives, such as liquidity risk and counterparty credit risk. Liquidity risk is the risk that a fund will be unable to close out the derivative in the open market in a timely manner. Counterparty credit risk is the risk that the counterparty will not be able to fulfill its obligation to a fund. Counterparty credit risk related to exchange-traded contracts may be mitigated by the protection provided by the exchange on which they trade.
Investing in derivatives may involve greater risks than investing in the underlying assets directly and, to varying degrees, may involve risk of loss in excess of any initial investment and collateral received and amounts recognized in the Statement of Assets and Liabilities. In addition, there may be the risk that the change in value of the derivative contract does not correspond to the change in value of the underlying instrument.
Futures Contracts. A futures contract is an agreement between two parties to buy or sell a specified underlying instrument for a fixed price at a specified future date. Futures contracts were used to manage exposure to the stock market.
Upon entering into a futures contract, a fund is required to deposit either cash or securities (initial margin) with a clearing broker in an amount equal to a certain percentage of the face value of the contract. Futures contracts are marked-to-market daily and subsequent daily payments are made or received by a fund depending on the daily fluctuations in the value of the futures contracts and are recorded as unrealized appreciation or (depreciation). This receivable and/or payable, if any, is included in daily variation margin on futures contracts in the Statement of Assets and Liabilities. Realized gain or (loss) is recorded upon the expiration or closing of a futures contract. The net realized gain (loss) and change in net unrealized appreciation (depreciation) on futures contracts during the period is presented in the Statement of Operations.
Any open futures contracts at period end are presented in the Schedule of Investments under the caption "Futures Contracts". The notional amount at value reflects each contract's exposure to the underlying instrument or index at period end, and is representative of volume of activity during the period unless an average notional amount is presented. Any securities deposited to meet initial margin requirements are identified in the Schedule of Investments. Any cash deposited to meet initial margin requirements is presented as segregated cash with brokers for derivative instruments in the Statement of Assets and Liabilities.
5. Purchases and Sales of Investments.
Purchases and sales of securities, other than short-term securities, U.S. government securities and in-kind transactions, as applicable, are noted in the table below.
| | Purchases ($) | Sales ($) |
| VIP Asset Manager: Growth Portfolio | 22,602,092 | 18,882,175 |
6. Fees and Other Transactions with Affiliates.
Management Fee. Fidelity Management & Research Company LLC (the investment adviser) and its affiliates provide the Fund with investment management related services for which the Fund pays a monthly management fee.
Effective March 1, 2024, the Fund's management contract was amended to incorporate administrative services previously covered under separate services agreements (Transfer Agent and Accounting agreements). The amended contract incorporates a management fee rate that may vary by class. The investment adviser or an affiliate pays certain expenses of managing and operating the Fund out of each class's management fee. Each class of the Fund pays a management fee to the investment adviser. The management fee is calculated and paid to the investment adviser every month. When determining a class's management fee, a mandate rate is calculated based on the monthly average net assets of a group of funds advised by FMR within a designated asset class. A discount rate is subtracted from the mandate rate once the Fund's monthly average net assets reach a certain level. The mandate rate and discount rate may vary by class. The annual management fee rate for a class of shares of the Fund is the lesser of (1) the class's mandate rate reduced by the class's discount rate (if applicable) or (2) the amount set forth in the following table.
| | Maximum Management Fee Rate % |
| Initial Class | .59 |
| Service Class | .59 |
| Service Class 2 | .59 |
| Investor Class | .67 |
One-twelfth of the management fee rate for a class is applied to the average net assets of the class for the month, giving a dollar amount which is the management fee for the class for that month. A different management fee rate may be applicable to each class of the Fund. The difference between classes is the result of separate arrangements for class-level services and/or waivers of certain expenses. It is not the result of any difference in advisory or custodial fees or other expenses related to the management of the Fund's assets, which do not vary by class. For the portion of the reporting period on or after March 1, 2024, the total annualized management fee rates were as follows:
| | Total Management Fee Rate % |
| Initial Class | .59 |
| Service Class | .59 |
| Service Class 2 | .59 |
| Investor Class | .67 |
Prior to March 1, 2024, the management fee was the sum of an individual fund fee rate that was based on an annual rate of .30% of the Fund's average net assets and an annualized group fee rate that averaged .22% during the period. The group fee rate was based upon the monthly average net assets of a group of registered investment companies with which the investment adviser has management contracts. The group fee rate decreased as assets under management increased and increased as assets under management decreased. For the portion of the reporting period prior to March 1, 2024, the total annualized management fee rate was .52%.
Effective March 1, 2024, the Fund's sub-advisory agreements with FMR Investment Management (UK) Limited, Fidelity Management & Research (Hong Kong) Limited, and Fidelity Management & Research (Japan) Limited were amended to provide that the investment adviser pays each sub-adviser monthly fees equal to 110% of the sub-adviser's costs for providing sub-advisory services.
Distribution and Service Plan Fees. In accordance with Rule 12b-1 of the 1940 Act, the Fund has adopted separate 12b-1 Plans for each Service Class of shares. Each Service Class pays Fidelity Distributors Company LLC (FDC), an affiliate of the investment adviser, a service fee. For the period, the service fee is based on an annual rate of .10% of Service Class' average net assets and .25% of Service Class 2's average net assets.
For the period, total fees, all of which were re-allowed to insurance companies for the distribution of shares and providing shareholder support services, were as follows:
| Service Class | $1,865 |
| Service Class 2 | 23,064 |
| | $24,929 |
Transfer Agent Fees. Fidelity Investments Institutional Operations Company LLC (FIIOC), an affiliate of the investment adviser, is the Fund's transfer, dividend disbursing, and shareholder servicing agent. Effective March 1, 2024, the Fund's management contract was amended to incorporate transfer agent services and associated fees previously covered under a separate services agreement.
During January 1, 2024 through February 29, 2024, the transfer agent fees for each class were a fixed annual rate of class-level average net assets as follows:
| | Amount ($) | % of Class-Level Average Net Assets |
| Initial Class | 9,278 | .0630 |
| Service Class | 382 | .0630 |
| Service Class 2 | 1,651 | .0630 |
| Investor Class | 32,343 | .1390 |
| | 43,654 | |
Accounting Fees. Fidelity Service Company, Inc. (FSC), an affiliate of the investment adviser, maintains the Fund's accounting records. Effective March 1, 2024, the Fund's management contract was amended to incorporate accounting services and associated fees previously covered under a separate services agreement.
During January 1, 2024 through February 29, 2024, the accounting fees were a fixed annual rate of average net assets as follows:
| | % of Average Net Assets |
| VIP Asset Manager: Growth Portfolio | .0472 |
Interfund Trades. Funds may purchase from or sell securities to other Fidelity Funds under procedures adopted by the Board. The procedures have been designed to ensure these interfund trades are executed in accordance with Rule 17a-7 of the 1940 Act. Any interfund trades are included within the respective purchases and sales amounts shown in the Purchases and Sales of Investments note. Interfund trades during the period are noted in the table below.
| | Purchases ($) | Sales ($) | Realized Gain (Loss)($) |
| VIP Asset Manager: Growth Portfolio | 67,200 | 7,464 | (105) |
7. Committed Line of Credit.
Certain Funds participate with other funds managed by the investment adviser or an affiliate in a $4.25 billion credit facility (the "line of credit") to be utilized for temporary or emergency purposes to fund shareholder redemptions or for other short-term liquidity purposes. The participating funds have agreed to pay commitment fees on their pro-rata portion of the line of credit, which are reflected in Miscellaneous expenses on the Statement of Operations, and are listed below. During the period, there were no borrowings on this line of credit.
| | Amount ($) |
| VIP Asset Manager: Growth Portfolio | 228 |
8. Security Lending.
Funds lend portfolio securities from time to time in order to earn additional income. Lending agents are used, including National Financial Services (NFS), an affiliate of the investment adviser. Pursuant to a securities lending agreement, NFS will receive a fee, which is capped at 9.9% of a fund's daily lending revenue, for its services as lending agent. A fund may lend securities to certain qualified borrowers, including NFS. On the settlement date of the loan, a fund receives collateral (in the form of U.S. Treasury obligations, letters of credit and/or cash) against the loaned securities and maintains collateral in an amount not less than 100% of the market value of the loaned securities during the period of the loan. The market value of the loaned securities is determined at the close of business of a fund and any additional required collateral is delivered to a fund on the next business day. A fund or borrower may terminate the loan at any time, and if the borrower defaults on its obligation to return the securities loaned because of insolvency or other reasons, a fund may apply collateral received from the borrower against the obligation. A fund may experience delays and costs in recovering the securities loaned. Any cash collateral received is invested in the Fidelity Securities Lending Cash Central Fund. Any loaned securities are identified as such in the Schedule of Investments, and the value of loaned securities and cash collateral at period end, as applicable, are presented in the Statement of Assets and Liabilities. Security lending income represents the income earned on investing cash collateral, less rebates paid to borrowers and any lending agent fees associated with the loan, plus any premium payments received for lending certain types of securities. Security lending income is presented in the Statement of Operations as a component of income from Fidelity Central Funds. Affiliated security lending activity, if any, was as follows:
| | Total Security Lending Fees Paid to NFS ($) | Security Lending Income From Securities Loaned to NFS ($) | Value of Securities Loaned to NFS at Period End ($) |
| VIP Asset Manager: Growth Portfolio | 258 | - | - |
9. Expense Reductions.
Effective November 1, 2023, the investment adviser has contractually agreed to waive the Fund's management fee with respect to the portion of the Fund's assets invested in certain affiliated ETFs. This waiver cannot be removed or modified without the approval of the Board. During the period this waiver reduced the Fund's management fee as follows:
| | Waiver ($) |
| VIP Asset Manager: Growth Portfolio | 2,402 |
Through arrangements with the Fund's custodian, credits realized as a result of certain uninvested cash balances were used to reduce the Fund's expenses. During the period, custodian credits reduced the Fund's expenses by $474.
In addition, during the period the investment adviser or an affiliate reimbursed and/or waived a portion of fund-level operating expenses in the amount of $11,023.
10. Distributions to Shareholders.
Distributions to shareholders of each class were as follows:
| | Six months ended June 30, 2024 | Year ended December 31, 2023 |
| VIP Asset Manager: Growth Portfolio | | |
| Distributions to shareholders | | |
| Initial Class | $909,041 | $1,523,262 |
| Service Class | 37,956 | 59,300 |
| Service Class 2 | 171,056 | 236,126 |
| Investor Class | 1,463,045 | 2,347,528 |
Total | $2,581,098 | $4,166,216 |
11. Share Transactions.
Transactions for each class of shares were as follows and may contain in-kind transactions:
| | Shares | Shares | Dollars | Dollars |
| | Six months ended June 30, 2024 | Year ended December 31, 2023 | Six months ended June 30, 2024 | Year ended December 31, 2023 |
| VIP Asset Manager: Growth Portfolio | | | | |
| Initial Class | | | | |
| Shares sold | 42,250 | 89,121 | $923,951 | $1,783,560 |
| Reinvestment of distributions | 42,066 | 71,296 | 909,041 | 1,523,262 |
| Shares redeemed | (258,366) | (602,856) | (5,684,729) | (12,111,528) |
| Net increase (decrease) | (174,050) | (442,439) | $(3,851,737) | $(8,804,706) |
| Service Class | | | | |
| Shares sold | 2,892 | 25,260 | $62,877 | $490,035 |
| Reinvestment of distributions | 1,774 | 2,803 | 37,956 | 59,300 |
| Shares redeemed | (5,602) | (12,879) | (123,098) | (253,691) |
| Net increase (decrease) | (936) | 15,184 | $(22,265) | $295,644 |
| Service Class 2 | | | | |
| Shares sold | 342,144 | 508,123 | $7,393,577 | $10,104,265 |
| Reinvestment of distributions | 8,076 | 11,243 | 171,056 | 236,126 |
| Shares redeemed | (15,347) | (30,785) | (329,828) | (612,138) |
| Net increase (decrease) | 334,873 | 488,581 | $7,234,805 | $9,728,253 |
| Investor Class | | | | |
| Shares sold | 337,904 | 493,977 | $7,409,716 | $10,045,580 |
| Reinvestment of distributions | 68,239 | 110,735 | 1,463,046 | 2,347,528 |
| Shares redeemed | (292,485) | (929,205) | (6,409,637) | (18,880,278) |
| Net increase (decrease) | 113,658 | (324,493) | $2,463,125 | $(6,487,170) |
12. Other.
A fund's organizational documents provide former and current trustees and officers with a limited indemnification against liabilities arising in connection with the performance of their duties to the fund. In the normal course of business, a fund may also enter into contracts that provide general indemnifications. A fund's maximum exposure under these arrangements is unknown as this would be dependent on future claims that may be made against a fund. The risk of material loss from such claims is considered remote.
At the end of the period, the investment adviser or its affiliates were owners of record of more than 10% of the outstanding shares as follows:
| Fund | Affiliated % |
| VIP Asset Manager: Growth Portfolio | 81% |
13. Risk and Uncertainties.
Many factors affect a fund's performance. Developments that disrupt global economies and financial markets, such as pandemics, epidemics, outbreaks of infectious diseases, war, terrorism, and environmental disasters, may significantly affect a fund's investment performance. The effects of these developments to a fund will be impacted by the types of securities in which a fund invests, the financial condition, industry, economic sector, and geographic location of an issuer, and a fund's level of investment in the securities of that issuer. Significant concentrations in security types, issuers, industries, sectors, and geographic locations may magnify the factors that affect a fund's performance.
Item 8: Changes in and Disagreements with Accountants for Open-End Management Investment Companies
Note: This is not applicable for any fund included in this document.
Item 9: Proxy Disclosures for Open-End Management Investment Companies
Note: This is not applicable for any fund included in this document.
Item 10: Remuneration Paid to Directors, Officers, and others of Open-End Management Investment Companies
Note: This information is disclosed as part of the financial statements for each Fund as part of Item 7: Financial Statements and Financial Highlights for Open-End Management Investment companies.
Item 11: Statement Regarding Basis for Approval of Investment Advisory Contract
Board Approval of Investment Advisory Contracts
VIP Asset Manager: Growth Portfolio
At its January 2024 meeting, the Board of Trustees, including the Independent Trustees (together, the Board), approved an amended and restated management contract with Fidelity Management & Research Company LLC (FMR) (the Management Contract), and amended and restated sub-advisory agreements (the Sub-Advisory Contracts, and together with the Management Contract, the Advisory Contracts) for the fund, including the fund's sub-advisory agreements with FMR Investment Management (UK) Limited (FMR UK), Fidelity Management & Research (Hong Kong) Limited (FMR H.K.), and Fidelity Management & Research (Japan) Limited (FMR Japan). The Advisory Contracts will be effective March 1, 2024. The Board will consider the annual renewal of the fund's Advisory Contracts in September 2024, following its review of additional materials provided by FMR.
Management Contract. The Board approved the Management Contract, which implements a new fee structure combining the management fee, transfer agent fee (TA Fee), and pricing and bookkeeping fee (P&B Fee) of the fund and each class into a single class-level fee based on tiered schedules and subject to a maximum class-level rate (the Unified Fee). In exchange for the Unified Fee, the fund will receive investment advisory, management, administrative, transfer agent, pricing and bookkeeping services under a single agreement - the Management Contract.
In its consideration of the Management Contract over several meetings, the Board received, reviewed and discussed a comprehensive set of analyses regarding the Unified Fee including (i) the legal framework, (ii) design goals for the Unified Fee, (iii) calculation methodology for the Unified Fee and illustrative examples, (iv) annual and cumulative projected impacts under various scenarios, both in the aggregate and at the fund/class level, (v) explanations of schedules, rate levers and maximum rates and (vi) shareholder benefits and projected savings.
The Board considered that the maximum Unified Fee for each class of the fund would be no higher than the sum of (i) the lowest contractual management fee under the fund's existing management contract, which is the individual fund fee, if any, plus the lowest contractual marginal group fee rate and (ii) the TA and P&B Fee rates, which are fixed fee rates since December 1, 2023 (together, the "Unified Fee Cap"). The Board noted that, as a result of this Unified Fee Cap, the Unified Fee would be no greater than the fees previously authorized to be charged for the same services. The Board noted that certain expenses such as third-party expenses, Rule 12b-1 fees, and certain other miscellaneous expenses would be outside the scope of the Unified Fee and the calculation of such fees would not change as a result of the Unified Fee. The Board considered that, under the Management Contract, a different management fee rate will be applicable to each class of the fund. The Board noted that Fidelity has represented that the difference in expenses between classes is based on differences in class-specific expenses and not due to any difference in advisory or third-party custodial fees or other expenses related to the management of the fund's assets.
The Board considered that implementation of the Unified Fee, which includes the Unified Fee Cap, would cause all funds subject to a Unified Fee, including the fund, to experience an immediate reduction on contractual fee rates for services provided under the current management contracts. The Board considered that some funds would not experience lower fees as a result of existing fee caps. The Board further considered that, in addition to the contractual fee savings, the Unified Fee offers funds and their shareholders greater protection from future rate increases for services previously offered under separate agreements that are now covered by the Management Contract because such rate increases would require shareholder, as well as Board, approval.
Sub-Advisory Contracts. In connection with the Unified Fee changes, the Board considered the Sub-Advisory Contracts, which changed the arrangements for fees paid by FMR to the sub-advisers under the agreements. The Board noted that the agreements with FMR UK, FMR H.K., and FMR Japan were amended to provide that FMR will compensate each sub-adviser at a fee equal to 110% of the sub-adviser's costs incurred in providing services under the agreement. The Board considered that, under the Sub-Advisory Contracts, FMR, and not the fund, will continue to pay the sub-advisory fees to each applicable sub-adviser.
The Board considered that the approval of the fund's Advisory Contracts will not result in any changes in the investment process or strategies employed in the management of the fund's assets or the day-to-day management of the fund or the persons primarily responsible for such management. Further, the Board considered that the Management Contract would not change the obligations and services of FMR and its affiliates on behalf of the fund, and, in particular, there would be no change in the nature and level of advisory, management, administration, transfer agent, and pricing and bookkeeping services provided to the fund by FMR and its affiliates.
In connection with its consideration of future renewals of the fund's Advisory Contracts, the Board will consider: (i) the nature, extent and quality of services provided to the funds, including shareholder and administrative services and investment performance; (ii) the competitiveness of the management fee and total expenses for the fund; (iii) the costs of the services and profitability, including the revenues earned and the expenses incurred in conducting the business of developing, marketing, distributing, managing, administering, and servicing the fund and its shareholders, to the extent applicable; and (iv) whether there have been economies of scale in respect of the Fidelity funds, whether the Fidelity funds (including the fund) have appropriately benefited from any such economies of scale, and whether there is the potential for realization of any further economies.
Based on its evaluation of all of the conclusions noted above, and after considering all factors it believed relevant, the Board concluded that the fund's management fee structure is fair and reasonable, and that the fund's Advisory Contracts should be approved.
1.705700.126
VIPAMG-SANN-0824
Fidelity® Variable Insurance Products:
VIP Asset Manager Portfolio
Semi-Annual Report
June 30, 2024
Contents
To view a fund's proxy voting guidelines and proxy voting record for the 12-month period ended June 30, visit http://www.fidelity.com/proxyvotingresults or visit the Securities and Exchange Commission's (SEC) web site at http://www.sec.gov.
You may also call 1-877-208-0098 to request a free copy of the proxy voting guidelines.
Fidelity® Variable Insurance Products are separate account options which are purchased through a variable insurance contract.
Standard & Poor's, S&P and S&P 500 are registered service marks of The McGraw-Hill Companies, Inc. and have been licensed for use by Fidelity Distributors Corporation.
Other third-party marks appearing herein are the property of their respective owners.
All other marks appearing herein are registered or unregistered trademarks or service marks of FMR LLC or an affiliated company. © 2024 FMR LLC. All rights reserved.
This report and the financial statements contained herein are submitted for the general information of the shareholders of the Fund. This report is not authorized for distribution to prospective investors in the Fund unless preceded or accompanied by an effective prospectus.
A fund files its complete schedule of portfolio holdings with the SEC for the first and third quarters of each fiscal year on Form N-PORT. Forms N-PORT are available on the SEC's web site at http://www.sec.gov. A fund's Forms N-PORT may be reviewed and copied at the SEC's Public Reference Room in Washington, DC. Information regarding the operation of the SEC's Public Reference Room may be obtained by calling 1-800-SEC-0330.
For a complete list of a fund's portfolio holdings, view the most recent holdings listing, semiannual report, or annual report on Fidelity's web site at http://www.fidelity.com, http://www.institutional.fidelity.com, or http://www.401k.com, as applicable.
NOT FDIC INSURED •MAY LOSE VALUE •NO BANK GUARANTEE
Neither the Fund nor Fidelity Distributors Corporation is a bank.
Item 7: Financial Statements and Financial Highlights for Open-End Management Investment Companies (Semi-Annual Report)
VIP Asset Manager Portfolio
Schedule of Investments June 30, 2024 (Unaudited)
Showing Percentage of Net Assets
| U.S. Treasury Obligations - 0.2% |
| | | Principal Amount (a) | Value ($) |
U.S. Treasury Bills, yield at date of purchase 5.3% to 5.33% 7/25/24 to 9/19/24 (b) (Cost $2,248,415) | | 2,270,000 | 2,248,479 |
| | | | |
| Fixed-Income Funds - 38.8% |
| | | Shares | Value ($) |
| Fidelity Emerging Markets Debt Local Currency Central Fund (c) | | 80,265 | 6,914,062 |
| Fidelity Floating Rate Central Fund (c) | | 94,504 | 9,258,542 |
| Fidelity High Income Central Fund (c) | | 65,969 | 6,887,805 |
| Fidelity Inflation-Protected Bond Index Central Fund (c) | | 102,726 | 9,183,700 |
| Fidelity International Credit Central Fund (c) | | 28,665 | 2,314,107 |
| iShares 20+ Year Treasury Bond ETF | | 51,874 | 4,760,996 |
| VIP Investment Grade Central Fund (c) | | 3,509,784 | 321,285,616 |
| TOTAL FIXED-INCOME FUNDS (Cost $396,000,569) | | | 360,604,828 |
| | | | |
| Money Market Funds - 0.4% |
| | | Shares | Value ($) |
| Fidelity Cash Central Fund 5.38% (d) | | 2,840,375 | 2,840,943 |
| Fidelity Securities Lending Cash Central Fund 5.38% (d)(e) | | 989,901 | 990,000 |
| TOTAL MONEY MARKET FUNDS (Cost $3,830,943) | | | 3,830,943 |
| | | | |
| Equity Funds - 60.7% |
| | | Shares | Value ($) |
| Domestic Equity Funds - 37.6% | | | |
| Fidelity Commodity Strategy Central Fund (c) | | 43,340 | 4,025,878 |
| Fidelity Hedged Equity ETF (f) | | 461,532 | 11,940,156 |
| Fidelity Real Estate Equity Central Fund (c) | | 29,135 | 3,695,199 |
| Fidelity U.S. Equity Central Fund (c) | | 2,413,032 | 329,909,762 |
TOTAL DOMESTIC EQUITY FUNDS | | | 349,570,995 |
| International Equity Funds - 22.5% | | | |
| Fidelity Emerging Markets Equity Central Fund (c) | | 282,771 | 61,759,992 |
| Fidelity International Equity Central Fund (c) | | 1,405,583 | 147,642,421 |
TOTAL INTERNATIONAL EQUITY FUNDS | | | 209,402,413 |
| Mid-Cap Blend Funds - 0.2% | | | |
| Fidelity Enhanced Mid Cap ETF (f) | | 77,821 | 2,291,828 |
| Small Blend Funds - 0.4% | | | |
| iShares Russell 2000 ETF (g) | | 16,979 | 3,444,869 |
| TOTAL EQUITY FUNDS (Cost $337,594,736) | | | 564,710,105 |
| | | | |
| TOTAL INVESTMENT IN SECURITIES - 100.1% (Cost $739,674,663) | 931,394,355 |
NET OTHER ASSETS (LIABILITIES) - (0.1)% | (1,280,093) |
| NET ASSETS - 100.0% | 930,114,262 |
| | |
| Futures Contracts |
| | Number of contracts | Expiration Date | Notional Amount ($) | Value ($) | Unrealized Appreciation/ (Depreciation) ($) |
| Sold | | | | | |
| | | | | | |
| Equity Index Contracts | | | | | |
| CME E-mini S&P 500 Index Contracts (United States) | 128 | Sep 2024 | 35,337,600 | (113,413) | (113,413) |
| ICE MSCI EAFE Index Contracts (United States) | 153 | Sep 2024 | 17,925,480 | (113,804) | (113,804) |
| ICE MSCI Emerging Markets Index Contracts (United States) | 95 | Sep 2024 | 5,168,950 | (13,822) | (13,822) |
| | | | | | |
| TOTAL FUTURES CONTRACTS | | | | | (241,039) |
| The notional amount of futures sold as a percentage of Net Assets is 6.3% |
For the period, the average monthly notional amount at value for futures contracts in the aggregate was $55,795,205.
Security Type Abbreviations
Legend
| (a) | Amount is stated in United States dollars unless otherwise noted. |
| (b) | Security or a portion of the security was pledged to cover margin requirements for futures contracts. At period end, the value of securities pledged amounted to $2,248,479. |
| (c) | Affiliated fund that is generally available only to investment companies and other accounts managed by Fidelity Investments. A complete unaudited schedule of portfolio holdings for each Fidelity Central Fund is filed with the SEC for the first and third quarters of each fiscal year on Form N-PORT and is available upon request or at the SEC's website at www.sec.gov. An unaudited holdings listing for the Fund, which presents direct holdings as well as the pro-rata share of securities and other investments held indirectly through its investment in underlying non-money market Fidelity Central Funds, other than the Commodity Strategy Central Fund, is available at fidelity.com and/or institutional.fidelity.com, as applicable. In addition, each Fidelity Central Fund's financial statements are available on the SEC's website or upon request. |
| (d) | Affiliated fund that is generally available only to investment companies and other accounts managed by Fidelity Investments. The rate quoted is the annualized seven-day yield of the fund at period end. A complete unaudited listing of the fund's holdings as of its most recent quarter end is available upon request. In addition, each Fidelity Central Fund's financial statements are available on the SEC's website or upon request. |
| (e) | Investment made with cash collateral received from securities on loan. |
| (g) | Security or a portion of the security is on loan at period end. |
Affiliated Central Funds
Fiscal year to date information regarding the Fund's investments in Fidelity Central Funds, including the ownership percentage, is presented below.
| Affiliate | Value, beginning of period ($) | Purchases ($) | Sales Proceeds ($) | Dividend Income ($) | Realized Gain (loss) ($) | Change in Unrealized appreciation (depreciation) ($) | Value, end of period ($) | % ownership, end of period |
| Fidelity Cash Central Fund 5.38% | 3,439,685 | 47,695,778 | 48,294,544 | 190,132 | 24 | - | 2,840,943 | 0.0% |
| Fidelity Commodity Strategy Central Fund | 4,124,657 | 18,375 | 323,263 | - | (70,248) | 276,357 | 4,025,878 | 1.7% |
| Fidelity Emerging Markets Debt Central Fund | 1,050,159 | 41,294 | 1,089,122 | 17,141 | (139,144) | 136,813 | - | 0.0% |
| Fidelity Emerging Markets Debt Local Currency Central Fund | 7,984,931 | 109,411 | 796,624 | 109,410 | (127,556) | (256,100) | 6,914,062 | 2.7% |
| Fidelity Emerging Markets Equity Central Fund | 60,315,015 | 518,597 | 3,646,535 | 311,465 | (1,002,683) | 5,575,598 | 61,759,992 | 2.5% |
| Fidelity Floating Rate Central Fund | 12,136,294 | 501,770 | 3,319,931 | 464,487 | (54,698) | (4,893) | 9,258,542 | 0.6% |
| Fidelity Hedged Equity Central Fund | 11,893,358 | 3,587 | 12,974,737 | 3,586 | 2,008,475 | (930,683) | - | 0.0% |
| Fidelity High Income Central Fund | 4,764,215 | 2,555,780 | 432,218 | 220,540 | 1,878 | (1,850) | 6,887,805 | 0.5% |
| Fidelity Inflation-Protected Bond Index Central Fund | 15,853,274 | 80,729 | 6,861,163 | 29,073 | (837,496) | 948,356 | 9,183,700 | 2.2% |
| Fidelity International Credit Central Fund | 4,787,509 | 77,676 | 2,593,571 | 61,243 | (637,298) | 679,791 | 2,314,107 | 2.5% |
| Fidelity International Equity Central Fund | 143,796,973 | 2,626,487 | 9,073,908 | 2,110,617 | 841,517 | 9,451,352 | 147,642,421 | 2.7% |
| Fidelity Real Estate Equity Central Fund | 4,028,946 | 45,176 | 323,285 | 26,779 | 9,203 | (64,841) | 3,695,199 | 0.4% |
| Fidelity Securities Lending Cash Central Fund 5.38% | 1,042,200 | 51,438,968 | 51,491,168 | 2,501 | - | - | 990,000 | 0.0% |
| Fidelity U.S. Equity Central Fund | 315,950,019 | 2,813,500 | 21,112,076 | 1,611,902 | 2,403,736 | 29,854,583 | 329,909,762 | 1.7% |
| Fidelity VIP Investment Grade Central Fund | 333,042,057 | 22,577,171 | 26,735,417 | 6,709,908 | (418,377) | (7,179,818) | 321,285,616 | 10.8% |
| Total | 924,209,292 | 131,104,299 | 189,067,562 | 11,868,784 | 1,977,333 | 38,484,665 | 906,708,027 | |
| | | | | | | | | |
Amounts in the dividend income column in the above table include any capital gain distributions from underlying funds, which are presented in the corresponding line item in the Statement of Operations, if applicable.
Amounts in the dividend income column for Fidelity Securities Lending Cash Central Fund represents the income earned on investing cash collateral, less rebates paid to borrowers and any lending agent fees associated with the loan, plus any premium payments received for lending certain types of securities.
Amounts included in the purchases and sales proceeds columns may include in-kind transactions, if applicable.
Affiliated Underlying Funds
Fiscal year to date information regarding the Fund's investments in affiliated Underlying Funds is presented below. Exchanges between classes of the same affiliated Underlying Funds may occur. If an Underlying Funds changes its name, the name presented below is the name in effect at period end.
| Affiliate | Value, beginning of period ($) | Purchases ($) | Sales Proceeds ($) | Dividend Income ($) | Realized Gain (loss) ($) | Change in Unrealized appreciation (depreciation) ($) | Value, end of period ($) |
| Fidelity Enhanced Mid Cap ETF | - | 2,341,143 | - | 5,992 | - | (49,315) | 2,291,828 |
| Fidelity Hedged Equity ETF | - | 12,945,285 | 1,291,975 | 13,846 | (9,040) | 295,886 | 11,940,156 |
| Fidelity Low Volatility Factor ETF | 9,360,489 | - | 9,526,469 | - | 322,160 | (156,180) | - |
| | 9,360,489 | 15,286,428 | 10,818,444 | 19,838 | 313,120 | 90,391 | 14,231,984 |
Amounts in the dividend income column in the above table include any capital gain distributions from underlying funds, which are presented in the corresponding line item in the Statement of Operations, if applicable.
Amounts included in the purchases and sales proceeds columns may include in-kind transactions, if applicable.
Investment Valuation
The following is a summary of the inputs used, as of June 30, 2024, involving the Fund's assets and liabilities carried at fair value. The inputs or methodology used for valuing securities may not be an indication of the risk associated with investing in those securities. For more information on valuation inputs, and their aggregation into the levels used below, please refer to the Investment Valuation section in the accompanying Notes to Financial Statements.
| Valuation Inputs at Reporting Date: |
| Description | Total ($) | Level 1 ($) | Level 2 ($) | Level 3 ($) |
Investments in Securities: | | | | |
|
| U.S. Government and Government Agency Obligations | 2,248,479 | - | 2,248,479 | - |
|
| Fixed-Income Funds | 360,604,828 | 360,604,828 | - | - |
|
| Money Market Funds | 3,830,943 | 3,830,943 | - | - |
|
| Equity Funds | 564,710,105 | 564,710,105 | - | - |
| Total Investments in Securities: | 931,394,355 | 929,145,876 | 2,248,479 | - |
Derivative Instruments: Liabilities | | | | |
Futures Contracts | (241,039) | (241,039) | - | - |
| Total Liabilities | (241,039) | (241,039) | - | - |
| Total Derivative Instruments: | (241,039) | (241,039) | - | - |
Value of Derivative Instruments
The following table is a summary of the Fund's value of derivative instruments by primary risk exposure as of June 30, 2024. For additional information on derivative instruments, please refer to the Derivative Instruments section in the accompanying Notes to Financial Statements.
Primary Risk Exposure / Derivative Type | Value |
| Asset ($) | Liability ($) |
| Equity Risk | | |
Futures Contracts (a) | 0 | (241,039) |
| Total Equity Risk | 0 | (241,039) |
| Total Value of Derivatives | 0 | (241,039) |
(a)Reflects gross cumulative appreciation (depreciation) on futures contracts as presented in the Schedule of Investments. In the Statement of Assets and Liabilities, the period end daily variation margin is included in receivable or payable for daily variation margin on futures contracts, and the net cumulative appreciation (depreciation) is included in Total accumulated earnings (loss).
Financial Statements (Unaudited)
| Statement of Assets and Liabilities |
| | | | June 30, 2024 (Unaudited) |
| | | | | |
| Assets | | | | |
| Investment in securities, at value (including securities loaned of $973,872) - See accompanying schedule: | | | | |
Unaffiliated issuers (cost $10,810,891) | $ | 10,454,344 | | |
Fidelity Central Funds (cost $714,878,361) | | 906,708,027 | | |
Other affiliated issuers (cost $13,985,411) | | 14,231,984 | | |
| | | | | |
| | | | | |
| Total Investment in Securities (cost $739,674,663) | | | $ | 931,394,355 |
| Receivable for investments sold | | | | 609,159 |
| Receivable for fund shares sold | | | | 73,874 |
| Dividends receivable | | | | 6,026 |
| Distributions receivable from Fidelity Central Funds | | | | 18,268 |
| Receivable for daily variation margin on futures contracts | | | | 122,820 |
| Other receivables | | | | 2,900 |
Total assets | | | | 932,227,402 |
| Liabilities | | | | |
| Payable for fund shares redeemed | $ | 683,028 | | |
| Accrued management fee | | 400,558 | | |
| Distribution and service plan fees payable | | 3,795 | | |
| Other payables and accrued expenses | | 35,759 | | |
| Collateral on securities loaned | | 990,000 | | |
| Total liabilities | | | | 2,113,140 |
| Net Assets | | | $ | 930,114,262 |
| Net Assets consist of: | | | | |
| Paid in capital | | | $ | 732,566,335 |
| Total accumulated earnings (loss) | | | | 197,547,927 |
| Net Assets | | | $ | 930,114,262 |
| | | | | |
| Net Asset Value and Maximum Offering Price | | | | |
| Initial Class : | | | | |
Net Asset Value, offering price and redemption price per share ($687,731,003 ÷ 42,062,459 shares) | | | $ | 16.35 |
| Service Class : | | | | |
Net Asset Value, offering price and redemption price per share ($2,589,596 ÷ 160,251 shares) | | | $ | 16.16 |
| Service Class 2 : | | | | |
Net Asset Value, offering price and redemption price per share ($17,450,044 ÷ 1,103,938 shares) | | | $ | 15.81 |
| Investor Class : | | | | |
Net Asset Value, offering price and redemption price per share ($222,343,619 ÷ 13,722,336 shares) | | | $ | 16.20 |
| Statement of Operations |
| | | | Six months ended June 30, 2024 (Unaudited) |
| Investment Income | | | | |
| Dividends (including $19,838 earned from affiliated issuers) | | | $ | 142,873 |
| Interest | | | | 59,586 |
| Income from Fidelity Central Funds (including $2,501 from security lending) | | | | 11,868,784 |
| Total income | | | | 12,071,243 |
| Expenses | | | | |
| Management fee | $ | 2,359,133 | | |
| Transfer agent fees | | 126,927 | | |
| Distribution and service plan fees | | 22,160 | | |
| Accounting fees | | 63,279 | | |
| Custodian fees and expenses | | 8,674 | | |
| Independent trustees' fees and expenses | | 1,254 | | |
| Audit | | 30,343 | | |
| Legal | | 1,750 | | |
| Miscellaneous | | 23,313 | | |
| Total expenses before reductions | | 2,636,833 | | |
| Expense reductions | | (50,641) | | |
| Total expenses after reductions | | | | 2,586,192 |
| Net Investment income (loss) | | | | 9,485,051 |
| Realized and Unrealized Gain (Loss) | | | | |
| Net realized gain (loss) on: | | | | |
| Investment Securities: | | | | |
| Unaffiliated issuers | | (288,463) | | |
| Fidelity Central Funds | | 1,977,333 | | |
| Other affiliated issuers | | 313,120 | | |
| Foreign currency transactions | | 289 | | |
| Futures contracts | | (5,627,110) | | |
| Total net realized gain (loss) | | | | (3,624,831) |
| Change in net unrealized appreciation (depreciation) on: | | | | |
| Investment Securities: | | | | |
| Unaffiliated issuers | | (122,094) | | |
| Fidelity Central Funds | | 38,484,665 | | |
| Other affiliated issuers | | 90,391 | | |
| Assets and liabilities in foreign currencies | | (304) | | |
| Futures contracts | | 1,473,093 | | |
| Total change in net unrealized appreciation (depreciation) | | | | 39,925,751 |
| Net gain (loss) | | | | 36,300,920 |
| Net increase (decrease) in net assets resulting from operations | | | $ | 45,785,971 |
| Statement of Changes in Net Assets |
| |
| | Six months ended June 30, 2024 (Unaudited) | | Year ended December 31, 2023 |
| Increase (Decrease) in Net Assets | | | | |
| Operations | | | | |
| Net investment income (loss) | $ | 9,485,051 | $ | 20,868,255 |
| Net realized gain (loss) | | (3,624,831) | | 9,511,712 |
| Change in net unrealized appreciation (depreciation) | | 39,925,751 | | 83,217,057 |
| Net increase (decrease) in net assets resulting from operations | | 45,785,971 | | 113,597,024 |
| Distributions to shareholders | | (4,626,461) | | (31,471,834) |
| | | | | |
| Share transactions - net increase (decrease) | | (54,037,852) | | (69,316,930) |
| Total increase (decrease) in net assets | | (12,878,342) | | 12,808,260 |
| | | | | |
| Net Assets | | | | |
| Beginning of period | | 942,992,604 | | 930,184,344 |
| End of period | $ | 930,114,262 | $ | 942,992,604 |
| | | | | |
| | | | | |
Financial Highlights
VIP Asset Manager Portfolio Initial Class |
| |
| | Six months ended (Unaudited) June 30, 2024 | | Years ended December 31, 2023 | | 2022 | | 2021 | | 2020 | | 2019 |
Selected Per-Share Data | | | | | | | | | | | | |
| Net asset value, beginning of period | $ | 15.64 | $ | 14.32 | $ | 18.33 | $ | 17.04 | $ | 15.23 | $ | 13.68 |
| Income from Investment Operations | | | | | | | | | | | | |
Net investment income (loss) A,B | | .16 | | .34 | | .32 | | .29 | | .22 | | .27 |
| Net realized and unrealized gain (loss) | | .63 | | 1.50 | | (2.94) | | 1.40 | | 2.03 | | 2.16 |
| Total from investment operations | | .79 | | 1.84 | | (2.62) | | 1.69 | | 2.25 | | 2.43 |
| Distributions from net investment income | | (.01) | | (.36) | | (.32) | | (.30) | | (.24) | | (.27) |
| Distributions from net realized gain | | (.07) | | (.16) | | (1.07) | | (.10) | | (.21) | | (.61) |
| Total distributions | | (.08) | | (.52) | | (1.39) | | (.40) | | (.44) C | | (.88) |
| Net asset value, end of period | $ | 16.35 | $ | 15.64 | $ | 14.32 | $ | 18.33 | $ | 17.04 | $ | 15.23 |
Total Return D,E,F | | | | 12.94% | | (14.94)% | | 9.92% | | 14.87% | | 18.25% |
Ratios to Average Net Assets B,G,H | | | | | | | | | | | | |
| Expenses before reductions | | .54% I | | .59% | | .59% | | .59% | | .59% | | .60% |
| Expenses net of fee waivers, if any | | | | .58% | | .59% | | .58% | | .59% | | .60% |
| Expenses net of all reductions | | .53% I | | .58% | | .59% | | .58% | | .59% | | .60% |
| Net investment income (loss) | | 2.05% I | | 2.26% | | 2.08% | | 1.62% | | 1.41% | | 1.88% |
| Supplemental Data | | | | | | | | | | | | |
| Net assets, end of period (000 omitted) | $ | 687,731 | $ | 696,248 | $ | 688,649 | $ | 889,923 | $ | 889,473 | $ | 843,000 |
Portfolio turnover rate J | | | | 19% | | 29% | | 20% | | 20% | | 30% |
ACalculated based on average shares outstanding during the period.
BNet investment income (loss) is affected by the timing of the declaration of dividends by any underlying mutual funds or exchange-traded funds (ETFs). Net investment income (loss) of any mutual funds or ETFs is not included in the Fund's net investment income (loss) ratio.
CTotal distributions per share do not sum due to rounding.
DTotal returns for periods of less than one year are not annualized.
ETotal returns do not reflect charges attributable to your insurance company's separate account. Inclusion of these charges would reduce the total returns shown.
FTotal returns would have been lower if certain expenses had not been reduced during the applicable periods shown.
GFees and expenses of any underlying mutual funds or exchange-traded funds (ETFs) are not included in the Fund's expense ratio. The Fund indirectly bears its proportionate share of these expenses. For additional expense information related to investments in Fidelity Central Funds, please refer to the "Investments in Fidelity Central Funds" note found in the Notes to Financial Statements section of the most recent Annual or Semi-Annual report.
HExpense ratios reflect operating expenses of the class. Expenses before reductions do not reflect amounts reimbursed, waived, or reduced through arrangements with the investment adviser, brokerage services, or other offset arrangements, if applicable, and do not represent the amount paid by the class during periods when reimbursements, waivers or reductions occur.
IAnnualized.
JAmount does not include the portfolio activity of any underlying mutual funds or exchange-traded funds (ETFs).
VIP Asset Manager Portfolio Service Class |
| |
| | Six months ended (Unaudited) June 30, 2024 | | Years ended December 31, 2023 | | 2022 | | 2021 | | 2020 | | 2019 |
Selected Per-Share Data | | | | | | | | | | | | |
| Net asset value, beginning of period | $ | 15.47 | $ | 14.16 | $ | 18.14 | $ | 16.86 | $ | 15.08 | $ | 13.55 |
| Income from Investment Operations | | | | | | | | | | | | |
Net investment income (loss) A,B | | .15 | | .32 | | .30 | | .27 | | .20 | | .26 |
| Net realized and unrealized gain (loss) | | .62 | | 1.49 | | (2.91) | | 1.38 | | 2.01 | | 2.13 |
| Total from investment operations | | .77 | | 1.81 | | (2.61) | | 1.65 | | 2.21 | | 2.39 |
| Distributions from net investment income | | (.01) | | (.34) | | (.31) | | (.27) | | (.23) | | (.25) |
| Distributions from net realized gain | | (.07) | | (.16) | | (1.07) | | (.10) | | (.21) | | (.61) |
| Total distributions | | (.08) | | (.50) | | (1.37) C | | (.37) | | (.43) C | | (.86) |
| Net asset value, end of period | $ | 16.16 | $ | 15.47 | $ | 14.16 | $ | 18.14 | $ | 16.86 | $ | 15.08 |
Total Return D,E,F | | | | 12.90% | | (15.03)% | | 9.80% | | 14.74% | | 18.16% |
Ratios to Average Net Assets B,G,H | | | | | | | | | | | | |
| Expenses before reductions | | .64% I | | .69% | | .69% | | .69% | | .69% | | .70% |
| Expenses net of fee waivers, if any | | | | .68% | | .69% | | .69% | | .69% | | .70% |
| Expenses net of all reductions | | .63% I | | .68% | | .69% | | .69% | | .69% | | .70% |
| Net investment income (loss) | | 1.95% I | | 2.16% | | 1.98% | | 1.52% | | 1.31% | | 1.78% |
| Supplemental Data | | | | | | | | | | | | |
| Net assets, end of period (000 omitted) | $ | 2,590 | $ | 2,504 | $ | 2,480 | $ | 3,627 | $ | 5,108 | $ | 3,923 |
Portfolio turnover rate J | | | | 19% | | 29% | | 20% | | 20% | | 30% |
ACalculated based on average shares outstanding during the period.
BNet investment income (loss) is affected by the timing of the declaration of dividends by any underlying mutual funds or exchange-traded funds (ETFs). Net investment income (loss) of any mutual funds or ETFs is not included in the Fund's net investment income (loss) ratio.
CTotal distributions per share do not sum due to rounding.
DTotal returns for periods of less than one year are not annualized.
ETotal returns do not reflect charges attributable to your insurance company's separate account. Inclusion of these charges would reduce the total returns shown.
FTotal returns would have been lower if certain expenses had not been reduced during the applicable periods shown.
GFees and expenses of any underlying mutual funds or exchange-traded funds (ETFs) are not included in the Fund's expense ratio. The Fund indirectly bears its proportionate share of these expenses. For additional expense information related to investments in Fidelity Central Funds, please refer to the "Investments in Fidelity Central Funds" note found in the Notes to Financial Statements section of the most recent Annual or Semi-Annual report.
HExpense ratios reflect operating expenses of the class. Expenses before reductions do not reflect amounts reimbursed, waived, or reduced through arrangements with the investment adviser, brokerage services, or other offset arrangements, if applicable, and do not represent the amount paid by the class during periods when reimbursements, waivers or reductions occur.
IAnnualized.
JAmount does not include the portfolio activity of any underlying mutual funds or exchange-traded funds (ETFs).
VIP Asset Manager Portfolio Service Class 2 |
| |
| | Six months ended (Unaudited) June 30, 2024 | | Years ended December 31, 2023 | | 2022 | | 2021 | | 2020 | | 2019 |
Selected Per-Share Data | | | | | | | | | | | | |
| Net asset value, beginning of period | $ | 15.14 | $ | 13.88 | $ | 17.81 | $ | 16.56 | $ | 14.82 | $ | 13.33 |
| Income from Investment Operations | | | | | | | | | | | | |
Net investment income (loss) A,B | | .14 | | .29 | | .27 | | .24 | | .17 | | .23 |
| Net realized and unrealized gain (loss) | | .61 | | 1.45 | | (2.85) | | 1.36 | | 1.97 | | 2.11 |
| Total from investment operations | | .75 | | 1.74 | | (2.58) | | 1.60 | | 2.14 | | 2.34 |
| Distributions from net investment income | | (.01) | | (.32) | | (.28) | | (.25) | | (.20) | | (.23) |
| Distributions from net realized gain | | (.07) | | (.16) | | (1.07) | | (.10) | | (.21) | | (.61) |
| Total distributions | | (.08) | | (.48) | | (1.35) | | (.35) | | (.40) C | | (.85) C |
| Net asset value, end of period | $ | 15.81 | $ | 15.14 | $ | 13.88 | $ | 17.81 | $ | 16.56 | $ | 14.82 |
Total Return D,E,F | | | | 12.65% | | (15.15)% | | 9.68% | | 14.54% | | 18.01% |
Ratios to Average Net Assets B,G,H | | | | | | | | | | | | |
| Expenses before reductions | | .79% I | | .84% | | .84% | | .84% | | .84% | | .85% |
| Expenses net of fee waivers, if any | | | | .83% | | .84% | | .83% | | .84% | | .85% |
| Expenses net of all reductions | | .78% I | | .83% | | .84% | | .83% | | .84% | | .85% |
| Net investment income (loss) | | 1.80% I | | 2.01% | | 1.83% | | 1.37% | | 1.16% | | 1.63% |
| Supplemental Data | | | | | | | | | | | | |
| Net assets, end of period (000 omitted) | $ | 17,450 | $ | 16,471 | $ | 14,925 | $ | 20,038 | $ | 19,943 | $ | 19,343 |
Portfolio turnover rate J | | | | 19% | | 29% | | 20% | | 20% | | 30% |
ACalculated based on average shares outstanding during the period.
BNet investment income (loss) is affected by the timing of the declaration of dividends by any underlying mutual funds or exchange-traded funds (ETFs). Net investment income (loss) of any mutual funds or ETFs is not included in the Fund's net investment income (loss) ratio.
CTotal distributions per share do not sum due to rounding.
DTotal returns for periods of less than one year are not annualized.
ETotal returns do not reflect charges attributable to your insurance company's separate account. Inclusion of these charges would reduce the total returns shown.
FTotal returns would have been lower if certain expenses had not been reduced during the applicable periods shown.
GFees and expenses of any underlying mutual funds or exchange-traded funds (ETFs) are not included in the Fund's expense ratio. The Fund indirectly bears its proportionate share of these expenses. For additional expense information related to investments in Fidelity Central Funds, please refer to the "Investments in Fidelity Central Funds" note found in the Notes to Financial Statements section of the most recent Annual or Semi-Annual report.
HExpense ratios reflect operating expenses of the class. Expenses before reductions do not reflect amounts reimbursed, waived, or reduced through arrangements with the investment adviser, brokerage services, or other offset arrangements, if applicable, and do not represent the amount paid by the class during periods when reimbursements, waivers or reductions occur.
IAnnualized.
JAmount does not include the portfolio activity of any underlying mutual funds or exchange-traded funds (ETFs).
VIP Asset Manager Portfolio Investor Class |
| |
| | Six months ended (Unaudited) June 30, 2024 | | Years ended December 31, 2023 | | 2022 | | 2021 | | 2020 | | 2019 |
Selected Per-Share Data | | | | | | | | | | | | |
| Net asset value, beginning of period | $ | 15.51 | $ | 14.20 | $ | 18.19 | $ | 16.91 | $ | 15.12 | $ | 13.59 |
| Income from Investment Operations | | | | | | | | | | | | |
Net investment income (loss) A,B | | .16 | | .32 | | .31 | | .28 | | .20 | | .26 |
| Net realized and unrealized gain (loss) | | .61 | | 1.50 | | (2.92) | | 1.39 | | 2.02 | | 2.14 |
| Total from investment operations | | .77 | | 1.82 | | (2.61) | | 1.67 | | 2.22 | | 2.40 |
| Distributions from net investment income | | (.01) | | (.35) | | (.31) | | (.28) | | (.23) | | (.25) |
| Distributions from net realized gain | | (.07) | | (.16) | | (1.07) | | (.10) | | (.21) | | (.61) |
| Total distributions | | (.08) | | (.51) | | (1.38) | | (.39) C | | (.43) C | | (.87) C |
| Net asset value, end of period | $ | 16.20 | $ | 15.51 | $ | 14.20 | $ | 18.19 | $ | 16.91 | $ | 15.12 |
Total Return D,E,F | | | | 12.90% | | (15.00)% | | 9.85% | | 14.77% | | 18.14% |
Ratios to Average Net Assets B,G,H | | | | | | | | | | | | |
| Expenses before reductions | | .62% I | | .66% | | .66% | | .66% | | .67% | | .68% |
| Expenses net of fee waivers, if any | | | | .66% | | .66% | | .66% | | .67% | | .68% |
| Expenses net of all reductions | | .61% I | | .66% | | .66% | | .66% | | .67% | | .68% |
| Net investment income (loss) | | 1.98% I | | 2.18% | | 2.01% | | 1.55% | | 1.33% | | 1.80% |
| Supplemental Data | | | | | | | | | | | | |
| Net assets, end of period (000 omitted) | $ | 222,344 | $ | 227,770 | $ | 224,131 | $ | 285,912 | $ | 254,632 | $ | 229,330 |
Portfolio turnover rate J | | | | 19% | | 29% | | 20% | | 20% | | 30% |
ACalculated based on average shares outstanding during the period.
BNet investment income (loss) is affected by the timing of the declaration of dividends by any underlying mutual funds or exchange-traded funds (ETFs). Net investment income (loss) of any mutual funds or ETFs is not included in the Fund's net investment income (loss) ratio.
CTotal distributions per share do not sum due to rounding.
DTotal returns for periods of less than one year are not annualized.
ETotal returns do not reflect charges attributable to your insurance company's separate account. Inclusion of these charges would reduce the total returns shown.
FTotal returns would have been lower if certain expenses had not been reduced during the applicable periods shown.
GFees and expenses of any underlying mutual funds or exchange-traded funds (ETFs) are not included in the Fund's expense ratio. The Fund indirectly bears its proportionate share of these expenses. For additional expense information related to investments in Fidelity Central Funds, please refer to the "Investments in Fidelity Central Funds" note found in the Notes to Financial Statements section of the most recent Annual or Semi-Annual report.
HExpense ratios reflect operating expenses of the class. Expenses before reductions do not reflect amounts reimbursed, waived, or reduced through arrangements with the investment adviser, brokerage services, or other offset arrangements, if applicable, and do not represent the amount paid by the class during periods when reimbursements, waivers or reductions occur.
IAnnualized.
JAmount does not include the portfolio activity of any underlying mutual funds or exchange-traded funds (ETFs).
Notes to Financial Statements
(Unaudited)For the period ended June 30, 2024
1. Organization.
VIP Asset Manager Portfolio (the Fund) is a fund of Variable Insurance Products Fund V (the Trust) and is authorized to issue an unlimited number of shares. The Trust is registered under the Investment Company Act of 1940, as amended (the 1940 Act), as an open-end management investment company organized as a Massachusetts business trust. Shares of the Fund may only be purchased by insurance companies for the purpose of funding variable annuity or variable life insurance contracts. The Fund offers the following classes of shares: Initial Class shares, Service Class shares, Service Class 2 shares and Investor Class shares. All classes have equal rights and voting privileges, except for matters affecting a single class.
2. Investments in Fidelity Central Funds.
Funds may invest in Fidelity Central Funds, which are open-end investment companies generally available only to other investment companies and accounts managed by the investment adviser and its affiliates. The Schedule of Investments lists any Fidelity Central Funds held as an investment as of period end, but does not include the underlying holdings of each Fidelity Central Fund. An investing fund indirectly bears its proportionate share of the expenses of the underlying Fidelity Central Funds.
Based on its investment objective, each Fidelity Central Fund may invest or participate in various investment vehicles or strategies that are similar to those of the investing fund. These strategies are consistent with the investment objectives of the investing fund and may involve certain economic risks which may cause a decline in value of each of the Fidelity Central Funds and thus a decline in the value of the investing fund.
| Fidelity Central Fund | Investment Manager | Investment Objective | Investment Practices | Expense RatioA |
| Fidelity Commodity Strategy Central Fund | Geode Capital Management, LLC (Geode) | Seeks to provide investment returns that correspond to the performance of the commodities market. | Investment in commodity-related investments through a wholly-owned subsidiary organized under the laws of the Cayman Islands Futures | .01% |
| Fidelity Emerging Markets Equity Central Fund | Fidelity Management & Research Company LLC (FMR) | Seeks capital appreciation by investing primarily in equity securities of issuers in emerging markets. | Foreign Securities Futures | .02% |
| Fidelity International Equity Central Fund | Fidelity Management & Research Company LLC (FMR) | Seeks capital appreciation by investing primarily in non-U.S. based common stocks, including securities of issuers located in emerging markets. | Foreign Securities | .01% |
| Fidelity Floating Rate Central Fund | Fidelity Management & Research Company LLC (FMR) | Seeks a high level of income by normally investing in floating rate loans and other floating rate securities. | Loans & Direct Debt Instruments Restricted Securities | .01% |
| Fidelity High Income Central Fund | Fidelity Management & Research Company LLC (FMR) | Seeks a high level of income and may also seek capital appreciation by investing primarily in debt securities, preferred stocks, and convertible securities, with an emphasis on lower-quality debt securities. | Delayed Delivery & When Issued Securities Loans & Direct Debt Instruments Restricted Securities | Less than .005% |
| Fidelity Inflation-Protected Bond Index Central Fund | Fidelity Management & Research Company LLC (FMR) | Seeks to provide investment results that correspond to the performance of the inflation-protected United States Treasury market, and may invest in derivatives. | | Less than .005% |
| Fidelity VIP Investment Grade Central Fund | Fidelity Management & Research Company LLC (FMR) | Seeks a high level of current income by normally investing in investment-grade debt securities and repurchase agreements. | Delayed Delivery & When Issued Securities Restricted Securities | Less than .005% |
| Fidelity Real Estate Equity Central Fund | Fidelity Management & Research Company LLC (FMR) | Seeks above-average income and long-term capital growth by investing primarily in equity securities of issuers in the real estate industry. | | Less than .005% |
| Fidelity International Credit Central Fund | Fidelity Management & Research Company LLC (FMR) | Seeks a high level of current income by normally investing in debt securities of foreign issuers, including debt securities of issuers located in emerging markets. Foreign currency exposure is hedged utilizing foreign currency contracts. | Delayed Delivery & When Issued Securities Foreign Securities Forward Foreign Currency Contracts Futures Restricted Securities Swaps | .001% |
| Fidelity U.S. Equity Central Fund | Fidelity Management & Research Company LLC (FMR) | Seeks capital appreciation by investing primarily in common stocks, allocated across different market sectors. | Foreign Securities Futures Restricted Securities | Less than .005% |
| Fidelity Emerging Markets Debt Local Currency Central Fund | Fidelity Management & Research Company LLC (FMR) | Seeks high total return by normally investing in debt securities of issuers in emerging markets and other debt investments that are tied economically to emerging markets and denominated in the local currency of the issuer. | Foreign Securities Restricted Securities | .02% |
| Fidelity Money Market Central Funds | Fidelity Management & Research Company LLC (FMR) | Each fund seeks to obtain a high level of current income consistent with the preservation of capital and liquidity. | Short-term Investments | Less than .005% |
A Expenses expressed as a percentage of average net assets and are as of each underlying Central Fund's most recent annual or semi-annual shareholder report.
An unaudited holdings listing for the investing fund, which presents direct holdings as well as the pro-rata share of any securities and other investments held indirectly through its investment in underlying non-money market Fidelity Central Funds, is available at fidelity.com and/or institutional.fidelity.com, as applicable. A complete unaudited list of holdings for each Fidelity Central Fund is available upon request or at the Securities and Exchange Commission website at www.sec.gov. In addition, the financial statements of the Fidelity Central Funds which contain the significant accounting policies (including investment valuation policies) of those funds, and are not covered by the Report of Independent Registered Public Accounting Firm, are available on the Securities and Exchange Commission website or upon request.
3. Significant Accounting Policies.
The Fund is an investment company and applies the accounting and reporting guidance of the Financial Accounting Standards Board (FASB) Accounting Standards Codification Topic 946 Financial Services - Investment Companies. The financial statements have been prepared in conformity with accounting principles generally accepted in the United States of America (GAAP), which require management to make certain estimates and assumptions at the date of the financial statements. Actual results could differ from those estimates. Subsequent events, if any, through the date that the financial statements were issued have been evaluated in the preparation of the financial statements. The Fund's Schedule of Investments lists any underlying mutual funds or exchange-traded funds (ETFs) but does not include the underlying holdings of these funds. The following summarizes the significant accounting policies of the Fund:
Investment Valuation. Investments are valued as of 4:00 p.m. Eastern time on the last calendar day of the period. The Board of Trustees (the Board) has designated the Fund's investment adviser as the valuation designee responsible for the fair valuation function and performing fair value determinations as needed. The investment adviser has established a Fair Value Committee (the Committee) to carry out the day-to-day fair valuation responsibilities and has adopted policies and procedures to govern the fair valuation process and the activities of the Committee. In accordance with these fair valuation policies and procedures, which have been approved by the Board, the Fund attempts to obtain prices from one or more third party pricing services or brokers to value its investments. When current market prices, quotations or currency exchange rates are not readily available or reliable, investments will be fair valued in good faith by the Committee, in accordance with the policies and procedures. Factors used in determining fair value vary by investment type and may include market or investment specific events, transaction data, estimated cash flows, and market observations of comparable investments. The frequency that the fair valuation procedures are used cannot be predicted and they may be utilized to a significant extent. The Committee manages the Fund's fair valuation practices and maintains the fair valuation policies and procedures. The Fund's investment adviser reports to the Board information regarding the fair valuation process and related material matters.
The Fund categorizes the inputs to valuation techniques used to value its investments into a disclosure hierarchy consisting of three levels as shown below:
Level 1 - unadjusted quoted prices in active markets for identical investments
Level 2 - other significant observable inputs (including quoted prices for similar investments, interest rates, prepayment speeds, etc.)
Level 3 - unobservable inputs (including the Fund's own assumptions based on the best information available)
Valuation techniques used to value the Fund's investments by major category are as follows:
Debt securities, including restricted securities, are valued based on evaluated prices received from third party pricing services or from brokers who make markets in such securities. U.S. government and government agency obligations are valued by pricing services who utilize matrix pricing which considers yield or price of bonds of comparable quality, coupon, maturity and type or by broker-supplied prices. When independent prices are unavailable or unreliable, debt securities may be valued utilizing pricing methodologies which consider similar factors that would be used by third party pricing services. Debt securities are generally categorized as Level 2 in the hierarchy but may be Level 3 depending on the circumstances.
Exchange-Traded Funds (ETFs) are valued at their last sale price or official closing price as reported by a third party pricing service on the primary market or exchange on which they are traded and are categorized as Level 1 in the hierarchy. In the event there were no sales during the day but the exchange reports a closing bid level, ETFs are valued at the closing bid and would be categorized as Level 1 in the hierarchy. In the event there was no closing bid, ETFs may be valued by another method that the Board believes reflects fair value in accordance with the Board's fair value pricing policies and may be categorized as Level 2 in the hierarchy.
Futures contracts are valued at the settlement price established each day by the board of trade or exchange on which they are traded and are categorized as Level 1 in the hierarchy. Investments in open-end mutual funds, including the Fidelity Central Funds, are valued at their closing net asset value (NAV) each business day and are categorized as Level 1 in the hierarchy.
Changes in valuation techniques may result in transfers in or out of an assigned level within the disclosure hierarchy. The aggregate value of investments by input level as of June 30, 2024 is included at the end of the Fund's Schedule of Investments.
Foreign Currency. Certain Funds may use foreign currency contracts to facilitate transactions in foreign-denominated securities. Gains and losses from these transactions may arise from changes in the value of the foreign currency or if the counterparties do not perform under the contracts' terms.
Foreign-denominated assets, including investment securities, and liabilities are translated into U.S. dollars at the exchange rates at period end. Purchases and sales of investment securities, income and dividends received, and expenses denominated in foreign currencies are translated into U.S. dollars at the exchange rate in effect on the transaction date.
The effects of exchange rate fluctuations on investments are included with the net realized and unrealized gain (loss) on investment securities. Other foreign currency transactions resulting in realized and unrealized gain (loss) are disclosed separately.
Investment Transactions and Income. For financial reporting purposes, the Fund's investment holdings and NAV include trades executed through the end of the last business day of the period. The NAV per share for processing shareholder transactions is calculated as of the close of business of the New York Stock Exchange (NYSE), normally 4:00 p.m. Eastern time and includes trades executed through the end of the prior business day. Gains and losses on securities sold are determined on the basis of identified cost and include proceeds received from litigation. Commissions paid to certain brokers with whom the investment adviser, or its affiliates, places trades on behalf of a fund include an amount in addition to trade execution, which may be rebated back to a fund. Any such rebates are included in net realized gain (loss) on investments in the Statement of Operations. Dividend income is recorded on the ex-dividend date, except for certain dividends from foreign securities where the ex-dividend date may have passed, which are recorded as soon as the Fund is informed of the ex-dividend date. Non-cash dividends included in dividend income, if any, are recorded at the fair market value of the securities received. Income and capital gain distributions from Fidelity Central Funds, if any, are recorded on the ex-dividend date. Interest income is accrued as earned and includes coupon interest and amortization of premium and accretion of discount on debt securities as applicable. Investment income is recorded net of foreign taxes withheld where recovery of such taxes is uncertain. Funds may file withholding tax reclaims in certain jurisdictions to recover a portion of amounts previously withheld. Any withholding tax reclaims income is included in the Statement of Operations in dividends. Any receivables for withholding tax reclaims are included in the Statement of Assets and Liabilities in dividends receivable.
Class Allocations and Expenses. Investment income, realized and unrealized capital gains and losses, common expenses of a fund, and certain fund-level expense reductions, if any, are allocated daily on a pro-rata basis to each class based on the relative net assets of each class to the total net assets of a fund. Each class differs with respect to transfer agent and distribution and service plan fees incurred, as applicable. Certain expense reductions may also differ by class, if applicable. For the reporting period, the allocated portion of income and expenses to each class as a percent of its average net assets may vary due to the timing of recording these transactions in relation to fluctuating net assets of the classes. Expenses directly attributable to a fund are charged to that fund. Expenses attributable to more than one fund are allocated among the respective funds on the basis of relative net assets or other appropriate methods. Expenses included in the accompanying financial statements reflect the expenses of that fund and do not include any expenses associated with any underlying mutual funds or exchange-traded funds (ETFs). Although not included in a fund's expenses, a fund indirectly bears its proportionate share of these expenses through the net asset value of each underlying mutual fund or exchange-traded fund (ETF). Expense estimates are accrued in the period to which they relate and adjustments are made when actual amounts are known.
Deferred Trustee Compensation. Under a Deferred Compensation Plan (the Plan) for certain Funds, certain independent Trustees have elected to defer receipt of a portion of their annual compensation. Deferred amounts are invested in affiliated mutual funds, are marked-to-market and remain in a fund until distributed in accordance with the Plan. The investment of deferred amounts and the offsetting payable to the Trustees presented below are included in the accompanying Statement of Assets and Liabilities in other receivables and other payables and accrued expenses, as applicable.
| VIP Asset Manager Portfolio | $2,900 |
Income Tax Information and Distributions to Shareholders. Each year, the Fund intends to qualify as a regulated investment company under Subchapter M of the Internal Revenue Code, including distributing substantially all of its taxable income and realized gains. As a result, no provision for U.S. Federal income taxes is required. The Fund files a U.S. federal tax return, in addition to state and local tax returns as required. The Fund's federal income tax returns are subject to examination by the Internal Revenue Service (IRS) for a period of three fiscal years after they are filed. State and local tax returns may be subject to examination for an additional fiscal year depending on the jurisdiction. Foreign taxes are provided for based on the Fund's understanding of the tax rules and rates that exist in the foreign markets in which it invests.
Distributions are declared and recorded on the ex-dividend date. Income and capital gain distributions are declared separately for each class. Income and capital gain distributions are determined in accordance with income tax regulations, which may differ from GAAP.
Capital accounts within the financial statements are adjusted for permanent book-tax differences. These adjustments have no impact on net assets or the results of operations. Capital accounts are not adjusted for temporary book-tax differences which will reverse in a subsequent period.
Book-tax differences are primarily due to futures contracts and losses deferred due to wash sales.
As of period end, the cost and unrealized appreciation (depreciation) in securities, and derivatives if applicable, for federal income tax purposes were as follows:
| Gross unrealized appreciation | $228,256,951 |
| Gross unrealized depreciation | (28,718,270) |
| Net unrealized appreciation (depreciation) | $199,538,681 |
| Tax cost | $731,614,635 |
4. Derivative Instruments.
Risk Exposures and the Use of Derivative Instruments. The Fund's investment objectives allow for various types of derivative instruments, including futures contracts. Derivatives are investments whose value is primarily derived from underlying assets, indices or reference rates and may be transacted on an exchange or over-the-counter (OTC). Derivatives may involve a future commitment to buy or sell a specified asset based on specified terms, to exchange future cash flows at periodic intervals based on a notional principal amount, or for one party to make one or more payments upon the occurrence of specified events in exchange for periodic payments from the other party.
Derivatives were used to increase returns and to manage exposure to certain risks as defined below. The success of any strategy involving derivatives depends on analysis of numerous economic factors, and if the strategies for investment do not work as intended, the objectives may not be achieved.
Derivatives were used to increase or decrease exposure to the following risk(s):
| Equity Risk | Equity risk relates to the fluctuations in the value of financial instruments as a result of changes in market prices (other than those arising from interest rate risk or foreign exchange risk), whether caused by factors specific to an individual investment, its issuer, or all factors affecting all instruments traded in a market or market segment. |
Funds are also exposed to additional risks from investing in derivatives, such as liquidity risk and counterparty credit risk. Liquidity risk is the risk that a fund will be unable to close out the derivative in the open market in a timely manner. Counterparty credit risk is the risk that the counterparty will not be able to fulfill its obligation to a fund. Counterparty credit risk related to exchange-traded contracts may be mitigated by the protection provided by the exchange on which they trade.
Investing in derivatives may involve greater risks than investing in the underlying assets directly and, to varying degrees, may involve risk of loss in excess of any initial investment and collateral received and amounts recognized in the Statement of Assets and Liabilities. In addition, there may be the risk that the change in value of the derivative contract does not correspond to the change in value of the underlying instrument.
Futures Contracts. A futures contract is an agreement between two parties to buy or sell a specified underlying instrument for a fixed price at a specified future date. Futures contracts were used to manage exposure to the stock market.
Upon entering into a futures contract, a fund is required to deposit either cash or securities (initial margin) with a clearing broker in an amount equal to a certain percentage of the face value of the contract. Futures contracts are marked-to-market daily and subsequent daily payments are made or received by a fund depending on the daily fluctuations in the value of the futures contracts and are recorded as unrealized appreciation or (depreciation). This receivable and/or payable, if any, is included in daily variation margin on futures contracts in the Statement of Assets and Liabilities. Realized gain or (loss) is recorded upon the expiration or closing of a futures contract. The net realized gain (loss) and change in net unrealized appreciation (depreciation) on futures contracts during the period is presented in the Statement of Operations.
Any open futures contracts at period end are presented in the Schedule of Investments under the caption "Futures Contracts". The notional amount at value reflects each contract's exposure to the underlying instrument or index at period end, and is representative of volume of activity during the period unless an average notional amount is presented. Any securities deposited to meet initial margin requirements are identified in the Schedule of Investments. Any cash deposited to meet initial margin requirements is presented as segregated cash with brokers for derivative instruments in the Statement of Assets and Liabilities.
5. Purchases and Sales of Investments.
Purchases and sales of securities, other than short-term securities, U.S. government securities and in-kind transactions, as applicable, are noted in the table below.
| | Purchases ($) | Sales ($) |
| VIP Asset Manager Portfolio | 50,551,727 | 103,188,258 |
6. Fees and Other Transactions with Affiliates.
Management Fee. Fidelity Management & Research Company LLC (the investment adviser) and its affiliates provide the Fund with investment management related services for which the Fund pays a monthly management fee.
Effective March 1, 2024, the Fund's management contract was amended to incorporate administrative services previously covered under separate services agreements (Transfer Agent and Accounting agreements). The amended contract incorporates a management fee rate that may vary by class. The investment adviser or an affiliate pays certain expenses of managing and operating the Fund out of each class's management fee. Each class of the Fund pays a management fee to the investment adviser. The management fee is calculated and paid to the investment adviser every month. When determining a class's management fee, a mandate rate is calculated based on the monthly average net assets of a group of funds advised by FMR within a designated asset class. A discount rate is subtracted from the mandate rate once the Fund's monthly average net assets reach a certain level. The mandate rate and discount rate may vary by class. The annual management fee rate for a class of shares of the Fund is the lesser of (1) the class's mandate rate reduced by the class's discount rate (if applicable) or (2) the amount set forth in the following table.
| | Maximum Management Fee Rate % |
| Initial Class | .55 |
| Service Class | .55 |
| Service Class 2 | .55 |
| Investor Class | .62 |
One-twelfth of the management fee rate for a class is applied to the average net assets of the class for the month, giving a dollar amount which is the management fee for the class for that month. A different management fee rate may be applicable to each class of the Fund. The difference between classes is the result of separate arrangements for class-level services and/or waivers of certain expenses. It is not the result of any difference in advisory or custodial fees or other expenses related to the management of the Fund's assets, which do not vary by class. For the portion of the reporting period on or after March 1, 2024, the total annualized management fee rates were as follows:
| | Total Management Fee Rate % |
| Initial Class | .50 |
| Service Class | .50 |
| Service Class 2 | .50 |
| Investor Class | .58 |
Prior to March 1, 2024, the management fee was the sum of an individual fund fee rate that was based on an annual rate of .25% of the Fund's average net assets and an annualized group fee rate that averaged .22% during the period. The group fee rate was based upon the monthly average net assets of a group of registered investment companies with which the investment adviser has management contracts. The group fee rate decreased as assets under management increased and increased as assets under management decreased. For the portion of the reporting period prior to March 1, 2024, the total annualized management fee rate was .47%.
Effective March 1, 2024, the Fund's sub-advisory agreements with FMR Investment Management (UK) Limited, Fidelity Management & Research (Hong Kong) Limited, and Fidelity Management & Research (Japan) Limited were amended to provide that the investment adviser pays each sub-adviser monthly fees equal to 110% of the sub-adviser's costs for providing sub-advisory services.
Distribution and Service Plan Fees. In accordance with Rule 12b-1 of the 1940 Act, the Fund has adopted separate 12b-1 Plans for each Service Class of shares. Each Service Class pays Fidelity Distributors Company LLC (FDC), an affiliate of the investment adviser, a service fee. For the period, the service fee is based on an annual rate of .10% of Service Class' average net assets and .25% of Service Class 2's average net assets.
For the period, total fees, all of which were re-allowed to insurance companies for the distribution of shares and providing shareholder support services, were as follows:
| Service Class | $1,268 |
| Service Class 2 | 20,892 |
| | $22,160 |
Transfer Agent Fees. Fidelity Investments Institutional Operations Company LLC (FIIOC), an affiliate of the investment adviser, is the Fund's transfer, dividend disbursing, and shareholder servicing agent. Effective March 1, 2024, the Fund's management contract was amended to incorporate transfer agent services and associated fees previously covered under a separate services agreement.
During the period January 1, 2024 through February 29, 2024, the transfer agent fees for each class were a fixed annual rate of class-level average net assets as follows:
| | Amount ($) | % of Class-Level Average Net Assets |
| Initial Class | 72,382 | .0630 |
| Service Class | 262 | .0630 |
| Service Class 2 | 1,727 | .0630 |
| Investor Class | 52,556 | .1390 |
| | 126,927 | |
Accounting Fees. Fidelity Service Company, Inc. (FSC), an affiliate of the investment adviser, maintains the Fund's accounting records. Effective March 1, 2024, the Fund's management contract was amended to incorporate accounting services and associated fees previously covered under a separate services agreement.
During the period January 1, 2024 through February 29, 2024, the accounting fees were a fixed annual rate of average net assets as follows:
| | % of Average Net Assets |
| VIP Asset Manager Portfolio | .0406 |
Interfund Trades. Funds may purchase from or sell securities to other Fidelity Funds under procedures adopted by the Board. The procedures have been designed to ensure these interfund trades are executed in accordance with Rule 17a-7 of the 1940 Act. Any interfund trades are included within the respective purchases and sales amounts shown in the Purchases and Sales of Investments note. Interfund trades during the period are noted in the table below.
| | Purchases ($) | Sales ($) | Realized Gain (Loss)($) |
| VIP Asset Manager Portfolio | - | 821,000 | (107,312) |
7. Committed Line of Credit.
Certain Funds participate with other funds managed by the investment adviser or an affiliate in a $4.25 billion credit facility (the "line of credit") to be utilized for temporary or emergency purposes to fund shareholder redemptions or for other short-term liquidity purposes. The participating funds have agreed to pay commitment fees on their pro-rata portion of the line of credit, which are reflected in Miscellaneous expenses on the Statement of Operations, and are listed below. During the period, there were no borrowings on this line of credit.
| | Amount ($) |
| VIP Asset Manager Portfolio | 868 |
8. Security Lending.
Funds lend portfolio securities from time to time in order to earn additional income. Lending agents are used, including National Financial Services (NFS), an affiliate of the investment adviser. Pursuant to a securities lending agreement, NFS will receive a fee, which is capped at 9.9% of a fund's daily lending revenue, for its services as lending agent. A fund may lend securities to certain qualified borrowers, including NFS. On the settlement date of the loan, a fund receives collateral (in the form of U.S. Treasury obligations, letters of credit and/or cash) against the loaned securities and maintains collateral in an amount not less than 100% of the market value of the loaned securities during the period of the loan. The market value of the loaned securities is determined at the close of business of a fund and any additional required collateral is delivered to a fund on the next business day. A fund or borrower may terminate the loan at any time, and if the borrower defaults on its obligation to return the securities loaned because of insolvency or other reasons, a fund may apply collateral received from the borrower against the obligation. A fund may experience delays and costs in recovering the securities loaned. Any cash collateral received is invested in the Fidelity Securities Lending Cash Central Fund. Any loaned securities are identified as such in the Schedule of Investments, and the value of loaned securities and cash collateral at period end, as applicable, are presented in the Statement of Assets and Liabilities. Security lending income represents the income earned on investing cash collateral, less rebates paid to borrowers and any lending agent fees associated with the loan, plus any premium payments received for lending certain types of securities. Security lending income is presented in the Statement of Operations as a component of income from Fidelity Central Funds. Affiliated security lending activity, if any, was as follows:
| | Total Security Lending Fees Paid to NFS ($) | Security Lending Income From Securities Loaned to NFS ($) | Value of Securities Loaned to NFS at Period End ($) |
| VIP Asset Manager Portfolio | 239 | - | - |
9. Expense Reductions.
Effective November 1, 2023, the investment adviser has contractually agreed to waive the Fund's management fee with respect to the portion of the Fund's assets invested in certain affiliated ETFs. This waiver cannot be removed or modified without the approval of the Board. During the period this waiver reduced the Fund's management fee as follows:
| | Waiver ($) |
| VIP Asset Manager Portfolio | 8,847 |
Through arrangements with the Fund's custodian, credits realized as a result of certain uninvested cash balances were used to reduce the Fund's expenses. During the period, custodian credits reduced the Fund's expenses by $36.
In addition, during the period the investment adviser or an affiliate reimbursed and/or waived a portion of fund-level operating expenses in the amount of $41,758.
10. Distributions to Shareholders.
Distributions to shareholders of each class were as follows:
| | Six months ended June 30, 2024 | Year ended December 31, 2023 |
| VIP Asset Manager Portfolio | | |
| Distributions to shareholders | | |
| Initial Class | $3,403,724 | $23,344,015 |
| Service Class | 12,508 | 82,405 |
| Service Class 2 | 84,206 | 514,496 |
| Investor Class | 1,126,023 | 7,530,918 |
Total | $4,626,461 | $31,471,834 |
11. Share Transactions.
Transactions for each class of shares were as follows and may contain in-kind transactions:
| | Shares | Shares | Dollars | Dollars |
| | Six months ended June 30, 2024 | Year ended December 31, 2023 | Six months ended June 30, 2024 | Year ended December 31, 2023 |
| VIP Asset Manager Portfolio | | | | |
| Initial Class | | | | |
| Shares sold | 445,463 | 1,463,280 | $7,110,833 | $21,707,385 |
| Reinvestment of distributions | 216,384 | 1,521,440 | 3,403,724 | 23,344,015 |
| Shares redeemed | (3,108,239) | (6,576,680) | (49,480,105) | (98,130,807) |
| Net increase (decrease) | (2,446,392) | (3,591,960) | $(38,965,548) | $(53,079,407) |
| Service Class | | | | |
| Shares sold | 239 | 8,878 | $3,763 | $130,736 |
| Reinvestment of distributions | 804 | 5,434 | 12,508 | 82,405 |
| Shares redeemed | (2,652) | (27,578) | (41,670) | (415,524) |
| Net increase (decrease) | (1,609) | (13,266) | $(25,399) | $(202,383) |
| Service Class 2 | | | | |
| Shares sold | 87,047 | 111,815 | $1,356,757 | $1,608,434 |
| Reinvestment of distributions | 5,529 | 34,639 | 84,206 | 514,496 |
| Shares redeemed | (76,203) | (134,360) | (1,175,478) | (1,948,738) |
| Net increase (decrease) | 16,373 | 12,094 | $265,485 | $174,192 |
| Investor Class | | | | |
| Shares sold | 138,149 | 138,956 | $2,180,151 | $2,077,606 |
| Reinvestment of distributions | 72,181 | 495,135 | 1,126,023 | 7,530,918 |
| Shares redeemed | (1,174,421) | (1,733,509) | (18,618,564) | (25,817,856) |
| Net increase (decrease) | (964,091) | (1,099,418) | $(15,312,390) | $(16,209,332) |
12. Other.
A fund's organizational documents provide former and current trustees and officers with a limited indemnification against liabilities arising in connection with the performance of their duties to the fund. In the normal course of business, a fund may also enter into contracts that provide general indemnifications. A fund's maximum exposure under these arrangements is unknown as this would be dependent on future claims that may be made against a fund. The risk of material loss from such claims is considered remote.
At the end of the period, the investment adviser or its affiliates were owners of record of more than 10% of the outstanding shares as follows:
| Fund | Affiliated % | Number ofUnaffiliated Shareholders | Unaffiliated Shareholders % |
| VIP Asset Manager Portfolio | 43% | 2 | 28% |
13. Risk and Uncertainties.
Many factors affect a fund's performance. Developments that disrupt global economies and financial markets, such as pandemics, epidemics, outbreaks of infectious diseases, war, terrorism, and environmental disasters, may significantly affect a fund's investment performance. The effects of these developments to a fund will be impacted by the types of securities in which a fund invests, the financial condition, industry, economic sector, and geographic location of an issuer, and a fund's level of investment in the securities of that issuer. Significant concentrations in security types, issuers, industries, sectors, and geographic locations may magnify the factors that affect a fund's performance.
Item 8: Changes in and Disagreements with Accountants for Open-End Management Investment Companies
Note: This is not applicable for any fund included in this document.
Item 9: Proxy Disclosures for Open-End Management Investment Companies
Note: This is not applicable for any fund included in this document.
Item 10: Remuneration Paid to Directors, Officers, and others of Open-End Management Investment Companies
Note: This information is disclosed as part of the financial statements for each Fund as part of Item 7: Financial Statements and Financial Highlights for Open-End Management Investment companies.
Item 11: Statement Regarding Basis for Approval of Investment Advisory Contract
Board Approval of Investment Advisory Contracts
VIP Asset Manager Portfolio
At its January 2024 meeting, the Board of Trustees, including the Independent Trustees (together, the Board), approved an amended and restated management contract with Fidelity Management & Research Company LLC (FMR) (the Management Contract), and amended and restated sub-advisory agreements (the Sub-Advisory Contracts, and together with the Management Contract, the Advisory Contracts) for the fund, including the fund's sub-advisory agreements with FMR Investment Management (UK) Limited (FMR UK), Fidelity Management & Research (Hong Kong) Limited (FMR H.K.), and Fidelity Management & Research (Japan) Limited (FMR Japan). The Advisory Contracts will be effective March 1, 2024. The Board will consider the annual renewal of the fund's Advisory Contracts in September 2024, following its review of additional materials provided by FMR.
Management Contract. The Board approved the Management Contract, which implements a new fee structure combining the management fee, transfer agent fee (TA Fee), and pricing and bookkeeping fee (P&B Fee) of the fund and each class into a single class-level fee based on tiered schedules and subject to a maximum class-level rate (the Unified Fee). In exchange for the Unified Fee, the fund will receive investment advisory, management, administrative, transfer agent, pricing and bookkeeping services under a single agreement - the Management Contract.
In its consideration of the Management Contract over several meetings, the Board received, reviewed and discussed a comprehensive set of analyses regarding the Unified Fee including (i) the legal framework, (ii) design goals for the Unified Fee, (iii) calculation methodology for the Unified Fee and illustrative examples, (iv) annual and cumulative projected impacts under various scenarios, both in the aggregate and at the fund/class level, (v) explanations of schedules, rate levers and maximum rates and (vi) shareholder benefits and projected savings.
The Board considered that the maximum Unified Fee for each class of the fund would be no higher than the sum of (i) the lowest contractual management fee under the fund's existing management contract, which is the individual fund fee, if any, plus the lowest contractual marginal group fee rate and (ii) the TA and P&B Fee rates, which are fixed fee rates since December 1, 2023 (together, the "Unified Fee Cap"). The Board noted that, as a result of this Unified Fee Cap, the Unified Fee would be no greater than the fees previously authorized to be charged for the same services. The Board noted that certain expenses such as third-party expenses, Rule 12b-1 fees, and certain other miscellaneous expenses would be outside the scope of the Unified Fee and the calculation of such fees would not change as a result of the Unified Fee. The Board considered that, under the Management Contract, a different management fee rate will be applicable to each class of the fund. The Board noted that Fidelity has represented that the difference in expenses between classes is based on differences in class-specific expenses and not due to any difference in advisory or third-party custodial fees or other expenses related to the management of the fund's assets.
The Board considered that implementation of the Unified Fee, which includes the Unified Fee Cap, would cause all funds subject to a Unified Fee, including the fund, to experience an immediate reduction on contractual fee rates for services provided under the current management contracts. The Board considered that some funds would not experience lower fees as a result of existing fee caps. The Board further considered that, in addition to the contractual fee savings, the Unified Fee offers funds and their shareholders greater protection from future rate increases for services previously offered under separate agreements that are now covered by the Management Contract because such rate increases would require shareholder, as well as Board, approval.
Sub-Advisory Contracts. In connection with the Unified Fee changes, the Board considered the Sub-Advisory Contracts, which changed the arrangements for fees paid by FMR to the sub-advisers under the agreements. The Board noted that the agreements with FMR UK, FMR H.K., and FMR Japan were amended to provide that FMR will compensate each sub-adviser at a fee equal to 110% of the sub-adviser's costs incurred in providing services under the agreement. The Board considered that, under the Sub-Advisory Contracts, FMR, and not the fund, will continue to pay the sub-advisory fees to each applicable sub-adviser.
The Board considered that the approval of the fund's Advisory Contracts will not result in any changes in the investment process or strategies employed in the management of the fund's assets or the day-to-day management of the fund or the persons primarily responsible for such management. Further, the Board considered that the Management Contract would not change the obligations and services of FMR and its affiliates on behalf of the fund, and, in particular, there would be no change in the nature and level of advisory, management, administration, transfer agent, and pricing and bookkeeping services provided to the fund by FMR and its affiliates.
In connection with its consideration of future renewals of the fund's Advisory Contracts, the Board will consider: (i) the nature, extent and quality of services provided to the funds, including shareholder and administrative services and investment performance; (ii) the competitiveness of the management fee and total expenses for the fund; (iii) the costs of the services and profitability, including the revenues earned and the expenses incurred in conducting the business of developing, marketing, distributing, managing, administering, and servicing the fund and its shareholders, to the extent applicable; and (iv) whether there have been economies of scale in respect of the Fidelity funds, whether the Fidelity funds (including the fund) have appropriately benefited from any such economies of scale, and whether there is the potential for realization of any further economies.
Based on its evaluation of all of the conclusions noted above, and after considering all factors it believed relevant, the Board concluded that the fund's management fee structure is fair and reasonable, and that the fund's Advisory Contracts should be approved.
1.705701.126
VIPAM-SANN-0824
Fidelity® Variable Insurance Products:
VIP Investor Freedom Income Portfolio℠
VIP Investor Freedom 2010 Portfolio℠
VIP Investor Freedom 2015 Portfolio℠
VIP Investor Freedom 2020 Portfolio℠
VIP Investor Freedom 2025 Portfolio℠
VIP Investor Freedom 2030 Portfolio℠
VIP Investor Freedom 2035 Portfolio℠
VIP Investor Freedom 2040 Portfolio℠
VIP Investor Freedom 2045 Portfolio℠
VIP Investor Freedom 2050 Portfolio℠
Semi-Annual Report
June 30, 2024
Contents
To view a fund's proxy voting guidelines and proxy voting record for the 12-month period ended June 30, visit http://www.fidelity.com/proxyvotingresults or visit the Securities and Exchange Commission's (SEC) web site at http://www.sec.gov.
You may also call 1-877-208-0098 to request a free copy of the proxy voting guidelines.
Fidelity® Variable Insurance Products are separate account options which are purchased through a variable insurance contract.
Standard & Poor's, S&P and S&P 500 are registered service marks of The McGraw-Hill Companies, Inc. and have been licensed for use by Fidelity Distributors Corporation.
Other third-party marks appearing herein are the property of their respective owners.
All other marks appearing herein are registered or unregistered trademarks or service marks of FMR LLC or an affiliated company. © 2024 FMR LLC. All rights reserved.
This report and the financial statements contained herein are submitted for the general information of the shareholders of the Funds. This report is not authorized for distribution to prospective investors in the Funds unless preceded or accompanied by an effective prospectus.
A fund files its complete schedule of portfolio holdings with the SEC for the first and third quarters of each fiscal year on Form N-PORT. Forms N-PORT are available on the SEC's web site at http://www.sec.gov. A fund's Forms N-PORT may be reviewed and copied at the SEC's Public Reference Room in Washington, DC. Information regarding the operation of the SEC's Public Reference Room may be obtained by calling 1-800-SEC-0330.
For a complete list of a fund's portfolio holdings, view the most recent holdings listing, semiannual report, or annual report on Fidelity's web site at http://www.fidelity.com, http://www.institutional.fidelity.com, or http://www.401k.com, as applicable.
NOT FDIC INSURED •MAY LOSE VALUE •NO BANK GUARANTEE
Neither the Funds nor Fidelity Distributors Corporation is a bank.
Item 7: Financial Statements and Financial Highlights for Open-End Management Investment Companies (Semi-Annual Report)
VIP Investor Freedom Income Portfolio℠
Schedule of Investments June 30, 2024 (Unaudited)
Showing Percentage of Net Assets
| Domestic Equity Funds - 8.0% |
| | | Shares | Value ($) |
| VIP Contrafund Portfolio Investor Class (a) | | 17,998 | 1,080,428 |
| VIP Equity-Income Portfolio Investor Class (a) | | 32,897 | 881,306 |
| VIP Growth & Income Portfolio Investor Class (a) | | 39,759 | 1,212,251 |
| VIP Growth Portfolio Investor Class (a) | | 15,997 | 1,796,345 |
| VIP Mid Cap Portfolio Investor Class (a) | | 7,148 | 278,129 |
| VIP Value Portfolio Investor Class (a) | | 31,867 | 617,261 |
| VIP Value Strategies Portfolio Investor Class (a) | | 18,494 | 307,005 |
| TOTAL DOMESTIC EQUITY FUNDS (Cost $2,949,473) | | | 6,172,725 |
| | | | |
| International Equity Funds - 13.6% |
| | | Shares | Value ($) |
| VIP Emerging Markets Portfolio Investor Class (a) | | 383,877 | 4,429,944 |
| VIP Overseas Portfolio Investor Class (a) | | 218,090 | 6,025,829 |
| TOTAL INTERNATIONAL EQUITY FUNDS (Cost $6,708,904) | | | 10,455,773 |
| | | | |
| Bond Funds - 62.9% |
| | | Shares | Value ($) |
| Fidelity Inflation-Protected Bond Index Fund (a) | | 1,380,850 | 12,579,541 |
| Fidelity International Bond Index Fund (a) | | 182,599 | 1,668,951 |
| Fidelity Long-Term Treasury Bond Index Fund (a) | | 180,560 | 1,713,517 |
| VIP High Income Portfolio Investor Class (a) | | 270,004 | 1,269,018 |
| VIP Investment Grade Bond II Portfolio Investor Class (a) | | 3,289,948 | 30,991,305 |
| TOTAL BOND FUNDS (Cost $51,169,075) | | | 48,222,332 |
| | | | |
| Short-Term Funds - 15.5% |
| | | Shares | Value ($) |
VIP Government Money Market Portfolio Investor Class 5.09% (a)(b) (Cost $11,849,301) | | 11,849,301 | 11,849,301 |
| | | | |
| TOTAL INVESTMENT IN SECURITIES - 100.0% (Cost $72,676,753) | 76,700,131 |
NET OTHER ASSETS (LIABILITIES) - 0.0% | (387) |
| NET ASSETS - 100.0% | 76,699,744 |
| | |
Legend
| (b) | The rate quoted is the annualized seven-day yield of the fund at period end. |
Affiliated Underlying Funds
Fiscal year to date information regarding the Fund's investments in affiliated Underlying Funds is presented below. Exchanges between classes of the same affiliated Underlying Funds may occur. If an Underlying Funds changes its name, the name presented below is the name in effect at period end.
| Affiliate | Value, beginning of period ($) | Purchases ($) | Sales Proceeds ($) | Dividend Income ($) | Realized Gain (loss) ($) | Change in Unrealized appreciation (depreciation) ($) | Value, end of period ($) |
| Fidelity Inflation-Protected Bond Index Fund | 10,835,963 | 347,097 | 1,658,132 | 17,148 | (175,836) | 264,071 | 12,579,541 |
| Fidelity International Bond Index Fund | 1,611,785 | 80,076 | 406,626 | 15,128 | (30,277) | 21,753 | 1,668,951 |
| Fidelity Long-Term Treasury Bond Index Fund | 2,117,312 | 123,362 | 822,209 | 29,024 | (184,938) | 64,489 | 1,713,517 |
| VIP Contrafund Portfolio Investor Class | 650,621 | 237,498 | 250,423 | 3,224 | 16,389 | 166,164 | 1,080,428 |
| VIP Emerging Markets Portfolio Investor Class | 3,167,082 | 574,820 | 628,187 | 2,754 | 45,097 | 258,907 | 4,429,944 |
| VIP Equity-Income Portfolio Investor Class | 527,603 | 258,075 | 170,860 | 3,387 | 6,024 | 53,253 | 881,306 |
| VIP Government Money Market Portfolio Investor Class 5.09% | 11,568,270 | 1,237,164 | 3,776,171 | 254,950 | - | - | 11,849,301 |
| VIP Growth & Income Portfolio Investor Class | 724,972 | 324,969 | 246,148 | 6,023 | 9,811 | 112,182 | 1,212,251 |
| VIP Growth Portfolio Investor Class | 1,077,461 | 405,511 | 386,867 | 19,354 | 17,916 | 252,045 | 1,796,345 |
| VIP High Income Portfolio Investor Class | 1,046,321 | 32,203 | 139,329 | 451 | (15,124) | 46,421 | 1,269,018 |
| VIP Investment Grade Bond II Portfolio Investor Class | 24,742,061 | 2,283,870 | 3,301,634 | 15,443 | (118,294) | 47,972 | 30,991,305 |
| VIP Mid Cap Portfolio Investor Class | 165,164 | 81,158 | 49,127 | 3,470 | 2,065 | 14,774 | 278,129 |
| VIP Overseas Portfolio Investor Class | 4,578,447 | 522,218 | 790,129 | 17,490 | 115,016 | 193,872 | 6,025,829 |
| VIP Value Portfolio Investor Class | 368,176 | 203,924 | 108,310 | 9,102 | 4,531 | 5,947 | 617,261 |
| VIP Value Strategies Portfolio Investor Class | 182,076 | 104,053 | 54,320 | 2,947 | 2,551 | 2,258 | 307,005 |
| | 63,363,314 | 6,815,998 | 12,788,472 | 399,895 | (305,069) | 1,504,108 | 76,700,131 |
Amounts in the dividend income column in the above table include any capital gain distributions from underlying funds, which are presented in the corresponding line item in the Statement of Operations, if applicable.
Amounts included in the purchases and sales proceeds columns may include in-kind transactions, if applicable.
Investment Valuation
The following is a summary of the inputs used, as of June 30, 2024, involving the Fund's assets and liabilities carried at fair value. The inputs or methodology used for valuing securities may not be an indication of the risk associated with investing in those securities. For more information on valuation inputs, and their aggregation into the levels used below, please refer to the Investment Valuation section in the accompanying Notes to Financial Statements.
| Valuation Inputs at Reporting Date: |
| Description | Total ($) | Level 1 ($) | Level 2 ($) | Level 3 ($) |
Investments in Securities: | | | | |
|
| Domestic Equity Funds | 6,172,725 | 6,172,725 | - | - |
|
| International Equity Funds | 10,455,773 | 10,455,773 | - | - |
|
| Bond Funds | 48,222,332 | 48,222,332 | - | - |
|
| Short-Term Funds | 11,849,301 | 11,849,301 | - | - |
| Total Investments in Securities: | 76,700,131 | 76,700,131 | - | - |
VIP Investor Freedom Income Portfolio℠
Financial Statements (Unaudited)
| Statement of Assets and Liabilities |
| | | | June 30, 2024 (Unaudited) |
| | | | | |
| Assets | | | | |
| Investment in securities, at value - See accompanying schedule: | | | | |
Affiliated issuers (cost $72,676,753) | $ | 76,700,131 | | |
| | | | | |
| | | | | |
| Total Investment in Securities (cost $72,676,753) | | | $ | 76,700,131 |
| Cash | | | | 34 |
| Receivable for investments sold | | | | 276,616 |
Total assets | | | | 76,976,781 |
| Liabilities | | | | |
| Payable for investments purchased | $ | 274,169 | | |
| Payable for fund shares redeemed | | 2,868 | | |
| Total liabilities | | | | 277,037 |
| Net Assets | | | $ | 76,699,744 |
| Net Assets consist of: | | | | |
| Paid in capital | | | $ | 75,818,773 |
| Total accumulated earnings (loss) | | | | 880,971 |
| Net Assets | | | $ | 76,699,744 |
Net Asset Value, offering price and redemption price per share ($76,699,744 ÷ 6,940,901 shares) | | | $ | 11.05 |
| Statement of Operations |
| | | | Six months ended June 30, 2024 (Unaudited) |
| Investment Income | | | | |
| Dividends: | | | | |
| Affiliated issuers | | | $ | 346,105 |
| Expenses | | | | |
| Independent trustees' fees and expenses | $ | 88 | | |
| Total expenses | | | | 88 |
| Net Investment income (loss) | | | | 346,017 |
| Realized and Unrealized Gain (Loss) | | | | |
| Net realized gain (loss) on: | | | | |
| Investment Securities: | | | | |
| Affiliated issuers | | (305,069) | | |
| Capital gain distributions from underlying funds: | | | | |
| Affiliated issuers | | 53,790 | | |
| Total net realized gain (loss) | | | | (251,279) |
| Change in net unrealized appreciation (depreciation) on: | | | | |
| Investment Securities: | | | | |
| Affiliated issuers | | 1,504,108 | | |
| Total change in net unrealized appreciation (depreciation) | | | | 1,504,108 |
| Net gain (loss) | | | | 1,252,829 |
| Net increase (decrease) in net assets resulting from operations | | | $ | 1,598,846 |
| Statement of Changes in Net Assets |
| |
| | Six months ended June 30, 2024 (Unaudited) | | Year ended December 31, 2023 |
| Increase (Decrease) in Net Assets | | | | |
| Operations | | | | |
| Net investment income (loss) | $ | 346,017 | $ | 2,273,893 |
| Net realized gain (loss) | | (251,279) | | (333,373) |
| Change in net unrealized appreciation (depreciation) | | 1,504,108 | | 3,112,227 |
| Net increase (decrease) in net assets resulting from operations | | 1,598,846 | | 5,052,747 |
| Distributions to shareholders | | (420,655) | | (2,918,126) |
| | | | | |
| Share transactions | | | | |
| Proceeds from sales of shares | | 1,089,283 | | 3,828,335 |
| Net asset value of shares issued in exchange for the net assets of the Target Fund(s) (see Merger Information note) | | 18,112,866 | | - |
| Reinvestment of distributions | | 420,655 | | 2,918,126 |
| Cost of shares redeemed | | (7,467,813) | | (18,462,983) |
| | | | | |
Net increase (decrease) in net assets resulting from share transactions | | 12,154,991 | | (11,716,522) |
| Total increase (decrease) in net assets | | 13,333,182 | | (9,581,901) |
| | | | | |
| Net Assets | | | | |
| Beginning of period | | 63,366,562 | | 72,948,463 |
| End of period | $ | 76,699,744 | $ | 63,366,562 |
| | | | | |
| Other Information | | | | |
| Shares | | | | |
| Sold | | 100,100 | | 356,711 |
| Issued in exchange for the shares of the Target Fund(s) (see Merger Information note) | | 1,648,130 | | - |
| Issued in reinvestment of distributions | | 39,167 | | 271,775 |
| Redeemed | | (686,907) | | (1,721,984) |
| Net increase (decrease) | | 1,100,490 | | (1,093,498) |
| | | | | |
Financial Highlights
VIP Investor Freedom Income Portfolio℠ |
| |
| | Six months ended (Unaudited) June 30, 2024 | | Years ended December 31, 2023 | | 2022 | | 2021 | | 2020 | | 2019 |
Selected Per-Share Data | | | | | | | | | | | | |
| Net asset value, beginning of period | $ | 10.85 | $ | 10.52 | $ | 12.62 | $ | 12.68 | $ | 11.91 | $ | 11.10 |
| Income from Investment Operations | | | | | | | | | | | | |
Net investment income (loss) A,B | | .06 | | .36 | | .27 | | .24 | | .16 | | .26 |
| Net realized and unrealized gain (loss) | | .21 | | .46 | | (1.74) | | .17 | | 1.06 | | 1.05 |
| Total from investment operations | | .27 | | .82 | | (1.47) | | .41 | | 1.22 | | 1.31 |
| Distributions from net investment income | | (.07) | | (.49) | | (.25) | | (.13) | | (.16) | | (.25) |
| Distributions from net realized gain | | - | | - | | (.38) | | (.34) | | (.29) | | (.25) |
| Total distributions | | (.07) | | (.49) | | (.63) | | (.47) | | (.45) | | (.50) |
| Net asset value, end of period | $ | 11.05 | $ | 10.85 | $ | 10.52 | $ | 12.62 | $ | 12.68 | $ | 11.91 |
Total Return C,D,E | | | | 7.88% | | (12.03)% | | 3.28% | | 10.40% | | 12.02% |
Ratios to Average Net Assets B,F,G | | | | | | | | | | | | |
Expenses before reductions H | | -% I | | -% | | -% | | -% | | -% | | -% |
Expenses net of fee waivers, if any H | | | | -% | | -% | | -% | | -% | | -% |
Expenses net of all reductions H | | -% I | | -% | | -% | | -% | | -% | | -% |
| Net investment income (loss) | | 1.10% I | | 3.36% | | 2.44% | | 1.88% | | 1.32% | | 2.19% |
| Supplemental Data | | | | | | | | | | | | |
| Net assets, end of period (000 omitted) | $ | 76,700 | $ | 63,367 | $ | 72,948 | $ | 102,427 | $ | 97,889 | $ | 85,736 |
Portfolio turnover rate J | | | | 20% | | 65% | | 27% | | 49% | | 25% |
ACalculated based on average shares outstanding during the period.
BNet investment income (loss) is affected by the timing of the declaration of dividends by any underlying mutual funds or exchange-traded funds (ETFs). Net investment income (loss) of any mutual funds or ETFs is not included in the Fund's net investment income (loss) ratio.
CTotal returns for periods of less than one year are not annualized.
DTotal returns do not reflect charges attributable to your insurance company's separate account. Inclusion of these charges would reduce the total returns shown.
ETotal returns would have been lower if certain expenses had not been reduced during the applicable periods shown.
FFees and expenses of any underlying mutual funds or exchange-traded funds (ETFs) are not included in the Fund's expense ratio. The Fund indirectly bears its proportionate share of these expenses.
GExpense ratios reflect operating expenses of the class. Expenses before reductions do not reflect amounts reimbursed, waived, or reduced through arrangements with the investment adviser, brokerage services, or other offset arrangements, if applicable, and do not represent the amount paid by the class during periods when reimbursements, waivers or reductions occur.
HAmount represents less than $.005 per share.
IAnnualized.
JAmount does not include the portfolio activity of any underlying mutual funds or exchange-traded funds (ETFs).
KThe portfolio turnover rate does not include the assets acquired in the merger.
VIP Investor Freedom 2010 Portfolio℠
Schedule of Investments June 30, 2024 (Unaudited)
Showing Percentage of Net Assets
| Domestic Equity Funds - 12.5% |
| | | Shares | Value ($) |
| VIP Contrafund Portfolio Investor Class (a) | | 20,411 | 1,225,295 |
| VIP Equity-Income Portfolio Investor Class (a) | | 37,310 | 999,530 |
| VIP Growth & Income Portfolio Investor Class (a) | | 45,092 | 1,374,868 |
| VIP Growth Portfolio Investor Class (a) | | 18,143 | 2,037,240 |
| VIP Mid Cap Portfolio Investor Class (a) | | 8,107 | 315,440 |
| VIP Value Portfolio Investor Class (a) | | 36,141 | 700,060 |
| VIP Value Strategies Portfolio Investor Class (a) | | 20,976 | 348,194 |
| TOTAL DOMESTIC EQUITY FUNDS (Cost $3,346,385) | | | 7,000,627 |
| | | | |
| International Equity Funds - 16.6% |
| | | Shares | Value ($) |
| VIP Emerging Markets Portfolio Investor Class (a) | | 322,126 | 3,717,340 |
| VIP Overseas Portfolio Investor Class (a) | | 202,088 | 5,583,686 |
| TOTAL INTERNATIONAL EQUITY FUNDS (Cost $6,308,965) | | | 9,301,026 |
| | | | |
| Bond Funds - 60.1% |
| | | Shares | Value ($) |
| Fidelity Inflation-Protected Bond Index Fund (a) | | 950,647 | 8,660,391 |
| Fidelity International Bond Index Fund (a) | | 147,386 | 1,347,108 |
| Fidelity Long-Term Treasury Bond Index Fund (a) | | 146,380 | 1,389,150 |
| VIP High Income Portfolio Investor Class (a) | | 197,050 | 926,136 |
| VIP Investment Grade Bond II Portfolio Investor Class (a) | | 2,262,951 | 21,316,999 |
| TOTAL BOND FUNDS (Cost $35,858,175) | | | 33,639,784 |
| | | | |
| Short-Term Funds - 10.8% |
| | | Shares | Value ($) |
VIP Government Money Market Portfolio Investor Class 5.09% (a)(b) (Cost $6,023,374) | | 6,023,374 | 6,023,374 |
| | | | |
| TOTAL INVESTMENT IN SECURITIES - 100.0% (Cost $51,536,899) | 55,964,811 |
NET OTHER ASSETS (LIABILITIES) - 0.0% | 31 |
| NET ASSETS - 100.0% | 55,964,842 |
| | |
Legend
| (b) | The rate quoted is the annualized seven-day yield of the fund at period end. |
Affiliated Underlying Funds
Fiscal year to date information regarding the Fund's investments in affiliated Underlying Funds is presented below. Exchanges between classes of the same affiliated Underlying Funds may occur. If an Underlying Funds changes its name, the name presented below is the name in effect at period end.
| Affiliate | Value, beginning of period ($) | Purchases ($) | Sales Proceeds ($) | Dividend Income ($) | Realized Gain (loss) ($) | Change in Unrealized appreciation (depreciation) ($) | Value, end of period ($) |
| Fidelity Inflation-Protected Bond Index Fund | 9,058,065 | 287,273 | 749,811 | 14,814 | (64,555) | 129,419 | 8,660,391 |
| Fidelity International Bond Index Fund | 1,580,749 | 56,830 | 280,741 | 15,149 | (23,454) | 13,724 | 1,347,108 |
| Fidelity Long-Term Treasury Bond Index Fund | 2,030,133 | 95,045 | 617,791 | 28,724 | (165,108) | 46,871 | 1,389,150 |
| VIP Contrafund Portfolio Investor Class | 1,074,930 | 133,661 | 251,583 | 4,756 | 55,472 | 212,815 | 1,225,295 |
| VIP Emerging Markets Portfolio Investor Class | 3,345,014 | 489,308 | 429,638 | 2,915 | 40,888 | 271,768 | 3,717,340 |
| VIP Equity-Income Portfolio Investor Class | 871,684 | 199,892 | 159,122 | 5,206 | 7,410 | 79,666 | 999,530 |
| VIP Government Money Market Portfolio Investor Class 5.09% | 7,342,620 | 1,039,240 | 2,358,486 | 159,536 | - | - | 6,023,374 |
| VIP Growth & Income Portfolio Investor Class | 1,197,780 | 241,414 | 240,596 | 8,719 | 13,284 | 162,986 | 1,374,868 |
| VIP Growth Portfolio Investor Class | 1,780,132 | 251,615 | 388,621 | 29,172 | 73,166 | 320,948 | 2,037,240 |
| VIP High Income Portfolio Investor Class | 931,209 | 22,279 | 55,229 | 403 | (6,041) | 33,918 | 926,136 |
| VIP Investment Grade Bond II Portfolio Investor Class | 20,544,834 | 2,029,571 | 1,177,943 | 12,945 | (14,555) | (64,908) | 21,316,999 |
| VIP Mid Cap Portfolio Investor Class | 272,870 | 62,296 | 44,620 | 5,334 | 2,484 | 22,410 | 315,440 |
| VIP Overseas Portfolio Investor Class | 5,434,877 | 423,730 | 668,937 | 20,761 | 96,872 | 297,144 | 5,583,686 |
| VIP Value Portfolio Investor Class | 608,277 | 171,892 | 96,263 | 13,978 | 4,638 | 11,516 | 700,060 |
| VIP Value Strategies Portfolio Investor Class | 300,815 | 87,486 | 47,700 | 4,511 | 2,692 | 4,901 | 348,194 |
| | 56,373,989 | 5,591,532 | 7,567,081 | 326,923 | 23,193 | 1,543,178 | 55,964,811 |
Amounts in the dividend income column in the above table include any capital gain distributions from underlying funds, which are presented in the corresponding line item in the Statement of Operations, if applicable.
Amounts included in the purchases and sales proceeds columns may include in-kind transactions, if applicable.
Investment Valuation
The following is a summary of the inputs used, as of June 30, 2024, involving the Fund's assets and liabilities carried at fair value. The inputs or methodology used for valuing securities may not be an indication of the risk associated with investing in those securities. For more information on valuation inputs, and their aggregation into the levels used below, please refer to the Investment Valuation section in the accompanying Notes to Financial Statements.
| Valuation Inputs at Reporting Date: |
| Description | Total ($) | Level 1 ($) | Level 2 ($) | Level 3 ($) |
Investments in Securities: | | | | |
|
| Domestic Equity Funds | 7,000,627 | 7,000,627 | - | - |
|
| International Equity Funds | 9,301,026 | 9,301,026 | - | - |
|
| Bond Funds | 33,639,784 | 33,639,784 | - | - |
|
| Short-Term Funds | 6,023,374 | 6,023,374 | - | - |
| Total Investments in Securities: | 55,964,811 | 55,964,811 | - | - |
VIP Investor Freedom 2010 Portfolio℠
Financial Statements (Unaudited)
| Statement of Assets and Liabilities |
| | | | June 30, 2024 (Unaudited) |
| | | | | |
| Assets | | | | |
| Investment in securities, at value - See accompanying schedule: | | | | |
Affiliated issuers (cost $51,536,899) | $ | 55,964,811 | | |
| | | | | |
| | | | | |
| Total Investment in Securities (cost $51,536,899) | | | $ | 55,964,811 |
| Cash | | | | 10 |
| Receivable for investments sold | | | | 234,648 |
Total assets | | | | 56,199,469 |
| Liabilities | | | | |
| Payable for investments purchased | $ | 230,903 | | |
| Payable for fund shares redeemed | | 3,724 | | |
| Total liabilities | | | | 234,627 |
| Net Assets | | | $ | 55,964,842 |
| Net Assets consist of: | | | | |
| Paid in capital | | | $ | 52,607,684 |
| Total accumulated earnings (loss) | | | | 3,357,158 |
| Net Assets | | | $ | 55,964,842 |
Net Asset Value, offering price and redemption price per share ($55,964,842 ÷ 4,595,581 shares) | | | $ | 12.18 |
| Statement of Operations |
| | | | Six months ended June 30, 2024 (Unaudited) |
| Investment Income | | | | |
| Dividends: | | | | |
| Affiliated issuers | | | $ | 247,891 |
| Expenses | | | | |
| Independent trustees' fees and expenses | $ | 75 | | |
| Total expenses | | | | 75 |
| Net Investment income (loss) | | | | 247,816 |
| Realized and Unrealized Gain (Loss) | | | | |
| Net realized gain (loss) on: | | | | |
| Investment Securities: | | | | |
| Affiliated issuers | | 23,193 | | |
| Capital gain distributions from underlying funds: | | | | |
| Affiliated issuers | | 79,032 | | |
| Total net realized gain (loss) | | | | 102,225 |
| Change in net unrealized appreciation (depreciation) on: | | | | |
| Investment Securities: | | | | |
| Affiliated issuers | | 1,543,178 | | |
| Total change in net unrealized appreciation (depreciation) | | | | 1,543,178 |
| Net gain (loss) | | | | 1,645,403 |
| Net increase (decrease) in net assets resulting from operations | | | $ | 1,893,219 |
| Statement of Changes in Net Assets |
| |
| | Six months ended June 30, 2024 (Unaudited) | | Year ended December 31, 2023 |
| Increase (Decrease) in Net Assets | | | | |
| Operations | | | | |
| Net investment income (loss) | $ | 247,816 | $ | 1,787,859 |
| Net realized gain (loss) | | 102,225 | | 347,151 |
| Change in net unrealized appreciation (depreciation) | | 1,543,178 | | 3,116,971 |
| Net increase (decrease) in net assets resulting from operations | | 1,893,219 | | 5,251,981 |
| Distributions to shareholders | | (350,347) | | (2,290,424) |
| | | | | |
| Share transactions | | | | |
| Proceeds from sales of shares | | 126,611 | | 1,062,269 |
| Reinvestment of distributions | | 350,347 | | 2,290,424 |
| Cost of shares redeemed | | (2,431,026) | | (12,657,329) |
| | | | | |
Net increase (decrease) in net assets resulting from share transactions | | (1,954,068) | | (9,304,636) |
| Total increase (decrease) in net assets | | (411,196) | | (6,343,079) |
| | | | | |
| Net Assets | | | | |
| Beginning of period | | 56,376,038 | | 62,719,117 |
| End of period | $ | 55,964,842 | $ | 56,376,038 |
| | | | | |
| Other Information | | | | |
| Shares | | | | |
| Sold | | 10,452 | | 90,730 |
| Issued in reinvestment of distributions | | 29,741 | | 196,386 |
| Redeemed | | (203,026) | | (1,094,117) |
| Net increase (decrease) | | (162,833) | | (807,001) |
| | | | | |
Financial Highlights
VIP Investor Freedom 2010 Portfolio℠ |
| |
| | Six months ended (Unaudited) June 30, 2024 | | Years ended December 31, 2023 | | 2022 | | 2021 | | 2020 | | 2019 |
Selected Per-Share Data | | | | | | | | | | | | |
| Net asset value, beginning of period | $ | 11.85 | $ | 11.27 | $ | 13.93 | $ | 13.73 | $ | 12.84 | $ | 11.79 |
| Income from Investment Operations | | | | | | | | | | | | |
Net investment income (loss) A,B | | .05 | | .35 | | .29 | | .26 | | .17 | | .27 |
| Net realized and unrealized gain (loss) | | .35 | | .70 | | (2.10) | | .52 | | 1.37 | | 1.57 |
| Total from investment operations | | .40 | | 1.05 | | (1.81) | | .78 | | 1.54 | | 1.84 |
| Distributions from net investment income | | (.07) | | (.47) | | (.26) | | (.14) | | (.17) | | (.26) |
| Distributions from net realized gain | | - | | - | | (.59) | | (.44) | | (.49) | | (.53) |
| Total distributions | | (.07) | | (.47) | | (.85) | | (.58) | | (.65) C | | (.79) |
| Net asset value, end of period | $ | 12.18 | $ | 11.85 | $ | 11.27 | $ | 13.93 | $ | 13.73 | $ | 12.84 |
Total Return D,E,F | | | | 9.40% | | (13.50)% | | 5.81% | | 12.40% | | 16.10% |
Ratios to Average Net Assets B,G,H | | | | | | | | | | | | |
Expenses before reductions I | | -% J | | -% | | -% | | -% | | -% | | -% |
Expenses net of fee waivers, if any I | | | | -% | | -% | | -% | | -% | | -% |
Expenses net of all reductions I | | -% J | | -% | | -% | | -% | | -% | | -% |
| Net investment income (loss) | | .88% J | | 3.03% | | 2.40% | | 1.87% | | 1.33% | | 2.15% |
| Supplemental Data | | | | | | | | | | | | |
| Net assets, end of period (000 omitted) | $ | 55,965 | $ | 56,376 | $ | 62,719 | $ | 85,277 | $ | 76,008 | $ | 66,651 |
Portfolio turnover rate K | | | | 18% | | 64% | | 23% | | 39% | | 31% |
ACalculated based on average shares outstanding during the period.
BNet investment income (loss) is affected by the timing of the declaration of dividends by any underlying mutual funds or exchange-traded funds (ETFs). Net investment income (loss) of any mutual funds or ETFs is not included in the Fund's net investment income (loss) ratio.
CTotal distributions per share do not sum due to rounding.
DTotal returns for periods of less than one year are not annualized.
ETotal returns do not reflect charges attributable to your insurance company's separate account. Inclusion of these charges would reduce the total returns shown.
FTotal returns would have been lower if certain expenses had not been reduced during the applicable periods shown.
GFees and expenses of any underlying mutual funds or exchange-traded funds (ETFs) are not included in the Fund's expense ratio. The Fund indirectly bears its proportionate share of these expenses.
HExpense ratios reflect operating expenses of the class. Expenses before reductions do not reflect amounts reimbursed, waived, or reduced through arrangements with the investment adviser, brokerage services, or other offset arrangements, if applicable, and do not represent the amount paid by the class during periods when reimbursements, waivers or reductions occur.
IAmount represents less than $.005 per share.
JAnnualized.
KAmount does not include the portfolio activity of any underlying mutual funds or exchange-traded funds (ETFs).
VIP Investor Freedom 2015 Portfolio℠
Schedule of Investments June 30, 2024 (Unaudited)
Showing Percentage of Net Assets
| Domestic Equity Funds - 18.0% |
| | | Shares | Value ($) |
| VIP Contrafund Portfolio Investor Class (a) | | 47,877 | 2,874,071 |
| VIP Equity-Income Portfolio Investor Class (a) | | 87,512 | 2,344,438 |
| VIP Growth & Income Portfolio Investor Class (a) | | 105,766 | 3,224,805 |
| VIP Growth Portfolio Investor Class (a) | | 42,555 | 4,778,530 |
| VIP Mid Cap Portfolio Investor Class (a) | | 19,015 | 739,874 |
| VIP Value Portfolio Investor Class (a) | | 84,772 | 1,642,025 |
| VIP Value Strategies Portfolio Investor Class (a) | | 49,199 | 816,697 |
| TOTAL DOMESTIC EQUITY FUNDS (Cost $7,807,662) | | | 16,420,440 |
| | | | |
| International Equity Funds - 20.3% |
| | | Shares | Value ($) |
| VIP Emerging Markets Portfolio Investor Class (a) | | 608,767 | 7,025,174 |
| VIP Overseas Portfolio Investor Class (a) | | 415,126 | 11,469,938 |
| TOTAL INTERNATIONAL EQUITY FUNDS (Cost $12,208,214) | | | 18,495,112 |
| | | | |
| Bond Funds - 56.4% |
| | | Shares | Value ($) |
| Fidelity Inflation-Protected Bond Index Fund (a) | | 1,437,983 | 13,100,023 |
| Fidelity International Bond Index Fund (a) | | 267,994 | 2,449,462 |
| Fidelity Long-Term Treasury Bond Index Fund (a) | | 245,944 | 2,334,008 |
| VIP High Income Portfolio Investor Class (a) | | 320,865 | 1,508,064 |
| VIP Investment Grade Bond II Portfolio Investor Class (a) | | 3,399,193 | 32,020,398 |
| TOTAL BOND FUNDS (Cost $54,970,620) | | | 51,411,955 |
| | | | |
| Short-Term Funds - 5.3% |
| | | Shares | Value ($) |
VIP Government Money Market Portfolio Investor Class 5.09% (a)(b) (Cost $4,780,108) | | 4,780,108 | 4,780,108 |
| | | | |
| TOTAL INVESTMENT IN SECURITIES - 100.0% (Cost $79,766,604) | 91,107,615 |
NET OTHER ASSETS (LIABILITIES) - 0.0% | 31 |
| NET ASSETS - 100.0% | 91,107,646 |
| | |
Legend
| (b) | The rate quoted is the annualized seven-day yield of the fund at period end. |
Affiliated Underlying Funds
Fiscal year to date information regarding the Fund's investments in affiliated Underlying Funds is presented below. Exchanges between classes of the same affiliated Underlying Funds may occur. If an Underlying Funds changes its name, the name presented below is the name in effect at period end.
| Affiliate | Value, beginning of period ($) | Purchases ($) | Sales Proceeds ($) | Dividend Income ($) | Realized Gain (loss) ($) | Change in Unrealized appreciation (depreciation) ($) | Value, end of period ($) |
| Fidelity Inflation-Protected Bond Index Fund | 13,627,799 | 775,935 | 1,400,942 | 22,070 | (44,397) | 141,628 | 13,100,023 |
| Fidelity International Bond Index Fund | 2,798,139 | 180,112 | 511,304 | 26,534 | (20,005) | 2,520 | 2,449,462 |
| Fidelity Long-Term Treasury Bond Index Fund | 3,360,256 | 225,871 | 1,057,573 | 47,389 | (236,208) | 41,662 | 2,334,008 |
| VIP Contrafund Portfolio Investor Class | 2,616,792 | 248,252 | 614,946 | 10,855 | 158,347 | 465,626 | 2,874,071 |
| VIP Emerging Markets Portfolio Investor Class | 6,343,446 | 978,117 | 876,166 | 5,419 | 68,327 | 511,450 | 7,025,174 |
| VIP Equity-Income Portfolio Investor Class | 2,121,988 | 388,525 | 363,335 | 12,109 | 11,329 | 185,931 | 2,344,438 |
| VIP Government Money Market Portfolio Investor Class 5.09% | 6,852,888 | 1,444,385 | 3,517,165 | 132,175 | - | - | 4,780,108 |
| VIP Growth & Income Portfolio Investor Class | 2,915,835 | 416,475 | 511,779 | 20,019 | 22,584 | 381,690 | 3,224,805 |
| VIP Growth Portfolio Investor Class | 4,333,562 | 439,119 | 913,434 | 66,579 | 123,315 | 795,968 | 4,778,530 |
| VIP High Income Portfolio Investor Class | 1,503,864 | 72,859 | 113,076 | 640 | (4,210) | 48,627 | 1,508,064 |
| VIP Investment Grade Bond II Portfolio Investor Class | 30,477,999 | 3,816,913 | 2,156,454 | 18,878 | (47,310) | (70,750) | 32,020,398 |
| VIP Mid Cap Portfolio Investor Class | 664,295 | 129,625 | 110,647 | 12,532 | 6,717 | 49,884 | 739,874 |
| VIP Overseas Portfolio Investor Class | 11,183,279 | 926,342 | 1,433,324 | 42,038 | 210,048 | 583,593 | 11,469,938 |
| VIP Value Portfolio Investor Class | 1,480,804 | 354,480 | 226,099 | 32,486 | 19,149 | 13,691 | 1,642,025 |
| VIP Value Strategies Portfolio Investor Class | 732,325 | 186,141 | 116,756 | 10,466 | 10,614 | 4,373 | 816,697 |
| | 91,013,271 | 10,583,151 | 13,923,000 | 460,189 | 278,300 | 3,155,893 | 91,107,615 |
Amounts in the dividend income column in the above table include any capital gain distributions from underlying funds, which are presented in the corresponding line item in the Statement of Operations, if applicable.
Amounts included in the purchases and sales proceeds columns may include in-kind transactions, if applicable.
Investment Valuation
The following is a summary of the inputs used, as of June 30, 2024, involving the Fund's assets and liabilities carried at fair value. The inputs or methodology used for valuing securities may not be an indication of the risk associated with investing in those securities. For more information on valuation inputs, and their aggregation into the levels used below, please refer to the Investment Valuation section in the accompanying Notes to Financial Statements.
| Valuation Inputs at Reporting Date: |
| Description | Total ($) | Level 1 ($) | Level 2 ($) | Level 3 ($) |
Investments in Securities: | | | | |
|
| Domestic Equity Funds | 16,420,440 | 16,420,440 | - | - |
|
| International Equity Funds | 18,495,112 | 18,495,112 | - | - |
|
| Bond Funds | 51,411,955 | 51,411,955 | - | - |
|
| Short-Term Funds | 4,780,108 | 4,780,108 | - | - |
| Total Investments in Securities: | 91,107,615 | 91,107,615 | - | - |
VIP Investor Freedom 2015 Portfolio℠
Financial Statements (Unaudited)
| Statement of Assets and Liabilities |
| | | | June 30, 2024 (Unaudited) |
| | | | | |
| Assets | | | | |
| Investment in securities, at value - See accompanying schedule: | | | | |
Affiliated issuers (cost $79,766,604) | $ | 91,107,615 | | |
| | | | | |
| | | | | |
| Total Investment in Securities (cost $79,766,604) | | | $ | 91,107,615 |
| Cash | | | | 10 |
| Receivable for investments sold | | | | 438,548 |
| Receivable for fund shares sold | | | | 27 |
Total assets | | | | 91,546,200 |
| Liabilities | | | | |
| Payable for investments purchased | $ | 438,073 | | |
| Payable for fund shares redeemed | | 481 | | |
| Total liabilities | | | | 438,554 |
| Net Assets | | | $ | 91,107,646 |
| Net Assets consist of: | | | | |
| Paid in capital | | | $ | 79,606,032 |
| Total accumulated earnings (loss) | | | | 11,501,614 |
| Net Assets | | | $ | 91,107,646 |
Net Asset Value, offering price and redemption price per share ($91,107,646 ÷ 7,414,731 shares) | | | $ | 12.29 |
| Statement of Operations |
| | | | Six months ended June 30, 2024 (Unaudited) |
| Investment Income | | | | |
| Dividends: | | | | |
| Affiliated issuers | | | $ | 280,387 |
| Expenses | | | | |
| Independent trustees' fees and expenses | $ | 120 | | |
| Total expenses | | | | 120 |
| Net Investment income (loss) | | | | 280,267 |
| Realized and Unrealized Gain (Loss) | | | | |
| Net realized gain (loss) on: | | | | |
| Investment Securities: | | | | |
| Affiliated issuers | | 278,300 | | |
| Capital gain distributions from underlying funds: | | | | |
| Affiliated issuers | | 179,802 | | |
| Total net realized gain (loss) | | | | 458,102 |
| Change in net unrealized appreciation (depreciation) on: | | | | |
| Investment Securities: | | | | |
| Affiliated issuers | | 3,155,893 | | |
| Total change in net unrealized appreciation (depreciation) | | | | 3,155,893 |
| Net gain (loss) | | | | 3,613,995 |
| Net increase (decrease) in net assets resulting from operations | | | $ | 3,894,262 |
| Statement of Changes in Net Assets |
| |
| | Six months ended June 30, 2024 (Unaudited) | | Year ended December 31, 2023 |
| Increase (Decrease) in Net Assets | | | | |
| Operations | | | | |
| Net investment income (loss) | $ | 280,267 | $ | 2,574,669 |
| Net realized gain (loss) | | 458,102 | | 1,142,123 |
| Change in net unrealized appreciation (depreciation) | | 3,155,893 | | 5,945,677 |
| Net increase (decrease) in net assets resulting from operations | | 3,894,262 | | 9,662,469 |
| Distributions to shareholders | | (570,796) | | (3,297,264) |
| | | | | |
| Share transactions | | | | |
| Proceeds from sales of shares | | 2,981,746 | | 1,806,390 |
| Reinvestment of distributions | | 570,796 | | 3,297,264 |
| Cost of shares redeemed | | (6,783,514) | | (19,521,477) |
| | | | | |
Net increase (decrease) in net assets resulting from share transactions | | (3,230,972) | | (14,417,823) |
| Total increase (decrease) in net assets | | 92,494 | | (8,052,618) |
| | | | | |
| Net Assets | | | | |
| Beginning of period | | 91,015,152 | | 99,067,770 |
| End of period | $ | 91,107,646 | $ | 91,015,152 |
| | | | | |
| Other Information | | | | |
| Shares | | | | |
| Sold | | 247,302 | | 154,397 |
| Issued in reinvestment of distributions | | 48,291 | | 284,558 |
| Redeemed | | (569,180) | | (1,703,834) |
| Net increase (decrease) | | (273,587) | | (1,264,879) |
| | | | | |
Financial Highlights
VIP Investor Freedom 2015 Portfolio℠ |
| |
| | Six months ended (Unaudited) June 30, 2024 | | Years ended December 31, 2023 | | 2022 | | 2021 | | 2020 | | 2019 |
Selected Per-Share Data | | | | | | | | | | | | |
| Net asset value, beginning of period | $ | 11.84 | $ | 11.07 | $ | 14.02 | $ | 13.73 | $ | 12.86 | $ | 11.59 |
| Income from Investment Operations | | | | | | | | | | | | |
Net investment income (loss) A,B | | .04 | | .31 | | .28 | | .25 | | .16 | | .25 |
| Net realized and unrealized gain (loss) | | .49 | | .88 | | (2.23) | | .78 | | 1.53 | | 1.80 |
| Total from investment operations | | .53 | | 1.19 | | (1.95) | | 1.03 | | 1.69 | | 2.05 |
| Distributions from net investment income | | (.07) | | (.42) | | (.25) | | (.15) | | (.17) | | (.26) |
| Distributions from net realized gain | | (.01) | | - | | (.75) | | (.59) | | (.66) | | (.52) |
| Total distributions | | (.08) | | (.42) | | (1.00) | | (.74) | | (.82) C | | (.78) |
| Net asset value, end of period | $ | 12.29 | $ | 11.84 | $ | 11.07 | $ | 14.02 | $ | 13.73 | $ | 12.86 |
Total Return D,E,F | | | | 10.85% | | (14.58)% | | 7.64% | | 13.70% | | 18.24% |
Ratios to Average Net Assets B,G,H | | | | | | | | | | | | |
Expenses before reductions I | | -% J | | -% | | -% | | -% | | -% | | -% |
Expenses net of fee waivers, if any I | | | | -% | | -% | | -% | | -% | | -% |
Expenses net of all reductions I | | -% J | | -% | | -% | | -% | | -% | | -% |
| Net investment income (loss) | | .62% J | | 2.74% | | 2.34% | | 1.78% | | 1.28% | | 2.05% |
| Supplemental Data | | | | | | | | | | | | |
| Net assets, end of period (000 omitted) | $ | 91,108 | $ | 91,015 | $ | 99,068 | $ | 123,323 | $ | 114,226 | $ | 107,298 |
Portfolio turnover rate K | | | | 19% | | 69% | | 31% | | 42% | | 30% |
ACalculated based on average shares outstanding during the period.
BNet investment income (loss) is affected by the timing of the declaration of dividends by any underlying mutual funds or exchange-traded funds (ETFs). Net investment income (loss) of any mutual funds or ETFs is not included in the Fund's net investment income (loss) ratio.
CTotal distributions per share do not sum due to rounding.
DTotal returns for periods of less than one year are not annualized.
ETotal returns do not reflect charges attributable to your insurance company's separate account. Inclusion of these charges would reduce the total returns shown.
FTotal returns would have been lower if certain expenses had not been reduced during the applicable periods shown.
GFees and expenses of any underlying mutual funds or exchange-traded funds (ETFs) are not included in the Fund's expense ratio. The Fund indirectly bears its proportionate share of these expenses.
HExpense ratios reflect operating expenses of the class. Expenses before reductions do not reflect amounts reimbursed, waived, or reduced through arrangements with the investment adviser, brokerage services, or other offset arrangements, if applicable, and do not represent the amount paid by the class during periods when reimbursements, waivers or reductions occur.
IAmount represents less than $.005 per share.
JAnnualized.
KAmount does not include the portfolio activity of any underlying mutual funds or exchange-traded funds (ETFs).
VIP Investor Freedom 2020 Portfolio℠
Schedule of Investments June 30, 2024 (Unaudited)
Showing Percentage of Net Assets
| Domestic Equity Funds - 23.5% |
| | | Shares | Value ($) |
| VIP Contrafund Portfolio Investor Class (a) | | 124,799 | 7,491,698 |
| VIP Equity-Income Portfolio Investor Class (a) | | 228,109 | 6,111,034 |
| VIP Growth & Income Portfolio Investor Class (a) | | 275,690 | 8,405,796 |
| VIP Growth Portfolio Investor Class (a) | | 110,926 | 12,455,887 |
| VIP Mid Cap Portfolio Investor Class (a) | | 49,565 | 1,928,557 |
| VIP Value Portfolio Investor Class (a) | | 220,967 | 4,280,125 |
| VIP Value Strategies Portfolio Investor Class (a) | | 128,241 | 2,128,795 |
| TOTAL DOMESTIC EQUITY FUNDS (Cost $20,265,231) | | | 42,801,892 |
| | | | |
| International Equity Funds - 24.0% |
| | | Shares | Value ($) |
| VIP Emerging Markets Portfolio Investor Class (a) | | 1,381,247 | 15,939,589 |
| VIP Overseas Portfolio Investor Class (a) | | 1,000,716 | 27,649,771 |
| TOTAL INTERNATIONAL EQUITY FUNDS (Cost $29,157,553) | | | 43,589,360 |
| | | | |
| Bond Funds - 52.3% |
| | | Shares | Value ($) |
| Fidelity Inflation-Protected Bond Index Fund (a) | | 2,693,730 | 24,539,879 |
| Fidelity International Bond Index Fund (a) | | 596,602 | 5,452,942 |
| Fidelity Long-Term Treasury Bond Index Fund (a) | | 577,958 | 5,484,825 |
| VIP High Income Portfolio Investor Class (a) | | 640,244 | 3,009,149 |
| VIP Investment Grade Bond II Portfolio Investor Class (a) | | 6,000,832 | 56,527,833 |
| TOTAL BOND FUNDS (Cost $101,809,606) | | | 95,014,628 |
| | | | |
| Short-Term Funds - 0.2% |
| | | Shares | Value ($) |
VIP Government Money Market Portfolio Investor Class 5.09% (a)(b) (Cost $347,622) | | 347,622 | 347,622 |
| | | | |
| TOTAL INVESTMENT IN SECURITIES - 100.0% (Cost $151,580,012) | 181,753,502 |
NET OTHER ASSETS (LIABILITIES) - 0.0% | 3,452 |
| NET ASSETS - 100.0% | 181,756,954 |
| | |
Legend
| (b) | The rate quoted is the annualized seven-day yield of the fund at period end. |
Affiliated Underlying Funds
Fiscal year to date information regarding the Fund's investments in affiliated Underlying Funds is presented below. Exchanges between classes of the same affiliated Underlying Funds may occur. If an Underlying Funds changes its name, the name presented below is the name in effect at period end.
| Affiliate | Value, beginning of period ($) | Purchases ($) | Sales Proceeds ($) | Dividend Income ($) | Realized Gain (loss) ($) | Change in Unrealized appreciation (depreciation) ($) | Value, end of period ($) |
| Fidelity Inflation-Protected Bond Index Fund | 26,220,041 | 1,792,125 | 3,650,847 | 42,166 | (170,167) | 348,727 | 24,539,879 |
| Fidelity International Bond Index Fund | 6,334,040 | 453,945 | 1,294,537 | 59,909 | (57,859) | 17,353 | 5,452,942 |
| Fidelity Long-Term Treasury Bond Index Fund | 7,104,399 | 1,719,723 | 2,920,783 | 108,901 | (477,695) | 59,181 | 5,484,825 |
| VIP Contrafund Portfolio Investor Class | 7,260,820 | 507,881 | 1,959,851 | 29,298 | 662,324 | 1,020,524 | 7,491,698 |
| VIP Emerging Markets Portfolio Investor Class | 15,115,781 | 2,127,541 | 2,662,900 | 12,921 | 164,564 | 1,194,603 | 15,939,589 |
| VIP Equity-Income Portfolio Investor Class | 5,887,833 | 846,309 | 1,151,946 | 33,122 | 62,945 | 465,893 | 6,111,034 |
| VIP Government Money Market Portfolio Investor Class 5.09% | 3,815,501 | 1,124,633 | 4,592,512 | 35,434 | - | - | 347,622 |
| VIP Growth & Income Portfolio Investor Class | 8,090,535 | 881,453 | 1,651,618 | 54,203 | 283,109 | 802,317 | 8,405,796 |
| VIP Growth Portfolio Investor Class | 12,024,459 | 932,349 | 2,982,166 | 179,684 | 554,849 | 1,926,396 | 12,455,887 |
| VIP High Income Portfolio Investor Class | 3,120,471 | 173,473 | 375,604 | 1,330 | (29,811) | 120,620 | 3,009,149 |
| VIP Investment Grade Bond II Portfolio Investor Class | 57,617,540 | 6,060,761 | 6,879,116 | 35,555 | (153,732) | (117,620) | 56,527,833 |
| VIP Mid Cap Portfolio Investor Class | 1,843,273 | 292,278 | 360,117 | 34,467 | 31,010 | 122,113 | 1,928,557 |
| VIP Overseas Portfolio Investor Class | 28,216,596 | 1,877,926 | 4,443,159 | 106,236 | 745,347 | 1,253,061 | 27,649,771 |
| VIP Value Portfolio Investor Class | 4,108,837 | 817,234 | 734,737 | 88,806 | 55,992 | 32,799 | 4,280,125 |
| VIP Value Strategies Portfolio Investor Class | 2,032,042 | 437,974 | 382,453 | 28,780 | 32,689 | 8,543 | 2,128,795 |
| | 188,792,168 | 20,045,605 | 36,042,346 | 850,812 | 1,703,565 | 7,254,510 | 181,753,502 |
Amounts in the dividend income column in the above table include any capital gain distributions from underlying funds, which are presented in the corresponding line item in the Statement of Operations, if applicable.
Amounts included in the purchases and sales proceeds columns may include in-kind transactions, if applicable.
Investment Valuation
The following is a summary of the inputs used, as of June 30, 2024, involving the Fund's assets and liabilities carried at fair value. The inputs or methodology used for valuing securities may not be an indication of the risk associated with investing in those securities. For more information on valuation inputs, and their aggregation into the levels used below, please refer to the Investment Valuation section in the accompanying Notes to Financial Statements.
| Valuation Inputs at Reporting Date: |
| Description | Total ($) | Level 1 ($) | Level 2 ($) | Level 3 ($) |
Investments in Securities: | | | | |
|
| Domestic Equity Funds | 42,801,892 | 42,801,892 | - | - |
|
| International Equity Funds | 43,589,360 | 43,589,360 | - | - |
|
| Bond Funds | 95,014,628 | 95,014,628 | - | - |
|
| Short-Term Funds | 347,622 | 347,622 | - | - |
| Total Investments in Securities: | 181,753,502 | 181,753,502 | - | - |
VIP Investor Freedom 2020 Portfolio℠
Financial Statements (Unaudited)
| Statement of Assets and Liabilities |
| | | | June 30, 2024 (Unaudited) |
| | | | | |
| Assets | | | | |
| Investment in securities, at value - See accompanying schedule: | | | | |
Affiliated issuers (cost $151,580,012) | $ | 181,753,502 | | |
| | | | | |
| | | | | |
| Total Investment in Securities (cost $151,580,012) | | | $ | 181,753,502 |
| Cash | | | | 3,422 |
| Receivable for investments sold | | | | 1,032,603 |
Total assets | | | | 182,789,527 |
| Liabilities | | | | |
| Payable for investments purchased | $ | 1,029,278 | | |
| Payable for fund shares redeemed | | 3,295 | | |
| Total liabilities | | | | 1,032,573 |
| Net Assets | | | $ | 181,756,954 |
| Net Assets consist of: | | | | |
| Paid in capital | | | $ | 150,155,265 |
| Total accumulated earnings (loss) | | | | 31,601,689 |
| Net Assets | | | $ | 181,756,954 |
Net Asset Value, offering price and redemption price per share ($181,756,954 ÷ 14,071,242 shares) | | | $ | 12.92 |
| Statement of Operations |
| | | | Six months ended June 30, 2024 (Unaudited) |
| Investment Income | | | | |
| Dividends: | | | | |
| Affiliated issuers | | | $ | 365,377 |
| Expenses | | | | |
| Independent trustees' fees and expenses | $ | 248 | | |
| Total expenses before reductions | | 248 | | |
| Expense reductions | | (30) | | |
| Total expenses after reductions | | | | 218 |
| Net Investment income (loss) | | | | 365,159 |
| Realized and Unrealized Gain (Loss) | | | | |
| Net realized gain (loss) on: | | | | |
| Investment Securities: | | | | |
| Affiliated issuers | | 1,703,565 | | |
| Capital gain distributions from underlying funds: | | | | |
| Affiliated issuers | | 485,435 | | |
| Total net realized gain (loss) | | | | 2,189,000 |
| Change in net unrealized appreciation (depreciation) on: | | | | |
| Investment Securities: | | | | |
| Affiliated issuers | | 7,254,510 | | |
| Total change in net unrealized appreciation (depreciation) | | | | 7,254,510 |
| Net gain (loss) | | | | 9,443,510 |
| Net increase (decrease) in net assets resulting from operations | | | $ | 9,808,669 |
| Statement of Changes in Net Assets |
| |
| | Six months ended June 30, 2024 (Unaudited) | | Year ended December 31, 2023 |
| Increase (Decrease) in Net Assets | | | | |
| Operations | | | | |
| Net investment income (loss) | $ | 365,159 | $ | 4,742,091 |
| Net realized gain (loss) | | 2,189,000 | | 3,014,725 |
| Change in net unrealized appreciation (depreciation) | | 7,254,510 | | 14,254,181 |
| Net increase (decrease) in net assets resulting from operations | | 9,808,669 | | 22,010,997 |
| Distributions to shareholders | | (2,398,602) | | (5,980,890) |
| | | | | |
| Share transactions | | | | |
| Proceeds from sales of shares | | 3,959,862 | | 5,702,745 |
| Reinvestment of distributions | | 2,398,602 | | 5,980,890 |
| Cost of shares redeemed | | (20,808,198) | | (28,888,352) |
| | | | | |
Net increase (decrease) in net assets resulting from share transactions | | (14,449,734) | | (17,204,717) |
| Total increase (decrease) in net assets | | (7,039,667) | | (1,174,610) |
| | | | | |
| Net Assets | | | | |
| Beginning of period | | 188,796,621 | | 189,971,231 |
| End of period | $ | 181,756,954 | $ | 188,796,621 |
| | | | | |
| Other Information | | | | |
| Shares | | | | |
| Sold | | 316,925 | | 473,472 |
| Issued in reinvestment of distributions | | 194,062 | | 495,145 |
| Redeemed | | (1,659,891) | | (2,421,850) |
| Net increase (decrease) | | (1,148,904) | | (1,453,233) |
| | | | | |
Financial Highlights
VIP Investor Freedom 2020 Portfolio℠ |
| |
| | Six months ended (Unaudited) June 30, 2024 | | Years ended December 31, 2023 | | 2022 | | 2021 | | 2020 | | 2019 |
Selected Per-Share Data | | | | | | | | | | | | |
| Net asset value, beginning of period | $ | 12.40 | $ | 11.39 | $ | 14.83 | $ | 14.36 | $ | 13.29 | $ | 11.73 |
| Income from Investment Operations | | | | | | | | | | | | |
Net investment income (loss) A,B | | .03 | | .30 | | .27 | | .26 | | .16 | | .26 |
| Net realized and unrealized gain (loss) | | .65 | | 1.10 | | (2.49) | | 1.07 | | 1.75 | | 2.04 |
| Total from investment operations | | .68 | | 1.40 | | (2.22) | | 1.33 | | 1.91 | | 2.30 |
| Distributions from net investment income | | (.07) | | (.39) | | (.26) | | (.16) | | (.17) | | (.26) |
| Distributions from net realized gain | | (.10) | | - | | (.97) | | (.71) | | (.67) | | (.48) |
| Total distributions | | (.16) C | | (.39) | | (1.22) C | | (.86) C | | (.84) | | (.74) |
| Net asset value, end of period | $ | 12.92 | $ | 12.40 | $ | 11.39 | $ | 14.83 | $ | 14.36 | $ | 13.29 |
Total Return D,E,F | | | | 12.39% | | (15.83)% | | 9.54% | | 14.95% | | 20.11% |
Ratios to Average Net Assets B,G,H | | | | | | | | | | | | |
Expenses before reductions I | | -% J | | -% | | -% | | -% | | -% | | -% |
Expenses net of fee waivers, if any I | | | | -% | | -% | | -% | | -% | | -% |
Expenses net of all reductions I | | -% J | | -% | | -% | | -% | | -% | | -% |
| Net investment income (loss) | | .40% J | | 2.49% | | 2.23% | | 1.78% | | 1.25% | | 2.05% |
| Supplemental Data | | | | | | | | | | | | |
| Net assets, end of period (000 omitted) | $ | 181,757 | $ | 188,797 | $ | 189,971 | $ | 252,026 | $ | 236,662 | $ | 229,641 |
Portfolio turnover rate K | | | | 22% | | 61% | | 32% | | 42% | | 32% |
ACalculated based on average shares outstanding during the period.
BNet investment income (loss) is affected by the timing of the declaration of dividends by any underlying mutual funds or exchange-traded funds (ETFs). Net investment income (loss) of any mutual funds or ETFs is not included in the Fund's net investment income (loss) ratio.
CTotal distributions per share do not sum due to rounding.
DTotal returns for periods of less than one year are not annualized.
ETotal returns do not reflect charges attributable to your insurance company's separate account. Inclusion of these charges would reduce the total returns shown.
FTotal returns would have been lower if certain expenses had not been reduced during the applicable periods shown.
GFees and expenses of any underlying mutual funds or exchange-traded funds (ETFs) are not included in the Fund's expense ratio. The Fund indirectly bears its proportionate share of these expenses.
HExpense ratios reflect operating expenses of the class. Expenses before reductions do not reflect amounts reimbursed, waived, or reduced through arrangements with the investment adviser, brokerage services, or other offset arrangements, if applicable, and do not represent the amount paid by the class during periods when reimbursements, waivers or reductions occur.
IAmount represents less than $.005 per share.
JAnnualized.
KAmount does not include the portfolio activity of any underlying mutual funds or exchange-traded funds (ETFs).
VIP Investor Freedom 2025 Portfolio℠
Schedule of Investments June 30, 2024 (Unaudited)
Showing Percentage of Net Assets
| Domestic Equity Funds - 28.4% |
| | | Shares | Value ($) |
| VIP Contrafund Portfolio Investor Class (a) | | 178,838 | 10,735,652 |
| VIP Equity-Income Portfolio Investor Class (a) | | 326,873 | 8,756,930 |
| VIP Growth & Income Portfolio Investor Class (a) | | 395,057 | 12,045,289 |
| VIP Growth Portfolio Investor Class (a) | | 158,957 | 17,849,231 |
| VIP Mid Cap Portfolio Investor Class (a) | | 71,024 | 2,763,557 |
| VIP Value Portfolio Investor Class (a) | | 316,639 | 6,133,294 |
| VIP Value Strategies Portfolio Investor Class (a) | | 183,762 | 3,050,456 |
| TOTAL DOMESTIC EQUITY FUNDS (Cost $27,849,942) | | | 61,334,409 |
| | | | |
| International Equity Funds - 27.3% |
| | | Shares | Value ($) |
| VIP Emerging Markets Portfolio Investor Class (a) | | 1,810,068 | 20,888,182 |
| VIP Overseas Portfolio Investor Class (a) | | 1,376,158 | 38,023,254 |
| TOTAL INTERNATIONAL EQUITY FUNDS (Cost $40,368,435) | | | 58,911,436 |
| | | | |
| Bond Funds - 44.3% |
| | | Shares | Value ($) |
| Fidelity Inflation-Protected Bond Index Fund (a) | | 2,924,593 | 26,643,046 |
| Fidelity International Bond Index Fund (a) | | 687,270 | 6,281,648 |
| Fidelity Long-Term Treasury Bond Index Fund (a) | | 1,406,897 | 13,351,455 |
| VIP High Income Portfolio Investor Class (a) | | 760,420 | 3,573,975 |
| VIP Investment Grade Bond II Portfolio Investor Class (a) | | 4,858,418 | 45,766,303 |
| TOTAL BOND FUNDS (Cost $102,814,089) | | | 95,616,427 |
| | | | |
| Short-Term Funds - 0.0% |
| | | Shares | Value ($) |
Fidelity Cash Central Fund 5.38% (b) (Cost $920) | | 920 | 920 |
| | | | |
| TOTAL INVESTMENT IN SECURITIES - 100.0% (Cost $171,033,386) | 215,863,192 |
NET OTHER ASSETS (LIABILITIES) - 0.0% | 51 |
| NET ASSETS - 100.0% | 215,863,243 |
| | |
Legend
| (b) | Affiliated fund that is generally available only to investment companies and other accounts managed by Fidelity Investments. The rate quoted is the annualized seven-day yield of the fund at period end. A complete unaudited listing of the fund's holdings as of its most recent quarter end is available upon request. In addition, each Fidelity Central Fund's financial statements are available on the SEC's website or upon request. |
Affiliated Central Funds
Fiscal year to date information regarding the Fund's investments in Fidelity Central Funds, including the ownership percentage, is presented below.
| Affiliate | Value, beginning of period ($) | Purchases ($) | Sales Proceeds ($) | Dividend Income ($) | Realized Gain (loss) ($) | Change in Unrealized appreciation (depreciation) ($) | Value, end of period ($) | % ownership, end of period |
| Fidelity Cash Central Fund 5.38% | 920 | - | - | 25 | - | - | 920 | 0.0% |
| Total | 920 | - | - | 25 | - | - | 920 | |
| | | | | | | | | |
Amounts in the dividend income column in the above table include any capital gain distributions from underlying funds, which are presented in the corresponding line item in the Statement of Operations, if applicable.
Amounts included in the purchases and sales proceeds columns may include in-kind transactions, if applicable.
Affiliated Underlying Funds
Fiscal year to date information regarding the Fund's investments in affiliated Underlying Funds is presented below. Exchanges between classes of the same affiliated Underlying Funds may occur. If an Underlying Funds changes its name, the name presented below is the name in effect at period end.
| Affiliate | Value, beginning of period ($) | Purchases ($) | Sales Proceeds ($) | Dividend Income ($) | Realized Gain (loss) ($) | Change in Unrealized appreciation (depreciation) ($) | Value, end of period ($) |
| Fidelity Inflation-Protected Bond Index Fund | 27,028,466 | 2,602,481 | 3,181,894 | 45,595 | (99,458) | 293,451 | 26,643,046 |
| Fidelity International Bond Index Fund | 7,653,948 | 649,579 | 1,974,448 | 71,916 | (107,755) | 60,324 | 6,281,648 |
| Fidelity Long-Term Treasury Bond Index Fund | 12,479,234 | 5,459,915 | 3,771,223 | 237,992 | (708,803) | (107,668) | 13,351,455 |
| VIP Contrafund Portfolio Investor Class | 10,488,933 | 537,641 | 2,709,325 | 42,063 | 1,005,823 | 1,412,580 | 10,735,652 |
| VIP Emerging Markets Portfolio Investor Class | 19,998,250 | 2,591,815 | 3,527,437 | 17,194 | 107,671 | 1,717,883 | 20,888,182 |
| VIP Equity-Income Portfolio Investor Class | 8,505,454 | 1,031,968 | 1,541,429 | 47,857 | 113,410 | 647,527 | 8,756,930 |
| VIP Government Money Market Portfolio Investor Class 5.09% | - | 441,957 | 441,957 | 1,902 | - | - | - |
| VIP Growth & Income Portfolio Investor Class | 11,687,466 | 1,071,612 | 2,275,065 | 78,288 | 473,541 | 1,087,735 | 12,045,289 |
| VIP Growth Portfolio Investor Class | 17,370,525 | 963,599 | 4,050,099 | 257,971 | 886,487 | 2,678,719 | 17,849,231 |
| VIP High Income Portfolio Investor Class | 3,726,207 | 184,064 | 444,972 | 1,596 | (43,861) | 152,537 | 3,573,975 |
| VIP Investment Grade Bond II Portfolio Investor Class | 56,274,990 | 3,327,907 | 13,484,762 | 33,365 | (728,701) | 376,869 | 45,766,303 |
| VIP Mid Cap Portfolio Investor Class | 2,662,837 | 374,905 | 494,005 | 49,921 | 57,124 | 162,696 | 2,763,557 |
| VIP Overseas Portfolio Investor Class | 38,664,121 | 2,439,305 | 5,832,210 | 146,799 | 972,098 | 1,779,940 | 38,023,254 |
| VIP Value Portfolio Investor Class | 5,935,662 | 1,053,939 | 983,561 | 128,284 | 64,445 | 62,809 | 6,133,294 |
| VIP Value Strategies Portfolio Investor Class | 2,935,535 | 579,937 | 524,105 | 41,679 | 38,811 | 20,278 | 3,050,456 |
| | 225,411,628 | 23,310,624 | 45,236,492 | 1,202,422 | 2,030,832 | 10,345,680 | 215,862,272 |
Amounts in the dividend income column in the above table include any capital gain distributions from underlying funds, which are presented in the corresponding line item in the Statement of Operations, if applicable.
Amounts included in the purchases and sales proceeds columns may include in-kind transactions, if applicable.
Investment Valuation
The following is a summary of the inputs used, as of June 30, 2024, involving the Fund's assets and liabilities carried at fair value. The inputs or methodology used for valuing securities may not be an indication of the risk associated with investing in those securities. For more information on valuation inputs, and their aggregation into the levels used below, please refer to the Investment Valuation section in the accompanying Notes to Financial Statements.
| Valuation Inputs at Reporting Date: |
| Description | Total ($) | Level 1 ($) | Level 2 ($) | Level 3 ($) |
Investments in Securities: | | | | |
|
| Domestic Equity Funds | 61,334,409 | 61,334,409 | - | - |
|
| International Equity Funds | 58,911,436 | 58,911,436 | - | - |
|
| Bond Funds | 95,616,427 | 95,616,427 | - | - |
|
| Short-Term Funds | 920 | 920 | - | - |
| Total Investments in Securities: | 215,863,192 | 215,863,192 | - | - |
VIP Investor Freedom 2025 Portfolio℠
Financial Statements (Unaudited)
| Statement of Assets and Liabilities |
| | | | June 30, 2024 (Unaudited) |
| | | | | |
| Assets | | | | |
| Investment in securities, at value - See accompanying schedule: | | | | |
Fidelity Central Funds (cost $920) | $ | 920 | | |
Other affiliated issuers (cost $171,032,466) | | 215,862,272 | | |
| | | | | |
| | | | | |
| Total Investment in Securities (cost $171,033,386) | | | $ | 215,863,192 |
| Cash | | | | 84 |
| Receivable for investments sold | | | | 1,392,371 |
| Receivable for fund shares sold | | | | 4,034 |
| Distributions receivable from Fidelity Central Funds | | | | 4 |
Total assets | | | | 217,259,685 |
| Liabilities | | | | |
| Payable for investments purchased | $ | 1,396,341 | | |
| Payable for fund shares redeemed | | 101 | | |
| Total liabilities | | | | 1,396,442 |
| Net Assets | | | $ | 215,863,243 |
| Net Assets consist of: | | | | |
| Paid in capital | | | $ | 169,223,637 |
| Total accumulated earnings (loss) | | | | 46,639,606 |
| Net Assets | | | $ | 215,863,243 |
Net Asset Value, offering price and redemption price per share ($215,863,243 ÷ 14,635,143 shares) | | | $ | 14.75 |
| Statement of Operations |
| | | | Six months ended June 30, 2024 (Unaudited) |
| Investment Income | | | | |
| Dividends: | | | | |
| Affiliated issuers | | | $ | 505,310 |
| Income from Fidelity Central Funds | | | | 25 |
| Total income | | | | 505,335 |
| Expenses | | | | |
| Independent trustees' fees and expenses | $ | 299 | | |
| Total expenses | | | | 299 |
| Net Investment income (loss) | | | | 505,036 |
| Realized and Unrealized Gain (Loss) | | | | |
| Net realized gain (loss) on: | | | | |
| Investment Securities: | | | | |
| Affiliated issuers | | 2,030,832 | | |
| Capital gain distributions from underlying funds: | | | | |
| Affiliated issuers | | 697,112 | | |
| Total net realized gain (loss) | | | | 2,727,944 |
| Change in net unrealized appreciation (depreciation) on: | | | | |
| Investment Securities: | | | | |
| Affiliated issuers | | 10,345,680 | | |
| Total change in net unrealized appreciation (depreciation) | | | | 10,345,680 |
| Net gain (loss) | | | | 13,073,624 |
| Net increase (decrease) in net assets resulting from operations | | | $ | 13,578,660 |
| Statement of Changes in Net Assets |
| |
| | Six months ended June 30, 2024 (Unaudited) | | Year ended December 31, 2023 |
| Increase (Decrease) in Net Assets | | | | |
| Operations | | | | |
| Net investment income (loss) | $ | 505,036 | $ | 5,169,881 |
| Net realized gain (loss) | | 2,727,944 | | 3,829,145 |
| Change in net unrealized appreciation (depreciation) | | 10,345,680 | | 20,169,538 |
| Net increase (decrease) in net assets resulting from operations | | 13,578,660 | | 29,168,564 |
| Distributions to shareholders | | (1,905,579) | | (6,397,113) |
| | | | | |
| Share transactions | | | | |
| Proceeds from sales of shares | | 1,980,132 | | 3,335,240 |
| Reinvestment of distributions | | 1,905,579 | | 6,397,113 |
| Cost of shares redeemed | | (25,108,096) | | (40,038,718) |
| | | | | |
Net increase (decrease) in net assets resulting from share transactions | | (21,222,385) | | (30,306,365) |
| Total increase (decrease) in net assets | | (9,549,304) | | (7,534,914) |
| | | | | |
| Net Assets | | | | |
| Beginning of period | | 225,412,547 | | 232,947,461 |
| End of period | $ | 215,863,243 | $ | 225,412,547 |
| | | | | |
| Other Information | | | | |
| Shares | | | | |
| Sold | | 138,102 | | 251,175 |
| Issued in reinvestment of distributions | | 135,628 | | 470,894 |
| Redeemed | | (1,754,100) | | (2,996,065) |
| Net increase (decrease) | | (1,480,370) | | (2,273,996) |
| | | | | |
Financial Highlights
VIP Investor Freedom 2025 Portfolio℠ |
| |
| | Six months ended (Unaudited) June 30, 2024 | | Years ended December 31, 2023 | | 2022 | | 2021 | | 2020 | | 2019 |
Selected Per-Share Data | | | | | | | | | | | | |
| Net asset value, beginning of period | $ | 13.99 | $ | 12.67 | $ | 16.55 | $ | 15.74 | $ | 14.38 | $ | 12.45 |
| Income from Investment Operations | | | | | | | | | | | | |
Net investment income (loss) A,B | | .03 | | .30 | | .27 | | .28 | | .18 | | .28 |
| Net realized and unrealized gain (loss) | | .85 | | 1.40 | | (2.85) | | 1.38 | | 2.02 | | 2.37 |
| Total from investment operations | | .88 | | 1.70 | | (2.58) | | 1.66 | | 2.20 | | 2.65 |
| Distributions from net investment income | | (.06) | | (.38) | | (.28) | | (.18) | | (.18) | | (.28) |
| Distributions from net realized gain | | (.06) | | - | | (1.02) | | (.67) | | (.66) | | (.44) |
| Total distributions | | (.12) | | (.38) | | (1.30) | | (.85) | | (.84) | | (.72) |
| Net asset value, end of period | $ | 14.75 | $ | 13.99 | $ | 12.67 | $ | 16.55 | $ | 15.74 | $ | 14.38 |
Total Return C,D,E | | | | 13.55% | | (16.45)% | | 10.78% | | 15.88% | | 21.73% |
Ratios to Average Net Assets B,F,G | | | | | | | | | | | | |
Expenses before reductions H | | -% I | | -% | | -% | | -% | | -% | | -% |
Expenses net of fee waivers, if any H | | | | -% | | -% | | -% | | -% | | -% |
Expenses net of all reductions H | | -% I | | -% | | -% | | -% | | -% | | -% |
| Net investment income (loss) | | .46% I | | 2.25% | | 2.02% | | 1.74% | | 1.26% | | 2.03% |
| Supplemental Data | | | | | | | | | | | | |
| Net assets, end of period (000 omitted) | $ | 215,863 | $ | 225,413 | $ | 232,947 | $ | 317,596 | $ | 285,539 | $ | 248,822 |
Portfolio turnover rate J | | | | 19% | | 60% | | 30% | | 43% | | 29% |
ACalculated based on average shares outstanding during the period.
BNet investment income (loss) is affected by the timing of the declaration of dividends by any underlying mutual funds or exchange-traded funds (ETFs). Net investment income (loss) of any mutual funds or ETFs is not included in the Fund's net investment income (loss) ratio.
CTotal returns for periods of less than one year are not annualized.
DTotal returns do not reflect charges attributable to your insurance company's separate account. Inclusion of these charges would reduce the total returns shown.
ETotal returns would have been lower if certain expenses had not been reduced during the applicable periods shown.
FFees and expenses of any underlying mutual funds or exchange-traded funds (ETFs) are not included in the Fund's expense ratio. The Fund indirectly bears its proportionate share of these expenses. For additional expense information related to investments in Fidelity Central Funds, please refer to the "Investments in Fidelity Central Funds" note found in the Notes to Financial Statements section of the most recent Annual or Semi-Annual report.
GExpense ratios reflect operating expenses of the class. Expenses before reductions do not reflect amounts reimbursed, waived, or reduced through arrangements with the investment adviser, brokerage services, or other offset arrangements, if applicable, and do not represent the amount paid by the class during periods when reimbursements, waivers or reductions occur.
HAmount represents less than $.005 per share.
IAnnualized.
JAmount does not include the portfolio activity of any underlying mutual funds or exchange-traded funds (ETFs).
VIP Investor Freedom 2030 Portfolio℠
Schedule of Investments June 30, 2024 (Unaudited)
Showing Percentage of Net Assets
| Domestic Equity Funds - 32.4% |
| | | Shares | Value ($) |
| VIP Contrafund Portfolio Investor Class (a) | | 347,487 | 20,859,619 |
| VIP Equity-Income Portfolio Investor Class (a) | | 635,110 | 17,014,603 |
| VIP Growth & Income Portfolio Investor Class (a) | | 767,588 | 23,403,760 |
| VIP Growth Portfolio Investor Class (a) | | 308,854 | 34,681,185 |
| VIP Mid Cap Portfolio Investor Class (a) | | 137,999 | 5,369,524 |
| VIP Value Portfolio Investor Class (a) | | 615,226 | 11,916,927 |
| VIP Value Strategies Portfolio Investor Class (a) | | 357,046 | 5,926,962 |
| TOTAL DOMESTIC EQUITY FUNDS (Cost $65,927,395) | | | 119,172,580 |
| | | | |
| International Equity Funds - 29.9% |
| | | Shares | Value ($) |
| VIP Emerging Markets Portfolio Investor Class (a) | | 3,332,711 | 38,459,490 |
| VIP Overseas Portfolio Investor Class (a) | | 2,597,472 | 71,768,141 |
| TOTAL INTERNATIONAL EQUITY FUNDS (Cost $83,230,417) | | | 110,227,631 |
| | | | |
| Bond Funds - 37.7% |
| | | Shares | Value ($) |
| Fidelity Inflation-Protected Bond Index Fund (a) | | 3,502,064 | 31,903,800 |
| Fidelity International Bond Index Fund (a) | | 966,462 | 8,833,465 |
| Fidelity Long-Term Treasury Bond Index Fund (a) | | 2,561,883 | 24,312,273 |
| VIP High Income Portfolio Investor Class (a) | | 1,297,536 | 6,098,417 |
| VIP Investment Grade Bond II Portfolio Investor Class (a) | | 7,197,057 | 67,796,280 |
| TOTAL BOND FUNDS (Cost $149,338,609) | | | 138,944,235 |
| | | | |
| TOTAL INVESTMENT IN SECURITIES - 100.0% (Cost $298,496,421) | 368,344,446 |
NET OTHER ASSETS (LIABILITIES) - 0.0% | (57) |
| NET ASSETS - 100.0% | 368,344,389 |
| | |
Legend
Affiliated Underlying Funds
Fiscal year to date information regarding the Fund's investments in affiliated Underlying Funds is presented below. Exchanges between classes of the same affiliated Underlying Funds may occur. If an Underlying Funds changes its name, the name presented below is the name in effect at period end.
| Affiliate | Value, beginning of period ($) | Purchases ($) | Sales Proceeds ($) | Dividend Income ($) | Realized Gain (loss) ($) | Change in Unrealized appreciation (depreciation) ($) | Value, end of period ($) |
| Fidelity Inflation-Protected Bond Index Fund | 29,308,255 | 4,086,339 | 1,741,707 | 51,431 | (5,626) | 256,539 | 31,903,800 |
| Fidelity International Bond Index Fund | 10,191,161 | 1,035,847 | 2,335,856 | 96,939 | (116,819) | 59,132 | 8,833,465 |
| Fidelity Long-Term Treasury Bond Index Fund | 20,988,446 | 9,439,383 | 4,743,257 | 415,055 | (1,055,521) | (316,778) | 24,312,273 |
| VIP Contrafund Portfolio Investor Class | 18,868,495 | 1,161,881 | 3,663,286 | 76,505 | 811,817 | 3,680,712 | 20,859,619 |
| VIP Emerging Markets Portfolio Investor Class | 33,950,905 | 4,882,613 | 3,655,493 | 29,581 | (86,877) | 3,368,342 | 38,459,490 |
| VIP Equity-Income Portfolio Investor Class | 15,300,404 | 1,972,924 | 1,661,113 | 86,916 | 56,171 | 1,346,217 | 17,014,603 |
| VIP Government Money Market Portfolio Investor Class 5.09% | - | 729,708 | 729,708 | 3,135 | - | - | - |
| VIP Growth & Income Portfolio Investor Class | 21,024,526 | 2,020,992 | 2,536,808 | 142,469 | 122,773 | 2,772,277 | 23,403,760 |
| VIP Growth Portfolio Investor Class | 31,247,840 | 2,114,658 | 5,316,424 | 469,193 | 702,600 | 5,932,511 | 34,681,185 |
| VIP High Income Portfolio Investor Class | 5,837,063 | 436,063 | 353,852 | 2,535 | (1,736) | 180,879 | 6,098,417 |
| VIP Investment Grade Bond II Portfolio Investor Class | 78,371,865 | 6,235,762 | 16,369,201 | 46,994 | (755,464) | 313,318 | 67,796,280 |
| VIP Mid Cap Portfolio Investor Class | 4,790,238 | 759,874 | 583,889 | 90,813 | 27,662 | 375,639 | 5,369,524 |
| VIP Overseas Portfolio Investor Class | 67,250,038 | 5,359,037 | 5,799,431 | 258,965 | 67,369 | 4,891,128 | 71,768,141 |
| VIP Value Portfolio Investor Class | 10,677,730 | 2,097,620 | 1,085,026 | 232,950 | 41,816 | 184,787 | 11,916,927 |
| VIP Value Strategies Portfolio Investor Class | 5,280,813 | 1,146,713 | 604,514 | 75,816 | 30,537 | 73,413 | 5,926,962 |
| | 353,087,779 | 43,479,414 | 51,179,565 | 2,079,297 | (161,298) | 23,118,116 | 368,344,446 |
Amounts in the dividend income column in the above table include any capital gain distributions from underlying funds, which are presented in the corresponding line item in the Statement of Operations, if applicable.
Amounts included in the purchases and sales proceeds columns may include in-kind transactions, if applicable.
Investment Valuation
The following is a summary of the inputs used, as of June 30, 2024, involving the Fund's assets and liabilities carried at fair value. The inputs or methodology used for valuing securities may not be an indication of the risk associated with investing in those securities. For more information on valuation inputs, and their aggregation into the levels used below, please refer to the Investment Valuation section in the accompanying Notes to Financial Statements.
| Valuation Inputs at Reporting Date: |
| Description | Total ($) | Level 1 ($) | Level 2 ($) | Level 3 ($) |
Investments in Securities: | | | | |
|
| Domestic Equity Funds | 119,172,580 | 119,172,580 | - | - |
|
| International Equity Funds | 110,227,631 | 110,227,631 | - | - |
|
| Bond Funds | 138,944,235 | 138,944,235 | - | - |
| Total Investments in Securities: | 368,344,446 | 368,344,446 | - | - |
VIP Investor Freedom 2030 Portfolio℠
Financial Statements (Unaudited)
| Statement of Assets and Liabilities |
| | | | June 30, 2024 (Unaudited) |
| | | | | |
| Assets | | | | |
| Investment in securities, at value - See accompanying schedule: | | | | |
Affiliated issuers (cost $298,496,421) | $ | 368,344,446 | | |
| | | | | |
| | | | | |
| Total Investment in Securities (cost $298,496,421) | | | $ | 368,344,446 |
| Cash | | | | 2 |
| Receivable for investments sold | | | | 2,383,368 |
| Receivable for fund shares sold | | | | 676,183 |
Total assets | | | | 371,403,999 |
| Liabilities | | | | |
| Payable for investments purchased | $ | 3,059,466 | | |
| Payable for fund shares redeemed | | 144 | | |
| Total liabilities | | | | 3,059,610 |
| Net Assets | | | $ | 368,344,389 |
| Net Assets consist of: | | | | |
| Paid in capital | | | $ | 302,413,031 |
| Total accumulated earnings (loss) | | | | 65,931,358 |
| Net Assets | | | $ | 368,344,389 |
Net Asset Value, offering price and redemption price per share ($368,344,389 ÷ 24,090,343 shares) | | | $ | 15.29 |
| Statement of Operations |
| | | | Six months ended June 30, 2024 (Unaudited) |
| Investment Income | | | | |
| Dividends: | | | | |
| Affiliated issuers | | | $ | 814,840 |
| Expenses | | | | |
| Independent trustees' fees and expenses | $ | 479 | | |
| Total expenses | | | | 479 |
| Net Investment income (loss) | | | | 814,361 |
| Realized and Unrealized Gain (Loss) | | | | |
| Net realized gain (loss) on: | | | | |
| Investment Securities: | | | | |
| Affiliated issuers | | (161,298) | | |
| Capital gain distributions from underlying funds: | | | | |
| Affiliated issuers | | 1,264,457 | | |
| Total net realized gain (loss) | | | | 1,103,159 |
| Change in net unrealized appreciation (depreciation) on: | | | | |
| Investment Securities: | | | | |
| Affiliated issuers | | 23,118,116 | | |
| Total change in net unrealized appreciation (depreciation) | | | | 23,118,116 |
| Net gain (loss) | | | | 24,221,275 |
| Net increase (decrease) in net assets resulting from operations | | | $ | 25,035,636 |
| Statement of Changes in Net Assets |
| |
| | Six months ended June 30, 2024 (Unaudited) | | Year ended December 31, 2023 |
| Increase (Decrease) in Net Assets | | | | |
| Operations | | | | |
| Net investment income (loss) | $ | 814,361 | $ | 7,330,788 |
| Net realized gain (loss) | | 1,103,159 | | 2,581,324 |
| Change in net unrealized appreciation (depreciation) | | 23,118,116 | | 37,546,454 |
| Net increase (decrease) in net assets resulting from operations | | 25,035,636 | | 47,458,566 |
| Distributions to shareholders | | (1,153,293) | | (8,449,708) |
| | | | | |
| Share transactions | | | | |
| Proceeds from sales of shares | | 7,423,221 | | 11,192,683 |
| Reinvestment of distributions | | 1,153,293 | | 8,449,708 |
| Cost of shares redeemed | | (17,202,137) | | (46,438,462) |
| | | | | |
Net increase (decrease) in net assets resulting from share transactions | | (8,625,623) | | (26,796,071) |
| Total increase (decrease) in net assets | | 15,256,720 | | 12,212,787 |
| | | | | |
| Net Assets | | | | |
| Beginning of period | | 353,087,669 | | 340,874,882 |
| End of period | $ | 368,344,389 | $ | 353,087,669 |
| | | | | |
| Other Information | | | | |
| Shares | | | | |
| Sold | | 504,641 | | 823,891 |
| Issued in reinvestment of distributions | | 79,483 | | 606,998 |
| Redeemed | | (1,160,774) | | (3,412,909) |
| Net increase (decrease) | | (576,650) | | (1,982,020) |
| | | | | |
Financial Highlights
VIP Investor Freedom 2030 Portfolio℠ |
| |
| | Six months ended (Unaudited) June 30, 2024 | | Years ended December 31, 2023 | | 2022 | | 2021 | | 2020 | | 2019 |
Selected Per-Share Data | | | | | | | | | | | | |
| Net asset value, beginning of period | $ | 14.31 | $ | 12.79 | $ | 16.73 | $ | 15.70 | $ | 14.26 | $ | 12.10 |
| Income from Investment Operations | | | | | | | | | | | | |
Net investment income (loss) A,B | | .03 | | .29 | | .26 | | .28 | | .17 | | .27 |
| Net realized and unrealized gain (loss) | | 1.00 | | 1.57 | | (2.95) | | 1.60 | | 2.14 | | 2.62 |
| Total from investment operations | | 1.03 | | 1.86 | | (2.69) | | 1.88 | | 2.31 | | 2.89 |
| Distributions from net investment income | | (.05) | | (.34) | | (.27) | | (.17) | | (.17) | | (.27) |
| Distributions from net realized gain | | - | | - | | (.99) | | (.68) | | (.69) | | (.46) |
| Total distributions | | (.05) | | (.34) | | (1.25) C | | (.85) | | (.87) C | | (.73) |
| Net asset value, end of period | $ | 15.29 | $ | 14.31 | $ | 12.79 | $ | 16.73 | $ | 15.70 | $ | 14.26 |
Total Return D,E,F | | | | 14.63% | | (16.91)% | | 12.25% | | 16.82% | | 24.42% |
Ratios to Average Net Assets B,G,H | | | | | | | | | | | | |
Expenses before reductions I | | -% J | | -% | | -% | | -% | | -% | | -% |
Expenses net of fee waivers, if any I | | | | -% | | -% | | -% | | -% | | -% |
Expenses net of all reductions I | | -% J | | -% | | -% | | -% | | -% | | -% |
| Net investment income (loss) | | .45% J | | 2.11% | | 1.88% | | 1.71% | | 1.26% | | 2.03% |
| Supplemental Data | | | | | | | | | | | | |
| Net assets, end of period (000 omitted) | $ | 368,344 | $ | 353,088 | $ | 340,875 | $ | 415,184 | $ | 325,667 | $ | 276,764 |
Portfolio turnover rate K | | | | 21% | | 57% | | 23% | | 41% | | 29% |
ACalculated based on average shares outstanding during the period.
BNet investment income (loss) is affected by the timing of the declaration of dividends by any underlying mutual funds or exchange-traded funds (ETFs). Net investment income (loss) of any mutual funds or ETFs is not included in the Fund's net investment income (loss) ratio.
CTotal distributions per share do not sum due to rounding.
DTotal returns for periods of less than one year are not annualized.
ETotal returns do not reflect charges attributable to your insurance company's separate account. Inclusion of these charges would reduce the total returns shown.
FTotal returns would have been lower if certain expenses had not been reduced during the applicable periods shown.
GFees and expenses of any underlying mutual funds or exchange-traded funds (ETFs) are not included in the Fund's expense ratio. The Fund indirectly bears its proportionate share of these expenses.
HExpense ratios reflect operating expenses of the class. Expenses before reductions do not reflect amounts reimbursed, waived, or reduced through arrangements with the investment adviser, brokerage services, or other offset arrangements, if applicable, and do not represent the amount paid by the class during periods when reimbursements, waivers or reductions occur.
IAmount represents less than $.005 per share.
JAnnualized.
KAmount does not include the portfolio activity of any underlying mutual funds or exchange-traded funds (ETFs).
VIP Investor Freedom 2035 Portfolio℠
Schedule of Investments June 30, 2024 (Unaudited)
Showing Percentage of Net Assets
| Domestic Equity Funds - 38.7% |
| | | Shares | Value ($) |
| VIP Contrafund Portfolio Investor Class (a) | | 15,125 | 907,968 |
| VIP Equity-Income Portfolio Investor Class (a) | | 27,645 | 740,612 |
| VIP Growth & Income Portfolio Investor Class (a) | | 33,412 | 1,018,723 |
| VIP Growth Portfolio Investor Class (a) | | 13,444 | 1,509,593 |
| VIP Mid Cap Portfolio Investor Class (a) | | 6,007 | 233,727 |
| VIP Value Portfolio Investor Class (a) | | 26,779 | 518,718 |
| VIP Value Strategies Portfolio Investor Class (a) | | 15,542 | 257,993 |
| TOTAL DOMESTIC EQUITY FUNDS (Cost $4,511,225) | | | 5,187,334 |
| | | | |
| International Equity Funds - 34.2% |
| | | Shares | Value ($) |
| VIP Emerging Markets Portfolio Investor Class (a) | | 135,490 | 1,563,550 |
| VIP Overseas Portfolio Investor Class (a) | | 109,129 | 3,015,227 |
| TOTAL INTERNATIONAL EQUITY FUNDS (Cost $4,223,050) | | | 4,578,777 |
| | | | |
| Bond Funds - 27.1% |
| | | Shares | Value ($) |
| Fidelity Inflation-Protected Bond Index Fund (a) | | 62,813 | 572,229 |
| Fidelity International Bond Index Fund (a) | | 27,653 | 252,750 |
| Fidelity Long-Term Treasury Bond Index Fund (a) | | 99,043 | 939,918 |
| VIP High Income Portfolio Investor Class (a) | | 47,197 | 221,828 |
| VIP Investment Grade Bond II Portfolio Investor Class (a) | | 174,915 | 1,647,698 |
| TOTAL BOND FUNDS (Cost $3,635,109) | | | 3,634,423 |
| | | | |
| TOTAL INVESTMENT IN SECURITIES - 100.0% (Cost $12,369,384) | 13,400,534 |
NET OTHER ASSETS (LIABILITIES) - 0.0% | 73 |
| NET ASSETS - 100.0% | 13,400,607 |
| | |
Legend
Affiliated Underlying Funds
Fiscal year to date information regarding the Fund's investments in affiliated Underlying Funds is presented below. Exchanges between classes of the same affiliated Underlying Funds may occur. If an Underlying Funds changes its name, the name presented below is the name in effect at period end.
| Affiliate | Value, beginning of period ($) | Purchases ($) | Sales Proceeds ($) | Dividend Income ($) | Realized Gain (loss) ($) | Change in Unrealized appreciation (depreciation) ($) | Value, end of period ($) |
| Fidelity Inflation-Protected Bond Index Fund | 240,670 | 339,514 | 13,181 | 601 | (269) | 5,495 | 572,229 |
| Fidelity International Bond Index Fund | 152,951 | 153,511 | 53,346 | 1,902 | (4) | (362) | 252,750 |
| Fidelity Long-Term Treasury Bond Index Fund | 409,440 | 666,927 | 106,153 | 11,944 | (6,802) | (23,494) | 939,918 |
| VIP Contrafund Portfolio Investor Class | 422,221 | 451,522 | 108,731 | 2,191 | (51) | 143,007 | 907,968 |
| VIP Emerging Markets Portfolio Investor Class | 701,984 | 835,469 | 81,040 | 785 | 149 | 106,988 | 1,563,550 |
| VIP Equity-Income Portfolio Investor Class | 342,362 | 394,611 | 39,222 | 2,480 | 187 | 42,674 | 740,612 |
| VIP Government Money Market Portfolio Investor Class 5.09% | - | 20,810 | 20,810 | 84 | - | - | - |
| VIP Growth & Income Portfolio Investor Class | 470,445 | 518,656 | 62,401 | 4,074 | 223 | 91,800 | 1,018,723 |
| VIP Growth Portfolio Investor Class | 699,256 | 757,067 | 162,190 | 13,480 | (386) | 215,846 | 1,509,593 |
| VIP High Income Portfolio Investor Class | 106,364 | 116,711 | 6,337 | 59 | (65) | 5,155 | 221,828 |
| VIP Investment Grade Bond II Portfolio Investor Class | 984,966 | 978,376 | 314,622 | 753 | (4,081) | 3,059 | 1,647,698 |
| VIP Mid Cap Portfolio Investor Class | 107,218 | 128,257 | 13,814 | 2,596 | 167 | 11,899 | 233,727 |
| VIP Overseas Portfolio Investor Class | 1,439,435 | 1,557,130 | 130,289 | 7,112 | (171) | 149,122 | 3,015,227 |
| VIP Value Portfolio Investor Class | 238,963 | 297,128 | 22,230 | 6,647 | 374 | 4,483 | 518,718 |
| VIP Value Strategies Portfolio Investor Class | 118,194 | 151,433 | 13,575 | 2,167 | 239 | 1,702 | 257,993 |
| | 6,434,469 | 7,367,122 | 1,147,941 | 56,875 | (10,490) | 757,374 | 13,400,534 |
Amounts in the dividend income column in the above table include any capital gain distributions from underlying funds, which are presented in the corresponding line item in the Statement of Operations, if applicable.
Amounts included in the purchases and sales proceeds columns may include in-kind transactions, if applicable.
Investment Valuation
The following is a summary of the inputs used, as of June 30, 2024, involving the Fund's assets and liabilities carried at fair value. The inputs or methodology used for valuing securities may not be an indication of the risk associated with investing in those securities. For more information on valuation inputs, and their aggregation into the levels used below, please refer to the Investment Valuation section in the accompanying Notes to Financial Statements.
| Valuation Inputs at Reporting Date: |
| Description | Total ($) | Level 1 ($) | Level 2 ($) | Level 3 ($) |
Investments in Securities: | | | | |
|
| Domestic Equity Funds | 5,187,334 | 5,187,334 | - | - |
|
| International Equity Funds | 4,578,777 | 4,578,777 | - | - |
|
| Bond Funds | 3,634,423 | 3,634,423 | - | - |
| Total Investments in Securities: | 13,400,534 | 13,400,534 | - | - |
VIP Investor Freedom 2035 Portfolio℠
Financial Statements (Unaudited)
| Statement of Assets and Liabilities |
| | | | June 30, 2024 (Unaudited) |
| | | | | |
| Assets | | | | |
| Investment in securities, at value - See accompanying schedule: | | | | |
Affiliated issuers (cost $12,369,384) | $ | 13,400,534 | | |
| | | | | |
| | | | | |
| Total Investment in Securities (cost $12,369,384) | | | $ | 13,400,534 |
| Cash | | | | 75 |
| Receivable for investments sold | | | | 113,789 |
Total assets | | | | 13,514,398 |
| Liabilities | | | | |
| Payable for investments purchased | $ | 113,724 | | |
| Payable for fund shares redeemed | | 67 | | |
| Total liabilities | | | | 113,791 |
| Net Assets | | | $ | 13,400,607 |
| Net Assets consist of: | | | | |
| Paid in capital | | | $ | 12,346,449 |
| Total accumulated earnings (loss) | | | | 1,054,158 |
| Net Assets | | | $ | 13,400,607 |
Net Asset Value, offering price and redemption price per share ($13,400,607 ÷ 1,164,873 shares) | | | $ | 11.50 |
| Statement of Operations |
| | | | Six months ended June 30, 2024 (Unaudited) |
| Investment Income | | | | |
| Dividends: | | | | |
| Affiliated issuers | | | $ | 20,783 |
| Expenses | | | | |
| Independent trustees' fees and expenses | $ | 11 | | |
| Miscellaneous | | 9 | | |
| Total expenses before reductions | | 20 | | |
| Expense reductions | | (1) | | |
| Total expenses after reductions | | | | 19 |
| Net Investment income (loss) | | | | 20,764 |
| Realized and Unrealized Gain (Loss) | | | | |
| Net realized gain (loss) on: | | | | |
| Investment Securities: | | | | |
| Affiliated issuers | | (10,490) | | |
| Capital gain distributions from underlying funds: | | | | |
| Affiliated issuers | | 36,092 | | |
| Total net realized gain (loss) | | | | 25,602 |
| Change in net unrealized appreciation (depreciation) on: | | | | |
| Investment Securities: | | | | |
| Affiliated issuers | | 757,374 | | |
| Total change in net unrealized appreciation (depreciation) | | | | 757,374 |
| Net gain (loss) | | | | 782,976 |
| Net increase (decrease) in net assets resulting from operations | | | $ | 803,740 |
| Statement of Changes in Net Assets |
| |
| | Six months ended June 30, 2024 (Unaudited) | | For the period April 13, 2023 (commencement of operations) through December 31, 2023 |
| Increase (Decrease) in Net Assets | | | | |
| Operations | | | | |
| Net investment income (loss) | $ | 20,764 | $ | 98,408 |
| Net realized gain (loss) | | 25,602 | | 55,321 |
| Change in net unrealized appreciation (depreciation) | | 757,374 | | 273,776 |
| Net increase (decrease) in net assets resulting from operations | | 803,740 | | 427,505 |
| Distributions to shareholders | | (75,952) | | (101,135) |
| | | | | |
| Share transactions | | | | |
| Proceeds from sales of shares | | 6,387,272 | | 6,859,975 |
| Reinvestment of distributions | | 66,152 | | 83,535 |
| Cost of shares redeemed | | (215,134) | | (835,351) |
| | | | | |
Net increase (decrease) in net assets resulting from share transactions | | 6,238,290 | | 6,108,159 |
| Total increase (decrease) in net assets | | 6,966,078 | | 6,434,529 |
| | | | | |
| Net Assets | | | | |
| Beginning of period | | 6,434,529 | | - |
| End of period | $ | 13,400,607 | $ | 6,434,529 |
| | | | | |
| Other Information | | | | |
| Shares | | | | |
| Sold | | 576,641 | | 678,232 |
| Issued in reinvestment of distributions | | 6,103 | | 7,800 |
| Redeemed | | (19,796) | | (84,107) |
| Net increase (decrease) | | 562,948 | | 601,925 |
| | | | | |
Financial Highlights
VIP Investor Freedom 2035 Portfolio℠ |
| |
| | Six months ended (Unaudited) June 30, 2024 | | Years ended December 31, 2023 A |
Selected Per-Share Data | | | | |
| Net asset value, beginning of period | $ | 10.69 | $ | 10.00 |
| Income from Investment Operations | | | | |
Net investment income (loss) B,C | | .02 | | .24 |
| Net realized and unrealized gain (loss) | | .89 | | .63 |
| Total from investment operations | | .91 | | .87 |
| Distributions from net investment income | | - | | (.17) |
| Distributions from net realized gain | | (.10) | | - D |
| Total distributions | | (.10) | | (.18) E |
| Net asset value, end of period | $ | 11.50 | $ | 10.69 |
Total Return F,G,H | | | | 8.66% |
Ratios to Average Net Assets C,I,J | | | | |
Expenses before reductions D | | -% K,L | | -% K |
Expenses net of fee waivers, if any D | | | | -% K |
Expenses net of all reductions D | | -% K,L | | -% K |
| Net investment income (loss) | | .43% K,L | | 3.25% K |
| Supplemental Data | | | | |
| Net assets, end of period (000 omitted) | $ | 13,401 | $ | 6,435 |
Portfolio turnover rate M | | | | 37% K |
AFor the period April 13, 2023 (commencement of operations) through December 31, 2023.
BCalculated based on average shares outstanding during the period.
CNet investment income (loss) is affected by the timing of the declaration of dividends by any underlying mutual funds or exchange-traded funds (ETFs). Net investment income (loss) of any mutual funds or ETFs is not included in the Fund's net investment income (loss) ratio.
DAmount represents less than $.005 per share.
ETotal distributions per share do not sum due to rounding.
FTotal returns for periods of less than one year are not annualized.
GTotal returns do not reflect charges attributable to your insurance company's separate account. Inclusion of these charges would reduce the total returns shown.
HTotal returns would have been lower if certain expenses had not been reduced during the applicable periods shown.
IFees and expenses of any underlying mutual funds or exchange-traded funds (ETFs) are not included in the Fund's expense ratio. The Fund indirectly bears its proportionate share of these expenses.
JExpense ratios reflect operating expenses of the class. Expenses before reductions do not reflect amounts reimbursed, waived, or reduced through arrangements with the investment adviser, brokerage services, or other offset arrangements, if applicable, and do not represent the amount paid by the class during periods when reimbursements, waivers or reductions occur.
KAnnualized.
LProxy expenses are not annualized.
MAmount does not include the portfolio activity of any underlying mutual funds or exchange-traded funds (ETFs).
VIP Investor Freedom 2040 Portfolio℠
Schedule of Investments June 30, 2024 (Unaudited)
Showing Percentage of Net Assets
| Domestic Equity Funds - 47.3% |
| | | Shares | Value ($) |
| VIP Contrafund Portfolio Investor Class (a) | | 14,260 | 856,019 |
| VIP Equity-Income Portfolio Investor Class (a) | | 26,063 | 698,232 |
| VIP Growth & Income Portfolio Investor Class (a) | | 31,500 | 960,432 |
| VIP Growth Portfolio Investor Class (a) | | 12,675 | 1,423,327 |
| VIP Mid Cap Portfolio Investor Class (a) | | 5,663 | 220,353 |
| VIP Value Portfolio Investor Class (a) | | 25,247 | 489,032 |
| VIP Value Strategies Portfolio Investor Class (a) | | 14,653 | 243,234 |
| TOTAL DOMESTIC EQUITY FUNDS (Cost $4,163,280) | | | 4,890,629 |
| | | | |
| International Equity Funds - 40.0% |
| | | Shares | Value ($) |
| VIP Emerging Markets Portfolio Investor Class (a) | | 119,917 | 1,383,837 |
| VIP Overseas Portfolio Investor Class (a) | | 99,881 | 2,759,707 |
| TOTAL INTERNATIONAL EQUITY FUNDS (Cost $3,759,759) | | | 4,143,544 |
| | | | |
| Bond Funds - 12.7% |
| | | Shares | Value ($) |
| Fidelity Inflation-Protected Bond Index Fund (a) | | 24,296 | 221,338 |
| Fidelity International Bond Index Fund (a) | | 12,148 | 111,033 |
| Fidelity Long-Term Treasury Bond Index Fund (a) | | 72,141 | 684,622 |
| VIP High Income Portfolio Investor Class (a) | | 5,961 | 28,018 |
| VIP Investment Grade Bond II Portfolio Investor Class (a) | | 28,389 | 267,423 |
| TOTAL BOND FUNDS (Cost $1,320,052) | | | 1,312,434 |
| | | | |
| TOTAL INVESTMENT IN SECURITIES - 100.0% (Cost $9,243,091) | 10,346,607 |
NET OTHER ASSETS (LIABILITIES) - 0.0% | 75 |
| NET ASSETS - 100.0% | 10,346,682 |
| | |
Legend
Affiliated Underlying Funds
Fiscal year to date information regarding the Fund's investments in affiliated Underlying Funds is presented below. Exchanges between classes of the same affiliated Underlying Funds may occur. If an Underlying Funds changes its name, the name presented below is the name in effect at period end.
| Affiliate | Value, beginning of period ($) | Purchases ($) | Sales Proceeds ($) | Dividend Income ($) | Realized Gain (loss) ($) | Change in Unrealized appreciation (depreciation) ($) | Value, end of period ($) |
| Fidelity Inflation-Protected Bond Index Fund | 154,354 | 75,065 | 9,969 | 319 | (135) | 2,023 | 221,338 |
| Fidelity International Bond Index Fund | 101,571 | 58,150 | 48,374 | 1,018 | 260 | (574) | 111,033 |
| Fidelity Long-Term Treasury Bond Index Fund | 440,948 | 363,220 | 88,221 | 10,246 | (6,039) | (25,286) | 684,622 |
| VIP Contrafund Portfolio Investor Class | 578,071 | 224,717 | 102,667 | 2,411 | 2,727 | 153,171 | 856,019 |
| VIP Emerging Markets Portfolio Investor Class | 898,561 | 461,035 | 82,028 | 818 | 2,304 | 103,965 | 1,383,837 |
| VIP Equity-Income Portfolio Investor Class | 468,751 | 223,435 | 41,044 | 2,770 | 101 | 46,989 | 698,232 |
| VIP Government Money Market Portfolio Investor Class 5.09% | - | 18,548 | 18,548 | 79 | - | - | - |
| VIP Growth & Income Portfolio Investor Class | 644,121 | 275,964 | 59,529 | 4,495 | 358 | 99,518 | 960,432 |
| VIP Growth Portfolio Investor Class | 957,343 | 390,440 | 155,469 | 14,784 | 3,411 | 227,602 | 1,423,327 |
| VIP High Income Portfolio Investor Class | 19,510 | 9,104 | 1,308 | 9 | (7) | 719 | 28,018 |
| VIP Investment Grade Bond II Portfolio Investor Class | 413,221 | 187,442 | 329,510 | 223 | (5,525) | 1,795 | 267,423 |
| VIP Mid Cap Portfolio Investor Class | 146,763 | 72,845 | 11,983 | 2,882 | 35 | 12,693 | 220,353 |
| VIP Overseas Portfolio Investor Class | 1,900,461 | 845,748 | 138,925 | 7,636 | 616 | 151,807 | 2,759,707 |
| VIP Value Portfolio Investor Class | 327,138 | 177,430 | 20,812 | 7,444 | (30) | 5,306 | 489,032 |
| VIP Value Strategies Portfolio Investor Class | 161,793 | 91,108 | 11,647 | 2,411 | (15) | 1,995 | 243,234 |
| | 7,212,606 | 3,474,251 | 1,120,034 | 57,545 | (1,939) | 781,723 | 10,346,607 |
Amounts in the dividend income column in the above table include any capital gain distributions from underlying funds, which are presented in the corresponding line item in the Statement of Operations, if applicable.
Amounts included in the purchases and sales proceeds columns may include in-kind transactions, if applicable.
Investment Valuation
The following is a summary of the inputs used, as of June 30, 2024, involving the Fund's assets and liabilities carried at fair value. The inputs or methodology used for valuing securities may not be an indication of the risk associated with investing in those securities. For more information on valuation inputs, and their aggregation into the levels used below, please refer to the Investment Valuation section in the accompanying Notes to Financial Statements.
| Valuation Inputs at Reporting Date: |
| Description | Total ($) | Level 1 ($) | Level 2 ($) | Level 3 ($) |
Investments in Securities: | | | | |
|
| Domestic Equity Funds | 4,890,629 | 4,890,629 | - | - |
|
| International Equity Funds | 4,143,544 | 4,143,544 | - | - |
|
| Bond Funds | 1,312,434 | 1,312,434 | - | - |
| Total Investments in Securities: | 10,346,607 | 10,346,607 | - | - |
VIP Investor Freedom 2040 Portfolio℠
Financial Statements (Unaudited)
| Statement of Assets and Liabilities |
| | | | June 30, 2024 (Unaudited) |
| | | | | |
| Assets | | | | |
| Investment in securities, at value - See accompanying schedule: | | | | |
Affiliated issuers (cost $9,243,091) | $ | 10,346,607 | | |
| | | | | |
| | | | | |
| Total Investment in Securities (cost $9,243,091) | | | $ | 10,346,607 |
| Cash | | | | 74 |
| Receivable for investments sold | | | | 87,159 |
| Receivable for fund shares sold | | | | 2,649 |
Total assets | | | | 10,436,489 |
| Liabilities | | | | |
| Payable for investments purchased | $ | 89,805 | | |
| Payable for fund shares redeemed | | 2 | | |
| Total liabilities | | | | 89,807 |
| Net Assets | | | $ | 10,346,682 |
| Net Assets consist of: | | | | |
| Paid in capital | | | $ | 9,196,304 |
| Total accumulated earnings (loss) | | | | 1,150,378 |
| Net Assets | | | $ | 10,346,682 |
Net Asset Value, offering price and redemption price per share ($10,346,682 ÷ 875,332 shares) | | | $ | 11.82 |
| Statement of Operations |
| | | | Six months ended June 30, 2024 (Unaudited) |
| Investment Income | | | | |
| Dividends: | | | | |
| Affiliated issuers | | | $ | 17,718 |
| Expenses | | | | |
| Independent trustees' fees and expenses | $ | 11 | | |
| Miscellaneous | | 11 | | |
| Total expenses before reductions | | 22 | | |
| Expense reductions | | (1) | | |
| Total expenses after reductions | | | | 21 |
| Net Investment income (loss) | | | | 17,697 |
| Realized and Unrealized Gain (Loss) | | | | |
| Net realized gain (loss) on: | | | | |
| Investment Securities: | | | | |
| Affiliated issuers | | (1,939) | | |
| Capital gain distributions from underlying funds: | | | | |
| Affiliated issuers | | 39,827 | | |
| Total net realized gain (loss) | | | | 37,888 |
| Change in net unrealized appreciation (depreciation) on: | | | | |
| Investment Securities: | | | | |
| Affiliated issuers | | 781,723 | | |
| Total change in net unrealized appreciation (depreciation) | | | | 781,723 |
| Net gain (loss) | | | | 819,611 |
| Net increase (decrease) in net assets resulting from operations | | | $ | 837,308 |
| Statement of Changes in Net Assets |
| |
| | Six months ended June 30, 2024 (Unaudited) | | For the period April 13, 2023 (commencement of operations) through December 31, 2023 |
| Increase (Decrease) in Net Assets | | | | |
| Operations | | | | |
| Net investment income (loss) | $ | 17,697 | $ | 89,685 |
| Net realized gain (loss) | | 37,888 | | 101,920 |
| Change in net unrealized appreciation (depreciation) | | 781,723 | | 321,793 |
| Net increase (decrease) in net assets resulting from operations | | 837,308 | | 513,398 |
| Distributions to shareholders | | (107,733) | | (92,595) |
| | | | | |
| Share transactions | | | | |
| Proceeds from sales of shares | | 2,568,785 | | 6,769,009 |
| Reinvestment of distributions | | 92,133 | | 78,495 |
| Cost of shares redeemed | | (256,475) | | (55,643) |
| | | | | |
Net increase (decrease) in net assets resulting from share transactions | | 2,404,443 | | 6,791,861 |
| Total increase (decrease) in net assets | | 3,134,018 | | 7,212,664 |
| | | | | |
| Net Assets | | | | |
| Beginning of period | | 7,212,664 | | - |
| End of period | $ | 10,346,682 | $ | 7,212,664 |
| | | | | |
| Other Information | | | | |
| Shares | | | | |
| Sold | | 225,872 | | 662,827 |
| Issued in reinvestment of distributions | | 8,338 | | 7,215 |
| Redeemed | | (23,303) | | (5,617) |
| Net increase (decrease) | | 210,907 | | 664,425 |
| | | | | |
Financial Highlights
VIP Investor Freedom 2040 Portfolio℠ |
| |
| | Six months ended (Unaudited) June 30, 2024 | | Years ended December 31, 2023 A |
Selected Per-Share Data | | | | |
| Net asset value, beginning of period | $ | 10.86 | $ | 10.00 |
| Income from Investment Operations | | | | |
Net investment income (loss) B,C | | .02 | | .21 |
| Net realized and unrealized gain (loss) | | 1.10 | | .79 |
| Total from investment operations | | 1.12 | | 1.00 |
| Distributions from net investment income | | - | | (.14) |
| Distributions from net realized gain | | (.16) | | - D |
| Total distributions | | (.16) | | (.14) |
| Net asset value, end of period | $ | 11.82 | $ | 10.86 |
Total Return E,F,G | | | | 10.01% |
Ratios to Average Net Assets C,H,I | | | | |
Expenses before reductions D | | -% J,K | | -% K |
Expenses net of fee waivers, if any D | | | | -% K |
Expenses net of all reductions D | | -% J,K | | -% K |
| Net investment income (loss) | | .40% J,K | | 2.94% K |
| Supplemental Data | | | | |
| Net assets, end of period (000 omitted) | $ | 10,347 | $ | 7,213 |
Portfolio turnover rate L | | | | 14% K |
AFor the period April 13, 2023 (commencement of operations) through December 31, 2023.
BCalculated based on average shares outstanding during the period.
CNet investment income (loss) is affected by the timing of the declaration of dividends by any underlying mutual funds or exchange-traded funds (ETFs). Net investment income (loss) of any mutual funds or ETFs is not included in the Fund's net investment income (loss) ratio.
DAmount represents less than $.005 per share.
ETotal returns for periods of less than one year are not annualized.
FTotal returns do not reflect charges attributable to your insurance company's separate account. Inclusion of these charges would reduce the total returns shown.
GTotal returns would have been lower if certain expenses had not been reduced during the applicable periods shown.
HFees and expenses of any underlying mutual funds or exchange-traded funds (ETFs) are not included in the Fund's expense ratio. The Fund indirectly bears its proportionate share of these expenses.
IExpense ratios reflect operating expenses of the class. Expenses before reductions do not reflect amounts reimbursed, waived, or reduced through arrangements with the investment adviser, brokerage services, or other offset arrangements, if applicable, and do not represent the amount paid by the class during periods when reimbursements, waivers or reductions occur.
JProxy expenses are not annualized.
KAnnualized.
LAmount does not include the portfolio activity of any underlying mutual funds or exchange-traded funds (ETFs).
VIP Investor Freedom 2045 Portfolio℠
Schedule of Investments June 30, 2024 (Unaudited)
Showing Percentage of Net Assets
| Domestic Equity Funds - 50.5% |
| | | Shares | Value ($) |
| VIP Contrafund Portfolio Investor Class (a) | | 5,964 | 358,042 |
| VIP Equity-Income Portfolio Investor Class (a) | | 10,901 | 292,040 |
| VIP Growth & Income Portfolio Investor Class (a) | | 13,175 | 401,706 |
| VIP Growth Portfolio Investor Class (a) | | 5,302 | 595,323 |
| VIP Mid Cap Portfolio Investor Class (a) | | 2,369 | 92,164 |
| VIP Value Portfolio Investor Class (a) | | 10,560 | 204,541 |
| VIP Value Strategies Portfolio Investor Class (a) | | 6,129 | 101,734 |
| TOTAL DOMESTIC EQUITY FUNDS (Cost $1,739,161) | | | 2,045,550 |
| | | | |
| International Equity Funds - 42.5% |
| | | Shares | Value ($) |
| VIP Emerging Markets Portfolio Investor Class (a) | | 49,099 | 566,599 |
| VIP Overseas Portfolio Investor Class (a) | | 41,782 | 1,154,444 |
| TOTAL INTERNATIONAL EQUITY FUNDS (Cost $1,568,895) | | | 1,721,043 |
| | | | |
| Bond Funds - 7.0% |
| | | Shares | Value ($) |
| Fidelity Inflation-Protected Bond Index Fund (a) | | 5,196 | 47,339 |
| Fidelity International Bond Index Fund (a) | | 89 | 812 |
| Fidelity Long-Term Treasury Bond Index Fund (a) | | 23,452 | 222,562 |
| VIP High Income Portfolio Investor Class (a) | | 2,332 | 10,960 |
| TOTAL BOND FUNDS (Cost $288,114) | | | 281,673 |
| | | | |
| TOTAL INVESTMENT IN SECURITIES - 100.0% (Cost $3,596,170) | 4,048,266 |
NET OTHER ASSETS (LIABILITIES) - 0.0% | 73 |
| NET ASSETS - 100.0% | 4,048,339 |
| | |
Legend
Affiliated Underlying Funds
Fiscal year to date information regarding the Fund's investments in affiliated Underlying Funds is presented below. Exchanges between classes of the same affiliated Underlying Funds may occur. If an Underlying Funds changes its name, the name presented below is the name in effect at period end.
| Affiliate | Value, beginning of period ($) | Purchases ($) | Sales Proceeds ($) | Dividend Income ($) | Realized Gain (loss) ($) | Change in Unrealized appreciation (depreciation) ($) | Value, end of period ($) |
| Fidelity Inflation-Protected Bond Index Fund | 58,017 | 20,555 | 31,615 | 71 | (934) | 1,316 | 47,339 |
| Fidelity International Bond Index Fund | 14,892 | 3,285 | 17,335 | 104 | 270 | (300) | 812 |
| Fidelity Long-Term Treasury Bond Index Fund | 165,756 | 108,094 | 39,856 | 3,373 | (2,766) | (8,666) | 222,562 |
| VIP Contrafund Portfolio Investor Class | 230,819 | 100,632 | 35,602 | 977 | 551 | 61,642 | 358,042 |
| VIP Emerging Markets Portfolio Investor Class | 352,114 | 201,105 | 28,715 | 326 | 795 | 41,300 | 566,599 |
| VIP Equity-Income Portfolio Investor Class | 187,159 | 100,575 | 14,452 | 1,124 | (26) | 18,784 | 292,040 |
| VIP Government Money Market Portfolio Investor Class 5.09% | - | 6,690 | 6,690 | 28 | - | - | - |
| VIP Growth & Income Portfolio Investor Class | 257,189 | 124,869 | 20,388 | 1,822 | 49 | 39,987 | 401,706 |
| VIP Growth Portfolio Investor Class | 382,282 | 175,887 | 55,782 | 5,992 | 891 | 92,045 | 595,323 |
| VIP High Income Portfolio Investor Class | 7,333 | 3,758 | 399 | 3 | (5) | 273 | 10,960 |
| VIP Investment Grade Bond II Portfolio Investor Class | 50,144 | 4,497 | 54,029 | 11 | (618) | 6 | - |
| VIP Mid Cap Portfolio Investor Class | 58,622 | 32,245 | 3,905 | 1,170 | 42 | 5,160 | 92,164 |
| VIP Overseas Portfolio Investor Class | 751,475 | 390,990 | 49,047 | 3,072 | 101 | 60,925 | 1,154,444 |
| VIP Value Portfolio Investor Class | 130,647 | 78,596 | 6,961 | 3,022 | 27 | 2,232 | 204,541 |
| VIP Value Strategies Portfolio Investor Class | 64,622 | 40,187 | 3,949 | 979 | 54 | 820 | 101,734 |
| | 2,711,071 | 1,391,965 | 368,725 | 22,074 | (1,569) | 315,524 | 4,048,266 |
Amounts in the dividend income column in the above table include any capital gain distributions from underlying funds, which are presented in the corresponding line item in the Statement of Operations, if applicable.
Amounts included in the purchases and sales proceeds columns may include in-kind transactions, if applicable.
Investment Valuation
The following is a summary of the inputs used, as of June 30, 2024, involving the Fund's assets and liabilities carried at fair value. The inputs or methodology used for valuing securities may not be an indication of the risk associated with investing in those securities. For more information on valuation inputs, and their aggregation into the levels used below, please refer to the Investment Valuation section in the accompanying Notes to Financial Statements.
| Valuation Inputs at Reporting Date: |
| Description | Total ($) | Level 1 ($) | Level 2 ($) | Level 3 ($) |
Investments in Securities: | | | | |
|
| Domestic Equity Funds | 2,045,550 | 2,045,550 | - | - |
|
| International Equity Funds | 1,721,043 | 1,721,043 | - | - |
|
| Bond Funds | 281,673 | 281,673 | - | - |
| Total Investments in Securities: | 4,048,266 | 4,048,266 | - | - |
VIP Investor Freedom 2045 Portfolio℠
Financial Statements (Unaudited)
| Statement of Assets and Liabilities |
| | | | June 30, 2024 (Unaudited) |
| | | | | |
| Assets | | | | |
| Investment in securities, at value - See accompanying schedule: | | | | |
Affiliated issuers (cost $3,596,170) | $ | 4,048,266 | | |
| | | | | |
| | | | | |
| Total Investment in Securities (cost $3,596,170) | | | $ | 4,048,266 |
| Cash | | | | 74 |
| Receivable for investments sold | | | | 32,914 |
Total assets | | | | 4,081,254 |
| Liabilities | | | | |
| Payable for investments purchased | $ | 32,896 | | |
| Payable for fund shares redeemed | | 19 | | |
| Total liabilities | | | | 32,915 |
| Net Assets | | | $ | 4,048,339 |
| Net Assets consist of: | | | | |
| Paid in capital | | | $ | 3,579,343 |
| Total accumulated earnings (loss) | | | | 468,996 |
| Net Assets | | | $ | 4,048,339 |
Net Asset Value, offering price and redemption price per share ($4,048,339 ÷ 338,770 shares) | | | $ | 11.95 |
| Statement of Operations |
| | | | Six months ended June 30, 2024 (Unaudited) |
| Investment Income | | | | |
| Dividends: | | | | |
| Affiliated issuers | | | $ | 5,929 |
| Expenses | | | | |
| Independent trustees' fees and expenses | $ | 4 | | |
| Miscellaneous | | 8 | | |
| Total expenses before reductions | | 12 | | |
| Expense reductions | | (1) | | |
| Total expenses after reductions | | | | 11 |
| Net Investment income (loss) | | | | 5,918 |
| Realized and Unrealized Gain (Loss) | | | | |
| Net realized gain (loss) on: | | | | |
| Investment Securities: | | | | |
| Affiliated issuers | | (1,569) | | |
| Capital gain distributions from underlying funds: | | | | |
| Affiliated issuers | | 16,145 | | |
| Total net realized gain (loss) | | | | 14,576 |
| Change in net unrealized appreciation (depreciation) on: | | | | |
| Investment Securities: | | | | |
| Affiliated issuers | | 315,524 | | |
| Total change in net unrealized appreciation (depreciation) | | | | 315,524 |
| Net gain (loss) | | | | 330,100 |
| Net increase (decrease) in net assets resulting from operations | | | $ | 336,018 |
| Statement of Changes in Net Assets |
| |
| | Six months ended June 30, 2024 (Unaudited) | | For the period April 13, 2023 (commencement of operations) through December 31, 2023 |
| Increase (Decrease) in Net Assets | | | | |
| Operations | | | | |
| Net investment income (loss) | $ | 5,918 | $ | 29,300 |
| Net realized gain (loss) | | 14,576 | | 38,012 |
| Change in net unrealized appreciation (depreciation) | | 315,524 | | 136,572 |
| Net increase (decrease) in net assets resulting from operations | | 336,018 | | 203,884 |
| Distributions to shareholders | | (40,342) | | (30,564) |
| | | | | |
| Share transactions | | | | |
| Proceeds from sales of shares | | 1,069,662 | | 2,621,413 |
| Reinvestment of distributions | | 24,942 | | 17,664 |
| Cost of shares redeemed | | (53,081) | | (101,257) |
| | | | | |
Net increase (decrease) in net assets resulting from share transactions | | 1,041,523 | | 2,537,820 |
| Total increase (decrease) in net assets | | 1,337,199 | | 2,711,140 |
| | | | | |
| Net Assets | | | | |
| Beginning of period | | 2,711,140 | | - |
| End of period | $ | 4,048,339 | $ | 2,711,140 |
| | | | | |
| Other Information | | | | |
| Shares | | | | |
| Sold | | 92,582 | | 256,789 |
| Issued in reinvestment of distributions | | 2,239 | | 1,616 |
| Redeemed | | (4,621) | | (9,835) |
| Net increase (decrease) | | 90,200 | | 248,570 |
| | | | | |
Financial Highlights
VIP Investor Freedom 2045 Portfolio℠ |
| |
| | Six months ended (Unaudited) June 30, 2024 | | Years ended December 31, 2023 A |
Selected Per-Share Data | | | | |
| Net asset value, beginning of period | $ | 10.91 | $ | 10.00 |
| Income from Investment Operations | | | | |
Net investment income (loss) B,C | | .02 | | .19 |
| Net realized and unrealized gain (loss) | | 1.17 | | .85 |
| Total from investment operations | | 1.19 | | 1.04 |
| Distributions from net investment income | | - | | (.12) |
| Distributions from net realized gain | | (.15) | | (.01) |
| Total distributions | | (.15) | | (.13) |
| Net asset value, end of period | $ | 11.95 | $ | 10.91 |
Total Return D,E,F | | | | 10.39% |
Ratios to Average Net Assets C,G,H | | | | |
Expenses before reductions I | | -% J,K | | -% K |
Expenses net of fee waivers, if any I | | | | -% K |
Expenses net of all reductions I | | -% J,K | | -% K |
| Net investment income (loss) | | .36% J,K | | 2.53% K |
| Supplemental Data | | | | |
| Net assets, end of period (000 omitted) | $ | 4,048 | $ | 2,711 |
Portfolio turnover rate L | | | | 19% K |
AFor the period April 13, 2023 (commencement of operations) through December 31, 2023.
BCalculated based on average shares outstanding during the period.
CNet investment income (loss) is affected by the timing of the declaration of dividends by any underlying mutual funds or exchange-traded funds (ETFs). Net investment income (loss) of any mutual funds or ETFs is not included in the Fund's net investment income (loss) ratio.
DTotal returns for periods of less than one year are not annualized.
ETotal returns do not reflect charges attributable to your insurance company's separate account. Inclusion of these charges would reduce the total returns shown.
FTotal returns would have been lower if certain expenses had not been reduced during the applicable periods shown.
GFees and expenses of any underlying mutual funds or exchange-traded funds (ETFs) are not included in the Fund's expense ratio. The Fund indirectly bears its proportionate share of these expenses.
HExpense ratios reflect operating expenses of the class. Expenses before reductions do not reflect amounts reimbursed, waived, or reduced through arrangements with the investment adviser, brokerage services, or other offset arrangements, if applicable, and do not represent the amount paid by the class during periods when reimbursements, waivers or reductions occur.
IAmount represents less than .005%.
JProxy expenses are not annualized.
KAnnualized.
LAmount does not include the portfolio activity of any underlying mutual funds or exchange-traded funds (ETFs).
VIP Investor Freedom 2050 Portfolio℠
Schedule of Investments June 30, 2024 (Unaudited)
Showing Percentage of Net Assets
| Domestic Equity Funds - 50.5% |
| | | Shares | Value ($) |
| VIP Contrafund Portfolio Investor Class (a) | | 7,468 | 448,329 |
| VIP Equity-Income Portfolio Investor Class (a) | | 13,650 | 365,683 |
| VIP Growth & Income Portfolio Investor Class (a) | | 16,497 | 503,003 |
| VIP Growth Portfolio Investor Class (a) | | 6,639 | 745,445 |
| VIP Mid Cap Portfolio Investor Class (a) | | 2,966 | 115,404 |
| VIP Value Portfolio Investor Class (a) | | 13,223 | 256,120 |
| VIP Value Strategies Portfolio Investor Class (a) | | 7,674 | 127,388 |
| TOTAL DOMESTIC EQUITY FUNDS (Cost $2,224,264) | | | 2,561,372 |
| | | | |
| International Equity Funds - 42.5% |
| | | Shares | Value ($) |
| VIP Emerging Markets Portfolio Investor Class (a) | | 61,480 | 709,478 |
| VIP Overseas Portfolio Investor Class (a) | | 52,318 | 1,445,559 |
| TOTAL INTERNATIONAL EQUITY FUNDS (Cost $1,982,742) | | | 2,155,037 |
| | | | |
| Bond Funds - 7.0% |
| | | Shares | Value ($) |
| Fidelity Inflation-Protected Bond Index Fund (a) | | 6,507 | 59,277 |
| Fidelity International Bond Index Fund (a) | | 111 | 1,017 |
| Fidelity Long-Term Treasury Bond Index Fund (a) | | 29,366 | 278,687 |
| VIP High Income Portfolio Investor Class (a) | | 2,920 | 13,724 |
| TOTAL BOND FUNDS (Cost $357,082) | | | 352,705 |
| | | | |
| TOTAL INVESTMENT IN SECURITIES - 100.0% (Cost $4,564,088) | 5,069,114 |
NET OTHER ASSETS (LIABILITIES) - 0.0% | 73 |
| NET ASSETS - 100.0% | 5,069,187 |
| | |
Legend
Affiliated Underlying Funds
Fiscal year to date information regarding the Fund's investments in affiliated Underlying Funds is presented below. Exchanges between classes of the same affiliated Underlying Funds may occur. If an Underlying Funds changes its name, the name presented below is the name in effect at period end.
| Affiliate | Value, beginning of period ($) | Purchases ($) | Sales Proceeds ($) | Dividend Income ($) | Realized Gain (loss) ($) | Change in Unrealized appreciation (depreciation) ($) | Value, end of period ($) |
| Fidelity Inflation-Protected Bond Index Fund | 61,304 | 45,880 | 48,452 | 87 | (1,097) | 1,642 | 59,277 |
| Fidelity International Bond Index Fund | 15,735 | 10,314 | 25,036 | 109 | 316 | (312) | 1,017 |
| Fidelity Long-Term Treasury Bond Index Fund | 175,072 | 192,255 | 75,457 | 4,076 | (4,388) | (8,795) | 278,687 |
| VIP Contrafund Portfolio Investor Class | 243,897 | 213,406 | 79,945 | 899 | 3,122 | 67,849 | 448,329 |
| VIP Emerging Markets Portfolio Investor Class | 372,141 | 370,405 | 85,944 | 340 | 714 | 52,162 | 709,478 |
| VIP Equity-Income Portfolio Investor Class | 197,773 | 183,360 | 37,207 | 1,174 | 321 | 21,436 | 365,683 |
| VIP Government Money Market Portfolio Investor Class 5.09% | - | 8,779 | 8,779 | 37 | - | - | - |
| VIP Growth & Income Portfolio Investor Class | 271,765 | 238,144 | 53,492 | 1,678 | 915 | 45,671 | 503,003 |
| VIP Growth Portfolio Investor Class | 403,921 | 357,996 | 122,525 | 5,511 | 5,624 | 100,429 | 745,445 |
| VIP High Income Portfolio Investor Class | 7,749 | 7,236 | 1,583 | 4 | (2) | 324 | 13,724 |
| VIP Investment Grade Bond II Portfolio Investor Class | 52,987 | 6,144 | 58,455 | 9 | (581) | (95) | - |
| VIP Mid Cap Portfolio Investor Class | 61,927 | 60,377 | 12,443 | 1,222 | 278 | 5,265 | 115,404 |
| VIP Overseas Portfolio Investor Class | 794,144 | 742,966 | 155,716 | 3,208 | 2,091 | 62,074 | 1,445,559 |
| VIP Value Portfolio Investor Class | 138,033 | 140,509 | 24,769 | 3,156 | 105 | 2,242 | 256,120 |
| VIP Value Strategies Portfolio Investor Class | 68,270 | 70,553 | 12,232 | 1,023 | 132 | 665 | 127,388 |
| | 2,864,718 | 2,648,324 | 802,035 | 22,533 | 7,550 | 350,557 | 5,069,114 |
Amounts in the dividend income column in the above table include any capital gain distributions from underlying funds, which are presented in the corresponding line item in the Statement of Operations, if applicable.
Amounts included in the purchases and sales proceeds columns may include in-kind transactions, if applicable.
Investment Valuation
The following is a summary of the inputs used, as of June 30, 2024, involving the Fund's assets and liabilities carried at fair value. The inputs or methodology used for valuing securities may not be an indication of the risk associated with investing in those securities. For more information on valuation inputs, and their aggregation into the levels used below, please refer to the Investment Valuation section in the accompanying Notes to Financial Statements.
| Valuation Inputs at Reporting Date: |
| Description | Total ($) | Level 1 ($) | Level 2 ($) | Level 3 ($) |
Investments in Securities: | | | | |
|
| Domestic Equity Funds | 2,561,372 | 2,561,372 | - | - |
|
| International Equity Funds | 2,155,037 | 2,155,037 | - | - |
|
| Bond Funds | 352,705 | 352,705 | - | - |
| Total Investments in Securities: | 5,069,114 | 5,069,114 | - | - |
VIP Investor Freedom 2050 Portfolio℠
Financial Statements (Unaudited)
| Statement of Assets and Liabilities |
| | | | June 30, 2024 (Unaudited) |
| | | | | |
| Assets | | | | |
| Investment in securities, at value - See accompanying schedule: | | | | |
Affiliated issuers (cost $4,564,088) | $ | 5,069,114 | | |
| | | | | |
| | | | | |
| Total Investment in Securities (cost $4,564,088) | | | $ | 5,069,114 |
| Cash | | | | 74 |
| Receivable for investments sold | | | | 41,095 |
Total assets | | | | 5,110,283 |
| Liabilities | | | | |
| Payable for investments purchased | $ | 41,074 | | |
| Payable for fund shares redeemed | | 22 | | |
| Total liabilities | | | | 41,096 |
| Net Assets | | | $ | 5,069,187 |
| Net Assets consist of: | | | | |
| Paid in capital | | | $ | 4,536,363 |
| Total accumulated earnings (loss) | | | | 532,824 |
| Net Assets | | | $ | 5,069,187 |
Net Asset Value, offering price and redemption price per share ($5,069,187 ÷ 423,483 shares) | | | $ | 11.97 |
| Statement of Operations |
| | | | Six months ended June 30, 2024 (Unaudited) |
| Investment Income | | | | |
| Dividends: | | | | |
| Affiliated issuers | | | $ | 6,752 |
| Expenses | | | | |
| Independent trustees' fees and expenses | $ | 5 | | |
| Miscellaneous | | 4 | | |
| Total expenses before reductions | | 9 | | |
| Expense reductions | | (1) | | |
| Total expenses after reductions | | | | 8 |
| Net Investment income (loss) | | | | 6,744 |
| Realized and Unrealized Gain (Loss) | | | | |
| Net realized gain (loss) on: | | | | |
| Investment Securities: | | | | |
| Affiliated issuers | | 7,550 | | |
| Capital gain distributions from underlying funds: | | | | |
| Affiliated issuers | | 15,781 | | |
| Total net realized gain (loss) | | | | 23,331 |
| Change in net unrealized appreciation (depreciation) on: | | | | |
| Investment Securities: | | | | |
| Affiliated issuers | | 350,557 | | |
| Total change in net unrealized appreciation (depreciation) | | | | 350,557 |
| Net gain (loss) | | | | 373,888 |
| Net increase (decrease) in net assets resulting from operations | | | $ | 380,632 |
| Statement of Changes in Net Assets |
| |
| | Six months ended June 30, 2024 (Unaudited) | | For the period April 13, 2023 (commencement of operations) through December 31, 2023 |
| Increase (Decrease) in Net Assets | | | | |
| Operations | | | | |
| Net investment income (loss) | $ | 6,744 | $ | 27,251 |
| Net realized gain (loss) | | 23,331 | | 36,149 |
| Change in net unrealized appreciation (depreciation) | | 350,557 | | 154,469 |
| Net increase (decrease) in net assets resulting from operations | | 380,632 | | 217,869 |
| Distributions to shareholders | | (36,847) | | (28,830) |
| | | | | |
| Share transactions | | | | |
| Proceeds from sales of shares | | 2,309,450 | | 2,662,800 |
| Reinvestment of distributions | | 21,547 | | 17,730 |
| Cost of shares redeemed | | (470,389) | | (4,775) |
| | | | | |
Net increase (decrease) in net assets resulting from share transactions | | 1,860,608 | | 2,675,755 |
| Total increase (decrease) in net assets | | 2,204,393 | | 2,864,794 |
| | | | | |
| Net Assets | | | | |
| Beginning of period | | 2,864,794 | | - |
| End of period | $ | 5,069,187 | $ | 2,864,794 |
| | | | | |
| Other Information | | | | |
| Shares | | | | |
| Sold | | 200,574 | | 261,115 |
| Issued in reinvestment of distributions | | 1,932 | | 1,619 |
| Redeemed | | (41,285) | | (472) |
| Net increase (decrease) | | 161,221 | | 262,262 |
| | | | | |
Financial Highlights
VIP Investor Freedom 2050 Portfolio℠ |
| |
| | Six months ended (Unaudited) June 30, 2024 | | Years ended December 31, 2023 A |
Selected Per-Share Data | | | | |
| Net asset value, beginning of period | $ | 10.92 | $ | 10.00 |
| Income from Investment Operations | | | | |
Net investment income (loss) B,C | | .02 | | .18 |
| Net realized and unrealized gain (loss) | | 1.18 | | .85 |
| Total from investment operations | | 1.20 | | 1.03 |
| Distributions from net investment income | | - | | (.11) |
| Distributions from net realized gain | | (.15) | | (.01) |
| Total distributions | | (.15) | | (.11) D |
| Net asset value, end of period | $ | 11.97 | $ | 10.92 |
Total Return E,F,G | | | | 10.31% |
Ratios to Average Net Assets C,H,I | | | | |
Expenses before reductions J | | -% K,L | | -% K |
Expenses net of fee waivers, if any J | | | | -% K |
Expenses net of all reductions J | | -% K,L | | -% K |
| Net investment income (loss) | | .34% K,L | | 2.40% K |
| Supplemental Data | | | | |
| Net assets, end of period (000 omitted) | $ | 5,069 | $ | 2,865 |
Portfolio turnover rate M | | | | 12% K |
AFor the period April 13, 2023 (commencement of operations) through December 31, 2023.
BCalculated based on average shares outstanding during the period.
CNet investment income (loss) is affected by the timing of the declaration of dividends by any underlying mutual funds or exchange-traded funds (ETFs). Net investment income (loss) of any mutual funds or ETFs is not included in the Fund's net investment income (loss) ratio.
DTotal distributions per share do not sum due to rounding.
ETotal returns for periods of less than one year are not annualized.
FTotal returns do not reflect charges attributable to your insurance company's separate account. Inclusion of these charges would reduce the total returns shown.
GTotal returns would have been lower if certain expenses had not been reduced during the applicable periods shown.
HFees and expenses of any underlying mutual funds or exchange-traded funds (ETFs) are not included in the Fund's expense ratio. The Fund indirectly bears its proportionate share of these expenses.
IExpense ratios reflect operating expenses of the class. Expenses before reductions do not reflect amounts reimbursed, waived, or reduced through arrangements with the investment adviser, brokerage services, or other offset arrangements, if applicable, and do not represent the amount paid by the class during periods when reimbursements, waivers or reductions occur.
JAmount represents less than .005%.
KAnnualized.
LProxy expenses are not annualized.
MAmount does not include the portfolio activity of any underlying mutual funds or exchange-traded funds (ETFs).
Notes to Financial Statements
(Unaudited)For the period ended June 30, 2024
1. Organization.
VIP Investor Freedom Income Portfolio, VIP Investor Freedom 2005 Portfolio, VIP Investor Freedom 2010 Portfolio, VIP Investor Freedom 2015 Portfolio, VIP Investor Freedom 2020 Portfolio, VIP Investor Freedom 2025 Portfolio, VIP Investor Freedom 2030 Portfolio, VIP Investor Freedom 2035 Portfolio, VIP Investor Freedom 2040 Portfolio, VIP Investor Freedom 2045 Portfolio and VIP Investor Freedom 2050 Portfolio (the Funds) are funds of Variable Insurance Products Fund V (the Trust). The Trust is registered under the Investment Company Act of 1940, as amended (the 1940 Act), as an open-end management investment company organized as a Massachusetts business trust. Each Fund is authorized to issue an unlimited number of shares. Shares of each Fund may only be purchased by insurance companies for the purpose of funding variable annuity or variable life insurance contracts.
2. Investments in Fidelity Central Funds.
Funds may invest in Fidelity Central Funds, which are open-end investment companies generally available only to other investment companies and accounts managed by the investment adviser and its affiliates. The Schedule of Investments lists any Fidelity Central Funds held as an investment as of period end, but does not include the underlying holdings of each Fidelity Central Fund. An investing fund indirectly bears its proportionate share of the expenses of the underlying Fidelity Central Funds.
Based on its investment objective, each Fidelity Central Fund may invest or participate in various investment vehicles or strategies that are similar to those of the investing fund. These strategies are consistent with the investment objectives of the investing fund and may involve certain economic risks which may cause a decline in value of each of the Fidelity Central Funds and thus a decline in the value of the investing fund.
| Fidelity Central Fund | Investment Manager | Investment Objective | Investment Practices | Expense RatioA |
| Fidelity Money Market Central Funds | Fidelity Management & Research Company LLC (FMR) | Each fund seeks to obtain a high level of current income consistent with the preservation of capital and liquidity. | Short-term Investments | Less than .005% |
A Expenses expressed as a percentage of average net assets and are as of each underlying Central Fund's most recent annual or semi-annual shareholder report.
A complete unaudited list of holdings for each Fidelity Central Fund is available upon request or at the Securities and Exchange Commission website at www.sec.gov. In addition, the financial statements of the Fidelity Central Funds which contain the significant accounting policies (including investment valuation policies) of those funds, and are not covered by the Report of Independent Registered Public Accounting Firm, are available on the Securities and Exchange Commission website or upon request.
3. Significant Accounting Policies.
Each Fund is an investment company and applies the accounting and reporting guidance of the Financial Accounting Standards Board (FASB) Accounting Standards Codification Topic 946 Financial Services - Investment Companies. The financial statements have been prepared in conformity with accounting principles generally accepted in the United States of America (GAAP), which require management to make certain estimates and assumptions at the date of the financial statements. Actual results could differ from those estimates. Subsequent events, if any, through the date that the financial statements were issued have been evaluated in the preparation of the financial statements. Each Fund's Schedule of Investments lists any underlying mutual funds or exchange-traded funds (ETFs) but does not include the underlying holdings of these funds. The following summarizes the significant accounting policies of each Fund:
Investment Valuation. Investments are valued as of 4:00 p.m. Eastern time on the last calendar day of the period. Each Fund categorizes the inputs to valuation techniques used to value its investments into a disclosure hierarchy consisting of three levels as shown below:
Level 1 - unadjusted quoted prices in active markets for identical investments
Level 2 - other significant observable inputs (including quoted prices for similar investments, interest rates, prepayment speeds, etc.)
Level 3 - unobservable inputs (including the Fund's own assumptions based on the best information available)
Valuation techniques used to value each Fund's investments by major category are as follows:
Investments in open-end mutual funds are valued at their closing net asset value (NAV) each business day and are categorized as Level 1 in the hierarchy.
The aggregate value of investments by input level as of June 30, 2024 is included at the end of each Fund's Schedule of Investments.
Investment Transactions and Income. For financial reporting purposes, the Funds' investment holdings and NAV include trades executed through the end of the last business day of the period. The NAV per share for processing shareholder transactions is calculated as of the close of business of the New York Stock Exchange (NYSE), normally 4:00 p.m. Eastern time and includes trades executed through the end of the prior business day. Gains and losses on securities sold are determined on the basis of identified cost. Income and capital gain distributions from any underlying mutual funds or exchange-traded funds (ETFs) are recorded on the ex-dividend date.
Expenses. Expenses directly attributable to a fund are charged to that fund. Expenses attributable to more than one fund are allocated among the respective funds on the basis of relative net assets or other appropriate methods. Expenses included in the accompanying financial statements reflect the expenses of that fund and do not include any expenses associated with any underlying mutual funds or exchange-traded funds. Although not included in a fund's expenses, a fund indirectly bears its proportionate share of these expenses through the net asset value of each underlying mutual fund or exchange-traded fund. Expense estimates are accrued in the period to which they relate and adjustments are made when actual amounts are known.
Income Tax Information and Distributions to Shareholders. Each year, each Fund intends to qualify as a regulated investment company under Subchapter M of the Internal Revenue Code, including distributing substantially all of its taxable income and realized gains. As a result, no provision for U.S. Federal income taxes is required. Each Fund files a U.S. federal tax return, in addition to state and local tax returns as required. Each Fund's federal income tax returns are subject to examination by the Internal Revenue Service (IRS) for a period of three fiscal years after they are filed. State and local tax returns may be subject to examination for an additional fiscal year depending on the jurisdiction.
Distributions are declared and recorded on the ex-dividend date. Income and capital gain distributions are determined in accordance with income tax regulations, which may differ from GAAP.
Capital accounts within the financial statements are adjusted for permanent book-tax differences. These adjustments have no impact on net assets or the results of operations. Capital accounts are not adjusted for temporary book-tax differences which will reverse in a subsequent period.
Book-tax differences are primarily due to the short-term gain distributions from the underlying mutual funds or exchange-traded funds (ETFs), capital loss carryforwards and losses deferred due to wash sales.
As of period end, the cost and unrealized appreciation (depreciation) in securities, and derivatives if applicable, for federal income tax purposes were as follows for each Fund:
| | Tax cost ($) | Gross unrealized appreciation ($) | Gross unrealized depreciation ($) | Net unrealized appreciation (depreciation)($) |
| VIP Investor Freedom Income Portfolio | 73,060,103 | 6,951,216 | (3,311,188) | 3,640,028 |
| VIP Investor Freedom 2010 Portfolio | 51,744,917 | 6,639,623 | (2,419,729) | 4,219,894 |
| VIP Investor Freedom 2015 Portfolio | 80,215,062 | 14,832,794 | (3,940,241) | 10,892,553 |
| VIP Investor Freedom 2020 Portfolio | 152,462,266 | 36,823,253 | (7,532,017) | 29,291,236 |
| VIP Investor Freedom 2025 Portfolio | 172,229,627 | 51,865,900 | (8,232,335) | 43,633,565 |
| VIP Investor Freedom 2030 Portfolio | 300,450,508 | 79,873,816 | (11,979,878) | 67,893,938 |
| VIP Investor Freedom 2035 Portfolio | 12,401,740 | 1,052,555 | (53,761) | 998,794 |
| VIP Investor Freedom 2040 Portfolio | 9,255,422 | 1,127,695 | (36,510) | 1,091,185 |
| VIP Investor Freedom 2045 Portfolio | 3,600,469 | 462,201 | (14,404) | 447,797 |
| VIP Investor Freedom 2050 Portfolio | 4,570,987 | 514,010 | (15,883) | 498,127 |
Capital loss carryforwards are only available to offset future capital gains of the Funds to the extent provided by regulations and may be limited. The capital loss carryforward information presented below, including any applicable limitation, is estimated as of prior fiscal period end and is subject to adjustment.
| | Short-term ($) | Long-term ($) | Total capital loss carryforward ($) |
| VIP Investor Freedom Income Portfolio | (854,710) | (1,971,523) | (2,826,233) |
| VIP Investor Freedom 2010 Portfolio | (703,469) | (416,483) | (1,119,952) |
| VIP Investor Freedom 2030 Portfolio | (3,129,410) | (937,747) | (4,067,157) |
4. Purchases and Sales of Investments.
Purchases and sales of securities, other than short-term securities, securities acquired in the merger and in-kind transactions, as applicable, are noted in the table below.
| | Purchases ($) | Sales ($) |
| VIP Investor Freedom Income Portfolio | 6,815,998 | 12,788,472 |
| VIP Investor Freedom 2010 Portfolio | 5,591,532 | 7,567,081 |
| VIP Investor Freedom 2015 Portfolio | 10,583,151 | 13,923,000 |
| VIP Investor Freedom 2020 Portfolio | 20,045,605 | 36,042,346 |
| VIP Investor Freedom 2025 Portfolio | 23,310,624 | 45,236,492 |
| VIP Investor Freedom 2030 Portfolio | 43,479,414 | 51,179,565 |
| VIP Investor Freedom 2035 Portfolio | 7,367,122 | 1,147,941 |
| VIP Investor Freedom 2040 Portfolio | 3,474,251 | 1,120,034 |
| VIP Investor Freedom 2045 Portfolio | 1,391,965 | 368,725 |
| VIP Investor Freedom 2050 Portfolio | 2,648,324 | 802,035 |
5. Fees and Other Transactions with Affiliates.
Management Fee. Fidelity Management & Research Company LLC (the investment adviser) provides the Funds with investment management related services. The Funds do not pay any fees for these services.
Interfund Trades. Funds may purchase from or sell securities to other Fidelity Funds under procedures adopted by the Board. The procedures have been designed to ensure these interfund trades are executed in accordance with Rule 17a-7 of the 1940 Act. Any interfund trades are included within the respective purchases and sales amounts shown in the Purchases and Sales of Investments note. During the period, there were no interfund trades.
6. Expense Reductions.
Through arrangements with each applicable Fund's custodian, credits realized as a result of certain uninvested cash balances were used to reduce each applicable Fund's expenses. All of the applicable expense reductions are noted in the table below.
| | Custodian credits ($) |
| VIP Investor Freedom 2020 Portfolio | 30 |
| VIP Investor Freedom 2035 Portfolio | 1 |
| VIP Investor Freedom 2040 Portfolio | 1 |
| VIP Investor Freedom 2045 Portfolio | 1 |
| VIP Investor Freedom 2050 Portfolio | 1 |
7. Other.
A fund's organizational documents provide former and current trustees and officers with a limited indemnification against liabilities arising in connection with the performance of their duties to the fund. In the normal course of business, a fund may also enter into contracts that provide general indemnifications. A fund's maximum exposure under these arrangements is unknown as this would be dependent on future claims that may be made against a fund. The risk of material loss from such claims is considered remote.
At the end of the period, the investment adviser or its affiliates were owners of record of more than 10% of the outstanding shares as follows:
| Fund | Affiliated % |
VIP Investor Freedom Income Portfolio | 100% |
| VIP Investor Freedom 2010 Portfolio | 100% |
| VIP Investor Freedom 2015 Portfolio | 100% |
| VIP Investor Freedom 2020 Portfolio | 100% |
| VIP Investor Freedom 2025 Portfolio | 100% |
| VIP Investor Freedom 2030 Portfolio | 100% |
| VIP Investor Freedom 2035 Portfolio | 100% |
| VIP Investor Freedom 2040 Portfolio | 100% |
| VIP Investor Freedom 2045 Portfolio | 100% |
| VIP Investor Freedom 2050 Portfolio | 100% |
8. Risk and Uncertainties.
Many factors affect a fund's performance. Developments that disrupt global economies and financial markets, such as pandemics, epidemics, outbreaks of infectious diseases, war, terrorism, and environmental disasters, may significantly affect a fund's investment performance. The effects of these developments to a fund will be impacted by the types of securities in which a fund invests, the financial condition, industry, economic sector, and geographic location of an issuer, and a fund's level of investment in the securities of that issuer. Significant concentrations in security types, issuers, industries, sectors, and geographic locations may magnify the factors that affect a fund's performance.
9. Merger Information.
On June 7, 2024, VIP Investor Freedom Income Portfolio acquired all of the assets and assumed all of the liabilities of VIP Investor Freedom 2005 Portfolio ("Target Fund") pursuant to an Agreement and Plan of Reorganization (Agreements) approved by the Board of Trustees ("The Board"). The securities held by the Target Fund were the primary assets acquired by VIP Investor Freedom Income Portfolio. The acquisition was accomplished by an exchange of shares of VIP Investor Freedom Income Portfolio for shares then outstanding of the Target Fund at its respective net asset value on the acquisition date. The reorganization provides shareholders of the Target Fund access to a larger portfolio with a similar investment objective and lower projected expenses. For financial reporting purposes, the assets and liabilities of the Target Fund and shares issued by VIP Investor Freedom Income Portfolio were recorded at fair value; however, the cost basis of the investments received from the Target Fund were carried forward and will be utilized for purposes of VIP Investor Freedom Income Portfolio's ongoing reporting of realized and unrealized gains and losses to more closely align subsequent reporting of realized gains with amounts distributable to shareholders for tax purposes. The reorganization qualified as a tax-free reorganization for federal income tax purposes with no gain or loss recognized to the funds or their shareholders.
| Target Fund | Investments $ | Unrealized appreciation (depreciation) $ | Net Assets $ | Shares Exchanged | Shares Exchanged Ratio |
| VIP Investor Freedom 2005 Portfolio | 18,110,255 | 841,155 | 18,112,866 | 1,648,130 | .9900181984 |
| Surviving Fund | Net Assets $ | Total net assets after the acquisition $ |
| VIP Investor Freedom Income Portfolio | 59,587,913 | 77,700,779 |
Pro forma results of operations of the combined entity for the entire period ended June 30, 2024, as though the acquisition had occurred as of the beginning of the year (rather than on the actual acquisition date), are as follows:
| Net investment income (loss) | $454,363 |
| Total net realized gain (loss) | (305,531) |
| Total change in net unrealized appreciation (depreciation) | 1,810,035 |
| Net increase (decrease) in net assets resulting from operations | $1,958,867 |
Because the combined investment portfolios have been managed as a single portfolio since the acquisition was completed, it is not practicable to separate the amounts of revenue and earnings of the acquired funds that have been included in the VIP Freedom Income Portfolio accompanying Statement of Operations since June 7, 2024
Item 8: Changes in and Disagreements with Accountants for Open-End Management Investment Companies
Note: This is not applicable for any fund included in this document.
Item 9: Proxy Disclosures for Open-End Management Investment Companies
Note: This is not applicable for any fund included in this document.
Item 10: Remuneration Paid to Directors, Officers, and others of Open-End Management Investment Companies
Note: This information is disclosed as part of the financial statements for each Fund as part of Item 7: Financial Statements and Financial Highlights for Open-End Management Investment companies.
Item 11: Statement Regarding Basis for Approval of Investment Advisory Contract
Note: This is not applicable for any fund included in this document.
1.833440.118
VIPIFF-SANN-0824
Fidelity® Variable Insurance Products:
VIP Investment Grade Bond II Portfolio
Semi-Annual Report
June 30, 2024
Contents
To view a fund's proxy voting guidelines and proxy voting record for the 12-month period ended June 30, visit http://www.fidelity.com/proxyvotingresults or visit the Securities and Exchange Commission's (SEC) web site at http://www.sec.gov.
You may also call 1-877-208-0098 to request a free copy of the proxy voting guidelines.
Fidelity® Variable Insurance Products are separate account options which are purchased through a variable insurance contract.
Standard & Poor's, S&P and S&P 500 are registered service marks of The McGraw-Hill Companies, Inc. and have been licensed for use by Fidelity Distributors Corporation.
Other third-party marks appearing herein are the property of their respective owners.
All other marks appearing herein are registered or unregistered trademarks or service marks of FMR LLC or an affiliated company. © 2024 FMR LLC. All rights reserved.
This report and the financial statements contained herein are submitted for the general information of the shareholders of the Fund. This report is not authorized for distribution to prospective investors in the Fund unless preceded or accompanied by an effective prospectus.
A fund files its complete schedule of portfolio holdings with the SEC for the first and third quarters of each fiscal year on Form N-PORT. Forms N-PORT are available on the SEC's web site at http://www.sec.gov. A fund's Forms N-PORT may be reviewed and copied at the SEC's Public Reference Room in Washington, DC. Information regarding the operation of the SEC's Public Reference Room may be obtained by calling 1-800-SEC-0330.
For a complete list of a fund's portfolio holdings, view the most recent holdings listing, semiannual report, or annual report on Fidelity's web site at http://www.fidelity.com, http://www.institutional.fidelity.com, or http://www.401k.com, as applicable.
NOT FDIC INSURED •MAY LOSE VALUE •NO BANK GUARANTEE
Neither the Fund nor Fidelity Distributors Corporation is a bank.
Item 7: Financial Statements and Financial Highlights for Open-End Management Investment Companies (Semi-Annual Report)
VIP Investment Grade Bond II Portfolio
Schedule of Investments June 30, 2024 (Unaudited)
Showing Percentage of Net Assets
| Nonconvertible Bonds - 25.0% |
| | | Principal Amount (a) | Value ($) |
| COMMUNICATION SERVICES - 2.2% | | | |
| Diversified Telecommunication Services - 0.5% | | | |
| AT&T, Inc.: | | | |
| 1.65% 2/1/28 | | 284,000 | 252,202 |
| 2.25% 2/1/32 | | 467,000 | 378,830 |
| 2.55% 12/1/33 | | 1,877,000 | 1,492,491 |
| 2.75% 6/1/31 | | 509,000 | 435,854 |
| 2.95% 7/15/26 | | 219,000 | 208,899 |
| 3.3% 2/1/52 | | 484,000 | 321,395 |
| 3.5% 6/1/41 | | 261,000 | 199,404 |
| 3.5% 9/15/53 | | 864,000 | 586,516 |
| 3.55% 9/15/55 | | 1,880,000 | 1,267,478 |
| 3.65% 6/1/51 | | 400,000 | 282,534 |
| 3.65% 9/15/59 | | 1,076,000 | 721,589 |
| 3.8% 2/15/27 | | 247,000 | 238,638 |
| 3.8% 12/1/57 | | 1,915,000 | 1,337,888 |
| 4.35% 6/15/45 | | 175,000 | 145,120 |
| 4.5% 3/9/48 | | 224,000 | 184,687 |
| 4.65% 6/1/44 | | 216,000 | 184,580 |
| Orange SA 5.5% 2/6/44 | | 82,000 | 79,095 |
| Telefonica Emisiones S.A.U.: | | | |
| 4.103% 3/8/27 | | 171,000 | 165,988 |
| 5.213% 3/8/47 | | 180,000 | 158,985 |
| 7.045% 6/20/36 | | 71,000 | 77,249 |
| Verizon Communications, Inc.: | | | |
| 1.5% 9/18/30 | | 110,000 | 89,764 |
| 1.68% 10/30/30 | | 92,000 | 74,772 |
| 2.1% 3/22/28 | | 751,000 | 675,397 |
| 2.355% 3/15/32 | | 1,607,000 | 1,313,684 |
| 2.55% 3/21/31 | | 2,142,000 | 1,819,861 |
| 3% 3/22/27 | | 163,000 | 154,220 |
| 3.55% 3/22/51 | | 299,000 | 215,172 |
| 4.125% 3/16/27 | | 192,000 | 187,160 |
| 4.272% 1/15/36 | | 666,000 | 603,359 |
| 4.329% 9/21/28 | | 419,000 | 407,414 |
| 4.4% 11/1/34 | | 103,000 | 95,444 |
| 4.75% 11/1/41 | | 27,000 | 24,847 |
| 5.012% 4/15/49 | | 67,000 | 64,737 |
| 5.012% 8/21/54 | | 344,000 | 313,496 |
| | | | 14,758,749 |
| Entertainment - 0.2% | | | |
| The Walt Disney Co.: | | | |
| 2% 9/1/29 | | 286,000 | 248,574 |
| 2.65% 1/13/31 | | 435,000 | 379,681 |
| 2.75% 9/1/49 | | 286,000 | 181,674 |
| 3.5% 5/13/40 | | 187,000 | 149,193 |
| 3.6% 1/13/51 | | 186,000 | 138,632 |
| 3.7% 10/15/25 | | 192,000 | 188,336 |
| 3.8% 3/22/30 | | 2,891,000 | 2,738,201 |
| 4.7% 3/23/50 | | 1,046,000 | 945,030 |
| 5.4% 10/1/43 | | 106,000 | 104,863 |
| 6.15% 3/1/37 | | 108,000 | 116,843 |
| 6.15% 2/15/41 | | 288,000 | 309,127 |
| | | | 5,500,154 |
| Interactive Media & Services - 0.0% | | | |
| Alphabet, Inc.: | | | |
| 0.45% 8/15/25 | | 204,000 | 194,214 |
| 1.1% 8/15/30 | | 404,000 | 329,951 |
| 1.998% 8/15/26 | | 63,000 | 59,337 |
| 2.05% 8/15/50 | | 404,000 | 229,722 |
| Baidu, Inc. 3.425% 4/7/30 | | 334,000 | 304,351 |
| | | | 1,117,575 |
| Media - 1.3% | | | |
| Charter Communications Operating LLC/Charter Communications Operating Capital Corp.: | | | |
| 2.8% 4/1/31 | | 701,000 | 572,940 |
| 3.5% 6/1/41 | | 924,000 | 620,575 |
| 3.7% 4/1/51 | | 243,000 | 147,766 |
| 3.85% 4/1/61 | | 2,000,000 | 1,167,836 |
| 3.9% 6/1/52 | | 4,000,000 | 2,508,346 |
| 4.2% 3/15/28 | | 302,000 | 285,401 |
| 4.4% 4/1/33 | | 318,000 | 280,331 |
| 4.8% 3/1/50 | | 6,000,000 | 4,401,527 |
| 4.908% 7/23/25 | | 163,000 | 161,417 |
| 5.05% 3/30/29 | | 1,087,000 | 1,045,360 |
| 5.125% 7/1/49 | | 339,000 | 260,217 |
| 5.25% 4/1/53 | | 242,000 | 189,854 |
| 5.375% 5/1/47 | | 2,518,000 | 2,011,647 |
| 5.5% 4/1/63 | | 318,000 | 246,417 |
| 5.75% 4/1/48 | | 143,000 | 119,555 |
| 6.1% 6/1/29 | | 2,108,000 | 2,114,894 |
| 6.384% 10/23/35 | | 369,000 | 359,775 |
| 6.484% 10/23/45 | | 474,000 | 432,942 |
| 6.55% 6/1/34 | | 1,149,000 | 1,149,382 |
| 6.834% 10/23/55 | | 3,000,000 | 2,836,417 |
| Comcast Corp.: | | | |
| 1.5% 2/15/31 | | 390,000 | 313,223 |
| 1.95% 1/15/31 | | 70,000 | 57,812 |
| 2.35% 1/15/27 | | 653,000 | 611,356 |
| 2.45% 8/15/52 | | 390,000 | 219,545 |
| 2.65% 2/1/30 | | 216,000 | 191,250 |
| 2.8% 1/15/51 | | 224,000 | 138,379 |
| 3.15% 3/1/26 | | 137,000 | 132,423 |
| 3.3% 2/1/27 | | 327,000 | 313,445 |
| 3.375% 8/15/25 | | 376,000 | 368,469 |
| 3.4% 4/1/30 | | 200,000 | 183,859 |
| 3.45% 2/1/50 | | 204,000 | 143,933 |
| 3.75% 4/1/40 | | 160,000 | 130,155 |
| 3.969% 11/1/47 | | 143,000 | 111,536 |
| 4% 3/1/48 | | 329,000 | 258,148 |
| 4.15% 10/15/28 | | 517,000 | 500,500 |
| Discovery Communications LLC 3.625% 5/15/30 | | 765,000 | 673,159 |
| Fox Corp.: | | | |
| 4.709% 1/25/29 | | 515,000 | 505,820 |
| 5.476% 1/25/39 | | 331,000 | 315,573 |
| 5.576% 1/25/49 | | 406,000 | 372,759 |
| Time Warner Cable LLC: | | | |
| 4.5% 9/15/42 | | 418,000 | 305,934 |
| 5.5% 9/1/41 | | 214,000 | 178,216 |
| 5.875% 11/15/40 | | 188,000 | 163,122 |
| 6.55% 5/1/37 | | 2,538,000 | 2,403,497 |
| 7.3% 7/1/38 | | 585,000 | 591,998 |
| TWDC Enterprises 18 Corp.: | | | |
| 1.85% 7/30/26 | | 140,000 | 130,917 |
| 3% 7/30/46 | | 123,000 | 83,652 |
| 3.15% 9/17/25 | | 260,000 | 253,376 |
| 4.125% 6/1/44 | | 156,000 | 130,085 |
| Warnermedia Holdings, Inc.: | | | |
| 3.638% 3/15/25 | | 281,000 | 276,643 |
| 3.755% 3/15/27 | | 853,000 | 809,855 |
| 4.054% 3/15/29 | | 190,000 | 175,464 |
| 4.279% 3/15/32 | | 4,437,000 | 3,872,736 |
| 5.05% 3/15/42 | | 692,000 | 562,879 |
| 5.141% 3/15/52 | | 8,192,000 | 6,378,359 |
| | | | 42,770,676 |
| Wireless Telecommunication Services - 0.2% | | | |
| T-Mobile U.S.A., Inc.: | | | |
| 2.05% 2/15/28 | | 412,000 | 370,059 |
| 2.25% 11/15/31 | | 5,000,000 | 4,086,464 |
| 3.3% 2/15/51 | | 412,000 | 278,149 |
| 3.5% 4/15/25 | | 241,000 | 236,941 |
| 3.75% 4/15/27 | | 997,000 | 958,277 |
| 3.875% 4/15/30 | | 1,339,000 | 1,251,733 |
| Vodafone Group PLC: | | | |
| 5.125% 6/19/59 | | 180,000 | 156,479 |
| 5.25% 5/30/48 | | 655,000 | 603,447 |
| | | | 7,941,549 |
TOTAL COMMUNICATION SERVICES | | | 72,088,703 |
| CONSUMER DISCRETIONARY - 0.5% | | | |
| Automobiles - 0.1% | | | |
| General Motors Co.: | | | |
| 5% 10/1/28 | | 189,000 | 187,220 |
| 5.2% 4/1/45 | | 117,000 | 102,684 |
| 5.95% 4/1/49 | | 173,000 | 167,904 |
| 6.6% 4/1/36 | | 160,000 | 167,422 |
| 6.75% 4/1/46 | | 196,000 | 204,673 |
| 6.8% 10/1/27 | | 364,000 | 377,865 |
| General Motors Financial Co., Inc.: | | | |
| 3.85% 1/5/28 | | 192,000 | 182,165 |
| 4% 1/15/25 | | 169,000 | 167,345 |
| 4% 10/6/26 | | 101,000 | 97,797 |
| 4.3% 7/13/25 | | 340,000 | 335,458 |
| 4.35% 1/17/27 | | 219,000 | 213,309 |
| 5.65% 1/17/29 | | 587,000 | 589,745 |
| 5.85% 4/6/30 | | 1,080,000 | 1,093,215 |
| | | | 3,886,802 |
| Broadline Retail - 0.0% | | | |
| Alibaba Group Holding Ltd.: | | | |
| 2.125% 2/9/31 | | 572,000 | 472,203 |
| 3.15% 2/9/51 | | 589,000 | 374,310 |
| Kohl's Corp. 4.25% 7/17/25 | | 100,000 | 98,181 |
| Nordstrom, Inc.: | | | |
| 4% 3/15/27 | | 124,000 | 118,104 |
| 5% 1/15/44 | | 55,000 | 44,411 |
| | | | 1,107,209 |
| Diversified Consumer Services - 0.1% | | | |
| American University 3.672% 4/1/49 | | 66,000 | 51,097 |
| Duke University 2.832% 10/1/55 | | 128,000 | 82,909 |
| George Washington University: | | | |
| 4.126% 9/15/48 | | 192,000 | 162,618 |
| 4.3% 9/15/44 | | 55,000 | 48,485 |
| Massachusetts Institute of Technology: | | | |
| 2.989% 7/1/50 | | 128,000 | 89,958 |
| 3.885% 7/1/2116 | | 78,000 | 57,412 |
| 3.959% 7/1/38 | | 130,000 | 118,166 |
| Northwestern University: | | | |
| 3.662% 12/1/57 | | 152,000 | 113,350 |
| 4.643% 12/1/44 | | 92,000 | 86,806 |
| President and Fellows of Harvard College: | | | |
| 3.3% 7/15/56 | | 133,000 | 95,208 |
| 3.619% 10/1/37 | | 27,000 | 23,504 |
| Rice University 3.774% 5/15/55 | | 50,000 | 40,296 |
| Trane Technologies Global Holding Co. Ltd.: | | | |
| 3.75% 8/21/28 | | 127,000 | 121,064 |
| 4.3% 2/21/48 | | 136,000 | 112,734 |
| Trustees of Princeton Univ. 5.7% 3/1/39 | | 27,000 | 28,996 |
| University Notre Dame du Lac 3.438% 2/15/45 | | 91,000 | 71,849 |
| University of Southern California: | | | |
| 2.945% 10/1/51 | | 314,000 | 209,996 |
| 5.25% 10/1/2111 | | 55,000 | 53,650 |
| | | | 1,568,098 |
| Hotels, Restaurants & Leisure - 0.1% | | | |
| Expedia Group, Inc. 3.25% 2/15/30 | | 237,000 | 213,627 |
| McDonald's Corp.: | | | |
| 3.3% 7/1/25 | | 165,000 | 161,547 |
| 3.5% 7/1/27 | | 475,000 | 455,200 |
| 3.6% 7/1/30 | | 448,000 | 414,850 |
| 3.7% 1/30/26 | | 463,000 | 452,375 |
| Metropolitan Museum of Art 3.4% 7/1/45 | | 82,000 | 62,245 |
| | | | 1,759,844 |
| Leisure Products - 0.0% | | | |
| Hasbro, Inc. 3% 11/19/24 | | 552,000 | 546,641 |
| Specialty Retail - 0.2% | | | |
| AutoNation, Inc.: | | | |
| 3.85% 3/1/32 | | 2,004,000 | 1,779,835 |
| 4.75% 6/1/30 | | 96,000 | 91,745 |
| AutoZone, Inc.: | | | |
| 3.25% 4/15/25 | | 110,000 | 107,951 |
| 3.625% 4/15/25 | | 461,000 | 453,957 |
| 3.75% 6/1/27 | | 159,000 | 152,836 |
| 4% 4/15/30 | | 996,000 | 936,555 |
| Lowe's Companies, Inc.: | | | |
| 1.3% 4/15/28 | | 220,000 | 191,958 |
| 1.7% 10/15/30 | | 334,000 | 272,702 |
| 3.35% 4/1/27 | | 85,000 | 81,097 |
| 3.65% 4/5/29 | | 294,000 | 276,563 |
| 3.7% 4/15/46 | | 96,000 | 70,538 |
| 3.75% 4/1/32 | | 899,000 | 816,203 |
| 4.05% 5/3/47 | | 315,000 | 243,370 |
| 4.45% 4/1/62 | | 1,098,000 | 853,607 |
| 4.5% 4/15/30 | | 811,000 | 787,019 |
| O'Reilly Automotive, Inc. 4.2% 4/1/30 | | 148,000 | 140,863 |
| | | | 7,256,799 |
| Textiles, Apparel & Luxury Goods - 0.0% | | | |
| NIKE, Inc.: | | | |
| 2.4% 3/27/25 | | 171,000 | 167,316 |
| 2.85% 3/27/30 | | 165,000 | 148,558 |
| 3.25% 3/27/40 | | 334,000 | 259,837 |
| 3.375% 11/1/46 | | 123,000 | 90,502 |
| 3.375% 3/27/50 | | 165,000 | 118,887 |
| Tapestry, Inc. 3.05% 3/15/32 | | 80,000 | 64,512 |
| | | | 849,612 |
TOTAL CONSUMER DISCRETIONARY | | | 16,975,005 |
| CONSUMER STAPLES - 1.0% | | | |
| Beverages - 0.6% | | | |
| Anheuser-Busch Companies LLC / Anheuser-Busch InBev Worldwide, Inc. 4.9% 2/1/46 | | 10,000,000 | 9,219,596 |
| Anheuser-Busch InBev Finance, Inc. 4.625% 2/1/44 | | 158,000 | 141,072 |
| Anheuser-Busch InBev Worldwide, Inc.: | | | |
| 3.5% 6/1/30 | | 465,000 | 431,994 |
| 4.439% 10/6/48 | | 203,000 | 173,713 |
| 4.6% 4/15/48 | | 514,000 | 454,596 |
| 8.2% 1/15/39 | | 77,000 | 97,951 |
| Constellation Brands, Inc.: | | | |
| 3.5% 5/9/27 | | 274,000 | 261,594 |
| 3.7% 12/6/26 | | 207,000 | 200,004 |
| 5.25% 11/15/48 | | 199,000 | 185,178 |
| Diageo Capital PLC: | | | |
| 1.375% 9/29/25 | | 380,000 | 361,723 |
| 2% 4/29/30 | | 407,000 | 346,916 |
| 2.125% 4/29/32 | | 367,000 | 297,599 |
| Keurig Dr. Pepper, Inc. 3.8% 5/1/50 | | 87,000 | 64,746 |
| Molson Coors Beverage Co.: | | | |
| 3% 7/15/26 | | 1,419,000 | 1,358,411 |
| 4.2% 7/15/46 | | 363,000 | 290,102 |
| 5% 5/1/42 | | 1,644,000 | 1,503,721 |
| The Coca-Cola Co.: | | | |
| 1.375% 3/15/31 | | 334,000 | 268,164 |
| 1.45% 6/1/27 | | 230,000 | 210,085 |
| 1.65% 6/1/30 | | 230,000 | 192,944 |
| 2.5% 6/1/40 | | 230,000 | 161,447 |
| 2.5% 3/15/51 | | 167,000 | 101,209 |
| 2.6% 6/1/50 | | 230,000 | 142,835 |
| 2.75% 6/1/60 | | 230,000 | 139,572 |
| 3.375% 3/25/27 | | 713,000 | 688,421 |
| 3.45% 3/25/30 | | 436,000 | 407,742 |
| | | | 17,701,335 |
| Consumer Staples Distribution & Retail - 0.0% | | | |
| Dollar Tree, Inc. 4% 5/15/25 | | 219,000 | 215,807 |
| Sysco Corp.: | | | |
| 3.3% 7/15/26 | | 90,000 | 86,552 |
| 3.75% 10/1/25 | | 156,000 | 152,683 |
| 6.6% 4/1/40 | | 270,000 | 291,618 |
| | | | 746,660 |
| Food Products - 0.0% | | | |
| Campbell Soup Co. 4.8% 3/15/48 | | 384,000 | 335,330 |
| General Mills, Inc.: | | | |
| 2.875% 4/15/30 | | 289,000 | 256,340 |
| 3% 2/1/51 | | 168,000 | 106,933 |
| 4.2% 4/17/28 | | 472,000 | 457,172 |
| | | | 1,155,775 |
| Household Products - 0.1% | | | |
| Kimberly-Clark Corp.: | | | |
| 1.05% 9/15/27 | | 579,000 | 513,432 |
| 3.1% 3/26/30 | | 116,000 | 106,090 |
| 3.2% 7/30/46 | | 69,000 | 49,039 |
| 3.95% 11/1/28 | | 234,000 | 225,705 |
| Procter & Gamble Co.: | | | |
| 1% 4/23/26 | | 315,000 | 294,162 |
| 1.95% 4/23/31 | | 500,000 | 425,100 |
| 2.85% 8/11/27 | | 123,000 | 116,232 |
| 3% 3/25/30 | | 272,000 | 250,271 |
| | | | 1,980,031 |
| Tobacco - 0.3% | | | |
| Altria Group, Inc.: | | | |
| 3.875% 9/16/46 | | 274,000 | 197,346 |
| 4.25% 8/9/42 | | 963,000 | 766,233 |
| 4.5% 5/2/43 | | 466,000 | 381,461 |
| 4.8% 2/14/29 | | 491,000 | 482,908 |
| 5.8% 2/14/39 | | 256,000 | 256,142 |
| 5.95% 2/14/49 | | 452,000 | 443,181 |
| BAT Capital Corp.: | | | |
| 3.222% 8/15/24 | | 164,000 | 163,385 |
| 3.557% 8/15/27 | | 153,000 | 145,329 |
| 4.39% 8/15/37 | | 298,000 | 251,459 |
| 4.54% 8/15/47 | | 306,000 | 235,615 |
| 4.758% 9/6/49 | | 334,000 | 262,787 |
| 6.421% 8/2/33 | | 422,000 | 441,211 |
| Imperial Brands Finance PLC: | | | |
| 4.25% 7/21/25 (b) | | 1,945,000 | 1,915,426 |
| 6.125% 7/27/27 (b) | | 1,309,000 | 1,331,715 |
| Philip Morris International, Inc.: | | | |
| 2.75% 2/25/26 | | 103,000 | 98,684 |
| 3.875% 8/21/42 | | 132,000 | 102,720 |
| 4.125% 3/4/43 | | 274,000 | 219,763 |
| 4.875% 11/15/43 | | 165,000 | 145,503 |
| 6.375% 5/16/38 | | 40,000 | 42,968 |
| Reynolds American, Inc.: | | | |
| 4.45% 6/12/25 | | 303,000 | 299,451 |
| 5.7% 8/15/35 | | 153,000 | 149,399 |
| 5.85% 8/15/45 | | 116,000 | 106,990 |
| 6.15% 9/15/43 | | 502,000 | 483,181 |
| 7.25% 6/15/37 | | 570,000 | 616,002 |
| | | | 9,538,859 |
TOTAL CONSUMER STAPLES | | | 31,122,660 |
| ENERGY - 2.3% | | | |
| Energy Equipment & Services - 0.0% | | | |
| Baker Hughes Co.: | | | |
| 4.08% 12/15/47 | | 659,000 | 526,976 |
| 5.125% 9/15/40 | | 55,000 | 52,311 |
| Halliburton Co.: | | | |
| 2.92% 3/1/30 | | 264,000 | 236,101 |
| 3.8% 11/15/25 | | 14,000 | 13,700 |
| 4.85% 11/15/35 | | 270,000 | 256,812 |
| 5% 11/15/45 | | 207,000 | 187,385 |
| 7.45% 9/15/39 | | 41,000 | 48,541 |
| | | | 1,321,826 |
| Oil, Gas & Consumable Fuels - 2.3% | | | |
| Apache Corp. 5.1% 9/1/40 | | 82,000 | 69,975 |
| Boardwalk Pipelines LP 4.95% 12/15/24 | | 130,000 | 129,500 |
| Canadian Natural Resources Ltd.: | | | |
| 3.9% 2/1/25 | | 51,000 | 50,414 |
| 4.95% 6/1/47 | | 175,000 | 151,852 |
| 5.85% 2/1/35 | | 644,000 | 638,811 |
| 6.25% 3/15/38 | | 188,000 | 192,879 |
| Cenovus Energy, Inc.: | | | |
| 2.65% 1/15/32 | | 196,000 | 162,108 |
| 5.4% 6/15/47 | | 154,000 | 141,743 |
| 6.75% 11/15/39 | | 8,000 | 8,632 |
| Columbia Pipeline Group, Inc. 4.5% 6/1/25 | | 259,000 | 255,818 |
| Columbia Pipelines Operating Co. LLC: | | | |
| 5.927% 8/15/30 (b) | | 432,000 | 441,269 |
| 6.036% 11/15/33 (b) | | 1,163,000 | 1,188,490 |
| 6.497% 8/15/43 (b) | | 348,000 | 362,435 |
| 6.544% 11/15/53 (b) | | 626,000 | 659,610 |
| 6.714% 8/15/63 (b) | | 375,000 | 396,740 |
| ConocoPhillips Co.: | | | |
| 5.95% 3/15/46 | | 165,000 | 171,576 |
| 6.5% 2/1/39 | | 206,000 | 226,438 |
| DCP Midstream Operating LP: | | | |
| 5.125% 5/15/29 | | 1,257,000 | 1,250,905 |
| 5.6% 4/1/44 | | 154,000 | 147,479 |
| 6.45% 11/3/36 (b) | | 311,000 | 327,304 |
| 6.75% 9/15/37 (b) | | 1,205,000 | 1,300,945 |
| Devon Energy Corp.: | | | |
| 5% 6/15/45 | | 456,000 | 388,702 |
| 5.6% 7/15/41 | | 79,000 | 73,494 |
| Enbridge, Inc.: | | | |
| 4.25% 12/1/26 | | 223,000 | 217,711 |
| 5.5% 12/1/46 | | 397,000 | 380,137 |
| Energy Transfer LP: | | | |
| 3.75% 5/15/30 | | 750,000 | 689,929 |
| 3.9% 7/15/26 | | 206,000 | 199,472 |
| 4.95% 6/15/28 | | 767,000 | 756,866 |
| 5% 5/15/50 | | 3,892,000 | 3,303,591 |
| 5.15% 3/15/45 | | 219,000 | 192,510 |
| 5.25% 4/15/29 | | 258,000 | 256,979 |
| 5.3% 4/1/44 | | 159,000 | 143,040 |
| 5.4% 10/1/47 | | 420,000 | 375,727 |
| 5.8% 6/15/38 | | 523,000 | 511,918 |
| 6% 6/15/48 | | 923,000 | 889,381 |
| 6.125% 12/15/45 | | 120,000 | 117,649 |
| 6.25% 4/15/49 | | 257,000 | 255,660 |
| Enterprise Products Operating LP: | | | |
| 3.3% 2/15/53 | | 104,000 | 70,043 |
| 3.7% 2/15/26 | | 652,000 | 635,235 |
| 3.95% 2/15/27 | | 710,000 | 689,776 |
| 4.2% 1/31/50 | | 163,000 | 130,702 |
| 4.25% 2/15/48 | | 547,000 | 447,105 |
| 4.8% 2/1/49 | | 201,000 | 178,270 |
| 4.85% 8/15/42 | | 69,000 | 62,321 |
| 4.85% 3/15/44 | | 137,000 | 123,384 |
| 4.9% 5/15/46 | | 117,000 | 105,511 |
| 5.7% 2/15/42 | | 55,000 | 55,025 |
| 7.55% 4/15/38 | | 55,000 | 64,990 |
| EOG Resources, Inc. 4.15% 1/15/26 | | 154,000 | 151,578 |
| Equinor ASA: | | | |
| 2.375% 5/22/30 | | 316,000 | 275,915 |
| 3.125% 4/6/30 | | 274,000 | 249,875 |
| 3.625% 9/10/28 | | 331,000 | 316,082 |
| 3.7% 4/6/50 | | 438,000 | 332,647 |
| 5.1% 8/17/40 | | 55,000 | 53,122 |
| Exxon Mobil Corp.: | | | |
| 3.043% 3/1/26 | | 228,000 | 220,521 |
| 3.452% 4/15/51 | | 114,000 | 82,272 |
| 3.567% 3/6/45 | | 182,000 | 138,983 |
| Hess Corp.: | | | |
| 3.5% 7/15/24 | | 104,000 | 103,902 |
| 4.3% 4/1/27 | | 614,000 | 598,673 |
| 5.6% 2/15/41 | | 2,043,000 | 2,036,369 |
| 5.8% 4/1/47 | | 117,000 | 118,420 |
| 7.125% 3/15/33 | | 126,000 | 141,429 |
| 7.3% 8/15/31 | | 168,000 | 187,269 |
| 7.875% 10/1/29 | | 551,000 | 616,225 |
| Kinder Morgan Energy Partners LP: | | | |
| 4.25% 9/1/24 | | 411,000 | 409,773 |
| 4.7% 11/1/42 | | 104,000 | 87,163 |
| 5% 3/1/43 | | 27,000 | 23,599 |
| 5.5% 3/1/44 | | 192,000 | 177,359 |
| 5.625% 9/1/41 | | 27,000 | 25,457 |
| 6.55% 9/15/40 | | 140,000 | 144,153 |
| Kinder Morgan, Inc.: | | | |
| 4.3% 3/1/28 | | 273,000 | 265,039 |
| 5.2% 3/1/48 | | 241,000 | 213,679 |
| 5.3% 12/1/34 | | 234,000 | 226,802 |
| 5.55% 6/1/45 | | 573,000 | 534,455 |
| Marathon Oil Corp. 5.2% 6/1/45 | | 137,000 | 126,130 |
| Marathon Petroleum Corp.: | | | |
| 4.5% 4/1/48 | | 160,000 | 128,698 |
| 4.7% 5/1/25 | | 601,000 | 596,086 |
| 6.5% 3/1/41 | | 27,000 | 28,100 |
| MPLX LP: | | | |
| 4.125% 3/1/27 | | 259,000 | 251,494 |
| 4.7% 4/15/48 | | 535,000 | 440,062 |
| 4.8% 2/15/29 | | 393,000 | 385,214 |
| 4.875% 12/1/24 | | 344,000 | 342,527 |
| 4.95% 9/1/32 | | 2,488,000 | 2,380,540 |
| 5.2% 3/1/47 | | 168,000 | 150,013 |
| 5.5% 2/15/49 | | 662,000 | 610,668 |
| Occidental Petroleum Corp.: | | | |
| 6.2% 3/15/40 | | 214,000 | 214,417 |
| 6.45% 9/15/36 | | 578,000 | 603,723 |
| 6.6% 3/15/46 | | 717,000 | 747,998 |
| 7.5% 5/1/31 | | 964,000 | 1,063,515 |
| ONEOK, Inc.: | | | |
| 4.25% 9/15/46 | | 151,000 | 118,249 |
| 4.45% 9/1/49 | | 160,000 | 125,777 |
| 4.95% 7/13/47 | | 160,000 | 136,646 |
| 5% 3/1/26 | | 82,000 | 81,315 |
| 5.2% 7/15/48 | | 83,000 | 73,413 |
| Ovintiv, Inc. 6.5% 2/1/38 | | 244,000 | 250,892 |
| Petroleos Mexicanos: | | | |
| 4.5% 1/23/26 | | 668,000 | 634,809 |
| 5.95% 1/28/31 | | 807,000 | 648,626 |
| 6.35% 2/12/48 | | 1,658,000 | 1,051,669 |
| 6.49% 1/23/27 | | 481,000 | 461,231 |
| 6.5% 3/13/27 | | 607,000 | 578,107 |
| 6.5% 1/23/29 | | 698,000 | 629,945 |
| 6.7% 2/16/32 | | 2,119,000 | 1,772,904 |
| 6.75% 9/21/47 | | 1,520,000 | 1,001,482 |
| 6.84% 1/23/30 | | 484,000 | 425,630 |
| 6.95% 1/28/60 | | 989,000 | 649,526 |
| 7.69% 1/23/50 | | 2,036,000 | 1,467,508 |
| 8.75% 6/2/29 | | 15,000,000 | 14,728,125 |
| Phillips 66 Co.: | | | |
| 3.85% 4/9/25 | | 77,000 | 75,980 |
| 4.875% 11/15/44 | | 27,000 | 23,906 |
| 5.875% 5/1/42 | | 260,000 | 261,999 |
| Plains All American Pipeline LP/PAA Finance Corp.: | | | |
| 3.55% 12/15/29 | | 166,000 | 151,576 |
| 3.6% 11/1/24 | | 371,000 | 368,220 |
| 4.65% 10/15/25 | | 336,000 | 331,465 |
| 4.9% 2/15/45 | | 52,000 | 44,078 |
| 6.65% 1/15/37 | | 77,000 | 80,974 |
| Sabine Pass Liquefaction LLC 4.5% 5/15/30 | | 1,002,000 | 961,250 |
| Spectra Energy Partners LP 3.375% 10/15/26 | | 447,000 | 427,937 |
| Suncor Energy, Inc.: | | | |
| 4% 11/15/47 | | 137,000 | 103,201 |
| 6.8% 5/15/38 | | 232,000 | 247,593 |
| 6.85% 6/1/39 | | 55,000 | 59,261 |
| The Williams Companies, Inc.: | | | |
| 3.5% 11/15/30 | | 1,068,000 | 968,042 |
| 3.75% 6/15/27 | | 640,000 | 614,272 |
| 3.9% 1/15/25 | | 250,000 | 247,623 |
| 4.65% 8/15/32 | | 2,571,000 | 2,442,044 |
| 4.85% 3/1/48 | | 231,000 | 199,791 |
| 5.3% 8/15/52 | | 581,000 | 537,443 |
| 5.75% 6/24/44 | | 52,000 | 50,912 |
| TotalEnergies Capital International SA: | | | |
| 3.127% 5/29/50 | | 98,000 | 66,078 |
| 3.455% 2/19/29 | | 585,000 | 548,811 |
| 3.461% 7/12/49 | | 179,000 | 130,169 |
| TransCanada PipeLines Ltd.: | | | |
| 4.75% 5/15/38 | | 288,000 | 263,391 |
| 4.875% 1/15/26 | | 137,000 | 135,866 |
| 4.875% 5/15/48 | | 135,000 | 118,563 |
| 5.1% 3/15/49 | | 96,000 | 87,137 |
| 6.1% 6/1/40 | | 184,000 | 187,061 |
| Transcontinental Gas Pipe Line Co. LLC: | | | |
| 3.25% 5/15/30 | | 288,000 | 259,866 |
| 4.45% 8/1/42 | | 212,000 | 184,451 |
| 4.6% 3/15/48 | | 110,000 | 93,654 |
| Valero Energy Corp. 6.625% 6/15/37 | | 149,000 | 158,830 |
| Western Midstream Operating LP: | | | |
| 3.95% 6/1/25 | | 109,000 | 106,942 |
| 4.5% 3/1/28 | | 251,000 | 242,042 |
| 4.65% 7/1/26 | | 1,137,000 | 1,114,903 |
| 4.75% 8/15/28 | | 145,000 | 141,718 |
| | | | 72,262,900 |
TOTAL ENERGY | | | 73,584,726 |
| FINANCIALS - 12.8% | | | |
| Banks - 6.1% | | | |
| Banco Santander SA: | | | |
| 1.849% 3/25/26 | | 400,000 | 374,929 |
| 2.958% 3/25/31 | | 400,000 | 341,860 |
| 3.225% 11/22/32 (c) | | 200,000 | 166,653 |
| Bank of America Corp.: | | | |
| U.S. Secured Overnight Fin. Rate (SOFR) Index + 0.650% 1.53% 12/6/25 (c)(d) | | 1,351,000 | 1,325,788 |
| 1.658% 3/11/27 (c) | | 532,000 | 498,792 |
| 1.734% 7/22/27 (c) | | 690,000 | 639,579 |
| 2.015% 2/13/26 (c) | | 692,000 | 676,162 |
| 2.087% 6/14/29 (c) | | 157,000 | 139,282 |
| 2.299% 7/21/32 (c) | | 2,174,000 | 1,779,694 |
| 2.651% 3/11/32 (c) | | 506,000 | 428,153 |
| 2.676% 6/19/41 (c) | | 340,000 | 237,553 |
| 2.687% 4/22/32 (c) | | 246,000 | 207,900 |
| 2.831% 10/24/51 (c) | | 276,000 | 174,376 |
| 2.972% 7/21/52 (c) | | 268,000 | 174,750 |
| 3.194% 7/23/30 (c) | | 1,318,000 | 1,196,776 |
| 3.248% 10/21/27 | | 103,000 | 97,419 |
| 3.366% 1/23/26 (c) | | 724,000 | 713,981 |
| 3.419% 12/20/28 (c) | | 3,213,000 | 3,021,260 |
| 3.5% 4/19/26 | | 631,000 | 611,573 |
| 3.593% 7/21/28 (c) | | 304,000 | 289,342 |
| 3.705% 4/24/28 (c) | | 241,000 | 230,833 |
| 3.846% 3/8/37 (c) | | 197,000 | 172,644 |
| 3.95% 4/21/25 | | 518,000 | 510,563 |
| 3.97% 3/5/29 (c) | | 601,000 | 574,642 |
| 3.974% 2/7/30 (c) | | 388,000 | 367,445 |
| 4% 1/22/25 | | 165,000 | 163,430 |
| 4.083% 3/20/51 (c) | | 173,000 | 138,166 |
| 4.183% 11/25/27 | | 425,000 | 410,290 |
| 4.2% 8/26/24 | | 2,742,000 | 2,735,082 |
| 4.25% 10/22/26 | | 645,000 | 628,991 |
| 4.271% 7/23/29 (c) | | 494,000 | 475,976 |
| 4.33% 3/15/50 (c) | | 359,000 | 299,691 |
| 4.443% 1/20/48 (c) | | 418,000 | 356,396 |
| 4.45% 3/3/26 | | 547,000 | 537,911 |
| 4.571% 4/27/33 (c) | | 10,000,000 | 9,430,620 |
| 5% 1/21/44 | | 147,000 | 138,291 |
| 5.015% 7/22/33 (c) | | 14,951,000 | 14,613,424 |
| 5.875% 2/7/42 | | 90,000 | 93,580 |
| 6.11% 1/29/37 | | 194,000 | 201,568 |
| 7.75% 5/14/38 | | 114,000 | 135,561 |
| Bank of Montreal 3.803% 12/15/32 (c) | | 320,000 | 300,660 |
| Barclays PLC: | | | |
| 2.279% 11/24/27 (c) | | 500,000 | 463,202 |
| 2.894% 11/24/32 (c) | | 520,000 | 430,144 |
| 4.836% 5/9/28 | | 263,000 | 253,943 |
| 4.95% 1/10/47 | | 443,000 | 395,006 |
| 5.088% 6/20/30 (c) | | 923,000 | 882,433 |
| 5.2% 5/12/26 | | 781,000 | 772,034 |
| 5.829% 5/9/27 (c) | | 4,830,000 | 4,837,081 |
| 6.224% 5/9/34 (c) | | 2,572,000 | 2,635,349 |
| BNP Paribas SA 2.219% 6/9/26 (b)(c) | | 947,000 | 915,442 |
| Citigroup, Inc.: | | | |
| 1.122% 1/28/27 (c) | | 487,000 | 454,201 |
| 2.561% 5/1/32 (c) | | 414,000 | 345,010 |
| 3.106% 4/8/26 (c) | | 854,000 | 836,674 |
| 3.52% 10/27/28 (c) | | 632,000 | 597,359 |
| 3.668% 7/24/28 (c) | | 1,119,000 | 1,066,664 |
| 3.7% 1/12/26 | | 305,000 | 297,038 |
| 3.875% 3/26/25 | | 1,193,000 | 1,176,571 |
| 3.887% 1/10/28 (c) | | 123,000 | 118,730 |
| 3.98% 3/20/30 (c) | | 976,000 | 921,356 |
| 4.125% 7/25/28 | | 423,000 | 406,046 |
| 4.3% 11/20/26 | | 218,000 | 212,648 |
| 4.4% 6/10/25 | | 110,000 | 108,498 |
| 4.412% 3/31/31 (c) | | 1,601,000 | 1,525,866 |
| 4.45% 9/29/27 | | 3,118,000 | 3,039,220 |
| 4.6% 3/9/26 | | 441,000 | 433,914 |
| 4.65% 7/23/48 | | 389,000 | 339,352 |
| 4.75% 5/18/46 | | 216,000 | 185,293 |
| 4.91% 5/24/33 (c) | | 11,248,000 | 10,801,007 |
| 5.3% 5/6/44 | | 55,000 | 51,233 |
| 5.5% 9/13/25 | | 831,000 | 830,084 |
| 5.875% 1/30/42 | | 149,000 | 152,759 |
| 6.27% 11/17/33 (c) | | 5,000,000 | 5,236,665 |
| 8.125% 7/15/39 | | 219,000 | 273,777 |
| Citizens Financial Group, Inc. 2.638% 9/30/32 | | 662,000 | 507,861 |
| Commonwealth Bank of Australia 3.61% 9/12/34 (b)(c) | | 328,000 | 295,447 |
| Cooperatieve Rabobank UA: | | | |
| 3.75% 7/21/26 | | 528,000 | 508,255 |
| 4.375% 8/4/25 | | 936,000 | 921,274 |
| 5.25% 5/24/41 | | 82,000 | 80,935 |
| Export-Import Bank of Korea: | | | |
| 0.625% 2/9/26 | | 719,000 | 670,413 |
| 2.875% 1/21/25 | | 208,000 | 205,292 |
| Fifth Third Bancorp: | | | |
| 2.55% 5/5/27 | | 407,000 | 376,936 |
| 8.25% 3/1/38 | | 57,000 | 67,405 |
| HSBC Holdings PLC: | | | |
| 2.013% 9/22/28 (c) | | 1,336,000 | 1,199,820 |
| 2.099% 6/4/26 (c) | | 500,000 | 483,400 |
| 4.292% 9/12/26 (c) | | 1,276,000 | 1,253,578 |
| 4.375% 11/23/26 | | 787,000 | 766,919 |
| 4.95% 3/31/30 | | 398,000 | 391,188 |
| 6.5% 9/15/37 | | 288,000 | 294,951 |
| 6.8% 6/1/38 | | 167,000 | 181,928 |
| ING Groep NV: | | | |
| 1.726% 4/1/27 (c) | | 253,000 | 236,618 |
| 2.727% 4/1/32 (c) | | 256,000 | 215,920 |
| Intesa Sanpaolo SpA 5.71% 1/15/26 (b) | | 1,614,000 | 1,598,656 |
| Japan Bank International Cooperation: | | | |
| 1.25% 1/21/31 | | 1,072,000 | 868,032 |
| 2.375% 4/20/26 | | 358,000 | 341,510 |
| 2.875% 6/1/27 | | 208,000 | 197,075 |
| 3.25% 7/20/28 | | 246,000 | 233,023 |
| JPMorgan Chase & Co.: | | | |
| 0.768% 8/9/25 (c) | | 1,241,000 | 1,234,207 |
| 1.47% 9/22/27 (c) | | 821,000 | 754,081 |
| 1.953% 2/4/32 (c) | | 440,000 | 357,889 |
| 2.083% 4/22/26 (c) | | 1,010,000 | 980,771 |
| 2.522% 4/22/31 (c) | | 329,000 | 284,363 |
| 2.545% 11/8/32 (c) | | 642,000 | 534,584 |
| 2.95% 10/1/26 | | 692,000 | 659,428 |
| 2.956% 5/13/31 (c) | | 884,000 | 774,755 |
| 3.109% 4/22/51 (c) | | 409,000 | 278,471 |
| 3.3% 4/1/26 | | 247,000 | 239,114 |
| 3.509% 1/23/29 (c) | | 867,000 | 819,890 |
| 3.54% 5/1/28 (c) | | 466,000 | 444,736 |
| 3.875% 9/10/24 | | 6,391,000 | 6,366,028 |
| 3.882% 7/24/38 (c) | | 123,000 | 105,446 |
| 3.9% 7/15/25 | | 592,000 | 582,885 |
| 3.96% 1/29/27 (c) | | 334,000 | 326,249 |
| 3.964% 11/15/48 (c) | | 258,000 | 204,953 |
| 4.005% 4/23/29 (c) | | 563,000 | 538,319 |
| 4.125% 12/15/26 | | 1,929,000 | 1,879,353 |
| 4.203% 7/23/29 (c) | | 1,198,000 | 1,152,907 |
| 4.323% 4/26/28 (c) | | 326,000 | 318,024 |
| 4.452% 12/5/29 (c) | | 335,000 | 325,224 |
| 4.493% 3/24/31 (c) | | 1,607,000 | 1,547,907 |
| 4.586% 4/26/33 (c) | | 8,275,000 | 7,893,821 |
| 4.85% 2/1/44 | | 137,000 | 127,828 |
| 4.912% 7/25/33 (c) | | 15,028,000 | 14,595,750 |
| 4.95% 6/1/45 | | 262,000 | 245,241 |
| 5.5% 10/15/40 | | 156,000 | 156,616 |
| 5.6% 7/15/41 | | 41,000 | 41,701 |
| 5.625% 8/16/43 | | 137,000 | 139,168 |
| 5.717% 9/14/33 (c) | | 2,300,000 | 2,331,839 |
| Lloyds Banking Group PLC: | | | |
| 4.344% 1/9/48 | | 411,000 | 319,930 |
| 4.582% 12/10/25 | | 320,000 | 314,174 |
| 4.65% 3/24/26 | | 236,000 | 231,659 |
| Mitsubishi UFJ Financial Group, Inc.: | | | |
| 1.538% 7/20/27 (c) | | 309,000 | 285,941 |
| 2.309% 7/20/32 (c) | | 300,000 | 246,674 |
| 2.801% 7/18/24 | | 224,000 | 223,679 |
| 3.195% 7/18/29 | | 390,000 | 355,638 |
| 3.751% 7/18/39 | | 217,000 | 181,261 |
| 3.961% 3/2/28 | | 603,000 | 580,574 |
| Mizuho Financial Group, Inc.: | | | |
| 1.554% 7/9/27 (c) | | 317,000 | 293,429 |
| 2.226% 5/25/26 (c) | | 374,000 | 362,414 |
| 2.26% 7/9/32 (c) | | 314,000 | 255,300 |
| 2.591% 5/25/31 (c) | | 454,000 | 387,555 |
| NatWest Group PLC: | | | |
| 3 month U.S. LIBOR + 1.750% 4.892% 5/18/29 (c)(d) | | 234,000 | 228,738 |
| 3.073% 5/22/28 (c) | | 584,000 | 546,470 |
| 3.754% 11/1/29 (c) | | 354,000 | 350,436 |
| 4.8% 4/5/26 | | 358,000 | 353,564 |
| Oesterreichische Kontrollbank AG 0.375% 9/17/25 | | 299,000 | 282,706 |
| PNC Financial Services Group, Inc.: | | | |
| 1.15% 8/13/26 | | 345,000 | 317,095 |
| 2.2% 11/1/24 | | 185,000 | 182,959 |
| 2.6% 7/23/26 | | 667,000 | 631,526 |
| 4.626% 6/6/33 (c) | | 15,000,000 | 13,887,968 |
| Royal Bank of Canada: | | | |
| 1.2% 4/27/26 | | 308,000 | 286,105 |
| 2.05% 1/21/27 | | 567,000 | 526,547 |
| 4.65% 1/27/26 | | 356,000 | 350,972 |
| Santander Holdings U.S.A., Inc. 2.49% 1/6/28 (c) | | 717,000 | 660,752 |
| Santander UK Group Holdings PLC 2.469% 1/11/28 (c) | | 334,000 | 308,138 |
| Societe Generale 1.488% 12/14/26 (b)(c) | | 1,222,000 | 1,142,386 |
| Truist Financial Corp. 1.267% 3/2/27 (c) | | 899,000 | 836,016 |
| U.S. Bancorp: | | | |
| 1.375% 7/22/30 | | 334,000 | 269,074 |
| 3% 7/30/29 | | 297,000 | 265,834 |
| 3.1% 4/27/26 | | 247,000 | 236,823 |
| Wells Fargo & Co.: | | | |
| 2.164% 2/11/26 (c) | | 1,018,000 | 995,892 |
| 2.188% 4/30/26 (c) | | 806,000 | 782,661 |
| 2.406% 10/30/25 (c) | | 1,970,000 | 1,947,620 |
| 2.572% 2/11/31 (c) | | 644,000 | 557,363 |
| 3% 10/23/26 | | 557,000 | 529,114 |
| 3.068% 4/30/41 (c) | | 487,000 | 357,108 |
| 3.35% 3/2/33 (c) | | 157,000 | 136,151 |
| 3.526% 3/24/28 (c) | | 1,167,000 | 1,113,140 |
| 3.584% 5/22/28 (c) | | 287,000 | 273,347 |
| 3.9% 5/1/45 | | 130,000 | 102,643 |
| 4.1% 6/3/26 | | 88,000 | 85,720 |
| 4.4% 6/14/46 | | 196,000 | 158,086 |
| 4.478% 4/4/31 (c) | | 1,796,000 | 1,719,481 |
| 4.75% 12/7/46 | | 439,000 | 371,739 |
| 4.897% 7/25/33 (c) | | 13,435,000 | 12,922,647 |
| 4.9% 11/17/45 | | 265,000 | 230,429 |
| 5.013% 4/4/51 (c) | | 2,145,000 | 1,953,917 |
| 5.375% 11/2/43 | | 184,000 | 172,528 |
| 5.499% 1/23/35 (c) | | 670,000 | 667,650 |
| 5.606% 1/15/44 | | 312,000 | 299,305 |
| Westpac Banking Corp.: | | | |
| 1.953% 11/20/28 | | 200,000 | 176,793 |
| 2.85% 5/13/26 | | 130,000 | 124,631 |
| 4.11% 7/24/34 (c) | | 800,000 | 739,184 |
| 4.421% 7/24/39 | | 160,000 | 141,231 |
| | | | 197,004,886 |
| Capital Markets - 3.4% | | | |
| Affiliated Managers Group, Inc. 3.5% 8/1/25 | | 278,000 | 271,883 |
| Ares Capital Corp.: | | | |
| 2.15% 7/15/26 | | 705,000 | 651,562 |
| 3.25% 7/15/25 | | 173,000 | 168,076 |
| 3.875% 1/15/26 | | 1,565,000 | 1,511,054 |
| Athene Global Funding: | | | |
| 5.339% 1/15/27 (b) | | 4,421,000 | 4,419,892 |
| 5.583% 1/9/29 (b) | | 2,226,000 | 2,235,005 |
| Bank of New York Mellon Corp.: | | | |
| 1.8% 7/28/31 | | 574,000 | 464,317 |
| 2.8% 5/4/26 | | 154,000 | 147,805 |
| Blackstone Private Credit Fund: | | | |
| 2.7% 1/15/25 | | 437,000 | 428,875 |
| 4.7% 3/24/25 | | 2,482,000 | 2,457,326 |
| 7.05% 9/29/25 | | 3,077,000 | 3,106,640 |
| Deutsche Bank AG: | | | |
| 4.1% 1/13/26 | | 330,000 | 324,141 |
| 4.5% 4/1/25 | | 1,502,000 | 1,483,704 |
| Deutsche Bank AG New York Branch: | | | |
| 2.311% 11/16/27 (c) | | 171,000 | 157,879 |
| 4.1% 1/13/26 | | 598,000 | 584,775 |
| 6.72% 1/18/29 (c) | | 1,810,000 | 1,867,888 |
| Goldman Sachs Group, Inc.: | | | |
| 0.855% 2/12/26 (c) | | 471,000 | 456,798 |
| 1.093% 12/9/26 (c) | | 1,144,000 | 1,069,404 |
| 2.383% 7/21/32 (c) | | 1,960,000 | 1,609,612 |
| 2.6% 2/7/30 | | 334,000 | 292,685 |
| 2.615% 4/22/32 (c) | | 848,000 | 712,963 |
| 2.65% 10/21/32 (c) | | 434,000 | 360,797 |
| 3.102% 2/24/33 (c) | | 16,994,000 | 14,513,940 |
| 3.272% 9/29/25 (c) | | 167,000 | 165,924 |
| 3.436% 2/24/43 (c) | | 137,000 | 103,456 |
| 3.5% 1/23/25 | | 1,432,000 | 1,414,373 |
| 3.691% 6/5/28 (c) | | 5,717,000 | 5,469,007 |
| 3.8% 3/15/30 | | 1,945,000 | 1,818,442 |
| 3.85% 1/26/27 | | 829,000 | 801,097 |
| 4.25% 10/21/25 | | 422,000 | 414,605 |
| 4.411% 4/23/39 (c) | | 130,000 | 114,951 |
| 4.75% 10/21/45 | | 433,000 | 388,718 |
| 5.95% 1/15/27 | | 411,000 | 417,949 |
| 6.75% 10/1/37 | | 843,000 | 909,453 |
| Intercontinental Exchange, Inc.: | | | |
| 1.85% 9/15/32 | | 310,000 | 240,291 |
| 2.65% 9/15/40 | | 310,000 | 214,242 |
| 3.75% 12/1/25 | | 158,000 | 154,325 |
| 3.75% 9/21/28 | | 256,000 | 243,462 |
| 4.25% 9/21/48 | | 290,000 | 236,856 |
| Moody's Corp.: | | | |
| 3.25% 1/15/28 | | 737,000 | 696,964 |
| 3.75% 3/24/25 | | 637,000 | 628,364 |
| 4.875% 12/17/48 | | 284,000 | 253,094 |
| Morgan Stanley: | | | |
| 1.164% 10/21/25 (c) | | 390,000 | 384,368 |
| 1.512% 7/20/27 (c) | | 270,000 | 249,616 |
| 1.593% 5/4/27 (c) | | 393,000 | 366,379 |
| 2.188% 4/28/26 (c) | | 672,000 | 652,609 |
| 2.239% 7/21/32 (c) | | 255,000 | 208,312 |
| 2.511% 10/20/32 (c) | | 137,000 | 113,231 |
| 2.72% 7/22/25 (c) | | 520,000 | 519,023 |
| 3.125% 7/27/26 | | 2,912,000 | 2,783,985 |
| 3.217% 4/22/42 (c) | | 498,000 | 372,754 |
| 3.591% 7/22/28 (c) | | 984,000 | 935,688 |
| 3.622% 4/1/31 (c) | | 1,260,000 | 1,156,194 |
| 3.625% 1/20/27 | | 1,381,000 | 1,331,486 |
| 3.772% 1/24/29 (c) | | 337,000 | 320,793 |
| 3.875% 1/27/26 | | 144,000 | 140,765 |
| 3.95% 4/23/27 | | 937,000 | 904,921 |
| 3.971% 7/22/38 (c) | | 171,000 | 144,806 |
| 4.3% 1/27/45 | | 55,000 | 46,605 |
| 4.375% 1/22/47 | | 304,000 | 260,090 |
| 4.431% 1/23/30 (c) | | 552,000 | 533,999 |
| 4.457% 4/22/39 (c) | | 207,000 | 185,016 |
| 4.889% 7/20/33 (c) | | 10,161,000 | 9,795,300 |
| 5% 11/24/25 | | 1,838,000 | 1,825,315 |
| 5.597% 3/24/51 (c) | | 355,000 | 359,071 |
| 6.342% 10/18/33 (c) | | 15,700,000 | 16,665,387 |
| 6.375% 7/24/42 | | 80,000 | 87,981 |
| 7.25% 4/1/32 | | 27,000 | 30,614 |
| Peachtree Corners Funding Trust 3.976% 2/15/25 (b) | | 628,000 | 618,895 |
| S&P Global, Inc.: | | | |
| 2.9% 3/1/32 | | 1,181,000 | 1,020,533 |
| 2.95% 1/22/27 | | 167,000 | 158,450 |
| State Street Corp.: | | | |
| 1.684% 11/18/27 (c) | | 548,000 | 504,350 |
| 2.65% 5/19/26 | | 207,000 | 197,705 |
| UBS AG 3.625% 9/9/24 | | 272,000 | 270,697 |
| UBS Group AG: | | | |
| 1.494% 8/10/27 (b)(c) | | 732,000 | 671,579 |
| 2.593% 9/11/25 (b)(c) | | 1,329,000 | 1,320,168 |
| 3.75% 3/26/25 | | 585,000 | 576,928 |
| 3.869% 1/12/29 (b)(c) | | 505,000 | 476,674 |
| 4.125% 9/24/25 (b) | | 661,000 | 648,118 |
| 4.194% 4/1/31 (b)(c) | | 1,208,000 | 1,127,698 |
| 4.55% 4/17/26 | | 323,000 | 317,404 |
| 4.875% 5/15/45 | | 310,000 | 278,794 |
| 6.537% 8/12/33 (b)(c) | | 7,000,000 | 7,345,717 |
| | | | 109,890,612 |
| Consumer Finance - 1.9% | | | |
| AerCap Ireland Capital Ltd./AerCap Global Aviation Trust: | | | |
| 1.65% 10/29/24 | | 528,000 | 520,846 |
| 2.45% 10/29/26 | | 878,000 | 819,028 |
| 3% 10/29/28 | | 730,000 | 663,403 |
| 3.3% 1/30/32 | | 567,000 | 487,176 |
| 3.4% 10/29/33 | | 204,000 | 171,113 |
| 3.5% 1/15/25 | | 1,042,000 | 1,028,936 |
| 3.85% 10/29/41 | | 204,000 | 159,542 |
| 3.875% 1/23/28 | | 430,000 | 407,401 |
| 4.45% 10/1/25 | | 270,000 | 266,227 |
| 4.45% 4/3/26 | | 393,000 | 385,752 |
| 5.75% 6/6/28 | | 4,500,000 | 4,546,934 |
| 6.45% 4/15/27 | | 2,464,000 | 2,520,234 |
| 6.5% 7/15/25 | | 455,000 | 458,480 |
| Ally Financial, Inc.: | | | |
| 2.2% 11/2/28 | | 330,000 | 285,756 |
| 5.125% 9/30/24 | | 268,000 | 267,317 |
| 5.8% 5/1/25 | | 1,168,000 | 1,166,889 |
| 6.7% 2/14/33 | | 6,000,000 | 5,965,026 |
| 7.1% 11/15/27 | | 2,990,000 | 3,115,348 |
| 8% 11/1/31 | | 5,339,000 | 5,892,055 |
| Capital One Financial Corp.: | | | |
| 2.636% 3/3/26 (c) | | 612,000 | 598,896 |
| 3.273% 3/1/30 (c) | | 783,000 | 706,773 |
| 3.3% 10/30/24 | | 398,000 | 394,711 |
| 3.65% 5/11/27 | | 1,693,000 | 1,618,954 |
| 3.75% 7/28/26 | | 267,000 | 257,719 |
| 3.75% 3/9/27 | | 970,000 | 931,613 |
| 3.8% 1/31/28 | | 1,242,000 | 1,180,723 |
| 4.985% 7/24/26 (c) | | 2,477,000 | 2,455,465 |
| 5.247% 7/26/30 (c) | | 3,190,000 | 3,133,920 |
| 5.468% 2/1/29 (c) | | 2,078,000 | 2,068,390 |
| 5.817% 2/1/34 (c) | | 8,003,000 | 7,920,872 |
| 6.377% 6/8/34 (c) | | 2,857,000 | 2,931,168 |
| Discover Financial Services: | | | |
| 3.95% 11/6/24 | | 358,000 | 355,701 |
| 4.1% 2/9/27 | | 358,000 | 344,178 |
| 4.5% 1/30/26 | | 1,105,000 | 1,083,016 |
| 6.7% 11/29/32 | | 644,000 | 672,010 |
| Ford Motor Credit Co. LLC 4.063% 11/1/24 | | 2,211,000 | 2,197,674 |
| GE Capital International Funding Co. 3.373% 11/15/25 | | 790,000 | 767,935 |
| Synchrony Financial: | | | |
| 3.7% 8/4/26 | | 129,000 | 123,099 |
| 3.95% 12/1/27 | | 965,000 | 901,177 |
| 4.25% 8/15/24 | | 840,000 | 837,977 |
| 5.15% 3/19/29 | | 1,437,000 | 1,379,813 |
| | | | 61,989,247 |
| Financial Services - 0.9% | | | |
| Aon Corp. / Aon Global Holdings PLC 2.6% 12/2/31 | | 547,000 | 455,673 |
| Corebridge Financial, Inc.: | | | |
| 3.5% 4/4/25 | | 254,000 | 249,773 |
| 3.65% 4/5/27 | | 4,362,000 | 4,174,115 |
| 3.85% 4/5/29 | | 355,000 | 332,719 |
| 3.9% 4/5/32 | | 423,000 | 378,626 |
| 4.35% 4/5/42 | | 96,000 | 78,934 |
| 4.4% 4/5/52 | | 285,000 | 224,066 |
| Corebridge Global Funding 5.9% 9/19/28 (b) | | 1,806,000 | 1,843,813 |
| Equitable Holdings, Inc.: | | | |
| 4.35% 4/20/28 | | 759,000 | 733,695 |
| 4.572% 2/15/29 (b) | | 185,000 | 177,841 |
| Jackson Financial, Inc.: | | | |
| 3.125% 11/23/31 | | 304,000 | 254,788 |
| 5.17% 6/8/27 | | 1,172,000 | 1,168,299 |
| 5.67% 6/8/32 | | 1,260,000 | 1,268,270 |
| Japan International Cooperation Agency 1.75% 4/28/31 | | 274,000 | 225,546 |
| Jbs U.S.A. Holding Lux/ Jbs U.S.A. F: | | | |
| 2.5% 1/15/27 | | 1,107,000 | 1,030,006 |
| 3% 5/15/32 | | 991,000 | 815,814 |
| 3.625% 1/15/32 | | 381,000 | 328,909 |
| 5.125% 2/1/28 | | 1,205,000 | 1,191,133 |
| 5.5% 1/15/30 | | 159,000 | 156,577 |
| 5.75% 4/1/33 | | 1,805,000 | 1,800,688 |
| 6.75% 3/15/34 (b) | | 5,571,000 | 5,905,862 |
| KfW: | | | |
| 0.375% 7/18/25 | | 472,000 | 449,563 |
| 0.625% 1/22/26 | | 1,471,000 | 1,377,023 |
| 2% 5/2/25 | | 105,000 | 102,275 |
| 2.5% 11/20/24 | | 286,000 | 282,816 |
| 2.875% 4/3/28 | | 421,000 | 397,539 |
| Pine Street Trust II 5.568% 2/15/49 (b) | | 716,000 | 656,935 |
| The Western Union Co. 2.85% 1/10/25 | | 300,000 | 295,105 |
| Voya Financial, Inc.: | | | |
| 3.65% 6/15/26 | | 433,000 | 417,847 |
| 5.7% 7/15/43 | | 103,000 | 99,792 |
| | | | 26,874,042 |
| Insurance - 0.5% | | | |
| AFLAC, Inc.: | | | |
| 3.6% 4/1/30 | | 167,000 | 155,172 |
| 4% 10/15/46 | | 104,000 | 81,665 |
| AIA Group Ltd. 3.375% 4/7/30 (b) | | 924,000 | 841,386 |
| American International Group, Inc.: | | | |
| 3.875% 1/15/35 | | 74,000 | 65,903 |
| 4.2% 4/1/28 | | 509,000 | 491,974 |
| 4.375% 6/30/50 | | 157,000 | 130,057 |
| 4.5% 7/16/44 | | 243,000 | 209,716 |
| 4.7% 7/10/35 | | 159,000 | 144,728 |
| 4.75% 4/1/48 | | 269,000 | 237,014 |
| Aon PLC: | | | |
| 4.6% 6/14/44 | | 44,000 | 37,542 |
| 4.75% 5/15/45 | | 161,000 | 139,642 |
| Athene Holding Ltd. 3.5% 1/15/31 | | 187,000 | 165,514 |
| Baylor Scott & White Holdings: | | | |
| Series 2021, 2.839% 11/15/50 | | 484,000 | 316,072 |
| 3.967% 11/15/46 | | 69,000 | 56,923 |
| Brown & Brown, Inc. 4.2% 3/17/32 | | 217,000 | 198,061 |
| Fairfax Financial Holdings Ltd. 4.625% 4/29/30 | | 177,000 | 168,747 |
| Five Corners Funding Trust II 2.85% 5/15/30 (b) | | 1,385,000 | 1,219,456 |
| Hartford Financial Services Group, Inc.: | | | |
| 2.8% 8/19/29 | | 195,000 | 173,159 |
| 3.6% 8/19/49 | | 233,000 | 170,428 |
| 4.4% 3/15/48 | | 266,000 | 221,110 |
| Liberty Mutual Group, Inc. 4.569% 2/1/29 (b) | | 514,000 | 501,087 |
| Lincoln National Corp.: | | | |
| 3.625% 12/12/26 | | 165,000 | 157,865 |
| 4.35% 3/1/48 | | 83,000 | 63,085 |
| 4.375% 6/15/50 | | 167,000 | 126,947 |
| Manulife Financial Corp. 4.15% 3/4/26 | | 334,000 | 326,790 |
| Markel Group, Inc. 3.35% 9/17/29 | | 167,000 | 153,214 |
| Marsh & McLennan Companies, Inc.: | | | |
| 4.2% 3/1/48 | | 134,000 | 108,836 |
| 4.35% 1/30/47 | | 77,000 | 64,919 |
| 4.375% 3/15/29 | | 711,000 | 694,610 |
| 4.9% 3/15/49 | | 255,000 | 228,160 |
| Massachusetts Mutual Life Insurance Co. 3.729% 10/15/70 (b) | | 730,000 | 493,059 |
| MetLife, Inc.: | | | |
| 3.6% 11/13/25 | | 334,000 | 326,526 |
| 4.125% 8/13/42 | | 171,000 | 141,754 |
| 4.6% 5/13/46 | | 55,000 | 47,919 |
| 4.721% 12/15/44 (c) | | 137,000 | 120,657 |
| 5.375% 7/15/33 | | 1,754,000 | 1,768,156 |
| Pacific LifeCorp 5.125% 1/30/43 (b) | | 660,000 | 610,256 |
| Principal Financial Group, Inc. 4.3% 11/15/46 | | 219,000 | 181,586 |
| Progressive Corp.: | | | |
| 2.45% 1/15/27 | | 130,000 | 121,879 |
| 2.5% 3/15/27 | | 254,000 | 237,752 |
| 3% 3/15/32 | | 478,000 | 414,648 |
| 4.2% 3/15/48 | | 152,000 | 125,117 |
| Prudential Financial, Inc.: | | | |
| 3.878% 3/27/28 | | 114,000 | 109,451 |
| 3.905% 12/7/47 | | 15,000 | 11,522 |
| 3.935% 12/7/49 | | 294,000 | 222,832 |
| 4.35% 2/25/50 | | 343,000 | 279,381 |
| 4.418% 3/27/48 | | 174,000 | 144,231 |
| 5.125% 3/1/52 (c) | | 115,000 | 106,906 |
| 5.7% 12/14/36 | | 10,000 | 10,238 |
| Swiss Re Finance Luxembourg SA 5% 4/2/49 (b)(c) | | 200,000 | 192,500 |
| TIAA Asset Management Finance LLC 4.125% 11/1/24 (b) | | 222,000 | 220,612 |
| Unum Group: | | | |
| 3.875% 11/5/25 | | 610,000 | 593,991 |
| 4% 6/15/29 | | 554,000 | 522,088 |
| 5.75% 8/15/42 | | 914,000 | 878,839 |
| | | | 15,531,682 |
TOTAL FINANCIALS | | | 411,290,469 |
| HEALTH CARE - 1.5% | | | |
| Biotechnology - 0.4% | | | |
| AbbVie, Inc. 2.6% 11/21/24 | | 424,000 | 419,327 |
| Amgen, Inc.: | | | |
| 1.65% 8/15/28 | | 532,000 | 465,423 |
| 1.9% 2/21/25 | | 224,000 | 218,803 |
| 2.6% 8/19/26 | | 288,000 | 272,900 |
| 2.8% 8/15/41 | | 544,000 | 382,397 |
| 3.125% 5/1/25 | | 55,000 | 53,924 |
| 3.35% 2/22/32 | | 160,000 | 141,906 |
| 3.375% 2/21/50 | | 307,000 | 216,185 |
| 4.4% 5/1/45 | | 272,000 | 228,869 |
| 4.663% 6/15/51 | | 342,000 | 292,197 |
| 5.15% 3/2/28 | | 1,562,000 | 1,561,771 |
| 5.25% 3/2/30 | | 1,426,000 | 1,436,461 |
| 5.25% 3/2/33 | | 1,610,000 | 1,605,308 |
| 5.6% 3/2/43 | | 1,529,000 | 1,506,870 |
| 5.65% 3/2/53 | | 760,000 | 748,480 |
| 5.75% 3/2/63 | | 1,385,000 | 1,356,237 |
| | | | 10,907,058 |
| Health Care Equipment & Supplies - 0.0% | | | |
| Baxter International, Inc.: | | | |
| 1.915% 2/1/27 | | 405,000 | 371,227 |
| 2.539% 2/1/32 | | 446,000 | 365,785 |
| | | | 737,012 |
| Health Care Providers & Services - 0.9% | | | |
| Allina Health System, Inc. 3.887% 4/15/49 | | 182,000 | 140,289 |
| Banner Health: | | | |
| 2.907% 1/1/42 | | 45,000 | 32,409 |
| 2.913% 1/1/51 | | 377,000 | 248,224 |
| Baptist Healthcare System Obli 3.54% 8/15/50 | | 368,000 | 267,426 |
| Bon Secours Mercy Health, Inc. 2.095% 6/1/31 | | 252,000 | 208,279 |
| Centene Corp.: | | | |
| 2.45% 7/15/28 | | 1,232,000 | 1,093,806 |
| 2.625% 8/1/31 | | 575,000 | 472,200 |
| 3.375% 2/15/30 | | 640,000 | 568,073 |
| 4.25% 12/15/27 | | 721,000 | 688,401 |
| 4.625% 12/15/29 | | 1,121,000 | 1,060,270 |
| Children's Hospital Medical Center 4.268% 5/15/44 | | 91,000 | 79,046 |
| Children's Hospital of Philadelphia 2.704% 7/1/50 | | 277,000 | 178,383 |
| Cigna Group: | | | |
| 3.05% 10/15/27 | | 402,000 | 377,474 |
| 4.375% 10/15/28 | | 1,489,000 | 1,445,925 |
| 4.5% 2/25/26 | | 209,000 | 205,827 |
| 4.8% 8/15/38 | | 1,120,000 | 1,029,106 |
| 6.125% 11/15/41 | | 82,000 | 85,354 |
| CommonSpirit Health: | | | |
| 3.91% 10/1/50 | | 425,000 | 322,783 |
| 4.35% 11/1/42 | | 55,000 | 46,484 |
| CVS Health Corp.: | | | |
| 2.7% 8/21/40 | | 415,000 | 275,731 |
| 2.875% 6/1/26 | | 206,000 | 196,146 |
| 3% 8/15/26 | | 532,000 | 506,946 |
| 3.25% 8/15/29 | | 482,000 | 437,248 |
| 3.625% 4/1/27 | | 225,000 | 215,827 |
| 3.875% 7/20/25 | | 128,000 | 125,678 |
| 4.1% 3/25/25 | | 113,000 | 111,740 |
| 4.3% 3/25/28 | | 655,000 | 632,480 |
| 4.78% 3/25/38 | | 749,000 | 668,720 |
| 4.875% 7/20/35 | | 85,000 | 79,415 |
| 5% 1/30/29 | | 1,255,000 | 1,242,127 |
| 5.05% 3/25/48 | | 751,000 | 647,067 |
| 5.125% 7/20/45 | | 242,000 | 212,975 |
| 5.25% 1/30/31 | | 515,000 | 509,156 |
| 5.3% 12/5/43 | | 120,000 | 109,237 |
| Franciscan Missionaries of Our Lady Health System, Inc. 3.914% 7/1/49 | | 292,000 | 223,276 |
| HCA Holdings, Inc.: | | | |
| 3.5% 9/1/30 | | 6,450,000 | 5,818,136 |
| 3.625% 3/15/32 | | 333,000 | 293,327 |
| 5.25% 6/15/49 | | 475,000 | 423,363 |
| 5.625% 9/1/28 | | 1,513,000 | 1,527,566 |
| 5.875% 2/1/29 | | 1,674,000 | 1,704,298 |
| Humana, Inc.: | | | |
| 1.35% 2/3/27 | | 346,000 | 313,513 |
| 2.15% 2/3/32 | | 347,000 | 276,876 |
| 3.125% 8/15/29 | | 223,000 | 202,018 |
| 3.7% 3/23/29 | | 333,000 | 312,272 |
| 4.95% 10/1/44 | | 69,000 | 60,005 |
| INTEGRIS Baptist Medical Center, Inc. 3.875% 8/15/50 | | 313,000 | 233,110 |
| Kaiser Foundation Hospitals: | | | |
| 3.266% 11/1/49 | | 251,000 | 178,143 |
| 4.15% 5/1/47 | | 180,000 | 150,456 |
| 4.875% 4/1/42 | | 49,000 | 46,214 |
| Massachusetts General Brigham, Inc. 4.117% 7/1/55 | | 96,000 | 77,313 |
| Memorial Sloan-Kettring Cancer Center 4.2% 7/1/55 | | 82,000 | 68,155 |
| MidMichigan Health 3.409% 6/1/50 | | 129,000 | 90,251 |
| New York & Presbyterian Hospital: | | | |
| 4.024% 8/1/45 | | 96,000 | 80,733 |
| 4.063% 8/1/56 | | 72,000 | 58,072 |
| Novant Health, Inc. 3.168% 11/1/51 | | 227,000 | 151,844 |
| NYU Hospitals Center 4.784% 7/1/44 | | 208,000 | 191,782 |
| Orlando Health Obligated Group 3.327% 10/1/50 | | 208,000 | 150,793 |
| Piedmont Healthcare, Inc. 2.719% 1/1/42 | | 42,000 | 29,308 |
| Providence St. Joseph Health Obligated Group 2.7% 10/1/51 | | 74,000 | 43,833 |
| Sabra Health Care LP 3.2% 12/1/31 | | 1,175,000 | 976,735 |
| Sutter Health 3.361% 8/15/50 | | 504,000 | 360,416 |
| Toledo Hospital 5.325% 11/15/28 | | 265,000 | 253,075 |
| Trinity Health Corp. 2.632% 12/1/40 | | 121,000 | 85,402 |
| West Virginia University Health System Obligated Group 3.129% 6/1/50 | | 170,000 | 111,606 |
| | | | 29,012,143 |
| Life Sciences Tools & Services - 0.0% | | | |
| Revvity, Inc.: | | | |
| 0.85% 9/15/24 | | 154,000 | 152,262 |
| 2.25% 9/15/31 | | 191,000 | 156,282 |
| | | | 308,544 |
| Pharmaceuticals - 0.2% | | | |
| AstraZeneca Finance LLC: | | | |
| 1.2% 5/28/26 | | 249,000 | 231,180 |
| 2.25% 5/28/31 | | 242,000 | 204,359 |
| AstraZeneca PLC: | | | |
| 4.375% 11/16/45 | | 207,000 | 179,793 |
| 4.375% 8/17/48 | | 339,000 | 291,733 |
| 6.45% 9/15/37 | | 89,000 | 99,136 |
| Bayer U.S. Finance II LLC: | | | |
| 2.85% 4/15/25 (b) | | 105,000 | 102,017 |
| 3.95% 4/15/45 (b) | | 38,000 | 26,642 |
| 4.25% 12/15/25 (b) | | 548,000 | 536,096 |
| Elanco Animal Health, Inc. 6.65% 8/28/28 (c) | | 168,000 | 170,296 |
| Eli Lilly & Co. 2.25% 5/15/50 | | 592,000 | 345,167 |
| Haleon U.S. Capital LLC: | | | |
| 3.375% 3/24/27 | | 498,000 | 475,207 |
| 3.625% 3/24/32 | | 499,000 | 447,015 |
| Mylan NV 4.55% 4/15/28 | | 502,000 | 483,589 |
| Utah Acquisition Sub, Inc. 3.95% 6/15/26 | | 398,000 | 385,898 |
| Viatris, Inc.: | | | |
| 1.65% 6/22/25 | | 123,000 | 118,213 |
| 2.7% 6/22/30 | | 1,067,000 | 905,615 |
| 3.85% 6/22/40 | | 107,000 | 78,131 |
| 4% 6/22/50 | | 474,000 | 318,992 |
| Zoetis, Inc.: | | | |
| 3.95% 9/12/47 | | 55,000 | 42,873 |
| 4.7% 2/1/43 | | 36,000 | 32,057 |
| | | | 5,474,009 |
TOTAL HEALTH CARE | | | 46,438,766 |
| INDUSTRIALS - 1.0% | | | |
| Aerospace & Defense - 0.3% | | | |
| BAE Systems PLC 3.4% 4/15/30 (b) | | 285,000 | 258,118 |
| General Electric Co.: | | | |
| 3.625% 5/1/30 | | 328,000 | 300,530 |
| 6.875% 1/10/39 | | 4,000 | 4,522 |
| Lockheed Martin Corp. 3.55% 1/15/26 | | 104,000 | 101,479 |
| The Boeing Co.: | | | |
| 2.5% 3/1/25 | | 126,000 | 122,960 |
| 2.7% 2/1/27 | | 217,000 | 200,051 |
| 2.95% 2/1/30 | | 278,000 | 238,003 |
| 3.625% 3/1/48 | | 110,000 | 70,464 |
| 3.65% 3/1/47 | | 76,000 | 49,403 |
| 3.75% 2/1/50 | | 424,000 | 277,449 |
| 4.875% 5/1/25 | | 479,000 | 473,914 |
| 5.04% 5/1/27 | | 372,000 | 363,804 |
| 5.15% 5/1/30 | | 706,000 | 677,962 |
| 5.705% 5/1/40 | | 1,466,000 | 1,351,600 |
| 5.805% 5/1/50 | | 869,000 | 783,143 |
| 5.93% 5/1/60 | | 372,000 | 332,587 |
| 6.259% 5/1/27 (b) | | 654,000 | 658,421 |
| 6.298% 5/1/29 (b) | | 838,000 | 849,782 |
| 6.388% 5/1/31 (b) | | 635,000 | 646,466 |
| 6.528% 5/1/34 (b) | | 679,000 | 695,228 |
| 6.858% 5/1/54 (b) | | 1,023,000 | 1,049,774 |
| 6.875% 3/15/39 | | 90,000 | 92,603 |
| 7.008% 5/1/64 (b) | | 965,000 | 988,035 |
| | | | 10,586,298 |
| Air Freight & Logistics - 0.0% | | | |
| FedEx Corp.: | | | |
| 3.1% 8/5/29 | | 173,000 | 158,268 |
| 3.9% 2/1/35 | | 162,000 | 144,178 |
| 4.05% 2/15/48 | | 100,000 | 77,711 |
| 4.4% 1/15/47 | | 219,000 | 178,525 |
| 4.55% 4/1/46 | | 41,000 | 34,162 |
| 4.95% 10/17/48 | | 216,000 | 190,671 |
| 5.25% 5/15/50 | | 117,000 | 108,835 |
| | | | 892,350 |
| Building Products - 0.1% | | | |
| Carrier Global Corp.: | | | |
| 2.242% 2/15/25 | | 347,000 | 339,638 |
| 2.493% 2/15/27 | | 245,000 | 229,381 |
| 2.722% 2/15/30 | | 427,000 | 377,232 |
| 3.377% 4/5/40 | | 171,000 | 132,277 |
| 3.577% 4/5/50 | | 387,000 | 281,495 |
| 5.9% 3/15/34 | | 342,000 | 356,935 |
| 6.2% 3/15/54 | | 355,000 | 380,078 |
| Masco Corp.: | | | |
| 2% 2/15/31 | | 255,000 | 207,721 |
| 3.125% 2/15/51 | | 129,000 | 83,280 |
| Owens Corning 3.95% 8/15/29 | | 187,000 | 176,808 |
| | | | 2,564,845 |
| Commercial Services & Supplies - 0.0% | | | |
| Republic Services, Inc.: | | | |
| 1.45% 2/15/31 | | 614,000 | 486,836 |
| 2.9% 7/1/26 | | 116,000 | 110,879 |
| 3.2% 3/15/25 | | 309,000 | 303,624 |
| 3.95% 5/15/28 | | 288,000 | 276,866 |
| Waste Management, Inc. 4.15% 7/15/49 | | 352,000 | 290,483 |
| | | | 1,468,688 |
| Ground Transportation - 0.1% | | | |
| Canadian Pacific Railway Co.: | | | |
| 1.75% 12/2/26 | | 310,000 | 285,994 |
| 2.45% 12/2/31 | | 654,000 | 595,179 |
| 3.1% 12/2/51 | | 325,000 | 215,815 |
| CSX Corp.: | | | |
| 3.25% 6/1/27 | | 137,000 | 130,681 |
| 3.4% 8/1/24 | | 127,000 | 126,752 |
| 3.8% 11/1/46 | | 157,000 | 121,348 |
| 3.95% 5/1/50 | | 98,000 | 76,819 |
| 4.1% 3/15/44 | | 186,000 | 152,876 |
| 4.5% 3/15/49 | | 378,000 | 324,216 |
| 4.75% 11/15/48 | | 159,000 | 141,888 |
| | | | 2,171,568 |
| Industrial Conglomerates - 0.0% | | | |
| Trane Technologies Financing Ltd.: | | | |
| 3.8% 3/21/29 | | 393,000 | 373,511 |
| 4.65% 11/1/44 | | 165,000 | 146,435 |
| | | | 519,946 |
| Machinery - 0.1% | | | |
| Caterpillar Financial Services Corp.: | | | |
| 1.1% 9/14/27 | | 394,000 | 351,172 |
| 2.4% 8/9/26 | | 78,000 | 73,897 |
| Caterpillar, Inc.: | | | |
| 3.25% 9/19/49 | | 456,000 | 324,607 |
| 3.803% 8/15/42 | | 69,000 | 55,939 |
| 5.3% 9/15/35 | | 192,000 | 199,564 |
| Cummins, Inc. 1.5% 9/1/30 | | 167,000 | 136,997 |
| Eaton Corp.: | | | |
| 4% 11/2/32 | | 52,000 | 48,440 |
| 4.15% 11/2/42 | | 52,000 | 44,182 |
| Otis Worldwide Corp.: | | | |
| 2.565% 2/15/30 | | 367,000 | 322,110 |
| 3.362% 2/15/50 | | 279,000 | 195,760 |
| | | | 1,752,668 |
| Passenger Airlines - 0.0% | | | |
| American Airlines Pass Through Trust equipment trust certificate 2.875% 1/11/36 | | 209,661 | 179,617 |
| American Airlines, Inc. equipment trust certificate 3.2% 12/15/29 | | 139,528 | 129,382 |
| Southwest Airlines Co. 5.125% 6/15/27 | | 167,000 | 166,140 |
| United Airlines 2015-1 Class AA pass-thru trust 3.45% 6/1/29 | | 11,650 | 10,964 |
| United Airlines pass-thru trust equipment trust certificate 3.1% 1/7/30 | | 281,862 | 261,611 |
| United Airlines, Inc. equipment trust certificate Series 2012-2B 4% 4/29/26 | | 61,644 | 61,638 |
| | | | 809,352 |
| Professional Services - 0.0% | | | |
| Thomson Reuters Corp.: | | | |
| 3.35% 5/15/26 | | 192,000 | 185,125 |
| 3.85% 9/29/24 | | 130,000 | 129,291 |
| | | | 314,416 |
| Trading Companies & Distributors - 0.1% | | | |
| Air Lease Corp.: | | | |
| 2.2% 1/15/27 | | 237,000 | 218,792 |
| 3.125% 12/1/30 | | 334,000 | 291,838 |
| 3.375% 7/1/25 | | 809,000 | 790,511 |
| 3.625% 12/1/27 | | 262,000 | 247,149 |
| 4.25% 9/15/24 | | 448,000 | 446,486 |
| | | | 1,994,776 |
| Transportation Infrastructure - 0.3% | | | |
| Avolon Holdings Funding Ltd.: | | | |
| 4.25% 4/15/26 (b) | | 198,000 | 192,315 |
| 4.375% 5/1/26 (b) | | 587,000 | 570,997 |
| 6.375% 5/4/28 (b) | | 7,268,000 | 7,380,754 |
| | | | 8,144,066 |
TOTAL INDUSTRIALS | | | 31,218,973 |
| INFORMATION TECHNOLOGY - 0.6% | | | |
| Electronic Equipment, Instruments & Components - 0.1% | | | |
| Dell International LLC/EMC Corp.: | | | |
| 4% 7/15/24 | | 315,000 | 314,781 |
| 4.9% 10/1/26 | | 259,000 | 256,466 |
| 5.3% 10/1/29 | | 690,000 | 693,893 |
| 5.85% 7/15/25 | | 162,000 | 162,393 |
| 6.02% 6/15/26 | | 454,000 | 458,750 |
| 6.1% 7/15/27 | | 298,000 | 305,588 |
| 6.2% 7/15/30 | | 258,000 | 270,847 |
| 8.1% 7/15/36 | | 287,000 | 342,270 |
| 8.35% 7/15/46 | | 141,000 | 178,306 |
| Tyco Electronics Group SA: | | | |
| 3.45% 8/1/24 | | 100,000 | 99,741 |
| 3.7% 2/15/26 | | 147,000 | 143,534 |
| 7.125% 10/1/37 | | 68,000 | 78,395 |
| | | | 3,304,964 |
| IT Services - 0.0% | | | |
| CDW LLC/CDW Finance Corp. 2.67% 12/1/26 | | 394,000 | 368,056 |
| Semiconductors & Semiconductor Equipment - 0.3% | | | |
| Analog Devices, Inc. 2.8% 10/1/41 | | 408,000 | 287,486 |
| Broadcom Corp./Broadcom Cayman LP: | | | |
| 3.5% 1/15/28 | | 192,000 | 181,660 |
| 3.875% 1/15/27 | | 105,000 | 101,593 |
| Broadcom, Inc.: | | | |
| 1.95% 2/15/28 (b) | | 209,000 | 187,088 |
| 2.45% 2/15/31 (b) | | 2,705,000 | 2,277,909 |
| 2.6% 2/15/33 (b) | | 1,777,000 | 1,440,091 |
| 3.459% 9/15/26 | | 346,000 | 333,054 |
| 3.469% 4/15/34 (b) | | 117,000 | 99,742 |
| 3.5% 2/15/41 (b) | | 1,435,000 | 1,100,002 |
| 4.3% 11/15/32 | | 344,000 | 321,526 |
| 4.75% 4/15/29 | | 469,000 | 462,572 |
| Micron Technology, Inc. 4.663% 2/15/30 | | 227,000 | 220,006 |
| NVIDIA Corp.: | | | |
| 2% 6/15/31 | | 697,000 | 585,705 |
| 2.85% 4/1/30 | | 297,000 | 269,317 |
| 3.5% 4/1/50 | | 165,000 | 126,662 |
| NXP BV/NXP Funding LLC/NXP U.S.A., Inc. 2.65% 2/15/32 | | 609,000 | 506,320 |
| Texas Instruments, Inc. 4.15% 5/15/48 | | 191,000 | 158,373 |
| | | | 8,659,106 |
| Software - 0.2% | | | |
| Oracle Corp.: | | | |
| 1.65% 3/25/26 | | 1,129,000 | 1,058,266 |
| 2.3% 3/25/28 | | 1,288,000 | 1,164,486 |
| 2.5% 4/1/25 | | 296,000 | 289,143 |
| 2.65% 7/15/26 | | 247,000 | 234,085 |
| 2.8% 4/1/27 | | 736,000 | 690,996 |
| 2.95% 5/15/25 | | 137,000 | 133,864 |
| 3.25% 11/15/27 | | 469,000 | 442,149 |
| 3.4% 7/8/24 | | 130,000 | 129,942 |
| 3.6% 4/1/40 | | 736,000 | 565,701 |
| 3.6% 4/1/50 | | 427,000 | 298,846 |
| 3.85% 7/15/36 | | 278,000 | 234,349 |
| 3.85% 4/1/60 | | 497,000 | 341,547 |
| 3.95% 3/25/51 | | 365,000 | 269,872 |
| 4% 7/15/46 | | 269,000 | 205,142 |
| 4% 11/15/47 | | 480,000 | 363,398 |
| 4.125% 5/15/45 | | 82,000 | 64,205 |
| 4.3% 7/8/34 | | 106,000 | 96,535 |
| 5.375% 7/15/40 | | 343,000 | 326,160 |
| VMware, Inc. 1.4% 8/15/26 | | 702,000 | 646,386 |
| | | | 7,555,072 |
TOTAL INFORMATION TECHNOLOGY | | | 19,887,198 |
| MATERIALS - 0.3% | | | |
| Chemicals - 0.2% | | | |
| Celanese U.S. Holdings LLC: | | | |
| 6.35% 11/15/28 | | 1,512,000 | 1,553,551 |
| 6.55% 11/15/30 | | 1,533,000 | 1,601,975 |
| 6.7% 11/15/33 | | 895,000 | 940,510 |
| Eastman Chemical Co. 4.65% 10/15/44 | | 82,000 | 68,545 |
| Nutrien Ltd.: | | | |
| 4% 12/15/26 | | 313,000 | 302,848 |
| 4.2% 4/1/29 | | 142,000 | 135,874 |
| 5% 4/1/49 | | 247,000 | 217,457 |
| 5.25% 1/15/45 | | 96,000 | 88,268 |
| 5.625% 12/1/40 | | 49,000 | 47,524 |
| The Dow Chemical Co.: | | | |
| 2.1% 11/15/30 | | 237,000 | 199,905 |
| 3.6% 11/15/50 | | 244,000 | 169,882 |
| 4.375% 11/15/42 | | 134,000 | 110,449 |
| 4.8% 11/30/28 | | 234,000 | 231,710 |
| 4.8% 5/15/49 | | 211,000 | 179,967 |
| 9.4% 5/15/39 | | 82,000 | 108,556 |
| The Mosaic Co.: | | | |
| 4.05% 11/15/27 | | 158,000 | 151,514 |
| 5.625% 11/15/43 | | 103,000 | 97,325 |
| Westlake Corp. 5% 8/15/46 | | 55,000 | 47,943 |
| | | | 6,253,803 |
| Containers & Packaging - 0.0% | | | |
| International Paper Co.: | | | |
| 4.4% 8/15/47 | | 238,000 | 189,319 |
| 5.15% 5/15/46 | | 50,000 | 45,427 |
| WRKCo, Inc. 4.2% 6/1/32 | | 167,000 | 156,103 |
| | | | 390,849 |
| Metals & Mining - 0.1% | | | |
| BHP Billiton Financial (U.S.A.) Ltd. 5% 9/30/43 | | 82,000 | 76,510 |
| Freeport-McMoRan, Inc. 4.625% 8/1/30 | | 1,118,000 | 1,075,529 |
| Nucor Corp.: | | | |
| 2.979% 12/15/55 | | 110,000 | 67,566 |
| 6.4% 12/1/37 | | 167,000 | 180,503 |
| Rio Tinto Finance (U.S.A.) Ltd.: | | | |
| 5.2% 11/2/40 | | 357,000 | 345,820 |
| 7.125% 7/15/28 | | 55,000 | 59,296 |
| Southern Copper Corp.: | | | |
| 3.875% 4/23/25 | | 101,000 | 99,296 |
| 5.25% 11/8/42 | | 158,000 | 146,861 |
| 7.5% 7/27/35 | | 167,000 | 192,676 |
| Vale Overseas Ltd. 3.75% 7/8/30 | | 667,000 | 600,300 |
| Vale SA 5.625% 9/11/42 | | 181,000 | 176,305 |
| | | | 3,020,662 |
| Paper & Forest Products - 0.0% | | | |
| Suzano Austria GmbH: | | | |
| 2.5% 9/15/28 | | 412,000 | 360,516 |
| 6% 1/15/29 | | 330,000 | 329,736 |
| | | | 690,252 |
TOTAL MATERIALS | | | 10,355,566 |
| REAL ESTATE - 1.4% | | | |
| Equity Real Estate Investment Trusts (REITs) - 1.2% | | | |
| Alexandria Real Estate Equities, Inc.: | | | |
| 2% 5/18/32 | | 254,000 | 198,796 |
| 3% 5/18/51 | | 193,000 | 116,208 |
| 4.85% 4/15/49 | | 316,000 | 266,288 |
| 4.9% 12/15/30 | | 523,000 | 511,853 |
| American Homes 4 Rent LP: | | | |
| 2.375% 7/15/31 | | 95,000 | 77,186 |
| 3.625% 4/15/32 | | 389,000 | 340,098 |
| 4.25% 2/15/28 | | 264,000 | 252,884 |
| AvalonBay Communities, Inc. 2.3% 3/1/30 | | 167,000 | 144,469 |
| Boston Properties, Inc.: | | | |
| 2.75% 10/1/26 | | 192,000 | 179,161 |
| 3.25% 1/30/31 | | 1,011,000 | 854,519 |
| 4.5% 12/1/28 | | 489,000 | 461,283 |
| 6.75% 12/1/27 | | 1,962,000 | 2,012,661 |
| Brixmor Operating Partnership LP: | | | |
| 3.9% 3/15/27 | | 155,000 | 148,876 |
| 4.05% 7/1/30 | | 804,000 | 746,130 |
| 4.125% 6/15/26 | | 791,000 | 770,121 |
| 4.125% 5/15/29 | | 819,000 | 773,021 |
| Corporate Office Properties LP: | | | |
| 2% 1/15/29 | | 228,000 | 193,321 |
| 2.25% 3/15/26 | | 209,000 | 197,322 |
| 2.75% 4/15/31 | | 310,000 | 256,305 |
| Crown Castle, Inc.: | | | |
| 1.35% 7/15/25 | | 741,000 | 709,049 |
| 2.25% 1/15/31 | | 199,000 | 163,660 |
| 3.25% 1/15/51 | | 180,000 | 119,515 |
| ERP Operating LP: | | | |
| 1.85% 8/1/31 | | 500,000 | 403,800 |
| 3.25% 8/1/27 | | 356,000 | 336,978 |
| Healthcare Realty Holdings LP: | | | |
| 3.1% 2/15/30 | | 165,000 | 144,282 |
| 3.5% 8/1/26 | | 172,000 | 164,768 |
| Healthpeak OP, LLC: | | | |
| 3% 1/15/30 | | 343,000 | 304,380 |
| 3.25% 7/15/26 | | 72,000 | 68,957 |
| 3.4% 2/1/25 | | 13,000 | 12,807 |
| 3.5% 7/15/29 | | 82,000 | 75,747 |
| Hudson Pacific Properties LP 4.65% 4/1/29 | | 972,000 | 748,572 |
| Invitation Homes Operating Partnership LP 4.15% 4/15/32 | | 799,000 | 728,908 |
| Kimco Realty OP, LLC: | | | |
| 1.9% 3/1/28 | | 284,000 | 253,096 |
| 3.8% 4/1/27 | | 110,000 | 105,796 |
| 4.125% 12/1/46 | | 274,000 | 209,550 |
| 4.45% 9/1/47 | | 142,000 | 113,293 |
| Kite Realty Group Trust: | | | |
| 4% 3/15/25 | | 783,000 | 771,204 |
| 4.75% 9/15/30 | | 1,220,000 | 1,165,292 |
| LXP Industrial Trust (REIT): | | | |
| 2.375% 10/1/31 | | 83,000 | 66,126 |
| 2.7% 9/15/30 | | 230,000 | 194,051 |
| NNN (REIT), Inc. 3% 4/15/52 | | 234,000 | 145,686 |
| Omega Healthcare Investors, Inc.: | | | |
| 3.25% 4/15/33 | | 2,781,000 | 2,247,968 |
| 3.375% 2/1/31 | | 527,000 | 450,100 |
| 3.625% 10/1/29 | | 742,000 | 662,429 |
| 4.5% 1/15/25 | | 556,000 | 551,536 |
| 4.5% 4/1/27 | | 2,294,000 | 2,220,861 |
| 4.75% 1/15/28 | | 801,000 | 775,045 |
| 5.25% 1/15/26 | | 714,000 | 707,090 |
| Phillips Edison Grocery Center Operating Partnership I LP 5.75% 7/15/34 | | 482,000 | 475,996 |
| Piedmont Operating Partnership LP 2.75% 4/1/32 | | 184,000 | 134,950 |
| Realty Income Corp.: | | | |
| 2.2% 6/15/28 | | 100,000 | 89,471 |
| 2.85% 12/15/32 | | 123,000 | 101,370 |
| 3.25% 1/15/31 | | 128,000 | 113,228 |
| 3.4% 1/15/28 | | 200,000 | 188,517 |
| Retail Opportunity Investments Partnership LP 4% 12/15/24 | | 123,000 | 121,715 |
| Simon Property Group LP: | | | |
| 2.2% 2/1/31 | | 731,000 | 604,287 |
| 2.45% 9/13/29 | | 205,000 | 180,103 |
| 3.25% 9/13/49 | | 320,000 | 214,408 |
| 3.375% 12/1/27 | | 547,000 | 517,378 |
| SITE Centers Corp.: | | | |
| 3.625% 2/1/25 | | 284,000 | 280,230 |
| 4.25% 2/1/26 | | 371,000 | 366,897 |
| Store Capital LLC: | | | |
| 2.75% 11/18/30 | | 1,096,000 | 908,109 |
| 4.625% 3/15/29 | | 225,000 | 212,500 |
| Sun Communities Operating LP: | | | |
| 2.3% 11/1/28 | | 210,000 | 184,602 |
| 2.7% 7/15/31 | | 542,000 | 447,655 |
| UDR, Inc. 2.1% 6/15/33 | | 446,000 | 339,444 |
| Ventas Realty LP: | | | |
| 3% 1/15/30 | | 958,000 | 845,770 |
| 3.25% 10/15/26 | | 96,000 | 91,224 |
| 3.5% 2/1/25 | | 919,000 | 906,066 |
| 3.85% 4/1/27 | | 260,000 | 249,973 |
| 4% 3/1/28 | | 876,000 | 835,555 |
| 4.125% 1/15/26 | | 235,000 | 229,615 |
| 4.375% 2/1/45 | | 178,000 | 139,779 |
| 4.75% 11/15/30 | | 1,258,000 | 1,207,402 |
| 4.875% 4/15/49 | | 78,000 | 66,187 |
| VICI Properties LP: | | | |
| 4.375% 5/15/25 | | 99,000 | 97,686 |
| 4.75% 2/15/28 | | 964,000 | 941,583 |
| 4.95% 2/15/30 | | 1,228,000 | 1,184,701 |
| 5.125% 5/15/32 | | 823,000 | 784,101 |
| 5.75% 4/1/34 | | 377,000 | 373,467 |
| Vornado Realty LP 2.15% 6/1/26 | | 237,000 | 218,580 |
| Welltower OP LLC 4.95% 9/1/48 | | 274,000 | 247,989 |
| Weyerhaeuser Co. 4% 4/15/30 | | 317,000 | 295,870 |
| WP Carey, Inc.: | | | |
| 2.4% 2/1/31 | | 477,000 | 395,689 |
| 3.85% 7/15/29 | | 160,000 | 149,388 |
| 4% 2/1/25 | | 673,000 | 664,933 |
| | | | 38,527,466 |
| Real Estate Management & Development - 0.2% | | | |
| Brandywine Operating Partnership LP: | | | |
| 3.95% 11/15/27 | | 579,000 | 524,615 |
| 4.55% 10/1/29 | | 734,000 | 638,857 |
| 8.05% 3/15/28 | | 2,672,000 | 2,771,890 |
| CBRE Group, Inc.: | | | |
| 2.5% 4/1/31 | | 699,000 | 580,666 |
| 4.875% 3/1/26 | | 156,000 | 154,092 |
| Digital Realty Trust LP 3.7% 8/15/27 | | 219,000 | 209,044 |
| Essex Portfolio LP: | | | |
| 3% 1/15/30 | | 51,000 | 45,301 |
| 4% 3/1/29 | | 167,000 | 157,739 |
| Mid-America Apartments LP 3.95% 3/15/29 | | 190,000 | 181,752 |
| Tanger Properties LP: | | | |
| 2.75% 9/1/31 | | 551,000 | 448,896 |
| 3.125% 9/1/26 | | 767,000 | 723,059 |
| 3.875% 7/15/27 | | 170,000 | 161,182 |
| | | | 6,597,093 |
TOTAL REAL ESTATE | | | 45,124,559 |
| UTILITIES - 1.4% | | | |
| Electric Utilities - 0.8% | | | |
| Alabama Power Co.: | | | |
| 1.45% 9/15/30 | | 500,000 | 407,488 |
| 3.05% 3/15/32 | | 828,000 | 715,976 |
| 3.7% 12/1/47 | | 162,000 | 120,383 |
| 3.75% 3/1/45 | | 27,000 | 20,724 |
| 4.15% 8/15/44 | | 127,000 | 104,709 |
| 4.3% 7/15/48 | | 161,000 | 131,937 |
| 5.2% 6/1/41 | | 106,000 | 98,180 |
| Appalachian Power Co.: | | | |
| 4.45% 6/1/45 | | 165,000 | 132,893 |
| 4.5% 3/1/49 | | 251,000 | 198,568 |
| Baltimore Gas & Electric Co.: | | | |
| 2.9% 6/15/50 | | 220,000 | 138,123 |
| 3.5% 8/15/46 | | 69,000 | 49,761 |
| CenterPoint Energy Houston Electric LLC: | | | |
| 3.35% 4/1/51 | | 313,000 | 216,922 |
| 3.55% 8/1/42 | | 52,000 | 40,229 |
| 4.25% 2/1/49 | | 71,000 | 57,878 |
| Cleco Corporate Holdings LLC: | | | |
| 3.375% 9/15/29 | | 433,000 | 379,126 |
| 3.743% 5/1/26 | | 1,810,000 | 1,744,849 |
| Commonwealth Edison Co.: | | | |
| 3.1% 11/1/24 | | 274,000 | 272,600 |
| 3.2% 11/15/49 | | 467,000 | 311,976 |
| 3.65% 6/15/46 | | 78,000 | 58,001 |
| 3.7% 3/1/45 | | 85,000 | 64,801 |
| 3.75% 8/15/47 | | 169,000 | 127,300 |
| 4% 3/1/48 | | 187,000 | 145,265 |
| 4% 3/1/49 | | 164,000 | 126,989 |
| DTE Electric Co. 3.95% 3/1/49 | | 100,000 | 78,776 |
| Duke Energy Carolinas LLC: | | | |
| 2.85% 3/15/32 | | 83,000 | 71,109 |
| 2.95% 12/1/26 | | 165,000 | 157,201 |
| 3.2% 8/15/49 | | 219,000 | 146,900 |
| 3.75% 6/1/45 | | 55,000 | 41,337 |
| 3.875% 3/15/46 | | 107,000 | 82,118 |
| 4% 9/30/42 | | 103,000 | 82,955 |
| Duke Energy Corp.: | | | |
| 2.45% 6/1/30 | | 529,000 | 454,217 |
| 2.65% 9/1/26 | | 366,000 | 345,993 |
| 3.75% 9/1/46 | | 250,000 | 181,958 |
| 4.2% 6/15/49 | | 260,000 | 199,965 |
| 4.8% 12/15/45 | | 76,000 | 65,600 |
| Duke Energy Florida LLC 3.4% 10/1/46 | | 69,000 | 48,561 |
| Duke Energy Ohio, Inc. 4.3% 2/1/49 | | 744,000 | 597,653 |
| Duke Energy Progress LLC: | | | |
| 3.4% 4/1/32 | | 334,000 | 295,147 |
| 4.15% 12/1/44 | | 49,000 | 39,463 |
| 4.375% 3/30/44 | | 55,000 | 45,694 |
| Duquesne Light Holdings, Inc.: | | | |
| 2.532% 10/1/30 (b) | | 166,000 | 139,651 |
| 2.775% 1/7/32 (b) | | 574,000 | 465,897 |
| Entergy Corp.: | | | |
| 0.9% 9/15/25 | | 464,000 | 439,027 |
| 2.8% 6/15/30 | | 359,000 | 313,555 |
| 2.95% 9/1/26 | | 129,000 | 122,396 |
| 3.75% 6/15/50 | | 113,000 | 79,882 |
| Entergy Louisiana LLC 4.2% 9/1/48 | | 87,000 | 68,766 |
| Entergy, Inc.: | | | |
| 3.55% 9/30/49 | | 111,000 | 79,340 |
| 4% 3/30/29 | | 485,000 | 464,574 |
| Eversource Energy: | | | |
| 2.55% 3/15/31 | | 440,000 | 365,797 |
| 2.9% 10/1/24 | | 234,000 | 232,271 |
| 3.35% 3/15/26 | | 181,000 | 173,884 |
| 3.45% 1/15/50 | | 122,000 | 83,424 |
| Exelon Corp.: | | | |
| 2.75% 3/15/27 | | 183,000 | 171,514 |
| 3.35% 3/15/32 | | 222,000 | 194,634 |
| 3.95% 6/15/25 | | 539,000 | 530,395 |
| 4.05% 4/15/30 | | 218,000 | 204,572 |
| 5.1% 6/15/45 | | 30,000 | 27,255 |
| FirstEnergy Corp.: | | | |
| 1.6% 1/15/26 | | 344,000 | 323,784 |
| 2.25% 9/1/30 | | 370,000 | 309,709 |
| 3.4% 3/1/50 | | 100,000 | 66,891 |
| 4.15% 7/15/27 | | 233,000 | 223,575 |
| 5.1% 7/15/47 | | 129,000 | 111,010 |
| Interstate Power and Light Co. 2.3% 6/1/30 | | 381,000 | 325,361 |
| IPALCO Enterprises, Inc. 4.25% 5/1/30 | | 1,025,000 | 951,398 |
| Northern States Power Co.: | | | |
| 2.6% 6/1/51 | | 360,000 | 214,584 |
| 2.9% 3/1/50 | | 327,000 | 208,307 |
| 3.4% 8/15/42 | | 55,000 | 41,543 |
| 4.125% 5/15/44 | | 123,000 | 100,285 |
| NSTAR Electric Co. 3.2% 5/15/27 | | 210,000 | 199,917 |
| Pacific Gas & Electric Co.: | | | |
| 3.15% 1/1/26 | | 400,355 | 385,611 |
| 3.25% 6/1/31 | | 167,000 | 143,589 |
| 3.45% 7/1/25 | | 166,815 | 162,735 |
| 3.5% 6/15/25 | | 334,000 | 326,724 |
| 4.2% 6/1/41 | | 834,000 | 653,294 |
| 4.55% 7/1/30 | | 1,037,586 | 983,266 |
| 4.75% 2/15/44 | | 33,000 | 26,963 |
| Potomac Electric Power Co. 6.5% 11/15/37 | | 104,000 | 114,344 |
| PPL Capital Funding, Inc. 3.1% 5/15/26 | | 219,000 | 210,146 |
| PPL Electric Utilities Corp.: | | | |
| 3% 10/1/49 | | 364,000 | 240,794 |
| 4.15% 10/1/45 | | 96,000 | 79,248 |
| Progress Energy, Inc. 6% 12/1/39 | | 143,000 | 143,767 |
| Public Service Co. of Colorado: | | | |
| 2.9% 5/15/25 | | 302,000 | 294,707 |
| 3.8% 6/15/47 | | 127,000 | 92,584 |
| Public Service Electric & Gas Co.: | | | |
| 2.45% 1/15/30 | | 279,000 | 243,840 |
| 3.15% 1/1/50 | | 315,000 | 215,739 |
| 3.65% 9/1/42 | | 77,000 | 60,361 |
| 4% 6/1/44 | | 137,000 | 108,828 |
| Puget Sound Energy, Inc. 4.3% 5/20/45 | | 176,000 | 144,088 |
| Southern California Edison Co.: | | | |
| 2.25% 6/1/30 | | 248,000 | 210,295 |
| 2.95% 2/1/51 | | 550,000 | 340,906 |
| 4% 4/1/47 | | 274,000 | 209,695 |
| 4.125% 3/1/48 | | 194,000 | 150,616 |
| Southern Co.: | | | |
| 3.25% 7/1/26 | | 302,000 | 290,345 |
| 4.4% 7/1/46 | | 201,000 | 167,835 |
| Tampa Electric Co.: | | | |
| 4.45% 6/15/49 | | 321,000 | 268,827 |
| 6.15% 5/15/37 | | 172,000 | 179,500 |
| Union Electric Co. 3.9% 9/15/42 | | 101,000 | 81,310 |
| Virginia Electric & Power Co.: | | | |
| 3.1% 5/15/25 | | 110,000 | 107,723 |
| 3.3% 12/1/49 | | 200,000 | 134,852 |
| 3.8% 4/1/28 | | 409,000 | 391,451 |
| 3.8% 9/15/47 | | 225,000 | 166,816 |
| 4.2% 5/15/45 | | 289,000 | 235,858 |
| 4.45% 2/15/44 | | 75,000 | 63,336 |
| 4.6% 12/1/48 | | 194,000 | 165,005 |
| 6% 5/15/37 | | 55,000 | 56,681 |
| Wisconsin Electric Power Co. 4.25% 6/1/44 | | 129,000 | 105,884 |
| Xcel Energy, Inc. 3.35% 12/1/26 | | 82,000 | 78,248 |
| | | | 23,868,334 |
| Gas Utilities - 0.0% | | | |
| Eastern Energy Gas Holdings LLC 2.5% 11/15/24 | | 304,000 | 300,427 |
| Nakilat, Inc. 6.067% 12/31/33 (b) | | 182,004 | 188,602 |
| Southern California Gas Co. 2.6% 6/15/26 | | 363,000 | 344,799 |
| Southern Co. Gas Capital Corp. 3.95% 10/1/46 | | 371,000 | 278,471 |
| | | | 1,112,299 |
| Independent Power and Renewable Electricity Producers - 0.2% | | | |
| Constellation Energy Generation, LLC 3.25% 6/1/25 | | 334,000 | 326,573 |
| Emera U.S. Finance LP: | | | |
| 3.55% 6/15/26 | | 237,000 | 227,278 |
| 4.75% 6/15/46 | | 143,000 | 117,672 |
| The AES Corp.: | | | |
| 1.375% 1/15/26 | | 4,000,000 | 3,748,461 |
| 2.45% 1/15/31 | | 807,000 | 664,411 |
| 3.3% 7/15/25 (b) | | 1,079,000 | 1,051,896 |
| 3.95% 7/15/30 (b) | | 941,000 | 860,387 |
| | | | 6,996,678 |
| Multi-Utilities - 0.4% | | | |
| Ameren Illinois Co. 4.5% 3/15/49 | | 207,000 | 176,526 |
| Berkshire Hathaway Energy Co.: | | | |
| 3.25% 4/15/28 | | 274,000 | 257,028 |
| 3.7% 7/15/30 | | 275,000 | 255,711 |
| 3.8% 7/15/48 | | 274,000 | 201,366 |
| 4.05% 4/15/25 | | 1,561,000 | 1,543,976 |
| 4.25% 10/15/50 | | 237,000 | 185,794 |
| 4.5% 2/1/45 | | 182,000 | 159,291 |
| 5.15% 11/15/43 | | 212,000 | 199,944 |
| CenterPoint Energy, Inc. 3.7% 9/1/49 | | 167,000 | 120,071 |
| Consolidated Edison Co. of New York, Inc.: | | | |
| 3.35% 4/1/30 | | 99,000 | 90,891 |
| 3.875% 6/15/47 | | 78,000 | 60,316 |
| 4.45% 3/15/44 | | 219,000 | 186,550 |
| 4.5% 5/15/58 | | 260,000 | 211,960 |
| 4.65% 12/1/48 | | 287,000 | 244,941 |
| 5.5% 12/1/39 | | 69,000 | 67,994 |
| Delmarva Power & Light Co. 4% 6/1/42 | | 110,000 | 86,526 |
| Dominion Energy, Inc.: | | | |
| 3.375% 4/1/30 | | 632,000 | 570,882 |
| 3.9% 10/1/25 | | 354,000 | 346,614 |
| 4.9% 8/1/41 | | 55,000 | 48,410 |
| DTE Energy Co.: | | | |
| 2.85% 10/1/26 | | 165,000 | 156,197 |
| 3.8% 3/15/27 | | 370,000 | 353,858 |
| NiSource, Inc.: | | | |
| 0.95% 8/15/25 | | 374,000 | 355,221 |
| 1.7% 2/15/31 | | 444,000 | 353,094 |
| 2.95% 9/1/29 | | 1,074,000 | 965,298 |
| 3.49% 5/15/27 | | 210,000 | 200,351 |
| 3.6% 5/1/30 | | 1,800,000 | 1,651,797 |
| 3.95% 3/30/48 | | 274,000 | 205,509 |
| 4.375% 5/15/47 | | 131,000 | 105,106 |
| 4.8% 2/15/44 | | 151,000 | 131,249 |
| Puget Energy, Inc.: | | | |
| 3.65% 5/15/25 | | 221,000 | 216,651 |
| 4.1% 6/15/30 | | 1,710,000 | 1,573,247 |
| 4.224% 3/15/32 | | 756,000 | 677,620 |
| San Diego Gas & Electric Co. 4.5% 8/15/40 | | 27,000 | 24,048 |
| Sempra: | | | |
| 3.25% 6/15/27 | | 167,000 | 157,623 |
| 3.8% 2/1/38 | | 233,000 | 190,361 |
| 4% 2/1/48 | | 604,000 | 458,533 |
| 6% 10/15/39 | | 27,000 | 27,313 |
| WEC Energy Group, Inc. CME Term SOFR 3 Month Index + 2.110% 7.6965% 5/15/67 (c)(d) | | 295,000 | 291,623 |
| | | | 13,109,490 |
| Water Utilities - 0.0% | | | |
| American Water Capital Corp.: | | | |
| 2.95% 9/1/27 | | 167,000 | 156,392 |
| 3.45% 6/1/29 | | 167,000 | 155,386 |
| 6.593% 10/15/37 | | 179,000 | 198,930 |
| | | | 510,708 |
TOTAL UTILITIES | | | 45,597,509 |
| TOTAL NONCONVERTIBLE BONDS (Cost $835,267,362) | | | 803,684,134 |
| | | | |
| U.S. Treasury Obligations - 43.8% |
| | | Principal Amount (a) | Value ($) |
| U.S. Treasury Bonds: | | | |
| 1.125% 5/15/40 | | 15,985,600 | 9,836,764 |
| 1.75% 8/15/41 | | 23,171,800 | 15,311,491 |
| 1.875% 11/15/51 | | 14,846,000 | 8,617,639 |
| 2% 8/15/51 | | 27,127,600 | 16,295,634 |
| 2.25% 2/15/52 | | 11,359,700 | 7,236,484 |
| 2.375% 11/15/49 | | 6,448,000 | 4,281,371 |
| 2.375% 5/15/51 | | 8,558,600 | 5,636,640 |
| 2.875% 5/15/52 | | 15,000,000 | 10,993,945 |
| 3% 2/15/47 | | 15,804,500 | 12,112,668 |
| 3% 8/15/52 | | 57,000,000 | 42,881,367 |
| 3.375% 8/15/42 | | 78,200,000 | 66,048,454 |
| 3.625% 2/15/53 | | 31,000,000 | 26,371,797 |
| 3.625% 5/15/53 | | 7,500,000 | 6,382,324 |
| 4% 11/15/42 | | 14,000,000 | 12,901,875 |
| 4.125% 8/15/53 | | 44,733,000 | 41,655,859 |
| 4.25% 2/15/54 | | 85,020,000 | 80,954,981 |
| 4.625% 5/15/54 | | 7,200,000 | 7,300,125 |
| U.S. Treasury Notes: | | | |
| 0.375% 7/31/27 | | 8,695,100 | 7,669,350 |
| 0.5% 10/31/27 | | 12,237,600 | 10,741,840 |
| 1.125% 2/29/28 | | 9,043,800 | 8,034,498 |
| 1.125% 8/31/28 | | 17,817,900 | 15,610,847 |
| 1.25% 5/31/28 | | 19,521,400 | 17,306,941 |
| 1.25% 6/30/28 | | 12,849,100 | 11,367,438 |
| 2.25% 8/15/27 | | 18,256,900 | 17,058,078 |
| 2.25% 11/15/27 | | 8,316,200 | 7,736,015 |
| 2.625% 7/31/29 | | 30,000,000 | 27,643,359 |
| 2.75% 7/31/27 | | 25,000,000 | 23,738,281 |
| 2.75% 8/15/32 | | 9,228,000 | 8,211,839 |
| 2.875% 5/15/32 | | 5,778,000 | 5,205,843 |
| 3.375% 5/15/33 | | 74,200,000 | 68,765,430 |
| 3.5% 2/15/33 | | 86,600,000 | 81,167,172 |
| 3.75% 5/31/30 | | 47,700,000 | 46,192,606 |
| 3.75% 6/30/30 | | 10,000,000 | 9,679,688 |
| 3.875% 11/30/27 | | 4,000,000 | 3,923,906 |
| 3.875% 11/30/29 | | 55,000,000 | 53,719,531 |
| 3.875% 8/15/33 | | 15,962,000 | 15,355,943 |
| 4% 1/15/27 | | 780,000 | 768,666 |
| 4% 2/29/28 | | 30,000,000 | 29,542,969 |
| 4% 6/30/28 | | 7,000,000 | 6,893,633 |
| 4% 10/31/29 | | 53,000,000 | 52,103,555 |
| 4% 2/28/30 | | 52,000,000 | 51,059,531 |
| 4% 7/31/30 | | 25,000,000 | 24,523,438 |
| 4% 1/31/31 | | 30,000,000 | 29,396,484 |
| 4% 2/15/34 | | 44,100,000 | 42,804,563 |
| 4.125% 10/31/27 | | 45,000,000 | 44,495,508 |
| 4.125% 7/31/28 | | 75,000,000 | 74,206,055 |
| 4.125% 8/31/30 | | 14,100,000 | 13,920,445 |
| 4.125% 3/31/31 | | 17,500,000 | 17,269,629 |
| 4.125% 11/15/32 | | 35,000,000 | 34,410,742 |
| 4.25% 3/15/27 | | 11,170,000 | 11,080,553 |
| 4.25% 2/28/31 | | 200,000 | 198,820 |
| 4.375% 12/15/26 | | 740,000 | 735,751 |
| 4.375% 11/30/30 | | 24,600,000 | 24,620,180 |
| 4.375% 5/15/34 | | 990,000 | 990,309 |
| 4.5% 4/15/27 | | 4,040,000 | 4,034,003 |
| 4.5% 5/31/29 | | 210,000 | 211,427 |
| 4.625% 6/15/27 | | 2,690,000 | 2,697,776 |
| 4.625% 4/30/29 | | 40,000,000 | 40,459,375 |
| 4.625% 4/30/31 | | 45,200,000 | 45,927,438 |
| 4.625% 5/31/31 | | 43,260,000 | 43,962,975 |
| TOTAL U.S. TREASURY OBLIGATIONS (Cost $1,489,985,381) | | | 1,410,261,848 |
| | | | |
| U.S. Government Agency - Mortgage Securities - 28.8% |
| | | Principal Amount (a) | Value ($) |
| Fannie Mae - 6.9% | | | |
| Refinitiv USD IBOR Consumer Cash Fallbacks Term 1Y + 1.310% 6.438% 5/1/34 (c)(d) | | 2,575 | 2,587 |
| Refinitiv USD IBOR Consumer Cash Fallbacks Term 1Y + 1.420% 5.572% 9/1/33 (c)(d) | | 6,586 | 6,618 |
| Refinitiv USD IBOR Consumer Cash Fallbacks Term 1Y + 1.480% 5.73% 7/1/34 (c)(d) | | 318 | 323 |
| Refinitiv USD IBOR Consumer Cash Fallbacks Term 1Y + 1.510% 5.789% 11/1/34 (c)(d) | | 42,633 | 43,470 |
| Refinitiv USD IBOR Consumer Cash Fallbacks Term 1Y + 1.550% 5.803% 6/1/36 (c)(d) | | 795 | 811 |
| Refinitiv USD IBOR Consumer Cash Fallbacks Term 1Y + 1.550% 7.174% 10/1/33 (c)(d) | | 311 | 314 |
| Refinitiv USD IBOR Consumer Cash Fallbacks Term 1Y + 1.560% 7.359% 7/1/35 (c)(d) | | 435 | 440 |
| Refinitiv USD IBOR Consumer Cash Fallbacks Term 1Y + 1.640% 6.274% 11/1/36 (c)(d) | | 7,349 | 7,486 |
| Refinitiv USD IBOR Consumer Cash Fallbacks Term 1Y + 1.640% 7.02% 4/1/41 (c)(d) | | 2,502 | 2,550 |
| Refinitiv USD IBOR Consumer Cash Fallbacks Term 1Y + 1.700% 7.16% 6/1/42 (c)(d) | | 4,645 | 4,748 |
| Refinitiv USD IBOR Consumer Cash Fallbacks Term 1Y + 1.730% 7.393% 5/1/36 (c)(d) | | 4,446 | 4,538 |
| Refinitiv USD IBOR Consumer Cash Fallbacks Term 1Y + 1.750% 6.325% 7/1/35 (c)(d) | | 513 | 523 |
| Refinitiv USD IBOR Consumer Cash Fallbacks Term 1Y + 1.780% 6.163% 2/1/36 (c)(d) | | 2,490 | 2,540 |
| Refinitiv USD IBOR Consumer Cash Fallbacks Term 1Y + 1.800% 6.05% 7/1/41 (c)(d) | | 1,405 | 1,441 |
| Refinitiv USD IBOR Consumer Cash Fallbacks Term 1Y + 1.810% 6.068% 9/1/41 (c)(d) | | 2,076 | 2,136 |
| Refinitiv USD IBOR Consumer Cash Fallbacks Term 1Y + 1.810% 6.145% 7/1/41 (c)(d) | | 2,791 | 2,868 |
| Refinitiv USD IBOR Consumer Cash Fallbacks Term 1Y + 1.820% 6.195% 12/1/35 (c)(d) | | 2,587 | 2,648 |
| Refinitiv USD IBOR Consumer Cash Fallbacks Term 1Y + 1.830% 6.08% 10/1/41 (c)(d) | | 1,805 | 1,825 |
| Refinitiv USD IBOR Consumer Cash Fallbacks Term 1Y + 1.880% 6.318% 11/1/34 (c)(d) | | 3,074 | 3,142 |
| Refinitiv USD IBOR Consumer Cash Fallbacks Term 1Y + 1.950% 6.385% 9/1/36 (c)(d) | | 4,669 | 4,795 |
| Refinitiv USD IBOR Consumer Cash Fallbacks Term 1Y + 1.950% 7.515% 7/1/37 (c)(d) | | 1,776 | 1,827 |
| U.S. TREASURY 1 YEAR INDEX + 1.940% 5.87% 10/1/33 (c)(d) | | 6,644 | 6,711 |
| U.S. TREASURY 1 YEAR INDEX + 2.200% 6.583% 3/1/35 (c)(d) | | 580 | 586 |
| U.S. TREASURY 1 YEAR INDEX + 2.220% 6.392% 8/1/36 (c)(d) | | 7,847 | 7,941 |
| U.S. TREASURY 1 YEAR INDEX + 2.280% 6.402% 10/1/33 (c)(d) | | 917 | 929 |
| U.S. TREASURY 1 YEAR INDEX + 2.420% 6.851% 5/1/35 (c)(d) | | 990 | 1,004 |
| 1.5% 9/1/35 to 6/1/51 | | 21,513,021 | 17,032,633 |
| 2% 2/1/28 to 3/1/52 | | 44,785,891 | 37,995,146 |
| 2.5% 7/1/26 to 1/1/52 | | 51,863,965 | 43,857,517 |
| 3% 8/1/26 to 5/1/52 (e) | | 36,984,624 | 32,790,569 |
| 3.5% 5/1/28 to 7/1/52 | | 25,478,015 | 23,252,560 |
| 4% 7/1/30 to 1/1/52 | | 15,594,929 | 14,549,912 |
| 4.5% to 4.5% 8/1/24 to 11/1/52 | | 9,651,832 | 9,243,652 |
| 5% 9/1/25 to 12/1/52 | | 5,844,050 | 5,737,979 |
| 5.5% 6/1/27 to 4/1/54 | | 10,220,175 | 10,135,094 |
| 6% to 6% 11/1/32 to 6/1/54 | | 14,079,406 | 14,185,572 |
| 6.5% 5/1/31 to 6/1/54 | | 13,705,615 | 14,080,652 |
| 7% to 7% 8/1/25 to 2/1/29 | | 4,978 | 5,113 |
| 7.5% to 7.5% 9/1/25 to 11/1/31 | | 7,928 | 8,153 |
TOTAL FANNIE MAE | | | 222,989,353 |
| Freddie Mac - 3.9% | | | |
| Refinitiv USD IBOR Consumer Cash Fallbacks Term 1Y + 1.370% 5.625% 3/1/36 (c)(d) | | 3,997 | 4,039 |
| Refinitiv USD IBOR Consumer Cash Fallbacks Term 1Y + 1.650% 7.299% 4/1/35 (c)(d) | | 4,029 | 4,064 |
| Refinitiv USD IBOR Consumer Cash Fallbacks Term 1Y + 1.880% 6.13% 9/1/41 (c)(d) | | 2,833 | 2,905 |
| Refinitiv USD IBOR Consumer Cash Fallbacks Term 1Y + 1.880% 7.255% 4/1/41 (c)(d) | | 667 | 681 |
| Refinitiv USD IBOR Consumer Cash Fallbacks Term 1Y + 1.910% 6.16% 6/1/41 (c)(d) | | 2,090 | 2,150 |
| Refinitiv USD IBOR Consumer Cash Fallbacks Term 1Y + 1.910% 7.213% 5/1/41 (c)(d) | | 6,071 | 6,204 |
| Refinitiv USD IBOR Consumer Cash Fallbacks Term 1Y + 1.910% 7.336% 6/1/41 (c)(d) | | 5,707 | 5,848 |
| Refinitiv USD IBOR Consumer Cash Fallbacks Term 1Y + 1.910% 7.562% 5/1/41 (c)(d) | | 6,573 | 6,734 |
| Refinitiv USD IBOR Consumer Cash Fallbacks Term 1Y + 1.960% 6.263% 9/1/37 (c)(d) | | 4,078 | 4,186 |
| Refinitiv USD IBOR Consumer Cash Fallbacks Term 1Y + 2.030% 6.158% 3/1/33 (c)(d) | | 61 | 61 |
| Refinitiv USD IBOR Consumer Cash Fallbacks Term 1Y + 2.160% 6.41% 11/1/35 (c)(d) | | 288 | 295 |
| Refinitiv USD IBOR Consumer Cash Fallbacks Term 1Y + 3.000% 8.626% 10/1/35 (c)(d) | | 282 | 290 |
| U.S. TREASURY 1 YEAR INDEX + 1.700% 5.928% 3/1/36 (c)(d) | | 32,206 | 32,167 |
| U.S. TREASURY 1 YEAR INDEX + 2.230% 6.342% 12/1/35 (c)(d) | | 14,264 | 14,396 |
| U.S. TREASURY 1 YEAR INDEX + 2.240% 6.371% 1/1/35 (c)(d) | | 446 | 450 |
| U.S. TREASURY 1 YEAR INDEX + 2.250% 6.454% 3/1/35 (c)(d) | | 7,407 | 7,467 |
| 1.5% 7/1/35 to 2/1/51 | | 22,078,783 | 17,734,815 |
| 2% 2/1/35 to 4/1/52 | | 20,941,504 | 17,384,919 |
| 2% 9/1/35 | | 230,607 | 203,650 |
| 2% 10/1/35 | | 1,498,256 | 1,323,118 |
| 2.5% 3/1/28 to 3/1/52 | | 27,488,385 | 23,919,236 |
| 3% 10/1/26 to 5/1/52 | | 12,896,993 | 11,405,678 |
| 3% 8/1/47 | | 5,253 | 4,581 |
| 3.5% 4/1/28 to 7/1/52 | | 16,922,808 | 15,442,650 |
| 3.5% 8/1/47 | | 5,094 | 4,591 |
| 3.5% 9/1/47 | | 225,068 | 203,887 |
| 4% 8/1/33 to 8/1/52 (f) | | 6,327,405 | 5,884,788 |
| 4.5% 6/1/25 to 9/1/50 | | 4,026,814 | 3,880,045 |
| 5% 5/1/28 to 8/1/53 | | 9,270,974 | 9,058,082 |
| 5.5% 4/1/27 to 3/1/54 | | 10,785,568 | 10,703,698 |
| 6% 4/1/32 to 4/1/54 | | 4,904,017 | 4,955,994 |
| 6.5% 11/1/36 to 1/1/54 | | 3,396,461 | 3,506,159 |
| 7.5% 8/1/26 to 9/1/31 | | 1,036 | 1,079 |
| 8% 5/1/27 | | 16 | 16 |
| 8.5% 5/1/27 to 1/1/28 | | 115 | 117 |
TOTAL FREDDIE MAC | | | 125,709,040 |
| Ginnie Mae - 6.9% | | | |
| 3.5% 12/15/40 to 6/20/51 | | 11,956,746 | 10,899,983 |
| 4% 1/15/25 to 10/20/48 | | 4,717,033 | 4,445,624 |
| 5% 1/20/39 to 5/20/54 | | 11,502,766 | 11,223,668 |
| 6.5% 4/15/35 to 1/15/39 | | 21,433 | 22,190 |
| 7% 1/15/28 to 7/15/32 | | 25,707 | 26,195 |
| 7.5% to 7.5% 12/15/25 to 10/15/28 | | 3,482 | 3,531 |
| 8% 3/15/30 to 9/15/30 | | 739 | 766 |
| 1.5% 3/20/51 to 12/20/51 | | 274,501 | 214,446 |
| 2% 10/20/50 to 11/20/51 | | 18,105,421 | 14,667,888 |
| 2% 7/1/54 (g) | | 11,650,000 | 9,433,427 |
| 2% 7/1/54 (g) | | 14,450,000 | 11,700,688 |
| 2% 7/1/54 (g) | | 4,625,000 | 3,745,030 |
| 2% 7/1/54 (g) | | 1,450,000 | 1,174,117 |
| 2% 7/1/54 (g) | | 7,600,000 | 6,153,995 |
| 2% 8/1/54 (g) | | 2,900,000 | 2,350,387 |
| 2% 8/1/54 (g) | | 17,400,000 | 14,102,324 |
| 2.5% 7/20/43 to 1/20/52 | | 25,917,631 | 21,709,465 |
| 2.5% 7/1/54 (g) | | 1,200,000 | 1,009,187 |
| 2.5% 7/1/54 (g) | | 1,200,000 | 1,009,187 |
| 3% 7/15/42 to 6/20/51 | | 11,287,002 | 9,965,422 |
| 3% 7/1/54 (g) | | 5,500,000 | 4,795,926 |
| 3% 7/1/54 (g) | | 5,375,000 | 4,686,927 |
| 3% 7/1/54 (g) | | 2,325,000 | 2,027,369 |
| 3% 7/1/54 (g) | | 2,825,000 | 2,463,362 |
| 3% 8/1/54 (g) | | 8,200,000 | 7,153,492 |
| 3% 8/1/54 (g) | | 1,350,000 | 1,177,709 |
| 3.5% 7/1/54 (g) | | 2,400,000 | 2,157,078 |
| 3.5% 7/1/54 (g) | | 2,750,000 | 2,471,652 |
| 3.5% 8/1/54 (g) | | 3,650,000 | 3,282,125 |
| 4% 7/1/54 (g) | | 6,300,000 | 5,822,054 |
| 4% 8/1/54 (g) | | 6,300,000 | 5,837,000 |
| 4.5% to 4.5% 11/20/33 to 4/20/53 | | 3,737,365 | 3,605,039 |
| 4.5% 7/1/54 (g) | | 3,800,000 | 3,612,169 |
| 5% 7/1/54 (g) | | 4,600,000 | 4,478,756 |
| 5% 7/1/54 (g) | | 4,600,000 | 4,478,756 |
| 5.5% 12/20/32 to 12/20/48 | | 222,430 | 226,171 |
| 5.5% 7/1/54 (g) | | 3,600,000 | 3,571,739 |
| 5.5% 7/1/54 (g) | | 3,200,000 | 3,174,879 |
| 5.5% 7/1/54 (g) | | 4,500,000 | 4,464,674 |
| 5.5% 7/1/54 (g) | | 2,900,000 | 2,877,234 |
| 5.5% 8/1/54 (g) | | 4,500,000 | 4,462,565 |
| 5.5% 8/1/54 (g) | | 2,575,000 | 2,553,579 |
| 6% to 6% 5/20/34 to 12/15/40 | | 79,888 | 82,015 |
| 6% 7/1/54 (g) | | 1,625,000 | 1,631,983 |
| 6% 7/1/54 (g) | | 1,300,000 | 1,305,586 |
| 6% 7/1/54 (g) | | 4,450,000 | 4,469,122 |
| 6% 7/1/54 (g) | | 325,000 | 326,397 |
| 6% 7/1/54 (g) | | 2,000,000 | 2,008,594 |
| 6% 8/1/54 (g) | | 3,800,000 | 3,813,806 |
| 6% 8/1/54 (g) | | 2,850,000 | 2,860,354 |
| 6% 8/1/54 (g) | | 1,525,000 | 1,530,540 |
TOTAL GINNIE MAE | | | 221,266,172 |
| Uniform Mortgage Backed Securities - 11.1% | | | |
| 2% 7/1/39 (g) | | 800,000 | 703,187 |
| 2% 8/1/39 (g) | | 800,000 | 703,875 |
| 2% 7/1/54 (g) | | 46,800,000 | 36,602,720 |
| 2% 7/1/54 (g) | | 15,000,000 | 11,731,641 |
| 2% 7/1/54 (g) | | 11,800,000 | 9,228,891 |
| 2% 7/1/54 (g) | | 8,700,000 | 6,804,352 |
| 2% 7/1/54 (g) | | 7,675,000 | 6,002,690 |
| 2% 7/1/54 (g) | | 4,800,000 | 3,754,125 |
| 2% 7/1/54 (g) | | 11,400,000 | 8,916,047 |
| 2% 7/1/54 (g) | | 3,500,000 | 2,737,383 |
| 2% 7/1/54 (g) | | 1,400,000 | 1,094,953 |
| 2% 7/1/54 (g) | | 2,300,000 | 1,798,852 |
| 2% 7/1/54 (g) | | 8,550,000 | 6,687,035 |
| 2% 7/1/54 (g) | | 2,700,000 | 2,111,695 |
| 2% 7/1/54 (g) | | 7,275,000 | 5,689,846 |
| 2% 8/1/54 (g) | | 59,800,000 | 46,816,858 |
| 2% 8/1/54 (g) | | 17,000,000 | 13,309,140 |
| 2% 8/1/54 (g) | | 5,850,000 | 4,579,910 |
| 2% 8/1/54 (g) | | 5,875,000 | 4,599,482 |
| 2.5% 7/1/54 (g) | | 25,500,000 | 20,826,329 |
| 2.5% 7/1/54 (g) | | 4,375,000 | 3,573,145 |
| 2.5% 7/1/54 (g) | | 4,350,000 | 3,552,727 |
| 2.5% 7/1/54 (g) | | 4,800,000 | 3,920,250 |
| 2.5% 7/1/54 (g) | | 2,100,000 | 1,715,109 |
| 2.5% 7/1/54 (g) | | 400,000 | 326,688 |
| 2.5% 7/1/54 (g) | | 3,300,000 | 2,695,172 |
| 2.5% 7/1/54 (g) | | 3,000,000 | 2,450,156 |
| 2.5% 7/1/54 (g) | | 2,400,000 | 1,960,125 |
| 2.5% 7/1/54 (g) | | 600,000 | 490,031 |
| 2.5% 7/1/54 (g) | | 200,000 | 163,344 |
| 2.5% 8/1/54 (g) | | 25,700,000 | 21,008,745 |
| 2.5% 8/1/54 (g) | | 2,800,000 | 2,288,891 |
| 2.5% 8/1/54 (g) | | 1,000,000 | 817,461 |
| 3% 7/1/54 (g) | | 11,350,000 | 9,658,146 |
| 3% 7/1/54 (g) | | 7,150,000 | 6,084,207 |
| 3% 7/1/54 (g) | | 4,750,000 | 4,041,956 |
| 3% 7/1/54 (g) | | 1,400,000 | 1,191,313 |
| 3% 8/1/54 (g) | | 9,550,000 | 8,132,427 |
| 3% 8/1/54 (g) | | 5,750,000 | 4,896,487 |
| 3.5% 7/1/54 (g) | | 2,650,000 | 2,345,456 |
| 3.5% 7/1/54 (g) | | 1,700,000 | 1,504,632 |
| 3.5% 7/1/54 (g) | | 1,600,000 | 1,416,124 |
| 3.5% 7/1/54 (g) | | 1,550,000 | 1,371,870 |
| 3.5% 7/1/54 (g) | | 1,600,000 | 1,416,124 |
| 3.5% 7/1/54 (g) | | 1,500,000 | 1,327,616 |
| 3.5% 7/1/54 (g) | | 150,000 | 132,762 |
| 4% 7/1/54 (g) | | 5,400,000 | 4,940,157 |
| 4% 7/1/54 (g) | | 1,350,000 | 1,235,039 |
| 4% 7/1/54 (g) | | 3,075,000 | 2,813,145 |
| 4% 8/1/54 (g) | | 3,075,000 | 2,814,586 |
| 5.5% 7/1/54 (g) | | 1,700,000 | 1,676,691 |
| 5.5% 7/1/54 (g) | | 4,700,000 | 4,635,558 |
| 5.5% 7/1/54 (g) | | 3,500,000 | 3,452,012 |
| 5.5% 7/1/54 (g) | | 1,800,000 | 1,775,320 |
| 6% 7/1/54 (g) | | 13,600,000 | 13,638,258 |
| 6% 7/1/54 (g) | | 4,750,000 | 4,763,362 |
| 6% 7/1/54 (g) | | 6,475,000 | 6,493,215 |
| 6% 7/1/54 (g) | | 6,300,000 | 6,317,723 |
| 6% 7/1/54 (g) | | 3,000,000 | 3,008,439 |
| 6% 8/1/54 (g) | | 15,050,000 | 15,090,573 |
TOTAL UNIFORM MORTGAGE BACKED SECURITIES | | | 355,834,053 |
| TOTAL U.S. GOVERNMENT AGENCY - MORTGAGE SECURITIES (Cost $950,766,453) | | | 925,798,618 |
| | | | |
| Asset-Backed Securities - 7.8% |
| | | Principal Amount (a) | Value ($) |
| Aaset 2024-1 U.S. Ltd. / Aaset 20 Series 2024-1A: | | | |
| Class A1, 6.261% 5/16/49 (b) | | 1,807,000 | 1,808,446 |
| Class A2, 6.261% 5/16/49 (b) | | 1,645,000 | 1,647,139 |
| AASET Trust: | | | |
| Series 2018-1A Class A, 3.844% 1/16/38 (b) | | 275,106 | 197,249 |
| Series 2019-1 Class A, 3.844% 5/15/39 (b) | | 64,882 | 61,315 |
| Series 2019-2 Class A, 3.376% 10/16/39 (b) | | 440,796 | 418,765 |
| Series 2021-1A Class A, 2.95% 11/16/41 (b) | | 566,294 | 521,914 |
| Series 2021-2A Class A, 2.798% 1/15/47 (b) | | 1,154,875 | 1,032,699 |
| AASET, Ltd. Series 2022-1A Class A, 6% 5/16/47 (b) | | 10,991,874 | 10,972,988 |
| Affirm Asset Securitization Trust: | | | |
| Series 2024-A Class 1A, 5.61% 2/15/29 (b) | | 500,000 | 499,228 |
| Series 2024-X1 Class A, 6.27% 5/15/29 (b) | | 1,020,397 | 1,021,640 |
| Aimco: | | | |
| Series 2024-10A Class ARR, CME Term SOFR 3 Month Index + 1.410% 6.7414% 7/22/37 (b)(c)(d) | | 1,348,000 | 1,348,690 |
| Series 2024-BA Class ARR, CME Term SOFR 3 Month Index + 1.500% 6.8277% 4/16/37 (b)(c)(d) | | 2,766,000 | 2,782,516 |
| AIMCO CLO Series 2021-AA Class AR2, CME Term SOFR 3 Month Index + 1.400% 6.7187% 10/17/34 (b)(c)(d) | | 3,002,000 | 3,006,326 |
| Aimco Clo 21 Ltd. / Aimco Clo 2 Series 2024-21A Class A1, CME Term SOFR 3 Month Index + 1.500% 6.8251% 4/18/37 (b)(c)(d) | | 1,864,000 | 1,864,434 |
| Aimco Clo 22 Ltd. / Aimco Clo 2 Series 2024-22A Class A, CME Term SOFR 3 Month Index + 1.500% 6.8266% 4/19/37 (b)(c)(d) | | 1,960,000 | 1,963,914 |
| AIMCO CLO Ltd. Series 2021-11A Class AR, CME Term SOFR 3 Month Index + 1.390% 6.7087% 10/17/34 (b)(c)(d) | | 524,413 | 524,850 |
| AIMCO CLO Ltd. / AIMCO CLO LLC Series 2021-14A Class A, CME Term SOFR 3 Month Index + 1.250% 6.5762% 4/20/34 (b)(c)(d) | | 2,044,526 | 2,045,327 |
| Allegro CLO XV, Ltd. / Allegro CLO VX LLC Series 2022-1A Class A, CME Term SOFR 3 Month Index + 1.500% 6.8246% 7/20/35 (b)(c)(d) | | 667,851 | 668,759 |
| Allegro CLO, Ltd. Series 2021-1A Class A, CME Term SOFR 3 Month Index + 1.400% 6.7262% 7/20/34 (b)(c)(d) | | 627,261 | 627,822 |
| Ally Auto Receivables Trust Series 2024-1 Class A3, 5.08% 12/15/28 | | 1,420,000 | 1,416,501 |
| Apollo Aviation Securitization Equity Trust Series 2020-1A Class A, 3.351% 1/16/40 (b) | | 145,724 | 134,062 |
| Ares CLO Series 2024-54A Class AR, CME Term SOFR 3 Month Index + 1.270% 6.5986% 10/15/32 (b)(c)(d) | | 2,723,000 | 2,723,953 |
| Ares LIX CLO Ltd. Series 2021-59A Class A, CME Term SOFR 3 Month Index + 1.290% 6.6152% 4/25/34 (b)(c)(d) | | 425,583 | 425,879 |
| Ares Ln Funding V Ltd. Series 2024-ALF5A Class A1, CME Term SOFR 3 Month Index + 1.500% 6.8235% 7/25/37 (b)(c)(d) | | 2,450,000 | 2,450,674 |
| Ares LV CLO Ltd. Series 2021-55A Class A1R, CME Term SOFR 3 Month Index + 1.390% 6.7202% 7/15/34 (b)(c)(d) | | 1,132,637 | 1,134,690 |
| Ares LVIII CLO LLC Series 2022-58A Class AR, CME Term SOFR 3 Month Index + 1.330% 6.6586% 1/15/35 (b)(c)(d) | | 1,304,759 | 1,305,325 |
| Ares XLI CLO Ltd. / Ares XLI CLO LLC Series 2021-41A Class AR2, CME Term SOFR 3 Month Index + 1.330% 6.6602% 4/15/34 (b)(c)(d) | | 3,561,718 | 3,561,718 |
| Babson CLO Ltd. Series 2021-1A Class AR, CME Term SOFR 3 Month Index + 1.410% 6.7402% 10/15/36 (b)(c)(d) | | 14,190,185 | 14,200,643 |
| Barings CLO Ltd.: | | | |
| Series 2021-1A Class A, CME Term SOFR 3 Month Index + 1.280% 6.6052% 4/25/34 (b)(c)(d) | | 934,550 | 934,805 |
| Series 2021-4A Class A, CME Term SOFR 3 Month Index + 1.480% 6.8062% 1/20/32 (b)(c)(d) | | 787,546 | 788,496 |
| Barings CLO Ltd. 2023-IV Series 2024-4A Class A, CME Term SOFR 3 Month Index + 1.750% 7.0612% 1/20/37 (b)(c)(d) | | 3,356,000 | 3,390,329 |
| Beechwood Park CLO Ltd. Series 2022-1A Class A1R, CME Term SOFR 3 Month Index + 1.300% 6.6171% 1/17/35 (b)(c)(d) | | 17,227,148 | 17,184,528 |
| BETHP Series 2021-1A Class A, CME Term SOFR 3 Month Index + 1.390% 6.7202% 1/15/35 (b)(c)(d) | | 799,679 | 800,651 |
| Blackbird Capital Aircraft: | | | |
| Series 2016-1A Class A, 4.213% 12/16/41 (b) | | 500,110 | 495,194 |
| Series 2021-1A Class A, 2.443% 7/15/46 (b) | | 842,911 | 754,094 |
| Bofa Auto Trust 2024-1 Series 2024-1A Class A3, 5.35% 11/15/28 (b) | | 562,000 | 563,674 |
| Bristol Park CLO, Ltd. Series 2020-1A Class AR, CME Term SOFR 3 Month Index + 1.250% 6.5802% 4/15/29 (b)(c)(d) | | 1,073,324 | 1,073,957 |
| Capital One Multi-Asset Execution Trust: | | | |
| Series 2019-A3 Class A3, 2.06% 8/15/28 | | 283,000 | 265,649 |
| Series 2023-A1 Class A, 4.42% 5/15/28 | | 1,700,000 | 1,677,087 |
| Carlyle U.S. CLO Ltd. Series 2024-11A Class A1R, CME Term SOFR 3 Month Index + 1.410% 0% 7/25/37 (b)(c)(d) | | 3,068,000 | 3,068,000 |
| CarMax Auto Owner Trust Series 2021-1 Class A3, 0.34% 12/15/25 | | 74,432 | 73,976 |
| Carmax Auto Owner Trust Series 2024-2 Class A3, 5.5% 1/16/29 | | 1,011,000 | 1,016,434 |
| Carmax Auto Owner Trust 2023-4 Series 2023-4 Class A3, 6% 7/17/28 | | 1,353,000 | 1,369,196 |
| Castlelake Aircraft Securitization Trust Series 2019-1A: | | | |
| Class A, 3.967% 4/15/39 (b) | | 448,537 | 403,797 |
| Class B, 5.095% 4/15/39 (b) | | 272,765 | 185,347 |
| Castlelake Aircraft Structured Trust: | | | |
| Series 2018-1 Class A, 4.125% 6/15/43 (b) | | 141,207 | 131,682 |
| Series 2021-1A Class A, 3.474% 1/15/46 (b) | | 108,086 | 101,670 |
| Cedar Funding Ltd.: | | | |
| Series 2021-10A Class AR, CME Term SOFR 3 Month Index + 1.360% 6.6862% 10/20/32 (b)(c)(d) | | 799,316 | 799,931 |
| Series 2021-12A Class A1R, CME Term SOFR 3 Month Index + 1.390% 6.7152% 10/25/34 (b)(c)(d) | | 490,758 | 491,488 |
| Series 2022-15A Class A, CME Term SOFR 3 Month Index + 1.320% 6.6446% 4/20/35 (b)(c)(d) | | 3,994,984 | 3,998,036 |
| Cedar Funding Xvii Clo Ltd. Series 2023-17A Class A, CME Term SOFR 3 Month Index + 1.850% 7.1746% 7/20/36 (b)(c)(d) | | 2,065,000 | 2,075,069 |
| CEDF Series 2021-6A Class ARR, CME Term SOFR 3 Month Index + 1.310% 6.6362% 4/20/34 (b)(c)(d) | | 772,931 | 773,063 |
| CFMT LLC Series 2023 HB12 Class A, 4.25% 4/25/33 (b) | | 683,553 | 670,423 |
| Chase Auto Owner Trust Series 2024-1A Class A3, 5.13% 5/25/29 (b) | | 900,000 | 899,396 |
| Chesapeake Funding II LLC Series 2023-2A Class A1, 6.16% 10/15/35 (b) | | 744,140 | 748,496 |
| Citibank Credit Card Issuance Trust Series 2018-A7 Class A7, 3.96% 10/13/30 | | 442,000 | 426,208 |
| Citizens Auto Receivables Trust Series 2024-2 Class A3, 5.33% 8/15/28 (b) | | 700,000 | 699,810 |
| CNH Equipment Trust Series 2023 A Class A2, 5.34% 9/15/26 | | 414,034 | 413,486 |
| Columbia Cent CLO 29 Ltd./Columbia Cent CLO 29 Corp. Series 2021-29A Class AR, CME Term SOFR 3 Month Index + 1.430% 6.7562% 10/20/34 (b)(c)(d) | | 795,912 | 797,225 |
| Columbia Cent CLO 31 Ltd. Series 2021-31A Class A1, CME Term SOFR 3 Month Index + 1.460% 6.7862% 4/20/34 (b)(c)(d) | | 853,929 | 854,879 |
| Columbia Cent CLO Ltd. / Columbia Cent CLO Corp. Series 2021-30A Class A1, CME Term SOFR 3 Month Index + 1.570% 6.8962% 1/20/34 (b)(c)(d) | | 1,117,642 | 1,118,461 |
| DB Master Finance LLC Series 2017-1A Class A2II, 4.03% 11/20/47 (b) | | 709,688 | 673,878 |
| Discover Card Execution Note Trust Series 2023 A1 Class A, 4.31% 3/15/28 | | 600,000 | 590,958 |
| Dllaa 2023-1A Series 2023-1A: | | | |
| Class A2, 5.93% 7/20/26 (b) | | 370,608 | 371,103 |
| Class A3, 5.64% 2/22/28 (b) | | 597,000 | 600,212 |
| DLLAD: | | | |
| Series 2023-1A Class A3, 4.79% 1/20/28 (b) | | 600,000 | 593,976 |
| Series 2024-1A Class A3, 5.3% 7/20/29 (b) | | 444,000 | 445,569 |
| Dominos Pizza Master Issuer LLC Series 2018-1A Class A2II, 4.328% 7/25/48 (b) | | 1,895,000 | 1,822,507 |
| Dryden 98 CLO Ltd. Series 2022-98A Class A, CME Term SOFR 3 Month Index + 1.300% 6.6246% 4/20/35 (b)(c)(d) | | 2,345,807 | 2,349,375 |
| Dryden CLO, Ltd.: | | | |
| Series 2021-76A Class A1R, CME Term SOFR 3 Month Index + 1.410% 6.7362% 10/20/34 (b)(c)(d) | | 2,028,431 | 2,029,861 |
| Series 2024-83A Class AR, CME Term SOFR 3 Month Index + 1.530% 6.8642% 4/18/37 (b)(c)(d) | | 2,387,000 | 2,390,342 |
| Dryden Senior Loan Fund: | | | |
| Series 2018-58A Class A1, CME Term SOFR 3 Month Index + 1.260% 6.5787% 7/17/31 (b)(c)(d) | | 767,146 | 767,530 |
| Series 2021-85A Class AR, CME Term SOFR 3 Month Index + 1.410% 6.7402% 10/15/35 (b)(c)(d) | | 2,675,984 | 2,678,834 |
| Series 2021-90A Class A1A, CME Term SOFR 3 Month Index + 1.390% 6.7174% 2/20/35 (b)(c)(d) | | 1,574,048 | 1,574,818 |
| Series 2024-78A Class A1R, CME Term SOFR 3 Month Index + 1.530% 6.8471% 4/17/37 (b)(c)(d) | | 600,000 | 602,299 |
| Series 2024-85A Class A1R2, CME Term SOFR 3 Month Index + 1.380% 0% 7/15/37 (b)(c)(d) | | 2,435,000 | 2,435,000 |
| Eaton Vance CLO, Ltd.: | | | |
| Series 2021-2A Class AR, CME Term SOFR 3 Month Index + 1.410% 6.7402% 1/15/35 (b)(c)(d) | | 1,957,851 | 1,960,698 |
| Series 2024-1A Class AR2, CME Term SOFR 3 Month Index + 1.510% 6.8399% 7/15/37 (b)(c)(d) | | 2,449,000 | 2,447,440 |
| Enterprise Fleet Financing Series 2024-2: | | | |
| Class A2, 5.74% 12/20/26 (b) | | 800,000 | 802,120 |
| Class A3, 5.61% 4/20/28 (b) | | 800,000 | 806,521 |
| Enterprise Fleet Financing 2023-3 L Series 2023-3 Class A2, 6.4% 3/20/30 (b) | | 2,153,000 | 2,177,269 |
| Flatiron CLO Ltd. Series 2021-1A: | | | |
| Class A1, CME Term SOFR 3 Month Index + 1.370% 6.6982% 7/19/34 (b)(c)(d) | | 924,249 | 926,067 |
| Class AR, 3 month U.S. LIBOR + 1.080% 6.6683% 11/16/34 (b)(c)(d) | | 816,255 | 816,255 |
| Ford Credit Floorplan Master Owner Trust: | | | |
| Series 2023-1 Class A1, 4.92% 5/15/28 (b) | | 1,700,000 | 1,688,603 |
| Series 2024-1 Class A1, 5.29% 4/15/29 (b) | | 1,700,000 | 1,706,452 |
| GM Financial Automobile Leasing Trust Series 2023-2 Class A2A, 5.44% 10/20/25 | | 326,258 | 326,112 |
| Gm Financial Consumer Automobile Re Series 2023-3 Class A3, 5.45% 6/16/28 | | 1,245,000 | 1,248,943 |
| GM Financial Consumer Automobile Receivables Series 2023 2 Class A3, 4.47% 2/16/28 | | 1,870,000 | 1,849,364 |
| GM Financial Consumer Automobile Receivables Trust Series 2021-1 Class A3, 0.35% 10/16/25 | | 8,100 | 8,079 |
| Gm Financial Leasing Trust 202 Series 2023-3 Class A3, 5.38% 11/20/26 | | 620,000 | 619,552 |
| Gm Financial Revolving Receiva Series 2024-1 Class A, 4.98% 12/11/36 (b) | | 579,000 | 576,974 |
| GMF Floorplan Owner Revolving Trust Series 2023-1 Class A1, 5.34% 6/15/28 (b) | | 1,600,000 | 1,601,971 |
| Honda Auto Receivables Series 2023-2 Class A3, 4.93% 11/15/27 | | 1,321,000 | 1,313,512 |
| Honda Auto Receivables 2023-3 Series 2023-3 Class A3, 5.41% 2/18/28 | | 700,000 | 701,788 |
| Horizon Aircraft Finance I Ltd. Series 2018-1 Class A, 4.458% 12/15/38 (b) | | 247,722 | 225,325 |
| Horizon Aircraft Finance Ltd. Series 2019-1 Class A, 3.721% 7/15/39 (b) | | 217,281 | 198,675 |
| Hyundai Auto Lease Securitizat Series 2024-B Class A3, 5.41% 5/17/27 (b) | | 1,800,000 | 1,803,921 |
| Hyundai Auto Receivables Trust Series 2024-A Class A3, 4.99% 2/15/29 | | 1,480,000 | 1,474,587 |
| Invesco CLO Ltd. Series 2021-3A Class A, CME Term SOFR 3 Month Index + 1.390% 6.7162% 10/22/34 (b)(c)(d) | | 560,077 | 560,814 |
| Invesco U.S. Clo 2024-1 Ltd. Series 2024-1RA Class AR, CME Term SOFR 3 Month Index + 1.550% 6.8694% 4/15/37 (b)(c)(d) | | 1,500,000 | 1,508,046 |
| Invesco U.S. CLO Ltd. Series 2024-3A Class A, CME Term SOFR 3 Month Index + 1.510% 6.8292% 7/20/37 (b)(c)(d) | | 1,884,000 | 1,883,736 |
| KKR CLO Ltd. Series 2022-41A Class A1, CME Term SOFR 3 Month Index + 1.330% 6.6586% 4/15/35 (b)(c)(d) | | 1,298,569 | 1,298,824 |
| Kubota Credit Owner Trust Series 2024-2A Class A3, 5.26% 11/15/28 (b) | | 1,000,000 | 999,373 |
| Madison Park Funding Series 2024-19A Class AR3, CME Term SOFR 3 Month Index + 1.600% 6.9246% 1/22/37 (b)(c)(d) | | 410,000 | 412,887 |
| Madison Park Funding L Ltd. / Madison Park Funding L LLC Series 2021-50A Class A, CME Term SOFR 3 Month Index + 1.400% 6.7282% 4/19/34 (b)(c)(d) | | 1,795,369 | 1,798,418 |
| Madison Park Funding LII Ltd. / Madison Park Funding LII LLC Series 2021-52A Class A, CME Term SOFR 3 Month Index + 1.360% 6.6862% 1/22/35 (b)(c)(d) | | 910,439 | 910,480 |
| Madison Park Funding XLV Ltd./Madison Park Funding XLV LLC Series 2021-45A Class AR, CME Term SOFR 3 Month Index + 1.380% 6.7102% 7/15/34 (b)(c)(d) | | 1,248,118 | 1,248,867 |
| Madison Pk Funding Lxvii Ltd. / Mad Series 2024-67A Class A1, CME Term SOFR 3 Month Index + 1.510% 6.8002% 4/25/37 (b)(c)(d) | | 2,755,000 | 2,760,579 |
| Magnetite CLO LTD Series 2023-36A Class A, CME Term SOFR 3 Month Index + 1.800% 7.1246% 4/22/36 (b)(c)(d) | | 1,441,000 | 1,449,885 |
| Magnetite IX, Ltd. / Magnetite IX LLC Series 2021-30A Class A, CME Term SOFR 3 Month Index + 1.390% 6.7152% 10/25/34 (b)(c)(d) | | 965,191 | 965,704 |
| Magnetite XXI Ltd. Series 2021-21A Class AR, CME Term SOFR 3 Month Index + 1.280% 6.6062% 4/20/34 (b)(c)(d) | | 746,434 | 746,821 |
| Magnetite XXIX, Ltd. / Magnetite XXIX LLC Series 2021-29A Class A, CME Term SOFR 3 Month Index + 1.250% 6.5802% 1/15/34 (b)(c)(d) | | 748,428 | 748,934 |
| Marlette Funding Trust 2024-1 Series 2024-1A Class A, 5.95% 7/17/34 (b) | | 561,000 | 561,185 |
| Mercedes-Benz Auto Lease Trust Series 2024-A Class A3, 5.32% 1/18/28 | | 1,600,000 | 1,604,628 |
| Merchants Fleet Funding LLC: | | | |
| Series 2023-1A Class A, 7.21% 5/20/36 (b) | | 1,085,706 | 1,095,404 |
| Series 2024-1A Class A, 5.82% 4/20/37 (b) | | 1,200,000 | 1,201,716 |
| Milos CLO, Ltd. Series 2020-1A Class AR, CME Term SOFR 3 Month Index + 1.330% 6.6562% 10/20/30 (b)(c)(d) | | 1,587,182 | 1,588,372 |
| Neuberger Berman Loan Advisers Series 2024-25A Class AR2, CME Term SOFR 3 Month Index + 1.400% 6.723% 7/18/38 (b)(c)(d) | | 2,320,000 | 2,320,000 |
| Oak Hill Credit Partners Series 2024-18A Class A1, 6.7917% 4/20/37 (b)(c) | | 1,960,000 | 1,973,210 |
| Park Place Securities, Inc. Series 2005-WCH1 Class M4, CME Term SOFR 1 Month Index + 1.350% 6.7047% 1/25/36 (c)(d) | | 7,993 | 7,885 |
| Peace Park CLO, Ltd. Series 2021-1A Class A, CME Term SOFR 3 Month Index + 1.390% 6.7162% 10/20/34 (b)(c)(d) | | 1,605,558 | 1,606,892 |
| PK ALIFT Loan Funding 3 LP Series 2024-1 Class A1, 5.842% 9/15/39 (b) | | 546,000 | 546,109 |
| Planet Fitness Master Issuer LLC: | | | |
| Series 2019-1A Class A2, 3.858% 12/5/49 (b) | | 581,595 | 531,269 |
| Series 2022-1A: | | | |
Class A2I, 3.251% 12/5/51 (b) | | 637,330 | 598,198 |
Class A2II, 4.008% 12/5/51 (b) | | 569,883 | 500,544 |
| Project Silver Series 2019-1 Class A, 3.967% 7/15/44 (b) | | 441,366 | 400,024 |
| Rockland Park CLO Ltd. Series 2021-1A Class A, CME Term SOFR 3 Month Index + 1.380% 6.7062% 4/20/34 (b)(c)(d) | | 4,536,406 | 4,541,033 |
| RR Ltd. Series 2022-7A Class A1AB, CME Term SOFR 3 Month Index + 1.340% 6.6686% 1/15/37 (b)(c)(d) | | 1,078,307 | 1,078,840 |
| Rram 2022-24A Series 2023-24A Class A1AR, CME Term SOFR 3 Month Index + 1.730% 7.0586% 1/15/36 (b)(c)(d) | | 6,000,000 | 6,029,910 |
| Sapphire Aviation Finance Series 2020-1A Class A, 3.228% 3/15/40 (b) | | 471,633 | 432,790 |
| SBA Tower Trust: | | | |
| Series 2019, 2.836% 1/15/50 (b) | | 779,000 | 765,318 |
| 1.884% 7/15/50 (b) | | 300,000 | 282,132 |
| 2.328% 7/15/52 (b) | | 229,000 | 205,597 |
| Sbna Auto Lease Trust Series 2024-B Class A3, 5.56% 11/22/27 (b) | | 1,200,000 | 1,203,047 |
| Sfs Auto Receivables Securitiz Series 2023-1A Class A2A, 5.89% 3/22/27 (b) | | 587,960 | 588,498 |
| Sfs Auto Receivables Securitization Trust Series 2024-2A Class A3, 5.33% 11/20/29 (b) | | 840,000 | 842,247 |
| Subway Funding LLC Issuer Series 2024-1A: | | | |
| Class A23, 6.505% 7/30/54 (b) | | 2,103,000 | 2,143,359 |
| Class A2I, 6.028% 7/30/54 (b) | | 4,033,000 | 4,068,579 |
| Class A2II, 6.268% 7/30/54 (b) | | 2,398,000 | 2,430,292 |
| SYMP Series 2022-32A Class A1, CME Term SOFR 3 Month Index + 1.320% 6.6464% 4/23/35 (b)(c)(d) | | 4,851,802 | 4,860,555 |
| Symphony Clo 43 Ltd. Series 2024-43A Class A1, CME Term SOFR 3 Month Index + 1.520% 6.8465% 4/15/37 (b)(c)(d) | | 1,901,000 | 1,910,712 |
| Symphony CLO Ltd. Series 2020-22A Class A1A, CME Term SOFR 3 Month Index + 1.550% 6.8785% 4/18/33 (b)(c)(d) | | 2,000,000 | 2,003,342 |
| Symphony CLO XIX, Ltd. / Symphony CLO XIX LLC Series 2018-19A Class A, CME Term SOFR 3 Month Index + 1.220% 6.5493% 4/16/31 (b)(c)(d) | | 5,483,347 | 5,484,427 |
| Symphony CLO XXV Ltd. / Symphony CLO XXV LLC Series 2021-25A Class A, CME Term SOFR 3 Month Index + 1.240% 6.5682% 4/19/34 (b)(c)(d) | | 947,359 | 948,332 |
| Symphony CLO XXVI Ltd. / Symphony CLO XXVI LLC Series 2021-26A Class AR, CME Term SOFR 3 Month Index + 1.340% 6.6662% 4/20/33 (b)(c)(d) | | 875,909 | 876,685 |
| Terwin Mortgage Trust Series 2003-4HE Class A1, CME Term SOFR 1 Month Index + 0.970% 6.3197% 9/25/34 (c)(d) | | 849 | 854 |
| Tesla Series 2024-A Class A2A, 5.37% 6/22/26 (b) | | 601,000 | 599,746 |
| Tesla Auto Lease Trust 2023-B Series 2023-B Class A3, 6.13% 9/21/26 (b) | | 1,200,000 | 1,206,579 |
| Tesla Auto Lease Trust 23-A Series 2023-A Class A3, 5.89% 6/22/26 (b) | | 1,400,000 | 1,402,994 |
| Thunderbolt Aircraft Lease Ltd. Series 2018-A Class A, 4.147% 9/15/38 (b)(c) | | 534,622 | 483,678 |
| Thunderbolt III Aircraft Lease Ltd. Series 2019-1 Class A, 3.671% 11/15/39 (b) | | 661,403 | 578,747 |
| Toyota Auto Receivables Owner Trust Series 2022-C Class A3, 3.76% 4/15/27 | | 3,256,000 | 3,209,114 |
| Toyota Lease Owner Trust: | | | |
| Series 2023 A Class A3, 4.93% 4/20/26 (b) | | 1,485,000 | 1,478,693 |
| Series 2024-A Class A3, 5.25% 4/20/27 (b) | | 1,490,000 | 1,489,792 |
| Upstart Securitization Trust Series 2022-1 Class A, 3.12% 3/20/32 (b) | | 35,423 | 35,256 |
| Vcat 2021-Npl5 LLC Series 2021-NPL5 Class A1, 1.8677% 8/25/51 (b)(c) | | 464,668 | 457,479 |
| Volkswagen Auto Lease Trust 2024- Series 2024-A Class A3, 5.21% 6/21/27 | | 950,000 | 948,959 |
| Voya Clo 2023-1 Ltd. Series 2023-1A Class A1, CME Term SOFR 3 Month Index + 1.800% 7.1702% 1/20/37 (b)(c)(d) | | 2,577,000 | 2,604,960 |
| Voya Clo Ltd. Series 2024-1A Class A1, CME Term SOFR 3 Month Index + 1.520% 6.8461% 4/15/37 (b)(c)(d) | | 900,000 | 900,527 |
| Voya CLO Ltd./Voya CLO LLC: | | | |
| Series 2021-2A Class A1R, CME Term SOFR 3 Month Index + 1.420% 6.7482% 7/19/34 (b)(c)(d) | | 522,906 | 523,148 |
| Series 2021-3A Class AR, CME Term SOFR 3 Month Index + 1.410% 6.7362% 10/20/34 (b)(c)(d) | | 1,070,174 | 1,070,490 |
| Voya CLO, Ltd. Series 2021-1A Class AR, CME Term SOFR 3 Month Index + 1.410% 6.7393% 7/16/34 (b)(c)(d) | | 882,055 | 883,599 |
| Wheels Fleet Lease Funding 1 L Series 2023-2A Class A, 6.46% 8/18/38 (b) | | 2,300,000 | 2,318,229 |
| Willis Engine Structured Trust Vi Series 2023-A Class A, 8% 10/15/48 (b) | | 1,143,459 | 1,207,870 |
| World Omni Auto Receivables Trust: | | | |
| Series 2023 B Class A3, 4.66% 5/15/28 | | 1,572,000 | 1,556,301 |
| Series 2023-C Class A3, 5.15% 11/15/28 | | 762,000 | 759,417 |
| World Omni Automobile Lease Series 2023-A Class A2A, 5.47% 11/17/25 | | 724,849 | 724,584 |
| TOTAL ASSET-BACKED SECURITIES (Cost $248,523,982) | | | 251,584,008 |
| | | | |
| Collateralized Mortgage Obligations - 1.4% |
| | | Principal Amount (a) | Value ($) |
| Private Sponsor - 0.5% | | | |
| Binom Securitization Trust 202 Series 2022-RPL1 Class A1, 3% 2/25/61 (b) | | 563,585 | 509,951 |
| BRAVO Residential Funding Trust sequential payer Series 2022-RPL1 Class A1, 2.75% 9/25/61 (b) | | 912,990 | 814,466 |
| Bravo Residential Funding Trust sequential payer Series 2023-RPL1 Class A1, 5% 5/25/63 (b) | | 1,514,850 | 1,485,816 |
| CFMT Series 2022-HB10 Class A, 3.25% 11/25/35 (b) | | 319,601 | 314,157 |
| Cfmt LLC floater sequential payer Series 2024-HB13 Class A, 3% 5/25/34 (b)(c) | | 861,726 | 825,385 |
| CFMT LLC sequential payer Series 2022-HB8 Class A, 3.75% 4/25/25 (b) | | 1,416,950 | 1,396,546 |
| Finance of America HECM Buyout sequential payer Series 2022-HB1 Class A, 2.6948% 2/25/32 (b)(c) | | 396,619 | 387,808 |
| Gs Mtg-Backed Securities Trust 2024-Rpl Series 2024-RPL2 Class A1, 3.75% 7/25/61 (b) | | 388,155 | 368,674 |
| MFA Trust sequential payer Series 2022-RPL1 Class A1, 3.3% 8/25/61 (b) | | 2,822,000 | 2,590,441 |
| NYMT Loan Trust sequential payer Series 2021-CP1 Class A1, 2.0424% 7/25/61 (b) | | 302,813 | 273,396 |
| Nymt Loan Trust 2024-Cp1 sequential payer Series 2024-CP1 Class A1, 3.75% 2/25/68 (b) | | 482,601 | 441,599 |
| Ocwen Ln Investment Trust 2023-Hb1 Series 2023-HB1 Class A, 3% 6/25/36 (b) | | 238,452 | 230,040 |
| Ocwen Loan Invest Trust Series 2024-HB1 Class A, 3% 2/25/37 (b) | | 196,132 | 187,493 |
| Prpm 2024-Rcf3 LLC Series 2024-RCF3 Class A1, 4% 5/25/54 (b) | | 953,680 | 911,780 |
| Prpm 2024-Rpl2 LLC Series 2024-RPL2 Class A1, 3.5% 5/25/54 (b)(c) | | 989,396 | 936,461 |
| RMF Buyout Issuance Trust sequential payer Series 2022-HB1 Class A, 4.272% 4/25/32 (b) | | 9,806 | 9,763 |
| Towd Point Mortgage Trust: | | | |
| sequential payer Series 2022-K147 Class A2, 3.75% 7/25/62 (b) | | 2,981,888 | 2,756,135 |
| Series 2020-1 Class A1, 2.71% 1/25/60 (b) | | 1,448,297 | 1,353,022 |
TOTAL PRIVATE SPONSOR | | | 15,792,933 |
| U.S. Government Agency - 0.9% | | | |
| Fannie Mae: | | | |
| planned amortization class: | | | |
Series 1999-57 Class PH, 6.5% 12/25/29 | | 5,294 | 5,302 |
Series 2021-45 Class DA, 3% 7/25/51 | | 473,947 | 412,378 |
Series 2022-2 Class TH, 2.5% 2/25/52 | | 155,160 | 137,854 |
Series 2022-20 Class HC, 2.5% 4/25/52 | | 1,868,926 | 1,654,398 |
| sequential payer: | | | |
Series 2020-101 Class BA, 1.5% 9/25/45 | | 529,734 | 449,158 |
Series 2020-43 Class MA, 2% 1/25/45 | | 836,950 | 750,180 |
Series 2020-49 Class JA, 2% 8/25/44 | | 72,533 | 65,469 |
Series 2020-51 Class BA, 2% 6/25/46 | | 759,890 | 647,511 |
Series 2020-80 Class BA, 1.5% 3/25/45 | | 687,467 | 585,947 |
Series 2021-68 Class A, 2% 7/25/49 | | 152,783 | 118,742 |
Series 2021-85 Class L, 2.5% 8/25/48 | | 83,344 | 71,716 |
Series 2021-95: | | | |
Class 0, 2.5% 9/25/48 | | 621,681 | 536,494 |
Class BA, 2.5% 6/25/49 | | 944,144 | 811,970 |
Series 2021-96: | | | |
Class AH, 2.5% 3/25/49 | | 1,345,114 | 1,171,373 |
Class HA, 2.5% 2/25/50 | | 133,836 | 114,985 |
Series 2022-1 Class KA, 3% 5/25/48 | | 316,631 | 282,767 |
Series 2022-11 Class B, 3% 6/25/49 | | 379,510 | 341,887 |
Series 2022-13: | | | |
Class HA, 3% 8/25/46 | | 502,578 | 458,821 |
Class MA, 3% 5/25/44 | | 1,287,165 | 1,192,708 |
Series 2022-25 Class AB, 4% 9/25/47 | | 478,943 | 457,579 |
Series 2022-3: | | | |
Class D, 2% 2/25/48 | | 867,686 | 756,154 |
Class N, 2% 10/25/47 | | 2,570,945 | 2,205,756 |
Series 2022-30 Class E, 4.5% 7/25/48 | | 914,432 | 881,439 |
Series 2022-4 Class B, 2.5% 5/25/49 | | 97,689 | 84,166 |
Series 2022-42 Class BA, 4% 6/25/50 | | 1,000,566 | 946,137 |
Series 2022-49 Class TC, 4% 12/25/48 | | 288,979 | 273,281 |
Series 2022-5: | | | |
Class 0, 2.5% 6/25/48 | | 373,154 | 325,772 |
Class BA, 2.5% 12/25/49 | | 360,334 | 304,258 |
Class DA, 2.25% 11/25/47 | | 1,052,912 | 919,425 |
Series 2022-7: | | | |
Class A, 3% 5/25/48 | | 451,200 | 402,953 |
Class E, 2.5% 11/25/47 | | 908,841 | 803,755 |
| Series 2020-45 Class JL, 3% 7/25/40 | | 30,605 | 27,270 |
| Series 2021-21 Class HG, 2% 11/25/47 | | 308,449 | 266,908 |
| Series 2021-59 Class H, 2% 6/25/48 | | 86,081 | 68,772 |
| Series 2021-66: | | | |
Class DA, 2% 1/25/48 | | 92,196 | 74,040 |
Class DM, 2% 1/25/48 | | 97,979 | 78,684 |
| Freddie Mac: | | | |
| sequential payer: | | | |
Series 2020-4993 Class LA, 2% 8/25/44 | | 796,194 | 719,139 |
Series 2020-5018: | | | |
Class LC, 3% 10/25/40 | | 206,588 | 184,525 |
Class LY, 3% 10/25/40 | | 157,089 | 140,279 |
Series 2021-5169 Class TP, 2.5% 6/25/49 | | 269,181 | 231,231 |
Series 2021-5175 Class CB, 2.5% 4/25/50 | | 483,131 | 414,111 |
Series 2021-5180 Class KA, 2.5% 10/25/47 | | 96,008 | 84,554 |
Series 2022-5189: | | | |
Class DA, 2.5% 5/25/49 | | 248,422 | 210,965 |
Class TP, 2.5% 5/25/49 | | 224,603 | 193,851 |
Series 2022-5190: | | | |
Class BA, 2.5% 11/25/47 | | 234,025 | 205,885 |
Class CA, 2.5% 5/25/49 | | 188,028 | 162,257 |
Series 2022-5191 Class CA, 2.5% 4/25/50 | | 113,052 | 96,293 |
Series 2022-5197: | | | |
Class A, 2.5% 6/25/49 | | 188,028 | 162,257 |
Class DA, 2.5% 11/25/47 | | 177,667 | 156,499 |
Series 2022-5198 Class BA, 2.5% 11/25/47 | | 869,327 | 768,132 |
Series 2022-5202: | | | |
Class AG, 3% 1/25/49 | | 140,040 | 125,156 |
Class LB, 2.5% 10/25/47 | | 190,279 | 166,139 |
Class UA, 3% 4/25/50 | | 325,580 | 290,154 |
| Series 2020-5041 Class LB, 3% 11/25/40 | | 352,089 | 314,706 |
| Series 2021-5083 Class VA, 1% 8/15/38 | | 940,638 | 877,380 |
| Series 2021-5176 Class AG, 2% 1/25/47 | | 361,972 | 308,221 |
| Series 2021-5182 Class A, 2.5% 10/25/48 | | 628,424 | 541,746 |
| Series 2022-5207 Class PA, 3% 6/25/51 | | 3,497,086 | 3,099,977 |
| Series 2022-5210 Class AB, 3% 1/25/42 | | 486,947 | 442,608 |
| Freddie Mac Multi-family Structured pass-thru certificates sequential payer: | | | |
| Series 2021-5159: | | | |
Class EA, 2.5% 8/25/48 | | 265,144 | 228,338 |
Class GC, 2% 11/25/47 | | 76,931 | 66,266 |
| Series 2021-5164 Class M, 2.5% 7/25/48 | | 270,243 | 232,848 |
TOTAL U.S. GOVERNMENT AGENCY | | | 29,109,526 |
| TOTAL COLLATERALIZED MORTGAGE OBLIGATIONS (Cost $45,288,352) | | | 44,902,459 |
| | | | |
| Commercial Mortgage Securities - 5.8% |
| | | Principal Amount (a) | Value ($) |
| Arbor Multifamily Mortgage Securities Trust sequential payer Series 2021-MF2 Class ASB, 2.2446% 6/15/54 (b) | | 600,000 | 534,678 |
| BAMLL Commercial Mortgage Securities Trust: | | | |
| floater Series 2022-DKLX Class A, CME Term SOFR 1 Month Index + 1.150% 6.479% 1/15/39 (b)(c)(d) | | 497,039 | 492,224 |
| sequential payer Series 2019-BPR Class ANM, 3.112% 11/5/32 (b) | | 484,000 | 443,465 |
| Series 2019-BPR Class BNM, 3.465% 11/5/32 (b) | | 109,000 | 93,876 |
| BANK: | | | |
| sequential payer: | | | |
Series 2017-BNK4 Class ASB, 3.419% 5/15/50 | | 343,035 | 334,343 |
Series 2017-BNK9 Class A4, 3.538% 11/15/54 | | 400,000 | 375,806 |
Series 2018-BN10 Class A5, 3.688% 2/15/61 | | 3,248,347 | 3,065,902 |
Series 2018-BN14 Class ASB, 4.185% 9/15/60 | | 313,786 | 305,492 |
Series 2019-BN19 Class ASB, 3.071% 8/15/61 | | 650,000 | 614,289 |
Series 2019-BN21 Class A5, 2.851% 10/17/52 | | 82,630 | 72,464 |
Series 2020-BN25 Class A5, 2.649% 1/15/63 | | 462,410 | 399,798 |
Series 2020-BN26 Class ASB, 2.313% 3/15/63 | | 1,100,000 | 1,010,005 |
Series 2020-BN28 Class A4, 1.844% 3/15/63 | | 1,148,351 | 940,243 |
Series 2021-BN35 Class A5, 2.285% 6/15/64 | | 567,169 | 466,369 |
Series 2022-BNK41 Class A4, 3.9165% 4/15/65 (c) | | 963,521 | 871,651 |
Series 2023-5YR1: | | | |
| Class A2, 5.779% 4/15/56 | | 800,000 | 807,534 |
| Class A3, 6.26% 4/15/56 | | 1,400,000 | 1,433,605 |
| Series 2021-BN33 Class XA, 1.1643% 5/15/64 (c)(h) | | 12,007,805 | 585,648 |
| Bank5 2023-5Yr3 sequential payer Series 2023-5YR3 Class A3, 6.724% 9/15/56 | | 600,000 | 627,445 |
| BBCMS Mortgage Trust sequential payer: | | | |
| Series 2021-C11 Class A5, 2.322% 9/15/54 | | 722,307 | 596,767 |
| Series 2023-C21 Class A3, 6.5063% 9/15/56 (c) | | 1,422,000 | 1,496,663 |
| Benchmark 2023-V3 Mtg Trust: | | | |
| sequential payer Series 2023-V3 Class A3, 6.3629% 7/15/56 | | 400,000 | 412,919 |
| Series 2023-V3 Class XA, 1.0533% 7/15/56 (c) | | 31,987,946 | 921,538 |
| Benchmark Mortgage Trust: | | | |
| sequential payer: | | | |
Series 2018-B4 Class A5, 4.121% 7/15/51 | | 172,167 | 163,967 |
Series 2019-B10: | | | |
| Class A4, 3.717% 3/15/62 | | 159,609 | 148,574 |
| Class ASB, 3.615% 3/15/62 | | 476,832 | 459,551 |
Series 2019-B9 Class AAB, 3.9325% 3/15/52 | | 902,980 | 876,318 |
Series 2020-B19 Class A5, 1.85% 9/15/53 | | 468,749 | 378,433 |
Series 2021-B24 Class A5, 2.5843% 3/15/54 | | 700,621 | 580,183 |
Series 2021-B28 Class ASB, 1.9804% 8/15/54 | | 1,600,000 | 1,390,913 |
| Series 2018-B8 Class A5, 4.2317% 1/15/52 | | 1,180,306 | 1,108,562 |
| Series 2019-B12 Class A5, 3.1156% 8/15/52 | | 726,144 | 655,293 |
| Series 2019-B9 Class A5, 4.0156% 3/15/52 | | 642,936 | 598,032 |
| BLP Commercial Mortgage Trust sequential payer Series 2024-IND2 Class A, CME Term SOFR 1 Month Index + 1.340% 6.671% 3/15/41 (b)(c)(d) | | 1,311,000 | 1,301,168 |
| BMO Mortgage Trust: | | | |
| sequential payer Series 2023-5C1 Class A3, 6.534% 8/15/56 | | 1,700,000 | 1,761,431 |
| Series 2023-C6 Class XA, 0.9823% 9/15/56 (c)(h) | | 13,475,021 | 753,120 |
| BMP floater Series 2024-MF23: | | | |
| Class A, CME Term SOFR 1 Month Index + 1.370% 6.7008% 6/15/41 (b)(c)(d) | | 1,792,000 | 1,779,680 |
| Class B, CME Term SOFR 1 Month Index + 1.640% 6.9704% 6/15/41 (b)(c)(d) | | 885,000 | 879,476 |
| Class C, CME Term SOFR 1 Month Index + 1.840% 7.1701% 6/15/41 (b)(c)(d) | | 626,000 | 621,302 |
| BPR Trust floater Series 2022-OANA: | | | |
| Class A, CME Term SOFR 1 Month Index + 1.890% 7.2268% 4/15/37 (b)(c)(d) | | 2,835,445 | 2,835,444 |
| Class B, CME Term SOFR 1 Month Index + 2.440% 7.7758% 4/15/37 (b)(c)(d) | | 841,247 | 841,247 |
| BX Commercial Mortgage Trust: | | | |
| floater: | | | |
Series 2019-IMC: | | | |
| Class B, CME Term SOFR 1 Month Index + 1.340% 6.6753% 4/15/34 (b)(c)(d) | | 412,398 | 404,672 |
| Class C, CME Term SOFR 1 Month Index + 1.640% 6.9753% 4/15/34 (b)(c)(d) | | 272,629 | 265,819 |
| Class D, CME Term SOFR 1 Month Index + 1.940% 7.2753% 4/15/34 (b)(c)(d) | | 286,192 | 278,329 |
Series 2021-BXMF Class A, CME Term SOFR 1 Month Index + 0.750% 6.0794% 10/15/26 (b)(c)(d) | | 2,238,295 | 2,208,935 |
Series 2021-LBA Class AJV, CME Term SOFR 1 Month Index + 0.910% 6.2435% 2/15/36 (b)(c)(d) | | 200,000 | 197,438 |
Series 2021-PAC: | | | |
| Class A, CME Term SOFR 1 Month Index + 0.800% 6.1326% 10/15/36 (b)(c)(d) | | 1,109,960 | 1,095,788 |
| Class B, CME Term SOFR 1 Month Index + 1.010% 6.3423% 10/15/36 (b)(c)(d) | | 162,246 | 159,517 |
| Class C, CME Term SOFR 1 Month Index + 1.210% 6.5421% 10/15/36 (b)(c)(d) | | 217,124 | 212,999 |
| Class D, CME Term SOFR 1 Month Index + 1.410% 6.7418% 10/15/36 (b)(c)(d) | | 210,720 | 205,142 |
| Class E, CME Term SOFR 1 Month Index + 2.060% 7.391% 10/15/36 (b)(c)(d) | | 732,746 | 714,489 |
Series 2022-IND Class A, CME Term SOFR 1 Month Index + 1.490% 6.8198% 4/15/37 (b)(c)(d) | | 774,214 | 772,042 |
Series 2022-LP2: | | | |
| Class A, CME Term SOFR 1 Month Index + 1.010% 6.3417% 2/15/39 (b)(c)(d) | | 984,851 | 973,776 |
| Class B, CME Term SOFR 1 Month Index + 1.310% 6.6411% 2/15/39 (b)(c)(d) | | 350,914 | 346,310 |
| Class C, CME Term SOFR 1 Month Index + 1.560% 6.8905% 2/15/39 (b)(c)(d) | | 350,914 | 346,091 |
| Class D, CME Term SOFR 1 Month Index + 1.960% 7.2896% 2/15/39 (b)(c)(d) | | 350,914 | 345,652 |
Series 2023-XL3: | | | |
| Class A, CME Term SOFR 1 Month Index + 1.760% 7.0903% 12/9/40 (b)(c)(d) | | 2,021,000 | 2,022,258 |
| Class B, CME Term SOFR 1 Month Index + 2.190% 7.5197% 12/9/40 (b)(c)(d) | | 447,000 | 447,696 |
| Class C, CME Term SOFR 1 Month Index + 2.640% 7.969% 12/9/40 (b)(c)(d) | | 242,000 | 242,377 |
| floater sequential payer: | | | |
Series 2019-IMC Class A, CME Term SOFR 1 Month Index + 1.040% 6.3753% 4/15/34 (b)(c)(d) | | 562,789 | 556,464 |
Series 2021-SOAR Class A, CME Term SOFR 1 Month Index + 0.780% 6.1135% 6/15/38 (b)(c)(d) | | 230,582 | 227,995 |
Series 2024-XL5 Class A, CME Term SOFR 1 Month Index + 1.390% 6.7205% 3/15/41 (b)(c)(d) | | 6,758,909 | 6,720,890 |
| BX Commercial Mortgage Trust 2024-Xl4: | | | |
| floater: | | | |
Series 2024-XL4 Class B, CME Term SOFR 1 Month Index + 1.790% 7.1083% 2/15/39 (b)(c)(d) | | 383,148 | 380,514 |
Series 2024-XL5: | | | |
| Class B, CME Term SOFR 1 Month Index + 1.690% 7.0201% 3/15/41 (b)(c)(d) | | 1,154,615 | 1,147,054 |
| Class C, CME Term SOFR 1 Month Index + 1.940% 7.2697% 3/15/41 (b)(c)(d) | | 1,533,413 | 1,520,025 |
| floater sequential payer Series 2024-XL4 Class A, CME Term SOFR 1 Month Index + 1.440% 6.7709% 2/15/39 (b)(c)(d) | | 3,020,863 | 3,010,479 |
| BX Commercial Mtg Trust floater Series 2024-MDHS Class A, 6.9913% 5/15/41 (b)(c) | | 3,906,000 | 3,896,229 |
| BX Trust floater: | | | |
| Series 2022-GPA Class A, CME Term SOFR 1 Month Index + 2.160% 7.4938% 8/15/39 (b)(c)(d) | | 1,900,901 | 1,901,490 |
| Series 2022-IND: | | | |
Class B, CME Term SOFR 1 Month Index + 1.940% 7.2688% 4/15/37 (b)(c)(d) | | 394,689 | 392,963 |
Class C, CME Term SOFR 1 Month Index + 2.290% 7.6188% 4/15/37 (b)(c)(d) | | 89,111 | 88,804 |
Class D, CME Term SOFR 1 Month Index + 2.830% 8.1678% 4/15/37 (b)(c)(d) | | 74,617 | 74,360 |
| Series 2024-CNYN: | | | |
Class A, CME Term SOFR 1 Month Index + 1.440% 6.7707% 4/15/29 (b)(c)(d) | | 4,464,142 | 4,466,888 |
Class B, CME Term SOFR 1 Month Index + 1.690% 7.0204% 4/15/29 (b)(c)(d) | | 711,401 | 706,952 |
Class C, CME Term SOFR 1 Month Index + 1.940% 7.27% 4/15/29 (b)(c)(d) | | 590,185 | 587,232 |
| CAMB Commercial Mortgage Trust floater Series 2019-LIFE: | | | |
| Class A, CME Term SOFR 1 Month Index + 1.360% 6.696% 12/15/37 (b)(c)(d) | | 2,145,000 | 2,147,323 |
| Class E, CME Term SOFR 1 Month Index + 2.440% 7.776% 12/15/37 (b)(c)(d) | | 520,000 | 519,026 |
| CF Hippolyta Issuer LLC sequential payer Series 2021-1A Class A1, 1.53% 3/15/61 (b) | | 1,194,866 | 1,094,438 |
| CFCRE Commercial Mortgage Trust sequential payer: | | | |
| Series 2016-C7 Class A2, 3.5853% 12/10/54 | | 527,861 | 502,266 |
| Series 2017-C8 Class A3, 3.3048% 6/15/50 | | 1,960,100 | 1,849,655 |
| Citigroup Commercial Mortgage Trust sequential payer: | | | |
| Series 2014-GC25 Class A4, 3.635% 10/10/47 | | 825,999 | 822,388 |
| Series 2015-GC29 Class A4, 3.192% 4/10/48 | | 311,943 | 305,226 |
| Series 2015-P1 Class A5, 3.717% 9/15/48 | | 160,809 | 156,780 |
| Series 2016-C1 Class A4, 3.209% 5/10/49 | | 508,851 | 486,604 |
| Series 2016-P4 Class A4, 2.902% 7/10/49 | | 589,456 | 557,321 |
| Series 2018-B2 Class A4, 4.009% 3/10/51 | | 400,000 | 379,512 |
| Series 2019-C7 Class A4, 3.102% 12/15/72 | | 2,911,044 | 2,611,593 |
| Series 2020-GC46 Class AAB, 2.614% 2/15/53 | | 500,000 | 463,827 |
| COMM Mortgage Trust: | | | |
| sequential payer Series 2015-DC1 Class A4, 3.078% 2/10/48 | | 1,849,245 | 1,836,111 |
| Series 2015-CR22 Class A5, 3.309% 3/10/48 | | 532,572 | 521,804 |
| Computershare Corporate Trust Series 2018-C48 Class A5, 4.302% 1/15/52 | | 1,284,202 | 1,228,437 |
| Credit Suisse Mortgage Trust sequential payer Series 2020-NET Class A, 2.2569% 8/15/37 (b) | | 218,197 | 206,385 |
| CSAIL Commercial Mortgage Trust sequential payer: | | | |
| Series 2015-C3 Class A4, 3.7182% 8/15/48 | | 344,472 | 335,308 |
| Series 2019-C17: | | | |
Class A4, 2.7628% 9/15/52 | | 516,958 | 461,255 |
Class A5, 3.0161% 9/15/52 | | 516,958 | 456,589 |
| DTP Commercial Mortgage Trust 2023-Ste2 sequential payer Series 2023-STE2 Class A, 6.038% 1/15/41 (b)(c) | | 605,000 | 605,597 |
| ELP Commercial Mortgage Trust floater Series 2021-ELP Class A, CME Term SOFR 1 Month Index + 0.810% 6.1445% 11/15/38 (b)(c)(d) | | 2,964,315 | 2,929,133 |
| Extended Stay America Trust floater Series 2021-ESH: | | | |
| Class A, CME Term SOFR 1 Month Index + 1.190% 6.5235% 7/15/38 (b)(c)(d) | | 612,761 | 610,463 |
| Class B, CME Term SOFR 1 Month Index + 1.490% 6.8235% 7/15/38 (b)(c)(d) | | 1,464,272 | 1,458,346 |
| Class C, CME Term SOFR 1 Month Index + 1.810% 7.1435% 7/15/38 (b)(c)(d) | | 188,821 | 188,351 |
| Class D, CME Term SOFR 1 Month Index + 2.360% 7.6935% 7/15/38 (b)(c)(d) | | 10,505,906 | 10,499,354 |
| Freddie Mac: | | | |
| sequential payer: | | | |
Series 2015-K043 Class A2, 3.062% 12/25/24 | | 1,869,987 | 1,846,656 |
Series 2015-K049 Class A2, 3.01% 7/25/25 | | 261,871 | 255,676 |
Series 2016-K054 Class A2, 2.745% 1/25/26 | | 1,287,022 | 1,241,443 |
Series 2016-K055 Class A2, 2.673% 3/25/26 | | 2,700,000 | 2,593,715 |
Series 2016-K057 Class A2, 2.57% 7/25/26 | | 437,441 | 417,713 |
Series 2020-K104 Class A2, 2.253% 1/25/30 | | 2,053,820 | 1,811,105 |
Series 2020-K116 Class A2, 1.378% 7/25/30 | | 1,745,881 | 1,441,334 |
Series 2020-K117 Class A2, 1.406% 8/25/30 | | 890,789 | 734,779 |
Series 2020-K118 Class A2, 1.493% 9/25/30 | | 423,042 | 349,929 |
Series 2020-K121 Class A2, 1.547% 10/25/30 | | 593,860 | 491,233 |
Series 2021-K125 Class A2, 1.846% 1/25/31 | | 230,204 | 193,001 |
Series 2021-K126 Class A2, 2.074% 1/25/31 | | 327,624 | 278,858 |
Series 2021-K130 Class A2, 1.723% 6/25/31 | | 281,917 | 232,291 |
Series 2021-K136 Class A2, 2.127% 11/25/31 | | 771,017 | 646,181 |
Series 2023-K751 Class A2, 4.412% 3/25/30 | | 400,000 | 392,557 |
Series 2024-K517 Class A2, 5.355% 1/25/29 | | 3,200,000 | 3,260,434 |
Series K058 Class A2, 2.653% 8/25/26 | | 2,100,000 | 2,000,144 |
Series K080 Class A2, 3.926% 7/25/28 | | 454,836 | 439,534 |
| Series 2017-K064 Class A2, 3.224% 3/25/27 | | 472,919 | 452,756 |
| Series 2017-K068 Class A2, 3.244% 8/25/27 | | 652,712 | 621,914 |
| Series 2017-K727 Class A2, 2.946% 7/25/24 | | 823,009 | 819,833 |
| Series 2018-K730 Class A2, 3.59% 1/25/25 | | 1,001,120 | 990,371 |
| Series 2019-K094 Class A2, 2.903% 6/25/29 | | 1,410,116 | 1,296,906 |
| Series 2019-K1510 Class A2, 3.718% 1/25/31 | | 407,161 | 382,711 |
| Series 2021-K123 Class A2, 1.621% 12/25/30 | | 781,693 | 648,249 |
| Series K046 Class A2, 3.205% 3/25/25 | | 908,339 | 893,344 |
| Series K047 Class A2, 3.329% 5/25/25 | | 2,190,572 | 2,150,938 |
| Series K053 Class A2, 2.995% 12/25/25 | | 194,973 | 189,074 |
| Series K056 Class A2, 2.525% 5/25/26 | | 568,904 | 543,629 |
| Series K062 Class A1, 3.032% 9/25/26 | | 136,282 | 133,491 |
| Series K063 Class A2, 3.43% 1/25/27 | | 2,600,000 | 2,505,460 |
| Series K079 Class A2, 3.926% 6/25/28 | | 213,322 | 206,214 |
| Freddie Mac Multi-family Structured pass-thru certificates: | | | |
| sequential payer Series 2015 K045 Class A2, 3.023% 1/25/25 | | 1,328,205 | 1,307,881 |
| Series K044 Class A2, 2.811% 1/25/25 | | 2,724,707 | 2,683,436 |
| GS Mortgage Securities Trust: | | | |
| floater: | | | |
Series 2018-3PCK Class A, CME Term SOFR 1 Month Index + 2.060% 7.3935% 9/15/31 (b)(c)(d) | | 249,124 | 247,966 |
Series 2021-IP: | | | |
| Class A, CME Term SOFR 1 Month Index + 1.060% 6.3935% 10/15/36 (b)(c)(d) | | 1,961,563 | 1,937,043 |
| Class B, CME Term SOFR 1 Month Index + 1.260% 6.5935% 10/15/36 (b)(c)(d) | | 450,000 | 439,594 |
| Class C, CME Term SOFR 1 Month Index + 1.660% 6.9935% 10/15/36 (b)(c)(d) | | 2,451,000 | 2,366,747 |
| sequential payer: | | | |
Series 2014-GC26 Class A4, 3.364% 11/10/47 | | 303,597 | 302,491 |
Series 2018-GS10 Class A4, 3.89% 7/10/51 | | 3,800,000 | 3,600,802 |
Series 2018-GS9 Class A4, 3.992% 3/10/51 | | 400,000 | 371,284 |
Series 2020-GC45 Class A5, 2.9106% 2/13/53 | | 1,245,771 | 1,098,587 |
| Intown Mortgage Trust floater sequential payer Series 2022-STAY Class A, CME Term SOFR 1 Month Index + 2.480% 7.8176% 8/15/39 (b)(c)(d) | | 4,070,000 | 4,077,606 |
| J.P. Morgan Chase Commercial Mortgage Securities Trust floater Series 2012-NLP Class A, CME Term SOFR 1 Month Index + 0.590% 5.9253% 4/15/37 (b)(c)(d) | | 318,267 | 303,553 |
| JPMBB Commercial Mortgage Securities Trust sequential payer: | | | |
| Series 2014-C23 Class A5, 3.9342% 9/15/47 | | 176,527 | 175,737 |
| Series 2014-C24 Class A5, 3.6385% 11/15/47 | | 714,600 | 708,510 |
| Series 2015-C29 Class A4, 3.6108% 5/15/48 | | 246,754 | 241,746 |
| JPMCC Commercial Mortgage Securities Trust Series 2016-JP4 Class ASB, 3.4743% 12/15/49 | | 399,858 | 389,825 |
| JPMorgan Chase Commercial Mortgage Securities Trust Series 2018-WPT Class DFX, 5.3503% 7/5/33 (b) | | 158,353 | 118,767 |
| Ksl Commercial Mtg Trust 2023-Ht floater Series 2023-HT Class A, CME Term SOFR 1 Month Index + 2.290% 7.619% 12/15/36 (b)(c)(d) | | 2,900,000 | 2,907,250 |
| Life Financial Services Trust floater Series 2022-BMR2: | | | |
| Class A1, CME Term SOFR 1 Month Index + 1.290% 6.6241% 5/15/39 (b)(c)(d) | | 2,976,439 | 2,923,421 |
| Class B, CME Term SOFR 1 Month Index + 1.790% 7.1228% 5/15/39 (b)(c)(d) | | 899,162 | 875,565 |
| Class C, CME Term SOFR 1 Month Index + 2.090% 7.422% 5/15/39 (b)(c)(d) | | 511,349 | 496,332 |
| Class D, CME Term SOFR 1 Month Index + 2.540% 7.8708% 5/15/39 (b)(c)(d) | | 454,472 | 432,228 |
| LIFE Mortgage Trust floater Series 2021-BMR: | | | |
| Class A, CME Term SOFR 1 Month Index + 0.810% 6.1435% 3/15/38 (b)(c)(d) | | 675,307 | 663,082 |
| Class B, CME Term SOFR 1 Month Index + 0.990% 6.3235% 3/15/38 (b)(c)(d) | | 217,253 | 212,099 |
| Class C, CME Term SOFR 1 Month Index + 1.210% 6.5435% 3/15/38 (b)(c)(d) | | 136,648 | 133,065 |
| Class D, CME Term SOFR 1 Month Index + 1.510% 6.8435% 3/15/38 (b)(c)(d) | | 190,097 | 184,638 |
| Class E, CME Term SOFR 1 Month Index + 1.860% 7.1935% 3/15/38 (b)(c)(d) | | 166,149 | 159,719 |
| Morgan Stanley BAML Trust Series 2015-C20 Class A4, 3.249% 2/15/48 | | 403,691 | 398,496 |
| Morgan Stanley Capital sequential payer Series 2016-UB11 Class A4, 2.782% 8/15/49 | | 1,200,000 | 1,127,128 |
| Morgan Stanley Capital I Trust: | | | |
| sequential payer: | | | |
Series 2017-H1 Class A4, 3.259% 6/15/50 | | 1,500,000 | 1,422,327 |
Series 2019-L2 Class A3, 3.806% 3/15/52 | | 1,000,000 | 937,638 |
Series 2019-MEAD Class A, 3.17% 11/10/36 (b) | | 1,052,468 | 1,003,305 |
Series 2020-L4 Class A3, 2.698% 2/15/53 | | 487,766 | 424,606 |
| Series 2018-H4 Class A4, 4.31% 12/15/51 | | 1,275,945 | 1,220,919 |
| Series 2019-MEAD: | | | |
Class B, 3.283% 11/10/36 (b)(c) | | 152,075 | 143,451 |
Class C, 3.283% 11/10/36 (b)(c) | | 145,921 | 135,457 |
| Natixis Commercial Mortgage Securities Trust sequential payer Series 2020-2PAC Class A, 2.966% 12/15/38 (b) | | 531,500 | 486,922 |
| Open Trust 2023-Air sequential payer Series 2023-AIR: | | | |
| Class A, CME Term SOFR 1 Month Index + 3.080% 8.4179% 10/15/28 (b)(c)(d) | | 1,632,374 | 1,650,739 |
| Class B, CME Term SOFR 1 Month Index + 3.830% 9.1548% 10/15/28 (b)(c)(d) | | 983,217 | 985,675 |
| OPG Trust floater Series 2021-PORT Class A, CME Term SOFR 1 Month Index + 0.590% 5.9275% 10/15/36 (b)(c)(d) | | 1,373,753 | 1,350,585 |
| Providence Place Group Ltd. Partnership Series 2000-C1 Class A2, 7.75% 7/20/28 (b) | | 231,728 | 234,695 |
| SPGN Mortgage Trust floater Series 2022-TFLM: | | | |
| Class B, CME Term SOFR 1 Month Index + 2.000% 7.3288% 2/15/39 (b)(c)(d) | | 263,000 | 258,034 |
| Class C, CME Term SOFR 1 Month Index + 2.650% 7.9788% 2/15/39 (b)(c)(d) | | 137,000 | 133,125 |
| SREIT Trust floater: | | | |
| Series 2021-FLWR Class A, CME Term SOFR 1 Month Index + 0.690% 6.02% 7/15/36 (b)(c)(d) | | 813,932 | 803,258 |
| Series 2021-MFP: | | | |
Class A, CME Term SOFR 1 Month Index + 0.840% 6.1741% 11/15/38 (b)(c)(d) | | 2,240,402 | 2,219,410 |
Class B, CME Term SOFR 1 Month Index + 1.190% 6.5231% 11/15/38 (b)(c)(d) | | 1,694,882 | 1,669,473 |
Class C, CME Term SOFR 1 Month Index + 1.440% 6.7723% 11/15/38 (b)(c)(d) | | 344,260 | 339,099 |
Class D, CME Term SOFR 1 Month Index + 1.690% 7.0215% 11/15/38 (b)(c)(d) | | 226,263 | 222,871 |
| VLS Commercial Mortgage Trust sequential payer Series 2020-LAB Class A, 2.13% 10/10/42 (b) | | 1,123,328 | 900,606 |
| Wells Fargo Commercial Mortgage Trust: | | | |
| floater Series 2021-FCMT Class A, CME Term SOFR 1 Month Index + 1.310% 6.6435% 5/15/31 (b)(c)(d) | | 552,000 | 537,913 |
| sequential payer: | | | |
Series 2015-C26 Class A4, 3.166% 2/15/48 | | 720,434 | 710,000 |
Series 2019-C52 Class A5, 2.892% 8/15/52 | | 887,720 | 786,272 |
Series 2019-C54 Class A4, 3.146% 12/15/52 | | 63,390 | 56,600 |
| Wells Fargo Commercial Mtg Trust sequential payer Series 2016-C37, Class A4, 3.525% 12/15/49 | | 458,817 | 439,104 |
| Wells Fargo Commercial Mtg Trust 2020-C sequential payer Series 2020-C55: | | | |
| Class A5, 2.725% 2/15/53 | | 438,989 | 384,128 |
| Class ASB, 2.651% 2/15/53 | | 400,000 | 371,669 |
| WF-RBS Commercial Mortgage Trust Series 2014-C25 Class A5, 3.631% 11/15/47 | | 396,151 | 392,228 |
| TOTAL COMMERCIAL MORTGAGE SECURITIES (Cost $186,317,860) | | | 185,752,359 |
| | | | |
| Municipal Securities - 0.0% |
| | | Principal Amount (a) | Value ($) |
| Dallas Fort Worth Int'l. Arpt. Rev.: | | | |
| Series 2019 A, 3.144% 11/1/45 | | 65,000 | 48,412 |
| Series 2021 C, 2.843% 11/1/46 | | 400,000 | 285,579 |
| Series 2022 A, 4.507% 11/1/51 | | 155,000 | 137,571 |
| TOTAL MUNICIPAL SECURITIES (Cost $531,396) | | | 471,562 |
| | | | |
| Foreign Government and Government Agency Obligations - 0.3% |
| | | Principal Amount (a) | Value ($) |
| Alberta Province: | | | |
| 1% 5/20/25 | | 968,000 | 933,142 |
| 3.3% 3/15/28 | | 274,000 | 261,338 |
| British Columbia Province 2.25% 6/2/26 | | 654,000 | 622,673 |
| Kingdom of Saudi Arabia: | | | |
| 3.25% 10/22/30 (b) | | 396,000 | 356,276 |
| 4.5% 4/22/60 (b) | | 301,000 | 243,998 |
| Korea Development Bank 1.625% 1/19/31 | | 367,000 | 299,233 |
| Landwirtschaftliche Rentenbank: | | | |
| 1.75% 7/27/26 | | 233,000 | 219,145 |
| 2.5% 11/15/27 | | 242,000 | 226,150 |
| Ontario Province: | | | |
| 0.625% 1/21/26 | | 70,000 | 65,425 |
| 1.125% 10/7/30 | | 658,000 | 533,763 |
| 2.3% 6/15/26 | | 391,000 | 372,185 |
| 2.5% 4/27/26 | | 137,000 | 131,245 |
| Panamanian Republic: | | | |
| 3.16% 1/23/30 | | 517,000 | 436,090 |
| 4.5% 4/16/50 | | 353,000 | 237,834 |
| 4.5% 4/1/56 | | 547,000 | 354,456 |
| Quebec Province: | | | |
| 1.5% 2/11/25 | | 791,000 | 773,187 |
| 2.5% 4/20/26 | | 322,000 | 309,030 |
| 2.75% 4/12/27 | | 350,000 | 332,413 |
| 2.875% 10/16/24 | | 57,000 | 56,615 |
| United Mexican States: | | | |
| 3.25% 4/16/30 | | 366,000 | 321,623 |
| 3.5% 2/12/34 | | 1,114,000 | 906,239 |
| 4.28% 8/14/41 | | 1,201,000 | 932,577 |
| 4.35% 1/15/47 | | 395,000 | 294,892 |
| 4.5% 1/31/50 | | 254,000 | 191,056 |
| 4.6% 2/10/48 | | 481,000 | 367,484 |
| 4.75% 3/8/44 | | 266,000 | 213,199 |
| 5.55% 1/21/45 | | 107,000 | 96,534 |
| 6.05% 1/11/40 | | 132,000 | 127,875 |
| Uruguay Republic: | | | |
| 4.125% 11/20/45 | | 130,228 | 113,258 |
| 4.375% 10/27/27 | | 33,363 | 33,013 |
| TOTAL FOREIGN GOVERNMENT AND GOVERNMENT AGENCY OBLIGATIONS (Cost $11,324,707) | | | 10,361,948 |
| | | | |
| Supranational Obligations - 0.4% |
| | | Principal Amount (a) | Value ($) |
| African Development Bank 0.875% 7/22/26 | | 419,000 | 386,618 |
| Asian Development Bank: | | | |
| 0.375% 9/3/25 | | 1,103,000 | 1,044,006 |
| 0.5% 2/4/26 | | 611,000 | 569,852 |
| 0.75% 10/8/30 | | 534,000 | 426,757 |
| 1.5% 10/18/24 | | 617,000 | 609,776 |
| 2% 4/24/26 | | 173,000 | 164,428 |
| 2.5% 11/2/27 | | 184,000 | 172,191 |
| 2.625% 1/12/27 | | 178,000 | 169,288 |
| 2.75% 1/19/28 | | 1,032,000 | 970,427 |
| European Investment Bank: | | | |
| 0.75% 9/23/30 | | 762,000 | 611,383 |
| 0.875% 5/17/30 | | 183,000 | 149,465 |
| 1.25% 2/14/31 | | 331,000 | 271,176 |
| 1.875% 2/10/25 | | 82,000 | 80,281 |
| 2.375% 5/24/27 | | 110,000 | 103,424 |
| 2.5% 10/15/24 | | 157,000 | 155,669 |
| Inter-American Development Bank: | | | |
| 0.625% 7/15/25 | | 607,000 | 579,371 |
| 0.875% 4/20/26 | | 1,388,000 | 1,292,910 |
| 1.75% 3/14/25 | | 505,000 | 492,544 |
| 2% 6/2/26 | | 110,000 | 104,237 |
| 2.125% 1/15/25 | | 50,000 | 49,126 |
| 2.25% 6/18/29 | | 524,000 | 472,841 |
| 2.375% 7/7/27 | | 184,000 | 172,440 |
| 4.375% 1/24/44 | | 239,000 | 222,104 |
| International Bank for Reconstruction & Development: | | | |
| 0.375% 7/28/25 | | 717,000 | 681,828 |
| 0.5% 10/28/25 | | 905,000 | 853,029 |
| 0.75% 8/26/30 | | 454,000 | 363,998 |
| 0.875% 5/14/30 | | 555,000 | 452,967 |
| 1.25% 2/10/31 | | 497,000 | 405,646 |
| 1.5% 8/28/24 | | 543,000 | 539,574 |
| 1.625% 1/15/25 | | 488,000 | 478,277 |
| 1.875% 10/27/26 | | 130,000 | 121,955 |
| 2.5% 11/25/24 | | 156,000 | 154,164 |
| 2.5% 7/29/25 | | 104,000 | 101,186 |
| 2.5% 3/29/32 | | 1,000,000 | 873,888 |
| International Finance Corp. 0.75% 8/27/30 | | 303,000 | 243,194 |
| TOTAL SUPRANATIONAL OBLIGATIONS (Cost $15,311,399) | | | 14,540,020 |
| | | | |
| Bank Notes - 0.1% |
| | | Principal Amount (a) | Value ($) |
| Citizens Bank NA: | | | |
| 2.25% 4/28/25 | | 359,000 | 348,669 |
| 3.75% 2/18/26 | | 370,000 | 357,676 |
| Discover Bank: | | | |
| ICE IBA - USD SOFR SPREAD-ADJ + 1.730% 5.974% 8/9/28 (c)(d) | | 347,000 | 346,563 |
| 3.45% 7/27/26 | | 350,000 | 334,269 |
| Regions Bank 6.45% 6/26/37 | | 969,000 | 988,007 |
| Truist Bank 3.3% 5/15/26 | | 208,000 | 199,301 |
| TOTAL BANK NOTES (Cost $2,748,023) | | | 2,574,485 |
| | | | |
| Fixed-Income Funds - 0.5% |
| | | Shares | Value ($) |
Fidelity Specialized High Income Central Fund (g)(i) (Cost $16,270,504) | | 185,891 | 16,042,417 |
| | | | |
| Money Market Funds - 0.8% |
| | | Shares | Value ($) |
Fidelity Cash Central Fund 5.38% (j) (Cost $24,503,050) | | 24,498,150 | 24,503,050 |
| | | | |
| Purchased Swaptions - 0.1% |
| | Expiration Date | Notional Amount (a) | Value ($) |
| Put Options - 0.1% | | | | |
| Option on an interest rate swap with Bank of America N.A. to pay annually a fixed rate of 3.7375% and receive annually a floating rate based on the U.S. Secured Overnight Fin. Rate (SOFR) Index, expiring February 2035. | 2/26/25 | | 5,500,000 | 182,062 |
| Option on an interest rate swap with Bank of America N.A. to pay annually a fixed rate of 3.94% and receive annually a floating rate based on the U.S. Secured Overnight Fin. Rate (SOFR) Index, expiring May 2034. | 5/10/29 | | 5,400,000 | 207,587 |
| Option on an interest rate swap with Bank of America N.A. to pay annually a fixed rate of 4.05% and receive annually a floating rate based on the U.S. Secured Overnight Fin. Rate (SOFR) Index, expiring April 2034. | 4/23/29 | | 4,800,000 | 176,830 |
| Option on an interest rate swap with Goldman Sachs Bank U.S.A. to pay annually a fixed rate of 3.3525% and receive annually a floating rate based on the U.S. Secured Overnight Fin. Rate (SOFR) Index, expiring February 2035. | 2/03/25 | | 3,300,000 | 171,925 |
| Option on an interest rate swap with Goldman Sachs Bank U.S.A. to pay annually a fixed rate of 3.865% and receive annually a floating rate based on the U.S. Secured Overnight Fin. Rate (SOFR) Index, expiring May 2035. | 5/15/25 | | 2,600,000 | 81,014 |
| Option on an interest rate swap with JPMorgan Chase Bank N.A. to pay annually a fixed rate of 3.8225% and receive annually a floating rate based on the U.S. Secured Overnight Fin. Rate (SOFR) Index, expiring February 2035. | 2/24/25 | | 4,600,000 | 135,736 |
| Option on an interest rate swap with JPMorgan Chase Bank N.A. to pay annually a fixed rate of 3.92625% and receive annually a floating rate based on the U.S. Secured Overnight Fin. Rate (SOFR) Index, expiring May 2034. | 5/14/29 | | 5,000,000 | 193,334 |
| | | | | |
| TOTAL PUT OPTIONS | | | | 1,148,488 |
| Call Options - 0.0% | | | | |
| Option on an interest rate swap with Bank of America N.A. to receive annually a fixed rate of 3.7375% and pay annually a floating rate based on the U.S. Secured Overnight Fin. Rate (SOFR) Index, expiring February 2035. | 2/26/25 | | 5,500,000 | 133,321 |
| Option on an interest rate swap with Bank of America N.A. to receive annually a fixed rate of 3.94% and pay annually a floating rate based on the U.S. Secured Overnight Fin. Rate (SOFR) Index, expiring May 2034. | 5/10/29 | | 5,400,000 | 234,597 |
| Option on an interest rate swap with Bank of America N.A. to receive annually a fixed rate of 4.05% and pay annually a floating rate based on the U.S. Secured Overnight Fin. Rate (SOFR) Index, expiring April 2034. | 4/23/29 | | 4,800,000 | 221,054 |
| Option on an interest rate swap with Goldman Sachs Bank U.S.A. to receive annually a fixed rate of 3.3525% and pay annually a floating rate based on the U.S. Secured Overnight Fin. Rate (SOFR) Index, expiring February 2035. | 2/03/25 | | 3,300,000 | 39,156 |
| Option on an interest rate swap with Goldman Sachs Bank U.S.A. to receive annually a fixed rate of 3.865% and pay annually a floating rate based on the U.S. Secured Overnight Fin. Rate (SOFR) Index, expiring May 2035. | 5/15/25 | | 2,600,000 | 88,668 |
| Option on an interest rate swap with JPMorgan Chase Bank N.A. to receive annually a fixed rate of 3.8225% and pay annually a floating rate based on the U.S. Secured Overnight Fin. Rate (SOFR) Index, expiring February 2035. | 2/24/25 | | 4,600,000 | 125,940 |
| Option on an interest rate swap with JPMorgan Chase Bank N.A. to receive annually a fixed rate of 3.92625% and pay annually a floating rate based on the U.S. Secured Overnight Fin. Rate (SOFR) Index, expiring May 2034. | 5/14/29 | | 5,000,000 | 215,727 |
| | | | | |
| TOTAL CALL OPTIONS | | | | 1,058,463 |
TOTAL PURCHASED SWAPTIONS (Cost $2,371,256) | | | | 2,206,951 |
| TOTAL INVESTMENT IN SECURITIES - 114.8% (Cost $3,829,209,725) | 3,692,683,859 |
NET OTHER ASSETS (LIABILITIES) - (14.8)% | (477,002,154) |
| NET ASSETS - 100.0% | 3,215,681,705 |
| | |
| TBA Sale Commitments |
| | Principal Amount (a) | Value ($) |
| Ginnie Mae | | |
| 2% 7/1/54 | (2,900,000) | (2,348,239) |
| 2% 7/1/54 | (17,400,000) | (14,089,410) |
| 2% 7/1/54 | (750,000) | (607,302) |
| 3% 7/1/54 | (8,200,000) | (7,150,289) |
| 3% 7/1/54 | (1,350,000) | (1,177,182) |
| 3% 7/1/54 | (2,825,000) | (2,463,362) |
| 3.5% 7/1/54 | (3,650,000) | (3,280,556) |
| 4% 7/1/54 | (6,300,000) | (5,822,054) |
| 5% 7/1/54 | (4,600,000) | (4,478,756) |
| 5% 7/1/54 | (4,600,000) | (4,478,756) |
| 5.5% 7/1/54 | (4,500,000) | (4,464,674) |
| 5.5% 7/1/54 | (4,500,000) | (4,464,674) |
| 5.5% 7/1/54 | (2,575,000) | (2,554,786) |
| 6% 7/1/54 | (3,800,000) | (3,816,329) |
| 6% 7/1/54 | (2,850,000) | (2,862,247) |
| 6% 7/1/54 | (1,525,000) | (1,531,553) |
| | | |
| TOTAL GINNIE MAE | | (65,590,169) |
| | | |
| Uniform Mortgage Backed Securities | | |
| 2% 7/1/39 | (800,000) | (703,187) |
| 2% 7/1/54 | (1,100,000) | (860,320) |
| 2% 7/1/54 | (1,400,000) | (1,094,953) |
| 2% 7/1/54 | (1,400,000) | (1,094,953) |
| 2% 7/1/54 | (59,800,000) | (46,770,142) |
| 2% 7/1/54 | (2,300,000) | (1,798,852) |
| 2% 7/1/54 | (3,500,000) | (2,737,383) |
| 2% 7/1/54 | (3,500,000) | (2,737,383) |
| 2% 7/1/54 | (1,400,000) | (1,094,953) |
| 2% 7/1/54 | (2,300,000) | (1,798,852) |
| 2% 7/1/54 | (17,000,000) | (13,295,860) |
| 2% 7/1/54 | (5,850,000) | (4,575,340) |
| 2% 7/1/54 | (5,875,000) | (4,594,893) |
| 2% 7/1/54 | (2,300,000) | (1,798,852) |
| 2% 7/1/54 | (3,800,000) | (2,972,016) |
| 2% 7/1/54 | (8,550,000) | (6,687,035) |
| 2% 7/1/54 | (7,275,000) | (5,689,846) |
| 2% 7/1/54 | (2,700,000) | (2,111,695) |
| 2.5% 7/1/54 | (25,700,000) | (20,989,673) |
| 2.5% 7/1/54 | (3,100,000) | (2,531,828) |
| 2.5% 7/1/54 | (2,500,000) | (2,041,797) |
| 2.5% 7/1/54 | (400,000) | (326,688) |
| 2.5% 7/1/54 | (400,000) | (326,688) |
| 2.5% 7/1/54 | (3,300,000) | (2,695,172) |
| 2.5% 7/1/54 | (1,300,000) | (1,061,734) |
| 2.5% 7/1/54 | (600,000) | (490,031) |
| 2.5% 7/1/54 | (2,200,000) | (1,796,781) |
| 2.5% 7/1/54 | (1,100,000) | (898,391) |
| 2.5% 7/1/54 | (2,400,000) | (1,960,125) |
| 2.5% 7/1/54 | (600,000) | (490,031) |
| 2.5% 7/1/54 | (2,800,000) | (2,286,813) |
| 2.5% 7/1/54 | (1,000,000) | (816,719) |
| 3% 7/1/54 | (9,550,000) | (8,126,458) |
| 3% 7/1/54 | (1,200,000) | (1,021,126) |
| 3% 7/1/54 | (1,600,000) | (1,361,501) |
| 3% 7/1/54 | (5,750,000) | (4,892,894) |
| 3% 7/1/54 | (3,300,000) | (2,808,095) |
| 3.5% 7/1/54 | (2,800,000) | (2,478,217) |
| 3.5% 7/1/54 | (2,200,000) | (1,947,171) |
| 3.5% 7/1/54 | (1,300,000) | (1,150,601) |
| 3.5% 7/1/54 | (1,550,000) | (1,371,870) |
| 3.5% 7/1/54 | (1,600,000) | (1,416,124) |
| 3.5% 7/1/54 | (1,300,000) | (1,150,601) |
| 3.5% 8/1/54 | (150,000) | (132,785) |
| 4% 7/1/54 | (3,075,000) | (2,813,145) |
| 4% 7/1/54 | (3,075,000) | (2,813,145) |
| 5.5% 7/1/54 | (1,000,000) | (986,289) |
| 5.5% 7/1/54 | (2,500,000) | (2,465,723) |
| 6% 7/1/54 | (1,200,000) | (1,203,376) |
| 6% 7/1/54 | (2,000,000) | (2,005,626) |
| 6% 7/1/54 | (15,050,000) | (15,092,337) |
| 6.5% 7/1/54 | (3,200,000) | (3,256,748) |
| | | |
| TOTAL UNIFORM MORTGAGE BACKED SECURITIES | | (199,622,818) |
| | | |
TOTAL TBA SALE COMMITMENTS (Proceeds $266,919,236) | | (265,212,987) |
| Futures Contracts |
| | Number of contracts | Expiration Date | Notional Amount ($) | Value ($) | Unrealized Appreciation/ (Depreciation) ($) |
| Purchased | | | | | |
| | | | | | |
| Treasury Contracts | | | | | |
| CBOT Ultra Long Term U.S. Treasury Bond Contracts (United States) | 8 | Sep 2024 | 1,002,750 | 6,494 | 6,494 |
| | | | | | |
| Sold | | | | | |
| | | | | | |
| Treasury Contracts | | | | | |
| CBOT 10-Year U.S. Treasury Note Contracts (United States) | 217 | Sep 2024 | 23,866,609 | (101,437) | (101,437) |
| CBOT 2-Year U.S. Treasury Note Contracts (United States) | 38 | Sep 2024 | 7,760,313 | (3,589) | (3,589) |
| CBOT 5-Year U.S. Treasury Note Contracts (United States) | 56 | Sep 2024 | 5,968,375 | (25,909) | (25,909) |
| CBOT Long Term U.S. Treasury Bond Contracts (United States) | 42 | Sep 2024 | 4,969,125 | (37,488) | (37,488) |
| | | | | | |
| TOTAL SOLD | | | | | (168,423) |
| | | | | | |
| TOTAL FUTURES CONTRACTS | | | | | (161,929) |
| The notional amount of futures purchased as a percentage of Net Assets is 0.0% |
| The notional amount of futures sold as a percentage of Net Assets is 1.3% |
| Credit Default Swaps |
| Underlying Reference | Rating(1) | Maturity Date | Clearinghouse / Counterparty | Fixed Payment Received/ (Paid) | Payment Frequency | Notional Amount(2)(3) | Value ($)(1) | Upfront Premium Received/ (Paid) ($) | Unrealized Appreciation/ (Depreciation) ($) |
| Buy Protection | | | | | | | | | | |
| CMBX N.A. AAA Index Series 13 | | Dec 2072 | Citigroup Global Markets Ltd. | (0.5%) | Monthly | | 760,000 | 6,539 | (8,148) | (1,609) |
| CMBX N.A. AAA Index Series 13 | | Dec 2072 | Morgan Stanley Capital Services LLC | (0.5%) | Monthly | | 990,000 | 8,517 | (15,807) | (7,290) |
| CMBX N.A. AAA Index Series 13 | | Dec 2072 | Morgan Stanley Capital Services LLC | (0.5%) | Monthly | | 620,000 | 5,334 | (4,127) | 1,207 |
| CMBX N.A. BBB- Index Series 16 | | Apr 2065 | Citigroup Global Markets Ltd. | (3%) | Monthly | | 200,000 | 35,040 | (52,530) | (17,490) |
| CMBX N.A. BBB- Index Series 16 | | Apr 2065 | Citigroup Global Markets Ltd. | (3%) | Monthly | | 720,000 | 126,144 | (216,644) | (90,500) |
| CMBX N.A. BBB- Index Series 16 | | Apr 2065 | Citigroup Global Markets Ltd. | (3%) | Monthly | | 90,000 | 15,768 | (20,055) | (4,287) |
| CMBX N.A. BBB- Index Series 16 | | Apr 2065 | Citigroup Global Markets Ltd. | (3%) | Monthly | | 390,000 | 68,328 | (107,042) | (38,714) |
| CMBX N.A. BBB- Index Series 16 | | Apr 2065 | Goldman Sachs & Co. LLC | (3%) | Monthly | | 260,000 | 45,552 | (68,253) | (22,701) |
| CMBX N.A. BBB- Index Series 16 | | Apr 2065 | Goldman Sachs & Co. LLC | (3%) | Monthly | | 1,060,000 | 185,711 | (302,438) | (116,727) |
| CMBX N.A. BBB- Index Series 16 | | Apr 2065 | Goldman Sachs & Co. LLC | (3%) | Monthly | | 400,000 | 70,080 | (95,851) | (25,771) |
| CMBX N.A. BBB- Index Series 16 | | Apr 2065 | Goldman Sachs & Co. LLC | (3%) | Monthly | | 90,000 | 15,768 | (20,961) | (5,193) |
| CMBX N.A. BBB- Index Series 16 | | Apr 2065 | Goldman Sachs & Co. LLC | (3%) | Monthly | | 380,000 | 66,576 | (97,138) | (30,562) |
| CMBX N.A. BBB- Index Series 16 | | Apr 2065 | JPMorgan Securities LLC | (3%) | Monthly | | 300,000 | 52,560 | (85,628) | (33,068) |
| CMBX N.A. BBB- Index Series 16 | | Apr 2065 | JPMorgan Securities LLC | (3%) | Monthly | | 130,000 | 22,776 | (34,294) | (11,518) |
| CMBX N.A. BBB- Index Series 16 | | Apr 2065 | Morgan Stanley Capital Services LLC | (3%) | Monthly | | 320,000 | 56,064 | (80,807) | (24,743) |
| CMBX N.A. BBB- Index Series 16 | | Apr 2065 | Morgan Stanley Capital Services LLC | (3%) | Monthly | | 180,000 | 31,536 | (43,070) | (11,534) |
| CMBX N.A. BBB- Index Series 17 | | Dec 2056 | Citigroup Global Markets Ltd. | (3%) | Monthly | | 150,000 | 20,938 | (24,387) | (3,449) |
| CMBX N.A. BBB- Index Series 17 | | Dec 2056 | Goldman Sachs & Co. LLC | (3%) | Monthly | | 100,000 | 13,958 | (14,092) | (134) |
| CMBX N.A. BBB- Index Series 17 | | Dec 2056 | Goldman Sachs & Co. LLC | (3%) | Monthly | | 200,000 | 27,917 | (28,697) | (780) |
| CMBX N.A. BBB- Index Series 17 | | Dec 2056 | JPMorgan Securities LLC | (3%) | Monthly | | 200,000 | 27,917 | (26,471) | 1,446 |
| CMBX N.A. BBB- Index Series 17 | | Dec 2056 | Morgan Stanley Capital Services LLC | (3%) | Monthly | | 100,000 | 13,958 | (13,999) | (41) |
| CMBX N.A. BBB- Index Series 17 | | Dec 2056 | Morgan Stanley Capital Services LLC | (3%) | Monthly | | 200,000 | 27,917 | (28,697) | (780) |
| | | | | | | | | | | |
| TOTAL BUY PROTECTION | | | | | | | | 944,898 | (1,389,136) | (444,238) |
| Sell Protection | | | | | | | | | | |
| CMBX N.A. AAA Index Series 13 | NR | Dec 2072 | Morgan Stanley Capital Services LLC | 0.5% | Monthly | | 1,490,000 | (12,819) | 33,709 | 20,890 |
| CMBX N.A. AAA Index Series 13 | NR | Dec 2072 | Morgan Stanley Capital Services LLC | 0.5% | Monthly | | 880,000 | (7,571) | 20,474 | 12,903 |
| CMBX N.A. AAA Index Series 15 | NR | Nov 2064 | Citigroup Global Markets Ltd. | 0.5% | Monthly | | 1,500,000 | (24,411) | 14,983 | (9,428) |
| CMBX N.A. AAA Index Series 15 | NR | Nov 2064 | Citigroup Global Markets Ltd. | 0.5% | Monthly | | 100,000 | (1,627) | 1,369 | (258) |
| CMBX N.A. AAA Index Series 16 | NR | Apr 2065 | Citigroup Global Markets Ltd. | 0.5% | Monthly | | 1,100,000 | (22,539) | 22,080 | (459) |
| CMBX N.A. AAA Index Series 16 | NR | Apr 2065 | Citigroup Global Markets Ltd. | 0.5% | Monthly | | 3,300,000 | (67,618) | 66,721 | (897) |
| CMBX N.A. AAA Index Series 16 | NR | Apr 2065 | Citigroup Global Markets Ltd. | 0.5% | Monthly | | 4,350,000 | (89,133) | 129,160 | 40,027 |
| CMBX N.A. AAA Index Series 16 | NR | Apr 2065 | Goldman Sachs & Co. LLC | 0.5% | Monthly | | 900,000 | (18,441) | 11,904 | (6,537) |
| CMBX N.A. AAA Index Series 16 | NR | Apr 2065 | Goldman Sachs & Co. LLC | 0.5% | Monthly | | 1,300,000 | (27,208) | 26,185 | (1,023) |
| CMBX N.A. AAA Index Series 17 | NR | Dec 2056 | Citigroup Global Markets Ltd. | 0.5% | Monthly | | 1,000,000 | (25,809) | 25,094 | (715) |
| CMBX N.A. AAA Index Series 17 | NR | Dec 2056 | Citigroup Global Markets Ltd. | 0.5% | Monthly | | 3,300,000 | (85,169) | 83,338 | (1,831) |
| CMBX N.A. AAA Index Series 17 | NR | Dec 2056 | Goldman Sachs & Co. LLC | 0.5% | Monthly | | 400,000 | (10,324) | 9,078 | (1,246) |
| CMBX N.A. AAA Index Series 17 | NR | Dec 2056 | Goldman Sachs & Co. LLC | 0.5% | Monthly | | 600,000 | (15,485) | 15,163 | (322) |
| CMBX N.A. AAA Index Series 17 | NR | Dec 2056 | Goldman Sachs & Co. LLC | 0.5% | Monthly | | 600,000 | (15,978) | 15,304 | (674) |
| | | | | | | | | | | |
| TOTAL SELL PROTECTION | | | | | | | | (424,132) | 474,562 | 50,430 |
| TOTAL CREDIT DEFAULT SWAPS | | | | | | | | 520,766 | (914,574) | (393,808) |
(1)Ratings are presented for credit default swaps in which the Fund has sold protection on the underlying referenced debt. Ratings for an underlying index represent a weighted average of the ratings of all securities included in the index. The credit rating or value can be measures of the current payment/performance risk. Ratings are from Moody's Investors Service, Inc. Where Moody's® ratings are not available, S&P® ratings are disclosed and are indicated as such. All ratings are as of the report date and do not reflect subsequent changes.
(2)The notional amount of each credit default swap where the Fund has sold protection approximates the maximum potential amount of future payments that the Fund could be required to make if a credit event were to occur.
(3)Notional amount is stated in U.S. Dollars unless otherwise noted.
| Interest Rate Swaps |
| Payment Received | Payment Frequency | Payment Paid | Payment Frequency | Clearinghouse / Counterparty(1) | Maturity Date | Notional Amount(2) | Value ($) | Upfront Premium Received/ (Paid) ($)(3) | Unrealized Appreciation/ (Depreciation) ($) |
U.S. Secured Overnight Fin. Rate (SOFR) Index(4) | Annual | 3.75% | Annual | LCH | Sep 2026 | | 27,976,000 | 52,056 | 0 | 52,056 |
U.S. Secured Overnight Fin. Rate (SOFR) Index(4) | Annual | 3.5% | Annual | LCH | Sep 2027 | | 9,037,000 | 26,861 | 0 | 26,861 |
U.S. Secured Overnight Fin. Rate (SOFR) Index(4) | Annual | 3.5% | Annual | LCH | Sep 2029 | | 2,646,000 | 16,471 | 0 | 16,471 |
U.S. Secured Overnight Fin. Rate (SOFR) Index(4) | Annual | 3.5% | Annual | LCH | Sep 2031 | | 23,949,000 | 217,333 | 0 | 217,333 |
| 3.75% | Annual | U.S. Secured Overnight Fin. Rate (SOFR) Index(4) | Annual | LCH | Sep 2034 | | 3,300,000 | (41,284) | 0 | (41,284) |
U.S. Secured Overnight Fin. Rate (SOFR) Index(4) | Annual | 3.75% | Annual | LCH | Sep 2044 | | 5,441,000 | 114,327 | 0 | 114,327 |
| 3.5% | Annual | U.S. Secured Overnight Fin. Rate (SOFR) Index(4) | Annual | LCH | Sep 2054 | | 706,000 | (20,935) | 0 | (20,935) |
| TOTAL INTEREST RATE SWAPS | | | | | | | | 364,829 | 0 | 364,829 |
(1)Swaps with LCH Clearnet Group (LCH) are centrally cleared swaps.
(2)Notional amount is stated in U.S. Dollars unless otherwise noted.
(3)Any premiums for centrally cleared swaps are recorded periodically throughout the term of the swap to variation margin and included in unrealized appreciation (depreciation).
(4)Represents floating rate.
For the period, the average monthly notional amount at value for swaps in the aggregate was $17,441,667.
Legend
| (a) | Amount is stated in United States dollars unless otherwise noted. |
| (b) | Security exempt from registration under Rule 144A of the Securities Act of 1933. These securities may be resold in transactions exempt from registration, normally to qualified institutional buyers. At the end of the period, the value of these securities amounted to $408,094,307 or 12.7% of net assets. |
| (c) | Coupon rates for floating and adjustable rate securities reflect the rates in effect at period end. |
| (d) | Coupon is indexed to a floating interest rate which may be multiplied by a specified factor and/or subject to caps or floors. |
| (e) | Security or a portion of the security was pledged to cover margin requirements for futures contracts. At period end, the value of securities pledged amounted to $785,330. |
| (f) | Security or a portion of the security was pledged to cover margin requirements for centrally cleared swaps. At period end, the value of securities pledged amounted to $1,923,139. |
| (g) | Security or a portion of the security purchased on a delayed delivery or when-issued basis. |
| (h) | Interest Only (IO) security represents the right to receive only monthly interest payments on an underlying pool of mortgages or assets. Principal shown is the outstanding par amount of the pool as of the end of the period. |
| (i) | Affiliated fund that is generally available only to investment companies and other accounts managed by Fidelity Investments. A complete unaudited schedule of portfolio holdings for each Fidelity Central Fund is filed with the SEC for the first and third quarters of each fiscal year on Form N-PORT and is available upon request or at the SEC's website at www.sec.gov. An unaudited holdings listing for the Fund, which presents direct holdings as well as the pro-rata share of securities and other investments held indirectly through its investment in underlying non-money market Fidelity Central Funds, is available at fidelity.com and/or institutional.fidelity.com, as applicable. In addition, each Fidelity Central Fund's financial statements are available on the SEC's website or upon request. |
| (j) | Affiliated fund that is generally available only to investment companies and other accounts managed by Fidelity Investments. The rate quoted is the annualized seven-day yield of the fund at period end. A complete unaudited listing of the fund's holdings as of its most recent quarter end is available upon request. In addition, each Fidelity Central Fund's financial statements are available on the SEC's website or upon request. |
Affiliated Central Funds
Fiscal year to date information regarding the Fund's investments in Fidelity Central Funds, including the ownership percentage, is presented below.
| Affiliate | Value, beginning of period ($) | Purchases ($) | Sales Proceeds ($) | Dividend Income ($) | Realized Gain (loss) ($) | Change in Unrealized appreciation (depreciation) ($) | Value, end of period ($) | % ownership, end of period |
| Fidelity Cash Central Fund 5.38% | 57,300,436 | 331,313,312 | 364,111,565 | 1,393,529 | 867 | - | 24,503,050 | 0.0% |
| Fidelity Specialized High Income Central Fund | 15,645,506 | 442,048 | - | 442,086 | - | (45,137) | 16,042,417 | 6.9% |
| Total | 72,945,942 | 331,755,360 | 364,111,565 | 1,835,615 | 867 | (45,137) | 40,545,467 | |
| | | | | | | | | |
Amounts in the dividend income column in the above table include any capital gain distributions from underlying funds, which are presented in the corresponding line item in the Statement of Operations, if applicable.
Amounts included in the purchases and sales proceeds columns may include in-kind transactions, if applicable.
Investment Valuation
The following is a summary of the inputs used, as of June 30, 2024, involving the Fund's assets and liabilities carried at fair value. The inputs or methodology used for valuing securities may not be an indication of the risk associated with investing in those securities. For more information on valuation inputs, and their aggregation into the levels used below, please refer to the Investment Valuation section in the accompanying Notes to Financial Statements.
| Valuation Inputs at Reporting Date: |
| Description | Total ($) | Level 1 ($) | Level 2 ($) | Level 3 ($) |
Investments in Securities: | | | | |
|
| Corporate Bonds | 803,684,134 | - | 803,684,134 | - |
|
| U.S. Government and Government Agency Obligations | 1,410,261,848 | - | 1,410,261,848 | - |
|
| U.S. Government Agency - Mortgage Securities | 925,798,618 | - | 925,798,618 | - |
|
| Asset-Backed Securities | 251,584,008 | - | 251,584,008 | - |
|
| Collateralized Mortgage Obligations | 44,902,459 | - | 44,902,459 | - |
|
| Commercial Mortgage Securities | 185,752,359 | - | 185,752,359 | - |
|
| Municipal Securities | 471,562 | - | 471,562 | - |
|
| Foreign Government and Government Agency Obligations | 10,361,948 | - | 10,361,948 | - |
|
| Supranational Obligations | 14,540,020 | - | 14,540,020 | - |
|
| Bank Notes | 2,574,485 | - | 2,574,485 | - |
|
| Fixed-Income Funds | 16,042,417 | 16,042,417 | - | - |
|
| Money Market Funds | 24,503,050 | 24,503,050 | - | - |
|
| Purchased Swaptions | 2,206,951 | - | 2,206,951 | - |
| Total Investments in Securities: | 3,692,683,859 | 40,545,467 | 3,652,138,392 | - |
Derivative Instruments: Assets | | | | |
Futures Contracts | 6,494 | 6,494 | - | - |
Swaps | 1,371,946 | - | 1,371,946 | - |
| Total Assets | 1,378,440 | 6,494 | 1,371,946 | - |
| Liabilities | | | | |
Futures Contracts | (168,423) | (168,423) | - | - |
Swaps | (486,351) | - | (486,351) | - |
| Total Liabilities | (654,774) | (168,423) | (486,351) | - |
| Total Derivative Instruments: | 723,666 | (161,929) | 885,595 | - |
Other Financial Instruments: | | | | |
TBA Sale Commitments | (265,212,987) | - | (265,212,987) | - |
| Total Other Financial Instruments: | (265,212,987) | - | (265,212,987) | - |
Value of Derivative Instruments
The following table is a summary of the Fund's value of derivative instruments by primary risk exposure as of June 30, 2024. For additional information on derivative instruments, please refer to the Derivative Instruments section in the accompanying Notes to Financial Statements.
Primary Risk Exposure / Derivative Type | Value |
| Asset ($) | Liability ($) |
| Credit Risk | | |
Swaps (a) | 944,898 | (424,132) |
| Total Credit Risk | 944,898 | (424,132) |
| Interest Rate Risk | | |
Futures Contracts (b) | 6,494 | (168,423) |
Purchased Swaptions (c) | 2,206,951 | 0 |
Swaps (d) | 427,048 | (62,219) |
| Total Interest Rate Risk | 2,640,493 | (230,642) |
| Total Value of Derivatives | 3,585,391 | (654,774) |
(a)For bi-lateral over-the-counter (OTC) swaps, reflects gross value which is presented in the Statement of Assets and Liabilities in the bi-lateral OTC swaps, at value line-items.
(b)Reflects gross cumulative appreciation (depreciation) on futures contracts as presented in the Schedule of Investments. In the Statement of Assets and Liabilities, the period end daily variation margin is included in receivable or payable for daily variation margin on futures contracts, and the net cumulative appreciation (depreciation) is included in Total accumulated earnings (loss).
(c)Gross value is presented in the Statement of Assets and Liabilities in the Investments in Securities at value line-item.
(d)For centrally cleared swaps, reflects gross cumulative appreciation (depreciation) as presented in the Schedule of Investments. In the Statement of Assets and Liabilities, the period end daily variation margin for centrally cleared swaps is included in receivable or payable for daily variation margin on centrally cleared swaps, and the net cumulative appreciation (depreciation) for centrally cleared swaps is included in Total accumulated earnings (loss).
Financial Statements (Unaudited)
| Statement of Assets and Liabilities |
| | | | June 30, 2024 (Unaudited) |
| | | | | |
| Assets | | | | |
| Investment in securities, at value - See accompanying schedule: | | | | |
Unaffiliated issuers (cost $3,788,436,171) | $ | 3,652,138,392 | | |
Fidelity Central Funds (cost $40,773,554) | | 40,545,467 | | |
| | | | | |
| | | | | |
| Total Investment in Securities (cost $3,829,209,725) | | | $ | 3,692,683,859 |
| Cash | | | | 1,196,077 |
| Receivable for investments sold | | | | 3,772,761 |
| Receivable for TBA sale commitments | | | | 266,919,236 |
| Receivable for swaps | | | | 41,489 |
| Receivable for fund shares sold | | | | 2,587,493 |
| Interest receivable | | | | 29,671,500 |
| Distributions receivable from Fidelity Central Funds | | | | 192,209 |
| Receivable for daily variation margin on futures contracts | | | | 76,009 |
| Receivable for daily variation margin on centrally cleared swaps | | | | 113,984 |
| Bi-lateral OTC swaps, at value | | | | 944,898 |
| Other receivables | | | | 86 |
Total assets | | | | 3,998,199,601 |
| Liabilities | | | | |
| Payable for investments purchased | | | | |
Regular delivery | $ | 13,747,144 | | |
Delayed delivery | | 500,242,129 | | |
| TBA sale commitments, at value | | 265,212,987 | | |
| Payable for fund shares redeemed | | 1,645,060 | | |
| Bi-lateral OTC swaps, at value | | 424,132 | | |
| Accrued management fee | | 1,087,029 | | |
| Other payables and accrued expenses | | 159,415 | | |
| Total liabilities | | | | 782,517,896 |
| Net Assets | | | $ | 3,215,681,705 |
| Net Assets consist of: | | | | |
| Paid in capital | | | $ | 3,367,201,171 |
| Total accumulated earnings (loss) | | | | (151,519,466) |
| Net Assets | | | $ | 3,215,681,705 |
| | | | | |
| Net Asset Value and Maximum Offering Price | | | | |
| Initial Class : | | | | |
Net Asset Value, offering price and redemption price per share ($765,072,499 ÷ 81,163,151 shares) | | | $ | 9.43 |
| Investor Class : | | | | |
Net Asset Value, offering price and redemption price per share ($2,450,609,206 ÷ 260,014,412 shares) | | | $ | 9.42 |
| Statement of Operations |
| | | | Six months ended June 30, 2024 (Unaudited) |
| Investment Income | | | | |
| Interest | | | $ | 69,391,260 |
| Income from Fidelity Central Funds | | | | 1,835,615 |
| Total income | | | | 71,226,875 |
| Expenses | | | | |
| Management fee | $ | 5,660,853 | | |
| Transfer agent fees | | 486,486 | | |
| Accounting fees and expenses | | 163,188 | | |
| Custodian fees and expenses | | 89,725 | | |
| Independent trustees' fees and expenses | | 4,094 | | |
| Registration fees | | 30,381 | | |
| Audit | | 25,925 | | |
| Legal | | 2,250 | | |
| Miscellaneous | | 2,830 | | |
| Total expenses before reductions | | 6,465,732 | | |
| Expense reductions | | (74,170) | | |
| Total expenses after reductions | | | | 6,391,562 |
| Net Investment income (loss) | | | | 64,835,313 |
| Realized and Unrealized Gain (Loss) | | | | |
| Net realized gain (loss) on: | | | | |
| Investment Securities: | | | | |
| Unaffiliated issuers | | (5,568,440) | | |
| Fidelity Central Funds | | 867 | | |
| Futures contracts | | (162,598) | | |
| Swaps | | 640,666 | | |
| Written options | | 18,474 | | |
| Total net realized gain (loss) | | | | (5,071,031) |
| Change in net unrealized appreciation (depreciation) on: | | | | |
| Investment Securities: | | | | |
| Unaffiliated issuers | | (73,005,917) | | |
| Fidelity Central Funds | | (45,137) | | |
| Futures contracts | | 113,526 | | |
| Swaps | | 1,333,051 | | |
| Written options | | (1,092) | | |
| TBA Sale commitments | | 2,899,168 | | |
| Total change in net unrealized appreciation (depreciation) | | | | (68,706,401) |
| Net gain (loss) | | | | (73,777,432) |
| Net increase (decrease) in net assets resulting from operations | | | $ | (8,942,119) |
| Statement of Changes in Net Assets |
| |
| | Six months ended June 30, 2024 (Unaudited) | | Year ended December 31, 2023 |
| Increase (Decrease) in Net Assets | | | | |
| Operations | | | | |
| Net investment income (loss) | $ | 64,835,313 | $ | 115,968,988 |
| Net realized gain (loss) | | (5,071,031) | | (47,179,598) |
| Change in net unrealized appreciation (depreciation) | | (68,706,401) | | 102,413,361 |
| Net increase (decrease) in net assets resulting from operations | | (8,942,119) | | 171,202,751 |
| Distributions to shareholders | | (1,959,039) | | (115,213,666) |
| | | | | |
| Share transactions - net increase (decrease) | | 104,553,833 | | 257,729,252 |
| Total increase (decrease) in net assets | | 93,652,675 | | 313,718,337 |
| | | | | |
| Net Assets | | | | |
| Beginning of period | | 3,122,029,030 | | 2,808,310,693 |
| End of period | $ | 3,215,681,705 | $ | 3,122,029,030 |
| | | | | |
| | | | | |
Financial Highlights
VIP Investment Grade Bond II Portfolio Initial Class |
| |
| | Six months ended (Unaudited) June 30, 2024 | | Years ended December 31, 2023 | | 2022 A |
Selected Per-Share Data | | | | | | |
| Net asset value, beginning of period | $ | 9.46 | $ | 9.29 | $ | 10.00 |
| Income from Investment Operations | | | | | | |
Net investment income (loss) B,C | | .198 | | .370 | | .191 |
| Net realized and unrealized gain (loss) | | (.222) | | .167 | | (.721) D |
| Total from investment operations | | (.024) | | .537 | | (.530) |
| Distributions from net investment income | | (.006) | | (.367) | | (.180) |
| Total distributions | | (.006) | | (.367) | | (.180) |
| Net asset value, end of period | $ | 9.43 | $ | 9.46 | $ | 9.29 |
Total Return E,F,G | | | | 5.91% | | (5.31)% |
Ratios to Average Net Assets C,H,I | | | | | | |
| Expenses before reductions | | .40% J | | .41% | | .40% J |
| Expenses net of fee waivers, if any | | | | .40% | | .40% J |
| Expenses net of all reductions | | .40% J | | .40% | | .40% J |
| Net investment income (loss) | | 4.25% J | | 3.93% | | 3.32% J |
| Supplemental Data | | | | | | |
| Net assets, end of period (000 omitted) | $ | 765,072 | $ | 647,893 | $ | 528,508 |
Portfolio turnover rate K | | | | 190% | | 225% J,L |
AFor the period May 27, 2022 (commencement of operations) through December 31, 2022
BCalculated based on average shares outstanding during the period.
CNet investment income (loss) is affected by the timing of the declaration of dividends by any underlying mutual funds or exchange-traded funds (ETFs). Net investment income (loss) of any mutual funds or ETFs is not included in the Fund's net investment income (loss) ratio.
DThe amount shown for a share outstanding does not correspond with the aggregate net gain (loss) on investments for the period due to the timing of sales and repurchases of shares in relation to fluctuating market values of the investments of the Fund.
ETotal returns for periods of less than one year are not annualized.
FTotal returns do not reflect charges attributable to your insurance company's separate account. Inclusion of these charges would reduce the total returns shown.
GTotal returns would have been lower if certain expenses had not been reduced during the applicable periods shown.
HFees and expenses of any underlying mutual funds or exchange-traded funds (ETFs) are not included in the Fund's expense ratio. The Fund indirectly bears its proportionate share of these expenses. For additional expense information related to investments in Fidelity Central Funds, please refer to the "Investments in Fidelity Central Funds" note found in the Notes to Financial Statements section of the most recent Annual or Semi-Annual report.
IExpense ratios reflect operating expenses of the class. Expenses before reductions do not reflect amounts reimbursed, waived, or reduced through arrangements with the investment adviser, brokerage services, or other offset arrangements, if applicable, and do not represent the amount paid by the class during periods when reimbursements, waivers or reductions occur.
JAnnualized.
KAmount does not include the portfolio activity of any underlying mutual funds or exchange-traded funds (ETFs).
LPortfolio turnover rate excludes securities received or delivered in-kind.
VIP Investment Grade Bond II Portfolio Investor Class |
| |
| | Six months ended (Unaudited) June 30, 2024 | | Years ended December 31, 2023 | | 2022 A |
Selected Per-Share Data | | | | | | |
| Net asset value, beginning of period | $ | 9.46 | $ | 9.29 | $ | 10.00 |
| Income from Investment Operations | | | | | | |
Net investment income (loss) B,C | | .197 | | .367 | | .189 |
| Net realized and unrealized gain (loss) | | (.231) | | .167 | | (.721) D |
| Total from investment operations | | (.034) | | .534 | | (.532) |
| Distributions from net investment income | | (.006) | | (.364) | | (.178) |
| Total distributions | | (.006) | | (.364) | | (.178) |
| Net asset value, end of period | $ | 9.42 | $ | 9.46 | $ | 9.29 |
Total Return E,F,G | | | | 5.88% | | (5.33)% |
Ratios to Average Net Assets C,H,I | | | | | | |
| Expenses before reductions | | .43% J | | .44% | | .44% J |
| Expenses net of fee waivers, if any | | | | .44% | | .43% J |
| Expenses net of all reductions | | .42% J | | .44% | | .43% J |
| Net investment income (loss) | | 4.23% J | | 3.89% | | 3.29% J |
| Supplemental Data | | | | | | |
| Net assets, end of period (000 omitted) | $ | 2,450,609 | $ | 2,474,136 | $ | 2,279,803 |
Portfolio turnover rate K | | | | 190% | | 225% J,L |
AFor the period May 27, 2022 (commencement of operations) through December 31, 2022
BCalculated based on average shares outstanding during the period.
CNet investment income (loss) is affected by the timing of the declaration of dividends by any underlying mutual funds or exchange-traded funds (ETFs). Net investment income (loss) of any mutual funds or ETFs is not included in the Fund's net investment income (loss) ratio.
DThe amount shown for a share outstanding does not correspond with the aggregate net gain (loss) on investments for the period due to the timing of sales and repurchases of shares in relation to fluctuating market values of the investments of the Fund.
ETotal returns for periods of less than one year are not annualized.
FTotal returns do not reflect charges attributable to your insurance company's separate account. Inclusion of these charges would reduce the total returns shown.
GTotal returns would have been lower if certain expenses had not been reduced during the applicable periods shown.
HFees and expenses of any underlying mutual funds or exchange-traded funds (ETFs) are not included in the Fund's expense ratio. The Fund indirectly bears its proportionate share of these expenses. For additional expense information related to investments in Fidelity Central Funds, please refer to the "Investments in Fidelity Central Funds" note found in the Notes to Financial Statements section of the most recent Annual or Semi-Annual report.
IExpense ratios reflect operating expenses of the class. Expenses before reductions do not reflect amounts reimbursed, waived, or reduced through arrangements with the investment adviser, brokerage services, or other offset arrangements, if applicable, and do not represent the amount paid by the class during periods when reimbursements, waivers or reductions occur.
JAnnualized.
KAmount does not include the portfolio activity of any underlying mutual funds or exchange-traded funds (ETFs).
LPortfolio turnover rate excludes securities received or delivered in-kind.
Notes to Financial Statements
(Unaudited)For the period ended June 30, 2024
1. Organization.
VIP Investment Grade Bond II Portfolio (the Fund) is a fund of Variable Insurance Products Fund V (the Trust) and is authorized to issue an unlimited number of shares. The Trust is registered under the Investment Company Act of 1940, as amended (the 1940 Act), as an open-end management investment company organized as a Massachusetts business trust. Shares of the Fund may only be purchased by insurance companies for the purpose of funding variable annuity or variable life insurance contracts. The Fund offers the following classes of shares: Initial Class shares and Investor Class shares. All classes have equal rights and voting privileges, except for matters affecting a single class.
2. Investments in Fidelity Central Funds.
Funds may invest in Fidelity Central Funds, which are open-end investment companies generally available only to other investment companies and accounts managed by the investment adviser and its affiliates. The Schedule of Investments lists any Fidelity Central Funds held as an investment as of period end, but does not include the underlying holdings of each Fidelity Central Fund. An investing fund indirectly bears its proportionate share of the expenses of the underlying Fidelity Central Funds.
Based on its investment objective, each Fidelity Central Fund may invest or participate in various investment vehicles or strategies that are similar to those of the investing fund. These strategies are consistent with the investment objectives of the investing fund and may involve certain economic risks which may cause a decline in value of each of the Fidelity Central Funds and thus a decline in the value of the investing fund.
| Fidelity Central Fund | Investment Manager | Investment Objective | Investment Practices | Expense RatioA |
| Fidelity Specialized High Income Central Fund | Fidelity Management & Research Company LLC (FMR) | Seeks a high level of current income by normally investing in income-producing debt securities, with an emphasis on lower-quality debt securities. | Loans & Direct Debt Instruments Restricted Securities | Less than .005% |
| Fidelity Money Market Central Funds | Fidelity Management & Research Company LLC (FMR) | Each fund seeks to obtain a high level of current income consistent with the preservation of capital and liquidity. | Short-term Investments | Less than .005% |
A Expenses expressed as a percentage of average net assets and are as of each underlying Central Fund's most recent annual or semi-annual shareholder report.
An unaudited holdings listing for the investing fund, which presents direct holdings as well as the pro-rata share of any securities and other investments held indirectly through its investment in underlying non-money market Fidelity Central Funds, is available at fidelity.com and/or institutional.fidelity.com, as applicable. A complete unaudited list of holdings for each Fidelity Central Fund is available upon request or at the Securities and Exchange Commission website at www.sec.gov. In addition, the financial statements of the Fidelity Central Funds which contain the significant accounting policies (including investment valuation policies) of those funds, and are not covered by the Report of Independent Registered Public Accounting Firm, are available on the Securities and Exchange Commission website or upon request.
3. Significant Accounting Policies.
The Fund is an investment company and applies the accounting and reporting guidance of the Financial Accounting Standards Board (FASB) Accounting Standards Codification Topic 946 Financial Services - Investment Companies. The financial statements have been prepared in conformity with accounting principles generally accepted in the United States of America (GAAP), which require management to make certain estimates and assumptions at the date of the financial statements. Actual results could differ from those estimates. Subsequent events, if any, through the date that the financial statements were issued have been evaluated in the preparation of the financial statements. The Fund's Schedule of Investments lists any underlying mutual funds or exchange-traded funds (ETFs) but does not include the underlying holdings of these funds. The following summarizes the significant accounting policies of the Fund:
Investment Valuation. Investments are valued as of 4:00 p.m. Eastern time on the last calendar day of the period. The Board of Trustees (the Board) has designated the Fund's investment adviser as the valuation designee responsible for the fair valuation function and performing fair value determinations as needed. The investment adviser has established a Fair Value Committee (the Committee) to carry out the day-to-day fair valuation responsibilities and has adopted policies and procedures to govern the fair valuation process and the activities of the Committee. In accordance with these fair valuation policies and procedures, which have been approved by the Board, the Fund attempts to obtain prices from one or more third party pricing services or brokers to value its investments. When current market prices, quotations or currency exchange rates are not readily available or reliable, investments will be fair valued in good faith by the Committee, in accordance with the policies and procedures. Factors used in determining fair value vary by investment type and may include market or investment specific events, transaction data, estimated cash flows, and market observations of comparable investments. The frequency that the fair valuation procedures are used cannot be predicted and they may be utilized to a significant extent. The Committee manages the Fund's fair valuation practices and maintains the fair valuation policies and procedures. The Fund's investment adviser reports to the Board information regarding the fair valuation process and related material matters.
The Fund categorizes the inputs to valuation techniques used to value its investments into a disclosure hierarchy consisting of three levels as shown below:
Level 1 - unadjusted quoted prices in active markets for identical investments
Level 2 - other significant observable inputs (including quoted prices for similar investments, interest rates, prepayment speeds, etc.)
Level 3 - unobservable inputs (including the Fund's own assumptions based on the best information available)
Valuation techniques used to value the Fund's investments by major category are as follows:
Debt securities, including restricted securities, are valued based on evaluated prices received from third party pricing services or from brokers who make markets in such securities. Corporate bonds, bank notes, foreign government and government agency obligations, municipal securities, supranational obligations and U.S. government and government agency obligations are valued by pricing services who utilize matrix pricing which considers yield or price of bonds of comparable quality, coupon, maturity and type or by broker-supplied prices. Asset backed securities, collateralized mortgage obligations, commercial mortgage securities, and U.S. government agency mortgage securities are valued by pricing services who utilize matrix pricing which considers prepayment speed assumptions, attributes of the collateral, yield or price of bonds of comparable quality, coupon, maturity and type or by broker-supplied prices. Brokers which make markets in asset backed securities, collateralized mortgage obligations and commercial mortgage securities may also consider such factors as the structure of the issue, cash flow assumptions, the value of underlying assets as well as any guarantees. Swaps are marked-to-market daily based on valuations from third party pricing services, registered derivatives clearing organizations (clearinghouses) or broker-supplied valuations. These pricing sources may utilize inputs such as interest rate curves, credit spread curves, default possibilities and recovery rates. When independent prices are unavailable or unreliable, debt securities and swaps may be valued utilizing pricing methodologies which consider similar factors that would be used by third party pricing services. Debt securities and swaps are generally categorized as Level 2 in the hierarchy but may be Level 3 depending on the circumstances.
Futures contracts are valued at the settlement price established each day by the board of trade or exchange on which they are traded and are categorized as Level 1 in the hierarchy. Options traded over-the-counter are valued using service or broker-supplied valuations and are categorized as Level 2 in the hierarchy. Investments in open-end mutual funds, including the Fidelity Central Funds, are valued at their closing net asset value (NAV) each business day and are categorized as Level 1 in the hierarchy.
Changes in valuation techniques may result in transfers in or out of an assigned level within the disclosure hierarchy. The aggregate value of investments by input level as of June 30, 2024 is included at the end of the Fund's Schedule of Investments.
Investment Transactions and Income. For financial reporting purposes, the Fund's investment holdings and NAV include trades executed through the end of the last business day of the period. The NAV per share for processing shareholder transactions is calculated as of the close of business of the New York Stock Exchange (NYSE), normally 4:00 p.m. Eastern time and includes trades executed through the end of the prior business day. Gains and losses on securities sold are determined on the basis of identified cost. Income and capital gain distributions from Fidelity Central Funds, if any, are recorded on the ex-dividend date. Interest income is accrued as earned and includes coupon interest and amortization of premium and accretion of discount on debt securities as applicable. Debt obligations may be placed on non-accrual status and related interest income may be reduced by ceasing current accruals and writing off interest receivables when the collection of all or a portion of interest has become doubtful based on consistently applied procedures. A debt obligation is removed from non-accrual status when the issuer resumes interest payments or when collectability of interest is reasonably assured.
Class Allocations and Expenses. Investment income, realized and unrealized capital gains and losses, common expenses of a fund, and certain fund-level expense reductions, if any, are allocated daily on a pro-rata basis to each class based on the relative net assets of each class to the total net assets of a fund. Each class differs with respect to transfer agent and distribution and service plan fees incurred, as applicable. Certain expense reductions may also differ by class, if applicable. For the reporting period, the allocated portion of income and expenses to each class as a percent of its average net assets may vary due to the timing of recording these transactions in relation to fluctuating net assets of the classes. Expenses directly attributable to a fund are charged to that fund. Expenses attributable to more than one fund are allocated among the respective funds on the basis of relative net assets or other appropriate methods. Expenses included in the accompanying financial statements reflect the expenses of that fund and do not include any expenses associated with any underlying mutual funds or exchange-traded funds (ETFs). Although not included in a fund's expenses, a fund indirectly bears its proportionate share of these expenses through the net asset value of each underlying mutual fund or exchange-traded fund (ETF). Expense estimates are accrued in the period to which they relate and adjustments are made when actual amounts are known.
Income Tax Information and Distributions to Shareholders. Each year, the Fund intends to qualify as a regulated investment company under Subchapter M of the Internal Revenue Code, including distributing substantially all of its taxable income and realized gains. As a result, no provision for U.S. Federal income taxes is required. The Fund files a U.S. federal tax return, in addition to state and local tax returns as required. The Fund's federal income tax returns are subject to examination by the Internal Revenue Service (IRS) for a period of three fiscal years after they are filed. State and local tax returns may be subject to examination for an additional fiscal year depending on the jurisdiction.
Distributions are declared and recorded on the ex-dividend date. Income and capital gain distributions are declared separately for each class. Income and capital gain distributions are determined in accordance with income tax regulations, which may differ from GAAP.
Capital accounts within the financial statements are adjusted for permanent book-tax differences. These adjustments have no impact on net assets or the results of operations. Capital accounts are not adjusted for temporary book-tax differences which will reverse in a subsequent period.
Book-tax differences are primarily due to futures contracts, swaps, capital loss carryforwards and losses deferred due to wash sales and futures contracts.
As of period end, the cost and unrealized appreciation (depreciation) in securities, and derivatives if applicable, for federal income tax purposes were as follows:
| Gross unrealized appreciation | $15,287,613 |
| Gross unrealized depreciation | (150,546,205) |
| Net unrealized appreciation (depreciation) | $(135,258,592) |
| Tax cost | $3,829,457,792 |
Capital loss carryforwards are only available to offset future capital gains of the Fund to the extent provided by regulations and may be limited. The capital loss carryforward information presented below, including any applicable limitation, is estimated as of prior fiscal period end and is subject to adjustment.
Short-term | $(52,587,483) |
Long-term | (19,671,573) |
| Total capital loss carryforward | $(72,259,056) |
Delayed Delivery Transactions and When-Issued Securities. During the period, certain Funds transacted in securities on a delayed delivery or when-issued basis. Payment and delivery may take place after the customary settlement period for that security. The price of the underlying securities and the date when the securities will be delivered and paid for are fixed at the time the transaction is negotiated. Securities purchased on a delayed delivery or when-issued basis are identified as such in the Schedule of Investments. Compensation for interest forgone in the purchase of a delayed delivery or when-issued debt security may be received. With respect to purchase commitments, each applicable Fund identifies securities as segregated in its records with a value at least equal to the amount of the commitment. Payables and receivables associated with the purchases and sales of delayed delivery securities having the same coupon, settlement date and broker are offset. Delayed delivery or when-issued securities that have been purchased from and sold to different brokers are reflected as both payables and receivables in the Statement of Assets and Liabilities under the caption "Delayed delivery", as applicable. Losses may arise due to changes in the value of the underlying securities or if the counterparty does not perform under the contract's terms, or if the issuer does not issue the securities due to political, economic, or other factors.
To-Be-Announced (TBA) Securities and Mortgage Dollar Rolls. TBA securities involve buying or selling mortgage-backed securities (MBS) on a forward commitment basis. A TBA transaction typically does not designate the actual security to be delivered and only includes an approximate principal amount; however delivered securities must meet specified terms defined by industry guidelines, including issuer, rate and current principal amount outstanding on underlying mortgage pools. Funds may enter into a TBA transaction with the intent to take possession of or deliver the underlying MBS, or a fund may elect to extend the settlement by entering into either a mortgage or reverse mortgage dollar roll. Mortgage dollar rolls are transactions where a fund sells TBA securities and simultaneously agrees to repurchase MBS on a later date at a lower price and with the same counterparty. Reverse mortgage dollar rolls involve the purchase and simultaneous agreement to sell TBA securities on a later date at a lower price. Transactions in mortgage dollar rolls and reverse mortgage dollar rolls are accounted for as purchases and sales and may result in an increase to a fund's portfolio turnover rate.
Purchases and sales of TBA securities involve risks similar to those discussed above for delayed delivery and when-issued securities. Also, if the counterparty in a mortgage dollar roll or a reverse mortgage dollar roll transaction files for bankruptcy or becomes insolvent, a fund's right to repurchase or sell securities may be limited. Additionally, when a fund sells TBA securities without already owning or having the right to obtain the deliverable securities (an uncovered forward commitment to sell), it incurs a risk of loss because it could have to purchase the securities at a price that is higher than the price at which it sold them. A fund may be unable to purchase the deliverable securities if the corresponding market is illiquid.
TBA securities subject to a forward commitment to sell at period end are included at the end of the Schedule of Investments under the caption "TBA Sale Commitments." The value of these commitments and proceeds to be received at contractual settlement date are reflected in the Statement of Assets and Liabilities as "TBA sale commitments, at value" and "Receivable for TBA sale commitments," respectively. If the TBA sale commitment is closed through the acquisition of an offsetting TBA purchase commitment, a fund realizes a gain or loss. If a fund delivers securities under the commitment, a fund realizes a gain or loss from the sale of the securities based upon the price established at the date the commitment was entered into.
Restricted Securities (including Private Placements). Funds may invest in securities that are subject to legal or contractual restrictions on resale. These securities generally may be resold in transactions exempt from registration or to the public if the securities are registered. Disposal of these securities may involve time-consuming negotiations and expense, and prompt sale at an acceptable price may be difficult. Information regarding restricted securities held at period end is included at the end of the Schedule of Investments, if applicable.
4. Derivative Instruments.
Risk Exposures and the Use of Derivative Instruments. The Fund's investment objectives allow for various types of derivative instruments, including futures contracts, swaps and options. Derivatives are investments whose value is primarily derived from underlying assets, indices or reference rates and may be transacted on an exchange or over-the-counter (OTC). Derivatives may involve a future commitment to buy or sell a specified asset based on specified terms, to exchange future cash flows at periodic intervals based on a notional principal amount, or for one party to make one or more payments upon the occurrence of specified events in exchange for periodic payments from the other party.
Derivatives were used to increase returns, to gain exposure to certain types of assets and to manage exposure to certain risks as defined below. The success of any strategy involving derivatives depends on analysis of numerous economic factors, and if the strategies for investment do not work as intended, the objectives may not be achieved.
Derivatives were used to increase or decrease exposure to the following risk(s):
| | |
| Credit Risk | Credit risk relates to the ability of the issuer of a financial instrument to make further principal or interest payments on an obligation or commitment that it has to a fund. |
| Interest Rate Risk | Interest rate risk relates to the fluctuations in the value of interest-bearing securities due to changes in the prevailing levels of market interest rates. |
Funds are also exposed to additional risks from investing in derivatives, such as liquidity risk and counterparty credit risk. Liquidity risk is the risk that a fund will be unable to close out the derivative in the open market in a timely manner. Counterparty credit risk is the risk that the counterparty will not be able to fulfill its obligation to a fund. Derivative counterparty credit risk is managed through formal evaluation of the creditworthiness of all potential counterparties. On certain OTC derivatives such as options and bi-lateral swaps, a fund attempts to reduce its exposure to counterparty credit risk by entering into an International Swaps and Derivatives Association, Inc. (ISDA) Master Agreement with each of its counterparties. The ISDA Master Agreement gives a fund the right to terminate all transactions traded under such agreement upon the deterioration in the credit quality of the counterparty beyond specified levels. The ISDA Master Agreement gives each party the right, upon an event of default by the other party or a termination of the agreement, to close out all transactions traded under such agreement and to net amounts owed under each transaction to one net payable by one party to the other. To mitigate counterparty credit risk on bi-lateral OTC derivatives, a fund receives collateral in the form of cash or securities once net unrealized appreciation on outstanding derivative contracts under an ISDA Master Agreement exceeds certain applicable thresholds, subject to certain minimum transfer provisions. The collateral received is held in segregated accounts with the custodian bank in accordance with the collateral agreements entered into between a fund, the counterparty and the custodian bank. A fund could experience delays and costs in gaining access to the collateral even though it is held by the custodian bank. The maximum risk of loss to a fund from counterparty credit risk related to bi-lateral OTC derivatives is generally the aggregate unrealized appreciation and unpaid counterparty payments in excess of any collateral pledged by the counterparty to a fund. For OTC written options with upfront premiums received, a fund is obligated to perform and therefore does not have counterparty risk. For OTC written options with premiums to be received at a future date, the maximum risk of loss from counterparty credit risk is the amount of the premium in excess of any collateral pledged by the counterparty. A fund may be required to pledge collateral for the benefit of the counterparties on bi-lateral OTC derivatives in an amount not less than each counterparty's unrealized appreciation on outstanding derivative contracts, subject to certain minimum transfer provisions, and any such pledged collateral is identified in the Schedule of Investments. Exchange-traded contracts are not covered by the ISDA Master Agreement; however counterparty credit risk related to these contracts may be mitigated by the protection provided by the exchange on which they trade. Counterparty credit risk related to centrally cleared swaps may be mitigated by the protection provided by the clearinghouse.
Investing in derivatives may involve greater risks than investing in the underlying assets directly and, to varying degrees, may involve risk of loss in excess of any initial investment and collateral received and amounts recognized in the Statement of Assets and Liabilities. In addition, there may be the risk that the change in value of the derivative contract does not correspond to the change in value of the underlying instrument.
Net Realized Gain (Loss) and Change in Net Unrealized Appreciation (Depreciation) on Derivatives. The table below, which reflects the impacts of derivatives on the financial performance, summarizes the net realized gain (loss) and change in net unrealized appreciation (depreciation) for derivatives during the period as presented in the Statement of Operations.
| Primary Risk Exposure / Derivative Type | Net Realized Gain (Loss)($) | Change in Net Unrealized Appreciation (Depreciation)($) |
| VIP Investment Grade Bond II Portfolio | | |
| Credit Risk | | |
| Swaps | (64,929) | (73,309) |
| Total Credit Risk | (64,929) | (73,309) |
| Interest Rate Risk | | |
| Futures Contracts | (162,598) | 113,526 |
| Purchased Options | - | (164,305) |
| Written Options | 18,474 | (1,092) |
| Swaps | 705,595 | 1,406,360 |
| Total Interest Rate Risk | 561,471 | 1,354,489 |
| Totals | 496,542 | 1,281,180 |
If there are any open positions at period end, a summary of the value of derivatives by primary risk exposure is included at the end of the Schedule of Investments.
Futures Contracts. A futures contract is an agreement between two parties to buy or sell a specified underlying instrument for a fixed price at a specified future date. Futures contracts were used to manage exposure to the bond market and fluctuations in interest rates.
Upon entering into a futures contract, a fund is required to deposit either cash or securities (initial margin) with a clearing broker in an amount equal to a certain percentage of the face value of the contract. Futures contracts are marked-to-market daily and subsequent daily payments are made or received by a fund depending on the daily fluctuations in the value of the futures contracts and are recorded as unrealized appreciation or (depreciation). This receivable and/or payable, if any, is included in daily variation margin on futures contracts in the Statement of Assets and Liabilities. Realized gain or (loss) is recorded upon the expiration or closing of a futures contract. The net realized gain (loss) and change in net unrealized appreciation (depreciation) on futures contracts during the period is presented in the Statement of Operations.
Any open futures contracts at period end are presented in the Schedule of Investments under the caption "Futures Contracts". The notional amount at value reflects each contract's exposure to the underlying instrument or index at period end, and is representative of volume of activity during the period unless an average notional amount is presented. Any securities deposited to meet initial margin requirements are identified in the Schedule of Investments. Any cash deposited to meet initial margin requirements is presented as segregated cash with brokers for derivative instruments in the Statement of Assets and Liabilities.
Options. Options give the purchaser the right, but not the obligation, to buy (call) or sell (put) an underlying security or financial instrument at an agreed exercise or strike price between or on certain dates. Options obligate the seller (writer) to buy (put) or sell (call) an underlying instrument at the exercise or strike price or cash settle an underlying derivative instrument if the holder exercises the option on or before the expiration date. OTC options, such as swaptions, which are options where the underlying instrument is a swap, were used to manage exposure to fluctuations in interest rates.
Upon entering into an options contract, a fund will pay or receive a premium. Premiums paid on purchased options are reflected as cost of investments and premiums received on written options are reflected as a liability on the Statement of Assets and Liabilities. Certain options may be purchased or written with premiums to be paid or received on a future date. Options are valued daily and any unrealized appreciation (depreciation) is reflected in total accumulated earnings (loss) in the Statement of Assets and Liabilities. When an option is exercised, the cost or proceeds of the underlying instrument purchased or sold is adjusted by the amount of the premium. When an option is closed, a gain or loss is realized depending on whether the proceeds or amount paid for the closing sale transaction is greater or less than the premium received or paid. When an option expires, gains and losses are realized to the extent of premiums received and paid, respectively. The net realized and unrealized gains (losses) on purchased options are included in the Statement of Operations in net realized gain (loss) and change in net unrealized appreciation (depreciation) on investment securities. The net realized gain (loss) and change in net unrealized appreciation (depreciation) on written options are presented in the Statement of Operations.
Any open options at period end are presented in the Schedule of Investments under the captions "Purchased Options," "Purchased Swaptions," "Written Options" and "Written Swaptions," as applicable, and are representative of volume of activity during the period unless an average notional amount is presented.
Writing puts and buying calls tend to increase exposure to the underlying instrument while buying puts and writing calls tend to decrease exposure to the underlying instrument. For purchased options, risk of loss is limited to the premium paid, and for written options, risk of loss is the change in value in excess of the premium received.
Swaps. A swap is a contract between two parties to exchange future cash flows at periodic intervals based on a notional principal amount. A bi-lateral OTC swap is a transaction between a fund and a dealer counterparty where cash flows are exchanged between the two parties for the life of the swap. A centrally cleared swap is a transaction executed between a fund and a dealer counterparty, then cleared by a futures commission merchant (FCM) through a clearinghouse. Once cleared, the clearinghouse serves as a central counterparty, with whom a fund exchanges cash flows for the life of the transaction, similar to transactions in futures contracts.
Bi-lateral OTC swaps are marked-to-market daily and changes in value are reflected in the Statement of Assets and Liabilities in the bi-lateral OTC swaps at value line items. Any upfront premiums paid or received upon entering a bi-lateral OTC swap to compensate for differences between stated terms of the swap and prevailing market conditions (e.g. credit spreads, interest rates or other factors) are recorded in total accumulated earnings (loss) in the Statement of Assets and Liabilities and amortized to realized gain or (loss) ratably over the term of the swap. Any unamortized upfront premiums are presented in the Schedule of Investments.
Centrally cleared swaps require a fund to deposit either cash or securities (initial margin) with the FCM, at the instruction of and for the benefit of the clearinghouse. Any securities deposited to meet initial margin requirements are identified in the Schedule of Investments. Any cash deposited to meet initial margin requirements is presented in segregated cash with brokers for derivative instruments in the Statement of Assets and Liabilities. Centrally cleared swaps are marked-to-market daily and subsequent payments (variation margin) are made or received depending on the daily fluctuations in the value of the swaps and are recorded as unrealized appreciation or (depreciation). These daily payments, if any, are included in receivable or payable for daily variation margin on centrally cleared swaps in the Statement of Assets and Liabilities. Any premiums for centrally cleared swaps are recorded periodically throughout the term of the swap to variation margin and included in total accumulated earnings (loss) in the Statement of Assets and Liabilities. Any premiums are recognized as realized gain (loss) upon termination or maturity of the swap.
For both bi-lateral and centrally cleared swaps, payments are exchanged at specified intervals, accrued daily commencing with the effective date of the contract and recorded as realized gain or (loss). Some swaps may be terminated prior to the effective date and realize a gain or loss upon termination. The net realized gain (loss) and change in net unrealized appreciation (depreciation) on swaps during the period is presented in the Statement of Operations.
Any open swaps at period end are included in the Schedule of Investments under the caption "Swaps", and are representative of volume of activity during the period unless an average notional amount is presented.
Credit Default Swaps. Credit default swaps enable a fund to buy or sell protection against specified credit events on a single-name issuer or a traded credit index. Under the terms of a credit default swap the buyer of protection (buyer) receives credit protection in exchange for making periodic payments to the seller of protection (seller) based on a fixed percentage applied to a notional principal amount. In return for these payments, the seller will be required to make a payment upon the occurrence of one or more specified credit events. A fund enters into credit default swaps as a seller to gain credit exposure to an issuer and/or as a buyer to obtain a measure of protection against defaults of an issuer. Periodic payments are made over the life of the contract by the buyer provided that no credit event occurs.
For credit default swaps on most corporate and sovereign issuers, credit events include bankruptcy, failure to pay or repudiation/moratorium. For credit default swaps on corporate or sovereign issuers, the obligation that may be put to the seller is not limited to the specific reference obligation described in the Schedule of Investments. For credit default swaps on asset-backed securities, a credit event may be triggered by events such as failure to pay principal, maturity extension, rating downgrade or write-down. For credit default swaps on asset-backed securities, the reference obligation described represents the security that may be put to the seller. For credit default swaps on a traded credit index, a specified credit event may affect all or individual underlying securities included in the index.
As a seller, if an underlying credit event occurs, a fund will pay a net settlement amount of cash equal to the notional amount of the swap less the recovery value of the reference obligation or underlying securities comprising an index. Only in the event of the industry's inability to value the underlying asset will a fund be required to take delivery of the reference obligation or underlying securities comprising an index and pay an amount equal to the notional amount of the swap.
As a buyer, if an underlying credit event occurs, a fund will receive a net settlement amount of cash equal to the notional amount of the swap less the recovery value of the reference obligation or underlying securities comprising an index. Only in the event of the industry's inability to value the underlying asset will a fund be required to deliver the reference obligation or underlying securities comprising an index in exchange for payment of an amount equal to the notional amount of the swap.
Typically, the value of each credit default swap and credit rating disclosed for each reference obligation in the Schedule of Investments, where a fund is the seller, can be used as measures of the current payment/performance risk of the swap. As the value of the swap changes as a positive or negative percentage of the total notional amount, the payment/performance risk may decrease or increase, respectively. In addition to these measures, the investment adviser monitors a variety of factors including cash flow assumptions, market activity and market sentiment as part of its ongoing process of assessing payment/performance risk.
Interest Rate Swaps. Interest rate swaps are agreements between counterparties to exchange cash flows, one based on a fixed rate, and the other on a floating rate. A fund enters into interest rate swaps to manage its exposure to interest rate changes. Changes in interest rates can have an effect on both the value of bond holdings as well as the amount of interest income earned. In general, the value of bonds can fall when interest rates rise and can rise when interest rates fall.
5. Purchases and Sales of Investments.
Purchases and sales of securities, other than short-term securities, U.S. government securities and in-kind transactions, as applicable, are noted in the table below.
| | Purchases ($) | Sales ($) |
| VIP Investment Grade Bond II Portfolio | 2,232,631,530 | 2,187,293,473 |
6. Fees and Other Transactions with Affiliates.
Management Fee. Fidelity Management & Research Company LLC (the investment adviser) and its affiliates provide the Fund with investment management related services for which the Fund pays a monthly management fee.
Effective March 1, 2024, the Fund's management contract was amended to incorporate administrative services previously covered under separate services agreements (Transfer Agent and Accounting agreements). The amended contract incorporates a management fee rate that may vary by class. The investment adviser or an affiliate pays certain expenses of managing and operating the Fund out of each class's management fee. Each class of the Fund pays a management fee to the investment adviser. The management fee is calculated and paid to the investment adviser every month. When determining a class's management fee, a mandate rate is calculated based on the monthly average net assets of a group of funds advised by FMR within a designated asset class. A discount rate is subtracted from the mandate rate once the Fund's monthly average net assets reach a certain level. The mandate rate and discount rate may vary by class. The annual management fee rate for a class of shares of the Fund is the lesser of (1) the class's mandate rate reduced by the class's discount rate (if applicable) or (2) the amount set forth in the following table.
| | Maximum Management Fee Rate % |
| Initial Class | .38 |
| Investor Class | .41 |
One-twelfth of the management fee rate for a class is applied to the average net assets of the class for the month, giving a dollar amount which is the management fee for the class for that month. A different management fee rate may be applicable to each class of the Fund. The difference between classes is the result of separate arrangements for class-level services and/or waivers of certain expenses. It is not the result of any difference in advisory or custodial fees or other expenses related to the management of the Fund's assets, which do not vary by class. For the portion of the reporting period on or after March 1, 2024, the total annualized management fee rates were as follows:
| | Total Management Fee Rate % |
| Initial Class | .38 |
| Investor Class | .41 |
Prior to March 1, 2024, the management fee was the sum of an individual fund fee rate that was based on an annual rate of .20% of the Fund's average net assets and an annualized group fee rate that averaged .10% during the period. The group fee rate was based upon the monthly average net assets of a group of registered investment companies with which the investment adviser has management contracts. The group fee rate decreased as assets under management increased and increased as assets under management decreased. For the portion of the reporting period prior to March 1, 2024, the total annualized management fee rate was .30%.
Effective March 1, 2024, the Fund's sub-advisory agreements with FMR Investment Management (UK) Limited, Fidelity Management & Research (Hong Kong) Limited, and Fidelity Management & Research (Japan) Limited were amended to provide that the investment adviser pays each sub-adviser monthly fees equal to 110% of the sub-adviser's costs for providing sub-advisory services.
Transfer Agent Fees. Fidelity Investments Institutional Operations Company LLC (FIIOC), an affiliate of the investment adviser, is the Fund's transfer, dividend disbursing, and shareholder servicing agent. Effective March 1, 2024, the Fund's management contract was amended to incorporate transfer agent services and associated fees previously covered under a separate services agreement.
During the period January 1, 2024 through February 29, 2024, the transfer agent fees for each class were a fixed annual rate of class-level average net assets as follows:
| | Amount ($) | % of Class-Level Average Net Assets |
| Initial Class | 70,617 | .0680 |
| Investor Class | 415,869 | .1020 |
| | 486,486 | |
Accounting Fees. Fidelity Service Company, Inc. (FSC), an affiliate of the investment adviser, maintains the Fund's accounting records. Effective March 1, 2024, the Fund's management contract was amended to incorporate accounting services and associated fees previously covered under a separate services agreement.
During the period January 1, 2024 through February 29, 2024, the accounting fees were a fixed annual rate of average net assets as follows:
| | % of Average Net Assets |
| VIP Investment Grade Bond II Portfolio | .0319 |
Interfund Trades. Funds may purchase from or sell securities to other Fidelity Funds under procedures adopted by the Board. The procedures have been designed to ensure these interfund trades are executed in accordance with Rule 17a-7 of the 1940 Act. Any interfund trades are included within the respective purchases and sales amounts shown in the Purchases and Sales of Investments note. During the period, there were no interfund trades.
7. Committed Line of Credit.
Certain Funds participate with other funds managed by the investment adviser or an affiliate in a $4.25 billion credit facility (the "line of credit") to be utilized for temporary or emergency purposes to fund shareholder redemptions or for other short-term liquidity purposes. The participating funds have agreed to pay commitment fees on their pro-rata portion of the line of credit, which are reflected in Miscellaneous expenses on the Statement of Operations, and are listed below. During the period, there were no borrowings on this line of credit.
| | Amount ($) |
| VIP Investment Grade Bond II Portfolio | 2,829 |
8. Expense Reductions.
Through arrangements with the Fund's custodian, credits realized as a result of certain uninvested cash balances were used to reduce the Fund's expenses. During the period, custodian credits reduced the Fund's expenses by $1,463.
In addition, during the period the investment adviser or an affiliate reimbursed and/or waived a portion of fund-level operating expenses in the amount of $72,707.
9. Distributions to Shareholders.
Distributions to shareholders of each class were as follows:
| | Six months ended June 30, 2024 | Year ended December 31, 2023 |
| VIP Investment Grade Bond II Portfolio | | |
| Distributions to shareholders | | |
| Initial Class | $383,646 | $23,447,707 |
| Investor Class | 1,575,393 | 91,765,959 |
Total | $1,959,039 | $115,213,666 |
10. Share Transactions.
Transactions for each class of shares were as follows and may contain in-kind transactions:
| | Shares | Shares | Dollars | Dollars |
| | Six months ended June 30, 2024 | Year ended December 31, 2023 | Six months ended June 30, 2024 | Year ended December 31, 2023 |
| VIP Investment Grade Bond II Portfolio | | | | |
| Initial Class | | | | |
| Shares sold | 27,215,144 | 21,072,688 | $257,552,812 | $198,853,080 |
| Reinvestment of distributions | 41,297 | 2,561,711 | 383,646 | 23,447,707 |
| Shares redeemed | (14,564,517) | (12,058,072) | (139,866,633) | (113,550,841) |
| Net increase (decrease) | 12,691,924 | 11,576,327 | $118,069,825 | $108,749,946 |
| Investor Class | | | | |
| Shares sold | 21,040,872 | 41,309,206 | $204,097,937 | $389,397,660 |
| Reinvestment of distributions | 169,579 | 10,024,101 | 1,575,393 | 91,765,959 |
| Shares redeemed | (22,665,993) | (35,286,498) | (219,189,322) | (332,184,313) |
| Net increase (decrease) | (1,455,542) | 16,046,809 | $(13,515,992) | $148,979,306 |
11. Other.
A fund's organizational documents provide former and current trustees and officers with a limited indemnification against liabilities arising in connection with the performance of their duties to the fund. In the normal course of business, a fund may also enter into contracts that provide general indemnifications. A fund's maximum exposure under these arrangements is unknown as this would be dependent on future claims that may be made against a fund. The risk of material loss from such claims is considered remote.
At the end of the period, the following mutual funds managed by the investment adviser or its affiliates were the owners of record of 10% or more of the total outstanding shares.
| | VIP FundsManager 50% Portfolio | VIP FundsManager 60% Portfolio |
| VIP Investment Grade Bond Portfolio II | 23% | 31% |
Mutual funds managed by the investment adviser or its affiliates, in aggregate, were the owners of record of more than 20% of the total outstanding shares.
| | % of shares held |
| VIP Investment Grade Bond Portfolio II | 95% |
12. Risk and Uncertainties.
Many factors affect a fund's performance. Developments that disrupt global economies and financial markets, such as pandemics, epidemics, outbreaks of infectious diseases, war, terrorism, and environmental disasters, may significantly affect a fund's investment performance. The effects of these developments to a fund will be impacted by the types of securities in which a fund invests, the financial condition, industry, economic sector, and geographic location of an issuer, and a fund's level of investment in the securities of that issuer. Significant concentrations in security types, issuers, industries, sectors, and geographic locations may magnify the factors that affect a fund's performance.
Item 8: Changes in and Disagreements with Accountants for Open-End Management Investment Companies
Note: This is not applicable for any fund included in this document.
Item 9: Proxy Disclosures for Open-End Management Investment Companies
Note: This is not applicable for any fund included in this document.
Item 10: Remuneration Paid to Directors, Officers, and others of Open-End Management Investment Companies
Note: This information is disclosed as part of the financial statements for each Fund as part of Item 7: Financial Statements and Financial Highlights for Open-End Management Investment companies.
Item 11: Statement Regarding Basis for Approval of Investment Advisory Contract
Board Approval of Investment Advisory Contracts
VIP Investment Grade Bond II Portfolio
At its January 2024 meeting, the Board of Trustees, including the Independent Trustees (together, the Board), approved an amended and restated management contract with Fidelity Management & Research Company LLC (FMR) (the Management Contract), and amended and restated sub-advisory agreements (the Sub-Advisory Contracts, and together with the Management Contract, the Advisory Contracts) for the fund, including the fund's sub-advisory agreements with FMR Investment Management (UK) Limited (FMR UK), Fidelity Management & Research (Hong Kong) Limited (FMR H.K.), and Fidelity Management & Research (Japan) Limited (FMR Japan). The Advisory Contracts will be effective March 1, 2024. The Board will consider the annual renewal of the fund's Advisory Contracts in September 2024, following its review of additional materials provided by FMR.
Management Contract. The Board approved the Management Contract, which implements a new fee structure combining the management fee, transfer agent fee (TA Fee), and pricing and bookkeeping fee (P&B Fee) of the fund and each class into a single class-level fee based on tiered schedules and subject to a maximum class-level rate (the Unified Fee). In exchange for the Unified Fee, the fund will receive investment advisory, management, administrative, transfer agent, pricing and bookkeeping services under a single agreement - the Management Contract.
In its consideration of the Management Contract over several meetings, the Board received, reviewed and discussed a comprehensive set of analyses regarding the Unified Fee including (i) the legal framework, (ii) design goals for the Unified Fee, (iii) calculation methodology for the Unified Fee and illustrative examples, (iv) annual and cumulative projected impacts under various scenarios, both in the aggregate and at the fund/class level, (v) explanations of schedules, rate levers and maximum rates and (vi) shareholder benefits and projected savings.
The Board considered that the maximum Unified Fee for each class of the fund would be no higher than the sum of (i) the lowest contractual management fee under the fund's existing management contract, which is the individual fund fee, if any, plus the lowest contractual marginal group fee rate and (ii) the TA and P&B Fee rates, which are fixed fee rates since December 1, 2023 (together, the "Unified Fee Cap"). The Board noted that, as a result of this Unified Fee Cap, the Unified Fee would be no greater than the fees previously authorized to be charged for the same services. The Board noted that certain expenses such as third-party expenses, Rule 12b-1 fees, and certain other miscellaneous expenses would be outside the scope of the Unified Fee and the calculation of such fees would not change as a result of the Unified Fee. The Board considered that, under the Management Contract, a different management fee rate will be applicable to each class of the fund. The Board noted that Fidelity has represented that the difference in expenses between classes is based on differences in class-specific expenses and not due to any difference in advisory or third-party custodial fees or other expenses related to the management of the fund's assets.
The Board considered that implementation of the Unified Fee, which includes the Unified Fee Cap, would cause all funds subject to a Unified Fee, including the fund, to experience an immediate reduction on contractual fee rates for services provided under the current management contracts. The Board considered that some funds would not experience lower fees as a result of existing fee caps. The Board further considered that, in addition to the contractual fee savings, the Unified Fee offers funds and their shareholders greater protection from future rate increases for services previously offered under separate agreements that are now covered by the Management Contract because such rate increases would require shareholder, as well as Board, approval.
Sub-Advisory Contracts. In connection with the Unified Fee changes, the Board considered the Sub-Advisory Contracts, which changed the arrangements for fees paid by FMR to the sub-advisers under the agreements. The Board noted that the agreements with FMR UK, FMR H.K., and FMR Japan were amended to provide that FMR will compensate each sub-adviser at a fee equal to 110% of the sub-adviser's costs incurred in providing services under the agreement. The Board considered that, under the Sub-Advisory Contracts, FMR, and not the fund, will continue to pay the sub-advisory fees to each applicable sub-adviser.
The Board considered that the approval of the fund's Advisory Contracts will not result in any changes in the investment process or strategies employed in the management of the fund's assets or the day-to-day management of the fund or the persons primarily responsible for such management. Further, the Board considered that the Management Contract would not change the obligations and services of FMR and its affiliates on behalf of the fund, and, in particular, there would be no change in the nature and level of advisory, management, administration, transfer agent, and pricing and bookkeeping services provided to the fund by FMR and its affiliates.
In connection with its consideration of future renewals of the fund's Advisory Contracts, the Board will consider: (i) the nature, extent and quality of services provided to the funds, including shareholder and administrative services and investment performance; (ii) the competitiveness of the management fee and total expenses for the fund; (iii) the costs of the services and profitability, including the revenues earned and the expenses incurred in conducting the business of developing, marketing, distributing, managing, administering, and servicing the fund and its shareholders, to the extent applicable; and (iv) whether there have been economies of scale in respect of the Fidelity funds, whether the Fidelity funds (including the fund) have appropriately benefited from any such economies of scale, and whether there is the potential for realization of any further economies.
Based on its evaluation of all of the conclusions noted above, and after considering all factors it believed relevant, the Board concluded that the fund's management fee structure is fair and reasonable, and that the fund's Advisory Contracts should be approved.
1.9905667.102
VIGBI-SANN-0824
Fidelity® Variable Insurance Products:
VIP Strategic Income Portfolio
Semi-Annual Report
June 30, 2024
Contents
To view a fund's proxy voting guidelines and proxy voting record for the 12-month period ended June 30, visit http://www.fidelity.com/proxyvotingresults or visit the Securities and Exchange Commission's (SEC) web site at http://www.sec.gov.
You may also call 1-877-208-0098 to request a free copy of the proxy voting guidelines.
Fidelity® Variable Insurance Products are separate account options which are purchased through a variable insurance contract.
Standard & Poor's, S&P and S&P 500 are registered service marks of The McGraw-Hill Companies, Inc. and have been licensed for use by Fidelity Distributors Corporation.
Other third-party marks appearing herein are the property of their respective owners.
All other marks appearing herein are registered or unregistered trademarks or service marks of FMR LLC or an affiliated company. © 2024 FMR LLC. All rights reserved.
This report and the financial statements contained herein are submitted for the general information of the shareholders of the Fund. This report is not authorized for distribution to prospective investors in the Fund unless preceded or accompanied by an effective prospectus.
A fund files its complete schedule of portfolio holdings with the SEC for the first and third quarters of each fiscal year on Form N-PORT. Forms N-PORT are available on the SEC's web site at http://www.sec.gov. A fund's Forms N-PORT may be reviewed and copied at the SEC's Public Reference Room in Washington, DC. Information regarding the operation of the SEC's Public Reference Room may be obtained by calling 1-800-SEC-0330.
For a complete list of a fund's portfolio holdings, view the most recent holdings listing, semiannual report, or annual report on Fidelity's web site at http://www.fidelity.com, http://www.institutional.fidelity.com, or http://www.401k.com, as applicable.
NOT FDIC INSURED •MAY LOSE VALUE •NO BANK GUARANTEE
Neither the Fund nor Fidelity Distributors Corporation is a bank.
Item 7: Financial Statements and Financial Highlights for Open-End Management Investment Companies (Semi-Annual Report)
VIP Strategic Income Portfolio
Schedule of Investments June 30, 2024 (Unaudited)
Showing Percentage of Net Assets
| Corporate Bonds - 35.1% |
| | | Principal Amount (a) | Value ($) |
| Convertible Bonds - 0.5% | | | |
| COMMUNICATION SERVICES - 0.2% | | | |
| Media - 0.2% | | | |
| DISH Network Corp.: | | | |
| 0% 12/15/25 | | 1,767,000 | 1,298,927 |
| 3.375% 8/15/26 | | 2,667,000 | 1,653,967 |
| | | | 2,952,894 |
| CONSUMER DISCRETIONARY - 0.1% | | | |
| Hotels, Restaurants & Leisure - 0.1% | | | |
| New Cotai LLC 5% 2/24/27 (b) | | 310,010 | 669,405 |
| | | | |
| FINANCIALS - 0.0% | | | |
| Capital Markets - 0.0% | | | |
| Coinbase Global, Inc. 0.25% 4/1/30 (c) | | 390,000 | 375,570 |
| | | | |
| INFORMATION TECHNOLOGY - 0.2% | | | |
| Semiconductors & Semiconductor Equipment - 0.2% | | | |
| Wolfspeed, Inc. 1.875% 12/1/29 | | 5,455,000 | 3,005,705 |
| | | | |
| TOTAL CONVERTIBLE BONDS | | | 7,003,574 |
| Nonconvertible Bonds - 34.6% | | | |
| COMMUNICATION SERVICES - 2.5% | | | |
| Diversified Telecommunication Services - 0.8% | | | |
| Altice France SA: | | | |
| 5.125% 1/15/29(c) | | 135,000 | 88,084 |
| 5.125% 7/15/29(c) | | 4,495,000 | 2,955,917 |
| 5.5% 1/15/28(c) | | 1,355,000 | 928,022 |
| 5.5% 10/15/29(c) | | 2,950,000 | 1,944,308 |
| Colombia Telecomunicaciones SA 4.95% 7/17/30 (c) | | 210,000 | 164,063 |
| Frontier Communications Holdings LLC: | | | |
| 5% 5/1/28(c) | | 1,165,000 | 1,097,540 |
| 5.875% 10/15/27(c) | | 620,000 | 605,312 |
| IHS Holding Ltd. 5.625% 11/29/26 (c) | | 415,000 | 393,861 |
| Liquid Telecommunications Financing PLC 5.5% 9/4/26 (c) | | 830,000 | 526,013 |
| Qtel International Finance Ltd. 2.625% 4/8/31 (c) | | 385,000 | 331,702 |
| Qwest Corp. 7.25% 9/15/25 | | 35,000 | 34,054 |
| Sable International Finance Ltd. 5.75% 9/7/27 (c) | | 1,722,000 | 1,659,039 |
| Sitios Latinoamerica S.A.B. de CV 5.375% 4/4/32 (c) | | 445,000 | 412,598 |
| Telefonica Celular del Paraguay SA 5.875% 4/15/27 (c) | | 570,000 | 557,709 |
| Telenet Finance Luxembourg Notes SARL 5.5% 3/1/28 (c) | | 600,000 | 567,000 |
| | | | 12,265,222 |
| Entertainment - 0.1% | | | |
| Roblox Corp. 3.875% 5/1/30 (c) | | 1,160,000 | 1,030,654 |
| | | | |
| Interactive Media & Services - 0.1% | | | |
| Tencent Holdings Ltd.: | | | |
| 1.81% 1/26/26(c) | | 240,000 | 227,550 |
| 2.39% 6/3/30(c) | | 495,000 | 425,170 |
| 3.975% 4/11/29(c) | | 180,000 | 170,831 |
| | | | 823,551 |
| Media - 1.1% | | | |
| Altice Financing SA: | | | |
| 5% 1/15/28(c) | | 990,000 | 752,825 |
| 5.75% 8/15/29(c) | | 1,190,000 | 864,008 |
| DISH DBS Corp. 5.75% 12/1/28 (c) | | 685,000 | 474,920 |
| DISH Network Corp. 11.75% 11/15/27 (c) | | 2,920,000 | 2,863,059 |
| Gannett Holdings LLC 6% 11/1/26 (c) | | 400,000 | 381,882 |
| LCPR Senior Secured Financing DAC: | | | |
| 5.125% 7/15/29(c) | | 1,370,000 | 1,136,040 |
| 6.75% 10/15/27(c) | | 544,000 | 509,538 |
| Scripps Escrow II, Inc. 3.875% 1/15/29 (c) | | 165,000 | 114,919 |
| Sirius XM Radio, Inc.: | | | |
| 3.875% 9/1/31(c) | | 570,000 | 465,311 |
| 4% 7/15/28(c) | | 580,000 | 523,945 |
| 5% 8/1/27(c) | | 485,000 | 464,252 |
| Telecomunicaciones Digitales SA 4.5% 1/30/30 (c) | | 1,020,000 | 909,126 |
| TV Azteca SA de CV 8.25% (Reg. S) (d) | | 1,500,000 | 583,065 |
| Univision Communications, Inc.: | | | |
| 4.5% 5/1/29(c) | | 570,000 | 479,068 |
| 7.375% 6/30/30(c) | | 2,520,000 | 2,344,025 |
| 8.5% 7/31/31(c) | | 415,000 | 403,106 |
| Videotron Ltd. 5.125% 4/15/27 (c) | | 615,000 | 605,519 |
| VTR Finance BV 6.375% 7/15/28 (c) | | 320,000 | 278,600 |
| VZ Secured Financing BV 5% 1/15/32 (c) | | 1,105,000 | 942,201 |
| Ziggo BV 4.875% 1/15/30 (c) | | 430,000 | 382,274 |
| | | | 15,477,683 |
| Wireless Telecommunication Services - 0.4% | | | |
| AXIAN Telecom 7.375% 2/16/27 (c) | | 525,000 | 511,581 |
| C&W Senior Finance Ltd. 6.875% 9/15/27 (c) | | 2,480,000 | 2,379,482 |
| CT Trust 5.125% 2/3/32 (c) | | 720,000 | 636,120 |
| Millicom International Cellular SA: | | | |
| 4.5% 4/27/31(c) | | 530,000 | 455,138 |
| 7.375% 4/2/32(c) | | 265,000 | 264,205 |
| MTN (Mauritius) Investments Ltd. 6.5% 10/13/26 (c) | | 315,000 | 313,425 |
| VMED O2 UK Financing I PLC 4.75% 7/15/31 (c) | | 995,000 | 839,159 |
| VTR Comunicaciones SpA: | | | |
| 4.375% 4/15/29(c) | | 210,000 | 181,683 |
| 5.125% 1/15/28(c) | | 620,000 | 562,456 |
| | | | 6,143,249 |
TOTAL COMMUNICATION SERVICES | | | 35,740,359 |
| | | | |
| CONSUMER DISCRETIONARY - 3.8% | | | |
| Automobile Components - 0.3% | | | |
| Adient Global Holdings Ltd. 7% 4/15/28 (c) | | 300,000 | 307,067 |
| Clarios Global LP / Clarios U.S. Finance Co. 6.75% 5/15/28 (c) | | 600,000 | 607,232 |
| Dana, Inc. 4.5% 2/15/32 | | 410,000 | 352,111 |
| Hertz Corp.: | | | |
| 4.625% 12/1/26(c) | | 280,000 | 203,129 |
| 5% 12/1/29(c) | | 340,000 | 208,796 |
| 5.5%(b)(c)(d) | | 650,000 | 21,125 |
| 6%(b)(c)(d) | | 575,000 | 51,750 |
| 6.25%(b)(d) | | 670,000 | 21,775 |
| 7.125%(b)(c)(d) | | 620,000 | 55,800 |
| 12.625% 7/15/29(c) | | 130,000 | 134,417 |
| Macquarie AirFinance Holdings: | | | |
| 6.4% 3/26/29(c) | | 195,000 | 198,299 |
| 6.5% 3/26/31(c) | | 295,000 | 303,353 |
| 8.125% 3/30/29(c) | | 435,000 | 459,880 |
| Metalsa SA de CV 3.75% 5/4/31 (c) | | 455,000 | 363,318 |
| Nesco Holdings II, Inc. 5.5% 4/15/29 (c) | | 715,000 | 662,253 |
| Tenneco, Inc. 8% 11/17/28 (c) | | 880,000 | 801,104 |
| | | | 4,751,409 |
| Automobiles - 0.0% | | | |
| McLaren Finance PLC 7.5% 8/1/26 (c) | | 390,000 | 339,008 |
| | | | |
| Broadline Retail - 0.2% | | | |
| Alibaba Group Holding Ltd. 2.125% 2/9/31 | | 300,000 | 247,659 |
| Angi Group LLC 3.875% 8/15/28 (c) | | 335,000 | 287,844 |
| Grupo Axo SAPI de CV 5.75% 6/8/26 (c) | | 355,000 | 357,929 |
| JD.com, Inc. 3.375% 1/14/30 | | 850,000 | 774,401 |
| Prosus NV: | | | |
| 2.031% 8/3/32 (Reg. S) | EUR | 210,000 | 182,434 |
| 3.061% 7/13/31(c) | | 385,000 | 319,069 |
| 3.68% 1/21/30(c) | | 370,000 | 328,259 |
| 4.027% 8/3/50(c) | | 595,000 | 406,459 |
| 4.193% 1/19/32(c) | | 205,000 | 181,233 |
| | | | 3,085,287 |
| Distributors - 0.0% | | | |
| Windsor Holdings III, LLC 8.5% 6/15/30 (c) | | 295,000 | 307,888 |
| | | | |
| Diversified Consumer Services - 0.3% | | | |
| Adtalem Global Education, Inc. 5.5% 3/1/28 (c) | | 420,000 | 403,998 |
| GEMS MENASA Cayman Ltd./GEMS Education Delaware LLC 7.125% 7/31/26 (c) | | 1,130,000 | 1,122,938 |
| Service Corp. International 4% 5/15/31 | | 570,000 | 507,628 |
| TKC Holdings, Inc. 6.875% 5/15/28 (c) | | 950,000 | 921,088 |
| WASH Multifamily Acquisition, Inc. 5.75% 4/15/26 (c) | | 475,000 | 464,356 |
| | | | 3,420,008 |
| Hotels, Restaurants & Leisure - 2.1% | | | |
| 1011778 BC Unlimited Liability Co./New Red Finance, Inc.: | | | |
| 3.875% 1/15/28(c) | | 570,000 | 533,859 |
| 4% 10/15/30(c) | | 2,320,000 | 2,042,296 |
| 4.375% 1/15/28(c) | | 560,000 | 528,177 |
| Bimbo Bakeries U.S.A., Inc.: | | | |
| 5.375% 1/9/36(c) | | 200,000 | 194,750 |
| 6.4% 1/15/34(c) | | 400,000 | 422,375 |
| Bloomin Brands, Inc. / OSI Restaurant Partners LLC 5.125% 4/15/29 (c) | | 270,000 | 243,101 |
| Boyd Gaming Corp. 4.75% 6/15/31 (c) | | 715,000 | 648,008 |
| Carnival Corp.: | | | |
| 4% 8/1/28(c) | | 3,420,000 | 3,211,783 |
| 7% 8/15/29(c) | | 300,000 | 310,976 |
| 7.625% 3/1/26(c) | | 1,070,000 | 1,080,577 |
| Carnival Holdings (Bermuda) Ltd. 10.375% 5/1/28 (c) | | 885,000 | 958,087 |
| Churchill Downs, Inc.: | | | |
| 5.75% 4/1/30(c) | | 725,000 | 704,218 |
| 6.75% 5/1/31(c) | | 600,000 | 603,248 |
| Fertitta Entertainment LLC / Fertitta Entertainment Finance Co., Inc.: | | | |
| 4.625% 1/15/29(c) | | 1,175,000 | 1,070,027 |
| 6.75% 1/15/30(c) | | 1,600,000 | 1,405,050 |
| Garden SpinCo Corp. 8.625% 7/20/30 (c) | | 260,000 | 280,694 |
| GENM Capital Labuan Ltd. 3.882% 4/19/31 (c) | | 595,000 | 520,625 |
| Hilton Domestic Operating Co., Inc.: | | | |
| 3.75% 5/1/29(c) | | 330,000 | 302,597 |
| 4% 5/1/31(c) | | 500,000 | 447,553 |
| 4.875% 1/15/30 | | 975,000 | 935,780 |
| Hilton Worldwide Finance LLC/Hilton Worldwide Finance Corp. 4.875% 4/1/27 | | 435,000 | 427,397 |
| Jacobs Entertainment, Inc. 6.75% 2/15/29 (c) | | 395,000 | 366,343 |
| Light & Wonder International, Inc. 7.5% 9/1/31 (c) | | 295,000 | 304,800 |
| McDonald's Corp. 4.25% 3/7/35 (Reg. S) | EUR | 734,000 | 811,299 |
| Meituan: | | | |
| 2.125% 10/28/25(c) | | 275,000 | 262,609 |
| 3.05% 10/28/30(c) | | 335,000 | 288,205 |
| Merlin Entertainments PLC 5.75% 6/15/26 (c) | | 395,000 | 389,156 |
| MGM Resorts International 4.75% 10/15/28 | | 665,000 | 633,120 |
| NagaCorp Ltd. 7.95% 7/6/24 (Reg. S) | | 600,000 | 595,980 |
| NCL Corp. Ltd. 5.875% 2/15/27 (c) | | 550,000 | 542,815 |
| Ontario Gaming GTA LP / OTG Co. issuer, Inc. 8% 8/1/30 (c) | | 600,000 | 615,750 |
| Papa John's International, Inc. 3.875% 9/15/29 (c) | | 255,000 | 225,698 |
| Premier Entertainment Sub LLC: | | | |
| 5.625% 9/1/29(c) | | 510,000 | 366,766 |
| 5.875% 9/1/31(c) | | 110,000 | 74,809 |
| Royal Caribbean Cruises Ltd.: | | | |
| 5.375% 7/15/27(c) | | 415,000 | 408,618 |
| 6.25% 3/15/32(c) | | 565,000 | 569,747 |
| 7.25% 1/15/30(c) | | 300,000 | 310,625 |
| 8.25% 1/15/29(c) | | 2,295,000 | 2,423,242 |
| 9.25% 1/15/29(c) | | 1,725,000 | 1,841,548 |
| SeaWorld Parks & Entertainment, Inc. 5.25% 8/15/29 (c) | | 560,000 | 529,129 |
| Station Casinos LLC 4.625% 12/1/31 (c) | | 410,000 | 365,434 |
| Studio City Finance Ltd. 5% 1/15/29 (c) | | 320,000 | 281,700 |
| Voc Escrow Ltd. 5% 2/15/28 (c) | | 990,000 | 959,692 |
| Yum! Brands, Inc. 4.625% 1/31/32 | | 590,000 | 542,612 |
| | | | 30,580,875 |
| Household Durables - 0.3% | | | |
| Ashton Woods U.S.A. LLC/Ashton Woods Finance Co. 4.625% 4/1/30 (c) | | 410,000 | 366,442 |
| Brookfield Residential Properties, Inc./Brookfield Residential U.S. Corp. 4.875% 2/15/30 (c) | | 405,000 | 362,263 |
| Century Communities, Inc. 3.875% 8/15/29 (c) | | 420,000 | 374,437 |
| LGI Homes, Inc. 8.75% 12/15/28 (c) | | 285,000 | 296,857 |
| Tempur Sealy International, Inc.: | | | |
| 3.875% 10/15/31(c) | | 735,000 | 614,387 |
| 4% 4/15/29(c) | | 790,000 | 712,435 |
| TopBuild Corp. 3.625% 3/15/29 (c) | | 305,000 | 273,742 |
| TRI Pointe Homes, Inc. 5.7% 6/15/28 | | 865,000 | 848,357 |
| Vestel Elektonik Sanayi ve Ticaret A/S 9.75% 5/15/29 (c) | | 320,000 | 319,500 |
| | | | 4,168,420 |
| Specialty Retail - 0.5% | | | |
| Arko Corp. 5.125% 11/15/29 (c) | | 415,000 | 361,269 |
| Asbury Automotive Group, Inc.: | | | |
| 4.5% 3/1/28 | | 184,000 | 174,334 |
| 4.625% 11/15/29(c) | | 450,000 | 415,921 |
| 4.75% 3/1/30 | | 184,000 | 170,504 |
| 5% 2/15/32(c) | | 485,000 | 439,414 |
| Bath & Body Works, Inc.: | | | |
| 6.625% 10/1/30(c) | | 925,000 | 927,888 |
| 6.75% 7/1/36 | | 870,000 | 866,153 |
| 7.5% 6/15/29 | | 500,000 | 514,963 |
| Carvana Co.: | | | |
| 12% 12/1/28 pay-in-kind(c)(e) | | 183,511 | 197,334 |
| 13% 6/1/30 pay-in-kind(c)(e) | | 278,575 | 304,946 |
| 14% 6/1/31 pay-in-kind(c)(e) | | 330,834 | 372,083 |
| LBM Acquisition LLC 6.25% 1/15/29 (c) | | 900,000 | 795,489 |
| LCM Investments Holdings 8.25% 8/1/31 (c) | | 355,000 | 370,435 |
| PetSmart, Inc. / PetSmart Finance Corp.: | | | |
| 4.75% 2/15/28(c) | | 610,000 | 566,615 |
| 7.75% 2/15/29(c) | | 445,000 | 433,371 |
| Wand NewCo 3, Inc. 7.625% 1/30/32 (c) | | 565,000 | 583,527 |
| | | | 7,494,246 |
| Textiles, Apparel & Luxury Goods - 0.1% | | | |
| Crocs, Inc.: | | | |
| 4.125% 8/15/31(c) | | 280,000 | 243,792 |
| 4.25% 3/15/29(c) | | 435,000 | 396,493 |
| Kontoor Brands, Inc. 4.125% 11/15/29 (c) | | 240,000 | 217,260 |
| | | | 857,545 |
TOTAL CONSUMER DISCRETIONARY | | | 55,004,686 |
| | | | |
| CONSUMER STAPLES - 1.6% | | | |
| Beverages - 0.2% | | | |
| Anheuser-Busch InBev SA NV 3.95% 3/22/44 (Reg. S) | EUR | 1,250,000 | 1,314,839 |
| Central American Bottling Corp. 5.25% 4/27/29 (c) | | 600,000 | 558,000 |
| Triton Water Holdings, Inc. 6.25% 4/1/29 (c) | | 315,000 | 303,821 |
| | | | 2,176,660 |
| Consumer Staples Distribution & Retail - 0.7% | | | |
| Albertsons Companies LLC/Safeway, Inc./New Albertson's, Inc./Albertson's LLC: | | | |
| 3.5% 3/15/29(c) | | 525,000 | 472,260 |
| 4.625% 1/15/27(c) | | 1,310,000 | 1,265,353 |
| 4.875% 2/15/30(c) | | 5,365,000 | 5,069,929 |
| C&S Group Enterprises LLC 5% 12/15/28 (c) | | 510,000 | 367,018 |
| KeHE Distributor / Nextwave 9% 2/15/29 (c) | | 1,030,000 | 1,055,643 |
| Minerva Luxembourg SA 8.875% 9/13/33 (c) | | 320,000 | 330,482 |
| NBM U.S. Holdings, Inc. 6.625% 8/6/29 (c) | | 615,000 | 607,313 |
| Performance Food Group, Inc.: | | | |
| 4.25% 8/1/29(c) | | 400,000 | 364,163 |
| 5.5% 10/15/27(c) | | 475,000 | 464,597 |
| U.S. Foods, Inc. 7.25% 1/15/32 (c) | | 290,000 | 300,960 |
| United Natural Foods, Inc. 6.75% 10/15/28 (c) | | 465,000 | 419,784 |
| | | | 10,717,502 |
| Food Products - 0.7% | | | |
| Adecoagro SA 6% 9/21/27 (c) | | 570,000 | 550,763 |
| Camposol SA 6% 2/3/27 (c) | | 295,000 | 249,275 |
| Chobani LLC/Finance Corp., Inc. 4.625% 11/15/28 (c) | | 375,000 | 354,153 |
| Darling Ingredients, Inc. 6% 6/15/30 (c) | | 675,000 | 663,705 |
| Fiesta Purchaser, Inc. 7.875% 3/1/31 (c) | | 535,000 | 552,809 |
| Lamb Weston Holdings, Inc.: | | | |
| 4.125% 1/31/30(c) | | 555,000 | 503,997 |
| 4.375% 1/31/32(c) | | 275,000 | 245,264 |
| MARB BondCo PLC 3.95% 1/29/31 (c) | | 345,000 | 285,919 |
| Post Holdings, Inc.: | | | |
| 4.5% 9/15/31(c) | | 1,215,000 | 1,089,061 |
| 4.625% 4/15/30(c) | | 3,850,000 | 3,537,832 |
| 5.5% 12/15/29(c) | | 1,085,000 | 1,046,930 |
| Simmons Foods, Inc. 4.625% 3/1/29 (c) | | 430,000 | 378,125 |
| | | | 9,457,833 |
| Household Products - 0.0% | | | |
| Kronos Acquisition Holdings, Inc. 8.25% 6/30/31 (c)(f) | | 550,000 | 550,550 |
| Spectrum Brands Holdings, Inc. 3.875% 3/15/31 (c) | | 103,000 | 86,080 |
| | | | 636,630 |
| Personal Care Products - 0.0% | | | |
| BellRing Brands, Inc. 7% 3/15/30 (c) | | 685,000 | 701,980 |
| | | | |
TOTAL CONSUMER STAPLES | | | 23,690,605 |
| | | | |
| ENERGY - 6.5% | | | |
| Energy Equipment & Services - 0.8% | | | |
| Borr IHC Ltd. / Borr Finance Ltd.: | | | |
| 10% 11/15/28(c) | | 419,085 | 436,373 |
| 10.375% 11/15/30(c) | | 141,481 | 147,494 |
| Diamond Foreign Asset Co. / Diamond Finance, LLC 8.5% 10/1/30 (c) | | 290,000 | 304,403 |
| Guara Norte SARL 5.198% 6/15/34 (c) | | 414,075 | 381,570 |
| Jonah Energy Parent LLC 12% 11/5/25 (b)(g) | | 347,812 | 376,089 |
| Nabors Industries Ltd. 7.5% 1/15/28 (c) | | 510,000 | 486,644 |
| Nabors Industries, Inc. 9.125% 1/31/30 (c) | | 575,000 | 595,663 |
| Noble Finance II LLC 8% 4/15/30 (c) | | 300,000 | 312,215 |
| NuStar Logistics LP 6% 6/1/26 | | 640,000 | 639,008 |
| Oleoducto Central SA 4% 7/14/27 (c) | | 454,000 | 420,858 |
| Seadrill Finance Ltd. 8.375% 8/1/30 (c) | | 595,000 | 621,882 |
| Southern Gas Corridor CJSC 6.875% 3/24/26 (c) | | 1,075,000 | 1,082,391 |
| The Oil and Gas Holding Co.: | | | |
| 7.5% 10/25/27(c) | | 665,000 | 677,677 |
| 8.375% 11/7/28(c) | | 180,000 | 191,340 |
| Transocean Titan Finance Ltd. 8.375% 2/1/28 (c) | | 621,000 | 640,926 |
| Transocean, Inc.: | | | |
| 8% 2/1/27(c) | | 381,000 | 379,680 |
| 8.25% 5/15/29(c) | | 205,000 | 205,845 |
| 8.5% 5/15/31(c) | | 205,000 | 205,088 |
| 8.75% 2/15/30(c) | | 1,327,500 | 1,393,713 |
| Valaris Ltd. 8.375% 4/30/30 (c) | | 295,000 | 305,397 |
| Vallourec SA 7.5% 4/15/32 (c) | | 565,000 | 584,686 |
| Viridien 8.75% 4/1/27 (c) | | 590,000 | 562,317 |
| Yinson Boronia Production BV 8.947% 7/31/42 (c) | | 475,000 | 478,325 |
| | | | 11,429,584 |
| Oil, Gas & Consumable Fuels - 5.7% | | | |
| Antero Midstream Partners LP/Antero Midstream Finance Corp.: | | | |
| 5.375% 6/15/29(c) | | 430,000 | 416,824 |
| 5.75% 1/15/28(c) | | 955,000 | 938,842 |
| BP Capital Markets BV 4.323% 5/12/35 (Reg. S) | EUR | 2,243,000 | 2,483,432 |
| Canacol Energy Ltd. 5.75% 11/24/28 (c) | | 265,000 | 140,864 |
| Chesapeake Energy Corp.: | | | |
| 5.875% 2/1/29(c) | | 310,000 | 306,884 |
| 6.75% 4/15/29(c) | | 440,000 | 440,846 |
| 7%(b)(d) | | 360,000 | 0 |
| 8%(b)(d) | | 115,000 | 0 |
| 8%(b)(d) | | 180,000 | 0 |
| Citgo Petroleum Corp.: | | | |
| 6.375% 6/15/26(c) | | 470,000 | 467,428 |
| 7% 6/15/25(c) | | 1,340,000 | 1,339,636 |
| 8.375% 1/15/29(c) | | 1,280,000 | 1,319,312 |
| Civitas Resources, Inc. 8.625% 11/1/30 (c) | | 580,000 | 621,888 |
| CNX Midstream Partners LP 4.75% 4/15/30 (c) | | 295,000 | 265,843 |
| CNX Resources Corp.: | | | |
| 6% 1/15/29(c) | | 315,000 | 308,254 |
| 7.375% 1/15/31(c) | | 295,000 | 301,613 |
| Comstock Resources, Inc.: | | | |
| 5.875% 1/15/30(c) | | 1,525,000 | 1,419,043 |
| 6.75% 3/1/29(c) | | 1,030,000 | 998,193 |
| CQP Holdco LP / BIP-V Chinook Holdco LLC: | | | |
| 5.5% 6/15/31(c) | | 1,265,000 | 1,199,126 |
| 7.5% 12/15/33(c) | | 760,000 | 788,346 |
| CrownRock LP/CrownRock Finance, Inc. 5% 5/1/29 (c) | | 245,000 | 243,017 |
| CVR Energy, Inc.: | | | |
| 5.75% 2/15/28(c) | | 2,320,000 | 2,151,243 |
| 8.5% 1/15/29(c) | | 2,000,000 | 2,008,236 |
| DT Midstream, Inc.: | | | |
| 4.125% 6/15/29(c) | | 430,000 | 397,254 |
| 4.375% 6/15/31(c) | | 430,000 | 391,654 |
| Ecopetrol SA: | | | |
| 4.625% 11/2/31 | | 335,000 | 274,600 |
| 8.875% 1/13/33 | | 960,000 | 991,200 |
| EG Global Finance PLC 12% 11/30/28 (c) | | 4,410,000 | 4,695,230 |
| EIG Pearl Holdings SARL 3.545% 8/31/36 (c) | | 1,345,000 | 1,155,859 |
| Empresa Nacional de Petroleo 6.15% 5/10/33 (c) | | 305,000 | 304,390 |
| Endeavor Energy Resources LP/EER Finance, Inc. 5.75% 1/30/28 (c) | | 880,000 | 888,268 |
| Energean Israel Finance Ltd.: | | | |
| 4.875% 3/30/26 (Reg. S)(c) | | 615,000 | 579,638 |
| 8.5% 9/30/33 (Reg. S)(c) | | 200,000 | 189,000 |
| Energean PLC 6.5% 4/30/27 (c) | | 550,000 | 541,544 |
| Energy Transfer LP: | | | |
| 5.5% 6/1/27 | | 860,000 | 862,550 |
| 5.625% 5/1/27(c) | | 2,960,000 | 2,946,765 |
| 5.75% 4/1/25 | | 250,000 | 249,260 |
| 6% 2/1/29(c) | | 2,415,000 | 2,431,581 |
| EnLink Midstream LLC 6.5% 9/1/30 (c) | | 895,000 | 916,083 |
| FEL Energy VI SARL 5.75% 12/1/40 (c) | | 249,853 | 224,946 |
| Galaxy Pipeline Assets BidCo Ltd.: | | | |
| 2.16% 3/31/34(c) | | 316,056 | 271,117 |
| 2.625% 3/31/36(c) | | 1,210,000 | 985,772 |
| GeoPark Ltd. 5.5% 1/17/27 (c) | | 505,000 | 458,130 |
| Global Partners LP/GLP Finance Corp. 8.25% 1/15/32 (c) | | 355,000 | 364,880 |
| Gran Tierra Energy, Inc. 9.5% 10/15/29 (c) | | 350,000 | 334,075 |
| Hess Midstream Operations LP: | | | |
| 4.25% 2/15/30(c) | | 460,000 | 422,238 |
| 5.125% 6/15/28(c) | | 595,000 | 576,112 |
| 5.5% 10/15/30(c) | | 275,000 | 265,739 |
| 5.625% 2/15/26(c) | | 795,000 | 789,008 |
| HF Sinclair Corp.: | | | |
| 5% 2/1/28(c) | | 400,000 | 387,518 |
| 6.375% 4/15/27(c) | | 280,000 | 280,592 |
| Hilcorp Energy I LP/Hilcorp Finance Co. 6.25% 11/1/28 (c) | | 590,000 | 582,710 |
| Howard Midstream Energy Partners LLC 8.875% 7/15/28 (c) | | 740,000 | 783,015 |
| KazMunaiGaz National Co.: | | | |
| 3.5% 4/14/33(c) | | 335,000 | 274,386 |
| 5.375% 4/24/30(c) | | 165,000 | 160,978 |
| 5.75% 4/19/47(c) | | 170,000 | 148,325 |
| Kinetik Holdings LP 5.875% 6/15/30 (c) | | 425,000 | 418,800 |
| Kosmos Energy Ltd.: | | | |
| 7.125% 4/4/26(c) | | 1,460,000 | 1,439,013 |
| 7.5% 3/1/28(c) | | 100,000 | 95,406 |
| Leviathan Bond Ltd. 6.125% 6/30/25 (Reg. S) (c) | | 495,000 | 479,150 |
| MC Brazil Downstream Trading SARL 7.25% 6/30/31 (c) | | 977,906 | 865,692 |
| Medco Laurel Tree PTE Ltd. 6.95% 11/12/28 (c) | | 640,000 | 625,190 |
| Medco Maple Tree Pte. Ltd. 8.96% 4/27/29 (c) | | 550,000 | 575,438 |
| MEG Energy Corp. 7.125% 2/1/27 (c) | | 231,000 | 234,220 |
| Mesquite Energy, Inc. 7.25% (b)(c)(d) | | 1,063,000 | 0 |
| Murphy Oil U.S.A., Inc.: | | | |
| 4.75% 9/15/29 | | 370,000 | 350,461 |
| 5.625% 5/1/27 | | 305,000 | 301,489 |
| NAK Naftogaz Ukraine: | | | |
| 7.625% 11/8/28(c) | | 230,000 | 172,500 |
| 7.65% (Reg. S)(d) | | 622,250 | 572,470 |
| NGPL PipeCo LLC 4.875% 8/15/27 (c) | | 150,000 | 146,696 |
| Northern Oil & Gas, Inc.: | | | |
| 8.125% 3/1/28(c) | | 290,000 | 293,273 |
| 8.75% 6/15/31(c) | | 590,000 | 619,078 |
| Occidental Petroleum Corp. 7.2% 3/15/29 | | 240,000 | 254,700 |
| Parkland Corp.: | | | |
| 4.5% 10/1/29(c) | | 440,000 | 402,734 |
| 4.625% 5/1/30(c) | | 550,000 | 501,624 |
| PBF Holding Co. LLC/PBF Finance Corp.: | | | |
| 6% 2/15/28 | | 1,445,000 | 1,408,867 |
| 7.875% 9/15/30(c) | | 870,000 | 890,642 |
| Permian Resources Operating LLC 5.875% 7/1/29 (c) | | 405,000 | 399,431 |
| Petroleos de Venezuela SA: | | | |
| 5.375%(d) | | 480,000 | 56,126 |
| 6%(c)(d) | | 930,000 | 110,205 |
| 6%(c)(d) | | 585,000 | 69,323 |
| 12.75%(c)(d) | | 110,000 | 15,730 |
| Petroleos Mexicanos: | | | |
| 6.5% 6/2/41 | | 170,000 | 115,600 |
| 6.625% 6/15/35 | | 1,965,000 | 1,490,944 |
| 6.7% 2/16/32 | | 821,000 | 686,906 |
| 6.75% 9/21/47 | | 798,000 | 525,778 |
| 6.875% 8/4/26 | | 555,000 | 542,513 |
| 6.95% 1/28/60 | | 780,000 | 512,265 |
| 7.69% 1/23/50 | | 4,073,000 | 2,935,737 |
| Petronas Capital Ltd.: | | | |
| 3.404% 4/28/61(c) | | 500,000 | 329,830 |
| 3.5% 4/21/30(c) | | 230,000 | 210,862 |
| Petrorio Luxembourg Holding SA 6.125% 6/9/26 (c) | | 230,000 | 224,969 |
| PT Adaro Indonesia 4.25% 10/31/24 (c) | | 725,000 | 717,801 |
| PT Pertamina Persero 4.175% 1/21/50 (c) | | 240,000 | 185,100 |
| QatarEnergy: | | | |
| 1.375% 9/12/26(c) | | 900,000 | 828,000 |
| 2.25% 7/12/31(c) | | 1,255,000 | 1,047,925 |
| 3.125% 7/12/41(c) | | 1,235,000 | 916,988 |
| 3.3% 7/12/51(c) | | 930,000 | 649,838 |
| SA Global Sukuk Ltd. 1.602% 6/17/26 (c) | | 775,000 | 723,172 |
| Saudi Arabian Oil Co.: | | | |
| 2.25% 11/24/30(c) | | 1,010,000 | 851,556 |
| 3.25% 11/24/50(c) | | 800,000 | 538,000 |
| 3.5% 4/16/29(c) | | 1,400,000 | 1,302,000 |
| 3.5% 11/24/70(c) | | 460,000 | 296,700 |
| 4.25% 4/16/39(c) | | 1,705,000 | 1,481,219 |
| 4.375% 4/16/49(c) | | 215,000 | 176,770 |
| Sitio Royalties OP / Sitio Finance Corp. 7.875% 11/1/28 (c) | | 720,000 | 744,459 |
| SM Energy Co.: | | | |
| 5.625% 6/1/25 | | 330,000 | 328,583 |
| 6.625% 1/15/27 | | 1,125,000 | 1,120,524 |
| 6.75% 9/15/26 | | 250,000 | 250,083 |
| Southwestern Energy Co.: | | | |
| 5.375% 3/15/30 | | 560,000 | 541,004 |
| 5.7% 1/23/25(h) | | 14,000 | 13,956 |
| Sunoco LP/Sunoco Finance Corp.: | | | |
| 4.5% 5/15/29 | | 605,000 | 565,808 |
| 4.5% 4/30/30 | | 555,000 | 513,391 |
| 7% 9/15/28(c) | | 290,000 | 297,252 |
| Tallgrass Energy Partners LP / Tallgrass Energy Finance Corp.: | | | |
| 5.5% 1/15/28(c) | | 30,000 | 28,702 |
| 6% 3/1/27(c) | | 300,000 | 295,679 |
| 6% 9/1/31(c) | | 540,000 | 504,655 |
| Talos Production, Inc.: | | | |
| 9% 2/1/29(c) | | 250,000 | 262,386 |
| 9.375% 2/1/31(c) | | 285,000 | 300,906 |
| Targa Resources Partners LP/Targa Resources Partners Finance Corp. 4.875% 2/1/31 | | 625,000 | 596,408 |
| Teine Energy Ltd. 6.875% 4/15/29 (c) | | 445,000 | 435,458 |
| Tengizchevroil Finance Co. International Ltd. 3.25% 8/15/30 (c) | | 650,000 | 536,656 |
| Tullow Oil PLC: | | | |
| 7% 3/1/25(c) | | 125,000 | 119,805 |
| 10.25% 5/15/26(c) | | 835,000 | 791,423 |
| Unit Corp. 0% 12/1/29 (b) | | 120,000 | 0 |
| Venture Global Calcasieu Pass LLC: | | | |
| 3.875% 8/15/29(c) | | 355,000 | 323,313 |
| 4.125% 8/15/31(c) | | 355,000 | 318,565 |
| 6.25% 1/15/30(c) | | 1,195,000 | 1,212,801 |
| | | | 81,973,835 |
TOTAL ENERGY | | | 93,403,419 |
| | | | |
| FINANCIALS - 4.8% | | | |
| Banks - 1.0% | | | |
| Access Bank PLC 6.125% 9/21/26 (c) | | 470,000 | 447,234 |
| AIB Group PLC 2.875% 5/30/31 (Reg. S) (e) | EUR | 619,000 | 642,639 |
| Banco Do Brasil SA 6% 3/18/31 (c) | | 420,000 | 412,781 |
| Banco Santander SA 5.75% 8/23/33 (Reg. S) (e) | EUR | 2,100,000 | 2,345,387 |
| Bancolombia SA 8.625% 12/24/34 (e) | | 295,000 | 300,605 |
| Bank of Ireland Group PLC 6.75% 3/1/33 (Reg. S) (e) | EUR | 400,000 | 459,354 |
| BankMuscat SAOG 4.75% 3/17/26 (Reg. S) | | 225,000 | 219,656 |
| Banque Federative du Credit Mutuel SA 3.75% 2/3/34 (Reg. S) | EUR | 400,000 | 425,833 |
| Barclays PLC: | | | |
| 4.506% 1/31/33 (Reg. S)(e) | EUR | 1,881,000 | 2,052,820 |
| 5.262% 1/29/34 (Reg. S)(e) | EUR | 1,172,000 | 1,340,755 |
| Commerzbank AG: | | | |
| 4.625% 1/17/31 (Reg. S)(e) | EUR | 600,000 | 654,919 |
| 6.5% 12/6/32 (Reg. S)(e) | EUR | 300,000 | 339,149 |
| 6.75% 10/5/33 (Reg. S)(e) | EUR | 600,000 | 691,189 |
| HSBC Holdings PLC Eur Swap Annual 5Y Index + 3.300% 6.364% 11/16/32 (Reg. S) (e)(i) | EUR | 1,125,000 | 1,277,426 |
| Magyar Export-Import Bank 6.125% 12/4/27 (c) | | 200,000 | 200,688 |
| NatWest Group PLC 5.763% 2/28/34 (Reg. S) (e) | EUR | 1,886,000 | 2,111,430 |
| OTP Bank PLC 8.75% 5/15/33 (Reg. S) (e) | | 215,000 | 225,011 |
| | | | 14,146,876 |
| Capital Markets - 0.8% | | | |
| AssuredPartners, Inc.: | | | |
| 5.625% 1/15/29(c) | | 475,000 | 444,317 |
| 7.5% 2/15/32(c) | | 280,000 | 281,056 |
| Broadstreet Partners, Inc. 5.875% 4/15/29 (c) | | 725,000 | 676,486 |
| Coinbase Global, Inc.: | | | |
| 3.375% 10/1/28(c) | | 1,445,000 | 1,238,890 |
| 3.625% 10/1/31(c) | | 865,000 | 693,554 |
| Deutsche Bank AG 4% 6/24/32 (Reg. S) (e) | EUR | 4,000,000 | 4,177,630 |
| Hightower Holding LLC 6.75% 4/15/29 (c) | | 285,000 | 266,659 |
| Jane Street Group LLC/JSG Finance, Inc. 4.5% 11/15/29 (c) | | 395,000 | 370,539 |
| MSCI, Inc.: | | | |
| 3.25% 8/15/33(c) | | 420,000 | 346,976 |
| 4% 11/15/29(c) | | 340,000 | 317,674 |
| UBS Group AG: | | | |
| 4.125% 6/9/33 (Reg. S)(e) | EUR | 878,000 | 948,574 |
| 4.75% 3/17/32 (Reg. S)(e) | EUR | 1,401,000 | 1,568,324 |
| | | | 11,330,679 |
| Consumer Finance - 0.8% | | | |
| Ally Financial, Inc.: | | | |
| 8% 11/1/31 | | 5,045,000 | 5,567,600 |
| 8% 11/1/31 | | 823,000 | 907,091 |
| OneMain Finance Corp.: | | | |
| 4% 9/15/30 | | 330,000 | 283,220 |
| 5.375% 11/15/29 | | 500,000 | 468,928 |
| 6.625% 1/15/28 | | 385,000 | 386,365 |
| 7.125% 3/15/26 | | 3,310,000 | 3,363,466 |
| 7.875% 3/15/30 | | 285,000 | 293,851 |
| Shriram Finance Ltd.: | | | |
| 4.15% 7/18/25(c) | | 545,000 | 531,717 |
| 6.625% 4/22/27(c) | | 230,000 | 229,856 |
| | | | 12,032,094 |
| Financial Services - 0.8% | | | |
| Abu Dhabi Developmental Holding Co. PJSC 5.5% 5/8/34 (c) | | 230,000 | 236,210 |
| Block, Inc. 3.5% 6/1/31 | | 570,000 | 491,714 |
| Compass Group Diversified Holdings LLC 5% 1/15/32 (c) | | 275,000 | 248,852 |
| Cosan Luxembourg SA 7.25% 6/27/31 (c) | | 300,000 | 302,700 |
| CRH SMW Finance DAC 4.25% 7/11/35 (Reg. S) | EUR | 1,791,000 | 1,956,775 |
| GACI First Investment 5.25% 10/13/32 (Reg. S) | | 315,000 | 313,327 |
| Icahn Enterprises LP/Icahn Enterprises Finance Corp.: | | | |
| 4.375% 2/1/29 | | 630,000 | 538,676 |
| 5.25% 5/15/27 | | 1,730,000 | 1,624,038 |
| 6.25% 5/15/26 | | 1,305,000 | 1,294,696 |
| James Hardie International Finance Ltd. 5% 1/15/28 (c) | | 455,000 | 438,909 |
| Liberty Costa Rica SR SF 10.875% 1/15/31 (c) | | 425,000 | 450,766 |
| MDGH GMTN RSC Ltd.: | | | |
| 2.875% 11/7/29(c) | | 530,000 | 477,000 |
| 4.375% 11/22/33(c) | | 305,000 | 287,463 |
| 5.084% 5/22/53(c) | | 345,000 | 326,348 |
| 5.5% 4/28/33(c) | | 300,000 | 307,969 |
| MGIC Investment Corp. 5.25% 8/15/28 | | 465,000 | 452,719 |
| NCR Atleos Corp. 9.5% 4/1/29 (c) | | 435,000 | 470,122 |
| PTT Treasury Center Co. Ltd. 3.7% 7/16/70 (c) | | 230,000 | 156,554 |
| Raizen Fuels Finance SA 6.95% 3/5/54 (c) | | 360,000 | 365,400 |
| | | | 10,740,238 |
| Insurance - 1.4% | | | |
| Acrisure LLC / Acrisure Finance, Inc.: | | | |
| 6% 8/1/29(c) | | 425,000 | 392,119 |
| 7.5% 11/6/30(c) | | 275,000 | 275,191 |
| 8.25% 2/1/29(c) | | 1,335,000 | 1,341,457 |
| Alliant Holdings Intermediate LLC/Alliant Holdings Co.-Issuer: | | | |
| 4.25% 10/15/27(c) | | 665,000 | 622,662 |
| 5.875% 11/1/29(c) | | 415,000 | 388,335 |
| 6.75% 10/15/27(c) | | 1,985,000 | 1,957,924 |
| 6.75% 4/15/28(c) | | 1,760,000 | 1,762,793 |
| 7% 1/15/31(c) | | 490,000 | 495,010 |
| AmWINS Group, Inc. 4.875% 6/30/29 (c) | | 415,000 | 386,060 |
| ASR Nederland NV 7% 12/7/43 (Reg. S) (e) | EUR | 2,916,000 | 3,524,619 |
| GTCR AP Finance, Inc. 8% 5/15/27 (c) | | 290,000 | 290,668 |
| HUB International Ltd.: | | | |
| 5.625% 12/1/29(c) | | 1,705,000 | 1,612,419 |
| 7.25% 6/15/30(c) | | 1,915,000 | 1,963,126 |
| 7.375% 1/31/32(c) | | 710,000 | 719,998 |
| MAPFRE SA 2.875% 4/13/30 (Reg. S) | EUR | 1,400,000 | 1,390,125 |
| NN Group NV 6% 11/3/43 (Reg. S) (e) | EUR | 1,221,000 | 1,411,619 |
| Panther Escrow Issuer LLC 7.125% 6/1/31 (c) | | 970,000 | 981,091 |
| Sagicor Financial Co. Ltd. 5.3% 5/13/28 (c) | | 480,000 | 456,566 |
| Sampo Oyj 2.5% 9/3/52 (Reg. S) (e) | EUR | 222,000 | 204,601 |
| USI, Inc. 7.5% 1/15/32 (c) | | 380,000 | 385,945 |
| | | | 20,562,328 |
TOTAL FINANCIALS | | | 68,812,215 |
| | | | |
| HEALTH CARE - 1.8% | | | |
| Biotechnology - 0.0% | | | |
| Grifols SA 4.75% 10/15/28 (c) | | 280,000 | 241,633 |
| | | | |
| Health Care Equipment & Supplies - 0.1% | | | |
| Avantor Funding, Inc. 3.875% 11/1/29 (c) | | 275,000 | 250,075 |
| Bausch + Lomb Corp. 8.375% 10/1/28 (c) | | 580,000 | 593,775 |
| Hologic, Inc. 4.625% 2/1/28 (c) | | 215,000 | 205,702 |
| | | | 1,049,552 |
| Health Care Providers & Services - 1.0% | | | |
| 180 Medical, Inc. 3.875% 10/15/29 (c) | | 300,000 | 271,511 |
| Auna SA 10% 12/15/29 (c) | | 286,000 | 292,215 |
| Cano Health, Inc. 6.25% 10/1/28 (c)(d) | | 185,000 | 231 |
| CHS/Community Health Systems, Inc.: | | | |
| 4.75% 2/15/31(c) | | 1,150,000 | 904,165 |
| 5.25% 5/15/30(c) | | 825,000 | 680,206 |
| 6% 1/15/29(c) | | 485,000 | 428,016 |
| 6.125% 4/1/30(c) | | 1,035,000 | 724,253 |
| 10.875% 1/15/32(c) | | 915,000 | 952,320 |
| DaVita, Inc.: | | | |
| 3.75% 2/15/31(c) | | 210,000 | 179,121 |
| 4.625% 6/1/30(c) | | 1,590,000 | 1,436,771 |
| HealthEquity, Inc. 4.5% 10/1/29 (c) | | 295,000 | 275,731 |
| ModivCare Escrow Issuer, Inc. 5% 10/1/29 (c) | | 325,000 | 229,025 |
| Modivcare, Inc. 5.875% 11/15/25 (c) | | 485,000 | 492,125 |
| Molina Healthcare, Inc.: | | | |
| 3.875% 11/15/30(c) | | 640,000 | 568,963 |
| 3.875% 5/15/32(c) | | 550,000 | 476,573 |
| 4.375% 6/15/28(c) | | 465,000 | 437,675 |
| Tenet Healthcare Corp.: | | | |
| 5.125% 11/1/27 | | 975,000 | 954,168 |
| 6.125% 6/15/30 | | 1,430,000 | 1,419,990 |
| 6.25% 2/1/27 | | 1,850,000 | 1,848,786 |
| 6.75% 5/15/31 | | 2,040,000 | 2,070,625 |
| | | | 14,642,470 |
| Health Care Technology - 0.0% | | | |
| IQVIA, Inc. 5% 5/15/27 (c) | | 640,000 | 624,451 |
| | | | |
| Life Sciences Tools & Services - 0.1% | | | |
| Charles River Laboratories International, Inc.: | | | |
| 3.75% 3/15/29(c) | | 525,000 | 479,062 |
| 4% 3/15/31(c) | | 605,000 | 539,599 |
| 4.25% 5/1/28(c) | | 185,000 | 174,641 |
| | | | 1,193,302 |
| Pharmaceuticals - 0.6% | | | |
| Bausch Health Companies, Inc.: | | | |
| 4.875% 6/1/28(c) | | 810,000 | 606,172 |
| 5.75% 8/15/27(c) | | 870,000 | 690,573 |
| 6.125% 2/1/27(c) | | 1,495,000 | 1,244,588 |
| 11% 9/30/28(c) | | 240,000 | 213,600 |
| Bayer AG: | | | |
| 5.375% 3/25/82 (Reg. S)(e) | EUR | 300,000 | 305,671 |
| 6.625% 9/25/83 (Reg. S)(e) | EUR | 200,000 | 216,446 |
| 7% 9/25/83 (Reg. S)(e) | EUR | 1,100,000 | 1,215,158 |
| Organon & Co. / Organon Foreign Debt Co-Issuer BV: | | | |
| 4.125% 4/30/28(c) | | 1,015,000 | 942,627 |
| 5.125% 4/30/31(c) | | 885,000 | 794,953 |
| Teva Pharmaceutical Finance Netherlands III BV: | | | |
| 4.75% 5/9/27 | | 555,000 | 534,833 |
| 5.125% 5/9/29 | | 275,000 | 264,541 |
| 7.875% 9/15/29 | | 850,000 | 913,192 |
| | | | 7,942,354 |
TOTAL HEALTH CARE | | | 25,693,762 |
| | | | |
| INDUSTRIALS - 5.0% | | | |
| Aerospace & Defense - 1.5% | | | |
| Bombardier, Inc.: | | | |
| 6% 2/15/28(c) | | 280,000 | 276,779 |
| 7.125% 6/15/26(c) | | 146,000 | 148,106 |
| 7.25% 7/1/31(c) | | 280,000 | 287,482 |
| 7.875% 4/15/27(c) | | 658,000 | 659,675 |
| 8.75% 11/15/30(c) | | 430,000 | 464,737 |
| BWX Technologies, Inc. 4.125% 6/30/28 (c) | | 630,000 | 588,027 |
| Embraer Netherlands Finance BV: | | | |
| 5.4% 2/1/27 | | 325,000 | 321,953 |
| 6.95% 1/17/28(c) | | 390,000 | 400,847 |
| 7% 7/28/30(c) | | 320,000 | 333,900 |
| Moog, Inc. 4.25% 12/15/27 (c) | | 185,000 | 175,160 |
| Rolls-Royce PLC 5.75% 10/15/27 (c) | | 650,000 | 652,971 |
| TransDigm, Inc.: | | | |
| 4.625% 1/15/29 | | 930,000 | 867,726 |
| 5.5% 11/15/27 | | 7,825,000 | 7,678,281 |
| 6.375% 3/1/29(c) | | 780,000 | 783,934 |
| 6.625% 3/1/32(c) | | 280,000 | 282,817 |
| 6.75% 8/15/28(c) | | 3,560,000 | 3,595,600 |
| 6.875% 12/15/30(c) | | 2,350,000 | 2,398,998 |
| 7.125% 12/1/31(c) | | 575,000 | 592,467 |
| Triumph Group, Inc. 9% 3/15/28 (c) | | 360,000 | 377,366 |
| VistaJet Malta Finance PLC / XO Management Holding, Inc. 9.5% 6/1/28 (c) | | 450,000 | 394,481 |
| | | | 21,281,307 |
| Air Freight & Logistics - 0.1% | | | |
| Aeropuerto Internacional de Tocumen SA 5.125% 8/11/61 (c) | | 205,000 | 151,188 |
| Rand Parent LLC 8.5% 2/15/30 (c) | | 745,000 | 754,246 |
| | | | 905,434 |
| Building Products - 0.2% | | | |
| Advanced Drain Systems, Inc.: | | | |
| 5% 9/30/27(c) | | 125,000 | 122,208 |
| 6.375% 6/15/30(c) | | 280,000 | 281,012 |
| Carrier Global Corp. 4.5% 11/29/32 | EUR | 1,087,000 | 1,216,929 |
| MITER Brands Acquisition Holdco, Inc. / MIWD Borrower LLC 6.75% 4/1/32 (c) | | 420,000 | 422,987 |
| MIWD Holdco II LLC / MIWD Finance Corp. 5.5% 2/1/30 (c) | | 185,000 | 170,735 |
| Shea Homes Ltd. Partnership/Corp. 4.75% 4/1/29 | | 475,000 | 441,718 |
| Sisecam UK PLC 8.625% 5/2/32 (c) | | 375,000 | 381,445 |
| | | | 3,037,034 |
| Commercial Services & Supplies - 1.1% | | | |
| Artera Services LLC 8.5% 2/15/31 (c) | | 1,175,000 | 1,209,660 |
| Atlas Luxco 4 SARL / Allied Universal Holdco LLC / Allied Universal Finance Corp.: | | | |
| 4.625% 6/1/28(c) | | 502,000 | 457,866 |
| 4.625% 6/1/28(c) | | 348,000 | 317,042 |
| Brand Industrial Services, Inc. 10.375% 8/1/30 (c) | | 2,225,000 | 2,404,544 |
| Clean Harbors, Inc. 6.375% 2/1/31 (c) | | 250,000 | 250,651 |
| CoreCivic, Inc. 8.25% 4/15/29 | | 1,575,000 | 1,627,981 |
| Covanta Holding Corp.: | | | |
| 4.875% 12/1/29(c) | | 995,000 | 908,164 |
| 5% 9/1/30 | | 800,000 | 723,053 |
| GFL Environmental, Inc.: | | | |
| 4% 8/1/28(c) | | 420,000 | 390,352 |
| 4.75% 6/15/29(c) | | 575,000 | 542,664 |
| 6.75% 1/15/31(c) | | 425,000 | 433,578 |
| Madison IAQ LLC: | | | |
| 4.125% 6/30/28(c) | | 535,000 | 498,956 |
| 5.875% 6/30/29(c) | | 425,000 | 395,420 |
| Neptune BidCo U.S., Inc. 9.29% 4/15/29 (c) | | 2,380,000 | 2,284,800 |
| OpenLane, Inc. 5.125% 6/1/25 (c) | | 525,000 | 517,300 |
| The Brink's Co. 4.625% 10/15/27 (c) | | 620,000 | 593,858 |
| The GEO Group, Inc.: | | | |
| 8.625% 4/15/29(c) | | 970,000 | 993,480 |
| 10.25% 4/15/31(c) | | 695,000 | 727,172 |
| Williams Scotsman, Inc. 7.375% 10/1/31 (c) | | 290,000 | 298,441 |
| | | | 15,574,982 |
| Construction & Engineering - 0.5% | | | |
| AECOM 5.125% 3/15/27 | | 625,000 | 614,172 |
| Arcosa, Inc. 4.375% 4/15/29 (c) | | 415,000 | 385,379 |
| Bouygues SA 5.375% 6/30/42 (Reg. S) | EUR | 1,800,000 | 2,172,454 |
| Greensaif Pipelines Bidco SARL: | | | |
| 6.129% 2/23/38(c) | | 1,015,000 | 1,037,520 |
| 6.51% 2/23/42(c) | | 305,000 | 319,488 |
| Pike Corp.: | | | |
| 5.5% 9/1/28(c) | | 1,850,000 | 1,775,073 |
| 8.625% 1/31/31(c) | | 715,000 | 757,414 |
| | | | 7,061,500 |
| Electrical Equipment - 0.0% | | | |
| Sensata Technologies BV 4% 4/15/29 (c) | | 590,000 | 541,679 |
| | | | |
| Ground Transportation - 0.7% | | | |
| JSC Georgian Railway 4% 6/17/28 (c) | | 191,000 | 168,319 |
| Uber Technologies, Inc.: | | | |
| 4.5% 8/15/29(c) | | 1,260,000 | 1,200,515 |
| 6.25% 1/15/28(c) | | 545,000 | 545,640 |
| 7.5% 9/15/27(c) | | 2,950,000 | 3,007,876 |
| 8% 11/1/26(c) | | 4,260,000 | 4,296,947 |
| XPO, Inc.: | | | |
| 6.25% 6/1/28(c) | | 300,000 | 300,900 |
| 7.125% 2/1/32(c) | | 430,000 | 440,724 |
| | | | 9,960,921 |
| Industrial Conglomerates - 0.0% | | | |
| GRUP KUO, S.A.B. de CV 5.75% 7/7/27 (c) | | 355,000 | 342,767 |
| | | | |
| Machinery - 0.1% | | | |
| Allison Transmission, Inc. 5.875% 6/1/29 (c) | | 420,000 | 414,254 |
| ATS Corp. 4.125% 12/15/28 (c) | | 460,000 | 419,193 |
| Chart Industries, Inc. 7.5% 1/1/30 (c) | | 790,000 | 816,359 |
| | | | 1,649,806 |
| Marine Transportation - 0.1% | | | |
| MISC Capital Two (Labuan) Ltd.: | | | |
| 3.625% 4/6/25(c) | | 360,000 | 354,523 |
| 3.75% 4/6/27(c) | | 570,000 | 545,370 |
| Seaspan Corp. 5.5% 8/1/29 (c) | | 425,000 | 379,340 |
| | | | 1,279,233 |
| Passenger Airlines - 0.5% | | | |
| Air Canada 3.875% 8/15/26 (c) | | 425,000 | 404,257 |
| Allegiant Travel Co. 7.25% 8/15/27 (c) | | 445,000 | 423,501 |
| American Airlines, Inc.: | | | |
| 7.25% 2/15/28(c) | | 990,000 | 990,644 |
| 8.5% 5/15/29(c) | | 945,000 | 981,824 |
| American Airlines, Inc. / AAdvantage Loyalty IP Ltd. 5.75% 4/20/29 (c) | | 1,485,000 | 1,444,710 |
| Azul Secured Finance LLP: | | | |
| 11.5% 5/28/29(c) | | 623,771 | 514,611 |
| 11.93% 8/28/28(c) | | 300,000 | 291,094 |
| Spirit Loyalty Cayman Ltd. / Spirit IP Cayman Ltd.: | | | |
| 8% 9/20/25(c) | | 150,000 | 109,497 |
| 8% 9/20/25(c) | | 462,000 | 337,250 |
| United Airlines, Inc.: | | | |
| 4.375% 4/15/26(c) | | 1,450,000 | 1,400,711 |
| 4.625% 4/15/29(c) | | 870,000 | 810,240 |
| | | | 7,708,339 |
| Professional Services - 0.0% | | | |
| TriNet Group, Inc. 3.5% 3/1/29 (c) | | 455,000 | 404,995 |
| | | | |
| Trading Companies & Distributors - 0.1% | | | |
| Fortress Transportation & Infrastructure Investors LLC 7.875% 12/1/30 (c) | | 430,000 | 449,835 |
| Foundation Building Materials, Inc. 6% 3/1/29 (c) | | 310,000 | 275,108 |
| H&E Equipment Services, Inc. 3.875% 12/15/28 (c) | | 995,000 | 897,757 |
| | | | 1,622,700 |
| Transportation Infrastructure - 0.1% | | | |
| Aeropuertos Dominicanos Siglo XXI SA 7% 6/30/34 (c)(f) | | 300,000 | 302,280 |
| DP World Crescent Ltd. 3.7495% 1/30/30 (c) | | 425,000 | 392,594 |
| DP World Ltd. 5.625% 9/25/48 (c) | | 400,000 | 380,500 |
| | | | 1,075,374 |
TOTAL INDUSTRIALS | | | 72,446,071 |
| | | | |
| INFORMATION TECHNOLOGY - 1.5% | | | |
| Communications Equipment - 0.0% | | | |
| IHS Netherlands Holdco BV 8% 9/18/27 (c) | | 390,000 | 378,666 |
| | | | |
| Electronic Equipment, Instruments & Components - 0.1% | | | |
| Coherent Corp. 5% 12/15/29 (c) | | 435,000 | 411,673 |
| CPI CG, Inc. 10% 7/15/29 (c)(f) | | 275,000 | 285,313 |
| TTM Technologies, Inc. 4% 3/1/29 (c) | | 455,000 | 417,499 |
| | | | 1,114,485 |
| IT Services - 0.2% | | | |
| Acuris Finance U.S. 5% 5/1/28 (c) | | 430,000 | 381,882 |
| ASGN, Inc. 4.625% 5/15/28 (c) | | 510,000 | 480,967 |
| CA Magnum Holdings 5.375% 10/31/26 (c) | | 955,000 | 913,517 |
| Camelot Finance SA 4.5% 11/1/26 (c) | | 570,000 | 551,026 |
| Go Daddy Operating Co. LLC / GD Finance Co., Inc.: | | | |
| 3.5% 3/1/29(c) | | 610,000 | 550,865 |
| 5.25% 12/1/27(c) | | 500,000 | 489,566 |
| Unisys Corp. 6.875% 11/1/27 (c) | | 365,000 | 320,373 |
| | | | 3,688,196 |
| Semiconductors & Semiconductor Equipment - 0.1% | | | |
| ON Semiconductor Corp. 3.875% 9/1/28 (c) | | 690,000 | 636,807 |
| Synaptics, Inc. 4% 6/15/29 (c) | | 350,000 | 317,140 |
| | | | 953,947 |
| Software - 0.9% | | | |
| Clarivate Science Holdings Corp.: | | | |
| 3.875% 7/1/28(c) | | 500,000 | 464,388 |
| 4.875% 7/1/29(c) | | 475,000 | 440,830 |
| Cloud Software Group, Inc. 6.5% 3/31/29 (c) | | 4,985,000 | 4,787,169 |
| Elastic NV 4.125% 7/15/29 (c) | | 1,165,000 | 1,063,717 |
| Fair Isaac Corp. 4% 6/15/28 (c) | | 580,000 | 542,532 |
| Gen Digital, Inc. 5% 4/15/25 (c) | | 530,000 | 526,341 |
| ION Trading Technologies Ltd.: | | | |
| 5.75% 5/15/28(c) | | 575,000 | 525,416 |
| 9.5% 5/30/29(c) | | 415,000 | 423,051 |
| MicroStrategy, Inc. 6.125% 6/15/28 (c) | | 995,000 | 964,412 |
| NCR Voyix Corp.: | | | |
| 5% 10/1/28(c) | | 335,000 | 316,301 |
| 5.25% 10/1/30(c) | | 335,000 | 306,190 |
| Open Text Corp. 6.9% 12/1/27 (c) | | 530,000 | 550,063 |
| Open Text Holdings, Inc.: | | | |
| 4.125% 2/15/30(c) | | 300,000 | 270,542 |
| 4.125% 12/1/31(c) | | 245,000 | 215,344 |
| PTC, Inc.: | | | |
| 3.625% 2/15/25(c) | | 350,000 | 345,683 |
| 4% 2/15/28(c) | | 345,000 | 324,722 |
| UKG, Inc. 6.875% 2/1/31 (c) | | 425,000 | 430,325 |
| Veritas U.S., Inc./Veritas Bermuda Ltd. 7.5% 9/1/25 (c) | | 945,000 | 817,175 |
| | | | 13,314,201 |
| Technology Hardware, Storage & Peripherals - 0.2% | | | |
| Lenovo Group Ltd.: | | | |
| 3.421% 11/2/30(c) | | 485,000 | 428,164 |
| 5.875% 4/24/25 (Reg. S) | | 200,000 | 199,678 |
| Seagate HDD Cayman: | | | |
| 8.25% 12/15/29 | | 985,000 | 1,056,413 |
| 8.5% 7/15/31 | | 640,000 | 689,281 |
| | | | 2,373,536 |
TOTAL INFORMATION TECHNOLOGY | | | 21,823,031 |
| | | | |
| MATERIALS - 3.5% | | | |
| Chemicals - 1.1% | | | |
| Air Products & Chemicals, Inc. 4% 3/3/35 | EUR | 954,000 | 1,037,122 |
| BASF AG 4.25% 3/8/32 (Reg. S) | EUR | 1,400,000 | 1,556,869 |
| Braskem Idesa SAPI: | | | |
| 6.99% 2/20/32(c) | | 205,000 | 156,005 |
| 7.45% 11/15/29(c) | | 600,000 | 486,000 |
| Braskem Netherlands BV: | | | |
| 5.875% 1/31/50(c) | | 300,000 | 221,160 |
| 7.25% 2/13/33(c) | | 375,000 | 353,438 |
| 8.5% 1/12/31(c) | | 595,000 | 607,272 |
| Consolidated Energy Finance SA 12% 2/15/31 (c) | | 450,000 | 464,139 |
| ENN Clean Energy International Investment Ltd. 3.375% 5/12/26 (c) | | 420,000 | 400,444 |
| Ingevity Corp. 3.875% 11/1/28 (c) | | 665,000 | 603,354 |
| LSB Industries, Inc. 6.25% 10/15/28 (c) | | 960,000 | 925,833 |
| MEGlobal BV: | | | |
| 2.625% 4/28/28(c) | | 275,000 | 246,778 |
| 4.25% 11/3/26(c) | | 235,000 | 227,392 |
| MEGlobal Canada, Inc. 5% 5/18/25 (c) | | 445,000 | 440,550 |
| NOVA Chemicals Corp. 8.5% 11/15/28 (c) | | 385,000 | 408,534 |
| OCP SA: | | | |
| 3.75% 6/23/31(c) | | 365,000 | 315,497 |
| 5.125% 6/23/51(c) | | 305,000 | 229,608 |
| 6.75% 5/2/34(c) | | 255,000 | 261,694 |
| 6.875% 4/25/44(c) | | 325,000 | 311,188 |
| 7.5% 5/2/54(c) | | 200,000 | 203,784 |
| Olympus Water U.S. Holding Corp.: | | | |
| 4.25% 10/1/28(c) | | 720,000 | 654,963 |
| 7.125% 10/1/27(c) | | 355,000 | 356,348 |
| 9.75% 11/15/28(c) | | 1,485,000 | 1,571,087 |
| Orbia Advance Corp. S.A.B. de CV: | | | |
| 1.875% 5/11/26(c) | | 630,000 | 586,971 |
| 2.875% 5/11/31(c) | | 340,000 | 281,031 |
| Sasol Financing U.S.A. LLC: | | | |
| 4.375% 9/18/26 | | 795,000 | 748,542 |
| 5.5% 3/18/31 | | 200,000 | 168,616 |
| 8.75% 5/3/29(c) | | 200,000 | 203,039 |
| SCIH Salt Holdings, Inc. 4.875% 5/1/28 (c) | | 375,000 | 348,466 |
| SCIL IV LLC / SCIL U.S.A. Holdings LLC 5.375% 11/1/26 (c) | | 640,000 | 618,843 |
| The Scotts Miracle-Gro Co. 4% 4/1/31 | | 595,000 | 513,352 |
| W.R. Grace Holding LLC: | | | |
| 5.625% 8/15/29(c) | | 665,000 | 612,927 |
| 7.375% 3/1/31(c) | | 300,000 | 304,039 |
| | | | 16,424,885 |
| Construction Materials - 0.2% | | | |
| Smyrna Ready Mix Concrete LLC 8.875% 11/15/31 (c) | | 1,150,000 | 1,220,065 |
| Summit Materials LLC/Summit Materials Finance Corp.: | | | |
| 5.25% 1/15/29(c) | | 645,000 | 621,278 |
| 7.25% 1/15/31(c) | | 435,000 | 449,681 |
| | | | 2,291,024 |
| Containers & Packaging - 0.6% | | | |
| Ardagh Metal Packaging Finance U.S.A. LLC/Ardagh Metal Packaging Finance PLC: | | | |
| 3.25% 9/1/28(c) | | 300,000 | 263,580 |
| 4% 9/1/29(c) | | 605,000 | 511,985 |
| 6% 6/15/27(c) | | 280,000 | 275,134 |
| Cascades, Inc.: | | | |
| 5.125% 1/15/26(c) | | 300,000 | 295,413 |
| 5.375% 1/15/28(c) | | 300,000 | 288,792 |
| Clydesdale Acquisition Holdings, Inc.: | | | |
| 6.625% 4/15/29(c) | | 915,000 | 899,293 |
| 8.75% 4/15/30(c) | | 2,175,000 | 2,128,575 |
| Crown Cork & Seal, Inc.: | | | |
| 7.375% 12/15/26 | | 1,210,000 | 1,250,188 |
| 7.5% 12/15/96 | | 160,000 | 170,000 |
| Graham Packaging Co., Inc. 7.125% 8/15/28 (c) | | 365,000 | 344,802 |
| Graphic Packaging International, Inc. 3.75% 2/1/30 (c) | | 355,000 | 316,914 |
| Intelligent Packaging Ltd. Finco, Inc. 6% 9/15/28 (c) | | 255,000 | 246,551 |
| Mauser Packaging Solutions Holding Co. 7.875% 4/15/27 (c) | | 605,000 | 617,095 |
| Sealed Air Corp./Sealed Air Corp. U.S. 6.125% 2/1/28 (c) | | 300,000 | 299,277 |
| Trident TPI Holdings, Inc. 12.75% 12/31/28 (c) | | 295,000 | 322,200 |
| | | | 8,229,799 |
| Metals & Mining - 1.6% | | | |
| Alcoa Nederland Holding BV: | | | |
| 4.125% 3/31/29(c) | | 775,000 | 718,822 |
| 6.125% 5/15/28(c) | | 200,000 | 199,144 |
| 7.125% 3/15/31(c) | | 230,000 | 236,379 |
| Algoma Steel SCA 0% 12/31/24 (b) | | 102,200 | 0 |
| Antofagasta PLC: | | | |
| 2.375% 10/14/30(c) | | 685,000 | 569,620 |
| 5.625% 5/13/32(c) | | 260,000 | 259,269 |
| Aris Mining Corp. 6.875% 8/9/26 (c) | | 715,000 | 673,441 |
| Arsenal AIC Parent LLC 8% 10/1/30 (c) | | 350,000 | 367,289 |
| ATI, Inc.: | | | |
| 4.875% 10/1/29 | | 280,000 | 261,738 |
| 5.125% 10/1/31 | | 245,000 | 226,461 |
| 7.25% 8/15/30 | | 295,000 | 304,516 |
| Celtic Resources Holdings DAC 4.125% (b)(c)(d) | | 445,000 | 63,795 |
| Cleveland-Cliffs, Inc.: | | | |
| 4.625% 3/1/29(c) | | 465,000 | 440,034 |
| 4.875% 3/1/31(c) | | 465,000 | 410,013 |
| 6.75% 4/15/30(c) | | 965,000 | 954,755 |
| Compania de Minas Buenaventura SAA 5.5% 7/23/26 (c) | | 400,000 | 386,375 |
| Compass Minerals International, Inc. 6.75% 12/1/27 (c) | | 1,305,000 | 1,247,110 |
| Corporacion Nacional del Cobre de Chile (Codelco): | | | |
| 3% 9/30/29(c) | | 105,000 | 92,663 |
| 3.15% 1/14/30(c) | | 280,000 | 247,538 |
| 3.7% 1/30/50(c) | | 870,000 | 593,231 |
| 5.125% 2/2/33(c) | | 290,000 | 274,956 |
| 5.95% 1/8/34(c) | | 205,000 | 204,078 |
| 6.3% 9/8/53(c) | | 290,000 | 285,922 |
| 6.44% 1/26/36(c) | | 205,000 | 210,766 |
| CSN Inova Ventures 6.75% 1/28/28 (c) | | 485,000 | 460,750 |
| CSN Resources SA: | | | |
| 5.875% 4/8/32(c) | | 420,000 | 350,438 |
| 8.875% 12/5/30(c) | | 200,000 | 198,750 |
| Eldorado Gold Corp. 6.25% 9/1/29 (c) | | 420,000 | 400,848 |
| Endeavour Mining PLC 5% 10/14/26 (c) | | 580,000 | 549,913 |
| ERO Copper Corp. 6.5% 2/15/30 (c) | | 415,000 | 400,446 |
| First Quantum Minerals Ltd.: | | | |
| 8.625% 6/1/31(c) | | 1,120,000 | 1,113,280 |
| 9.375% 3/1/29(c) | | 665,000 | 694,842 |
| FMG Resources August 2006 Pty Ltd.: | | | |
| 4.375% 4/1/31(c) | | 445,000 | 397,709 |
| 4.5% 9/15/27(c) | | 485,000 | 463,442 |
| Fresnillo PLC 4.25% 10/2/50 (c) | | 360,000 | 265,050 |
| HudBay Minerals, Inc. 4.5% 4/1/26 (c) | | 360,000 | 352,158 |
| Kaiser Aluminum Corp. 4.625% 3/1/28 (c) | | 595,000 | 556,720 |
| Metinvest BV 8.5% 4/23/26 (Reg. S) | | 200,000 | 160,000 |
| Mineral Resources Ltd.: | | | |
| 8% 11/1/27(c) | | 280,000 | 286,459 |
| 8.125% 5/1/27(c) | | 960,000 | 967,490 |
| 8.5% 5/1/30(c) | | 210,000 | 217,406 |
| 9.25% 10/1/28(c) | | 515,000 | 540,509 |
| Murray Energy Corp.: | | | |
| 11.25%(b)(c)(d) | | 490,000 | 0 |
| 12% pay-in-kind(b)(c)(d)(e) | | 548,100 | 0 |
| Nexa Resources SA: | | | |
| 6.5% 1/18/28(c) | | 356,000 | 358,448 |
| 6.75% 4/9/34(c) | | 200,000 | 201,920 |
| POSCO: | | | |
| 5.75% 1/17/28(c) | | 420,000 | 425,551 |
| 5.875% 1/17/33(c) | | 200,000 | 205,741 |
| PT Freeport Indonesia: | | | |
| 4.763% 4/14/27(c) | | 225,000 | 220,244 |
| 5.315% 4/14/32(c) | | 450,000 | 435,488 |
| 6.2% 4/14/52(c) | | 265,000 | 259,617 |
| PT Indonesia Asahan Aluminium 5.45% 5/15/30 (c) | | 880,000 | 862,400 |
| Roller Bearing Co. of America, Inc. 4.375% 10/15/29 (c) | | 200,000 | 184,048 |
| Samarco Mineracao SA 9% 6/30/31 pay-in-kind (c)(e) | | 1,043,603 | 968,855 |
| Stillwater Mining Co. 4% 11/16/26 (c) | | 410,000 | 374,638 |
| TMK Capital SA 4.3% (Reg. S) (b)(d) | | 400,000 | 60,000 |
| Vale Overseas Ltd. 6.4% 6/28/54 | | 515,000 | 509,696 |
| Volcan Compania Minera SAA 4.375% 2/11/26 (c) | | 490,000 | 379,903 |
| | | | 23,050,674 |
| Paper & Forest Products - 0.0% | | | |
| Inversiones CMPC SA 3% 4/6/31 (c) | | 245,000 | 207,867 |
| Suzano Austria GmbH 3.75% 1/15/31 | | 245,000 | 213,395 |
| | | | 421,262 |
TOTAL MATERIALS | | | 50,417,644 |
| | | | |
| REAL ESTATE - 1.3% | | | |
| Equity Real Estate Investment Trusts (REITs) - 1.1% | | | |
| Iron Mountain Information Management Services, Inc. 5% 7/15/32 (c) | | 415,000 | 379,078 |
| Iron Mountain, Inc.: | | | |
| 4.875% 9/15/29(c) | | 1,300,000 | 1,225,039 |
| 5% 7/15/28(c) | | 630,000 | 603,523 |
| 5.25% 7/15/30(c) | | 585,000 | 556,034 |
| 5.625% 7/15/32(c) | | 585,000 | 555,495 |
| MPT Operating Partnership LP/MPT Finance Corp.: | | | |
| 3.5% 3/15/31 | | 665,000 | 433,325 |
| 4.625% 8/1/29 | | 970,000 | 704,039 |
| 5% 10/15/27 | | 2,850,000 | 2,353,838 |
| Prologis International Funding II SA: | | | |
| 3.125% 6/1/31 (Reg. S) | EUR | 2,300,000 | 2,326,168 |
| 4.625% 2/21/35 (Reg. S) | EUR | 957,000 | 1,054,144 |
| SBA Communications Corp. 3.875% 2/15/27 | | 890,000 | 848,195 |
| Uniti Group LP/Uniti Fiber Holdings, Inc./CSL Capital LLC 6% 1/15/30 (c) | | 335,000 | 202,605 |
| Uniti Group LP/Uniti Group Finance, Inc./CSL Capital LLC: | | | |
| 4.75% 4/15/28(c) | | 940,000 | 768,588 |
| 6.5% 2/15/29(c) | | 655,000 | 417,681 |
| 10.5% 2/15/28(c) | | 635,000 | 621,844 |
| VICI Properties LP / VICI Note Co.: | | | |
| 3.875% 2/15/29(c) | | 665,000 | 614,674 |
| 4.25% 12/1/26(c) | | 1,140,000 | 1,099,403 |
| 4.625% 12/1/29(c) | | 650,000 | 615,143 |
| | | | 15,378,816 |
| Real Estate Management & Development - 0.2% | | | |
| Greystar Real Estate Partners 7.75% 9/1/30 (c) | | 260,000 | 273,778 |
| SELP Finance SARL: | | | |
| 0.875% 5/27/29 (Reg. S) | EUR | 588,000 | 540,959 |
| 3.75% 8/10/27 (Reg. S) | EUR | 1,069,000 | 1,139,321 |
| Taylor Morrison Communities, Inc./Monarch Communities, Inc.: | | | |
| 5.125% 8/1/30(c) | | 635,000 | 608,072 |
| 5.875% 6/15/27(c) | | 495,000 | 492,825 |
| Weekley Homes LLC/Weekley Finance Corp. 4.875% 9/15/28 (c) | | 300,000 | 277,818 |
| | | | 3,332,773 |
TOTAL REAL ESTATE | | | 18,711,589 |
| | | | |
| UTILITIES - 2.3% | | | |
| Electric Utilities - 1.4% | | | |
| Chile Electricity LUX MPC SARL 6.01% 1/20/33 (c) | | 200,000 | 202,364 |
| Clearway Energy Operating LLC: | | | |
| 3.75% 1/15/32(c) | | 280,000 | 238,059 |
| 4.75% 3/15/28(c) | | 365,000 | 348,766 |
| Electricite de France SA: | | | |
| 4.625% 1/25/43 (Reg. S) | EUR | 1,200,000 | 1,271,414 |
| 4.75% 6/17/44 (Reg. S) | EUR | 1,100,000 | 1,178,317 |
| EnBW International Finance BV 4.3% 5/23/34 (Reg. S) | EUR | 1,719,000 | 1,902,385 |
| Energias de Portugal SA: | | | |
| 1.875% 3/14/82 (Reg. S)(e) | EUR | 600,000 | 557,429 |
| 5.943% 4/23/83 (Reg. S)(e) | EUR | 100,000 | 111,509 |
| Eskom Holdings SOC Ltd.: | | | |
| 6.35% 8/10/28(c) | | 590,000 | 571,439 |
| 7.125% 2/11/25(c) | | 735,000 | 732,244 |
| 8.45% 8/10/28(c) | | 240,000 | 241,275 |
| Israel Electric Corp. Ltd. 3.75% 2/22/32 (Reg. S) (c) | | 605,000 | 497,083 |
| Lamar Funding Ltd. 3.958% 5/7/25 (c) | | 600,000 | 585,000 |
| Mong Duong Finance Holdings BV 5.125% 5/7/29 (c) | | 552,349 | 525,940 |
| NextEra Energy Partners LP 7.25% 1/15/29 (c) | | 285,000 | 292,259 |
| NRG Energy, Inc.: | | | |
| 3.375% 2/15/29(c) | | 305,000 | 271,316 |
| 3.625% 2/15/31(c) | | 605,000 | 518,846 |
| 3.875% 2/15/32(c) | | 58,000 | 49,799 |
| 5.75% 1/15/28 | | 1,665,000 | 1,652,004 |
| 6.625% 1/15/27 | | 315,000 | 314,372 |
| ORSTED A/S 5.25% 12/8/22 (Reg. S) (e) | EUR | 600,000 | 651,405 |
| Pacific Gas & Electric Co.: | | | |
| 3.95% 12/1/47 | | 578,000 | 413,917 |
| 4% 12/1/46 | | 743,000 | 533,659 |
| 4.3% 3/15/45 | | 315,000 | 242,135 |
| PG&E Corp.: | | | |
| 5% 7/1/28 | | 1,345,000 | 1,294,082 |
| 5.25% 7/1/30 | | 510,000 | 487,063 |
| Vistra Operations Co. LLC: | | | |
| 4.375% 5/1/29(c) | | 1,105,000 | 1,028,901 |
| 5% 7/31/27(c) | | 1,220,000 | 1,180,158 |
| 5.5% 9/1/26(c) | | 820,000 | 808,648 |
| 5.625% 2/15/27(c) | | 1,495,000 | 1,469,945 |
| 7.75% 10/15/31(c) | | 580,000 | 604,007 |
| | | | 20,775,740 |
| Gas Utilities - 0.1% | | | |
| ENN Energy Holdings Ltd. 4.625% 5/17/27 (c) | | 640,000 | 626,600 |
| Southern Natural Gas Co. LLC: | | | |
| 7.35% 2/15/31 | | 175,000 | 186,498 |
| 8% 3/1/32 | | 335,000 | 380,420 |
| Suburban Propane Partners LP/Suburban Energy Finance Corp. 5% 6/1/31 (c) | | 570,000 | 513,307 |
| | | | 1,706,825 |
| Independent Power and Renewable Electricity Producers - 0.4% | | | |
| Atlantica Sustainable Infrastructure PLC 4.125% 6/15/28 (c) | | 370,000 | 362,081 |
| Aydem Yenilenebilir Enerji A/S 7.75% 2/2/27 (c) | | 245,000 | 237,956 |
| Buffalo Energy Mexico Holdings 7.875% 2/15/39 (c) | | 320,000 | 331,900 |
| Energo-Pro A/S 8.5% 2/4/27 (c) | | 465,000 | 464,855 |
| EnfraGen Energia Sur SA 5.375% 12/30/30 (c) | | 1,020,000 | 853,294 |
| Investment Energy Resources Ltd. 6.25% 4/26/29 (c) | | 485,000 | 456,658 |
| PT Pertamina Geothermal Energy 5.15% 4/27/28 (c) | | 205,000 | 203,078 |
| RWE AG 4.125% 2/13/35 (Reg. S) | EUR | 971,000 | 1,056,049 |
| Sunnova Energy Corp.: | | | |
| 5.875% 9/1/26(c) | | 145,000 | 112,738 |
| 11.75% 10/1/28(c) | | 860,000 | 614,900 |
| Termocandelaria Power Ltd. 7.875% 1/30/29 (c) | | 402,500 | 403,632 |
| | | | 5,097,141 |
| Multi-Utilities - 0.3% | | | |
| Abu Dhabi National Energy Co. PJSC: | | | |
| 4% 10/3/49(c) | | 448,000 | 362,180 |
| 4.696% 4/24/33(c) | | 350,000 | 341,250 |
| 4.875% 4/23/30(c) | | 195,000 | 194,695 |
| E.ON SE 4.125% 3/25/44 (Reg. S) | EUR | 747,000 | 790,417 |
| Engie SA 4.25% 3/6/44 (Reg. S) | EUR | 1,000,000 | 1,039,511 |
| National Grid PLC 4.275% 1/16/35 (Reg. S) | EUR | 1,388,000 | 1,507,328 |
| | | | 4,235,381 |
| Water Utilities - 0.1% | | | |
| Aegea Finance SARL 9% 1/20/31 (c) | | 200,000 | 207,000 |
| Suez SACA 2.375% 5/24/30 (Reg. S) | EUR | 1,800,000 | 1,775,099 |
| | | | 1,982,099 |
TOTAL UTILITIES | | | 33,797,186 |
| | | | |
| TOTAL NONCONVERTIBLE BONDS | | | 499,540,567 |
| TOTAL CORPORATE BONDS (Cost $525,485,832) | | | 506,544,141 |
| | | | |
| U.S. Government and Government Agency Obligations - 23.4% |
| | | Principal Amount (a) | Value ($) |
| U.S. Government Agency Obligations - 0.0% | | | |
| Tennessee Valley Authority: | | | |
| 5.25% 9/15/39 | | 126,000 | 130,612 |
| 5.375% 4/1/56 | | 302,000 | 316,193 |
TOTAL U.S. GOVERNMENT AGENCY OBLIGATIONS | | | 446,805 |
| U.S. Treasury Obligations - 23.3% | | | |
| U.S. Treasury Bills, yield at date of purchase 5.32% to 5.33% 7/25/24 to 8/1/24 (j) | | 1,240,000 | 1,234,671 |
| U.S. Treasury Bonds: | | | |
| 2% 8/15/51 | | 14,526,000 | 8,725,814 |
| 2.25% 2/15/52 | | 12,700,000 | 8,090,297 |
| 2.5% 2/15/45 | | 17,524,000 | 12,500,225 |
| 2.875% 5/15/52 | | 6,426,000 | 4,709,806 |
| 3% 5/15/45 | | 1,800,000 | 1,399,078 |
| 3% 2/15/49 | | 13,991,000 | 10,597,636 |
| 3.25% 5/15/42 | | 1,428,000 | 1,187,471 |
| 3.625% 2/15/53 | | 19,112,000 | 16,258,638 |
| 4.125% 8/15/53 | | 3,781,000 | 3,520,909 |
| 4.25% 2/15/54 | | 5,920,000 | 5,636,950 |
| 4.375% 8/15/43 | | 10,015,000 | 9,666,822 |
| 4.75% 2/15/37 | | 8,126,000 | 8,433,899 |
| U.S. Treasury Notes: | | | |
| 0.375% 12/31/25 | | 8,019,000 | 7,499,331 |
| 0.375% 1/31/26 | | 2,100,000 | 1,957,184 |
| 0.625% 7/31/26 | | 2,400,000 | 2,207,813 |
| 0.75% 3/31/26 | | 4,704,000 | 4,386,847 |
| 0.75% 8/31/26 | | 15,467,000 | 14,224,807 |
| 1% 7/31/28 | | 4,418,000 | 3,859,019 |
| 1.125% 10/31/26 | | 1,700,000 | 1,568,848 |
| 1.125% 8/31/28 | | 40,242,000 | 35,257,281 |
| 1.25% 12/31/26 | | 698,000 | 643,441 |
| 1.25% 9/30/28 | | 2,930,000 | 2,574,738 |
| 1.375% 10/31/28 | | 3,514,000 | 3,098,634 |
| 1.5% 1/31/27 | | 4,595,000 | 4,252,529 |
| 1.5% 11/30/28 | | 860,000 | 761,033 |
| 1.625% 9/30/26 | | 4,153,000 | 3,886,786 |
| 1.75% 1/31/29 | | 2,583,000 | 2,303,108 |
| 1.875% 2/28/27 | | 27,200,000 | 25,374,625 |
| 2.5% 2/28/26 | | 7,215,000 | 6,946,129 |
| 2.5% 3/31/27 | | 900,000 | 853,066 |
| 2.625% 7/31/29 | | 1,210,000 | 1,114,949 |
| 2.75% 7/31/27 | | 1,240,000 | 1,177,419 |
| 2.75% 5/31/29 | | 155,000 | 143,993 |
| 2.75% 8/15/32 | | 6,935,000 | 6,171,337 |
| 2.875% 4/30/29 | | 3,300,000 | 3,086,145 |
| 2.875% 5/15/32 | | 4,068,000 | 3,665,173 |
| 3.125% 11/15/28 | | 1,180,000 | 1,120,493 |
| 3.375% 5/15/33 | | 250,000 | 231,689 |
| 3.5% 1/31/28 | | 4,190,000 | 4,057,917 |
| 3.5% 2/15/33 | | 3,800,000 | 3,561,609 |
| 3.625% 5/15/26 | | 3,720,000 | 3,643,540 |
| 3.625% 3/31/30 | | 7,767,000 | 7,478,165 |
| 3.75% 5/31/30 | | 189,000 | 183,027 |
| 3.875% 1/15/26 | | 50,000 | 49,248 |
| 3.875% 11/30/27 | | 850,000 | 833,830 |
| 3.875% 12/31/27 | | 6,700,000 | 6,571,758 |
| 3.875% 8/15/33 | | 1,810,000 | 1,741,277 |
| 4% 1/15/27 | | 4,470,000 | 4,405,045 |
| 4% 10/31/29 | | 1,300,000 | 1,278,012 |
| 4% 7/31/30 | | 2,500,000 | 2,452,344 |
| 4% 1/31/31 | | 680,000 | 666,320 |
| 4.125% 2/15/27 | | 12,610,000 | 12,465,182 |
| 4.125% 10/31/27 | | 900,000 | 889,910 |
| 4.125% 7/31/28 | | 850,000 | 841,002 |
| 4.125% 8/31/30 | | 3,320,000 | 3,277,722 |
| 4.125% 3/31/31 | | 4,008,000 | 3,955,238 |
| 4.125% 11/15/32 | | 4,064,000 | 3,995,579 |
| 4.25% 12/31/25 | | 2,992,000 | 2,963,051 |
| 4.25% 3/15/27 | | 8,840,000 | 8,769,211 |
| 4.25% 2/28/31 | | 3,660,000 | 3,638,412 |
| 4.375% 11/30/28 | | 3,230,000 | 3,229,495 |
| 4.375% 11/30/30 | | 2,591,000 | 2,593,125 |
| 4.5% 3/31/26 | | 3,241,000 | 3,224,035 |
| 4.625% 3/15/26 | | 2,250,000 | 2,242,178 |
| 4.625% 11/15/26 | | 9,400,000 | 9,395,594 |
| 4.625% 9/30/30 | | 399,000 | 404,611 |
| 4.875% 10/31/30 | | 4,520,000 | 4,647,655 |
| 5% 10/31/25 | | 1,990,000 | 1,989,839 |
TOTAL U.S. TREASURY OBLIGATIONS | | | 335,772,564 |
| Other Government Related - 0.1% | | | |
| Private Export Funding Corp. Secured 1.75% 11/15/24 | | 1,030,000 | 1,015,076 |
| TOTAL U.S. GOVERNMENT AND GOVERNMENT AGENCY OBLIGATIONS (Cost $373,427,437) | | | 337,234,445 |
| | | | |
| U.S. Government Agency - Mortgage Securities - 3.2% |
| | | Principal Amount (a) | Value ($) |
| Fannie Mae - 1.0% | | | |
| 1.5% 11/1/40 to 11/1/41 | | 3,718,052 | 3,019,184 |
| 2% 2/1/28 to 12/1/41 | | 4,430,348 | 3,734,459 |
| 2.5% 1/1/30 to 5/1/42 | | 2,590,741 | 2,354,359 |
| 3% 11/1/34 to 2/1/52 (j) | | 1,566,634 | 1,422,403 |
| 3.5% 5/1/35 to 3/1/52 (j) | | 1,283,296 | 1,158,498 |
| 5% 10/1/52 to 12/1/52 (j)(k) | | 1,387,225 | 1,355,803 |
| 6% 6/1/53 (j) | | 837,360 | 849,379 |
| 6.5% 3/1/54 | | 149,478 | 152,305 |
TOTAL FANNIE MAE | | | 14,046,390 |
| Freddie Mac - 0.9% | | | |
| 1.5% 12/1/40 to 4/1/41 | | 1,039,842 | 845,597 |
| 2% 2/1/41 to 7/1/41 | | 1,635,087 | 1,372,521 |
| 2.5% 1/1/30 to 2/1/42 | | 6,858,109 | 6,087,365 |
| 3% 9/1/34 | | 312,262 | 292,157 |
| 3.5% 3/1/50 to 3/1/52 (k) | | 1,570,821 | 1,399,061 |
| 5% 10/1/52 to 12/1/52 (j)(k) | | 1,303,670 | 1,273,908 |
| 5.5% 9/1/52 | | 339,093 | 337,143 |
| 6.5% 10/1/53 | | 792,174 | 817,056 |
TOTAL FREDDIE MAC | | | 12,424,808 |
| Ginnie Mae - 0.4% | | | |
| Ginnie Mae: | | | |
| 2% 8/1/54 (f) | | 250,000 | 202,620 |
| 2% 8/1/54 (f) | | 1,400,000 | 1,134,670 |
| 2% 10/20/50 to 2/20/51 | | 941,283 | 762,677 |
| 2% 7/1/54 (f) | | 1,200,000 | 971,683 |
| 2% 7/1/54 (f) | | 1,450,000 | 1,174,117 |
| 2% 7/1/54 (f) | | 475,000 | 384,625 |
| 2% 7/1/54 (f) | | 150,000 | 121,460 |
| 2% 7/1/54 (f) | | 775,000 | 627,546 |
| 2.5% 8/20/51 to 12/20/51 | | 1,352,254 | 1,121,246 |
TOTAL GINNIE MAE | | | 6,500,644 |
| Uniform Mortgage Backed Securities - 0.9% | | | |
| 2% 7/1/54 (f) | | 800,000 | 625,688 |
| 2% 7/1/54 (f) | | 800,000 | 625,688 |
| 2.5% 7/1/54 (f) | | 2,600,000 | 2,123,469 |
| 2.5% 7/1/54 (f) | | 2,600,000 | 2,123,469 |
| 5% 7/1/54 (f) | | 1,300,000 | 1,256,379 |
| 5.5% 7/1/54 (f) | | 7,000,000 | 6,904,023 |
TOTAL UNIFORM MORTGAGE BACKED SECURITIES | | | 13,658,716 |
| TOTAL U.S. GOVERNMENT AGENCY - MORTGAGE SECURITIES (Cost $48,023,077) | | | 46,630,558 |
| | | | |
| Collateralized Mortgage Obligations - 1.3% |
| | | Principal Amount (a) | Value ($) |
| U.S. Government Agency - 1.3% | | | |
| Fannie Mae: | | | |
| planned amortization class Series 2021-65 Class MA, 2% 8/25/51 | | 784,963 | 670,044 |
| sequential payer: | | | |
Series 2020-101 Class BA, 1.5% 9/25/45 | | 353,157 | 299,439 |
Series 2020-49 Class JA, 2% 8/25/44 | | 116,055 | 104,753 |
Series 2020-51 Class BA, 2% 6/25/46 | | 455,934 | 388,507 |
Series 2020-67 Class KZ, 3.25% 9/25/40 | | 100,984 | 91,287 |
Series 2020-75 Class HA, 1.5% 12/25/44 | | 1,317,967 | 1,138,086 |
Series 2021-68 Class A, 2% 7/25/49 | | 244,453 | 189,987 |
Series 2021-85 Class L, 2.5% 8/25/48 | | 133,351 | 114,745 |
Series 2021-96 Class HA, 2.5% 2/25/50 | | 214,138 | 183,976 |
Series 2022-1 Class KA, 3% 5/25/48 | | 216,236 | 193,109 |
Series 2022-13 Class MA, 3% 5/25/44 | | 858,355 | 795,366 |
Series 2022-3: | | | |
Class G, 2% 11/25/47 | | 450,695 | 386,695 |
Class N, 2% 10/25/47 | | 1,684,412 | 1,445,150 |
Series 2022-4 Class B, 2.5% 5/25/49 | | 156,302 | 134,666 |
Series 2022-49 Class TE, 4.5% 12/25/48 | | 1,681,809 | 1,615,346 |
Series 2022-5: | | | |
Class 0, 2.5% 6/25/48 | | 186,577 | 162,885 |
Class BA, 2.5% 12/25/49 | | 239,668 | 202,370 |
Series 2022-65 Class GA, 5% 4/25/46 | | 1,587,980 | 1,533,278 |
Series 2022-7 Class A, 3% 5/25/48 | | 308,137 | 275,187 |
| Series 2020-45 Class JL, 3% 7/25/40 | | 34,438 | 30,686 |
| Series 2021-59 Class H, 2% 6/25/48 | | 137,727 | 110,033 |
| Series 2021-66: | | | |
Class DA, 2% 1/25/48 | | 147,514 | 118,464 |
Class DM, 2% 1/25/48 | | 156,765 | 125,893 |
| Freddie Mac: | | | |
| planned amortization class: | | | |
Series 2021-5122 Class TE, 1.5% 6/25/51 | | 500,786 | 404,648 |
Series 2022-5213 Class JM, 3.5% 9/25/51 | | 746,654 | 702,391 |
Series 2022-5214 Class CG, 3.5% 4/25/52 | | 282,938 | 262,401 |
Series 2022-5220 Class PK, 3.5% 1/25/51 | | 362,989 | 334,167 |
Series 2022-5224 Class DQ, 3.75% 8/25/44 | | 422,968 | 398,539 |
| sequential payer: | | | |
Series 2020-5018: | | | |
Class LC, 3% 10/25/40 | | 232,409 | 207,589 |
Class LT, 3.25% 10/25/40 | | 103,832 | 94,687 |
Class LY, 3% 10/25/40 | | 176,723 | 157,812 |
Series 2021-5175 Class CB, 2.5% 4/25/50 | | 773,010 | 662,577 |
Series 2021-5180 Class KA, 2.5% 10/25/47 | | 153,613 | 135,286 |
Series 2022-5189 Class DA, 2.5% 5/25/49 | | 165,615 | 140,643 |
Series 2022-5190 Class BA, 2.5% 11/25/47 | | 159,822 | 140,605 |
Series 2022-5191 Class CA, 2.5% 4/25/50 | | 180,882 | 154,068 |
Series 2022-5197 Class DA, 2.5% 11/25/47 | | 121,333 | 106,877 |
Series 2022-5198 Class BA, 2.5% 11/25/47 | | 608,302 | 537,492 |
Series 2022-5200 Class LA, 3% 10/25/48 | | 283,482 | 254,060 |
Series 2022-5202 Class LB, 2.5% 10/25/47 | | 129,946 | 113,461 |
| Series 2020-5041 Class LB, 3% 11/25/40 | | 396,098 | 354,042 |
| Series 2021-5083 Class VA, 1% 8/15/38 | | 1,478,145 | 1,378,740 |
| Series 2021-5176 Class AG, 2% 1/25/47 | | 579,155 | 493,153 |
| Series 2021-5182 Class A, 2.5% 10/25/48 | | 1,005,480 | 866,796 |
| Freddie Mac Multi-family Structured pass-thru certificates sequential payer Series 2021-5159 Class GC, 2% 11/25/47 | | 123,090 | 106,025 |
| | | | |
| TOTAL COLLATERALIZED MORTGAGE OBLIGATIONS (Cost $18,360,174) | | | 18,316,011 |
| | | | |
| Commercial Mortgage Securities - 3.3% |
| | | Principal Amount (a) | Value ($) |
| Fannie Mae Series 2022-66, Class KA, 5% 10/25/52 | | 325,277 | 320,162 |
| Freddie Mac: | | | |
| floater Series 2024-K523 Class A/S, U.S. 30-Day Avg. Secured Overnight Fin. Rate (SOFR) Index + 0.550% 5.8743% 5/25/29 (e)(i) | | 2,200,000 | 2,199,998 |
| sequential payer: | | | |
Series 2015-K043 Class A2, 3.062% 12/25/24 | | 1,539,301 | 1,520,096 |
Series 2015-K049 Class A2, 3.01% 7/25/25 | | 633,270 | 618,288 |
Series 2015-K050 Class A2, 3.334% 8/25/25 (e) | | 1,457,293 | 1,425,696 |
Series 2015-K051 Class A2, 3.308% 9/25/25 | | 2,200,000 | 2,148,965 |
Series 2015-KPLB Class A, 2.77% 5/25/25 | | 1,180,000 | 1,150,721 |
Series 2016-K052 Class A2, 3.151% 11/25/25 | | 4,852,314 | 4,722,310 |
Series 2016-K055 Class A2, 2.673% 3/25/26 | | 2,100,000 | 2,017,334 |
Series 2017-K066 Class A2, 3.117% 6/25/27 | | 290,000 | 275,936 |
Series 2017-K729 Class A2, 3.136% 10/25/24 | | 893,313 | 885,334 |
Series 2018-K731 Class A2, 3.6% 2/25/25 | | 303,757 | 300,000 |
Series 2018-K732 Class A2, 3.7% 5/25/25 | | 1,722,843 | 1,697,317 |
Series 2018-K733 Class A2, 3.75% 8/25/25 | | 1,769,139 | 1,736,668 |
Series 2019-K735 Class A2, 2.862% 5/25/26 | | 1,069,169 | 1,027,820 |
Series 2019-K736 Class A2, 2.282% 7/25/26 | | 900,000 | 855,622 |
Series 2022-K747 Class A2, 2.05% 11/25/28 | | 500,000 | 445,814 |
Series K058 Class A2, 2.653% 8/25/26 | | 1,300,000 | 1,238,184 |
Series K073 Class A2, 3.35% 1/25/28 | | 300,000 | 285,373 |
| Series 2016-K059 Class A2, 3.12% 9/25/26 (e) | | 500,000 | 480,574 |
| Series 2017-K727 Class A2, 2.946% 7/25/24 | | 707,708 | 704,977 |
| Series K048 Class A2, 3.284% 6/25/25 (e) | | 8,914,000 | 8,744,195 |
| Series K053 Class A2, 2.995% 12/25/25 | | 2,300,000 | 2,230,408 |
| Series K056 Class A2, 2.525% 5/25/26 | | 200,000 | 191,115 |
| Series K063 Class A2, 3.43% 1/25/27 | | 600,000 | 578,183 |
| Series K734 Class A2, 3.208% 2/25/26 | | 900,000 | 874,406 |
| Freddie Mac Multi-family Structured pass-thru certificates: | | | |
| sequential payer Series 2015 K045 Class A2, 3.023% 1/25/25 | | 2,602,623 | 2,562,798 |
| Series K044 Class A2, 2.811% 1/25/25 | | 1,682,907 | 1,657,416 |
| FREMF 2015-KPLB Mortgage Trust Series 2015-KPLB Class B, 2.5% 5/25/25 (c) | | 4,200,000 | 4,064,675 |
| TOTAL COMMERCIAL MORTGAGE SECURITIES (Cost $47,095,643) | | | 46,960,385 |
| | | | |
| Foreign Government and Government Agency Obligations - 10.5% |
| | | Principal Amount (a) | Value ($) |
| Abu Dhabi National Energy Co. PJSC 4.375% 1/24/29 (c) | | 315,000 | 307,223 |
| Angola Republic: | | | |
| 8.25% 5/9/28 (c) | | 650,000 | 610,188 |
| 8.75% 4/14/32 (c) | | 170,000 | 150,503 |
| 9.375% 5/8/48 (c) | | 310,000 | 259,334 |
| 9.5% 11/12/25 (c) | | 795,000 | 806,180 |
| Arab Republic of Egypt: | | | |
| , yield at date of purchase 25.8506% to 31.6253% 12/10/24 to 3/18/25 | EGP | 30,825,000 | 554,773 |
| 7.0529% 1/15/32 (c) | | 30,000 | 23,972 |
| 7.5% 1/31/27 (c) | | 830,000 | 797,059 |
| 7.5% 2/16/61 (c) | | 480,000 | 320,850 |
| 7.6003% 3/1/29 (c) | | 370,000 | 335,659 |
| 7.903% 2/21/48 (c) | | 460,000 | 322,863 |
| 8.5% 1/31/47 (c) | | 580,000 | 429,200 |
| 8.7002% 3/1/49 (c) | | 460,000 | 342,700 |
| Argentine Republic: | | | |
| 0.75% 7/9/30 (h) | | 5,725,308 | 3,211,898 |
| 1% 7/9/29 | | 738,798 | 422,269 |
| 3.5% 7/9/41 (h) | | 1,140,000 | 446,880 |
| 3.625% 7/9/35 (h) | | 3,492,241 | 1,466,741 |
| 4.25% 1/9/38 (h) | | 2,032,304 | 932,828 |
| Australian Commonwealth: | | | |
| 1.75% 11/21/32 (Reg. S) | AUD | 1,600,000 | 878,611 |
| 1.75% 6/21/51 (Reg. S) | AUD | 8,595,000 | 3,172,362 |
| Bahamian Republic 6% 11/21/28 (c) | | 310,000 | 271,056 |
| Bahrain Kingdom: | | | |
| 5.625% 5/18/34 (c) | | 155,000 | 138,919 |
| 7.5% 2/12/36 (c) | | 200,000 | 204,188 |
| Bank Gospodarstwa Krajowego: | | | |
| 5.375% 5/22/33 (c) | | 200,000 | 198,080 |
| 6.25% 10/31/28 (c) | | 200,000 | 206,822 |
| Barbados Government 6.5% 10/1/29 (c) | | 354,000 | 335,083 |
| Bermuda Government: | | | |
| 2.375% 8/20/30 (c) | | 55,000 | 46,252 |
| 3.375% 8/20/50 (c) | | 165,000 | 112,355 |
| 3.717% 1/25/27 (c) | | 645,000 | 615,572 |
| 4.75% 2/15/29 (c) | | 360,000 | 348,602 |
| 5% 7/15/32 (c) | | 260,000 | 251,063 |
| Bonos para la Reconstruccion de una Argentina Libre 0% 6/30/25 | | 370,000 | 348,048 |
| Brazilian Federative Republic: | | | |
| 3.875% 6/12/30 | | 830,000 | 732,475 |
| 6% 10/20/33 | | 335,000 | 321,935 |
| 7.125% 1/20/37 | | 565,000 | 590,425 |
| 7.125% 5/13/54 | | 215,000 | 207,583 |
| 8.25% 1/20/34 | | 1,045,000 | 1,187,120 |
| Canadian Government 1.25% 3/1/27 | CAD | 3,000,000 | 2,058,039 |
| Chilean Republic: | | | |
| 2.45% 1/31/31 | | 1,355,000 | 1,155,815 |
| 2.75% 1/31/27 | | 310,000 | 291,497 |
| 3.1% 1/22/61 | | 700,000 | 433,344 |
| 3.5% 1/31/34 | | 200,000 | 173,600 |
| 4% 1/31/52 | | 200,000 | 154,625 |
| 4.34% 3/7/42 | | 260,000 | 224,440 |
| 5.33% 1/5/54 | | 505,000 | 477,225 |
| Colombian Republic: | | | |
| 3% 1/30/30 | | 1,025,000 | 837,938 |
| 3.125% 4/15/31 | | 535,000 | 421,580 |
| 3.25% 4/22/32 | | 290,000 | 222,430 |
| 4.125% 5/15/51 | | 220,000 | 132,110 |
| 5% 6/15/45 | | 855,000 | 600,638 |
| 5.2% 5/15/49 | | 650,000 | 458,250 |
| 6.125% 1/18/41 | | 40,000 | 33,620 |
| 7.375% 9/18/37 | | 140,000 | 135,870 |
| 7.5% 2/2/34 | | 250,000 | 250,125 |
| 8% 4/20/33 | | 280,000 | 290,220 |
| 8% 11/14/35 | | 310,000 | 318,370 |
| 8.75% 11/14/53 | | 290,000 | 305,370 |
| Costa Rican Republic: | | | |
| 5.625% 4/30/43 (c) | | 285,000 | 254,095 |
| 6.125% 2/19/31 (c) | | 130,000 | 130,447 |
| 7.3% 11/13/54 (c) | | 305,000 | 317,772 |
| Democratic Socialist Republic of Sri Lanka: | | | |
| 6.2% (c)(d) | | 300,000 | 175,781 |
| 6.825% (c)(d) | | 365,000 | 214,095 |
| 7.55% (c)(d) | | 235,000 | 134,303 |
| 7.85% (c)(d) | | 505,000 | 296,530 |
| Dominican Republic: | | | |
| 4.5% 1/30/30 (c) | | 735,000 | 669,769 |
| 4.875% 9/23/32 (c) | | 860,000 | 771,313 |
| 5.875% 1/30/60 (c) | | 270,000 | 229,669 |
| 5.95% 1/25/27 (c) | | 445,000 | 442,330 |
| 6% 7/19/28 (c) | | 360,000 | 356,760 |
| 6.5% 2/15/48 (c) | | 215,000 | 203,981 |
| 6.6% 6/1/36 (c) | | 224,000 | 223,216 |
| 6.85% 1/27/45 (c) | | 300,000 | 294,450 |
| 6.875% 1/29/26 (c) | | 790,000 | 798,888 |
| 7.05% 2/3/31 (c) | | 375,000 | 386,016 |
| 7.45% 4/30/44 (c) | | 335,000 | 351,750 |
| Dutch Government 0.5% 7/15/32 (Reg. S) (c) | EUR | 10,000 | 8,993 |
| Ecopetrol SA 8.375% 1/19/36 | | 290,000 | 284,635 |
| Ecuador Republic: | | | |
| 3.5% 7/31/35 (c)(h) | | 705,000 | 351,398 |
| 6% 7/31/30 (c)(h) | | 1,220,000 | 772,031 |
| El Salvador Republic: | | | |
| 0.25% 4/17/30 (c) | | 290,000 | 8,410 |
| 6.375% 1/18/27 (c) | | 75,000 | 66,525 |
| 7.1246% 1/20/50 (c) | | 290,000 | 183,697 |
| 7.625% 2/1/41 (c) | | 90,000 | 60,570 |
| 7.65% 6/15/35 (c) | | 135,000 | 97,158 |
| 9.25% 4/17/30 (c) | | 290,000 | 257,583 |
| Emirate of Abu Dhabi: | | | |
| 3% 9/15/51 (c) | | 645,000 | 432,956 |
| 3.125% 9/30/49 (c) | | 1,915,000 | 1,336,311 |
| 3.875% 4/16/50 (c) | | 620,000 | 494,450 |
| 5.5% 4/30/54 (c) | | 395,000 | 401,419 |
| Emirate of Dubai: | | | |
| 3.9% 9/9/50 (Reg. S) | | 920,000 | 675,625 |
| 5.25% 1/30/43 (Reg. S) | | 330,000 | 311,128 |
| Export Credit Bank of Turkey 9% 1/28/27 (c) | | 305,000 | 316,914 |
| Gabonese Republic: | | | |
| 6.625% 2/6/31 (c) | | 425,000 | 320,875 |
| 7% 11/24/31 (c) | | 455,000 | 343,525 |
| Georgia Republic 2.75% 4/22/26 (c) | | 290,000 | 264,897 |
| German Federal Republic: | | | |
| 1.8% 8/15/53(Reg. S) | EUR | 2,290,000 | 2,024,234 |
| 2.2% 12/12/24(Reg. S) | EUR | 7,140,000 | 7,607,738 |
| 2.4% 10/19/28(Reg. S) | EUR | 2,570,000 | 2,741,415 |
| 2.6% 8/15/33(Reg. S) | EUR | 23,860,000 | 25,837,577 |
| Ghana Republic: | | | |
| 7.75% (c)(d) | | 285,000 | 144,459 |
| 8.627% (c)(d) | | 255,000 | 127,500 |
| 10.75% 10/14/30 (c) | | 520,000 | 350,675 |
| Guatemalan Republic: | | | |
| 4.9% 6/1/30 (c) | | 230,000 | 217,709 |
| 5.375% 4/24/32 (c) | | 120,000 | 113,813 |
| 6.125% 6/1/50 (c) | | 225,000 | 203,133 |
| 6.6% 6/13/36 (c) | | 190,000 | 190,356 |
| Hungarian Republic: | | | |
| 2.125% 9/22/31 (c) | | 205,000 | 162,155 |
| 3.125% 9/21/51 (c) | | 340,000 | 215,900 |
| 5.25% 6/16/29 (c) | | 295,000 | 289,469 |
| 5.5% 6/16/34 (c) | | 695,000 | 674,802 |
| 6.125% 5/22/28 (c) | | 225,000 | 229,219 |
| 6.75% 9/25/52 (c) | | 145,000 | 155,494 |
| Indonesian Republic: | | | |
| 3.2% 9/23/61 | | 400,000 | 257,125 |
| 4.35% 1/11/48 | | 300,000 | 256,407 |
| 5.125% 1/15/45 (c) | | 1,160,000 | 1,125,563 |
| 5.25% 1/17/42 (c) | | 305,000 | 298,934 |
| 5.95% 1/8/46 (c) | | 350,000 | 370,125 |
| 6.625% 2/17/37 (c) | | 220,000 | 245,506 |
| 6.75% 1/15/44 (c) | | 330,000 | 381,459 |
| 7.75% 1/17/38 (c) | | 930,000 | 1,143,609 |
| 8.5% 10/12/35 (c) | | 875,000 | 1,104,784 |
| Islamic Republic of Pakistan: | | | |
| 6% 4/8/26 (c) | | 730,000 | 656,316 |
| 6.875% 12/5/27 (c) | | 215,000 | 185,505 |
| 7.375% 4/8/31 (c) | | 480,000 | 377,550 |
| Israeli State: | | | |
| 3.375% 1/15/50 | | 595,000 | 379,543 |
| 5.75% 3/12/54 | | 315,000 | 283,106 |
| Ivory Coast: | | | |
| 5.875% 10/17/31 (c) | EUR | 920,000 | 887,670 |
| 6.375% 3/3/28 (c) | | 490,000 | 473,463 |
| 8.25% 1/30/37 (c) | | 300,000 | 289,500 |
| Jamaican Government: | | | |
| 6.75% 4/28/28 | | 255,000 | 261,216 |
| 7.875% 7/28/45 | | 160,000 | 185,950 |
| Jordanian Kingdom: | | | |
| 4.95% 7/7/25 (c) | | 575,000 | 559,727 |
| 7.375% 10/10/47 (c) | | 110,000 | 93,706 |
| 7.5% 1/13/29 (c) | | 200,000 | 195,000 |
| 7.75% 1/15/28 (c) | | 320,000 | 316,700 |
| Kingdom of Saudi Arabia: | | | |
| 2.25% 2/2/33 (c) | | 665,000 | 531,584 |
| 3.45% 2/2/61 (c) | | 1,120,000 | 730,800 |
| 3.625% 3/4/28 (c) | | 315,000 | 300,038 |
| 3.75% 1/21/55 (c) | | 655,000 | 462,594 |
| 4.5% 10/26/46 (c) | | 640,000 | 542,600 |
| 4.5% 4/22/60 (c) | | 225,000 | 182,391 |
| 4.625% 10/4/47 (c) | | 330,000 | 281,738 |
| 5% 1/18/53 (c) | | 375,000 | 330,000 |
| 5.75% 1/16/54 (c) | | 315,000 | 306,810 |
| Lebanese Republic: | | | |
| 5.8% (d) | | 625,000 | 42,969 |
| 6.375% (d) | | 810,000 | 55,688 |
| Mongolia Government 7.875% 6/5/29 (c) | | 200,000 | 204,022 |
| Moroccan Kingdom 6.5% 9/8/33 (c) | | 495,000 | 510,314 |
| Panamanian Republic: | | | |
| 2.252% 9/29/32 | | 400,000 | 287,800 |
| 3.298% 1/19/33 | | 445,000 | 346,210 |
| 3.87% 7/23/60 | | 715,000 | 407,327 |
| 4.5% 5/15/47 | | 250,000 | 172,969 |
| 4.5% 4/16/50 | | 780,000 | 525,525 |
| 6.853% 3/28/54 | | 200,000 | 183,600 |
| 7.875% 3/1/57 | | 290,000 | 301,419 |
| 8% 3/1/38 | | 305,000 | 321,470 |
| Peruvian Republic: | | | |
| 2.783% 1/23/31 | | 740,000 | 633,810 |
| 3% 1/15/34 | | 440,000 | 358,188 |
| 3.3% 3/11/41 | | 360,000 | 267,188 |
| Philippine Republic: | | | |
| 2.65% 12/10/45 | | 390,000 | 255,572 |
| 2.95% 5/5/45 | | 160,000 | 110,750 |
| 5% 7/17/33 | | 210,000 | 207,244 |
| 5.5% 1/17/48 | | 200,000 | 202,313 |
| 5.6% 5/14/49 | | 295,000 | 298,351 |
| 5.609% 4/13/33 | | 305,000 | 313,578 |
| 5.95% 10/13/47 | | 490,000 | 521,238 |
| Polish Government: | | | |
| 5.5% 4/4/53 | | 210,000 | 205,544 |
| 5.5% 3/18/54 | | 285,000 | 276,473 |
| 5.75% 11/16/32 | | 425,000 | 440,245 |
| Provincia de Cordoba: | | | |
| 6.875% 12/10/25 (c) | | 195,922 | 181,489 |
| 6.99% 6/1/27 (c) | | 515,562 | 425,957 |
| Republic of Armenia 3.6% 2/2/31 (c) | | 280,000 | 228,113 |
| Republic of Benin: | | | |
| 4.875% 1/19/32 (c) | EUR | 275,000 | 246,469 |
| 7.96% 2/13/38 (c) | | 290,000 | 269,156 |
| Republic of Kenya: | | | |
| 6.3% 1/23/34 (c) | | 195,000 | 145,580 |
| 7.25% 2/28/28 (c) | | 100,000 | 90,781 |
| 9.75% 2/16/31 (c) | | 350,000 | 333,375 |
| Republic of Montenegro 7.25% 3/12/31 (c) | | 380,000 | 381,425 |
| Republic of Nigeria: | | | |
| , yield at date of purchase 25.6137% to 28.7481% 3/6/25 to 5/20/25 | NGN | 1,000,660,000 | 555,732 |
| 6.125% 9/28/28 (c) | | 1,020,000 | 894,413 |
| 6.5% 11/28/27 (c) | | 445,000 | 411,764 |
| 7.143% 2/23/30 (c) | | 360,000 | 312,188 |
| 7.625% 11/21/25 (c) | | 345,000 | 345,431 |
| 7.696% 2/23/38 (c) | | 280,000 | 216,738 |
| 7.875% 2/16/32 (c) | | 160,000 | 138,400 |
| Republic of Paraguay: | | | |
| 2.739% 1/29/33 (c) | | 225,000 | 180,984 |
| 4.95% 4/28/31 (c) | | 480,000 | 457,950 |
| 5.4% 3/30/50 (c) | | 265,000 | 229,059 |
| 6% 2/9/36 (c) | | 260,000 | 259,838 |
| Republic of Senegal 6.25% 5/23/33 (c) | | 315,000 | 263,419 |
| Republic of Serbia: | | | |
| 2.125% 12/1/30 (c) | | 840,000 | 669,375 |
| 6% 6/12/34 (c) | | 335,000 | 329,556 |
| 6.5% 9/26/33 (c) | | 405,000 | 410,695 |
| Republic of Uzbekistan: | | | |
| 3.7% 11/25/30 (c) | | 115,000 | 94,588 |
| 3.9% 10/19/31 (c) | | 205,000 | 166,819 |
| Republic of Zambia: | | | |
| 0.5% 12/31/53 (c) | | 62,254 | 30,427 |
| 5.75% 6/30/33 (c) | | 74,935 | 65,920 |
| Romanian Republic: | | | |
| 2% 4/14/33 (Reg. S) | EUR | 135,000 | 108,479 |
| 3% 2/27/27 (c) | | 265,000 | 246,450 |
| 3.375% 1/28/50 (Reg. S) | EUR | 170,000 | 120,900 |
| 3.625% 3/27/32 (c) | | 470,000 | 397,591 |
| 4% 2/14/51 (c) | | 150,000 | 103,594 |
| 6.625% 2/17/28 (c) | | 225,000 | 229,644 |
| 7.125% 1/17/33 (c) | | 80,000 | 84,300 |
| 8% 4/29/30 | RON | 1,115,000 | 253,492 |
| Rwanda Republic 5.5% 8/9/31 (c) | | 560,000 | 448,875 |
| South African Republic: | | | |
| 4.85% 9/27/27 | | 285,000 | 272,888 |
| 4.85% 9/30/29 | | 235,000 | 214,731 |
| 5% 10/12/46 | | 395,000 | 276,994 |
| 5.65% 9/27/47 | | 190,000 | 143,213 |
| 5.75% 9/30/49 | | 620,000 | 466,550 |
| 5.875% 4/20/32 | | 280,000 | 259,350 |
| State of Qatar: | | | |
| 4.4% 4/16/50 (c) | | 1,450,000 | 1,271,469 |
| 4.625% 6/2/46 (c) | | 575,000 | 526,844 |
| 4.817% 3/14/49 (c) | | 1,060,000 | 991,431 |
| 5.103% 4/23/48 (c) | | 975,000 | 949,406 |
| 9.75% 6/15/30 (c) | | 295,000 | 371,977 |
| Sultanate of Oman: | | | |
| 5.375% 3/8/27 (c) | | 120,000 | 118,988 |
| 5.625% 1/17/28 (c) | | 930,000 | 928,838 |
| 6% 8/1/29 (c) | | 450,000 | 456,750 |
| 6.25% 1/25/31 (c) | | 425,000 | 437,484 |
| 6.5% 3/8/47 (c) | | 195,000 | 194,513 |
| 6.75% 1/17/48 (c) | | 920,000 | 936,963 |
| 7% 1/25/51 (c) | | 105,000 | 110,513 |
| Turkish Republic: | | | |
| 4.25% 4/14/26 | | 830,000 | 799,134 |
| 4.75% 1/26/26 | | 980,000 | 954,275 |
| 4.875% 10/9/26 | | 650,000 | 627,250 |
| 4.875% 4/16/43 | | 815,000 | 576,867 |
| 5.125% 2/17/28 | | 520,000 | 494,163 |
| 5.25% 3/13/30 | | 185,000 | 169,217 |
| 5.75% 5/11/47 | | 520,000 | 399,588 |
| 6% 3/25/27 | | 170,000 | 167,503 |
| 6% 1/14/41 | | 770,000 | 639,100 |
| 6.625% 2/17/45 | | 310,000 | 267,472 |
| 7.625% 5/15/34 | | 325,000 | 327,336 |
| 9.125% 7/13/30 | | 350,000 | 381,500 |
| 9.375% 3/14/29 | | 490,000 | 532,875 |
| 9.375% 1/19/33 | | 840,000 | 938,963 |
| 9.875% 1/15/28 | | 1,165,000 | 1,278,952 |
| 26.2% 10/5/33 | TRY | 8,645,000 | 261,083 |
| 31.08% 11/8/28 | TRY | 7,595,000 | 240,493 |
| 37% 2/18/26 | TRY | 4,065,000 | 122,555 |
| Ukraine Government: | | | |
| 6.876% 5/21/31 (c) | | 170,000 | 48,450 |
| 7.253% 3/15/35 (c) | | 585,000 | 166,433 |
| 7.375% 9/25/34 (c) | | 285,000 | 81,225 |
| 7.75% 9/1/24 (c) | | 441,000 | 139,577 |
| 7.75% 9/1/25 (c) | | 1,150,000 | 362,825 |
| 7.75% 9/1/26 (c) | | 1,230,000 | 378,840 |
| 7.75% 9/1/28 (c) | | 200,000 | 60,600 |
| 7.75% 9/1/29 (c) | | 110,000 | 33,275 |
| 7.75% 8/1/41 (c)(e) | | 370,000 | 180,560 |
| United Kingdom, Great Britain and Northern Ireland 3.25% 1/31/33(Reg. S) | GBP | 6,250,000 | 7,404,102 |
| United Mexican States: | | | |
| 3.5% 2/12/34 | | 610,000 | 496,235 |
| 3.75% 4/19/71 | | 1,000,000 | 600,500 |
| 4.875% 5/19/33 | | 345,000 | 318,090 |
| 5.75% 10/12/2110 | | 840,000 | 694,838 |
| 6% 5/7/36 | | 600,000 | 584,400 |
| 6.05% 1/11/40 | | 670,000 | 649,063 |
| 6.338% 5/4/53 | | 305,000 | 287,005 |
| 6.35% 2/9/35 | | 465,000 | 467,558 |
| Uruguay Republic: | | | |
| 5.1% 6/18/50 | | 675,000 | 637,031 |
| 5.75% 10/28/34 | | 300,000 | 312,600 |
| 9.75% 7/20/33 | UYU | 11,685,000 | 295,650 |
| Venezuelan Republic: | | | |
| 9.25% (d) | | 2,395,000 | 441,878 |
| 11.95% (Reg. S) (d) | | 1,090,000 | 198,380 |
| 12.75% (d) | | 190,000 | 34,580 |
| Vietnamese Socialist Republic 5.5% 3/12/28 | | 1,591,000 | 1,507,266 |
| TOTAL FOREIGN GOVERNMENT AND GOVERNMENT AGENCY OBLIGATIONS (Cost $164,232,896) | | | 151,672,671 |
| | | | |
| Common Stocks - 6.8% |
| | | Shares | Value ($) |
| COMMUNICATION SERVICES - 0.5% | | | |
| Interactive Media & Services - 0.4% | | | |
| Alphabet, Inc. Class A | | 4,200 | 765,030 |
| Meta Platforms, Inc. Class A | | 8,800 | 4,437,136 |
| Pinterest, Inc. Class A (l) | | 21,200 | 934,284 |
| | | | 6,136,450 |
| Media - 0.1% | | | |
| EchoStar Corp. Class A (l) | | 36,100 | 642,941 |
| iHeartMedia, Inc. (l)(m) | | 5,655 | 6,164 |
| | | | 649,105 |
| Wireless Telecommunication Services - 0.0% | | | |
| Digicel Group Ltd. (b) | | 6,023 | 14,515 |
TOTAL COMMUNICATION SERVICES | | | 6,800,070 |
| CONSUMER DISCRETIONARY - 1.0% | | | |
| Automobile Components - 0.0% | | | |
| UC Holdings, Inc. (b)(l) | | 33,750 | 27,675 |
| Automobiles - 0.1% | | | |
| BYD Co. Ltd. (H Shares) | | 55,500 | 1,648,286 |
| Broadline Retail - 0.2% | | | |
| Amazon.com, Inc. (l) | | 10,200 | 1,971,150 |
| Hotels, Restaurants & Leisure - 0.2% | | | |
| Airbnb, Inc. Class A (l) | | 6,400 | 970,432 |
| Booking Holdings, Inc. | | 200 | 792,300 |
| Boyd Gaming Corp. | | 12,300 | 677,730 |
| Domino's Pizza, Inc. | | 1,100 | 567,963 |
| New Cotai LLC/New Cotai Capital Corp. (b)(g)(l) | | 247,076 | 182,836 |
| Studio City International Holdings Ltd.: | | | |
| ADR (c)(l) | | 10,083 | 58,986 |
| (NYSE) ADR (l) | | 11,100 | 64,935 |
| | | | 3,315,182 |
| Household Durables - 0.1% | | | |
| TopBuild Corp. (l) | | 4,300 | 1,656,661 |
| Specialty Retail - 0.2% | | | |
| Dick's Sporting Goods, Inc. | | 5,700 | 1,224,645 |
| Lowe's Companies, Inc. | | 2,900 | 639,334 |
| Williams-Sonoma, Inc. | | 2,300 | 649,451 |
| | | | 2,513,430 |
| Textiles, Apparel & Luxury Goods - 0.2% | | | |
| Crocs, Inc. (l) | | 11,600 | 1,692,904 |
| LVMH Moet Hennessy Louis Vuitton SE | | 500 | 383,896 |
| Tapestry, Inc. | | 9,300 | 397,947 |
| | | | 2,474,747 |
TOTAL CONSUMER DISCRETIONARY | | | 13,607,131 |
| CONSUMER STAPLES - 0.1% | | | |
| Beverages - 0.0% | | | |
| Celsius Holdings, Inc. (l) | | 11,200 | 639,408 |
| Consumer Staples Distribution & Retail - 0.1% | | | |
| Southeastern Grocers, Inc. rights (b)(l) | | 40,826 | 44,909 |
| U.S. Foods Holding Corp. (l) | | 12,800 | 678,144 |
| | | | 723,053 |
| Personal Care Products - 0.0% | | | |
| elf Beauty, Inc. (l) | | 3,200 | 674,304 |
TOTAL CONSUMER STAPLES | | | 2,036,765 |
| ENERGY - 0.4% | | | |
| Energy Equipment & Services - 0.0% | | | |
| Forbes Energy Services Ltd. (b)(l) | | 6,562 | 1 |
| Superior Energy Services, Inc. Class A (b) | | 5,560 | 379,915 |
| | | | 379,916 |
| Oil, Gas & Consumable Fuels - 0.4% | | | |
| Antero Resources Corp. (l) | | 12,900 | 420,927 |
| California Resources Corp. warrants 10/27/24 (l) | | 3,099 | 55,270 |
| Canvas Energy, Inc.: | | | |
| Series A warrants 10/1/24 (b)(l) | | 13 | 0 |
| Series B warrants 10/1/25 (b)(l) | | 13 | 0 |
| Cheniere Energy, Inc. | | 7,900 | 1,381,157 |
| EP Energy Corp. (b)(l) | | 52,316 | 71,150 |
| Mesquite Energy, Inc. (b)(l) | | 15,322 | 1,277,818 |
| Permian Resource Corp. Class A (m) | | 151,900 | 2,453,185 |
| Unit Corp. | | 2,069 | 75,519 |
| | | | 5,735,026 |
TOTAL ENERGY | | | 6,114,942 |
| FINANCIALS - 1.0% | | | |
| Capital Markets - 0.2% | | | |
| Ares Management Corp. Class A, | | 4,400 | 586,432 |
| Blue Owl Capital, Inc. Class A | | 33,300 | 591,075 |
| Coinbase Global, Inc. (l) | | 4,400 | 977,812 |
| Moody's Corp. | | 1,600 | 673,488 |
| | | | 2,828,807 |
| Consumer Finance - 0.1% | | | |
| OneMain Holdings, Inc. | | 29,100 | 1,411,059 |
| Financial Services - 0.5% | | | |
| Apollo Global Management, Inc. | | 20,300 | 2,396,821 |
| Block, Inc. Class A (l) | | 9,800 | 632,002 |
| Carnelian Point Holdings LP warrants (b)(l) | | 54 | 158 |
| Fiserv, Inc. (l) | | 5,800 | 864,432 |
| MasterCard, Inc. Class A | | 3,000 | 1,323,480 |
| Visa, Inc. Class A | | 8,800 | 2,309,736 |
| | | | 7,526,629 |
| Insurance - 0.2% | | | |
| Arthur J. Gallagher & Co. | | 8,600 | 2,230,066 |
TOTAL FINANCIALS | | | 13,996,561 |
| HEALTH CARE - 0.0% | | | |
| Health Care Providers & Services - 0.0% | | | |
| Tenet Healthcare Corp. (l) | | 3,700 | 492,211 |
| INDUSTRIALS - 1.1% | | | |
| Aerospace & Defense - 0.1% | | | |
| TransDigm Group, Inc. | | 500 | 638,805 |
| Building Products - 0.3% | | | |
| Builders FirstSource, Inc. (l) | | 3,200 | 442,912 |
| Carlisle Companies, Inc. | | 2,800 | 1,134,588 |
| Fortune Brands Innovations, Inc. | | 11,300 | 733,822 |
| Trane Technologies PLC | | 3,600 | 1,184,148 |
| | | | 3,495,470 |
| Construction & Engineering - 0.2% | | | |
| Comfort Systems U.S.A., Inc. | | 3,800 | 1,155,656 |
| EMCOR Group, Inc. | | 1,900 | 693,652 |
| Willscot Mobile Mini Holdings (l) | | 28,500 | 1,072,740 |
| | | | 2,922,048 |
| Electrical Equipment - 0.4% | | | |
| Eaton Corp. PLC | | 6,500 | 2,038,075 |
| Nextracker, Inc. Class A (l) | | 19,000 | 890,720 |
| nVent Electric PLC | | 12,100 | 926,981 |
| Vertiv Holdings Co. | | 20,100 | 1,740,057 |
| | | | 5,595,833 |
| Machinery - 0.1% | | | |
| Deere & Co. | | 700 | 261,541 |
| Parker Hannifin Corp. | | 2,600 | 1,315,106 |
| | | | 1,576,647 |
| Passenger Airlines - 0.0% | | | |
| Air Canada (l) | | 800 | 10,467 |
| Delta Air Lines, Inc. | | 5,200 | 246,688 |
| | | | 257,155 |
| Trading Companies & Distributors - 0.0% | | | |
| Core & Main, Inc. (l) | | 10,800 | 528,552 |
| Penhall Acquisition Co. (b) | | 428 | 0 |
| | | | 528,552 |
| Transportation Infrastructure - 0.0% | | | |
| Tricer Holdco SCA: | | | |
| Class A1 (b)(g)(l) | | 16,755 | 0 |
| Class A2 (b)(g)(l) | | 16,755 | 0 |
| Class A3 (b)(g)(l) | | 16,755 | 0 |
| Class A4 (b)(g)(l) | | 16,755 | 0 |
| Class A5 (b)(g)(l) | | 16,755 | 0 |
| Class A6 (b)(g)(l) | | 16,755 | 0 |
| Class A7 (b)(g)(l) | | 16,755 | 0 |
| Class A8 (b)(g)(l) | | 16,755 | 0 |
| Class A9 (b)(g)(l) | | 16,755 | 0 |
| | | | 0 |
TOTAL INDUSTRIALS | | | 15,014,510 |
| INFORMATION TECHNOLOGY - 2.0% | | | |
| Communications Equipment - 0.1% | | | |
| Arista Networks, Inc. (l) | | 3,600 | 1,261,728 |
| IT Services - 0.0% | | | |
| Accenture PLC Class A | | 1,800 | 546,138 |
| GTT Communications, Inc. (b)(l) | | 4,921 | 156,931 |
| | | | 703,069 |
| Semiconductors & Semiconductor Equipment - 1.2% | | | |
| ASML Holding NV (depository receipt) | | 900 | 920,457 |
| KLA Corp. | | 2,000 | 1,649,020 |
| Lam Research Corp. | | 1,700 | 1,810,245 |
| Marvell Technology, Inc. | | 9,500 | 664,050 |
| Micron Technology, Inc. | | 5,200 | 683,956 |
| NVIDIA Corp. | | 66,000 | 8,153,640 |
| NXP Semiconductors NV | | 2,300 | 618,907 |
| ON Semiconductor Corp. (l) | | 25,965 | 1,779,901 |
| Taiwan Semiconductor Manufacturing Co. Ltd. sponsored ADR | | 4,200 | 730,002 |
| | | | 17,010,178 |
| Software - 0.6% | | | |
| Adobe, Inc. (l) | | 3,000 | 1,666,620 |
| Autodesk, Inc. (l) | | 2,300 | 569,135 |
| Gen Digital, Inc. | | 21,100 | 527,078 |
| Microsoft Corp. | | 6,500 | 2,905,175 |
| Oracle Corp. | | 7,800 | 1,101,360 |
| Palo Alto Networks, Inc. (l) | | 2,000 | 678,020 |
| Salesforce, Inc. | | 5,300 | 1,362,630 |
| UiPath, Inc. Class A (l) | | 31,400 | 398,152 |
| | | | 9,208,170 |
| Technology Hardware, Storage & Peripherals - 0.1% | | | |
| Dell Technologies, Inc. | | 5,800 | 799,878 |
TOTAL INFORMATION TECHNOLOGY | | | 28,983,023 |
| MATERIALS - 0.3% | | | |
| Chemicals - 0.1% | | | |
| Olin Corp. | | 15,900 | 749,685 |
| The Chemours Co. LLC | | 30,845 | 696,172 |
| Westlake Corp. | | 2,200 | 318,604 |
| | | | 1,764,461 |
| Construction Materials - 0.1% | | | |
| Eagle Materials, Inc. | | 5,100 | 1,109,046 |
| Martin Marietta Materials, Inc. | | 1,100 | 595,980 |
| | | | 1,705,026 |
| Containers & Packaging - 0.1% | | | |
| Graphic Packaging Holding Co. | | 34,200 | 896,382 |
| Metals & Mining - 0.0% | | | |
| Algoma Steel SCA (b)(l) | | 10,220 | 0 |
| Elah Holdings, Inc. (l) | | 14 | 512 |
| | | | 512 |
TOTAL MATERIALS | | | 4,366,381 |
| UTILITIES - 0.4% | | | |
| Electric Utilities - 0.2% | | | |
| Constellation Energy Corp. | | 12,900 | 2,583,483 |
| PG&E Corp. | | 53,066 | 926,532 |
| Portland General Electric Co. | | 140 | 6,054 |
| | | | 3,516,069 |
| Independent Power and Renewable Electricity Producers - 0.2% | | | |
| PureWest Energy (b)(l) | | 901 | 203 |
| Vistra Corp. | | 30,600 | 2,630,988 |
| | | | 2,631,191 |
TOTAL UTILITIES | | | 6,147,260 |
| TOTAL COMMON STOCKS (Cost $71,399,190) | | | 97,558,854 |
| | | | |
| Nonconvertible Preferred Stocks - 0.0% |
| | | Shares | Value ($) |
| INDUSTRIALS - 0.0% | | | |
| Transportation Infrastructure - 0.0% | | | |
Tricer Holdco SCA (b)(g)(l) (Cost $286,754) | | 8,042,141 | 80 |
| | | | |
| Bank Loan Obligations - 3.9% |
| | | Principal Amount (a) | Value ($) |
| COMMUNICATION SERVICES - 0.1% | | | |
| Diversified Telecommunication Services - 0.1% | | | |
| Aventiv Technologies LLC: | | | |
| 1LN, term loan: | | | |
| CME Term SOFR 1 Month Index + 7.500% 13.0962% 7/31/25 (e)(i)(n) | | 10,900 | 11,009 |
| CME Term SOFR 3 Month Index + 5.090% 10.6862% 7/31/25 (e)(i)(n) | | 413,134 | 335,328 |
| Tranche FLSO 1LN, term loan CME Term SOFR 1 Month Index + 7.500% 7/31/25 (b)(i)(n)(o) | | 24,890 | 24,890 |
| Connect U.S. Finco LLC Tranche B 1LN, term loan CME Term SOFR 1 Month Index + 4.500% 9.8439% 9/13/29 (e)(i)(n) | | 465,645 | 438,144 |
| Gtt Remainco LLC 1LN, term loan CME Term SOFR 1 Month Index + 7.000% 12.4439% 12/30/27 (e)(i)(n) | | 269,972 | 251,074 |
| | | | 1,060,445 |
| Media - 0.0% | | | |
| Diamond Sports Group LLC 1LN, term loan CME Term SOFR 1 Month Index + 8.000% 15.4292% 8/24/26 (e)(i)(n) | | 158,509 | 147,889 |
| Univision Communications, Inc.: | | | |
| 1LN, term loan CME Term SOFR 3 Month Index + 4.250% 9.5846% 6/24/29 (e)(i)(n) | | 34,300 | 34,246 |
| Tranche B 1LN, term loan CME Term SOFR 1 Month Index + 3.250% 8.7084% 1/31/29 (e)(i)(n) | | 347,013 | 338,337 |
| | | | 520,472 |
TOTAL COMMUNICATION SERVICES | | | 1,580,917 |
| CONSUMER DISCRETIONARY - 0.8% | | | |
| Automobile Components - 0.0% | | | |
| Clarios Global LP Tranche B 1LN, term loan CME Term SOFR 1 Month Index + 3.250% 8.3439% 5/6/30 (e)(i)(n) | | 134,663 | 134,831 |
| Broadline Retail - 0.0% | | | |
| Great Outdoors Group LLC Tranche B 1LN, term loan CME Term SOFR 1 Month Index + 3.750% 9.2084% 3/5/28 (e)(i)(n) | | 139,284 | 139,067 |
| Diversified Consumer Services - 0.2% | | | |
| Sotheby's Tranche B 1LN, term loan CME Term SOFR 1 Month Index + 4.500% 10.0902% 1/15/27 (e)(i)(n) | | 214,320 | 196,057 |
| Spin Holdco, Inc. Tranche B 1LN, term loan CME Term SOFR 3 Month Index + 4.000% 9.6001% 3/4/28 (e)(i)(n) | | 820,909 | 695,720 |
| TKC Holdings, Inc. 1LN, term loan CME Term SOFR 1 Month Index + 5.500% 11.109% 5/14/28 (e)(i)(n) | | 1,227,811 | 1,224,435 |
| | | | 2,116,212 |
| Hotels, Restaurants & Leisure - 0.3% | | | |
| Carnival Corp. Tranche B 1LN, term loan: | | | |
| CME Term SOFR 1 Month Index + 2.750% 8.0939% 8/9/27 (e)(i)(n) | | 1,284,922 | 1,288,944 |
| CME Term SOFR 1 Month Index + 2.750% 8.0939% 10/18/28 (e)(i)(n) | | 690,036 | 690,899 |
| Fertitta Entertainment LLC NV Tranche B 1LN, term loan CME Term SOFR 1 Month Index + 4.000% 9.0808% 1/27/29 (e)(i)(n) | | 1,382,236 | 1,383,106 |
| Light & Wonder International, Inc. Tranche B 1LN, term loan CME Term SOFR 1 Month Index + 2.750% 8.0805% 4/16/29 (e)(i)(n) | | 108,350 | 108,273 |
| Ontario Gaming GTA LP Tranche B 1LN, term loan CME Term SOFR 1 Month Index + 4.250% 9.5846% 8/1/30 (e)(i)(n) | | 288,550 | 289,586 |
| | | | 3,760,808 |
| Specialty Retail - 0.3% | | | |
| LBM Acquisition LLC Tranche B 1LN, term loan CME Term SOFR 1 Month Index + 3.750% 9.1775% 6/6/31 (e)(i)(n) | | 4,838,210 | 4,752,187 |
| Wand NewCo 3, Inc. Tranche B 1LN, term loan CME Term SOFR 1 Month Index + 3.750% 9.0939% 1/20/31 (e)(i)(n) | | 105,000 | 105,637 |
| | | | 4,857,824 |
TOTAL CONSUMER DISCRETIONARY | | | 11,008,742 |
| CONSUMER STAPLES - 0.0% | | | |
| Beverages - 0.0% | | | |
| Naked Juice LLC 1LN, term loan CME Term SOFR 1 Month Index + 3.250% 8.6846% 1/24/29 (e)(i)(n) | | 102,900 | 95,263 |
| Food Products - 0.0% | | | |
| Fiesta Purchaser, Inc. Tranche B 1LN, term loan CME Term SOFR 1 Month Index + 4.000% 9.3439% 2/12/31 (e)(i)(n) | | 100,000 | 100,614 |
TOTAL CONSUMER STAPLES | | | 195,877 |
| ENERGY - 0.1% | | | |
| Energy Equipment & Services - 0.0% | | | |
| Forbes Energy Services LLC Tranche B, term loan 0% (b)(d)(e)(n) | | 61,482 | 0 |
| Oil, Gas & Consumable Fuels - 0.1% | | | |
| EG America LLC Tranche BC 1LN, term loan CME Term SOFR 1 Month Index + 5.500% 11.0716% 2/7/28 (e)(i)(n) | | 2,160,952 | 2,129,446 |
| Mesquite Energy, Inc.: | | | |
| 1LN, term loan 3 month U.S. LIBOR + 8.000% 0% (b)(d)(i)(n) | | 283,417 | 0 |
| term loan 0% (b)(d)(e)(n) | | 122,000 | 0 |
| | | | 2,129,446 |
TOTAL ENERGY | | | 2,129,446 |
| FINANCIALS - 0.3% | | | |
| Capital Markets - 0.1% | | | |
| Citadel Securities LP Tranche B 1LN, term loan CME Term SOFR 1 Month Index + 2.250% 7.5939% 7/29/30 (e)(i)(n) | | 522,669 | 523,976 |
| Insurance - 0.2% | | | |
| Acrisure LLC: | | | |
| Tranche B 1LN, term loan CME Term SOFR 1 Month Index + 3.500% 8.9437% 2/15/27 (e)(i)(n) | | 863,256 | 861,978 |
| Tranche B6 1LN, term loan CME Term SOFR 1 Month Index + 3.250% 8.5936% 11/6/30 (e)(i)(n) | | 348,163 | 347,511 |
| Alliant Holdings Intermediate LLC Tranche B6 1LN, term loan CME Term SOFR 1 Month Index + 3.500% 8.8387% 11/6/30 (e)(i)(n) | | 513,769 | 514,869 |
| HUB International Ltd. Tranche B 1LN, term loan CME Term SOFR 1 Month Index + 3.250% 8.5746% 6/20/30 (e)(i)(n) | | 224,438 | 224,830 |
| Truist Insurance Holdings LLC: | | | |
| 2L, term loan CME Term SOFR 1 Month Index + 4.750% 10.0859% 3/8/32 (e)(i)(n) | | 1,175,000 | 1,196,056 |
| Tranche B 1LN, term loan CME Term SOFR 1 Month Index + 3.250% 8.5846% 5/6/31 (e)(i)(n) | | 225,000 | 225,200 |
| | | | 3,370,444 |
TOTAL FINANCIALS | | | 3,894,420 |
| HEALTH CARE - 0.4% | | | |
| Health Care Equipment & Supplies - 0.1% | | | |
| Medline Borrower LP Tranche B 1LN, term loan CME Term SOFR 1 Month Index + 2.750% 8.0939% 10/23/28 (e)(i)(n) | | 1,060,155 | 1,061,575 |
| Health Care Providers & Services - 0.1% | | | |
| Gainwell Acquisition Corp. Tranche B 1LN, term loan CME Term SOFR 3 Month Index + 4.000% 9.4346% 10/1/27 (e)(i)(n) | | 952,012 | 920,672 |
| Phoenix Newco, Inc. Tranche B 1LN, term loan CME Term SOFR 1 Month Index + 3.250% 8.7084% 11/15/28 (e)(i)(n) | | 322,575 | 323,078 |
| | | | 1,243,750 |
| Health Care Technology - 0.2% | | | |
| Athenahealth Group, Inc. Tranche B 1LN, term loan CME Term SOFR 1 Month Index + 3.500% 8.5939% 2/15/29 (e)(i)(n) | | 1,336,695 | 1,330,853 |
| Cotiviti, Inc. Tranche B 1LN, term loan CME Term SOFR 1 Month Index + 3.250% 8.5792% 5/1/31 (e)(i)(n) | | 1,910,213 | 1,898,274 |
| | | | 3,229,127 |
TOTAL HEALTH CARE | | | 5,534,452 |
| INDUSTRIALS - 0.5% | | | |
| Building Products - 0.1% | | | |
| Hunter Douglas, Inc. Tranche B 1LN, term loan CME Term SOFR 3 Month Index + 3.500% 8.8359% 2/25/29 (e)(i)(n) | | 1,024,100 | 1,014,228 |
| MIWD Holdco II LLC Tranche B2, term loan CME Term SOFR 1 Month Index + 3.500% 8.8439% 3/28/31 (e)(i)(n) | | 35,000 | 35,182 |
| | | | 1,049,410 |
| Commercial Services & Supplies - 0.3% | | | |
| ABG Intermediate Holdings 2 LLC Tranche B1 LN, term loan CME Term SOFR 1 Month Index + 3.500% 8.9292% 12/21/28 (e)(i)(n) | | 870,662 | 870,662 |
| Artera Services LLC Tranche B 1LN, term loan CME Term SOFR 1 Month Index + 4.500% 9.8346% 2/10/31 (e)(i)(n) | | 294,263 | 295,313 |
| Bifm California Buyer, Inc. Tranche 1LN, term loan CME Term SOFR 1 Month Index + 4.250% 9.5939% 5/31/28 (e)(i)(n) | | 69,825 | 70,087 |
| Brand Industrial Services, Inc. Tranche B 1LN, term loan CME Term SOFR 1 Month Index + 4.500% 9.8268% 8/1/30 (e)(i)(n) | | 1,499,707 | 1,503,876 |
| Madison IAQ LLC Tranche B 1LN, term loan CME Term SOFR 1 Month Index + 3.250% 8.0936% 6/21/28 (e)(i)(n) | | 136,150 | 136,179 |
| Neptune BidCo U.S., Inc. Tranche B 1LN, term loan CME Term SOFR 1 Month Index + 5.000% 10.4059% 4/11/29 (e)(i)(n) | | 782,100 | 734,846 |
| Sabert Corp. Tranche B 1LN, term loan CME Term SOFR 1 Month Index + 3.750% 9.1952% 12/16/26 (e)(i)(n) | | 266,511 | 267,398 |
| The GEO Group, Inc. Tranche B 1LN, term loan CME Term SOFR 1 Month Index + 5.250% 10.5939% 4/14/29 (e)(i)(n) | | 212,313 | 216,293 |
| | | | 4,094,654 |
| Machinery - 0.0% | | | |
| Chart Industries, Inc. Tranche B 1LN, term loan CME Term SOFR 1 Month Index + 3.250% 8.6775% 3/17/30 (e)(i)(n) | | 77,452 | 77,646 |
| STS Operating, Inc. 1LN, term loan CME Term SOFR 1 Month Index + 4.000% 9.4439% 3/25/31 (e)(i)(n) | | 279,300 | 279,736 |
| | | | 357,382 |
| Passenger Airlines - 0.0% | | | |
| SkyMiles IP Ltd. Tranche B 1LN, term loan CME Term SOFR 3 Month Index + 3.750% 9.0746% 10/20/27 (e)(i)(n) | | 88,001 | 89,991 |
| United Airlines, Inc. Tranche 1LN, term loan CME Term SOFR 1 Month Index + 2.750% 8.0936% 2/24/31 (e)(i)(n) | | 124,688 | 124,798 |
| | | | 214,789 |
| Professional Services - 0.1% | | | |
| Galaxy U.S. Opco, Inc. 1LN, term loan CME Term SOFR 1 Month Index + 4.750% 10.0795% 4/29/29 (e)(i)(n) | | 1,122,152 | 906,138 |
TOTAL INDUSTRIALS | | | 6,622,373 |
| INFORMATION TECHNOLOGY - 1.2% | | | |
| Electronic Equipment, Instruments & Components - 0.0% | | | |
| DG Investment Intermediate Holdings, Inc. Tranche B 1LN, term loan CME Term SOFR 1 Month Index + 3.750% 9.1937% 3/31/28 (e)(i)(n) | | 97,003 | 96,639 |
| IT Services - 0.0% | | | |
| Acuris Finance U.S., Inc. 1LN, term loan CME Term SOFR 3 Month Index + 4.000% 9.4846% 2/16/28 (e)(i)(n) | | 60,938 | 60,912 |
| GTT Communications, Inc. 1LN, term loan CME Term SOFR 3 Month Index + 9.000% 14.4346% 6/30/28 (e)(i)(n) | | 222,503 | 161,315 |
| | | | 222,227 |
| Software - 1.2% | | | |
| Applied Systems, Inc.: | | | |
| Tranche 2LN, term loan CME Term SOFR 1 Month Index + 5.250% 10.5594% 2/23/32 (e)(i)(n) | | 10,000 | 10,325 |
| Tranche B 1LN, term loan CME Term SOFR 1 Month Index + 3.500% 8.8346% 2/24/31 (e)(i)(n) | | 550,000 | 553,718 |
| Boxer Parent Co., Inc. Tranche B 1LN, term loan CME Term SOFR 1 Month Index + 4.250% 9.3439% 12/29/28 (e)(i)(n) | | 1,583,350 | 1,584,759 |
| ConnectWise LLC Tranche B 1LN, term loan CME Term SOFR 1 Month Index + 3.500% 9.0962% 9/30/28 (e)(i)(n) | | 855,346 | 847,862 |
| McAfee Corp. Tranche B 1LN, term loan CME Term SOFR 1 Month Index + 3.250% 8.5792% 3/1/29 (e)(i)(n) | | 1,509,942 | 1,506,409 |
| MH Sub I LLC Tranche B 1LN, term loan CME Term SOFR 1 Month Index + 4.250% 9.5939% 5/3/28 (e)(i)(n) | | 893,250 | 891,758 |
| Modena Buyer LLC 1LN, term loan CME Term SOFR 1 Month Index + 4.500% 4/21/31 (i)(n)(o) | | 1,355,000 | 1,320,705 |
| Polaris Newco LLC Tranche B 1LN, term loan CME Term SOFR 1 Month Index + 4.000% 9.5911% 6/2/28 (e)(i)(n) | | 311,200 | 310,898 |
| Project Alpha Intermediate Holding, Inc. Tranche B 1LN, term loan CME Term SOFR 1 Month Index + 3.750% 9.072% 10/28/30 (e)(i)(n) | | 580,000 | 581,328 |
| Proofpoint, Inc. Tranche B 1LN, term loan CME Term SOFR 1 Month Index + 3.000% 8.3439% 8/31/28 (e)(i)(n) | | 3,725,385 | 3,726,801 |
| RealPage, Inc. Tranche B 1LN, term loan CME Term SOFR 1 Month Index + 3.000% 8.4584% 4/22/28 (e)(i)(n) | | 302,250 | 293,433 |
| UKG, Inc. Tranche B 1LN, term loan CME Term SOFR 1 Month Index + 3.500% 8.5763% 2/10/31 (e)(i)(n) | | 3,862,560 | 3,875,114 |
| Veritas U.S., Inc. Tranche B 1LN, term loan CME Term SOFR 1 Month Index + 5.000% 10.4584% 9/1/25 (e)(i)(n) | | 489,660 | 424,711 |
| VS Buyer LLC Tranche B 1LN, term loan CME Term SOFR 1 Month Index + 3.250% 8.5808% 4/14/31 (e)(i)(n) | | 1,696,744 | 1,698,865 |
| | | | 17,626,686 |
TOTAL INFORMATION TECHNOLOGY | | | 17,945,552 |
| MATERIALS - 0.5% | | | |
| Chemicals - 0.2% | | | |
| Consolidated Energy Finance SA Tranche B 1LN, term loan CME Term SOFR 1 Month Index + 4.500% 9.8439% 11/15/30 (e)(i)(n) | | 563,588 | 547,525 |
| Discovery Purchaser Corp. 1LN, term loan CME Term SOFR 3 Month Index + 4.370% 9.6813% 10/4/29 (e)(i)(n) | | 2,063,493 | 2,058,045 |
| Olympus Water U.S. Holding Corp. Tranche B 1LN, term loan CME Term SOFR 3 Month Index + 3.750% 9.321% 11/9/28 (e)(i)(n) | | 166,175 | 166,359 |
| W.R. Grace Holding LLC Tranche B 1LN, term loan CME Term SOFR 3 Month Index + 3.750% 8.5939% 9/22/28 (e)(i)(n) | | 702,323 | 704,458 |
| | | | 3,476,387 |
| Containers & Packaging - 0.3% | | | |
| Clydesdale Acquisition Holdings, Inc. 1LN, term loan CME Term SOFR 1 Month Index + 3.670% 9.1189% 4/13/29 (e)(i)(n) | | 3,451,252 | 3,456,636 |
| Kloeckner Pentaplast of America, Inc. Tranche B 1LN, term loan CME Term SOFR 6 Month Index + 4.750% 10.2675% 2/9/26 (e)(i)(n) | | 77,400 | 72,176 |
| | | | 3,528,812 |
| Metals & Mining - 0.0% | | | |
| Arsenal AIC Parent LLC Tranche B 1LN, term loan CME Term SOFR 1 Month Index + 3.750% 9.0939% 8/19/30 (e)(i)(n) | | 79,401 | 79,778 |
TOTAL MATERIALS | | | 7,084,977 |
| UTILITIES - 0.0% | | | |
| Independent Power and Renewable Electricity Producers - 0.0% | | | |
| Talen Energy Supply LLC: | | | |
| Tranche TLB-EXIT 1LN, term loan CME Term SOFR 1 Month Index + 4.500% 8.8267% 5/17/30 (e)(i)(n) | | 24,093 | 24,326 |
| Tranche TLC-EXIT 1LN, term loan CME Term SOFR 1 Month Index + 4.500% 8.8267% 5/17/30 (e)(i)(n) | | 15,846 | 15,998 |
| | | | 40,324 |
| TOTAL BANK LOAN OBLIGATIONS (Cost $56,351,603) | | | 56,037,080 |
| | | | |
| Fixed-Income Funds - 5.5% |
| | | Shares | Value ($) |
Fidelity Floating Rate Central Fund (p) (Cost $80,171,552) | | 809,013 | 79,259,027 |
| | | | |
| Preferred Securities - 2.9% |
| | | Principal Amount (a) | Value ($) |
| COMMUNICATION SERVICES - 0.1% | | | |
| Diversified Telecommunication Services - 0.1% | | | |
| CAS Capital No 1 Ltd. 4% (Reg. S) (e)(q) | | 800,000 | 762,233 |
| Orange SA 5.375% (Reg. S) (e)(q) | EUR | 700,000 | 784,170 |
| | | | 1,546,403 |
| CONSUMER DISCRETIONARY - 0.2% | | | |
| Automobiles - 0.2% | | | |
| Volkswagen International Finance NV: | | | |
| 4.375% (Reg. S) (e)(q) | EUR | 2,200,000 | 2,194,570 |
| 7.875% (Reg. S) (e)(q) | EUR | 300,000 | 383,654 |
| | | | 2,578,224 |
| CONSUMER STAPLES - 0.0% | | | |
| Food Products - 0.0% | | | |
| Cosan Overseas Ltd. 8.25% (q) | | 710,000 | 728,170 |
| ENERGY - 0.3% | | | |
| Oil, Gas & Consumable Fuels - 0.3% | | | |
| Energy Transfer LP: | | | |
| 6.625% (e)(q) | | 1,515,000 | 1,507,978 |
| 7.125% (e)(q) | | 2,460,000 | 2,459,114 |
| Summit Midstream Partners LP 3 month U.S. LIBOR + 7.430% 13.0308% (d)(e)(i)(q) | | 148,000 | 183,520 |
| | | | 4,150,612 |
| FINANCIALS - 2.1% | | | |
| Banks - 2.0% | | | |
| Banco de Credito e Inversiones 8.75% (c)(e)(q) | | 290,000 | 314,968 |
| Banco del Estado de Chile 7.95% (c)(e)(q) | | 260,000 | 271,690 |
| Banco Do Brasil SA 10-Year Treasury Constant Maturity Rate + 4.390% 8.748% (c)(e)(i)(q) | | 560,000 | 580,631 |
| Banco Mercantil del Norte SA: | | | |
| 6.75% (c)(e)(q) | | 545,000 | 541,142 |
| 7.625% (c)(e)(q) | | 610,000 | 606,948 |
| Bank of America Corp.: | | | |
| 5.875% (e)(q) | | 5,125,000 | 5,185,271 |
| 6.25% (e)(q) | | 2,910,000 | 2,956,248 |
| BBVA Bancomer SA Texas Branch: | | | |
| 5.125% 1/18/33 (c)(e) | | 340,000 | 318,042 |
| 5.35% 11/12/29 (c)(e) | | 180,000 | 178,589 |
| 8.45% 6/29/38 (c)(e) | | 310,000 | 319,652 |
| Citigroup, Inc.: | | | |
| CME Term SOFR 3 Month Index + 3.420% 9.007% (e)(i)(q) | | 270,000 | 272,425 |
| 5% (e)(q) | | 3,245,000 | 3,272,925 |
| Citigroup, Inc. 4.7% (e)(q) | | 3,805,000 | 3,793,977 |
| JPMorgan Chase & Co.: | | | |
| 4% (e)(q) | | 4,005,000 | 3,932,950 |
| 4.6% (e)(q) | | 2,025,000 | 2,035,419 |
| 5% (e)(q) | | 1,660,000 | 1,689,532 |
| NBK Tier 1 Ltd. 3.625% (c)(e)(q) | | 230,000 | 215,564 |
| Tinkoff Bank JSC 6% (b)(c)(d)(e)(q) | | 275,000 | 13,750 |
| Wells Fargo & Co. 5.875% (e)(q) | | 2,600,000 | 2,593,962 |
| | | | 29,093,685 |
| Capital Markets - 0.1% | | | |
| Goldman Sachs Group, Inc. CME Term SOFR 3 Month Index + 3.130% 8.4612% (e)(i)(q) | | 951,000 | 964,314 |
| Financial Services - 0.0% | | | |
| OEC Finance Ltd. 7.5% pay-in-kind (c)(q) | | 2,217 | 143 |
TOTAL FINANCIALS | | | 30,058,142 |
| INDUSTRIALS - 0.0% | | | |
| Marine Transportation - 0.0% | | | |
| DP World Salaam 6% (Reg. S) (e)(q) | | 600,000 | 613,963 |
| INFORMATION TECHNOLOGY - 0.1% | | | |
| IT Services - 0.1% | | | |
| Network i2i Ltd.: | | | |
| 3.975% (c)(e)(q) | | 315,000 | 300,523 |
| 5.65% (c)(e)(q) | | 570,000 | 570,790 |
| | | | 871,313 |
| MATERIALS - 0.1% | | | |
| Construction Materials - 0.1% | | | |
| CEMEX S.A.B. de CV: | | | |
| 5.125% (c)(e)(q) | | 845,000 | 825,660 |
| 9.125% (c)(e)(q) | | 475,000 | 508,927 |
| | | | 1,334,587 |
| UTILITIES - 0.0% | | | |
| Electric Utilities - 0.0% | | | |
| Enel SpA 6.625% (Reg. S) (e)(q) | EUR | 564,000 | 689,671 |
| TOTAL PREFERRED SECURITIES (Cost $42,413,144) | | | 42,571,085 |
| | | | |
| Money Market Funds - 4.8% |
| | | Shares | Value ($) |
| Fidelity Cash Central Fund 5.38% (r) | | 66,277,361 | 66,290,616 |
| Fidelity Securities Lending Cash Central Fund 5.38% (r)(s) | | 2,511,449 | 2,511,700 |
| TOTAL MONEY MARKET FUNDS (Cost $68,797,371) | | | 68,802,316 |
| | | | |
| Purchased Swaptions - 0.0% |
| | Expiration Date | Notional Amount (a) | Value ($) |
| Put Options - 0.0% | | | | |
| Option on an interest rate swap with Citibank N.A. to receive annually a floating rate based on the U.S. Secured Overnight Fin. Rate (SOFR) Index and pay a fixed rate of 3.694%, expiring December 2033. | 12/12/28 | | 6,800,000 | 280,984 |
| Option on an interest rate swap with Goldman Sachs Bank U.S.A. to pay annually a fixed rate of 3.3525% and receive annually a floating rate based on the U.S. Secured Overnight Fin. Rate (SOFR) Index, expiring February 2035. | 2/03/25 | | 1,400,000 | 72,938 |
| | | | | |
| TOTAL PUT OPTIONS | | | | 353,922 |
| Call Options - 0.0% | | | | |
| Option on an interest rate swap with Citibank N.A. to receive annually a fixed rate of 3.694% and pay a floating rate based on the U.S. Secured Overnight Fin. Rate (SOFR) Index, expiring December 2033. | 12/12/28 | | 6,800,000 | 256,687 |
| Option on an interest rate swap with Goldman Sachs Bank U.S.A. to receive annually a fixed rate of 3.3525% and pay annually a floating rate based on the U.S. Secured Overnight Fin. Rate (SOFR) Index, expiring February 2035. | 2/03/25 | | 1,400,000 | 16,612 |
| | | | | |
| TOTAL CALL OPTIONS | | | | 273,299 |
TOTAL PURCHASED SWAPTIONS (Cost $651,560) | | | | 627,221 |
| TOTAL INVESTMENT IN SECURITIES - 100.7% (Cost $1,496,696,233) | 1,452,213,874 |
NET OTHER ASSETS (LIABILITIES) - (0.7)% | (10,418,644) |
| NET ASSETS - 100.0% | 1,441,795,230 |
| | |
| TBA Sale Commitments |
| | Principal Amount (a) | Value ($) |
| Ginnie Mae | | |
| Ginnie Mae 2.5% 7/1/54 | (1,400,000) | (1,177,385) |
| 2% 7/1/54 | (800,000) | (647,787) |
| 2% 7/1/54 | (250,000) | (202,434) |
| 2% 7/1/54 | (1,400,000) | (1,133,631) |
| 2% 7/1/54 | (100,000) | (80,974) |
| | | |
| TOTAL GINNIE MAE | | (3,242,211) |
| | | |
| Uniform Mortgage Backed Securities | | |
| 2% 7/1/54 | (1,275,000) | (997,189) |
| 2% 7/1/54 | (800,000) | (625,688) |
| 2% 7/1/54 | (800,000) | (625,688) |
| 2.5% 7/1/54 | (2,625,000) | (2,143,887) |
| 2.5% 7/1/54 | (2,600,000) | (2,123,469) |
| 5% 7/1/54 | (1,300,000) | (1,256,379) |
| 5% 8/1/54 | (1,300,000) | (1,256,734) |
| 5.5% 7/1/54 | (7,000,000) | (6,904,023) |
| 5.5% 8/1/54 | (7,000,000) | (6,904,570) |
| Uniform Mortgage Backed Securities 2.5% 8/1/54 | (2,600,000) | (2,125,398) |
| | | |
| TOTAL UNIFORM MORTGAGE BACKED SECURITIES | | (24,963,025) |
| | | |
TOTAL TBA SALE COMMITMENTS (Proceeds $28,333,802) | | (28,205,236) |
| Futures Contracts |
| | Number of contracts | Expiration Date | Notional Amount ($) | Value ($) | Unrealized Appreciation/ (Depreciation) ($) |
| Purchased | | | | | |
| | | | | | |
| Bond Index Contracts | | | | | |
| Eurex Euro-Bund Contracts (Germany) | 82 | Sep 2024 | 11,558,592 | 141,855 | 141,855 |
| | | | | | |
| Treasury Contracts | | | | | |
| CBOT 10-Year U.S. Treasury Note Contracts (United States) | 1,020 | Sep 2024 | 112,184,063 | 650,684 | 650,684 |
| CBOT 2-Year U.S. Treasury Note Contracts (United States) | 219 | Sep 2024 | 44,723,906 | 72,814 | 72,814 |
| CBOT 5-Year U.S. Treasury Note Contracts (United States) | 8 | Sep 2024 | 852,625 | 5,552 | 5,552 |
| CBOT Long Term U.S. Treasury Bond Contracts (United States) | 34 | Sep 2024 | 4,022,625 | 30,481 | 30,481 |
| CBOT Ultra Long Term U.S. Treasury Bond Contracts (United States) | 4 | Sep 2024 | 501,375 | 3,247 | 3,247 |
| | | | | | |
| TOTAL TREASURY CONTRACTS | | | | | 762,778 |
| | | | | | |
| TOTAL PURCHASED | | | | | 904,633 |
| | | | | | |
| Sold | | | | | |
| | | | | | |
| Bond Index Contracts | | | | | |
| Eurex Euro-BTP Contracts (Germany) | 90 | Sep 2024 | 11,112,284 | 99,539 | 99,539 |
| | | | | | |
| TOTAL FUTURES CONTRACTS | | | | | 1,004,172 |
| The notional amount of futures purchased as a percentage of Net Assets is 12.1% |
| The notional amount of futures sold as a percentage of Net Assets is 0.8% |
For the period, the average monthly notional amount at value for futures contracts in the aggregate was $194,482,380.
| Forward Foreign Currency Contracts |
Currency Purchased
| Currency Sold | Counterparty | Settlement Date | Unrealized Appreciation/ (Depreciation) ($) |
| | | | | | | |
| USD | 103,690 | EUR | 96,750 | State Street Bank and Trust Co | 7/01/24 | 76 |
| EUR | 463,000 | USD | 496,982 | HSBC Bank | 7/19/24 | (722) |
| USD | 3,938,501 | AUD | 5,950,000 | Bank of America, N.A. | 7/19/24 | (32,642) |
| USD | 2,034,987 | CAD | 2,797,000 | State Street Bank and Trust Co | 7/19/24 | (10,351) |
| USD | 297,778 | EUR | 277,000 | BNP Paribas S.A. | 7/19/24 | 880 |
| USD | 316,452 | EUR | 295,000 | Brown Brothers Harriman & Co | 7/19/24 | 261 |
| USD | 636,699 | EUR | 595,000 | Royal Bank of Canada | 7/19/24 | (1,043) |
| USD | 98,847,174 | EUR | 92,443,000 | State Street Bank and Trust Co | 7/19/24 | (236,507) |
| USD | 7,635,306 | GBP | 6,001,000 | Brown Brothers Harriman & Co | 7/19/24 | 48,660 |
| | | | | | | |
| TOTAL FORWARD FOREIGN CURRENCY CONTRACTS | | (231,388) |
| Unrealized Appreciation | | | 49,877 |
| Unrealized Depreciation | | | (281,265) |
For the period, the average contract value for forward foreign currency contracts was $116,626,384. Contract value represents contract amount in United States dollars plus or minus unrealized appreciation or depreciation, respectively.
| Interest Rate Swaps |
| Payment Received | Payment Frequency | Payment Paid | Payment Frequency | Clearinghouse / Counterparty(1) | Maturity Date | Notional Amount(2) | Value ($) | Upfront Premium Received/ (Paid) ($)(3) | Unrealized Appreciation/ (Depreciation) ($) |
U.S. Secured Overnight Fin. Rate (SOFR) Index(4) | Annual | 3.75% | Annual | LCH | Sep 2026 | | 47,000 | 87 | 0 | 87 |
U.S. Secured Overnight Fin. Rate (SOFR) Index(4) | Annual | 3.5% | Annual | LCH | Sep 2027 | | 30,654,000 | 99,776 | 0 | 99,776 |
U.S. Secured Overnight Fin. Rate (SOFR) Index(4) | Annual | 3.5% | Annual | LCH | Sep 2029 | | 32,000 | 199 | 0 | 199 |
U.S. Secured Overnight Fin. Rate (SOFR) Index(4) | Annual | 3.5% | Annual | LCH | Sep 2031 | | 7,851,000 | 71,963 | 0 | 71,963 |
| 3.75% | Annual | U.S. Secured Overnight Fin. Rate (SOFR) Index(4) | Annual | LCH | Sep 2034 | | 1,090,000 | (13,636) | 0 | (13,636) |
U.S. Secured Overnight Fin. Rate (SOFR) Index(4) | Annual | 3.75% | Annual | LCH | Sep 2044 | | 474,000 | 9,960 | 0 | 9,960 |
| TOTAL INTEREST RATE SWAPS | | | | | | | | 168,349 | 0 | 168,349 |
(1)Swaps with LCH Clearnet Group (LCH) are centrally cleared swaps.
(2)Notional amount is stated in U.S. Dollars unless otherwise noted.
(3)Any premiums for centrally cleared swaps are recorded periodically throughout the term of the swap to variation margin and included in unrealized appreciation (depreciation).
(4)Represents floating rate.
Currency Abbreviations
| AUD | - | Australian dollar |
| CAD | - | Canadian dollar |
| EGP | - | Egyptian pound |
| EUR | - | European Monetary Unit |
| GBP | - | British pound sterling |
| NGN | - | Nigerian naira |
| RON | - | Romanian leu |
| TRY | - | Turkish Lira |
| USD | - | U.S. dollar |
| UYU | - | Uruguay peso |
Legend
| (a) | Amount is stated in United States dollars unless otherwise noted. |
| (c) | Security exempt from registration under Rule 144A of the Securities Act of 1933. These securities may be resold in transactions exempt from registration, normally to qualified institutional buyers. At the end of the period, the value of these securities amounted to $427,578,539 or 29.7% of net assets. |
| (d) | Non-income producing - Security is in default. |
| (e) | Coupon rates for floating and adjustable rate securities reflect the rates in effect at period end. |
| (f) | Security or a portion of the security purchased on a delayed delivery or when-issued basis. |
| (g) | Restricted securities (including private placements) - Investment in securities not registered under the Securities Act of 1933 (excluding 144A issues). At the end of the period, the value of restricted securities (excluding 144A issues) amounted to $559,005 or 0.0% of net assets. |
| (h) | Security initially issued at one coupon which converts to a higher coupon at a specified date. The rate shown is the rate at period end. |
| (i) | Coupon is indexed to a floating interest rate which may be multiplied by a specified factor and/or subject to caps or floors. |
| (j) | Security or a portion of the security was pledged to cover margin requirements for futures contracts. At period end, the value of securities pledged amounted to $2,591,501. |
| (k) | Security or a portion of the security was pledged to cover margin requirements for centrally cleared swaps. At period end, the value of securities pledged amounted to $1,048,737. |
| (m) | Security or a portion of the security is on loan at period end. |
| (n) | Remaining maturities of bank loan obligations may be less than the stated maturities shown as a result of contractual or optional prepayments by the borrower. Such prepayments cannot be predicted with certainty. |
| (o) | The coupon rate will be determined upon settlement of the loan after period end. |
| (p) | Affiliated fund that is generally available only to investment companies and other accounts managed by Fidelity Investments. A complete unaudited schedule of portfolio holdings for each Fidelity Central Fund is filed with the SEC for the first and third quarters of each fiscal year on Form N-PORT and is available upon request or at the SEC's website at www.sec.gov. An unaudited holdings listing for the Fund, which presents direct holdings as well as the pro-rata share of securities and other investments held indirectly through its investment in underlying non-money market Fidelity Central Funds, is available at fidelity.com and/or institutional.fidelity.com, as applicable. In addition, each Fidelity Central Fund's financial statements are available on the SEC's website or upon request. |
| (q) | Security is perpetual in nature with no stated maturity date. |
| (r) | Affiliated fund that is generally available only to investment companies and other accounts managed by Fidelity Investments. The rate quoted is the annualized seven-day yield of the fund at period end. A complete unaudited listing of the fund's holdings as of its most recent quarter end is available upon request. In addition, each Fidelity Central Fund's financial statements are available on the SEC's website or upon request. |
| (s) | Investment made with cash collateral received from securities on loan. |
| Additional information on each restricted holding is as follows: |
| Security | Acquisition Date | Acquisition Cost ($) |
| Jonah Energy Parent LLC 12% 11/5/25 | 5/05/23 | 340,856 |
| | | |
| New Cotai LLC/New Cotai Capital Corp. | 9/11/20 | 1,223,948 |
| | | |
| Tricer Holdco SCA | 10/16/09 - 12/30/17 | 286,754 |
| | | |
| Tricer Holdco SCA Class A1 | 10/16/09 - 10/29/09 | 45,666 |
| | | |
| Tricer Holdco SCA Class A2 | 10/16/09 - 10/29/09 | 45,666 |
| | | |
| Tricer Holdco SCA Class A3 | 10/16/09 - 10/29/09 | 45,666 |
| | | |
| Tricer Holdco SCA Class A4 | 10/16/09 - 10/29/09 | 45,666 |
| | | |
| Tricer Holdco SCA Class A5 | 10/16/09 - 10/29/09 | 45,666 |
| | | |
| Tricer Holdco SCA Class A6 | 10/16/09 - 10/29/09 | 45,666 |
| | | |
| Tricer Holdco SCA Class A7 | 10/16/09 - 10/29/09 | 45,666 |
| | | |
| Tricer Holdco SCA Class A8 | 10/16/09 - 10/29/09 | 45,666 |
| | | |
| Tricer Holdco SCA Class A9 | 10/16/09 - 10/29/09 | 45,706 |
| | | |
Affiliated Central Funds
Fiscal year to date information regarding the Fund's investments in Fidelity Central Funds, including the ownership percentage, is presented below.
| Affiliate | Value, beginning of period ($) | Purchases ($) | Sales Proceeds ($) | Dividend Income ($) | Realized Gain (loss) ($) | Change in Unrealized appreciation (depreciation) ($) | Value, end of period ($) | % ownership, end of period |
| Fidelity Cash Central Fund 5.38% | 45,433,517 | 182,144,013 | 161,287,077 | 1,075,874 | 2,324 | (2,161) | 66,290,616 | 0.1% |
| Fidelity Floating Rate Central Fund | 74,970,126 | 5,744,389 | 1,000,000 | 3,644,380 | (13,552) | (441,936) | 79,259,027 | 5.3% |
| Fidelity Securities Lending Cash Central Fund 5.38% | - | 19,542,539 | 17,030,839 | 202 | - | - | 2,511,700 | 0.0% |
| Total | 120,403,643 | 207,430,941 | 179,317,916 | 4,720,456 | (11,228) | (444,097) | 148,061,343 | |
| | | | | | | | | |
Amounts in the dividend income column in the above table include any capital gain distributions from underlying funds, which are presented in the corresponding line item in the Statement of Operations, if applicable.
Amounts in the dividend income column for Fidelity Securities Lending Cash Central Fund represents the income earned on investing cash collateral, less rebates paid to borrowers and any lending agent fees associated with the loan, plus any premium payments received for lending certain types of securities.
Amounts included in the purchases and sales proceeds columns may include in-kind transactions, if applicable.
Investment Valuation
The following is a summary of the inputs used, as of June 30, 2024, involving the Fund's assets and liabilities carried at fair value. The inputs or methodology used for valuing securities may not be an indication of the risk associated with investing in those securities. For more information on valuation inputs, and their aggregation into the levels used below, please refer to the Investment Valuation section in the accompanying Notes to Financial Statements.
| Valuation Inputs at Reporting Date: |
| Description | Total ($) | Level 1 ($) | Level 2 ($) | Level 3 ($) |
Investments in Securities: | | | | |
|
| Equities: | | | | |
Communication Services | 6,800,070 | 6,785,555 | - | 14,515 |
Consumer Discretionary | 13,607,131 | 11,364,438 | 2,032,182 | 210,511 |
Consumer Staples | 2,036,765 | 1,991,856 | - | 44,909 |
Energy | 6,114,942 | 4,386,058 | - | 1,728,884 |
Financials | 13,996,561 | 13,996,403 | - | 158 |
Health Care | 492,211 | 492,211 | - | - |
Industrials | 15,014,590 | 15,014,510 | - | 80 |
Information Technology | 28,983,023 | 28,826,092 | - | 156,931 |
Materials | 4,366,381 | 4,366,381 | - | - |
Utilities | 6,147,260 | 6,147,057 | - | 203 |
|
| Corporate Bonds | 506,544,141 | - | 505,224,402 | 1,319,739 |
|
| U.S. Government and Government Agency Obligations | 337,234,445 | - | 337,234,445 | - |
|
| U.S. Government Agency - Mortgage Securities | 46,630,558 | - | 46,630,558 | - |
|
| Collateralized Mortgage Obligations | 18,316,011 | - | 18,316,011 | - |
|
| Commercial Mortgage Securities | 46,960,385 | - | 46,960,385 | - |
|
| Foreign Government and Government Agency Obligations | 151,672,671 | - | 151,672,671 | - |
|
| Bank Loan Obligations | 56,037,080 | - | 56,012,190 | 24,890 |
|
| Fixed-Income Funds | 79,259,027 | 79,259,027 | - | - |
|
| Preferred Securities | 42,571,085 | - | 42,557,335 | 13,750 |
|
| Money Market Funds | 68,802,316 | 68,802,316 | - | - |
|
| Purchased Swaptions | 627,221 | - | 627,221 | - |
| Total Investments in Securities: | 1,452,213,874 | 241,431,904 | 1,207,267,400 | 3,514,570 |
Derivative Instruments: Assets | | | | |
Futures Contracts | 1,004,172 | 1,004,172 | - | - |
Forward Foreign Currency Contracts | 49,877 | - | 49,877 | - |
Swaps | 181,985 | - | 181,985 | - |
| Total Assets | 1,236,034 | 1,004,172 | 231,862 | - |
| Liabilities | | | | |
Forward Foreign Currency Contracts | (281,265) | - | (281,265) | - |
Swaps | (13,636) | - | (13,636) | - |
| Total Liabilities | (294,901) | - | (294,901) | - |
| Total Derivative Instruments: | 941,133 | 1,004,172 | (63,039) | - |
Other Financial Instruments: | | | | |
TBA Sale Commitments | (28,205,236) | - | (28,205,236) | - |
| Total Other Financial Instruments: | (28,205,236) | - | (28,205,236) | - |
Value of Derivative Instruments
The following table is a summary of the Fund's value of derivative instruments by primary risk exposure as of June 30, 2024. For additional information on derivative instruments, please refer to the Derivative Instruments section in the accompanying Notes to Financial Statements.
Primary Risk Exposure / Derivative Type | Value |
| Asset ($) | Liability ($) |
| Foreign Exchange Risk | | |
Forward Foreign Currency Contracts (a) | 49,877 | (281,265) |
| Total Foreign Exchange Risk | 49,877 | (281,265) |
| Interest Rate Risk | | |
Futures Contracts (b) | 1,004,172 | 0 |
Purchased Swaptions (c) | 627,221 | 0 |
Swaps (d) | 181,985 | (13,636) |
| Total Interest Rate Risk | 1,813,378 | (13,636) |
| Total Value of Derivatives | 1,863,255 | (294,901) |
(a)Gross value is presented in the Statement of Assets and Liabilities in the unrealized appreciation/depreciation on forward foreign currency contracts line-items.
(b)Reflects gross cumulative appreciation (depreciation) on futures contracts as presented in the Schedule of Investments. In the Statement of Assets and Liabilities, the period end daily variation margin is included in receivable or payable for daily variation margin on futures contracts, and the net cumulative appreciation (depreciation) is included in Total accumulated earnings (loss).
(c)Gross value is presented in the Statement of Assets and Liabilities in the Investments in Securities at value line-item.
(d)For centrally cleared swaps, reflects gross cumulative appreciation (depreciation) as presented in the Schedule of Investments. In the Statement of Assets and Liabilities, the period end daily variation margin for centrally cleared swaps is included in receivable or payable for daily variation margin on centrally cleared swaps, and the net cumulative appreciation (depreciation) for centrally cleared swaps is included in Total accumulated earnings (loss).
Financial Statements (Unaudited)
| Statement of Assets and Liabilities |
| | | | June 30, 2024 (Unaudited) |
| | | | | |
| Assets | | | | |
| Investment in securities, at value (including securities loaned of $2,457,674) - See accompanying schedule: | | | | |
Unaffiliated issuers (cost $1,347,727,310) | $ | 1,304,152,531 | | |
Fidelity Central Funds (cost $148,968,923) | | 148,061,343 | | |
| | | | | |
| | | | | |
| Total Investment in Securities (cost $1,496,696,233) | | | $ | 1,452,213,874 |
| Segregated cash with brokers for derivative instruments | | | | 221,738 |
| Cash | | | | 2,631,038 |
| Foreign currency held at value (cost $35,078) | | | | 34,999 |
| Receivable for investments sold | | | | 442,849 |
| Receivable for TBA sale commitments | | | | 28,333,802 |
| Unrealized appreciation on forward foreign currency contracts | | | | 49,877 |
| Receivable for fund shares sold | | | | 199,810 |
| Dividends receivable | | | | 52,781 |
| Interest receivable | | | | 16,739,653 |
| Distributions receivable from Fidelity Central Funds | | | | 254,708 |
| Receivable for daily variation margin on centrally cleared swaps | | | | 29,904 |
Total assets | | | | 1,501,205,033 |
| Liabilities | | | | |
| Payable for investments purchased | | | | |
Regular delivery | $ | 7,144,860 | | |
Delayed delivery | | 19,496,284 | | |
| TBA sale commitments, at value | | 28,205,236 | | |
| Unrealized depreciation on forward foreign currency contracts | | 281,265 | | |
| Payable for fund shares redeemed | | 454,215 | | |
| Accrued management fee | | 775,404 | | |
| Distribution and service plan fees payable | | 123,213 | | |
| Payable for daily variation margin on futures contracts | | 344,103 | | |
| Other payables and accrued expenses | | 73,523 | | |
| Collateral on securities loaned | | 2,511,700 | | |
| Total liabilities | | | | 59,409,803 |
| Net Assets | | | $ | 1,441,795,230 |
| Net Assets consist of: | | | | |
| Paid in capital | | | $ | 1,513,277,328 |
| Total accumulated earnings (loss) | | | | (71,482,098) |
| Net Assets | | | $ | 1,441,795,230 |
| | | | | |
| Net Asset Value and Maximum Offering Price | | | | |
| Initial Class : | | | | |
Net Asset Value, offering price and redemption price per share ($76,851,772 ÷ 7,154,261 shares) | | | $ | 10.74 |
| Service Class : | | | | |
Net Asset Value, offering price and redemption price per share ($1,436,220 ÷ 133,981 shares) | | | $ | 10.72 |
| Service Class 2 : | | | | |
Net Asset Value, offering price and redemption price per share ($590,836,330 ÷ 55,778,521 shares) | | | $ | 10.59 |
| Investor Class : | | | | |
Net Asset Value, offering price and redemption price per share ($772,670,908 ÷ 72,249,790 shares) | | | $ | 10.69 |
| Statement of Operations |
| | | | Six months ended June 30, 2024 (Unaudited) |
| Investment Income | | | | |
| Dividends | | | $ | 2,584,608 |
| Interest | | | | 31,704,793 |
| Income from Fidelity Central Funds (including $202 from security lending) | | | | 4,720,456 |
| Total income | | | | 39,009,857 |
| Expenses | | | | |
| Management fee | $ | 4,345,897 | | |
| Transfer agent fees | | 201,758 | | |
| Distribution and service plan fees | | 716,123 | | |
| Accounting fees | | 79,461 | | |
| Custodian fees and expenses | | 21,125 | | |
| Independent trustees' fees and expenses | | 1,897 | | |
| Registration fees | | 63 | | |
| Audit | | 60,821 | | |
| Legal | | 24,818 | | |
| Miscellaneous | | 37,412 | | |
| Total expenses before reductions | | 5,489,375 | | |
| Expense reductions | | (65,375) | | |
| Total expenses after reductions | | | | 5,424,000 |
| Net Investment income (loss) | | | | 33,585,857 |
| Realized and Unrealized Gain (Loss) | | | | |
| Net realized gain (loss) on: | | | | |
| Investment Securities: | | | | |
| Unaffiliated issuers | | (523,923) | | |
| Fidelity Central Funds | | (11,228) | | |
| Forward foreign currency contracts | | 2,874,385 | | |
| Foreign currency transactions | | (22,655) | | |
| Futures contracts | | (1,765,984) | | |
| Swaps | | 521,149 | | |
| Total net realized gain (loss) | | | | 1,071,744 |
| Change in net unrealized appreciation (depreciation) on: | | | | |
| Investment Securities: | | | | |
| Unaffiliated issuers | | 740,389 | | |
| Fidelity Central Funds | | (444,097) | | |
| Forward foreign currency contracts | | 1,095,641 | | |
| Assets and liabilities in foreign currencies | | (63,247) | | |
| Futures contracts | | (2,928,176) | | |
| Swaps | | 830,770 | | |
| TBA Sale commitments | | 528,334 | | |
| Total change in net unrealized appreciation (depreciation) | | | | (240,386) |
| Net gain (loss) | | | | 831,358 |
| Net increase (decrease) in net assets resulting from operations | | | $ | 34,417,215 |
| Statement of Changes in Net Assets |
| |
| | Six months ended June 30, 2024 (Unaudited) | | Year ended December 31, 2023 |
| Increase (Decrease) in Net Assets | | | | |
| Operations | | | | |
| Net investment income (loss) | $ | 33,585,857 | $ | 61,894,301 |
| Net realized gain (loss) | | 1,071,744 | | (41,475,449) |
| Change in net unrealized appreciation (depreciation) | | (240,386) | | 102,411,161 |
| Net increase (decrease) in net assets resulting from operations | | 34,417,215 | | 122,830,013 |
| Distributions to shareholders | | (542,606) | | (60,369,827) |
| | | | | |
| Share transactions - net increase (decrease) | | (9,553,470) | | (22,362,620) |
| Total increase (decrease) in net assets | | 24,321,139 | | 40,097,566 |
| | | | | |
| Net Assets | | | | |
| Beginning of period | | 1,417,474,091 | | 1,377,376,525 |
| End of period | $ | 1,441,795,230 | $ | 1,417,474,091 |
| | | | | |
| | | | | |
Financial Highlights
VIP Strategic Income Portfolio Initial Class |
| |
| | Six months ended (Unaudited) June 30, 2024 | | Years ended December 31, 2023 | | 2022 | | 2021 | | 2020 | | 2019 |
Selected Per-Share Data | | | | | | | | | | | | |
| Net asset value, beginning of period | $ | 10.48 | $ | 10.02 | $ | 11.74 | $ | 11.81 | $ | 11.45 | $ | 10.75 |
| Income from Investment Operations | | | | | | | | | | | | |
Net investment income (loss) A,B | | .256 | | .475 | | .377 | | .327 | | .380 | | .421 |
| Net realized and unrealized gain (loss) | | .008 | | .460 | | (1.690) | | .113 | | .477 | | .749 |
| Total from investment operations | | .264 | | .935 | | (1.313) | | .440 | | .857 | | 1.170 |
| Distributions from net investment income | | (.004) | | (.475) | | (.380) | | (.320) | | (.385) | | (.385) |
| Distributions from net realized gain | | - | | - | | (.011) | | (.190) | | (.112) | | (.085) |
| Distributions from tax return of capital | | - | | - | | (.016) | | - | | - | | - |
| Total distributions | | (.004) | | (.475) | | (.407) | | (.510) | | (.497) | | (.470) |
| Net asset value, end of period | $ | 10.74 | $ | 10.48 | $ | 10.02 | $ | 11.74 | $ | 11.81 | $ | 11.45 |
Total Return C,D,E | | | | 9.41% | | (11.26)% | | 3.74% | | 7.52% | | 10.89% |
Ratios to Average Net Assets B,F,G | | | | | | | | | | | | |
| Expenses before reductions | | .66% H | | .67% | | .67% | | .66% | | .67% | | .67% |
| Expenses net of fee waivers, if any | | | | .67% | | .66% | | .66% | | .67% | | .67% |
| Expenses net of all reductions | | .65% H | | .66% | | .66% | | .66% | | .66% | | .66% |
| Net investment income (loss) | | 4.87% H | | 4.59% | | 3.52% | | 2.72% | | 3.32% | | 3.67% |
| Supplemental Data | | | | | | | | | | | | |
| Net assets, end of period (000 omitted) | $ | 76,852 | $ | 76,209 | $ | 71,244 | $ | 84,605 | $ | 79,320 | $ | 83,769 |
Portfolio turnover rate I | | | | 78% | | 75% | | 103% | | 116% | | 144% |
ACalculated based on average shares outstanding during the period.
BNet investment income (loss) is affected by the timing of the declaration of dividends by any underlying mutual funds or exchange-traded funds (ETFs). Net investment income (loss) of any mutual funds or ETFs is not included in the Fund's net investment income (loss) ratio.
CTotal returns for periods of less than one year are not annualized.
DTotal returns do not reflect charges attributable to your insurance company's separate account. Inclusion of these charges would reduce the total returns shown.
ETotal returns would have been lower if certain expenses had not been reduced during the applicable periods shown.
FFees and expenses of any underlying mutual funds or exchange-traded funds (ETFs) are not included in the Fund's expense ratio. The Fund indirectly bears its proportionate share of these expenses. For additional expense information related to investments in Fidelity Central Funds, please refer to the "Investments in Fidelity Central Funds" note found in the Notes to Financial Statements section of the most recent Annual or Semi-Annual report.
GExpense ratios reflect operating expenses of the class. Expenses before reductions do not reflect amounts reimbursed, waived, or reduced through arrangements with the investment adviser, brokerage services, or other offset arrangements, if applicable, and do not represent the amount paid by the class during periods when reimbursements, waivers or reductions occur.
HAnnualized.
IAmount does not include the portfolio activity of any underlying mutual funds or exchange-traded funds (ETFs).
VIP Strategic Income Portfolio Service Class |
| |
| | Six months ended (Unaudited) June 30, 2024 | | Years ended December 31, 2023 | | 2022 | | 2021 | | 2020 | | 2019 |
Selected Per-Share Data | | | | | | | | | | | | |
| Net asset value, beginning of period | $ | 10.47 | $ | 10.00 | $ | 11.73 | $ | 11.81 | $ | 11.42 | $ | 10.72 |
| Income from Investment Operations | | | | | | | | | | | | |
Net investment income (loss) A,B | | .250 | | .464 | | .356 | | .315 | | .371 | | .409 |
| Net realized and unrealized gain (loss) | | .004 | | .470 | | (1.682) | | .105 | | .489 | | .750 |
| Total from investment operations | | .254 | | .934 | | (1.326) | | .420 | | .860 | | 1.159 |
| Distributions from net investment income | | (.004) | | (.464) | | (.377) | | (.310) | | (.358) | | (.374) |
| Distributions from net realized gain | | - | | - | | (.011) | | (.190) | | (.112) | | (.085) |
| Distributions from tax return of capital | | - | | - | | (.016) | | - | | - | | - |
| Total distributions | | (.004) | | (.464) | | (.404) | | (.500) | | (.470) | | (.459) |
| Net asset value, end of period | $ | 10.72 | $ | 10.47 | $ | 10.00 | $ | 11.73 | $ | 11.81 | $ | 11.42 |
Total Return C,D,E | | | | 9.42% | | (11.38)% | | 3.57% | | 7.56% | | 10.82% |
Ratios to Average Net Assets B,F,G | | | | | | | | | | | | |
| Expenses before reductions | | .76% H | | .77% | | .77% | | .76% | | .77% | | .77% |
| Expenses net of fee waivers, if any | | | | .77% | | .76% | | .76% | | .77% | | .77% |
| Expenses net of all reductions | | .75% H | | .76% | | .76% | | .76% | | .77% | | .76% |
| Net investment income (loss) | | 4.76% H | | 4.49% | | 3.42% | | 2.62% | | 3.21% | | 3.57% |
| Supplemental Data | | | | | | | | | | | | |
| Net assets, end of period (000 omitted) | $ | 1,436 | $ | 1,356 | $ | 1,446 | $ | 502 | $ | 426 | $ | 1,945 |
Portfolio turnover rate I | | | | 78% | | 75% | | 103% | | 116% | | 144% |
ACalculated based on average shares outstanding during the period.
BNet investment income (loss) is affected by the timing of the declaration of dividends by any underlying mutual funds or exchange-traded funds (ETFs). Net investment income (loss) of any mutual funds or ETFs is not included in the Fund's net investment income (loss) ratio.
CTotal returns for periods of less than one year are not annualized.
DTotal returns do not reflect charges attributable to your insurance company's separate account. Inclusion of these charges would reduce the total returns shown.
ETotal returns would have been lower if certain expenses had not been reduced during the applicable periods shown.
FFees and expenses of any underlying mutual funds or exchange-traded funds (ETFs) are not included in the Fund's expense ratio. The Fund indirectly bears its proportionate share of these expenses. For additional expense information related to investments in Fidelity Central Funds, please refer to the "Investments in Fidelity Central Funds" note found in the Notes to Financial Statements section of the most recent Annual or Semi-Annual report.
GExpense ratios reflect operating expenses of the class. Expenses before reductions do not reflect amounts reimbursed, waived, or reduced through arrangements with the investment adviser, brokerage services, or other offset arrangements, if applicable, and do not represent the amount paid by the class during periods when reimbursements, waivers or reductions occur.
HAnnualized.
IAmount does not include the portfolio activity of any underlying mutual funds or exchange-traded funds (ETFs).
VIP Strategic Income Portfolio Service Class 2 |
| |
| | Six months ended (Unaudited) June 30, 2024 | | Years ended December 31, 2023 | | 2022 | | 2021 | | 2020 | | 2019 |
Selected Per-Share Data | | | | | | | | | | | | |
| Net asset value, beginning of period | $ | 10.35 | $ | 9.90 | $ | 11.61 | $ | 11.69 | $ | 11.34 | $ | 10.65 |
| Income from Investment Operations | | | | | | | | | | | | |
Net investment income (loss) A,B | | .239 | | .443 | | .346 | | .293 | | .348 | | .389 |
| Net realized and unrealized gain (loss) | | .005 | | .458 | | (1.675) | | .108 | | .471 | | .745 |
| Total from investment operations | | .244 | | .901 | | (1.329) | | .401 | | .819 | | 1.134 |
| Distributions from net investment income | | (.004) | | (.451) | | (.355) | | (.292) | | (.357) | | (.359) |
| Distributions from net realized gain | | - | | - | | (.011) | | (.189) | | (.112) | | (.085) |
| Distributions from tax return of capital | | - | | - | | (.015) | | - | | - | | - |
| Total distributions | | (.004) | | (.451) | | (.381) | | (.481) | | (.469) | | (.444) |
| Net asset value, end of period | $ | 10.59 | $ | 10.35 | $ | 9.90 | $ | 11.61 | $ | 11.69 | $ | 11.34 |
Total Return C,D,E | | | | 9.18% | | (11.52)% | | 3.44% | | 7.25% | | 10.66% |
Ratios to Average Net Assets B,F,G | | | | | | | | | | | | |
| Expenses before reductions | | .91% H | | .92% | | .92% | | .91% | | .92% | | .92% |
| Expenses net of fee waivers, if any | | | | .92% | | .91% | | .91% | | .92% | | .92% |
| Expenses net of all reductions | | .90% H | | .91% | | .91% | | .91% | | .91% | | .91% |
| Net investment income (loss) | | 4.61% H | | 4.34% | | 3.27% | | 2.47% | | 3.07% | | 3.42% |
| Supplemental Data | | | | | | | | | | | | |
| Net assets, end of period (000 omitted) | $ | 590,836 | $ | 562,099 | $ | 507,410 | $ | 619,208 | $ | 534,029 | $ | 502,859 |
Portfolio turnover rate I | | | | 78% | | 75% | | 103% | | 116% | | 144% |
ACalculated based on average shares outstanding during the period.
BNet investment income (loss) is affected by the timing of the declaration of dividends by any underlying mutual funds or exchange-traded funds (ETFs). Net investment income (loss) of any mutual funds or ETFs is not included in the Fund's net investment income (loss) ratio.
CTotal returns for periods of less than one year are not annualized.
DTotal returns do not reflect charges attributable to your insurance company's separate account. Inclusion of these charges would reduce the total returns shown.
ETotal returns would have been lower if certain expenses had not been reduced during the applicable periods shown.
FFees and expenses of any underlying mutual funds or exchange-traded funds (ETFs) are not included in the Fund's expense ratio. The Fund indirectly bears its proportionate share of these expenses. For additional expense information related to investments in Fidelity Central Funds, please refer to the "Investments in Fidelity Central Funds" note found in the Notes to Financial Statements section of the most recent Annual or Semi-Annual report.
GExpense ratios reflect operating expenses of the class. Expenses before reductions do not reflect amounts reimbursed, waived, or reduced through arrangements with the investment adviser, brokerage services, or other offset arrangements, if applicable, and do not represent the amount paid by the class during periods when reimbursements, waivers or reductions occur.
HAnnualized.
IAmount does not include the portfolio activity of any underlying mutual funds or exchange-traded funds (ETFs).
VIP Strategic Income Portfolio Investor Class |
| |
| | Six months ended (Unaudited) June 30, 2024 | | Years ended December 31, 2023 | | 2022 | | 2021 | | 2020 | | 2019 |
Selected Per-Share Data | | | | | | | | | | | | |
| Net asset value, beginning of period | $ | 10.44 | $ | 9.98 | $ | 11.70 | $ | 11.77 | $ | 11.41 | $ | 10.71 |
| Income from Investment Operations | | | | | | | | | | | | |
Net investment income (loss) A,B | | .253 | | .470 | | .372 | | .322 | | .375 | | .416 |
| Net realized and unrealized gain (loss) | | .001 | | .462 | | (1.689) | | .114 | | .478 | | .750 |
| Total from investment operations | | .254 | | .932 | | (1.317) | | .436 | | .853 | | 1.166 |
| Distributions from net investment income | | (.004) | | (.472) | | (.376) | | (.316) | | (.381) | | (.381) |
| Distributions from net realized gain | | - | | - | | (.011) | | (.190) | | (.112) | | (.085) |
| Distributions from tax return of capital | | - | | - | | (.016) | | - | | - | | - |
| Total distributions | | (.004) | | (.472) | | (.403) | | (.506) | | (.493) | | (.466) |
| Net asset value, end of period | $ | 10.69 | $ | 10.44 | $ | 9.98 | $ | 11.70 | $ | 11.77 | $ | 11.41 |
Total Return C,D,E | | | | 9.42% | | (11.33)% | | 3.72% | | 7.51% | | 10.89% |
Ratios to Average Net Assets B,F,G | | | | | | | | | | | | |
| Expenses before reductions | | .69% H | | .70% | | .70% | | .69% | | .70% | | .70% |
| Expenses net of fee waivers, if any | | | | .70% | | .70% | | .69% | | .70% | | .70% |
| Expenses net of all reductions | | .68% H | | .70% | | .70% | | .69% | | .70% | | .70% |
| Net investment income (loss) | | 4.83% H | | 4.56% | | 3.49% | | 2.69% | | 3.28% | | 3.63% |
| Supplemental Data | | | | | | | | | | | | |
| Net assets, end of period (000 omitted) | $ | 772,671 | $ | 777,810 | $ | 797,276 | $ | 986,699 | $ | 944,625 | $ | 969,943 |
Portfolio turnover rate I | | | | 78% | | 75% | | 103% | | 116% | | 144% |
ACalculated based on average shares outstanding during the period.
BNet investment income (loss) is affected by the timing of the declaration of dividends by any underlying mutual funds or exchange-traded funds (ETFs). Net investment income (loss) of any mutual funds or ETFs is not included in the Fund's net investment income (loss) ratio.
CTotal returns for periods of less than one year are not annualized.
DTotal returns do not reflect charges attributable to your insurance company's separate account. Inclusion of these charges would reduce the total returns shown.
ETotal returns would have been lower if certain expenses had not been reduced during the applicable periods shown.
FFees and expenses of any underlying mutual funds or exchange-traded funds (ETFs) are not included in the Fund's expense ratio. The Fund indirectly bears its proportionate share of these expenses. For additional expense information related to investments in Fidelity Central Funds, please refer to the "Investments in Fidelity Central Funds" note found in the Notes to Financial Statements section of the most recent Annual or Semi-Annual report.
GExpense ratios reflect operating expenses of the class. Expenses before reductions do not reflect amounts reimbursed, waived, or reduced through arrangements with the investment adviser, brokerage services, or other offset arrangements, if applicable, and do not represent the amount paid by the class during periods when reimbursements, waivers or reductions occur.
HAnnualized.
IAmount does not include the portfolio activity of any underlying mutual funds or exchange-traded funds (ETFs).
Notes to Financial Statements
(Unaudited)For the period ended June 30, 2024
1. Organization.
VIP Strategic Income Portfolio (the Fund) is a fund of Variable Insurance Products Fund V (the Trust) and is authorized to issue an unlimited number of shares. The Trust is registered under the Investment Company Act of 1940, as amended (the 1940 Act), as an open-end management investment company organized as a Massachusetts business trust. Shares of the Fund may only be purchased by insurance companies for the purpose of funding variable annuity or variable life insurance contracts. The Fund offers the following classes of shares: Initial Class shares, Service Class shares, Service Class 2 shares and Investor Class shares. All classes have equal rights and voting privileges, except for matters affecting a single class.
2. Investments in Fidelity Central Funds.
Funds may invest in Fidelity Central Funds, which are open-end investment companies generally available only to other investment companies and accounts managed by the investment adviser and its affiliates. The Schedule of Investments lists any Fidelity Central Funds held as an investment as of period end, but does not include the underlying holdings of each Fidelity Central Fund. An investing fund indirectly bears its proportionate share of the expenses of the underlying Fidelity Central Funds.
Based on its investment objective, each Fidelity Central Fund may invest or participate in various investment vehicles or strategies that are similar to those of the investing fund. These strategies are consistent with the investment objectives of the investing fund and may involve certain economic risks which may cause a decline in value of each of the Fidelity Central Funds and thus a decline in the value of the investing fund.
| Fidelity Central Fund | Investment Manager | Investment Objective | Investment Practices | Expense RatioA |
| Fidelity Floating Rate Central Fund | Fidelity Management & Research Company LLC (FMR) | Seeks a high level of income by normally investing in floating rate loans and other floating rate securities. | Loans & Direct Debt Instruments Restricted Securities | Less than .005% |
| Fidelity Money Market Central Funds | Fidelity Management & Research Company LLC (FMR) | Each fund seeks to obtain a high level of current income consistent with the preservation of capital and liquidity. | Short-term Investments | Less than .005% |
A Expenses expressed as a percentage of average net assets and are as of each underlying Central Fund's most recent annual or semi-annual shareholder report.
An unaudited holdings listing for the investing fund, which presents direct holdings as well as the pro-rata share of any securities and other investments held indirectly through its investment in underlying non-money market Fidelity Central Funds, is available at fidelity.com and/or institutional.fidelity.com, as applicable. A complete unaudited list of holdings for each Fidelity Central Fund is available upon request or at the Securities and Exchange Commission website at www.sec.gov. In addition, the financial statements of the Fidelity Central Funds which contain the significant accounting policies (including investment valuation policies) of those funds, and are not covered by the Report of Independent Registered Public Accounting Firm, are available on the Securities and Exchange Commission website or upon request.
3. Significant Accounting Policies.
The Fund is an investment company and applies the accounting and reporting guidance of the Financial Accounting Standards Board (FASB) Accounting Standards Codification Topic 946 Financial Services - Investment Companies. The financial statements have been prepared in conformity with accounting principles generally accepted in the United States of America (GAAP), which require management to make certain estimates and assumptions at the date of the financial statements. Actual results could differ from those estimates. Subsequent events, if any, through the date that the financial statements were issued have been evaluated in the preparation of the financial statements. The Fund's Schedule of Investments lists any underlying mutual funds or exchange-traded funds (ETFs) but does not include the underlying holdings of these funds. The following summarizes the significant accounting policies of the Fund:
Investment Valuation. Investments are valued as of 4:00 p.m. Eastern time on the last calendar day of the period. The Board of Trustees (the Board) has designated the Fund's investment adviser as the valuation designee responsible for the fair valuation function and performing fair value determinations as needed. The investment adviser has established a Fair Value Committee (the Committee) to carry out the day-to-day fair valuation responsibilities and has adopted policies and procedures to govern the fair valuation process and the activities of the Committee. In accordance with these fair valuation policies and procedures, which have been approved by the Board, the Fund attempts to obtain prices from one or more third party pricing services or brokers to value its investments. When current market prices, quotations or currency exchange rates are not readily available or reliable, investments will be fair valued in good faith by the Committee, in accordance with the policies and procedures. Factors used in determining fair value vary by investment type and may include market or investment specific events, transaction data, estimated cash flows, and market observations of comparable investments. The frequency that the fair valuation procedures are used cannot be predicted and they may be utilized to a significant extent. The Committee manages the Fund's fair valuation practices and maintains the fair valuation policies and procedures. The Fund's investment adviser reports to the Board information regarding the fair valuation process and related material matters.
The Fund categorizes the inputs to valuation techniques used to value its investments into a disclosure hierarchy consisting of three levels as shown below:
Level 1 - unadjusted quoted prices in active markets for identical investments
Level 2 - other significant observable inputs (including quoted prices for similar investments, interest rates, prepayment speeds, etc.)
Level 3 - unobservable inputs (including the Fund's own assumptions based on the best information available)
Valuation techniques used to value the Fund's investments by major category are as follows:
Debt securities, including restricted securities, are valued based on evaluated prices received from third party pricing services or from brokers who make markets in such securities. Corporate bonds, bank loan obligations, foreign government and government agency obligations, preferred securities and U.S. government and government agency obligations are valued by pricing services who utilize matrix pricing which considers yield or price of bonds of comparable quality, coupon, maturity and type or by broker-supplied prices. Collateralized mortgage obligations, commercial mortgage securities and U.S. government agency mortgage securities are valued by pricing services who utilize matrix pricing which considers prepayment speed assumptions, attributes of the collateral, yield or price of bonds of comparable quality, coupon, maturity and type or by broker-supplied prices. Swaps are marked-to-market daily based on valuations from third party pricing services, registered derivatives clearing organizations (clearinghouses) or broker-supplied valuations. These pricing sources may utilize inputs such as interest rate curves, credit spread curves, default possibilities and recovery rates. When independent prices are unavailable or unreliable, debt securities and swaps may be valued utilizing pricing methodologies which consider similar factors that would be used by third party pricing services. For foreign debt securities, when significant market or security specific events arise, valuations may be determined in good faith in accordance with procedures adopted by the Board. Debt securities and swaps are generally categorized as Level 2 in the hierarchy but may be Level 3 depending on the circumstances. The Fund invests a significant portion of its assets in below investment grade securities. The value of these securities can be more volatile due to changes in the credit quality of the issuer and is sensitive to changes in economic, market and regulatory conditions.
Equity securities, including restricted securities, for which market quotations are readily available, are valued at the last reported sale price or official closing price as reported by a third party pricing service on the primary market or exchange on which they are traded and are categorized as Level 1 in the hierarchy. In the event there were no sales during the day or closing prices are not available, securities are valued at the last quoted bid price or may be valued using the last available price and are generally categorized as Level 2 in the hierarchy. For foreign equity securities, when market or security specific events arise, comparisons to the valuation of American Depositary Receipts (ADRs), futures contracts, ETFs and certain indexes as well as quoted prices for similar securities may be used and would be categorized as Level 2 in the hierarchy. For equity securities, including restricted securities, where observable inputs are limited, assumptions about market activity and risk are used and these securities may be categorized as Level 3 in the hierarchy.
The U.S. dollar value of forward foreign currency contracts is determined using currency exchange rates supplied by a pricing service and are categorized as Level 2 in the hierarchy. Futures contracts are valued at the settlement price established each day by the board of trade or exchange on which they are traded and are categorized as Level 1 in the hierarchy. Options traded over-the-counter are valued using service or broker-supplied valuations and are categorized as Level 2 in the hierarchy. Investments in open-end mutual funds, including the Fidelity Central Funds, are valued at their closing net asset value (NAV) each business day and are categorized as Level 1 in the hierarchy.
Changes in valuation techniques may result in transfers in or out of an assigned level within the disclosure hierarchy. The aggregate value of investments by input level as of June 30, 2024 is included at the end of the Fund's Schedule of Investments.
Foreign Currency. Foreign-denominated assets, including investment securities, and liabilities are translated into U.S. dollars at the exchange rates at period end. Purchases and sales of investment securities, income and dividends received, and expenses denominated in foreign currencies are translated into U.S. dollars at the exchange rate in effect on the transaction date.
The effects of exchange rate fluctuations on investments are included with the net realized and unrealized gain (loss) on investment securities. Other foreign currency transactions resulting in realized and unrealized gain (loss) are disclosed separately.
Realized gains and losses on foreign currency transactions arise from the disposition of foreign currency, realized changes in the value of foreign currency between the trade and settlement dates on security transactions, and the difference between the amounts of dividends, interest and foreign withholding taxes recorded on transaction date and the U.S. dollar equivalent of the amounts actually received or paid. Unrealized gains and losses on assets and liabilities in foreign currencies arise from changes in the value of foreign currency, and from assets and liabilities denominated in foreign currencies, other than investments, which are held at period end.
Investment Transactions and Income. For financial reporting purposes, the Fund's investment holdings and NAV include trades executed through the end of the last business day of the period. The NAV per share for processing shareholder transactions is calculated as of the close of business of the New York Stock Exchange (NYSE), normally 4:00 p.m. Eastern time and includes trades executed through the end of the prior business day. Gains and losses on securities sold are determined on the basis of identified cost. Commissions paid to certain brokers with whom the investment adviser, or its affiliates, places trades on behalf of a fund include an amount in addition to trade execution, which may be rebated back to a fund. Any such rebates are included in net realized gain (loss) on investments in the Statement of Operations. Dividend income is recorded on the ex-dividend date, except for certain dividends from foreign securities where the ex-dividend date may have passed, which are recorded as soon as the Fund is informed of the ex-dividend date. Non-cash dividends included in dividend income, if any, are recorded at the fair market value of the securities received. Income and capital gain distributions from Fidelity Central Funds, if any, are recorded on the ex-dividend date. Certain distributions received by the Fund represent a return of capital or capital gain. The Fund determines the components of these distributions subsequent to the ex-dividend date, based upon receipt of tax filings or other correspondence relating to the underlying investment. These distributions are recorded as a reduction of cost of investments and/or as a realized gain. Interest income is accrued as earned and includes coupon interest and amortization of premium and accretion of discount on debt securities as applicable. Paid in Kind (PIK) income is recorded at the fair market value of the securities received. Investment income is recorded net of foreign taxes withheld where recovery of such taxes is uncertain. Debt obligations may be placed on non-accrual status and related interest income may be reduced by ceasing current accruals and writing off interest receivables when the collection of all or a portion of interest has become doubtful based on consistently applied procedures. A debt obligation is removed from non-accrual status when the issuer resumes interest payments or when collectability of interest is reasonably assured. Funds may file withholding tax reclaims in certain jurisdictions to recover a portion of amounts previously withheld. Any withholding tax reclaims income is included in the Statement of Operations in dividends. Any receivables for withholding tax reclaims are included in the Statement of Assets and Liabilities in dividends receivable.
Class Allocations and Expenses. Investment income, realized and unrealized capital gains and losses, common expenses of a fund, and certain fund-level expense reductions, if any, are allocated daily on a pro-rata basis to each class based on the relative net assets of each class to the total net assets of a fund. Each class differs with respect to transfer agent and distribution and service plan fees incurred, as applicable. Certain expense reductions may also differ by class, if applicable. For the reporting period, the allocated portion of income and expenses to each class as a percent of its average net assets may vary due to the timing of recording these transactions in relation to fluctuating net assets of the classes. Expenses directly attributable to a fund are charged to that fund. Expenses attributable to more than one fund are allocated among the respective funds on the basis of relative net assets or other appropriate methods. Expenses included in the accompanying financial statements reflect the expenses of that fund and do not include any expenses associated with any underlying mutual funds or exchange-traded funds (ETFs). Although not included in a fund's expenses, a fund indirectly bears its proportionate share of these expenses through the net asset value of each underlying mutual fund or exchange-traded fund (ETF). Expense estimates are accrued in the period to which they relate and adjustments are made when actual amounts are known.
Income Tax Information and Distributions to Shareholders. Each year, the Fund intends to qualify as a regulated investment company under Subchapter M of the Internal Revenue Code, including distributing substantially all of its taxable income and realized gains. As a result, no provision for U.S. Federal income taxes is required. The Fund files a U.S. federal tax return, in addition to state and local tax returns as required. The Fund's federal income tax returns are subject to examination by the Internal Revenue Service (IRS) for a period of three fiscal years after they are filed. State and local tax returns may be subject to examination for an additional fiscal year depending on the jurisdiction. Foreign taxes are provided for based on the Fund's understanding of the tax rules and rates that exist in the foreign markets in which it invests.
Distributions are declared and recorded on the ex-dividend date. Income and capital gain distributions are declared separately for each class. Income and capital gain distributions are determined in accordance with income tax regulations, which may differ from GAAP.
Capital accounts within the financial statements are adjusted for permanent book-tax differences. These adjustments have no impact on net assets or the results of operations. Capital accounts are not adjusted for temporary book-tax differences which will reverse in a subsequent period.
Book-tax differences are primarily due to futures contracts, swaps, foreign currency transactions, defaulted bonds, market discount, contingent interest, partnerships, capital loss carryforwards and losses deferred due to wash sales and futures transactions.
As of period end, the cost and unrealized appreciation (depreciation) in securities, and derivatives if applicable, for federal income tax purposes were as follows:
| Gross unrealized appreciation | $56,117,880 |
| Gross unrealized depreciation | (91,889,443) |
| Net unrealized appreciation (depreciation) | $(35,771,563) |
| Tax cost | $1,489,055,136 |
Capital loss carryforwards are only available to offset future capital gains of the Fund to the extent provided by regulations and may be limited. The capital loss carryforward information presented below, including any applicable limitation, is estimated as of prior fiscal period end and is subject to adjustment.
Short-term | $(31,754,523) |
Long-term | (30,283,601) |
| Total capital loss carryforward | $(62,038,124) |
Delayed Delivery Transactions and When-Issued Securities. During the period, certain Funds transacted in securities on a delayed delivery or when-issued basis. Payment and delivery may take place after the customary settlement period for that security. The price of the underlying securities and the date when the securities will be delivered and paid for are fixed at the time the transaction is negotiated. Securities purchased on a delayed delivery or when-issued basis are identified as such in the Schedule of Investments. Compensation for interest forgone in the purchase of a delayed delivery or when-issued debt security may be received. With respect to purchase commitments, each applicable Fund identifies securities as segregated in its records with a value at least equal to the amount of the commitment. Payables and receivables associated with the purchases and sales of delayed delivery securities having the same coupon, settlement date and broker are offset. Delayed delivery or when-issued securities that have been purchased from and sold to different brokers are reflected as both payables and receivables in the Statement of Assets and Liabilities under the caption "Delayed delivery", as applicable. Losses may arise due to changes in the value of the underlying securities or if the counterparty does not perform under the contract's terms, or if the issuer does not issue the securities due to political, economic, or other factors.
To-Be-Announced (TBA) Securities and Mortgage Dollar Rolls. TBA securities involve buying or selling mortgage-backed securities (MBS) on a forward commitment basis. A TBA transaction typically does not designate the actual security to be delivered and only includes an approximate principal amount; however delivered securities must meet specified terms defined by industry guidelines, including issuer, rate and current principal amount outstanding on underlying mortgage pools. Funds may enter into a TBA transaction with the intent to take possession of or deliver the underlying MBS, or a fund may elect to extend the settlement by entering into either a mortgage or reverse mortgage dollar roll. Mortgage dollar rolls are transactions where a fund sells TBA securities and simultaneously agrees to repurchase MBS on a later date at a lower price and with the same counterparty. Reverse mortgage dollar rolls involve the purchase and simultaneous agreement to sell TBA securities on a later date at a lower price. Transactions in mortgage dollar rolls and reverse mortgage dollar rolls are accounted for as purchases and sales and may result in an increase to a fund's portfolio turnover rate.
Purchases and sales of TBA securities involve risks similar to those discussed above for delayed delivery and when-issued securities. Also, if the counterparty in a mortgage dollar roll or a reverse mortgage dollar roll transaction files for bankruptcy or becomes insolvent, a fund's right to repurchase or sell securities may be limited. Additionally, when a fund sells TBA securities without already owning or having the right to obtain the deliverable securities (an uncovered forward commitment to sell), it incurs a risk of loss because it could have to purchase the securities at a price that is higher than the price at which it sold them. A fund may be unable to purchase the deliverable securities if the corresponding market is illiquid.
TBA securities subject to a forward commitment to sell at period end are included at the end of the Schedule of Investments under the caption "TBA Sale Commitments." The value of these commitments and proceeds to be received at contractual settlement date are reflected in the Statement of Assets and Liabilities as "TBA sale commitments, at value" and "Receivable for TBA sale commitments," respectively. If the TBA sale commitment is closed through the acquisition of an offsetting TBA purchase commitment, a fund realizes a gain or loss. If a fund delivers securities under the commitment, a fund realizes a gain or loss from the sale of the securities based upon the price established at the date the commitment was entered into.
Restricted Securities (including Private Placements). Funds may invest in securities that are subject to legal or contractual restrictions on resale. These securities generally may be resold in transactions exempt from registration or to the public if the securities are registered. Disposal of these securities may involve time-consuming negotiations and expense, and prompt sale at an acceptable price may be difficult. Information regarding restricted securities held at period end is included at the end of the Schedule of Investments, if applicable.
Loans and Other Direct Debt Instruments. Direct debt instruments are interests in amounts owed to lenders by corporate or other borrowers. These instruments may be in the form of loans, trade claims or other receivables and may include standby financing commitments such as revolving credit facilities that obligate a fund to supply additional cash to the borrower on demand. Loans may be acquired through assignment, participation, or may be made directly to a borrower. Such instruments are presented in the Bank Loan Obligations section in the Schedule of Investments. Certain funds may also invest in unfunded loan commitments, which are contractual obligations for future funding. Information regarding unfunded commitments is included at the end of the Schedule of Investments, if applicable.
4. Derivative Instruments.
Risk Exposures and the Use of Derivative Instruments. The Fund's investment objectives allow for various types of derivative instruments, including futures contracts, forward foreign currency contracts, options and swaps. Derivatives are investments whose value is primarily derived from underlying assets, indices or reference rates and may be transacted on an exchange or over-the-counter (OTC). Derivatives may involve a future commitment to buy or sell a specified asset based on specified terms, to exchange future cash flows at periodic intervals based on a notional principal amount, or for one party to make one or more payments upon the occurrence of specified events in exchange for periodic payments from the other party.
Derivatives were used to increase returns, to gain exposure to certain types of assets, to facilitate transactions in foreign-denominated securities and to manage exposure to certain risks as defined below. The success of any strategy involving derivatives depends on analysis of numerous economic factors, and if the strategies for investment do not work as intended, the objectives may not be achieved.
Derivatives were used to increase or decrease exposure to the following risk(s):
| | |
| Foreign Exchange Risk | Foreign exchange rate risk relates to fluctuations in the value of an asset or liability due to changes in currency exchange rates. |
| Interest Rate Risk | Interest rate risk relates to the fluctuations in the value of interest-bearing securities due to changes in the prevailing levels of market interest rates. |
Funds are also exposed to additional risks from investing in derivatives, such as liquidity risk and counterparty credit risk. Liquidity risk is the risk that a fund will be unable to close out the derivative in the open market in a timely manner. Counterparty credit risk is the risk that the counterparty will not be able to fulfill its obligation to a fund. Derivative counterparty credit risk is managed through formal evaluation of the creditworthiness of all potential counterparties. On certain OTC derivatives such as forward foreign currency contracts and options, a fund attempts to reduce its exposure to counterparty credit risk by entering into an International Swaps and Derivatives Association, Inc. (ISDA) Master Agreement with each of its counterparties. The ISDA Master Agreement gives a fund the right to terminate all transactions traded under such agreement upon the deterioration in the credit quality of the counterparty beyond specified levels. The ISDA Master Agreement gives each party the right, upon an event of default by the other party or a termination of the agreement, to close out all transactions traded under such agreement and to net amounts owed under each transaction to one net payable by one party to the other. To mitigate counterparty credit risk on bi-lateral OTC derivatives, a fund receives collateral in the form of cash or securities once net unrealized appreciation on outstanding derivative contracts under an ISDA Master Agreement exceeds certain applicable thresholds, subject to certain minimum transfer provisions. The collateral received is held in segregated accounts with the custodian bank in accordance with the collateral agreements entered into between a fund, the counterparty and the custodian bank. A fund could experience delays and costs in gaining access to the collateral even though it is held by the custodian bank. The maximum risk of loss to a fund from counterparty credit risk related to bi-lateral OTC derivatives is generally the aggregate unrealized appreciation and unpaid counterparty payments in excess of any collateral pledged by the counterparty to a fund. A fund may be required to pledge collateral for the benefit of the counterparties on bi-lateral OTC derivatives in an amount not less than each counterparty's unrealized appreciation on outstanding derivative contracts, subject to certain minimum transfer provisions, and any such pledged collateral is identified in the Schedule of Investments. Exchange-traded contracts are not covered by the ISDA Master Agreement; however counterparty credit risk related to these contracts may be mitigated by the protection provided by the exchange on which they trade. Counterparty credit risk related to centrally cleared swaps may be mitigated by the protection provided by the clearinghouse.
Investing in derivatives may involve greater risks than investing in the underlying assets directly and, to varying degrees, may involve risk of loss in excess of any initial investment and collateral received and amounts recognized in the Statement of Assets and Liabilities. In addition, there may be the risk that the change in value of the derivative contract does not correspond to the change in value of the underlying instrument.
Net Realized Gain (Loss) and Change in Net Unrealized Appreciation (Depreciation) on Derivatives. The table below, which reflects the impacts of derivatives on the financial performance, summarizes the net realized gain (loss) and change in net unrealized appreciation (depreciation) for derivatives during the period as presented in the Statement of Operations.
| Primary Risk Exposure / Derivative Type | Net Realized Gain (Loss)($) | Change in Net Unrealized Appreciation (Depreciation)($) |
| VIP Strategic Income Portfolio | | |
| Foreign Exchange Risk | | |
| Forward Foreign Currency Contracts | 2,874,385 | 1,095,641 |
| Total Foreign Exchange Risk | 2,874,385 | 1,095,641 |
| Interest Rate Risk | | |
| Futures Contracts | (1,765,984) | (2,928,176) |
| Purchased Options | - | (37,405) |
| Swaps | 521,149 | 830,770 |
| Total Interest Rate Risk | (1,244,835) | (2,134,811) |
| Totals | 1,629,550 | (1,039,170) |
If there are any open positions at period end, a summary of the value of derivatives by primary risk exposure is included at the end of the Schedule of Investments.
Forward Foreign Currency Contracts. Forward foreign currency contracts represent obligations to purchase or sell foreign currency on a specified future date at a price fixed at the time the contracts are entered into. Forward foreign currency contracts were used to facilitate transactions in foreign-denominated securities and to manage exposure to certain foreign currencies.
Forward foreign currency contracts are valued daily and fluctuations in exchange rates on open contracts are recorded as unrealized appreciation or (depreciation) and reflected in total accumulated earnings (loss) in the Statement of Assets and Liabilities. When the contract is closed, a gain or loss is realized equal to the difference between the closing value and the value at the time it was opened. Non-deliverable forward foreign currency exchange contracts are settled with the counterparty in cash without the delivery of foreign currency. The net realized gain (loss) and change in net unrealized appreciation (depreciation) on forward foreign currency contracts during the period is presented in the Statement of Operations.
Any open forward foreign currency contracts at period end are presented in the Schedule of Investments under the caption "Forward Foreign Currency Contracts." The contract amount and unrealized appreciation (depreciation) reflects each contract's exposure to the underlying currency at period end, and is representative of volume of activity during the period unless an average contract value is presented.
Futures Contracts. A futures contract is an agreement between two parties to buy or sell a specified underlying instrument for a fixed price at a specified future date. Futures contracts were used to manage exposure to the bond market and fluctuations in interest rates.
Upon entering into a futures contract, a fund is required to deposit either cash or securities (initial margin) with a clearing broker in an amount equal to a certain percentage of the face value of the contract. Futures contracts are marked-to-market daily and subsequent daily payments are made or received by a fund depending on the daily fluctuations in the value of the futures contracts and are recorded as unrealized appreciation or (depreciation). This receivable and/or payable, if any, is included in daily variation margin on futures contracts in the Statement of Assets and Liabilities. Realized gain or (loss) is recorded upon the expiration or closing of a futures contract. The net realized gain (loss) and change in net unrealized appreciation (depreciation) on futures contracts during the period is presented in the Statement of Operations.
Any open futures contracts at period end are presented in the Schedule of Investments under the caption "Futures Contracts". The notional amount at value reflects each contract's exposure to the underlying instrument or index at period end, and is representative of volume of activity during the period unless an average notional amount is presented. Any securities deposited to meet initial margin requirements are identified in the Schedule of Investments. Any cash deposited to meet initial margin requirements is presented as segregated cash with brokers for derivative instruments in the Statement of Assets and Liabilities.
Options. Options give the purchaser the right, but not the obligation, to buy (call) or sell (put) an underlying security or financial instrument at an agreed exercise or strike price between or on certain dates. Options obligate the seller (writer) to buy (put) or sell (call) an underlying instrument at the exercise or strike price or cash settle an underlying derivative instrument if the holder exercises the option on or before the expiration date. OTC options, such as swaptions, which are options where the underlying instrument is a swap, were used to manage exposure to fluctuations in interest rates.
Upon entering into an options contract, a fund will pay or receive a premium. Premiums paid on purchased options are reflected as cost of investments and premiums received on written options are reflected as a liability on the Statement of Assets and Liabilities. Certain options may be purchased or written with premiums to be paid or received on a future date. Options are valued daily and any unrealized appreciation (depreciation) is reflected in total accumulated earnings (loss) in the Statement of Assets and Liabilities. When an option is exercised, the cost or proceeds of the underlying instrument purchased or sold is adjusted by the amount of the premium. When an option is closed, a gain or loss is realized depending on whether the proceeds or amount paid for the closing sale transaction is greater or less than the premium received or paid. When an option expires, gains and losses are realized to the extent of premiums received and paid, respectively. The net realized and unrealized gains (losses) on purchased options are included in the Statement of Operations in net realized gain (loss) and change in net unrealized appreciation (depreciation) on investment securities. The net realized gain (loss) and change in net unrealized appreciation (depreciation) on written options are presented in the Statement of Operations.
Any open options at period end are presented in the Schedule of Investments under the captions "Purchased Options," "Purchased Swaptions," "Written Options" and "Written Swaptions," as applicable, and are representative of volume of activity during the period unless an average notional amount is presented.
Writing puts and buying calls tend to increase exposure to the underlying instrument while buying puts and writing calls tend to decrease exposure to the underlying instrument. For purchased options, risk of loss is limited to the premium paid, and for written options, risk of loss is the change in value in excess of the premium received.
Swaps. A swap is a contract between two parties to exchange future cash flows at periodic intervals based on a notional principal amount. A centrally cleared swap is a transaction executed between a fund and a dealer counterparty, then cleared by a futures commission merchant (FCM) through a clearinghouse. Once cleared, the clearinghouse serves as a central counterparty, with whom a fund exchanges cash flows for the life of the transaction, similar to transactions in futures contracts.
Centrally cleared swaps require a fund to deposit either cash or securities (initial margin) with the FCM, at the instruction of and for the benefit of the clearinghouse. Any securities deposited to meet initial margin requirements are identified in the Schedule of Investments. Any cash deposited to meet initial margin requirements is presented in segregated cash with brokers for derivative instruments in the Statement of Assets and Liabilities. Centrally cleared swaps are marked-to-market daily and subsequent payments (variation margin) are made or received depending on the daily fluctuations in the value of the swaps and are recorded as unrealized appreciation or (depreciation). These daily payments, if any, are included in receivable or payable for daily variation margin on centrally cleared swaps in the Statement of Assets and Liabilities. Any premiums for centrally cleared swaps are recorded periodically throughout the term of the swap to variation margin and included in total accumulated earnings (loss) in the Statement of Assets and Liabilities. Any premiums are recognized as realized gain (loss) upon termination or maturity of the swap.
Payments are exchanged at specified intervals, accrued daily commencing with the effective date of the contract and recorded as realized gain or (loss). Some swaps may be terminated prior to the effective date and realize a gain or loss upon termination. The net realized gain (loss) and change in net unrealized appreciation (depreciation) on swaps during the period is presented in the Statement of Operations.
Any open swaps at period end are included in the Schedule of Investments under the caption "Swaps", and are representative of volume of activity during the period unless an average notional amount is presented.
Interest Rate Swaps. Interest rate swaps are agreements between counterparties to exchange cash flows, one based on a fixed rate, and the other on a floating rate. A fund enters into interest rate swaps to manage its exposure to interest rate changes. Changes in interest rates can have an effect on both the value of bond holdings as well as the amount of interest income earned. In general, the value of bonds can fall when interest rates rise and can rise when interest rates fall.
5. Purchases and Sales of Investments.
Purchases and sales of securities, other than short-term securities, U.S. government securities and in-kind transactions, as applicable, are noted in the table below.
| | Purchases ($) | Sales ($) |
| VIP Strategic Income Portfolio | 398,206,995 | 418,076,325 |
6. Fees and Other Transactions with Affiliates.
Management Fee. Fidelity Management & Research Company LLC (the investment adviser) and its affiliates provide the Fund with investment management related services for which the Fund pays a monthly management fee.
Effective March 1, 2024, the Fund's management contract was amended to incorporate administrative services previously covered under separate services agreements (Transfer Agent and Accounting agreements). The amended contract incorporates a management fee rate that may vary by class. The investment adviser or an affiliate pays certain expenses of managing and operating the Fund out of each class's management fee. Each class of the Fund pays a management fee to the investment adviser. The management fee is calculated and paid to the investment adviser every month. When determining a class's management fee, a mandate rate is calculated based on the monthly average net assets of a group of funds advised by FMR within a designated asset class. A discount rate is subtracted from the mandate rate once the Fund's monthly average net assets reach a certain level. The mandate rate and discount rate may vary by class. The annual management fee rate for a class of shares of the Fund is the lesser of (1) the class's mandate rate reduced by the class's discount rate (if applicable) or (2) the amount set forth in the following table.
| | Maximum Management Fee Rate % |
| Initial Class | .63 |
| Service Class | .63 |
| Service Class 2 | .63 |
| Investor Class | .66 |
One-twelfth of the management fee rate for a class is applied to the average net assets of the class for the month, giving a dollar amount which is the management fee for the class for that month. A different management fee rate may be applicable to each class of the Fund. The difference between classes is the result of separate arrangements for class-level services and/or waivers of certain expenses. It is not the result of any difference in advisory or custodial fees or other expenses related to the management of the Fund's assets, which do not vary by class. For the portion of the reporting period on or after March 1, 2024, the total annualized management fee rates were as follows:
| | Total Management Fee Rate % |
| Initial Class | .63 |
| Service Class | .63 |
| Service Class 2 | .63 |
| Investor Class | .66 |
Prior to March 1, 2024, the management fee was the sum of an individual fund fee rate that was based on an annual rate of .45% of the Fund's average net assets and an annualized group fee rate that averaged .10% during the period. The group fee rate was based upon the monthly average net assets of a group of registered investment companies with which the investment adviser has management contracts. The group fee rate decreased as assets under management increased and increased as assets under management decreased. For the portion of the reporting period prior to March 1, 2024, the total annualized management fee rate was .55%.
Effective March 1, 2024, the Fund's sub-advisory agreements with FMR Investment Management (UK) Limited, Fidelity Management & Research (Hong Kong) Limited, and Fidelity Management & Research (Japan) Limited were amended to provide that the investment adviser pays each sub-adviser monthly fees equal to 110% of the sub-adviser's costs for providing sub-advisory services.
Effective March 1, 2024, the Fund's sub-advisory agreement with FIL Investment Advisors (FIA) was amended to provide that the investment adviser pays FIA monthly fees at an annual rate of 0.30% with respect to the average daily net assets of the Fund managed by FIA. FIA in turn pays FIA(UK).
Distribution and Service Plan Fees. In accordance with Rule 12b-1 of the 1940 Act, the Fund has adopted separate 12b-1 Plans for each Service Class of shares. Each Service Class pays Fidelity Distributors Company LLC (FDC), an affiliate of the investment adviser, a service fee. For the period, the service fee is based on an annual rate of .10% of Service Class' average net assets and .25% of Service Class 2's average net assets.
For the period, total fees, all of which were re-allowed to insurance companies for the distribution of shares and providing shareholder support services, were as follows:
| Service Class | $692 |
| Service Class 2 | 715,431 |
| | $716,123 |
Transfer Agent Fees. Fidelity Investments Institutional Operations Company LLC (FIIOC), an affiliate of the investment adviser, is the Fund's transfer, dividend disbursing, and shareholder servicing agent. Effective March 1, 2024, the Fund's management contract was amended to incorporate transfer agent services and associated fees previously covered under a separate services agreement.
During the period, January 1, 2024 through February 29, 2024, the transfer agent fees for each class were a fixed annual rate of class-level average net assets as follows:
| | Amount ($) | % of Class-Level Average Net Assets |
| Initial Class | 8,550 | .0680 |
| Service Class | 151 | .0680 |
| Service Class 2 | 63,152 | .0680 |
| Investor Class | 129,905 | .1020 |
| | 201,758 | |
Accounting Fees. Fidelity Service Company, Inc. (FSC), an affiliate of the investment adviser, maintains the Fund's accounting records. Effective March 1, 2024, the Fund's management contract was amended to incorporate accounting services and associated fees previously covered under a separate services agreement.
During the period, January 1, 2024 through February 29, 2024, the accounting fees were a fixed annual rate of average net assets as follows:
| | % of Average Net Assets |
| VIP Strategic Income Portfolio | .0341 |
Brokerage Commissions. A portion of portfolio transactions were placed with brokerage firms which are affiliates of the investment adviser. Brokerage commissions are included in net realized gain (loss) and change in net unrealized appreciation (depreciation) in the Statement of Operations. The commissions paid to these affiliated firms were as follows:
| | Amount ($) |
| VIP Strategic Income Portfolio | 192 |
Interfund Trades. Funds may purchase from or sell securities to other Fidelity Funds under procedures adopted by the Board. The procedures have been designed to ensure these interfund trades are executed in accordance with Rule 17a-7 of the 1940 Act. Any interfund trades are included within the respective purchases and sales amounts shown in the Purchases and Sales of Investments note. Interfund trades during the period are noted in the table below.
| | Purchases ($) | Sales ($) | Realized Gain (Loss)($) |
| VIP Strategic Income Portfolio | 1,829,208 | 1,257,456 | 149,211 |
7. Committed Line of Credit.
Certain Funds participate with other funds managed by the investment adviser or an affiliate in a $4.25 billion credit facility (the "line of credit") to be utilized for temporary or emergency purposes to fund shareholder redemptions or for other short-term liquidity purposes. The participating funds have agreed to pay commitment fees on their pro-rata portion of the line of credit, which are reflected in Miscellaneous expenses on the Statement of Operations, and are listed below. During the period, there were no borrowings on this line of credit.
| | Amount ($) |
| VIP Strategic Income Portfolio | 1,308 |
8. Security Lending.
Funds lend portfolio securities from time to time in order to earn additional income. Lending agents are used, including National Financial Services (NFS), an affiliate of the investment adviser. Pursuant to a securities lending agreement, NFS will receive a fee, which is capped at 9.9% of a fund's daily lending revenue, for its services as lending agent. A fund may lend securities to certain qualified borrowers, including NFS. On the settlement date of the loan, a fund receives collateral (in the form of U.S. Treasury obligations, letters of credit and/or cash) against the loaned securities and maintains collateral in an amount not less than 100% of the market value of the loaned securities during the period of the loan. The market value of the loaned securities is determined at the close of business of a fund and any additional required collateral is delivered to a fund on the next business day. A fund or borrower may terminate the loan at any time, and if the borrower defaults on its obligation to return the securities loaned because of insolvency or other reasons, a fund may apply collateral received from the borrower against the obligation. A fund may experience delays and costs in recovering the securities loaned. Any cash collateral received is invested in the Fidelity Securities Lending Cash Central Fund. Any loaned securities are identified as such in the Schedule of Investments, and the value of loaned securities and cash collateral at period end, as applicable, are presented in the Statement of Assets and Liabilities. Security lending income represents the income earned on investing cash collateral, less rebates paid to borrowers and any lending agent fees associated with the loan, plus any premium payments received for lending certain types of securities. Security lending income is presented in the Statement of Operations as a component of income from Fidelity Central Funds. Affiliated security lending activity, if any, was as follows:
| | Total Security Lending Fees Paid to NFS ($) | Security Lending Income From Securities Loaned to NFS ($) | Value of Securities Loaned to NFS at Period End ($) |
| VIP Strategic Income Portfolio | 23 | - | - |
9. Expense Reductions.
Through arrangements with the Fund's custodian, credits realized as a result of certain uninvested cash balances were used to reduce the Fund's expenses. During the period, custodian credits reduced the Fund's expenses by $25,470.
In addition, during the period the investment adviser or an affiliate reimbursed and/or waived a portion of fund-level operating expenses in the amount of $39,905.
10. Distributions to Shareholders.
Distributions to shareholders of each class were as follows:
| | Six months ended June 30, 2024 | Year ended December 31, 2023 |
| VIP Strategic Income Portfolio | | |
| Distributions to shareholders | | |
| Initial Class | $28,976 | $3,335,055 |
| Service Class | 516 | 57,420 |
| Service Class 2 | 218,402 | 23,409,961 |
| Investor Class | 294,712 | 33,567,391 |
Total | $542,606 | $60,369,827 |
11. Share Transactions.
Transactions for each class of shares were as follows and may contain in-kind transactions:
| | Shares | Shares | Dollars | Dollars |
| | Six months ended June 30, 2024 | Year ended December 31, 2023 | Six months ended June 30, 2024 | Year ended December 31, 2023 |
| VIP Strategic Income Portfolio | | | | |
| Initial Class | | | | |
| Shares sold | 412,172 | 1,126,735 | $4,348,538 | $11,661,824 |
| Reinvestment of distributions | 2,773 | 323,478 | 28,976 | 3,335,055 |
| Shares redeemed | (529,747) | (1,291,573) | (5,592,560) | (13,368,273) |
| Net increase (decrease) | (114,802) | 158,640 | $(1,215,046) | $1,628,606 |
| Service Class | | | | |
| Shares sold | 14,178 | 22,215 | $149,546 | $228,491 |
| Reinvestment of distributions | 41 | 4,609 | 430 | 47,426 |
| Shares redeemed | (9,760) | (41,831) | (102,743) | (428,837) |
| Net increase (decrease) | 4,459 | (15,007) | $47,233 | $(152,920) |
| Service Class 2 | | | | |
| Shares sold | 4,469,616 | 6,808,643 | $46,585,507 | $69,518,676 |
| Reinvestment of distributions | 21,184 | 2,299,603 | 218,402 | 23,409,961 |
| Shares redeemed | (3,015,963) | (6,054,876) | (31,433,215) | (61,741,063) |
| Net increase (decrease) | 1,474,837 | 3,053,370 | $15,370,694 | $31,187,574 |
| Investor Class | | | | |
| Shares sold | 1,286,342 | 2,067,578 | $13,542,520 | $21,381,691 |
| Reinvestment of distributions | 28,338 | 3,271,676 | 294,712 | 33,567,391 |
| Shares redeemed | (3,573,848) | (10,723,998) | (37,593,583) | (109,974,962) |
| Net increase (decrease) | (2,259,168) | (5,384,744) | $(23,756,351) | $(55,025,880) |
12. Other.
A fund's organizational documents provide former and current trustees and officers with a limited indemnification against liabilities arising in connection with the performance of their duties to the fund. In the normal course of business, a fund may also enter into contracts that provide general indemnifications. A fund's maximum exposure under these arrangements is unknown as this would be dependent on future claims that may be made against a fund. The risk of material loss from such claims is considered remote.
At the end of the period, the investment adviser or its affiliates were owners of record of more than 10% and certain otherwise unaffiliated shareholders each were owners of record of more than 10% of the outstanding shares as follows:
| Fund | Affiliated % | Number of Unaffiliated Shareholders | Unaffiliated Shareholders % |
| VIP Strategic Income Portfolio | 56% | 2 | 23% |
13. Credit Risk.
The Fund's relatively large investment in countries with limited or developing capital markets may involve greater risks than investments in more developed markets and the prices of such investments may be volatile. The yields of emerging market debt obligations reflect, among other things, perceived credit risk. The consequences of political, social or economic changes in these markets may have disruptive effects on the market prices of the Fund's investments and the income they generate, as well as the Fund's ability to repatriate such amounts.
14. Risk and Uncertainties.
Many factors affect a fund's performance. Developments that disrupt global economies and financial markets, such as pandemics, epidemics, outbreaks of infectious diseases, war, terrorism, and environmental disasters, may significantly affect a fund's investment performance. The effects of these developments to a fund will be impacted by the types of securities in which a fund invests, the financial condition, industry, economic sector, and geographic location of an issuer, and a fund's level of investment in the securities of that issuer. Significant concentrations in security types, issuers, industries, sectors, and geographic locations may magnify the factors that affect a fund's performance.
Item 8: Changes in and Disagreements with Accountants for Open-End Management Investment Companies
Note: This is not applicable for any fund included in this document.
Item 9: Proxy Disclosures for Open-End Management Investment Companies
Note: This is not applicable for any fund included in this document.
Item 10: Remuneration Paid to Directors, Officers, and others of Open-End Management Investment Companies
Note: This information is disclosed as part of the financial statements for each Fund as part of Item 7: Financial Statements and Financial Highlights for Open-End Management Investment companies.
Item 11: Statement Regarding Basis for Approval of Investment Advisory Contract
Board Approval of Investment Advisory Contracts
VIP Strategic Income Portfolio
At its January 2024 meeting, the Board of Trustees, including the Independent Trustees (together, the Board), approved an amended and restated management contract with Fidelity Management & Research Company LLC (FMR) (the Management Contract), and amended and restated sub-advisory agreements (the Sub-Advisory Contracts, and together with the Management Contract, the Advisory Contracts) for the fund, including the fund's sub-advisory agreements with FMR Investment Management (UK) Limited (FMR UK), Fidelity Management & Research (Hong Kong) Limited (FMR H.K.), Fidelity Management & Research (Japan) Limited (FMR Japan), and FIL Investment Advisors (FIL). The Advisory Contracts will be effective March 1, 2024. The Board will consider the annual renewal of the fund's Advisory Contracts in September 2024, following its review of additional materials provided by FMR.
Management Contract. The Board approved the Management Contract, which implements a new fee structure combining the management fee, transfer agent fee (TA Fee), and pricing and bookkeeping fee (P&B Fee) of the fund and each class into a single class-level fee based on tiered schedules and subject to a maximum class-level rate (the Unified Fee). In exchange for the Unified Fee, the fund will receive investment advisory, management, administrative, transfer agent, pricing and bookkeeping services under a single agreement - the Management Contract.
In its consideration of the Management Contract over several meetings, the Board received, reviewed and discussed a comprehensive set of analyses regarding the Unified Fee including (i) the legal framework, (ii) design goals for the Unified Fee, (iii) calculation methodology for the Unified Fee and illustrative examples, (iv) annual and cumulative projected impacts under various scenarios, both in the aggregate and at the fund/class level, (v) explanations of schedules, rate levers and maximum rates and (vi) shareholder benefits and projected savings.
The Board considered that the maximum Unified Fee for each class of the fund would be no higher than the sum of (i) the lowest contractual management fee under the fund's existing management contract, which is the individual fund fee, if any, plus the lowest contractual marginal group fee rate and (ii) the TA and P&B Fee rates, which are fixed fee rates since December 1, 2023 (together, the "Unified Fee Cap"). The Board noted that, as a result of this Unified Fee Cap, the Unified Fee would be no greater than the fees previously authorized to be charged for the same services. The Board noted that certain expenses such as third-party expenses, Rule 12b-1 fees, and certain other miscellaneous expenses would be outside the scope of the Unified Fee and the calculation of such fees would not change as a result of the Unified Fee. The Board considered that, under the Management Contract, a different management fee rate will be applicable to each class of the fund. The Board noted that Fidelity has represented that the difference in expenses between classes is based on differences in class-specific expenses and not due to any difference in advisory or third-party custodial fees or other expenses related to the management of the fund's assets.
The Board considered that implementation of the Unified Fee, which includes the Unified Fee Cap, would cause all funds subject to a Unified Fee, including the fund, to experience an immediate reduction on contractual fee rates for services provided under the current management contracts. The Board considered that some funds would not experience lower fees as a result of existing fee caps. The Board further considered that, in addition to the contractual fee savings, the Unified Fee offers funds and their shareholders greater protection from future rate increases for services previously offered under separate agreements that are now covered by the Management Contract because such rate increases would require shareholder, as well as Board, approval.
Sub-Advisory Contracts. In connection with the Unified Fee changes, the Board considered the Sub-Advisory Contracts, which changed the arrangements for fees paid by FMR to the sub-advisers under the agreements. The Board noted that the agreements with FMR UK, FMR H.K., and FMR Japan were amended to provide that FMR will compensate each sub-adviser at a fee equal to 110% of the sub-adviser's costs incurred in providing services under the agreement. The Board further noted that the agreement with FIL was amended to provide that FMR will compensate FIL at a flat fee rate of 0.30% of the net assets sub-advised by it. The Board considered that, under the Sub-Advisory Contracts, FMR, and not the fund, will continue to pay the sub-advisory fees to each applicable sub-adviser.
The Board considered that the approval of the fund's Advisory Contracts will not result in any changes in the investment process or strategies employed in the management of the fund's assets or the day-to-day management of the fund or the persons primarily responsible for such management. Further, the Board considered that the Management Contract would not change the obligations and services of FMR and its affiliates on behalf of the fund, and, in particular, there would be no change in the nature and level of advisory, management, administration, transfer agent, and pricing and bookkeeping services provided to the fund by FMR and its affiliates.
In connection with its consideration of future renewals of the fund's Advisory Contracts, the Board will consider: (i) the nature, extent and quality of services provided to the funds, including shareholder and administrative services and investment performance; (ii) the competitiveness of the management fee and total expenses for the fund; (iii) the costs of the services and profitability, including the revenues earned and the expenses incurred in conducting the business of developing, marketing, distributing, managing, administering, and servicing the fund and its shareholders, to the extent applicable; and (iv) whether there have been economies of scale in respect of the Fidelity funds, whether the Fidelity funds (including the fund) have appropriately benefited from any such economies of scale, and whether there is the potential for realization of any further economies.
Based on its evaluation of all of the conclusions noted above, and after considering all factors it believed relevant, the Board concluded that the fund's management fee structure is fair and reasonable, and that the fund's Advisory Contracts should be approved.
1.803539.120
VIPSI-SANN-0824
Fidelity® Variable Insurance Products:
VIP Bond Index Portfolio
Semi-Annual Report
June 30, 2024
Contents
To view a fund's proxy voting guidelines and proxy voting record for the 12-month period ended June 30, visit http://www.fidelity.com/proxyvotingresults or visit the Securities and Exchange Commission's (SEC) web site at http://www.sec.gov.
You may also call 1-877-208-0098 to request a free copy of the proxy voting guidelines.
Fidelity® Variable Insurance Products are separate account options which are purchased through a variable insurance contract.
BLOOMBERG ® is a trademark and service mark of Bloomberg Finance L.P. and its affiliates (collectively "Bloomberg"). Bloomberg or Bloomberg's licensors own all proprietary rights in the Bloomberg Indices. Neither Bloomberg nor Bloomberg's licensors approves or endorses this material, or guarantees the accuracy or completeness of any information herein, or makes any warranty, express or implied, as to the results to be obtained therefrom and, to the maximum extent allowed by law, neither shall have any liability or responsibility for injury or damages arising in connection therewith.
Standard & Poor's, S&P and S&P 500 are registered service marks of The McGraw-Hill Companies, Inc. and have been licensed for use by Fidelity Distributors Corporation.
Other third-party marks appearing herein are the property of their respective owners.
All other marks appearing herein are registered or unregistered trademarks or service marks of FMR LLC or an affiliated company. © 2024 FMR LLC. All rights reserved.
This report and the financial statements contained herein are submitted for the general information of the shareholders of the Fund. This report is not authorized for distribution to prospective investors in the Fund unless preceded or accompanied by an effective prospectus.
A fund files its complete schedule of portfolio holdings with the SEC for the first and third quarters of each fiscal year on Form N-PORT. Forms N-PORT are available on the SEC's web site at http://www.sec.gov. A fund's Forms N-PORT may be reviewed and copied at the SEC's Public Reference Room in Washington, DC. Information regarding the operation of the SEC's Public Reference Room may be obtained by calling 1-800-SEC-0330.
For a complete list of a fund's portfolio holdings, view the most recent holdings listing, semiannual report, or annual report on Fidelity's web site at http://www.fidelity.com, http://www.institutional.fidelity.com, or http://www.401k.com, as applicable.
NOT FDIC INSURED •MAY LOSE VALUE •NO BANK GUARANTEE
Neither the Fund nor Fidelity Distributors Corporation is a bank.
Item 7: Financial Statements and Financial Highlights for Open-End Management Investment Companies (Semi-Annual Report)
Schedule of Investments June 30, 2024 (Unaudited)
Showing Percentage of Net Assets
| Nonconvertible Bonds - 27.6% |
| | | Principal Amount (a) | Value ($) |
| COMMUNICATION SERVICES - 2.0% | | | |
| Diversified Telecommunication Services - 0.7% | | | |
| AT&T, Inc.: | | | |
| 1.65% 2/1/28 | | 200,000 | 177,607 |
| 2.25% 2/1/32 | | 50,000 | 40,560 |
| 2.75% 6/1/31 | | 300,000 | 256,888 |
| 3.3% 2/1/52 | | 50,000 | 33,202 |
| 3.5% 6/1/41 | | 1,000,000 | 764,001 |
| 3.5% 9/15/53 | | 347,000 | 235,557 |
| 3.55% 9/15/55 | | 340,000 | 229,225 |
| 3.65% 6/1/51 | | 280,000 | 197,773 |
| 3.65% 9/15/59 | | 257,000 | 172,350 |
| 3.8% 2/15/27 | | 43,000 | 41,544 |
| 4.1% 2/15/28 | | 143,000 | 138,017 |
| 4.65% 6/1/44 | | 40,000 | 34,181 |
| Bell Canada: | | | |
| 5.1% 5/11/33 | | 100,000 | 98,069 |
| 5.55% 2/15/54 | | 20,000 | 19,384 |
| Orange SA 9% 3/1/31 (b) | | 180,000 | 214,697 |
| Sprint Capital Corp. 8.75% 3/15/32 | | 120,000 | 144,337 |
| Telefonica Emisiones S.A.U.: | | | |
| 4.103% 3/8/27 | | 150,000 | 145,604 |
| 5.213% 3/8/47 | | 250,000 | 220,812 |
| TELUS Corp. 3.4% 5/13/32 | | 130,000 | 112,905 |
| Verizon Communications, Inc.: | | | |
| 1.5% 9/18/30 | | 270,000 | 220,330 |
| 2.1% 3/22/28 | | 540,000 | 485,639 |
| 2.355% 3/15/32 | | 9,000 | 7,357 |
| 2.65% 11/20/40 | | 60,000 | 41,327 |
| 2.987% 10/30/56 | | 227,000 | 138,974 |
| 3.55% 3/22/51 | | 500,000 | 359,819 |
| 3.875% 2/8/29 | | 210,000 | 199,594 |
| 4% 3/22/50 | | 114,000 | 88,796 |
| 4.016% 12/3/29 | | 100,000 | 94,514 |
| 4.125% 8/15/46 | | 54,000 | 43,651 |
| 4.272% 1/15/36 | | 276,000 | 250,041 |
| 4.329% 9/21/28 | | 643,000 | 625,219 |
| 5.012% 8/21/54 | | 38,000 | 34,630 |
| 7.75% 12/1/30 | | 60,000 | 68,291 |
| | | | 5,934,895 |
| Entertainment - 0.2% | | | |
| The Walt Disney Co.: | | | |
| 2% 9/1/29 | | 50,000 | 43,457 |
| 2.65% 1/13/31 | | 200,000 | 174,566 |
| 2.75% 9/1/49 | | 100,000 | 63,522 |
| 3.35% 3/24/25 | | 400,000 | 394,036 |
| 3.5% 5/13/40 | | 30,000 | 23,935 |
| 3.6% 1/13/51 | | 30,000 | 22,360 |
| 3.7% 9/15/24 | | 300,000 | 298,745 |
| 3.8% 3/22/30 | | 110,000 | 104,186 |
| 3.8% 5/13/60 | | 30,000 | 22,228 |
| 4.7% 3/23/50 | | 100,000 | 90,347 |
| | | | 1,237,382 |
| Interactive Media & Services - 0.1% | | | |
| Alphabet, Inc.: | | | |
| 1.1% 8/15/30 | | 200,000 | 163,342 |
| 1.9% 8/15/40 | | 264,000 | 171,943 |
| 2.05% 8/15/50 | | 170,000 | 96,665 |
| Meta Platforms, Inc.: | | | |
| 3.5% 8/15/27 | | 60,000 | 57,604 |
| 3.85% 8/15/32 | | 60,000 | 55,779 |
| 4.45% 8/15/52 | | 150,000 | 129,310 |
| 4.6% 5/15/28 | | 70,000 | 69,708 |
| 4.95% 5/15/33 | | 100,000 | 100,501 |
| 5.6% 5/15/53 | | 60,000 | 61,240 |
| | | | 906,092 |
| Media - 0.7% | | | |
| Charter Communications Operating LLC/Charter Communications Operating Capital Corp.: | | | |
| 2.25% 1/15/29 | | 50,000 | 42,734 |
| 3.7% 4/1/51 | | 80,000 | 48,647 |
| 3.75% 2/15/28 | | 100,000 | 92,941 |
| 3.95% 6/30/62 | | 110,000 | 65,169 |
| 4.2% 3/15/28 | | 48,000 | 45,362 |
| 4.8% 3/1/50 | | 100,000 | 73,359 |
| 5.125% 7/1/49 | | 60,000 | 46,056 |
| 5.375% 4/1/38 | | 42,000 | 36,570 |
| 5.375% 5/1/47 | | 190,000 | 151,792 |
| 6.15% 11/10/26 | | 150,000 | 151,450 |
| 6.384% 10/23/35 | | 621,000 | 605,475 |
| Comcast Corp.: | | | |
| 2.35% 1/15/27 | | 260,000 | 243,419 |
| 2.45% 8/15/52 | | 135,000 | 75,996 |
| 2.65% 2/1/30 | | 80,000 | 70,833 |
| 2.8% 1/15/51 | | 180,000 | 111,197 |
| 2.887% 11/1/51 | | 179,000 | 111,677 |
| 2.937% 11/1/56 | | 385,000 | 232,238 |
| 2.987% 11/1/63 | | 305,000 | 178,997 |
| 3.4% 4/1/30 | | 87,000 | 79,979 |
| 3.55% 5/1/28 | | 76,000 | 72,196 |
| 3.75% 4/1/40 | | 31,000 | 25,217 |
| 3.9% 3/1/38 | | 50,000 | 42,377 |
| 4.049% 11/1/52 | | 146,000 | 113,070 |
| 4.55% 1/15/29 | | 110,000 | 108,262 |
| 5.35% 5/15/53 | | 110,000 | 105,447 |
| 5.5% 5/15/64 | | 20,000 | 19,243 |
| Discovery Communications LLC: | | | |
| 3.625% 5/15/30 | | 220,000 | 193,588 |
| 5.2% 9/20/47 | | 18,000 | 13,982 |
| Fox Corp.: | | | |
| 4.709% 1/25/29 | | 34,000 | 33,394 |
| 5.476% 1/25/39 | | 189,000 | 180,191 |
| 5.576% 1/25/49 | | 23,000 | 21,117 |
| Paramount Global: | | | |
| 4.2% 6/1/29 | | 210,000 | 187,002 |
| 4.95% 1/15/31 | | 190,000 | 167,160 |
| 5.85% 9/1/43 | | 363,000 | 285,463 |
| Time Warner Cable LLC 5.5% 9/1/41 | | 351,000 | 292,308 |
| TWDC Enterprises 18 Corp.: | | | |
| 2.95% 6/15/27 | | 98,000 | 92,591 |
| 3% 2/13/26 | | 210,000 | 202,443 |
| 3% 7/30/46 | | 100,000 | 68,010 |
| Warnermedia Holdings, Inc.: | | | |
| 3.755% 3/15/27 | | 100,000 | 94,942 |
| 4.279% 3/15/32 | | 189,000 | 164,964 |
| 5.05% 3/15/42 | | 100,000 | 81,341 |
| 5.141% 3/15/52 | | 175,000 | 136,256 |
| 5.391% 3/15/62 | | 160,000 | 124,876 |
| | | | 5,289,331 |
| Wireless Telecommunication Services - 0.3% | | | |
| America Movil S.A.B. de CV 3.625% 4/22/29 | | 200,000 | 186,326 |
| Rogers Communications, Inc.: | | | |
| 3.8% 3/15/32 | | 130,000 | 116,155 |
| 4.55% 3/15/52 | | 160,000 | 130,621 |
| 5% 3/15/44 | | 20,000 | 17,875 |
| 7.5% 8/15/38 | | 50,000 | 58,165 |
| T-Mobile U.S.A., Inc.: | | | |
| 3% 2/15/41 | | 529,000 | 378,522 |
| 3.5% 4/15/25 | | 410,000 | 403,094 |
| 3.6% 11/15/60 | | 210,000 | 141,946 |
| 3.75% 4/15/27 | | 80,000 | 76,893 |
| 3.875% 4/15/30 | | 80,000 | 74,786 |
| 4.375% 4/15/40 | | 74,000 | 64,125 |
| 4.5% 4/15/50 | | 80,000 | 66,813 |
| 4.8% 7/15/28 | | 125,000 | 123,302 |
| 5.05% 7/15/33 | | 125,000 | 122,289 |
| 5.2% 1/15/33 | | 55,000 | 54,414 |
| 5.65% 1/15/53 | | 55,000 | 54,185 |
| Vodafone Group PLC: | | | |
| 4.375% 5/30/28 | | 97,000 | 94,953 |
| 5.25% 5/30/48 | | 170,000 | 156,620 |
| 6.15% 2/27/37 | | 392,000 | 416,363 |
| | | | 2,737,447 |
TOTAL COMMUNICATION SERVICES | | | 16,105,147 |
| CONSUMER DISCRETIONARY - 1.6% | | | |
| Automobile Components - 0.0% | | | |
| Lear Corp. 5.25% 5/15/49 | | 50,000 | 44,201 |
| Automobiles - 0.3% | | | |
| American Honda Finance Corp.: | | | |
| 1% 9/10/25 | | 220,000 | 208,772 |
| 1.2% 7/8/25 | | 330,000 | 316,149 |
| 4.9% 1/10/34 | | 70,000 | 67,930 |
| 5.125% 7/7/28 | | 60,000 | 60,273 |
| Ford Motor Co.: | | | |
| 3.25% 2/12/32 | | 30,000 | 24,793 |
| 4.75% 1/15/43 | | 30,000 | 24,260 |
| 5.291% 12/8/46 | | 110,000 | 96,240 |
| 6.1% 8/19/32 | | 230,000 | 229,672 |
| General Motors Co.: | | | |
| 5.4% 10/15/29 | | 100,000 | 99,488 |
| 5.4% 4/1/48 | | 40,000 | 35,789 |
| 5.95% 4/1/49 | | 220,000 | 213,520 |
| 6.125% 10/1/25 | | 455,000 | 457,368 |
| 6.75% 4/1/46 | | 69,000 | 72,053 |
| General Motors Financial Co., Inc.: | | | |
| 4.35% 4/9/25 | | 84,000 | 83,092 |
| 5.6% 6/18/31 | | 80,000 | 79,401 |
| 5.65% 1/17/29 | | 250,000 | 251,169 |
| 6.4% 1/9/33 | | 100,000 | 103,785 |
| Honda Motor Co. Ltd. 2.271% 3/10/25 | | 310,000 | 303,168 |
| | | | 2,726,922 |
| Broadline Retail - 0.3% | | | |
| Alibaba Group Holding Ltd.: | | | |
| 2.125% 2/9/31 | | 240,000 | 198,127 |
| 3.15% 2/9/51 | | 245,000 | 155,698 |
| Amazon.com, Inc.: | | | |
| 0.8% 6/3/25 | | 110,000 | 105,579 |
| 1% 5/12/26 | | 6,000 | 5,582 |
| 2.1% 5/12/31 | | 105,000 | 88,459 |
| 2.5% 6/3/50 | | 110,000 | 67,268 |
| 2.7% 6/3/60 | | 160,000 | 94,144 |
| 3.1% 5/12/51 | | 105,000 | 72,152 |
| 3.15% 8/22/27 | | 460,000 | 436,786 |
| 3.875% 8/22/37 | | 440,000 | 388,547 |
| 4.05% 8/22/47 | | 280,000 | 233,112 |
| eBay, Inc.: | | | |
| 4% 7/15/42 | | 40,000 | 32,006 |
| 5.95% 11/22/27 | | 170,000 | 175,122 |
| | | | 2,052,582 |
| Diversified Consumer Services - 0.1% | | | |
| American University 3.672% 4/1/49 | | 130,000 | 100,646 |
| Duke University 2.832% 10/1/55 | | 30,000 | 19,432 |
| George Washington University 4.126% 9/15/48 | | 100,000 | 84,697 |
| Massachusetts Institute of Technology 2.989% 7/1/50 | | 250,000 | 175,698 |
| Northwestern University 3.662% 12/1/57 | | 100,000 | 74,572 |
| Trane Technologies Global Holding Co. Ltd. 3.75% 8/21/28 | | 210,000 | 200,184 |
| University of Chicago 3% 10/1/52 | | 100,000 | 69,585 |
| University of Southern California 2.945% 10/1/51 | | 240,000 | 160,507 |
| | | | 885,321 |
| Hotels, Restaurants & Leisure - 0.3% | | | |
| Expedia Group, Inc.: | | | |
| 3.8% 2/15/28 | | 50,000 | 47,588 |
| 5% 2/15/26 | | 160,000 | 158,781 |
| Marriott International, Inc.: | | | |
| 3.125% 6/15/26 | | 390,000 | 374,206 |
| 4.875% 5/15/29 | | 300,000 | 296,184 |
| McDonald's Corp.: | | | |
| 2.125% 3/1/30 | | 400,000 | 343,336 |
| 2.625% 9/1/29 | | 150,000 | 134,465 |
| 3.3% 7/1/25 | | 32,000 | 31,330 |
| 3.5% 7/1/27 | | 91,000 | 87,207 |
| 3.6% 7/1/30 | | 340,000 | 314,842 |
| 3.625% 5/1/43 | | 20,000 | 15,300 |
| 3.8% 4/1/28 | | 84,000 | 80,659 |
| 4.2% 4/1/50 | | 40,000 | 31,885 |
| 4.7% 12/9/35 | | 109,000 | 103,519 |
| Starbucks Corp.: | | | |
| 2.55% 11/15/30 | | 597,000 | 515,232 |
| 4.5% 11/15/48 | | 50,000 | 41,747 |
| | | | 2,576,281 |
| Household Durables - 0.0% | | | |
| Toll Brothers Finance Corp. 4.35% 2/15/28 | | 60,000 | 57,947 |
| Whirlpool Corp.: | | | |
| 4.75% 2/26/29 | | 160,000 | 157,385 |
| 5.5% 3/1/33 | | 20,000 | 19,719 |
| | | | 235,051 |
| Leisure Products - 0.0% | | | |
| Hasbro, Inc.: | | | |
| 3.55% 11/19/26 | | 190,000 | 181,337 |
| 3.9% 11/19/29 | | 30,000 | 27,669 |
| | | | 209,006 |
| Specialty Retail - 0.5% | | | |
| AutoNation, Inc. 1.95% 8/1/28 | | 100,000 | 86,710 |
| AutoZone, Inc.: | | | |
| 3.625% 4/15/25 | | 62,000 | 61,053 |
| 4% 4/15/30 | | 150,000 | 141,047 |
| 4.75% 2/1/33 | | 40,000 | 38,194 |
| 5.1% 7/15/29 | | 10,000 | 9,959 |
| 5.4% 7/15/34 | | 10,000 | 9,890 |
| Lowe's Companies, Inc.: | | | |
| 3.5% 4/1/51 | | 300,000 | 205,605 |
| 3.65% 4/5/29 | | 80,000 | 75,255 |
| 4.05% 5/3/47 | | 53,000 | 40,948 |
| 5% 4/15/33 | | 470,000 | 462,764 |
| 5.75% 7/1/53 | | 30,000 | 29,545 |
| 5.85% 4/1/63 | | 40,000 | 38,990 |
| O'Reilly Automotive, Inc. 3.6% 9/1/27 | | 260,000 | 247,691 |
| The Home Depot, Inc.: | | | |
| 2.7% 4/15/30 | | 146,000 | 130,068 |
| 2.8% 9/14/27 | | 84,000 | 78,664 |
| 2.95% 6/15/29 | | 686,000 | 628,394 |
| 3.125% 12/15/49 | | 20,000 | 13,647 |
| 3.35% 4/15/50 | | 100,000 | 71,023 |
| 3.5% 9/15/56 | | 50,000 | 35,442 |
| 3.9% 6/15/47 | | 29,000 | 22,874 |
| 4.25% 4/1/46 | | 104,000 | 87,467 |
| 4.5% 12/6/48 | | 90,000 | 77,950 |
| 4.95% 6/25/34 | | 200,000 | 197,915 |
| 5.3% 6/25/54 | | 150,000 | 146,453 |
| 5.875% 12/16/36 | | 110,000 | 116,550 |
| TJX Companies, Inc. 3.875% 4/15/30 | | 687,000 | 651,126 |
| | | | 3,705,224 |
| Textiles, Apparel & Luxury Goods - 0.1% | | | |
| NIKE, Inc.: | | | |
| 2.4% 3/27/25 | | 38,000 | 37,181 |
| 2.85% 3/27/30 | | 570,000 | 513,201 |
| 3.375% 3/27/50 | | 40,000 | 28,821 |
| Tapestry, Inc. 7.85% 11/27/33 | | 110,000 | 115,859 |
| | | | 695,062 |
TOTAL CONSUMER DISCRETIONARY | | | 13,129,650 |
| CONSUMER STAPLES - 1.7% | | | |
| Beverages - 0.4% | | | |
| Anheuser-Busch InBev Worldwide, Inc.: | | | |
| 4.5% 6/1/50 | | 100,000 | 89,362 |
| 4.6% 4/15/48 | | 78,000 | 68,985 |
| 4.6% 6/1/60 | | 50,000 | 43,677 |
| 4.95% 1/15/42 | | 461,000 | 432,629 |
| 5.45% 1/23/39 | | 270,000 | 273,712 |
| 5.55% 1/23/49 | | 130,000 | 130,972 |
| 5.8% 1/23/59 (Reg. S) | | 190,000 | 197,701 |
| Constellation Brands, Inc.: | | | |
| 3.6% 2/15/28 | | 63,000 | 59,741 |
| 3.75% 5/1/50 | | 90,000 | 66,370 |
| 5.25% 11/15/48 | | 50,000 | 46,527 |
| Diageo Capital PLC: | | | |
| 1.375% 9/29/25 | | 200,000 | 190,380 |
| 2% 4/29/30 | | 200,000 | 170,475 |
| Keurig Dr. Pepper, Inc.: | | | |
| 2.55% 9/15/26 | | 50,000 | 47,154 |
| 3.8% 5/1/50 | | 190,000 | 141,399 |
| 5.085% 5/25/48 | | 20,000 | 18,425 |
| Molson Coors Beverage Co. 4.2% 7/15/46 | | 92,000 | 73,524 |
| PepsiCo Singapore Financing I Pte. Ltd. 4.7% 2/16/34 | | 50,000 | 48,751 |
| PepsiCo, Inc.: | | | |
| 1.4% 2/25/31 | | 440,000 | 353,651 |
| 1.625% 5/1/30 | | 267,000 | 223,454 |
| 2.75% 10/21/51 | | 90,000 | 57,142 |
| 4% 5/2/47 | | 116,000 | 94,337 |
| The Coca-Cola Co.: | | | |
| 1.45% 6/1/27 | | 30,000 | 27,402 |
| 1.65% 6/1/30 | | 30,000 | 25,167 |
| 2.5% 6/1/40 | | 30,000 | 21,058 |
| 2.6% 6/1/50 | | 30,000 | 18,631 |
| 2.75% 6/1/60 | | 30,000 | 18,205 |
| 2.875% 5/5/41 | | 150,000 | 110,154 |
| 3.45% 3/25/30 | | 186,000 | 173,945 |
| 4.2% 3/25/50 | | 150,000 | 128,051 |
| 5% 5/13/34 | | 50,000 | 50,166 |
| | | | 3,401,147 |
| Consumer Staples Distribution & Retail - 0.4% | | | |
| Costco Wholesale Corp. 1.375% 6/20/27 | | 395,000 | 358,790 |
| Dollar General Corp.: | | | |
| 3.5% 4/3/30 | | 40,000 | 36,536 |
| 5% 11/1/32 | | 110,000 | 107,186 |
| 5.45% 7/5/33 | | 40,000 | 39,768 |
| Dollar Tree, Inc. 4% 5/15/25 | | 248,000 | 244,384 |
| Kroger Co.: | | | |
| 1.7% 1/15/31 | | 400,000 | 321,986 |
| 2.65% 10/15/26 | | 230,000 | 217,317 |
| 3.7% 8/1/27 | | 100,000 | 96,161 |
| 5.4% 1/15/49 | | 28,000 | 26,492 |
| Sysco Corp.: | | | |
| 3.3% 2/15/50 | | 50,000 | 34,208 |
| 4.45% 3/15/48 | | 52,000 | 43,210 |
| 6.6% 4/1/50 | | 220,000 | 244,859 |
| Target Corp.: | | | |
| 2.25% 4/15/25 | | 508,000 | 495,641 |
| 2.65% 9/15/30 | | 77,000 | 68,236 |
| 2.95% 1/15/52 | | 100,000 | 64,402 |
| 3.9% 11/15/47 | | 40,000 | 31,601 |
| 4% 7/1/42 | | 15,000 | 12,627 |
| Walmart, Inc.: | | | |
| 1.8% 9/22/31 | | 80,000 | 65,915 |
| 3.05% 7/8/26 | | 10,000 | 9,664 |
| 3.625% 12/15/47 | | 20,000 | 15,493 |
| 3.7% 6/26/28 | | 170,000 | 164,885 |
| 3.9% 4/15/28 | | 250,000 | 243,578 |
| 3.95% 6/28/38 | | 150,000 | 134,479 |
| 4.05% 6/29/48 | | 80,000 | 66,435 |
| 4.1% 4/15/33 | | 350,000 | 333,456 |
| 4.5% 4/15/53 | | 70,000 | 61,958 |
| | | | 3,539,267 |
| Food Products - 0.4% | | | |
| Archer Daniels Midland Co.: | | | |
| 2.5% 8/11/26 | | 450,000 | 426,435 |
| 4.5% 8/15/33 | | 100,000 | 94,993 |
| Campbell Soup Co.: | | | |
| 4.15% 3/15/28 | | 80,000 | 77,476 |
| 4.8% 3/15/48 | | 60,000 | 52,395 |
| Conagra Brands, Inc.: | | | |
| 4.85% 11/1/28 | | 190,000 | 186,734 |
| 5.3% 11/1/38 | | 13,000 | 12,235 |
| 5.4% 11/1/48 | | 60,000 | 55,257 |
| General Mills, Inc.: | | | |
| 2.875% 4/15/30 | | 40,000 | 35,480 |
| 3% 2/1/51 | | 80,000 | 50,921 |
| 4.2% 4/17/28 | | 89,000 | 86,204 |
| Kellanova: | | | |
| 3.25% 4/1/26 | | 200,000 | 192,901 |
| 4.5% 4/1/46 | | 32,000 | 26,645 |
| Kraft Heinz Foods Co.: | | | |
| 3.75% 4/1/30 | | 220,000 | 205,393 |
| 4.375% 6/1/46 | | 140,000 | 113,859 |
| 4.625% 10/1/39 | | 100,000 | 88,580 |
| 5% 7/15/35 | | 150,000 | 145,519 |
| McCormick & Co., Inc. 2.5% 4/15/30 | | 110,000 | 95,329 |
| Mondelez International, Inc. 4.125% 5/7/28 | | 270,000 | 262,202 |
| Pilgrim's Pride Corp. 3.5% 3/1/32 | | 100,000 | 85,044 |
| The J.M. Smucker Co. 6.2% 11/15/33 | | 270,000 | 283,555 |
| Tyson Foods, Inc.: | | | |
| 4% 3/1/26 | | 170,000 | 165,959 |
| 4.875% 8/15/34 | | 70,000 | 65,921 |
| 5.1% 9/28/48 | | 50,000 | 43,607 |
| Unilever Capital Corp.: | | | |
| 1.375% 9/14/30 | | 135,000 | 110,005 |
| 2% 7/28/26 | | 280,000 | 263,138 |
| | | | 3,225,787 |
| Household Products - 0.2% | | | |
| Colgate-Palmolive Co. 3.1% 8/15/27 | | 430,000 | 409,377 |
| Kimberly-Clark Corp.: | | | |
| 1.05% 9/15/27 | | 110,000 | 97,543 |
| 3.05% 8/15/25 | | 490,000 | 478,672 |
| 3.1% 3/26/30 | | 22,000 | 20,121 |
| 6.625% 8/1/37 | | 40,000 | 45,492 |
| Procter & Gamble Co.: | | | |
| 3% 3/25/30 | | 105,000 | 96,612 |
| 3.55% 3/25/40 | | 160,000 | 133,658 |
| | | | 1,281,475 |
| Personal Care Products - 0.0% | | | |
| Estee Lauder Companies, Inc.: | | | |
| 1.95% 3/15/31 | | 200,000 | 164,421 |
| 4.375% 6/15/45 | | 70,000 | 59,268 |
| Kenvue, Inc.: | | | |
| 4.9% 3/22/33 | | 65,000 | 64,285 |
| 5.05% 3/22/28 | | 65,000 | 65,355 |
| 5.05% 3/22/53 | | 65,000 | 61,311 |
| 5.2% 3/22/63 | | 20,000 | 18,879 |
| | | | 433,519 |
| Tobacco - 0.3% | | | |
| Altria Group, Inc.: | | | |
| 2.625% 9/16/26 | | 110,000 | 103,673 |
| 3.4% 5/6/30 | | 300,000 | 271,424 |
| 3.875% 9/16/46 | | 38,000 | 27,369 |
| 4.45% 5/6/50 | | 80,000 | 61,435 |
| 4.8% 2/14/29 | | 120,000 | 118,022 |
| 5.8% 2/14/39 | | 100,000 | 100,056 |
| 5.95% 2/14/49 | | 30,000 | 29,415 |
| 6.2% 11/1/28 | | 70,000 | 72,587 |
| BAT Capital Corp.: | | | |
| 3.557% 8/15/27 | | 130,000 | 123,482 |
| 4.39% 8/15/37 | | 521,000 | 439,631 |
| 4.54% 8/15/47 | | 213,000 | 164,007 |
| 6.343% 8/2/30 | | 40,000 | 41,701 |
| Philip Morris International, Inc.: | | | |
| 3.125% 3/2/28 | | 54,000 | 50,393 |
| 4.375% 11/15/41 | | 265,000 | 222,885 |
| 4.875% 2/15/28 | | 30,000 | 29,738 |
| 5.125% 2/15/30 | | 190,000 | 189,317 |
| 5.375% 2/15/33 | | 100,000 | 99,292 |
| 6.375% 5/16/38 | | 100,000 | 107,420 |
| | | | 2,251,847 |
TOTAL CONSUMER STAPLES | | | 14,133,042 |
| ENERGY - 1.7% | | | |
| Energy Equipment & Services - 0.0% | | | |
| Baker Hughes Co. 4.08% 12/15/47 | | 172,000 | 137,542 |
| Halliburton Co. 4.5% 11/15/41 | | 100,000 | 86,407 |
| NOV, Inc. 3.6% 12/1/29 | | 110,000 | 101,178 |
| | | | 325,127 |
| Oil, Gas & Consumable Fuels - 1.7% | | | |
| Apache Corp. 5.25% 2/1/42 | | 100,000 | 85,922 |
| Canadian Natural Resources Ltd.: | | | |
| 3.85% 6/1/27 | | 558,000 | 536,669 |
| 4.95% 6/1/47 | | 19,000 | 16,487 |
| Cenovus Energy, Inc. 5.4% 6/15/47 | | 74,000 | 68,110 |
| Cheniere Corpus Christi Holdings LLC 3.7% 11/15/29 | | 70,000 | 64,680 |
| Cheniere Energy Partners LP 4.5% 10/1/29 | | 150,000 | 142,896 |
| Chevron Corp.: | | | |
| 1.554% 5/11/25 | | 80,000 | 77,446 |
| 1.995% 5/11/27 | | 80,000 | 73,917 |
| 2.236% 5/11/30 | | 80,000 | 69,246 |
| 2.978% 5/11/40 | | 80,000 | 60,110 |
| 3.078% 5/11/50 | | 80,000 | 54,605 |
| Chevron U.S.A., Inc.: | | | |
| 3.85% 1/15/28 | | 55,000 | 53,368 |
| 4.95% 8/15/47 | | 30,000 | 28,323 |
| Columbia Pipeline Group, Inc. 5.8% 6/1/45 | | 20,000 | 19,510 |
| ConocoPhillips Co.: | | | |
| 5.7% 9/15/63 | | 50,000 | 49,679 |
| 5.95% 3/15/46 | | 86,000 | 89,427 |
| 6.5% 2/1/39 | | 260,000 | 285,795 |
| Continental Resources, Inc. 4.9% 6/1/44 | | 30,000 | 24,522 |
| Devon Energy Corp. 5% 6/15/45 | | 100,000 | 85,242 |
| Diamondback Energy, Inc. 4.25% 3/15/52 | | 120,000 | 92,972 |
| Eastern Gas Transmission & Storage, Inc. 3.9% 11/15/49 | | 60,000 | 42,388 |
| Enbridge Energy Partners LP 5.875% 10/15/25 | | 76,000 | 76,180 |
| Enbridge, Inc.: | | | |
| 2.5% 8/1/33 | | 100,000 | 79,360 |
| 5.5% 12/1/46 | | 60,000 | 57,451 |
| 5.625% 4/5/34 | | 140,000 | 139,770 |
| 5.7% 3/8/33 | | 220,000 | 221,730 |
| 8.5% 1/15/84 (b) | | 40,000 | 43,121 |
| Energy Transfer LP: | | | |
| 5% 5/15/50 | | 160,000 | 135,811 |
| 5.8% 6/15/38 | | 70,000 | 68,517 |
| 6% 6/15/48 | | 356,000 | 343,033 |
| 6.25% 4/15/49 | | 50,000 | 49,739 |
| 6.55% 12/1/33 | | 170,000 | 180,162 |
| Enterprise Products Operating LP: | | | |
| 3.125% 7/31/29 | | 70,000 | 64,106 |
| 3.95% 2/15/27 | | 85,000 | 82,579 |
| 4.2% 1/31/50 | | 418,000 | 335,174 |
| 4.25% 2/15/48 | | 105,000 | 85,825 |
| 5.25% 8/16/77 (b) | | 100,000 | 95,632 |
| 5.35% 1/31/33 | | 100,000 | 100,839 |
| 7.55% 4/15/38 | | 20,000 | 23,633 |
| EOG Resources, Inc. 4.375% 4/15/30 | | 510,000 | 497,675 |
| EQT Corp. 7% 2/1/30 | | 90,000 | 95,510 |
| Equinor ASA: | | | |
| 3.125% 4/6/30 | | 357,000 | 325,567 |
| 3.25% 11/18/49 | | 160,000 | 111,943 |
| 3.625% 9/10/28 | | 120,000 | 114,592 |
| Exxon Mobil Corp.: | | | |
| 3.452% 4/15/51 | | 330,000 | 238,157 |
| 4.227% 3/19/40 | | 421,000 | 370,016 |
| Hess Corp.: | | | |
| 4.3% 4/1/27 | | 150,000 | 146,256 |
| 7.125% 3/15/33 | | 130,000 | 145,919 |
| Kinder Morgan Energy Partners LP: | | | |
| 5% 8/15/42 | | 100,000 | 87,556 |
| 5% 3/1/43 | | 215,000 | 187,917 |
| Kinder Morgan, Inc.: | | | |
| 4.3% 3/1/28 | | 112,000 | 108,734 |
| 5.2% 6/1/33 | | 250,000 | 242,582 |
| 5.2% 3/1/48 | | 30,000 | 26,599 |
| 7.75% 1/15/32 | | 110,000 | 124,143 |
| Marathon Oil Corp.: | | | |
| 4.4% 7/15/27 | | 240,000 | 234,658 |
| 5.7% 4/1/34 | | 50,000 | 50,906 |
| Marathon Petroleum Corp.: | | | |
| 4.75% 9/15/44 | | 21,000 | 17,905 |
| 5.125% 12/15/26 | | 410,000 | 408,456 |
| MPLX LP: | | | |
| 4.7% 4/15/48 | | 28,000 | 23,031 |
| 4.8% 2/15/29 | | 30,000 | 29,406 |
| 5.5% 2/15/49 | | 310,000 | 285,962 |
| Occidental Petroleum Corp. 6.6% 3/15/46 | | 220,000 | 229,511 |
| ONEOK, Inc.: | | | |
| 3.95% 3/1/50 | | 75,000 | 54,417 |
| 4.45% 9/1/49 | | 40,000 | 31,444 |
| 4.55% 7/15/28 | | 59,000 | 57,539 |
| 5% 3/1/26 | | 72,000 | 71,398 |
| 5.65% 11/1/28 | | 50,000 | 50,751 |
| 6.05% 9/1/33 | | 130,000 | 133,846 |
| 6.1% 11/15/32 | | 220,000 | 227,376 |
| 6.625% 9/1/53 | | 100,000 | 106,714 |
| Ovintiv, Inc.: | | | |
| 6.5% 2/1/38 | | 50,000 | 51,412 |
| 6.625% 8/15/37 | | 50,000 | 52,052 |
| Phillips 66 Co.: | | | |
| 2.15% 12/15/30 | | 70,000 | 58,471 |
| 3.15% 12/15/29 | | 170,000 | 153,825 |
| 3.3% 3/15/52 | | 140,000 | 91,530 |
| 3.9% 3/15/28 | | 94,000 | 90,075 |
| 5.65% 6/15/54 | | 30,000 | 28,816 |
| Pioneer Natural Resources Co.: | | | |
| 1.125% 1/15/26 | | 230,000 | 215,706 |
| 1.9% 8/15/30 | | 19,000 | 15,919 |
| Plains All American Pipeline LP/PAA Finance Corp. 5.15% 6/1/42 | | 100,000 | 88,579 |
| Sabine Pass Liquefaction LLC 4.5% 5/15/30 | | 850,000 | 815,432 |
| Schlumberger Investment SA 4.85% 5/15/33 | | 60,000 | 58,772 |
| Shell International Finance BV: | | | |
| 3.125% 11/7/49 | | 100,000 | 67,849 |
| 3.25% 4/6/50 | | 100,000 | 69,423 |
| 3.75% 9/12/46 | | 70,000 | 54,092 |
| 4.375% 5/11/45 | | 293,000 | 249,765 |
| Spectra Energy Partners LP 3.375% 10/15/26 | | 158,000 | 151,262 |
| Suncor Energy, Inc. 4% 11/15/47 | | 179,000 | 134,839 |
| Targa Resources Corp. 6.125% 3/15/33 | | 250,000 | 256,746 |
| Targa Resources Partners LP/Targa Resources Partners Finance Corp. 5.5% 3/1/30 | | 230,000 | 228,588 |
| The Williams Companies, Inc.: | | | |
| 2.6% 3/15/31 | | 160,000 | 135,153 |
| 3.75% 6/15/27 | | 35,000 | 33,593 |
| 4.85% 3/1/48 | | 83,000 | 71,786 |
| 5.4% 3/2/26 | | 120,000 | 119,884 |
| 5.65% 3/15/33 | | 60,000 | 60,547 |
| TotalEnergies Capital International SA 3.127% 5/29/50 | | 220,000 | 148,339 |
| TotalEnergies Capital SA: | | | |
| 5.15% 4/5/34 | | 40,000 | 40,015 |
| 5.488% 4/5/54 | | 40,000 | 39,446 |
| 5.638% 4/5/64 | | 30,000 | 29,706 |
| TransCanada PipeLines Ltd.: | | | |
| 4.1% 4/15/30 | | 190,000 | 179,268 |
| 7.625% 1/15/39 | | 231,000 | 269,447 |
| Transcontinental Gas Pipe Line Co. LLC: | | | |
| 3.25% 5/15/30 | | 66,000 | 59,553 |
| 3.95% 5/15/50 | | 180,000 | 136,336 |
| Valero Energy Corp.: | | | |
| 2.85% 4/15/25 | | 190,000 | 185,739 |
| 3.65% 12/1/51 | | 100,000 | 68,987 |
| 4.35% 6/1/28 | | 20,000 | 19,354 |
| 6.625% 6/15/37 | | 30,000 | 31,979 |
| Western Midstream Operating LP: | | | |
| 5.25% 2/1/50 | | 20,000 | 17,530 |
| 5.3% 3/1/48 | | 100,000 | 86,342 |
| | | | 13,706,619 |
TOTAL ENERGY | | | 14,031,746 |
| FINANCIALS - 9.7% | | | |
| Banks - 5.4% | | | |
| Banco Santander SA: | | | |
| 1.849% 3/25/26 | | 200,000 | 187,464 |
| 2.749% 12/3/30 | | 200,000 | 166,417 |
| 2.958% 3/25/31 | | 200,000 | 170,930 |
| 5.538% 3/14/30 (b) | | 400,000 | 396,999 |
| 6.607% 11/7/28 | | 200,000 | 210,057 |
| Bank of America Corp.: | | | |
| U.S. Secured Overnight Fin. Rate (SOFR) Index + 1.290% 5.08% 1/20/27 (b)(c) | | 800,000 | 795,199 |
| 0.981% 9/25/25 (b) | | 600,000 | 593,277 |
| 1.197% 10/24/26 (b) | | 924,000 | 871,663 |
| 2.482% 9/21/36 (b) | | 90,000 | 71,736 |
| 2.651% 3/11/32 (b) | | 180,000 | 152,307 |
| 2.676% 6/19/41 (b) | | 200,000 | 139,737 |
| 2.687% 4/22/32 (b) | | 356,000 | 300,863 |
| 2.972% 2/4/33 (b) | | 90,000 | 76,165 |
| 3.419% 12/20/28 (b) | | 220,000 | 206,871 |
| 3.946% 1/23/49 (b) | | 23,000 | 18,104 |
| 3.97% 3/5/29 (b) | | 125,000 | 119,518 |
| 3.974% 2/7/30 (b) | | 60,000 | 56,821 |
| 4% 1/22/25 | | 370,000 | 366,479 |
| 4.083% 3/20/51 (b) | | 220,000 | 175,702 |
| 4.271% 7/23/29 (b) | | 80,000 | 77,081 |
| 4.33% 3/15/50 (b) | | 60,000 | 50,088 |
| 5% 1/21/44 | | 400,000 | 376,302 |
| 5.288% 4/25/34 (b) | | 500,000 | 494,752 |
| 5.872% 9/15/34 (b) | | 260,000 | 267,461 |
| 6.204% 11/10/28 (b) | | 500,000 | 514,914 |
| Bank of Montreal: | | | |
| 3.088% 1/10/37 (b) | | 110,000 | 90,015 |
| 5.266% 12/11/26 | | 300,000 | 299,544 |
| 5.717% 9/25/28 | | 70,000 | 71,416 |
| Bank of Nova Scotia: | | | |
| 1.95% 2/2/27 | | 100,000 | 92,241 |
| 4.588% 5/4/37 (b) | | 50,000 | 45,032 |
| 4.85% 2/1/30 | | 120,000 | 118,072 |
| 5.25% 6/12/28 | | 160,000 | 160,805 |
| Barclays PLC: | | | |
| 2.279% 11/24/27 (b) | | 400,000 | 370,562 |
| 2.852% 5/7/26 (b) | | 516,000 | 503,092 |
| 5.088% 6/20/30 (b) | | 726,000 | 694,092 |
| 5.501% 8/9/28 (b) | | 220,000 | 219,587 |
| Canadian Imperial Bank of Commerce: | | | |
| 3.6% 4/7/32 | | 71,000 | 62,881 |
| 6.092% 10/3/33 | | 102,000 | 105,695 |
| Citigroup, Inc.: | | | |
| 2.976% 11/5/30 (b) | | 270,000 | 240,479 |
| 3.106% 4/8/26 (b) | | 500,000 | 489,856 |
| 3.29% 3/17/26 (b) | | 170,000 | 166,965 |
| 3.52% 10/27/28 (b) | | 205,000 | 193,764 |
| 3.98% 3/20/30 (b) | | 160,000 | 151,042 |
| 4.412% 3/31/31 (b) | | 370,000 | 352,636 |
| 4.6% 3/9/26 | | 550,000 | 541,163 |
| 4.65% 7/23/48 | | 78,000 | 68,045 |
| 5.3% 5/6/44 | | 80,000 | 74,521 |
| 5.316% 3/26/41 (b) | | 617,000 | 594,260 |
| 5.875% 2/22/33 | | 410,000 | 417,396 |
| 6.27% 11/17/33 (b) | | 100,000 | 104,733 |
| Citizens Financial Group, Inc.: | | | |
| 2.5% 2/6/30 | | 30,000 | 25,441 |
| 2.638% 9/30/32 | | 78,000 | 59,839 |
| 2.85% 7/27/26 | | 100,000 | 94,438 |
| Comerica, Inc. 5.982% 1/30/30 (b) | | 50,000 | 49,267 |
| Cooperatieve Rabobank UA/NY 5.041% 3/5/27 | | 300,000 | 299,525 |
| Export-Import Bank of Korea: | | | |
| 2.875% 1/21/25 | | 350,000 | 345,444 |
| 5.125% 9/18/28 | | 380,000 | 385,388 |
| Fifth Third Bancorp: | | | |
| 2.55% 5/5/27 | | 200,000 | 185,227 |
| 5.631% 1/29/32 (b) | | 40,000 | 39,652 |
| 6.361% 10/27/28 (b) | | 120,000 | 122,616 |
| HSBC Holdings PLC: | | | |
| 2.848% 6/4/31 (b) | | 380,000 | 328,489 |
| 2.871% 11/22/32 (b) | | 200,000 | 166,328 |
| 4.292% 9/12/26 (b) | | 1,260,000 | 1,237,859 |
| 5.402% 8/11/33 (b) | | 250,000 | 247,338 |
| 5.597% 5/17/28 (b) | | 290,000 | 291,134 |
| 6.1% 1/14/42 | | 30,000 | 31,912 |
| 6.8% 6/1/38 | | 449,000 | 474,706 |
| 7.39% 11/3/28 (b) | | 220,000 | 232,653 |
| Huntington Bancshares, Inc.: | | | |
| 2.55% 2/4/30 | | 90,000 | 76,942 |
| 4.443% 8/4/28 (b) | | 70,000 | 67,806 |
| 6.208% 8/21/29 (b) | | 130,000 | 132,734 |
| ING Groep NV: | | | |
| 2.727% 4/1/32 (b) | | 200,000 | 168,688 |
| 3.869% 3/28/26 (b) | | 290,000 | 285,782 |
| Japan Bank International Cooperation: | | | |
| 0.625% 7/15/25 | | 750,000 | 714,790 |
| 1.25% 1/21/31 | | 580,000 | 469,644 |
| JPMorgan Chase & Co.: | | | |
| 1.47% 9/22/27 (b) | | 390,000 | 358,212 |
| 1.578% 4/22/27 (b) | | 188,000 | 175,443 |
| 1.953% 2/4/32 (b) | | 250,000 | 203,346 |
| 2.083% 4/22/26 (b) | | 200,000 | 194,212 |
| 2.522% 4/22/31 (b) | | 150,000 | 129,649 |
| 2.545% 11/8/32 (b) | | 40,000 | 33,307 |
| 2.58% 4/22/32 (b) | | 239,000 | 201,857 |
| 2.739% 10/15/30 (b) | | 720,000 | 637,048 |
| 2.95% 10/1/26 | | 224,000 | 213,457 |
| 2.956% 5/13/31 (b) | | 50,000 | 43,821 |
| 3.109% 4/22/51 (b) | | 100,000 | 68,086 |
| 3.54% 5/1/28 (b) | | 660,000 | 629,884 |
| 3.875% 9/10/24 | | 240,000 | 239,062 |
| 3.882% 7/24/38 (b) | | 734,000 | 629,246 |
| 4.005% 4/23/29 (b) | | 43,000 | 41,115 |
| 4.203% 7/23/29 (b) | | 30,000 | 28,871 |
| 4.452% 12/5/29 (b) | | 200,000 | 194,163 |
| 4.565% 6/14/30 (b) | | 470,000 | 456,184 |
| 4.95% 6/1/45 | | 135,000 | 126,364 |
| 5.35% 6/1/34 (b) | | 270,000 | 268,804 |
| 5.717% 9/14/33 (b) | | 120,000 | 121,661 |
| KeyCorp: | | | |
| 2.25% 4/6/27 | | 350,000 | 318,107 |
| 6.401% 3/6/35 (b) | | 50,000 | 50,692 |
| Lloyds Banking Group PLC: | | | |
| 4.45% 5/8/25 | | 200,000 | 197,954 |
| 4.582% 12/10/25 | | 1,518,000 | 1,490,362 |
| 5.721% 6/5/30 (b) | | 500,000 | 504,063 |
| M&T Bank Corp.: | | | |
| 4.553% 8/16/28 (b) | | 170,000 | 162,917 |
| 5.053% 1/27/34 (b) | | 40,000 | 37,020 |
| Mitsubishi UFJ Financial Group, Inc.: | | | |
| 2.193% 2/25/25 | | 740,000 | 723,814 |
| 2.341% 1/19/28 (b) | | 210,000 | 195,127 |
| 3.287% 7/25/27 | | 150,000 | 142,261 |
| 3.751% 7/18/39 | | 290,000 | 242,238 |
| 3.777% 3/2/25 | | 84,000 | 82,920 |
| 4.286% 7/26/38 | | 70,000 | 63,214 |
| 5.242% 4/19/29 (b) | | 200,000 | 200,350 |
| Mizuho Financial Group, Inc.: | | | |
| 1.554% 7/9/27 (b) | | 285,000 | 263,809 |
| 2.226% 5/25/26 (b) | | 400,000 | 387,609 |
| 5.382% 7/10/30 (b)(d) | | 300,000 | 299,477 |
| 5.778% 7/6/29 (b) | | 310,000 | 314,161 |
| National Australia Bank Ltd. 4.966% 1/12/26 | | 260,000 | 258,627 |
| NatWest Group PLC: | | | |
| 3.073% 5/22/28 (b) | | 290,000 | 271,364 |
| 5.583% 3/1/28 (b) | | 300,000 | 300,235 |
| 5.847% 3/2/27 (b) | | 200,000 | 200,467 |
| Oesterreichische Kontrollbank AG 0.375% 9/17/25 | | 83,000 | 78,477 |
| PNC Financial Services Group, Inc.: | | | |
| 1.15% 8/13/26 | | 514,000 | 472,425 |
| 2.2% 11/1/24 | | 70,000 | 69,228 |
| 5.354% 12/2/28 (b) | | 90,000 | 90,067 |
| 5.582% 6/12/29 (b) | | 100,000 | 101,094 |
| 5.676% 1/22/35 (b) | | 150,000 | 150,805 |
| 5.939% 8/18/34 (b) | | 100,000 | 102,497 |
| 6.037% 10/28/33 (b) | | 30,000 | 30,908 |
| Royal Bank of Canada: | | | |
| 0.75% 10/7/24 | | 480,000 | 473,703 |
| 2.55% 7/16/24 | | 360,000 | 359,487 |
| 4.65% 1/27/26 | | 55,000 | 54,223 |
| 5% 5/2/33 | | 130,000 | 128,281 |
| 5.15% 2/1/34 | | 70,000 | 69,462 |
| 6% 11/1/27 | | 100,000 | 102,456 |
| Santander Holdings U.S.A., Inc.: | | | |
| 4.5% 7/17/25 | | 82,000 | 80,814 |
| 6.124% 5/31/27 (b) | | 350,000 | 351,445 |
| 6.565% 6/12/29 (b) | | 100,000 | 102,328 |
| 7.66% 11/9/31 (b) | | 40,000 | 43,353 |
| Santander UK Group Holdings PLC 6.534% 1/10/29 (b) | | 200,000 | 205,453 |
| Sumitomo Mitsui Financial Group, Inc.: | | | |
| 1.474% 7/8/25 | | 400,000 | 384,004 |
| 2.142% 9/23/30 | | 70,000 | 58,368 |
| 2.174% 1/14/27 | | 800,000 | 741,737 |
| 2.348% 1/15/25 | | 200,000 | 196,467 |
| 2.75% 1/15/30 | | 200,000 | 175,468 |
| 3.352% 10/18/27 | | 80,000 | 75,546 |
| 3.364% 7/12/27 | | 80,000 | 75,936 |
| 3.784% 3/9/26 | | 640,000 | 622,981 |
| 6.184% 7/13/43 | | 40,000 | 43,783 |
| The Toronto-Dominion Bank: | | | |
| 1.95% 1/12/27 | | 100,000 | 92,807 |
| 2.45% 1/12/32 | | 90,000 | 74,116 |
| 4.456% 6/8/32 | | 200,000 | 188,478 |
| 5.156% 1/10/28 | | 360,000 | 359,568 |
| Truist Financial Corp.: | | | |
| 1.2% 8/5/25 | | 700,000 | 666,858 |
| 1.267% 3/2/27 (b) | | 29,000 | 26,968 |
| 4.916% 7/28/33 (b) | | 50,000 | 46,279 |
| 5.711% 1/24/35 (b) | | 150,000 | 149,345 |
| 5.867% 6/8/34 (b) | | 100,000 | 100,760 |
| 6.123% 10/28/33 (b) | | 30,000 | 30,677 |
| U.S. Bancorp: | | | |
| 1.375% 7/22/30 | | 210,000 | 169,178 |
| 2.491% 11/3/36 (b) | | 50,000 | 39,364 |
| 3.1% 4/27/26 | | 240,000 | 230,111 |
| 4.839% 2/1/34 (b) | | 150,000 | 142,206 |
| 5.775% 6/12/29 (b) | | 270,000 | 274,088 |
| 5.836% 6/12/34 (b) | | 60,000 | 60,834 |
| 5.85% 10/21/33 (b) | | 70,000 | 71,090 |
| Wachovia Corp. 5.5% 8/1/35 | | 140,000 | 138,095 |
| Wells Fargo & Co.: | | | |
| 2.164% 2/11/26 (b) | | 310,000 | 303,268 |
| 2.188% 4/30/26 (b) | | 340,000 | 330,155 |
| 2.572% 2/11/31 (b) | | 690,000 | 597,174 |
| 3.068% 4/30/41 (b) | | 100,000 | 73,328 |
| 3.584% 5/22/28 (b) | | 82,000 | 78,099 |
| 4.1% 6/3/26 | | 1,194,000 | 1,163,059 |
| 4.75% 12/7/46 | | 157,000 | 132,945 |
| 4.897% 7/25/33 (b) | | 130,000 | 125,042 |
| 5.013% 4/4/51 (b) | | 130,000 | 118,419 |
| 5.375% 2/7/35 | | 100,000 | 99,865 |
| 5.389% 4/24/34 (b) | | 280,000 | 276,799 |
| 5.557% 7/25/34 (b) | | 200,000 | 199,852 |
| 5.574% 7/25/29 (b) | | 200,000 | 201,814 |
| 6.491% 10/23/34 (b) | | 430,000 | 458,404 |
| Westpac Banking Corp.: | | | |
| 2.894% 2/4/30 (b) | | 590,000 | 578,405 |
| 4.11% 7/24/34 (b) | | 320,000 | 295,674 |
| | | | 44,652,943 |
| Capital Markets - 1.7% | | | |
| Ameriprise Financial, Inc.: | | | |
| 2.875% 9/15/26 | | 100,000 | 95,226 |
| 5.15% 5/15/33 | | 40,000 | 40,065 |
| Ares Capital Corp.: | | | |
| 2.15% 7/15/26 | | 234,000 | 216,263 |
| 3.2% 11/15/31 | | 50,000 | 41,234 |
| 5.95% 7/15/29 | | 70,000 | 68,814 |
| Bank of New York Mellon Corp.: | | | |
| 1.8% 7/28/31 | | 80,000 | 64,713 |
| 3.85% 4/28/28 | | 27,000 | 26,030 |
| 4.543% 2/1/29 (b) | | 240,000 | 235,283 |
| 4.975% 3/14/30 (b) | | 150,000 | 149,101 |
| 5.802% 10/25/28 (b) | | 110,000 | 112,077 |
| 6.474% 10/25/34 (b) | | 140,000 | 150,990 |
| Blackrock Funding, Inc. 5.25% 3/14/54 | | 100,000 | 96,636 |
| BlackRock, Inc. 2.1% 2/25/32 | | 50,000 | 40,705 |
| Blackstone Private Credit Fund: | | | |
| 2.7% 1/15/25 | | 160,000 | 157,025 |
| 4.7% 3/24/25 | | 180,000 | 178,211 |
| 5.95% 7/16/29 (e) | | 50,000 | 48,968 |
| 7.3% 11/27/28 (e) | | 50,000 | 51,812 |
| Blue Owl Capital Corp. 5.95% 3/15/29 | | 50,000 | 49,209 |
| Brookfield Finance, Inc.: | | | |
| 2.724% 4/15/31 | | 312,000 | 263,908 |
| 4.85% 3/29/29 | | 80,000 | 78,598 |
| 5.968% 3/4/54 | | 50,000 | 49,449 |
| 6.35% 1/5/34 | | 30,000 | 31,442 |
| Charles Schwab Corp.: | | | |
| 1.65% 3/11/31 | | 70,000 | 56,215 |
| 2% 3/20/28 | | 215,000 | 192,987 |
| 3.2% 3/2/27 | | 350,000 | 333,094 |
| 6.136% 8/24/34 (b) | | 80,000 | 83,307 |
| 6.196% 11/17/29 (b) | | 60,000 | 62,402 |
| CME Group, Inc.: | | | |
| 3.75% 6/15/28 | | 110,000 | 105,939 |
| 5.3% 9/15/43 | | 40,000 | 39,978 |
| Credit Suisse U.S.A., Inc. 7.125% 7/15/32 | | 60,000 | 65,997 |
| Deutsche Bank AG 4.1% 1/13/26 | | 200,000 | 196,449 |
| Deutsche Bank AG New York Branch: | | | |
| 2.311% 11/16/27 (b) | | 150,000 | 138,490 |
| 3.729% 1/14/32 (b) | | 200,000 | 168,625 |
| 4.1% 1/13/26 | | 200,000 | 195,577 |
| Goldman Sachs Group, Inc.: | | | |
| 2.615% 4/22/32 (b) | | 255,000 | 214,393 |
| 3.691% 6/5/28 (b) | | 440,000 | 420,914 |
| 4.017% 10/31/38 (b) | | 887,000 | 754,346 |
| 4.223% 5/1/29 (b) | | 60,000 | 57,757 |
| 4.411% 4/23/39 (b) | | 230,000 | 203,375 |
| 4.75% 10/21/45 | | 28,000 | 25,136 |
| 6.75% 10/1/37 | | 230,000 | 248,131 |
| HPS Corporate Lending Fund: | | | |
| 6.25% 9/30/29 (e) | | 40,000 | 39,554 |
| 6.75% 1/30/29 (e) | | 20,000 | 20,147 |
| Intercontinental Exchange, Inc.: | | | |
| 1.85% 9/15/32 | | 180,000 | 139,524 |
| 2.65% 9/15/40 | | 80,000 | 55,288 |
| 3% 6/15/50 | | 138,000 | 89,760 |
| 3.75% 9/21/28 | | 50,000 | 47,551 |
| 4.6% 3/15/33 | | 240,000 | 228,725 |
| Invesco Finance PLC 3.75% 1/15/26 | | 110,000 | 107,075 |
| Jefferies Financial Group, Inc.: | | | |
| 4.15% 1/23/30 | | 40,000 | 37,157 |
| 4.85% 1/15/27 | | 100,000 | 98,674 |
| 5.875% 7/21/28 | | 140,000 | 141,406 |
| Legg Mason, Inc. 5.625% 1/15/44 | | 20,000 | 19,416 |
| LPL Holdings, Inc. 6.75% 11/17/28 | | 30,000 | 31,504 |
| Moody's Corp. 4.875% 12/17/48 | | 123,000 | 109,615 |
| Morgan Stanley: | | | |
| 2.188% 4/28/26 (b) | | 940,000 | 912,876 |
| 2.699% 1/22/31 (b) | | 230,000 | 201,613 |
| 3.591% 7/22/28 (b) | | 210,000 | 199,689 |
| 3.625% 1/20/27 | | 96,000 | 92,558 |
| 3.772% 1/24/29 (b) | | 300,000 | 285,572 |
| 3.95% 4/23/27 | | 200,000 | 193,153 |
| 3.971% 7/22/38 (b) | | 120,000 | 101,618 |
| 4.375% 1/22/47 | | 148,000 | 126,623 |
| 4.457% 4/22/39 (b) | | 295,000 | 263,670 |
| 5.164% 4/20/29 (b) | | 200,000 | 199,351 |
| 5.25% 4/21/34 (b) | | 420,000 | 413,429 |
| 5.297% 4/20/37 (b) | | 140,000 | 134,052 |
| 5.597% 3/24/51 (b) | | 90,000 | 91,032 |
| 5.948% 1/19/38 (b) | | 80,000 | 79,534 |
| 6.342% 10/18/33 (b) | | 320,000 | 339,677 |
| 6.375% 7/24/42 | | 190,000 | 208,956 |
| NASDAQ, Inc.: | | | |
| 2.5% 12/21/40 | | 100,000 | 65,212 |
| 5.35% 6/28/28 | | 90,000 | 90,817 |
| 5.55% 2/15/34 | | 40,000 | 40,054 |
| 5.95% 8/15/53 | | 8,000 | 8,083 |
| 6.1% 6/28/63 | | 20,000 | 20,341 |
| Nomura Holdings, Inc. 3.103% 1/16/30 | | 623,000 | 550,751 |
| Northern Trust Corp. 1.95% 5/1/30 | | 220,000 | 186,824 |
| S&P Global, Inc.: | | | |
| 2.3% 8/15/60 | | 100,000 | 50,792 |
| 2.45% 3/1/27 | | 590,000 | 551,612 |
| 4.75% 8/1/28 | | 140,000 | 138,986 |
| Sixth Street Specialty Lending, Inc. 6.125% 3/1/29 | | 30,000 | 29,612 |
| State Street Corp.: | | | |
| 1.684% 11/18/27 (b) | | 204,000 | 187,751 |
| 4.821% 1/26/34 (b) | | 100,000 | 96,549 |
| 5.684% 11/21/29 (b) | | 110,000 | 112,559 |
| 6.123% 11/21/34 (b) | | 30,000 | 31,136 |
| UBS Group AG 4.55% 4/17/26 | | 580,000 | 569,951 |
| | | | 13,548,700 |
| Consumer Finance - 0.8% | | | |
| AerCap Ireland Capital Ltd./AerCap Global Aviation Trust: | | | |
| 2.45% 10/29/26 | | 250,000 | 233,208 |
| 2.875% 8/14/24 | | 150,000 | 149,399 |
| 3.85% 10/29/41 | | 150,000 | 117,310 |
| 4.45% 4/3/26 | | 150,000 | 147,234 |
| 4.625% 10/15/27 | | 220,000 | 214,355 |
| 5.3% 1/19/34 | | 150,000 | 146,910 |
| Ally Financial, Inc.: | | | |
| 5.125% 9/30/24 | | 290,000 | 289,261 |
| 5.8% 5/1/25 | | 250,000 | 249,762 |
| 6.848% 1/3/30 (b) | | 120,000 | 123,304 |
| 6.992% 6/13/29 (b) | | 120,000 | 124,521 |
| American Express Co.: | | | |
| 2.5% 7/30/24 | | 219,000 | 219,000 |
| 2.55% 3/4/27 | | 100,000 | 93,464 |
| 3.3% 5/3/27 | | 30,000 | 28,542 |
| 4.05% 12/3/42 | | 160,000 | 133,562 |
| 4.989% 5/26/33 (b) | | 30,000 | 28,902 |
| 5.043% 5/1/34 (b) | | 90,000 | 88,014 |
| Capital One Financial Corp.: | | | |
| 3.75% 7/28/26 | | 70,000 | 67,567 |
| 3.8% 1/31/28 | | 251,000 | 238,616 |
| 5.817% 2/1/34 (b) | | 250,000 | 247,434 |
| 6.377% 6/8/34 (b) | | 100,000 | 102,596 |
| Ford Motor Credit Co. LLC: | | | |
| 6.798% 11/7/28 | | 280,000 | 289,322 |
| 6.8% 5/12/28 | | 310,000 | 319,372 |
| 7.2% 6/10/30 | | 200,000 | 210,383 |
| John Deere Capital Corp.: | | | |
| 2.8% 7/18/29 | | 220,000 | 199,311 |
| 4.75% 6/8/26 | | 740,000 | 735,324 |
| 4.85% 10/11/29 | | 400,000 | 400,000 |
| 5.05% 6/12/34 | | 50,000 | 49,648 |
| Synchrony Financial: | | | |
| 3.95% 12/1/27 | | 150,000 | 140,079 |
| 5.15% 3/19/29 | | 159,000 | 152,672 |
| Toyota Motor Credit Corp.: | | | |
| 3% 4/1/25 | | 580,000 | 569,733 |
| 4.7% 1/12/33 | | 70,000 | 68,053 |
| 4.8% 1/5/34 | | 120,000 | 116,614 |
| 5.45% 11/10/27 | | 380,000 | 385,591 |
| | | | 6,679,063 |
| Financial Services - 1.0% | | | |
| AB Svensk Exportkredit 2.25% 3/22/27 | | 400,000 | 374,386 |
| Aon Corp. / Aon Global Holdings PLC 5.35% 2/28/33 | | 200,000 | 198,654 |
| Berkshire Hathaway, Inc. 4.5% 2/11/43 | | 33,000 | 30,596 |
| Blue Owl Credit Income Corp.: | | | |
| 6.6% 9/15/29 (e) | | 30,000 | 29,593 |
| 6.65% 3/15/31 | | 70,000 | 68,414 |
| BP Capital Markets America, Inc.: | | | |
| 3% 2/24/50 | | 240,000 | 156,195 |
| 3.001% 3/17/52 | | 100,000 | 64,200 |
| 5.227% 11/17/34 | | 90,000 | 89,327 |
| CNH Industrial Capital LLC 5.5% 1/12/29 | | 120,000 | 121,274 |
| Corebridge Financial, Inc.: | | | |
| 3.5% 4/4/25 | | 130,000 | 127,836 |
| 3.85% 4/5/29 | | 80,000 | 74,979 |
| 4.35% 4/5/42 | | 20,000 | 16,445 |
| 5.75% 1/15/34 | | 40,000 | 40,265 |
| 6.875% 12/15/52 (b) | | 100,000 | 100,905 |
| DH Europe Finance II SARL: | | | |
| 2.2% 11/15/24 | | 70,000 | 69,149 |
| 2.6% 11/15/29 | | 80,000 | 71,342 |
| 3.4% 11/15/49 | | 50,000 | 36,056 |
| Equitable Holdings, Inc. 4.35% 4/20/28 | | 360,000 | 347,997 |
| Fedex Corp. 2020-1 Class AA pass-thru Trust equipment trust certificate 1.875% 8/20/35 | | 31,701 | 26,299 |
| Fidelity National Information Services, Inc.: | | | |
| 1.15% 3/1/26 | | 246,000 | 229,170 |
| 2.25% 3/1/31 | | 200,000 | 167,026 |
| Fiserv, Inc.: | | | |
| 2.75% 7/1/24 | | 440,000 | 440,000 |
| 3.5% 7/1/29 | | 80,000 | 73,962 |
| 4.4% 7/1/49 | | 240,000 | 194,771 |
| Global Payments, Inc.: | | | |
| 1.2% 3/1/26 | | 346,000 | 322,044 |
| 4.15% 8/15/49 | | 20,000 | 15,084 |
| 5.4% 8/15/32 | | 140,000 | 137,173 |
| Japan International Cooperation Agency 1.75% 4/28/31 | | 200,000 | 164,632 |
| Jbs U.S.A. Holding Lux/ Jbs U.S.A. F: | | | |
| 3% 5/15/32 | | 100,000 | 82,322 |
| 5.75% 4/1/33 | | 330,000 | 329,212 |
| KfW: | | | |
| 0% 4/18/36 | | 200,000 | 115,761 |
| 0.375% 7/18/25 | | 2,072,000 | 1,973,504 |
| 2.875% 4/3/28 | | 14,000 | 13,220 |
| 4.75% 10/29/30 | | 170,000 | 172,918 |
| MasterCard, Inc.: | | | |
| 2% 11/18/31 | | 240,000 | 197,263 |
| 2.95% 6/1/29 | | 50,000 | 45,952 |
| 3.3% 3/26/27 | | 38,000 | 36,455 |
| 3.35% 3/26/30 | | 53,000 | 49,041 |
| 3.85% 3/26/50 | | 115,000 | 90,705 |
| National Rural Utilities Cooperative Finance Corp.: | | | |
| 4.15% 12/15/32 | | 170,000 | 156,643 |
| 4.85% 2/7/29 | | 100,000 | 99,400 |
| 5.8% 1/15/33 | | 60,000 | 61,660 |
| PayPal Holdings, Inc.: | | | |
| 1.65% 6/1/25 | | 70,000 | 67,544 |
| 2.3% 6/1/30 | | 120,000 | 103,446 |
| 4.4% 6/1/32 | | 100,000 | 95,144 |
| 5.25% 6/1/62 | | 30,000 | 27,381 |
| Sixth Street Lending Partners 6.5% 3/11/29 (e) | | 50,000 | 49,431 |
| The Western Union Co.: | | | |
| 2.85% 1/10/25 | | 70,000 | 68,858 |
| 6.2% 11/17/36 | | 20,000 | 20,336 |
| Visa, Inc.: | | | |
| 1.1% 2/15/31 | | 250,000 | 199,040 |
| 2.05% 4/15/30 | | 350,000 | 300,523 |
| 2.7% 4/15/40 | | 150,000 | 109,298 |
| 4.15% 12/14/35 | | 38,000 | 35,461 |
| | | | 8,288,292 |
| Insurance - 0.8% | | | |
| AFLAC, Inc. 3.6% 4/1/30 | | 224,000 | 208,135 |
| Allstate Corp.: | | | |
| 1.45% 12/15/30 | | 110,000 | 87,836 |
| 5.55% 5/9/35 | | 156,000 | 157,985 |
| American International Group, Inc.: | | | |
| 4.25% 3/15/29 | | 100,000 | 96,241 |
| 4.375% 6/30/50 | | 240,000 | 198,813 |
| 4.5% 7/16/44 | | 25,000 | 21,576 |
| 4.75% 4/1/48 | | 100,000 | 88,109 |
| 5.75% 4/1/48 (b) | | 280,000 | 274,158 |
| Aon Corp. 3.75% 5/2/29 | | 120,000 | 112,618 |
| Aon North America, Inc. 5.45% 3/1/34 | | 250,000 | 248,902 |
| Arch Capital Group Ltd. 7.35% 5/1/34 | | 20,000 | 22,613 |
| Arch Capital Group U.S., Inc. 5.144% 11/1/43 | | 50,000 | 45,850 |
| Arthur J. Gallagher & Co.: | | | |
| 3.5% 5/20/51 | | 50,000 | 34,461 |
| 5.75% 3/2/53 | | 45,000 | 43,631 |
| 6.75% 2/15/54 | | 30,000 | 33,031 |
| Assurant, Inc. 4.9% 3/27/28 | | 60,000 | 59,056 |
| Assured Guaranty U.S. Holdings, Inc. 6.125% 9/15/28 | | 70,000 | 72,073 |
| Athene Holding Ltd.: | | | |
| 3.5% 1/15/31 | | 20,000 | 17,702 |
| 4.125% 1/12/28 | | 84,000 | 81,009 |
| 6.15% 4/3/30 | | 180,000 | 186,294 |
| 6.65% 2/1/33 | | 100,000 | 105,094 |
| Baylor Scott & White Holdings Series 2021, 2.839% 11/15/50 | | 120,000 | 78,365 |
| Berkshire Hathaway Finance Corp.: | | | |
| 1.45% 10/15/30 | | 120,000 | 98,683 |
| 2.85% 10/15/50 | | 220,000 | 141,455 |
| 4.2% 8/15/48 | | 243,000 | 203,935 |
| Brighthouse Financial, Inc.: | | | |
| 3.85% 12/22/51 | | 30,000 | 19,075 |
| 5.625% 5/15/30 | | 80,000 | 80,026 |
| Brown & Brown, Inc. 4.2% 3/17/32 | | 110,000 | 100,400 |
| Chubb INA Holdings, Inc.: | | | |
| 1.375% 9/15/30 | | 350,000 | 285,350 |
| 4.35% 11/3/45 | | 128,000 | 110,448 |
| Fairfax Financial Holdings Ltd.: | | | |
| 5.625% 8/16/32 | | 90,000 | 88,717 |
| 6.1% 3/15/55 (e) | | 70,000 | 67,616 |
| Globe Life, Inc. 2.15% 8/15/30 | | 50,000 | 40,143 |
| Hartford Financial Services Group, Inc.: | | | |
| 4.4% 3/15/48 | | 70,000 | 58,187 |
| 6.1% 10/1/41 | | 30,000 | 31,088 |
| Lincoln National Corp. 4.35% 3/1/48 | | 160,000 | 121,609 |
| Manulife Financial Corp. 5.375% 3/4/46 | | 40,000 | 38,510 |
| Markel Group, Inc.: | | | |
| 3.35% 9/17/29 | | 30,000 | 27,523 |
| 3.5% 11/1/27 | | 100,000 | 94,798 |
| 5% 5/20/49 | | 50,000 | 44,192 |
| Marsh & McLennan Companies, Inc.: | | | |
| 4.2% 3/1/48 | | 110,000 | 89,343 |
| 4.9% 3/15/49 | | 70,000 | 62,632 |
| 5.7% 9/15/53 | | 40,000 | 40,402 |
| 5.75% 11/1/32 | | 100,000 | 104,162 |
| MetLife, Inc.: | | | |
| 4.05% 3/1/45 | | 18,000 | 14,451 |
| 4.55% 3/23/30 | | 600,000 | 589,296 |
| 4.875% 11/13/43 | | 100,000 | 91,112 |
| Principal Financial Group, Inc. 5.375% 3/15/33 | | 120,000 | 119,678 |
| Progressive Corp.: | | | |
| 2.5% 3/15/27 | | 100,000 | 93,603 |
| 4.2% 3/15/48 | | 135,000 | 111,124 |
| Prudential Financial, Inc.: | | | |
| 3.878% 3/27/28 | | 23,000 | 22,082 |
| 3.935% 12/7/49 | | 38,000 | 28,801 |
| 4.35% 2/25/50 | | 285,000 | 232,139 |
| 5.125% 3/1/52 (b) | | 50,000 | 46,481 |
| 6% 9/1/52 (b) | | 40,000 | 39,526 |
| 6.5% 3/15/54 (b) | | 60,000 | 60,569 |
| Prudential Funding Asia PLC 3.125% 4/14/30 | | 60,000 | 53,755 |
| Reinsurance Group of America, Inc.: | | | |
| 3.95% 9/15/26 | | 50,000 | 48,608 |
| 6% 9/15/33 | | 30,000 | 30,627 |
| The Travelers Companies, Inc.: | | | |
| 2.55% 4/27/50 | | 200,000 | 121,782 |
| 4% 5/30/47 | | 32,000 | 25,717 |
| 4.1% 3/4/49 | | 50,000 | 40,629 |
| Unum Group: | | | |
| 4% 6/15/29 | | 100,000 | 94,240 |
| 4.125% 6/15/51 | | 20,000 | 14,673 |
| 6% 6/15/54 | | 30,000 | 28,812 |
| Willis Group North America, Inc.: | | | |
| 2.95% 9/15/29 | | 250,000 | 223,941 |
| 5.35% 5/15/33 | | 20,000 | 19,610 |
| | | | 6,373,102 |
TOTAL FINANCIALS | | | 79,542,100 |
| HEALTH CARE - 3.2% | | | |
| Biotechnology - 0.5% | | | |
| AbbVie, Inc.: | | | |
| 2.6% 11/21/24 | | 60,000 | 59,339 |
| 2.95% 11/21/26 | | 50,000 | 47,662 |
| 3.2% 11/21/29 | | 80,000 | 73,408 |
| 3.8% 3/15/25 | | 61,000 | 60,248 |
| 4.05% 11/21/39 | | 50,000 | 43,430 |
| 4.25% 11/21/49 | | 390,000 | 325,008 |
| 4.3% 5/14/36 | | 140,000 | 128,875 |
| 4.55% 3/15/35 | | 80,000 | 75,885 |
| 4.7% 5/14/45 | | 120,000 | 108,395 |
| 4.8% 3/15/29 | | 150,000 | 149,420 |
| 4.875% 11/14/48 | | 100,000 | 91,868 |
| 5.05% 3/15/34 | | 220,000 | 219,356 |
| 5.4% 3/15/54 | | 150,000 | 148,323 |
| Amgen, Inc.: | | | |
| 3% 1/15/52 | | 30,000 | 19,648 |
| 3.15% 2/21/40 | | 410,000 | 306,388 |
| 3.2% 11/2/27 | | 56,000 | 52,764 |
| 3.375% 2/21/50 | | 110,000 | 77,460 |
| 4.2% 3/1/33 | | 260,000 | 240,874 |
| 4.4% 5/1/45 | | 102,000 | 85,826 |
| 4.875% 3/1/53 | | 50,000 | 44,029 |
| 5.15% 3/2/28 | | 480,000 | 479,929 |
| 5.25% 3/2/33 | | 100,000 | 99,709 |
| 5.65% 3/2/53 | | 182,000 | 179,241 |
| 5.75% 3/2/63 | | 140,000 | 137,093 |
| Biogen, Inc. 3.25% 2/15/51 | | 270,000 | 179,296 |
| Gilead Sciences, Inc.: | | | |
| 2.8% 10/1/50 | | 180,000 | 112,750 |
| 4% 9/1/36 | | 40,000 | 35,276 |
| 4.15% 3/1/47 | | 60,000 | 48,732 |
| 4.5% 2/1/45 | | 311,000 | 268,624 |
| | | | 3,898,856 |
| Health Care Equipment & Supplies - 0.2% | | | |
| Abbott Laboratories: | | | |
| 3.875% 9/15/25 | | 240,000 | 236,537 |
| 4.9% 11/30/46 | | 150,000 | 141,706 |
| Baxter International, Inc.: | | | |
| 1.915% 2/1/27 | | 180,000 | 164,990 |
| 2.539% 2/1/32 | | 180,000 | 147,626 |
| Becton, Dickinson & Co.: | | | |
| 2.823% 5/20/30 | | 150,000 | 132,634 |
| 3.7% 6/6/27 | | 52,000 | 50,029 |
| 4.669% 6/6/47 | | 130,000 | 113,312 |
| 5.081% 6/7/29 | | 100,000 | 99,909 |
| Boston Scientific Corp.: | | | |
| 3.75% 3/1/26 | | 120,000 | 116,797 |
| 4% 3/1/29 | | 100,000 | 96,303 |
| 4.7% 3/1/49 | | 140,000 | 124,695 |
| GE Healthcare Technologies, Inc.: | | | |
| 5.857% 3/15/30 | | 100,000 | 102,772 |
| 5.905% 11/22/32 | | 140,000 | 144,477 |
| Medtronic, Inc. 4.625% 3/15/45 | | 168,000 | 151,735 |
| Stryker Corp.: | | | |
| 2.9% 6/15/50 | | 100,000 | 65,522 |
| 3.5% 3/15/26 | | 240,000 | 232,883 |
| | | | 2,121,927 |
| Health Care Providers & Services - 1.3% | | | |
| Aetna, Inc.: | | | |
| 4.75% 3/15/44 | | 60,000 | 50,485 |
| 6.625% 6/15/36 | | 60,000 | 63,699 |
| AHS Hospital Corp. 2.78% 7/1/51 | | 250,000 | 158,958 |
| Allina Health System, Inc. 3.887% 4/15/49 | | 20,000 | 15,416 |
| Banner Health 2.913% 1/1/51 | | 100,000 | 65,842 |
| Baptist Healthcare System Obli 3.54% 8/15/50 | | 100,000 | 72,670 |
| Bon Secours Mercy Health, Inc. 2.095% 6/1/31 | | 71,000 | 58,682 |
| Cardinal Health, Inc.: | | | |
| 3.41% 6/15/27 | | 67,000 | 63,801 |
| 5.45% 2/15/34 | | 110,000 | 109,493 |
| Cencora, Inc. 5.125% 2/15/34 | | 110,000 | 108,001 |
| Centene Corp.: | | | |
| 2.45% 7/15/28 | | 100,000 | 88,783 |
| 2.625% 8/1/31 | | 130,000 | 106,758 |
| 3.375% 2/15/30 | | 260,000 | 230,780 |
| Children's Hospital of Philadelphia 2.704% 7/1/50 | | 79,000 | 50,875 |
| Cigna Group: | | | |
| 4.125% 11/15/25 | | 25,000 | 24,580 |
| 4.375% 10/15/28 | | 30,000 | 29,132 |
| 4.5% 2/25/26 | | 74,000 | 72,877 |
| 4.8% 8/15/38 | | 80,000 | 73,508 |
| 4.8% 7/15/46 | | 465,000 | 408,885 |
| 4.9% 12/15/48 | | 30,000 | 26,367 |
| CommonSpirit Health: | | | |
| 2.76% 10/1/24 | | 740,000 | 734,037 |
| 3.91% 10/1/50 | | 125,000 | 94,936 |
| CVS Health Corp.: | | | |
| 2.7% 8/21/40 | | 467,000 | 310,280 |
| 3% 8/15/26 | | 20,000 | 19,058 |
| 3.25% 8/15/29 | | 195,000 | 176,895 |
| 3.625% 4/1/27 | | 170,000 | 163,069 |
| 3.75% 4/1/30 | | 380,000 | 349,705 |
| 4.1% 3/25/25 | | 32,000 | 31,643 |
| 4.25% 4/1/50 | | 37,000 | 28,148 |
| 4.3% 3/25/28 | | 264,000 | 254,923 |
| 5% 1/30/29 | | 40,000 | 39,590 |
| 5.05% 3/25/48 | | 131,000 | 112,871 |
| 5.25% 2/21/33 | | 150,000 | 146,471 |
| 5.3% 6/1/33 | | 70,000 | 68,408 |
| 5.625% 2/21/53 | | 130,000 | 120,680 |
| 6% 6/1/63 | | 20,000 | 19,150 |
| 6.05% 6/1/54 | | 50,000 | 49,035 |
| Elevance Health, Inc.: | | | |
| 3.35% 12/1/24 | | 89,000 | 88,193 |
| 3.65% 12/1/27 | | 320,000 | 305,870 |
| 4.101% 3/1/28 | | 50,000 | 48,322 |
| 4.375% 12/1/47 | | 175,000 | 145,262 |
| 4.55% 3/1/48 | | 250,000 | 212,591 |
| Franciscan Missionaries of Our Lady Health System, Inc. 3.914% 7/1/49 | | 120,000 | 91,757 |
| HCA Holdings, Inc.: | | | |
| 4.5% 2/15/27 | | 1,013,000 | 989,861 |
| 5.25% 6/15/49 | | 100,000 | 89,129 |
| 5.6% 4/1/34 | | 200,000 | 198,794 |
| 6% 4/1/54 | | 200,000 | 197,606 |
| Humana, Inc.: | | | |
| 3.95% 3/15/27 | | 445,000 | 430,244 |
| 4.625% 12/1/42 | | 80,000 | 67,167 |
| 5.75% 12/1/28 | | 70,000 | 71,411 |
| INTEGRIS Baptist Medical Center, Inc. 3.875% 8/15/50 | | 83,000 | 61,815 |
| Kaiser Foundation Hospitals: | | | |
| 2.81% 6/1/41 | | 63,000 | 45,549 |
| 3.266% 11/1/49 | | 80,000 | 56,779 |
| 4.15% 5/1/47 | | 30,000 | 25,076 |
| MidMichigan Health 3.409% 6/1/50 | | 33,000 | 23,087 |
| Novant Health, Inc. 3.168% 11/1/51 | | 105,000 | 70,236 |
| Orlando Health Obligated Group 3.327% 10/1/50 | | 57,000 | 41,323 |
| Piedmont Healthcare, Inc. 2.719% 1/1/42 | | 37,000 | 25,819 |
| Providence St. Joseph Health Obligated Group 2.7% 10/1/51 | | 130,000 | 77,004 |
| Sabra Health Care LP 5.125% 8/15/26 | | 50,000 | 49,211 |
| Sutter Health 3.361% 8/15/50 | | 130,000 | 92,964 |
| Trinity Health Corp. 2.632% 12/1/40 | | 50,000 | 35,290 |
| UnitedHealth Group, Inc.: | | | |
| 1.15% 5/15/26 | | 180,000 | 167,323 |
| 1.25% 1/15/26 | | 81,000 | 76,320 |
| 2.375% 8/15/24 | | 90,000 | 89,638 |
| 2.9% 5/15/50 | | 120,000 | 77,826 |
| 3.05% 5/15/41 | | 230,000 | 169,753 |
| 3.5% 8/15/39 | | 772,000 | 623,741 |
| 3.7% 8/15/49 | | 40,000 | 30,069 |
| 3.75% 10/15/47 | | 30,000 | 22,839 |
| 4.25% 1/15/29 | | 100,000 | 97,372 |
| 4.45% 12/15/48 | | 102,000 | 87,451 |
| 4.625% 7/15/35 | | 100,000 | 95,742 |
| 4.7% 4/15/29 | | 340,000 | 337,323 |
| 5% 4/15/34 | | 40,000 | 39,480 |
| 5.05% 4/15/53 | | 100,000 | 92,624 |
| 5.25% 2/15/28 | | 90,000 | 91,171 |
| 5.35% 2/15/33 | | 90,000 | 91,189 |
| 6.05% 2/15/63 | | 60,000 | 63,138 |
| West Virginia University Health System Obligated Group 3.129% 6/1/50 | | 70,000 | 45,955 |
| | | | 10,437,805 |
| Life Sciences Tools & Services - 0.1% | | | |
| Revvity, Inc. 2.25% 9/15/31 | | 90,000 | 73,641 |
| Thermo Fisher Scientific, Inc.: | | | |
| 2.6% 10/1/29 | | 250,000 | 223,641 |
| 4.95% 11/21/32 | | 210,000 | 208,118 |
| 5.086% 8/10/33 | | 20,000 | 19,949 |
| | | | 525,349 |
| Pharmaceuticals - 1.1% | | | |
| AstraZeneca Finance LLC: | | | |
| 1.2% 5/28/26 | | 290,000 | 269,246 |
| 2.25% 5/28/31 | | 440,000 | 371,562 |
| 4.875% 3/3/33 | | 110,000 | 108,965 |
| AstraZeneca PLC: | | | |
| 4.375% 11/16/45 | | 45,000 | 39,085 |
| 4.375% 8/17/48 | | 50,000 | 43,028 |
| Bristol-Myers Squibb Co.: | | | |
| 2.9% 7/26/24 | | 70,000 | 69,861 |
| 3.2% 6/15/26 | | 650,000 | 626,646 |
| 3.7% 3/15/52 | | 330,000 | 241,820 |
| 3.9% 3/15/62 | | 100,000 | 71,933 |
| 4.125% 6/15/39 | | 100,000 | 86,776 |
| 4.55% 2/20/48 | | 42,000 | 35,991 |
| 4.9% 2/22/29 | | 130,000 | 129,744 |
| 5.2% 2/22/34 | | 190,000 | 189,612 |
| 5.55% 2/22/54 | | 131,000 | 129,151 |
| 5.75% 2/1/31 | | 70,000 | 72,676 |
| Eli Lilly & Co.: | | | |
| 2.25% 5/15/50 | | 200,000 | 116,610 |
| 4.875% 2/27/53 | | 50,000 | 46,853 |
| 5.1% 2/9/64 | | 100,000 | 95,510 |
| GlaxoSmithKline Capital, Inc. 3.875% 5/15/28 | | 130,000 | 125,504 |
| Haleon U.S. Capital LLC 3.625% 3/24/32 | | 250,000 | 223,956 |
| Johnson & Johnson: | | | |
| 2.1% 9/1/40 | | 220,000 | 146,813 |
| 2.45% 3/1/26 | | 760,000 | 729,859 |
| 2.45% 9/1/60 | | 110,000 | 62,140 |
| 3.4% 1/15/38 | | 116,000 | 97,364 |
| 3.55% 3/1/36 | | 110,000 | 96,299 |
| 4.9% 6/1/31 | | 100,000 | 100,982 |
| Merck & Co., Inc.: | | | |
| 1.45% 6/24/30 | | 100,000 | 82,735 |
| 3.7% 2/10/45 | | 45,000 | 35,320 |
| 4.05% 5/17/28 | | 100,000 | 97,897 |
| 4.15% 5/18/43 | | 266,000 | 226,689 |
| 4.5% 5/17/33 | | 150,000 | 144,831 |
| 5% 5/17/53 | | 150,000 | 141,049 |
| Mylan NV 4.55% 4/15/28 | | 20,000 | 19,266 |
| Novartis Capital Corp.: | | | |
| 1.75% 2/14/25 | | 100,000 | 97,750 |
| 2% 2/14/27 | | 320,000 | 298,008 |
| 2.75% 8/14/50 | | 50,000 | 32,482 |
| 3% 11/20/25 | | 460,000 | 447,442 |
| 3.1% 5/17/27 | | 90,000 | 85,927 |
| 4% 11/20/45 | | 35,000 | 29,235 |
| Pfizer Investment Enterprises: | | | |
| 4.45% 5/19/26 | | 640,000 | 631,825 |
| 4.45% 5/19/28 | | 270,000 | 265,273 |
| 4.65% 5/19/30 | | 113,000 | 111,380 |
| 4.75% 5/19/33 | | 200,000 | 194,864 |
| 5.11% 5/19/43 | | 150,000 | 142,618 |
| 5.3% 5/19/53 | | 154,000 | 148,536 |
| 5.34% 5/19/63 | | 150,000 | 141,586 |
| Pfizer, Inc.: | | | |
| 2.55% 5/28/40 | | 125,000 | 87,013 |
| 2.7% 5/28/50 | | 380,000 | 244,084 |
| 3.45% 3/15/29 | | 70,000 | 66,217 |
| 4% 12/15/36 | | 36,000 | 32,307 |
| Royalty Pharma PLC 3.3% 9/2/40 | | 100,000 | 72,279 |
| Shire Acquisitions Investments Ireland DAC 3.2% 9/23/26 | | 110,000 | 105,493 |
| Takeda Pharmaceutical Co. Ltd.: | | | |
| 2.05% 3/31/30 | | 200,000 | 168,783 |
| 3.025% 7/9/40 | | 272,000 | 196,981 |
| Viatris, Inc.: | | | |
| 2.7% 6/22/30 | | 100,000 | 84,875 |
| 3.85% 6/22/40 | | 120,000 | 87,624 |
| 4% 6/22/50 | | 100,000 | 67,298 |
| Zoetis, Inc. 4.45% 8/20/48 | | 60,000 | 51,080 |
| | | | 8,966,733 |
TOTAL HEALTH CARE | | | 25,950,670 |
| INDUSTRIALS - 1.8% | | | |
| Aerospace & Defense - 0.6% | | | |
| General Dynamics Corp.: | | | |
| 2.125% 8/15/26 | | 160,000 | 150,623 |
| 3.625% 4/1/30 | | 140,000 | 131,239 |
| 4.25% 4/1/50 | | 50,000 | 42,115 |
| General Electric Co. 4.35% 5/1/50 | | 489,000 | 415,491 |
| Huntington Ingalls Industries, Inc. 4.2% 5/1/30 | | 60,000 | 56,415 |
| L3Harris Technologies, Inc.: | | | |
| 4.854% 4/27/35 | | 100,000 | 94,928 |
| 5.4% 1/15/27 | | 270,000 | 271,091 |
| Lockheed Martin Corp.: | | | |
| 4.07% 12/15/42 | | 70,000 | 58,864 |
| 4.09% 9/15/52 | | 70,000 | 56,056 |
| 4.7% 5/15/46 | | 28,000 | 25,193 |
| 5.9% 11/15/63 | | 200,000 | 209,810 |
| Northrop Grumman Corp.: | | | |
| 3.25% 1/15/28 | | 80,000 | 75,342 |
| 4.03% 10/15/47 | | 106,000 | 83,764 |
| 5.25% 5/1/50 | | 120,000 | 113,846 |
| RTX Corp.: | | | |
| 3.75% 11/1/46 | | 30,000 | 22,447 |
| 4.05% 5/4/47 | | 18,000 | 14,152 |
| 4.125% 11/16/28 | | 260,000 | 250,276 |
| 4.35% 4/15/47 | | 50,000 | 41,230 |
| 4.45% 11/16/38 | | 370,000 | 326,709 |
| 5.15% 2/27/33 | | 240,000 | 237,507 |
| 6.1% 3/15/34 | | 200,000 | 210,522 |
| The Boeing Co.: | | | |
| 3.2% 3/1/29 | | 126,000 | 111,790 |
| 4.875% 5/1/25 | | 660,000 | 652,992 |
| 5.705% 5/1/40 | | 836,000 | 770,763 |
| 5.805% 5/1/50 | | 130,000 | 117,156 |
| 6.528% 5/1/34 (e) | | 150,000 | 153,585 |
| | | | 4,693,906 |
| Air Freight & Logistics - 0.1% | | | |
| FedEx Corp.: | | | |
| 4.05% 2/15/48 | | 150,000 | 116,567 |
| 4.25% 5/15/30 | | 175,000 | 168,033 |
| 4.9% 1/15/34 | | 130,000 | 126,551 |
| 4.95% 10/17/48 | | 102,000 | 90,039 |
| United Parcel Service, Inc.: | | | |
| 2.8% 11/15/24 | | 88,000 | 87,168 |
| 4.875% 3/3/33 | | 360,000 | 354,467 |
| 5.05% 3/3/53 | | 20,000 | 18,686 |
| 5.5% 5/22/54 | | 140,000 | 138,830 |
| | | | 1,100,341 |
| Building Products - 0.1% | | | |
| Carrier Global Corp.: | | | |
| 2.493% 2/15/27 | | 50,000 | 46,813 |
| 2.722% 2/15/30 | | 100,000 | 88,345 |
| 3.377% 4/5/40 | | 195,000 | 150,843 |
| 3.577% 4/5/50 | | 50,000 | 36,369 |
| Johnson Controls International PLC 5.125% 9/14/45 | | 6,000 | 5,455 |
| Johnson Controls International PLC/Tyco Fire & Security Finance SCA 4.9% 12/1/32 | | 150,000 | 146,276 |
| Masco Corp.: | | | |
| 2% 2/15/31 | | 103,000 | 83,903 |
| 3.125% 2/15/51 | | 52,000 | 33,570 |
| Owens Corning: | | | |
| 3.875% 6/1/30 | | 100,000 | 93,183 |
| 4.4% 1/30/48 | | 20,000 | 16,095 |
| 5.95% 6/15/54 | | 40,000 | 40,320 |
| | | | 741,172 |
| Commercial Services & Supplies - 0.1% | | | |
| Republic Services, Inc.: | | | |
| 1.45% 2/15/31 | | 500,000 | 396,446 |
| 3.95% 5/15/28 | | 28,000 | 26,918 |
| Veralto Corp. 5.45% 9/18/33 (e) | | 40,000 | 39,924 |
| Waste Management, Inc.: | | | |
| 4.875% 2/15/29 | | 390,000 | 388,782 |
| 4.875% 2/15/34 | | 80,000 | 78,421 |
| 4.95% 7/3/27 | | 40,000 | 39,938 |
| 4.95% 7/3/31 | | 40,000 | 39,677 |
| | | | 1,010,106 |
| Electrical Equipment - 0.1% | | | |
| ABB Finance (U.S.A.), Inc. 4.375% 5/8/42 | | 30,000 | 26,624 |
| Emerson Electric Co. 2% 12/21/28 | | 290,000 | 257,096 |
| Regal Rexnord Corp.: | | | |
| 6.05% 4/15/28 | | 170,000 | 172,042 |
| 6.4% 4/15/33 | | 20,000 | 20,464 |
| Rockwell Automation, Inc. 4.2% 3/1/49 | | 50,000 | 41,788 |
| | | | 518,014 |
| Ground Transportation - 0.3% | | | |
| Burlington Northern Santa Fe LLC: | | | |
| 3% 4/1/25 | | 280,000 | 275,146 |
| 3.05% 2/15/51 | | 211,000 | 139,429 |
| 3.25% 6/15/27 | | 30,000 | 28,690 |
| 4.05% 6/15/48 | | 207,000 | 166,836 |
| 4.45% 3/15/43 | | 100,000 | 87,834 |
| 5.2% 4/15/54 | | 80,000 | 76,635 |
| 6.15% 5/1/37 | | 20,000 | 21,573 |
| Canadian National Railway Co. 2.45% 5/1/50 | | 210,000 | 125,485 |
| Canadian Pacific Railway Co.: | | | |
| 1.75% 12/2/26 | | 140,000 | 129,158 |
| 2.45% 12/2/31 | | 140,000 | 127,408 |
| 3.1% 12/2/51 | | 140,000 | 92,967 |
| 4.2% 11/15/69 | | 70,000 | 53,121 |
| CSX Corp.: | | | |
| 2.4% 2/15/30 | | 80,000 | 69,791 |
| 4.3% 3/1/48 | | 140,000 | 116,627 |
| 4.5% 3/15/49 | | 160,000 | 137,234 |
| 4.75% 11/15/48 | | 70,000 | 62,466 |
| Norfolk Southern Corp.: | | | |
| 2.9% 8/25/51 | | 110,000 | 68,535 |
| 3.8% 8/1/28 | | 63,000 | 60,294 |
| 4.05% 8/15/52 | | 90,000 | 69,452 |
| 4.1% 5/15/21 | | 60,000 | 42,336 |
| 4.15% 2/28/48 | | 38,000 | 30,164 |
| 4.45% 3/1/33 | | 150,000 | 141,481 |
| 5.35% 8/1/54 | | 50,000 | 47,676 |
| Union Pacific Corp.: | | | |
| 2.75% 3/1/26 | | 160,000 | 153,899 |
| 2.891% 4/6/36 | | 79,000 | 63,638 |
| 2.973% 9/16/62 | | 290,000 | 171,505 |
| 3.25% 2/5/50 | | 50,000 | 34,914 |
| 3.6% 9/15/37 | | 38,000 | 31,947 |
| 3.839% 3/20/60 | | 70,000 | 51,398 |
| 5.15% 1/20/63 | | 120,000 | 110,689 |
| | | | 2,788,328 |
| Industrial Conglomerates - 0.1% | | | |
| 3M Co.: | | | |
| 2.375% 8/26/29 | | 177,000 | 154,587 |
| 2.65% 4/15/25 | | 24,000 | 23,457 |
| 3% 8/7/25 | | 310,000 | 302,116 |
| 3.05% 4/15/30 | | 19,000 | 17,029 |
| 3.625% 10/15/47 | | 50,000 | 36,199 |
| 3.7% 4/15/50 | | 24,000 | 17,447 |
| 3.875% 6/15/44 | | 20,000 | 15,484 |
| Honeywell International, Inc.: | | | |
| 2.8% 6/1/50 | | 150,000 | 98,789 |
| 3.812% 11/21/47 | | 20,000 | 15,676 |
| 4.875% 9/1/29 | | 70,000 | 70,103 |
| 5% 3/1/35 | | 70,000 | 69,397 |
| 5.25% 3/1/54 | | 70,000 | 67,925 |
| 5.35% 3/1/64 | | 20,000 | 19,408 |
| Trane Technologies Financing Ltd. 3.8% 3/21/29 | | 125,000 | 118,801 |
| | | | 1,026,418 |
| Machinery - 0.2% | | | |
| Caterpillar Financial Services Corp. 1.1% 9/14/27 | | 530,000 | 472,388 |
| Caterpillar, Inc.: | | | |
| 3.25% 9/19/49 | | 110,000 | 78,304 |
| 4.75% 5/15/64 | | 40,000 | 35,299 |
| 5.2% 5/27/41 | | 100,000 | 97,206 |
| Cummins, Inc.: | | | |
| 4.875% 10/1/43 | | 110,000 | 100,954 |
| 4.9% 2/20/29 | | 60,000 | 59,919 |
| Deere & Co. 2.875% 9/7/49 | | 130,000 | 87,296 |
| Eaton Corp.: | | | |
| 4.15% 3/15/33 | | 150,000 | 140,467 |
| 4.7% 8/23/52 | | 20,000 | 18,073 |
| Otis Worldwide Corp.: | | | |
| 2.056% 4/5/25 | | 48,000 | 46,706 |
| 2.565% 2/15/30 | | 70,000 | 61,438 |
| 3.362% 2/15/50 | | 50,000 | 35,082 |
| Parker Hannifin Corp.: | | | |
| 3.25% 6/14/29 | | 60,000 | 55,107 |
| 4% 6/14/49 | | 110,000 | 85,561 |
| Stanley Black & Decker, Inc. 2.75% 11/15/50 | | 150,000 | 85,878 |
| | | | 1,459,678 |
| Passenger Airlines - 0.1% | | | |
| Southwest Airlines Co. 5.125% 6/15/27 | | 595,000 | 591,936 |
| United Airlines Pass-Through Trust Series 2023-1 Class A, 5.8% 7/15/37 | | 50,000 | 50,758 |
| United Airlines pass-thru trust equipment trust certificate 3.1% 1/7/30 | | 180,681 | 167,699 |
| | | | 810,393 |
| Professional Services - 0.0% | | | |
| Thomson Reuters Corp. 3.35% 5/15/26 | | 76,000 | 73,279 |
| Trading Companies & Distributors - 0.1% | | | |
| Air Lease Corp.: | | | |
| 2.875% 1/15/26 | | 120,000 | 115,131 |
| 2.875% 1/15/32 | | 70,000 | 58,562 |
| 3.125% 12/1/30 | | 40,000 | 34,951 |
| 3.25% 3/1/25 | | 88,000 | 86,447 |
| 3.75% 6/1/26 | | 158,000 | 152,666 |
| 5.2% 7/15/31 | | 70,000 | 68,410 |
| GATX Corp.: | | | |
| 4.55% 11/7/28 | | 130,000 | 127,091 |
| 6.9% 5/1/34 | | 100,000 | 108,889 |
| | | | 752,147 |
TOTAL INDUSTRIALS | | | 14,973,782 |
| INFORMATION TECHNOLOGY - 1.9% | | | |
| Communications Equipment - 0.1% | | | |
| Cisco Systems, Inc.: | | | |
| 4.8% 2/26/27 | | 370,000 | 368,999 |
| 4.85% 2/26/29 | | 110,000 | 109,981 |
| 5.05% 2/26/34 | | 110,000 | 109,918 |
| 5.3% 2/26/54 | | 50,000 | 48,971 |
| 5.5% 1/15/40 | | 90,000 | 91,359 |
| 5.9% 2/15/39 | | 130,000 | 138,257 |
| | | | 867,485 |
| Electronic Equipment, Instruments & Components - 0.1% | | | |
| Amphenol Corp. 5.25% 4/5/34 | | 130,000 | 129,593 |
| Corning, Inc. 5.35% 11/15/48 | | 140,000 | 131,341 |
| Dell International LLC/EMC Corp.: | | | |
| 5.3% 10/1/29 | | 390,000 | 392,200 |
| 8.1% 7/15/36 | | 80,000 | 95,406 |
| 8.35% 7/15/46 | | 187,000 | 236,477 |
| Vontier Corp. 2.4% 4/1/28 | | 60,000 | 53,184 |
| | | | 1,038,201 |
| IT Services - 0.2% | | | |
| CDW LLC/CDW Finance Corp.: | | | |
| 2.67% 12/1/26 | | 150,000 | 140,123 |
| 3.569% 12/1/31 | | 40,000 | 34,936 |
| IBM Corp.: | | | |
| 1.95% 5/15/30 | | 175,000 | 148,055 |
| 2.95% 5/15/50 | | 175,000 | 110,854 |
| 3.5% 5/15/29 | | 843,000 | 788,080 |
| 4% 6/20/42 | | 90,000 | 73,561 |
| 5.6% 11/30/39 | | 50,000 | 50,831 |
| IBM International Capital 4.6% 2/5/29 | | 180,000 | 176,922 |
| | | | 1,523,362 |
| Semiconductors & Semiconductor Equipment - 0.7% | | | |
| Advanced Micro Devices, Inc. 4.393% 6/1/52 | | 30,000 | 25,365 |
| Analog Devices, Inc.: | | | |
| 2.8% 10/1/41 | | 130,000 | 91,601 |
| 2.95% 10/1/51 | | 40,000 | 26,181 |
| Applied Materials, Inc.: | | | |
| 4.35% 4/1/47 | | 28,000 | 24,454 |
| 5.85% 6/15/41 | | 70,000 | 74,035 |
| Broadcom Corp./Broadcom Cayman LP 3.5% 1/15/28 | | 1,324,000 | 1,252,694 |
| Broadcom, Inc.: | | | |
| 3.187% 11/15/36 (e) | | 90,000 | 71,223 |
| 3.419% 4/15/33 (e) | | 82,000 | 70,696 |
| 4% 4/15/29 (e) | | 70,000 | 66,692 |
| 4.3% 11/15/32 | | 250,000 | 233,667 |
| 4.75% 4/15/29 | | 50,000 | 49,315 |
| 4.926% 5/15/37 (e) | | 80,000 | 75,241 |
| 5% 4/15/30 | | 50,000 | 50,021 |
| Intel Corp.: | | | |
| 3.25% 11/15/49 | | 110,000 | 73,777 |
| 3.734% 12/8/47 | | 617,000 | 453,465 |
| 4.875% 2/10/28 | | 100,000 | 99,629 |
| 5.15% 2/21/34 | | 50,000 | 49,376 |
| 5.2% 2/10/33 | | 710,000 | 708,891 |
| 5.9% 2/10/63 | | 20,000 | 19,958 |
| KLA Corp.: | | | |
| 4.65% 7/15/32 | | 110,000 | 107,382 |
| 4.95% 7/15/52 | | 110,000 | 102,206 |
| Lam Research Corp. 2.875% 6/15/50 | | 150,000 | 97,385 |
| Marvell Technology, Inc. 5.95% 9/15/33 | | 60,000 | 61,971 |
| Micron Technology, Inc.: | | | |
| 3.366% 11/1/41 | | 30,000 | 21,948 |
| 4.663% 2/15/30 | | 230,000 | 222,914 |
| 5.327% 2/6/29 | | 50,000 | 50,236 |
| 5.375% 4/15/28 | | 60,000 | 60,255 |
| NVIDIA Corp.: | | | |
| 2% 6/15/31 | | 216,000 | 181,510 |
| 2.85% 4/1/30 | | 100,000 | 90,679 |
| 3.5% 4/1/40 | | 50,000 | 41,404 |
| 3.5% 4/1/50 | | 50,000 | 38,382 |
| NXP BV/NXP Funding LLC/NXP U.S.A., Inc. 2.65% 2/15/32 | | 270,000 | 224,477 |
| Qualcomm, Inc.: | | | |
| 1.65% 5/20/32 | | 54,000 | 42,534 |
| 5.4% 5/20/33 | | 250,000 | 259,060 |
| 6% 5/20/53 | | 120,000 | 129,457 |
| Texas Instruments, Inc.: | | | |
| 4.15% 5/15/48 | | 70,000 | 58,042 |
| 4.85% 2/8/34 | | 60,000 | 59,460 |
| 4.9% 3/14/33 | | 200,000 | 199,552 |
| 5.05% 5/18/63 | | 40,000 | 37,173 |
| | | | 5,602,308 |
| Software - 0.5% | | | |
| Adobe, Inc. 4.95% 4/4/34 | | 70,000 | 69,688 |
| Microsoft Corp.: | | | |
| 2.525% 6/1/50 | | 326,000 | 205,842 |
| 2.921% 3/17/52 | | 534,000 | 362,503 |
| 3.3% 2/6/27 | | 115,000 | 110,929 |
| 3.4% 6/15/27 | | 210,000 | 202,103 |
| 3.45% 8/8/36 | | 31,000 | 27,024 |
| 4.2% 11/3/35 | | 170,000 | 162,435 |
| Oracle Corp.: | | | |
| 1.65% 3/25/26 | | 207,000 | 194,031 |
| 2.5% 4/1/25 | | 80,000 | 78,147 |
| 2.95% 4/1/30 | | 360,000 | 320,165 |
| 3.25% 11/15/27 | | 96,000 | 90,504 |
| 3.6% 4/1/50 | | 300,000 | 209,962 |
| 3.8% 11/15/37 | | 110,000 | 90,616 |
| 3.85% 4/1/60 | | 80,000 | 54,977 |
| 3.9% 5/15/35 | | 220,000 | 190,728 |
| 4% 11/15/47 | | 187,000 | 141,574 |
| 4.9% 2/6/33 | | 250,000 | 242,508 |
| 5.375% 7/15/40 | | 641,000 | 609,530 |
| Roper Technologies, Inc.: | | | |
| 1% 9/15/25 | | 50,000 | 47,366 |
| 1.4% 9/15/27 | | 50,000 | 44,517 |
| 1.75% 2/15/31 | | 50,000 | 40,250 |
| 2% 6/30/30 | | 330,000 | 275,687 |
| Salesforce, Inc.: | | | |
| 2.7% 7/15/41 | | 220,000 | 153,974 |
| 2.9% 7/15/51 | | 20,000 | 12,906 |
| VMware, Inc.: | | | |
| 2.2% 8/15/31 | | 50,000 | 40,627 |
| 4.7% 5/15/30 | | 100,000 | 96,741 |
| | | | 4,075,334 |
| Technology Hardware, Storage & Peripherals - 0.3% | | | |
| Apple, Inc.: | | | |
| 1.125% 5/11/25 | | 772,000 | 745,014 |
| 1.2% 2/8/28 | | 440,000 | 389,087 |
| 1.25% 8/20/30 | | 50,000 | 40,937 |
| 2.375% 2/8/41 | | 330,000 | 227,891 |
| 2.55% 8/20/60 | | 200,000 | 121,874 |
| 2.95% 9/11/49 | | 240,000 | 164,180 |
| 3% 11/13/27 | | 96,000 | 90,955 |
| 3.2% 5/11/27 | | 200,000 | 191,653 |
| 3.75% 11/13/47 | | 57,000 | 45,465 |
| 3.85% 5/4/43 | | 369,000 | 308,844 |
| 4.3% 5/10/33 | | 250,000 | 246,432 |
| 4.5% 2/23/36 | | 90,000 | 87,842 |
| HP, Inc.: | | | |
| 2.2% 6/17/25 | | 160,000 | 154,704 |
| 4.2% 4/15/32 | | 110,000 | 101,891 |
| | | | 2,916,769 |
TOTAL INFORMATION TECHNOLOGY | | | 16,023,459 |
| MATERIALS - 0.8% | | | |
| Chemicals - 0.4% | | | |
| Air Products & Chemicals, Inc.: | | | |
| 1.5% 10/15/25 | | 100,000 | 95,215 |
| 2.05% 5/15/30 | | 60,000 | 51,407 |
| 2.7% 5/15/40 | | 60,000 | 42,803 |
| 2.8% 5/15/50 | | 100,000 | 64,220 |
| Albemarle Corp.: | | | |
| 4.65% 6/1/27 | | 120,000 | 118,068 |
| 5.65% 6/1/52 | | 20,000 | 17,727 |
| DuPont de Nemours, Inc.: | | | |
| 4.725% 11/15/28 | | 35,000 | 34,865 |
| 5.319% 11/15/38 | | 411,000 | 422,775 |
| Eastman Chemical Co. 4.5% 12/1/28 | | 174,000 | 169,099 |
| Ecolab, Inc.: | | | |
| 1.3% 1/30/31 | | 300,000 | 238,691 |
| 2.7% 12/15/51 | | 20,000 | 12,290 |
| International Flavors & Fragrances, Inc. 4.375% 6/1/47 | | 50,000 | 38,505 |
| Linde, Inc. 2% 8/10/50 | | 60,000 | 32,594 |
| LYB International Finance II BV 3.5% 3/2/27 | | 166,000 | 159,010 |
| LYB International Finance III LLC: | | | |
| 3.375% 10/1/40 | | 20,000 | 14,628 |
| 3.625% 4/1/51 | | 120,000 | 82,501 |
| 4.2% 10/15/49 | | 100,000 | 76,691 |
| 5.5% 3/1/34 | | 50,000 | 49,471 |
| Nutrien Ltd.: | | | |
| 4.2% 4/1/29 | | 13,000 | 12,439 |
| 4.9% 3/27/28 | | 160,000 | 158,122 |
| 5% 4/1/49 | | 103,000 | 90,681 |
| Sherwin-Williams Co.: | | | |
| 3.45% 6/1/27 | | 290,000 | 276,179 |
| 3.8% 8/15/49 | | 80,000 | 60,369 |
| 4.5% 6/1/47 | | 50,000 | 42,162 |
| The Dow Chemical Co.: | | | |
| 2.1% 11/15/30 | | 250,000 | 210,870 |
| 3.6% 11/15/50 | | 200,000 | 139,248 |
| 4.8% 5/15/49 | | 50,000 | 42,646 |
| 7.375% 11/1/29 | | 46,000 | 50,647 |
| The Mosaic Co.: | | | |
| 4.05% 11/15/27 | | 90,000 | 86,305 |
| 5.45% 11/15/33 | | 50,000 | 49,503 |
| Westlake Corp. 3.6% 8/15/26 | | 625,000 | 601,383 |
| | | | 3,541,114 |
| Construction Materials - 0.0% | | | |
| Martin Marietta Materials, Inc.: | | | |
| 2.4% 7/15/31 | | 100,000 | 82,729 |
| 2.5% 3/15/30 | | 90,000 | 78,200 |
| | | | 160,929 |
| Containers & Packaging - 0.1% | | | |
| Amcor Group Finance 5.45% 5/23/29 | | 150,000 | 150,494 |
| Avery Dennison Corp. 2.65% 4/30/30 | | 80,000 | 69,587 |
| International Paper Co. 4.8% 6/15/44 | | 155,000 | 134,051 |
| WRKCo, Inc.: | | | |
| 4.2% 6/1/32 | | 50,000 | 46,738 |
| 4.65% 3/15/26 | | 290,000 | 285,765 |
| | | | 686,635 |
| Metals & Mining - 0.2% | | | |
| ArcelorMittal SA: | | | |
| 6.35% 6/17/54 | | 40,000 | 38,848 |
| 6.75% 3/1/41 (b) | | 20,000 | 20,400 |
| 6.8% 11/29/32 | | 80,000 | 84,277 |
| Barrick Gold Corp. 5.25% 4/1/42 | | 163,000 | 153,764 |
| BHP Billiton Financial (U.S.A.) Ltd.: | | | |
| 5% 9/30/43 | | 176,000 | 164,217 |
| 5.25% 9/8/33 | | 90,000 | 90,062 |
| Freeport-McMoRan, Inc. 5.4% 11/14/34 | | 140,000 | 137,700 |
| Newmont Corp.: | | | |
| 2.25% 10/1/30 | | 100,000 | 85,338 |
| 2.6% 7/15/32 | | 250,000 | 208,380 |
| 2.8% 10/1/29 | | 100,000 | 89,770 |
| 5.45% 6/9/44 | | 80,000 | 77,348 |
| Nucor Corp. 6.4% 12/1/37 | | 50,000 | 54,043 |
| Rio Tinto Finance (U.S.A.) Ltd.: | | | |
| 2.75% 11/2/51 | | 120,000 | 74,443 |
| 5.2% 11/2/40 | | 120,000 | 116,242 |
| Southern Copper Corp.: | | | |
| 5.875% 4/23/45 | | 30,000 | 29,738 |
| 6.75% 4/16/40 | | 50,000 | 54,700 |
| Vale Overseas Ltd.: | | | |
| 3.75% 7/8/30 | | 300,000 | 270,000 |
| 6.4% 6/28/54 | | 60,000 | 59,382 |
| | | | 1,808,652 |
| Paper & Forest Products - 0.1% | | | |
| Suzano Austria GmbH 2.5% 9/15/28 | | 298,000 | 260,762 |
TOTAL MATERIALS | | | 6,458,092 |
| REAL ESTATE - 1.0% | | | |
| Equity Real Estate Investment Trusts (REITs) - 0.9% | | | |
| Alexandria Real Estate Equities, Inc.: | | | |
| 2% 5/18/32 | | 125,000 | 97,832 |
| 3% 5/18/51 | | 125,000 | 75,264 |
| 4.85% 4/15/49 | | 90,000 | 75,841 |
| American Homes 4 Rent LP: | | | |
| 4.9% 2/15/29 | | 130,000 | 127,052 |
| 5.5% 2/1/34 | | 30,000 | 29,499 |
| American Tower Corp.: | | | |
| 2.1% 6/15/30 | | 160,000 | 134,058 |
| 3.1% 6/15/50 | | 160,000 | 103,273 |
| 3.6% 1/15/28 | | 32,000 | 30,195 |
| 3.8% 8/15/29 | | 70,000 | 65,064 |
| 5.9% 11/15/33 | | 110,000 | 112,637 |
| AvalonBay Communities, Inc.: | | | |
| 2.3% 3/1/30 | | 130,000 | 112,461 |
| 3.2% 1/15/28 | | 203,000 | 190,796 |
| Boston Properties, Inc.: | | | |
| 2.55% 4/1/32 | | 90,000 | 70,183 |
| 2.9% 3/15/30 | | 20,000 | 16,968 |
| 3.65% 2/1/26 | | 100,000 | 96,506 |
| 6.75% 12/1/27 | | 180,000 | 184,648 |
| Brixmor Operating Partnership LP: | | | |
| 4.05% 7/1/30 | | 41,000 | 38,049 |
| 4.125% 5/15/29 | | 19,000 | 17,933 |
| 5.5% 2/15/34 | | 40,000 | 39,305 |
| Camden Property Trust 4.9% 1/15/34 | | 60,000 | 57,406 |
| Corporate Office Properties LP 2.75% 4/15/31 | | 50,000 | 41,339 |
| Crown Castle, Inc.: | | | |
| 1.35% 7/15/25 | | 79,000 | 75,594 |
| 2.25% 1/15/31 | | 280,000 | 230,276 |
| 3.25% 1/15/51 | | 40,000 | 26,559 |
| 3.7% 6/15/26 | | 100,000 | 96,638 |
| 5.1% 5/1/33 | | 160,000 | 154,335 |
| CubeSmart LP 3% 2/15/30 | | 80,000 | 70,823 |
| EPR Properties 3.75% 8/15/29 | | 70,000 | 62,413 |
| Equinix Europe 2 Financing Corp. LLC 5.5% 6/15/34 | | 170,000 | 169,724 |
| ERP Operating LP: | | | |
| 3.5% 3/1/28 | | 61,000 | 57,858 |
| 4.15% 12/1/28 | | 330,000 | 318,531 |
| Federal Realty OP LP 5.375% 5/1/28 | | 50,000 | 50,055 |
| Healthpeak OP, LLC 3% 1/15/30 | | 140,000 | 124,237 |
| Highwoods Realty LP 4.125% 3/15/28 | | 80,000 | 74,744 |
| Invitation Homes Operating Partnership LP 5.5% 8/15/33 | | 50,000 | 49,293 |
| Kilroy Realty LP 6.25% 1/15/36 | | 40,000 | 37,961 |
| Kimco Realty OP, LLC: | | | |
| 1.9% 3/1/28 | | 570,000 | 507,974 |
| 3.3% 2/1/25 | | 180,000 | 177,272 |
| Kite Realty Group LP 5.5% 3/1/34 | | 30,000 | 29,330 |
| LXP Industrial Trust (REIT) 6.75% 11/15/28 | | 50,000 | 51,853 |
| NNN (REIT), Inc. 3% 4/15/52 | | 100,000 | 62,259 |
| Omega Healthcare Investors, Inc. 5.25% 1/15/26 | | 230,000 | 227,774 |
| Piedmont Operating Partnership LP 3.15% 8/15/30 | | 30,000 | 23,903 |
| Prologis LP: | | | |
| 1.75% 2/1/31 | | 370,000 | 300,055 |
| 3% 4/15/50 | | 145,000 | 93,652 |
| Public Storage Operating Co. 5.125% 1/15/29 | | 260,000 | 262,207 |
| Realty Income Corp.: | | | |
| 2.1% 3/15/28 | | 90,000 | 80,646 |
| 3.25% 1/15/31 | | 220,000 | 194,611 |
| 3.4% 1/15/28 | | 230,000 | 216,794 |
| 4.9% 7/15/33 | | 50,000 | 47,795 |
| Regency Centers LP 4.125% 3/15/28 | | 60,000 | 57,763 |
| Simon Property Group LP: | | | |
| 2.65% 7/15/30 | | 125,000 | 108,883 |
| 3.375% 12/1/27 | | 935,000 | 884,366 |
| 6.25% 1/15/34 | | 20,000 | 21,095 |
| Sun Communities Operating LP 2.7% 7/15/31 | | 80,000 | 66,075 |
| UDR, Inc. 2.1% 6/15/33 | | 80,000 | 60,887 |
| Ventas Realty LP: | | | |
| 4.4% 1/15/29 | | 40,000 | 38,436 |
| 4.875% 4/15/49 | | 160,000 | 135,768 |
| VICI Properties LP: | | | |
| 4.75% 2/15/28 | | 70,000 | 68,372 |
| 4.95% 2/15/30 | | 60,000 | 57,884 |
| 5.125% 5/15/32 | | 70,000 | 66,691 |
| 6.125% 4/1/54 | | 40,000 | 38,398 |
| Vornado Realty LP 3.5% 1/15/25 | | 110,000 | 108,352 |
| Welltower OP LLC 4.95% 9/1/48 | | 76,000 | 68,785 |
| Weyerhaeuser Co. 4% 11/15/29 | | 160,000 | 150,453 |
| WP Carey, Inc. 3.85% 7/15/29 | | 70,000 | 65,357 |
| | | | 7,589,040 |
| Real Estate Management & Development - 0.1% | | | |
| CBRE Group, Inc. 5.95% 8/15/34 | | 50,000 | 50,618 |
| Digital Realty Trust LP 4.45% 7/15/28 | | 120,000 | 116,286 |
| Essex Portfolio LP 2.65% 3/15/32 | | 170,000 | 140,687 |
| Extra Space Storage LP: | | | |
| 5.4% 2/1/34 | | 20,000 | 19,576 |
| 5.9% 1/15/31 | | 150,000 | 153,185 |
| Mid-America Apartments LP 5% 3/15/34 | | 40,000 | 38,837 |
| | | | 519,189 |
TOTAL REAL ESTATE | | | 8,108,229 |
| UTILITIES - 2.2% | | | |
| Electric Utilities - 1.6% | | | |
| AEP Transmission Co. LLC 5.4% 3/15/53 | | 160,000 | 152,931 |
| Alabama Power Co. 6% 3/1/39 | | 180,000 | 187,127 |
| American Electric Power Co., Inc. 5.625% 3/1/33 | | 140,000 | 139,484 |
| Appalachian Power Co.: | | | |
| 3.3% 6/1/27 | | 110,000 | 103,988 |
| 4.45% 6/1/45 | | 18,000 | 14,497 |
| 4.5% 3/1/49 | | 90,000 | 71,200 |
| Arizona Public Service Co.: | | | |
| 2.95% 9/15/27 | | 68,000 | 63,387 |
| 3.5% 12/1/49 | | 100,000 | 67,938 |
| 5.55% 8/1/33 | | 30,000 | 29,742 |
| Baltimore Gas & Electric Co.: | | | |
| 2.9% 6/15/50 | | 200,000 | 125,566 |
| 3.2% 9/15/49 | | 150,000 | 99,787 |
| CenterPoint Energy Houston Electric LLC 3.35% 4/1/51 | | 250,000 | 173,260 |
| Commonwealth Edison Co.: | | | |
| 3.2% 11/15/49 | | 30,000 | 20,041 |
| 4% 3/1/48 | | 42,000 | 32,626 |
| 4.9% 2/1/33 | | 210,000 | 205,098 |
| 6.45% 1/15/38 | | 50,000 | 54,121 |
| Connecticut Light & Power Co. 4.9% 7/1/33 | | 140,000 | 136,257 |
| DTE Electric Co.: | | | |
| 3% 3/1/32 | | 100,000 | 86,407 |
| 5.2% 3/1/34 | | 60,000 | 59,807 |
| 5.4% 4/1/53 | | 110,000 | 107,262 |
| Duke Energy Carolinas LLC: | | | |
| 2.45% 8/15/29 | | 190,000 | 167,537 |
| 3.95% 3/15/48 | | 31,000 | 23,837 |
| 4.25% 12/15/41 | | 341,000 | 284,989 |
| Duke Energy Corp.: | | | |
| 2.45% 6/1/30 | | 182,000 | 156,271 |
| 3.75% 9/1/46 | | 80,000 | 58,227 |
| 3.95% 8/15/47 | | 250,000 | 186,859 |
| 4.2% 6/15/49 | | 90,000 | 69,219 |
| Duke Energy Florida LLC: | | | |
| 6.35% 9/15/37 | | 110,000 | 117,095 |
| 6.4% 6/15/38 | | 100,000 | 107,157 |
| Duke Energy Indiana LLC 2.75% 4/1/50 | | 100,000 | 60,499 |
| Duke Energy Ohio, Inc.: | | | |
| 2.125% 6/1/30 | | 70,000 | 59,094 |
| 3.65% 2/1/29 | | 160,000 | 151,009 |
| Duke Energy Progress LLC: | | | |
| 3.7% 10/15/46 | | 170,000 | 125,975 |
| 5.25% 3/15/33 | | 100,000 | 99,701 |
| Entergy Corp. 0.9% 9/15/25 | | 400,000 | 378,471 |
| Entergy Louisiana LLC: | | | |
| 3.1% 6/15/41 | | 110,000 | 79,377 |
| 4.2% 4/1/50 | | 70,000 | 54,895 |
| Entergy Mississippi LLC 5% 9/1/33 | | 90,000 | 87,198 |
| Entergy, Inc.: | | | |
| 3.55% 9/30/49 | | 29,000 | 20,728 |
| 5.15% 1/15/33 | | 110,000 | 108,820 |
| Eversource Energy: | | | |
| 2.55% 3/15/31 | | 120,000 | 99,763 |
| 3.3% 1/15/28 | | 62,000 | 57,909 |
| 3.45% 1/15/50 | | 60,000 | 41,028 |
| 5.45% 3/1/28 | | 150,000 | 150,443 |
| Exelon Corp.: | | | |
| 3.4% 4/15/26 | | 150,000 | 145,136 |
| 4.05% 4/15/30 | | 230,000 | 215,833 |
| 4.45% 4/15/46 | | 144,000 | 118,749 |
| 5.45% 3/15/34 | | 30,000 | 29,787 |
| FirstEnergy Corp.: | | | |
| 1.6% 1/15/26 | | 85,000 | 80,005 |
| 5.1% 7/15/47 | | 140,000 | 120,476 |
| Florida Power & Light Co.: | | | |
| 2.85% 4/1/25 | | 317,000 | 310,775 |
| 2.875% 12/4/51 | | 150,000 | 95,266 |
| 3.15% 10/1/49 | | 100,000 | 67,998 |
| 4.05% 10/1/44 | | 90,000 | 74,056 |
| 4.125% 6/1/48 | | 26,000 | 21,161 |
| 5.1% 4/1/33 | | 70,000 | 69,673 |
| Georgia Power Co.: | | | |
| 4.95% 5/17/33 | | 200,000 | 195,002 |
| 5.25% 3/15/34 | | 100,000 | 99,684 |
| Indiana Michigan Power Co. 3.75% 7/1/47 | | 100,000 | 73,607 |
| Interstate Power and Light Co.: | | | |
| 2.3% 6/1/30 | | 93,000 | 79,419 |
| 3.6% 4/1/29 | | 80,000 | 74,914 |
| Kentucky Utilities Co. 5.125% 11/1/40 | | 100,000 | 94,031 |
| MidAmerican Energy Co.: | | | |
| 3.65% 4/15/29 | | 190,000 | 179,662 |
| 3.65% 8/1/48 | | 30,000 | 22,512 |
| 5.8% 10/15/36 | | 100,000 | 103,601 |
| Nevada Power Co. 6% 3/15/54 | | 20,000 | 20,321 |
| NextEra Energy Capital Holdings, Inc.: | | | |
| 1.875% 1/15/27 | | 500,000 | 460,621 |
| 2.44% 1/15/32 | | 500,000 | 409,917 |
| 3.5% 4/1/29 | | 140,000 | 130,106 |
| Northern States Power Co.: | | | |
| 2.9% 3/1/50 | | 80,000 | 50,962 |
| 3.4% 8/15/42 | | 100,000 | 75,533 |
| 3.6% 9/15/47 | | 50,000 | 36,451 |
| NSTAR Electric Co. 4.95% 9/15/52 | | 50,000 | 44,916 |
| Oglethorpe Power Corp. 5.8% 6/1/54 (e) | | 100,000 | 97,839 |
| Oncor Electric Delivery Co. LLC: | | | |
| 3.1% 9/15/49 | | 100,000 | 66,493 |
| 3.75% 4/1/45 | | 120,000 | 93,044 |
| 4.55% 9/15/32 | | 150,000 | 143,326 |
| 5.35% 10/1/52 | | 20,000 | 19,085 |
| Pacific Gas & Electric Co.: | | | |
| 2.1% 8/1/27 | | 210,000 | 189,478 |
| 3.3% 8/1/40 | | 100,000 | 71,214 |
| 3.5% 8/1/50 | | 682,000 | 445,076 |
| 5.55% 5/15/29 | | 130,000 | 130,292 |
| 6.75% 1/15/53 | | 30,000 | 31,138 |
| PacifiCorp: | | | |
| 5.8% 1/15/55 | | 150,000 | 145,239 |
| 6% 1/15/39 | | 235,000 | 238,569 |
| PECO Energy Co. 3.9% 3/1/48 | | 96,000 | 74,626 |
| PG&E Wildfire Recovery: | | | |
| 5.099% 6/1/54 | | 50,000 | 47,834 |
| 5.212% 12/1/49 | | 160,000 | 154,623 |
| PPL Capital Funding, Inc. 4% 9/15/47 | | 20,000 | 14,258 |
| PPL Electric Utilities Corp.: | | | |
| 3% 10/1/49 | | 100,000 | 66,152 |
| 5.25% 5/15/53 | | 20,000 | 19,040 |
| Public Service Co. of Colorado: | | | |
| 3.7% 6/15/28 | | 87,000 | 82,623 |
| 6.25% 9/1/37 | | 182,000 | 190,722 |
| Public Service Electric & Gas Co.: | | | |
| 2.45% 1/15/30 | | 70,000 | 61,178 |
| 2.7% 5/1/50 | | 100,000 | 62,740 |
| 3.15% 1/1/50 | | 70,000 | 47,942 |
| 3.6% 12/1/47 | | 44,000 | 32,739 |
| 3.65% 9/1/42 | | 70,000 | 54,874 |
| 5.2% 8/1/33 | | 40,000 | 40,057 |
| Puget Sound Energy, Inc. 4.223% 6/15/48 | | 45,000 | 35,683 |
| Southern California Edison Co.: | | | |
| 4% 4/1/47 | | 562,000 | 430,104 |
| 5.75% 4/15/54 | | 20,000 | 19,573 |
| 5.95% 2/1/38 | | 50,000 | 50,598 |
| Southern Co.: | | | |
| 3.25% 7/1/26 | | 352,000 | 338,415 |
| 3.7% 4/30/30 | | 120,000 | 110,633 |
| Southwestern Electric Power Co. 3.85% 2/1/48 | | 190,000 | 136,573 |
| Southwestern Public Service Co. 3.75% 6/15/49 | | 80,000 | 57,486 |
| Tampa Electric Co. 4.45% 6/15/49 | | 100,000 | 83,747 |
| Tucson Electric Power Co. 5.5% 4/15/53 | | 50,000 | 48,159 |
| Union Electric Co. 5.45% 3/15/53 | | 130,000 | 125,038 |
| Virginia Electric & Power Co.: | | | |
| 2.4% 3/30/32 | | 60,000 | 49,299 |
| 3.3% 12/1/49 | | 60,000 | 40,456 |
| 3.8% 9/15/47 | | 50,000 | 37,070 |
| 4.6% 12/1/48 | | 52,000 | 44,228 |
| 5.3% 8/15/33 | | 50,000 | 49,726 |
| 5.35% 1/15/54 | | 20,000 | 18,870 |
| 5.7% 8/15/53 | | 50,000 | 49,719 |
| Wisconsin Power & Light Co. 4.95% 4/1/33 | | 100,000 | 96,756 |
| Xcel Energy, Inc.: | | | |
| 3.4% 6/1/30 | | 63,000 | 56,553 |
| 4% 6/15/28 | | 76,000 | 72,429 |
| | | | 12,748,117 |
| Gas Utilities - 0.1% | | | |
| Atmos Energy Corp.: | | | |
| 5.45% 10/15/32 | | 180,000 | 182,290 |
| 5.9% 11/15/33 | | 80,000 | 83,539 |
| 6.2% 11/15/53 | | 60,000 | 64,591 |
| CenterPoint Energy Resources Corp. 5.4% 7/1/34 | | 130,000 | 128,724 |
| Eastern Energy Gas Holdings LLC 2.5% 11/15/24 | | 50,000 | 49,412 |
| Piedmont Natural Gas Co., Inc. 2.5% 3/15/31 | | 100,000 | 83,951 |
| Southern California Gas Co. 5.2% 6/1/33 | | 100,000 | 98,733 |
| Southern Co. Gas Capital Corp. 3.95% 10/1/46 | | 308,000 | 231,183 |
| Southwest Gas Corp. 5.45% 3/23/28 | | 76,000 | 76,575 |
| | | | 998,998 |
| Independent Power and Renewable Electricity Producers - 0.0% | | | |
| Constellation Energy Generation, LLC: | | | |
| 5.8% 3/1/33 | | 130,000 | 132,643 |
| 6.5% 10/1/53 | | 70,000 | 74,298 |
| Southern Power Co. 4.95% 12/15/46 | | 80,000 | 69,890 |
| The AES Corp. 2.45% 1/15/31 | | 70,000 | 57,632 |
| | | | 334,463 |
| Multi-Utilities - 0.5% | | | |
| Ameren Corp. 5.7% 12/1/26 | | 200,000 | 201,584 |
| Ameren Illinois Co.: | | | |
| 4.5% 3/15/49 | | 30,000 | 25,583 |
| 4.95% 6/1/33 | | 140,000 | 136,649 |
| 5.55% 7/1/54 | | 50,000 | 49,035 |
| Berkshire Hathaway Energy Co.: | | | |
| 4.25% 10/15/50 | | 290,000 | 227,342 |
| 4.45% 1/15/49 | | 54,000 | 44,140 |
| CenterPoint Energy, Inc. 3.7% 9/1/49 | | 80,000 | 57,519 |
| CMS Energy Corp. 4.875% 3/1/44 | | 40,000 | 36,150 |
| Consolidated Edison Co. of New York, Inc.: | | | |
| 3.95% 4/1/50 | | 130,000 | 101,432 |
| 4.65% 12/1/48 | | 50,000 | 42,673 |
| 5.2% 3/1/33 | | 100,000 | 99,780 |
| 5.5% 12/1/39 | | 256,000 | 252,269 |
| 6.2% 6/15/36 | | 150,000 | 159,348 |
| Consumers Energy Co.: | | | |
| 2.5% 5/1/60 | | 100,000 | 56,245 |
| 4.625% 5/15/33 | | 130,000 | 124,466 |
| 4.9% 2/15/29 | | 110,000 | 109,498 |
| Dominion Energy, Inc.: | | | |
| 3.375% 4/1/30 | | 720,000 | 650,372 |
| 4.6% 3/15/49 | | 50,000 | 41,524 |
| 4.7% 12/1/44 | | 26,000 | 22,000 |
| 7% 6/15/38 | | 130,000 | 141,668 |
| DTE Energy Co. 2.85% 10/1/26 | | 140,000 | 132,531 |
| NiSource, Inc.: | | | |
| 0.95% 8/15/25 | | 280,000 | 265,941 |
| 2.95% 9/1/29 | | 190,000 | 170,770 |
| 3.49% 5/15/27 | | 50,000 | 47,703 |
| 3.95% 3/30/48 | | 46,000 | 34,501 |
| 5.25% 2/15/43 | | 156,000 | 143,016 |
| Public Service Enterprise Group, Inc.: | | | |
| 5.85% 11/15/27 | | 100,000 | 101,711 |
| 5.875% 10/15/28 | | 70,000 | 71,597 |
| 6.125% 10/15/33 | | 30,000 | 31,169 |
| Puget Energy, Inc. 4.1% 6/15/30 | | 200,000 | 184,006 |
| San Diego Gas & Electric Co. 5.35% 4/1/53 | | 100,000 | 94,502 |
| Sempra 6% 10/15/39 | | 274,000 | 277,172 |
| WEC Energy Group, Inc. 4.75% 1/15/28 | | 100,000 | 99,005 |
| | | | 4,232,901 |
| Water Utilities - 0.0% | | | |
| American Water Capital Corp. 3.75% 9/1/47 | | 280,000 | 211,801 |
TOTAL UTILITIES | | | 18,526,280 |
| TOTAL NONCONVERTIBLE BONDS (Cost $254,761,719) | | | 226,982,197 |
| | | | |
| U.S. Government and Government Agency Obligations - 42.0% |
| | | Principal Amount (a) | Value ($) |
| U.S. Government Agency Obligations - 0.9% | | | |
| Fannie Mae: | | | |
| 0.375% 8/25/25 | | 95,000 | 90,070 |
| 0.5% 6/17/25 | | 2,248,000 | 2,150,527 |
| 0.625% 4/22/25 | | 258,000 | 248,779 |
| 0.875% 8/5/30 | | 339,000 | 274,637 |
| 1.75% 7/2/24 | | 100,000 | 99,989 |
| 1.875% 9/24/26 | | 60,000 | 56,426 |
| 5.625% 7/15/37 | | 100,000 | 109,666 |
| Federal Farm Credit Bank 1.4% 3/10/28 | | 900,000 | 802,199 |
| Federal Home Loan Bank: | | | |
| 0.375% 9/4/25 | | 160,000 | 151,836 |
| 0.79% 2/25/26 | | 750,000 | 699,931 |
| 1.5% 8/15/24 | | 100,000 | 99,509 |
| 4.75% 3/10/34 | | 130,000 | 130,591 |
| 5.5% 7/15/36 | | 150,000 | 163,293 |
| Freddie Mac: | | | |
| 0% 11/15/38 | | 210,000 | 102,765 |
| 0.375% 7/21/25 | | 448,000 | 426,831 |
| 0.375% 9/23/25 | | 231,000 | 218,322 |
| 6.25% 7/15/32 | | 360,000 | 402,881 |
| Tennessee Valley Authority: | | | |
| 0.75% 5/15/25 | | 600,000 | 577,227 |
| 2.875% 2/1/27 | | 130,000 | 124,468 |
| 4.25% 9/15/65 | | 30,000 | 25,686 |
| 5.25% 9/15/39 | | 200,000 | 207,321 |
| 5.88% 4/1/36 | | 260,000 | 285,495 |
TOTAL U.S. GOVERNMENT AGENCY OBLIGATIONS | | | 7,448,449 |
| U.S. Treasury Obligations - 41.1% | | | |
| U.S. Treasury Bonds: | | | |
| 1.125% 5/15/40 | | 1,031,000 | 634,427 |
| 1.125% 8/15/40 | | 331,000 | 201,548 |
| 1.25% 5/15/50 | | 2,000 | 991 |
| 1.375% 11/15/40 | | 4,440,000 | 2,801,536 |
| 1.375% 8/15/50 | | 5,875,000 | 3,006,577 |
| 1.625% 11/15/50 | | 4,208,000 | 2,303,880 |
| 1.75% 8/15/41 | | 3,170,000 | 2,094,677 |
| 1.875% 2/15/41 | | 4,015,000 | 2,747,295 |
| 1.875% 2/15/51 | | 1,514,000 | 884,152 |
| 1.875% 11/15/51 | | 3,115,000 | 1,808,160 |
| 2% 11/15/41 | | 1,418,000 | 974,155 |
| 2% 8/15/51 | | 1,564,000 | 939,500 |
| 2.25% 5/15/41 | | 280,000 | 202,584 |
| 2.25% 8/15/46 | | 110,000 | 73,326 |
| 2.25% 8/15/49 | | 129,000 | 83,376 |
| 2.25% 2/15/52 | | 1,201,000 | 765,075 |
| 2.375% 2/15/42 | | 780,000 | 567,647 |
| 2.375% 5/15/51 | | 2,575,000 | 1,695,879 |
| 2.5% 2/15/45 | | 18,000 | 12,840 |
| 2.5% 2/15/46 | | 112,000 | 78,916 |
| 2.5% 5/15/46 | | 93,000 | 65,354 |
| 2.75% 8/15/42 | | 197,000 | 151,521 |
| 2.75% 11/15/42 | | 587,000 | 449,858 |
| 2.75% 8/15/47 | | 51,000 | 37,150 |
| 2.75% 11/15/47 | | 107,000 | 77,792 |
| 2.875% 5/15/43 | | 20,000 | 15,531 |
| 2.875% 8/15/45 | | 156,000 | 118,481 |
| 2.875% 5/15/49 | | 1,000 | 739 |
| 2.875% 5/15/52 | | 1,170,000 | 857,528 |
| 3% 5/15/42 | | 89,000 | 71,443 |
| 3% 11/15/44 | | 299,000 | 233,512 |
| 3% 5/15/45 | | 4,000 | 3,109 |
| 3% 2/15/47 | | 49,000 | 37,554 |
| 3% 5/15/47 | | 48,000 | 36,716 |
| 3% 2/15/48 | | 87,000 | 66,198 |
| 3% 8/15/48 | | 3,000 | 2,276 |
| 3% 2/15/49 | | 134,000 | 101,500 |
| 3% 8/15/52 | | 4,160,000 | 3,129,588 |
| 3.125% 11/15/41 | | 113,000 | 93,097 |
| 3.125% 2/15/42 | | 65,000 | 53,381 |
| 3.125% 2/15/43 | | 838,000 | 678,584 |
| 3.125% 8/15/44 | | 167,000 | 133,463 |
| 3.125% 5/15/48 | | 29,000 | 22,552 |
| 3.25% 5/15/42 | | 400,000 | 332,625 |
| 3.375% 8/15/42 | | 5,620,000 | 4,746,705 |
| 3.375% 5/15/44 | | 886,000 | 738,149 |
| 3.375% 11/15/48 | | 157,000 | 127,507 |
| 3.5% 2/15/39 | | 8,000 | 7,198 |
| 3.625% 2/15/44 | | 2,427,000 | 2,102,199 |
| 3.625% 2/15/53 | | 600,000 | 510,422 |
| 3.625% 5/15/53 | | 2,520,000 | 2,144,461 |
| 3.75% 8/15/41 | | 45,000 | 40,639 |
| 3.75% 11/15/43 | | 1,120,000 | 989,887 |
| 3.875% 8/15/40 | | 52,000 | 48,224 |
| 3.875% 2/15/43 | | 2,990,000 | 2,702,680 |
| 3.875% 5/15/43 | | 1,750,000 | 1,578,857 |
| 4% 11/15/42 | | 3,480,000 | 3,207,038 |
| 4% 11/15/52 | | 4,160,000 | 3,789,825 |
| 4.125% 8/15/53 | | 1,260,000 | 1,173,326 |
| 4.25% 2/15/54 | | 6,841,000 | 6,513,915 |
| 4.375% 2/15/38 | | 12,000 | 11,980 |
| 4.375% 11/15/39 | | 24,000 | 23,729 |
| 4.375% 5/15/41 | | 32,000 | 31,381 |
| 4.375% 8/15/43 | | 2,070,000 | 1,998,035 |
| 4.5% 5/15/38 | | 92,000 | 92,895 |
| 4.5% 8/15/39 | | 17,000 | 17,057 |
| 4.5% 2/15/44 | | 2,160,000 | 2,118,825 |
| 4.625% 5/15/44 | | 1,590,000 | 1,587,019 |
| 4.625% 5/15/54 | | 1,990,000 | 2,017,673 |
| 4.75% 2/15/41 | | 48,000 | 49,298 |
| 4.75% 11/15/43 | | 5,080,000 | 5,147,469 |
| 5.5% 8/15/28 | | 4,000 | 4,177 |
| U.S. Treasury Notes: | | | |
| 0.25% 5/31/25 | | 224,000 | 214,193 |
| 0.25% 7/31/25 | | 45,000 | 42,734 |
| 0.25% 8/31/25 | | 2,584,000 | 2,444,807 |
| 0.25% 9/30/25 | | 2,013,000 | 1,898,039 |
| 0.25% 10/31/25 | | 1,394,000 | 1,310,088 |
| 0.375% 1/31/26 | | 1,602,000 | 1,493,051 |
| 0.375% 7/31/27 | | 509,000 | 448,954 |
| 0.375% 9/30/27 | | 1,151,000 | 1,009,103 |
| 0.5% 2/28/26 | | 7,878,000 | 7,335,772 |
| 0.5% 4/30/27 | | 718,000 | 641,684 |
| 0.5% 5/31/27 | | 1,393,000 | 1,241,239 |
| 0.5% 6/30/27 | | 2,827,000 | 2,511,944 |
| 0.5% 10/31/27 | | 3,232,000 | 2,836,964 |
| 0.625% 7/31/26 | | 5,694,000 | 5,238,035 |
| 0.625% 3/31/27 | | 1,460,000 | 1,313,316 |
| 0.625% 11/30/27 | | 1,680,000 | 1,476,956 |
| 0.625% 12/31/27 | | 3,820,000 | 3,347,573 |
| 0.625% 5/15/30 | | 2,549,000 | 2,060,408 |
| 0.625% 8/15/30 | | 360,000 | 288,506 |
| 0.75% 3/31/26 | | 2,331,000 | 2,173,840 |
| 0.75% 4/30/26 | | 961,000 | 893,805 |
| 0.75% 5/31/26 | | 1,269,000 | 1,176,849 |
| 0.75% 1/31/28 | | 98,000 | 86,049 |
| 1% 7/31/28 | | 1,229,000 | 1,073,503 |
| 1.125% 2/28/27 | | 691,000 | 631,833 |
| 1.125% 2/29/28 | | 624,000 | 554,361 |
| 1.125% 8/31/28 | | 110,000 | 96,375 |
| 1.25% 11/30/26 | | 545,000 | 503,337 |
| 1.25% 12/31/26 | | 2,240,000 | 2,064,913 |
| 1.25% 3/31/28 | | 2,218,000 | 1,975,320 |
| 1.25% 4/30/28 | | 2,488,000 | 2,210,627 |
| 1.25% 9/30/28 | | 748,000 | 657,305 |
| 1.25% 8/15/31 | | 6,574,000 | 5,335,212 |
| 1.375% 8/31/26 | | 253,000 | 235,873 |
| 1.375% 10/31/28 | | 580,000 | 511,442 |
| 1.5% 8/15/26 | | 557,000 | 521,230 |
| 1.5% 1/31/27 | | 5,287,000 | 4,892,953 |
| 1.5% 11/30/28 | | 1,091,000 | 965,450 |
| 1.5% 2/15/30 | | 876,000 | 751,854 |
| 1.625% 2/15/26 | | 261,000 | 247,919 |
| 1.625% 5/15/26 | | 264,000 | 249,253 |
| 1.625% 9/30/26 | | 653,000 | 611,142 |
| 1.625% 10/31/26 | | 457,000 | 426,777 |
| 1.625% 11/30/26 | | 180,000 | 167,738 |
| 1.625% 8/15/29 | | 66,000 | 57,835 |
| 1.75% 1/31/29 | | 81,000 | 72,223 |
| 1.875% 6/30/26 | | 589,000 | 557,433 |
| 1.875% 7/31/26 | | 909,000 | 858,366 |
| 1.875% 2/28/29 | | 230,000 | 205,958 |
| 2% 2/15/25 | | 82,000 | 80,324 |
| 2% 8/15/25 | | 50,000 | 48,346 |
| 2% 11/15/26 | | 25,000 | 23,525 |
| 2.125% 5/15/25 | | 13,000 | 12,663 |
| 2.25% 2/15/27 | | 393,000 | 370,510 |
| 2.25% 8/15/27 | | 639,000 | 597,041 |
| 2.25% 11/15/27 | | 682,000 | 634,420 |
| 2.375% 4/30/26 | | 405,000 | 388,041 |
| 2.375% 5/15/27 | | 46,000 | 43,323 |
| 2.5% 2/28/26 | | 191,000 | 183,882 |
| 2.5% 3/31/27 | | 2,220,000 | 2,104,230 |
| 2.625% 12/31/25 | | 331,000 | 320,217 |
| 2.625% 1/31/26 | | 461,000 | 445,243 |
| 2.625% 5/31/27 | | 2,770,000 | 2,626,955 |
| 2.625% 2/15/29 | | 391,000 | 362,469 |
| 2.625% 7/31/29 | | 4,810,000 | 4,432,152 |
| 2.75% 6/30/25 | | 113,000 | 110,415 |
| 2.75% 4/30/27 | | 2,550,000 | 2,429,473 |
| 2.75% 7/31/27 | | 2,460,000 | 2,335,847 |
| 2.75% 2/15/28 | | 363,000 | 342,255 |
| 2.75% 5/31/29 | | 530,000 | 492,362 |
| 2.75% 8/15/32 | | 7,776,000 | 6,919,729 |
| 2.875% 5/31/25 | | 144,000 | 141,037 |
| 2.875% 5/15/28 | | 216,000 | 204,061 |
| 2.875% 8/15/28 | | 113,000 | 106,467 |
| 2.875% 5/15/32 | | 120,000 | 108,117 |
| 3% 9/30/25 | | 148,000 | 144,393 |
| 3% 10/31/25 | | 130,000 | 126,714 |
| 3.125% 8/31/27 | | 1,900,000 | 1,822,813 |
| 3.125% 11/15/28 | | 940,000 | 892,596 |
| 3.125% 8/31/29 | | 820,000 | 773,363 |
| 3.25% 6/30/27 | | 70,000 | 67,542 |
| 3.25% 6/30/29 | | 100,000 | 95,004 |
| 3.375% 5/15/33 | | 3,460,000 | 3,206,582 |
| 3.5% 1/31/28 | | 2,820,000 | 2,731,104 |
| 3.5% 4/30/28 | | 4,620,000 | 4,466,779 |
| 3.5% 1/31/30 | | 2,340,000 | 2,240,916 |
| 3.5% 4/30/30 | | 660,000 | 631,022 |
| 3.5% 2/15/33 | | 180,000 | 168,708 |
| 3.625% 3/31/28 | | 1,770,000 | 1,720,219 |
| 3.625% 3/31/30 | | 3,450,000 | 3,321,703 |
| 3.75% 4/15/26 | | 3,540,000 | 3,476,667 |
| 3.75% 12/31/28 | | 1,670,000 | 1,627,337 |
| 3.75% 5/31/30 | | 2,570,000 | 2,488,784 |
| 3.75% 6/30/30 | | 1,600,000 | 1,548,750 |
| 3.75% 12/31/30 | | 1,360,000 | 1,313,781 |
| 3.875% 1/15/26 | | 2,240,000 | 2,206,313 |
| 3.875% 11/30/27 | | 1,840,000 | 1,804,997 |
| 3.875% 12/31/27 | | 2,950,000 | 2,893,535 |
| 3.875% 11/30/29 | | 2,450,000 | 2,392,961 |
| 3.875% 8/15/33 | | 1,590,000 | 1,529,630 |
| 4% 2/15/26 | | 720,000 | 710,269 |
| 4% 1/15/27 | | 1,440,000 | 1,419,075 |
| 4% 2/29/28 | | 3,120,000 | 3,072,469 |
| 4% 6/30/28 | | 5,210,000 | 5,130,832 |
| 4% 1/31/29 | | 4,380,000 | 4,312,589 |
| 4% 10/31/29 | | 1,950,000 | 1,917,018 |
| 4% 2/28/30 | | 1,610,000 | 1,580,882 |
| 4% 7/31/30 | | 1,800,000 | 1,765,688 |
| 4% 1/31/31 | | 3,980,000 | 3,899,934 |
| 4% 2/15/34 | | 2,630,000 | 2,552,744 |
| 4.125% 6/15/26 | | 2,680,000 | 2,649,222 |
| 4.125% 2/15/27 | | 1,840,000 | 1,818,869 |
| 4.125% 9/30/27 | | 4,180,000 | 4,132,648 |
| 4.125% 10/31/27 | | 2,270,000 | 2,244,551 |
| 4.125% 7/31/28 | | 1,940,000 | 1,919,463 |
| 4.125% 8/31/30 | | 2,270,000 | 2,241,093 |
| 4.125% 11/15/32 | | 2,940,000 | 2,890,502 |
| 4.25% 1/31/26 | | 10,590,000 | 10,488,237 |
| 4.25% 3/15/27 | | 1,280,000 | 1,269,750 |
| 4.25% 2/28/29 | | 1,820,000 | 1,811,824 |
| 4.25% 2/28/31 | | 4,050,000 | 4,026,111 |
| 4.375% 8/15/26 | | 720,000 | 715,275 |
| 4.375% 11/30/28 | | 3,730,000 | 3,729,417 |
| 4.375% 11/30/30 | | 5,010,000 | 5,014,110 |
| 4.375% 5/15/34 | | 3,060,000 | 3,060,956 |
| 4.5% 11/15/25 | | 1,000,000 | 993,945 |
| 4.5% 7/15/26 | | 2,090,000 | 2,081,020 |
| 4.5% 4/15/27 | | 440,000 | 439,347 |
| 4.5% 5/15/27 | | 4,550,000 | 4,543,957 |
| 4.5% 5/31/29 | | 1,280,000 | 1,288,700 |
| 4.5% 11/15/33 | | 4,270,000 | 4,309,364 |
| 4.625% 2/28/26 | | 2,720,000 | 2,710,225 |
| 4.625% 6/30/26 | | 710,000 | 708,638 |
| 4.625% 9/15/26 | | 2,240,000 | 2,237,025 |
| 4.625% 11/15/26 | | 2,850,000 | 2,848,664 |
| 4.625% 9/30/28 | | 3,190,000 | 3,217,040 |
| 4.625% 4/30/31 | | 2,500,000 | 2,540,234 |
| 4.625% 5/31/31 | | 3,730,000 | 3,790,613 |
| 4.875% 11/30/25 | | 3,630,000 | 3,625,888 |
| 4.875% 4/30/26 | | 8,790,000 | 8,803,048 |
| 4.875% 5/31/26 | | 7,660,000 | 7,675,559 |
| 4.875% 10/31/28 | | 860,000 | 876,058 |
| 4.875% 10/31/30 | | 990,000 | 1,017,960 |
| 5% 9/30/25 | | 300,000 | 299,871 |
TOTAL U.S. TREASURY OBLIGATIONS | | | 338,022,805 |
| TOTAL U.S. GOVERNMENT AND GOVERNMENT AGENCY OBLIGATIONS (Cost $372,566,481) | | | 345,471,254 |
| | | | |
| U.S. Government Agency - Mortgage Securities - 26.2% |
| | | Principal Amount (a) | Value ($) |
| Fannie Mae - 10.9% | | | |
| 1.5% 2/1/36 to 4/1/52 | | 7,479,573 | 6,111,685 |
| 2% 7/1/35 to 4/1/52 | | 28,706,891 | 23,082,579 |
| 2.5% 1/1/27 to 5/1/53 | | 18,503,934 | 15,444,197 |
| 3% 4/1/32 to 8/1/52 | | 18,044,408 | 15,756,758 |
| 3.5% 2/1/27 to 6/1/52 | | 7,763,575 | 7,093,996 |
| 4% 6/1/34 to 10/1/52 | | 7,385,736 | 6,865,794 |
| 4.5% 10/1/39 to 8/1/53 | | 3,393,627 | 3,228,033 |
| 5% 7/1/48 to 2/1/54 | | 3,360,217 | 3,265,471 |
| 5.5% 5/1/44 to 6/1/54 | | 4,237,835 | 4,185,359 |
| 6% 10/1/52 to 5/1/54 | | 3,130,555 | 3,147,711 |
| 6.5% 4/1/43 to 6/1/54 | | 1,465,764 | 1,493,383 |
TOTAL FANNIE MAE | | | 89,674,966 |
| Freddie Mac - 8.3% | | | |
| 1.5% 7/1/36 to 11/1/51 | | 3,876,299 | 2,989,616 |
| 2% 10/1/30 to 1/1/52 | | 25,403,300 | 20,402,727 |
| 2% 9/1/35 | | 201,553 | 177,992 |
| 2% 11/1/35 | | 298,805 | 263,877 |
| 2% 11/1/35 | | 101,142 | 89,319 |
| 2.5% 4/1/27 to 4/1/52 | | 18,409,723 | 15,313,611 |
| 3% 1/1/29 to 6/1/52 | | 2,248,459 | 1,952,405 |
| 3% 8/1/47 | | 28,181 | 24,575 |
| 3.5% 7/1/33 to 9/1/52 | | 5,471,521 | 4,923,012 |
| 4% 3/1/26 to 9/1/52 | | 4,115,685 | 3,844,176 |
| 4.5% 7/1/38 to 2/1/54 | | 4,232,218 | 4,024,252 |
| 5% 6/1/30 to 12/1/53 | | 4,126,976 | 4,016,875 |
| 5.5% 6/1/49 to 4/1/54 | | 4,026,874 | 3,976,767 |
| 6% 12/1/52 to 5/1/54 | | 2,992,974 | 3,021,775 |
| 6.5% 11/1/52 to 12/1/53 | | 2,765,364 | 2,819,667 |
TOTAL FREDDIE MAC | | | 67,840,646 |
| Ginnie Mae - 6.3% | | | |
| Ginnie Mae: | | | |
| 5.5% 7/1/54 (d) | | 650,000 | 644,897 |
| 5.5% 7/1/54 (d) | | 400,000 | 396,860 |
| 5.5% 8/1/54 (d) | | 400,000 | 396,672 |
| 5.5% 8/1/54 (d) | | 125,000 | 123,960 |
| 1.5% 5/20/51 | | 100,396 | 78,432 |
| 2% 12/20/50 to 5/20/52 | | 10,338,494 | 8,374,359 |
| 2.5% 10/20/46 to 10/20/53 | | 10,742,075 | 9,047,475 |
| 3% 7/20/42 to 11/20/53 | | 7,731,221 | 6,781,410 |
| 3.5% 2/20/46 to 12/20/52 | | 5,819,194 | 5,263,151 |
| 4% 3/20/47 to 1/20/53 | | 3,780,148 | 3,513,379 |
| 4.5% 1/20/47 to 6/20/54 | | 3,736,294 | 3,561,663 |
| 5% 11/20/47 to 11/20/53 | | 3,191,215 | 3,114,890 |
| 5.5% 9/20/47 to 12/20/53 | | 2,635,426 | 2,616,131 |
| 6% 12/20/52 to 1/20/53 | | 906,442 | 911,320 |
| 6% 7/1/54 (d) | | 100,000 | 100,430 |
| 6% 7/1/54 (d) | | 425,000 | 426,826 |
| 6% 7/1/54 (d) | | 325,000 | 326,397 |
| 6% 7/1/54 (d) | | 700,000 | 703,008 |
| 6% 7/1/54 (d) | | 25,000 | 25,107 |
| 6% 7/1/54 (d) | | 750,000 | 753,223 |
| 6% 8/1/54 (d) | | 600,000 | 602,180 |
| 6% 8/1/54 (d) | | 475,000 | 476,726 |
| 6% 8/1/54 (d) | | 250,000 | 250,908 |
| 6.5% 12/20/52 to 7/20/53 | | 520,861 | 528,295 |
| 6.5% 7/1/54 (d) | | 1,300,000 | 1,318,052 |
| 6.5% 8/1/54 (d) | | 1,300,000 | 1,316,681 |
TOTAL GINNIE MAE | | | 51,652,432 |
| Uniform Mortgage Backed Securities - 0.7% | | | |
| 2% 7/1/54 (d) | | 50,000 | 39,105 |
| 3% 7/1/54 (d) | | 200,000 | 170,188 |
| 3% 7/1/54 (d) | | 300,000 | 255,281 |
| 3.5% 7/1/54 (d) | | 1,000,000 | 885,078 |
| 3.5% 7/1/54 (d) | | 100,000 | 88,508 |
| 3.5% 8/1/54 (d) | | 1,100,000 | 973,757 |
| 5% 7/1/54 (d) | | 425,000 | 410,739 |
| 5.5% 7/1/54 (d) | | 500,000 | 493,145 |
| 6% 7/1/54 (d) | | 75,000 | 75,211 |
| 6% 7/1/54 (d) | | 800,000 | 802,250 |
| 7% 7/1/54 (d) | | 1,200,000 | 1,233,759 |
| Uniform Mortgage Backed Securities: | | | |
| 2% 7/1/39 (d) | | 50,000 | 43,949 |
| 2.5% 7/1/54 (d) | | 225,000 | 183,762 |
| 2.5% 8/1/54 (d) | | 75,000 | 61,310 |
TOTAL UNIFORM MORTGAGE BACKED SECURITIES | | | 5,716,042 |
| TOTAL U.S. GOVERNMENT AGENCY - MORTGAGE SECURITIES (Cost $243,425,208) | | | 214,884,086 |
| | | | |
| Asset-Backed Securities - 0.3% |
| | | Principal Amount (a) | Value ($) |
| American Express Credit Accoun Series 2023-4 Class A, 5.15% 9/15/30 | | 100,000 | 101,218 |
| Capital One Multi-Asset Execution Trust: | | | |
| Series 2019-A3 Class A3, 2.06% 8/15/28 | | 116,000 | 108,888 |
| Series 2021-A2 Class A2, 1.39% 7/15/30 | | 150,000 | 130,680 |
| Capital One Prime Auto Receivables Series 2023-1 Class A3, 4.87% 2/15/28 | | 60,000 | 59,589 |
| CarMax Auto Owner Trust: | | | |
| Series 2021-1 Class A3, 0.34% 12/15/25 | | 30,853 | 30,663 |
| Series 2022-3 Class A2A, 3.97% 4/15/27 | | 302,788 | 299,067 |
| Series 2023 2 Class A3, 5.05% 1/18/28 | | 220,000 | 218,965 |
| Chase Issuance Trust Series 2023-A2 Class A, 5.08% 9/15/30 | | 400,000 | 403,306 |
| Citibank Credit Card Issuance Trust Series 2018-A7 Class A7, 3.96% 10/13/30 | | 250,000 | 241,068 |
| Ford Credit Auto Owner Trust Series 2023-A Class A3, 4.65% 2/15/28 | | 156,000 | 154,544 |
| Ford Credit Floorplan Master Owner Trust Series 2018-4 Class A, 4.06% 11/15/30 | | 258,000 | 247,645 |
| GM Financial Consumer Automobile Receivables Series 2023 2 Class A3, 4.47% 2/16/28 | | 220,000 | 217,572 |
| GM Financial Consumer Automobile Receivables Trust Series 2021-1 Class A3, 0.35% 10/16/25 | | 4,352 | 4,341 |
| Hyundai Auto Receivables Trust: | | | |
| Series 2022-B Class A3, 3.72% 11/16/26 | | 192,502 | 190,249 |
| Series 2022-C Class A3, 5.39% 6/15/27 | | 150,000 | 149,790 |
| Series 2023 A Class A3, 4.58% 4/15/27 | | 220,000 | 218,067 |
| TOTAL ASSET-BACKED SECURITIES (Cost $2,856,702) | | | 2,775,652 |
| | | | |
| Commercial Mortgage Securities - 1.4% |
| | | Principal Amount (a) | Value ($) |
| BANK sequential payer: | | | |
| Series 2017-BNK4 Class ASB, 3.419% 5/15/50 | | 104,079 | 101,442 |
| Series 2020-BN28 Class A4, 1.844% 3/15/63 | | 360,000 | 294,760 |
| Series 2022-BNK39 Class A4, 2.928% 2/15/55 | | 100,000 | 85,106 |
| Barclays Commercial Mortgage Securities sequential payer Series 2021-C12 Class A5, 2.689% 11/15/54 | | 220,000 | 185,656 |
| BBCMS Mortgage Trust sequential payer Series 2024-C26 Class A5, 5.829% 5/15/57 (b) | | 281,000 | 293,069 |
| Benchmark Mortgage Trust: | | | |
| sequential payer: | | | |
Series 2020-B19 Class A5, 1.85% 9/15/53 | | 410,000 | 331,004 |
Series 2021-B24 Class A5, 2.5843% 3/15/54 | | 500,000 | 414,049 |
| Series 2019-B12 Class A5, 3.1156% 8/15/52 | | 36,000 | 32,487 |
| Series 2019-B9 Class A5, 4.0156% 3/15/52 | | 130,000 | 120,921 |
| Bmo 2024-C9 Mtg Trust sequential payer Series 2024-C9 Class A5, 5.5494% 7/15/57 | | 225,000 | 231,750 |
| BMO Mortgage Trust sequential payer Series 2022-C1 Class A5, 3.374% 2/15/55 | | 100,000 | 87,749 |
| Citigroup Commercial Mortgage Trust sequential payer: | | | |
| Series 2015-GC29 Class A4, 3.192% 4/10/48 | | 80,000 | 78,277 |
| Series 2016-C1 Class A4, 3.209% 5/10/49 | | 90,000 | 86,065 |
| Series 2018-B2 Class A4, 4.009% 3/10/51 | | 1,000,000 | 948,780 |
| Computershare Corporate Trust Series 2018-C48 Class A5, 4.302% 1/15/52 | | 123,000 | 117,659 |
| CSAIL Commercial Mortgage Trust sequential payer Series 2019-C17: | | | |
| Class A4, 2.7628% 9/15/52 | | 200,000 | 178,450 |
| Class A5, 3.0161% 9/15/52 | | 200,000 | 176,645 |
| Freddie Mac: | | | |
| sequential payer: | | | |
Series 2016-K057 Class A2, 2.57% 7/25/26 | | 159,400 | 152,211 |
Series 2020-K104 Class A2, 2.253% 1/25/30 | | 680,000 | 599,639 |
Series 2020-K116 Class A2, 1.378% 7/25/30 | | 770,000 | 635,683 |
Series 2020-K117 Class A2, 1.406% 8/25/30 | | 590,000 | 486,669 |
Series 2020-K118 Class A2, 1.493% 9/25/30 | | 590,000 | 488,032 |
Series 2020-K121 Class A2, 1.547% 10/25/30 | | 890,000 | 736,195 |
Series 2021-K125 Class A2, 1.846% 1/25/31 | | 100,000 | 83,839 |
Series 2021-K126 Class A2, 2.074% 1/25/31 | | 200,000 | 170,231 |
Series 2021-K128 Class A2, 2.02% 3/25/31 | | 200,000 | 169,431 |
Series 2022-K140 Class A2, 2.25% 1/25/32 | | 800,000 | 673,668 |
Series 2023-156 Class A2, 4.43% 2/25/33 | | 125,000 | 121,862 |
Series K080 Class A2, 3.926% 7/25/28 | | 80,000 | 77,309 |
| Series 2017-K068 Class A2, 3.244% 8/25/27 | | 130,000 | 123,866 |
| Series 2019-K094 Class A2, 2.903% 6/25/29 | | 300,000 | 275,915 |
| Series 2019-K1510 Class A2, 3.718% 1/25/31 | | 124,000 | 116,554 |
| Series 2021-K123 Class A2, 1.621% 12/25/30 | | 700,000 | 580,502 |
| Series K079 Class A2, 3.926% 6/25/28 | | 20,000 | 19,334 |
| GS Mortgage Securities Trust sequential payer: | | | |
| Series 2014-GC26 Class A4, 3.364% 11/10/47 | | 48,919 | 48,741 |
| Series 2020-GC45 Class A5, 2.9106% 2/13/53 | | 260,000 | 229,282 |
| JPMBB Commercial Mortgage Securities Trust sequential payer Series 2014-C24 Class A5, 3.6385% 11/15/47 | | 150,000 | 148,722 |
| JPMDB Commercial Mortgage Securities Trust sequential payer Series 2020-COR7 Class A5, 2.1798% 5/13/53 | | 500,000 | 396,905 |
| Morgan Stanley Capital I Trust sequential payer Series 2020-L4 Class A3, 2.698% 2/15/53 | | 100,000 | 87,051 |
| UBS Commercial Mortgage Trust sequential payer Series 2019-C16 Class A4, 3.6048% 4/15/52 | | 350,000 | 319,236 |
| Wells Fargo Commercial Mortgage Trust sequential payer: | | | |
| Series 2019-C52 Class A5, 2.892% 8/15/52 | | 200,000 | 177,144 |
| Series 2019-C54 Class A4, 3.146% 12/15/52 | | 538,000 | 480,375 |
| Wells Fargo Commercial Mtg Trust 2020-C sequential payer Series 2020-C55 Class A5, 2.725% 2/15/53 | | 90,000 | 78,752 |
| TOTAL COMMERCIAL MORTGAGE SECURITIES (Cost $13,064,007) | | | 11,241,017 |
| | | | |
| Municipal Securities - 0.4% |
| | | Principal Amount (a) | Value ($) |
| American Muni. Pwr., Inc. Rev. (Combined Hydroelectric Proj.) Series 2010 B, 7.834% 2/15/41 | | 55,000 | 66,430 |
| Bay Area Toll Auth. San Francisco Bay Toll Bridge Rev.: | | | |
| Series 2009 F2, 6.263% 4/1/49 | | 75,000 | 81,018 |
| Series 2010 S1, 7.043% 4/1/50 | | 75,000 | 88,655 |
| California Gen. Oblig.: | | | |
| Series 2009, 7.55% 4/1/39 | | 145,000 | 172,364 |
| Series 2010, 7.6% 11/1/40 | | 350,000 | 419,320 |
| California State Univ. Rev. Series 2021 B, 2.719% 11/1/52 | | 195,000 | 129,463 |
| Chicago O'Hare Int'l. Arpt. Rev. Series 2010 B, 6.395% 1/1/40 | | 250,000 | 268,929 |
| Dallas Area Rapid Transit Sales Tax Rev. Series 2021 A, 2.613% 12/1/48 | | 200,000 | 135,834 |
| Dallas Fort Worth Int'l. Arpt. Rev.: | | | |
| Series 2019 A, 3.144% 11/1/45 | | 20,000 | 14,896 |
| Series 2021 C, 2.843% 11/1/46 | | 150,000 | 107,092 |
| Series 2022 A, 4.507% 11/1/51 | | 65,000 | 57,691 |
| Golden State Tobacco Securitization Corp. Tobacco Settlement Rev. Series 2021 B: | | | |
| 2.746% 6/1/34 | | 80,000 | 66,790 |
| 3.293% 6/1/42 | | 40,000 | 31,118 |
| Idaho Energy Resources Auth. Series 2021, 2.861% 9/1/46 | | 45,000 | 31,638 |
| Illinois Gen. Oblig. Series 2003, 5.1% 6/1/33 | | 470,588 | 461,746 |
| Massachusetts School Bldg. Auth. Dedicated Sales Tax Rev. Series 2019 B, 3.395% 10/15/40 | | 100,000 | 81,340 |
| Massachusetts Wtr. Resources Auth. Wtr. & Swr. Rev. Series 2021 C, 2.823% 8/1/41 | | 100,000 | 78,270 |
| Michigan Strategic Fund Ltd. Oblig. Rev. Series 2021 A, 3.225% 9/1/47 | | 100,000 | 76,110 |
| New Jersey Tpk. Auth. Tpk. Rev. Series 2009 E, 7.414% 1/1/40 | | 160,000 | 187,720 |
| New York City Gen. Oblig. Series 2011 F1, 6.271% 12/1/37 | | 100,000 | 106,748 |
| New York City Muni. Wtr. Fin. Auth. Wtr. & Swr. Sys. Rev. Series 2010 EE, 6.011% 6/15/42 | | 100,000 | 103,993 |
| New York Metropolitan Trans. Auth. Rev. Series 2010 A, 6.668% 11/15/39 | | 60,000 | 65,070 |
| New York State Dorm. Auth. Series 2021 C, 2.202% 3/15/34 | | 200,000 | 158,390 |
| Port Auth. of New York & New Jersey Series 225, 3.175% 7/15/60 | | 400,000 | 267,789 |
| Univ. of California Regents Med. Ctr. Pool Rev. Series N: | | | |
| 3.006% 5/15/50 | | 175,000 | 117,546 |
| 3.256% 5/15/60 | | 150,000 | 100,098 |
| Univ. of Michigan Rev. Series 2022 A, 4.454% 4/1/22 | | 80,000 | 66,174 |
| Univ. of Virginia Gen. Rev. Series 2021 B, 2.584% 11/1/51 | | 140,000 | 88,852 |
| TOTAL MUNICIPAL SECURITIES (Cost $4,715,848) | | | 3,631,084 |
| | | | |
| Foreign Government and Government Agency Obligations - 1.7% |
| | | Principal Amount (a) | Value ($) |
| Alberta Province: | | | |
| 1.3% 7/22/30 | | 130,000 | 107,563 |
| 3.3% 3/15/28 | | 75,000 | 71,534 |
| British Columbia Province: | | | |
| 4.2% 7/6/33 | | 140,000 | 134,166 |
| 4.9% 4/24/29 | | 200,000 | 202,638 |
| Chilean Republic: | | | |
| 3.24% 2/6/28 | | 200,000 | 187,938 |
| 3.86% 6/21/47 | | 325,000 | 252,525 |
| 4.95% 1/5/36 | | 270,000 | 258,795 |
| Indonesian Republic: | | | |
| 2.85% 2/14/30 | | 200,000 | 176,991 |
| 3.5% 2/14/50 | | 300,000 | 220,005 |
| 3.85% 10/15/30 | | 348,000 | 323,640 |
| 4.1% 4/24/28 | | 200,000 | 192,054 |
| Israeli State: | | | |
| 2.75% 7/3/30 | | 210,000 | 177,036 |
| 3.25% 1/17/28 | | 200,000 | 183,229 |
| 3.375% 1/15/50 | | 225,000 | 143,525 |
| 5.5% 3/12/34 | | 200,000 | 189,798 |
| Italian Republic: | | | |
| 2.375% 10/17/24 | | 550,000 | 544,539 |
| 2.875% 10/17/29 | | 350,000 | 311,543 |
| 4% 10/17/49 | | 200,000 | 148,620 |
| Korea Development Bank 1.625% 1/19/31 | | 200,000 | 163,070 |
| Korean Republic: | | | |
| 1% 9/16/30 | | 230,000 | 185,974 |
| 4.5% 7/3/29 | | 200,000 | 199,411 |
| Ontario Province: | | | |
| 1.05% 5/21/27 | | 1,413,000 | 1,274,724 |
| 1.125% 10/7/30 | | 175,000 | 141,958 |
| 2.125% 1/21/32 | | 200,000 | 167,496 |
| 2.3% 6/15/26 | | 50,000 | 47,594 |
| 2.5% 4/27/26 | | 115,000 | 110,169 |
| Panamanian Republic: | | | |
| 3.16% 1/23/30 | | 800,000 | 674,800 |
| 4.5% 4/16/50 | | 250,000 | 168,438 |
| 6.7% 1/26/36 | | 100,000 | 97,469 |
| Peruvian Republic: | | | |
| 1.862% 12/1/32 | | 340,000 | 257,550 |
| 2.78% 12/1/60 | | 100,000 | 56,094 |
| 2.844% 6/20/30 | | 190,000 | 166,428 |
| 3.55% 3/10/51 | | 170,000 | 120,381 |
| Philippine Republic: | | | |
| 2.65% 12/10/45 | | 600,000 | 393,188 |
| 3% 2/1/28 | | 200,000 | 186,125 |
| 5% 7/17/33 | | 200,000 | 197,375 |
| 5.17% 10/13/27 | | 200,000 | 200,000 |
| 6.375% 10/23/34 | | 100,000 | 109,438 |
| 9.5% 2/2/30 | | 110,000 | 132,584 |
| Polish Government: | | | |
| 3.25% 4/6/26 | | 73,000 | 71,003 |
| 4.625% 3/18/29 | | 230,000 | 227,866 |
| 5.125% 9/18/34 | | 150,000 | 147,585 |
| 5.5% 4/4/53 | | 100,000 | 97,878 |
| 5.5% 3/18/54 | | 100,000 | 97,008 |
| Quebec Province: | | | |
| 1.9% 4/21/31 | | 220,000 | 185,416 |
| 2.75% 4/12/27 | | 95,000 | 90,226 |
| 3.625% 4/13/28 | | 250,000 | 240,897 |
| United Mexican States: | | | |
| 3.25% 4/16/30 | | 1,971,000 | 1,732,016 |
| 3.5% 2/12/34 | | 619,000 | 503,557 |
| 4.5% 1/31/50 | | 480,000 | 361,050 |
| 4.75% 4/27/32 | | 387,000 | 357,733 |
| 4.75% 3/8/44 | | 120,000 | 96,180 |
| 6.05% 1/11/40 | | 170,000 | 164,688 |
| Uruguay Republic 7.625% 3/21/36 | | 678,000 | 805,337 |
| TOTAL FOREIGN GOVERNMENT AND GOVERNMENT AGENCY OBLIGATIONS (Cost $16,158,621) | | | 14,054,845 |
| | | | |
| Supranational Obligations - 1.0% |
| | | Principal Amount (a) | Value ($) |
| African Development Bank 0.875% 7/22/26 | | 160,000 | 147,635 |
| Asian Development Bank: | | | |
| 0.375% 9/3/25 | | 450,000 | 425,932 |
| 0.75% 10/8/30 | | 100,000 | 79,917 |
| 1.5% 10/18/24 | | 200,000 | 197,658 |
| 1.875% 1/24/30 | | 610,000 | 532,725 |
| 4.5% 8/25/28 | | 220,000 | 219,914 |
| 5.82% 6/16/28 | | 110,000 | 114,300 |
| Asian Infrastructure Investment Bank 4.25% 3/13/34 | | 110,000 | 107,387 |
| Corporacion Andina de Fomento 5% 1/24/29 | | 60,000 | 59,865 |
| European Investment Bank: | | | |
| 0.75% 9/23/30 | | 250,000 | 200,585 |
| 0.875% 5/17/30 | | 18,000 | 14,701 |
| 1.75% 3/15/29 | | 1,350,000 | 1,195,659 |
| 3.75% 2/14/33 | | 100,000 | 94,994 |
| 4.875% 2/15/36 | | 110,000 | 113,481 |
| Inter-American Development Bank: | | | |
| 0.625% 7/15/25 | | 390,000 | 372,248 |
| 1.125% 1/13/31 | | 290,000 | 235,127 |
| 1.75% 3/14/25 | | 194,000 | 189,215 |
| 2.25% 6/18/29 | | 1,029,000 | 928,537 |
| 4.375% 1/24/44 | | 39,000 | 36,243 |
| International Bank for Reconstruction & Development: | | | |
| 0.375% 7/28/25 | | 270,000 | 256,755 |
| 0.5% 10/28/25 | | 218,000 | 205,481 |
| 0.75% 8/26/30 | | 160,000 | 128,281 |
| 0.875% 5/14/30 | | 176,000 | 143,644 |
| 1.25% 2/10/31 | | 110,000 | 89,781 |
| 1.625% 1/15/25 | | 155,000 | 151,912 |
| 2.5% 11/22/27 | | 92,000 | 86,041 |
| 3.625% 9/21/29 | | 260,000 | 249,843 |
| 4% 7/25/30 | | 500,000 | 487,970 |
| 4.75% 11/14/33 | | 290,000 | 295,781 |
| 4.75% 2/15/35 | | 520,000 | 526,674 |
| International Finance Corp. 0.75% 8/27/30 | | 60,000 | 48,157 |
| TOTAL SUPRANATIONAL OBLIGATIONS (Cost $8,510,547) | | | 7,936,443 |
| | | | |
| Bank Notes - 0.3% |
| | | Principal Amount (a) | Value ($) |
| Bank of America NA 6% 10/15/36 | | 250,000 | 262,780 |
| Discover Bank 2.7% 2/6/30 | | 500,000 | 429,211 |
| PNC Bank NA 3.875% 4/10/25 | | 260,000 | 256,187 |
| Truist Bank 3.3% 5/15/26 | | 200,000 | 191,636 |
| U.S. Bank NA, Cincinnati 2.8% 1/27/25 | | 1,000,000 | 984,082 |
| TOTAL BANK NOTES (Cost $2,218,086) | | | 2,123,896 |
| | | | |
| Money Market Funds - 0.6% |
| | | Shares | Value ($) |
Fidelity Cash Central Fund 5.38% (f) (Cost $5,029,666) | | 5,028,660 | 5,029,666 |
| | | | |
| TOTAL INVESTMENT IN SECURITIES - 101.5% (Cost $923,306,885) | 834,130,140 |
NET OTHER ASSETS (LIABILITIES) - (1.5)% | (12,246,948) |
| NET ASSETS - 100.0% | 821,883,192 |
| | |
| TBA Sale Commitments |
| | Principal Amount (a) | Value ($) |
| Ginnie Mae | | |
| Ginnie Mae 5.5% 7/1/54 | (400,000) | (396,861) |
| Ginnie Mae 5.5% 7/1/54 | (400,000) | (396,860) |
| Ginnie Mae 5.5% 7/1/54 | (125,000) | (124,019) |
| 6% 7/1/54 | (600,000) | (602,578) |
| 6% 7/1/54 | (475,000) | (477,041) |
| 6% 7/1/54 | (250,000) | (251,074) |
| 6.5% 7/1/54 | (1,300,000) | (1,318,052) |
| | | |
| TOTAL GINNIE MAE | | (3,566,485) |
| | | |
| Uniform Mortgage Backed Securities | | |
| 2% 7/1/54 | (50,000) | (39,105) |
| 3.5% 7/1/54 | (1,100,000) | (973,585) |
| 6% 7/1/54 | (500,000) | (501,407) |
| Uniform Mortgage Backed Securities 2.5% 7/1/54 | (75,000) | (61,254) |
| | | |
| TOTAL UNIFORM MORTGAGE BACKED SECURITIES | | (1,575,351) |
| | | |
TOTAL TBA SALE COMMITMENTS (Proceeds $5,157,653) | | (5,141,836) |
Legend
| (a) | Amount is stated in United States dollars unless otherwise noted. |
| (b) | Coupon rates for floating and adjustable rate securities reflect the rates in effect at period end. |
| (c) | Coupon is indexed to a floating interest rate which may be multiplied by a specified factor and/or subject to caps or floors. |
| (d) | Security or a portion of the security purchased on a delayed delivery or when-issued basis. |
| (e) | Security exempt from registration under Rule 144A of the Securities Act of 1933. These securities may be resold in transactions exempt from registration, normally to qualified institutional buyers. At the end of the period, the value of these securities amounted to $882,321 or 0.1% of net assets. |
| (f) | Affiliated fund that is generally available only to investment companies and other accounts managed by Fidelity Investments. The rate quoted is the annualized seven-day yield of the fund at period end. A complete unaudited listing of the fund's holdings as of its most recent quarter end is available upon request. In addition, each Fidelity Central Fund's financial statements are available on the SEC's website or upon request. |
Affiliated Central Funds
Fiscal year to date information regarding the Fund's investments in Fidelity Central Funds, including the ownership percentage, is presented below.
| Affiliate | Value, beginning of period ($) | Purchases ($) | Sales Proceeds ($) | Dividend Income ($) | Realized Gain (loss) ($) | Change in Unrealized appreciation (depreciation) ($) | Value, end of period ($) | % ownership, end of period |
| Fidelity Cash Central Fund 5.38% | 2,187,186 | 101,759,027 | 98,916,379 | 83,706 | (168) | - | 5,029,666 | 0.0% |
| Total | 2,187,186 | 101,759,027 | 98,916,379 | 83,706 | (168) | - | 5,029,666 | |
| | | | | | | | | |
Amounts in the dividend income column in the above table include any capital gain distributions from underlying funds, which are presented in the corresponding line item in the Statement of Operations, if applicable.
Amounts included in the purchases and sales proceeds columns may include in-kind transactions, if applicable.
Investment Valuation
The following is a summary of the inputs used, as of June 30, 2024, involving the Fund's assets and liabilities carried at fair value. The inputs or methodology used for valuing securities may not be an indication of the risk associated with investing in those securities. For more information on valuation inputs, and their aggregation into the levels used below, please refer to the Investment Valuation section in the accompanying Notes to Financial Statements.
| Valuation Inputs at Reporting Date: |
| Description | Total ($) | Level 1 ($) | Level 2 ($) | Level 3 ($) |
Investments in Securities: | | | | |
|
| Corporate Bonds | 226,982,197 | - | 226,982,197 | - |
|
| U.S. Government and Government Agency Obligations | 345,471,254 | - | 345,471,254 | - |
|
| U.S. Government Agency - Mortgage Securities | 214,884,086 | - | 214,884,086 | - |
|
| Asset-Backed Securities | 2,775,652 | - | 2,775,652 | - |
|
| Commercial Mortgage Securities | 11,241,017 | - | 11,241,017 | - |
|
| Municipal Securities | 3,631,084 | - | 3,631,084 | - |
|
| Foreign Government and Government Agency Obligations | 14,054,845 | - | 14,054,845 | - |
|
| Supranational Obligations | 7,936,443 | - | 7,936,443 | - |
|
| Bank Notes | 2,123,896 | - | 2,123,896 | - |
|
| Money Market Funds | 5,029,666 | 5,029,666 | - | - |
| Total Investments in Securities: | 834,130,140 | 5,029,666 | 829,100,474 | - |
Other Financial Instruments: | | | | |
TBA Sale Commitments | (5,141,836) | - | (5,141,836) | - |
| Total Other Financial Instruments: | (5,141,836) | - | (5,141,836) | - |
Financial Statements (Unaudited)
| Statement of Assets and Liabilities |
| | | | June 30, 2024 (Unaudited) |
| | | | | |
| Assets | | | | |
| Investment in securities, at value - See accompanying schedule: | | | | |
Unaffiliated issuers (cost $918,277,219) | $ | 829,100,474 | | |
Fidelity Central Funds (cost $5,029,666) | | 5,029,666 | | |
| | | | | |
| | | | | |
| Total Investment in Securities (cost $923,306,885) | | | $ | 834,130,140 |
| Cash | | | | 253,382 |
| Foreign currency held at value (cost $84) | | | | 83 |
| Receivable for investments sold | | | | 145,643 |
| Receivable for TBA sale commitments | | | | 5,157,653 |
| Receivable for fund shares sold | | | | 497,570 |
| Interest receivable | | | | 6,389,236 |
| Distributions receivable from Fidelity Central Funds | | | | 11,869 |
Total assets | | | | 846,585,576 |
| Liabilities | | | | |
| Payable for investments purchased | | | | |
Regular delivery | $ | 5,318,700 | | |
Delayed delivery | | 13,864,778 | | |
| TBA sale commitments, at value | | 5,141,836 | | |
| Payable for fund shares redeemed | | 232,581 | | |
| Accrued management fee | | 61,610 | | |
| Distribution and service plan fees payable | | 48,519 | | |
| Other affiliated payables | | 34,228 | | |
| Other payables and accrued expenses | | 132 | | |
| Total liabilities | | | | 24,702,384 |
| Net Assets | | | $ | 821,883,192 |
| Net Assets consist of: | | | | |
| Paid in capital | | | $ | 919,389,874 |
| Total accumulated earnings (loss) | | | | (97,506,682) |
| Net Assets | | | $ | 821,883,192 |
| | | | | |
| Net Asset Value and Maximum Offering Price | | | | |
| Initial Class : | | | | |
Net Asset Value, offering price and redemption price per share ($581,943,278 ÷ 60,890,250 shares) | | | $ | 9.56 |
| Service Class : | | | | |
Net Asset Value, offering price and redemption price per share ($10,912,062 ÷ 1,142,276 shares) | | | $ | 9.55 |
| Service Class 2 : | | | | |
Net Asset Value, offering price and redemption price per share ($229,027,852 ÷ 24,059,060 shares) | | | $ | 9.52 |
| Statement of Operations |
| | | | Six months ended June 30, 2024 (Unaudited) |
| Investment Income | | | | |
| Interest | | | $ | 13,736,717 |
| Income from Fidelity Central Funds | | | | 83,706 |
| Total income | | | | 13,820,423 |
| Expenses | | | | |
| Management fee | $ | 358,610 | | |
| Transfer agent fees | | 199,228 | | |
| Distribution and service plan fees | | 275,982 | | |
| Independent trustees' fees and expenses | | 1,057 | | |
| Miscellaneous | | 5,157 | | |
| Total expenses before reductions | | 840,034 | | |
| Expense reductions | | (4,333) | | |
| Total expenses after reductions | | | | 835,701 |
| Net Investment income (loss) | | | | 12,984,722 |
| Realized and Unrealized Gain (Loss) | | | | |
| Net realized gain (loss) on: | | | | |
| Investment Securities: | | | | |
| Unaffiliated issuers | | (3,774,181) | | |
| Fidelity Central Funds | | (168) | | |
| Total net realized gain (loss) | | | | (3,774,349) |
| Change in net unrealized appreciation (depreciation) on: | | | | |
| Investment Securities: | | | | |
| Unaffiliated issuers | | (14,419,400) | | |
| Assets and liabilities in foreign currencies | | (1) | | |
| TBA Sale commitments | | 20,476 | | |
| Total change in net unrealized appreciation (depreciation) | | | | (14,398,925) |
| Net gain (loss) | | | | (18,173,274) |
| Net increase (decrease) in net assets resulting from operations | | | $ | (5,188,552) |
| Statement of Changes in Net Assets |
| |
| | Six months ended June 30, 2024 (Unaudited) | | Year ended December 31, 2023 |
| Increase (Decrease) in Net Assets | | | | |
| Operations | | | | |
| Net investment income (loss) | $ | 12,984,722 | $ | 19,791,679 |
| Net realized gain (loss) | | (3,774,349) | | (6,898,786) |
| Change in net unrealized appreciation (depreciation) | | (14,398,925) | | 24,384,524 |
| Net increase (decrease) in net assets resulting from operations | | (5,188,552) | | 37,277,417 |
| Distributions to shareholders | | (3,702,713) | | (17,505,569) |
| | | | | |
| Share transactions - net increase (decrease) | | 52,374,551 | | 108,820,685 |
| Total increase (decrease) in net assets | | 43,483,286 | | 128,592,533 |
| | | | | |
| Net Assets | | | | |
| Beginning of period | | 778,399,906 | | 649,807,373 |
| End of period | $ | 821,883,192 | $ | 778,399,906 |
| | | | | |
| | | | | |
Financial Highlights
VIP Bond Index Portfolio Initial Class |
| |
| | Six months ended (Unaudited) June 30, 2024 | | Years ended December 31, 2023 | | 2022 | | 2021 | | 2020 | | 2019 |
Selected Per-Share Data | | | | | | | | | | | | |
| Net asset value, beginning of period | $ | 9.67 | $ | 9.40 | $ | 11.02 | $ | 11.35 | $ | 10.68 | $ | 10.06 |
| Income from Investment Operations | | | | | | | | | | | | |
Net investment income (loss) A,B | | .158 | | .274 | | .196 | | .132 | | .183 | | .283 |
| Net realized and unrealized gain (loss) | | (.222) | | .233 | | (1.646) | | (.353) | | .621 | | .560 |
| Total from investment operations | | (.064) | | .507 | | (1.450) | | (.221) | | .804 | | .843 |
| Distributions from net investment income | | (.046) | | (.237) | | (.170) | | (.109) | | (.104) | | (.191) |
| Distributions from net realized gain | | - | | - | | - | | - | | (.030) | | (.032) |
| Total distributions | | (.046) | | (.237) | | (.170) | | (.109) | | (.134) | | (.223) |
| Net asset value, end of period | $ | 9.56 | $ | 9.67 | $ | 9.40 | $ | 11.02 | $ | 11.35 | $ | 10.68 |
Total Return C,D,E | | | | 5.47% | | (13.19)% | | (1.95)% | | 7.53% | | 8.38% |
Ratios to Average Net Assets B,F,G | | | | | | | | | | | | |
| Expenses before reductions | | .14% H,I | | .14% | | .14% | | .14% | | .14% | | .14% |
| Expenses net of fee waivers, if any | | | | .14% | | .14% | | .14% | | .14% | | .14% |
| Expenses net of all reductions | | .14% H,I | | .14% | | .14% | | .14% | | .14% | | .14% |
| Net investment income (loss) | | 3.34% H,I | | 2.89% | | 1.97% | | 1.19% | | 1.63% | | 2.67% |
| Supplemental Data | | | | | | | | | | | | |
| Net assets, end of period (000 omitted) | $ | 581,943 | $ | 558,733 | $ | 461,166 | $ | 513,626 | $ | 569,594 | $ | 258,250 |
Portfolio turnover rate J | | | | 36% | | 33% | | 138% | | 101% | | 81% |
ACalculated based on average shares outstanding during the period.
BNet investment income (loss) is affected by the timing of the declaration of dividends by any underlying mutual funds or exchange-traded funds (ETFs). Net investment income (loss) of any mutual funds or ETFs is not included in the Fund's net investment income (loss) ratio.
CTotal returns for periods of less than one year are not annualized.
DTotal returns do not reflect charges attributable to your insurance company's separate account. Inclusion of these charges would reduce the total returns shown.
ETotal returns would have been lower if certain expenses had not been reduced during the applicable periods shown.
FFees and expenses of any underlying mutual funds or exchange-traded funds (ETFs) are not included in the Fund's expense ratio. The Fund indirectly bears its proportionate share of these expenses. For additional expense information related to investments in Fidelity Central Funds, please refer to the "Investments in Fidelity Central Funds" note found in the Notes to Financial Statements section of the most recent Annual or Semi-Annual report.
GExpense ratios reflect operating expenses of the class. Expenses before reductions do not reflect amounts reimbursed, waived, or reduced through arrangements with the investment adviser, brokerage services, or other offset arrangements, if applicable, and do not represent the amount paid by the class during periods when reimbursements, waivers or reductions occur.
HAnnualized.
IProxy expenses are not annualized.
JAmount does not include the portfolio activity of any underlying mutual funds or exchange-traded funds (ETFs).
VIP Bond Index Portfolio Service Class |
| |
| | Six months ended (Unaudited) June 30, 2024 | | Years ended December 31, 2023 | | 2022 | | 2021 | | 2020 | | 2019 A |
Selected Per-Share Data | | | | | | | | | | | | |
| Net asset value, beginning of period | $ | 9.67 | $ | 9.41 | $ | 11.03 | $ | 11.37 | $ | 10.67 | $ | 10.33 |
| Income from Investment Operations | | | | | | | | | | | | |
Net investment income (loss) B,C | | .153 | | .261 | | .185 | | .119 | | .171 | | .197 |
| Net realized and unrealized gain (loss) | | (.229) | | .234 | | (1.645) | | (.352) | | .632 | | .359 |
| Total from investment operations | | (.076) | | .495 | | (1.460) | | (.233) | | .803 | | .556 |
| Distributions from net investment income | | (.044) | | (.235) | | (.160) | | (.107) | | (.073) | | (.184) |
| Distributions from net realized gain | | - | | - | | - | | - | | (.030) | | (.032) |
| Total distributions | | (.044) | | (.235) | | (.160) | | (.107) | | (.103) | | (.216) |
| Net asset value, end of period | $ | 9.55 | $ | 9.67 | $ | 9.41 | $ | 11.03 | $ | 11.37 | $ | 10.67 |
Total Return D,E,F | | | | 5.34% | | (13.27)% | | (2.05)% | | 7.53% | | 5.38% |
Ratios to Average Net Assets C,G,H | | | | | | | | | | | | |
| Expenses before reductions | | .24% I,J | | .24% | | .24% | | .24% | | .24% | | .24% I |
| Expenses net of fee waivers, if any | | | | .24% | | .24% | | .24% | | .24% | | .24% I |
| Expenses net of all reductions | | .24% I,J | | .24% | | .24% | | .24% | | .24% | | .24% I |
| Net investment income (loss) | | 3.24% I,J | | 2.79% | | 1.87% | | 1.09% | | 1.53% | | 2.53% I |
| Supplemental Data | | | | | | | | | | | | |
| Net assets, end of period (000 omitted) | $ | 10,912 | $ | 11,066 | $ | 3,144 | $ | 2,759 | $ | 550 | $ | 103 |
Portfolio turnover rate K | | | | 36% | | 33% | | 138% | | 101% | | 81% |
AFor the period April 11, 2019 (commencement of sale of shares) through December 31, 2019.
BCalculated based on average shares outstanding during the period.
CNet investment income (loss) is affected by the timing of the declaration of dividends by any underlying mutual funds or exchange-traded funds (ETFs). Net investment income (loss) of any mutual funds or ETFs is not included in the Fund's net investment income (loss) ratio.
DTotal returns for periods of less than one year are not annualized.
ETotal returns do not reflect charges attributable to your insurance company's separate account. Inclusion of these charges would reduce the total returns shown.
FTotal returns would have been lower if certain expenses had not been reduced during the applicable periods shown.
GFees and expenses of any underlying mutual funds or exchange-traded funds (ETFs) are not included in the Fund's expense ratio. The Fund indirectly bears its proportionate share of these expenses. For additional expense information related to investments in Fidelity Central Funds, please refer to the "Investments in Fidelity Central Funds" note found in the Notes to Financial Statements section of the most recent Annual or Semi-Annual report.
HExpense ratios reflect operating expenses of the class. Expenses before reductions do not reflect amounts reimbursed, waived, or reduced through arrangements with the investment adviser, brokerage services, or other offset arrangements, if applicable, and do not represent the amount paid by the class during periods when reimbursements, waivers or reductions occur.
IAnnualized.
JProxy expenses are not annualized.
KAmount does not include the portfolio activity of any underlying mutual funds or exchange-traded funds (ETFs).
VIP Bond Index Portfolio Service Class 2 |
| |
| | Six months ended (Unaudited) June 30, 2024 | | Years ended December 31, 2023 | | 2022 | | 2021 | | 2020 | | 2019 |
Selected Per-Share Data | | | | | | | | | | | | |
| Net asset value, beginning of period | $ | 9.63 | $ | 9.37 | $ | 10.98 | $ | 11.32 | $ | 10.68 | $ | 10.06 |
| Income from Investment Operations | | | | | | | | | | | | |
Net investment income (loss) A,B | | .145 | | .249 | | .170 | | .104 | | .161 | | .262 |
| Net realized and unrealized gain (loss) | | (.213) | | .225 | | (1.636) | | (.357) | | .614 | | .556 |
| Total from investment operations | | (.068) | | .474 | | (1.466) | | (.253) | | .775 | | .818 |
| Distributions from net investment income | | (.042) | | (.214) | | (.144) | | (.087) | | (.105) | | (.166) |
| Distributions from net realized gain | | - | | - | | - | | - | | (.030) | | (.032) |
| Total distributions | | (.042) | | (.214) | | (.144) | | (.087) | | (.135) | | (.198) |
| Net asset value, end of period | $ | 9.52 | $ | 9.63 | $ | 9.37 | $ | 10.98 | $ | 11.32 | $ | 10.68 |
Total Return C,D,E | | | | 5.13% | | (13.38)% | | (2.24)% | | 7.26% | | 8.13% |
Ratios to Average Net Assets B,F,G | | | | | | | | | | | | |
| Expenses before reductions | | .39% H,I | | .39% | | .39% | | .39% | | .37% | | .39% |
| Expenses net of fee waivers, if any | | | | .39% | | .39% | | .39% | | .37% | | .39% |
| Expenses net of all reductions | | .39% H,I | | .39% | | .39% | | .39% | | .37% | | .39% |
| Net investment income (loss) | | 3.09% H,I | | 2.64% | | 1.72% | | .94% | | 1.40% | | 2.48% |
| Supplemental Data | | | | | | | | | | | | |
| Net assets, end of period (000 omitted) | $ | 229,028 | $ | 208,601 | $ | 185,497 | $ | 227,058 | $ | 215,977 | $ | 1,167 |
Portfolio turnover rate J | | | | 36% | | 33% | | 138% | | 101% | | 81% |
ACalculated based on average shares outstanding during the period.
BNet investment income (loss) is affected by the timing of the declaration of dividends by any underlying mutual funds or exchange-traded funds (ETFs). Net investment income (loss) of any mutual funds or ETFs is not included in the Fund's net investment income (loss) ratio.
CTotal returns for periods of less than one year are not annualized.
DTotal returns do not reflect charges attributable to your insurance company's separate account. Inclusion of these charges would reduce the total returns shown.
ETotal returns would have been lower if certain expenses had not been reduced during the applicable periods shown.
FFees and expenses of any underlying mutual funds or exchange-traded funds (ETFs) are not included in the Fund's expense ratio. The Fund indirectly bears its proportionate share of these expenses. For additional expense information related to investments in Fidelity Central Funds, please refer to the "Investments in Fidelity Central Funds" note found in the Notes to Financial Statements section of the most recent Annual or Semi-Annual report.
GExpense ratios reflect operating expenses of the class. Expenses before reductions do not reflect amounts reimbursed, waived, or reduced through arrangements with the investment adviser, brokerage services, or other offset arrangements, if applicable, and do not represent the amount paid by the class during periods when reimbursements, waivers or reductions occur.
HAnnualized.
IProxy expenses are not annualized.
JAmount does not include the portfolio activity of any underlying mutual funds or exchange-traded funds (ETFs).
Notes to Financial Statements
(Unaudited)For the period ended June 30, 2024
1. Organization.
VIP Bond Index Portfolio (the Fund) is a fund of Variable Insurance Products Fund V (the Trust) and is authorized to issue an unlimited number of shares. The Trust is registered under the Investment Company Act of 1940, as amended (the 1940 Act), as an open-end management investment company organized as a Massachusetts business trust. Shares of the Fund may only be purchased by insurance companies for the purpose of funding variable annuity or variable life insurance contracts. The Fund offers the following classes of shares: Initial Class shares, Service Class shares and Service Class 2 shares. All classes have equal rights and voting privileges, except for matters affecting a single class.
2. Investments in Fidelity Central Funds.
Funds may invest in Fidelity Central Funds, which are open-end investment companies generally available only to other investment companies and accounts managed by the investment adviser and its affiliates. The Schedule of Investments lists any Fidelity Central Funds held as an investment as of period end, but does not include the underlying holdings of each Fidelity Central Fund. An investing fund indirectly bears its proportionate share of the expenses of the underlying Fidelity Central Funds.
Based on its investment objective, each Fidelity Central Fund may invest or participate in various investment vehicles or strategies that are similar to those of the investing fund. These strategies are consistent with the investment objectives of the investing fund and may involve certain economic risks which may cause a decline in value of each of the Fidelity Central Funds and thus a decline in the value of the investing fund.
| Fidelity Central Fund | Investment Manager | Investment Objective | Investment Practices | Expense RatioA |
| Fidelity Money Market Central Funds | Fidelity Management & Research Company LLC (FMR) | Each fund seeks to obtain a high level of current income consistent with the preservation of capital and liquidity. | Short-term Investments | Less than .005% |
A Expenses expressed as a percentage of average net assets and are as of each underlying Central Fund's most recent annual or semi-annual shareholder report.
A complete unaudited list of holdings for each Fidelity Central Fund is available upon request or at the Securities and Exchange Commission website at www.sec.gov. In addition, the financial statements of the Fidelity Central Funds which contain the significant accounting policies (including investment valuation policies) of those funds, and are not covered by the Report of Independent Registered Public Accounting Firm, are available on the Securities and Exchange Commission website or upon request.
3. Significant Accounting Policies.
The Fund is an investment company and applies the accounting and reporting guidance of the Financial Accounting Standards Board (FASB) Accounting Standards Codification Topic 946 Financial Services - Investment Companies. The financial statements have been prepared in conformity with accounting principles generally accepted in the United States of America (GAAP), which require management to make certain estimates and assumptions at the date of the financial statements. Actual results could differ from those estimates. Subsequent events, if any, through the date that the financial statements were issued have been evaluated in the preparation of the financial statements. The Fund's Schedule of Investments lists any underlying mutual funds or exchange-traded funds (ETFs) but does not include the underlying holdings of these funds. The following summarizes the significant accounting policies of the Fund:
Investment Valuation. Investments are valued as of 4:00 p.m. Eastern time on the last calendar day of the period. The Board of Trustees (the Board) has designated the Fund's investment adviser as the valuation designee responsible for the fair valuation function and performing fair value determinations as needed. The investment adviser has established a Fair Value Committee (the Committee) to carry out the day-to-day fair valuation responsibilities and has adopted policies and procedures to govern the fair valuation process and the activities of the Committee. In accordance with these fair valuation policies and procedures, which have been approved by the Board, the Fund attempts to obtain prices from one or more third party pricing services or brokers to value its investments. When current market prices, quotations or currency exchange rates are not readily available or reliable, investments will be fair valued in good faith by the Committee, in accordance with the policies and procedures. Factors used in determining fair value vary by investment type and may include market or investment specific events, transaction data, estimated cash flows, and market observations of comparable investments. The frequency that the fair valuation procedures are used cannot be predicted and they may be utilized to a significant extent. The Committee manages the Fund's fair valuation practices and maintains the fair valuation policies and procedures. The Fund's investment adviser reports to the Board information regarding the fair valuation process and related material matters.
The Fund categorizes the inputs to valuation techniques used to value its investments into a disclosure hierarchy consisting of three levels as shown below:
Level 1 - unadjusted quoted prices in active markets for identical investments
Level 2 - other significant observable inputs (including quoted prices for similar investments, interest rates, prepayment speeds, etc.)
Level 3 - unobservable inputs (including the Fund's own assumptions based on the best information available)
Valuation techniques used to value the Fund's investments by major category are as follows:
Debt securities, including restricted securities, are valued based on evaluated prices received from third party pricing services or from brokers who make markets in such securities. Corporate bonds, bank notes, foreign government and government agency obligations, municipal securities, supranational obligations and U.S. government and government agency obligations are valued by pricing services who utilize matrix pricing which considers yield or price of bonds of comparable quality, coupon, maturity and type or by broker-supplied prices. Asset backed securities, commercial mortgage securities and U.S. government agency mortgage securities are valued by pricing services who utilize matrix pricing which considers prepayment speed assumptions, attributes of the collateral, yield or price of bonds of comparable quality, coupon, maturity and type or by broker-supplied prices. When independent prices are unavailable or unreliable, debt securities may be valued utilizing pricing methodologies which consider similar factors that would be used by third party pricing services. Debt securities are generally categorized as Level 2 in the hierarchy but may be Level 3 depending on the circumstances.
Investments in open-end mutual funds, including the Fidelity Central Funds, are valued at their closing net asset value (NAV) each business day and are categorized as Level 1 in the hierarchy.
Changes in valuation techniques may result in transfers in or out of an assigned level within the disclosure hierarchy. The aggregate value of investments by input level as of June 30, 2024 is included at the end of the Fund's Schedule of Investments.
Foreign Currency. Certain Funds may use foreign currency contracts to facilitate transactions in foreign-denominated securities. Gains and losses from these transactions may arise from changes in the value of the foreign currency or if the counterparties do not perform under the contracts' terms.
Foreign-denominated assets, including investment securities, and liabilities are translated into U.S. dollars at the exchange rates at period end. Purchases and sales of investment securities, income and dividends received, and expenses denominated in foreign currencies are translated into U.S. dollars at the exchange rate in effect on the transaction date.
The effects of exchange rate fluctuations on investments are included with the net realized and unrealized gain (loss) on investment securities. Other foreign currency transactions resulting in realized and unrealized gain (loss) are disclosed separately.
Investment Transactions and Income. For financial reporting purposes, the Fund's investment holdings and NAV include trades executed through the end of the last business day of the period. The NAV per share for processing shareholder transactions is calculated as of the close of business of the New York Stock Exchange (NYSE), normally 4:00 p.m. Eastern time and includes trades executed through the end of the prior business day. Gains and losses on securities sold are determined on the basis of identified cost. Income and capital gain distributions from Fidelity Central Funds, if any, are recorded on the ex-dividend date. Interest income is accrued as earned and includes coupon interest and amortization of premium and accretion of discount on debt securities as applicable. Investment income is recorded net of foreign taxes withheld where recovery of such taxes is uncertain. Debt obligations may be placed on non-accrual status and related interest income may be reduced by ceasing current accruals and writing off interest receivables when the collection of all or a portion of interest has become doubtful based on consistently applied procedures. A debt obligation is removed from non-accrual status when the issuer resumes interest payments or when collectability of interest is reasonably assured.
Class Allocations and Expenses. Investment income, realized and unrealized capital gains and losses, common expenses of a fund, and certain fund-level expense reductions, if any, are allocated daily on a pro-rata basis to each class based on the relative net assets of each class to the total net assets of a fund. Each class differs with respect to transfer agent and distribution and service plan fees incurred, as applicable. Certain expense reductions may also differ by class, if applicable. For the reporting period, the allocated portion of income and expenses to each class as a percent of its average net assets may vary due to the timing of recording these transactions in relation to fluctuating net assets of the classes. Expenses directly attributable to a fund are charged to that fund. Expenses attributable to more than one fund are allocated among the respective funds on the basis of relative net assets or other appropriate methods. Expenses included in the accompanying financial statements reflect the expenses of that fund and do not include any expenses associated with any underlying mutual funds or exchange-traded funds (ETFs). Although not included in a fund's expenses, a fund indirectly bears its proportionate share of these expenses through the net asset value of each underlying mutual fund or exchange-traded fund (ETF). Expense estimates are accrued in the period to which they relate and adjustments are made when actual amounts are known.
Income Tax Information and Distributions to Shareholders. Each year, the Fund intends to qualify as a regulated investment company under Subchapter M of the Internal Revenue Code, including distributing substantially all of its taxable income and realized gains. As a result, no provision for U.S. Federal income taxes is required. The Fund files a U.S. federal tax return, in addition to state and local tax returns as required. The Fund's federal income tax returns are subject to examination by the Internal Revenue Service (IRS) for a period of three fiscal years after they are filed. State and local tax returns may be subject to examination for an additional fiscal year depending on the jurisdiction. Foreign taxes are provided for based on the Fund's understanding of the tax rules and rates that exist in the foreign markets in which it invests.
Distributions are declared and recorded on the ex-dividend date. Income and capital gain distributions are declared separately for each class. Income and capital gain distributions are determined in accordance with income tax regulations, which may differ from GAAP.
Capital accounts within the financial statements are adjusted for permanent book-tax differences. These adjustments have no impact on net assets or the results of operations. Capital accounts are not adjusted for temporary book-tax differences which will reverse in a subsequent period.
Book-tax differences are primarily due to market discount, capital loss carryforwards and losses deferred due to wash sales.
As of period end, the cost and unrealized appreciation (depreciation) in securities, and derivatives if applicable, for federal income tax purposes were as follows:
| Gross unrealized appreciation | $1,926,710 |
| Gross unrealized depreciation | (89,405,377) |
| Net unrealized appreciation (depreciation) | $(87,478,667) |
| Tax cost | $921,608,807 |
Capital loss carryforwards are only available to offset future capital gains of the Fund to the extent provided by regulations and may be limited. The capital loss carryforward information presented below, including any applicable limitation, is estimated as of prior fiscal period end and is subject to adjustment.
Short-term | $(7,527,095) |
Long-term | (11,181,350) |
| Total capital loss carryforward | $(18,708,444) |
Delayed Delivery Transactions and When-Issued Securities. During the period, certain Funds transacted in securities on a delayed delivery or when-issued basis. Payment and delivery may take place after the customary settlement period for that security. The price of the underlying securities and the date when the securities will be delivered and paid for are fixed at the time the transaction is negotiated. Securities purchased on a delayed delivery or when-issued basis are identified as such in the Schedule of Investments. Compensation for interest forgone in the purchase of a delayed delivery or when-issued debt security may be received. With respect to purchase commitments, each applicable Fund identifies securities as segregated in its records with a value at least equal to the amount of the commitment. Payables and receivables associated with the purchases and sales of delayed delivery securities having the same coupon, settlement date and broker are offset. Delayed delivery or when-issued securities that have been purchased from and sold to different brokers are reflected as both payables and receivables in the Statement of Assets and Liabilities under the caption "Delayed delivery", as applicable. Losses may arise due to changes in the value of the underlying securities or if the counterparty does not perform under the contract's terms, or if the issuer does not issue the securities due to political, economic, or other factors.
To-Be-Announced (TBA) Securities and Mortgage Dollar Rolls. TBA securities involve buying or selling mortgage-backed securities (MBS) on a forward commitment basis. A TBA transaction typically does not designate the actual security to be delivered and only includes an approximate principal amount; however delivered securities must meet specified terms defined by industry guidelines, including issuer, rate and current principal amount outstanding on underlying mortgage pools. Funds may enter into a TBA transaction with the intent to take possession of or deliver the underlying MBS, or a fund may elect to extend the settlement by entering into either a mortgage or reverse mortgage dollar roll. Mortgage dollar rolls are transactions where a fund sells TBA securities and simultaneously agrees to repurchase MBS on a later date at a lower price and with the same counterparty. Reverse mortgage dollar rolls involve the purchase and simultaneous agreement to sell TBA securities on a later date at a lower price. Transactions in mortgage dollar rolls and reverse mortgage dollar rolls are accounted for as purchases and sales and may result in an increase to a fund's portfolio turnover rate.
Purchases and sales of TBA securities involve risks similar to those discussed above for delayed delivery and when-issued securities. Also, if the counterparty in a mortgage dollar roll or a reverse mortgage dollar roll transaction files for bankruptcy or becomes insolvent, a fund's right to repurchase or sell securities may be limited. Additionally, when a fund sells TBA securities without already owning or having the right to obtain the deliverable securities (an uncovered forward commitment to sell), it incurs a risk of loss because it could have to purchase the securities at a price that is higher than the price at which it sold them. A fund may be unable to purchase the deliverable securities if the corresponding market is illiquid.
TBA securities subject to a forward commitment to sell at period end are included at the end of the Schedule of Investments under the caption "TBA Sale Commitments." The value of these commitments and proceeds to be received at contractual settlement date are reflected in the Statement of Assets and Liabilities as "TBA sale commitments, at value" and "Receivable for TBA sale commitments," respectively. If the TBA sale commitment is closed through the acquisition of an offsetting TBA purchase commitment, a fund realizes a gain or loss. If a fund delivers securities under the commitment, a fund realizes a gain or loss from the sale of the securities based upon the price established at the date the commitment was entered into.
Restricted Securities (including Private Placements). Funds may invest in securities that are subject to legal or contractual restrictions on resale. These securities generally may be resold in transactions exempt from registration or to the public if the securities are registered. Disposal of these securities may involve time-consuming negotiations and expense, and prompt sale at an acceptable price may be difficult. Information regarding restricted securities held at period end is included at the end of the Schedule of Investments, if applicable.
4. Purchases and Sales of Investments.
Purchases and sales of securities, other than short-term securities, U.S. government securities and in-kind transactions, as applicable, are noted in the table below.
| | Purchases ($) | Sales ($) |
| VIP Bond Index Portfolio | 106,744,009 | 89,528,988 |
5. Fees and Other Transactions with Affiliates.
Management Fee and Expense Contract. Fidelity Management & Research Company LLC (the investment adviser) and its affiliates provide the Fund with investment management related services for which the Fund pays a monthly management fee. The management fee is based on an annual rate of .09% of the Fund's average net assets. Under the management contract, the investment adviser pays all other fund-level expenses, except the compensation of the independent Trustees and certain miscellaneous expenses such as proxy and shareholder meeting expenses.
In addition, under the expense contract, the investment adviser pays class-level expenses as necessary so that the total expenses do not exceed certain amounts of each class' average net assets on an annual basis with certain exceptions, as noted in the following table:
Initial Class | .14% |
Service Class | .24% |
Service Class 2 | .39% |
Distribution and Service Plan Fees. In accordance with Rule 12b-1 of the 1940 Act, the Fund has adopted separate 12b-1 Plans for each Service Class of shares. Each Service Class pays Fidelity Distributors Company LLC (FDC), an affiliate of the investment adviser, a service fee. For the period, the service fee is based on an annual rate of .10% of Service Class' average net assets and .25% of Service Class 2's average net assets.
For the period, total fees, all of which were re-allowed to insurance companies for the distribution of shares and providing shareholder support services, were as follows:
| Service Class | $5,449 |
| Service Class 2 | 270,533 |
| | $275,982 |
Transfer Agent Fees. Fidelity Investments Institutional Operations Company LLC (FIIOC), an affiliate of the investment adviser, is the transfer, dividend disbursing, and shareholder servicing agent for each class. FIIOC receives asset-based fees based on each class's average net assets for transfer agent services, typesetting, and printing and mailing of shareholder reports, excluding mailing of proxy statements, equal to an annual rate of .06% of average net assets. Under the expense contract, each class pays a portion of the transfer agent fees equal to an annual rate of .05% of class-level average net assets. For the period, transfer agent fees for each class were as follows:
| Initial Class | $142,396 |
| Service Class | 2,725 |
| Service Class 2 | 54,107 |
| | $199,228 |
Interfund Trades. Funds may purchase from or sell securities to other Fidelity Funds under procedures adopted by the Board. The procedures have been designed to ensure these interfund trades are executed in accordance with Rule 17a-7 of the 1940 Act. Any interfund trades are included within the respective purchases and sales amounts shown in the Purchases and Sales of Investments note. During the period, there were no interfund trades.
Sub-Advisory Arrangements. Effective March 1, 2024, the Fund's sub-advisory agreements with FMR Investment Management (UK) Limited, Fidelity Management & Research (Hong Kong) Limited, and Fidelity Management & Research (Japan) Limited were amended to provide that the investment adviser pays each sub-adviser monthly fees equal to 110% of the sub-adviser's costs for providing sub-advisory services.
6. Committed Line of Credit.
Certain Funds participate with other funds managed by the investment adviser or an affiliate in a $4.25 billion credit facility (the "line of credit") to be utilized for temporary or emergency purposes to fund shareholder redemptions or for other short-term liquidity purposes. The commitment fees on the pro-rata portion of the line of credit are borne by the investment adviser. During the period, there were no borrowings on this line of credit.
7. Expense Reductions.
Through arrangements with the Fund's custodian, credits realized as a result of certain uninvested cash balances were used to reduce the Fund's expenses. During the period, custodian credits reduced the Fund's expenses by $4,333.
8. Distributions to Shareholders.
Distributions to shareholders of each class were as follows:
| | Six months ended June 30, 2024 | Year ended December 31, 2023 |
| VIP Bond Index Portfolio | | |
| Distributions to shareholders | | |
| Initial Class | $2,721,908 | $12,805,218 |
| Service Class | 51,958 | 230,657 |
| Service Class 2 | 928,847 | 4,469,694 |
Total | $3,702,713 | $17,505,569 |
9. Share Transactions.
Transactions for each class of shares were as follows and may contain in-kind transactions:
| | Shares | Shares | Dollars | Dollars |
| | Six months ended June 30, 2024 | Year ended December 31, 2023 | Six months ended June 30, 2024 | Year ended December 31, 2023 |
| VIP Bond Index Portfolio | | | | |
| Initial Class | | | | |
| Shares sold | 7,677,388 | 13,031,159 | $72,993,207 | $124,143,132 |
| Reinvestment of distributions | 286,818 | 1,361,916 | 2,721,908 | 12,805,218 |
| Shares redeemed | (4,870,140) | (5,646,805) | (46,087,502) | (53,362,229) |
| Net increase (decrease) | 3,094,066 | 8,746,270 | $29,627,613 | $83,586,121 |
| Service Class | | | | |
| Shares sold | 206,489 | 1,097,939 | $1,968,043 | $10,375,229 |
| Reinvestment of distributions | 5,430 | 24,384 | 51,532 | 228,382 |
| Shares redeemed | (214,602) | (311,509) | (2,033,993) | (2,959,926) |
| Net increase (decrease) | (2,683) | 810,814 | $(14,418) | $7,643,685 |
| Service Class 2 | | | | |
| Shares sold | 3,842,137 | 4,148,380 | $36,352,064 | $39,219,792 |
| Reinvestment of distributions | 98,146 | 476,666 | 928,465 | 4,467,751 |
| Shares redeemed | (1,531,662) | (2,761,504) | (14,519,173) | (26,096,664) |
| Net increase (decrease) | 2,408,621 | 1,863,542 | $22,761,356 | $17,590,879 |
10. Other.
A fund's organizational documents provide former and current trustees and officers with a limited indemnification against liabilities arising in connection with the performance of their duties to the fund. In the normal course of business, a fund may also enter into contracts that provide general indemnifications. A fund's maximum exposure under these arrangements is unknown as this would be dependent on future claims that may be made against a fund. The risk of material loss from such claims is considered remote.
At the end of the period, the investment adviser or its affiliates were owners of record of more than 10% and certain otherwise unaffiliated shareholders were owners of record of more than 10% of the outstanding shares as follows:
| Fund | Affiliated % | Number of Unaffiliated Shareholders | Unaffiliated Shareholders % |
| VIP Bond Index Portfolio | 59% | 1 | 31% |
11. Risk and Uncertainties.
Many factors affect a fund's performance. Developments that disrupt global economies and financial markets, such as pandemics, epidemics, outbreaks of infectious diseases, war, terrorism, and environmental disasters, may significantly affect a fund's investment performance. The effects of these developments to a fund will be impacted by the types of securities in which a fund invests, the financial condition, industry, economic sector, and geographic location of an issuer, and a fund's level of investment in the securities of that issuer. Significant concentrations in security types, issuers, industries, sectors, and geographic locations may magnify the factors that affect a fund's performance.
Item 8: Changes in and Disagreements with Accountants for Open-End Management Investment Companies
Note: This is not applicable for any fund included in this document.
Item 9: Proxy Disclosures for Open-End Management Investment Companies
Note: This is not applicable for any fund included in this document.
Item 10: Remuneration Paid to Directors, Officers, and others of Open-End Management Investment Companies
Note: This information is disclosed as part of the financial statements for each Fund as part of Item 7: Financial Statements and Financial Highlights for Open-End Management Investment companies.
Item 11: Statement Regarding Basis for Approval of Investment Advisory Contract
Board Approval of Investment Advisory Contracts
VIP Bond Index Portfolio
At its January 2024 meeting, the Board of Trustees, including the Independent Trustees (together, the Board), approved amended and restated sub-advisory agreements (the Sub-Advisory Contracts) for the fund, including the fund's sub-advisory agreements with FMR Investment Management (UK) Limited (FMR UK), Fidelity Management & Research (Hong Kong) Limited (FMR H.K.), and Fidelity Management & Research (Japan) Limited (FMR Japan). The Sub-Advisory Contracts will be effective March 1, 2024. The Board will consider the annual renewal of the fund's Sub-Advisory Contracts in September 2024, following its review of additional materials provided by FMR.
The Board considered the Sub-Advisory Contracts, which changed the arrangements for fees paid by FMR to the sub-advisers under the agreements. The Board noted that the agreements with FMR UK, FMR H.K., and FMR Japan were amended to provide that FMR will compensate each sub-adviser at a fee equal to 110% of the sub-adviser's costs incurred in providing services under the agreement. The Board considered that, under the Sub-Advisory Contracts, FMR, and not the fund, will continue to pay the sub-advisory fees to each applicable sub-adviser, and that the management fee paid by the fund under the management contract with FMR will remain unchanged.
The Board considered that the approval of the fund's Sub-Advisory Contracts will not result in any changes in the investment process or strategies employed in the management of the fund's assets or the day-to-day management of the fund or the persons primarily responsible for such management. Further, the Board considered that the Sub-Advisory Contracts would not change the obligations and services of FMR and its affiliates on behalf of the fund, and, in particular, there would be no change in the nature and level of services provided to the fund by FMR and its affiliates.
In connection with its consideration of future renewals of the fund's advisory contracts, the Board will consider: (i) the nature, extent and quality of services provided to the funds, including shareholder and administrative services and investment performance; (ii) the competitiveness of the management fee and total expenses for the fund; (iii) the costs of the services and profitability, including the revenues earned and the expenses incurred in conducting the business of developing, marketing, distributing, managing, administering, and servicing the fund and its shareholders, to the extent applicable; and (iv) whether there have been economies of scale in respect of the Fidelity funds, whether the Fidelity funds (including the fund) have appropriately benefited from any such economies of scale, and whether there is the potential for realization of any further economies.
Based on its evaluation of all of the conclusions noted above, and after considering all factors it believed relevant, the Board concluded that the fund's management fee structure is fair and reasonable, and that the fund's Sub-Advisory Contracts should be approved.
1.9887311.106
VUSB-SANN-0824
Fidelity® Variable Insurance Products:
VIP Target Volatility Portfolio
Semi-Annual Report
June 30, 2024
Contents
To view a fund's proxy voting guidelines and proxy voting record for the 12-month period ended June 30, visit http://www.fidelity.com/proxyvotingresults or visit the Securities and Exchange Commission's (SEC) web site at http://www.sec.gov.
You may also call 1-877-208-0098 to request a free copy of the proxy voting guidelines.
Fidelity® Variable Insurance Products are separate account options which are purchased through a variable insurance contract.
Standard & Poor's, S&P and S&P 500 are registered service marks of The McGraw-Hill Companies, Inc. and have been licensed for use by Fidelity Distributors Corporation.
Other third-party marks appearing herein are the property of their respective owners.
All other marks appearing herein are registered or unregistered trademarks or service marks of FMR LLC or an affiliated company. © 2024 FMR LLC. All rights reserved.
This report and the financial statements contained herein are submitted for the general information of the shareholders of the Fund. This report is not authorized for distribution to prospective investors in the Fund unless preceded or accompanied by an effective prospectus.
A fund files its complete schedule of portfolio holdings with the SEC for the first and third quarters of each fiscal year on Form N-PORT. Forms N-PORT are available on the SEC's web site at http://www.sec.gov. A fund's Forms N-PORT may be reviewed and copied at the SEC's Public Reference Room in Washington, DC. Information regarding the operation of the SEC's Public Reference Room may be obtained by calling 1-800-SEC-0330.
For a complete list of a fund's portfolio holdings, view the most recent holdings listing, semiannual report, or annual report on Fidelity's web site at http://www.fidelity.com, http://www.institutional.fidelity.com, or http://www.401k.com, as applicable.
NOT FDIC INSURED •MAY LOSE VALUE •NO BANK GUARANTEE
Neither the Fund nor Fidelity Distributors Corporation is a bank.
Item 7: Financial Statements and Financial Highlights for Open-End Management Investment Companies (Semi-Annual Report)
VIP Target Volatility Portfolio
Schedule of Investments June 30, 2024 (Unaudited)
Showing Percentage of Net Assets
| Equity Funds - 80.0% |
| | | Shares | Value ($) |
| Domestic Equity Funds - 46.6% | | | |
| Fidelity Contrafund (a) | | 229,963 | 4,645,253 |
| Fidelity Hedged Equity Fund (a) | | 40,803 | 505,955 |
| Fidelity Low-Priced Stock Fund (a) | | 81,644 | 3,821,756 |
| Fidelity U.S. Low Volatility Equity Fund (a) | | 37,881 | 436,765 |
| iShares Core S&P 500 ETF | | 37,266 | 20,393,073 |
| VIP Stock Selector All Cap Portfolio Investor Class (a) | | 5,150,892 | 58,514,133 |
TOTAL DOMESTIC EQUITY FUNDS | | | 88,316,935 |
| International Equity Funds - 33.4% | | | |
| Fidelity Canada Fund (a) | | 27,185 | 1,812,664 |
| Fidelity Emerging Markets Fund (a) | | 365,626 | 14,511,713 |
| Fidelity Enhanced International ETF (a)(b) | | 258,607 | 7,328,922 |
| Fidelity International Value Fund (a) | | 668,128 | 7,048,753 |
| Fidelity Japan Smaller Companies Fund (a) | | 112,679 | 1,774,689 |
| Fidelity Overseas Fund (a) | | 187,814 | 12,230,446 |
| iShares Core MSCI EAFE ETF | | 204,518 | 14,856,188 |
| iShares Core MSCI Emerging Markets ETF | | 68,668 | 3,675,798 |
TOTAL INTERNATIONAL EQUITY FUNDS | | | 63,239,173 |
| TOTAL EQUITY FUNDS (Cost $129,238,265) | | | 151,556,108 |
| | | | |
| Fixed-Income Funds - 18.5% |
| | | Shares | Value ($) |
| Fixed-Income Funds - 18.5% | | | |
| Fidelity Long-Term Treasury Bond Index Fund (a) | | 42,494 | 403,266 |
| Fidelity Total Bond Fund (a) | | 3,370,824 | 31,685,746 |
| Fidelity U.S. Bond Index Fund (a) | | 287,639 | 2,933,918 |
| | | | |
| TOTAL FIXED-INCOME FUNDS (Cost $36,587,898) | | | 35,022,930 |
| | | | |
| Investment Companies - 0.5% |
| | | Shares | Value ($) |
| Investment Companies - 0.5% | | | |
SPDR Bloomberg Barclays 1-10 Year TIPS ETF (Cost $845,951) | | 45,778 | 845,977 |
| | | | |
| Money Market Funds - 1.3% |
| | | Shares | Value ($) |
| Cash Equivalents - 1.3% | | | |
| Fidelity Cash Central Fund 5.38% (c) | | 1,944,774 | 1,945,163 |
| Fidelity Securities Lending Cash Central Fund 5.38% (c)(d) | | 484,252 | 484,300 |
TOTAL CASH EQUIVALENTS | | | 2,429,463 |
| Money Market Funds - 0.0% | | | |
| Fidelity Investments Money Market Government Portfolio Institutional Class 5.25% (a)(e) | | 1,791 | 1,791 |
| TOTAL MONEY MARKET FUNDS (Cost $2,431,254) | | | 2,431,254 |
| | | | |
| TOTAL INVESTMENT IN SECURITIES - 100.3% (Cost $169,103,368) | 189,856,269 |
NET OTHER ASSETS (LIABILITIES) - (0.3)% | (520,759) |
| NET ASSETS - 100.0% | 189,335,510 |
| | |
Security Type Abbreviations
Legend
| (b) | Security or a portion of the security is on loan at period end. |
| (c) | Affiliated fund that is generally available only to investment companies and other accounts managed by Fidelity Investments. The rate quoted is the annualized seven-day yield of the fund at period end. A complete unaudited listing of the fund's holdings as of its most recent quarter end is available upon request. In addition, each Fidelity Central Fund's financial statements are available on the SEC's website or upon request. |
| (d) | Investment made with cash collateral received from securities on loan. |
| (e) | The rate quoted is the annualized seven-day yield of the fund at period end. |
Affiliated Central Funds
Fiscal year to date information regarding the Fund's investments in Fidelity Central Funds, including the ownership percentage, is presented below.
| Affiliate | Value, beginning of period ($) | Purchases ($) | Sales Proceeds ($) | Dividend Income ($) | Realized Gain (loss) ($) | Change in Unrealized appreciation (depreciation) ($) | Value, end of period ($) | % ownership, end of period |
| Fidelity Cash Central Fund 5.38% | 2,729,446 | 9,445,758 | 10,230,041 | 39,934 | - | - | 1,945,163 | 0.0% |
| Fidelity Securities Lending Cash Central Fund 5.38% | 11,836,475 | 148,448,824 | 159,800,999 | 22,310 | - | - | 484,300 | 0.0% |
| Total | 14,565,921 | 157,894,582 | 170,031,040 | 62,244 | - | - | 2,429,463 | |
| | | | | | | | | |
Amounts in the dividend income column in the above table include any capital gain distributions from underlying funds, which are presented in the corresponding line item in the Statement of Operations, if applicable.
Amounts in the dividend income column for Fidelity Securities Lending Cash Central Fund represents the income earned on investing cash collateral, less rebates paid to borrowers and any lending agent fees associated with the loan, plus any premium payments received for lending certain types of securities.
Amounts included in the purchases and sales proceeds columns may include in-kind transactions, if applicable.
Affiliated Underlying Funds
Fiscal year to date information regarding the Fund's investments in affiliated Underlying Funds is presented below. Exchanges between classes of the same affiliated Underlying Funds may occur. If an Underlying Funds changes its name, the name presented below is the name in effect at period end.
| Affiliate | Value, beginning of period ($) | Purchases ($) | Sales Proceeds ($) | Dividend Income ($) | Realized Gain (loss) ($) | Change in Unrealized appreciation (depreciation) ($) | Value, end of period ($) |
| Fidelity Canada Fund | 2,193,677 | 7,170 | 457,538 | - | 23,019 | 46,336 | 1,812,664 |
| Fidelity Contrafund | 4,275,973 | 20,626 | 685,004 | 3,342 | 140,343 | 893,315 | 4,645,253 |
| Fidelity Emerging Markets Fund | 14,932,757 | 30,685 | 1,946,900 | - | 108,462 | 1,386,709 | 14,511,713 |
| Fidelity Enhanced International ETF | 6,853,086 | - | - | 132,148 | - | 475,836 | 7,328,922 |
| Fidelity Enhanced Large Cap Value ETF | 5,430,171 | - | 5,873,112 | 52,785 | 1,449,039 | (1,006,098) | - |
| Fidelity Equity-Income Fund | 2,458,571 | 19,922 | 2,701,566 | 18,810 | 644,908 | (421,835) | - |
| Fidelity Hedged Equity Fund | 982,202 | 265 | 569,613 | 265 | 74,981 | 18,120 | 505,955 |
| Fidelity International Value Fund | 8,175,363 | 26,750 | 1,707,154 | - | 140,584 | 413,210 | 7,048,753 |
| Fidelity Investments Money Market Government Portfolio Institutional Class 5.25% | 1,745 | 46 | - | 46 | - | - | 1,791 |
| Fidelity Japan Smaller Companies Fund | 1,698,068 | - | - | - | - | 76,621 | 1,774,689 |
| Fidelity Long-Term Treasury Bond Index Fund | 471,623 | 8,201 | 47,090 | 7,518 | (6,393) | (23,075) | 403,266 |
| Fidelity Low-Priced Stock Fund | 4,199,234 | 15,484 | 643,717 | - | 6,702 | 244,053 | 3,821,756 |
| Fidelity Overseas Fund | 14,119,442 | 46,433 | 2,963,905 | - | 215,175 | 813,301 | 12,230,446 |
| Fidelity Total Bond Fund | 38,425,479 | 771,478 | 6,799,067 | 714,839 | (671,389) | (40,755) | 31,685,746 |
| Fidelity U.S. Bond Index Fund | 3,593,376 | 56,203 | 641,306 | 50,938 | 5,230 | (79,585) | 2,933,918 |
| Fidelity U.S. Low Volatility Equity Fund | 975,054 | 1,923 | 609,134 | - | 89,023 | (20,101) | 436,765 |
| Fidelity Value Discovery Fund | 1,860,079 | 845 | 1,968,524 | - | 548,505 | (440,905) | - |
| VIP Stock Selector All Cap Portfolio Investor Class | 60,022,974 | 113,947 | 7,671,787 | - | 577,576 | 5,471,423 | 58,514,133 |
| | 170,668,874 | 1,119,978 | 35,285,417 | 980,691 | 3,345,765 | 7,806,570 | 147,655,770 |
Amounts in the dividend income column in the above table include any capital gain distributions from underlying funds, which are presented in the corresponding line item in the Statement of Operations, if applicable.
Amounts included in the purchases and sales proceeds columns may include in-kind transactions, if applicable.
Investment Valuation
The following is a summary of the inputs used, as of June 30, 2024, involving the Fund's assets and liabilities carried at fair value. The inputs or methodology used for valuing securities may not be an indication of the risk associated with investing in those securities. For more information on valuation inputs, and their aggregation into the levels used below, please refer to the Investment Valuation section in the accompanying Notes to Financial Statements.
| Valuation Inputs at Reporting Date: |
| Description | Total ($) | Level 1 ($) | Level 2 ($) | Level 3 ($) |
Investments in Securities: | | | | |
|
| Equity Funds | 151,556,108 | 151,556,108 | - | - |
|
| Fixed-Income Funds | 35,022,930 | 35,022,930 | - | - |
|
| Investment Companies | 845,977 | 845,977 | - | - |
|
| Money Market Funds | 2,431,254 | 2,431,254 | - | - |
| Total Investments in Securities: | 189,856,269 | 189,856,269 | - | - |
Financial Statements (Unaudited)
| Statement of Assets and Liabilities |
| | | | June 30, 2024 (Unaudited) |
| | | | | |
| Assets | | | | |
| Investment in securities, at value (including securities loaned of $473,278) - See accompanying schedule: | | | | |
Unaffiliated issuers (cost $36,203,225) | $ | 39,771,036 | | |
Fidelity Central Funds (cost $2,429,463) | | 2,429,463 | | |
Other affiliated issuers (cost $130,470,680) | | 147,655,770 | | |
| | | | | |
| | | | | |
| Total Investment in Securities (cost $169,103,368) | | | $ | 189,856,269 |
| Receivable for investments sold | | | | 90,229 |
| Receivable for fund shares sold | | | | 3,932 |
| Distributions receivable from Fidelity Central Funds | | | | 16,621 |
Total assets | | | | 189,967,051 |
| Liabilities | | | | |
| Payable for fund shares redeemed | $ | 95,123 | | |
| Accrued management fee | | 23,750 | | |
| Distribution and service plan fees payable | | 23,569 | | |
| Other affiliated payables | | 4,799 | | |
| Collateral on securities loaned | | 484,300 | | |
| Total liabilities | | | | 631,541 |
| Net Assets | | | $ | 189,335,510 |
| Net Assets consist of: | | | | |
| Paid in capital | | | $ | 169,967,127 |
| Total accumulated earnings (loss) | | | | 19,368,383 |
| Net Assets | | | $ | 189,335,510 |
| | | | | |
| Net Asset Value and Maximum Offering Price | | | | |
| Service Class : | | | | |
Net Asset Value, offering price and redemption price per share ($1,459,729 ÷ 116,428 shares) | | | $ | 12.54 |
| Service Class 2 : | | | | |
Net Asset Value, offering price and redemption price per share ($187,875,781 ÷ 15,061,729 shares) | | | $ | 12.47 |
| Statement of Operations |
| | | | Six months ended June 30, 2024 (Unaudited) |
| Investment Income | | | | |
| Dividends: | | | | |
| Unaffiliated issuers | | | $ | 404,855 |
| Affiliated issuers | | | | 969,945 |
| Income from Fidelity Central Funds (including $22,310 from security lending) | | | | 62,244 |
| Total income | | | | 1,437,044 |
| Expenses | | | | |
| Management fee | $ | 192,507 | | |
| Transfer agent fees | | 28,025 | | |
| Distribution and service plan fees | | 239,578 | | |
| Independent trustees' fees and expenses | | 259 | | |
| Total expenses before reductions | | 460,369 | | |
| Expense reductions | | (144,380) | | |
| Total expenses after reductions | | | | 315,989 |
| Net Investment income (loss) | | | | 1,121,055 |
| Realized and Unrealized Gain (Loss) | | | | |
| Net realized gain (loss) on: | | | | |
| Investment Securities: | | | | |
| Unaffiliated issuers | | 54,746 | | |
| Affiliated issuers | | 3,345,765 | | |
| Capital gain distributions from underlying funds: | | | | |
| Affiliated issuers | | 10,746 | | |
| Total net realized gain (loss) | | | | 3,411,257 |
| Change in net unrealized appreciation (depreciation) on: | | | | |
| Investment Securities: | | | | |
| Unaffiliated issuers | | 2,244,266 | | |
| Affiliated issuers | | 7,806,570 | | |
| Total change in net unrealized appreciation (depreciation) | | | | 10,050,836 |
| Net gain (loss) | | | | 13,462,093 |
| Net increase (decrease) in net assets resulting from operations | | | $ | 14,583,148 |
| Statement of Changes in Net Assets |
| |
| | Six months ended June 30, 2024 (Unaudited) | | Year ended December 31, 2023 |
| Increase (Decrease) in Net Assets | | | | |
| Operations | | | | |
| Net investment income (loss) | $ | 1,121,055 | $ | 3,839,367 |
| Net realized gain (loss) | | 3,411,257 | | (4,576,723) |
| Change in net unrealized appreciation (depreciation) | | 10,050,836 | | 26,376,042 |
| Net increase (decrease) in net assets resulting from operations | | 14,583,148 | | 25,638,686 |
| Distributions to shareholders | | - | | (3,856,525) |
| | | | | |
| Share transactions - net increase (decrease) | | (20,851,986) | | (28,701,243) |
| Total increase (decrease) in net assets | | (6,268,838) | | (6,919,082) |
| | | | | |
| Net Assets | | | | |
| Beginning of period | | 195,604,348 | | 202,523,430 |
| End of period | $ | 189,335,510 | $ | 195,604,348 |
| | | | | |
| | | | | |
Financial Highlights
VIP Target Volatility Portfolio Service Class |
| |
| | Six months ended (Unaudited) June 30, 2024 | | Years ended December 31, 2023 | | 2022 | | 2021 | | 2020 | | 2019 |
Selected Per-Share Data | | | | | | | | | | | | |
| Net asset value, beginning of period | $ | 11.61 | $ | 10.39 | $ | 12.76 | $ | 13.05 | $ | 12.40 | $ | 10.86 |
| Income from Investment Operations | | | | | | | | | | | | |
Net investment income (loss) A,B | | .08 | | .23 | | .17 | | .13 | | .14 | | .20 |
| Net realized and unrealized gain (loss) | | .85 | | 1.24 | | (2.13) | | 1.46 | | .97 | | 1.81 |
| Total from investment operations | | .93 | | 1.47 | | (1.96) | | 1.59 | | 1.11 | | 2.01 |
| Distributions from net investment income | | - | | (.25) | | (.27) | | - C | | (.18) | | (.19) |
| Distributions from net realized gain | | - | | - | | (.14) | | (1.88) | | (.29) | | (.28) |
| Total distributions | | - | | (.25) | | (.41) | | (1.88) | | (.46) D | | (.47) |
| Net asset value, end of period | $ | 12.54 | $ | 11.61 | $ | 10.39 | $ | 12.76 | $ | 13.05 | $ | 12.40 |
Total Return E,F,G | | | | 14.14% | | (15.53)% | | 12.16% | | 9.13% | | 18.81% |
Ratios to Average Net Assets B,H,I | | | | | | | | | | | | |
| Expenses before reductions | | .33% J | | .32% | | .35% | | .41% | | .40% | | .42% |
| Expenses net of fee waivers, if any | | | | .17% | | .20% | | .26% | | .25% | | .27% |
| Expenses net of all reductions | | .18% J | | .17% | | .20% | | .26% | | .25% | | .27% |
| Net investment income (loss) | | 1.31% J | | 2.10% | | 1.52% | | .93% | | 1.12% | | 1.72% |
| Supplemental Data | | | | | | | | | | | | |
| Net assets, end of period (000 omitted) | $ | 1,460 | $ | 1,352 | $ | 1,210 | $ | 1,486 | $ | 1,519 | $ | 1,434 |
Portfolio turnover rate K | | | | 61% | | 50% | | 64% | | 57% | | 65% |
ACalculated based on average shares outstanding during the period.
BNet investment income (loss) is affected by the timing of the declaration of dividends by any underlying mutual funds or exchange-traded funds (ETFs). Net investment income (loss) of any mutual funds or ETFs is not included in the Fund's net investment income (loss) ratio.
CAmount represents less than $.005 per share.
DTotal distributions per share do not sum due to rounding.
ETotal returns for periods of less than one year are not annualized.
FTotal returns do not reflect charges attributable to your insurance company's separate account. Inclusion of these charges would reduce the total returns shown.
GTotal returns would have been lower if certain expenses had not been reduced during the applicable periods shown.
HFees and expenses of any underlying mutual funds or exchange-traded funds (ETFs) are not included in the Fund's expense ratio. The Fund indirectly bears its proportionate share of these expenses. For additional expense information related to investments in Fidelity Central Funds, please refer to the "Investments in Fidelity Central Funds" note found in the Notes to Financial Statements section of the most recent Annual or Semi-Annual report.
IExpense ratios reflect operating expenses of the class. Expenses before reductions do not reflect amounts reimbursed, waived, or reduced through arrangements with the investment adviser, brokerage services, or other offset arrangements, if applicable, and do not represent the amount paid by the class during periods when reimbursements, waivers or reductions occur.
JAnnualized.
KAmount does not include the portfolio activity of any underlying mutual funds or exchange-traded funds (ETFs).
VIP Target Volatility Portfolio Service Class 2 |
| |
| | Six months ended (Unaudited) June 30, 2024 | | Years ended December 31, 2023 | | 2022 | | 2021 | | 2020 | | 2019 |
Selected Per-Share Data | | | | | | | | | | | | |
| Net asset value, beginning of period | $ | 11.56 | $ | 10.35 | $ | 12.71 | $ | 13.02 | $ | 12.37 | $ | 10.83 |
| Income from Investment Operations | | | | | | | | | | | | |
Net investment income (loss) A,B | | .07 | | .21 | | .15 | | .11 | | .12 | | .18 |
| Net realized and unrealized gain (loss) | | .84 | | 1.23 | | (2.11) | | 1.46 | | .97 | | 1.81 |
| Total from investment operations | | .91 | | 1.44 | | (1.96) | | 1.57 | | 1.09 | | 1.99 |
| Distributions from net investment income | | - | | (.23) | | (.26) | | - C | | (.16) | | (.16) |
| Distributions from net realized gain | | - | | - | | (.14) | | (1.88) | | (.29) | | (.28) |
| Total distributions | | - | | (.23) | | (.40) | | (1.88) | | (.44) D | | (.45) D |
| Net asset value, end of period | $ | 12.47 | $ | 11.56 | $ | 10.35 | $ | 12.71 | $ | 13.02 | $ | 12.37 |
Total Return E,F,G | | | | 13.93% | | (15.65)% | | 12.03% | | 8.99% | | 18.65% |
Ratios to Average Net Assets B,H,I | | | | | | | | | | | | |
| Expenses before reductions | | .48% J | | .47% | | .50% | | .56% | | .56% | | .57% |
| Expenses net of fee waivers, if any | | | | .32% | | .35% | | .41% | | .40% | | .42% |
| Expenses net of all reductions | | .33% J | | .32% | | .35% | | .41% | | .40% | | .42% |
| Net investment income (loss) | | 1.16% J | | 1.95% | | 1.37% | | .78% | | .97% | | 1.57% |
| Supplemental Data | | | | | | | | | | | | |
| Net assets, end of period (000 omitted) | $ | 187,876 | $ | 194,252 | $ | 201,313 | $ | 265,197 | $ | 269,141 | $ | 290,145 |
Portfolio turnover rate K | | | | 61% | | 50% | | 64% | | 57% | | 65% |
ACalculated based on average shares outstanding during the period.
BNet investment income (loss) is affected by the timing of the declaration of dividends by any underlying mutual funds or exchange-traded funds (ETFs). Net investment income (loss) of any mutual funds or ETFs is not included in the Fund's net investment income (loss) ratio.
CAmount represents less than $.005 per share.
DTotal distributions per share do not sum due to rounding.
ETotal returns for periods of less than one year are not annualized.
FTotal returns do not reflect charges attributable to your insurance company's separate account. Inclusion of these charges would reduce the total returns shown.
GTotal returns would have been lower if certain expenses had not been reduced during the applicable periods shown.
HFees and expenses of any underlying mutual funds or exchange-traded funds (ETFs) are not included in the Fund's expense ratio. The Fund indirectly bears its proportionate share of these expenses. For additional expense information related to investments in Fidelity Central Funds, please refer to the "Investments in Fidelity Central Funds" note found in the Notes to Financial Statements section of the most recent Annual or Semi-Annual report.
IExpense ratios reflect operating expenses of the class. Expenses before reductions do not reflect amounts reimbursed, waived, or reduced through arrangements with the investment adviser, brokerage services, or other offset arrangements, if applicable, and do not represent the amount paid by the class during periods when reimbursements, waivers or reductions occur.
JAnnualized.
KAmount does not include the portfolio activity of any underlying mutual funds or exchange-traded funds (ETFs).
Notes to Financial Statements
(Unaudited)For the period ended June 30, 2024
1. Organization.
VIP Target Volatility Portfolio (the Fund) is a fund of Variable Insurance Products Fund V (the Trust) and is authorized to issue an unlimited number of shares. The Trust is registered under the Investment Company Act of 1940, as amended (the 1940 Act), as an open-end management investment company organized as a Massachusetts business trust. Shares of the Fund may only be purchased by insurance companies for the purpose of funding variable annuity or variable life insurance contracts. The Fund offers the following classes of shares: Service Class shares and Service Class 2 shares. All classes have equal rights and voting privileges, except for matters affecting a single class.
2. Investments in Fidelity Central Funds.
Funds may invest in Fidelity Central Funds, which are open-end investment companies generally available only to other investment companies and accounts managed by the investment adviser and its affiliates. The Schedule of Investments lists any Fidelity Central Funds held as an investment as of period end, but does not include the underlying holdings of each Fidelity Central Fund. An investing fund indirectly bears its proportionate share of the expenses of the underlying Fidelity Central Funds.
Based on its investment objective, each Fidelity Central Fund may invest or participate in various investment vehicles or strategies that are similar to those of the investing fund. These strategies are consistent with the investment objectives of the investing fund and may involve certain economic risks which may cause a decline in value of each of the Fidelity Central Funds and thus a decline in the value of the investing fund.
| Fidelity Central Fund | Investment Manager | Investment Objective | Investment Practices | Expense RatioA |
| Fidelity Money Market Central Funds | Fidelity Management & Research Company LLC (FMR) | Each fund seeks to obtain a high level of current income consistent with the preservation of capital and liquidity. | Short-term Investments | Less than .005% |
A Expenses expressed as a percentage of average net assets and are as of each underlying Central Fund's most recent annual or semi-annual shareholder report.
A complete unaudited list of holdings for each Fidelity Central Fund is available upon request or at the Securities and Exchange Commission website at www.sec.gov. In addition, the financial statements of the Fidelity Central Funds which contain the significant accounting policies (including investment valuation policies) of those funds, and are not covered by the Report of Independent Registered Public Accounting Firm, are available on the Securities and Exchange Commission website or upon request.
3. Significant Accounting Policies.
The Fund is an investment company and applies the accounting and reporting guidance of the Financial Accounting Standards Board (FASB) Accounting Standards Codification Topic 946 Financial Services - Investment Companies. The financial statements have been prepared in conformity with accounting principles generally accepted in the United States of America (GAAP), which require management to make certain estimates and assumptions at the date of the financial statements. Actual results could differ from those estimates. Subsequent events, if any, through the date that the financial statements were issued have been evaluated in the preparation of the financial statements. The Fund's Schedule of Investments lists any underlying mutual funds or exchange-traded funds (ETFs) but does not include the underlying holdings of these funds. The following summarizes the significant accounting policies of the Fund:
Investment Valuation. Investments are valued as of 4:00 p.m. Eastern time on the last calendar day of the period. The Fund uses a third party pricing service approved by the Board of Trustees (the Board) to value its investments. The Board of Trustees (the Board) has designated the Fund's investment adviser as the valuation designee responsible for the fair valuation function and performing fair value determinations as needed. The investment adviser has established a Fair Value Committee (the Committee) to carry out the day-to-day fair valuation responsibilities and has adopted policies and procedures to govern the fair valuation process and the activities of the Committee. In accordance with these fair valuation policies and procedures, which have been approved by the Board, the Fund attempts to obtain prices from one or more third party pricing services or brokers to value its investments. When current market prices, quotations or currency exchange rates are not readily available or reliable, investments will be fair valued in good faith by the Committee, in accordance with the policies and procedures. Factors used in determining fair value vary by investment type and may include market or investment specific events, transaction data, estimated cash flows, and market observations of comparable investments. The frequency that the fair valuation procedures are used cannot be predicted and they may be utilized to a significant extent. The Committee manages the Fund's fair valuation practices and maintains the fair valuation policies and procedures. The Fund's investment adviser reports to the Board information regarding the fair valuation process and related material matters. The Fund categorizes the inputs to valuation techniques used to value its investments into a disclosure hierarchy consisting of three levels as shown below:
Level 1 - unadjusted quoted prices in active markets for identical investments
Level 2 - other significant observable inputs (including quoted prices for similar investments, interest rates, prepayment speeds, etc.)
Level 3 - unobservable inputs (including the Fund's own assumptions based on the best information available)
Valuation techniques used to value the Fund's investments by major category are as follows:
Investments in open-end mutual funds, including the Fidelity Central Funds, are valued at their closing net asset value (NAV) each business day and are categorized as Level 1 in the hierarchy.
ETF's are valued at their last sale price or official closing price as reported by a third party pricing service on the primary market or exchange on which they are traded and are categorized as Level 1 in the hierarchy. In the event there were no sales during the day but the exchange reports a closing bid level, ETFs are valued at the closing bid and would be categorized as Level 1 in the hierarchy. In the event there was no closing bid, ETFs may be valued by another method that the Board believes reflects fair value in accordance with the Board's fair value pricing policies and may be categorized as Level 2 in the hierarchy.
The aggregate value of investments by input level as of June 30, 2024 is included at the end of the Fund's Schedule of Investments.
Investment Transactions and Income. For financial reporting purposes, the Fund's investment holdings and NAV include trades executed through the end of the last business day of the period. The NAV per share for processing shareholder transactions is calculated as of the close of business of the New York Stock Exchange (NYSE), normally 4:00 p.m. Eastern time and includes trades executed through the end of the prior business day. Gains and losses on securities sold are determined on the basis of identified cost. Income and capital gain distributions from any underlying mutual funds or exchange-traded funds (ETFs) are recorded on the ex-dividend date.
Class Allocations and Expenses. Investment income, realized and unrealized capital gains and losses, common expenses of a fund, and certain fund-level expense reductions, if any, are allocated daily on a pro-rata basis to each class based on the relative net assets of each class to the total net assets of a fund. Each class differs with respect to transfer agent and distribution and service plan fees incurred, as applicable. Certain expense reductions may also differ by class, if applicable. For the reporting period, the allocated portion of income and expenses to each class as a percent of its average net assets may vary due to the timing of recording these transactions in relation to fluctuating net assets of the classes. Expenses directly attributable to a fund are charged to that fund. Expenses attributable to more than one fund are allocated among the respective funds on the basis of relative net assets or other appropriate methods. Expenses included in the accompanying financial statements reflect the expenses of that fund and do not include any expenses associated with any underlying mutual funds or exchange-traded funds (ETFs). Although not included in a fund's expenses, a fund indirectly bears its proportionate share of these expenses through the net asset value of each underlying mutual fund or exchange-traded fund (ETF). Expense estimates are accrued in the period to which they relate and adjustments are made when actual amounts are known.
Income Tax Information and Distributions to Shareholders. Each year, the Fund intends to qualify as a regulated investment company under Subchapter M of the Internal Revenue Code, including distributing substantially all of its taxable income and realized gains. As a result, no provision for U.S. Federal income taxes is required. The Fund files a U.S. federal tax return, in addition to state and local tax returns as required. The Fund's federal income tax returns are subject to examination by the Internal Revenue Service (IRS) for a period of three fiscal years after they are filed. State and local tax returns may be subject to examination for an additional fiscal year depending on the jurisdiction.
Distributions are declared and recorded on the ex-dividend date. Income and capital gain distributions are declared separately for each class. Income and capital gain distributions are determined in accordance with income tax regulations, which may differ from GAAP.
Capital accounts within the financial statements are adjusted for permanent book-tax differences. These adjustments have no impact on net assets or the results of operations. Capital accounts are not adjusted for temporary book-tax differences which will reverse in a subsequent period.
Book-tax differences are primarily due to the short-term gain distributions from the underlying mutual funds or exchange-traded funds (ETFs), futures transactions, capital loss carryforwards and losses deferred due to wash sales and excise tax regulations.
As of period end, the cost and unrealized appreciation (depreciation) in securities, and derivatives if applicable, for federal income tax purposes were as follows:
| Gross unrealized appreciation | $22,531,712 |
| Gross unrealized depreciation | (2,177,009) |
| Net unrealized appreciation (depreciation) | $20,354,703 |
| Tax cost | $169,501,566 |
Capital loss carryforwards are only available to offset future capital gains of the Fund to the extent provided by regulations and may be limited. The capital loss carryforward information presented below, including any applicable limitation, is estimated as of prior fiscal period end and is subject to adjustment.
Long-term | $(5,379,046) |
| Total capital loss carryforward | $(5,379,046) |
4. Purchases and Sales of Investments.
Purchases and sales of securities, other than short-term securities and in-kind transactions, as applicable, are noted in the table below.
| | Purchases ($) | Sales ($) |
| VIP Target Volatility Portfolio | 17,422,056 | 36,348,518 |
5. Fees and Other Transactions with Affiliates.
Management Fee. Fidelity Management & Research Company LLC (the investment adviser) provides the Fund with investment management related services. For these services the Fund pays a monthly management fee to the investment adviser. The management fee is computed at an annual rate of .20% of the Fund's average net assets. Under the management contract, the investment adviser pays all other fund-level operating expenses, except the compensation of the independent Trustees and certain other expenses such as interest expense.
During the period, the investment adviser waived a portion of its management fee as described in the Expense Reductions note.
Distribution and Service Plan Fees. In accordance with Rule 12b-1 of the 1940 Act, the Fund has adopted separate 12b-1 Plans for each Service Class of shares. Each Service Class pays Fidelity Distributors Company LLC (FDC), an affiliate of the investment adviser, a service fee. For the period, the service fee is based on an annual rate of .10% of Service Class' average net assets and .25% of Service Class 2's average net assets.
For the period, total fees, all of which were re-allowed to insurance companies for the distribution of shares and providing shareholder support services, were as follows:
| Service Class | $703 |
| Service Class 2 | 238,875 |
| | $239,578 |
Transfer Agent Fees. Fidelity Investments Institutional Operations Company LLC (FIIOC), an affiliate of the investment adviser, is the Fund's transfer, dividend disbursing, and shareholder servicing agent. FIIOC receives an asset-based fee with respect to each class. Each class pays a fee for transfer agent services, typesetting and printing and mailing of shareholder reports, excluding mailing of proxy statements, equal to an annual rate of .14% of class-level average net assets invested in underlying mutual funds or exchange-traded funds (ETFs) that are not managed by the investment adviser or its affiliates. For the period, transfer agent fees for each class were as follows:
| | Amount ($) | % of Class-Level Average Net Assets |
| Service Class | 205 | .03 |
| Service Class 2 | 27,820 | .03 |
| | 28,025 | |
Interfund Trades. Funds may purchase from or sell securities to other Fidelity Funds under procedures adopted by the Board. The procedures have been designed to ensure these interfund trades are executed in accordance with Rule 17a-7 of the 1940 Act. Any interfund trades are included within the respective purchases and sales amounts shown in the Purchases and Sales of Investments note. During the period, there were no interfund trades.
6. Committed Line of Credit.
Certain Funds participate with other funds managed by the investment adviser or an affiliate in a $4.25 billion credit facility (the "line of credit") to be utilized for temporary or emergency purposes to fund shareholder redemptions or for other short-term liquidity purposes. The commitment fees on the pro-rata portion of the line of credit are borne by the investment adviser. During the period, there were no borrowings on this line of credit.
7. Security Lending.
Funds lend portfolio securities from time to time in order to earn additional income. Lending agents are used, including National Financial Services (NFS), an affiliate of the investment adviser. Pursuant to a securities lending agreement, NFS will receive a fee, which is capped at 9.9% of a fund's daily lending revenue, for its services as lending agent. A fund may lend securities to certain qualified borrowers, including NFS. On the settlement date of the loan, a fund receives collateral (in the form of U.S. Treasury obligations, letters of credit and/or cash) against the loaned securities and maintains collateral in an amount not less than 100% of the market value of the loaned securities during the period of the loan. The market value of the loaned securities is determined at the close of business of a fund and any additional required collateral is delivered to a fund on the next business day. A fund or borrower may terminate the loan at any time, and if the borrower defaults on its obligation to return the securities loaned because of insolvency or other reasons, a fund may apply collateral received from the borrower against the obligation. A fund may experience delays and costs in recovering the securities loaned. Any cash collateral received is invested in the Fidelity Securities Lending Cash Central Fund. Any loaned securities are identified as such in the Schedule of Investments, and the value of loaned securities and cash collateral at period end, as applicable, are presented in the Statement of Assets and Liabilities. Security lending income represents the income earned on investing cash collateral, less rebates paid to borrowers and any lending agent fees associated with the loan, plus any premium payments received for lending certain types of securities. Security lending income is presented in the Statement of Operations as a component of income from Fidelity Central Funds. Affiliated security lending activity, if any, was as follows:
| | Total Security Lending Fees Paid to NFS ($) | Security Lending Income From Securities Loaned to NFS ($) | Value of Securities Loaned to NFS at Period End ($) |
| VIP Target Volatility Portfolio | 2,418 | - | - |
8. Expense Reductions.
The investment adviser contractually agreed to waive the Fund's management fee in an amount equal to .05% of the Fund's average net assets until April 30, 2025. During the period, the Fund's management fee was reduced by $48,127.
In addition, FMR has contractually agreed to reimburse .10% of class-level expenses for Service Class and Service Class 2. During the period, this reimbursement reduced the Fund's Service Class and Service Class 2's expenses by the following amounts:
| | Reimbursement ($) |
Service Class | 703 |
Service Class 2 | 95,550 |
9. Distributions to Shareholders.
Distributions to shareholders of each class were as follows:
| | Six months ended June 30, 2024 | Year ended December 31, 2023 |
| VIP Target Volatility Portfolio | | |
| Distributions to shareholders | | |
| Service Class | - | 29,104 |
| Service Class 2 | - | 3,827,421 |
Total | $ - | $3,856,525 |
10. Share Transactions.
Transactions for each class of shares were as follows and may contain in-kind transactions:
| | Shares | Shares | Dollars | Dollars |
| | Six months ended June 30, 2024 | Year ended December 31, 2023 | Six months ended June 30, 2024 | Year ended December 31, 2023 |
| VIP Target Volatility Portfolio | | | | |
| Service Class | | | | |
| Reinvestment of distributions | - | 16 | - | 190 |
| Shares redeemed | (5) | (12) | (65) | (133) |
| Net increase (decrease) | (5) | 4 | $(65) | $57 |
| Service Class 2 | | | | |
| Shares sold | 103,929 | 537,799 | $1,243,748 | $5,874,801 |
| Reinvestment of distributions | - | 330,520 | - | 3,827,421 |
| Shares redeemed | (1,842,661) | (3,516,533) | (22,095,669) | (38,403,522) |
| Net increase (decrease) | (1,738,732) | (2,648,214) | $(20,851,921) | $(28,701,300) |
11. Other.
A fund's organizational documents provide former and current trustees and officers with a limited indemnification against liabilities arising in connection with the performance of their duties to the fund. In the normal course of business, a fund may also enter into contracts that provide general indemnifications. A fund's maximum exposure under these arrangements is unknown as this would be dependent on future claims that may be made against a fund. The risk of material loss from such claims is considered remote.
At the end of the period, certain otherwise unaffiliated shareholders were owners of record of more than 10% of the outstanding shares as follows:
| Fund | Number of Unaffiliated Shareholders | Unaffiliated Shareholders % |
| VIP Target Volatility Portfolio | 1 | 93% |
12. Risk and Uncertainties.
Many factors affect a fund's performance. Developments that disrupt global economies and financial markets, such as pandemics, epidemics, outbreaks of infectious diseases, war, terrorism, and environmental disasters, may significantly affect a fund's investment performance. The effects of these developments to a fund will be impacted by the types of securities in which a fund invests, the financial condition, industry, economic sector, and geographic location of an issuer, and a fund's level of investment in the securities of that issuer. Significant concentrations in security types, issuers, industries, sectors, and geographic locations may magnify the factors that affect a fund's performance.
Item 8: Changes in and Disagreements with Accountants for Open-End Management Investment Companies
Note: This is not applicable for any fund included in this document.
Item 9: Proxy Disclosures for Open-End Management Investment Companies
Note: This is not applicable for any fund included in this document.
Item 10: Remuneration Paid to Directors, Officers, and others of Open-End Management Investment Companies
Note: This information is disclosed as part of the financial statements for each Fund as part of Item 7: Financial Statements and Financial Highlights for Open-End Management Investment companies.
Item 11: Statement Regarding Basis for Approval of Investment Advisory Contract
Note: This is not applicable for any fund included in this document.
1.955018.111
VIPTV-SANN-0824
Fidelity® Variable Insurance Products:
VIP Freedom Lifetime Income® I Portfolio
VIP Freedom Lifetime Income® II Portfolio
VIP Freedom Lifetime Income® III Portfolio
Semi-Annual Report
June 30, 2024
Contents
To view a fund's proxy voting guidelines and proxy voting record for the 12-month period ended June 30, visit http://www.fidelity.com/proxyvotingresults or visit the Securities and Exchange Commission's (SEC) web site at http://www.sec.gov.
You may also call 1-877-208-0098 to request a free copy of the proxy voting guidelines.
Fidelity® Variable Insurance Products are separate account options which are purchased through a variable insurance contract.
Standard & Poor's, S&P and S&P 500 are registered service marks of The McGraw-Hill Companies, Inc. and have been licensed for use by Fidelity Distributors Corporation.
Other third-party marks appearing herein are the property of their respective owners.
All other marks appearing herein are registered or unregistered trademarks or service marks of FMR LLC or an affiliated company. © 2024 FMR LLC. All rights reserved.
This report and the financial statements contained herein are submitted for the general information of the shareholders of the Funds. This report is not authorized for distribution to prospective investors in the Funds unless preceded or accompanied by an effective prospectus.
A fund files its complete schedule of portfolio holdings with the SEC for the first and third quarters of each fiscal year on Form N-PORT. Forms N-PORT are available on the SEC's web site at http://www.sec.gov. A fund's Forms N-PORT may be reviewed and copied at the SEC's Public Reference Room in Washington, DC. Information regarding the operation of the SEC's Public Reference Room may be obtained by calling 1-800-SEC-0330.
For a complete list of a fund's portfolio holdings, view the most recent holdings listing, semiannual report, or annual report on Fidelity's web site at http://www.fidelity.com, http://www.institutional.fidelity.com, or http://www.401k.com, as applicable.
NOT FDIC INSURED •MAY LOSE VALUE •NO BANK GUARANTEE
Neither the Funds nor Fidelity Distributors Corporation is a bank.
Item 7: Financial Statements and Financial Highlights for Open-End Management Investment Companies (Semi-Annual Report)
VIP Freedom Lifetime Income® I Portfolio
Schedule of Investments June 30, 2024 (Unaudited)
Showing Percentage of Net Assets
| Domestic Equity Funds - 8.0% |
| | | Shares | Value ($) |
| VIP Contrafund Portfolio Investor Class (a) | | 2,049 | 123,031 |
| VIP Equity-Income Portfolio Investor Class (a) | | 3,746 | 100,356 |
| VIP Growth & Income Portfolio Investor Class (a) | | 4,527 | 138,041 |
| VIP Growth Portfolio Investor Class (a) | | 1,822 | 204,553 |
| VIP Mid Cap Portfolio Investor Class (a) | | 814 | 31,671 |
| VIP Value Portfolio Investor Class (a) | | 3,629 | 70,289 |
| VIP Value Strategies Portfolio Investor Class (a) | | 2,106 | 34,960 |
| TOTAL DOMESTIC EQUITY FUNDS (Cost $388,839) | | | 702,901 |
| | | | |
| International Equity Funds - 13.6% |
| | | Shares | Value ($) |
| VIP Emerging Markets Portfolio Investor Class (a) | | 43,712 | 504,439 |
| VIP Overseas Portfolio Investor Class (a) | | 24,834 | 686,168 |
| TOTAL INTERNATIONAL EQUITY FUNDS (Cost $869,285) | | | 1,190,607 |
| | | | |
| Bond Funds - 62.9% |
| | | Shares | Value ($) |
| Fidelity Inflation-Protected Bond Index Fund (a) | | 157,240 | 1,432,457 |
| Fidelity International Bond Index Fund (a) | | 20,793 | 190,047 |
| Fidelity Long-Term Treasury Bond Index Fund (a) | | 20,565 | 195,159 |
| VIP High Income Portfolio Investor Class (a) | | 30,746 | 144,506 |
| VIP Investment Grade Bond II Portfolio Investor Class (a) | | 374,633 | 3,529,040 |
| TOTAL BOND FUNDS (Cost $5,798,328) | | | 5,491,209 |
| | | | |
| Short-Term Funds - 15.5% |
| | | Shares | Value ($) |
VIP Government Money Market Portfolio Investor Class 5.09% (a)(b) (Cost $1,349,570) | | 1,349,570 | 1,349,570 |
| | | | |
| TOTAL INVESTMENT IN SECURITIES - 100.0% (Cost $8,406,022) | 8,734,287 |
NET OTHER ASSETS (LIABILITIES) - 0.0% | 2 |
| NET ASSETS - 100.0% | 8,734,289 |
| | |
Legend
| (b) | The rate quoted is the annualized seven-day yield of the fund at period end. |
Affiliated Underlying Funds
Fiscal year to date information regarding the Fund's investments in affiliated Underlying Funds is presented below. Exchanges between classes of the same affiliated Underlying Funds may occur. If an Underlying Funds changes its name, the name presented below is the name in effect at period end.
| Affiliate | Value, beginning of period ($) | Purchases ($) | Sales Proceeds ($) | Dividend Income ($) | Realized Gain (loss) ($) | Change in Unrealized appreciation (depreciation) ($) | Value, end of period ($) |
| Fidelity Inflation-Protected Bond Index Fund | 1,534,190 | 22,658 | 135,191 | 2,454 | (13,682) | 24,482 | 1,432,457 |
| Fidelity International Bond Index Fund | 228,203 | 7,572 | 44,345 | 2,147 | (2,704) | 1,321 | 190,047 |
| Fidelity Long-Term Treasury Bond Index Fund | 299,772 | 12,537 | 100,019 | 4,108 | (20,679) | 3,548 | 195,159 |
| VIP Contrafund Portfolio Investor Class | 92,117 | 30,930 | 25,368 | 456 | 1,490 | 23,862 | 123,031 |
| VIP Emerging Markets Portfolio Investor Class | 448,404 | 74,190 | 59,601 | 389 | 2,053 | 39,393 | 504,439 |
| VIP Equity-Income Portfolio Investor Class | 74,699 | 33,481 | 16,331 | 478 | 692 | 7,815 | 100,356 |
| VIP Government Money Market Portfolio Investor Class 5.09% | 1,637,802 | 154,517 | 442,749 | 36,052 | - | - | 1,349,570 |
| VIP Growth & Income Portfolio Investor Class | 102,645 | 43,058 | 24,723 | 851 | 1,091 | 15,970 | 138,041 |
| VIP Growth Portfolio Investor Class | 152,552 | 53,009 | 38,077 | 2,735 | 1,597 | 35,472 | 204,553 |
| VIP High Income Portfolio Investor Class | 148,141 | 1,963 | 9,977 | 64 | (1,273) | 5,652 | 144,506 |
| VIP Investment Grade Bond II Portfolio Investor Class | 3,503,069 | 270,492 | 231,007 | 2,181 | (10,890) | (2,624) | 3,529,040 |
| VIP Mid Cap Portfolio Investor Class | 23,385 | 10,649 | 4,768 | 490 | 268 | 2,137 | 31,671 |
| VIP Overseas Portfolio Investor Class | 648,231 | 60,937 | 69,977 | 2,468 | 9,613 | 37,364 | 686,168 |
| VIP Value Portfolio Investor Class | 52,128 | 26,801 | 10,331 | 1,284 | 571 | 1,120 | 70,289 |
| VIP Value Strategies Portfolio Investor Class | 25,779 | 13,655 | 5,285 | 416 | 354 | 457 | 34,960 |
| | 8,971,117 | 816,449 | 1,217,749 | 56,573 | (31,499) | 195,969 | 8,734,287 |
Amounts in the dividend income column in the above table include any capital gain distributions from underlying funds, which are presented in the corresponding line item in the Statement of Operations, if applicable.
Amounts included in the purchases and sales proceeds columns may include in-kind transactions, if applicable.
Investment Valuation
The following is a summary of the inputs used, as of June 30, 2024, involving the Fund's assets and liabilities carried at fair value. The inputs or methodology used for valuing securities may not be an indication of the risk associated with investing in those securities. For more information on valuation inputs, and their aggregation into the levels used below, please refer to the Investment Valuation section in the accompanying Notes to Financial Statements.
| Valuation Inputs at Reporting Date: |
| Description | Total ($) | Level 1 ($) | Level 2 ($) | Level 3 ($) |
Investments in Securities: | | | | |
|
| Domestic Equity Funds | 702,901 | 702,901 | - | - |
|
| International Equity Funds | 1,190,607 | 1,190,607 | - | - |
|
| Bond Funds | 5,491,209 | 5,491,209 | - | - |
|
| Short-Term Funds | 1,349,570 | 1,349,570 | - | - |
| Total Investments in Securities: | 8,734,287 | 8,734,287 | - | - |
VIP Freedom Lifetime Income® I Portfolio
Financial Statements (Unaudited)
| Statement of Assets and Liabilities |
| | | | June 30, 2024 (Unaudited) |
| | | | | |
| Assets | | | | |
| Investment in securities, at value - See accompanying schedule: | | | | |
Affiliated issuers (cost $8,406,022) | $ | 8,734,287 | | |
| | | | | |
| | | | | |
| Total Investment in Securities (cost $8,406,022) | | | $ | 8,734,287 |
| Receivable for investments sold | | | | 31,423 |
Total assets | | | | 8,765,710 |
| Liabilities | | | | |
| Payable for investments purchased | $ | 31,276 | | |
| Payable for fund shares redeemed | | 144 | | |
| Other payables and accrued expenses | | 1 | | |
| Total liabilities | | | | 31,421 |
| Net Assets | | | $ | 8,734,289 |
| Net Assets consist of: | | | | |
| Paid in capital | | | $ | 8,571,617 |
| Total accumulated earnings (loss) | | | | 162,672 |
| Net Assets | | | $ | 8,734,289 |
Net Asset Value, offering price and redemption price per share ($8,734,289 ÷ 836,056 shares) | | | $ | 10.45 |
| Statement of Operations |
| | | | Six months ended June 30, 2024 (Unaudited) |
| Investment Income | | | | |
| Dividends: | | | | |
| Affiliated issuers | | | $ | 48,977 |
| Expenses | | | | |
| Independent trustees' fees and expenses | $ | 12 | | |
| Total expenses | | | | 12 |
| Net Investment income (loss) | | | | 48,965 |
| Realized and Unrealized Gain (Loss) | | | | |
| Net realized gain (loss) on: | | | | |
| Investment Securities: | | | | |
| Affiliated issuers | | (31,499) | | |
| Capital gain distributions from underlying funds: | | | | |
| Affiliated issuers | | 7,596 | | |
| Total net realized gain (loss) | | | | (23,903) |
| Change in net unrealized appreciation (depreciation) on: | | | | |
| Investment Securities: | | | | |
| Affiliated issuers | | 195,969 | | |
| Total change in net unrealized appreciation (depreciation) | | | | 195,969 |
| Net gain (loss) | | | | 172,066 |
| Net increase (decrease) in net assets resulting from operations | | | $ | 221,031 |
| Statement of Changes in Net Assets |
| |
| | Six months ended June 30, 2024 (Unaudited) | | Year ended December 31, 2023 |
| Increase (Decrease) in Net Assets | | | | |
| Operations | | | | |
| Net investment income (loss) | $ | 48,965 | $ | 312,205 |
| Net realized gain (loss) | | (23,903) | | (27,863) |
| Change in net unrealized appreciation (depreciation) | | 195,969 | | 405,756 |
| Net increase (decrease) in net assets resulting from operations | | 221,031 | | 690,098 |
| Distributions to shareholders | | (59,617) | | (389,059) |
| | | | | |
| Share transactions | | | | |
| Proceeds from sales of shares | | - | | 104,164 |
| Reinvestment of distributions | | 59,617 | | 389,059 |
| Cost of shares redeemed | | (458,312) | | (1,177,520) |
| | | | | |
Net increase (decrease) in net assets resulting from share transactions | | (398,695) | | (684,297) |
| Total increase (decrease) in net assets | | (237,281) | | (383,258) |
| | | | | |
| Net Assets | | | | |
| Beginning of period | | 8,971,570 | | 9,354,828 |
| End of period | $ | 8,734,289 | $ | 8,971,570 |
| | | | | |
| Other Information | | | | |
| Shares | | | | |
| Sold | | - | | 10,652 |
| Issued in reinvestment of distributions | | 5,868 | | 38,331 |
| Redeemed | | (44,559) | | (116,500) |
| Net increase (decrease) | | (38,691) | | (67,517) |
| | | | | |
Financial Highlights
VIP Freedom Lifetime Income® I Portfolio |
| |
| | Six months ended (Unaudited) June 30, 2024 | | Years ended December 31, 2023 | | 2022 | | 2021 | | 2020 | | 2019 |
Selected Per-Share Data | | | | | | | | | | | | |
| Net asset value, beginning of period | $ | 10.26 | $ | 9.93 | $ | 12.01 | $ | 12.11 | $ | 11.49 | $ | 10.57 |
| Income from Investment Operations | | | | | | | | | | | | |
Net investment income (loss) A,B | | .06 | | .35 | | .27 | | .22 | | .15 | | .24 |
| Net realized and unrealized gain (loss) | | .20 | | .42 | | (1.66) | | .17 | | 1.02 | | 1.05 |
| Total from investment operations | | .26 | | .77 | | (1.39) | | .39 | | 1.17 | | 1.29 |
| Distributions from net investment income | | (.07) | | (.44) | | (.24) | | (.13) | | (.16) | | (.25) |
| Distributions from net realized gain | | - | | - | | (.45) | | (.36) | | (.39) | | (.12) |
| Total distributions | | (.07) | | (.44) | | (.69) | | (.49) | | (.55) | | (.37) |
| Net asset value, end of period | $ | 10.45 | $ | 10.26 | $ | 9.93 | $ | 12.01 | $ | 12.11 | $ | 11.49 |
Total Return C,D,E | | | | 7.89% | | (12.01)% | | 3.26% | | 10.44% | | 12.28% |
Ratios to Average Net Assets B,F,G | | | | | | | | | | | | |
Expenses before reductions H | | -% I | | -% | | -% | | -% | | -% | | -% |
Expenses net of fee waivers, if any H | | | | -% | | -% | | -% | | -% | | -% |
Expenses net of all reductions H | | -% I | | -% | | -% | | -% | | -% | | -% |
| Net investment income (loss) | | 1.11% I | | 3.43% | | 2.59% | | 1.83% | | 1.29% | | 2.13% |
| Supplemental Data | | | | | | | | | | | | |
| Net assets, end of period (000 omitted) | $ | 8,734 | $ | 8,972 | $ | 9,355 | $ | 11,934 | $ | 12,553 | $ | 12,606 |
Portfolio turnover rate J | | | | 17% | | 63% | | 18% | | 26% | | 19% |
ACalculated based on average shares outstanding during the period.
BNet investment income (loss) is affected by the timing of the declaration of dividends by any underlying mutual funds or exchange-traded funds (ETFs). Net investment income (loss) of any mutual funds or ETFs is not included in the Fund's net investment income (loss) ratio.
CTotal returns for periods of less than one year are not annualized.
DTotal returns do not reflect charges attributable to your insurance company's separate account. Inclusion of these charges would reduce the total returns shown.
ETotal returns would have been lower if certain expenses had not been reduced during the applicable periods shown.
FFees and expenses of any underlying mutual funds or exchange-traded funds (ETFs) are not included in the Fund's expense ratio. The Fund indirectly bears its proportionate share of these expenses.
GExpense ratios reflect operating expenses of the class. Expenses before reductions do not reflect amounts reimbursed, waived, or reduced through arrangements with the investment adviser, brokerage services, or other offset arrangements, if applicable, and do not represent the amount paid by the class during periods when reimbursements, waivers or reductions occur.
HAmount represents less than .005%.
IAnnualized.
JAmount does not include the portfolio activity of any underlying mutual funds or exchange-traded funds (ETFs).
VIP Freedom Lifetime Income® II Portfolio
Schedule of Investments June 30, 2024 (Unaudited)
Showing Percentage of Net Assets
| Domestic Equity Funds - 13.9% |
| | | Shares | Value ($) |
| VIP Contrafund Portfolio Investor Class (a) | | 10,521 | 631,552 |
| VIP Equity-Income Portfolio Investor Class (a) | | 19,230 | 515,179 |
| VIP Growth & Income Portfolio Investor Class (a) | | 23,242 | 708,636 |
| VIP Growth Portfolio Investor Class (a) | | 9,351 | 1,050,047 |
| VIP Mid Cap Portfolio Investor Class (a) | | 4,178 | 162,584 |
| VIP Value Portfolio Investor Class (a) | | 18,628 | 360,826 |
| VIP Value Strategies Portfolio Investor Class (a) | | 10,811 | 179,466 |
| TOTAL DOMESTIC EQUITY FUNDS (Cost $1,747,874) | | | 3,608,290 |
| | | | |
| International Equity Funds - 17.5% |
| | | Shares | Value ($) |
| VIP Emerging Markets Portfolio Investor Class (a) | | 155,538 | 1,794,903 |
| VIP Overseas Portfolio Investor Class (a) | | 99,899 | 2,760,219 |
| TOTAL INTERNATIONAL EQUITY FUNDS (Cost $3,207,901) | | | 4,555,122 |
| | | | |
| Bond Funds - 58.9% |
| | | Shares | Value ($) |
| Fidelity Inflation-Protected Bond Index Fund (a) | | 427,927 | 3,898,416 |
| Fidelity International Bond Index Fund (a) | | 69,609 | 636,225 |
| Fidelity Long-Term Treasury Bond Index Fund (a) | | 69,626 | 660,753 |
| VIP High Income Portfolio Investor Class (a) | | 91,539 | 430,234 |
| VIP Investment Grade Bond II Portfolio Investor Class (a) | | 1,029,221 | 9,695,263 |
| TOTAL BOND FUNDS (Cost $16,252,090) | | | 15,320,891 |
| | | | |
| Short-Term Funds - 9.7% |
| | | Shares | Value ($) |
VIP Government Money Market Portfolio Investor Class 5.09% (a)(b) (Cost $2,512,808) | | 2,512,808 | 2,512,808 |
| | | | |
| TOTAL INVESTMENT IN SECURITIES - 100.0% (Cost $23,720,673) | 25,997,111 |
NET OTHER ASSETS (LIABILITIES) - 0.0% | 11 |
| NET ASSETS - 100.0% | 25,997,122 |
| | |
Legend
| (b) | The rate quoted is the annualized seven-day yield of the fund at period end. |
Affiliated Underlying Funds
Fiscal year to date information regarding the Fund's investments in affiliated Underlying Funds is presented below. Exchanges between classes of the same affiliated Underlying Funds may occur. If an Underlying Funds changes its name, the name presented below is the name in effect at period end.
| Affiliate | Value, beginning of period ($) | Purchases ($) | Sales Proceeds ($) | Dividend Income ($) | Realized Gain (loss) ($) | Change in Unrealized appreciation (depreciation) ($) | Value, end of period ($) |
| Fidelity Inflation-Protected Bond Index Fund | 4,098,444 | 130,659 | 360,164 | 6,588 | (29,258) | 58,735 | 3,898,416 |
| Fidelity International Bond Index Fund | 748,692 | 25,929 | 133,826 | 7,077 | (7,010) | 2,440 | 636,225 |
| Fidelity Long-Term Treasury Bond Index Fund | 969,030 | 45,912 | 298,487 | 13,598 | (74,174) | 18,472 | 660,753 |
| VIP Contrafund Portfolio Investor Class | 564,839 | 53,139 | 124,569 | 2,441 | 33,630 | 104,513 | 631,552 |
| VIP Emerging Markets Portfolio Investor Class | 1,630,777 | 228,472 | 213,570 | 1,412 | 5,466 | 143,758 | 1,794,903 |
| VIP Equity-Income Portfolio Investor Class | 458,039 | 90,761 | 78,069 | 2,694 | 3,390 | 41,058 | 515,179 |
| VIP Government Money Market Portfolio Investor Class 5.09% | 3,140,564 | 459,655 | 1,087,411 | 66,669 | - | - | 2,512,808 |
| VIP Growth & Income Portfolio Investor Class | 629,391 | 102,597 | 113,629 | 4,482 | 6,221 | 84,056 | 708,636 |
| VIP Growth Portfolio Investor Class | 935,401 | 98,749 | 187,259 | 14,969 | 26,746 | 176,410 | 1,050,047 |
| VIP High Income Portfolio Investor Class | 434,858 | 10,377 | 27,901 | 187 | (2,162) | 15,062 | 430,234 |
| VIP Investment Grade Bond II Portfolio Investor Class | 9,383,686 | 933,138 | 586,184 | 5,867 | (20,798) | (14,579) | 9,695,263 |
| VIP Mid Cap Portfolio Investor Class | 143,385 | 28,899 | 22,456 | 2,770 | 1,364 | 11,392 | 162,584 |
| VIP Overseas Portfolio Investor Class | 2,709,299 | 184,542 | 328,448 | 10,291 | 53,211 | 141,615 | 2,760,219 |
| VIP Value Portfolio Investor Class | 319,630 | 79,760 | 46,586 | 7,232 | 2,663 | 5,359 | 360,826 |
| VIP Value Strategies Portfolio Investor Class | 158,070 | 40,862 | 23,208 | 2,332 | 1,513 | 2,229 | 179,466 |
| | 26,324,105 | 2,513,451 | 3,631,767 | 148,609 | 802 | 790,520 | 25,997,111 |
Amounts in the dividend income column in the above table include any capital gain distributions from underlying funds, which are presented in the corresponding line item in the Statement of Operations, if applicable.
Amounts included in the purchases and sales proceeds columns may include in-kind transactions, if applicable.
Investment Valuation
The following is a summary of the inputs used, as of June 30, 2024, involving the Fund's assets and liabilities carried at fair value. The inputs or methodology used for valuing securities may not be an indication of the risk associated with investing in those securities. For more information on valuation inputs, and their aggregation into the levels used below, please refer to the Investment Valuation section in the accompanying Notes to Financial Statements.
| Valuation Inputs at Reporting Date: |
| Description | Total ($) | Level 1 ($) | Level 2 ($) | Level 3 ($) |
Investments in Securities: | | | | |
|
| Domestic Equity Funds | 3,608,290 | 3,608,290 | - | - |
|
| International Equity Funds | 4,555,122 | 4,555,122 | - | - |
|
| Bond Funds | 15,320,891 | 15,320,891 | - | - |
|
| Short-Term Funds | 2,512,808 | 2,512,808 | - | - |
| Total Investments in Securities: | 25,997,111 | 25,997,111 | - | - |
VIP Freedom Lifetime Income® II Portfolio
Financial Statements (Unaudited)
| Statement of Assets and Liabilities |
| | | | June 30, 2024 (Unaudited) |
| | | | | |
| Assets | | | | |
| Investment in securities, at value - See accompanying schedule: | | | | |
Affiliated issuers (cost $23,720,673) | $ | 25,997,111 | | |
| | | | | |
| | | | | |
| Total Investment in Securities (cost $23,720,673) | | | $ | 25,997,111 |
| Cash | | | | 6 |
| Receivable for investments sold | | | | 112,110 |
Total assets | | | | 26,109,227 |
| Liabilities | | | | |
| Payable for investments purchased | $ | 111,670 | | |
| Payable for fund shares redeemed | | 435 | | |
| Total liabilities | | | | 112,105 |
| Net Assets | | | $ | 25,997,122 |
| Net Assets consist of: | | | | |
| Paid in capital | | | $ | 23,731,707 |
| Total accumulated earnings (loss) | | | | 2,265,415 |
| Net Assets | | | $ | 25,997,122 |
Net Asset Value, offering price and redemption price per share ($25,997,122 ÷ 2,161,439 shares) | | | $ | 12.03 |
| Statement of Operations |
| | | | Six months ended June 30, 2024 (Unaudited) |
| Investment Income | | | | |
| Dividends: | | | | |
| Affiliated issuers | | | $ | 108,053 |
| Expenses | | | | |
| Independent trustees' fees and expenses | $ | 35 | | |
| Total expenses | | | | 35 |
| Net Investment income (loss) | | | | 108,018 |
| Realized and Unrealized Gain (Loss) | | | | |
| Net realized gain (loss) on: | | | | |
| Investment Securities: | | | | |
| Affiliated issuers | | 802 | | |
| Capital gain distributions from underlying funds: | | | | |
| Affiliated issuers | | 40,556 | | |
| Total net realized gain (loss) | | | | 41,358 |
| Change in net unrealized appreciation (depreciation) on: | | | | |
| Investment Securities: | | | | |
| Affiliated issuers | | 790,520 | | |
| Total change in net unrealized appreciation (depreciation) | | | | 790,520 |
| Net gain (loss) | | | | 831,878 |
| Net increase (decrease) in net assets resulting from operations | | | $ | 939,896 |
| Statement of Changes in Net Assets |
| |
| | Six months ended June 30, 2024 (Unaudited) | | Year ended December 31, 2023 |
| Increase (Decrease) in Net Assets | | | | |
| Operations | | | | |
| Net investment income (loss) | $ | 108,018 | $ | 804,590 |
| Net realized gain (loss) | | 41,358 | | 199,540 |
| Change in net unrealized appreciation (depreciation) | | 790,520 | | 1,422,936 |
| Net increase (decrease) in net assets resulting from operations | | 939,896 | | 2,427,066 |
| Distributions to shareholders | | (156,101) | | (992,391) |
| | | | | |
| Share transactions | | | | |
| Proceeds from sales of shares | | - | | 18,065 |
| Reinvestment of distributions | | 156,101 | | 992,391 |
| Cost of shares redeemed | | (1,267,748) | | (2,406,984) |
| | | | | |
Net increase (decrease) in net assets resulting from share transactions | | (1,111,647) | | (1,396,528) |
| Total increase (decrease) in net assets | | (327,852) | | 38,147 |
| | | | | |
| Net Assets | | | | |
| Beginning of period | | 26,324,974 | | 26,286,827 |
| End of period | $ | 25,997,122 | $ | 26,324,974 |
| | | | | |
| Other Information | | | | |
| Shares | | | | |
| Sold | | - | | 1,650 |
| Issued in reinvestment of distributions | | 13,445 | | 86,461 |
| Redeemed | | (107,845) | | (212,331) |
| Net increase (decrease) | | (94,400) | | (124,220) |
| | | | | |
Financial Highlights
VIP Freedom Lifetime Income® II Portfolio |
| |
| | Six months ended (Unaudited) June 30, 2024 | | Years ended December 31, 2023 | | 2022 | | 2021 | | 2020 | | 2019 |
Selected Per-Share Data | | | | | | | | | | | | |
| Net asset value, beginning of period | $ | 11.67 | $ | 11.04 | $ | 13.96 | $ | 13.83 | $ | 12.98 | $ | 11.78 |
| Income from Investment Operations | | | | | | | | | | | | |
Net investment income (loss) A,B | | .05 | | .35 | | .29 | | .25 | | .16 | | .26 |
| Net realized and unrealized gain (loss) | | .38 | | .72 | | (2.12) | | .60 | | 1.44 | | 1.65 |
| Total from investment operations | | .43 | | 1.07 | | (1.83) | | .85 | | 1.60 | | 1.91 |
| Distributions from net investment income | | (.07) | | (.44) | | (.26) | | (.15) | | (.17) | | (.27) |
| Distributions from net realized gain | | - | | - | | (.83) | | (.57) | | (.58) | | (.44) |
| Total distributions | | (.07) | | (.44) | | (1.09) | | (.72) | | (.75) | | (.71) |
| Net asset value, end of period | $ | 12.03 | $ | 11.67 | $ | 11.04 | $ | 13.96 | $ | 13.83 | $ | 12.98 |
Total Return C,D,E | | | | 9.80% | | (13.83)% | | 6.27% | | 12.78% | | 16.58% |
Ratios to Average Net Assets B,F,G | | | | | | | | | | | | |
Expenses before reductions H | | -% I | | -% | | -% | | -% | | -% | | -% |
Expenses net of fee waivers, if any H | | | | -% | | -% | | -% | | -% | | -% |
Expenses net of all reductions H | | -% I | | -% | | -% | | -% | | -% | | -% |
| Net investment income (loss) | | .83% I | | 3.07% | | 2.43% | | 1.78% | | 1.29% | | 2.07% |
| Supplemental Data | | | | | | | | | | | | |
| Net assets, end of period (000 omitted) | $ | 25,997 | $ | 26,325 | $ | 26,287 | $ | 33,250 | $ | 34,232 | $ | 33,602 |
Portfolio turnover rate J | | | | 18% | | 63% | | 23% | | 33% | | 24% |
ACalculated based on average shares outstanding during the period.
BNet investment income (loss) is affected by the timing of the declaration of dividends by any underlying mutual funds or exchange-traded funds (ETFs). Net investment income (loss) of any mutual funds or ETFs is not included in the Fund's net investment income (loss) ratio.
CTotal returns for periods of less than one year are not annualized.
DTotal returns do not reflect charges attributable to your insurance company's separate account. Inclusion of these charges would reduce the total returns shown.
ETotal returns would have been lower if certain expenses had not been reduced during the applicable periods shown.
FFees and expenses of any underlying mutual funds or exchange-traded funds (ETFs) are not included in the Fund's expense ratio. The Fund indirectly bears its proportionate share of these expenses.
GExpense ratios reflect operating expenses of the class. Expenses before reductions do not reflect amounts reimbursed, waived, or reduced through arrangements with the investment adviser, brokerage services, or other offset arrangements, if applicable, and do not represent the amount paid by the class during periods when reimbursements, waivers or reductions occur.
HAmount represents less than .005%.
IAnnualized.
JAmount does not include the portfolio activity of any underlying mutual funds or exchange-traded funds (ETFs).
VIP Freedom Lifetime Income® III Portfolio
Schedule of Investments June 30, 2024 (Unaudited)
Showing Percentage of Net Assets
| Domestic Equity Funds - 25.0% |
| | | Shares | Value ($) |
| VIP Contrafund Portfolio Investor Class (a) | | 21,261 | 1,276,312 |
| VIP Equity-Income Portfolio Investor Class (a) | | 38,861 | 1,041,091 |
| VIP Growth & Income Portfolio Investor Class (a) | | 46,967 | 1,432,032 |
| VIP Growth Portfolio Investor Class (a) | | 18,898 | 2,122,024 |
| VIP Mid Cap Portfolio Investor Class (a) | | 8,444 | 328,554 |
| VIP Value Portfolio Investor Class (a) | | 37,644 | 729,173 |
| VIP Value Strategies Portfolio Investor Class (a) | | 21,847 | 362,667 |
| TOTAL DOMESTIC EQUITY FUNDS (Cost $3,716,657) | | | 7,291,853 |
| | | | |
| International Equity Funds - 24.9% |
| | | Shares | Value ($) |
| VIP Emerging Markets Portfolio Investor Class (a) | | 229,080 | 2,643,581 |
| VIP Overseas Portfolio Investor Class (a) | | 167,964 | 4,640,858 |
| TOTAL INTERNATIONAL EQUITY FUNDS (Cost $5,261,877) | | | 7,284,439 |
| | | | |
| Bond Funds - 49.9% |
| | | Shares | Value ($) |
| Fidelity Inflation-Protected Bond Index Fund (a) | | 406,042 | 3,699,041 |
| Fidelity International Bond Index Fund (a) | | 94,046 | 859,578 |
| Fidelity Long-Term Treasury Bond Index Fund (a) | | 133,211 | 1,264,170 |
| VIP High Income Portfolio Investor Class (a) | | 102,992 | 484,063 |
| VIP Investment Grade Bond II Portfolio Investor Class (a) | | 879,815 | 8,287,854 |
| TOTAL BOND FUNDS (Cost $15,587,835) | | | 14,594,706 |
| | | | |
| Short-Term Funds - 0.2% |
| | | Shares | Value ($) |
VIP Government Money Market Portfolio Investor Class 5.09% (a)(b) (Cost $64,766) | | 64,766 | 64,766 |
| | | | |
| TOTAL INVESTMENT IN SECURITIES - 100.0% (Cost $24,631,135) | 29,235,764 |
NET OTHER ASSETS (LIABILITIES) - 0.0% | 8 |
| NET ASSETS - 100.0% | 29,235,772 |
| | |
Legend
| (b) | The rate quoted is the annualized seven-day yield of the fund at period end. |
Affiliated Underlying Funds
Fiscal year to date information regarding the Fund's investments in affiliated Underlying Funds is presented below. Exchanges between classes of the same affiliated Underlying Funds may occur. If an Underlying Funds changes its name, the name presented below is the name in effect at period end.
| Affiliate | Value, beginning of period ($) | Purchases ($) | Sales Proceeds ($) | Dividend Income ($) | Realized Gain (loss) ($) | Change in Unrealized appreciation (depreciation) ($) | Value, end of period ($) |
| Fidelity Inflation-Protected Bond Index Fund | 3,734,763 | 222,430 | 286,251 | 6,149 | (6,847) | 34,946 | 3,699,041 |
| Fidelity International Bond Index Fund | 954,574 | 59,651 | 148,802 | 9,199 | (4,759) | (1,086) | 859,578 |
| Fidelity Long-Term Treasury Bond Index Fund | 1,430,397 | 298,132 | 377,458 | 23,599 | (75,370) | (11,531) | 1,264,170 |
| VIP Contrafund Portfolio Investor Class | 1,170,699 | 59,892 | 231,747 | 4,779 | 70,031 | 207,437 | 1,276,312 |
| VIP Emerging Markets Portfolio Investor Class | 2,366,432 | 315,537 | 260,773 | 2,052 | (2,497) | 224,882 | 2,643,581 |
| VIP Equity-Income Portfolio Investor Class | 949,324 | 124,169 | 119,453 | 5,408 | 4,756 | 82,295 | 1,041,091 |
| VIP Government Money Market Portfolio Investor Class 5.09% | 569,826 | 170,434 | 675,494 | 5,512 | - | - | 64,766 |
| VIP Growth & Income Portfolio Investor Class | 1,304,477 | 116,451 | 168,002 | 8,847 | 11,099 | 168,007 | 1,432,032 |
| VIP Growth Portfolio Investor Class | 1,938,763 | 107,794 | 334,092 | 29,312 | 56,852 | 352,707 | 2,122,024 |
| VIP High Income Portfolio Investor Class | 473,088 | 22,444 | 25,740 | 205 | (145) | 14,416 | 484,063 |
| VIP Investment Grade Bond II Portfolio Investor Class | 7,971,340 | 812,276 | 462,510 | 4,990 | (18,786) | (14,466) | 8,287,854 |
| VIP Mid Cap Portfolio Investor Class | 297,202 | 43,196 | 36,969 | 5,631 | 2,663 | 22,462 | 328,554 |
| VIP Overseas Portfolio Investor Class | 4,469,968 | 266,520 | 419,734 | 17,093 | 54,202 | 269,902 | 4,640,858 |
| VIP Value Portfolio Investor Class | 662,492 | 122,355 | 70,047 | 14,498 | 3,970 | 10,403 | 729,173 |
| VIP Value Strategies Portfolio Investor Class | 327,639 | 66,776 | 38,385 | 4,702 | 2,372 | 4,265 | 362,667 |
| | 28,620,984 | 2,808,057 | 3,655,457 | 141,976 | 97,541 | 1,364,639 | 29,235,764 |
Amounts in the dividend income column in the above table include any capital gain distributions from underlying funds, which are presented in the corresponding line item in the Statement of Operations, if applicable.
Amounts included in the purchases and sales proceeds columns may include in-kind transactions, if applicable.
Investment Valuation
The following is a summary of the inputs used, as of June 30, 2024, involving the Fund's assets and liabilities carried at fair value. The inputs or methodology used for valuing securities may not be an indication of the risk associated with investing in those securities. For more information on valuation inputs, and their aggregation into the levels used below, please refer to the Investment Valuation section in the accompanying Notes to Financial Statements.
| Valuation Inputs at Reporting Date: |
| Description | Total ($) | Level 1 ($) | Level 2 ($) | Level 3 ($) |
Investments in Securities: | | | | |
|
| Domestic Equity Funds | 7,291,853 | 7,291,853 | - | - |
|
| International Equity Funds | 7,284,439 | 7,284,439 | - | - |
|
| Bond Funds | 14,594,706 | 14,594,706 | - | - |
|
| Short-Term Funds | 64,766 | 64,766 | - | - |
| Total Investments in Securities: | 29,235,764 | 29,235,764 | - | - |
VIP Freedom Lifetime Income® III Portfolio
Financial Statements (Unaudited)
| Statement of Assets and Liabilities |
| | | | June 30, 2024 (Unaudited) |
| | | | | |
| Assets | | | | |
| Investment in securities, at value - See accompanying schedule: | | | | |
Affiliated issuers (cost $24,631,135) | $ | 29,235,764 | | |
| | | | | |
| | | | | |
| Total Investment in Securities (cost $24,631,135) | | | $ | 29,235,764 |
| Cash | | | | 5 |
| Receivable for investments sold | | | | 177,932 |
Total assets | | | | 29,413,701 |
| Liabilities | | | | |
| Payable for investments purchased | $ | 177,448 | | |
| Payable for fund shares redeemed | | 481 | | |
| Total liabilities | | | | 177,929 |
| Net Assets | | | $ | 29,235,772 |
| Net Assets consist of: | | | | |
| Paid in capital | | | $ | 24,566,875 |
| Total accumulated earnings (loss) | | | | 4,668,897 |
| Net Assets | | | $ | 29,235,772 |
Net Asset Value, offering price and redemption price per share ($29,235,772 ÷ 2,201,378 shares) | | | $ | 13.28 |
| Statement of Operations |
| | | | Six months ended June 30, 2024 (Unaudited) |
| Investment Income | | | | |
| Dividends: | | | | |
| Affiliated issuers | | | $ | 62,839 |
| Expenses | | | | |
| Independent trustees' fees and expenses | $ | 38 | | |
| Total expenses | | | | 38 |
| Net Investment income (loss) | | | | 62,801 |
| Realized and Unrealized Gain (Loss) | | | | |
| Net realized gain (loss) on: | | | | |
| Investment Securities: | | | | |
| Affiliated issuers | | 97,541 | | |
| Capital gain distributions from underlying funds: | | | | |
| Affiliated issuers | | 79,137 | | |
| Total net realized gain (loss) | | | | 176,678 |
| Change in net unrealized appreciation (depreciation) on: | | | | |
| Investment Securities: | | | | |
| Affiliated issuers | | 1,364,639 | | |
| Total change in net unrealized appreciation (depreciation) | | | | 1,364,639 |
| Net gain (loss) | | | | 1,541,317 |
| Net increase (decrease) in net assets resulting from operations | | | $ | 1,604,118 |
| Statement of Changes in Net Assets |
| |
| | Six months ended June 30, 2024 (Unaudited) | | Year ended December 31, 2023 |
| Increase (Decrease) in Net Assets | | | | |
| Operations | | | | |
| Net investment income (loss) | $ | 62,801 | $ | 692,926 |
| Net realized gain (loss) | | 176,678 | | 352,098 |
| Change in net unrealized appreciation (depreciation) | | 1,364,639 | | 2,330,943 |
| Net increase (decrease) in net assets resulting from operations | | 1,604,118 | | 3,375,967 |
| Distributions to shareholders | | (360,852) | | (855,343) |
| | | | | |
| Share transactions | | | | |
| Proceeds from sales of shares | | 96,918 | | 91,608 |
| Reinvestment of distributions | | 360,852 | | 855,343 |
| Cost of shares redeemed | | (1,086,402) | | (2,614,932) |
| | | | | |
Net increase (decrease) in net assets resulting from share transactions | | (628,632) | | (1,667,981) |
| Total increase (decrease) in net assets | | 614,634 | | 852,643 |
| | | | | |
| Net Assets | | | | |
| Beginning of period | | 28,621,138 | | 27,768,495 |
| End of period | $ | 29,235,772 | $ | 28,621,138 |
| | | | | |
| Other Information | | | | |
| Shares | | | | |
| Sold | | 7,287 | | 7,857 |
| Issued in reinvestment of distributions | | 28,503 | | 69,067 |
| Redeemed | | (84,308) | | (214,663) |
| Net increase (decrease) | | (48,518) | | (137,739) |
| | | | | |
Financial Highlights
VIP Freedom Lifetime Income® III Portfolio |
| |
| | Six months ended (Unaudited) June 30, 2024 | | Years ended December 31, 2023 | | 2022 | | 2021 | | 2020 | | 2019 |
Selected Per-Share Data | | | | | | | | | | | | |
| Net asset value, beginning of period | $ | 12.72 | $ | 11.63 | $ | 15.29 | $ | 14.72 | $ | 13.53 | $ | 11.89 |
| Income from Investment Operations | | | | | | | | | | | | |
Net investment income (loss) A,B | | .03 | | .30 | | .27 | | .26 | | .16 | | .26 |
| Net realized and unrealized gain (loss) | | .69 | | 1.17 | | (2.58) | | 1.15 | | 1.83 | | 2.11 |
| Total from investment operations | | .72 | | 1.47 | | (2.31) | | 1.41 | | 1.99 | | 2.37 |
| Distributions from net investment income | | (.06) | | (.38) | | (.26) | | (.16) | | (.17) | | (.27) |
| Distributions from net realized gain | | (.10) | | - | | (1.10) | | (.67) | | (.62) | | (.47) |
| Total distributions | | (.16) | | (.38) | | (1.35) C | | (.84) C | | (.80) C | | (.73) C |
| Net asset value, end of period | $ | 13.28 | $ | 12.72 | $ | 11.63 | $ | 15.29 | $ | 14.72 | $ | 13.53 |
Total Return D,E,F | | | | 12.73% | | (16.04)% | | 9.78% | | 15.23% | | 20.44% |
Ratios to Average Net Assets B,G,H | | | | | | | | | | | | |
Expenses before reductions I | | -% J | | -% | | -% | | -% | | -% | | -% |
Expenses net of fee waivers, if any I | | | | -% | | -% | | -% | | -% | | -% |
Expenses net of all reductions I | | -% J | | -% | | -% | | -% | | -% | | -% |
| Net investment income (loss) | | .44% J | | 2.47% | | 2.18% | | 1.73% | | 1.24% | | 2.02% |
| Supplemental Data | | | | | | | | | | | | |
| Net assets, end of period (000 omitted) | $ | 29,236 | $ | 28,621 | $ | 27,768 | $ | 36,135 | $ | 35,275 | $ | 33,018 |
Portfolio turnover rate K | | | | 19% | | 61% | | 28% | | 35% | | 26% |
ACalculated based on average shares outstanding during the period.
BNet investment income (loss) is affected by the timing of the declaration of dividends by any underlying mutual funds or exchange-traded funds (ETFs). Net investment income (loss) of any mutual funds or ETFs is not included in the Fund's net investment income (loss) ratio.
CTotal distributions per share do not sum due to rounding.
DTotal returns for periods of less than one year are not annualized.
ETotal returns do not reflect charges attributable to your insurance company's separate account. Inclusion of these charges would reduce the total returns shown.
FTotal returns would have been lower if certain expenses had not been reduced during the applicable periods shown.
GFees and expenses of any underlying mutual funds or exchange-traded funds (ETFs) are not included in the Fund's expense ratio. The Fund indirectly bears its proportionate share of these expenses.
HExpense ratios reflect operating expenses of the class. Expenses before reductions do not reflect amounts reimbursed, waived, or reduced through arrangements with the investment adviser, brokerage services, or other offset arrangements, if applicable, and do not represent the amount paid by the class during periods when reimbursements, waivers or reductions occur.
IAmount represents less than $.005 per share.
JAnnualized.
KAmount does not include the portfolio activity of any underlying mutual funds or exchange-traded funds (ETFs).
Notes to Financial Statements
(Unaudited)For the period ended June 30, 2024
1. Organization.
VIP Freedom Lifetime Income I Portfolio, VIP Freedom Lifetime Income II Portfolio, and VIP Freedom Lifetime Income III Portfolio (the Funds) are funds of Variable Insurance Products Fund V (the Trust). The Trust is registered under the Investment Company Act of 1940, as amended (the 1940 Act), as an open-end management investment company organized as a Massachusetts business trust. Each Fund is authorized to issue an unlimited number of shares. Shares of each Fund may only be purchased by insurance companies for the purpose of funding variable annuity or variable life insurance contracts.
2. Significant Accounting Policies.
Each Fund is an investment company and applies the accounting and reporting guidance of the Financial Accounting Standards Board (FASB) Accounting Standards Codification Topic 946 Financial Services - Investment Companies. The financial statements have been prepared in conformity with accounting principles generally accepted in the United States of America (GAAP), which require management to make certain estimates and assumptions at the date of the financial statements. Actual results could differ from those estimates. Subsequent events, if any, through the date that the financial statements were issued have been evaluated in the preparation of the financial statements. Each Fund's Schedule of Investments lists any underlying mutual funds or exchange-traded funds (ETFs) but does not include the underlying holdings of these funds. The following summarizes the significant accounting policies of each Fund:
Investment Valuation. Investments are valued as of 4:00 p.m. Eastern time on the last calendar day of the period. Each Fund categorizes the inputs to valuation techniques used to value its investments into a disclosure hierarchy consisting of three levels as shown below:
Level 1 - unadjusted quoted prices in active markets for identical investments
Level 2 - other significant observable inputs (including quoted prices for similar investments, interest rates, prepayment speeds, etc.)
Level 3 - unobservable inputs (including the Fund's own assumptions based on the best information available)
Valuation techniques used to value each Fund's investments by major category are as follows:
Investments in open-end mutual funds are valued at their closing net asset value (NAV) each business day and are categorized as Level 1 in the hierarchy. The aggregate value of investments by input level as of June 30, 2024 is included at the end of each Fund's Schedule of Investments.
Investment Transactions and Income. For financial reporting purposes, the Funds' investment holdings and NAV include trades executed through the end of the last business day of the period. The NAV per share for processing shareholder transactions is calculated as of the close of business of the New York Stock Exchange (NYSE), normally 4:00 p.m. Eastern time and includes trades executed through the end of the prior business day. Gains and losses on securities sold are determined on the basis of identified cost. Income and capital gain distributions from any underlying mutual funds or exchange-traded funds (ETFs) are recorded on the ex-dividend date.
Expenses. Expenses directly attributable to a fund are charged to that fund. Expenses attributable to more than one fund are allocated among the respective funds on the basis of relative net assets or other appropriate methods. Expenses included in the accompanying financial statements reflect the expenses of that fund and do not include any expenses associated with any underlying mutual funds or exchange-traded funds. Although not included in a fund's expenses, a fund indirectly bears its proportionate share of these expenses through the net asset value of each underlying mutual fund or exchange-traded fund. Expense estimates are accrued in the period to which they relate and adjustments are made when actual amounts are known.
Income Tax Information and Distributions to Shareholders. Each year, each Fund intends to qualify as a regulated investment company under Subchapter M of the Internal Revenue Code, including distributing substantially all of its taxable income and realized gains. As a result, no provision for U.S. Federal income taxes is required. Each Fund files a U.S. federal tax return, in addition to state and local tax returns as required. Each Fund's federal income tax returns are subject to examination by the Internal Revenue Service (IRS) for a period of three fiscal years after they are filed. State and local tax returns may be subject to examination for an additional fiscal year depending on the jurisdiction.
Distributions are declared and recorded on the ex-dividend date. Income and capital gain distributions are determined in accordance with income tax regulations, which may differ from GAAP.
Capital accounts within the financial statements are adjusted for permanent book-tax differences. These adjustments have no impact on net assets or the results of operations. Capital accounts are not adjusted for temporary book-tax differences which will reverse in a subsequent period.
Book-tax differences are primarily due to short-term gain distributions from the Underlying Funds, capital loss carryforwards and losses deferred due to wash sales.
As of period end, the cost and unrealized appreciation (depreciation) in securities, and derivatives if applicable, for federal income tax purposes were as follows for each Fund:
| | Tax cost ($) | Gross unrealized appreciation ($) | Gross unrealized depreciation ($) | Net unrealized appreciation (depreciation)($) |
| VIP Freedom Lifetime Income I Portfolio. | 8,444,594 | 637,163 | (347,470) | 289,693 |
VIP Freedom Lifetime Income II Portfolio | 23,833,119 | 3,206,521 | (1,042,529) | 2,163,992 |
VIP Freedom Lifetime Income III Portfolio | 24,809,732 | 5,580,537 | (1,154,505) | 4,426,032 |
Capital loss carryforwards are only available to offset future capital gains of the Funds to the extent provided by regulations and may be limited. The capital loss carryforward information presented below, including any applicable limitation, is estimated as of prior fiscal period end and is subject to adjustment.
| | Short-term ($) | Long-term ($) | Total capital loss carryforward ($) |
| VIP Freedom Lifetime Income I Portfolio. | (60,164) | (79,486) | (139,650) |
VIP Freedom Lifetime Income II Portfolio | (16,402) | (-) | (16,402) |
3. Purchases and Sales of Investments.
Purchases and sales of securities, other than short-term securities and in-kind transactions, as applicable, are noted in the table below.
| | Purchases ($) | Sales ($) |
| VIP Freedom Lifetime Income I Portfolio | 816,449 | 1,217,749 |
| VIP Freedom Lifetime Income II Portfolio | 2,513,451 | 3,631,767 |
| VIP Freedom Lifetime Income III Portfolio | 2,808,057 | 3,655,457 |
4. Fees and Other Transactions with Affiliates.
Management Fee. Fidelity Management & Research Company LLC (the investment adviser) provides the Funds with investment management related services. The Funds do not pay any fees for these services.
Interfund Trades. Funds may purchase from or sell securities to other Fidelity Funds under procedures adopted by the Board. The procedures have been designed to ensure these interfund trades are executed in accordance with Rule 17a-7 of the 1940 Act. Any interfund trades are included within the respective purchases and sales amounts shown in the Purchases and Sales of Investments note. During the period, there were no interfund trades.
5. Other.
A fund's organizational documents provide former and current trustees and officers with a limited indemnification against liabilities arising in connection with the performance of their duties to the fund. In the normal course of business, a fund may also enter into contracts that provide general indemnifications. A fund's maximum exposure under these arrangements is unknown as this would be dependent on future claims that may be made against a fund. The risk of material loss from such claims is considered remote.
At the end of the period, the investment adviser or its affiliates were owners of record of more than 10% of the outstanding shares as follows:
| Fund | Affiliated % |
| VIP Freedom Lifetime Income I | 100% |
| VIP Freedom Lifetime Income II | 100% |
| VIP Freedom Lifetime Income III | 100% |
6. Risk and Uncertainties.
Many factors affect a fund's performance. Developments that disrupt global economies and financial markets, such as pandemics, epidemics, outbreaks of infectious diseases, war, terrorism, and environmental disasters, may significantly affect a fund's investment performance. The effects of these developments to a fund will be impacted by the types of securities in which a fund invests, the financial condition, industry, economic sector, and geographic location of an issuer, and a fund's level of investment in the securities of that issuer. Significant concentrations in security types, issuers, industries, sectors, and geographic locations may magnify the factors that affect a fund's performance.
Item 8: Changes in and Disagreements with Accountants for Open-End Management Investment Companies
Note: This is not applicable for any fund included in this document.
Item 9: Proxy Disclosures for Open-End Management Investment Companies
Note: This is not applicable for any fund included in this document.
Item 10: Remuneration Paid to Directors, Officers, and others of Open-End Management Investment Companies
Note: This information is disclosed as part of the financial statements for each Fund as part of Item 7: Financial Statements and Financial Highlights for Open-End Management Investment companies.
Item 11: Statement Regarding Basis for Approval of Investment Advisory Contract
Note: This is not applicable for any fund included in this document.
1.816202.118
VIPFLI-SANN-0824
Item 8.
Changes in and Disagreements with Accountants for Open-End Management Investment Companies
See Item 7.
Item 9.
Proxy Disclosures for Open-End Management Investment Companies
See Item 7.
Item 10.
Remuneration Paid to Directors, Officers, and Others of Open-End Management Investment Companies
See Item 7.
Item 11.
Statement Regarding Basis for Approval of Investment Advisory Contract
See Item 7.
Item 12.
Disclosure of Proxy Voting Policies and Procedures for Closed-End Management Investment Companies
Not applicable.
Item 13.
Portfolio Managers of Closed-End Management Investment Companies
Not applicable.
Item 14.
Purchases of Equity Securities by Closed-End Management Investment Company and Affiliated Purchasers
Not applicable.
Item 15.
Submission of Matters to a Vote of Security Holders
There were no material changes to the procedures by which shareholders may recommend nominees to the Variable Insurance Products Fund V’s Board of Trustees.
Item 16.
Controls and Procedures
(a)(i) The President and Treasurer and the Chief Financial Officer have concluded that the Variable Insurance Products Fund V’s (the “Trust”) disclosure controls and procedures (as defined in Rule 30a-3(c) under the Investment Company Act) provide reasonable assurances that material information relating to the Trust is made known to them by the appropriate persons, based on their evaluation of these controls and procedures as of a date within 90 days of the filing date of this report.
(a)(ii) There was no change in the Trust’s internal control over financial reporting (as defined in Rule 30a-3(d) under the Investment Company Act) that occurred during the period covered by this report that has materially affected, or is reasonably likely to materially affect, the Trust’s internal control over financial reporting.
Item 17.
Disclosure of Securities Lending Activities for Closed-End Management Investment Companies
Not applicable.
Item 18.
Recovery of Erroneously Awarded Compensation
(a)
Not applicable.
(b)
Not applicable.
Item 19.
Exhibits
SIGNATURES
Pursuant to the requirements of the Securities Exchange Act of 1934 and the Investment Company Act of 1940, the registrant has duly caused this report to be signed on its behalf by the undersigned, thereunto duly authorized.
Variable Insurance Products Fund V
|
By: | /s/Laura M. Del Prato |
| Laura M. Del Prato |
| President and Treasurer (Principal Executive Officer) |
|
|
Date: | August 22, 2024 |
Pursuant to the requirements of the Securities Exchange Act of 1934 and the Investment Company Act of 1940, this report has been signed below by the following persons on behalf of the registrant and in the capacities and on the dates indicated.
|
By: | /s/Laura M. Del Prato |
| Laura M. Del Prato |
| President and Treasurer (Principal Executive Officer) |
|
|
Date: | August 22, 2024 |
|
By: | /s/John J. Burke III |
| John J. Burke III |
| Chief Financial Officer (Principal Financial Officer) |
|
|
Date: | August 22, 2024 |